Volume XXIII January 2022 - Jyoti Nivas College
180
Volume XXIII January 2022 +
-
Upload
khangminh22 -
Category
Documents
-
view
1 -
download
0
Transcript of Volume XXIII January 2022 - Jyoti Nivas College

Volume XXIII January 2022
+

JOURNAL BY THE DEPARTMENT OF MBA, MCA AND M.COM(FA), JYOTI NIVAS COLLEGE AUTONOMOUS 2
Our motto: Let your light shine
Our Vision: Communion, Excellence, Service and Relevance
Our Mission: To Turn Out Intellectually Enlightened

JOURNAL BY THE DEPARTMENT OF MBA, MCA AND M.COM(FA), JYOTI NIVAS COLLEGE AUTONOMOUS 3
Editorial Board
Editor-in-Chief
Dr Sr Lalitha Thomas Principal
Jyoti Nivas College Autonomous Bengaluru-95
Editorial Board
Dr Shilpa Abhang, Department of MCA
Dr. Percy Bose, Department of MBA
Mr. Vincent, Department of M.Com (FA)

JOURNAL BY THE DEPARTMENT OF MBA, MCA AND M.COM(FA), JYOTI NIVAS COLLEGE AUTONOMOUS 4
Volume 23
January 2022
DHII
Published by:
Research Publication and Development Cell
Jyoti Nivas College Autonomous, Bengaluru– 560095,
India

JOURNAL BY THE DEPARTMENT OF MBA, MCA AND M.COM(FA), JYOTI NIVAS COLLEGE AUTONOMOUS 5
Edited, owned, printed, and published by Dr Sr Lalitha Thomas from Research Publication and
Development Cell, Jyoti Nivas College Autonomous, Bengaluru-560 095, India and printed at
National Printing Press, 580, K.R. Garden, Koramangala, Bengaluru-560 095.
©Dr Sr Lalitha Thomas 2021.
All rights reserved. No part of this publication may be reproduced, stored in a retrieval system,
or transmitted, in any form or by any means, electronic, mechanical, photocopying, recording or
otherwise without the prior permission RPDC of Jyoti Nivas College.
This journal is sold subject to the condition that it shall not, by way of trade or otherwise be lent,
re-soled, hired out, or otherwise circulated without the publisher's prior consent in any form of
binding or cover other than that in which it is published and without a similar condition
including this condition being imposed on the subsequent purchases.
JOURNAL BY THE DEPARTMENT OF MBA, MCA AND M.COM(FA), JYOTI NIVAS COLLEGE AUTONOMOUS 6
Message
"Sooner or later, those who win are those who think they can.” — Paul Tournier
It gives me immense pleasure to present to you the twenty third issue of the Research journal - ‘Dhii’
January 2022. It is a journal by the students of MBA/MCA/M.COM (FA) that has both internal and
external expert reviewer teams. The journal publishes articles on current research in the areas of
Finance, Marketing, Human Resource and Information Technology. This issue has seventeen articles.
The time spent at the Master’s Degree must make a difference. In a way it is a stepping-stone to a
different life altogether. Since, this is the ideal time for learning and teaching and learning thrives in
an ambience wherein new knowledge is created, the course has been planned carefully to enable the
students for further academic pursuits.
The purpose of this journal is to encourage students at the Master’s degree level to develop an interest
in research and the journal is the first step to create research culture, to make research a part of their
curriculum, to generate the interest among the young academicians at an early stage. In their final
year, the students have the opportunity to work on a research project in an area of their choice,
under the guidance of one of the faculty members. This is to offer students an opportunity to engage
with research and prepare them for higher levels of academia. Their endeavors at contributing
articles, compiling and editing teaches them valuable lessons on research.
While ‘Dhii’ hones the research skills in students, it challenges the staff to keep abreast with the latest
areas of research which in turn helps to improve the quality of their teaching.
My sincere appreciation goes to our student contributors, who worked with ease, enthusiasm and joy.
I thank my dear staff, who journeyed with our students and worked towards successful release of the
twenty first issues. Congratulations to the staff and students of MBA/MCA/M.COM (FA). In our
constant striving for excellence, we continue to march ahead keeping in mind the college motto ‘Let
Your Light Shine’.
God Bless You
Dr. Sr. Lalitha Thomas
Principal, Jyoti Nivas College Autonomous

JOURNAL BY THE DEPARTMENT OF MBA, MCA AND M.COM(FA), JYOTI NIVAS COLLEGE AUTONOMOUS 7
Names of the Reviewers
External Reviewer
Section I–MCA
Dr. YETHIRAJ N G, Assistant Professor and P G Coordinator, Department
of Computer Science, Maharani‘s Science college for women, Bangalore
Internal Reviewer
Dr. IRENE GETZIS, Assistant Professor, Department of MCA,
Jyoti Nivas College, Bangalore.
Dr. SHILPA ABHANG, Assistant Professor, Department of MCA,
Jyoti Nivas College, Bangalore.
Dr. RAJESH DHARMARAJ, Assistant Professor, Department of MCA,
Jyoti Nivas College, Bangalore.
Ms. SWARNAMUGI M, Assistant Professor, Department of MCA,
Jyoti Nivas College, Bangalore.
Dr. SENTHIL VADIVU, Assistant Professor, Department of MCA,
Jyoti Nivas College, Bangalore.
Section II–MBA
External Reviewers:
1. Mr. SREEKANTH, Manager - Human Resources, Buhler India Pvt Ltd,
Bengaluru
2. Ms. VANI DEVARAJ, Leadership Voyage, Bengaluru.
3. Mr. SUBIN AHAMMED, Founder & Director - The Consulting Brains,
Bengaluru
4. Ms. NISHATH SULTANA, Associate, KPMG, Bengaluru

JOURNAL BY THE DEPARTMENT OF MBA, MCA AND M.COM(FA), JYOTI NIVAS COLLEGE AUTONOMOUS 8
Internal Reviewers:
1. Dr. PERCY BOSE, Department of MBA, JNC, Bengaluru
2. Dr. PHILCY ANTHONY, Department of MBA, JNC, Bengaluru
3. Dr. PRIYA VINOD, Department of MBA, JNC, Bengaluru
4. Mrs. BELLA THOMAS, Department of MBA, Bengaluru
SECTION III - M.COM (FA)
External Reviewers:
1. Mr. DEBA B PRASAD, AVP, Happyness Factory, Bangalore.
2. Ms. SOWMYA KRISHNAN, AVP, Happyness Factory, Bangalore.
Internal Reviewers:
1. Dr. JAHNAVI, Department of M.Com (FA), JNC, Bangalore.
2. Mr. VINCENT PAUL, Department of M.Com (FA), JNC, Bangalore.

JOURNAL BY THE DEPARTMENT OF MBA, MCA AND M.COM(FA), JYOTI NIVAS COLLEGE AUTONOMOUS 9
DHII
JOURNAL OF THE MBA, MCA AND M.COM (FA)
DEPARTMENT, JYOTI NIVAS COLLEGE AUTONOMOUS
Volume XXIII January 2022
SECTION I (MCA)
1 FACE RECOGNITION
16
~Sumalatha M
2 HISTOGRAM AND HUMAN FACE DETECTION 21
~Akilandeswari T
3
.
WEATHER MONITORING SYSTEM BASED ON
INTERNET OF THINGS
27
~ Dinamani. R
4 OBJECT DETECTION BASED ON COLOR
37
~ Pavithra D
5 BRAIN TUMOR SEGMENTATION OF MRI IMAGES
45
~Shilpa k

JOURNAL BY THE DEPARTMENT OF MBA, MCA AND M.COM(FA), JYOTI NIVAS COLLEGE AUTONOMOUS 10
6 E-VOTING SYSTEM BY FACE DETECTION AND
RECOGNTION
56
~ Rakshitha V
7 AUTO TAGGING OF HUMAN IMAGES 61
~ Afrah Hashmi A G
SECTION II (MBA)
1 A STUDY ON COST CONTROL AND COST REDUCTION
AT WIN-MEDICARE PVT LTD
71
~Bibi Sarah
2 A STUDY ON EMPLOYEE MOTIVATION WITH
REFERENCE TO CUSHMAN &WAKEFEILD
85
~Chaitra SL
3 EFFECT OF PERSONAL SELLING ON GROWTH ON
HOMELFICWEGROW COMMUNITY
101
~Divya K
4 A STUDY ON IMPACT OF COVID-19 IN NON IT
RECRUITMENT PROCESS
110
~Kalsang Choedon
5 A STUDY ON RECRUITMENT AND SELECTION IN
RGA SOFTWARE SYSTEMS PVT LTD
119
~Nandini. K

JOURNAL BY THE DEPARTMENT OF MBA, MCA AND M.COM(FA), JYOTI NIVAS COLLEGE AUTONOMOUS 11
SECTION III (M.COM(FA))
1 IMMACULATE 136
~ Joyce Pallavi
2 A STUDY ON ANALYSIS ON FILING GST IN A
LOGISTICS FIRM
146
~ Pooja Bhaskar
3 COMPARISON OF PERFORMANCE OF ACTIVELY AND
PASSIVELY MANAGED MUTUAL FUNDS.
159
~ Sonali Thethwar
4 A STUDY ON PERFORMANCE AND EVALUATION OF
MUTUAL FUNDS
170
~ Shabi Zehra

JOURNAL BY THE DEPARTMENT OF MBA, MCA AND M.COM(FA), JYOTI NIVAS COLLEGE AUTONOMOUS 12
SECTION I (MCA)
JOURNAL BY THE DEPARTMENT OF MBA, MCA AND M.COM(FA), JYOTI NIVAS COLLEGE AUTONOMOUS 13
Foreword
Definiteness of purpose is the starting point of all achievement.
–W. Clement Stone
The purpose of this journal is to foster and reward the scholarly efforts of our students as
well as to provide a valuable learning experience. The first section of January 2022 of ‘DHII’
showcases 7 outstanding research papers from the field of computer science focusing the
active areas of research namely Digital Image Processing, Internet Of Things. Data
Visualization and Machine Learning
The first paper of Dhii is based on “Face Recognition”.
The main goal of face recognition is to detect a face, recognize it and identify a person. These
types of applications are mainly used in tracking a person in workplace, schools, colleges and many
more. This type of face recognition application helps the people to detect the human face and
helps to reduce the malpractice of making presence without them being present. Face recognition
systems have been used in wide range in recent times on smart phones and in other forms of
technology, such as robotics and many more. Face recognition systems have been utilized in
advanced human-computer interaction, video surveillance and automatic indexing of images.
Most of the face recognition applications use machine learning, artificial neural network and many
more.
The second paper is based on “Histogram and Human Face Detection”.
The ultimate goal or aim of a number of image processing applications is to extract the important
details or the features from image data provided by means of which some interpretation or
understanding of the scene or the image can be given to the machine. Image processing is
alteration of the existing image in the desired manner. The basic objective of image processing is
to enhance or evaluate some aspects of an image. Image processing is widely used in a number
of recognition applications. Here an image is taken and it is made to undergo few pre-processing
steps to extract or to enhance few important details that will help to use the same image in
further process. The development of such applications can be done using a number ways using
the machine learning methods and its algorithms or be it the deep learning methodologies. Its
discipline is very vast and can range from medicine to entertainment. Python takes care of this

JOURNAL BY THE DEPARTMENT OF MBA, MCA AND M.COM(FA), JYOTI NIVAS COLLEGE AUTONOMOUS 14
application with its variety of available library. In this work, we have used Python and Open cv
methods to extract few details and also to enhance the images to make the scene better for
further analysis.
The third paper is based on “Weather Monitoring System on Internet of Things”
The Internet of Things (IOT) is a latest concept of relating physical computing devices or any
other objects to internet and can communicate with each other. Each object is provided with
unique identifiers and the ability to transfer data over internet network without human
intervention and machine extraction. The project targets on a simple microcontroller- ESP8266
which monitors weather condition using three sensors such as temperature humidity and smoke
detector sensor. It then displays all data in the Blynk application .The project has been developed
by using wi-fi Nodemcu ESP8266, Dht11 temperature and humidity sensor MQ135 smoke
detector sensor .It is suitable for monitoring weather in any place and anytime.
The fourth paper is based on “Object Detection Based on Color”.
Object detection is a computer technology related to computer vision and image processing that
deals with detecting instances of semantic objects of a certain class (such as humans, buildings,
cars) in digital images and videos. Well-researched domains of object detection include face
detection and pedestrian detection. Object Detection refers to detecting an object in a given
image. This is done in several ways like Image Processing, Deep Learning or Convolutional Neural
Network (CNN) many ways. In all the things it captures the image and detects the object either
by extracting the features through the color or shape etc. Object Detection is been required in
many of field. There are several algorithms to perform this, but the efficiency depends on the
algorithm we choose.
The fifth paper is based on “Brain Tumor Segmentation of MRI images”.
The goal of segmentation is to simplify and change the representation of an image into
something that is more meaningful and easier to analysis. Tumor segmentation from MRI images
is important part of medical images experts. There are different segmentation techniques to
detect MRI brain tumor. Image segmentation is one of the fundamental approaches of digital
image processing. Brain tumor segmentation is MRI has become a popular research are in the
filled of medical required region. Here I have used a different types of segmentation is used to
detect the tumor part. In the work different segmentation methods are used to segment brain
tumors and compare the result of segmentation by using correlation analysis and see the best

JOURNAL BY THE DEPARTMENT OF MBA, MCA AND M.COM(FA), JYOTI NIVAS COLLEGE AUTONOMOUS 15
technique that could be applied to MRI images.
The sixth paper is based on “E-Voting System by Face Detection and Recognition”.
There are some drawbacks in conventional voting system such as damage of machines, chances
of violence, dummy voting and problem of proper monitoring. Manual voting system has been
followed in many parts of our country so people could not poll their vote because it is place
oriented and there is region wise distribution, voters need to reach the place of voting. To
overcome these problems a new confidential E-Voting system is introduced which provides
security to the election system by detection and recognizing voter’s face who is going to cast
his/her vote. In this system the voter’s face is detected, captured and stored in the database
then match the captured image with the image already stored on database to recognize the
person. If match occurs then the person is allow to cast their vote once the vote is casted the
same person will not be permitted to cast votes this provide security against duplicate vote and
fraudulent and make the system more efficient and user friendly
The seventh paper is based on “Auto Tagging of Human Images”.
In the current era the whole world revolves around social media. Image Tagging is on such
technology which will be very useful to recognize the people in the images and tag those
people based on their name in the social website. In this paper we are going to see how
image tagging works and by using Machine Learning algorithms like Local Binary Pattern
Histogram (LBPH) we are going to train the system, detect the faces in the image and
recognize the people in the images. The objective of this application is to use the Machine
Learning algorithms to tag the people in the images. First the system should detect the faces
in the images compare the features of the detected face with the trained data. If the
features match with the detected face, the display the name of the person in the image
above their faces.
Dr. Shilpa Abhang
Assistant Professor, Department of MCA
Jyoti Nivas College Autonomous

JOURNAL BY THE DEPARTMENT OF MBA, MCA AND M.COM(FA), JYOTI NIVAS COLLEGE AUTONOMOUS 16
DHII
Vol. XXIII January 2022
Journal Dept. of MBA, MCA and M. Com(FA)
Jyoti Nivas College Autonomous
FACE RECOGNITION
~Sumalatha M
Abstract
The main goal of face recognition is to detect a face, recognize it and identify a person. This type
of application is mainly used in tracking a person in workplace, schools, colleges and many
more. This type of face recognition application helps the people to detect the human face and
helps to reduce the malpractice of making presence without them being present. Face
recognition systems have been used in wide range in recent times on smart phones and in other
forms of technology, such as robotics and many more. Face recognition systems have been
utilized in advanced human-computer interaction, video surveillance and automatic indexing of
images. Most of the face recognition applications use machine learning, artificial neural
network and many more.
Keywords:: dlib, face_ recognition, labeled wild faces.
.
I. INTRODUCTION
Face is the most important part of human body. It plays an important role in identification and
authentication of a person, due to which it can be used for numerous daily life applications.
Facial recognition systems are attaining importance day by day. Once it was just a fictional scene
in movies. Now a lot of work has been done in this area.
Face recognition system is a capable technology which matches the human faces from the digital
image or video frame from the database of faces. It‘s the technique used for detecting individual
faces whose images are saved in the dataset.
Face recognition algorithms defined as geometry based or template-based algorithms. The
template-based methods can be built using tools like SVM (Support Vector Machines), PCA
(Principal Component Analysis), LDA (Linear Discriminant Analysis), Kernelor Trace. The
geometric feature-based methods analyze local facial features and their geometric relationship.

JOURNAL BY THE DEPARTMENT OF MBA, MCA AND M.COM(FA), JYOTI NIVAS COLLEGE AUTONOMOUS 17
Features indicating facial expressions are also called as feature-based methods.
The complete face region is taken into account as input data into face catching system was done
using holistic approach. Holistic methods are Eigenfaces (most widely used method for face
recognition), Principal Component Analysis, Linear Discriminant Analysis and independent
component analysis etc...
Combination of both holistic and feature extraction methods are known as Hybrid face
recognition system. The picture of a person's face is caught in 3D; the system is allowed to
observe the curves of the eye sockets, like the shapes of the chin or forehead. Detection,
Position, Matching, Measurement and Representation. Detection is done while Capturing a face
either a scanning a photograph or photographing a person's face in real time. Position is done
when determining the location, size and angle of the head are done using 3D system.
II. LITERATURE REVIEW
Paper 1: This paper explains about the different methods used in face recognition like
Geometric based methods, Holistic methods, Feature-based methods, Hybrid methods and Deep
learning methods in detail and also it has clear explanation on how it works.
This paper also has few proposed methodologies like Data specification, Face detection, Data
augmentation, Face recognition using CNN.
Paper 2: The paper talks about the two-step process face detection and face recognition. in
which the image captured can be classified as ―faces‖ and ―non-face‖.
This paper describes about the technique of real time profile detection and recognized by
modifying Viola-Jones algorithm.
The result achieved by them showed up to 50 human faces which were detected and tracked by
systems using the modified algorithm.
Paper 3: In this paper they have mentioned few techniques which can also be used for face
detection and recognition like color segmentation, image segmentation, image matching, filtering
non-facial images.
They have also discussed about the template-matching methods which are used for face
localization and detection by computing the correlation of an input image into standard face
pattern. The appearance-based methods are used for face detection using eigen faces, neural
networks and information theoretical approaches.
Paper 4: This paper explains about the face verification, analysis and face identification in
which they use 3D head pose, Illumination, Facial expression, Aging.
JOURNAL BY THE DEPARTMENT OF MBA, MCA AND M.COM(FA), JYOTI NIVAS COLLEGE AUTONOMOUS 18
They mainly focused on Appearance based face recognition which deals with vector
representation of image, linear analysis, PCA, ICA, LDA and non-linear analysis like kernel
PCA.
Paper 5: This paper explains about the real time face recognition using Viola Jones algorithm,
Features and internal image, Ada boost algorithm, Cascade classifier.
The paper also discusses about the RGB to Gray scale conversion of a image and recognition of
faces using Speeded Up Robust Features (SURF), Histogram of Orientated Gradients(HOG),
Local Binary Pattern(LBP).
Paper 6: This paper explains about the Ada Boost classifier, Local Binary Pattern features and
Support Vector Machine (SVM) classifier is used with Histogram of oriented gradients for face
detection evaluation.
Functions equivalent to intensity difference readings are quite easy to compute. The features set
must be only restricted to a small number of critical features which is achieved by boosting
algorithm.
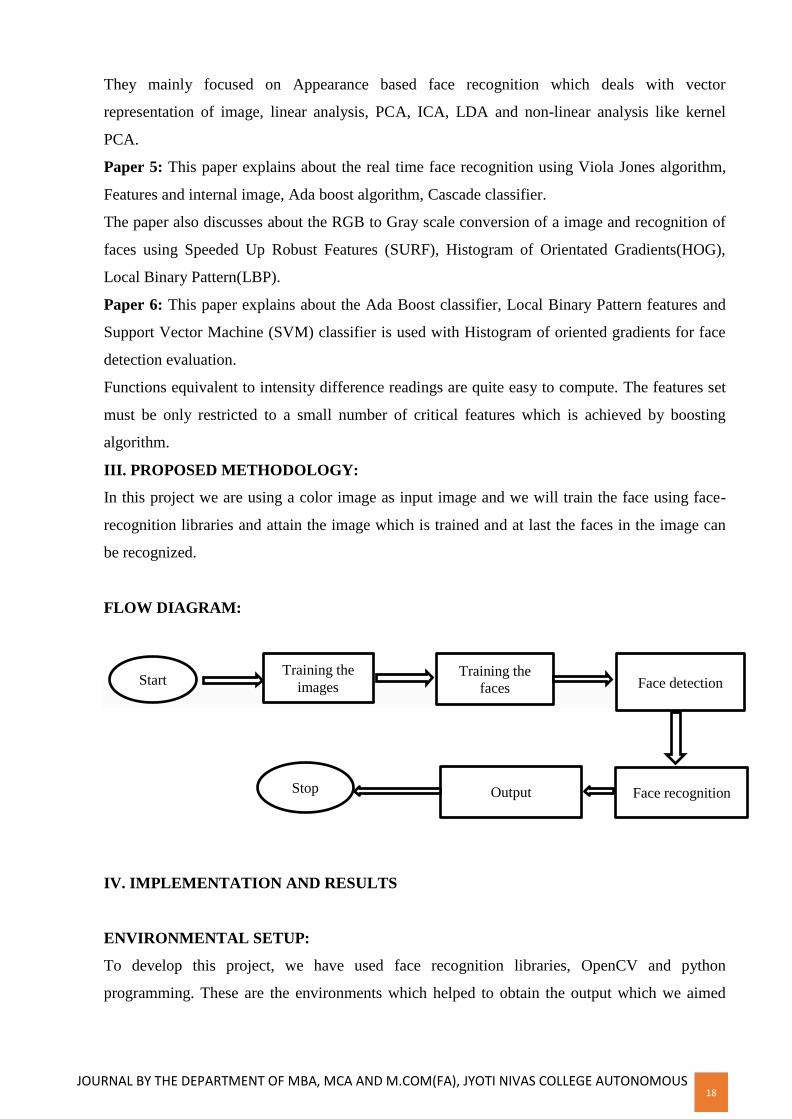
III. PROPOSED METHODOLOGY:
In this project we are using a color image as input image and we will train the face using face-
recognition libraries and attain the image which is trained and at last the faces in the image can
be recognized.
FLOW DIAGRAM:
IV. IMPLEMENTATION AND RESULTS
ENVIRONMENTAL SETUP:
To develop this project, we have used face recognition libraries, OpenCV and python
programming. These are the environments which helped to obtain the output which we aimed
Start Training the
images Training the
faces Face detection
Face recognition Output Stop

JOURNAL BY THE DEPARTMENT OF MBA, MCA AND M.COM(FA), JYOTI NIVAS COLLEGE AUTONOMOUS 19
for. We made use of online editor called google colab for working with face_ recognition
libraries which needs more time to run and space to store the data. As this is done using online
editor the hardware specifications hardly count as it can done or accessed even through the
mobile phones.
EXPERIMENTAL RESULT:
As per face recognition it should detect the face in the input image and it should create a square
mark as face is detected on the image as per the code. After detecting the faces in the image, it
has to identify the faces in the image as per the data it is trained with. As the result of face
identification and face recognition it will show the output with the square mark around the face
indicating that its detecting the face with their trained names.
INPUT IMAGE:
OUTPUT IMAGE:

JOURNAL BY THE DEPARTMENT OF MBA, MCA AND M.COM(FA), JYOTI NIVAS COLLEGE AUTONOMOUS 20
V. CONCLUSION:
In our proposed project we have done a simple face recognition system which detects the faces
in a image and recognizes the faces. These types of face recognition system can be further
developed and used for authentication purpose in many places. Face recognition is a area where
each and every day the methods and steps will get changed according to the technology
development.
This project is also done with one of them and it showed the good results. Each and every
method may have different types of implementation methods and process to be done. The result
may differ from one another.
VI. REFERENCES:
1. Maheen Zulfiqar, Fatima Syed, Khurram Khurshid, ―Deep Face Recognition For
Biometric Authentication‖, International Journal of Electric, Communication and
Computer Engineering, July 2019.
2. Mrunmayee Shirodkar, Varun Sinha, UrviJain, Bhusshan Nemade, ―Face detection and
Face recognition‖, International Journal of Advanced Research in Science, Engineering
and Technology, May 2017
3. Joon Hyung Shim, Yang Jinkyu, Inseong Kim, ―Face Detection‖, Journal of Michigan
State University, East Lansing,MI, 48824.
4. Xiaoguang Lu,‖ Image analysis of Face Recognition‖, Journal of Michigan Sate
University, East Lansing, MI, 48824.
5. Dr. Jia Uddin ,‖ Real time face recognition‖, journal of BRAC University, Bangladesh.
6. Faizan Ahmed, AaimaNajam,‖ Image based Face Detection and Recognition‖, journal of
COMSATS Institute of Information Technology, Lahore

JOURNAL BY THE DEPARTMENT OF MBA, MCA AND M.COM(FA), JYOTI NIVAS COLLEGE AUTONOMOUS 21
DHII
Vol. XXIII January 2022
Journal Dept. of MBA, MCA and M. Com (FA)
Jyoti Nivas College Autonomous
HISTOGRAM AND HUMAN FACE DETECTION
~Akilandeswari T
Abstract
The ultimate goal or aim of a number of image processing applications is to extract
theimportantdetailsorthefeaturesfromimagedataprovidedbymeansofwhichsomeinterpretation or
understanding of the scene or the image can be given to the machine. Image processing is
nothing but the alter of the existing image in the desired manner. The basic objective of image
processing is to enhance or evaluate some aspects of an image. Image processing is widely used
in a number of recognition applications. Here an image is taken and it is made to undergo few
pre-processing steps to extract or to enhance few important details that will help to use the same
image in further process. The development of such applications can be done using a number
ways using the machine learning methods and its algorithms or be it the deep learning
methodologies. Its discipline is very vast and can range from medicine to entertainment .Python
takes care of this application with its variety of available library. In this work, we have used
Python and Opencv methods to extract few details and also to enhance the images to make the
scene better for further analysis.
Keywords: Histogram, Face detection.
I. INTRODUCTION
Image processing is a method to perform some operations on an image in order to get some
useful information from it. It is nothing but a type of signal processing where the input is an
image and the output maybe in the form of an image or it can be the characteristics/features
associated to the image. Image processing is one of the rapidly growing technology and the three
general phase that all type of data has to undergo while using the Digital Image Processing are
pre-processing, enhancement and display. It allows much wider range of algorithms to be applied
on the image and can avoid problems such as build of noise and distortion during processing and
as a reason it can provide sophisticated performance.

JOURNAL BY THE DEPARTMENT OF MBA, MCA AND M.COM(FA), JYOTI NIVAS COLLEGE AUTONOMOUS 22
The work done here comprises of few techniques that are implemented on one image. The input
image is made to undergo the pre-processing techniques which includes the reduction of noise
and then converting the image to grayscale image as working with grayscale images are more
feasible, while putting it under the log transformations(GAMMA Correction) and then
thresholding the image. This work is implemented using the Python language and the online tool
called Repl.it was used as a tool to get the specified output of the image.
II. LITERATURE REVIEW
Paper 1: This paper tells about the face representation derived by the Linear Discriminant
Analysis (LDA) of multi-scale local binary pattern histograms is proposed for face recognition.
The face image is first partitioned into several non-overlapping regions. In each region, multi
scale local binary uniform pattern histograms1 are extracted and concatenated into a regional
feature. The features are then projected on the LDA space to be used as a discriminative facial
descriptor.
Paper 2: This paper presents a novel face detection approach in color images. We employ
spatial histograms as robust features for face detection. The spatial histograms consist of
marginal distribution of color image information. Facial texture and shape are preserved by the
spatial histogram representation. A hierarchical classifier combining histogram matching and
support vector machine is utilized to identify face and non-face.
Paper 3: This paper does some study on histogram equalization. Especially, the examples of
histogram equalization on the image show the difference of using two different mapping
methods respectively.
Paper 4: This paper implements ―Haar-Cascade algorithm‖ to identify human faces which is
organized in Open CV by Python language and Local binary pattern algorithm to recognize
faces. Haar like features are adapted by Viola -Jones for face detection. 1.)Haar- like features:
Haar-like features Haar-like features is used by Haar cascade classifier for human face detection.
There are three formations of Haar-like features. From the Fig.4, the first format is the edge
feature, second type is the line feature and the last type is the four rectangle feature. Using the
integral image, Haar like principle will provide fast computation. It‘s called Haar- like features.

JOURNAL BY THE DEPARTMENT OF MBA, MCA AND M.COM(FA), JYOTI NIVAS COLLEGE AUTONOMOUS 23
Output
Image
FaceDetection
Paper 5: This paper tells about human face detection, Haar Cascade method can filter selfie face
images that have an accuracy value of 64,6%. We use this assumption because basically, selfie
face images contain a human face. Human Face Detection: In recent years, several studies
discuss human face detection, especially using Haar Cascade Classifier: studies the problem of
face detection in the first attempt using a method named Haar cascade classifier from images
containing simple and complex backgrounds. They use a library named OpenCV to perform the
Haar cascade classifier method. Haar cascade classifier gives high accuracy even the
illumination strongly 6 affects the image. The Haar cascade classifier method has shown superior
performance with simple background images.
Paper 6: This paper, tells information about the face detection and tracking system with real
time video as an input. The working method of this system is entirely divided into two main
modules. The face recognition and detection from the video is the first module while the tracking
is the second module. To detect the face in the image, Face Name Graph Matching algorithm is
used. This algorithm involves various methods such as Haar-Cascade method, Open-cv libraries
etc.
III. PROPOSED METHODOLOGY
In this project I have worked on histogram and face detection of a human for analysis. I have
trained a data set using face detection libraries and algorithm. Then we can attain the image
which is trained using libraries and the face is detected finally.
FLOW CHART
Start
Histogram
InputImage

JOURNAL BY THE DEPARTMENT OF MBA, MCA AND M.COM(FA), JYOTI NIVAS COLLEGE AUTONOMOUS 24
IV. IMPLEMENTATION AND RESULTS ENVIRONMENTAL SETUP:
To develop this project we have made use of Opencv library and Python programming language.
I have used the anaconda navigator- jypter notebook. I have used all the libraries which is
required for the function.
ENVIRONMENTAL RESULTS:
After detecting the faces in the image, it has to identify the faces in the image as per the data it is
trained with. As the result of face identification and face recognition it will show the output with
the square mark around the face indicating that its detecting the face with their trained names.
INPUT IMAGE

JOURNAL BY THE DEPARTMENT OF MBA, MCA AND M.COM(FA), JYOTI NIVAS COLLEGE AUTONOMOUS 25
OUTPUT IMAGE
V. CONCLUSION
In our proposed project, we have done a clear study on the histogram and face detection for the
several purpose for the industrial and organization purposes as well as social media platforms.
This project gives us knowledge of Haar cascades features, histogram and how the image is
plotted using histogram as well as the face is detected. This is mainly used to avoid the
fraudulent in industries, security, banking and several other purposes.
REFERENCES
1. Multi-scale Local Binary Pattern Histograms for Face Recognition Chi-Ho Chan, Josef
Kittler, and Kieron Messer.
2. Spatial Histogram Features for Face Detection in Color Images Hongming Zhang and
Debin Zhao.
3. Face Recognition Using Haar - Cascade Classifier for Criminal Identification,
International Journal of Recent Technology and Engineering (IJRTE) ISSN: 2277- 3878,
Volume-7, Issue-6S5, April 2019. Senthamizh Selvi. R , D. Sivakumar, Sandhya.J .S,
Siva Sowmiya. S, Ramya. S , Kanaga Suba Raja. S.

JOURNAL BY THE DEPARTMENT OF MBA, MCA AND M.COM(FA), JYOTI NIVAS COLLEGE AUTONOMOUS 26
4. Face Detection using Haar Cascades to Filter Selfie Face Image on Instagram Adri
Priadana1 , Muhammad Habibi .
5. Use Of Haar Cascade Classifier For Face Tracking System In Real Time Video.
International Journal of Engineering Research & Technology (IJERT) Vol. 2 Issue 4,
April - 2013 ISSN: 2278-0181.

JOURNAL BY THE DEPARTMENT OF MBA, MCA AND M.COM(FA), JYOTI NIVAS COLLEGE AUTONOMOUS 27
DHII
Vol. XXIII January 2022
Journal Dept. of MBA, MCA and M.Com (FA)
Jyoti Nivas College Autonomous
WEATHER MONITORING SYSTEM BASED ON INTERNET OF THINGS
~Dinamani. R
Abstract
The Internet of Things (IOT) is a latest concept of relating physical computing devices or any
other objects to internet and can communicate with each other. Each object is provided with
unique identifiers and the ability to transfer data over internet network without human
intervention and machine extraction. The project targets on a simple microcontroller ESP8266
which monitor weather condition using three sensors such as temperature and humidity, and
smoke detector sensor. It then displays all data in the Blynk application .The project have been
developed by using wi-fi Nodemcu ESP8266, Dht11 temperature and humidity sensor MQ135
smoke detector sensor .It is suitable for monitoring weather in any place and anytime.
Keywords: Internet of Things (IOT), Blynk application
I.INTRODUCTION
Weather monitoring is an important aspect in many situations. For example, the weather
conditions are needed to be monitored in order to maintain the healthy growth in plants. Other
than that, it also needed for ensuring the safe environment in city or suburban. In modernization
world, technology is important for human to facilitate everyday life. Hence, the technology is
used in this project to help the people to know the condition of weather at a certain place by only
using finger tips.
Weather monitoring is an important aspect in many situations. The weather monitoring system
can be categorized into wired or wireless system. In wireless communication, the connectivity
will be more convenient and user-friendly. Thus, weather monitoring system would not need the
responsible person to be presence at the location. Wireless communication also is the transfer of
information or data over a distance without the use of wires from the transmitter to the receiver.
The distance of transmitting data can be short or long. The weather monitoring system will
collect all the data and will send to the application known as Blynk.

JOURNAL BY THE DEPARTMENT OF MBA, MCA AND M.COM(FA), JYOTI NIVAS COLLEGE AUTONOMOUS 28
This application can allow the user to know the extract weather every time and every day. The
motivation for this project is to make a people easily move from one place to another rplace.
1. PROBLEM STATEMENT
Weather forecasting is a significant function in meteorology and has been one of the most
systematically challenging troubles around the world. This scheme deals with the structure of a
weather display method using small cost components so that any electronics hobbyist can
construct it. As the replacement for using sensors to collect the weather data, the development
gets the information from weather stations placed around the world through a global weather
data supplier. Service weather phenomena challenge difficult weather forecast approach with the
partial explanation. Growing on communication method enable weather predicts specialist
systems to combine and share possessions and thus hybrid systems have emerged.
2. SOFTWARE DEVELOPMENT
Arduino IDE is an open source software. The code will be written on this software and it will
be upload to Arduino board. The Arduino board always changing to adapt to new needs and
challenges and its offer simple 8-bit boards to products for IoT applications, wearable, 3D
printing and embedded environment Blynk is a platform with Ios and Android apps to control
Arduino, RasberryPi and the others over the Internet.
Arduino is also an electronics platform based on easy-to-use hardware and software. Arduino
boards are able to read inputs - light on a sensor, a finger on a button, or a Twitter message - and
turn it into an output - activating a motor, turning on an LED, publishing something online. You
can tell your board what to do by sending a set of instructions to the microcontroller on the
board. To do so you use the Arduino programming language (based on Wiring), and the Arduino
Software (IDE), based on Processing.

JOURNAL BY THE DEPARTMENT OF MBA, MCA AND M.COM(FA), JYOTI NIVAS COLLEGE AUTONOMOUS 29
3. HARDWARE DEVELOPMENT
A. Nodemcu
The NodeMCU Development Board can be easily programmed with Arduino IDE since it is easy
to use. Programming NodeMCU with the Arduino IDE will hardly take 5-10 minutes. All you
need is the Arduino IDE, a USB cable and the NodeMCU board itself. You can check this
Getting Started Tutorial for NodeMCU to prepare your Arduino IDE for NodeMCU.
Uploading program
Once Arduino IDE is installed on the computer, connect the board with the computer using the
USB cable. Now open the Arduino IDE and choose the correct board by selecting
Tools>Boards>NodeMCU1.0 (ESP-12E Module), and choose the correct Port by selecting
Tools>Port. To get it started with the NodeMCU board and blink the built-in LED, load the
example code by selecting Files>Examples>Basics>Blink. Once the example code is loaded into
your IDE, click on the „upload ‟button given on the top bar. Once the upload is finished, you
should see the built-in LED of the board blinking.
B. Dht11: Temperature and Humidity sensor
DHT11 is a low-cost digital sensor for sensing temperature and humidity. This sensor can be
easily interfaced with any micro-controller such as Arduino, Raspberry Pi etc… to measure
humidity and temperature instantaneously. DHT11 humidity and temperature sensor is available
as a sensor and as a module. The difference between this sensor and module is the pull-up
resistor and a power-on LED. DHT11 is a relative humidity sensor. To measure the surrounding
air this sensor uses a thermistor and a capacitive humidity sensor.

JOURNAL BY THE DEPARTMENT OF MBA, MCA AND M.COM(FA), JYOTI NIVAS COLLEGE AUTONOMOUS 30
C. MQ-135 Sensor: Smoke detector
When it comes to measuring or detecting a particular Gas the MQ series Gas sensors are the
most inexpensive and commonly used ones. MQ135 is available as a module or as just the
sensor alone. If you are trying to only detect (not measuring PPM) the presence of a gas then you
can buy it as a module since it comes with an op-amp comparator and a digital output pin. But if
you planning to measure the PPM of a gas it is recommend buying the sensor alone without
module.
The MQ-135 Gas sensors are used in air quality control equipments and are suitable for detecting
or measuring of NH3, NOx, Alcohol, Benzene, Smoke, CO2. The MQ- 135 sensor module
comes with a Digital Pin which makes this sensor to operate even without a microcontroller and
that comes in handy when you are only trying to detect one particular gas. If you need to
measure the gases in PPM the analog pin need to be used. The analog pin is TTL driven and
works on 5V and so can be used with most common microcontrollers.
If you are looking for a sensor to detect or measure common air quality gases such as CO2,
Smoke, NH3, NOx, Alcohol, Benzene then this sensor might be the right choice for you.

JOURNAL BY THE DEPARTMENT OF MBA, MCA AND M.COM(FA), JYOTI NIVAS COLLEGE AUTONOMOUS 31
C. Jumper Wires:
A jumper wire (also known as jump wire, or jumper) is an electrical wire, or group of them in a
cable, with a connector or pin at each end (or sometimes without them – simply "tinned"), which
is normally used to interconnect the components of a breadboard or other prototype or
test circuit, internally or with other equipment or components, without soldering.
Individual jump wires are fitted by inserting their "end connectors" into the slots provided in a
breadboard, the header connector of a circuit board, or a piece of test equipment.
Here we use to connect sensor devices to nodemcu.
D. Breadboard:
A breadboard is a solder less device for temporary prototype with electronics and test circuit
designs. Most electronic components in electronic circuits can be interconnected by inserting
their leads or terminals into the holes and then making connections through wires where
appropriate. The breadboard has strips of metal underneath the board and connects the holes on
the top of the board. The metal strips are laid out as shown below. Note that the top and bottom
rows of holes are connected horizontally and split in the middle while the remaining holes are
connected vertically.

JOURNAL BY THE DEPARTMENT OF MBA, MCA AND M.COM(FA), JYOTI NIVAS COLLEGE AUTONOMOUS 32
E. Blynk app:
Blynk have been used to collect all the data. Blynk was designed for the Internet of Things. It
can control hardware remotely, it can display sensor data, it can store data, visualize it and do
many other cool things. Blynk supports hardware platforms such as Arduino, Raspberry Pi, and
similar microcontroller boards to build hardware for your projects. Blynk supports the following
connection types to connect your microcontroller board (hardware) with the Blynk Cloud and
Blynk's personal server: Ethernet, Wi-fi, Bluetooth, Cellular, and Serial.
Firstly, the user need to sign up make an account. Next, Blynk will send the Auth token to the
email that have been register. After the Authtoken have been send, the user can use the
application and can make their own data such as gauge, display value, button, table and others.
F. Temperature and Humidity
The device is assembled by interfacing DHT 11 Temperature and Humidity Sensor and
nodemcuesp8266 with the IOT board. The assembled circuit has the following circuit
connections:

JOURNAL BY THE DEPARTMENT OF MBA, MCA AND M.COM(FA), JYOTI NIVAS COLLEGE AUTONOMOUS 33
First of all the library for DHT sensor and Liquid Crystal Library is imported. The library is
automatically added by the nodemcu web IDE. A constant is defined to denote pin to which
DHT 11 sensor is interfaced and a constant is defined to denote variant of DHT sensor. An
object of blynk type is instantiated and mapped to the pins connecting the blynk with the
nodemcu board. A function dht wrapper is declared and called in instantiation of DHT object.
Some variables to hold the sample timing for DHT sensor and counter value are declared. A
character array is declared to hold the sensor data to be sent to the webpage. Another character
array holding the Auth Token is defined. The auth token that was sent to the user mail should be
stored in this character array.
The data is displayed on the app in real- time and gets updated in every 1 seconds. Check out the
program code to learn how nodemcu reads temperature and humidity from DHT-11 sensor and
send it to the Blynk App

JOURNAL BY THE DEPARTMENT OF MBA, MCA AND M.COM(FA), JYOTI NIVAS COLLEGE AUTONOMOUS 34
G. Smoke detector:
Like above Blynk set up with respect smoke detector sensor values
Here a smoke detector sensor is used. Firstly analog pin(A0) connected to analog pin in
nodemcu, Secondly signal pin connected to 3V3 pin in nodemcu. Third ground pin connected to
ground pin(GND) in nodemcu
JOURNAL BY THE DEPARTMENT OF MBA, MCA AND M.COM(FA), JYOTI NIVAS COLLEGE AUTONOMOUS 35
H. Rainfall Prediction:
Here, Austin Weather dataset to predict rainfall using linear regression is used. This dataset
contains data for every date from 2013-12-21 to 2017-07-31
a. Algorithm: Linear Regression
Linear regression is a linear approach to modeling the relationship between a scalar
response and one or more explanatory variables (also known as dependent and
independent variables). The case of one explanatory variable is called simple linear regression;
for more than one, the process is called multiple linear regressions. This term is distinct from
multivariate linear regression, where multiple correlated dependent variables are predicted, rather
than a single scalar variable.
b. Implementation
Rainfall Prediction is the application of science and technology to predict the amount of rainfall
over a region. It is important to exactly determine the rainfall for effective use of water
resources, crop productivity and pre-planning of water structures. Regression to predict the
amount of rainfall. Linear Regression tells us how many inches of rainfall we can expect.
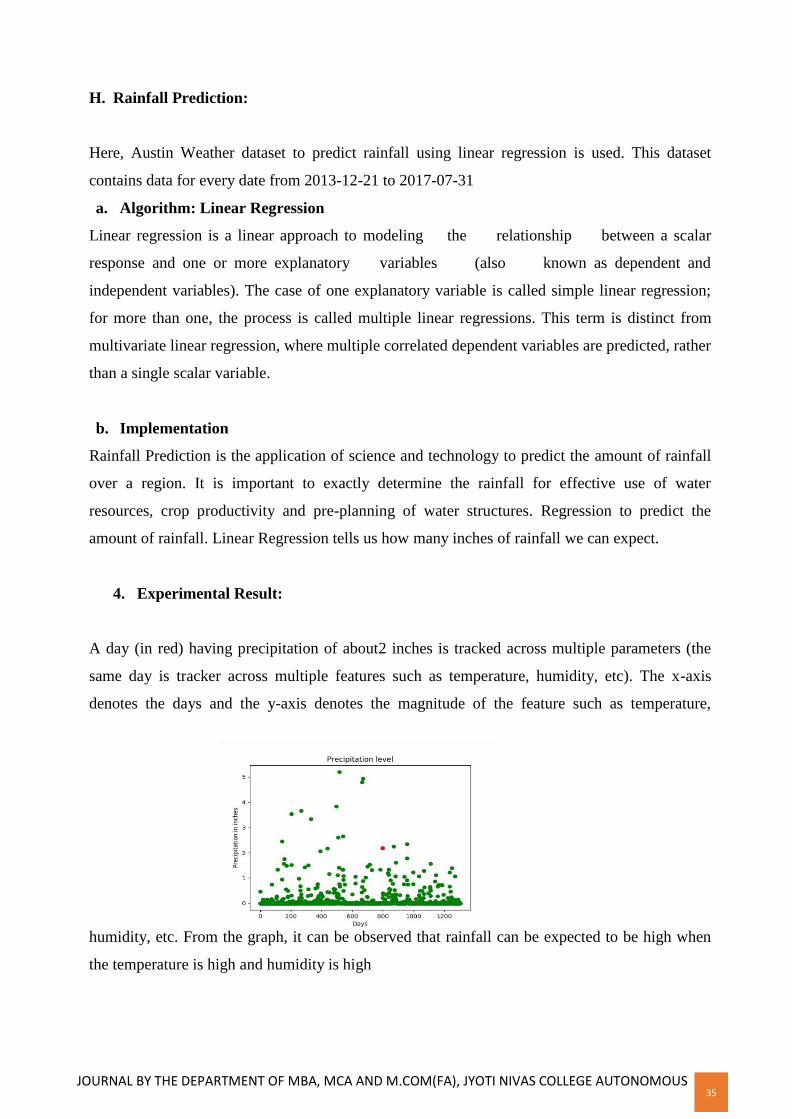
4. Experimental Result:
A day (in red) having precipitation of about2 inches is tracked across multiple parameters (the
same day is tracker across multiple features such as temperature, humidity, etc). The x-axis
denotes the days and the y-axis denotes the magnitude of the feature such as temperature,
humidity, etc. From the graph, it can be observed that rainfall can be expected to be high when
the temperature is high and humidity is high

JOURNAL BY THE DEPARTMENT OF MBA, MCA AND M.COM(FA), JYOTI NIVAS COLLEGE AUTONOMOUS 36
5. Conclusion:
This project achieved the objectives where to build weather monitoring system that can check
the weather conditions using application, Blynk. Next, the project also able to display the current
weather conditions weather monitoring system. The implementation of a system to monitor the
weather using Internet of Things (IoT) is accomplished. The system provides a low power
solution for monitoring and environment. The monitoring system has been tested in outdoor
environment and successfully updated data from sensor. The data will be used for various type of
analysis and it can be shared to other people or users.
References:
1. P.Susmitha, G. Sowmyabala, Design and Implementation of Weather Monitoring and
Controlling System, International Journal of Computer Applications.
2. Ashish Sharma, Gaurav Tiwari, Durvijay Singh, Low cost Solution for Temperature and
Humidity monitoring and control System using Touch Screen Technology, International
Journal of Latest Research in Engineering and Technology.
3. Wei. Q, Jin. N, Lou X, Ma. R, Xu.J, ―Software design for water environment remote
monitoring system based on mobile devices‖, Applied Mechanics and Materials, pp.
2027-2032, 2011.
4. Arduino Based Weather Monitoring System. AUTHOR: Karthik Krishnamurthi, Suraj
Thapa, Lokesh Kothari, Arun Prakash.
5. Internet of Things (IoT) Based Weather Monitoring system, Bulipe Srinivas Rao1, Prof.
DrK. Srinivasa Rao2, Mr N. Ome3, international Journal of Advanced Research in
Computer and Communication Engineering, ISO 3297:2007 Certified, Vol. 5,
Issue9,September 2016.
6. https://developer.android.com/training/basics/firstapp

37
DHII
Vol. XXIII January 2022
Journal Dept. of MBA, MCA and M. Com (FA)
Jyoti Nivas College Autonomous
OBJECT DETECTION BASED ON COLOR
~
Pavithra D
Abstract
Object detection is a computer technology related to computer vision and image processing that
deals with detecting instances of semantic objects of a certain class (such as humans, buildings,
cars) in digital images and videos. Well-researched domains of object detection include face
detection and pedestrian detection. Object Detection refers to detecting an object in a given
image. This is done in several ways like Image Processing, Deep Learning or Convolutional
Neural Network (CNN) many ways. In all the things it captures the image and detects the object
either by extracting the features through the color or shape etc. Object Detection is required in
many of field. There are several algorithms to perform this, but the efficiency depends on the
algorithm we choose.
Keywords: Gaussian Filter, RGB, HSV, Object Detection, Deep Learning, Machine Learning,
Convolutional Neural Network and Recurrent Neural Network
I. INTRODUCTION
Object Detection is a well-known computer technology connected with computer vision and
image processing that focuses on detecting objects or its instances of a certain class (such as
humans, buildings, flowers, animals, fruits etc) in digital images and videos. There are various
applications of object detection like face detection, character recognition, and vehicle calculator,
pedestrian detection so on.
Object detection can be used for various purpose including retrieval and surveillance. In these
various basic concepts used in object detection while making use of OpenCV library of python,
improving the efficiency and accuracy of object detection are presented.
It is widely used in computer vision tasks such as image annotation, activity recognition, face
detection, face recognition, vehicle recognition, video object co-segmentation, It is also used in

38
tracking objects, for example tracking a ball during a football match, tracking movement of a
cricket bat, or tracking a person in a video, or tracking a vehicle in self driving car so on.
Every object class has its own special features that help in classifying the class. For example, all
apples are red, for detecting object apple color detection and RGB color space is used to detect
apple color red by giving range.
Object detection methods generally fall in either machine learning-based approaches or deep
learning-based approaches. For Machine Learning approaches, it becomes necessary to first
define features using one of the methods below, then using a technique such as support vector
machine (SVM) to do the classification. On the other hand, deep learning techniques are able to
do end-to-end object detection without specifically defining features, and are typically based on
convolutional neural networks (CNN).
Digital image processing deals with manipulation of digital images through digital computer. It
is a subfield of signals and systems but focus particularly on images. DIP focuses on developing
a computer system that is able to perform processing on an image. The input of that system is a
digital image and the system process that image using efficient algorithms, and gives an image as
an output. The most common example is Adobe Photoshop. It is one of the widely used
application for processing digital images.
Signal processing is a discipline in electrical engineering and in mathematics that deals with
analysis and processing of analog and digital signals, and deals with storing, filtering, and other
operations on signals. These signals include transmission signals, sound or voice signals, image
signals, and other signals etc. Out of all these signals, the field that deals with the type of signals
for which the input is an image and the output is also an image is done in image processing. As
its names suggests, it deals with the processing on images. It can be further divided into analog
image processing and digital image processing.
Analog image processing is done on analog signals. It includes processing on two dimensional
analog signals. In this type of processing, the images are manipulated by electrical means by
varying the electrical signal. The common example include is the television image. Digital image
processing has dominated over analog image processing with the passage of time due its wider
range of applications. An image is nothing more than a two-dimensional signal. It is defined by
the mathematical function f(x,y) where x and y are the two co-ordinates horizontally and
vertically. The value of f(x,y) at any point is gives the pixel value at the point of an image.
Machine vision or computer vision deals with developing a system in which the input is an
image and the output is some information. For example: Developing a system that scans human
face and opens any kind of lock. This system would look something like this.

39
II. LITERATURE REVIEW
In paper [1] presents a review of the various techniques used to detect an object, localize an
object, categorize an object, extract features, appearance information, and many more, in an
images and videos. The comments are drawn based on the studied literature and key issues are
also identified relevant to the object detection. Information about the source codes and online
datasets is provided to facilitate the new researcher in object detection area. An idea about the
possible solution for the multi class object detection is also presented. There are various methods
for detecting objects in images as well as in videos. The process of OD is classified into five
major categories namely sliding window-based, contour-based, graph-based, fuzzy-based and
context-
In paper [I ]this paper proposed algorithm deformable illumination, to address the problem of
illumination variance in natural images. In deformable illumination changes, shape variance also
presents a challenge for detecting and recognizing objects in real scenes. Same active idea can
also be applied to object detection in such a way that even if object colors are changed between
model and scene.
In paper [3] This paper as SIFT feature-based k-NN classifier and a GIST feature is based on
SVM classifier are implemented. GIST features based SVM classifier using Gaussian kernel
showed a better classification accuracy than the SIFT feature-based k-NN. Thus, SVM classifier
with Gaussian kernel is finalized for query image classification. In the second phase of this work,
we will implement a k-NN classifier which will make use of SIFT feature-based on similarity
matrix to retrieve the images containing the query image.
In paper [4] This paper mainly focused on working on large real-world datasets.
Experimented using various state-of-the-art image representations and SVM classifiers for the
Task of semantic video retrieval. We have shown how the choices of representations, classifier
parameters, noise in the annotations affect the performance of the classifiers. We have also
shown that fast intersection kernel can be a good choice for this task of semantic video
retrieval. Possible future directions in this work are more experiments on feature parameters and
replacing the local feature descriptors namely SIFT with other descriptors which can be
computed in a faster manner. Also, we have used a generic approach, that is we have used a
common set of features and classification methodologies for all the classes.
In paper [5] This paper introduced a model-based object detection method which uses only
shape-fragment features. The object shape model is learned from a very small set of training
images. This paper proposed a novel framework for object detection. In training stage, object
class model can be represented using codebook of shape fragments. By comparing the shape
fragments of the detect image to the codebook, of distribution of object center image is
successfully achieved. Experimental comparisons with other methods were carried out to
evaluate the proposed method, and test results shows the method are more distinctive and robust
to image transformation and background clutter.

40
Table 1 depicts the existing techniques used.
Table1: Existing Methods
Paper Techniques Used
[1] A review and an approach for object
detection
Sliding window-based, context-based,
contour-based, fuzzy-based, and graph-based
[2]Object Detection and Recognition Via
Deformable Illumination and Deformable
Shape
Deformable illumination
[3]Object Recognition in Images SIFT feature, GIST feature, K-NN classifier
[4]Efficient SVM based Object Classification
and Detection
SVM classifier
[5] A Learning Algorithm for Model based
Object Detection
Shape-fragment feature
III. PROPOSED METHODOLOGY
The main aim of this work is to build a system that can detect the object from the given image. In
proposed work we train the system by giving some train data and then we try to detect the object. To
detect object, we use color detect and RGB color space to fetch the features. According to features,
shape and color of the object we train data.
Algorithm
• Step 1: Read the input image.
• Step 2: Convert the input image from BGR to RGB.
• Step 3: Resize the image to width of 700px

41
• Step 4: To remove noise and to blur, Gaussian blur filter is applied on the
image.
• Step 5: To focus on color, segmentation convert RGB image into HSV
• Step 6: Filter by color by minimum and maximum red amount.
• Step 7: Brightness of color by minimum and maximum hue amount.
• Step 8: Combine both filter color and brightness color.
• Step 9: To clean up and to circle we use ellipse.
• Step 10: It overlay the cleaned mask on image.
• Step 11: It circle the biggest apple.
• Step 12: covert the image back from RGB to BGR.
• Step 13: Detect the image.
• Step 14: write the new output image in .jpg.
Flow Diagram

42
IV. IMPLEMENTATION AND RESULTS
Environmental setup
Python Spyder environment installed ideally with Python 3.7.3, install libraries like Pandas,
NumPy. Minimum of 8GB RAM is required. Color-based, contour-based Algorithm is used for
feature extraction.
Libraries
Install the libraries like NumPy, OpenCV.
OpenCV: OpenCV-Python is a library of Python bindings designed to solve computer vision
problems. ... OpenCV-Python makes use of NumPy, which is a highly optimized library for
numerical operations with a MATLAB-style syntax. All the OpenCV array structures are
converted to and from NumPy arrays.
NumPy: NumPy is a general-purpose array-processing package. It provides a high-performance
multidimensional array object, and tools for working with these arrays. It is the fundamental
package for scientific computing with Python.
Experimental Results
As per object detection it should detect all 3 apple which are red and it should mask the red
position as the value given in the code. It will only mask red position and should circle the
detected object in the image; apple will not be in full red color it has some yellow shade and
green color that will not be masked as per the train data. All 3 apples are near to each other and it
is big apples and it is easy for system to recognize fast.
INPUT IMAGE:

43
OUTPUT IMAGE:
V. SCOPES AND APPLICATION
Tracking objects
People counting
Person detection
Vehicle detection
Automated CCTV surveillance
VI. CONCLUSION
Digital image processing involves in manipulation of the digital image over a screen, color
detection, contour-based detection and RGB Color space showed better result to detect object.
RGB color space is finalized compare to other color space to detect object in an image.
Object recognition is one of the fundamental tasks in computer vision. It is the process of
finding or identifying objects in digital images, stored videos and real time videos.
REFERENCES
1. Kartik Umesh Sharma* and Nileshsingh V. Thakur A review and an approach for object
detection, 2016 International Conference on Information Science (ICIS), 12-13 Aug. 2016.
2. M. M.K. and M. S. B.S., "Object recognition in images," 2016 International Conference
on Information Science (ICIS), Kochi, 2016, pp. 126-130, doi:
10.1109/INFOSCI.2016.7845313.
3. Sreekanth Vempati(Efficient SVM based Object Classification and Detection)

44
4. Q. Zhou, L. Ma, M. Celenk and D. Chelberg, "Object Detection and Recognition via
Deformable Illumination and Deformable Shape," 2006 International Conference on
Image Processing, Atlanta, GA, 2006, pp. 2737-2740, doi:
10.1109/ICIP.2006.313113.Chen Guodong(A Learning Algorithm for Model based
Object Detection)
5. Khushboo Khurana, Reetu Awasthi,Techniques for Object Recognition in Images and
Multi-Object Detection, International Journal of Advanced Research in Computer
Engineering & Technology (IJARCET) Volume 2, Issue 4, April 2013

45
DHII
Vol. XXIII January 2022
Journal Dept. of MBA, MCA and M. Com (FA)
Jyoti Nivas College Autonomous
BRAIN TUMOR SEGMENTATION OF MRI IMAGES
~
Shilpa k
Abstract
The goal of segmentation is to simplify and change the representation of an image into something
that is more meaningful and easier to analysis. Tumor segmentation from MRI images is important
part of medical images experts. There are different segmentation techniques to detect MRI brain
tumor. Image segmentation is one of the fundamental approaches of digital image processing. Brain
tumor segmentation is MRI has become a popular research are in the filled of medical required
region. Here I have used a different types of segmentation is used to detect the tumor part. In the
work different segmentation methods are used to segment brain tumors and compare the result of
segmentation by using correlation analysis and see the best technique that could be applied to MRI
images. In this work, I have used python and open CV and different python libraries.
Keywords: Segmentation, MRI images.
1. INTRODUCTION
The goal of segmentation is to simplify and change the representing of an image into something
that is more meaningful. Is typically used to locate object and boundaries(line, curve) in images.
Brain tumor segmentation is the process of separating the tumor from normal brain tissues.
Segmentation is the process of dividing an image into region with similar properties such as gray
level, color, texture, brightness and contrast. The role of segmentation is to sub dividing the object
is an image. Segmentation is to dividing an image into segment, you can process only the
important segment of image instead of processing the entire image. In the segmentation of brain
tumor and tissues from two dimensional magnetic imaging(MRI). To develop this work I have
used python, open CV and different libraries.

46
TYPES OF SEGMENTATION:
Thresholding segmentation:
Threshold segmentation is process of a partition a digital image into multiple segments. Each of
the pixel in region are similarity with respect to some characterizes for completed properly.
Such color intensity or texture. There are different types of threshold methods are local threshold
after the global threshold function is applied to the Di-com image, there problem a filtering
algorithm for the image has been applied. Threshold method is simplest methods in
segmentation. These methods based on a threshold value to turn a gray image into binary image.
K-Means clustering:
Algorithm attempts to split a given anonymous data set(a set containing number of information
as to class identify ) into fixed number(k) of cluster. The resulting classifier is used to classify
(using k=1) the data and thereby produced an initial randomized set of cluster. Cluster are
formed on the basic of some similarity feature like gray level intensity of pixel and distance of
pixel intensity. Main advantage of this algorithm is simplicity the main drawback is that k the
number of cluster must be determined.
Watershed Segmentation:
Watershed segmentation is another region- based method that has its origin in mathematical
morphology watershed separate basins from each other. The watershed transform decomposes an
image completely and thus assigns each pixel either to a region or a watershed. The algorithm
works as a gray scale image. During the successive flooding of the gray value relief, watersheds
with adjacent catchment basins are constructed. This flooding process is performed on the
gradient image.
Fuzzy C-Means clustering:
Fuzzy c-means(FCM) algorithm is one of the most popular methods for image segmentation. In
this paper, we present fuzzy c-means cluster segmentation algorithm based on modified
membership that incorporates spatial information into the membership function for clustering.
Edge based Clustering:
In edge based segmentation, an edge filter is applied to the image, pixel is classified as edge or
non-edge depending on the filter output, and pixels which are not spearing by an edge allocated
to the same categories.
47
Edge detection is an image technique for finding the boundaries of object with in image. It works
by detecting discontinuities in brightness with in images. It works by detecting images, Edge
detection and data extraction in areas such as image processing, computer vision and machine
vision.
I. LITERATURE REVIEW
In paper[1] information is covered through images. Image is a process where input image is
processed to get output also an image. Main aim of all image processing technique is to
recognize the image or object under considering easier visually. All the images that show the
physical attributes distribution. Medical imaging modalities as in MRI, CT scan mostly depends
the physical attributes distribution.
In paper [2] medical imaging, 3D segmentation of imaging plays a virtual role in stages which
occur before implementing object recognition.3D image segmentation helps in automated
diagnosis of brain diseases and helps in qualitative and quantitative analysis of image such as
measuring accurate size and volume of detecting portion.
Tumors can grow abruptly defecting in neighbor tissues also, which gives an overall abnormal
structure for healthy tissue as well. In this paper we will develop a technique of 3D segmentation
of a brain tumor by using segmentation in conjunction with morphological operation.
In paper [3] Digital analysis of image is an existing research area that require a synergy between
technical, engineer and bio - medical various other discipline. Segmentation is an operation that
I used to apportion the image according to similarity, discontinuity or by determining the edges
to explore the information. The main objective of studding of image segmentation technique is to
have best recognition of object of interest and to observe the feature in a particular image that
can be separated from its background. This paper planned is in three sections further Section 1
includes the detailed discussion about various image segmentation technique. Section 3 conclude
over all study.
In paper [4], Digital image processing is the use of computer algorithms to perform image
processing on digital images. Image segmentation is an important and challenging process of
image processing. Image segmentation technique is used to partition an image into meaningful
parts having similar features and properties. The main aim of segmentation is simplification. i.e.
representing an image into meaningful and easily analyzable ways. Image segmentation is

48
necessary first step in image analysis. The goal of image segmentation is to divide an image into
several parts/segments having similar features or attributes. The basic applications of image
segmentation are: content based image retrieval, Medical imaging, Object detection and
Recognition Tasks, , Automatic traffic control systems and Video surveillance, etc. The image
segmentation can be classified into two basic types: Local segmentation (concerned with specific
part or region of image) and global segmentation (concerned with segmentation the whole image
consisting of large number of pixels. The image segmentation approaches can be categories into
two types based on properties of images.
In paper [5], A brain tumor is an abnormal growth of tissue in the brain or central spine that can
disrupt proper brain function. Doctors refer to a tumor based on where the tumor cells originated
whether they are cancerous or not. There are various types of tumors such as Benign: The least
aggressive type of brain tumor is often called a benign brain tumor. They originate from cells
within or surrounding the brain, do not contain cancer cells, grow slowly, and typically have
clear borders that do not spread into other tissue. Malignant: Malignant brain tumors contain
cancer cells and often do not have clear borders.
In paper [6], Image segmentation may be defined as a technique, which partitions a given image
into a finite number of non-overlapping regions with respect to some characteristics, such as gray
value distribution etc. Segmentation of medical images is required for many medical diagnoses
like radiation treatment, planning volume visualization of regions of interest (ROI) defining
boundary of brain tumor and intra cerebral brain hemorrhage, etc. Many approaches are based on
fuzzy logic means and Neural Networks (NN) distribution, etc. segmentation of medical images
is required for many medical diagnoses like radiation treatment, planning volume visualization
of regions of interest (ROI) defining boundary of brain tumor and intra cerebral brain
hemorrhage, etc. basically image segmentation can be classified into three categories. Edge
based method, region based method and pixel based methods.
In paper [7], morphological operation and extraction of feature of tumor. Brain is the most
important and vital organ of the human body. The control and coordination of all the other vital
structures is carried out by the brain. The tumor is formed by the uncontrolled multiplication of
cell division. Numerous techniques were developed to detect and segment the brain tumor. Using
thresholding and morphological operations efficient brain tumor segmentation is carried out.
This is the efficient algorithm where segmentation of tumor is carried out and its features such as
centroid, perimeter and area are calculated from the segmented tumor. To detect the brain tumor,
scanned MRI images are given as the input. The work here helps in medical field to detect tumor

49
and its features help in giving the treatment plan to the patient. The entire paper is divided in to
seven sections which are described in detailed in the following sections.
II. Proposed Methodology
In this project we have to build a system that can detect the tumor from the given image. In our
proposed work we train the system by giving some train data and then we try to detect the tumor.
To detect tumor, here i have use the MRI brain images.
Here I have used the correlation co- efficient. The use to measure the strength of the relationship
between the two images.
The value range between -1.0 and 1.0
A calculated number greater than 1.0 or less than -1.0
Correlation Co-efficient:
The performance and the image quality are evaluated using correlation co- efficient.
This is the function used to do correlation (co-efficient) between two images (matrices)
r=corr2 (A, B) Computes the correlation coefficient between A and B.
Algorithm:
Step1: Input images It will read the image
Step2: MRI images image convert into gray scale image. After reading input
Step3: Preprocessing steps
Step4: Segmentation Methods
Step5: Output images.
Finally we will get the output image
How does image segmentation work:
We can divide or partition the image into various parts calls segments. It is not a great idea to
process the entire image at the same time as there will be region in the image which do not contain
any information.
By dividing the image into segments we can make use of the important segments for
processing the image. An image is a collection or set of different pixels. We group together the
pixels that have similar attributes using image segmentation .it will give you a practical idea of
image segmentation.
50
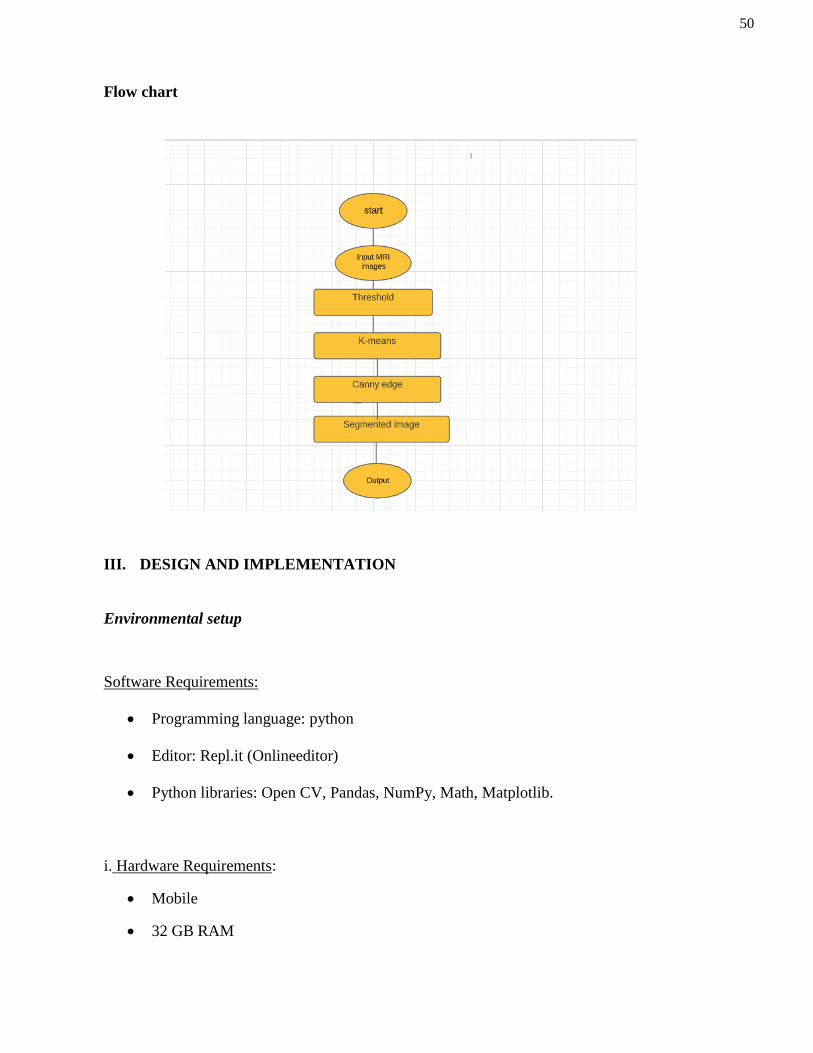
Flow chart
III. DESIGN AND IMPLEMENTATION
Environmental setup
Software Requirements:
Programming language: python
Editor: Repl.it (Onlineeditor)
Python libraries: Open CV, Pandas, NumPy, Math, Matplotlib.
i. Hardware Requirements:
Mobile
32 GB RAM

51
Dataset Used:
I have used grayscale image. A grayscale images, the pixel value is a single number that
represents the brightness of the pixel. The most common pixel format is the byte image, where
this number is stored as an 8-bit integer giving a range of possible value from 0to 255.Typically
zero is taken to be black and is taken to be white
The average methods takes the average value(R,G and B) as the grayscale=(R+G+B).
I have collected brain tumor dataset fromgaggle.com
I have used the jpeg and jpg format images
IV. RESULTS AND DISCUSSION
Input(Threshold):
OUTPUT:

52
Values:
Threshold method Correlation
Image1 0.9408
Image2 0.9485
Image3 0.9470
Image4 0.9404

53
INPUT(K-means cluster):
OUTPUT:
Values:
K means cluster Value
Image1 0.9408
Image2 0.9831
Image3 0.9877

54
INPUT(Canny edges):
OUTPUT:
Values:
Canny Value
Image1 0.9019
Image2 0.0503
Image3 0.9589

55
V. CONCLUSION
This research work explores the implementation technique on the MRI Images of brain. The
segmentation technique that is compared (Threshold-means clustering, canny edges).The input image
is compared against the output images based on statistical parameters of correlation.
In this research segmentation algorithm used and these algorithm compared based on their accuracy.
These three algorithm are easy and efficient. But after applying k-means clustering it showing the
tumor position clearly it is giving good result
VI. REFERENCES
1) Naveen Tokas1 , Shruti Karkra2* , Manoj Kumar Pandey, ―Comparison of Digital Image
Segmentation Techniques‖, International Journal of Computer Science and Mobile Computing,
Vol.5 Issue.5, May- 2016.
2) Dilpreet Kaur1 , Yadwinder Kaur2(―Various Image Segmentation Techniques‖) International
Journal of Computer Science and Mobile Computing, Vol.3 Issue.5,May- 2014
3) D. Manju1 , Dr. M. Seetha2 , Dr. K. Venugopala Rao3(Comparison Study of Segmentation
Techniques for Brain Tumor Detection‖)International Journal of Computer Science and Mobile
Computing Vol.2 Issue. 11, November- 2013
4) Siddhi N. Nerurkar (―Brain Tumor Detection using Image Segmentation‖)International Journal of
Engineering Research in Computer Science and Engineering
5) P.Jayapriya, Dr. S.Hemalatha (―Comparative Analysis Of Image Segmentation Techniques And
Its Algorithm‖)international journal of scientific & technology research volume 8, issue 10, October
2019.
6) Alan Jose1 , S.Ravi2 , M.Sambath (―Brain Tumor Segmentation Using K-Means Clustering And
Fuzzy C-Means Algorithms‖) International Journal of Innovative Research in Computer and
Communication Engineering Vol. 2, Issue 3, March

56
DHII
Vol. XXIII January 2022
Journal Dept. of MBA, MCA and M. Com (FA)
Jyoti Nivas College Autonomous
E-VOTING SYSTEM BY FACE DETECTION AND RECOGNTION
~
Rakshitha V
Abstract
There are some drawbacks in conventional voting system such as damage of machines, chances
of violence, dummy voting and problem of proper monitoring. Manual voting system has been
followed in many parts of our country so people could not poll their vote because it is place
oriented and there is region wise distribution, voters need to reach the place of voting. To
overcome these problems a new confidential E-Voting system is introduced which provides
security to the election system by detection and recognizing voter’s face who is going to cast
his/her vote. In this system the voter’s face is detected, captured and stored in the database then
match the captured image with the image already stored on database to recognize the person. If
match occurs then the person is allow to cast their vote once the vote is casted the same person
will not be permitted to cast votes this provide security against duplicate vote and fraudulent and
make the system more efficient and user friendly
Keywords::FDR, EVM
I. INTRODUCTION
India is considered as world's biggest majority rule governments with the network of around 1
billion. Voting hypothesis started formally in the18th century and recommendations for the
voting framework are been made from that point onward. The Present voting instrument has
numerous security issues. Over a significant time span involvement of the constituent process
authorized to center on the utilization of most recent advancements in e-voting process. The
improvement of the voting framework can be in the field of extra security in the verification
process. The headway in the present voting framework can be made utilizing biometrics.
Considering how far e-commerce has come, why can‘t people vote online in national and state
elections with the same security and convenience that they enjoy while banking or buying

57
books? Online voting system is a voting system in which the election data is recorded, stored and
processed primarily as digital information and it needs to address, obtain, mark, deliver, and
count ballots via computer. Therefore voter identification and authentication techniques are
essential for more secure platform mechanisms to overcome vulnerabilities of the client used by
the voter to cast her vote. Web based voting allows the voter to vote from any place in state or
out of state. Several voter identification and authentication techniques were introduced to secure
voting platforms and overcome fake voting.
FDR (Face Detection and Recognition) is used as an Authentication technique in online voting.
FDR system detects the face from an image captured using a webcam and recognize face from e-
voting database and check if the two images match. If a match accrues, then verify that the law
and roles of voting are not violated then allow him to vote.
II. EXISTING SYSTEM
a. Paper Based Voting
To the degree India is concerned, the voting system began in the eighteenth century itself. There
are distinctive voting systems open as demonstrated by its progression with advancements. Paper
based voting came into existence before the invention of internet. In this method voting is made
through paper and decisions are taken according to the majority of voting.
After the process of paper voting in the polling booth. The paper votes by the candidates are
counted to find the majority of votes for the particular symbol or name.
Impediments of paper-based voting:
It is extremely hard to gather the polling booths and transport to fundamental focuses.
Errors may happen amid manual tallying.
Need more labor for security.
III. PROPOSED SYSTEM
The aim of proposed system is to develop a system of improved facilities. The proposed system
can overcome all the limitations of the existing system. The system provides proper security and
reduces the manual work. The existing system has several disadvantages and many more
difficulties to work well. The proposed system tries to eliminate or reduce these difficulties up to
some extent. The proposed system will help the user to reduce the workload and mental conflict.
The proposed system helps the user to work user friendly and he can easily do his jobs without

58
time lagging. In this framework we make a thought of web based democratic framework utilizing
Biometric discovery for face. In this framework the voter's face is distinguished, clicked and
putted away in the database at that point coordinate the clicked picture with the picture present in
database to perceive the person. In the event that the two pictures coordinate, voter can give
his/her vote to their preferred chosen one. This will be all the more making sure about,
dependable, adaptable and less exhausting.
Functional Description
HTML
It's short for Hypertext Markup Language. It causes us to make electronic pages or records that
are shown on World Wide Web. It is a standard markup language for site pages. HTML
components are spoken to by <> labels. In this venture, we have to make a few layouts through
HTML.
PHP
PHP is a server side scripting language. that is used to develop Static websites or
Dynamic websites or Web applications. PHP stands for Hypertext Pre-processor, that
earlier stood for Personal Home Pages.
PHP scripts can only be interpreted on a server that has PHP installed.
The client computers accessing the PHP scripts require a web browser only.
A PHP file contains PHP tags and ends with the extension ".php".

59
IV. IMPLEMENTATION
In training set image block, firstly the Eigenface of image in the database (trained image) is
obtained. Then the weight W1 is calculated by using the Eigenface and the training set. In the
testing set image block, input unknown image X which is the captured image is taken. The
weight W2 is calculated using the input image and the Eigenface. Value of D is calculated by
finding the average of distances between W1 and W2. If the D value is less than 0, then the face
is recognized. Then the input image X and W2 values are stored. If the D value is greater than 0,
then the face is not recognized.

60
Steps:
Face Deduction
Eigenface Algorithms
Feature Segregation
Detected Features
Face Features (Edge, Line and Rectangle)
Extracted image
V. CONCLUSION
We have made this project to design and develop an efficient and economical system which is
capable of detecting the face and test it with the database image. To make voting system more
secures and providing it an online platform, this project is very beneficial. Other purpose to
making this project is to save the time, money or men power and providing top class security.
On line voting allow voter to vote 24 hour per day and 7 day per week also allow him to vote
from anywhere in his state or out of state. In this research, we proposed FRD systems based on
Eigenface is used as authentication technique in online voting. Both systems detect the face from
an image captured using a webcam and recognize face from database and check if the two
images match. If a match accrues, then verify that the law and roles of voting are not violated
then allow him to vote.
REFERENCES
a. Evaluation of image pre-processing techniques for Eigen face based face recognition. In
Proc. of the Second International Conference on Image and Graphics
b. ―Performance & Evaluation of Face Recognition Algorithm‖ World Journal of Science &
Technology.
c. E-Voting System Using Face Recognition And Dactyl gram‖, International Engineering
Research Journal (IERJ)
d. ―Secured Online Voting System Using Face Recognition‖, International Journal of Advanced
Research In Science Management And Technology
e. A Proposed Method Of Online Voting By Face Detection‖, International Journal Of
Advanced Technology in Engineering and Science

JOURNAL BY THE DEPARTMENT OF MBA, MCA AND M.COM(FA), JYOTI NIVAS COLLEGE AUTONOMOUS 61
61
DHII
Vol. XXIII January 2022
Journal Dept. of MBA, MCA and M. Com (FA)
Jyoti Nivas College Autonomous
AUTO TAGGING OF HUMAN IMAGES
~Afrah Hashmi AG
Abstract
In the current era the whole world revolves around social media. Image Tagging is on such
technology which will be very useful to recognize the people in the images and tag those
people based on their name in the social website. In this paper we are going to see how image
tagging works and by using Machine Learning algorithms like Local Binary Pattern
Histogram (LBPH) we are going to train the system, detect the faces in the image and
recognize the people in the images.
The objective of this application is to use the Machine Learning algorithms to tag the people
in the images. First the system should detect the faces in the images compare the features of
the detected face with the trained data. If the features match with the detected face, the
display the name of the person in the image above their faces.
Keywords:: LBPH, machine learning
I. INTRODUCTION
The need for facial recognition systems is increasing day by day. They are being used in entrance
control, surveillance systems, smart phone unlocking etc. In this article we will use LBPH to
extract features from an input test image and match them with the faces in system's database.
Whileinitiallyaformofcomputerapplication,facialrecognitionsystemshaveseenwiderusesinrecenttim
eson smart phones and in other forms of technology, such as robotics. Because computerized
facial recognition involves the measurement of a human's physiological characteristics facial
recognition systems are categorized as biometrics. Although the accuracy of facial recognition
systems as a biometric technology is lower than iris recognition and finger print recognition, it is
widely adopted due to its contactless process. Facial recognition systems have been deployed in
advanced human-computer interaction, video surveillance and automatic indexing of images. It is
not so easy to logically identify these individual components in the face. But, one can say that
there are several overlapping components of the face which are individually responsible for the
perception of emotion, age and the person himself.

JOURNAL BY THE DEPARTMENT OF MBA, MCA AND M.COM(FA), JYOTI NIVAS COLLEGE AUTONOMOUS 62
62
The objective of this project is to identify the human faces in the image and recognize the people
in the image. By using some efficient classifiers like haar cascade, machine learning algorithms
like Local Binary Pattern Histogram(LBPH) and some available dataset official images, first the
faces in the image has to be detected and then the faces has to be recognized by comparing the
features in the data set. The recognized faces are highlighted and the name of the person is labeled
above the face.
(a) (b) (c)
Figure1: (a) Akshay Kumar (b) Alia Bhatt (c) Alexandra Daddario
II. LITERATURE REVIEW
Machine learning is a method of data analysis that automates analytical model building. It is a
branch of artificial intelligence based on the idea that systems can learn from data, identify patterns
and make decisions with minimal human intervention. Local Binary Pattern(LBP) is a simple yet
very efficient texture operator which labels the pixel so fan image by thresholding the neighborhood
of each pixel and considers the result as a binary number. It was first described in 1994 (LBP) and
has since been found to be a powerful feature for texture classification. It has further been
determined that when LBP is combined with histograms of oriented gradients (HOG) descriptor, it
improves the detection performance considerably on some datasets. Using the LBP combined with
histograms we can represent the face images with a simple data vector.
In the first paper [1] authors used the pre-processing techniques such as Linear Image
Transformation and thresholding to detect the features such as eye and shape of the face. After
detecting the faces authors used the already trained data set to recognize the faces by using the
methodologies like Convolution Neural Network and Regional proposal.
In the first paper [2] authors used the pre-processing techniques such as Gamma Correction,
Difference of Gaussian Filtering and Contrast Equalization to detect the features such as eye and
shape of the face. After detecting the faces authors used the already trained data set to recognize the
faces by using the methodologies like Convolution Neural Network, Generating Heat Maps and
LBPH.

JOURNAL BY THE DEPARTMENT OF MBA, MCA AND M.COM(FA), JYOTI NIVAS COLLEGE AUTONOMOUS 63
63
In the first paper [3] authors used the pre-processing techniques such as Transformation, Scaling and
Haar Wavelet Transform to detect the features such as Selecting a Kernel. After detecting the faces
authors used the already trained dataset to recognize the faces by using the methodologies like
SupportVectorMachine.
In the first paper[4] authors used the pre-processing techniques such as Transformation and Scaling
to detect the features such as Face Outline, Eyes and Nose. After detecting the faces authors used
the already trained dataset to recognize the faces by using the methodologies like Conditional
Random Field.
Table1 depicts the existing techniques.
Table1.ExistingMethods
Paper Techniques Used
[1]Deep unified model for face recognition based
on CNN and edge computing.
Regional Proposal and Convolution Neural Network
[2] Face detection and Tagging using Deep
Learning
Convolution Neural Network, Generating Heat
Maps and LBPH
[3]Automated Photo Tagging in Facebook Support Vector Machine
[4]Auto tagging Facebook: Social Network
Context Improves Annotation
Conditional Random Field(CRF)
III. PROPOSEDSYSTEM
HAARCASCADE CLASSIFIER:
The core basis for Haar classifier object detection is the Haar-like features. These features, rather than
using the intensity values of a pixel, use the change in contrast values between adjacent rectangular
groups of pixels. The contrast variances between the pixel groups are used to determine relative light and
dark areas. Two or three adjacent groups with a relative contrast variance form a Haar-like feature. Haar-
like features, as shown in Figure 1 are used to detect an image. Haar features can easily be scaled by
increasing or decreasing the size of the pixel group being examined. This allows features to be used to
detect objects of various sizes.
LBPH (LOCAL BINARY PATTERN)ALGORITHM:
Local Binary Pattern (LBP)is a simple yet very efficient texture operator which labels the pixels of an
image by thresholding the neighborhood of each pixel and considers the result as a binary number.It was
first described in 1994(LBP) and has since been found to be a powerful feature for texture classification.
It has further been determined that when LBP is combined with histograms of oriented gradients (HOG)
descriptor, it improves the detection performance considerably on some datasets. Using the LBP

JOURNAL BY THE DEPARTMENT OF MBA, MCA AND M.COM(FA), JYOTI NIVAS COLLEGE AUTONOMOUS 64
64
combined with histograms we can represent the face images with a simple data vector.
As LBP is a visual descriptor it can also be used for face recognition tasks, as can be seen in the
following step-by-step explanation.
1. Parameters:
The LBPH uses 4 parameters:
Radius: the radius is used to build the circular local binary pattern and represents the radius
around the central pixel. It is usually set to 1.
Neighbors: the number of sample points to build the circular local binary pattern. Keep in
mind: the more sample points you include, the higher the computational cost. It is usually set
to 8.
Grid X: the number of cells in the horizontal direction. The more cells, the finer the grid, the
higher the dimensionality of the resulting feature vector. It is usually set to 8.
Grid Y: the number of cells in the vertical direction. The more cells, the finer the grid, the
higher the dimensionality of the resulting feature vector. It is usually set to 8.
Don‘t worry about the parameters right now, you will understand them after reading the next steps.
2. Training the Algorithm:
First, we need to train the algorithm. To do so, we need to use a dataset with the facial images of
the people we want to recognize. We need to also set an ID (it may be a number or the name of
the person) for each image, so the algorithm will use this information to recognize an input image
and give you an output. Images of the same person must have the same ID. With the training set
already constructed, let‘s see the LBPH computational steps.
3. Applying the LBP operation:
The first computational step of the LBPH is to create an intermediate image that describes the
original image in a better way, by highlighting the facial characteristics. To do so, the algorithm
uses a concept of a sliding window, based on the parameters radius and neighbors.

JOURNAL BY THE DEPARTMENT OF MBA, MCA AND M.COM(FA), JYOTI NIVAS COLLEGE AUTONOMOUS 65
65
Based on the image above, let‘s break it into several smallest so we can understand it easily:
Suppose we have a facial image in grayscale.
We can get part of this image as a window of 3x3 pixels.
It can also be represented as a 3x3 matrix containing the intensity of each pixel (0~255).
Then, we need to take the central value of the matrix to be used as the threshold.
This value will be used to define the new values from the 8 neighbors.
For each neighbor of the central value (threshold), we set a new binary value. We set 1 for
values equal or higher than the threshold and 0 for values lower than the threshold.
Now, the matrix will contain only binary values (ignoring the central value). We need to
concatenate each binary value from each position from the matrix line by line into a new
binary value (e.g.10001101). Note: some authors use other approaches to concatenate the
binary values (e.g. clockwise direction),but the final result will be the same.
Then, we convert this binary value to a decimal value and set it to the central value of the
matrix, which is actually a pixel from the original image.
At the end of this procedure (LBP procedure), we have a new image which represents
better the characteristics of the original image.
The LBP procedure was expanded to use a different number of radius and neighbors, it is
called Circular LBP.
It can be done by using bilinear interpolation. If some data point is between the pixels, it
uses the values from the 4 nearest pixels (2x2) to estimate the value of the new datapoint.
4. Extracting the Histograms:
Now, using the image generated in the last step, we can use the Grid X and Grid Y parameters to
divide the image into multiple grids, as can be seen in the following image:
Based on the image above, we can extract the histogram of each region as follows:
As we have an image in grayscale, each histogram (from each grid) will contain only 256
positions (0~255)representing the occurrences of each pixel intensity.

JOURNAL BY THE DEPARTMENT OF MBA, MCA AND M.COM(FA), JYOTI NIVAS COLLEGE AUTONOMOUS 66
66
Then,we need to concatenate each histogram to create a new and bigger histogram.
Supposing we have 8x8 grids, we will have 8x8x256=16.384 positions in the final
histogram. The final histogram represents the characteristics of the image original image.
5. Performing the face recognition:
In this step, the algorithm is already trained. Each histogram created is used to represent each
image from the training dataset. So, given an input image, we perform the steps again for this new
image and creates a histogram which represents the image.
So to find the image that matches the input image we just need to compare two histograms
and return the image with the closest histogram.
We can use various approaches to compare the histograms (calculate the distance between
two histograms), for example: euclidean distance, chi-square, absolute value, etc. In this
example, we can use the Euclidean distance (which is quite known) based on the
following formula:
So the algorithm output is the ID from the image with the closest histogram. The
algorithm should also return the calculated distance, which can be used as a ‗confidence‘
measurement.
Note: don‘t be fooled about the ‗confidence‘ name, as lower confidences are better
because it means the distance between the two histograms is closer.
We can then use a threshold and the ‗confidence‘ to automatically estimate if the algorithm
has correctly recognized the image. We can assume that the algorithm has successfully
recognized if the confidence is lower than the threshold defined.
IV. IMPLEMENTATION
ENVIRONMENTALSET-UP
HARDWARESPECIFICATION
Processor : i5 +
RAM : 4GB

JOURNAL BY THE DEPARTMENT OF MBA, MCA AND M.COM(FA), JYOTI NIVAS COLLEGE AUTONOMOUS 67
67
Hard Disk : 80GB
Speed : 1.2GHz+
SOFTWARESPECIFICATION
Operating System : Windows 7orHigher
IDE : Anaconda– Spyder 4.0.1
Language : Python
DATASET USED
It contains around 5000 jpeg images of celebrities.
There are three folder named:
Faces–which contains the cropped faces of celebrities.
Training–which contains the folders for individual celebrities with different folder names
and in each folder there are more than 30 images of that celebrity
Data.csv file–which contains the folder name and the respective celebrity names
The dataset is downloaded from Kaggle
The size of the dataset is785 MB
The images are of JPEG format
EXPERIMENTALRESULTS
JOURNAL BY THE DEPARTMENT OF MBA, MCA AND M.COM(FA), JYOTI NIVAS COLLEGE AUTONOMOUS 68
68
IV. SCOPES AND APPLICATIONS
Security companies are using facial recognition to secure their premises.
Immigration checkpoints use facial recognition to enforce smarter border control.
Fleet management companies can use face recognition to secure their vehicles.
Ride-sharing companies can use facial recognition to ensure the right passengers
are picked up by the right drivers.
IoT benefits from facial recognition by allowing enhanced security measures
and automatic access control at home.
Law Enforcement can use facial recognition technologies as one part of AI-
driven surveillance systems.
Retailers can use facial recognition to customize offline offerings and to
theoretically map online purchasing habits with their online ones.
V. CONCLUSION
Face recognition technology has come a long way in the last twenty years. Today, machines are
able to automatically verify identity information for secure transactions, for surveillance and
security tasks, and for access control to buildings etc. These applications usually work in
controlled environments and recognition algorithms can take advantage of the environmental
constraints to obtain high recognition accuracy. However, next generation face recognition
systems are going to have widespread application in smart environments –where computers and
machines are more like helpful assistants.
REFERENCES
1. Muhammad Zeeshaan Khan, Saad Harous, Saleet Ul Hasan, Muhammad Usman Ghani
Khan, RaziIqbal And Shahid Mumtaz, ―Deep Unified model for face recognition based on
CNN and edge computing‖ date of publication May23,2019.IEE,Volume June17. 2019.
2. JineshMehta,EshaanRamnani,andSanjaySingh,―FacedetectionandTaggingusingDeepLearn
ing‖,Published in 2018 International Conference on Computer, Communication, and
Signal Processing (ICCCSP), IEEE– 2018.
3. Sebastin Schuon, Harry Robertson and Hao Zou Schuon, ―Automated Photo Tagging in
Facebook‖ –2017.
4. Zak Stone, Todd Zickler and Trevor Darell, ―Auto tagging Facebook: Social Network
Context Improves Annotation‖, Published in 2008 IEEE Computer Society Conference on
Computer Vision and Pattern Recognition Workshops, IEEE-2008.

JOURNAL BY THE DEPARTMENT OF MBA, MCA AND M.COM(FA), JYOTI NIVAS COLLEGE AUTONOMOUS 69
69
SECTION II (MBA)

JOURNAL BY THE DEPARTMENT OF MBA, MCA AND M.COM(FA), JYOTI NIVAS COLLEGE AUTONOMOUS 70
70
Foreword It is impossible for a man to learn what he thinks he already knows.
-Epictetus
Our students from the Department of MBA as a part of their summer internships have worked
in various companies exploring different topics of Finance, Human Resource and Marketing
and had attained exposure to the real corporate world by working on real time projects. Their
incredible efforts on the research projects have been appreciated and put forward as research
articles, which we are happy to publish in the post graduate journal Dhii 2022
The MBA section comprises of five research papers from the field of human resource,
marketing and finance. The first paper deals with Standard costing and Variance analysis and
how it affects the cost reduction and cost control of the organization. The second paper is
about employee motivation in the organization. It also helps the individual to play major role
in achieving organization goals as well as personal goals.
The next paper is about HomelficWegrow Community is a company that began amidst the
lock down, when the education system was severely impacted, the company swooped in to
save the day by providing quality education with the benefit of convenience for each student.
The research has been conducted to understand the effect of personal selling on sales growth,
to know how the customer is convinced of the importance of the various courses offered by
HomeflicWegrow and to study the competitor‘s strategy of the company.
The fourth paper investigates challenges Recruiter has faced regarding alterations in jobs,
tasks and duties, flextime working schedules. It examines how HR managers are satisfied
with workplace management during the pandemic and with communication arrangements.
The following fifth paper is all about a study conducted on recruitment and selection using T-
test, Spearman rank correlation and Weighted average method carried out at RGA software
systems Pvt Ltd.,.
In conclusion, May I place on record, that all our student researchers realize that research is
all about search for new knowledge and efforts to create new knowledge.
Dr. Percy Bose
Head, Department of MBA,
Jyoti Nivas College Autonomous

JOURNAL BY THE DEPARTMENT OF MBA, MCA AND M.COM(FA), JYOTI NIVAS COLLEGE AUTONOMOUS 71
71
DHII
Vol. XXIII January 2022
Journal Dept. of MBA, MCA and M. Com (FA)
Jyoti Nivas College Autonomous
A STUDY ON COST CONTROL AND COST REDUCTION AT WIN-
MEDICARE PVT LTD
~Bibi Sarah
Abstract
This study aims to determine the cost involved in production and anticipate the budgeted cost
to analyze the profits. This study also provides insights into the cost reduction techniques
used by the organization to improve their efficiency and reduce the cost. The research
carried out using secondary data, collected from company’s internal records and reports.
The data is analyzed by using standard costing and comparative analysis. The finding of the
study can help the company plan and provide a fair idea on actual cost incurred and
standard cost set.
1. Introduction
Meaning of Cost
Resources must be sacrificed for any organization to achieve its objectives. To an
accountant, cost is defined as a resource for gone to achieve a specific goal. This can be
expressed as the monetary amount which must be paid to acquire goods and services‘
Study Text (n.d.) defines cost as the amount of expenditure incurred on, or attribute to a
specific thing or activity cost of anything ordinarily is money spent to acquire that thing.
In business and accounting, cost is the monetary value that a company has spent to
produce something. Cost denotes the amount of money that a company spends on the
creation or production of goods or services. It does not include the markup for profit. From
a seller‘s point of view, cost is the amount of money that is spent to produce a good or
product. If a producer were to sell his products at the production price, his costs and in
come would break even, meaning that he would not lose money on the sales. However, he
would not make a profit. From a buyer‘s point of view the cost of a product is also known
as the price. This is the amount that the seller charges for a product, and it includes both
the production cost and the mark-up, which is added by the seller to make a profit.

JOURNAL BY THE DEPARTMENT OF MBA, MCA AND M.COM(FA), JYOTI NIVAS COLLEGE AUTONOMOUS 72
72
Cost Control
Cost control is concerned with an element of marginal cost which involves the
determination of unit cost, measurement, and correction of the performance of
subordinates to make sure that the objective of the enterprises and the means to obtain
them are accomplished effectively and economically (Lockey,2002).Cost control is the
regulation of cost of operating a business and is concerned with keeping costs within
acceptable limits. These will usually be specified as a standard cost or target cost limits in
formal operational plan.
Cost Control Techniques
This refers to the various methods applied in controlling cost by various organization. The
techniques are evolved by the account department with cost and management section at
the core of implementation. It includes the following: budgetary control, standard costing
and material control. Budgetary Control In business, a budget may be defined as a formal
expression of the expected income and expenditure for a definite future time. Lucey
(1996) defines a budget as the expression of a firm`s plan in financial form for a period in
future. According to the Institute of Cost and Management Accountants, budget is defined
as a financial and/or quantitative statement, prepared earlier for a specified period, of the
course of action to be carried out during that period of attaining a given objective.
Benefits of Cost Control
Cost control work should enhance the efficiency of management and if necessary, should
result in action being taken to reduce the cost for profit purposes and to prevent fraud and
efficiency (Dury, 1985). Some of these benefits are as follows:
A simple control can be expressed overall operation from the purchase of goods to
account for sales.
An efficient cost control with reveal possible sources of economy and result in a
rational utilization of material and labor.
Cost control makes policy decisions by management very easy.
It ensures adequate production and prevent over stocking of material.

JOURNAL BY THE DEPARTMENT OF MBA, MCA AND M.COM(FA), JYOTI NIVAS COLLEGE AUTONOMOUS 73
73
Cost Reduction
Cost control aims at reducing the actual to the targets, cost reduction aims at reducing the
targets themselves. In other words, the aim of cost reduction is to see whether there is any
possibility in bringing about a saving in cost incurred- material, labor, overheads, etc.
According to the Terminology of Cost Accountancy of the Institute of Cost and
Management Accountants London, Cost reduction is to be understood as the success of
real and unchanging reduction in the unit costs of goods manufactured without impairing
their suitable for the use intended. Thus, the term cost reduction denotes real or genuine
saving in production, administration, selling and sharing costs resulting to the elimination
of wasteful and inessential elements from the design of the product and from the
techniques and practices carried out in connection therewith. The necessity for cost
reduction arises when the profit margin must be increased without an increase in the sales
turnover i.e., for the same volume of sales, the cost should be reduced.
Importance of Cost Control
Business Lackey (2002) analyzed the importance of cost control on business operation.
The importance of control function is to assist or help business management in diverse
ways. It guides the management in achieving pre-determined objectives. The control
process also ascertains the competence of different functions. The limitation in various
fields is also reported for taking corrective measures and provides starting point for future
action. The unchanged flow of information about projects keeps the long range of planning
on the right track. More so, it allows management to prevent repetition of previous
mistakes. Control helps in deciding the future course of action each time there is a
difference between standard and actual performance. Coordination of exercise through
unity of action is achieved by control. Managers will put in their best in coordinating the
exercise of his workers or staff so that departmental objectives can be a success.
Improving organizational competence is achieved through the control system. Evidently,
the performances of the manager are constantly examined and hence, do better than his
previous work. The performance of the manager is linked to the advantages and
disadvantages. Workers will continually be pressurized to improve on their duties. One of
the important tools of control is performance measurement which as certain that everyone
maximizes his contribution(Lackey, 2002).

JOURNAL BY THE DEPARTMENT OF MBA, MCA AND M.COM(FA), JYOTI NIVAS COLLEGE AUTONOMOUS 74
74
Variance
Variance is the difference between an actual cost and a budgeted or standard cost.
The purpose of variance analysis is to provide practical pointers to the causes of off-
standard performance so that management can improve operations. Favorable or positive
variances occur when revenue is higher, or cost lower, than anticipated or planned, leading
to a better profit result. Variance is the difference between an actual cost and a budgeted or
standard cost.
Variance Analysis
Variance analysis can be summarized as an analysis of the difference between planned and
actual numbers. The sum of all variances gives a picture of the overall over-performance or
under-performance for a particular reporting period. For each item, companies assess their
favorability by comparing actual costs to standard costs in the industry.
Types of Variances
Importance of Variance
There is a lot of importance of analysis of variance. There are many objects fulfilled with
their analysis. Without analysis of variance, there is no use of standard costing. The
important points of variances are asunder:

JOURNAL BY THE DEPARTMENT OF MBA, MCA AND M.COM(FA), JYOTI NIVAS COLLEGE AUTONOMOUS 75
75
1) Check and control of wastage is possible.
2) It improves the efficiency of the organization using standard costing.
3) It exercises control overall cost centers including department, individuals and so on.
4) Responsibility of a particular person or department can be fixed.
5) In the prediction of production cost, sales and profit, variance analysis is extremely
useful.
6) On the basis of variance analysis, delegation of authority could be made effective.
7) Variance analysis is easy to introduce, apply and orient result.
8) Various operational efficiencies can be measured.
VII. Research Methodology
Title of the Study: A Study on Cost Control and Cost Reduction at Win-Medicare Pvt Ltd
STATEMENT OF THE PROBLEM
1. To identify the factors militating against the success of the cost reduction exercise
in the company.
2. To evaluate how business organization can use cost control in increasing profit
maximization.
3. To know the effect of cost control and cost reduction on the overall performance of
business organizations.
4. To identify the strategies for solving competitive business economic problem.
5. Evaluation of the techniques involve in solving these problems, and how these
techniques can be applied.
6. To evaluate the operation costing system chosen by companies and how effective it is.
OBJECTIVES OF THE STUDY
To manage costs by establishing standards and analysis of variances.
To provide a basis for estimating future cost

JOURNAL BY THE DEPARTMENT OF MBA, MCA AND M.COM(FA), JYOTI NIVAS COLLEGE AUTONOMOUS 76
76
To formulate strategies for cost reductions
To Evaluate cost management performance
To Evaluate the predictive power of cost reduction in planning controlling and
decision making
To provide guidance on possible ways of improving performance
TOOLS USED FOR THE STUDY
Standard Costing
Standard costing is the practice of estimating the expense of a production process. It's a
branch of cost accounting that's used by a manufacturer, for example, to plan their costs for
the coming year on various expenses such as direct material, direct labor or overhead.
Comparative Analysis
Comparative analysis use comparison analysis to measure the financial relationships
between variables over two or more reporting periods. Businesses use comparative analysis
to identify their competitive positions and operating results over a defined period.
Larger organizations may often comprise the resources to perform financial comparative
analysis monthly or quarterly, but it is recommended to perform an annual financial
comparison analysis at a minimum.
LIMITATION OF THE STUDY
This research will reveal the essences of cost control and cost reduction in Win-
Medicare. The cost structure of the company, cost control measures adopted to
minimize waste of resources and in variably the major procedures embarked to
ensure that actual results are in line with the set standard; so that waste are measured,
and appropriate action taken to correct the activity.
In the process of carrying out this research work, the most nagging problem facing
the study is how to obtain reference materials. The study will be limiting its analysis
to data that is available to the researcher especially regarding the company that was
selected for the analysis.

JOURNAL BY THE DEPARTMENT OF MBA, MCA AND M.COM(FA), JYOTI NIVAS COLLEGE AUTONOMOUS 77
77
3. Analysis And Interpretation
The Following table shows Standard cost card information of the year 2019-2020
incurred in Win-Medicare
Manufacturing Cost
Information
Standard Qty Standard Cost Per
Unit
Cost Summary in
Rupees INR
Direct Material
Material 7000kgs 0.28 196000
Direct Labor
Workmen 6000hrs. 0.30 180000
Manufacturing Overhead
Variable Overhead 300hrs. 0.10 3000
Fixed Overhead 400hrs. 0.10 4000
Standard cost per Medicine 383000
Table1: Standard cost incurred inWin-Medicare Pvt Ltd for the financial year 2019-2020
Table Showing Standard Cost Card
Details
Standard or
Hrs.
Qty Standard Price or
Rate
Standard Cost in
Rupees
Direct Material 7000kgs 0.28 1960
Direct Labor 6000hrs. 0.30 1800
Variable
Manufacturing
Overhead
300 Hrs. 0.10 30
Fixed Overhead 400 Hrs. 0.10 40
Total
Cost
Standard 383000
Table2:Total standard cost in Win-Medicare Pvt Ltd for the financial year 2019-2020
Table Showing Actual Cost Card
Details Actual Qty or Hrs Actual Price or Rate Actual Cost In Rupees
Direct Material 7000Kgs 0.25 1750
Direct Labor 6000hrs. 0.30 1800
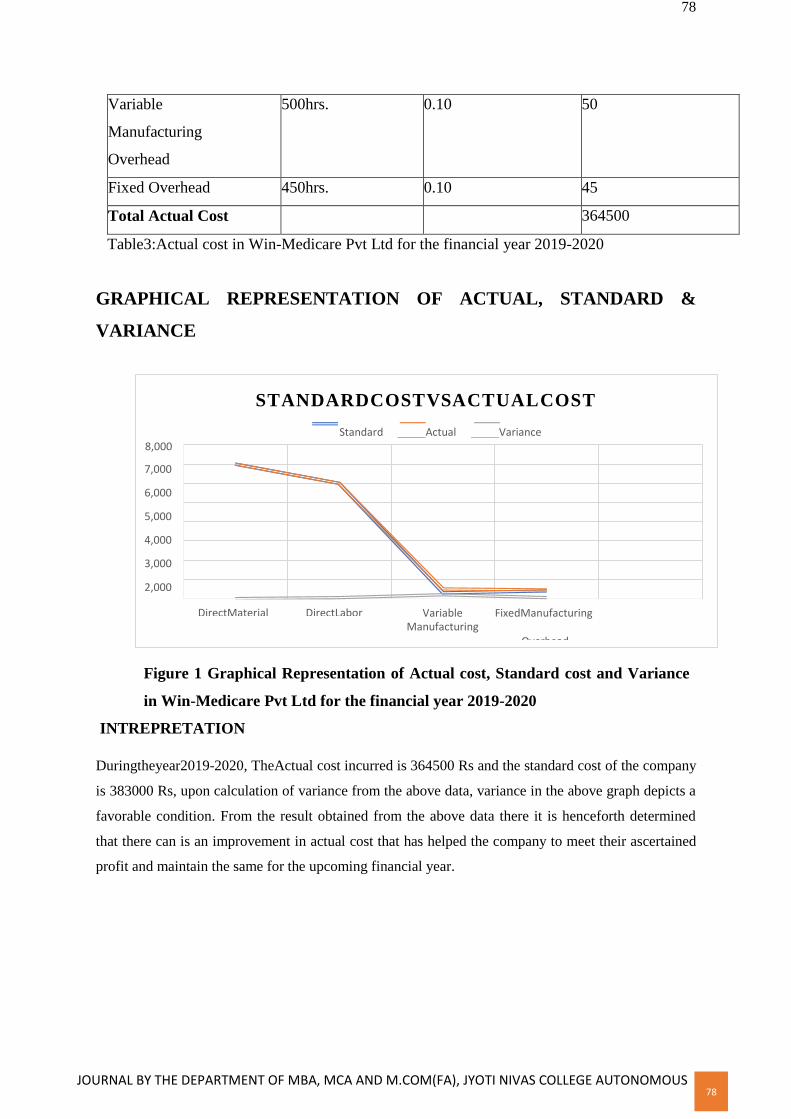
JOURNAL BY THE DEPARTMENT OF MBA, MCA AND M.COM(FA), JYOTI NIVAS COLLEGE AUTONOMOUS 78
78
STANDARDCOSTVSACTUALCOST
Standard Actual Variance 8,000
7,000
6,000
5,000
4,000
3,000
2,000
1,000 DirectMaterial DirectLabor Variable FixedManufacturing Manufacturing
Overhead
Variable
Manufacturing
Overhead
500hrs. 0.10 50
Fixed Overhead 450hrs. 0.10 45
Total Actual Cost 364500
Table3:Actual cost in Win-Medicare Pvt Ltd for the financial year 2019-2020
GRAPHICAL REPRESENTATION OF ACTUAL, STANDARD &
VARIANCE
Figure 1 Graphical Representation of Actual cost, Standard cost and Variance
in Win-Medicare Pvt Ltd for the financial year 2019-2020
INTREPRETATION
Duringtheyear2019-2020, TheActual cost incurred is 364500 Rs and the standard cost of the company
is 383000 Rs, upon calculation of variance from the above data, variance in the above graph depicts a
favorable condition. From the result obtained from the above data there it is henceforth determined
that there can is an improvement in actual cost that has helped the company to meet their ascertained
profit and maintain the same for the upcoming financial year.

JOURNAL BY THE DEPARTMENT OF MBA, MCA AND M.COM(FA), JYOTI NIVAS COLLEGE AUTONOMOUS 79
79
GRAPHICAL REPRESENTATION OF DIFFERENT TYPES OF
VARIANCE
Figure 2 Different types of variance calculated in Win-Medicare Pvt Ltd for the
financial year 2019-2020
INTREPRETATION
During the year 2019-2020, the following variances can be interpreted where in there is slight
difference in the standard and the actual cost. The material cost variance is 74%, Labor variance of
0%, variable overhead being 8%, fixed variable overhead with 10% and sales variance with 8%. This
above scenario gives rise to a favorable condition in the organization. The above graph depicts that
the rise in standard cost of the company leads to favorable conditions and has a positive effect on the
organization‘s profits during the financial year.
The Following table shows Standard cost card information of the year 2020 incurred
in Win-Medicare
Manufacturing Cost
Information
Standard Qty Standard Cost Per
Unit
Cost Summary In
Rupees
Direct Material
Material 6500kgs 0.30 195000
Direct Labor
Workmen 4000hrs. 0.28 112000
Manufacturing Overhead
Variable Overhead 300hrs. 0.10 3000
Fixed Overhead 350hrs. 0.10 3500
Standard cost per Medicine 313500
30% 0%
8%
10%
21% Variance
Material Cost Variance Labor Variance Variable Overhead Variance
Fixed Overhead Variance Sales Variance

JOURNAL BY THE DEPARTMENT OF MBA, MCA AND M.COM(FA), JYOTI NIVAS COLLEGE AUTONOMOUS 80
80
Table 4: Standard cost incurred inWin-Medicare Pvt Ltd for the financial year 2020-
2021
Table Showing Standard Cost Card
Details Standard or
Hrs
Qty Standard Price or
Rate
Standard Cost In
Rupees
Direct Material 6500kgs 0.30 195000
Direct Labor 4000hrs. 0.28 112000
Variable
Manufacturing
Overhead
300 hrs. 0.10 3000
Fixed Overhead 350 hrs. 0.10 3500
Total
Cost
Standard 313500
Table 5: Total standard cost in Win-Medicare Pvt Ltd for the financial year 2020-2021
Table Showing Actual Cost Card
Details Actual Qty or Hrs Actual Price or Rate Actual Cost In Rupees
Direct Material 7200kgs 0.25 180000
Direct Labor 4500hrs. 0.15 67500
Variable
Manufacturing
Overhead
450hrs. 0.08 3600
Fixed Overhead 450 hrs. 0.10 4500
Total Actual Cost 255600
Table 6: Table depicting actual cost in Win-Medicare Pvt Ltd for the financial year 2020-
2021

JOURNAL BY THE DEPARTMENT OF MBA, MCA AND M.COM(FA), JYOTI NIVAS COLLEGE AUTONOMOUS 81
81
STANDARDCOSTVSACTUALCOST
Standard Actual Variance 8,000
7,000
6,000
5,000
4,000
3,000
2,000
1,000 DirectMaterial DirectLabour Variable FixedManufacturing Manufacturing
OverheadOverh
GRAPHICAL REPRESENTATION OF ACTUAL, STANDARD &
VARIANCE
Figure 3 Graphical Representation of Actual cost, Standard cost and Variance in Win-
Medicare Pvt Ltd for the financial year 2020-2021
INTREPRETATION
Duringtheyear2020-2021, The Actual cost incurred is 248310 Rs and the standard cost of the
company is 313500 Rs, upon calculation of variance from the above data, variance in the above graph
depicts a favorable condition. From the result obtained from the above data there it is henceforth
determined that there can is an improvement in actual cost that has helped the company to meet their
ascertained profit and maintain the same for the upcoming financial year.

JOURNAL BY THE DEPARTMENT OF MBA, MCA AND M.COM(FA), JYOTI NIVAS COLLEGE AUTONOMOUS 82
82
GRAPHICAL REPRESENTATION OF DIFFERENT TYPES OF
VARIANCE
Figure 12: Different types of variance calculated in Win-Medicare Pvt Ltd for the
financial year 2020-2021
INTREPRETATION
During the year 2020-2021, the following variances can be interpreted wherein there is
difference in the standard and the actual cost. The material cost variance is 47%, Labor
variance of 36%, variable overhead being 1%, fixed variable overhead with 15% and sales
variance with 1%.This above scenario gives rise to a favorable condition in the organization.
The above graph depicts that the rise in standard cost of the company leads to favorable
conditions and has a positive effect on the organization‘s profits during the financial year.
4. Findings
During the year 2019-2020, the standard cost is 383000 Rs is higher in
comparison with actual cost that is 364500 Rs. This results in positive
favorable condition in the organization, respectively.
Duringtheyear2020-2021, the standard cost is 313500 Rs is higher in
comparison with actual cost that is 248310 Rs. This results in positive
favorable condition in the organization, respectively.
The profit recorded for the year 2019-2020 is 1049000 Rs respectively
The profit recorded for the year 2020-2021 1030700 Rs is respectively
30%
36%
1% 15%
21%
Variance
Material Cost Variance Labor Variance Variable Overhead Variance
Fixed Overhead Variance Sales Variance

JOURNAL BY THE DEPARTMENT OF MBA, MCA AND M.COM(FA), JYOTI NIVAS COLLEGE AUTONOMOUS 83
83
5. Suggestions
Planning has become the primary function of management most of the planning
relates to individual and individual proposals. Costs are nothing but his
expressions, largely in financial terms, cost control has, therefore become and
essential tool of management for controlling and maximizing profits.
Cost control and cost reduction scheme must be properly administered in an
organization by setting realistic standard Cost control should be operated in
every department in an organization especially the production department to
make sure that the numbers of finished goods are properly accounted for.
Target and standard should not be vague set as this will be unrealistic while
comprising planned cost in an organization.
For effective cost control to be achieved there should be proper data collection,
data analysis and control administration.
The company objectives of the organization should be apt and clear and know
how they can be achieved through cost control
Timetables for all stages of costing should be followed Reports, statements,
forms and other record to be maintained
Continuous comparison of actual performance with standard performance
6. Conclusion
The relevance of this research is to analyze the importance of cost control and cost
reduction techniques on Win-Medicare Pvt Ltd performance in a highly competitive
environment. For an organization to ensure more profit growth by producing quality
medicines and services with available resources on the ground there is a need to control
cost and reduce cost to the acceptable limit as regard to control and reduction on wastage
and loss. During this research, it was discovered that cost control and cost reduction
techniques seen to be very essential to the growth and survival of any organization in a
highly competitive environment ranging from practical planning and setting standard,
monitoring the standard till it is achieved and also strategically reducing cost expended
during business activities. All of this proves the essential need of cost control and cost

JOURNAL BY THE DEPARTMENT OF MBA, MCA AND M.COM(FA), JYOTI NIVAS COLLEGE AUTONOMOUS 84
84
reduction on organizational performance in a highly competitive market if well
considered.
7. References
BOOKS REFFERED
RESEARCH METHODOLOGY – FOR BEGINNERS BY RANJITH KUMAR
COST ACCOUNTING BY PROF.M. L AGARWAL AND K.L GUPTA
COST ACCOUNTING – PRINCIPLES AND PRACTICES BY M.N ARORA
WEBSITES REFFERED
https://www.investopedia.com/terms/c/cost-cutting.asp
https://en.wikipedia.org/wiki/Cost_accounting
https://umeshmodigroup.com/win-medicare.html

JOURNAL BY THE DEPARTMENT OF MBA, MCA AND M.COM(FA), JYOTI NIVAS COLLEGE AUTONOMOUS 85
85
DHII
Vol. XXIII January 2022
Journal Dept. of MBA, MCA and M. Com (FA)
Jyoti Nivas College Autonomous
A STUDY ON EMPLOYEE MOTIVATION WITH REFERENCE TO
CUSHMAN & WAKEFIELD
~ Chaitra
Abstract
Motivated workforce is a competitive advantage to any firm irrespective of the sector, size, or
product. Increased employee motivation will help in improving the efficiency of organization.
There were various objectives of the research to be conducted and they were, to know
whether employees are happy or satisfied working with the organization, individual
motivation and satisfaction is also most in achieving the organizational goals. The number of
respondents is included in this study is one hundred and ten people. The questionnaire to be
close ended and open ended questions to get a clear and deeper understanding of employees
opinion and specifically their attitude, behavior towards the organization. The research
methodology will include getting information from primary sources as one hundred and ten
respondents would be administered questionnaires. The findings of the study will enable the
researcher to recommend strategies for the firm to motivate their employees in a more
efficient and effective.
INTRODUCTION
Human resource management is the management of organizations human resources. It is
responsible for the attraction, selection, training assessment and rewarding of employees
while also overseeing organizational leadership and culture and enduring compliance with
employment and labor laws. HRM is a specialty within the field of management that focuses
on employees or staff well.
Motivation is a process which starts with a psychological or physiological need that initiates
behavior that is aimed at achieving the goal. Management‘s basic job is the effective
utilization of human resource for achievements of organizational objective. The personal
management is concerned with organizing human resources in such a way to get maximum
JOURNAL BY THE DEPARTMENT OF MBA, MCA AND M.COM(FA), JYOTI NIVAS COLLEGE AUTONOMOUS 86
86
output to the enterprise and to develop the talents of the people at work to the fullest
satisfaction. Motivation implies that one person, in organization context a manager, includes
another, say an employee, to engage in action by ensuring that channel to satisfy those needs
and aspiration becomes available to the person. In addition to this, the strong needs in a
direction that is satisfying to the latent needs in employees and harness them in a manner that
would be functional to the organization.
Research Methodology
Research may be defined as the systematic and objective analysis and recording of controlled
observation they may lead to the development or generalization. Principles or theories
resulting in prediction and possible ultimate control of events.
Statement of the problem
Functioning of an organization depends upon the employees. The focus would be to motivate
the employee at all levels. Motivation is ―A process that starts with physiological and
psychological deficiency or needs that activities behavior or a drive that is aimed at global or
incentive. Hence, the motivation strategy of employee plays a very important aspect in
organizations. The present study is to ensure on employee motivation at Cushman &
Wakefield.
Need and Importance of the study
Employee motivation is a prime HR activity. The growth of the organization, functions of the
organization depend upon highly motivated employees. This project is been undertaken on
the employee motivation and the main purpose of the study is to determine the motivation
level and the performance of the employees in the organization. The only way of motivating
the employees is by utilizing all the physical resource to the optimum so that they can give
their best to the organization.
Objectives of the Research
To understand the motivational level of employees at Cushman & Wakefield.
To identify the intrinsic and extrinsic motivators used at Cushman & Wakefield.
To evaluate motivational techniques utilized to stimulate employee growth in the firm.
To evaluate employee satisfaction about motivational measures adapted by Cushman &
Wakefield.

JOURNAL BY THE DEPARTMENT OF MBA, MCA AND M.COM(FA), JYOTI NIVAS COLLEGE AUTONOMOUS 87
87
To understand the employee‘s perception on the various motivators used at Cushman &
Wakefield.
Type of Research: Descriptive research is used for the study.
Sampling Techniques: Simple random sampling method are used.
Simple random sampling technique where very item in the population has an equal and likely
chance of being selected in the sample.
Sample Size: The sample of 110 employees was considered for the study.
Actual collection of Data - The data will be obtained through two sources Primary and Secondary.
Primary data will be collected by personal interview backed up by a standard questionnaire
from a target population.
Secondary information will be gathered through internal and external source.
Tools used for the Study: Graphs, tables, and pie chart as statistical methods are adopted
and for tabulation, use of weighted criteria and graphical representation. The survey tool is
used for data collection is through filling up of questionnaire by the respondents.
Period of study: Period of study on employee motivation at Cushman & Wakefield is taken
3 months for data collection and interpretation.
Limitations of the study
The findings of the study are applicable only to the company Cushman & Wakefield.
The study conducted in a specific period with limited sample size their results cannot be
generally used
The opinions of respondents are taken during the specific period hence the opinion may
change.
Time constrains.
Data analysis and interpretation
1. Does Financial Incentives motivate more than non- financial incentives?
Table: Motivation through financial incentives.
Variables
No of respondents
Percentage of the
respondents
Strongly Agree 44 40

JOURNAL BY THE DEPARTMENT OF MBA, MCA AND M.COM(FA), JYOTI NIVAS COLLEGE AUTONOMOUS 88
88
44
58
7 1 40% 52.70% 6.40% 0.90% 0
10
20
30
40
50
60
70
strongly Agree Agree Disagree Strongly Disagree
Motivation through finacial incentives
No of respondents Percentage of the respondents
Agree 58 52.7
Disagree 7 6.4
Strongly Disagree 1 0.9
Total 110 100
Analysis: From the above table, 40% of the respondents strongly agreed that the
salary increment motivated them, 52.7% of the respondents agreed that the salary
increment motivated them and 6.4% of the respondents disagreed and 0.9% of the
respondents strongly disagreed that the salary increment did not motivate the
employees.
Graph: Motivation through financial incentives.
Interpretation: From the above graph, it can be inferred that respondents are easily
motivated through financial incentives as compared to non-financial incentives. Most of the
respondents agree that financial incentives motivate them. This shows that financial incentive
is one of the most important factors which motivates at Cushman & Wakefield.
2.Do you think that the incentives and other benefits will influence performance?
Table: Motivation through incentives and other benefits.
Variables
No of
respondents
Percentage of the
respondents
Strongly Agree 57 51.8
Agree 50 45.5
Disagree 2 1.8
Strongly 1 0.9

JOURNAL BY THE DEPARTMENT OF MBA, MCA AND M.COM(FA), JYOTI NIVAS COLLEGE AUTONOMOUS 89
89
0%
20%
40%
60%
80%
100%
Strongly Agree Agree Disagree Strongly Disagree
57 50 2
1
51.80% 45.50% 1.80%
0.9
No of Respondents Percentage of the respondents
Disagree
Total 110 100
Analysis: From the above table, 57 of the respondents have strongly agreed, 50 of
the respondents have agreed, 2 of the respondents have disagreed and 1 respondent
strongly disagreed to the motivation through incentives and other benefits provided
by the organization.
Graph: Motivation through incentives and other benefits.
Interpretation: From the above graph, it shows that employees are also motivated by other
benefits provided by the organization; it impacts to increase the employee productivity,
loyalty, focus on goals and maintenance of attendance. Majority of the respondents strongly
agree that incentives and other benefits motivate them. This shows that incentives and other
benefits are one of the most important factors that motivate at Cushman & Wakefield. A
small amount of people has disagreed to this.
3.Do you agree an intrinsic and extrinsic factor improves the performance of
the work?
Table: Motivation through intrinsic and extrinsic factor for improving
performance.
Variables
No of respondents
Percentage of
the respondents
Strongly Agree 36 32.7
Agree 69 62.7

JOURNAL BY THE DEPARTMENT OF MBA, MCA AND M.COM(FA), JYOTI NIVAS COLLEGE AUTONOMOUS 90
90
Disagree 3 2.7
Strongly Disagree 2 1.8
Total 110 100
Analysis: From the above table, that 32.7% of the respondents strongly agree to the
intrinsic and extrinsic motivation available in the organization, 62.7% of the
respondents also agree to the same and 1-5 of the respondents disagree or are
dissatisfied about the intrinsic and extrinsic motivation by the organization.
Graph: Motivation through intrinsic and extrinsic factor for improving performance.
Interpretation: From the above graph, majority of the respondents are satisfied with the
intrinsic and extrinsic motivation provided by the organization which also motivates the
individuals to achieve their work goals. Many of them strongly agree to the same.
4.Employees are satisfied with the culture of the workplace.
Table: Motivation through culture of workplace.
Variables
No of respondents
Percentage of
the respondents
Strongly Agree 33 30
Agree 70 63.6
Disagree 6 5.5
Strongly Disagree 1 0.9
Total 110 100
Analysis: From the above table, 30% respondents are fully satisfied with the
workplace culture. 63.6% of the respondents are satisfied with workplace culture.
Rest of the respondents are not satisfied with the culture of the workplace.
No of respondents
Percentage0
50
100
strongly agreeAgree
Disagree
Strongly disagree
Intrinsic and extrinsic motivation
No of respondents Percentage

JOURNAL BY THE DEPARTMENT OF MBA, MCA AND M.COM(FA), JYOTI NIVAS COLLEGE AUTONOMOUS 91
91
Graph: Motivation through culture of workplace.
Interpretation: From the above data, it can be understanding that the opinion of respondents
regarding culture in the workplace also impact in motivating the employees to achieve their
goals. It is inferred that majority of the respondents are satisfied with the culture of the
workplace, it also motivates the employees to achieve both organizational and personal goals.
Many of the respondents are satisfied few of the respondents strongly agree to the cultural
atmosphere adapted by the organization.
5.The training activities by management is helping employees to get better
knowledge.
Table: Motivating individuals by providing training and development activities.
Variables
No of respondents
Percentage of the
respondents
Strongly Agree 46 41.8
Agree 60 54.5
Disagree 4 3.6
Strongly Disagree 0 0
Total 110 100
Analysis: From the above table, 41.8% of the respondents strongly agree that the
training and development activities taken by the organization in each interval
motivate employees. 54.5% of the respondents are satisfied with the training and
developmental activities of the organization.
Strongly Agree
30%
Agree
64%
Disagree
5%
No of respondents
Strongly Agree Agree Disagree strongly Disagree

JOURNAL BY THE DEPARTMENT OF MBA, MCA AND M.COM(FA), JYOTI NIVAS COLLEGE AUTONOMOUS 92
92
Graph: Motivating individuals by proving training and development activities.
Interpretation: From the above graph, it can be understood that the opinion of respondents
regarding the conducting of training and development activities by the organization, which
plays an important role in enhancing and motivating the individuals in achieving their
individual goals as well as organizational goals. Majority of the respondents are satisfied it
shows that training and development is also one of the important tools that motivate people at
Cushman & Wakefield.
6. Employees are satisfied with the support from the HR Department.
Table: Motivation by HR support and practices by organization.
Variables
No of respondents
Percentage of the
respondents
Strongly Agree 33 30
Agree 68 61.8
Disagree 7 6.4
Strongly Disagree 2 1.8
Total 110 100
Analysis: From the above table, 30%of the respondents strongly agree that they are
satisfied with the HR support in the organization; 61.8% of the respondents also
agree to the same and 2 and 7 of the respondents strongly disagree and disagree
respectively to the HR practices and support by the organization.
42%
54%
4%
No of respondents
Strongly Agree
Agree
Disagree
Strongly Disagree

JOURNAL BY THE DEPARTMENT OF MBA, MCA AND M.COM(FA), JYOTI NIVAS COLLEGE AUTONOMOUS 93
93
No of respondents
Percentage
0
50
100
Strongly
Agree
Agree Disagree Strongly
Disagree
Motivation by HR support and Practices
No of respondents Percentage
Graph: Motivation by HR support and practices by organization.
Interpretation: From the above graph, it can be understood that the opinion of the
respondents regarding support from HR department and policies adopted by the company that
motivate people to achieve their individual goals. Majority of the respondents are satisfied
with the HR practices and HR support in the organization; many of the respondents strongly
agreed to the same.
7.Good Physical working conditions are provided in the organization.
Table: Motivation through good physical working conditions.
Variables
No. of respondents
Percentage of the
respondents
Strongly Agree 38 34.5
Agree 64 58.2
Disagree 6 5.5
Strongly Disagree 2 1.8
Total 110 100
Analysis: From the above table, 34.5% of the respondents strongly agreed that good
working conditions motivate them, 58.2%of them agree to the good physical
working conditions and 5.5%of them disagreed or are dissatisfied about the working
conditions in an organization.

JOURNAL BY THE DEPARTMENT OF MBA, MCA AND M.COM(FA), JYOTI NIVAS COLLEGE AUTONOMOUS 94
94
Graph: Motivation through good physical working conditions.
Interpretation: The above graph states that a good working condition is very important and
is a legal requirement which intends to motivate people to work better in a good and safe
environment. Majority of the respondents agree that medical benefits in an organization
motivate them and many of them strongly agree medical benefits in an organization do the
same. This shows that it is one of the most important factors which motivates at Cushman &
Wakefield.
8. The employees in the organization feel secure at workplace.
Table: Motivation through safety measure provided by the firm.
Variables
No of respondents
Percentage of the
respondents
Strongly Agree 39 35.5
Agree 63 57.3
Disagree 7 6.4
Strongly Disagree 1 0.9
Total 110 100
Analysis: From the above data, 35.5%of the respondents strongly agree that the
safety measures adapted by organization are well versed and impact on motivating
people to do there their work, 57.3% of them agree to the same and 6 and 2 of the
respondents disagree and strongly disagree about the safety measures adapted in an
organization.
35%
58%
5% 2%
Motivation through Good physical working conditions
Strongly Agree
Agree
Disagree
Strongly diagree

JOURNAL BY THE DEPARTMENT OF MBA, MCA AND M.COM(FA), JYOTI NIVAS COLLEGE AUTONOMOUS 95
95
Graph: Motivation through safety measure provided by the organization.
Interpretation: From the above graph, it can be understood the opinion of the employees
regarding the safety measures provided by an organization. Majority of the respondents are
satisfied with the safety measures provided by the organization that also motivate individuals
to achieve their work goals.
9. Dose performance management initiatives of the organization helpful in
employee motivation.
Table: Motivation through performance management initiatives.
Variables
No of respondents
Percentage of
the respondents
Strongly Agree 39 35.5
Agree 65 59.1
Disagree 6 5.5
Strongly Disagree 0 0
Total 110 100
Analysis: From the above data, 35.5%of the respondents strongly agreed to the
motivation provided through performance management initiatives in the
organization. 59.1% of the respondents are satisfied with the performance
management initiatives in the organization. And rest of the respondents are not
satisfied with the motivation.
36%
58%
6% 0%
Motivation through safety measures
Strongly Agree
Agree
Disagree
Strongly Disagree

JOURNAL BY THE DEPARTMENT OF MBA, MCA AND M.COM(FA), JYOTI NIVAS COLLEGE AUTONOMOUS 96
96
Graph: Motivation through performance management initiatives.
Interpretation: From the above graph, it can understand the opinion of the respondents
regarding performance management initiatives of the organization. It will be helpful to the
employees for achieving individual goals and organizational goals. Majority of the
respondents are satisfied with the performance management initiatives of the organization at
the workplace, which helps them to achieve personal and organizational goals.
10. Does Motivation help you to perform well in the organization?
Table: Role of motivation in the organization.
Variables
No of respondents
Percentage of the
respondents
Strongly Agree 50 45.5
Agree 55 50
Disagree 5 4.5
Strongly Disagree 0 0
Total 110 100
Analysis: From the above table, 45.5% of the respondents are fully satisfied with the
motivation provided in the organization. 50% of the respondents are satisfied with
motivation provided by the organization. It shows that motivation plays a very
important role in the organization in helping individuals to achieve their goals.
39 65
6 0
35.50%
59.10%
5.50% 0% 0
20
40
60
80
Strongly agree Agree Disagree Strongly Disagree
Motivation through performance management initiatives
No of respondents Percentage

JOURNAL BY THE DEPARTMENT OF MBA, MCA AND M.COM(FA), JYOTI NIVAS COLLEGE AUTONOMOUS 97
97
Graph: Role of motivation in the organization.
Interpretation: From the above graph, it can be understood that the opinion of the
respondents regarding motivational role in the organization for helping the
individuals to achieve their goals and personal goals. Majority of the respondents are
satisfied with the motivation provided by the organization, which helps them to
achieve their personal and organizational goals.
11. What motivates you to stay in the company?
Table: Motivation to stay in the company.
Variables
No of respondents
Percentage of the
respondents
Good environment 65 59.1
Supervisor support 15 13.6
Incentives 19 17.3
Motivational Talks 11 10
Total 110 100
Analysis: From the above data, 59.1% of the respondents get motivated through
good environment to stay in the company. 13.6% of the employees are motivated by
supervisor support to stay in the company.17.3% of the respondents get motivated
through incentives to stay in the company. 10% of the respondents are motivated by
motivational talks to stay in the company.
Strongly agree
45%
Agree
50%
Disagree
5% Strongly disagree
0%
ROLE OF MOTIVATION IN THE ORGANIZATION
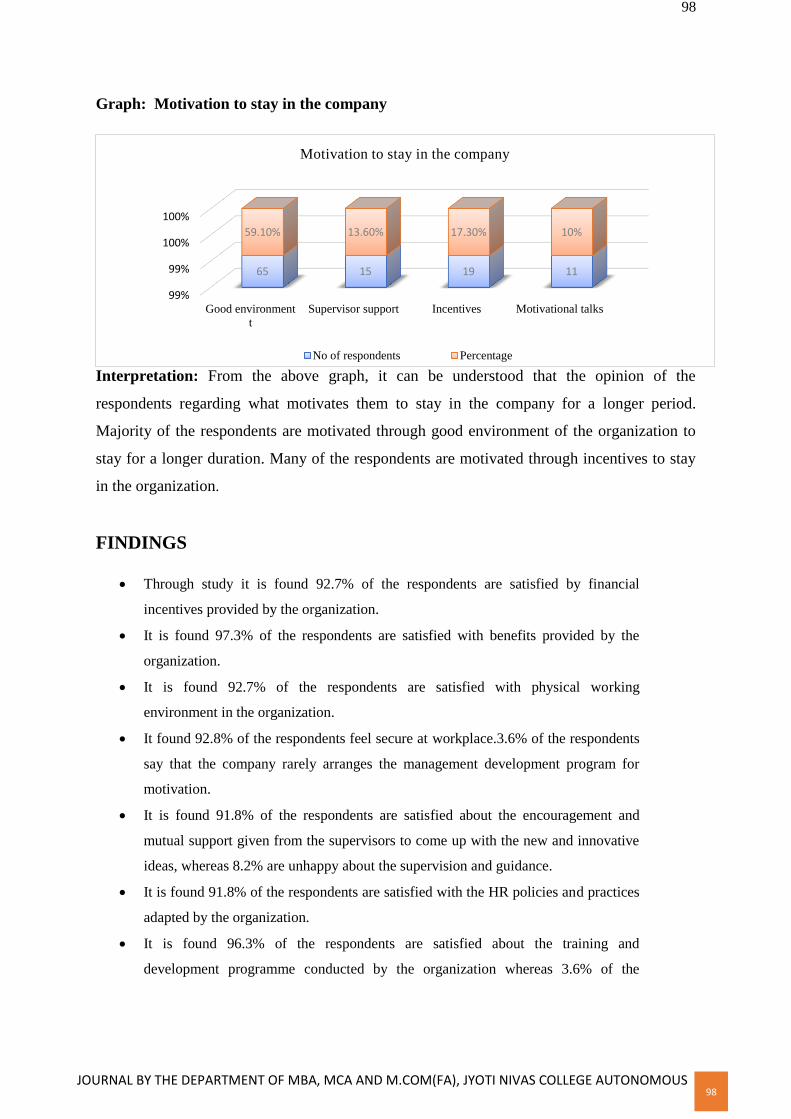
JOURNAL BY THE DEPARTMENT OF MBA, MCA AND M.COM(FA), JYOTI NIVAS COLLEGE AUTONOMOUS 98
98
Graph: Motivation to stay in the company
Interpretation: From the above graph, it can be understood that the opinion of the
respondents regarding what motivates them to stay in the company for a longer period.
Majority of the respondents are motivated through good environment of the organization to
stay for a longer duration. Many of the respondents are motivated through incentives to stay
in the organization.
FINDINGS
Through study it is found 92.7% of the respondents are satisfied by financial
incentives provided by the organization.
It is found 97.3% of the respondents are satisfied with benefits provided by the
organization.
It is found 92.7% of the respondents are satisfied with physical working
environment in the organization.
It found 92.8% of the respondents feel secure at workplace.3.6% of the respondents
say that the company rarely arranges the management development program for
motivation.
It is found 91.8% of the respondents are satisfied about the encouragement and
mutual support given from the supervisors to come up with the new and innovative
ideas, whereas 8.2% are unhappy about the supervision and guidance.
It is found 91.8% of the respondents are satisfied with the HR policies and practices
adapted by the organization.
It is found 96.3% of the respondents are satisfied about the training and
development programme conducted by the organization whereas 3.6% of the
99%
99%
100%
100%
Good environment
t
Supervisor support Incentives Motivational talks
65 15 19 11
59.10% 13.60% 17.30% 10%
Motivation to stay in the company
No of respondents Percentage

JOURNAL BY THE DEPARTMENT OF MBA, MCA AND M.COM(FA), JYOTI NIVAS COLLEGE AUTONOMOUS 99
99
respondents are not satisfied with the training and development programs conducted
in the organization.
Through the research, it found that 93.6% of the respondents are happy about the
workplace culture adapted by the organization, whereas 6.4% of the respondents are
not satisfied about the work culture.
SUGGESTIONS:
The suggestions for the findings from the study are as follows:
Organization should give importance to workplace communication where
employees can get equal opportunities to talk about the problems and solutions in
the organization.
Non – financial incentives should be implemented to improve the productivity level
of the employees.
Knowledge and skills of an employee should be encouraged or appreciated.
Better career development opportunities should be given to the employees for their
improvement.
Skills of the employees should be appreciated.
CONCLUSION:
The study concludes that the motivational program procedures in Cushman &
Wakefield are found that highly effective. The study on employee motivation
highlighted that the reviews of an employees‘ regarding their company was
excellent. The employees are the backbone of the organization. Companies will earn
profit and grow only by motivating the employees in the organization. Proper
relationship must be maintained between the superiors and subordinates; this will in
turn increase the spirit of motivation finally increasing the performance at the
workplace. The main intention of motivation is to maintain the relationship with
respect to organization and employees, so that it will also result in goodwill of the
organization.
It was observed during the survey that majority of the respondents were concerned
about the confidence of the work in the whole process within the organization.
Hence, the study concludes that the motivation and performance of the employees is

JOURNAL BY THE DEPARTMENT OF MBA, MCA AND M.COM(FA), JYOTI NIVAS COLLEGE AUTONOMOUS 100
100
interlinked. Effective and proper motivation can help to develop mutual interest
between the organization and its employees.
References
Ali, B. J., & Anwar, G. (2021). An Empirical Study of Employees‘ Motivation and
its Influence Job Satisfaction. Ali, BJ, & Anwar, G. (2021). An Empirical Study of
Employees‘ Motivation and its Influence Job Satisfaction. International Journal of
Engineering, Business and Management, 5(2), 21-30.
https://papers.ssrn.com/sol3/papers.cfm?abstract id=3822723
Shahzadi, I., Javed, A., Pirzada, S. S., Nasreen, S., & Khanam, F. (2014). Impact of
employee motivation on employee performance. European Journal of Business and
Management, 6(23), 159-16
https://www.researchgate.net/publication/338506233_A_Study_of_Employee_Moti
vation_in_Organization
https://www.researchgate.net/publication/328420397_The_Impact_of_Employee_M
otivation_on_Organizational_Commitmen
Journal of Industrial Engineering and Management -
http://dx.doi.org/10.3926/jiem.1530
https://www.investopedia.com/terms/r/realestate.asp
https://www.ibef.org/industry/real-estate-india.aspx
https://www.kagaay.com/blog/history-development-of-indian-real-estate-market/
https://indiancompanies.in/top-10-real-estate-company-in-india/
www.employees.motivation.com
www.hr.com
https://www.cushmanwakefield.com/en/india/about-us/history

JOURNAL BY THE DEPARTMENT OF MBA, MCA AND M. COM (FA), JYOTI NIVAS COLLEGE AUTONOMOUS
101
101
DHII
Vol. XXIII January 2022
Journal Dept. of MBA, MCA and M. Com (FA)
Jyoti Nivas College Autonomous
EFFECT OF PERSONAL SELLING ON SALES GROWTH ON HOMELFIC WEGROW
COMMUNITY
~ Divya K
Abstract
HomelficWegrow Community is a company that began amidst the lock down, when the education
system was severely impacted, the company swooped in to save the day by providing quality
education with the benefit of convenience for each student. To aid these individuals in their goal
of finding suitable employment, the organization launched courses which any individual can pick
up without any prerequisites. They believe that learning should take place every day, and
vocational learning should be accessible to all, irrespective of their age, economic background,
gender, or any other basis for discrimination. The platform ensures that students enjoy the safety
of staying within their homes while gaining certifications and practical experience from well-
known institutions such as ICSS, IBBM etc among many more top mentors who have work
experience in renowned companies such as Jaguar and Microsoft. The research has been
conducted to understand the effect of personal selling on sales growth, to know how the
customer is convinced of the importance of the various courses offered by HomeflicWegrow and
to study the competitor’s strategy of the company. The questionnaire prepared has been
conducted on the 100 students of Bengaluru to know their opinion on the various courses of
HomeflicWegrow and many other educational platforms. The data collected has been analyzed
thoroughly and interpreted in the form of tables and graphs and conclusions have been made on
the same. Market research offers numerous ways to improve the efficiency and effectiveness of
the company. The analyzed data will be used to enhance the decision making of marketing
managers. It can reduce the business risk through the acquisition of relevant data and
information.
1. GENERAL INTRODUCTION
India has risen as the second biggest market for e-learning after the US. The area is as of now
remains at US$ 2 billion and is required to achieve US$ 5.7 billion by 2020. The separation

JOURNAL BY THE DEPARTMENT OF MBA, MCA AND M. COM (FA), JYOTI NIVAS COLLEGE AUTONOMOUS
102
102
training market in India is relied upon to develop at a Compound Annual Growth Rate (CAGR)
of around 11 for each penny amid 2016-2020 The training division in India is ready to witness
real development in the years to come as India will have the world's biggest tertiary-age
populace and second biggest graduate ability pipeline comprehensively before the finish of 2020
Right now, India's advanced education framework was the biggest on the planet enlisting more
than 70 million understudies while in under two decades, India has figured out how to make
extra limit with regards to more than 40 million understudies. The present spending on
instruction was of over Rs. 46,200 crores (US$ 6.93 billion) for India.
According to IBEF, the Indian instruction showcase was relied upon to twofold to $180 billion
by 2020, by floated the quick extension of the advanced learning market and the world's biggest
populace in the age section of six to 17 years even as the part keeps on being tormented by poor
framework and a lack of prepared educators. The advanced learning market is relied upon to
reach $5.7 billion by 2020 as the number of web clients was expanding. India's web client base
was assessed to achieve 550 million by 2020 with an around 40% entrance, a huge increment
from the 35% as of now. India has one of the biggest systems of advanced education foundations
on the planet with 850 colleges (as of April 2018) and 42,047 universities. An aggregate of 35.7
million individuals was enlisted in advanced education organizations in 2016-17. Net Enrollment
Ratio (GER) in advanced education achieved 25.2 for every penny in 2016-17.
In such a blasting business sector, new companies have begun centering their endeavours to
underwrite this statistic profit and the idea of training new companies is ascending as far as
changing recognitions and desires for individuals. Non Stop development and the appearance of
advanced cells have set off an essential change in how school and understudies and in addition
experts look for new aptitudes and learning and data. Players in the training area have begun
outfitting these troublesome advances to take into account the vast crowd and have embraced
creative approach to convey educational costs and instructing to understudy. New companies in
India have begun handling famous issues in Indian training area by utilizing innovation trying to
make instruction and adapting more agreeable and available.
2. COMPANY PROFILE

JOURNAL BY THE DEPARTMENT OF MBA, MCA AND M. COM (FA), JYOTI NIVAS COLLEGE AUTONOMOUS
103
103
HomeflicWegrow Community Private Limited is a Private incorporated on 20 October 2020. It
is classified as Non-govt Company and is registered at Registrar of Companies, Kanpur. Its
authorized share capital is Rs. 1,000,000 and its paid-up capital is Rs. 860,000. It is involved in
other education. Directors of HomeflicWegrow Community Private Limited are YashHemendra
Agarwal, Latika Agarwal and ArpitLochan. HomeflicWegrow is a platform where the youth can
connect, learn, grow and achieve together. It allows immense opportunities for growth so that the
youth leaders of our nation contribute in the welfare of our nation dramatically. The focus of
HomeflicWegrow remained on the holistic development of every child and that development
was possible due to tackling the problem of accessibility and affordability. They introduced
unconventional courses such as ethical hacking, music production, DJing, singing, graphic
designing, content creation, curation and marketing among many more.
These courses were not always encouraged by parents as they always envisioned that their
children would go for traditional careers such as being doctors or engineers. However, the
upcoming demand for these careers was recognized by HomeflicWegrow, along with the fact
that attaining knowledge pertaining to these courses was not easy. This was due to the hefty
prices which were charged by renowned institutions and also the fact that they could only teach
those students who could be physically present in classes.
The businesses which provide top-quality education would find an expansive audience for
themselves and the students would be able to enhance their skill sets at nominal prices. However,
the start-up did not just stop there. It even introduced the ―entrepreneurship boot camp‖ which
has successful professionals from various fields who counsel, mentor and structure the start-up
ideas that young students come up with so that they are ready to launch their start-ups in the real
world without the worry of failure. The best idea at the end of the 21-day boot camp also
receives funding of Rs.3, 00,000 to invest in their future business. HomeflicWeGrow
Community is a company that began amidst the lock down, when the education system was
severely impacted, the company swooped in to save the day by providing quality education with
the benefit of convenience for each student. HomeflicWeGrow offers online courses to the
students. Because of pandemic people who are struggling and are not able to make their month
productive HomeflicWeGrow is providing an opportunity to all the students to enroll for all the
best courses that will add value to their CV with resalable prices.

JOURNAL BY THE DEPARTMENT OF MBA, MCA AND M. COM (FA), JYOTI NIVAS COLLEGE AUTONOMOUS
104
104
3. RESEARCH METHODOLOGY
STATEMENT OF THE PROBLEM
It is obvious that the situation affects everyone, and everyone needs to come together so that we
can overcome the pandemic. However, we must not allow the situation to compromise the
quality of learning for those whose hands the future of our country lies. That‘s why we, as young
reporters, while considering the issue we were researching, are giving our own opinions and
suggestions for improving online learning:
Vulnerable families should be supported so that they have the means to acquire equipment
and skills to be able to support their children learn online.
Students and young people should be consulted. Future decisions should also take into
consideration how students feel, their views, their conditions and needs. Students should
have access to materials without feeling discriminated against, left to feel helpless when they
have questions, or unheard when they have an opinion or request.
As the situation evolves, a more purposeful approach is definitely required, by including
representatives from multiple areas in evaluating and sharing their experiences about what
worked well and what didn‘t. It should consider the problems and solutions faced by
students, parents and teachers.
In the present era, people prefer to use online education as it is convenient and time saving.
So, there is absolute need to study the sales growth levels of the customer towards online
education system.
OBJECTIVES OF THE STUDY
To study the marketing strategy of HomeflicWegrow
To understand the effect of personal selling on sales growth of HomeflicWegrow
To study the revenue generation strategy of the company
To study the competitors strategy of the company.
LIMITATIONS OF THE STUDY
Biased responses from the respondents.
Incomplete filling of questionnaire.
Lack of time.

JOURNAL BY THE DEPARTMENT OF MBA, MCA AND M. COM (FA), JYOTI NIVAS COLLEGE AUTONOMOUS
105
105
4. DATA ANALYSIS AND INTERPRETATION
TABLE 1. OCCUPATIONAL DISTRIBUTION OF THE RESPONDENTS
No. of
respondents
Percentage
Student 49 49%
Employee 18 18%
Business 25 25%
House
wife
08 08%
Total 100 100%
GRAPH 1. SHOWING THE OCCUPATION DISTRIBUTION
INTERPRETATION: As per the above analysis 49 percent of the respondents are students, 25
percent of the respondents are business people, 18 percent of the respondents are employees and
08 percent of the respondents are house wives. It can be concluded that most of the respondents
are students.
student
49%
business
25%
employee
18%
house
wife
8%
OCCUPATION
DISTRIBUTION
student
business
employee
house wife
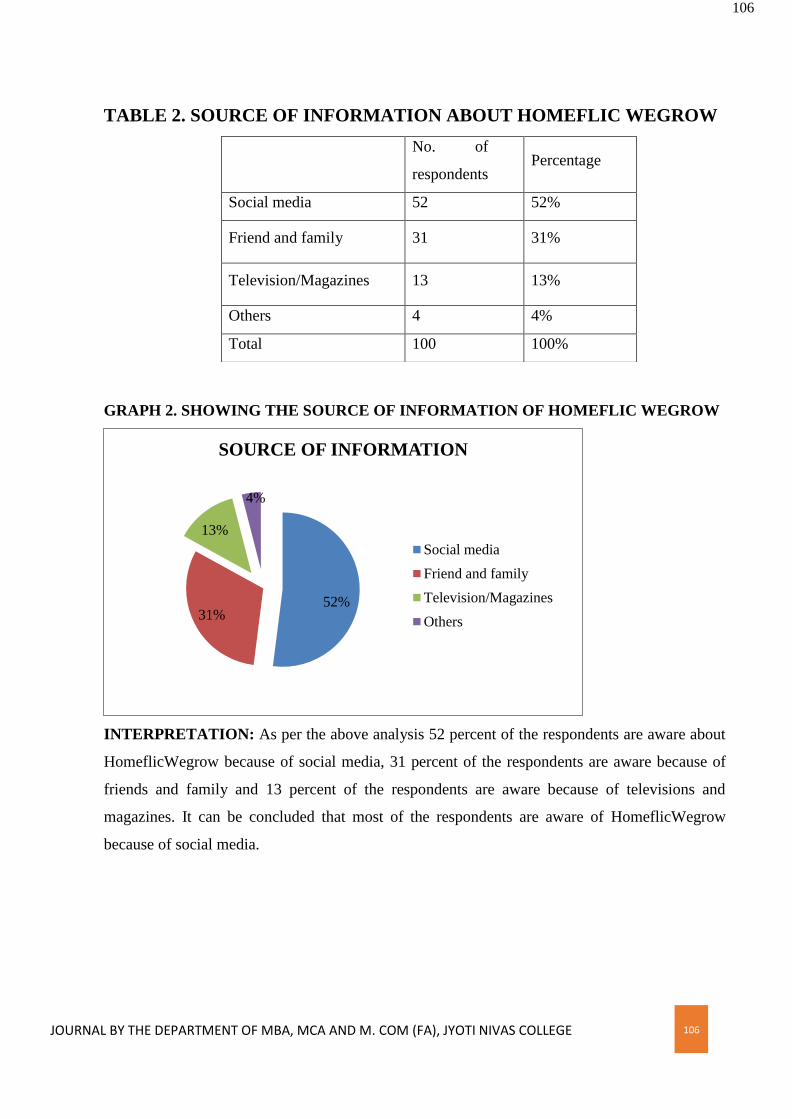
JOURNAL BY THE DEPARTMENT OF MBA, MCA AND M. COM (FA), JYOTI NIVAS COLLEGE AUTONOMOUS
106
106
TABLE 2. SOURCE OF INFORMATION ABOUT HOMEFLIC WEGROW
GRAPH 2. SHOWING THE SOURCE OF INFORMATION OF HOMEFLIC WEGROW
INTERPRETATION: As per the above analysis 52 percent of the respondents are aware about
HomeflicWegrow because of social media, 31 percent of the respondents are aware because of
friends and family and 13 percent of the respondents are aware because of televisions and
magazines. It can be concluded that most of the respondents are aware of HomeflicWegrow
because of social media.
52% 31%
13%
4%
SOURCE OF INFORMATION
Social media
Friend and family
Television/Magazines
Others
No. of
respondents Percentage
Social media 52 52%
Friend and family 31 31%
Television/Magazines 13 13%
Others 4 4%
Total 100 100%

JOURNAL BY THE DEPARTMENT OF MBA, MCA AND M. COM (FA), JYOTI NIVAS COLLEGE AUTONOMOUS
107
107
TABLE 3. USAGE OF E-LEARNING PLATFORM
No. of
respondents Percentage
HomeflicWegrow 55 55%
Udemy 20 20%
Vedantu 12 12%
TED 10 10%
Other apps 3 3%
Total 100 100%
GRAPH 3. SHOWING THE USAGE OF E-LEARNING PLATFORM
INTERPRETATION: As per the above analysis 55 percent of the respondents use
HomeflicWegrow, 20 percent of the respondents use Udemy, 12 percent of the respondents use
Vedantu, 10 percent of the respondents use TED and 03 percent of the respondents use other
apps. It can be concluded that most of the respondents use HomeflicWegrow for online courses.
5. SUGGESTIONS
According to the sources of awareness among the respondents, it is clearly seen that the
main source by which people come to know about the online learning courses is by social
media.HomeflicWegrow has successfully placed itself into the prospects mind making it
the India‘slargest online e-learning platform with huge range of products.
55%
20%
12%
10%
3%
USAGE OF E-LEARNING PLATFORM
Homeflic Wegrow
Udemy
Vedantu
TED
Other apps

JOURNAL BY THE DEPARTMENT OF MBA, MCA AND M. COM (FA), JYOTI NIVAS COLLEGE AUTONOMOUS
108
108
But HomeflicWegrow still needs to work on their core competence that is books and
stationery items.
With the entry of other competitors it will be a huge competitive market for
HomeflicWegrow and hence will have to position itself better.
The company should attract the market more vigorously and go in for trapping more and
new customers.
6. RECOMMENDATIONS
HomeflicWegrow can even have their education centers which can allow students to
come for the education, which will help them win the consumers faith.
Price will still be a factor as HomeflicWegrow being a huge company will use its
economies of scale to remove their competitors from the market; therefore they need to
be more competitive on that aspect.
Be very focused on students as well as parents and build amazing experiences for the
customers.
Company should provide a trail period of 1 week or more to customers before purchase,
as it is demanded by lots of customers.
To introduce even more new courses for the students.
Special care should be given to advertising, as there was lack of awareness among the
people.
The company should provide special schemes for customers with more information to
motivate them.
7. CONCLUSION
The study also reveals that main reason for marketing strategy in to growing importance of
online education is the increasing literacy about interne among people. They have identified that
internet is only advantageous through which they can serve their various purposes. This efficacy
of internet has intensified their tendency of being online and a step ahead in the syllabus. Today's
students strongly feel that every e-learning must use this efficacy to strengthen its marketing
efforts. So that they will get motivated to use online education with the intent of getting access to
exclusive content about new things and getting discount and sharing their feedback about brand
with the advertiser. With the advent of internet technology, consumers' preference towards
traditional marketing tools has decreased. Most popular traditional marketing tools are television

JOURNAL BY THE DEPARTMENT OF MBA, MCA AND M. COM (FA), JYOTI NIVAS COLLEGE AUTONOMOUS
109
109
& print media. The major benefits of online education are its capability of interaction between
consumers and advertisers followed by availability of wide range of information & ease of
accessing the class. These benefits make online education superior than traditional marketing.
But at the same time consumers are susceptible about the user-safety side of internet. They feel
that online education is unsafe as it may lead to increase in frauds& privacy issue.
REFERENCES
C.R. Kothari Research Methodology
www.homeflicwegrow.com

JOURNAL BY THE DEPARTMENT OF MBA, MCA AND M. COM (FA), JYOTI NIVAS COLLEGE AUTONOMOUS
110
110
DHII
Vol. XXIII January 2022
Journal Dept. of MBA, MCA and M. Com (FA)
Jyoti Nivas College Autonomous
A STUDY ON IMPACT OF COVID-19 IN NON IT RECRUITMENT
PROCESS
~ Kalsang Choedon
Abstract
During the last several months, jobs have become less secure and more demanding. In light of
these changes, it is appropriate to ask what is known about the implications of Covid-19 on
Recruitment. The paper investigates challenges Recruiter has faced regarding alterations in
jobs, tasks and duties, flextime working schedules. It examines how HR managers are satisfied
with workplace management during the pandemic and with communication arrangements. The
core function of an organization is Recruitment and Selection. Recruitment is the process of
attracting, screening, and selecting qualified people for a job at an organization or firm. For
some components of the recruitment process, mid- and large-size organizations often retain
professional recruiters or outsource some of the process to recruitment agencies. It is the
process to discover sources of manpower to meet the requirement of staffing schedule and to
employ effective measures for attracting that manpower in adequate numbers to facilitate
effective selection of an efficient working force.
1. Introduction
COVID-19, the disease caused by the novel coronavirus SARS-CoV-2, was first detected in
Wuhan, China, in December 2019, and has since evolved into a global pandemic in 2020,
producing one of the largest global health crises in modern history. The economic impact has
been big in many industries affecting the recruitment market itself. Instead of recruiting more
people to expand, companies are obliged to decrease the number of employees and minimize the
less profitable or more problematic areas. Companies are hiring less but more for partially
remote jobs. Also job announcements that offer remote work options get far more applications
than if they remain as an on-site offer. One of the biggest constraints remains the setting up of
how and when to start working. Not having a clear answer on travel restrictions makes it more
challenging to plan ahead for the enrollment of new people in the team. Shifting the whole

JOURNAL BY THE DEPARTMENT OF MBA, MCA AND M. COM (FA), JYOTI NIVAS COLLEGE AUTONOMOUS
111
111
recruitment process online through remote interviews and further with online on boarding
process. People are more cautious about job changes due to the economic and mobility
situations. Uncertainty is the most common feeling, so candidates tend to avoid applying for
positions where they fear their job position is not secure.
2. Research Methodology
Title of the Study
A Study on Impact of Covid-19 in Non IT Recruitment Process
Statement of the Problem
The current pandemic COVID-19 has brought all our life into a standstill. This as an adverse
impact on daily laborers, due to lack of work. Some organizations that have expanded their
business during the pandemic and have faced other types of staffing challenges. Many of them
have opted out for more flexible employment relationships and subcontracted work. This
research study aims to study the impact of covid-19 in non IT recruitment process.
Need and Importance
To study the impact of Covid-19 in Non IT Recruitment process in order to understand the
merits and demerits of the digital recruitment, change in the recruitment procedures followed by
the organization and use of modern technologies as a tool to hire the most qualified candidates.
Objectives of the Research
To analyses the impact of covid-19 on recruitment process.
To understand the steps of recruitment procedure followed by the companies during
pandemic covid-19.
To understand the recruitment strategies followed by the companies.
To study the future of digital recruitment.
Types of Research
Research is the systematic investigation into and study of materials and sources in order to
establish facts and reach new conclusions. Descriptive research is used to describe characteristics
of a population or phenomenon being studied. It collects data that are used to answer a wide
range of what, when and how questions pertaining to a particular population or group.

JOURNAL BY THE DEPARTMENT OF MBA, MCA AND M. COM (FA), JYOTI NIVAS COLLEGE AUTONOMOUS
112
112
Sampling Techniques
The researcher will be using probability (random) sampling method. It is a sampling technique in
which each sample has equal probability to be chosen. A sample chosen randomly is meant to be
an unbiased representation of total population.
Sample Size, Sample Description
50 respondents have been selected as a sample to the study.
The sample units selected for the survey are recruiters.
Research Instrument
The survey tool used in data collection are through filling up of questionnaire by the
respondents.
Limitation of the Study
This study is conducted for academic purpose only.
The study is restricted to Bangalore Urban.
The study confines to a limited number of respondents, the findings may not be
applicable to all the respondents.
There are chances for the responses to be biased and therefore it can be difficult to
analyze.
3. Analysis and Interpretation
Table 1: Showing the recruitment sources used by the respondents.
Category No. of
respondent
Percentage
Job Portals
(LinkedIn,
naukri, shine,
indeed etc.)
29 58%
Social Media 11 22%

JOURNAL BY THE DEPARTMENT OF MBA, MCA AND M. COM (FA), JYOTI NIVAS COLLEGE AUTONOMOUS
113
113
58% 22%
20%
0%
Job Portals Social Media Employees Referrals Outsourcing
Employees
Referrals
10 20%
Outsourcing 0 0%
Total 50 100%
Analysis: 58% of the respondents takes the help of Job portals, while 22% of respondents prefer
social media for sourcing and only 20% respondent source from employee referrals.
Graph 1: Showing the recruitment sources used by the respondents.
Interpretation: The majority of the respondents prefer to use job portals for sourcing the
potential candidates and only limited respondent prefer social media and employee referrals. No
respondent use outsourcing.
Table 2: The most common tool used for interview during Covid-19.
Category No. of
respondent
Percentage
Telephonic 16 32%
Virtual 31 62%
Walk-in 1 2%

JOURNAL BY THE DEPARTMENT OF MBA, MCA AND M. COM (FA), JYOTI NIVAS COLLEGE AUTONOMOUS
114
114
Others 2 4%
Total 50 100%
Analysis: The above table shown 32% of the interview happened through telephonic and 62%
through virtual, 2% walk-in and 4% others.
Graph 2: The most common tool used for interview during Covid-19.
Interpretation: The majority of the respondents voted Virtual interview for interviewing the
candidate during covid-19.
Table 3: What kind of work mode do the candidates prefer post covid-19.
Category No. of
respondent
Percentage
Work-from-home 37 74%
32%
62%
2% 4% 0%
10%
20%
30%
40%
50%
60%
70%
Telephonic Virtual Walk-in Others

JOURNAL BY THE DEPARTMENT OF MBA, MCA AND M. COM (FA), JYOTI NIVAS COLLEGE AUTONOMOUS
115
115
Work-from-office 5 10%
Anything 8 16%
Total 50 100%
Analysis: Respondents from the company surveyed has responded in the following way 74% of
the respondent had given votes for work from home, 16% voted for anything and 10% voted for
work from office.
Graph 3: What kind of work mode do the candidates prefer post covid-19.
Interpretation: Work from home is most popular work mode preferred by the candidate, post
covid-19.
4. Findings
Majority of the respondent who falls in the age group of 21-23 (58%) with highest
numbers have been working for 0-5 years in recruitment Industry.
74%
10% 16%
0%
10%
20%
30%
40%
50%
60%
70%
80%
Work-from-home Work-from-office Anything

JOURNAL BY THE DEPARTMENT OF MBA, MCA AND M. COM (FA), JYOTI NIVAS COLLEGE AUTONOMOUS
116
116
Majority of the respondent prefer sourcing candidates from Job portals rather than
sourcing from social media, employee referrals and outsourcings.
The most common tool used for interviewing the candidates during Covid-19 is Virtual
interview with the highest vote of 62%. The majority of the respondent voted for virtual
interview compared to telephonic and walk-in.
Due to the ongoing pandemic there is disruption of the economy, which affected the
business and it resulted in the decline of the hiring numbers.
The majority of the respondents agree that feedback received from HR after interviewing
the candidate during covid-19 is very slow compared to pre covid-19.
Due to the fear of virus, majority of the candidates prefer to work from home as there
would be less contact with people and less possibilities of getting infected. And only few
candidates are willing to work from office.
As covid-19 made it impossible to conduct face to face interview for the candidates. The
recruiter has adopted virtual mode of interview and the majority of the candidates are
comfortable to communicate to the interviewer through virtual interview medium.
5. Suggestions and Recommendations
From the findings I can suggest Wroots Global Private Limited the following things for the more
effectiveness of recruitment process.
Recruitment must be done by analyzing the job firstly which will make it easier and will
be beneficial from the Client‘s point of view.
I wish to suggest that the more emphasis should be given on internet, job advertisement
on social media platform so that more and more candidates can apply for the jobs and it is
easier for recruiter to find the right employee.

JOURNAL BY THE DEPARTMENT OF MBA, MCA AND M. COM (FA), JYOTI NIVAS COLLEGE AUTONOMOUS
117
117
The recruiter should constantly follow up with the candidates so that there is no
communication gap between the (HR Manager) Interviewer and the candidates. And
ensure that there is no misunderstanding between these two parties.
Providing trainings, workshops and seminars to employees will be beneficial and helpful
for employees as they would get better knowledge, skills and attitude on recruiting the
best candidates for the companies.
6. Conclusion
The main thing that I want to conclude firstly is that with the help of analysis, feedback
generated through questionnaire I found that the company is following an effective Recruitment
and Selection process to maximum extent. As per my study, out of the various methods of
sourcing candidates, the best one is getting references via references and networking.
In the process, I came across various experiences where the role of an HR and the relevant traits
she finds in the candidates were displayed. Company should focus on long term consistent
performance rather than short term. The emphasis towards training and enhancing skills of
recruiters needs to be more and also consistent.
Human resources are stated to be an integral part of any organization. The jobs, functions, tasks
and operations can be adequately performed by proficient and skilled personnel. Therefore,
within the organizational structure, it is vital to implement effective recruitment strategies and
selection processes.
Bibliography
Books and Journals
Aitken-Fox, E., Coffey, J., Dayaram, K., Fitzgerald, S., Gupta, C., McKenna, S., & Wei
Tian, A. (2020b). The impact of Covid-19 on human resource management: avoiding
generalisations. LSE Business Review.
Al-Kassem, A. H. (2017). Recruitment and selection practices in business process
outsourcing industry. Archives of Business Research, 5(3)
Adu-Darkoh, M. (2014). Employee recruitment and selection practices in the
construction industry in Ashanti Region. Unpublished thesis submitted to the Kwame

JOURNAL BY THE DEPARTMENT OF MBA, MCA AND M. COM (FA), JYOTI NIVAS COLLEGE AUTONOMOUS
118
118
Nkrumah University of Science and Technology for partial fulfilment for requirements
for the award of a degree in Master of Business Administration (HRM) Option.
Human resource management and the COVID-19 crisis: implications, challenges,
opportunities, and future organizational directions | Journal of Management &
Organization | Cambridge Core.
Websites
https://www.ilo.org/.../---migrant/documents/publication/wcms_74883…
COVID-19 has changed the hiring process forever! — People Matters
https://recruitingtimes.org/.../27795/how-covid-19-impacted-the-recruitment
Recruitment and hiring during COVID-19. | Coven Works
How has COVID-19 changed the face of recruitment? | HRD Canada (hcamag.com)
How Covid-19 Impacted the Recruitment - (recruitingtimes.org)
Human resource management and the COVID-19 crisis: implications, challenges,
opportunities, and future organizational directions | Journal of Management &
Organization | Cambridge Core.
Coronavirus and its impact on the recruitment industry

JOURNAL BY THE DEPARTMENT OF MBA, MCA AND M. COM (FA), JYOTI NIVAS COLLEGE AUTONOMOUS
119
119
DHII
Vol. XXIII January 2022
Journal Dept. of MBA, MCA and M. Com (FA)
Jyoti Nivas College Autonomous
A STUDY ON RECRUITMENT AND SELECTION IN RGA
SOFTWARE SYSTEMS PVT LTD.,
~ Nandini. K
Abstract
The success of an organisation depends heavily on the people who work there. An
Organisation cannot progress and succeed without positive and creative contributions from
people. Therefore, in order to achieve the goals of the organization it is necessary to hire
people with the necessary qualifications, experience and skills. To follow the current and
future requirements of the organization. It deals with the Human Resource that is
responsible for the activities related to recruitment and selection as a result of the study of
obtaining the results of analysis some suggestions to improve the recruitment and selection
has also been provided. The project was undertaken to analyse the concept “A study on
Recruitment and Selection at RGA software systems Pvt Ltd” in meeting the objective and to
adopt the best practices. Research methodology used to comprehend the object which
involve actual Collection of data through both primary and secondary sources in order to
procure the data, a questionnaire was designed and was share to the respondent and was
requested to give the feedback. The sample size of the research is 30 respondents. After
receiving the responses from the respondents, analysis and interpretation was done, At the
end, adaptable recommendations and suggestions based on the findings of the study are
given. The entire project report is presented in the form of a report using a chapter wise
scheme developed logically and sequentially. Finally, this project gives a complete view of
level of recruitment and selection procedures in the organization. If the level of recruitment
and selection procedures is good in organization then it could be possible for the
management to put forth the best results from the employees.
1. General Introduction:
Human Resource refer to the individuals or personnel or workforce within an organization
responsible for performing the tasks given to them for the purpose of achievement of goals

JOURNAL BY THE DEPARTMENT OF MBA, MCA AND M. COM (FA), JYOTI NIVAS COLLEGE AUTONOMOUS
120
120
and objectives of the organisation which is possible only through proper recruitment and
selection, providing proper orientation an induction, training, skill developments, proper
assessment of employees (performance appraisal), providing appropriate compensation and
benefits, maintaining proper labour relations and ultimately maintaining safety, welfare and
health concern of employees, which is process of human resource management.
The recruitment sources management is an extremely significant goal of the recruitment
process. The recruitment sources deliver the candidates for the selection procedure in the
organization. The better the candidates higher quality job candidates can be hired. Selection
is the process of evaluating the qualifications, experience, skill, knowledge, etc, of an
applicant in relation to the requirements of the job to determine his suitability for the job.
The selection procedure is the system of functions and devices adopted in a given company
to ascertain whether the candidate‘s specifications are matched with the job specifications
and requirements.
2. Industry And Company Profile
Service Industry it deals with Construction and Renting of Office Spaces through IT Parks
and Maintenance services. Company constructs the IT Parks at Bangalore and Rents it to the
IT companies and generates the revenue. It was established in the year 2000, with a clear
and concrete aim of creation of world class facilities. RGA envisaged a slew of IT Parks in
ELECTRONIC CITY, the prime space identified for IT development by the State of
Karnataka and ―Surya Park I‖ stands as a shining debut in the Electronic City in Bangalore.
Vision: To create bench marks and excel in our business ventures by providing world class
facilities associated with legendary client services and perpetually shaping ourselves into a
leading organization with empowered people and a sound societal and diversified approach
towards business.
Mission: To make ourselves indispensable in delivering world class facilities with a
determined focus on Quality, Time management and Client delight in an ethical and
environmentally friendly manner.
3. Research Methodology
The sampling size Chosen for this study was 30 respondents.
The study has been conducted in RGA Software Systems Pvt Ltd for a period of
2 months.

JOURNAL BY THE DEPARTMENT OF MBA, MCA AND M. COM (FA), JYOTI NIVAS COLLEGE AUTONOMOUS
121
121
Type of research is Descriptive research.
Type of data chosen is primary data and Secondary data.
Simple random sampling method was adopted for this research study.
The tools used for analysis are Simple Average Method, T-Test, Spearman‘s
Rank Correlation, Weighted Average Method.
Statement Of The Problem
Recruitment and Selection process describes how important an individual is with his or her
job which suits to them. It is estimated that at least one-third of business failures are due to
poor or wrong hiring decisions and inability to attract and retain the right talent and there is
a need for using the right recruiting procedure and retaining the employees, so the study on
recruitment procedure was selected in order to know how the organization is doing the
recruitment procedure that is to attract, select and retain the right candidates for right job.
Objectives Of The Study
• To understand the internal recruitment process in RGA.
• To identify the factors influencing recruitment.
• To identify factors influencing selection in RGA
• To analyse the effectiveness of recruitment and selection process.
• To give suitable recommendations to streamline the hiring process.
4. ANALYSIS AND INTERPRETATION OF DATA
Chart 1: Candidate Role in Recruitment Process
Analysis & Interpretation: 90% of the respondents feels that the Candidate Specifications
in Recruitment Process is clearly defined by the organization during the recruitment process,
and 10% of the respondents feels that it is not clearly defined. From above graph it is
0%
20%
40%
60%
80%
100%
Yes No
90%
10%

JOURNAL BY THE DEPARTMENT OF MBA, MCA AND M. COM (FA), JYOTI NIVAS COLLEGE AUTONOMOUS
122
122
observed that the candidate‘s specifications in recruitment process. Out of 100%
respondents 27% of respondent‘s feel that the position objective is defined clearly during the
recruitment process at RGA Software systems Pvt ltd.
Chart 2: Recruitment policy helpful towards achieving the goals of the
company.
Analysis & Interpretation: 28% of the respondents agree that the company‘s recruitment
policy is helpful in achieving the goals of the company. Whereas 2% of respondents
disagree that the company‘s recruitment policy is not helpful in achieving their goals as the
statement. The above graph shows whether the recruitment policy is helpful towards
achieving the goals of the company. 73% of the respondents say that the company‘s
recruitment policy is helpful in achieving the goals of the company.
Chart 3: Satisfaction with the job description given to the required
vacancy
93%
7%
Yes
No
90%
10% 0%
20%
40%
60%
80%
100%
Yes No

JOURNAL BY THE DEPARTMENT OF MBA, MCA AND M. COM (FA), JYOTI NIVAS COLLEGE AUTONOMOUS
123
123
0%
20%
40%
60%
Strongly
Disagree
Disagree Neutral Agree Strongly
Agree
Analysis & Interpretation: 90% of the respondents are highly satisfied with the job
description given to the required vacancy, and 10% of the respondents are dissatisfied with
the job description given to the required vacancy. Therefore, the above graph indicates that
the respondents are highly satisfied with the job description given to the required vacancy
for majority of its employees at RGA Software systems Pvt ltd.
Chart 4: The internal recruitment vacancies are declared publicly
Analysis & Interpretation: 23% of the respondents Strongly agree that the internal
recruitment are declared Publicly in RGA software systems Pvt ltd ,44% of the respondents
agree regarding the internal recruitment system, 23% of them are in neutral state,7% of
respondents disagree that there is no internal recruitment that are not declared Publicly , 3%
of respondents strongly disagree that there does not exist any internal recruitment which
declared Publicly during the recruitment system in RGA software systems Pvt ltd. Most of
the employees agree that the level of Transparency in recruitment system. from the above
graph, 44% of respondents respond that they agree to the internal recruitment of the
organization.

JOURNAL BY THE DEPARTMENT OF MBA, MCA AND M. COM (FA), JYOTI NIVAS COLLEGE AUTONOMOUS
124
124
Chart 5: External source of recruitment is followed by RGA software
systems Pvt ltd is given more priority
Analysis & Interpretation: The above table helps to find out that the external recruitment
system followed at RGA software systems Pvt ltd and are given much priority. In the above
table, 7% of the respondents responds that the employment exchange is an outside
source,33% has responded that online job portals are were given high priority, 43% of
respondents respond that the advertisement is an outside source,10% has responded that
consultancy are the external source of recruitment followed by the company and given more
priority.
Chart 6: The organization expectation from the candidates during
recruitment
Analysis & Interpretation: The above table helps to find out the organization expectation
from the candidates during recruitment system followed at RGA software systems Pvt ltd.
From the above table, Rounds were most of the candidates are screened out. Out of 30
respondents 77% of the respondent‘s opinion is through skill and knowledge and 13% of the
respondent‘s opinion is through Experience.7% of the respondent‘s opinion is through
13%
77%
3% 7%
Experience Skill and Knowledge Attitude Qualification

JOURNAL BY THE DEPARTMENT OF MBA, MCA AND M. COM (FA), JYOTI NIVAS COLLEGE AUTONOMOUS
125
125
Qualification and 3% of respondent‘s opinion is through attitude.
Chart 7: Opinion about the selection test conducted on the basis of
recruitment process
Analysis &Interpretation: 30% of the respondents are highly satisfied with the test
conducted, 60% of the respondents are satisfied with the Selection test, 10% of them are in
Neutral state. Hence, It is concluded that the respondents are highly satisfied with the
organization timeless recruitment and selection process at RGA software systems Pvt ltd.
Chart 8: Company looks for experienced employees in selection process
Analysis & Interpretation: The above table indicates, 23% of the respondents neither agree
or disagree that the company looks experienced employees in the selection process, 53%
agree to company looks experienced employees in the selection process, 23% strongly agree
that the company looks experienced employees in the selection process. Therefore, It is
concluded that majority of employee‘s respondent that they agree to the statement made that
the company looks for experienced employees in the selection process.
0%10%20%30%40%50%60%70%
30%
60%
10% 0% 0%
0%
50%
100%
Strongly
Disagree
Disagree Neutral Agree Strongly
Agree

JOURNAL BY THE DEPARTMENT OF MBA, MCA AND M. COM (FA), JYOTI NIVAS COLLEGE AUTONOMOUS
126
126
23%
54%
23% 0% 0% Strongly Agree
Agree
Neutral
Disagree
Strongly Disagree
Strongly
Disagree
Disagree Neutral Agree Strongly Agree
7%
0%
27%
15% 16%
Chart 9: Selection process will bring the right candidates for the right job
Analysis & Interpretation: The above table indicates,16% of the respondents agree
selection process at RGA software systems Pvt ltd will bring the right candidates for the
right job, 16% strongly agree that selection process will bring the right candidates for the
right job, 27% neither agree nor disagree that selection process will bring the right
candidates for the right job. Therefore, it is concluded that the respondents agree to the
selection process will bring the right candidates for the right job.
Chart 10: Recruitment and selection are done systematically
Analysis & Interpretation: The above table indicates, 64% of the respondents agree
recruitment and selection are done systematically at RGA software systems Pvt ltd, 20%
neither agree nor disagree that the recruitment and selection are done systematically. Most of
the respondents respond that they agree to the recruitment and selection are done
systematically at RGA software systems Pvt ltd.

JOURNAL BY THE DEPARTMENT OF MBA, MCA AND M. COM (FA), JYOTI NIVAS COLLEGE AUTONOMOUS
127
127
Chart 11: Recruitment and Selection process is helpful to meet the
company's manpower requirement.
Analysis & Interpretation: The above table indicates, That 17% of the respondents
strongly agree that the recruitment and selection process of company meets the current legal
requirements at RGA software systems Pvt ltd ,53% agree that the recruitment and selection
process of company meets the current legal requirements ,30% neither agree nor disagree
that the recruitment and selection process of company meets the current legal requirements.
Therefore, Majority of the respondents agree to the process of recruitment and selection
which is followed by the company is helpful to meet the company‘s manpower requirement
at RGA software systems Pvt ltd.
Chart 12: Defines about the job description and job specification in
recruitment process
Analysis & Interpretation: The above table indicates, Out of the total 30 respondents ,60%
of the respondents agree and clearly define about the job description and job specification in
hiring process, Respondents describe the job descriptions in the hiring process by the
personnel department. And clearly define job specifications. Majority of the respondents
agree and clearly define about the job description and job specification in hiring process,
Strongly
Disagree
Disagree Neutral Agree Strongly
Agree
7% 0% 13%
60%
20%
0%
100%
Strongly
Disagree
Disagree Neutral Agree Strongly
Agree

JOURNAL BY THE DEPARTMENT OF MBA, MCA AND M. COM (FA), JYOTI NIVAS COLLEGE AUTONOMOUS
128
128
0 5 10 15 20 25 30
Yes
No
29
1
Respondents describe the job descriptions in the hiring process by the personnel department.
And clearly define job specifications at RGA software systems Pvt ltd.
Chart 13: Hiring employees to make the best hiring decisions
Analysis & Interpretation: The above table indicates, 96% of the respondents agree that
HR trainer hirers employees to make the best hiring decisions,4% of the respondents
disagree to the statement. Hence, majority of the respondents agree that HR trainer hirers
employees to make the best hiring decisions at RGA software systems Pvt ltd.
Chart 14: HR team act as a consultant to enhance the quality of the
applicant pre-screening process
Analysis & Interpretation: From the above table, 87% of the respondents agree that HR
team act as a consultant to enhance the quality of the applicant pre-screening process but
13% of the respondents disagree to the statement and says consultant does not enhance the
quality of the applicant pre-screening process. The above graph indicates the Opinion that
the respondents agree that the HR team act as a consultant to enhance the quality of the
applicant pre-screening process at RGA software systems Pvt ltd.
87%
13% 0% 0%
Yes
No

JOURNAL BY THE DEPARTMENT OF MBA, MCA AND M. COM (FA), JYOTI NIVAS COLLEGE AUTONOMOUS
129
129
0% 10% 20% 30% 40% 50% 60% 70% 80% 90% 100%
Strongly Agree
Agree
Neutral
Disagree
Strongly Disagree
23%
57%
20%
0%
0%
Chart 15: E-recruitment is a suitable way of recruiting
Analysis & Interpretation:23% of the respondents Strongly agree that the e- recruitment as
a suitable way of recruiting in RGA software systems Pvt ltd, 57% of the respondents agree
regarding the e- recruitment as a suitable way of recruiting, 20% of them are in neutral state
they neither agree nor disagree that e- recruitment as a suitable way of recruiting at RGA
software systems Pvt ltd. The analysis made using weighted average method helps to
understand the Opinion that the respondents agree that thee-recruitment is a suitable way of
recruiting.
5. SUMMARY
FINDINGS
After analysing and interpreting the data, certain findings are drawn to make the
―A study on recruitment and selection at RGA software systems Pvt Ltd.,‖
90% of the respondents say that the position of objectives is defined clearly
during the recruitment process.
54% of respondents are highly satisfied with the job description provided for the
vacancy.
Majority of the respondent‘s opinion was good regarding recruitment and
selection process followed in the organization.
The study depicts that 64% respondents agree that recruitment and selection are
done systematically and 20% and neutral towards the recruitment and selection
which is done systematically.
In this survey 33% of the respondents said that the effectiveness of the interview
process and other selection measures such as testing is fair and 27% of

JOURNAL BY THE DEPARTMENT OF MBA, MCA AND M. COM (FA), JYOTI NIVAS COLLEGE AUTONOMOUS
130
130
respondents said that the equipment is excellent including the evaluation of
effectiveness of the interview and other choices.
The study depicts that 44% of the respondents agree that internal recruitment
vacancies are declared publicly,23% of the respondents Strongly agree to the
internal recruitment vacancies are declared publicly and 7% of the respondents
disagree to the internal recruitment vacancies which are declared publicly.
The study depicts that 23% of the respondents neither agree not disagree that the
company looks for experienced employees in selection process and 53% agree
that the company looks for experienced employees in selection process.
The study depicts that 16% of the respondents strongly agree that selection
process at RGA software systems private limited will bring the right candidate
for the right job,27% of the respondents neither agree nor disagree to the
selection process at RGA software systems private limited will bring the right
candidates for the right job.
SUGGESTIONS
The company needs to recruit high quality staff with the right skills on the
appropriate contracts to deliver the key objective of the position and
organization.
Employee should be given enough time to reflect and plan improvements.
The company must choose a recruiting approach that produce the best pool of
candidates quickly and cost effectively.
It is important for the organization to know exactly what they have to offer
potential employee, than highlight their best features when recruiting candidates.
As and when the resumes were received a primary screening of it is to be done
and a tracker should be updated which had all fields that was required for
evaluation and easy identification of the candidates suitable for various fields.
The company can recruit more candidates in for smooth functioning of the
organization.
Recruitment feedback should be taken by the candidates to improve the
recruitment process.
JOURNAL BY THE DEPARTMENT OF MBA, MCA AND M. COM (FA), JYOTI NIVAS COLLEGE AUTONOMOUS
131
131
follow up to be done to the newly engaged employees to ensure that they have
settled in and to check on how well they are doing if they have any problems, it
is better to identify them at the early stage rather than allowing them to fester.
It has been found the management has made mandatory of describing about
job profile in detail to the candidates at the time of recruitment. Thus, the
management may continue this strategy in future perspective.
CONCLUSION
Recruitment and selection are getting very much importance these days in the organization.
It is essential to effective Human Resource Management. It is the heart of the whole HR
system in the organization. The effectiveness of many other HR activities, such as selection
and training depend on the quality of new employees attracted through the recruitment
process. It is very critical thing to evaluate the human resources. Policies should always be
reviewed as these are affected by the changing environment. It is systematic procedure that
involves many activities. The process includes the steps like HR planning, attracting
applicant and screening them. It is very important activity as it provides right people in right
place at right time. If suitable employees are selected which are beneficial to the
organization it is at safe side but if decision goes wrong, it can be dangerous to the
organization. So, it is an activity for which HR department gets very much importance.
Finally, better recruitment and selection strategies result in improved organizational
outcomes. The more effectively organizations recruit and select candidates, the more likely
they are to hire and retain satisfied employees.
6. BIBLIOGRAPHY
BOOKS AND JOURNALS:
C.R. Kothari, ―Research methodology methods and Techniques‖, Second
Edition, New Age International Publishers,2004
Korsten (2003) and Jones (2006), Human Resource Management, Study to
Identify the Relationship Between Recruitment, Selection towards Employee
Engagement. International Journal of Scientific Research and Modern Education
(IJSRME), ISSN: 2455–5630, 1(2), 2016, 149-155
ALAN PRICE, (2007), Human resource management in a business context,
HUMAN RESOURCE MANAGEMENT and New Web Technologies Perspectives

JOURNAL BY THE DEPARTMENT OF MBA, MCA AND M. COM (FA), JYOTI NIVAS COLLEGE AUTONOMOUS
132
132
on Work Vol. 10, No. 2 (Winter 2007), pg. 36-38
JM Hiltrop-European Management journal,1996-Elsevier, A framework for
diagnosing human resource management practices, European management
journal, volume issue 3, June 1996, pg243-254
Jackson (1987), Bratton and Gold, (2017), human resources education/training
influences company‘s ability to identify profitable market segments,
"Ambidextrous workforces for managing market turbulence", Career
Development International, Vol. 24 No. 5, pp. 491-
507. https://doi.org/10.1108/CDI-10-2018-0265
WEBSITES:
www.googlescholar.com
www.rgafacilities.com
www.researchgate.net
https://gladtutor.com/recruitment -and-selection-process-in -hrm/

JOURNAL BY THE DEPARTMENT OF MBA, MCA AND M. COM (FA), JYOTI NIVAS COLLEGE AUTONOMOUS
133
133
SECTION III (MCOM(FA))

JOURNAL BY THE DEPARTMENT OF MBA, MCA AND M. COM (FA), JYOTI NIVAS COLLEGE AUTONOMOUS
134
134
FOREWORD
Nothing has such power to broaden the mind as the ability to investigate systematically and truly.
- Marcus Aurelius
The Purpose of Dhii is to develop a habit of conducting research among students’ fraternity in the field of accounts, taxation and finance. This Journal facilitates the students to a complete process of considering data and having full understanding of the ideas and information. The students were given a liberty to choose an independent topic and were encouraged to get one’s hand to a higher level of Academic progress, a world without accounting, Taxation and finance would lead to an economy that is without financial goals and development, and still would remain an underdeveloped country, therefore it is important for every individual to understand accounting, taxation and finance so as to have a well-established economy. The following articles throw a highlight on such important topics that could change the financial world and the economy of the country leading to be global leaders. The First Paper was a study on banks creating asset and the recovery, this topic is one most important topic and is the need of the hour, the RBI has laid in certain regulations pertaining to NPA and if NPA’s is not managed well it leads to financial distress. This paper mainly focuses on various types of Assets created by the bank such as, Car Loan, Gold Loan, House Loan, Credit Cards, Personal Loan, Bike Loan etc, it also should what is the percentage of assets created by the bank also this paper throws some light on the NPA’s The second paper talks about Indirect Taxation, GST was implemented in India on 1st July 2017, it changed the entire concept of indirect tax, it is most important to understand this tax as the government focused on having a unified tax in the country. This research paper focused on calculation of GST in the logistics Industry and also it studied the process of filing GST, in this paper discussion were made on the type of GST – Which is SGST and CGST along with it the process of filing a GST was researched upon, there are many individuals who do not know how to file GST and still take the help of third party this report explains the process of GST filing. The third research paper talk about Investment particularly in Mutual funds, this investment creates huge opportunity for wealth management companies to make investment in various avenues such as equity funds, debt funds and balanced funds, without mutual fund the financial industry would be performing well. This research paper mainly focuses on midcap funds of various companies to calculate Sharpe ratio, Jenson ratio and also trainer’s ratio, this research paper also focused on beta calculation and provided necessary suggestion to make an investment in mutual that can give a return of 15 to 20 %. The fourth paper talks about investment particularly in large Cap Mutual fund, these investments are dynamic financial institutions which play a crucial role in an economy by mobilizing savings and investing them in the capital market. They are usually objective

JOURNAL BY THE DEPARTMENT OF MBA, MCA AND M. COM (FA), JYOTI NIVAS COLLEGE AUTONOMOUS
135
135
orientated. The Fund Manager allocates assets to an investor’s portfolio based on their objectives. Mutual Fund will diversify your portfolio over a variety of investment vehicles. This study focuses on two leaves out of the many in mutual funds. The main aim is to understand the concept and the difference between actively and passively managed mutual funds. The data collected are used to determine returns on investment in the respective schemes selected for the study since return on investment is the key performance indicator which is often used by the investors. Mr. Vincent Paul Co-ordination, Department of M.Com (FA) Jyoti Nivas College, Autonomous Post Graduate Centre Bangalore

JOURNAL BY THE DEPARTMENT OF MBA, MCA AND M. COM (FA), JYOTI NIVAS COLLEGE AUTONOMOUS
136
136
DHII
Vol. XXIII January 2022
Journal Dept. of MBA, MCA and M. Com (FA)
Jyoti Nivas College Autonomous
IMMACULATE
~Joyce Pallavi
Abstract
Loans refer to when one party gives money to another on the condition that it is paid back,
typically with interest; yet ascertain time in the future. The terms of the loan determine what that
interest rate will be, how long be borrower has to repay the money, and sometimes place
additional stipulations on the funds including how the proceeds are used.
The growth of various banking and co-operative has largely contributed to an increasing lending
to borrowers. It is vital to note that, today’s economic growth poses a big challenge to lenders to
predict borrowers’ performance in recessionary conditions.
Individuals and organizations can apply for loans for a wide variety of reasons. When folks
consider loans, they generally solely think about motorcar loans and residential loans. Lenders,
however, market a large type of loans for several totally different functions. Each variety of loan
has its own risks and customary terms, reckoning on it operate. Lenders are also a lot of willing
to create bound kinds of loans than others supported their purpose.
Keywords: ( Loan, NPA, Accounts)
1. Introduction to Banking
The banking sector is that the life line of any fashionable economy. It is one among the vital
money pillars of the money sector that plays an important role within the functioning of associate
degree economy. It is important for economic development of a rustic that its funding needs of
the trade, trade and agriculture square measure met with higher degree of commitment and
responsibility. Thus, the development of a country is integrally linked with the development of
the banking. In a modern economy, banks are to be considered not as dealers in money but as the
leaders of development. They play a vital role within the mobilization of deposits and
disbursement of credit to numerous sectors of the economy. The industry reflects the economic
health of the country.
The strength of associate degree economy depends on the strength and potency of the financial
set-up, that successively depends on a sound and solvent industry. A sound industry with

JOURNAL BY THE DEPARTMENT OF MBA, MCA AND M. COM (FA), JYOTI NIVAS COLLEGE AUTONOMOUS
137
137
efficiency mobilized savings in productive sectors and a solvent industry ensures that the bank is
capable of meeting its obligation to the depositors.
2. What is Asset Valuation?
Asset valuation simply pertains to the process to determine the value of a specific property,
including stocks, options, bonds, buildings, machinery, or land, that is conducted usually when a
company or asset is to be sold, insured, or taken over. The assets may be categorized into
tangible and intangible assets. Valuations can be done on either an asset or a liability, such as
bonds issued by a company.
3. Asset Valuation – Valuing Tangible Assets
Tangible assets refer to a company‘s assets that have a physical form, which have been
purchased by an organization to produce its products or goods or to provide the services that it
offers. Tangible assets can be categorized as either fixed asset, such as structures, land, and
machinery, or as a current asset, such as cash.
Other examples of assets are company vehicles, IT equipment, investments, payments, and on-
hand stocks. To compute the net tangible assets of a company: The company needs to look at its
balance sheet and identify tangible and intangible assets.
From the total assets, deduct the total value of the intangible assets.
From what is left, deduct the total value of the liabilities. What is left are the net tangible assets
or net asset value.
4. Asset Valuation – Valuing Intangible Assets
Intangible assets are assets that take no physical form, but still provide a future benefit to the
company. They may include patents, logos, franchises, and trademarks. Say, for example, a
multinational company with assets of $15 billion goes bankrupt one day, and none of its tangible
assets are left. It can still have value because of its intangible assets, such as its logo and patents,
that many investors and other companies may be interested in acquiring.\
5. Review of Literature
Review of literature is a description of the literature relevant to a particular field or topic. it
offers an outline of what has been aforesaid, who the key writers are, what are the prevailing
theories and hypotheses, what question are being asked and what methods and methodologies are
appropriate and useful. as such, it's not in itself primary analysis however rather it reports on
alternative findings.

JOURNAL BY THE DEPARTMENT OF MBA, MCA AND M. COM (FA), JYOTI NIVAS COLLEGE AUTONOMOUS
138
138
Garber (1997) the study is about process of pursuing loans which have not been repaid and
managing to recover them by convincing the borrowers to make attempts to repay their
outstanding loans. Normally, this role of recovering loans is not an easy task as clients will go
out of their way to prove inaccessible to the lender (bank). The banking industry in most cases
has a debt recovery unit which is in charge of following loans before they become delinquent
and make attempts to recover the loans.
Maphartia (2004) the study is about rescheduling signifies a change in the existing terms of a
loan. A financial institution should consider rescheduling a debt when it has determined that the
rescheduling is in the government's interests and that recovery of all or a portion of the debt is
reasonably assured. As with installment payments, before rescheduling a debt, the agency should
reassess the debtor's financial position and ability to repay the debt if rescheduled.
The bank should discourage informal workout arrangements with debtors. Each bank should
establish uniform policies, procedures and criteria for rescheduling and other types of workouts
for each program area. Its po0licies and procedures should provide for the recognition of gains
and losses on rescheduled accounts in accordance with the provisions of credit management
standards
Capon (2002) the study is about Credit grading systems may be utilized by the banks a credit
recovery strategy. A credit score is a number that is based on a statistical analysis of a
borrower‘s credit report, and is used to represent the creditworthiness of that person. A credit
score is based totally on credit report info. Lenders, such as banks use credit scores to evaluate
the potential risk posed by giving loans to consumers and to mitigate losses due to bad debt.
Prosser (2003) the study is about unhealthy and uncertain loans share several similar
characteristics, the only real difference being their level of collect ability, the general rule is that
any debt greater than any debt greater than 6months must be carefully considered as a bad debt,
though a debt can become ‗bad‘ at any time within its life cycle depending on the circumstances,
while debts are often classified uncertain once a debt is aged 90days or additional. Additionally,
bad debts are generally the result of objective evidence that is when there is proof or advice from
an independent third party regarding the non collectable debt, while doubtful debts are based on
subjective, though not entirely arbitrary, estimations
Selvarajan B and Vadivalagan G (2013) the study considers about the problem of bad and
doubtful loan prevails in the entire Indian banking industry. Major portion of bad debts in Indian
banks arouse out of lending to the priority sector at the dictates of politicians and bureaucrats. If

JOURNAL BY THE DEPARTMENT OF MBA, MCA AND M. COM (FA), JYOTI NIVAS COLLEGE AUTONOMOUS
139
139
solely banks had monitored their loans effectively, the bad debt problem could have been
contained if not eliminated. The top management of banks was forced by politicians and
bureaucrats to throw good money after bad in the case of untrustworthy borrowers.
Akanksha Baghel (2017) the study is about India‘s banking industry is in the throes of a crisis.
Bad debts are piling up at banks. According to the statistics provided by banking concern of
Asian nation (RBI), Gross Non- Performing Assets (NPA) is INR 6120 Billion and the
percentage of variation is 89.3 in the economic year 2015-16 as against agency 3233 billion and
twenty-two.3 percentage variation in 2014-15.
The business of regular industrial Banks (SCBs) additionally slowed considerably throughout
2015-16. The Gross Non-Performing Advances (GNPAs) ratio increased sharply to 7.6 percent
from 5.1 percent between September 2015 and March 2016, largely reflecting a reclassification
of restructured standard advances as non-performing due to Asset Quality Review (AQR) India‘s
Bad Debt problem is choking off new credit and dampening the economic growth
G. Chandrasekhar Rao (2003) the study is about the survival of many weak bank
managements and unions of their employees, he noticed that the main reasons for the banking
units to become weak leading to mounting bad debts in diversification of funds by promoters, the
other region is the tardy legal system and the inadequate legislation for recoveries. The reasons
stated for the increasing Bad debts is the primary sector are directed and pre approved loans
sanctioned under sponsored programmers’, absence of any securities, lack of effective follow
up etc. it is found that majority of the defaulters are willful defaulters and hence criminal
proceeding against corporate defaulters are to be issued to recover this national wealth.
Government shall guarantee correct legal foundation for social control of contracts and effective
recovery of dues by banks.
Rajeshwari Krishnan (2002) focused on the matter of swelling dangerous and uncertain debts
in banks and institution of the country becomes a lot of and a lot of Unmanageable and created
threats for the monetary sector. She found the securitization can be used for the liquidating the
liquid and long-term debts like loans receivables of the financial institutions or bank by issuing
marketable securities against them. She concludes that the SARFAESI ACT is definitely big leap
forward not only in the field of NPA management but also promoting the securitizing market in
India. The act may require fine- tuning to bring in natural justice.
JOURNAL BY THE DEPARTMENT OF MBA, MCA AND M. COM (FA), JYOTI NIVAS COLLEGE AUTONOMOUS
140
140
6. Objective of the and Scope of the Study
1. To understand different types of loan sanctioned in Guardian Souharda Sahakari Bank
Niyamita.
2. To identify sector wise loan disbursement for last 5 years.
3. To identify the problems related to loans and advance department.
7. Data Collection
Data collection refers to the methods how the data will be collected for the purpose of the study
in order to analyse the information and to interpret and present the same.
8. Secondary Source
Secondary source is the data which is already available, and it includes the existing sources.
Secondary source refers to data which is collected by someone who is someone other than the
user. Secondary data will be collected from the
Annual reports.
Website.
Textbooks, magazines.
Balance sheet.
9. Tool of the Study
Annual report is that the very important tool accustomed collect the secondary data sort the
consumers for analysis. data collected from various sources were analyzed and additionally the
statistical technique used for analyzing, tabulated and given and style of statistical tables so on
modify interpretation supported that finding and conclusion were came across regarding job
satisfaction at guardian Souharda Sahakari Bank Niyamita.
10. Tool of Aanalysis
The data is tabulated victimization maths techniques like constructing descriptive table,
proportion and use of diagrams (pie charts, bar graph).
Tabulated data is analyzed on the premise of objectives framed and consequently inferences area
unit drawn.

JOURNAL BY THE DEPARTMENT OF MBA, MCA AND M. COM (FA), JYOTI NIVAS COLLEGE AUTONOMOUS
141
141
11. Analysis
Table Representing Long Term Loans of Guardian Bank
Particulars 2016 % 2017 %
Long term loans
Housing loan 5,044,758,888 18.1 3,998,583,341 16.06
Guardian nest credit 1,594,604,800 5.72 29,490,146,00 11.84
Secured term loans 13,358,754,047 47.94 107,003,153,98 42.99
Guardian secure credit 7,864,763,900 28.22 7,239,007,500 29.08
Total long term loan 278,628,816,35 99.98 24,886,920,839 99.97
Particulars 2018 % 2019 % 2020 %
Long term
loans
Housing loan 31,472,976 11.
3 16,118,109
5.
5 14,601,418 4.6
Guardian nest
credit 46,526,789
16.
71 61,206,997
21
.0
6
96,487,594 30.
47
Secured term
loans 94,939,067
34.
1 71,227,867
24
.5 45,446,200
14.
35
Guardian
secure credit
105,459,66
2
37.
88
142,067,09
4
48
.8
8
160,090,90
3
50.
56
Total long
term loan
278,398,49
4
99.
99
290,620,06
7
99
.9
316,626,11
5
99.
98
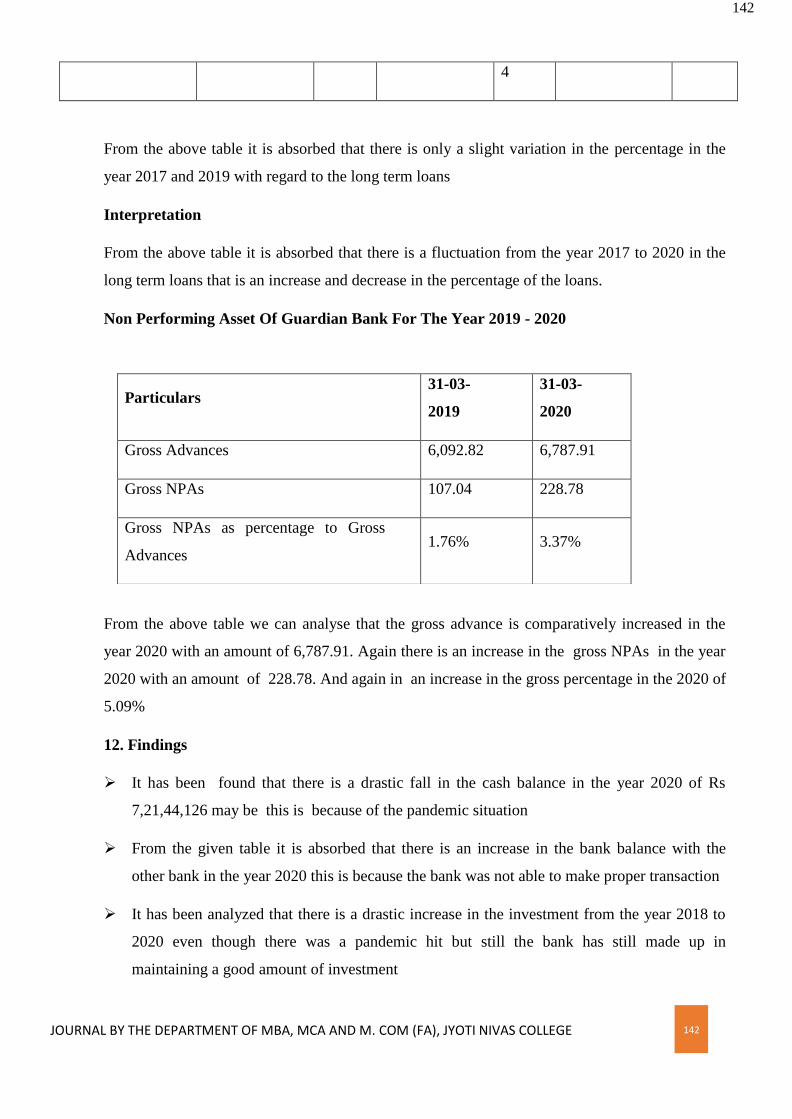
JOURNAL BY THE DEPARTMENT OF MBA, MCA AND M. COM (FA), JYOTI NIVAS COLLEGE AUTONOMOUS
142
142
4
From the above table it is absorbed that there is only a slight variation in the percentage in the
year 2017 and 2019 with regard to the long term loans
Interpretation
From the above table it is absorbed that there is a fluctuation from the year 2017 to 2020 in the
long term loans that is an increase and decrease in the percentage of the loans.
Non Performing Asset Of Guardian Bank For The Year 2019 - 2020
From the above table we can analyse that the gross advance is comparatively increased in the
year 2020 with an amount of 6,787.91. Again there is an increase in the gross NPAs in the year
2020 with an amount of 228.78. And again in an increase in the gross percentage in the 2020 of
5.09%
12. Findings
It has been found that there is a drastic fall in the cash balance in the year 2020 of Rs
7,21,44,126 may be this is because of the pandemic situation
From the given table it is absorbed that there is an increase in the bank balance with the
other bank in the year 2020 this is because the bank was not able to make proper transaction
It has been analyzed that there is a drastic increase in the investment from the year 2018 to
2020 even though there was a pandemic hit but still the bank has still made up in
maintaining a good amount of investment
Particulars 31-03-
2019
31-03-
2020
Gross Advances 6,092.82 6,787.91
Gross NPAs 107.04 228.78
Gross NPAs as percentage to Gross
Advances 1.76% 3.37%

JOURNAL BY THE DEPARTMENT OF MBA, MCA AND M. COM (FA), JYOTI NIVAS COLLEGE AUTONOMOUS
143
143
There is gradual increase in the advances but from the year 2017, 2018, 2019 and 2020 even
though there was pandemic hit the bank have still performed well
It has been found that there is a continuous increase in Deposits and other accounts from the
year 2016 to 2020
From the given table with regard to other liabilities there is decrease in other liabilities
from the year 2016 to 2017 and again in the year 2018, 2019 and 2020 there is a high level
of increase in the liabilities
It has been found that there is a slight decline in the capital from the year 2019 to 2020 this
could be because of the pandemic situation
It has analyzed that there is continuous increase in the Reserve and other reserve from the
year 2016 to 2020
It is absorbed that there is a fluctuation rate every year in the short term loan
It has been found that there is a high level of variations in the percentage from the year 2016
to 2018 but in the year 2019 and 2020 the percentage remains to be constant
From the given table there is a finding that there is a fluctuation from the year 2017 to 2020
in the long-term loans that is an increase and decrease in the percentage of the loans
It has been found that there is dip in the fixed deposit from the year 2018 to 2020 this could
be because of the pandemic hit
It has been found that there is a decline in the education loan from the year 2018 to 2020
where the bank has not recovered the loan amount from the customers may be this could be
because of the pandemic hit
It has been found that the taxi operating loan has performed well only in the year 2016 on a
comparison of all other years
It has been found that there is a constant decrease in the amount from the year 2019 this
could be because of the pandemic situation the bank could not perform well.
It has been analyzed that the gross advances have increased in the year 2016 but on the
comparison of both the years that is 2016 and 23017 the bank have performed well in the
2016 with the percentage a good percentage

JOURNAL BY THE DEPARTMENT OF MBA, MCA AND M. COM (FA), JYOTI NIVAS COLLEGE AUTONOMOUS
144
144
It has been found that the gross advances have increased in the year 2019 with a good
percentage
It has been found that there is an increase in the gross advances , gross NPAs and the
percentage in the year 2020 this could be because of the pandemic hit were the bank could
not perform well.
13. Suggestions
1. The bank should set up more ATM‘s, especially in remote areas to help the customer to draw
the money easily.
2. To charge low interest rates on the education loan (unsecured), taxi operator loan, and
unsecured term loan.
3.To speed up loan appraisal, and the issuing process should be quick and the interest charged
should be less
4. Guardian bank should introduce different kinds of loans like, agricultural loan, poverty
alleviation loan loans for women development etc.
5. Giving importance to the new portfolio department and their commissions as most of the
customers to a large extent consider the advice of those people while taking a loan.
6. Guardian bank should be more concerned about physical verification rather than phone
verification so it will avoid fraud or cheating.
7. To meet immediate requirement of customers, the banks have to increase their working hours.
8. Bank should improve the potential efficiency in speeding up the processing of the loan where
it helps in the consumption of time.
9. Guardian bank should decrease the interest rates of all types of loans only then customers will
prefer taking loan.
10. Guardian bank has to improve there interaction with its customer.Only then the customers
will be comfortable in taking loans
14. Conclusion
Bank always contribute towards the economic development of a country. Compared with other
banks Guardian bank is also playing lending role in socioeconomic development of the country.
By analyzing the performance, it is observed that a potential growth might be accelerated

JOURNAL BY THE DEPARTMENT OF MBA, MCA AND M. COM (FA), JYOTI NIVAS COLLEGE AUTONOMOUS
145
145
through effective implication of some policy, being an old generation bank it has an advantage
compared to newly established bank in the form of wide range of activates, however policy
implication needs to be as fast as possible to grab the early advantage.
In the case of loan and recovery the banker advances a lump sum for a certain period at an
agreed rate of interest rate. The entire amount is paid on an occasion either in cash or by credit in
his current account which he can draw at any time. The interest is charged for the full amount
sanctioned whether he withdraws the money from his account or not. The loan may be repaid in
installments or at the expire of certain period. The loan may be made with or without security. A
loan once repaid in full or in part cannot be withdrawn again by the customer. In case a borrower
wants further loan, he has to arrange for a fresh loan.
Loan may be a demand loan or a term loan. Demand loan is payable on demand. It is for a short
period and usually granted to meet working capital needs of the borrower. Term loans may be
medium –term or long term loan. Medium –term loans are granted for a period ranging from one
year to five years for the purchase of vehicles, tractors, tools and equipment‘s. Long-term loans
are granted for capital expenditure such as purchase of and. Construction of factory building,
purchase of new machinery and modernization of plant.
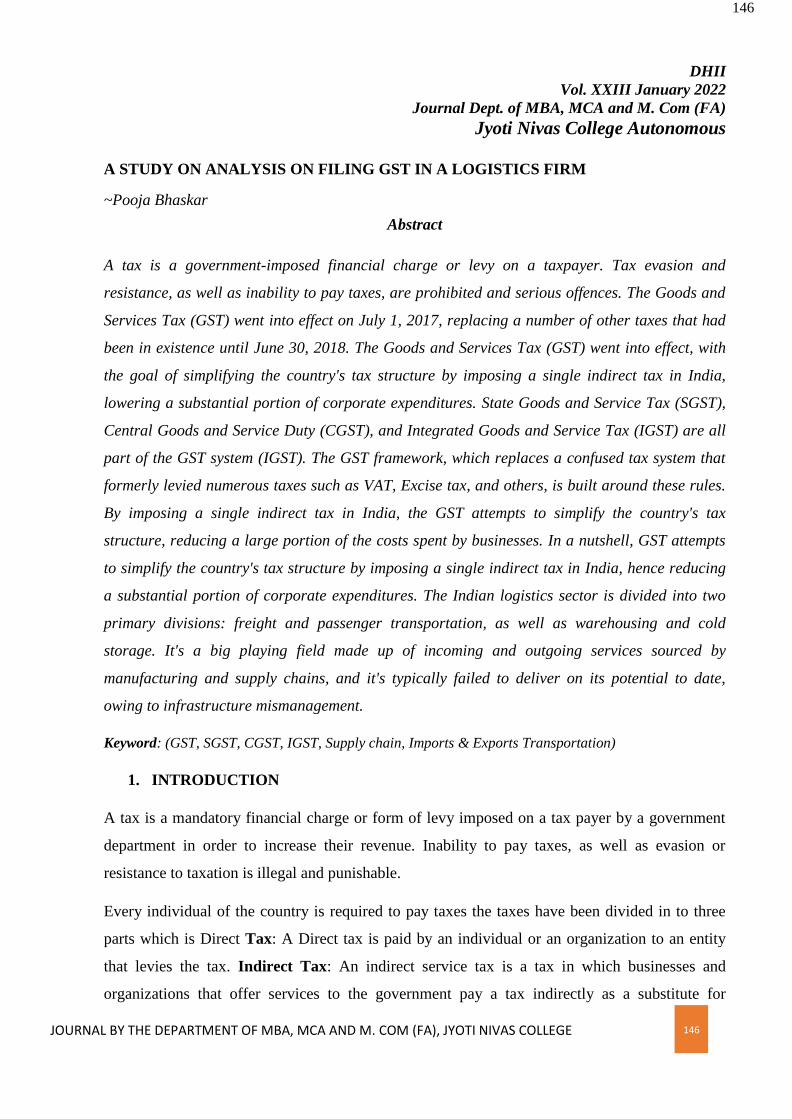
JOURNAL BY THE DEPARTMENT OF MBA, MCA AND M. COM (FA), JYOTI NIVAS COLLEGE AUTONOMOUS
146
146
DHII
Vol. XXIII January 2022
Journal Dept. of MBA, MCA and M. Com (FA)
Jyoti Nivas College Autonomous
A STUDY ON ANALYSIS ON FILING GST IN A LOGISTICS FIRM
~Pooja Bhaskar
Abstract
A tax is a government-imposed financial charge or levy on a taxpayer. Tax evasion and
resistance, as well as inability to pay taxes, are prohibited and serious offences. The Goods and
Services Tax (GST) went into effect on July 1, 2017, replacing a number of other taxes that had
been in existence until June 30, 2018. The Goods and Services Tax (GST) went into effect, with
the goal of simplifying the country's tax structure by imposing a single indirect tax in India,
lowering a substantial portion of corporate expenditures. State Goods and Service Tax (SGST),
Central Goods and Service Duty (CGST), and Integrated Goods and Service Tax (IGST) are all
part of the GST system (IGST). The GST framework, which replaces a confused tax system that
formerly levied numerous taxes such as VAT, Excise tax, and others, is built around these rules.
By imposing a single indirect tax in India, the GST attempts to simplify the country's tax
structure, reducing a large portion of the costs spent by businesses. In a nutshell, GST attempts
to simplify the country's tax structure by imposing a single indirect tax in India, hence reducing
a substantial portion of corporate expenditures. The Indian logistics sector is divided into two
primary divisions: freight and passenger transportation, as well as warehousing and cold
storage. It's a big playing field made up of incoming and outgoing services sourced by
manufacturing and supply chains, and it's typically failed to deliver on its potential to date,
owing to infrastructure mismanagement.
Keyword: (GST, SGST, CGST, IGST, Supply chain, Imports & Exports Transportation)
1. INTRODUCTION
A tax is a mandatory financial charge or form of levy imposed on a tax payer by a government
department in order to increase their revenue. Inability to pay taxes, as well as evasion or
resistance to taxation is illegal and punishable.
Every individual of the country is required to pay taxes the taxes have been divided in to three
parts which is Direct Tax: A Direct tax is paid by an individual or an organization to an entity
that levies the tax. Indirect Tax: An indirect service tax is a tax in which businesses and
organizations that offer services to the government pay a tax indirectly as a substitute for

JOURNAL BY THE DEPARTMENT OF MBA, MCA AND M. COM (FA), JYOTI NIVAS COLLEGE AUTONOMOUS
147
147
monetary profit. Goods and Service Tax (GST): GST is an indirect tax that is levied on the
provision of goods and services.
The Goods and Services Tax (GST) was implemented on July 1, 2017, and replaced a variety of
other taxes that were in place until June 30, 2018. The GST Law has been under debate for more
than two decades, and the bill was enacted by Prime Minister Narendra Modi and Finance
Minister Arun Jaitley. On 1st of July 2017 at 12 AM GST was implemented.GST is a tax that is
imposed on goods and services based on their final destination. With state/union territory GST
and national GST, it is a dual levy. Interstate supplies are subject to an integrated GST,
calculated as the sum of the cost and the applicable State or Union Territory Goods and Services
Tax. The goal of such a tax is to combine a variety of indirect taxes into a single comprehensive
tax that can be applied both at the federal and state levels. Through their separate legislations,
both the Centre and the States have the authority to levy and collect taxes.
The following are the components of GST:
Central Goods and Service Tax (CGST): The Central Goods and Service Tax (CGST)
is a tax levied and collected by the central government on all goods and services supplied
inside the state. If the supply is made outside of the state, the tax does not apply.
State Goods and Service Tax (SGST): SGST is a tax charged by the State Government
on intra-state deliveries of both goods and services, and is controlled by the SGST Act.
Union Territory Goods and Service Tax (UTGST): is imposed by the Union Territory
governments in the same way as SGST is collected by state governments on intra-state
sale of goods and services. It is a tax paid on goods and services supplied inside the
Union Territory. The UTGST Act governs it, and it is imposed in tandem with the CGST.
Integrated Goods and Service Tax (IGST): IGST, which will be controlled by the
IGST Act, is a tax paid on all inter-state supplies of goods and services under the GST. In
both situations of import into India and export from India, the IGST will apply to any
supply of goods and services.
List of Various GST Tax Slabs Rates in August 2021
GST slab of 0%:No tax will be levied on good like sanitary napkins, silver, raw material used in
brooms.
GST Slab of 5%:The goods which will fall under this slab are Cream, milk products, branded
paneer, kerosene, coal, cashew nu

JOURNAL BY THE DEPARTMENT OF MBA, MCA AND M. COM (FA), JYOTI NIVAS COLLEGE AUTONOMOUS
148
148
GST Slab of 12% -The items coming under this slab are Ayurvedic medicine, umbrella, sewing
machine, cell phones, ketchup and sauces etc
GST Slab of 18%- Most of the items that come under this slab some of them are Refined sugar,
pasta, hair dryer and curler, door, window etc
GST Slab of 28%- Over 200 items will be subject to a 28 percent tax. Sunscreen, pan masala,
dishwasher, weighing machine, paint, cement, and vacuum cleaner would be included in this
category under GST.
Impacts of GST on logistics Industry
As a sector that connects a numerous manufacturing and trading activities across the country on
a daily basis, and is constantly attempting to bridge the shaky gap between rising demand and
timely supply, it would be an understatement to call logistics the backbone of India's rapidly
changing economy. The logistics industry's playing field is made up of infrastructure,
technology, and numerous service providers, which successfully helps allow timely, safe, and
appropriate delivery of products and services to end consumers via a robust supply chain. As a
result, it's critical to comprehend the GST's impact on logistics.
Making hundreds of decisions based on size, weight, and capacity parameters, as well as
navigating unpredictable climate conditions while keeping costs low, are daily challenges faced
by players in this field, making the logistics sector a domain where the stakes are high for
everyone – traders, suppliers and consumers.
The GST system is built on broad provisions such State Goods and Service Tax (SGST), Central
Goods and Service Duty (CGST), and Integrated Goods and Service Tax (IGST) are at the heart
of the GST framework, which replaces a jumbled tax system that formerly levied various taxes
such as VAT, Excise tax, and others.
In brief, GST aims to streamline the country's tax structure by imposing a single indirect tax in
India, therefore alleviating a significant percentage of the costs incurred by business players.
Freight and passenger transportation, as well as warehousing and cold storage, are the two main
divisions of the Indian logistics industry. It's a large playing field made up of incoming and
outgoing services sourced by manufacturing and supply chains, and it's generally failed to
deliver on its potential to yet, owing to infrastructure mismanagement they are the major
challenges confronting India's logistics industry today.

JOURNAL BY THE DEPARTMENT OF MBA, MCA AND M. COM (FA), JYOTI NIVAS COLLEGE AUTONOMOUS
149
149
Unequally distributed infrastructure results in underutilization of critical resources while
burdening other components needlessly. The graph, shows that road and rail transportation carry
the brunt of the industry's burden, while air and waterways
are underutilized.
A clear mismatch between transportation networks,
software and technology, and storage facilities drives even
greater disorder in the business, resulting in significant
amounts of waste that could have been avoided.
2. REVIEW OF LITERATURE
(Radha yadav, 05, May 2020) in their research journal it states that In India, the Goods and
Services Tax (GST) was implemented on July 1, 2017. The GST's goal is to establish a unified
market with low tax rates and fewer tax exemptions. Lower tax burdens on various items and
services are expected to benefit consumers. Reduced indirect taxes will help address the
regressive aspect of this tax, which affects both the wealthy and the poor. The new tax structure
is anticipated to increase income for both the federal and state governments by improving tax
compliance. It will boost the economy by 1-2 percent. It lowers the tax burden on a variety of
products. After the GST, there will be no truck lines at the state border. GST is the government's
greatest step this year, and it will give India a world-class tax structure. It will have an effect on
the domestic economy, foreign commerce, businesses, and consumers. Despite the fact that GST
is an excellent tax system, India has several problems owing to its variety, lack of understanding,
and IT industry.
(DR.LALITHA.B.S, 2019)this research paper states that GST is a single taxation that applies to
the entire country and encompasses all other types of taxes, with the exception of customs duties.
The tax must be divided into two categories: federal and state, and the difference between the
two is referred to as the IGST. Taxpayers who are enrolled under the GST system must pay their
returns on a monthly basis. The majority of assesses will submit their returns with the auditor's
assistance, supplying all relevant documentation. Various problems have been observed by
taxpayers and auditors in recording and filing their forms. With the exception of customs
charges, GST is a single tax that applies to the whole country and covers all other forms of taxes.
(Yogesh Garg, 2019) This research speaks about the introduction of GST into the Indian tax
system it might be regarded a watershed moment in the country's history. It has combined a
variety of federal and state levies. Except for human use alcohol and petroleum products, GST

JOURNAL BY THE DEPARTMENT OF MBA, MCA AND M. COM (FA), JYOTI NIVAS COLLEGE AUTONOMOUS
150
150
has a substantial or small impact on all commodities and services. Despite the fact that exports
are zero-rated, meaning no tax is imposed; GST has had no substantial influence on India's
carpet and flooring exports. This might be due to luck or other causes. GST has the potential to
attract worldwide corporations in the future, therefore promoting investment and exports. The
author explained the concept of GST on goods and services exported is a zero-rate supply, which
means there is no GST to pay and the exporter can claim input tax credits on the products. He
said that Exports of Indian carpets were said to have decreased when the GST was implemented.
As a result, the purpose of this research is to determine the major impact of GST on the average
exports of the carpet and flooring sector for the prior and subsequent two years.
(Manoranjan Kumar, 2019) this research claims that with a population of over 1.3 billion
people and a varied distribution of wealth, India chose a federal system with six separate tax
slabs and a dual-GST framework. GST has been successful in certain nations but has failed in
others. We try to look at the roadblocks to a smooth GST rollout. We have identified 12
impediments to GST adoption in this research. This work uses interpretive structural modelling
(ISM) to discover the driving and dependent nature of various obstacles in order to construct a
structural model. According to the findings of the investigation, the primary challenges to GST
implementation include a lack of competent staff, a lack of clarity in GST regulations, political
reticence, and a lack of policy for efficient tax division. MICMAC analysis is used in addition to
the above research to group the obstacles into four categories based on their relative driving and
dependence powers.
(Gupta, 2016)The author states that the use of the IGST Model to deal with inter-State supply
leads to a single goal the development of a common national market and the release of the Indian
industrial capacity's chained energy. It is claimed that India has the potential to become the
world's top economy, and the introduction of GST might play a key role in this respect The GST
is intended to replace a wide number of taxes collected by the federal and state governments on
various economic activities. Retail sales (VAT), goods entering the state (Entry Tax), Luxury
Tax, Purchase Tax, and other taxes are levied by the states. All of these taxes are being proposed
to be merged into a single Products and Services Tax (GST), which will be imposed on the
delivery of goods and services at every stage of the supply chain, from manufacturing to retail.
(Dr.M.D.Umesha, 2015)In his research journal he explains how to prevent duplication of effort,
data created with public funding should be accessible and available and says it necessitates the
incorporation of next-generation digital media technologies into the structure and activities of the
government. As far as information resources are concerned, The New Companies Act (2013) is

JOURNAL BY THE DEPARTMENT OF MBA, MCA AND M. COM (FA), JYOTI NIVAS COLLEGE AUTONOMOUS
151
151
viewed as a substantial move toward good corporate governance by specialists between the ages
of 35 and 50 who are professionals in chartered accounting. The research says that they are
sceptical about the outcome of the e-forms that will be created. It has been shown that electronic
filing makes compliance easier for small businesses as well.
3. RESEARCH METODOLOGY
3.1 Background of the Study
GST return filing is a requirement for anyone who operates a business and is registered under the
GST Act. GST return filing is a crucial action that serves as a link between the government and
the tax payer. There are much compliance that a person must follow when filing the return, such
as providing all information such as every detail of the business activities, taxes paid, the
declaration of tax liability, and any other information that the government requires. GST returns
can be filed electronically through the GST Portal or manually. The returns that are supplied
manually or offline can then be uploaded to the portal.
The Ministry of Finance made the GST registration process easier to do online. The GST Portal
is where the applicant can complete the GST registration process. The portal creates GST ARN
immediately after the application is submitted. The applicant can monitor the status of his or her
application and make a post using the GST ARN. If required, queries the taxpayer must submit
the ARN within 7 days after its generation. You will be given a GST registration certificate as
well as a GSTIN.
3.1.1 Challenges Faces by Business While Filing GST
GST is now in effect, marking the most important tax adjustment since independence. The
problems that businesses face across the country are similar. The majority of businesses use
accounting software or enterprise resource planning systems to prepare tax returns that contain
excise, VAT, and service tax. As a result of the GST transition, businesses will need to update
their ERPs, either by upgrading existing software or purchasing new GST-compliant software.
Small businesses are worried about filing returns on time, but it's important to remember that
they must first submit GST-compliant invoices. For a pen-and-paper economy like India, the
change to digital record-keeping will be massive. Many small businesses lack the technology
expertise and resources needed to fully automate compliance.

JOURNAL BY THE DEPARTMENT OF MBA, MCA AND M. COM (FA), JYOTI NIVAS COLLEGE AUTONOMOUS
152
152
3.2 Statement of Problem
This report actively demonstrates that sometimes filing GST is a tedious job in order to find out
the difficulty in filing with GST-compliant, including all required information such as GSTIN,
place of supply, HSN code, and so on. Small businesses are worried about filing returns on time,
but it`s important to remember that they must first submit GST-compliant invoices. Many small
businesses lack the technology expertise and resources needed to fully automate compliance.
3.3 Need of the Study
To ensure the easiness in filing GST
It helps to understand the details of all transactions made in the business
It helps the business to identify the amount of CGST and SGST as well as rebates given
by the government
3.4 Objectives of the Study
To study the number of transactions of sale and purchase on monthly basis.
To calculate the total GST comparing CGST and SGST while filing
3.5 Research Design
Research design is a framework of processes and strategies used by a researcher to combine
various components of a study in a somewhat logical manner so that the research issue is
effectively handled. The major purpose of research design is to guarantee that all required data is
collected accurately and quickly. It extends beyond "how" to do research and produce insights
using a certain technique. In this study, the following research designs were used:
Quantitative Research: Quantitative techniques work with measurable numbers and
forms. It conducts a methodical investigation into events or data. It responds to questions
concerning the validity of quantitative relationships in order to explain, predict, or control
a phenomenon.
Descriptive Research: It focuses on gathering data to acquire a better knowledge of
present events. Descriptive research is used to describe a group of people's behaviours.
Only one variable is necessary to conduct the study. Descriptive research has three basic
goals: to describe, explain, and validate the findings.

JOURNAL BY THE DEPARTMENT OF MBA, MCA AND M. COM (FA), JYOTI NIVAS COLLEGE AUTONOMOUS
153
153
3.6 Types of the Study
The study is quantitative and analytical in character.
Analytical Research - The researcher must analyze facts or information that are already
available in order to create a critical assessment of the issue. The researcher examines
and explains why or how something occurs, rather than simply documenting the qualities.
As a result, analytical inquiry seeks to comprehend phenomena by identifying and
evaluating incidental relationships between them.
Quantitative Research - Quantitative research is based on quantity or amount
measurement. It can be used to describe phenomena that have a numerical value. It with
numbers and shapes that can be measured. It investigates events or data in a methodical
manner. It replies to inquiries about the adequacy of quantitative relationships in
explaining, predicting, or controlling a phenomenon.
3.7 Sources of Collection of Data
The process of data collection begins after a research problem has been identified and a study
approach has been sketched out. The researcher should keep two types of data in mind while
deciding on a data collection method for the study: primary and secondary data. Primary data is
information that is received for the first time and hence is unique. Secondary data, on the other
hand, is information that has already been gathered and statistically processed by someone else.
The researcher must pick between one or the other data gathering methods depending on the sort
of data he will utilize for his study. Primary and secondary data gathering methods differ because
primary data must be obtained from the start, whereas subsequent data collection is merely
combining.
Primary Source: The term "primary data" collection of information acquired by an investigator
directly from the source. It is the first time it has been collected, and it is more authentic and
reliable. The population census conducted by the Indian government every ten years, for
example, is primary data.
Secondary Source: Second-hand information is referred to as secondary data. It was not
collected from scratch, but rather from previously published or unpublished sources. Secondary
data includes information such as a person's address from a phone book or a company's phone
number from Just Dial.
JOURNAL BY THE DEPARTMENT OF MBA, MCA AND M. COM (FA), JYOTI NIVAS COLLEGE AUTONOMOUS
154
154
3.8 Sample Size
The act of determining the number of observations or repetitions to include in a statistical sample
is known as sample size determination. Any empirical study in which the purpose is to make
inferences about a population from a sample must consider the sample size. In practice, the
sample size for a study is frequently determined by the cost, time, or convenience of gathering
data, as well as the necessity for sufficient statistical power. Several different sample sizes may
be used in complex research. The sample size chosen for this research is 6 months of data.
3.9 Tools Implemented for the Study
ANOVA: The ANOVA, or Analysis of Variance test, is a statistical method for
comparing the means of two groups of data sets and determining how much they differ.
In simpler and more basic terms, the ANOVA test is used to determine which process,
among all other processes, is better. The "Linear Model" is the essential principle
underpinning the Analysis of Variance.
When there are two independent variables, a two-way ANOVA is used. It's a variant of
one-way ANOVA. When your experiment contains a quantitative outcome and two
independent variables, you may apply the two-way ANOVA test.
There are two techniques to do a two-way ANOVA:
Two-way ANOVA with replication: It is conducted when two groups are involved
and each group's members are involved in several activities.
Two-way ANOVA without replication: When you just have one group but want to
test it twice, you may utilise a two-way ANOVA without replication.
Two Sample T test: The two-sample t-test (also known as the independent samples
t-test) is a statistical approach for determining if two groups' unknown population
means are equal.
The null hypothesis in a two-sample t-test is always:
1 = 2 (H0) (the two-population means are equal)
Alternative hypotheses include two-tailed, left-tailed, and right-tailed
hypotheses:
H1 (double-tailed): μ1 ≠ μ2 (the two-population means are not equal)
H2: μ1 < μ2 (population 1 mean is less than population 2 mean)
H1: (right-tailed): μ1> μ2 (population 1 mean is greater than population 2
mean)

JOURNAL BY THE DEPARTMENT OF MBA, MCA AND M. COM (FA), JYOTI NIVAS COLLEGE AUTONOMOUS
155
155
3.10 Hypothesis
H0- There is no difference between CGST and SGST collection
H1- There is a difference between CGST and SGST collection
H0- There is difference between the month and category
H1- There is no difference between the month and category
3.11 Scope of the Study
In this research, features and benefits of GST process in a logistic firm is studied. The study
also covers the challenges faced by the business in filing the GST along with GST forms,
transactions of purchase and sale on monthly basis and the segregation of central Goods and
Service tax and State service tax.
Anova: Two-Factor Without Replication
SUMMARY Count Sum Average Variance
EDI Charges 7 21712 3101.714286 12229747.57
Documentation
Charges 7 29618 4231.142857 23585764.14
Agency
Charges 7 334565.4 47795.05714 2890514353
BOE
Processing
Charges 7 80240 11462.85714 167622582.1
Transportation
Charges 7 366036 52290.85714 3594310860
JANUARY 5 65903 13180.6 232432635.8
FEBURARY 5 25646.12 5129.224 31836461.85
MARCH 5 99946 19989.2 563531083.7
APRIL 5 79863.58 15972.716 274991031.6
MAY 5 49855 9971 67364312
JUNE 5 94872 18974.4 423884154.8
Total 5 416085.7 83217.14 7200100428
ANOVA
Source of
Variation SS df MS F P-value F crit
Rows 16457372407 4 4114343102 5.275027651 0.003411 2.776289
Columns 21410391815 6 3568398636 4.575068489 0.003142 2.508189
Error 18719188024 24 779966167.7
Total 56586952246 34

JOURNAL BY THE DEPARTMENT OF MBA, MCA AND M. COM (FA), JYOTI NIVAS COLLEGE AUTONOMOUS
156
156
3.12 Limitations of the Study
The research is primarily based on historical information.
Only the last six months of the study are considered.
Due to time constraints and the pandemic, I was unable to have much exposure to the
workplace. which made it difficult to collect additional data.
4. DATA ANALYSIS AND INTERPRETATION
4.1 Table Indicating the Consolidated Company Charges
Analysis: The Anova test is done for the different goods charges considered in the filling of GST
for a sample of six months (January to June). In the five Goods charges considered it is observed
that the variance of Transportation charges and Agency charges are very significant when
compared to EDI, Documentation and BOE Processing charges. The variance in terms of months
is significant for the months of March and June respectively.
Interpretation: The F critical value for different charges is 2.78 and for different months is 2.51.
Since the F value for both charges and different months is greater than their respective critical
values, we reject the Null Hypothesis and accept the Alternative Hypothesis. The p-value for both
the Goods Charges and Months is less than 0.05 (0.0034 for Goods charges and 0.0031 for
Months respectively). Hence, we conclude that the test statistic is significant at an alpha level of
0.05.
4.2 Table Indicating CGST and SGST Filing Difference
t-Test: Two-Sample Assuming Equal Variances
CGST SGST
Mean 15022.9575 15022.9575
Variance 112398016.1 112398016.1
Observations 6 6
Pooled Variance 112398016.1
Hypothesized Mean Difference 0
Df 10
t Stat 0
P(T<=t) one-tail 0.5
t Critical one-tail 1.812461123
P(T<=t) two-tail 1
t Critical two-tail 2.228138852

JOURNAL BY THE DEPARTMENT OF MBA, MCA AND M. COM (FA), JYOTI NIVAS COLLEGE AUTONOMOUS
157
157
Analysis: From the above we can analyse that the data is been analysed using two sample T test
which is conducted between the two populations of SGST and CGST data. The GST data is
divided into 2 parts state and Centre GST. This data is considered for a sample of six months from
January to June. The mean is been observed as 15022.9575 for CGST and 15022.96 for SGST.
The hypothesized mean difference is 0, and the critical one tail is 1.812461123.
Interpretation: The two-sample t-test is conducted between the two populations of SGST and
CGST data. The GST data is divided into 2 parts state and Centre GST. This data is considered for
a sample of six months from January to June.
The Null Hypothesis considered here is the mean of CGST is equal to SGST and Alternate
Hypothesis is that the means of CGST and SGST are not equal. The p-value for both one tail and
two tailed tests are greater than 0.05 which means that we are unable to reject the Null Hypothesis.
Hence, we can conclude that we accept Null Hypothesis and reject Alternate Hypothesis. Hence, it
is statistically proven that the general means of the two GST populations SGST and CGST are
equal.
Finding
The Taxable value differs from client to client. Since it is an interstate transaction there is
no IGST only SGST and CGST is applicable.
From this study we can identify that the company have provided a good number of
profitable services which does not have anything that is non-taxable due to which the tax
that has to be payable is comparatively less.
From this study we understand that the company‘s transportation charges impact directly
on the tax payable and it plays an important role in companies‘ income and all the clients
do not requires transportation charges as they themselves do it on their own.
We understand that the CGST and SGST charges for the company is same and there is no
differential value these are charged at 9 % each.
Suggestion
Overall, it is noted that the performance of the company is not at their best in recent times, but
they are gradually ascending to normalcy. Therefore, the company must majorly focus on its
marketing strategies and workforce so that they can manage the existing clients and plan for
diversification of business.

JOURNAL BY THE DEPARTMENT OF MBA, MCA AND M. COM (FA), JYOTI NIVAS COLLEGE AUTONOMOUS
158
158
Conclusion
As the previous indirect tax structure was historical and complex, the Indian government
developed the "Goods and Services Tax," the country's single largest indirect tax system. It is
filled with tax laws, litigations, and compliances, among other things. In addition, the fact that
many taxes are state-specific, as well as the taxation of inter-state trade, leads to the home market's
fragmentation, which raises the cost of doing business.
The logistics sector has benefited from the implementation of GST in terms of a simple and rapid
clearing process. Forward integration, a single tax rate under GST, and the reduction of corruption
in logistic procedures can all be beneficial. This study will help the readers understand that how a
Logistics company charge their GST for the services provided by them and also can have a quick
understanding on the E-way bill, invoices and other service charts. Overall, the company's
performance has not been at its best in recent years, but it is gradually returning to normalcy. As a
result, the company's marketing strategy and employees must be prioritized so that it can handle
existing clients and plan for business diversification.
JOURNAL BY THE DEPARTMENT OF MBA, MCA AND M. COM (FA), JYOTI NIVAS COLLEGE AUTONOMOUS
159
159
DHII
Vol. XXIII January 2022
Journal Dept. of MBA, MCA and M. Com (FA)
Jyoti Nivas College Autonomous
COMPARISON OF PERFORMANCE OF ACTIVELY AND PASSIVELY MANAGED
MUTUAL FUNDS
~Sonali Thethwar
Abstract
Mutual funds are dynamic financial institutions which play a crucial role in an economy by
mobilizing savings and investing them in the capital market. They are usually objective orientated.
The Fund Manager allocates assets to an investor’s portfolio based on their objectives. Mutual
Fund will diversify your portfolio over a variety of investment vehicles. In recent years, mutual
funds have proved to be the premier mode of investment for the investors. They have emerged as
dynamic financial capital intermediaries between the suppliers and the users of money. The study
focuses on two leaves out of the many in mutual funds. The main aim is to understand the concept
and the difference between actively and passively managed mutual funds. The data collected are
used to determine returns on investment in the respective schemes selected for the study since
return on investment is the key performance indicator which is often used by the investors. This
data obtained is then further used for making statistical analysis for the study such as two factor
ANOVA analysis without replication. The importance of the study lies in determining which funds
provide better returns keeping in view the objectives of the investors: Active Funds or Passive
Funds.
Key Words: -(Active Funds, Passive Funds, ANOVA Analysis, Return on investment.)
I. INTRODUCTION
A Mutual Fund is a financial and investment vehicle where several investors pool their money to
make money i.e., returns on their capital over a period. This corpus of fund is managed by a
professional known as a Fund Manager or a Portfolio Manager. These fund managers are experts
in their field and helps the investors to invest their money in a systematic way. A fund manager‘s
job is to invest the corpus in different type of securities such as bonds, gold, sovereign gold bonds,
stocks, and other such assets and seeks to provide potential returns on them. These potential gains
and as well as losses are equally and collectively borne by the investors in proportion to their
contribution to the funds.
The term Mutual funds is typically used in India, USA, and Canada, whereas in Europe it is

JOURNAL BY THE DEPARTMENT OF MBA, MCA AND M. COM (FA), JYOTI NIVAS COLLEGE AUTONOMOUS
160
160
termed as SICAV (Investment Company with variable capital) and in UK it is termed as OEIC
(Open-ended Investment Company)
The Securities and Exchange Board of India (Mutual Funds) Regulation 1996, a set of rules that
regulates the selling of units of mutual funds on the stock exchange of India, has defined Mutual
Funds as a trust in which the public can invest under more than one scheme to invest in the
securities. This includes gold, financial instruments related to gold, money market instruments or
real estate etc. Mutual funds are regulated by the Securities and Exchange Board of India (SEBI)
and are required to publish performance, comparison of benchmark, fees charged, and securities
held.
Mutual Funds are usually objective orientated. The Fund Manager allocates assets to an investor‘s
portfolio based on their objectives. These objectives can be long term or short term. If an investor
has a short-term objective, then the fund manager tries to base the portfolio on money market
instruments or debt schemes. If the investor is willing to take more risk, then the fund manager
focuses on equity schemes. These are flexible as per the needs and requirements of the investor.
There are various types of schemes available under Mutual Funds. As discussed above, these
schemes are based on an individual‘s objectives. These schemes make it possible to collect a huge
amount of money from the investors to invest in that one scheme which reflects their requirements
and needs. There are various types of mutual funds available for the investors. The paper
particularly focuses on two types namely: Active Funds and Passive Funds.
Active funds: - These are those funds which require active participation of the fund manager
while making any investment. Here, the fund manager must take proactive decisions to buy or sell
a particular stock depending upon its attributes and market conditions. The aim is to fetch higher
returns than that of index funds. There‘s a lot of thinking and research involved in this type of
funds.
Passive funds: -Passive funds are also known as ―Index Funds‖. This type of fund does not
require active participation of the fund managers while investing. Here, the main aim to fetch
returns similar to the index funds. The investment usually comprises of stocks in the same
proportion as that of the index funds.
II. LITERATURE REVIEW
[Edwin J. Elton, June 2019] The purpose of this article is to identify a small set of
exchange traded funds or ETFs that captures most of the variation in the population of
potential indexes and to determine whether a combination of exchange-traded funds from
this small set can be identified that outperforms active mutual funds in future periods.

JOURNAL BY THE DEPARTMENT OF MBA, MCA AND M. COM (FA), JYOTI NIVAS COLLEGE AUTONOMOUS
161
161
[Ernst J. Fahling, June 2019] The aim of this paper is to capture the worth created by
active funds in German investment fund market. The study shows standard comparison
with generally accepted Market Research Returns, and various performances. The study
analyzes the Risk- adjusted performance and shows that active funds can and do create
worth in terms of abnormal returns, but these are the most offset by expenses.
[Nanigian, March 1, 2019] This study examines the risk- adjusted performance of
actively managed mutual funds vs. passively managed mutual funds and it finds the
statistical significance of the difference in performance between the two types of funds
disappears when the passively managed funds are compared to competitively rated actively
managed funds.
[Beslin, February 2019] The main aim of this thesis is to examine and evaluate existing
papers to answer the question when, if ever, active portfolio management is superior to
passive. The entire primary active investment vehicles investing in various asset classes,
geographical markets and in different economic conditions are covered. The outcomes
show most active management strategies underperform the market on a risk-adjusted basis.
On the practical side, the paper is aimed to help an average retail investor make educated
decisions when investing, saving in the capital market.
[Anadu, Kruttli, McCabe, Osambela, & Shin, August 27, 2018] This paper analyzes the
potential effects of the shift on financial stability of effects on investment fund‘s liquidity
transformation and redemption risks; passive strategies that amplify market volatility;
increases in asset-management industry concentration; and the effects on valuations,
volatility and movement of assets that are included indexes.
[Sushko, 2018] The rise of ―smart beta‖ ETFs further blurs the distinction between
passive and active fund management. Rather than track traditional market value-weighted
indices, smart beta ETFs implement factor-weighting index strategies (such as those for
value, volatility, and dividend yield). The construction of which can be considered active
in nature.
[Cox, May 1, 2017] This paper examines the past research has consistently shown in U.S
markets to be efficient. And the results of this analysis support that actively managed U.S
funds significantly underperformed compared to their standard or benchmarks, indicating
that there is no benefit to active management in the U.S.
[Hada, July 2016] This paper is quantitative research that attempts to analyze the
performance of index based or passively managed and actively managed diversified equity
mutual fund schemes on various parameters and giving investors a broad view about the

JOURNAL BY THE DEPARTMENT OF MBA, MCA AND M. COM (FA), JYOTI NIVAS COLLEGE AUTONOMOUS
162
162
past performance. And giving them a better platform to compare the performance before
investing their money.
[Darnell, 2012] This paper studies the choice between active and passive management is
an important one, the paper states that the choices are often made on a foundation of false
assumptions and flawed logic. The basis for sound choice is simple. It usually depends on
whether markets are efficient or inefficient; some managers can identify inefficiencies in
advance.
[Yao, March 2010] The study analyses the relation between active and passive mutual
funds ownership and trading activity in the U.S. It shows the efficiency of the stock prices.
The paper finds that active funds are drawn to the same stock as passive funds, and that
active funds increase the price efficiency of the stocks through their trades. We also find
that stocks with ―excessive‖ levels of passive fund ownership and trading exhibit more
long-term pricing anomalies as well as a larger price reversal following trades.
III. PROPOSED WORK
Background of the Study:
Over the last decade, mutual funds have emerged to be the preferred alternative of investment
across the country. Mutual funds have caught general public‘s attention and interest and therefore
have seen a huge demand for itself. As the industry grows manifold, it is important for the
investors to be well versed with the technicalities of the same. Hence, this study focuses on one
leaf out of the many in mutual funds. It drives individuals' attention to two types of mutual funds:
active and passive mutual funds. The focus is to compare the two contradicting mutual funds by
analysing the performance of the different active and passive schemes.
Statement of the Problem
There are different types of mutual funds available. Active and passive mutual funds are one of
them. The study attempts to analyse the performance of five selected schemes of active and
passive mutual funds. Since this investment avenue is new to the general investors, they lack
knowledge of choosing the right type of mutual fund which suits their financial objective. They
are unable to quantify the risks that will provide them with higher returns.
Need of the Study
The study aims at understanding mutual funds and its working. It also gives an understanding
about how active and passive management work. The investors need to understand which serves to
get desired returns from the schemes adopted. The study involves comparison of active and
passive funds and hence provides the investors an answer as to which is the better alternative.
JOURNAL BY THE DEPARTMENT OF MBA, MCA AND M. COM (FA), JYOTI NIVAS COLLEGE AUTONOMOUS
163
163
Objective of the study
To comparatively evaluate the performance of active and passive funds using ANOVA.
Data Collection
The study is performed on data collected from secondary sources like websites such as
moneycontrol.com, advisorkhoj.com and the official websites of the selected schemes like
axisbank.com etc. The data consists of the last 6 years' daily historical NAV of the selected
schemes.
Sampling Technique
The study is analytical in nature. In this type of study, the researcher uses facts and information
that are already available and analyse them to make a critical evaluation of the material. It
attempts to explain why and how and usually concerns itself with cause-effect relationships among
variables.
Sample Size
The study consists of five active funds and five passive fund schemes consisting of mid cap and
large cap companies managed by eight different asset management companies.
Active funds are those funds which have more involvement of the fund manager. They focus on
creating a portfolio that generates higher returns than the index funds.
Passive funds are the funds which don't involve active participation from the fund manager. This
type of funds rigorously follows the market index to reciprocate their returns.
Tools and Techniques
ANOVA: -
Two-Factor ANOVA, also known as factorial analysis, is an extension to the one-way analysis of
variance. In a two-factor analysis, there are two variables, rather than one as in a single factor
analysis. The assumption is that both variables and factors affect the dependent variable. Each
factor contains two or more classes and the degree of freedom for each variable is one less than
the number of levels.
Scope of the Study
The extent of the study is not just limited to the selected schemes of active and passive funds
whose performance has been tracked but it also throws light on how generally active and passive
'management' works. It also tells you about the evolution of the Mutual funds in the Indian market.

JOURNAL BY THE DEPARTMENT OF MBA, MCA AND M. COM (FA), JYOTI NIVAS COLLEGE AUTONOMOUS
164
164
Limitations of the study
1. The study is purely based on past performance of the funds.
2. Due to time constraints, the sample size is small.
3. The data used is for regular plans only. It doesn't consider direct plans.
4. It uses the daily NAV of the schemes and hence it is time consuming.
IV. IMPLEMENTATION
Evaluation of active and passive funds schemes: -
In this chapter, an analysis of the performance of the schemes is carried out to find which funds
are faring better. It compares the performance of the active and passive mutual funds schemes to
know which is more appropriate for investing. A brief analysis has been done on ten different
schemes. To examine their performance, two hypotheses are set up and examined for their
validity:
H1: There is no significant difference in the returns obtained from the active and passive funds.
H2: There is a significant difference in the returns obtained from the active and passive funds.
ANOVA: Two-factor Without Replication data analysis:
YEA
R S1 S2 S3 S4 S5 S6 S7 S8 S9 S10
2016
20.
279
886
62
12.6
5689
752
4.375
932
4.382
3829
21
3.4
264
929
1
-
1.950
6828
-
2.599
1423
14.96
4732
51
9.7
533
792
4
4.1
088
052
75
2017
24.
910
168
38
2.52
9920
888
25.85
198
26.26
1037
81
29.
572
131
02
35.55
1587
1
-
31.74
866
39.76
2641
51
37.
855
100
5
24.
649
580
16
2018
15.
092
074
41
9.42
1188
296
7.603
818
7.785
7862
18
6.4
202
241
58
4.311
8298
1
7.033
8574
-
1.333
9716
7
-
20.
766
995
0.3
232
268
96
2019 16.
639
22.0
7295
15.33
583
38.35
2866
18.
821
11.46
0373
17.79
7257
14.12
6155
4.5
439
12.
836

JOURNAL BY THE DEPARTMENT OF MBA, MCA AND M. COM (FA), JYOTI NIVAS COLLEGE AUTONOMOUS
165
165
987
91
209 59 794
41
1 21 568
6
694
56
2020
-
21.
947
169
44
12.2
5261
536
20.88
065
-
22.56
9622
15
-
14.
190
862
49
25.65
7955
6
21.20
2224
5
24.10
0604
36
6.7
713
177
5
14.
320
285
15
2021
15.
999
99
-
4.81
521
23.58
312
33.85
247
21.
044
1
34.15
0584
7
-
19.78
4014
31.61
2622
16
46.
755
858
2
21.
985
004
46
S1 = HDFC SENSEX ETF
S2 = AXIS GOLD ETF
S3 = ICICI PRUDENTIAL SENSEX
S4 = LIC
S5 = UTI SENSEX ETF
S6 = AXIS MIDCAP REG GR
S7 = AXIS BLUECHIP REG GR
S8 = MIRAE ASSET TAX SAVER
S9 = KOTAK INFRA ECONOMIC REFORM
S10 = SBI EQUITY HYBRID REG GR
SUMMARY COUNT SUM AVERAGE VARIANCE
2016 10 69.3986839 6.93986839 54.05140541
2017 10 215.1954874 21.51954874 458.0062192
2018 10 35.89103852 3.589103852 94.28752126
2019 10 171.9878677 17.19878677 77.73008789
2020 10 66.47799864 6.647799864 364.0297574
2021 10 204.3845255 20.43845255 385.9297935
S1 6 70.97493788 11.82915631 286.9108979
S2 6 54.11836415 9.019727359 85.55029963
S3 6 97.63133 16.27188833 76.7996749
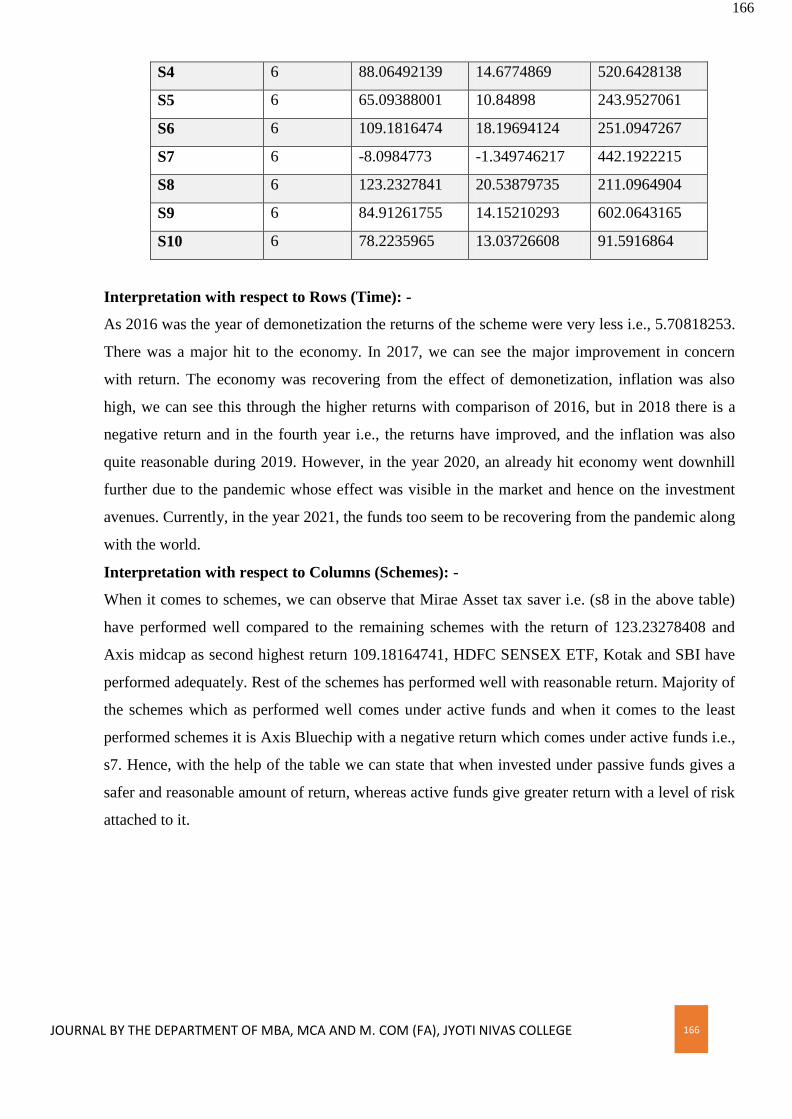
JOURNAL BY THE DEPARTMENT OF MBA, MCA AND M. COM (FA), JYOTI NIVAS COLLEGE AUTONOMOUS
166
166
S4 6 88.06492139 14.6774869 520.6428138
S5 6 65.09388001 10.84898 243.9527061
S6 6 109.1816474 18.19694124 251.0947267
S7 6 -8.0984773 -1.349746217 442.1922215
S8 6 123.2327841 20.53879735 211.0964904
S9 6 84.91261755 14.15210293 602.0643165
S10 6 78.2235965 13.03726608 91.5916864
Interpretation with respect to Rows (Time): -
As 2016 was the year of demonetization the returns of the scheme were very less i.e., 5.70818253.
There was a major hit to the economy. In 2017, we can see the major improvement in concern
with return. The economy was recovering from the effect of demonetization, inflation was also
high, we can see this through the higher returns with comparison of 2016, but in 2018 there is a
negative return and in the fourth year i.e., the returns have improved, and the inflation was also
quite reasonable during 2019. However, in the year 2020, an already hit economy went downhill
further due to the pandemic whose effect was visible in the market and hence on the investment
avenues. Currently, in the year 2021, the funds too seem to be recovering from the pandemic along
with the world.
Interpretation with respect to Columns (Schemes): -
When it comes to schemes, we can observe that Mirae Asset tax saver i.e. (s8 in the above table)
have performed well compared to the remaining schemes with the return of 123.23278408 and
Axis midcap as second highest return 109.18164741, HDFC SENSEX ETF, Kotak and SBI have
performed adequately. Rest of the schemes has performed well with reasonable return. Majority of
the schemes which as performed well comes under active funds and when it comes to the least
performed schemes it is Axis Bluechip with a negative return which comes under active funds i.e.,
s7. Hence, with the help of the table we can state that when invested under passive funds gives a
safer and reasonable amount of return, whereas active funds give greater return with a level of risk
attached to it.

JOURNAL BY THE DEPARTMENT OF MBA, MCA AND M. COM (FA), JYOTI NIVAS COLLEGE AUTONOMOUS
167
167
ANOVA CALCULATION: -
ANOVA
Source
of
Variati
on
SS D
f
MS F P-value F crit
Rows 3107.208
685
5 621.4417
369
2.5533407
16
0.04068526
677
2.422085
466
Colum
ns
1954.042
578
9 217.1158
42
0.8920719
135
0.53985000
01
2.095755
094
Error 10952.27
048
4
5
243.3837
885
Total 16013.52
175
5
9
There are two hypotheses: one for the rows and the other for the columns. Let‘s look at the rows
first:
H0: There is no significant difference in the fund‘s performance in all the years.
Since the p-value for the rows = 0.04068526677 < .05 = α (or F = 2.553340716> 2.422085466 =
F-crit) we reject the null hypothesis, and so at the 95% level of confidence we conclude that there
is a significant difference in performance of funds across different years
H1: There is no significant difference between the schemes returns.
Since the p-value for the columns = .05398500001 > .05 = α (or F = 0.8920719135<2.095755094
= F-crit) we acceptt the null hypothesis, and so at the 95% level of confidence we conclude there
is no significant difference between the schemes return.
Suggestions
The investor should prefer HDFC SENSEX ETF, UTI SENSEX ETF, LIC MF ETF,
KOTAK, and MIRAE for investment as this all schemes have higher market as a result an
investor can get a good amount profit or return.

JOURNAL BY THE DEPARTMENT OF MBA, MCA AND M. COM (FA), JYOTI NIVAS COLLEGE AUTONOMOUS
168
168
Funds having short returns are the ones with less risk. Investors who would want to take
less risk should prefer investing in funds with short return and those who wish to take high
risk can invest in funds having high levels of risk.
Fund allocation is an important factor to investigate basically the fund invested by the
investor would be further invested in different companies by the fund manager. Investors
who are looking for higher returns should probably invest in those schemes which are
performing well in the market.
Risk averse individuals are advised to invest in passive funds.
The investors should also give preference to the experience of the fund managers handling
the portfolio of their investments.
If the investors are looking to invest for a longer period, then they are advised to opt for
passive funds as it fits well into their objectives.
Conclusion
With the increase in awareness about investments in the country, Mutual funds have emerged to
be the primary mode of investment in the recent years. The paper talks about the meaning,
working, types, advantages, disadvantages, and other important aspects of mutual funds. A sample
of actively managed schemes and passively managed schemes has been examined to assess if
active funds create value relative to the passive market or passive funds create value relative to the
market. The Two-factor ANOVA Analysis without replication has been used to analyse the
performance of the active and passive mutual funds. As the results have shown, different measures
of performance point out that the passive funds have performed but active funds provide better
returns.
References
Elton, E. J., Gruber, M. J., & de Souza, A. (2019). Passive mutual funds and ETFs:
Performance and comparison. Journal of Banking & Finance, 106, 265-275.
Fahling, E. J., Steurer, E., & Sauer, S. (2019). Active vs. Passive Funds—An Empirical
Analysis of the German Equity Market. Journal of Financial Risk Management, 8(02), 73
Nanigian, D. (2021). The Historical Record on Active vs. Passive Mutual Fund
Performance. Passive Mutual Fund Performance (February 19, 2021).
Beslin, I. (2019). Returns of active vs. passive strategies of portfolio management: A
systematic.

JOURNAL BY THE DEPARTMENT OF MBA, MCA AND M. COM (FA), JYOTI NIVAS COLLEGE AUTONOMOUS
169
169
Anadu, K., Kruttli, M., McCabe, P., Osambela, E., &Hee Shin, C. (2018). The Shift from
Active to Passive Investing: Potential Risks to Financial Stability? Federal Reserve Bank
of Boston (Vol. 4). Working paper, RPA 18.
Sushko, V., & Turner, G. (2018). The implications of passive investing for securities
markets. BIS Quarterly Review, March.
Cox, C. C. (2017). A comparison of active and passive portfolio management.
Hada, B. S., Suri, A. K., & Jha, B. (2016). A critical analysis of performance of active and
passive investment strategy of Indian mutual fund schemes. European journal of
economics, finance and administrative sciences, ISSN 1450-2275 (88): 37, 44.
Arnott, R. D., & Darnell, M. (2003). Active versus passive management: Framing the
decision. The Journal of Investing, 12(1), 31-36.
Wermers, R., & Yao, T. (2010). Active vs. passive investing and the efficiency of
individual stock prices. Unpublished paper, University of Iowa, and University of
Maryland (May).
www.moneycontrol.com
www.advisorkhoj.com
www.morningstar.com

JOURNAL BY THE DEPARTMENT OF MBA, MCA AND M. COM (FA), JYOTI NIVAS COLLEGE AUTONOMOUS
170
170
DHII
Vol. XXIII January 2022
Journal Dept. of MBA, MCA and M. Com (FA)
Jyoti Nivas College Autonomous
A STUDY ON PERFORMANCE AND EVALUATION OF MUTUAL FUNDS
~Shabi Zehra
Abstract
Mutual funds are financial businesses that collect money from a large number of investors and
then sell and buy back their shares on a regular basis. These mutual funds' equities are relatively
liquid, and they may be utilised to acquire, redeem, and sell shares at a Net asset value. Small and
individual investors can gain access to professionally managed portfolios of equities, bonds, and
other securities through mutual funds. Mutual funds are asset management businesses that are
professionally managed. Investors' money is collected through a number of schemes, and the funds
are invested in a portfolio of investments that satisfy their return expectations. Equity-based
growth funds, bonds and debentures-based income funds, tax-saving funds, balanced funds,
sectorial funds, and index-based funds are among the options available.
Keywords:(Mutual Funds, Scheme, professionally managed, Tax-Saving Funds, Balanced funds)
1. Introduction
Mutual funds are investment companies that pool money from investors at large and offer to sell
and buy back its shares on a continuous basis. The stocks these mutual funds have are very fluid
and are used for buying or redeeming and/ or selling shares at a Net asset value. Mutual funds
charge annual fees (called expense ratio) and in some cases commission. It brings lot of benefit to
the investors, and the working of a mutual fund is regulated and supervised by statutory bodies.
There are several types of schemes being offered to attract different types of investors. Mutual
Funds are professionally managed asset management companies. They invest in a portfolio of
investment that would meet their return expectations. The schemes offered include equity-based
growth schemes, bonds and debentures-based income funds, tax- saving schemes and balanced
funds. Fund managers monitor the movement of values of these portfolios and take prompt steps
to change the fund components whenever the situation warrants.
1.1Definition on Mutual Fund:
The SEBI (MF) Regulations, 1993 defines mutual funds as ―A fund established in a form of a trust
by sponsor to raise monies by the trustees through the sale of units to the public under one or more

JOURNAL BY THE DEPARTMENT OF MBA, MCA AND M. COM (FA), JYOTI NIVAS COLLEGE AUTONOMOUS
171
171
schemes for investing in securities in accordance with these regulations.‘‘
Mutual fund draws up as institutions for providing small investors with avenues of investments in
the capital market. Since small investors generally do not have adequate time, knowledge,
experience and resources for directly accessing the capital market, they have to rely on an
intermediary.
1.2 Process of Mutual Funds
Investors pull their money with fund manager
Fund manager invest in different securities.
Securities generate returns.
Returns are passed back to investors.
1.3 Types of Mutual Funds:
REVIEW OF LITERATURE:
Dr Vikas Choudhary, (October 2010) the study has compared the various equity diversified
mutual funds. Summary of results is presented in different tables. In India, innumerable mutual
fund schemes are available to general investors which generally confound them to pick the best
out of them. This study provides some insights on mutual fund performance so as to assist the
common investor in taking the rational investment decisions for allocating their resources in
correct mutual fund schemes. The data employed in the study consisted of monthly NAVs for the
open-ended scheme. The study utilized the benchmark portfolios according to the scheme
objective such as BSE Sensex for all growth/equity schemes. The performance of sample mutual
fund scheme has been evaluated in terms of return and risk analysis, and risk adjusted
performance measure such as Sharpe ratio and Treynor‘s ratio.
Gupta & Agarwal (2009), found very little research on the construction of best mutual fund
portfolio. Their objective of the research was to construct the best portfolio using cluster method,

JOURNAL BY THE DEPARTMENT OF MBA, MCA AND M. COM (FA), JYOTI NIVAS COLLEGE AUTONOMOUS
172
172
taking industry concentration as a variable and compares the performance of two types of
portfolios with selected benchmarks. Results are found to be encouraging, as far as risk mitigation
is concerned. The results expected to help in the construction of best portfolio of mutual funds.
M. Vijay Anand (2000) focused on the schemes of Birla Sunlife and the competitor‘s schemes
available in the market. Author studied the analysis of Performance of Equity fund for 3 years and
SWOT Analysis of Birla Sunlife by Literature survey and Delphi technique. In depth financial
review the author identifies among the selected equity funds that earns higher returns than
benchmark and competitors and concluded that Birla Sunlife performs well compared to the
benchmarks and competitors.
Nalini Prava Tripathy (1996) concluded that the Indian capital market has been increasing
tremendously during last few years. With the reforms of economy, reforms of industrial policy,
reforms of public sector and reforms of financial sector, the economy has been opened up and
many developments have been taking place in the Indian money market and capital market.
Jensen Michael (1968), developed a composite portfolio evaluation technique concerning risk-
adjusted returns. He evaluated the ability of 115 fund managers in selecting securities during the
period 1945-66. Analysis of net returns indicated that, 39 funds had above average returns, while
76 funds yielded abnormally poor returns. Using gross returns, 48 funds showed above average
results and 67 funds below average results. Jensen concluded that, there was very little evidence
that funds were able to perform significantly better than expected as fund managers were not able
to forecast securities price movements.
Research Methodology
Background of Study
Mutual fund is a financial vehicle which pools money from many investors to invest in securities
like stocks, bonds, and other money market instruments. Mutual funds give small or individual
investors access to diversified, professionally managed portfolios at a low price. Mutual funds are
getting more popularity around the world. This is because mutual funds today have assets under
management worth not millions but trillions of dollars. Mutual funds have been in existing for a
long time, U.S being the pioneer in mutual fund industry where the growth of mutual fund started
after the World War II. Mutual funds provide many benefits to their investors; they reduce the risk
of investing in stock market by diversification. Mutual funds portfolio is also professionally
managed and monitored by the professionals who have experience in selecting the profitable
security.
JOURNAL BY THE DEPARTMENT OF MBA, MCA AND M. COM (FA), JYOTI NIVAS COLLEGE AUTONOMOUS
173
173
3.2 Statement of the Problem
A study on analysis of the performance of mutual funds with reference to mid-cap companies
Investing in mutual fund involves measuring of risk and return, the Indian mutual fund Industry is
growing through a phase of transformation. The study is an attempt to study the growth and
performance of mid cap mutual funds.
3.3 Need of the Study
To know about mutual fund and it‘s functioning.
To understand the different schemes of mutual funds.
To calculate the return of private and public mutual fund.
To guide investors in making proper investment decision.
3.4 Objectives of the Study
To understand the concept of mutual fund.
To evaluate the performance of the selected mutual funds scheme in India.
To know the volatility of funds using beta and standard deviation.
3.5 Research Design
Research design is the conceptual structure within which research is conducted. It constitutes the
blueprint for the collection, measurement and analysis of data. Research design is the arrangement
of conditions for collection and analysis of data in a manner that aims to combine relevance to the
research purpose and economy in the research process.
According to Green and Tull, ―It is the specification of techniques and processes for obtaining the
information required. It is the over-all operational pattern or framework of the project which states
what data is to be gathered from which source by what processes.‖
3.6 Data collection
1. Primary data:
The data is collected for the first time by the original investigator. Primary data is the data
collected by a researcher from first hand sources, using different methods such as interviews,
surveys, or experiments.
2. Secondary data:
Secondary data is the data that have been already collected by and readily available from other
sources. Such type of data is more quickly available than the primary data. Secondary data
methods such as textbooks, encyclopedia etc.
The data collected for this study is based on the secondary data or sources such as textbooks,
websites such as money control etc. The data is collected for a period of 6 months.

JOURNAL BY THE DEPARTMENT OF MBA, MCA AND M. COM (FA), JYOTI NIVAS COLLEGE AUTONOMOUS
174
174
3.7 Sample size
A sample size refers to the number of observations included in the study. In this study the sample
size is chosen from 10 different mid cap companies for past 6 months.
3.8 Tools implemented for the study:
1. Standard deviation: It measures the total risk of the fund. It measures the total
fluctuations of the NAV as compared to the average returns of the schemes during a particular
period. A higher standard deviation indicates that the return of the fund is more unstable and
riskier than the fund having lower standard deviation. Therefore, low standard deviation means
low risk in funds return.
S.D (𝝈) = √∑ (𝑿−𝒙 ) 𝟐𝒏−1
2. Beta: It measures the systematic risk of portfolio. Beta is used to compare a stock‘s market to
that of the other stocks, it is represented as Beta =1 : 1 % change in market index return causes
exactly 1% change in that the stock moves in tandem with the market.
Beta = 2 : 1% change in market index return causes 2% change in the stock return, it is more
volatile. The stocks with more than 1 Beta value are considered to be risky.
Negative Beta: It indicates that the stock return moves in the opposite direction.
It is computed by the following formula:
Beta = 𝒏𝜮𝒙𝒚−∑𝒙∑𝒚𝒏∑𝒙𝟐− (∑𝒙) 2
3. Treynor Ratio: It was developed by Jack Treynor, an American economist who was one of the
inventors of Capital Asset Pricing (CAPM). It determines how much excess return was generated
for each unit of risk taken on by a portfolio. The Treynor‘s ratio is a measurement of the returns
which is earned in excess of that which could have been earned on an investment that has no
diversification risk. Under the analysis, the better performance is generated when the Treynor‘s
ratio is higher. RP is a return on mutual fund, RF is the risk-free rate of return, is the beta of the
fund.
Treynor Ratio =RP−𝑹𝒇/β
4. Sharpe’s Ratio: It was developed by Nobel laureate William F Sharpe in 1996. It was
originally called as ―reward-to-variability‖. It consists of taking the excess return of the portfolio,
relative to the risk-free rate, and dividing it by the standard deviation of the portfolio‘s excess
return. Sharpe ratios above 1.00 is considered to be ―good‘‘ as this would suggest that the
portfolio is offering excess returns relative to its volatility. Sharpe ratio is calculated by deducting
the risk-free rate of return from the average monthly return for a portfolio and dividing the result
by standard deviation of the portfolio return.
SR = 𝑹𝑷−𝑹/σ

JOURNAL BY THE DEPARTMENT OF MBA, MCA AND M. COM (FA), JYOTI NIVAS COLLEGE AUTONOMOUS
175
175
3.9 Limitation of the study
The study is mainly based on historical data
The study has taken only Mid cap companies into consideration
The study is considered only for 6 months past data of 10 different companies.
3.10 Scope of the study
There have always been fluctuations and uncertainty in the stock market. The investors must be
equipped with sufficient knowledge of the Indian stock market, which helps the investors making
wise investment decision. The main scope is to know how it helps the investors create wealth. The
study also includes the analysis of risk and return of 6 mutual funds.
1 DATA ANALYSIS AND INTERPRETATION
Beta of Midcap Fund for the month of September 2021
FUND NAME Beta
Axis Midcap Fund 0.70
Baroda Pioneer Mid cap
Fund
0.85
ICICI Prudential Mid Cap
Fund
0.98
HDFC Mid Cap Fund 0.90
Edelweiss Mid Cap Fund 0.88
Invesco India Mid Cap
Fund
0.79
Standard deviation of midcap fund for the month of September 2021.
0.72 0.85 0.95 0.9 0.88 0.79
Analysis:
From the table ICICI Prudential has the highest
Beta of 0.98. The volatility of HDFC Mid cap fund
is 0.90. The Beta of Edelweiss Mid cap Fund,
Invesco India Mid cap Fund and Baroda pioneer
Mid Cap Fund have a smaller difference in their
Beta that is 0.88, 0.79 and 0.85 respectively.
The Beta of Axis Mid cap Fund is 0.70. The market Beta is considered as one.
Interpretation.
From the graph Axis Mid cap Fund and Baroda
Mid cap fund has less volatile compared to the
market. Invesco India Mid cap Fund and
Edelweiss Mid cap Fund are more or less moves
with tandem with market.
The HDFC Mid cap Fund and ICICI prudential
are high volatile compared to other funds.
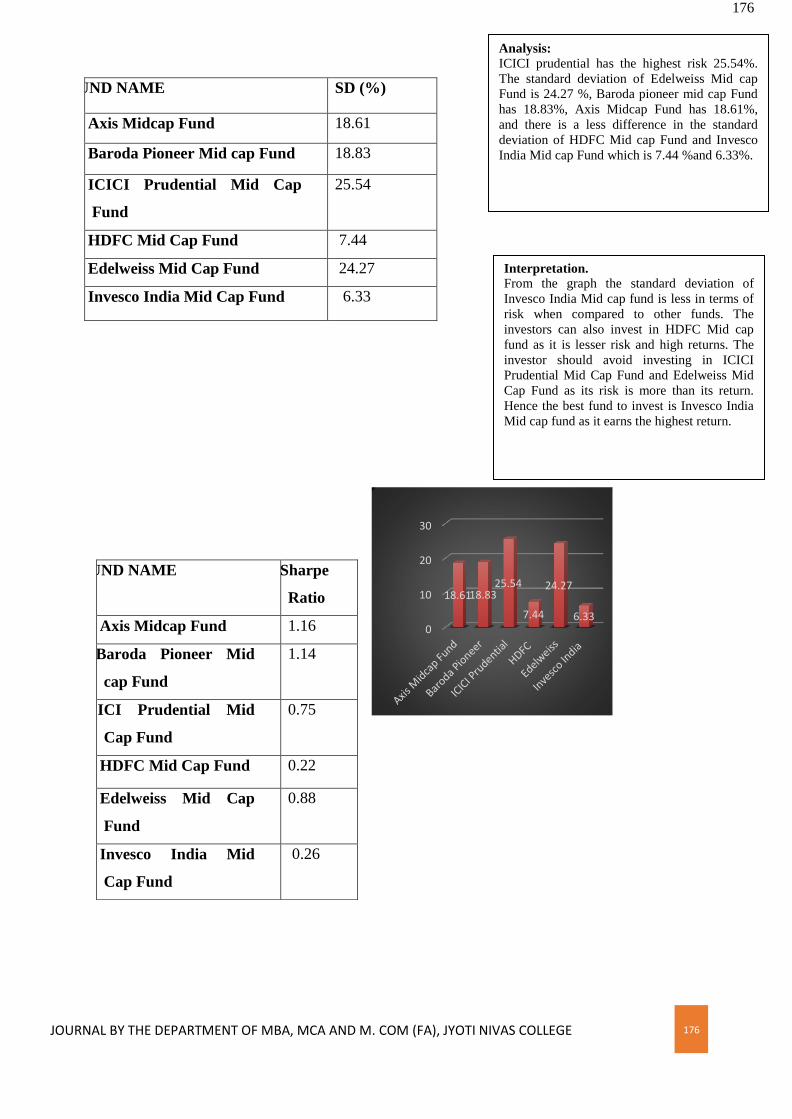
JOURNAL BY THE DEPARTMENT OF MBA, MCA AND M. COM (FA), JYOTI NIVAS COLLEGE AUTONOMOUS
176
176
0
10
20
30
18.61 18.83 25.54
7.44
24.27
6.33
FUND NAME SD (%)
Axis Midcap Fund 18.61
Baroda Pioneer Mid cap Fund 18.83
ICICI Prudential Mid Cap
Fund
25.54
HDFC Mid Cap Fund 7.44
Edelweiss Mid Cap Fund 24.27
Invesco India Mid Cap Fund 6.33
FUND NAME Sharpe
Ratio
Axis Midcap Fund 1.16
Baroda Pioneer Mid
cap Fund
1.14
ICICI Prudential Mid
Cap Fund
0.75
HDFC Mid Cap Fund 0.22
Edelweiss Mid Cap
Fund
0.88
Invesco India Mid
Cap Fund
0.26
Analysis:
ICICI prudential has the highest risk 25.54%.
The standard deviation of Edelweiss Mid cap
Fund is 24.27 %, Baroda pioneer mid cap Fund
has 18.83%, Axis Midcap Fund has 18.61%,
and there is a less difference in the standard
deviation of HDFC Mid cap Fund and Invesco
India Mid cap Fund which is 7.44 %and 6.33%.
Interpretation.
From the graph the standard deviation of
Invesco India Mid cap fund is less in terms of
risk when compared to other funds. The
investors can also invest in HDFC Mid cap
fund as it is lesser risk and high returns. The
investor should avoid investing in ICICI
Prudential Mid Cap Fund and Edelweiss Mid
Cap Fund as its risk is more than its return.
Hence the best fund to invest is Invesco India
Mid cap fund as it earns the highest return.

JOURNAL BY THE DEPARTMENT OF MBA, MCA AND M. COM (FA), JYOTI NIVAS COLLEGE AUTONOMOUS
177
177
Sharpe ratio of midcap fund for the month of September 2021
5. Findings:
In the Month of April 2021:
ICICI Prudential assumes high risk percentage of 26.14.
According to Beta also ICICI Prudential is more volatile with highest Beta of 0.94.
In the Month of May 2021:
ICICI Prudential assumes high risk percentage of 26.31.
According to Beta also ICICI Prudential is more volatile with highest Beta of 0.95.
In the Month of June 2021:
ICICI Prudential assumes high risk percentage of 26.12.
According to Beta also ICICI Prudential is more volatile with highest Beta of 0.94.
In the Month of July 2021:
ICICI Prudential assumes high risk percentage of 26.15.
According to Beta also ICICI Prudential is more volatile with highest Beta of 0.95.
6. Suggestions
1.16 1.14
0.75
0.22
0.88
0.26
0
0.2
0.4
0.6
0.8
1
1.2
1.4
Analysis:
From the table Axis Mid cap Fund has the
highest ratio of 1.16 following by Baroda
Mid cap Fund as 1.14. Edelweiss Mid Cap
Fund has the ratio of 0.88 and ICICI
Prudential Mid cap Fund has a ratio of 0.75,
Invesco India Mid cap Fund has a ratio of
0.26 and HDFC has a least ratio of 0.22.
Interpretation.
From the above graph Axis Mid cap Fund
has performed well compared to all other
funds .Even though Baroda Mid cap Fund
give high return the fund performance is
considered while investing. Hence the
investor can choose Axis mid cap fund for
their investment.

JOURNAL BY THE DEPARTMENT OF MBA, MCA AND M. COM (FA), JYOTI NIVAS COLLEGE AUTONOMOUS
178
178
• According to the risk percentage ICICI Prudential Midcap fund in the month of April 2021
assumes the highest risk of 26.14.
• According to the Beta also ICICI prudential Midcap Fund in the month of May, June, July
has the highest volatile of 0.95 according to Sharpe‘s performance Index Axis Midcap Fund in
the month of September 2021 has performed compared to other funds with ratio of 1.16.
• According to Treynor‘s performance Index Invesco India Midcap Fund in the month of
August 2021 gets the highest premium of 107.11.
• HDFC Midcap opportunities Fund have the highest asset under management (AUM) of
Rs.31629 crores.
Overall, it is noted that the performance of some funds is not at their best in recent times.
Therefore, investors must invest cautiously and weigh their options carefully before planning new
investments. The following suggestions are worth considering in this respect.
7. Conclusion:
Mutual Funds mobilize money from investors, to invest in various securities as per investment
objective agreed upon between the mutual fund and the investors. Mutual Funds are one of the
most highly growing products in financial services market and suitable for all types of investors
from risk adverse to risk bearer. In mutual funds different avenues are available to investors.
While taking investment decision the investor should compare the risks and expected returns.
Mutual Fund offer investors the opportunity to earn income through professional management.
Mutual Funds are not liable to pay Income Tax. The investment in equity through Systematic
Investment Plan (SIP) can help the investors tackle the changing market scenario. Mutual Funds
are suitable for all age of investors, businessman, salary person, etc.
A Mutual Fund in India is registered with SEBI, which also monitors the operations of the fund to
protect investor‘s interest.
BIBLIOGRAPHY
Dr Vikas Choudhary, P. S. (October 2010). Performance Evaluation of Mutual Funds:
AStudy of selected Diversified Equity Mutual Funds in India. International Conference on
Business, Law and Corporate Social Responsibility.
Dr. Monty Kanodia, K. K. (2017). Performance Evaluation of Mutual Funds in India.
Account and Financial Management Journal.Mamta, s. C. (NOv 2019). Performance
Evaluation of Mutual Funds: A Study of Selected Equity
Diversified Mutual Funds in India. International Journal of Research in Business
Management.

JOURNAL BY THE DEPARTMENT OF MBA, MCA AND M. COM (FA), JYOTI NIVAS COLLEGE AUTONOMOUS
179
179
Mohamed.zaheeruddin, P. S. (2013). Performance evaluation of mutual funds in India with
special
Reference to selected financial intermediaries. IOSR Journal of Business and Management.
Ms. Shilpa Pal, A. C. (2014). A Critical Analysis of Selected Mutual Funds in India.
Procedia Economic and Finance.
Rehmani, A. (September 2018). Performance Evaluation of Select Mutual Funds: A Public-
Private Comparison. Department of Economics, Aligarh Muslim University (AMU), Aligar.
Rizwan Ali, R. U. (May 2011). Performance Evaluation of mutual funds. SSRN Electronic.
Text Books
o Aswantha Narayana T, Archana B S, Chandrakala G, Mini K Abraharam Financial
Management, Vision BookHouse.
o Security analysis and portfolio management – Punithavathy Pandian
References from Internet:
www.yahoofinance.com
Www.Moneycontrol.com

JOURNALBYTHEDEPARTMENTOFMBA,MCAANDM.COM(FA),JYOTINIVASCOLLEGEAUTONOMOUS 180
180
Published by:
Research Publication and Development Cell (RPDC)
Jyoti Nivas College Autonomous, Bengaluru–560095, India