Volume 7 - Risk Assessment and Spill Scenarios - Amazon AWS
475
Trans Mountain Pipeline (ULC) Trans Mountain Expansion Project Volume 7 Volume 7 – Risk Assessment and Management of Pipeline and Facility Spills Appendix D – 1 Appendix D Simulations of Hypothetical Oil Spills from the Trans Mountain Expansion Project Pipeline – P1 V6 Route
-
Upload
khangminh22 -
Category
Documents
-
view
1 -
download
0
Transcript of Volume 7 - Risk Assessment and Spill Scenarios - Amazon AWS

Trans Mountain Pipeline (ULC) Trans Mountain Expansion Project Volume 7 Volume 7 – Risk Assessment and Management of Pipeline and Facility Spills Appendix D – 1
Appendix D Simulations of Hypothetical Oil Spills from the Trans Mountain Expansion Project Pipeline – P1 V6 Route

REPORT
SIMULATIONS OF HYPOTHETICAL OIL SPILLS FROM THE TRANS MOUNTAIN EXPANSION PROJECT PIPELINE – P1 V6 ROUTE
PREPARED FOR:
Trans Mountain Expansion Project 2013-178
AUTHOR:
Chris Galagan
Jeremy Fontenault
DATE SUBMITTED
27 November, 2013

i
Table of Contents
Introduction .................................................................................................................................................. 2
Description of the OILMAP Land Model ....................................................................................................... 2
Application of the Model .............................................................................................................................. 7
Model Results ............................................................................................................................................... 8
References .................................................................................................................................................... 9
List of Figures
Figure 1. Map of the Trans Mountain expansion pipeline centerlines used for locating spill points used in the modeling. ................................................................................................................................................ 2 Figure 2. Conceptual diagram of the land transport model showing the possible fate of oil as it moves over the land surface. ................................................................................................................................... 4 Figure 3. Conceptual diagram of the water transport model showing the possible fate of oil entering the surface water network. ................................................................................................................................. 5 Figure 4. Map showing spill plumes along a section of the Edmonton to Gainford pipeline segment in Alberta. ......................................................................................................................................................... 8

2
Introduction RPS ASA simulated hypothetical spills occurring along the route of the proposed Trans Mountain expansion pipeline in Alberta and British Columbia, Canada. RPS ASA used its OILMAP Land model to determine the overland and downstream pathways of the spills using volumes provided by Trans Mountain at locations distributed along the proposed pipeline route. The output from the modeling, consisting of the predicted oil pathways and spill point locations, has been provided as ESRI shape files. This report describes the operational and environmental data used in the modeling and the model results. Figure 1 shows the pipeline centerlines used to locate spill points for the modeling.
Figure 1. Map of the Trans Mountain expansion pipeline centerlines used for locating spill points used in the modeling.
Description of the OILMAP Land Model OILMAP Land is a model system containing tools to generate spill points along a pipeline centerline, calculate the product volume discharged at each point resulting from a catastrophic break of the line, and model the overland and downstream pathways of hazardous liquid spills using standard geospatial data and appropriate environmental parameters. The model outputs spill pathways in geospatial data formats that may be used to perform HCA and other types of analysis.

3
Spill Pathway Determination
Land based spills travel down slope over land and often end up in a stream or other surface water feature. Prediction of flow over land and through the surface water network requires two fundamentally different modeling approaches. Oil flow over land is governed by the physical nature of the land surface and the degree of slope over which it flows. The land transport model calculates an oil mass balance that accounts for oil adhesion to land over the oiled path, the formation of small puddles, oil pooling in large depressions on the land surface, and oil evaporation to the atmosphere. Once the oil reaches a stream or lake its flow is governed by surface currents, requiring a different modeling approach. The water transport model moves oil on the water surface at a defined velocity and calculates the quantity of oil retained on the shore and oil evaporation to the atmosphere.
Calculating the Spill Path over Land
Starting at the spill location, the model determines the steepest descent direction in the eight adjacent cells of the land elevation grid. The oil moves to the neighboring cell with the lowest elevation. This process repeats successively until a flat area or depression is reached. In a flat area, the model searches the minimum distance path to a next lowest cell (i.e. looks beyond the eight adjacent cells) and moves the spill to that cell. In a depression area, the depression is filled before the spill continues down slope. Overland flow of the oil continues until the path reaches a stream or other surface water feature, or until the total spill volume is depleted from loss to the land surface and evaporation. The final spill path over land forms a chain of channels and pooled sections. A channel section is where no pooling occurs and the width of the spill path is dependent on the slope of the land surface. A pooled section consists of an area of one or more contiguous elevation grid cells that form a depression in which the spilled product has collected. Figure 2 depicts a conceptual diagram of the flow of oil over the land surface as simulated by the OILMAP Land model.
The digital elevation data used is necessarily coarse and only approximates topography that could potentially direct the flow of the spill or cause pools to form. Features such as roads, railway tracks and ditches that would impede or re-direct oil flow are not always captured in elevation data at the available scale.
The amount of oil retained on the land surface as oil flows down slope is determined by the nature of the land cover. A land cover type data grid specifies the amount of oil retention based on the cover type so that as oil traverses the land a variable loss rate is calculated. This loss value varies between 2 and 200 millimeters (0.08 – 7.9 inches) for the range of land cover types typically encountered. These oil loss rates are based on surface hydrologic studies (ASCE 1969, Kouwen 2001, and Schwartz et al 2002).
Separate from oil adherence based on land cover type, oil pooled on the land surface is the volume of oil retained within depressions defined in the land elevation grid. The oil retained on the ground is the sum of adhesion and pooling. Total oil loss during a spill simulation includes losses to the ground plus evaporative loss to the atmosphere (described below).

4
The velocity (V) of the leading edge of the spill as it travels over the land surface is determined by the slope of the land surface using Manning’s Equation:
V = 1/n R2/3 S1/2
Where R is the hydraulic radius, S is the slope, and n is a dimensionless number that characterizes the flow resistance. As an example, assuming n is 0.05 and R is 0.122m:
V = 4.92 S1/2 (meter/sec)
The width of the oil flow path is also determined by slope; the width increases as the slope of the land surface decreases and decreases with increasing land surface slope. The path width is typically 1-2 meters, and cannot exceed the dimension of the land elevation grid cells.
Figure 2. Conceptual diagram of the land transport model showing the possible fate of oil as it moves over the land surface.
Water Transport
Once the spilled oil enters a stream it is transported through the stream network at a velocity defined by the speed and direction of surface currents in each stream reach. While in the stream network, oil is lost by adhesion to the shore and by evaporation to the atmosphere. Figure 3 depicts a conceptual diagram of the water transport portion of the model. Total travel time and the velocity of the surface current in the stream control the distance the oil will travel downstream. Total travel times are typically defined in spill response plans as the time required to respond to and stop a catastrophic release. Oil is modeled to travel downstream until all available oil is lost to the shoreline or to evaporation, or the simulation reaches the downstream travel time. The 24-hour travel time used in the modeling does not reflect spill control response times.
channel flow
stream
pooling
Evaporation
spreading
Depression storage
Evaporation

5
Figure 3. Conceptual diagram of the water transport model showing the possible fate of oil entering the surface water network.
Oil is transported downstream at the current speed defined for each stream reach. The current speeds are calculated using the relationship between drainage area and stream flow determined from gauged streams throughout the region of the pipeline corridor. Using the area/flow relationship from gauged streams, flow for un-gauged streams can be estimated if the drainage area is known. Once flow is known the current speed can be calculated using an equation developed by Jobson (1996). This method is the same used by the USGS for calculating stream current speeds for its National Hydrography Dataset (NHD Plus). This method uses regression analyses on hydraulic variables for over 980 time-of-travel studies from about 90 different rivers in the U.S. These rivers represent a range of sizes, slopes, and channel geometries. Four principal parameters are used in the Jobson method: drainage area, reach slope, mean annual discharge, and discharge at the time of the measurement. Based on this analysis, regression equations were developed to relate velocity to drainage area and the other parameters. For the modeling reported here, the current speeds calculated using this method are for a maximum monthly mean flow condition.
The model does not take into account any braiding, debris, backwater, log jams or other impediments to downstream travel and assumes a straight-sided channel. Adherence of the spilled product occurs along the simulated banks.
When oil encounters a lake the slick will spread across the lake surface until it covers the entire lake or it reaches a minimum thickness. If the minimum thickness is reached, spreading stops and the oil travels no farther. The minimum thickness can be varied according to the oil type. If oil covers the lake surface before reaching the minimum thickness it continues in any out-flowing streams at the surface current velocity specified for the stream reach.
Oil is retained on stream shorelines as it is transported downstream by surface currents. Five different stream shore types are defined, each with a specified bank width and oil retention thickness. Oil volume adhering to the shoreline is calculated as the length of the shoreline oiled times the specified bank width times the oil thickness. Shoreline retention thickness values for different shore types are shown in Table 1.
flow
oil lost on shore
lake
Evaporation
Evaporation

6
Table 1. River shore types and associated oil retention values used in the model.
Shore Type Shore Width Oil Thickness
Light Oil Medium Oil Heavy Oil Bedrock 1.6 ft (0.5 m) 1 mm 2 mm 4 mm Gravel 3.3 ft (1 m) 2 mm 9 mm 15 mm Sand/Gravel 6.6 ft (2 m) 3 mm 13 mm 20 mm Sand 16.4 ft (5 m) 4 mm 17 mm 25 mm Marsh 65.6 ft (20 m) 6 mm 30 mm 40 mm
Evaporation
Oil evaporates as it spreads over land or water. The most volatile hydrocarbons (low carbon number) evaporate most rapidly, typically in less than a day and sometimes in under an hour (McAuliffe, 1989). OILMAP Land uses a method called the Evaporative Exposure Model of Stiver and Mackay (1984) which is used in oil spill models of all kinds, both water and land based, to predict the volume fraction evaporated.
Several simplifying assumptions are made that directly affect the amount of oil predicted to evaporate. In general, the rate of evaporation depends on surface area, oil thickness, and vapor oil pressure, which are functions of the composition of the oil, and on wind speed, air and land temperature. The mass of oil evaporated is particularly sensitive to the surface area of the spreading oil and the time period over which evaporation is calculated. On the land surface, area and evaporation time are functions of the slope defined by the elevation grid and the size of the depressions encountered. A steeper slope causes the oil to travel faster but along a narrower path, while a lower slope slows the speed of advance and increases the width of the oiled path.
In the stream network, oil surface area and evaporation time are functions of the stream surface area (total length of the oiled stream times the width) and stream velocity.
Oil loss to evaporation ceases once the total oil spill volume is released and the simulation is terminated. Termination may occur for a number of reasons including:
· Oil loss to the ground surface, stream banks, and evaporation · The stream travel time is exceeded · The spill reaches its minimum thickness on a lake surface · The spill reaches a dead end in the stream network, or the coastline.
In reality, oil will continue to evaporate from the ground or water surface, increasing the total evaporation amount. This conservative calculation of evaporative loss is consistent with a worst-case scenario approach.

7
Application of the Model Outflow point locations were provided by Trans Mountain for the pipeline segments shown in Figure 1. The outflow points were spaced at a 30-meter interval along the pipeline centerline and at additional selected locations, including stream crossings. Spill points used in the modeling were created at a 1-kilometer interval along the pipeline centerline and at stream crossings. The release volume for each spill point was determined by selecting the maximum total release volume from all outflow points within the 1-kilometer segment. Spill points at stream crossings were also assigned the maximum release volume for the 1-kilometer segment they fall within. The model was run once for each spill to determine the pathway over land and down streams.
Environmental Data
Land Elevation
The land surface was defined using elevation data from the 1 arc-second (about 30 meters) resolution National Elevation Dataset (NED) provided by the United States Geological Survey (USGS). The NED is derived from elevation data obtained from a number of sources, processed to a common coordinate system and vertical unit, and provided as a seamless dataset. Elevations are stored as meters referenced to the North American Vertical Datum of 1988 (NAVD 88) and based on the North American Datum 1983 (NAD83) horizontal reference datum.
Surface Water
The surface water streams and lakes network was defined using the National Hydro Network dataset. It provides geospatial vector data describing hydrographic features such as lakes, reservoirs, rivers, streams and canals in the form of a linear drainage network that is used by the model to route spills downstream.
The NHN is available to the public from the GeoBase web site (www.geobase.ca) but it requires some processing and QA/QC steps to make it usable by the OILMAP Land model. The dataset is comprised of data from federal and provincial/territorial sources, coordinated jointly by the federal government and provincial and territorial partners. The NHN is a vector data product primarily designed to allow hydrographic network analysis. It is intended for water flow analysis, water and watershed management, environmental and hydrographical applications.
Land Cover Type
The characteristics (other than elevation) of the land surface are defined using the LCC 2000 dataset developed by Natural Resources Canada, Earth Sciences Sector and published in 2009. The data were the result of vectorization of classified Landsat 5 and Landsat 7 ortho-imagery for agricultural and forest areas in Canada, and for Northern Territories. The digital data were obtained from geobase.ca. Details of the classification system can be found in Wulder and Nelson, 2003.

8
Model Results The OILMAP Land model was used to simulate 1,822 individual hypothetical spills from points distributed at a 1-kilometer interval and at stream crossings along the proposed Trans Mountain Expansion pipeline route (see Figure 1).
The model output has been provided in ESRI shape file format. Shape files containing the spill points and the model calculated spill pathways (plumes) have been provided for each of the 13 pipeline segments modeled. Each spill point is given a unique ID number per pipeline segment that can be used to relate the point to the resulting plume. Figure 4 shows the spill points and plumes for a short section of the Edmonton to Gainford pipeline segment.
Figure 4. Map showing spill plumes along a section of the Edmonton to Gainford pipeline segment in Alberta.

9
References American Society of Civil Engineers. 1969. Design and Construction of Sanitary and Storm Sewers.
Manuals and Reports of Engineering Practice, No. 37, New York.
Jobson, H.E., 1996. Prediction of Travel Time and Longitudinal Dispersion in Rivers and Streams. USGS Water Resources Investigations Report 96-4013.
Kouwen N., 2001, WATFLOOD/SPL9 Hydrological Model & Flood Forecasting System, Department of Civil Engineering, University of Waterloo, Waterloo, Ontario, Canada.
McAuliffe, C.D., 1989. The weathering of volatile hydrocarbons from crude oil slicks on water. Proceedings of the 1989 Oil Spill Conference. San Antonio, TX. pp. 357-364.
Stiver, W. and D. Mackay, 1984. Evaporation rate of spills of hydrocarbons and petroleum mixtures. Environmental Science and Technology, 18:834-840.
Wulder, M. and T. Nelson, 2003. EOSD Land Cover Classification Legend Report, Canadian Forest Service, Natural Resources Canada and TNT Geoservices, January, 2003.

Trans Mountain Pipeline (ULC) Trans Mountain Expansion Project Volume 7 Volume 7 – Risk Assessment and Management of Pipeline and Facility Spills Appendix E – 1
Appendix E Facility Integrity Hazards Listings

Trans Mountain Pipeline (ULC) Trans Mountain Expansion Project Volume 7 Volume 7 - Risk Assessment and Management of Pipeline and Facility Spills Appendix E – 2
Facility Integrity Hazards – Tanks
Event or Hazard Preventative Measure(s) Consequence Reduction Measures
Appurtenance leak API 653 in-service and out of service inspections Routine facility check, creep alarms, containment berms
Brittle Fracture API 650 design, commissioning hydrostatic testing
containment berms
External Corrosion External coating systems, API 653 in-service and out of service inspections
Routine facility check, creep alarms, containment berms
Shell Internal Corrosion
Bottom 3ft of shell is internally coated, API 653 in-service and out of service inspections, biocide treatments
Routine facility check, creep alarms, containment berms
Mixer seal leak Routine site inspections, mixer replacement program
Routine facility check, creep alarms, containment berms
Over-pressure-vacuum on fixed roof tank
P/V vents and vent maintenance and testing Frangible shell to roof joint, containment berms, routine facility check
Shell to floor weld failure from settlement
API 653 in-service and out of service inspections Routine facility check, creep alarms, containment berms
Tank over-fill Tank Overfill protection in accordance with API 2350, maintenance and testing of level switches and ESD circuit
containment berms
Vehicle Impact with tank/ appurtenance
controlled site access, bollards containment berms
wind damage to shell API 650 design, wind girders containment berms
EFR Corrosion External coating of floating roof, internal coating of floating roof in vapour spaces, expanded scope of in service and out of service inspections to address floating roof corrosion
Roof drains normally closed, tank shell, monthly inspections, containment berms
Floating roof jams with shell and sinks
Monthly roof inspection from gauging platform, annual roof inspection, API in service and out of service inspections, gauge pole centers roof
Roof drains normally closed, tank shell, monthly inspections, containment berms
Freezing damage to roof drain system
Winterization in cold climates, heat tracing of shell water drain nozzle and valve at locations with high winter rain and potential for freezing temperatures.
Routine facility check, creep alarms, containment berms
Roof sinks from overloading
pontoons and pontoon inspection and mitigation, roof drain monitoring, monthly inspections, vacuum breaker, tank leg pins
Roof drains normally closed, tank shell, monthly inspections, containment berms
EFR leg damages floor Striker plates on tank floor, low operating limits for tanks, legs set for operating position, floating roof anti-rotation device
Creep alarms, under tank liner (where applicable), under tank leak detection (where applicable)

Trans Mountain Pipeline (ULC) Trans Mountain Expansion Project Volume 7 Volume 7 - Risk Assessment and Management of Pipeline and Facility Spills Appendix E – 3
Facility Integrity Hazards – Tanks
Event or Hazard Preventative Measure(s) Consequence Reduction Measures
floor weld cracking API 653 out of service inspections Routine facility check, creep alarms, containment berms
Topside floor corrosion Tank floor lining, striker plates, API 653 out of service inspections, biocide treatments
Creep alarms, under tank liner (where applicable), under tank leak detection (where applicable)
Underside floor corrosion
Cathodic protection, API 653 out of service inspections
Creep alarms, under tank liner (where applicable), under tank leak detection (where applicable)
Full or partial surface tank fire
Floating roof with primary and secondary seals, controlled site access, hot work permitting system at all locations (some locations have: rim seal foam dams, foam piping and pourers for rim seal fire fighting, hazardous area electrical design, rim fire detection system)
Firewater, foam and equipment available for major tank fire (where applicable), containment berms, spacing and firewater systems to NFPA30. Fire eyes on some tanks
Tank area fire Vegetation control in tank bay, controlled site access, hot work permitting system
Firewater, foam and equipment available for major tank fire (where applicable), containment berms, spacing and firewater systems to NFPA30
Tank rim seal fire Floating roof with primary and secondary seals, controlled site access, hot work permitting system, ground shunts, tank grounding system
firewater, foam and equipment available for rim seal fire (where applicable), containment berms, spacing and firewater systems to NFPA30
Sump tank external corrosion
External coating or non-metallic structure, Groundwater monitoring well
Sump tank internal corrosion
Internal coating or non-metallic structure, biocide treatments,
Groundwater monitoring well
Sump tank crack or puncture
Internal inspections, double walled tank with interstitial space monitoring, installation procedures, protective bollards above buried tanks
Groundwater monitoring well
Sump overfill Sump level indication/creep alarm, high level ESD, high-high level ESD
Hydrocarbon detector in drainage path (where applicable)
Facility Integrity Hazards – Piping (Includes above and below ground piping, valves and fittings)
Event or Hazard Preventative Measure(s) Consequence Reduction Measures
Excessive pipe strain Stress analysis during design, change management, above ground piping inspection, backfilling standards
Routine facility check (for A/G), hydrocarbon detector in drainage path (where applicable), secondary containment (where applicable)
External Corrosion External coatings, above ground piping inspection, Facility Piping Assessment Program, Cathodic protection (for U/G)
Routine facility check (for A/G), hydrocarbon detector in drainage path (where applicable), secondary containment (where applicable)
Flange Leak Flange bolting standard, Routine facility check (for A/G), hydrocarbon detector in drainage path (where applicable), secondary containment (where applicable)

Trans Mountain Pipeline (ULC) Trans Mountain Expansion Project Volume 7 Volume 7 - Risk Assessment and Management of Pipeline and Facility Spills Appendix E – 4
Facility Integrity Hazards – Piping (Includes above and below ground piping, valves and fittings)
Event or Hazard Preventative Measure(s) Consequence Reduction Measures
Internal Corrosion Facility piping assessment program, in service or maintenance flushing
Routine facility check (for A/G), hydrocarbon detector in drainage path (where applicable), secondary containment (where applicable)
Internal Erosion Facility piping assessment program Routine facility check (for A/G), hydrocarbon detector in drainage path (where applicable), secondary containment (where applicable)
Overpressure Hydrostatic testing, full flow and thermal relief valves
Routine facility check (for A/G), hydrocarbon detector in drainage path (where applicable), secondary containment (where applicable)
Vandalism Site security Routine facility check (for A/G), hydrocarbon detector in drainage path (where applicable), secondary containment (where applicable)
Vehicle Impact Controlled access, bollards` Routine facility check (for A/G), hydrocarbon detector in drainage path (where applicable), secondary containment (where applicable)
Water Freezing in line or valve
Heat tracing, winterization, in-service or maintenance flushing, water content controlled by tariff
Routine facility check (for A/G), hydrocarbon detector in drainage path (where applicable), secondary containment (where applicable)
Impact from excavation equipment
Safe work permit system, damage prevention standards
Inspector required for inspection of piping in facilities
Vibration Above ground piping inspection, Routine facility check (for A/G), hydrocarbon detector in drainage path (where applicable), secondary containment (where applicable)
Valve left or bumped open inadvertently
Plugs or blinds on all open pipe ends, drain/vent checklists, valve locks or pins
Routine facility check (for A/G), hydrocarbon detector in drainage path (where applicable), secondary containment (where applicable)
Valve stem seal failure Snug gland nuts Routine facility check (for A/G), hydrocarbon detector in drainage path (where applicable), secondary containment (where applicable)
piping area fire Controlled drainage away from piping areas, hazardous area electrical design, combustible gas detection instrumentation (where applicable)
Fire fighting water, foam and equipment
EFR Roof drain piping corrosion
API Out of Service Inspections Winterization Procedure, EFR drain valves operated in normally closed position

Trans Mountain Pipeline (ULC) Trans Mountain Expansion Project Volume 7 Volume 7 - Risk Assessment and Management of Pipeline and Facility Spills Appendix E – 5
Facility Integrity Hazards – Pumps
Event or Hazard Preventative Measure(s) Consequence Reduction Measures
Case erosion Internal inspection Routine facility check, combustible gas detection, secondary containment, ESD system
Excessive vibration vibration protection, precision alignment, routine site check
Routine facility check, combustible gas detection, secondary containment, ESD system
Overpressure Hydrostatic testing, proper design, overpressure protection instrumentation (where applicable), relief valves (where applicable)
Routine facility check, combustible gas detection, secondary containment, ESD system
Over temperature Casing high temperature shutdown, pump bearing high temperature shutdown, incomplete sequence shutdown
Routine facility check, combustible gas detection, secondary containment, ESD system
Seal failure vibration protection, precision alignment Seal fail detection and containment systems, combustible gas detection, ESD system, secondary containment
Fire in pump room Combustible gas detection system, ESD System, hazardous area electrical design, permit requirements for hot work
Fire eyes, ESD system, secondary containment
Corrosion of deep well booster pump cans
Out of service inspections Routine facility check

Trans Mountain Pipeline (ULC) Trans Mountain Expansion Project Volume 7 Volume 7 – Risk Assessment and Management of Pipeline and Facility Spills Appendix F – 1
Appendix F Special Tactics for Spill Response

Trans Mountain Pipeline (ULC) Trans Mountain Expansion Project Volume 7 Volume 7 - Risk Assessment and Management of Pipeline and Facility Spills Appendix F – i
TABLE OF CONTENTS Page
1.0 DISPERSANTS ................................................................................................................................ 1 1.1 How Chemical Dispersion Works ........................................................................................ 1 1.2 Limitations ........................................................................................................................... 2 1.3 Methods of Application at Sea ............................................................................................ 3 1.4 Vessel Spraying .................................................................................................................. 3 1.5 Aerial Spraying .................................................................................................................... 4 1.6 Shoreline Application .......................................................................................................... 5 1.7 Monitoring Dispersant Effectiveness ................................................................................... 5 1.8 Environmental Considerations ............................................................................................ 6
2.0 IN-SITU BURNING ........................................................................................................................... 6 2.1 The Basics of Burning ......................................................................................................... 6 2.2 The Advantages and Disadvantages .................................................................................. 7 2.3 Weather and Physical Conditions for Burning .................................................................... 8 2.4 Emissions from Burning ...................................................................................................... 9 2.5 Ignition ............................................................................................................................... 10 2.6 Containment ...................................................................................................................... 12 2.7 Efficiency ........................................................................................................................... 13 2.8 Fuel Type .......................................................................................................................... 13 2.9 Health, Safety and Monitoring ........................................................................................... 14 2.10 Consideration of Burning as an Option ............................................................................. 14 2.11 Scenarios for Burning ....................................................................................................... 15 2.12 The Plans .......................................................................................................................... 18
3.0 REFERENCES ............................................................................................................................... 18
LIST OF FIGURES Figure 1 Oil Being Burned During the Deepwater Horizon Incident within a
Fire-resistant Boom ............................................................................................... 8 Figure 2 A Burn Team Waits for Their Igniter to Start a More Extensive Fire in
the Fire-resistant Boom ....................................................................................... 11 Figure 3 A Helitorch in Operation in Forest Fire Control .................................................... 12 Figure 4 A View of a Fire-resistant Boom with Highly Weathered Oil Burning .................. 13 Figure 5 Decision Flowchart for In-situ Burning ................................................................. 16 Figure 6 A View of a Salt Marsh Burn in Louisiana ........................................................... 18
LIST OF TABLES Table 1 Burning Properties of Various Fuels ............................................................................. 14 Table 2 Approximate Comparison of Countermeasures* .......................................................... 15

Trans Mountain Pipeline (ULC) Trans Mountain Expansion Project Volume 7 Volume 7 - Risk Assessment and Management of Pipeline and Facility Spills Appendix F – 1
1.0 DISPERSANTS While the existing planning standards focus on mechanical recovery, other response measures including the use of dispersants and in-situ burning exist and have proven effective in minimizing environmental harm in the event of a spill. However, the effectiveness of these measures can diminish as weathering of the oil progresses. While these methods are not appropriate in all cases, having conditional pre-approval for their use would avoid delays that diminish their effectiveness in situations when they offer a desirable means of diminishing environmental harm. Response organizations should be empowered with conditional preapprovals for in-situ burning, the use of dispersants and beach-cleaning agents.
When used appropriately, dispersants can be an effective method of response to an oil spill. They are capable of rapidly removing large amounts of certain oil types from the sea surface by transferring it into the water column. Following dispersant application, wave energy will cause the oil slick to break up into small oil droplets that are rapidly diluted and subsequently biodegraded by micro-organisms occurring naturally in the marine environment. They can also delay the formation of persistent water-in-oil emulsions. In common with other response techniques, the decision to use dispersants must be given careful consideration and take into account oil characteristics, sea and weather conditions, as well as surrounding environmental sensitivities.
Dispersants are a group of chemicals designed to be sprayed onto oil slicks to accelerate the process of natural dispersion. Significant environmental and economic benefits can be achieved, particularly when other at-sea response techniques are limited by weather conditions or the availability of resources. In certain situations, dispersants may provide the only means of removing significant quantities of surface oil quickly, thereby minimising or preventing damage to important sensitive resources. Their use is intended to minimise the damage caused by floating oil, for example to birds or before the oil may hit a sensitive shorelines. However, in common with all spill response options, the use of dispersants has limitations and its use should be carefully planned and controlled. Dispersant use will also depend upon national regulations governing the use of these products.
1.1 How Chemical Dispersion Works Natural dispersion of an oil slick occurs when waves and other turbulence at the sea surface cause all or part of the slick to break up into droplets and enter into the water column. The addition of dispersants is intended to accelerate this natural process.
Dispersants have two main components: a surfactant and a solvent. Surfactants molecules are made up of two parts: an oleophilic part (with an attraction to oil) and a hydrophilic part (with an attraction to water). When dispersants are sprayed onto an oil slick, the solvent will transport and distribute the surfactants through the oil slick to the oil/water interface where they arrange themselves so that the oleophilic part of the molecule is in the oil and the hydrophilic part is in the water. This creates a reduction in the surface tension at the oil/water interface and small oil droplets will break away from the oil slick with the help of wave energy. These droplets will be of varying sizes and although the larger ones may rise back to the surface some will remain in suspension and will drift apart and become degraded by naturally occurring bacteria. If dispersion is successful, a characteristic brown plume will spread slowly down from the water surface a few minutes after treatment.

Trans Mountain Pipeline (ULC) Trans Mountain Expansion Project Volume 7 Volume 7 - Risk Assessment and Management of Pipeline and Facility Spills Appendix F – 2
Notes: A: Dispersant droplets containing surfactants are sprayed onto the oil.
B: The solvent carries the surfactant into the oil. C: The surfactant molecules migrate to the oil/water interface and reduce surface tension, allowing. D: small oil droplets to break away from the slick. E: The droplets disperse by turbulent mixing, leaving only sheen on the water surface.
1.2 Limitations
Dispersants have little effect on very viscous, floating oils, as they tend to run off the oil into the water before the solvent can penetrate. As a general rule, dispersants are capable of dispersing most liquid oils and emulsions with viscosities of less than 2000 centistokes, equivalent to a medium fuel oil at 10-20ºC. They are unsuitable for dealing with viscous emulsions (mousse) or

Trans Mountain Pipeline (ULC) Trans Mountain Expansion Project Volume 7 Volume 7 - Risk Assessment and Management of Pipeline and Facility Spills Appendix F – 3
oils which have a pour point near to or above that of the ambient temperature. Even those oils which can be dispersed initially become resistant after a period of time as the viscosity increases as a result of evaporation and emulsification. For a particular oil, the time available before dispersant stops being effective depends upon such factors as sea state and temperature but is unlikely to be longer than a day or two. Dispersants can, however, be more effective with viscous oils on shorelines because the contact time may be prolonged allowing better penetration of the dispersant into the oil.
1.3 Methods of Application at Sea
Dispersants can be applied to open water by a variety of methods. In general workboats are more suitable for treating minor spills in harbours or confined waters. Large multi-engine planes are best equipped for handling large off-shore spills. Small, single-engine aircrafts and helicopters are suitable for treating smaller spills and near shore areas. Regardless of the method used, the droplet size of the dispersant is important as it needs to be sufficiently large to overcome the effects of wind and evaporative loss but not so large that it will result in the droplets being able to pierce through the oil slick. A uniform spray pattern of larger droplets, "rain drops", is required rather than a fog or a mist. Ultimately, whichever method of application is used, the key to a successful response using chemical dispersants is the ability to target the thickest part of the oil slick within a short time and before weathering or sea state render the oil undispersable.
1.4 Vessel Spraying Dispersants are usually applied from boats equipped with spray arms. In a typical spray arm system, pumps are used to pump dispersants from a storage tank through a set of nozzles calibrated to produce a uniform spray pattern of droplets.
Spray units can be portable or permanently installed on a vessel and systems are available which deliver the dispersant either undiluted or diluted with sea water. Spray arms are usually mounted as far forward on the vessel as possible to avoid the effect of the bow wave which can push the oil beyond the spray swath. Mounting the spray arms on the bow allows the vessel to travel faster and, because freeboard area is often greater at the bow also allows for longer spray arms. This combination allows optimisation of the amount of oil which can be treated (increasing the encounter rate) with a limited dispersant payload. If spray arms are not available, fire hoses or monitors are sometimes used to apply diluted concentrate dispersants. However, optimum dilution of the dispersant is difficult to achieve because of the very high flow rates and wastage of dispersant is a common problem. The high-powered jet of water also makes it difficult to apply the dispersant as a uniform spray of droplets and it frequently pierces through the oil making it ineffective. Thus fire monitors are unlikely to be an effective application tool unless specially modified for the purpose.

Trans Mountain Pipeline (ULC) Trans Mountain Expansion Project Volume 7 Volume 7 - Risk Assessment and Management of Pipeline and Facility Spills Appendix F – 4
Vessels offer certain advantages for dispersant spraying because they are usually readily available, easy to load and deploy, have cost advantages over aircraft and can apply dispersant fairly accurately to specific areas of a slick. Nevertheless, they also have serious limitations, particularly for larger spills, because of the low treatment rate which they offer and the added difficulty of locating the heaviest concentrations of oil from the bridge of a vessel. Furthermore, when slicks become fragmented or form narrow windrows, it is inevitable that some dispersant will be sprayed onto clear sea. These problems can be partially overcome by controlling the operation from spotter aircraft.
1.5 Aerial Spraying
The spraying of dispersant from an aircraft has the significant advantages of rapid response, good visibility, high treatment rates and optimum dispersant use. In addition, aircraft allow treatment of spills at greater distances from the shore than with vessels.
Two categories of aircraft are used: those designed for agricultural or pest control operations which require minor modification for dispersant application, and those which have been specifically adapted for the application of dispersant. Several types of helicopter have also been adapted to spray dispersants although most are able to carry an under slung bucket spray systems without the need for modifications. The ideal aircraft will be determined primarily by the size and location of the spill, although in reality local availability will be the crucial factor. The endurance, fuel consumption, turn around time, payload and the ability to operate from short or improvised landing strips are all important. In addition, the aircraft should be capable of operating at low altitude and relatively low speeds (50-150 knots) and be highly manoeuvrable.
Only type 3 dispersants are suitable for aerial spraying, since they require no mixing beyond that provided by the natural movement of the sea. The relatively low dose rate required also makes the best use of available payload.

Trans Mountain Pipeline (ULC) Trans Mountain Expansion Project Volume 7 Volume 7 - Risk Assessment and Management of Pipeline and Facility Spills Appendix F – 5
1.6 Shoreline Application
Dispersants are sometimes used to remove oil from hard surfaces such as rocks, sea walls and other manmade structures, particularly during the final stages of clean-up. However, it is important to remove the bulk of the stranded oil by other means first. Shores subjected to strong wave action are often cleaned naturally and they should not be sprayed unless the oil has to be removed immediately.
Dispersants may be applied to the surface and scrubbed into the oil before flushing with sea water. The dispersed oil cannot be collected and for this reason dispersant use on the shoreline is restricted to areas of low environmental concern. Shoreline cleaners may also be used but it is important to note that their mechanism of action is different from that of dispersants. Degreasers are often carried on board ships to deal with small spillages of oil on deck but most are more toxic than dispersant and should not be used as a dispersant at sea or as a shoreline cleaner. Today it is recommended to use citrus-based chemical cleaners as these usually have a lower environmental impact than traditional chemical cleaners.
1.7 Monitoring Dispersant Effectiveness It is essential that the effectiveness of chemical dispersion should be monitored continually and the response terminated as soon as the dispersant is no longer working. Successful dispersion will usually produce a coffee-coloured plume spreading under the water surface. However, visual observation of effectiveness may be impaired in poor weather conditions, in waters with high sediment content, when dispersing pale-coloured oils or in poor light. It is inappropriate to spray at night. Experience has shown that for the application of dispersants to be worthwhile, the oil will need to disperse sufficiently rapidly to effect a change in appearance of the slick and a subsequent reduction in oiled area, which should be visible from the air shortly after spraying. Conversely, if there is no change in oil appearance or coverage, and the dispersant runs off the oil to create a milky white plume in the water, the dispersant is not working. Equally, if the oil has become fragmented and widely scattered, it is unlikely that sufficient oil will be removed from the water surface by the dispersant to achieve a significant reduction in pollution damage.
Ultra-violet fluorimetry (UVF) is sometimes used to provide ‘real-time’ data on the concentration of dispersed oil in the water column during the application of dispersants. Typically, the variation in the concentration of fluorescent components is measured at least 1 metre under the slick using a fluorimeter that is towed behind a sampling boat. In open water, dispersion is demonstrated by a significant increase in the concentration of oil detected by the sensor

Trans Mountain Pipeline (ULC) Trans Mountain Expansion Project Volume 7 Volume 7 - Risk Assessment and Management of Pipeline and Facility Spills Appendix F – 6
compared with that measured prior to dispersant application. However, when used operationally, UVF does not provide a quantitative measurement of the amount of oil that is actually being removed from the sea surface and it should be used in combination with visual observations to decide whether a worthwhile response can be achieved.
1.8 Environmental Considerations The use of dispersants has in the past tended to provoke controversy since their application can be seen as a deliberate introduction into the sea of an additional pollutant into the water. Many of the first dispersants used in the 70s and 80s did show high toxicity to marine organisms. However, today there is a wealth of laboratory data indicating that modern dispersants and oil/dispersant mixtures exhibit relatively low toxicity to marine organisms.
The rapid dilution of the dispersed oil, the proximity to sensitive areas as well as the direction of currents and the mixing depths of surface waters are all factors which should be considered when deciding upon dispersant use. In the open sea, dispersed oil concentrations after spraying are unlikely to remain high for more than a few hours and significant biological effects are therefore improbable. In shallow waters close to the shore, where water exchange is poor, higher concentrations may persist for long periods and may give rise to adverse effects. However, the controlled application of dispersants may, on occasions, be beneficial in that it may reduce damage to adjacent ecologically sensitive shorelines by oiling.
The decision on whether or not to use dispersants rather than other response options will need to take into account the cost-effectiveness and conflicting priorities for protecting different resources from pollution damage. On occasions the benefit gained by using dispersants to protect coastal amenities, sea birds and intertidal marine life may far outweigh disadvantages such as the potential for temporary tainting of fish stocks. Certain resources such as water intakes, mariculture facilities or fish spawning areas are difficult to protect from dispersed oil and spraying may be decided against when near to these resources. Detailed contingency planning will aid in this decision process.
Trans Mountain proposes the use of dispersants as one means to respond to oil spills. Specific and detailed plans for the use of dispersants and consultations with government officials will be held to seek approval of these plans.
2.0 IN-SITU BURNING Like dispersant use, in-situ burning is a tactic that can, under the right circumstances, be extremely effective in spill response; especially if it can be deployed quickly. In-situ burning is the oldest technique applied to oil spills and is also one of the techniques that have been explored in scientific depth. The successful use of in-situ burning on the Deepwater Horizon spill in the Gulf of Mexico drew attention to the technique and left a positive image of burning. Burning is proposed by Trans Mountain to provide a rapid means to remove oil in the event of a spill onto water.
2.1 The Basics of Burning The fundamentals of in-situ burning are similar to that of any fire, namely that fuel, oxygen, and an ignition source are required (Fingas 2011). Fuel is provided by the vaporization of oil. The vaporization of the oil must be sufficient to yield a steady-state burning, that is one in which the amount of vaporization is about the same as that consumed by the fire. Once an oil slick is burning, it burns down the pool of oil at a rate of 2 to 4 mm per minute. If not enough vapours

Trans Mountain Pipeline (ULC) Trans Mountain Expansion Project Volume 7 Volume 7 - Risk Assessment and Management of Pipeline and Facility Spills Appendix F – 7
are produced, the fire will either not start or will be quickly extinguished. The amount of vapours produced is dependent on the amount of heat radiated back to the oil. This has been estimated to be about 2 to 3% of the heat from a pool fire (Fingas 2011). If the oil slick is too thin, some of this heat is conducted to the water layer below it. Since most oils have the same insulation factor, most slicks must be about 1 to 3 mm thick to yield a quantitative burn. Once burning, the heat radiated back to the slick and the insulation are usually sufficient to allow combustion down to about 1 mm of oil.
The amount of oil that can be removed in a given time depends on the fuel and on the area covered by the oil. As a general rule, oil burn rate is about 2,000 to 5,000 L/m2.day in a typical contained area. Several tests have shown that this does not vary significantly with oil weathering but varies with oil type (Fingas 2011, Mabile 2012). Emulsified oil may burn slower as its water content increases the heat requirement. Figure 1 shows one of the burns carried out during the Deepwater Horizon spill (Mabile 2012). This weathered oil was burning at a rate of about 5 tons per hour.
Flame spreading rates do not vary much with heavy fuel type, but vary significantly with wind, especially with wind direction. Flame spreading rates range from 0.01 to 0.02 m/s (0.02 to 0.04 knots). Downwind flame spreading rates range from 0.02 to 0.04 m/s (0.04 to 0.08 knots), and up to 0.16 m/s (0.3 knots) for high winds.
This oil burn has an area of about 800 square meters, which implies that the fire is consuming about 5 tons per hour of weathered oil. This burn was ignited using a home-made igniter with a flare and a plastic bottle of diesel fuel.
2.2 The Advantages and Disadvantages Advantages of in-situ burning include: rapid removal of oil from the water surface; requirement for less equipment and labour than many other techniques; significant reduction in the amount of material requiring disposal; significant removal of volatile oil components; requirement of less equipment and labour than other techniques and may be the only solution possible, such as in oil-in-ice situations and in wetlands (ASTM 2008).
Disadvantages of in-situ burning include the following: creation of a smoke plume; residues of the burn may have to be removed; oil must be a sufficient thickness to burn quantitatively, thus may require containment; and danger of the fire spreading to other combustible materials. And finally, burning oil is sometimes not viewed as an appealing alternative to collecting the oil and reprocessing it for reuse. In fact, recovered oil is usually incinerated as it often contains too many contaminants to be economically reused.

Trans Mountain Pipeline (ULC) Trans Mountain Expansion Project Volume 7 Volume 7 - Risk Assessment and Management of Pipeline and Facility Spills Appendix F – 8
Source: Photograph from Elastec/American Marine. Notes: This oil burn has an area of about 800 square meters which implies that the fire is
consuming about 5 tons per hour of weathered oil. This burn was ignited using a home-made igniter igniter - a flare and a plastic bottle of diesel fuel.
Figure 1 Oil Being Burned During the Deepwater Horizon Incident within a Fire-resistant Boom
2.3 Weather and Physical Conditions for Burning Weather conditions such as wind speed, gusts, shifts in wind direction, wave height and geometry, and water currents can influence the safety and effectiveness of a burn operation. Strong winds can make it difficult to ignite oil during in-situ burning. Once oil is ignited, high winds can extinguish the fire or make it difficult to control. In general, oil can be successfully ignited and burned safely at wind speeds less than 20 m/s (40 knots).
The effects of air and water temperatures on the ability to ignite and burn oil slicks is not well documented, however, tank tests have shown that air temperatures as low as - 20°C and water temperatures as low as -5°C, did not affect the ability of a slick to burn. Rain might lower the efficiency of the burn due to the cooling effect of the water.
High sea states can make it difficult to contain oil. Waves higher than 1 m can cause the oil to splash over the containment boom or otherwise cause boom failure. High waves can also contribute to the emulsification of oil, which could make it more difficult to ignite.
Tests in ice-covered areas have shown that ice coverage has a minimal effect on the ability of a slick to burn. In fact, ice is typically used as a natural method to contain oil for burning.

Trans Mountain Pipeline (ULC) Trans Mountain Expansion Project Volume 7 Volume 7 - Risk Assessment and Management of Pipeline and Facility Spills Appendix F – 9
Burning can be done safely at night if oil conditions, weather conditions, and sea conditions are well known. Towing booms at night could be safe in open seas with escort. Burning at night would be a relatively safe choice in the case of a thicker, uncontained spill at sea, especially if the spill is offshore and its extent is well known. Some nearshore spills and spills in marshes have been burned at night, which is a relatively safe practice when the concentrations and location of the oil are known and precautions can be taken to ensure that the fire does not spread to surrounding areas.
2.4 Emissions from Burning The prime products of fuel combustion are carbon dioxide and water. All other emissions are by-products. Smoke and emissions are the major concerns for in-situ burning. Basically, the major concern for humans or the environment is the particulate matter in the smoke. Polyaromatic hydrocarbons, or PAHs, are a primary concern in the emissions from burning oil, both in the soot particles and as a gaseous emission. Most of the PAHs in oil are burned except those left in the residue and the soot. The amount of residue varies but is generally less than 10% of the starting oil, and the soot is less than 0.1 to 2%. Another major concern related to the emissions from burning crude oil is with the other possible compounds that might be produced. Further information on emissions appears below.
Extensive measurements of burn emissions were carried out by an international consortium (Fingas 2011). The results of testing on more than 50 burns are summarized here.
Particulate Matter/Soot - All burns produce particulate matter which is the only emission from an oil fire that exceeds recommended human health concern levels close to fires. Concentrations at ground level (1.5 m) can still be above normal health concern levels (35 μg/m3) as close downwind as 500 m from a crude oil fire. The greatest concern is the smaller or respirable particulates. The PM-2.5 fraction (very fine particles) is currently the subject of concern (Fingas 2011). In summary, the smoke from in-situ burns is analogous to forest fires in that the major danger is particulate material. This issue is now understood and safe distances to burns can be predicted.
Polyaromatic Hydrocarbons (PAHs) - Crude oil burns result in polyaromatic hydrocarbons (PAHs) downwind of the fire, but the concentration on the particulate matter, both in the plume and the particulate precipitation at ground level, is often an order-of-magnitude less than the concentration of PAHs in the starting oil. This includes the concentration of multi-ringed PAHs (which are of more health concern) that are often created in other combustion processes such as low-temperature incinerators and diesel engines. There is a slight increase in the concentration of multi-ringed PAHs in the burn residue. When considering the mass balance of the burn, however, most of the PAHs, including the multi-ringed PAHs are destroyed by the fire.
Volatile Organic Compounds (VOCs) - Volatile organic compounds are compounds that have high enough vapour pressures to be gaseous at normal temperatures. When oil is burned, these compounds evaporate and are released. The emission of volatile compounds was measured at several test burns. One-hundred and forty-eight volatile organic compounds have been measured from fires and evaporating slicks (Fingas 2011). The concentrations of VOCs are relatively low in burns compared to an evaporating slick. Concentrations are below human health levels of concern even very close to the fire.
Dioxins and Dibenzofurans - Dioxins and dibenzofurans are highly toxic compounds often produced by burning chlorine-containing organic material. Particulates precipitated downwind and residue produced from several fires have been analyzed for dioxins and dibenzofurans.

Trans Mountain Pipeline (ULC) Trans Mountain Expansion Project Volume 7 Volume 7 - Risk Assessment and Management of Pipeline and Facility Spills Appendix F – 10
These toxic compounds were at background levels, indicating no production by crude oil fires (Fingas 2011, Aurell and Gullett 2010).
Carbonyls - Oil burns produce low amounts of partially-oxidized material, sometimes referred to as carbonyls or by their main constituents, aldehydes (formaldehyde, acetaldehyde, etc.) or ketones (acetone, etc.). Carbonyls from crude oil fires are at very low concentrations and are well below health concern levels even close to the fire.
Carbon Dioxide - Carbon dioxide is the end result of combustion and is found in increased concentrations around a burn. Normal atmospheric levels are about 300 ppm and levels near a burn can be around 500 ppm, this presents no danger to humans.
Carbon Monoxide - Carbon monoxide levels are usually at or below the lowest detection levels of the instruments and thus do not pose any hazard to humans.
Sulphur Dioxide - Sulphur dioxide, per se, is usually not detected at significant levels or sometimes not even at measurable levels in the area of an in-situ oil burn. Sulphuric acid, or sulphur dioxide that has reacted with water, is detected at fires and levels, although not of concern, appears to correspond to the sulphur content of the oil.
Other Compounds - There is a concern when burning crude oil about any ‘hidden’ compounds that might be produced. Soot and residue samples were extracted and ‘totally’ analyzed in various ways in several studies. While the studies were not conclusive, no compounds of the several hundred identified were of serious environmental or health concern. The soot analysis revealed that the bulk of the material was carbon and that all other detectable compounds were present on this carbon matrix in abundances of parts-per-million or less. The most frequent compounds identified were aldehydes, ketones, esters, acetates, and acids, all of which are formed by incomplete oxygenation of the oil. Similar analysis of the residue shows that the same minority compounds are present at about the same levels. The bulk of the residue is unburned oil without some of the volatile components.
2.5 Ignition Igniting the oil on water is a technical matter, the important principles are that ignition must occur very close to the oil surface and that sustained heat is required (ASTM 2007b). Lighting oil fires is often simple. The fires during the Deepwater Horizon spill in the US Gulf of Mexico, were lit using a homemade ignition device consisting of a marine safety flare, a plastic bottle of diesel fuel wrapped with duct tape and floats. The flare burns the bottle of diesel fuel, the diesel fuel pours out, and then is ignited. The diesel fuel burning is sufficient to start the oil burning. This ignition device is illustrated in Figure 2.
More volatile fuels such as lighter crudes can be ignited easier, but require caution because of rapid flame spreading. A variety of ignition devices or methods, both commercial and non-commercial, have been used to ignite oil slicks (ASTM 2007b). In general, an ignition device must meet two basic criteria in order to be effective. It must apply sufficient heat to produce enough oil vapours to ignite the oil and then keep it burning and secondly, it must be safe to use. Safety issues are foremost when operating ignition devices.
A sophisticated device used today for igniting oil slicks is the helitorch igniter. These are helicopter-slung devices that dispense packets of burning, gelled fuel and produce an 800°C flame that lasts up to 6 minutes (Fingas 2011, ASTM 2007b). This type of igniter was designed

Trans Mountain Pipeline (ULC) Trans Mountain Expansion Project Volume 7 Volume 7 - Risk Assessment and Management of Pipeline and Facility Spills Appendix F – 11
for the forestry industry and is used extensively for forest fire management. One such device is illustrated in Figure 3.
As noted earlier, ignition of heavier oils is best carried out using a primer such as diesel fuel or kerosene, and a small wick such as a piece of cardboard or sorbent (Mabile 2012). This enables a start similar to lighting a candle. The flames will then spread to the un-ignited oil nearby. Large-scale heavy oil ignition might be accomplished by applying primer and then using the helitorch to ignite this primer. Use of a gelled fuel igniter was found inadequate to directly ignite heavy fuels without the use of a primer (Fingas 2011).
Notes: The inset shows the igniter used. This consists of a bottle of diesel fuel and a marine safety flare (similar to a road flare) surrounded by styrofoam floats. Such igniters were used to start more than 400 burns during the Gulf oil spill.
Figure 2 A Burn Team Waits for Their Igniter to Start a More Extensive Fire in the Fire-resistant Boom

Trans Mountain Pipeline (ULC) Trans Mountain Expansion Project Volume 7 Volume 7 - Risk Assessment and Management of Pipeline and Facility Spills Appendix F – 12
Notes: Helitorches are made for lighting back- fires in forest fire control and are useful for igniting spilled oil in-situ burns.
Figure 3 A Helitorch in Operation in Forest Fire Control
2.6 Containment Burning oil on water typically requires that the oil be thickened using fire-resistant booms. Oil typically can be easily ignited if it is thicker than about 2 mm and this will burn down to about 1 mm. Containment will also help prevent fire spreading, adding a margin of safety.
The biggest concern with containment booms for in-situ burning is the ability of the boom’s components to withstand heat for long periods of time. A standard has been devised by the American Society for Testing and Materials (ASTM) to test the durability of fire-resistant booms for in-situ burning (ASTM 2007a). The standard is a minimum 5-hour test involving three 1-hour burning periods with two 1-hour cool-down periods between the burning periods. Fire-resistant booms are also tested for strength, integrity, and oil containment capabilities in a tank facility.
The different types of fire-resistant booms are water-cooled booms, stainless steel booms, thermally resistant booms, and ceramic booms. Fire-resistant booms require special handling, especially stainless steel booms, because of their size and weight. Thermally-resistant booms are similar in appearance and handle like conventional booms, but are built of many layers of fire-resistant materials. The fire-resistant boom shown in Figure 1 is a thermally-resistant boom as is the one shown in Figure 4.
Fire-resistant booms manufactured today are generally designed to survive several burns at one site, but are then disposed of or refurbished.

Trans Mountain Pipeline (ULC) Trans Mountain Expansion Project Volume 7 Volume 7 - Risk Assessment and Management of Pipeline and Facility Spills Appendix F – 13
Notes: The reddish oil is heavy oil emulsified with water. This emulsified oil burned after being started by the heat from the burning un-emulsified black oil.
Figure 4 A View of a Fire-resistant Boom with Highly Weathered Oil Burning
2.7 Efficiency Burn efficiency is the initial volume of oil before burning, less the volume remaining as residue, divided by the initial volume of the oil. The amount of soot produced is usually ignored in calculating burn efficiency. Efficiency is largely a function of oil thickness. For example, a slick of 2 mm burning down to 1 mm yields a maximum efficiency of 50%. A pool of oil 20 mm thick burns to approximately 1 mm, yielding an efficiency of about 95%. In a towed boom situation, burn efficiency is higher as the oil layer is concentrated at the rear. Current research has shown that other factors such as oil type and low water content only marginally affect efficiency.
Soot is formed in all fires. The amount of soot produced is not precisely known because of the difficulty of measuring soot from large fires. It is believed that the amount of soot is about 0.01 to 2% for crude and heavy oil fires (Fingas 2011).
2.8 Fuel Type Most fuel types will burn readily - that is why they are ‘fuels’. The following table shows the burn characteristics and rates of the various fuel types.

Trans Mountain Pipeline (ULC) Trans Mountain Expansion Project Volume 7 Volume 7 - Risk Assessment and Management of Pipeline and Facility Spills Appendix F – 14
TABLE 1
BURNING PROPERTIES OF VARIOUS FUELS
2.9 Health, Safety and Monitoring The primary environmental and health concerns related to in-situ burning are the emissions produced by the fire. The measurements of emissions have revealed several facts about the quantity, fate, and behaviour of the basic emissions from burning. Overall, emissions are now understood to the extent that emission levels and safe distances downwind can be calculated for fires of various sizes and types. A typical crude oil burn (500 m2 in area) would not exceed health limits for emissions beyond about 500 m from the fire. People and the environment can be protected by ensuring that the burn is kept the minimum distances away from populated and sensitive areas. In general, depending on weather conditions, in-situ burning would not be carried out within 1 km of heavily populated areas and generally not within 4 km after adding a wide safety margin. Weather conditions to be considered include the presence or absence of an inversion and the wind direction. Procedures for calculating these safe distances have been developed. All burns include field monitoring of particulate and gaseous emissions.
2.10 Consideration of Burning as an Option Burning is often compared to other options such as skimming and dispersants. In some marine spill situations, the best cleanup strategy may involve a combination of mechanical recovery techniques and burning for various portions of a spill. For example, burning can be applied in open water and oil that has already moved closer to shore can be recovered with booms and skimmers. Burning does not preclude the use of other countermeasures on other parts of the slick. When combining different cleanup techniques, the objective should be to find the optimal mix of equipment, personnel, and techniques that results in the least environmental impact of the spill. The selection of burning is advantageous in terms of the large removal rate, as shown in Table 2.
Fuel Burnability Ease of Ignition Flame SpreadBurning Rate*
(mm/min)Sootiness of Flame
Efficiency Range (%)
Diesel Fuel high easy moderate 3.5 very high 90-98Light Crude high easy moderate 3.5 high 85-98Medium Crude moderate easy moderate 3.5 medium 80-95Heavy Crude moderate medium moderate 3 medium 75-90Weathered Crude moderate add primer slow 2.5 to 3 low 60-90Heavy Fuel Oil moderate add primer slow 2 to 3 low 60-90Weathered Dilbit moderate add primer slow 2 to 3 low 60-90Waste Oil very low add primer slow 1 to 2 medium 15-50
* typical rates only --- to get the rate in Litre/m 2 /hour multiply by 60

Trans Mountain Pipeline (ULC) Trans Mountain Expansion Project Volume 7 Volume 7 - Risk Assessment and Management of Pipeline and Facility Spills Appendix F – 15
TABLE 2
APPROXIMATE COMPARISON OF COUNTERMEASURES*
2.11 Scenarios for Burning At Sea
Burning at sea is one situation where in-situ burning can be applied. There are several distinct steps involved in burning oil spills at sea. When an oil spill occurs, the situation is examined and analyzed for possible countermeasures. The type of oil, its thickness, and its state at the time burning could be applied, are reviewed. If burning is possible and of advantage, final planning will then take place. An operational plan is implemented using pre-established scenarios, check lists, and safety procedures. In most cases, containment will be required either because the slick is already too thin to ignite or will be too thin within hours. The decision tree is shown in Figure 5.
Personnel and equipment are then transported to the site. Fire-resistant boom is deployed downwind of the spill and a tow begun. When enough oil collected in the boom, it is ignited. The boom tow is resumed and continued until the fire is extinguished or the tow is stopped for operational reasons. The burning and progress of the tow are monitored by personnel on aircraft and on a larger ship from which an overview of the slick and conditions is possible. The monitoring crew can also direct the boom tow vessels to slick concentrations upwind. During the burn, monitoring normally includes estimating the area of oil burning at specific time intervals so that the total amount burned can be estimated. The amount of residue is similarly estimated. Particulate matter downwind is monitored to record the exposure levels.
The burn could be stopped in an emergency by releasing one end of the boom tow or by speeding up the tow so that oil is submerged under the water. If the burning stops because there is not enough oil in the boom, the tow can be resumed going downwind and then turning around into the wind before reigniting. After the burn operation is finished, for the day or for the single burn, the burn residue should be removed from the boom. As the burn residue is very viscous, a heavy-oil skimmer may be required if there is a large amount of material. A small amount of residue can be removed by hand using shovels or sorbents.
pp p Light crude Heavy Crude Bunker C/Weathered DilbitPresumed Effectiveness
Hours to clean
tons/ hour
Presumed Effectiveness
Hours to clean
tons/ hour
Presumed Effectiveness
Hours to clean
tons/ hour
Brush Drum Skimmer 80 7.5 8 85 10 6 90 12 6Large Weir Skimmer 80 1.5 40 85 3 20 90 3 20Large Brush Skimmer 80 0.5 120 85 0.7 90 90 0.8 85Dispersants 20 0.2 75 13 0.2 40 3 0.2 10In-situ Burning 95 0.2 360 95 0.3 240 95 0.3 240*there are many assumptions in the table including capacities of two average skimmers, dispersant effectiveness, but the burn rate is actual. This comparison is for a 150 m boom filled over time with 75 tons of oil and removed at the operating rates

Trans Mountain Pipeline (ULC) Trans Mountain Expansion Project Volume 7 Volume 7 - Risk Assessment and Management of Pipeline and Facility Spills Appendix F – 16
Figure 5 Decision Flowchart for In-situ Burning

Trans Mountain Pipeline (ULC) Trans Mountain Expansion Project Volume 7 Volume 7 - Risk Assessment and Management of Pipeline and Facility Spills Appendix F – 17
On Rivers
On rivers the situation is similar to at sea, however, one end of the boom and burn may be on the shore. On rivers the currents may exceed 0.5 m/s or 1 knot and thus booms are often used in the deflection mode. The boom is then deployed at various angles to the current so that the critical velocity (0.5 m/s) is not exceeded. The oil can then be deflected to areas where it can be burned. If strong currents prevent the optimal positioning of the boom in relation to the current, several booms can be deployed in a cascading pattern to progressively move oil toward one side of the watercourse. This technique is effective in wide rivers or where strong currents may cause a single boom to fail. When booms are used for deflection, the forces of the current on the boom are usually so powerful that stronger booms are required and they must be anchored along their entire length. Burning at the site of the area of deflection may be carried out without a fire-resistant boom if there is no contact with combustible material. Several successful burns have been carried out on rivers (Fingas 2011).
On Land
Burning on land is a much older and much more used technique than oil in-situ burning on water (Fingas 2011). Many of the same considerations in this overall burning section apply to land as might apply to burning on water. There are several important differences to consider, however. First, the ease of ignition and minimum burning thickness may not apply if there is combustible material such as dried grass available. Burning in cases where there is dried vegetative material or wood in the target area, is simply a matter of igniting that material. Both the dried vegetative material and oil will burn, depending on the circumstances. It should be borne in mind that burning is often used on land to remove combustible material as a fire prevention method as well as to control certain plant species. The effects on land are a largely a function of how much heat is transferred into the soil which, in turn, is a function of how quickly the fire passes over and soil moisture content.
With Ice
Many test burns have been conducted on or among ice floes. The ice serves as a natural barrier to the spreading of the oil. Much of the early burn work was carried out as a countermeasure for oil in ice (Fingas 2011). There are many research papers on this, many of these from 1974 to 1986 (Fingas 2011).
In Marshes
Several marsh burns have been conducted around the world, including recent well- documented burns in Louisiana and Texas, one of which is shown in Figure 6 (Baustian et al. 2010, ASTM 2010). These burns were largely successful and provided important information on protecting the marsh plants and the best time of year to burn. The roots of marsh plants, which also house the propagation portion of the plants, are sensitive to heat. If burning is conducted at a dry time of year, such as in late summer, these roots could be damaged.
Flooding is a useful technique for flushing oil out of a marsh while protecting the roots of marsh plants. This can sometimes be accomplished by putting a berm across the drainage ditches or by pumping water into the high areas of the marsh. Care must be taken to use flood water of similar salinity to that normally in the marsh and to restore the natural drainage in the marsh after the flood. Often marshes cannot be flooded, however, and thus burning could be conducted when the marsh is wet, such as in spring. If a marsh cannot be burned within about one month of oiling, there is usually no benefit to burning because the oil will already have penetrated and severely damaged the plant life.

Trans Mountain Pipeline (ULC) Trans Mountain Expansion Project Volume 7 Volume 7 - Risk Assessment and Management of Pipeline and Facility Spills Appendix F – 18
When burning in marshes, care must be taken to prevent damage to shrubs and trees that grow in the back and higher areas of the marsh. A firebreak must be available to prevent the fire from spreading outside the marsh and to ensure that wind will not drive the fire into nearby forested areas.
Source: Photograph from the US National Oceanic and Atmospheric Administration. Notes: The marsh was extensively oiled as a result of a hurricane causing damage to oil
facilities. This burn was successful and the marsh largely regenerated by the next season.
Figure 6 A View of a Salt Marsh Burn in Louisiana
2.12 The Plans Trans Mountain proposes the use of in-situ burning as one means to respond to oil spills. Burning will be developed in emergency response plans as a technique for responding to spills. Specific and detailed plans for the burns will be created in line with the discussion above. Consultations with government officials will be held to seek approval of these plans and areas in which burns can be conducted and under what conditions. Equipment will be put into place. Training sessions will be carried out to ensure that crews are in readiness.
3.0 REFERENCES Alaska Regional Response Team. Oil Dispersant Guidelines. Website:
http://alaskarrt.org/Default.aspx. Accessed: October 2013.
The International Tanker Owners Pollution Federation Limited. Website: http://www.itopf.com/. Accessed: October 2013.
American Society for Testing and Materials. 2008. ASTM F1788 - 08, Standard Guide for In-Situ Burning of Oil Spills on Water: Environmental and Operational Considerations.

Trans Mountain Pipeline (ULC) Trans Mountain Expansion Project Volume 7 Volume 7 - Risk Assessment and Management of Pipeline and Facility Spills Appendix F – 19
American Society for Testing and Materials. 2010. ASTM F2823 - 10, Standard Guide for In-Situ Burning of Oil Spills in Marshes.
American Society for Testing and Materials. 2007. ASTM F1990 - 07(2013), Standard Guide for In-Situ Burning of Spilled Oil: Ignition Devices.
American Society for Testing and Materials. 2007. ASTM F2152 - 07(2013), Standard Guide for In-Situ Burning of Spilled Oil: Fire-Resistant Boom.
American Society for Testing and Materials. 2008. ASTM F2230 – 08, Standard Guide for In-situ Burning of Oil Spills on Water: Ice Conditions.
Aurell, J. and B.K. Gullett. 2010. Aerostat sampling of PCDD/PCDF emissions from the gulf oil spill in situ burns. Environmental Science and Technology 44(24):9431-9437.
Baustian, J., I. Mendelssohn, Q. Lin and J. Rapp. 2010. In situ burning restores the ecological function and structure of an oil-impacted coastal marsh. Environmental Management 46(5):781-789.
Fingas, M. 2011. Oil Spill Science and Technology, Prevention, Response, and Cleanup. Chapter 23. Gulf Professional Publishing. ISBN: 978-1-85617-943-0.pp. 737-903.
Mabile, N. 2012. Controlled In-Situ Burning: Transition from Alternative Technology to Conventional Spill Response Option. Environmental Contamination and Response Technical Seminar; 35th, Environmental Contamination and Response. 22 pp.

Trans Mountain Pipeline (ULC) Trans Mountain Expansion Project Volume 7 Volume 7 – Risk Assessment and Management of Pipeline and Facility Spills Appendix G – 1
Appendix G Potential Cleanup and Damage Costs of a Hypothetical Oil Spill: Assessment of Trans Mountain Expansion Project

LEGAL_CAL:11151877.1
POTENTIAL CLEANUP & DAMAGE COSTS OF A HYPOTHETICAL OIL SPILL:
ASSESSMENT OF TRANS MOUNTAIN EXPANSION PROJECT
Prepared for:
Trans Mountain Pipeline ULC (Trans Mountain) 300 5th Avenue SW, Suite 2700 Calgary, AB T2P 5J2
Prepared by:
H Jack Ruitenbeek, PhD HJ RUITENBEEK RESOURCE CONSULTING LIMITED 875 Buttercup Road Gabriola, BC V0R 1X5
December 2013

TMEP Cleanup & Damage Cost Assessment: HJ Ruitenbeek, December 2013 (CONFIDENTIAL: draft 3/12) Page ii LEGAL_CAL:11151877.1
Table of Contents
Acronyms ................................................................................................................................................ iii
Section 1 – Background ....................................................................................................................... 1 Project Overview ........................................................................................................................................... 1 Purpose and Scope of Report ....................................................................................................................... 1 Outline of Report .......................................................................................................................................... 3
Section 2 – Concepts ............................................................................................................................. 4 Responsibility and Financial Liability ............................................................................................................ 4 Role of Financial Assurance Mechanisms ..................................................................................................... 5 Role of Insurance .......................................................................................................................................... 5
Section 3 – Methodologies and Information Sources ............................................................... 8 Methodologies .............................................................................................................................................. 8 Information Sources and Selected Cost Data ............................................................................................... 9 Summary of Spill Cost Assumptions............................................................................................................ 13
Section 4 – Analysis and Results .................................................................................................... 14 Hazards and Spill Sizes ................................................................................................................................ 14 Scenario Results – Pipeline Spill .................................................................................................................. 15 Scenario Results – Westridge Marine Terminal Spill .................................................................................. 16
Section 5 – Conclusion ....................................................................................................................... 18
Annexes .................................................................................................................................................. 20
Annex A – Federal, Alberta and BC Regulations ....................................................................... 21 Federal Legislation ...................................................................................................................................... 21 Provincial Legislation (Alberta) ................................................................................................................... 21 Provincial Legislation (British Columbia) ..................................................................................................... 22
Annex B – Land-based Spill Costs and Scenario Results ........................................................ 23

TMEP Cleanup & Damage Cost Assessment: HJ Ruitenbeek, December 2013 (CONFIDENTIAL: draft 3/12) Page iii LEGAL_CAL:11151877.1
Acronyms BC British Columbia CERCLA Comprehensive Environmental Response, Compensation, and Liability Act [US] CPCN Certificate of Public Convenience and Necessity DRAS Dynamic Risk Assessment Systems EGS Ecosystem Goods and Services EMA Environmental Management Act [BC] EPEA Environmental Protection and Enhancement Act [Alberta] HCA High Consequence Area IMO International Maritime Organization IOPC International Oil Pollution Compensation (Funds) ITOPF International Tanker Owners Pollution Federation KMC Kinder Morgan Canada Inc. NEB National Energy Board NRDA Natural Resource Damage Assessment OPA Oil Pollution Act [US 1990] PHMSA Pipeline and Hazardous Materials Safety Administration [US Department of
Transportation] ROW Right of Way SOPF Ship source Oil Pollution Fund [Canada] TMEP Trans Mountain Expansion Project TMPL Trans Mountain pipeline [system] US United States USEPA United States Environmental Protection Agency WCMRC Western Canada Marine Response Corporation YVR Vancouver International Airport

TMEP Cleanup & Damage Cost Assessment: HJ Ruitenbeek, December 2013 (CONFIDENTIAL: draft 3/12) Page 1 LEGAL_CAL:11151877.1
Section 1 – Background
Project Overview
Purpose and Scope of Report
The purpose of this report is to provide an assessment of potential spill costs associated with a variety of hypothetical spills arising from the future operation of the Project.
The assessment is undertaken to provide insights into a number of issues, including:
· The potential costs of spills over the lifetime of the project.
· Whether financial assurance mechanisms for financial redress to cover those potential costs are adequate given the scale and availability of such mechanisms; future mechanisms include a wide variety of potential sources, including TMEP resources, insurance, industry resources, national funding sources, and (for tanker source spills) international sources.
· The availability and desirability of using insurance as an assurance mechanism.
The scope of the assessment focuses on hypothetical spills of heavy oil (including diluted bitumen and products with similar properties) over the operating life of the Project. More specifically, it reflects inclusion of the following:
· Defined hazards on the pipeline segments of the Project. The hazards consist of those being considered in independent technical risk analyses, and include primarily the following: manufacturing defects, construction defects, incorrect operations, third party damages, and geohazards. Hazards associated with hypothetical leaks from equipment failure at pumping stations are excluded from the analysis, as any such leaks are assumed to be contained on TMEP property. The risk of external and internal corrosion related failures are regarded as negligible for this Project and are also not treated here.
· Terminal operations. Quantitative technical risk analyses of operations at the Westridge Marine Terminal form the basis for estimating the costs associated with a specific hypothetical spill arising from tanker loading. The report also outlines relevant financial assurances in place to cover such a hypothetical situation.
· Hypothetical spills. These spills commence on the pipeline ROW and spread outside of this easement, potentially having impacts on public resources in terrestrial, freshwater, and coastal marine environments.
· Attributable costs. These include both direct cleanup costs and natural resource damage (or “environmental”) costs, which are directly attributable to the spill.

TMEP Cleanup & Damage Cost Assessment: HJ Ruitenbeek, December 2013 (CONFIDENTIAL: draft 3/12) Page 2 LEGAL_CAL:11151877.1
· Estimates based on best available information and methodologies. To inform the assessment of potential spill costs, the estimates reflect conservative but credible assumptions. Information draws upon Project specific design parameters, as well as global spill experience.
· Impacts. Impacts are assessed only to the extent that they are directly attributable to the spill and that they occur on land within BC or Alberta, or in Canadian waters. The assessment focuses on spill costs incurred by Canadians, which include those having rights and obligations under Canadian laws if they are residents, businesses or organizations within these areas. All potentially affected parties are treated equally when considering economic costs or losses. No differential distributional weighting is applied to any specific group, age cohort, gender, social characteristic or location.
The report acknowledges the following issues relating to potential spill costs, but these issues do not form the focus of this assessment. They are included to shed light on certain factors that are relevant to the potential costs and financial assurances associated with hypothetical land based spills from the Project.
· Tanker operations in Canadian Waters. No numerical assessment is undertaken of costs associated with any specific hypothetical tanker spill, but the report does reference relevant financial assurances in place to cover such a situation. These assurances are associated with tanker operations and are not within the legal responsibility of the TMEP.
· Passive use values. Passive use values are explicitly excluded from the cost estimates. These represent a category of values associated with ecosystem goods and services (EGS) that are experienced by some parts of the population even though they do not directly use the EGS. Loss of such values is not explicitly separated and compensated in any jurisdiction; methodological issues do not permit their credible measurement and attribution.
It is not possible to predict the financial cost of any single spill, as it generally will depend on a range of biophysical factors, which themselves exhibit normal natural variations through time and space. Location, season, weather, product spilled, site access, mitigation methods applied after a spill, and remediation endpoints all play a role in determining the eventual cost of a spill. The approach taken in any such assessment therefore relies on using best available existing information and then on applying such information to a given hypothetical scenario. It must be stressed that spills remain low probability events. Spills are to be avoided, and regulators, operators, and users of pipeline infrastructure correctly seek to achieve a safe operation with zero spills. If a spill occurs, analysis of the circumstances informs future operations thus helping to approach the zero spill target. Experience thus draws from a wide array of rare events, and applies statistical methods coupled with informed judgment over what is relevant in various situations. In risk assessments of this nature, it is conventional to undertake the analyses in a manner that errs on the side of caution; where a range of possible outcomes might occur, risk analyses will typically choose a plausible hypothetical situation near the means and conduct a sensitivity analysis relating to a credible worst case scenario. It is always possible to describe a situation that looks worse than whatever formal scenario might be analyzed; any such thought experiments in themselves may serve a purpose for contingency planning or for establishing

TMEP Cleanup & Damage Cost Assessment: HJ Ruitenbeek, December 2013 (CONFIDENTIAL: draft 3/12) Page 3 LEGAL_CAL:11151877.1
additional mitigation measures. But implausible extreme scenarios represent outcomes and likelihoods that are more severe and less likely than situations that we face in our daily lives as individuals and societies.
This assessment does not seek to determine what is acceptable risk from either an individual or social perspective. It does, however, seek to elaborate the potential financial implications of rare events associated with pipeline spills so as to permit improved risk communication, informed discussion, and – ultimately – better decision-making. While we all may be aware of a worst possible outcome, or a best possible outcome, we do not make our decisions solely on the extremes.
The jurisdiction and regulatory regime in which a spill occurs also has a bearing on cleanup costs. This assessment addresses impacts in Canada. A common instinct is to assume that Canadian costs would be comparable to those in our immediate neighbor: the United States (US). But this assumption would be flawed. Experience with both terrestrial and marine spills shows that the US has among the highest per unit spill costs in the world. Studies undertaken by Etkin on historical spills through the 1980s and 1990s showed that average cleanup costs per tonne spilled in the US were an order of magnitude greater than those in Canada; Canadian spill costs were also systematically lower than those in Europe and East Asia. 1 Similar experience exists with insurance claims internationally. Etkin attributes the higher costs in the US to a number of institutional factors and opines that the higher costs “can be attributed to a large extent on the response requirements stipulated by the Oil Pollution Act of 1990 (OPA 90).”
Outline of Report
This report is organized in five sections as follows. This Section 1 provides general background information on the Project and on the scope and purpose of this report. Section 2 introduces and discusses a number of concepts relating to financial responsibility, financial assurances, and commercial insurance for land-based spills; it also provides a brief treatment of marine terminal spills within these contexts. Section 3 provides general background to the methodologies and information sources used for this assessment. Section 4 provides the results of the analyses, working first through the various hazards considered, spill sizes and scenarios; implications for spill cost assessment of a hypothetical spill associated with the Westridge Marine Terminal operations are also included within these analyses. Section 5 concludes with a summary of the main findings.
Annex A summarizes key aspects of the regulatory basis for pipeline spill prevention and remediation in Canada. Annex B provides supplementary information tables that accompany the analytical assumptions and results in the report.
1 For example, over the period 1974-99 the ratio of US:Canada unit costs for spills was about 12:1 including the Exxon Valdez spill and 4:1 excluding it; unit costs for spills in Canada were 72% those in Europe and 40% those in East Asia. Etkin DS (1999). Estimating Cleanup Costs for Oil Spills. Oil Spill Intelligence Report, International Oil Spill Conference Paper #168.

TMEP Cleanup & Damage Cost Assessment: HJ Ruitenbeek, December 2013 (CONFIDENTIAL: draft 3/12) Page 4 LEGAL_CAL:11151877.1
Section 2 – Concepts This Section introduces and discusses a number of concepts relating to financial responsibility, financial assurances, and commercial insurance for land-based spills; it also provides a brief treatment of marine spills within these contexts. Marine spills are relevant to the analysis of land-based spill costs for a number of reasons: land-based spills can impact coastal estuaries, coastlines, and the near shore marine environment; information relating to damage and cleanup costs for ship-source marine spills provides further data that can be used in estimating the costs in high consequence areas such as estuaries or coastal reaches; and, emergencies arising from terminal operations involving tanker loading can potentially jointly trigger provisions in both the tanker insurance and the pipeline terminal insurance.
Responsibility and Financial Liability
Canadian legislation (see Annex A for summary) details who is responsible for pipeline spills and what the extent is of associated financial liabilities. Pursuant to section 75 of the NEB Act, pipeline companies must pay compensation for all damage sustained by them as a result of the operation of a pipeline. There are no limits placed on liability for the prevention, remediation and cleanup of oil spills. Nor is there any limitation placed on liability for damages to persons, property and the environment. Provincial legislation has comparable provisions.
Industry practice for addressing financial responsibility and compensation is governed by the general law of insurance and an operator’s obligations to its insurers regarding the reporting, investigation and adjustment of compensation claims. However, practices for addressing financial responsibility and compensation are also subject to a process for assessing and compensating damages claimed pursuant to the NEB Act. Section 90 of the NEB Act establishes a process for arbitration proceedings and the appointment of a federal arbitration tribunal to settle any disputes regarding damages claims.
The clarity of responsibility and liability under law can have direct impacts on the eventual spill costs themselves. In Canada, as noted above, there is little ambiguity regarding pipeline spills, and mechanisms for financial redress are well established. Similar clarity is provided regarding ship-source spills; in Canada and internationally these remain the responsibility of tanker operators and owners, and compensation schemes are governed by international laws relating to insurance requirements of such operators and owners, complemented by guaranty funds such as the International Oil Pollution Compensation Fund (IOPCF) and the Canada Ship-source Oil Pollution Fund (SOPF) (see Volume 8A). Spills at a terminal are also subject to ship-source pollution provisions if the spill originates from the ship, and are the responsibility of the terminal operator if they occur outright from the terminal in the absence of any loading activities; where ambiguity arises, co-insurance provisions associated with the terminal operating provisions govern the recovery of costs. In all instances, emergency response efforts led by TMEP focus first on containing the spill and its physical and financial impacts within clearly pre-determined command structures and protocols.
Different countries have different means of determining spill liability; these can have a bearing on eventual spill costs. As noted in Section 1, spill costs in the US, all other things equal, have historically been significantly higher than those in other jurisdictions. Care must therefore be taken in simply extrapolating the numbers from US spill experience to hypothetical spills in

TMEP Cleanup & Damage Cost Assessment: HJ Ruitenbeek, December 2013 (CONFIDENTIAL: draft 3/12) Page 5 LEGAL_CAL:11151877.1
Canada; at best they serve as a benchmark for establishing a very conservative upper bound to hypothetical spill costs in Canada. We will revisit this later in subsequent Sections when showing the derivation of specific assumptions relating to spill costs for given hypothetical scenarios.
Role of Financial Assurance Mechanisms
It is industry practice to use a mix of financial assurance mechanisms, which are essentially a combination of self-insurance (based on company assets, income, and access to financing) and operational insurance (obtained through commercial markets). This mix typically depends, inter alia, upon internal and external assessments of risks, means for spreading these risks among shareholders and shippers, an operator’s financial position, and provisions in the Tariff and shipping agreements that regulate or stipulate what portion of tolls remain payable in event of a shutdown and on how costs can be recovered through tariff structures.
Trans Mountain Pipeline ULC, for example, currently maintains a General Liability insurance program with an annual limit totaling US$750 million; coverage for pollution legal liability is included within this program. The first $2 million is covered by self insurance or through insurance of the shippers per flow through treatment as described in the NEB Approval (TO-001-2013) of the Application to Approve Incentive Toll Settlement for the Year 2013-15. But regardless of whether insurance covers losses or liabilities, operators are required under regulatory provisions to make good any damages caused. Losses and claims in excess of insurance coverage could be covered by cash from operations, the issuance of debt, commercial paper and/or credit facility draws, expected future access to capital markets, or the sale of assets. Upon commissioning of the Project, Trans Mountain structure is projected at $6.4 billion in assets with approximately $3.2 billion in equity.
It is generally acknowledged that, in the event of a spill, it is important to return to operations as soon as practically and safely possible. Service is therefore generally restored, with concurrence of regulators, after appropriate inspections, mitigation measures, repairs, and tests have been completed. Restoration of service is frequently measured in days or weeks rather than months or years.
Role of Insurance
Commercially available operational insurance is accepted as one method for assuring that any costs associated with a spill can be covered. Companies in the liquids transport industry rely on insurance for many construction and operational needs. Construction phase insurance may typically include Builder’s All Risk/Course of Construction Insurance against risks of direct physical loss or direct physical damage to project works, and Construction Wrap Up Liability Insurance Program responding to legal liability for third party property damage and injuries arising from construction activities. For operational phases of projects, operators routinely hold a Property and Business Interruption Insurance Program, responding to physical loss or damage to key facilities and pipeline at major water crossings, including loss or earnings while shut down; this provides a guaranty of continuous income subject to policy terms and conditions. Also, General Liability Insurance policies consist of primary and excess liabilities that respond to legal liability for third party property damage and injuries resulting from operations, including pollution legal liability. Finally, Aircraft, Aviation and Automobile Liability insurance is normally

TMEP Cleanup & Damage Cost Assessment: HJ Ruitenbeek, December 2013 (CONFIDENTIAL: draft 3/12) Page 6 LEGAL_CAL:11151877.1
held through the course of operations requiring vehicle and aircraft use in connection with operations. Marine terminal operations also carry a number of associated insurance plans, including Marine Terminal Operators Liability insurance, Wharfinger’s Liability insurance, and Stevedor’s Liability insurance.
It is important to note, however, that insurance is itself a risk sharing mechanism that follows traditional concepts associated with economic efficiency, as follows:
· Risk transfer. Insurance provides an opportunity for transferring certain downside risks to third parties, thereby protecting the financial viability of an operation. This is effective in circumstances where uncertain hazards could result in large liabilities that exceed the financial resources of a single company.
· Risk pooling. Insurance provides an opportunity for pooling risks of different operations if the hazards are rare and if risks across the insurable parties are uncorrelated (i.e., if there is no reason to believe that everybody will be struck by the same hazards at the same time).
· No additional hazard. Insurance is effective if the act of insuring something does not increase the riskiness of the activity. If risks are higher in the presence of insurance, this is a situation of “moral hazard”; moral hazard may arise, for example, if operators feel that there is less need to be vigilant about operations because they have a limited downside. Moral hazard within the insurance industry can be managed through specifying deductibles (implying that operators still retain a financial interest) or through specifying maximum coverage limits (as is done with General Liability Limits and with mechanisms such as the SOPF and the IOPC Funds.) In Canada, to date, there is no reason to believe that moral hazard is an issue: operators continue to have the full responsibility of meeting any costs associated with accidents or unsafe operations.
In the Canadian context, spill insurance is not regulated but a number of models of the above have emerged. Companies routinely have coverage, which includes pollution legal liability, across their entire operations as part of their normal business planning to transfer risks to commercial insurers. Risk pooling was instrumental in establishing Canada’s world class system of funds to address ship-source pollution: the initial Maritime Pollution Claims Fund was established in 1973 and was capitalized through a levy collected from 1972-1976 on oil imported into or shipped from a place in Canada.2 The money was subsequently transferred to the SOPF in 1989: the Fund has operated successfully through paying for cleanup costs by self-generated income and recovering costs from other mechanisms such as the IOPC Funds. The pooled risk model provides funding that effectively complements resources available through
2 A full treatment of the different tiers of insurance available for vessel operations is provided in Volume 8A of the Project Application. These collectively provide assurances of about $1.3 billion. The maximum liability of the Canada SOPF during the fiscal year commencing April 1, 2013 is $161,293,660 for all claims from one oil spill; it increases annually through indexing. The Minister of Transport has the statutory power to impose a levy of 48.37 cents per metric ton of oil, as defined in the Act, imported by ship into or shipped from a place in Canada in bulk as cargo. The levy is indexed to the consumer price index annually. No levy has been imposed since 1976. As at March 31, 2013, the accumulated surplus in the SOPF was $398,906,816. (SOPF: The Administrator’s Annual Report 2012-2013.)

TMEP Cleanup & Damage Cost Assessment: HJ Ruitenbeek, December 2013 (CONFIDENTIAL: draft 3/12) Page 7 LEGAL_CAL:11151877.1
international conventions. International conventions apply only to spills of persistent oil from sea-going tankers. The SOPF is unique in that it not only covers sea-going tankers, but it is intended to pay claims regarding oil spills from all classes of ship such as general cargo vessels, cruise ships, ferries and other non-tankers. The SOPF covers both persistent and non-persistent oil spills. In addition, the SOPF applies to “ghost” spills, where the identity of the ship that caused the discharge cannot be established. A widely defined class of persons in the Canadian fishing industry may also claim for loss of income caused by an oil spill from a ship.

TMEP Cleanup & Damage Cost Assessment: HJ Ruitenbeek, December 2013 (CONFIDENTIAL: draft 3/12) Page 8 LEGAL_CAL:11151877.1
Section 3 – Methodologies and Information Sources This Section provides general background to the methodologies and information sources used for this assessment.
Methodologies
The general approach to the spill cost assessment is to rely upon estimated unit costs (expressed in dollars per barrel or $/bbl), distinguishing between: (i) direct “cleanup” costs; and, (ii) “damage” costs associated with secondary environmental and social costs to third parties. This approach follows the convention of much of the literature, and provides a basis for extrapolating historical information to hypothetical situations. The derivation of this summary metric can be much more complicated. It is shorthand for a rather complex series of events and circumstances, many of which may be highly uncertain.
Unit costs are then applied to potential spill volumes (outflows) at different sites. For modeling purposes, we distinguish between: (i) high consequence areas (HCAs) exhibiting particularly sensitive conditions along the pipeline ROW; and, (ii) other areas (non-HCA). For outflows we refer to “leaks” as smaller outflows; “ruptures” refer to loss of containment that might cause full or partial loss of oil between upstream and downstream isolation valves, depending on elevation profile and hydraulic conditions. Loss of containment does not arise from all hazards.
The methodology does not require specific assessments using primary data relating to resource values, businesses, or individual livelihoods at every area potentially impacted by a spill. Such a detailed assessment is beyond the scope of this exercise for a number of reasons. First, the life of the project is such that it is impossible to predict what resource values, businesses, or third party interests may be impacted at any future date or location. Second, the risk analysis is for the entire length of pipeline and its associated operations; the probabilistic nature of this analysis is such that financial consequences are assessed for the pipeline length as a whole rather than for any specific site. The probability of a given site being impacted (taken for example as a 1 km segment) is typically expressed in terms of a few chances in a million in any given year.3 Cumulatively these can add up, but rather than addressing the few chances in a million for a specific site and time the analysis addresses the length of the pipeline and the duration of its operation; it then relies on estimates of impacts in average or high consequence areas, as the case may be. Third, risk analyses themselves inform risk management actions. For example, if some HCAs are more likely to face higher hazards then it is normal to put greater mitigation measures in place for those sites so that losses are further limited. The approach used here thus considers likely costs or losses, but (as noted previously) employs conservative assumptions that would tend to overestimate such costs.
For improved risk communication, the conclusions also presents some spill cost results in the context of event probability. Such an event probability is usually expressed as its frequency of occurrence in a single year, or the “return period” of the event expressed as the inverse of its
3 A preliminary analysis of frequencies is provided in Volume 7 as well as discussion in TMEP Threat Assessment, Dynamic Risk Assessment Systems (DRAS) 2013. For example, initial runs of the third party damage model based on preliminary routes and hydraulics indicate that the average value for the frequency of this threat over the pipeline is in the order of 5.1x10⁻⁶ failures/km-yr.

TMEP Cleanup & Damage Cost Assessment: HJ Ruitenbeek, December 2013 (CONFIDENTIAL: draft 3/12) Page 9 LEGAL_CAL:11151877.1
frequency of occurrence in a single year. Spill risk event probabilities are always less than unity.
Spill risks referenced in this assessment rely on work conducted by DRAS presented in Volume 7.
To summarize, an oil spill is thus an event with an associated probability of occurrence. Large spills may be rare but have impacts with high total costs. Small spills may be more frequent but have impacts with lower total costs. The literature on oil spill costs typically separates two elements, which can be added: (i) cleanup costs; and, (ii) damage costs. The total cost, is the sum of these two items:
Total Conditional Cost = Total Conditional Cleanup Cost + Total Conditional Damage Cost
The term “conditional” in the above is usually implicit and it is included here just as a reminder that it can be understood to mean: “assuming a spill occurs”.
Again, it is stressed that more generally the costs per barrel can vary according to many factors. Indeed, spill costs and damages tend to exhibit economies of scale such that larger spills have lower unit cleanup cost and damage costs.
It should be noted also that the “dual” approach of separating spill cleanup costs from damage costs is itself at times problematic and prone to double counting if they are added together. It is not unusual for documented cleanup costs to include some immediate and direct compensation for third party social, environmental, or resource damages.4 These latter costs should normally be included as part of the overall damage costs rather than the direct cleanup costs. But, again, institutional or operational factors often consider any costs that are incurred early in the process to be part of cleanup rather than damages. Indeed, in the State of Washington for persistent oils, costs incurred for damage remediation in the first 48 hours after a spill event are eligible for credit against any eventual damage assessment; these costs thus tend to be counted as part of the immediate cleanup efforts instead of as damage remediation. The approach taken to such situations in this assessment is to acknowledge that some double counting may occur and to describe the total cost as likely being an over-estimate because of these circumstances.
Information Sources and Selected Cost Data
The analyses undertaken in this assessment do not rely on a single source, but are informed by a number of sources that are relevant to this Project. Because spills are a relatively rare phenomenon, this approach permits the use of a broader range of information. The sources summarized below refer both to terrestrial and to marine spill costs. Although this assessment concerns itself with pipeline spills, the hypothetical spill modeling considers circumstances when they impact a coastal or estuarine environment. Databases such as those maintained by the IOPC Funds – which relate to costs associated with tanker spills into the marine environment – also therefore have relevance to pipeline spills that may make their way to a marine or brackish water environment. Similarly, spill cost experience in coastal and terrestrial environments in Washington State serves to inform potential damage costs, although it is again acknowledged that unit costs derived from US experience are likely to result in overestimates of any costs incurred in Canada. 4 See: (i) Etkin DS. 2004. Modeling Oil Spill Response and Damage Costs. USEPA; (ii) Kontovas CA, Psaraftis HN, Ventikos NP. 2010. An empirical analysis of IOPCF oil spill cost data. Marine Pollution Bulletin 60(9):1455-1466.

TMEP Cleanup & Damage Cost Assessment: HJ Ruitenbeek, December 2013 (CONFIDENTIAL: draft 3/12) Page 10 LEGAL_CAL:11151877.1
Unless otherwise noted, all financial figures are expressed in 2013 terms; these were derived using standard publicly available exchange rates, price deflators, and GDP deflators as relevant. For the convenience of presentation, figures are routinely rounded.
Terrestrial Spill Cleanup Costs In various publications, Etkin has provided a wealth of costing information relating to oilspill cleanup and damage costs in North America.5 Her methods underline that actual spill costs depend on numerous factors, but her assessments of spill cost data from decades of samples have shown that most of the variation in unit spill costs can be explained by spill volume, oil type, proximity to water, dispersion along shorelines, location remoteness, and cleanup methods.
As noted previously, the Etkin data contains US spill costs that are considerably higher than what is typical for Canada. Consequently, the use of these costs as the initial benchmark for future hypothetical terrestrial spill cleanup costs in Canada results in a conservative estimate that is appropriate for informing potential financial exposure.
All other things equal, unit spill costs are higher for heavy oils, for impacts on water, for remote locations, and for manual cleanup techniques; also economy of scale in cleanup are realized such that larger spills tend to have lower unit cleanup costs. Annex B summarizes the resultant ranges from combining assumptions, and the algorithm provides a transparent means for estimating costs. It indicates that for reference conditions (representing light oils, inexpensive mechanical cleanup, no impacts on water or shorelines, and readily accessible spill sites), the cost range is from $553/bbl to $7,372/bbl, with the highest costs associated with small spills (<240 bbl) and the lowest unit costs associated with larger spills (>12,000 bbl). For heavy oils spilled at remote sites impacting waterways and 100 km of shorelines or estuaries, these costs would increase by a factor of 3.38: the adjusted value for a larger spill would be $1,869/bbl. If this larger spill also required manual cleanup the expected cost would further increase by a factor of 1.89: a larger spill of heavy oil under remote conditions, impacting water and shorelines requiring manual cleanup would thus cost $3,532/bbl for cleanup. In considering assessments of third party damages, Etkin concentrated on those spills impacting navigable waters from 1980-2002 and found that on average the damages added another 187% to cleanup costs, with a range of 169% to 227% depending on the sampling period within the spill history polled. These ratios, as we see below, are among the highest encountered in the literature.
Insights from this analysis are also seen in other experience. Apart from making sense intuitively in terms of what contributes to higher or lower cleanup costs, they also underline that spills requiring some manual cleanup in a riparian or marine environment will be among the most costly to address. This also permits us to rely on cost and damage information from various marine and estuarine studies to inform cleanup costs.
Marine and Coastal Cleanup Costs – IOPC Funds The IOPC Funds maintain information relating to all spill claims from tanker operations occurring in States that are signatory to the various conventions. Canada is a signatory; the US is not a signatory. Spill costs in this database thus exclude spills that occurred in a US jurisdiction. They also thus avoid some of the estimating biases that may rely on using US information. A comprehensive analysis of the spill information of the IOPC Fund information was undertaken
5 Etkin (1999, 2004), op. cit.

TMEP Cleanup & Damage Cost Assessment: HJ Ruitenbeek, December 2013 (CONFIDENTIAL: draft 3/12) Page 11 LEGAL_CAL:11151877.1
by Kontovas et al. (2010). The analyses provide information on both cleanup and total costs, with the difference attributable to environmental damage costs that were eligible under international conventions. A notable result is that the regression analyses over the period 1979–2006 again replicated the common result that smaller spills were more expensive to cleanup on a unit basis than were larger spills. A spill of 240 bbl (equivalent to about 38 m3) into a marine or coastal environment has an expected cleanup cost of $1,950/bbl and a total cost including damages of $3,030/bbl. 6 For a larger spill of 12,000 bbl (equivalent to 1,900 m3) the corresponding cleanup costs would be $484/bbl and a total cost including damages of $1,050/bbl. Kontovas et al. finds that the damage costs add approximately an additional 129% to cleanup costs at the median and recommends using this factor for point estimates. For the spill sizes considered here the ratios fall in a range of 56% to 116%.
Natural Resource Damage Assessment (NRDA) in Washington State Damage cost assessments have been undertaken in the US since 1990 under the Comprehensive Environmental Response, Compensation, and Liability Act (CERCLA) and the Oil Pollution Act.7 NRDA estimates the extent of third party damages arising from a spill event, and includes complex methodologies for determining damage costs. Washington State has maintained a spill database and documented the results of the assessments, or the imposition of compensation payments using “schedules” for determining the amount of damages. Until the end of 2012, the schedule assessed damages in a range of $1-$100/gallon of product spilled. After extensive public reviews and additional technical studies, this schedule was amended for larger spills (≥1,000 gallons = ~23.8 bbl) that currently place damages in the range of $3-$300/gallon, implying a maximum damage cost of $12,600/bbl of product spilled (compared to $4,200/bbl previously). Credit is available if restoration and remediation efforts are done during the initial cleanup phase such that eventual payments would be reduced; the initial cleanup is minimally 24 hours for non-persistent oils and 48 hours for persistent oils. Damages depend on various parameters including oil type; the 2013 Schedule defines five groups of oils by density, and a typical diluted bitumen would be a “Group 3” oil (defined as 0.85-0.949 specific gravity) and would not normally be subject to the highest damage cost.
The database of 529 spills dating from 1991 to 2013 provides some further insights into damage payments that were associated with these spills (amounts that follow are for settled spill claims up to and including 2012, adjusted from date of spill using imputed Washington State GDP deflators to 2013 for analytical purposes; damages may have occurred for a longer time period before closing the claim). Of the spills in the database, the mean size was 8 bbl, and only
6 Kontovas et al. express regression results in a formulaic form representing the fitted data. The equation of the fitted model of cleanup cost is LOG10 (Cleanup)=4.64773 + 0.643615 LOG10(V); V=volume in tonnes , i.e., Cleanup cost = 44,435*(V^0.644). For total costs the result is TC=51,432*(V^0.728). These show the declining unit costs to size; base costs are expressed for a 2009 base year in US$ and corrected to a 2013 base year using a factor of 1.08. 7 The BC Government put forward policy remarks advocating adoption of processes such as the NRDA process in Washington State. (Technical Analysis: Requirements for British Columbia to Consider Support for Heavy Oil Pipelines. Incl. Press Release 2012ENV0047-001074; 23 July 2012, Vancouver) NRDA is a process adopted to determine the nature and extent of damages that can be compensated arising from an activity or incident. It seeks potentially to attach an economic value to these damages that in turn informs compensation payments. Canada has no such process, as its legislative basis is different (Annex A). Moreover, the statistical infrastructure remains limited to conduct such analyses, especially at site-specific scales (see Statistics Canada, November 2013. Human Activity and the Environment: Measuring Ecosystem Goods and Services. Ministry of Industry: Ottawa.)

TMEP Cleanup & Damage Cost Assessment: HJ Ruitenbeek, December 2013 (CONFIDENTIAL: draft 3/12) Page 12 LEGAL_CAL:11151877.1
18 spills (3.4%) were over 50 bbl. The average spill damage cost was $655/bbl; the maximum was $5,610/bbl. The median spill damage cost was similar to the mean: $640/bbl.
Damage Costs – Impacted Land Base (BC and Alberta) Environmental economic valuation work conducted by Anielski (2012) 8 provided a basis for estimating the value of ecosystem goods and services in a mix of biomes through Alberta and BC, along a proposed pipeline ROW from Edmonton to Kitimat. The work used typical values for EGS within the context of a mix of environments including riparian habitats, coastal habitats, agricultural lands, undisturbed forest and previously disturbed forests. It relied upon values taken from similar habitats in Western Canada to derive per hectare values of goods and services. These were in turn translated into unit costs for spills that demonstrated a worst case impact in a widespread area equivalent to $10,200/bbl. The resultant values were regarded as conservatively high, in that they assumed that in many cases the existing land use would not be disturbed by ongoing activities. The values also included impacts on greenhouse gas emissions (which are not currently compensated through any form of financial mechanism) and a range of other ecosystem values which are not compensable. Moreover, the values assumed that once an area was disturbed or impacted it would remain impacted for 15 years without recovery.
Atlantic Canada Spill Cost Study (Transport Canada) In 2007 Transport Canada9 reviewed shipping operations to estimate the costs (cleanup and indirect environmental) of ship operations along the South Coast of Newfoundland. In its assessment, it considered potential future impacts from existing and potentially new activities that might have a bearing on oil spill risks in Canadian coastal waters. The study reviewed a total projected volume of 411 million barrels of annual movements of crude and product, of which 78% (322 million barrels a year) was linked to operations at North Atlantic (Come by Chance) refinery and Whiffen Head terminal (both in Placentia Bay, Newfoundland). The results placed cleanup costs in a range of $830/bbl to $6,020/bbl (2013$) for high persistence oil that would potentially damage Canadian coastlines. The study also implies damage costs to be in the range of $0.60 to $0.85 for every $1.00 of cleanup in Canada’s East Coast navigable waterways; the lower factor is for large spills greater than 10,000 barrels. These damage costs reflect potential impacts through onshore and near-shore damages to fisheries, aquaculture and tourism.
Selected Terrestrial Spill Costs in Canada Cleanup costs for spills in Canada are generally proprietary and are not recorded in public documents. Nonetheless, some reported information is available that places some context for the broader experiences noted above. Among the highest unit costs for cleanup are those associated with a train derailment causing the Wabamun spill (2005) that released approximately 4,400 barrels of oil and pole treating oil into a heavily used recreational lake in Alberta; total costs for cleanup and damages were approximately $33,000/bbl, of which about
8 Anielski M. 2012. Evaluation of Natural Capital and Ecological Goods and Services at Risk Associated with the Proposed Enbridge Northern Gateway Pipeline. Anielski Management Inc. Edmonton. Attachment 4 to Northern Gateway Reply Evidence. Exhibit B83-6 (A2V1S0). The purpose of these analyses was not for calculating liability or financial exposure, but for inclusion within a social cost-benefit analysis, which sought to conduct a sensitivity test for full inclusion of an upper bound cost of environmental externalities associated with spills. 9 Transport Canada. 2007. Synopsis Report – Environmental Oil Spill Risk Assessment for the South Coast of Newfoundland, Edition 1 September 2007, Revised 11/2007. Report TP14740E.

TMEP Cleanup & Damage Cost Assessment: HJ Ruitenbeek, December 2013 (CONFIDENTIAL: draft 3/12) Page 13 LEGAL_CAL:11151877.1
$10,000/bbl were third party damages. Some larger spills associated with pipeline accidents demonstrated lower cleanup and damage costs: the Pine River 6,200 bbl spill in 2000 had a cost including third party settlements of about $6,600/bbl; the 2011 Rainbow pipeline spill of 28,000 bbl near Little Buffalo, Alberta, had cleanup costs of about $2,500/bbl. A smaller 2007 spill of about 1,500 bbl into Burrard Inlet experienced cleanup costs estimated to be $11,000/bbl.
Summary of Spill Cost Assumptions
For the purposes of this assessment, we use the Etkin cleanup cost algorithms as an initial benchmark for calculating total spill cleanup costs (Annex B). For larger spills in the range of 1,000-4,000 m3 or approximately 6,300 to 25,000 barrels (used within the scenarios described subsequently) they yield upper-bound cleanup costs (using manual cleanup) in a range of $3,532 to $6,358 per barrel for heavy oils in remote locations striking freshwater and sensitive coastlines. Modest spills under 2,500 barrels have a benchmark cleanup cost of $11,000/bbl. Note that these benchmarks are all greater than the ranges applied by Kontovas et al. (~$500–$2,000/bbl) and by Transport Canada ($830/bbl to $6,020/bbl); they also reflect the costs of pipeline spills experienced in Canada in the examples above.
For damage costs we choose a benchmark multiplier of 1.5 applied to cleanup costs, which is conservatively applied across all pipeline spills for analyzing the scenarios. This multiplier is higher than that implied by IOPC Fund experience for all point source spills (1.29), higher than that implied by IOPC Fund experience through the regression results of Kontovas et al. for spills within the size range of interest (0.56 to 1.19), and higher than those implied by Transport Canada for spills of persistent oil in sensitive areas (0.6 to 0.85). The factor is somewhat lower than the range for US navigable waterways (1.69 to 2.27), which are in turn high by international standards. The factor is also lower than that which would be implied by the Anielski study ($10,200/bbl) and the Washington State NRDA schedule maximum ($12,600/bbl) if these were in turn applied to an average to moderate spill having benchmark costs of $6,358 or less. For this reason, the pipeline rupture scenarios are also conducted using a sensitivity analysis reflecting a fixed damage amount of $10,000/bbl. This is again still regarded as a “high” estimate as the Anielski study included non-compensable impacts using conservative estimates.

TMEP Cleanup & Damage Cost Assessment: HJ Ruitenbeek, December 2013 (CONFIDENTIAL: draft 3/12) Page 14 LEGAL_CAL:11151877.1
Section 4 – Analysis and Results This Section provides the results of the analyses, working first through the various hazards considered, spill sizes and scenarios.
Hazards and Spill Sizes
The hypothetical spills considered here potentially arise from manufacturing defects, construction defects, third party damage, incorrect operations and geohazards. Technical assessments of the risks associated with these threats are being undertaken through all stages of pipeline design. This assessment is based on findings for Route P1 V4 and rely on DRAS (2013).10 Specifically, the assessment included here reflects the following:
· Spill volume losses due to construction defects, manufacturing defects, and incorrect operations, are based on an analysis of the PHMSA Incident Database for the period 2002-2009 filtered for large (≥20”) hazardous liquids pipelines with installation year in 1990 or later.
· The analyses reflect relevant hazards along the approximately 987 km of buried pipeline.
· Failures arising from external corrosion and internal corrosion are treated as negligible.
· Significant outflows entering the environment due to equipment failure at pump stations is regarded as negligible.
Spill sizes for non-rupture events are based on the statistics available in the PHMSA database. For the period described above, these result in the following findings:
· A total of 23 events relating to manufacturing defects, operational system faults, and construction faults resulted in a mean spill of 692 barrels (~110 m3).
· A total of 8 third party strikes caused spills that did not result in a full loss of containment; these resulted in a mean spill of 758 barrels (~120 m3).
The PHMSA database does not provide an adequate statistical sample of ruptures involving partial or full loss of containment, as such events are rare. Rupture volumes were evaluated using a scenario approach to describe outcomes from moderate spill sizes to larger spill sizes. The larger spill sizes correspond to a maximum spill of 2,000 m3 (12,580 bbl) in HCAs and 4,000 m3 (25,160 bbl) in non-HCAs.
To place the risks in perspective, recall that consequences can differ along the pipeline ROW. Simple inspection of the pipeline ROW indicates, for example, that about 10% of the pipeline falls within high population areas and 14% is in the sensitive areas of the BC Lower Mainland. These areas can be considered, to varying degrees, as HCAs: cleanup costs will normally be
10 Summarized in Volume 7 Section 3.0 of the Project Application.

TMEP Cleanup & Damage Cost Assessment: HJ Ruitenbeek, December 2013 (CONFIDENTIAL: draft 3/12) Page 15 LEGAL_CAL:11151877.1
higher and third party damage costs may similarly be higher. Such increased costs are reflected in the scenario analyses that follow.
Scenario Results – Pipeline Spill
The scenario analyses involve a series of six cases, which are intended to demonstrate the cleanup and damage costs of hypothetical spills. As noted previously, spills are rare events and the costs should also be taken in the context of their expected frequency of occurrence. For potential liability reasons, limits of insurances and financial assurances are of greater concern for larger spills in high consequence areas, even though these will be rarer events than small spills or leaks, which may never have impacts outside of the pipeline ROW. Cleanup and damage costs for all scenarios using the benchmarks noted in Section 3 are provided in Annex B.
For leaks, the scenarios consider two spill volumes representing: (i) the mean spill associated with such events in the PHMSA database (715 bbl); and, (ii) the median of such events (30 bbl). The scenario assumes that the heavy oil spills are in remote areas, that 25% of the spilled volume reaches water, that they require manual cleanup, and that they have no shoreline impacts in the coastal or estuarine environment. Cleanup costs for the mean spill (715 bbl) are $11,000/bbl, while those for the median spill (30 bbl) are approximately $34,000. Cleanup costs alone are estimated to be $1-8 million; incorporating potential damage costs using a 1.5 factor suggests that all such spills would have a maximum financial exposure of under $20 million.
The hypothetical rupture scenarios consider spill sizes of 1,000 m3 (6,290 bbl), 2,000 m3 (12,580 bbl), and 4,000 m3 (25,160 bbl), also shown in Annex B. These spill sizes were selected as credible worst case scenarios, based on the outflow modeling results conducted by Dynamic Risk Assessment Systems (Volume 7). The outflow modeling results are computed for every portion of the pipeline to resolutions as fine as one meter in length; they reflected designed valve placements, releases during shutdown, and maximum static drainage given the elevation profile. The results demonstrate also that outflows are lower in HCAs than in the pipeline corridor as a whole: median outflows in the BC Lower Mainland, for example, are about 1,365 m3 (8,590 bbl) while for the modeled corridor as a whole they are about 1,615 m3 (10,160 bbl). Maximum credible outflows for the corridor as a whole correspond to 4,000 m3; for HCAs they correspond to 2,000 m3.
The specific rupture scenarios include two spills into a HCA: (i) an “average” size spill of 1,000 m3 and a larger spill of 2,000 m3. All of the high cost parameters apply to these spills including those associated with heavy oils, remote locations (which also can reflect seasonal difficulties in accessible locations such as the BC Lower Mainland), full exposure to water, manual cleanup, and up to 100 km of oiling on coastlines or estuaries. The rupture scenarios also include two large spills (2,000 m3 and 4,000 m3]) into non-HCAs: these still reflect remote location and manual cleanup for heavy oils, but exclude shoreline impacts and (as with the leaks) show only 25% reaching water. The hypothetical rupture releases are potentially larger in the non-HCA areas because pipeline design considerations have pro-actively included features that will limit volume releases near HCAs (such as isolation valves near river crossings). Cleanup costs for this set of ruptures are about $2,600/bbl for the non-HCA scenarios and from approximately $3,500 to $6,400/bbl for the spills in the HCA scenarios. In this reference case, cleanup costs for the HCA spills are $40-$45 million, and for the non-HCA spills are $32-
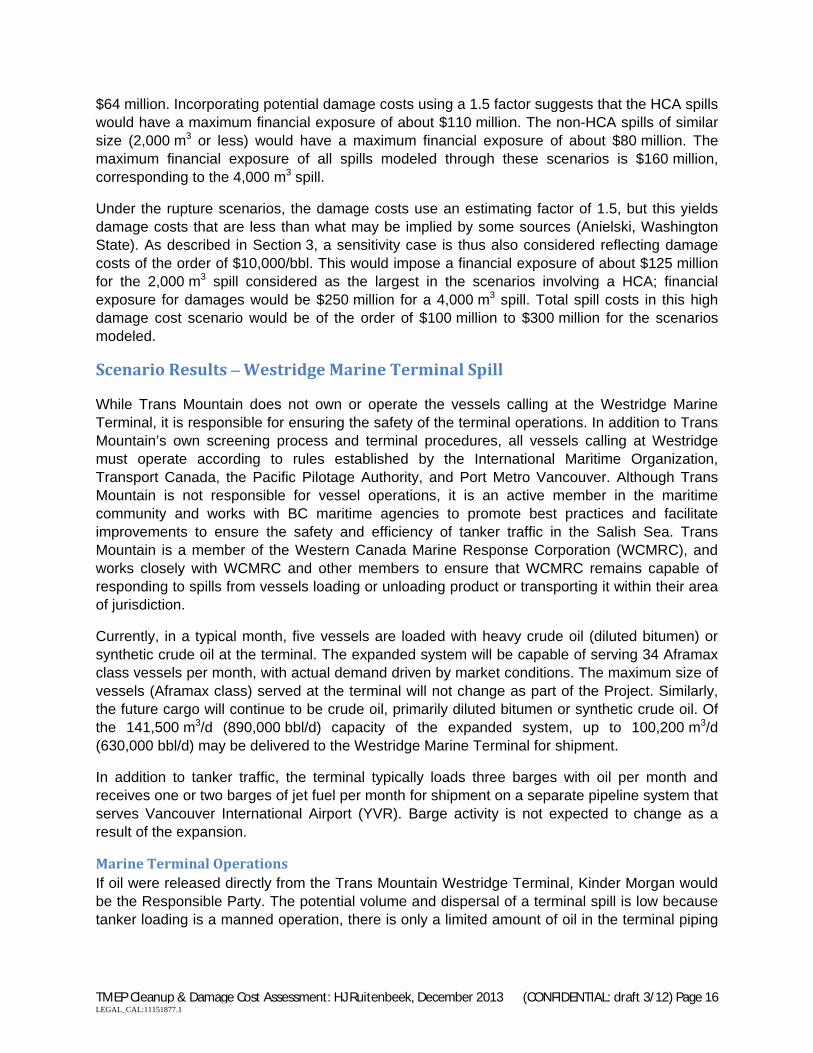
TMEP Cleanup & Damage Cost Assessment: HJ Ruitenbeek, December 2013 (CONFIDENTIAL: draft 3/12) Page 16 LEGAL_CAL:11151877.1
$64 million. Incorporating potential damage costs using a 1.5 factor suggests that the HCA spills would have a maximum financial exposure of about $110 million. The non-HCA spills of similar size (2,000 m3 or less) would have a maximum financial exposure of about $80 million. The maximum financial exposure of all spills modeled through these scenarios is $160 million, corresponding to the 4,000 m3 spill.
Under the rupture scenarios, the damage costs use an estimating factor of 1.5, but this yields damage costs that are less than what may be implied by some sources (Anielski, Washington State). As described in Section 3, a sensitivity case is thus also considered reflecting damage costs of the order of $10,000/bbl. This would impose a financial exposure of about $125 million for the 2,000 m3 spill considered as the largest in the scenarios involving a HCA; financial exposure for damages would be $250 million for a 4,000 m3 spill. Total spill costs in this high damage cost scenario would be of the order of $100 million to $300 million for the scenarios modeled.
Scenario Results – Westridge Marine Terminal Spill
While Trans Mountain does not own or operate the vessels calling at the Westridge Marine Terminal, it is responsible for ensuring the safety of the terminal operations. In addition to Trans Mountain’s own screening process and terminal procedures, all vessels calling at Westridge must operate according to rules established by the International Maritime Organization, Transport Canada, the Pacific Pilotage Authority, and Port Metro Vancouver. Although Trans Mountain is not responsible for vessel operations, it is an active member in the maritime community and works with BC maritime agencies to promote best practices and facilitate improvements to ensure the safety and efficiency of tanker traffic in the Salish Sea. Trans Mountain is a member of the Western Canada Marine Response Corporation (WCMRC), and works closely with WCMRC and other members to ensure that WCMRC remains capable of responding to spills from vessels loading or unloading product or transporting it within their area of jurisdiction.
Currently, in a typical month, five vessels are loaded with heavy crude oil (diluted bitumen) or synthetic crude oil at the terminal. The expanded system will be capable of serving 34 Aframax class vessels per month, with actual demand driven by market conditions. The maximum size of vessels (Aframax class) served at the terminal will not change as part of the Project. Similarly, the future cargo will continue to be crude oil, primarily diluted bitumen or synthetic crude oil. Of the 141,500 m3/d (890,000 bbl/d) capacity of the expanded system, up to 100,200 m3/d (630,000 bbl/d) may be delivered to the Westridge Marine Terminal for shipment.
In addition to tanker traffic, the terminal typically loads three barges with oil per month and receives one or two barges of jet fuel per month for shipment on a separate pipeline system that serves Vancouver International Airport (YVR). Barge activity is not expected to change as a result of the expansion.
Marine Terminal Operations If oil were released directly from the Trans Mountain Westridge Terminal, Kinder Morgan would be the Responsible Party. The potential volume and dispersal of a terminal spill is low because tanker loading is a manned operation, there is only a limited amount of oil in the terminal piping

TMEP Cleanup & Damage Cost Assessment: HJ Ruitenbeek, December 2013 (CONFIDENTIAL: draft 3/12) Page 17 LEGAL_CAL:11151877.1
at any given time and the water side of the terminal is surrounded by a marine boom whenever a vessel is being loaded.
Data from the International Tanker Owners Pollution Federation (ITOPF) covering 43 years of tanker operations at terminals worldwide show that 88% of spills involve discharge of under 50 barrels into the environment, most commonly due to equipment failure (Table 4.1). We estimate the costs of a maximum credible spill size to be that associated with a release of about 103 m3 (648 bbl). Using the Etkin (2004) estimating factors relating to a non-remote site, nearshore water exposure, and heavy oil properties, the mid-point cleanup cost is expected to be $9,200/bbl within a range of $6,370–$12,030/bbl depending upon cleanup methods; the highest cleanup cost assumes all manual cleanup with no mechanical or other methods. We conservatively adopt a value in the top quintile ($11,000/bbl) as a benchmark cleanup cost because shoreline oiling will be limited due to permanent booming and spill mitigation equipment is readily available and deployable onsite. The cleanup cost of this hypothetical spill is thus expected to be approximately $7.1 million. For environmental costs in Canadian shorelines we rely on Transport Canada factored cost data for Atlantic Canada and apply a multiplier of 0.85, which is that corresponding to a modest spill under 250 m3; the resultant estimated maximum damage costs would be $6.1 million. Total costs would be maximum $13.2 million. As with discussions elsewhere in this assessment, this is regarded as a conservative (high) estimate because of the nature of the assumptions and information sources.
Table 4.1 – Spills involving tanker loading/discharging operations, 1970–2012 (ITOPF Oil Tanker Spill Statistics 2012)
Size (barrels)
Total Allision/ Collision
Grounding Hull Failure
Equipment Failure
Fire/ Explosion
Other Unknown
<50 3157 (88%)
1 2 324 1124 50 842 814
50-5000 390 (11%)
4 0 36 143 8 96 103
>5000 41 (1%)
1 2 0 11 13 8 6
Total 3588 6 4 360 1278 71 946 923

TMEP Cleanup & Damage Cost Assessment: HJ Ruitenbeek, December 2013 (CONFIDENTIAL: draft 3/12) Page 18 LEGAL_CAL:11151877.1
Section 5 – Conclusion The purpose of this report is to provide an assessment of potential spill costs associated with a variety of hypothetical spills arising from the future operation of the Trans Mountain Expansion Project. The scope of the assessment focuses on hypothetical spills of heavy oil (including diluted bitumen and products with similar properties) over the operating life of the Project. The costs include direct cleanup costs and potential third party damage costs from hypothetical pipeline spills.
The significant findings include:
· Pipeline leaks with mean size of about 110 m3 (~700 barrels) may arise from hazards including manufacturing defects, operational system faults, construction faults or third party damage. Cleanup costs alone are estimated to be $1-8 million; incorporating potential damage costs suggests that any single spill would have a maximum financial exposure of under $20 million.
· Pipeline ruptures involving partial or full loss of containment are modeled for hypothetical spills of 1,000 m3 (6,290 bbl), 2,000 m3 (12,580 bbl) and 4,000 m3 (25,160 bbl) into High Consequence Areas (HCAs) involving oil in waterways and shoreline oiling, as well as into other areas (non-HCAs). The spills into HCAs are generally under 2,000 m3. Cleanup costs for HCA spills are $40-$45 million, and for the non-HCA spills are $32-$64 million. The HCA spills would have a maximum financial exposure of about $110 million including damage costs. The non-HCA spills of similar size (2,000 m3 or less) would have a maximum financial exposure of about $80 million. The maximum financial exposure of all spills modeled through these scenarios is $160 million.
· Some sources suggest using higher damage costs for risk management purposes. A sensitivity scenario was thus conducted using highest cost conditions for cleanup of a large spill (involving a hypothetical pipeline release of up to 4,000 m3 of heavy oil in a remote location impacting water and requiring manual cleanup procedures) and damage costs of the order of $10,000/bbl, which reflect among the highest found in the literature. Total spill costs in this high damage cost scenario would be of the order of $100 million to $300 million for the scenarios modeled.
· Based on best available information, a hypothetical spill at the vessel loading point of the Westridge Marine Terminal was also considered. Accidents associated with vessel operations are the responsibility of the vessel owner, but incidents at a marine terminal may fall under joint responsibility depending on the circumstances of the incident. Similar methods for calculating cleanup costs and potential damages from a hypothetical spill apply although some damage coefficients differ because of immediate availability of cleanup equipment. A spill of 103 m3 (648 bbl) was evaluated: such a spill would generate expected cleanup costs of $7.1 million and damage costs of $6.1 million for a total financial exposure of $13.2 million.
It is industry practice to use a mix of financial assurance mechanisms to cover any potential financial exposure associated with an oil spill. These mechanisms are essentially a combination

TMEP Cleanup & Damage Cost Assessment: HJ Ruitenbeek, December 2013 (CONFIDENTIAL: draft 3/12) Page 19 LEGAL_CAL:11151877.1
of self-insurance (based on company assets, income, and access to financing) and operational insurance (obtained through commercial markets). The regulated pipeline industry also has opportunities to recover pollution costs through future tolls imposed on shippers; financial security can also be assured in some cases through ongoing payments, which may be contractual obligations of shippers even in the event of pipeline shutdown after a spill occurs.
The current and proposed financial assurances and financial structure of the Project ($750 million of spill liability insurance and approximately $3.2 billion in equity) will be adequate to cover losses attributable to a spill and to ensure that the Project remains viable over its lifetime.

TMEP Cleanup & Damage Cost Assessment: HJ Ruitenbeek, December 2013 (CONFIDENTIAL: draft 3/12) Page 20 LEGAL_CAL:11151877.1
Annexes Annex A – Federal, Alberta and BC Regulatory Requirements
Annex B – Land-based Spill Costs and Scenario Results

TMEP Cleanup & Damage Cost Assessment: HJ Ruitenbeek, December 2013 (CONFIDENTIAL: draft 3/12) Page 21 LEGAL_CAL:11151877.1
Annex A – Federal, Alberta and BC Regulations This Annex summarizes key aspects of the regulatory basis for pipeline spill prevention and remediation in Canada.
Federal Legislation
Responsibility for the prevention, remediation and cleanup of pipeline spills is primarily addressed by the National Energy Board Act (“NEB Act”), its regulations and guidance provided to industry by the National Energy Board (“NEB”). Section 48(2) of the NEB Act gives the Board the power to make regulations providing for the protection of property and the environment. Pursuant to this regulatory authority the NEB has enacted section 48 of the Onshore Pipeline Regulations, 1999 SOR/99-294. Under this provision pipeline companies regulated by the NEB must develop and implement an Environment Protection Program to anticipate, prevent, mitigate and manage conditions that have the potential to adversely affect the environment. The NEB has developed the Remediation Process Guide that must be followed by companies that it regulates. This Guide establishes stringent criteria for soil and groundwater remediation in order to minimize risks to the public and environment as a result of oil spills.
Pursuant to section 51.1(2)(b) of the NEB Act, NEB inspectors are given broad enforcement powers, which include the authority to order pipeline companies to take any measures necessary to ensure safety of the public and employees and the protection of property or the environment.
Pursuant to section 75 of the NEB Act, pipeline companies regulated by the NEB must pay compensation to all persons interested, for all damage sustained by them as a result of the construction or operation of a pipeline. Pursuant to the NEB Act, there are no limits placed on liability for the prevention, remediation and cleanup of oil spills. Nor is there any limitation placed on liability for damages to persons, property and the environment.
To the extent that a spill affected or had the potential to affect waters frequented by fish regulated by the Fisheries Act, that legislation would also apply. The pipeline operator would have the duty to report the spill and take all reasonable measures to prevent, counteract, mitigate or remedy any adverse effects that result or may result from the spill (sections 38(4), 38(5) and 38(6)); fisheries inspectors have the power to take all reasonable measures at the expense of the person responsible (section 38(7.1)). In the event that the Federal government or Provincial governments incur costs as a result of a spill, the owner of the oil spilled or anyone who contributes to the spill (i.e. the pipeline operator) are jointly and severally liable to pay such costs (section 42(1)). Licensed commercial fishermen are also able to recover any losses they suffer from the pipeline operator and owner of the oil (section 42(3)).
Provincial Legislation (Alberta)
Oil spills in Alberta, including those from pipelines regulated by the NEB, are governed by Environmental Protection and Enhancement Act RSA 2000 c. E-12 (“EPEA”). Pursuant to section 112(1) of EPEA the person responsible for the oil spilled must take all reasonable measures to repair, remedy and confine the effects of a spill in addition to remediating, managing, removing or otherwise disposing of oil so as to prevent an adverse effect or a further

TMEP Cleanup & Damage Cost Assessment: HJ Ruitenbeek, December 2013 (CONFIDENTIAL: draft 3/12) Page 22 LEGAL_CAL:11151877.1
adverse effect. It is then the responsibility of such person to restore the environment to a condition satisfactory to the Director under EPEA. There is no maximum liability under the Alberta legislation.
Provincial Legislation (British Columbia)
Oil spills in British Columbia, including those from pipelines regulated by the NEB, are governed by the Environmental Management Act, SBC 2003, c. 53 (“EMA”).
Section 6(4) of the EMA prohibits the introduction of “waste into the environment in such a manner or quantity as to cause pollution”. The term “waste” includes “effluent” which is defined broadly to include any substance that injures or is capable of injuring personal health and safety or damages or is capable of damaging the environment.
Section 79 addresses spill prevention, abatement and reporting. The Minister of Environment may order any person who is in possession, charge or control of a polluting substance to undertake measures, at the person’s expense, to prevent or abate a spill (section 79(2) and (3)). Section 79(5) requires a person who was in possession, charge or control of a polluting substance immediately prior to a spill to report the release.
Section 80 sets out spill response powers available to the Provincial government. Section 80(2.1) enables the government to undertake a wide array of response and restoration measures directly. Subsections (4) (6) authorize the government to recover the incurred spill response costs from a person who had possession, charge or control of the spilled substance. EMA does not set limits to the recoverable costs.
EMA additionally authorizes the “director” under the Act to issue pollution prevention orders (section 81) and pollution abatement orders (section 83). Section 87 enables the Minister to take certain measures directly after declaring an “environmental emergency”, defined to include a “spill or leakage of oil”. Section 88 authorizes the Minister to recover costs respecting these measures from the person who caused the spill. EMA does not set limits to the recoverable costs.

TMEP Cleanup & Damage Cost Assessment: HJ Ruitenbeek, December 2013 (CONFIDENTIAL: draft 3/12) Page 23 LEGAL_CAL:11151877.1
Annex B – Land-based Spill Costs and Scenario Results This Annex provides supplementary information tables to accompany the analytical assumptions and results in the report.
Table B.1 – Typical unit cleanup and damage costs from oil spills. This presents a tabular summary of the cost estimating based on Etkin (2004) for oil spill cleanup costs in North America. The damage costs are added to the cleanup costs and refer to high consequence areas in US navigable waterways.

TMEP Cleanup & Damage Cost Assessment: HJ Ruitenbeek, December 2013 (CONFIDENTIAL: draft 3/12) Page 24 LEGAL_CAL:11151877.1
Table B.2 – Cleanup and damage cost estimates from oil spill scenarios along the Project pipeline right of way. This presents the results of spill costs assuming the cleanup cost parameters provided in Table B.1 are applied to the spill size and impact area types (HCA = High Consequence Area) associated with the six pipeline spill scenarios described in the assessment. The scenario involving a spill during loading at the Westridge Marine Terminal is also shown. Damage cost multipliers are assumed as 1.5 for the pipeline spill scenarios and 0.85 for the Westridge Marine Terminal spill scenario.

QUALITATIVE ECOLOGICAL RISK ASSESSMENT OF PIPELINE SPILLS
Technical Report for the Trans Mountain Pipeline ULC,
Trans Mountain Expansion Project
December 2013
Document #: REP-NEB-TERA-00019
Prepared for:
Trans Mountain Pipeline ULC Kinder Morgan Canada Inc. Suite 2700, 300 – 5th Avenue S.W. Calgary, Alberta T2P 5J2 Ph: 403-514-6400
Prepared by:
Stantec Consulting Ltd.
845 Prospect Street Fredericton, New Brunswick E3B 2T7
Ph: 506-452-7000

Trans Mountain Pipeline ULC Volume 7, Pipeline Facilities Technical Reports Trans Mountain Expansion Project Qualitative Ecological Risk Assessment of
Pipeline Spills Technical Report
December, 2013 REP-NEB-TERA-00019
Page i
EXECUTIVE SUMMARY
The purpose of this Ecological Risk Assessment (ERA) report is to evaluate the potential for ecological receptors (e.g., fish, fish eggs, invertebrates, amphibians, reptiles, birds, mammals, and plants) to experience negative environmental effects as a result of exposure to crude oil released to the environment as a result of the Project. The following summary is based upon the assumption that an oil spill as a result of construction of the Trans Mountain Pipeline would be a low probability event.
Because of the nature of spills to land (i.e., the limited spatial extent of environmental effects in the context of much larger habitat units) and the existence of legislated processes pertaining to environmental remediation following such spills, the ecological risk assessment does not directly consider effects to terrestrial environments. Conversely, crude oil entering aquatic environments has the potential to spread or be advected rapidly downstream, and as a result has the potential to affect much more of the available habitat. Aquatic ecosystems are known to be sensitive to spilled oil, and therefore this ERA report focuses on spills that enter aquatic environments.
The proposed TMEP pipeline corridor crosses 474 defined watercourses between Edmonton, Alberta and Burnaby, British Columbia, and runs parallel to several large rivers for a considerable portion of the distance. Where the pipeline runs parallel to a river, the potential for that river to be affected by oil in the unlikely event of an oil spill increases in proportion to the length of the pipeline corridor within the watershed, and the proximity of the corridor to the river. Based upon these and other criteria, hypothetical oil spill locations were selected in proximity to the Athabasca River near Hinton, Alberta; the North Thompson River near Darfield, British Columbia; the Fraser River near Hope, British Columbia; and the Fraser River near the Port Mann Bridge in greater Vancouver. This last location was selected to be as close as possible to the Fraser River Delta, in order to evaluate potential environmental effects of spilled oil on ecological receptors unique to the Delta, a tidal estuary.
Although the proposed TMEP pipeline will potentially carry a variety of crude oils, diluted bitumen is expected to comprise a large percentage of the oil shipped. For that reason, a sample of Cold Lake Winter Blend (CLWB) was procured and tested to provide information on the physical and chemical characteristics of a representative product. CLWB was selected because it is currently transported by Trans Mountain and is expected to remain a major product transported by the new pipeline. In addition, the diluent in CLWB is condensate (a light hydrocarbon mixture derived from natural gas liquids), which is volatile and relatively water-soluble. Due to the higher level of risk associated with inhalation of volatiles and/or exposure to dissolved hydrocarbons, CLWB was considered to be a conservative choice for the ERA, as opposed to heavy crude oil mixed with alternative diluents such as synthetic oil, which contain fewer volatile and less water soluble constituents.
A literature review was conducted to identify and acquire information on actual and modelled spills of heavy crude oils in the freshwater environment, and case studies were selected to inform predictions about the potential fate and transport and ecological effects of a diluted bitumen spill resulting from the Project. Actual spill case studies included the Kalamazoo River spill, East Walker River spill, Pine River spill, Wabamun Lake spill, Yellowstone River spill, OSSA II Pipeline spill, and the DM 932 barge spill, with crude oil types ranging from light crude oil to diluted bitumen and bunker type products. TMEP studies involving the behaviour of diluted bitumen on water in meso-scale experimental trials carried out at Gainford, Alberta (Witt O‟Brien‟s et al. 2013) were also reviewed. Finally, modelling case studies included predictions of oil spill fate and ecological effects conducted for the Enbridge Northern Gateway Project, representing a diluted bitumen and a synthetic crude oil, with hypothetical spill locations on the Athabasca, Crooked, Morice and Kitimat rivers in Alberta and British Columbia, as well as a predictions of oil spill fate and ecological effects of Jet “A” fuel released to the lower Fraser River near Vancouver.
When crude oil is spilled, volatile components quickly evaporate, and more water-soluble components can dissolve into the water. The amount of hydrocarbon that will dissolve into the water depends upon a number of factors, including the availability of relatively water soluble hydrocarbons, the amount of mixing energy in the water column, and the viscosity of the oil. If there is sufficient mixing energy to entrain droplets of oil into the water column, then the rate of dissolution is increased in comparison to the case

Trans Mountain Pipeline ULC Volume 7, Pipeline Facilities Technical Reports Trans Mountain Expansion Project Qualitative Ecological Risk Assessment of
Pipeline Spills Technical Report
December, 2013 REP-NEB-TERA-00019
Page ii
when oil is simply floating on the water surface. High oil viscosity increases the amount of mixing energy required. The resulting concentration of dissolved hydrocarbon depends upon the amount of oil released, relative to the amount of water flowing in the river. Therefore, high potential for acute effects to aquatic organisms occurs when light oils containing a high percentage of mono-aromatic hydrocarbons (MAH) and other light hydrocarbons are released into streams or small rivers with high gradients leading to high-energy mixing. Lower potential for such effects is observed as oils become more viscous, with lower percentages of MAH present, and as the level of turbulence decreases as river size increases, or river gradient decreases.
Once in the water column, oil droplets may be exposed to suspended sediments; if there is adequate contact, the particulate matter may adhere to the oil droplets and the resulting oil-mineral aggregate (OMA) may become neutrally to negatively buoyant and remain submerged or sink in the water column. Formation of substantial quantities of OMA requires high suspended sediment concentrations, and is enhanced by salinity, which is not normally present in freshwater ecosystems. Oil may also contact sand and gravel particles along shorelines, resulting in initial stranding of oil that may sink if it later re-enters the water column. In high flows, submerged oil is transported downstream and prevented from settling on the riverbed. In contrast, low flows have the potential to result in high levels of sedimentation of submerged oil, particularly in quiescent areas where silty sediments accumulate.
For spills in winter, direct environmental effects of spilled oil may depend upon the amount of snow and ice cover, as snow can absorb spilled oil, and ice cover on watercourses can prevent or limit contact between the oil and running water. Many ecological receptors are absent or dormant during the winter, and would not be exposed to the spilled oil. For such spills, there is a high potential to recover most of the spilled oil so that oil spill effects on ecological receptors can be minimal. Spills to rivers that are not ice covered in winter, however, would have environmental effects similar to the environmental effects of spills at other times of the year.
For the four locations considered in this study (the Athabasca River near Hinton, Alberta; the North Thompson River near Darfield, British Columbia; the Fraser River near Hope, British Columbia and the Fraser River as it enters the Delta, near Vancouver), seasonal flow regimes are such that high flows are observed during the summer, as snow and ice melt in the mountain headwater regions. Low flows are typically observed in winter, as water equivalents build up in snowpack. Spring and fall represent shoulder seasons when flows are intermediate. Using information from the actual spill events and modelling case studies, the likely behaviour of spilled heavy crude oil, and extent of oiling, was predicted for each river system. Stochastic modeling was used to predict the fate and transport of oil for the Fraser River Delta, due to the unique nature and complexity of this environment. For the other three spill examples, professional judgement was used, based upon the case studies.
From the predicted distribution of crude oil in the environment in each of the rivers, for winter, summer, and spring and fall seasons, interactions between spilled oil and ecological receptor groups were evaluated. Ecological receptor groups included aquatic biota (vegetation, benthic invertebrates, fish including eggs and larvae, and amphibians), terrestrial plant and soil invertebrate communities in riparian areas, mammals (with grizzly bear, moose, muskrat and river otter selected as representative types), birds (with bald eagle, Canada goose, great blue heron, mallard, spotted sandpiper and tree swallow selected as representative types) and reptiles (with the Western painted turtle selected as a representative) for the Delta oil spill scenario, two additional ecological receptors (biofilm and Western sandpiper) were evaluated.
For each river, season and ecological receptor type, the expected spatial extent, magnitude, duration and reversibility of negative environmental effects was evaluated, again with reference to case studies. The spatial extent of environmental effects was found to vary, depending upon the season and river characteristics, and both the spatial extent and magnitude of environmental effects was often rated as “high”, at least locally. However, effect durations taking into consideration oil spill response and restoration activities were typically less than five years, and often 12 to 24 months, and all rated negative environmental effects were considered to be “reversible”. Evidence from the case studies showed

Trans Mountain Pipeline ULC Volume 7, Pipeline Facilities Technical Reports Trans Mountain Expansion Project Qualitative Ecological Risk Assessment of
Pipeline Spills Technical Report
December, 2013 REP-NEB-TERA-00019
Page iii
overwhelmingly that freshwater ecosystems can recover from oil spills, often within relatively short periods of time.
Taking all of these factors into consideration, it is clear that a crude oil spill into a freshwater environment could have substantial negative environmental effects that could be long-lasting if prompt and effective measures are not taken to mitigate the immediate impacts by containment and recovery. However, as described in Volume 7, the probability of a crude oil spill reaching freshwater is very low. This confirms that spill prevention, preparedness, and effective response activities must always be a primary focus to reduce the probability of an oil spill to be as low as reasonably practical (ALARP), and to have adequate oil spill response plans and procedures in place that have proven capability to reduce the magnitude and extent of actual effects.

Trans Mountain Pipeline ULC Volume 7, Pipeline Facilities Technical Reports Trans Mountain Expansion Project Qualitative Ecological Risk Assessment of
Pipeline Spills Technical Report
December, 2013 REP-NEB-TERA-00019
Page iv
TABLE OF CONTENTS
Page EXECUTIVE SUMMARY ............................................................................................................................... I TABLE OF CONTENTS ............................................................................................................................... IV
1.0 INTRODUCTION ........................................................................................................................... 1-1
1.1. Project Overview .............................................................................................................. 1-1 1.2. Purpose ............................................................................................................................ 1-1 1.3. Objectives ........................................................................................................................ 1-2 1.4. Organization of the Report ............................................................................................... 1-2
2.0 CONSULTATION AND ENGAGEMENT ....................................................................................... 2-1
2.1. Public Consultation, Aboriginal Engagement and Landowner Relations......................... 2-1 2.2. Regulatory Consultation ................................................................................................... 2-1
3.0 PIPELINE SPILLS IN THE TERRESTRIAL ENVIRONMENT ...................................................... 3-1
3.1. Regulation of Pipeline Spills in the Terrestrial Environment ............................................ 3-1 3.1.1. National Energy Board ........................................................................................ 3-1 3.1.2. Provincial Regulatory Authorities ........................................................................ 3-2
3.2. Clean-up, Treatment, and Remediation Endpoints .......................................................... 3-3 3.3. Net Environmental Benefits Analysis ............................................................................... 3-4 3.4. Response and Mitigation for Land-based Spills .............................................................. 3-5
3.4.1. Agricultural Lands ............................................................................................... 3-5 3.4.2. Forested Areas.................................................................................................... 3-5 3.4.3. Wetlands ............................................................................................................. 3-6
3.5. Summary of Land-Based Spills ........................................................................................ 3-7
4.0 DESCRIPTION OF THE FRESHWATER ENVIRONMENT ......................................................... 4-1
4.1. North Saskatchewan River Basin .................................................................................... 4-1 4.2. Athabasca River Basin ..................................................................................................... 4-6 4.3. Columbia River Basin....................................................................................................... 4-8 4.4. Fraser River Basin ........................................................................................................... 4-9
5.0 QUALITATIVE ECOLOGICAL RISK ASSESSMENT FRAMEWORK .......................................... 5-1
5.1. Problem Formulation ........................................................................................................ 5-2 5.2. Exposure Assessment ..................................................................................................... 5-2 5.3. Hazard Assessment ......................................................................................................... 5-2 5.4. Risk Characterization ....................................................................................................... 5-3 5.5. Discussion of Certainty and Confidence .......................................................................... 5-4
6.0 QUALITATIVE ECOLOGICAL RISK ASSESSMENT ................................................................... 6-1
6.1. Problem Formulation ........................................................................................................ 6-1 6.1.1. Identification of Chemicals of Potential Concern ................................................ 6-1 6.1.2. Identification of Representative Hypothetical Spill Scenarios ............................. 6-4 6.1.3. Identification of Ecological Receptors ............................................................... 6-18 6.1.4. Identification of Exposure Pathways ................................................................. 6-22 6.1.5. Conceptual Site Model ...................................................................................... 6-23
6.2. Exposure Assessment ................................................................................................... 6-25 6.2.1. Fate and Behaviour of Oil When Spilled in the Environment ............................ 6-25 6.2.2. Selected Case Studies ...................................................................................... 6-30
6.3. Hazard Assessment ....................................................................................................... 6-51 6.3.1. Ecological Effects of Spilled Oil ........................................................................ 6-51
6.4. Risk Characterization ..................................................................................................... 6-60

Trans Mountain Pipeline ULC Volume 7, Pipeline Facilities Technical Reports Trans Mountain Expansion Project Qualitative Ecological Risk Assessment of
Pipeline Spills Technical Report
December, 2013 REP-NEB-TERA-00019
Page v
6.4.1. Tributary to the Athabasca River near Hinton, Alberta at RK 309.0 ................. 6-61 6.4.2. North Thompson River near Darfield, British Columbia at RK 766.0 ................ 6-70 6.4.3. Fraser River near Hope, British Columbia at RK 1072.8 .................................. 6-77 6.4.4. Fraser River and Delta near the Port Mann Bridge at RK 1167.5 .................... 6-87
6.5. Certainty and Confidence in the Ecological Risk Assessment .................................... 6-101
7.0 SUMMARY AND CONCLUSIONS ................................................................................................ 7-1
8.0 CLOSURE ..................................................................................................................................... 8-1
9.0 REFERENCES .............................................................................................................................. 9-1
9.1. Literature Cited ................................................................................................................. 9-1 9.2. Personal Communications ............................................................................................. 9-12 9.3. Data Sources Cited in Figures ....................................................................................... 9-12
LIST OF APPENDICES
APPENDIX A: LABORATORY CERTIFICATES .......................................................................................... A
APPENDIX B: RESULTS OF THE STOCHASTIC MODELING .................................................................. B
APPENDIX C: RECOVERY ASSESSMENT ............................................................................................... C
LIST OF FIGURES
Figure 4.1 Trans Mountain Expansion Project .................................................................................. 4-2 Figure 4.2 Aquatic Environment Traversed by the Trans Mountain Expansion Project in
Alberta .............................................................................................................................. 4-3 Figure 4.3 Aquatic Environment Traversed by the Trans Mountain Expansion Project in
British Columbia ............................................................................................................... 4-4 Figure 5.1 Ecological Risk Assessment Framework ......................................................................... 5-1 Figure 6.1 Historical Mean Monthly Streamflow (m3/s) Summary for the Athabasca River
at Hinton, Alberta (Station 07AD002) ............................................................................... 6-8 Figure 6.2 Historical Mean Monthly Streamflow (m3/s) Summary for the Athabasca River
Near Windfall, Alberta (Station 07AE001) ....................................................................... 6-9 Figure 6.3 Historical Mean Monthly Streamflow (m3/s) Summary for the North
Thompson River at McLure, BC (Station 08LB064) ...................................................... 6-11 Figure 6.4 Historical Mean Monthly Streamflow (m3/s) Summary for the Fraser River at
Hope, BC (Station 08MF005) ......................................................................................... 6-14 Figure 6.5 Historical Mean Monthly Streamflow (m3/s) Summary for the Lower Fraser
River at Mission, BC (Station 08MH024) ....................................................................... 6-15 Figure 6.6 Historical Mean Monthly Streamflow (m3/s) Summary for the Fraser River at
Port Mann Pumping Station, BC (Station 08MH126) ..................................................... 6-17 Figure 6.7 Conceptual Exposure Model for Ecological Receptors and Selected
Indicators ........................................................................................................................ 6-24 Figure 6.8 Oil Spills in Terrestrial Environments ............................................................................. 6-27 Figure 6.9 Oil Spills in Aquatic Environments ................................................................................. 6-27

Trans Mountain Pipeline ULC Volume 7, Pipeline Facilities Technical Reports Trans Mountain Expansion Project Qualitative Ecological Risk Assessment of
Pipeline Spills Technical Report
December, 2013 REP-NEB-TERA-00019
Page vi
LIST OF TABLES
Table 1.1 Organization of the Ecological Risk Assessment ............................................................ 1-2 Table 4.1 Summary of Watersheds and Major Watercourse Crossings in the North
Saskatchewan River Basin .............................................................................................. 4-5 Table 4.2 Streamflows from Hydrological Stations near Watercourse Crossings in the
North Saskatchewan River Basin .................................................................................... 4-5 Table 4.3 Summary of Watersheds and Watercourse Crossings in the Athabasca River
Basin ................................................................................................................................ 4-6 Table 4.4 Streamflows from Hydrological Stations near Watercourse Crossings in the
Athabasca River Basin ..................................................................................................... 4-7 Table 4.5 Summary of Watersheds and Named Watercourse Crossings in the
Columbia River Basin....................................................................................................... 4-8 Table 4.6 Streamflows from Hydrological Stations near Watercourse Crossings in the
Columbia River Basin....................................................................................................... 4-8 Table 4.7 Summary of Watersheds and Major Watercourse Crossings in the Fraser
River Basin ....................................................................................................................... 4-9 Table 4.8 Streamflows from Hydrological Stations near Watercourse Crossings in the
Fraser River Basin ......................................................................................................... 4-10 Table 6.1 Physical Properties for Cold lake winter blend Diluted Bitumen ...................................... 6-2 Table 6.2 Chemical Constituents of Cold Lake Winter Blend Diluted Bitumen ............................... 6-2 Table 6.3 Historical Mean Monthly Streamflow (m3/s) Summary for the Athabasca River
at Hinton, Alberta (Station 07AD002) ............................................................................... 6-8 Table 6.4 Historical Mean Monthly Streamflow (m3/s) Summary for the Athabasca River
Near Windfall, Alberta (Station 07AE001) ....................................................................... 6-9 Table 6.5 Historical Mean Monthly Streamflow (m3/s) Summary for the North
Thompson River at McLure, BC (Station 08LB064) ...................................................... 6-11 Table 6.6 Historical Mean Monthly Streamflow (m3/s) Summary for the Fraser River at
Hope, BC (Station 08MF005) ......................................................................................... 6-14 Table 6.7 Historical Mean Monthly Streamflow (m3/s) Summary for the Lower Fraser
River at Mission, BC (Station 08MH024) ....................................................................... 6-15 Table 6.8 Historical Mean Monthly Streamflow (m3/s) Summary for the Fraser River at
Port Mann Pumping Station, BC (Station 08MH126) ..................................................... 6-17 Table 6.9 Ecological Receptors Assessed in the ERA .................................................................. 6-19 Table 6.10 Potential Exposure Pathways Resulting from Hypothetical Pipeline Spills into
the Freshwater Environment .......................................................................................... 6-22 Table 6.11 Case Studies Selected in the Assessment of Oil Spills in the Freshwater
Environment ................................................................................................................... 6-30 Table 6.12 Kalamazoo Oil Spill Wildlife Recovery Summary as of May 2011 ................................. 6-33 Table 6.13 Mass Balance Fate of Spilled Diluted Bitumen and Synthetic Oil in Four
Rivers, Under Two Flow Conditions, Based on Modelling Carried Out for the Enbridge Northern Gateway Project .............................................................................. 6-46
Table 6.14 Acute Effects of Spilled Oil on Aquatic Ecological Receptors in Four Rivers, Under Two Flow Conditions, Based on Modelling Carried Out for the Enbridge Northern Gateway Project .............................................................................. 6-47
Table 6.15 Toxicological Benchmarks for Mammalian Ecological Receptors Exposed to Crude Oil ........................................................................................................................ 6-57
Table 6.16 Toxicological Benchmarks for Avian Ecological Receptors Exposed to Crude Oil ................................................................................................................................... 6-58
Table 6.17 Estimated Spill Volumes for Full-bore Rupture and Contractor Damage to the Pipeline .......................................................................................................................... 6-61
Table 6.18 Likely Environmental Effects of CLWB Spill during Winter to the Athabasca River near Hinton, Alberta .............................................................................................. 6-63
Table 6.19 Likely Environmental Effects of CLWB Spill during Summer to the Athabasca River near Hinton, Alberta .............................................................................................. 6-66

Trans Mountain Pipeline ULC Volume 7, Pipeline Facilities Technical Reports Trans Mountain Expansion Project Qualitative Ecological Risk Assessment of
Pipeline Spills Technical Report
December, 2013 REP-NEB-TERA-00019
Page vii
Table 6.20 Likely Environmental Effects of CLWB Spill during Spring or Fall to the Athabasca River near Hinton, Alberta............................................................................ 6-68
Table 6.21 Likely Environmental Effects of CLWB Spill during Winter to the North Thompson River near Darfield, British Columbia ........................................................... 6-72
Table 6.22 Likely Environmental Effects of CLWB Spill during Summer to the North Thompson River near Darfield, British Columbia ........................................................... 6-75
Table 6.23 Likely Environmental Effects of CLWB Spill during Spring or Fall to the North Thompson River near Darfield, British Columbia ........................................................... 6-76
Table 6.24 Likely Environmental Effects of CLWB Spill during Winter to the Fraser River near Hope, British Columbia .......................................................................................... 6-81
Table 6.25 Likely Environmental Effects of CLWB Spill during Summer to the Fraser River near Hope, British Columbia ................................................................................. 6-82
Table 6.26 Likely Environmental Effects of CLWB Spill during Spring or Fall to the Fraser River near Hope, British Columbia ..................................................................... 6-84
Table 6.27 Likely Environmental Effects of CLWB Spill during Winter to the Fraser River AND Delta near the Port Mann Bridge, British Columbia .............................................. 6-90
Table 6.28 Likely Environmental Effects of CLWB Spill during Summer to the Fraser River AND Delta near the Port Mann Bridge, British Columbia ..................................... 6-94
Table 6.29 Likely Environmental Effects of CLWB Spill during Spring or Fall to the Fraser River AND Delta near the Port Mann Bridge, British Columbia ......................... 6-98
Table C.1 Case Studies Selected in the Assessment of the Recovery of the Freshwater Environment after an Oil Spill ...................................................................................... C.1-1

Trans Mountain Pipeline ULC Volume 7, Pipeline Facilities Technical Reports Trans Mountain Expansion Project Qualitative Ecological Risk Assessment of
Pipeline Spills Technical Report
December, 2013 REP-NEB-TERA-00019
Page viii
DEFINITIONS AND ACRONYM LIST
Definition/Acronym Full Name
‰ parts per thousand
AB Alberta
acute short-term
AER Alberta Energy Regulator
AESRD Alberta Environment and Sustainable Resource Development
ASRD Alberta Sustainable Resource Development
AWB Access Western Blend
AWC Athabasca Watershed Council
bbl/d barrels/day
BC British Columbia
BC MELP British Columbia Ministry of Environment, Lands and Parks
BC MOE British Columbia Ministry Of Environment
bpd barrels per day
BSD Blue Sac Disease
BTEX Benzene, Toluene, Ethylbenzene, Xylenes
CCME Canadian Council of Ministers of the Environment
chronic long-term
CLWB Cold Lake Winter Blend
COPC Chemical of Potential Concern
COSEWIC Committee on the Status of Endangered Wildlife in Canada
CPCN Certificate of Public Convenience & Necessity
CSM Conceptual Site Model
DFO Department of Fisheries and Oceans
EA Environmental Assessment

Trans Mountain Pipeline ULC Volume 7, Pipeline Facilities Technical Reports Trans Mountain Expansion Project Qualitative Ecological Risk Assessment of
Pipeline Spills Technical Report
December, 2013 REP-NEB-TERA-00019
Page ix
Definition/Acronym Full Name
EHHRA Ecological and Human Health Risk Assessment for Pipeline Spills (Stantec et al. 2012)
EPEA Environmental Protection and Enhancement Act of Alberta
ERA Ecological Risk Assessment
ERCB Energy Resources Conservation Board
ESA Environmental and Socio-economic Assessment
EVOS Exxon Valdez Oil Spill
EWRTC East Walker River Trustee Council
HDD horizontal directional drilling
HDD horizontal directional drill
HFO Heavy Fuel Oil
HI Hazard Index
HQ Hazard Quotient
KMC Kinder Morgan Canada Inc.
LOAEL Lowest Observed Negative Effects Level
MAH Mono aromatic hydrocarbons
masl metres above sea level
NEB National Energy Board
NEB Act National Energy Board Act
NEBA Net Environmental Benefits Analysis
NOAA National Oceanic and Atmospheric Administration
NOAEL No Observed Negative Effects Level
NOAEL no observed negative effects level
NRC National Research Council
NTSB National Transportation Safety Board

Trans Mountain Pipeline ULC Volume 7, Pipeline Facilities Technical Reports Trans Mountain Expansion Project Qualitative Ecological Risk Assessment of
Pipeline Spills Technical Report
December, 2013 REP-NEB-TERA-00019
Page x
Definition/Acronym Full Name
NTSB National Transportation Safety Board
OMA oil-mineral aggregate
OSR oil spill response
PAH Polycyclic aromatic hydrocarbons
Project Trans Mountain Expansion Project
PTO pole treating oil
QRA Quantitative Risk Assessment
SARA Species at Risk Act
SCAT Shoreline Clean-up and Assessment Techniques
TMEP Trans Mountain Expansion Project
TMPL Trans Mountain Pipeline
TPAH Total Polycyclic Aromatic Hydrocarbons
Trans Mountain Trans Mountain Pipeline ULC
TRV Toxicity Reference Value
TSBC Transportation Safety Board of Canada
TSS total suspended solids
TUC Transit Utility Corridor
UC Unified Command
US United States
USDOT United States Department of Transportation
USEPA United States Environmental Protection Agency
USFWS United States Fish & Wildlife Service
UV ultraviolet light

Trans Mountain Pipeline ULC Volume 7, Pipeline Facilities Technical Reports Trans Mountain Expansion Project Qualitative Ecological Risk Assessment of
Pipeline Spills Technical Report
December, 2013 REP-NEB-TERA-00019
Page 1-1
1.0 INTRODUCTION
1.1. Project Overview
Trans Mountain Pipeline ULC (Trans Mountain) is a Canadian corporation with its head office located in Calgary, Alberta. Trans Mountain is a general partner of Trans Mountain Pipeline L.P., which is operated by Kinder Morgan Canada Inc. (KMC), and is fully owned by Kinder Morgan Energy Partners, L.P. Trans Mountain is the holder of the National Energy Board (NEB) certificates for the Trans Mountain pipeline system (TMPL system).
The TMPL system commenced operations 60 years ago and now transports a range of crude oil and petroleum products from Western Canada to locations in central and southwestern British Columbia (BC), Washington State and offshore. The TMPL system currently supplies much of the crude oil and refined products used in BC. The TMPL system is operated and maintained by staff located at Trans Mountain‟s regional and local offices in Alberta (Edmonton, Edson, and Jasper) and BC (Clearwater, Kamloops, Hope, Abbotsford, and Burnaby).
The TMPL system has an operating capacity of approximately 47,690 m3/d (300,000 bbl/d) using 23 active pump stations and 40 petroleum storage tanks. The expansion will increase the capacity to 141,500 m3/d (890,000 bbl/d).
The proposed expansion will comprise the following:
Pipeline segments that complete a twinning (or “looping”) of the pipeline in Alberta and BC with about 987 km of new buried pipeline.
New and modified facilities, including pump stations and tanks. Three new berths at the Westridge Marine Terminal in Burnaby, BC, each capable of handling
Aframax class vessels.
The expansion has been developed in response to requests for service from Western Canadian oil producers and West Coast refiners for increased pipeline capacity in support of growing oil production and access to growing West Coast and offshore markets. NEB decision RH-001-2012 reinforces market support for the expansion and provides Trans Mountain the necessary economic conditions to proceed with design, consultation, and regulatory applications.
Application is being made pursuant to Section 52 of the National Energy Board Act (NEB Act) for the proposed Trans Mountain Expansion Project (referred to as “TMEP” or “the Project”). The NEB will undertake a detailed review and hold a Public Hearing to determine if it is in the public interest to recommend a Certificate of Public Convenience and Necessity (CPCN) for construction and operation of the Project. Subject to the outcome of the NEB Hearing process, Trans Mountain plans to begin construction in 2016 and go into service in 2017.
Trans Mountain has embarked on an extensive program to engage Aboriginal communities and to consult with landowners, government agencies (e.g., regulators and municipalities), stakeholders, and the general public. Information on the Project is also available at www.transmountain.com.
1.2. Purpose
Any crude oil spill, however unlikely, has the potential to cause negative environmental effects. As such, Trans Mountain considers accident prevention and environmental protection to be key commitments for the Project. Accident prevention and environmental protection measures for the Project are described in numerous places throughout the Application. It is to be stressed that the hypothetical oil spill scenarios put forward in this volume are considered to be unlikely events, with a low probability of occurrence.
While accidental spill events resulting from the Project could affect a variety of aquatic and terrestrial habitats (e.g., forests, wetlands, rivers), the most serious effects are expected to be in the aquatic environment (as described in the Hazard Assessment in Section 6.2.2.1). Therefore, the purpose of the

Trans Mountain Pipeline ULC Volume 7, Pipeline Facilities Technical Reports Trans Mountain Expansion Project Qualitative Ecological Risk Assessment of
Pipeline Spills Technical Report
December, 2013 REP-NEB-TERA-00019
Page 1-2
ecological risk assessment (ERA) is to evaluate the potential that valued ecosystem components (ecological receptors) such as fish, fish eggs, invertebrates, amphibians, reptiles, birds, mammals, and plants would experience negative effects as a result of exposure to chemicals of potential concern (COPC) released to the freshwater or estuarine environment following an accidental pipeline spill as a result of the Project. Spills to the marine environment resulting from marine terminal operations (e.g., an accident during vessel loading at the Westridge Terminal) are assessed in Volume 7. Spills to the marine environment resulting from accidents during marine transportation (e.g., a vessel collision or grounding incident) are assessed in Volume 8A.
The ERA has been prepared in support of the Application to the NEB and will be used to inform pipeline and facility design and emergency response planning.
1.3. Objectives
For the purpose of the ERA, oil spills were qualitatively assessed over a range of watercourses and flow conditions found in the freshwater environment traversed by the Project. The ERA examined a range of potential acute and chronic environmental effects to aquatic organisms and wildlife. The key objectives of the ERA were the following:
1. Make predictions about the fate and transport of hypothetical releases of diluted bitumen into representative freshwater environments along the proposed pipeline corridor, under a range of flow conditions.
2. Assess the ecological effects that could result from hypothetical pipeline releases of diluted bitumen to the freshwater environments along the proposed pipeline corridor.
3. Assess long-term recovery of the freshwater environment after a hypothetical spill of diluted bitumen resulting from the Project.
1.4. Organization of the Report
Table 1.1 provides a summary of how the ERA is organized.
TABLE 1.1 ORGANIZATION OF THE ECOLOGICAL RISK ASSESSMENT
Report Section Content
Executive Summary A non-technical summary of key findings to assist the reader in quickly understanding the most important aspects and conclusions of the report.
Section 1 – Introduction An introductory section that describes the role of the ecological risk assessment. This section provides the context for the qualitative ecological risk assessment.
Section 2 – Consultation and Engagement
Describes the consultation and engagement activities conducted to inform Aboriginal communities, stakeholders, the public and government regulatory authorities about the approach to assessing potential environmental effects of the Project, and to seek input throughout the Project planning process
Section 3 – Pipeline Spills in the Terrestrial Environment
Describes the regulatory framework and response to hypothetical land-based pipeline spills, including response and mitigation strategies and remediation standards. Provides an evaluation of the potential environmental effects of spills in various terrestrial ecosystems along the pipeline corridor in response to spills in wetlands and forested and agricultural lands.
Section 4 – Description of the Freshwater Environment
Describes the exiting conditions within the freshwater environment along the proposed pipeline corridor.
Section 5 – Qualitative Ecological Risk Assessment Framework
A description of the methods used in the qualitative ecological risk assessment of acute and chronic ecological effects associated with a hypothetical pipeline spill in the freshwater environment along the proposed pipeline corridor.
Section 6 – Qualitative Ecological Risk Assessment
A qualitative assessment of the acute and chronic effects associated with a hypothetical pipeline spill in the freshwater environment along the proposed pipeline corridor. Includes the Problem Formulation, Exposure Assessment, Hazard Assessment, and Risk Characterization steps described in Section 5.
Section 7 – Summary and Conclusions A summary of the findings of the ecological risk assessment.
Section 8 – References A list of references cited.

Trans Mountain Pipeline ULC Volume 7, Pipeline Facilities Technical Reports Trans Mountain Expansion Project Qualitative Ecological Risk Assessment of
Pipeline Spills Technical Report
December, 2013 REP-NEB-TERA-00019
Page 2-1
2.0 CONSULTATION AND ENGAGEMENT
Trans Mountain and its consultants have conducted a number of engagement activities to inform Aboriginal communities, stakeholders, the public and regulatory authorities about the approach to assessing potential environmental and socio-economic effects of the Project, and to seek input throughout the Project planning process.
2.1. Public Consultation, Aboriginal Engagement and Landowner Relations
Trans Mountain has implemented and continues to conduct open, extensive and thorough public consultation, Aboriginal engagement and landowner relations programs. These programs were designed to reflect the unique nature of the Project as well as the diverse and varied communities along the proposed pipeline and marine corridors. These programs were based on Aboriginal communities, landowner and stakeholder groups‟ interests and inputs, knowledge levels, time and preferred methods of engagement. In order to build relationships for the long-term, these programs were based on the principles of accountability, communication, local focus, mutual benefit, relationship building, respect, responsiveness, shared process, sustainability, timeliness, and transparency.
Feedback related to the Project that was raised through various Aboriginal engagement and public consultation activities including public open houses, ESA Workshops, Community Workshops and one-on-one meetings, is summarized below and was considered in the development of this technical report, and the description of effects of pipeline spills in Volume 7:
• effect of spills on land, water fish and wildlife
The full description of the public consultation, Aboriginal engagement and landowner relations programs are located in Volumes 3A, 3B and 3C, respectively. Section 3.0 of Volumes 5A and 5B summarizes the consultation and engagement activities that have focused on identifying and assessing potential issues and concerns related to pipeline spills which may be affected by the construction and operation of the Project. Information collected through the public consultation, Aboriginal engagement and landowner relations programs for the Project was considered in the development of this technical report, and the assessment of pipeline spills in Volume 7.
2.2. Regulatory Consultation
Regulatory consultation with the applicable subject matter experts was conducted to present and discuss the proposed assessment methods and approaches for the various ERA studies. Consultation was completed in two phases with various expert groups including 1) consultation on the selection of ecological receptors for the ERA studies, and 2) consultation on the proposed oil spill fate modelling and assessment methods for assessing hypothetical spills.
Consultation on the selection of Key indicators for the ESA, and receptors for the ERA was completed in conjunction with the other ESA disciplines during a meeting held on April 16, 2013. The TMEP project team met with representatives from Environment Canada including members of the Canadian Wildlife Service (CWS) and the Environmental Assessment Office, as well as one external advisor to CWS. No specific comments or concerns were identified by the regulators during the consultation sessions, or through subsequent follow-up discussions.

Trans Mountain Pipeline ULC Volume 7, Pipeline Facilities Technical Reports Trans Mountain Expansion Project Qualitative Ecological Risk Assessment of
Pipeline Spills Technical Report
December, 2013 REP-NEB-TERA-00019
Page 3-1
3.0 PIPELINE SPILLS IN THE TERRESTRIAL ENVIRONMENT
As the movement of oil on land tends to be relatively limited and simpler in comparison to aquatic environments, response strategies can be more accurately targeted for land-based spills than for those in the aquatic environment. Land-based spills (e.g., spills to commercial or agricultural land, forested areas, and wetlands not having a free water surface) are not considered directly in the ERA; instead, the regulatory requirements and response strategies for pipeline spills in the terrestrial environment are discussed in this section. This is not to suggest that spills of crude oil to land will not result in negative environmental effects. Rather, it is an acknowledgement that spills that are limited to terrestrial habitats are likely to result in negative environmental effects that are more limited in spatial extent, and present fewer challenges for containment and recovery of spilled oil, as well as environmental restoration, than spills to water.
3.1. Regulation of Pipeline Spills in the Terrestrial Environment
Industry and regulatory authorities at the federal, provincial and local levels, share the responsibility to prepare for and respond to environmental emergencies, including land-based oil spills, with the common goal of protecting people, property and the environment. Small spills, such as those that may occur at a tank farm or pumping station within a facility, are generally dealt with directly by the facility operator (with reporting to the NEB as required). A larger spill with potential to cause off-site or off-right-of-way environmental effects could involve the mobilization and involvement of additional resources, under a Unified Command (UC) structure. Although a single Incident Commander normally handles the command function at an accident site, the Incident Command structure can be expanded into a Unified Command. The UC is an executive structure that includes the Responsible Party as well as regulators and other parties having key expertise related to the incident. This structure is used in order to coordinate an effective response while at the same time carrying out jurisdictional responsibilities. The UC helps to promote good and timely decision making and is responsible for overall management of the incident.
3.1.1. National Energy Board
The NEB is an independent federal regulatory authorities with the responsibility to regulate the construction and operation of interprovincial and international oil and gas pipelines and power lines. Established by the National Energy Board Act, the purpose of the NEB is to promote safety and security, environmental protection, and efficient energy infrastructure and markets in the Canadian public interest. Because the Project crosses provincial boundaries (i.e., Alberta and British Columbia), it is subject to regulation by the NEB.
NEB-regulated companies are required to maintain an up-to-date emergency procedures manual that addresses emergency management, environmental protection, and worker and public safety. In the event of a pipeline spill or release, companies are responsible for reporting the incident to the NEB, and for implementing the emergency management procedures outlined in the manual.
NEB-regulated pipelines are also regulated under the Canada Oil and Gas Operations Act and the Onshore Pipeline Regulations 1999 (OPR-99), whereby in the event of a spill, companies are required to:
Take reasonable measures to prevent further spillage Repair or remedy any condition resulting from the spill Reduce or mitigate any danger to life, health, property, or the environment.
The NEB has published a Remediation Process Guide (NEB 2011) to aid companies in the event of a spill. Upon detection, the company must report the spill to the NEB and all applicable regulators (e.g., Transportation Safety Board, provincial or territorial authorities). The company is then required to complete an Environmental Site Assessment and, if remediation is required, a Remedial Action Plan. The most stringent clean-up criteria must be used for remediation of soil and groundwater (i.e., the lower of provincial, territorial, or those developed by the Canadian Council of Ministers of the Environment

Trans Mountain Pipeline ULC Volume 7, Pipeline Facilities Technical Reports Trans Mountain Expansion Project Qualitative Ecological Risk Assessment of
Pipeline Spills Technical Report
December, 2013 REP-NEB-TERA-00019
Page 3-2
(CCME)), and the site is considered clean once the NEB approves the Remediation Closure Report, which demonstrates that all applicable standards have been met.
3.1.2. Provincial Regulatory Authorities
Although the Project will be regulated by the NEB, the involvement of other provincial and municipal regulatory authorities may be required depending on the particular circumstances of spill and site location. The involvement of provincial and municipal regulatory authorities is required when one or more of the following occurs as a result of a spill:
Contamination has occurred off-site The type of contamination has the potential for off-site migration The magnitude of the release has the potential for off-site migration of contaminants.
For on-site contamination from a spill, the involvement of provincial and municipal regulatory authorities may be required depending on a number of factors, including, but not limited to, the applicable provincial and municipal legislation and regulatory requirements, circumstances of the spill and site location.
3.1.2.1. Alberta
For NEB-regulated Projects, spills in Alberta are regulated by applicable provincial and municipal regulatory authorities, in addition to the NEB (and other applicable Federal regulatory authorities). For spills involving on-site or off-site contamination, Alberta Environment and Sustainable Resource Development (AESRD) must be immediately notified in accordance with the Environmental Protection and Enhancement Act of Alberta (EPEA) and the Release Reporting Regulation under EPEA. Under EPEA, reportable spills include those spills that have a substance released into the environment that could cause a negative effect, which is defined as “impairment of or damage to the environment, human health or safety or property”. Other definitions of reportable spills may be included in other applicable Acts, Regulations and Bylaws.
The Project proponent must comply with reporting, containment and clean-up requirements for spills in accordance with the applicable Alberta regulatory requirements for the Project, which may include, but are not limited to:
Regulatory requirements under EPEA, Alberta Tier 1 or Tier 2 Soil and Groundwater Remediation Guidelines (Alberta Environment 2010), and Surface Water Quality Guidelines for Use in Alberta (Alberta Environment 1999).
Regulatory requirements under provincial and municipal legislation for clean-up related activities, which may include, but are not limited to the applicable requirements under the Water Act (Alberta), Historical Resources Conservation Act (Alberta), Municipal Bylaws, Albertan wildlife, plants, habitat and species protection legislation, and other applicable Acts, Regulations and Bylaws.
For non-NEB regulated projects:
Spills in Alberta are regulated under Alberta Energy Regulator Directives (formerly Energy Resources Conservation Board (ERCB) Directives), the Oil and Gas Conservation Act and Regulations (151/71), the Pipeline Act and Regulations (91/2005), the Environmental Protection and Enhancement Act and Regulations, and other applicable Acts, Regulations and Bylaws.
As of June 2013, the Government of Alberta proclaimed the Responsible Energy Development Act, under which the Alberta Energy Regulator (AER) was launched. The AER replaces the ERCB and takes on the energy-related regulatory functions of the Alberta Ministry of Environment and Sustainable Resource Development with respect to public lands, water and the environment. The AER is currently being phased in; all phases will be complete in spring 2014.

Trans Mountain Pipeline ULC Volume 7, Pipeline Facilities Technical Reports Trans Mountain Expansion Project Qualitative Ecological Risk Assessment of
Pipeline Spills Technical Report
December, 2013 REP-NEB-TERA-00019
Page 3-3
3.1.2.2. British Columbia
In British Columbia, the Ministry of Environment‟s scope and responsibilities with respect to oil spills are set out in the Environmental Management Act and the Spill Reporting Regulation (BC Reg. 263/90). The Environmental Management Act sets out requirements for disposal of oil and hazardous materials, spill prevention and reporting, and pollution abatement. The Spill Reporting Regulation under the Act outlines the process for reporting spills, as well as the amounts of hazardous materials that must be reported if they are spilled. It requires the person in possession, charge, or control of the spilled substance to take all reasonable and practical actions to stop, contain, and minimize the effects of the spill.
British Columbia‟s land-based spill preparedness and response regime is guided by the “polluter-pay principle” in which industrial and commercial sectors that pose a risk to the environment and public safety have the responsibility to address risks and effects to human health and the environment. Industrial facilities that store, manufacture, transport, recycle, or handle dangerous goods, hazardous wastes, or hazardous chemicals should prepare a response (contingency) plan to respond to emergencies involving an accidental release of these substances into the environment.
When a spill occurs, the Responsible Party is expected to report the spill if a reportable level has been spilled into the environment, and to implement the operational decisions set out in the emergency response plan. Often the Responsible Party will either have a contractor that can be called in to respond to the spill or will have an Incident Management Team set up in case a spill occurs.
The Responsible Party is expected to take reasonable steps to contain the spill, and to restore the environment to its pre-spill condition. In many cases, the clean-up of a spill during the response is sufficient and no further investigation is required (British Columbia Ministry of Environment [BC MOE] 2009a). However, if additional follow-up is needed beyond the initial emergency response actions, such as continued monitoring, risk management, or extensive remediation, further actions would be conducted in accordance with the Environmental Management Act and Contaminated Sites Regulation
(BC Reg. 375/96).
Schedules contained in the Contaminated Sites Regulation define the numerical standards for soil, water, vapour, and sediment that are used to determine if a site is contaminated. Following that determination, a site owner/operator has the option of either cleaning up to the numerical standards listed in the Schedules or cleaning up to risk-based (site-specific) standards (BC MOE 2009b). Upon completion of clean-up activities, sampling and analyses are conducted and/or inspections and regular environmental monitoring are performed to confirm results.
3.2. Clean-up, Treatment, and Remediation Endpoints
The response actions and times for a land-based pipeline spill would depend on multiple factors including the volume and type of oil spilled, ground and air temperature, proximity to environmentally- or culturally-sensitive and/or human use areas, and surface conditions (i.e., roughness, vegetation type and cover, soil type, permeability, snow cover). In addition, the selection of appropriate control and containment techniques would consider the following, which would be assessed and monitored at the time of a spill:
Nature of the substrate Slope of the terrain Volume and thickness of the spilled oil Degree of penetration and potential for migration of the oil through the soil Presence and level of the water table and freshwater rivers and streams Biological community, resources, and cultural use.

Trans Mountain Pipeline ULC Volume 7, Pipeline Facilities Technical Reports Trans Mountain Expansion Project Qualitative Ecological Risk Assessment of
Pipeline Spills Technical Report
December, 2013 REP-NEB-TERA-00019
Page 3-4
As described in the General Oil Spill Response Plan, when containing a release on land, responders will attempt to:
Confine the affected site to as small an area as possible Prevent the released hydrocarbons from leaving the site Prevent surface water runoff from entering or leaving the site Prevent unauthorized humans and wildlife from entering the site Prevent the released hydrocarbons from reaching a waterway.
These goals are typically accomplished by using one or a combination of the following techniques:
Earth or lined sand bag dikes Sorbent dikes Snow or ice dikes Trenches Culvert blocks Bell holes.
Once contained on land, the released hydrocarbons would be recovered using suction or pumping. After the removal of liquid or pooled hydrocarbons, additional clean-up would continue using appropriate techniques (e.g., manual clean-up, sorbents, controlled burning, water flushing).
Plans for final site remediation, reclamation, and restoration activities would be developed as the emergency phase of spill response neared completion, typically after all free-phase liquid hydrocarbons and gross oiling had been removed and site assessments had been completed.
3.3. Net Environmental Benefits Analysis
During and after the clean-up of a large oil spill, the UC (comprising the response team, regulatory authorities, Aboriginal groups and other stakeholders) may review the remediation endpoints for the clean-up in combination with a Net Environmental Benefits Analysis (NEBA). The NEBA assesses the net environmental benefits gained by clean-up and remediation, in consideration of the environmental injuries caused by those activities (Efroymson et al. 2003), with the objective of enhancing recovery outcomes while minimizing further environmental damage.
Endpoints are characteristics of the environment that are considered to be an acceptable condition after clean-up and remediation (e.g., amount of weathered oil along a riverbank, amount of residual hydrocarbon remaining in soils). At a certain point in time, the environmental benefits that would be gained from further removal of residual hydrocarbons would be outweighed by potential damage caused by the clean-up or treatment activities. For example, removal of relatively low levels of weathered hydrocarbons could require extensive disturbance of riverbanks or wetlands which, if too intrusive, could delay rather than accelerate recovery (Baker 1995, 1997, Owens and Sergy 2003, 2007), or could permanently alter habitat.
An analysis of the net environmental benefits is required to assess the various recommended endpoints that promote natural recovery. Once the defined endpoint for a specific habitat (or substrate) is attained through clean-up and remediation measures, the residual hydrocarbons may be allowed to continue weathering through natural attenuation processes (e.g., biological degradation by microorganisms), which would continue to reduce their concentrations over time. The affected site would be monitored regularly to confirm that rehabilitation and recovery of the affected areas were successful. The need for and scope of monitoring would be determined in consultation with regulatory authorities, participating Aboriginal groups, and stakeholders, as appropriate.

Trans Mountain Pipeline ULC Volume 7, Pipeline Facilities Technical Reports Trans Mountain Expansion Project Qualitative Ecological Risk Assessment of
Pipeline Spills Technical Report
December, 2013 REP-NEB-TERA-00019
Page 3-5
3.4. Response and Mitigation for Land-based Spills
3.4.1. Agricultural Lands
A generic description of land-based spills is included in Section 6.2.1. A typical response to a pipeline spill in an area of agricultural land is described in the Application, Volume 7. Important elements of these standards have been summarized in the General Oil Spill Response Plan.
After completion of source control and containment actions, clean-up would likely include excavation and disposal of hydrocarbons and affected soils, and the remediation of groundwater, if applicable. The remediation of groundwater may involve one or more specialized treatment processes (e.g., in situ treatment, bioremediation, phytoremediation). To maintain use for agriculture, the priority would be to restore land capability within a reasonable amount of time. If the land is used for food production, excavation and replacement of soil is likely the most appropriate option. Affected soils would be replaced with soil of equal soil capability. Where possible, clean topsoil would be segregated and used for site reclamation.
Final site remediation, reclamation, and restoration activities require plans that would be developed and implemented as the emergency phase of spill response neared completion (i.e., typically after all free-phase liquid hydrocarbons and obvious oiling have been removed). Site-specific treatment plans would be required if groundwater was affected.
During emergency response activities, it is estimated that a small portion of diluted bitumen would weather, mainly through evaporation, in the first few days or hours, respectively. However, evaporation rates are likely to be lower during cold weather. Based on professional knowledge and general experience, approximately 99% of the recoverable volume (i.e., volume remaining taking into account evaporation and dissolution) would be recovered for inland spills that do not reach groundwater or surface water, leaving an approximate residual volume of less than 1%. The residual volume would then be subject to natural biodegradation and attenuation, which could be verified through test pits or drilling monitoring wells.
Given that land-based spills usually affect relatively small areas, there is a greater potential for predictions of the movement and environmental effects of a spill than for those in the aquatic environment. There are also greater operational opportunities and flexibility, and greater recovery potential (Owens 2002), as well as established response protocols and legislative frameworks for remediation. As a result, spill scenarios involving agricultural land are not considered further in the ERA.
3.4.2. Forested Areas
The pipeline will be located within a narrow right-of-way that will be maintained in grass and forb cover for the life of the Project. As a result, hydrocarbon spills from the pipeline would have to extend beyond this right-of-way to have an off-site effect on adjacent forested areas. This could occur through downslope movement of hydrocarbons on the surface, sub-surface, or in groundwater.
A generic description of land-based spills is included in Section 6.2.1. The description of response and mitigation for agricultural lands (Section 3.4.1) would also generally be applicable to forested areas, although the terrain could be more challenging, and site access could be more difficult.
Clearing and temporary roads may be required, as well as slope stabilization measures. During the initial response, objectives would include confining the hydrocarbon release to as small an area as reasonably possible, managing surface water, and preventing the contamination from reaching waterways or other environmentally-sensitive sites (e.g., biologically important areas, cultural sites, human use areas). To access the spill site and to accomplish the response objectives, efforts would be made to limit the amount of vegetation clearing and soil removal. Where possible, unaffected topsoil would be segregated and used during reclamation.

Trans Mountain Pipeline ULC Volume 7, Pipeline Facilities Technical Reports Trans Mountain Expansion Project Qualitative Ecological Risk Assessment of
Pipeline Spills Technical Report
December, 2013 REP-NEB-TERA-00019
Page 3-6
After free oil has been recovered, careful consideration would be given to the amount of additional clean-up that would be conducted. Clean-up decisions would need to consider net environmental benefit analyses (as described in Section 3.3).
Additional logistical challenges and factors that may be of importance in responding to spills in forested areas include:
Working on steep and uneven slopes Cleaning or removal and disposal of wood and organic debris Preserving topsoil Dealing with snow accumulations and the handling and disposal of contaminated snow Surface water management Presence of wildlife.
It is anticipated that in a typical forest spill scenario, less of the recoverable oil would be collected than for a similar spill to agricultural land. In general, land and other environmental media that would be affected by pipeline spills would be remediated to the applicable provincial environmental quality standards. As a result, spill scenarios involving forested areas are not considered further in the ERA.
3.4.3. Wetlands
Wetlands are considered to be environmentally sensitive areas; therefore, response options would be considered carefully to avoid further damage from clean-up and remediation activities. The response actions and times would differ depending on various factors including the oil type, amount spilled, meteorological conditions, and water level. In general, after the initial assessment, containment in wetlands would:
Confine the released hydrocarbons to as small an area as possible Prevent the hydrocarbons from reaching to an area where water movement could cause their rapid
dispersion Control wildlife and unauthorized humans from entering the site Restrict the potential for additional oiling of vegetation.
Containment of a release into wetlands would typically include one or more of the following techniques:
Earth or sand dikes Snow/ice dikes Trenches Containment booms Containment weirs Water-inflated dams.
Once contained, hydrocarbons would typically be recovered from wetlands using the following techniques:
Suction Pumping Fresh water flushing Oil skimming.
In general, other issues that would need to be considered include:
Soil disturbance Hydrodynamic effects Soil replacement Vegetation preservation

Trans Mountain Pipeline ULC Volume 7, Pipeline Facilities Technical Reports Trans Mountain Expansion Project Qualitative Ecological Risk Assessment of
Pipeline Spills Technical Report
December, 2013 REP-NEB-TERA-00019
Page 3-7
Natural attenuation Wildlife presence.
After free oil has been recovered, careful consideration would be given to the amount of additional clean-up that would be conducted. Clean-up decisions would need to consider net environmental benefit analyses (as described in Section 3.3).
Depending on the site and the amount of oiling, it is likely that a combination of clean-up methods (i.e., manual clean-up, sorbents, in situ burning, excavation) and natural attenuation could be used. The final remedial objectives and approach would be the decisions of the Unified Command based on:
Amount, location, type, and persistence of the hydrocarbons Nature and uses of the area Effects of various clean-up methods on the area and on native animal and plant species.
Natural attenuation would be considered if:
Clean-up activities were more harmful than allowing the habitat to recover naturally Hydrocarbon exposure would not cause further harm to environmentally sensitive areas of the site or
adjacent shoreline area Presence of the residual contamination was within applicable standards and was acceptable in terms
of the area‟s use.
Final site remediation, reclamation, and restoration activities would require plans that would be developed as the emergency phase of spill response neared completion (i.e., typically after all free-phase liquid hydrocarbons and obvious oiling have been removed). These plans may consider bioremediation as a type of natural attenuation.
Because of the uncertainty over the extent of burning or removal of soil and materials (i.e., peat), a conservative approach was taken in estimating the recovery of hydrocarbons. Without burning or aggressive excavation, a residual volume of approximately 20% to 30% of the spilled oil could remain on the wetland surface, in soil pore spaces, or bound to vegetation after initial weathering and recovery operations. Oil remaining after clean-up endpoints had been reached would continue to degrade, weather, and dissipate naturally. As a result, spill scenarios involving wetlands not having a free water surface were not considered further in the ERA.
3.5. Summary of Land-Based Spills
Due to the more confined and predictable nature of land-based spills (as opposed to those in the aquatic environment), they are more readily addressed through standard remediation strategies. Recovery of oil, often involving the physical removal of vegetation and surface soils, is usually practical and effective. Such response efforts would typically lead to a requirement for re-vegetation of the land subsequent to physical rehabilitation. While it is recognized that where mature forest is lost, such habitat can not be replaced in a short period of time, land-based spills (including the overland flowpath of spills that may enter aquatic environments) are considered to have recovered once site soils meet relevant soil quality guidelines, the site is re-vegetated, and all regulatory requirements have been met.
The environmental effects of a large crude oil spill to agricultural or forested land would undoubtedly be substantial. Unless there was a unique environmental feature such as critical habitat for an endangered mammal, bird, or plant species present, however, the environmental effects would generally be localized, reversible through the spill response and clean-up process, and affect only a small area of land in the context of the larger ecoregion within which effects would occur. Compensation to landowners for lost productive capacity would also mitigate damages. In the broader sense, therefore, and given their low probability of occurrence, the environmental effects of a crude oil spill to the terrestrial environment could be considered to be “not significant” in the context of the Environmental and Socio-economic Assessment (ESA) process.

Trans Mountain Pipeline ULC Volume 7, Pipeline Facilities Technical Reports Trans Mountain Expansion Project Qualitative Ecological Risk Assessment of
Pipeline Spills Technical Report
December, 2013 REP-NEB-TERA-00019
Page 3-8
Wetlands are transitional between terrestrial ecosystems and aquatic ecosystems, and as such, present a range of physical and biological properties. Where there is no free water surface (e.g., bogs and fens), the presence of vegetation such as peat and organic soils create conditions that limit the spread of hydrocarbons, and response and mitigation strategies can be applied as described in Section 3.4.3. In cases where there is a free water surface that facilitates the rapid spreading and downstream transport of oil (e.g., marshes, wet swamps, beaver impoundments, small open water bodies), wetlands will be more similar to watercourses both in terms of the receptors present and their sensitivity, and in terms of the remediation and rehabilitation methods implemented; the effects of hypothetical spills to the freshwater environment (which includes wetlands with a free water surface) are assessed in the ERA.

Trans Mountain Pipeline ULC Volume 7, Pipeline Facilities Technical Reports Trans Mountain Expansion Project Qualitative Ecological Risk Assessment of
Pipeline Spills Technical Report
December, 2013 REP-NEB-TERA-00019
Page 4-1
4.0 DESCRIPTION OF THE FRESHWATER ENVIRONMENT
The configuration of the Trans Mountain Expansion Project is shown in Figure 4.1. The proposed pipeline corridor originates in Alberta at the existing (Trans Mountain) Edmonton Terminal in Sherwood Park. From the Edmonton Terminal, the proposed pipeline corridor extends south, then west along the Edmonton Transit Utility Corridor (TUC), before diverging to the west towards the Town of Stony Plain. From the Stony Plain area, the proposed pipeline corridor generally parallels Highway 16 to Hinton, occasionally alternating between the north and south approaches of the highway. The Edmonton to Hinton Segment is approximately 340 km long and spans the North Saskatchewan and Athabasca River Basins. Within these basins, the following eight watersheds are crossed: Lower North Saskatchewan River; Middle North Saskatchewan River; Upper North Saskatchewan River; Sturgeon River; Pembina River; Lower McLeod River; Upper McLeod River; and Athabasca River.
Within British Columbia, the proposed pipeline corridor has been separated into the following construction segments: Hargreaves to Darfield, Black Pines to Hope, Hope to Burnaby, and Burnaby to Westridge. The proposed pipeline corridor spans two major drainage basins in British Columbia, which include the Fraser River Basin for much of its length, and the Columbia River Basin between Cedarside and Albreda. It also spans eastern portions of the existing BC Hydro 500 kV right-of-way near the settlement of Aspen Grove. Within the two river basins, the following thirteen watersheds are crossed: Upper Fraser River; Canoe Reach; Upper North Thompson River; Clearwater River; Lower North Thompson River; Thompson River; South Thompson River; Lower Nicola River; Fraser Canyon; Harrison River; Chilliwack River; Lower Fraser River; and Squamish.
The proposed pipeline corridor crosses 474 defined watercourses and also passes close to a number of important lakes and watercourses, such as Wabamun Lake and the Athabasca, North Thompson and Fraser Rivers. Figures 4.2 and 4.3 show the watersheds and major watercourses crossed by the proposed pipeline corridor.
Detailed fisheries information including the characteristics, fish species and status of fish species present in watercourses crossed by the proposed pipeline corridor are described in the fisheries reports prepared by TERA Environmental Consultants (2013) for the Province of Alberta, and by Triton Environmental Consultants (2013) for the Province of British Columbia.
The following sections summarize information on the existing conditions within each river basin traversed by the Project.
4.1. North Saskatchewan River Basin
The North Saskatchewan River originates in the Columbia Icefield in Banff National Park at an elevation of approximately 2,200 metres above sea level (masl). It flows approximately 1,400 km in a generally northeast direction through Edmonton to its confluence with the South Saskatchewan River in central Saskatchewan at an elevation of approximately 400 masl.
Within the North Saskatchewan River Basin, the Project crosses through four watersheds (Lower, Middle and Upper North Saskatchewan River and Sturgeon River) and the following larger watercourses: Goldbar Creek; Mill Creek; Whitemud Creek; Blackmud Creek; Dog Creek; Atim Creek; Kilini Creek; and the North Saskatchewan River (as shown in Table 4.1).

ZB MS
Nov 2013 A123110494_032_TRANSMOUNTAINROUTE_OVERVIEW
7894SHEET 1 OF 1
8.5 x 11 AQZB
MAP NUMBER
REVISION
DISCIPLINE
TERA REF.DATE
SCALE
PAGE
PAGE SIZE
DRAWN CHECKED DESIGN
ALL LOCATIONS APPROXIMATE
ALBERTA
BRITISHCOLUMBIA
Sources: Esri, USGS, NOAA
300000
300000
400000
400000
500000
500000
600000
600000
700000
700000
800000
800000
900000
900000
1000000
1000000
1100000
1100000
1200000
1200000
1300000
13000005400
000
5400
000
5500
000
5500
000
5600
000
5600
000
5700
000
5700
000
5800
000
5800
000
5900
000
5900
000
6000
000
6000
000
0 50 100 150 200km
1:4,500,000
1:4,500,000SCALE:
Trans Mountain Expansion ProjectProposed Pipeline CorridorExisting Trans Mountain PipelineProvincial Boundary
¯
This document is provided by Kinder Morgan Canada Inc. (KMC) for use by the intended recipient only. This information is confidential and proprietary to KMC and is not to be provided to any other recipient without the written consent of KMC. It is not to be used for
legal, engineering or surveying purposes, nor for doing any work on or around KMC's pipelines and facilities, all of which require KMC's prior written approval.Although there is no reason to believe that there are any errors associated with the data used to
generate this product or in the product itself, users of these data are advised that errors in the data may be present.
References:Bathymetry: Canadian Hydrographic Service, 2011Inbound & Outbound Shipping Lane: Moffat and Nichol, 2013Land of British Columbia: National Topographic Data Base, 2007Shore Types: BC MFLNRO, 2005Territorial Sea Boundary: Extrapolated from shoreline data (IHS Inc., 2011 & ESRI, 2005)Watercourse: National Hydrology Network, 2007Westridge Marine Terminal: Moffatt and Nichol, 2012
TRANS MOUNTAINEXPANSION PROJECT
TRANS MOUNTAINEXPANSIONPROJECT
FIGURE: 4.1

!5
HINTON
North Saskatchew an River
Sturgeon River
Pembina River
McLe
od
River
Athabas ca
River
North Sa
skatch
ewan River
McLeod River
McL e
odRi
ver
Athaba
sca River
Pembina River
Cross LakeProvincial
Park
Long LakeProvincial
Park
ProvincialPark
Thunder LakeProvincial
Park
SundanceProvincial
Park
Obed LakeProvincial Park
WilliamA. Switzer
Provincial Park
Strathcona ScienceProvincial Park
Pigeon LakeProvincial
Park
Crimson LakeProvincial
Park
Wabamun LakeProvincial Park
Eagle PointProvincial
Park
Miquelon LakeProvincial Park
Pembina RiverProvincial
Park
Rochon SandsProvincial
ParkAspen BeachProvincial
Park
Sylvan LakeProvincial
Park
Elk IslandNational Park
of Canada
JasperNational Park
of Canada
Banff NationalPark ofCanada
¬«16
¬«16
¬«2
¬«43
LACOMBE
CAMROSE
EDMONTON
FORT SASKATCHEWAN
LEDUC
RED DEER
SPRUCEGROVE
ST.ALBERT
WETASKIWIN
RK 309.0
AthabascaRiver
WatershedLower McLeod
RiverWatershed
PembinaRiver
Watershed
UpperMcLeod River
Watershed
SturgeonRiver
Watershed
Lower NorthSaskatchewan
River Watershed
Upper NorthSaskatchewan
River Watershed
Middle NorthSaskatchewan
River Watershed
Sources: Esri, USGS, NOAA
450000
450000
500000
500000
550000
550000
600000
600000
650000
650000
700000
700000
750000
750000
800000
800000
5800
000
5800
000
5850
000
5850
000
5900
000
5900
000
5950
000
5950
000
6000
000
6000
000
6050
000
6050
000
123110
494_03
0_Aqu
aticEn
v_AB.m
xd
0 5 10 15 20km
ZB MS
Projection: UTM Zone 11N (p. 1 to 77), UTM Zone 10N (p. 78 to146). Route Revision: 2; Facilities; B/W & Colour Imagery: 2008-2011: Provided by KMC, 2012; Existing Infrastructure: IHS Inc.,2012; Transportation: IHS Inc., 2012, BC Crown Registry and
Geographic Base Branch, 2010, Natural Resources Canada, 2011;Geopolitical Boundaries: Natural Resources Canada, 2003, AltaLIS,
2012, IHS Inc., 2011, BC FLNRO, 2007, ESRI, 2005; First NationLands: Government of Canada, 2012, AltaLIS, 2010, IHS Inc., 2011;
Hydrology: Natural Resources Canada, 2007, BC Crown Registryand Geographic Base Branch, 2008; Parks and Protected Areas:
Natural Resources Canada, 2012, AltaLIS, 2012, BC FLNRO, 2008;Club Root Infested Areas: Provided by KMC, 2012; Access and
Private Land: KMC & TERA, 2012. 1:50,000 NTS Maps: © 2012.Produced under license from Her Majesty the Queen in Right of
Canada, with permission of NRCan.
29 Nov 2013 A123110494_030_AQUATICENV_AB
78941:1,100,000
SHEET 1 OF 2
11x17 AQZB
MAP NUMBER
REVISION
DISCIPLINE
TERA REF.DATE
SCALE
PAGE
PAGE SIZE
DRAWN CHECKED DESIGN
This document is provided by Kinder Morgan Canada Inc. (KMC)for use by the intended recipient only. This information is
confidential and proprietary to KMC and is not to be provided toany other recipient without the written consent of KMC. It is notto be used for legal, engineering or surveying purposes, nor for
doing any work on or around KMC's pipelines and facilities, all ofwhich require KMC's prior written approval.
Although there is no reason to believe that there are anyerrors associated with the data used to generate this productor in the product itself, users of these data are advised that
errors in the data may be present.
ALL LOCATIONS APPROXIMATE
SCALE: 1:1,100,000
¯ AQUATIC ENVIRONMENTTRAVERSED BY THE TRANSMOUNTAIN EXPANSIONPROJECT IN ALBERTA
FIGURE: 4.2
!5 Representative SpillLocationTrans MountainExpansion ProjectProposed PipelineCorridorExisting Trans MountainPipelineHighwayRailwayWatershed BoundaryCity / Town / DistrictMunicipalityIndian ReserveNational ParkProvincial ParkProtected Area / NaturalArea / ProvincialRecreation Area /Wilderness ProvincialPark / ConservancyAreaProvincial Boundary

1231
1049
4_03
1_Aq
uaticE
nv_BC
.mxd
!5
!5!5
"
Maskuta
Creek
Fiddle RiverJASPERNATIONAL
PARK
Harrison Lake
Ni co laLa
ke
Kamloops Lake
Adam sLa
ke
Kinbasket Lake
Okan
agan
Lak e
Harrison RiverWatershed Similkameen
Watershed
Upper Fraser RiverWatershed
South ThompsonRiver Watershed
Westridge
Chilliwack River Watershed
Lower FraserRiver Watershed
C h illiwack River
Harrison Rive
r
Fraser River
Similkameen River
NicolaRiv er
Thompson River
Fraser River
Clearwater River
Canoe River
Squamish River
BonapartePark
MarbleRangePark
GranbyPark
NazkoLakePark
OkanaganMountain
Park
CumminsLakesPark
PineconeBurke Park
BigCreekPark
UpperSeymour
River Park
HamberPark
GraystokesPark
MountRobson
Park
CathedralPark
South ChilcotinMountains Park
GaribaldiPark
GladstonePark
GoldenEars Park
EdgeHillsPark
BowronLake Park
CaribooMountains
Park
MonasheePark
WellsGrayPark
MehatlCreekPark
SteinValleyPark
BirkenheadLake Park
TantalusPark
E.C.Manning
ParkSkagitValleyPark
¬«26
¬«20
¬«8
¬«24
¬«97
¬«5
¬«6
¬«3A
¬«12¬«99
¬«97
¬«33
¬«1
¬«3
¬«23
¬«1
METROVANCOUVER
WELLS
WILLIAMSLAKE
100 MILEHOUSE
REVELSTOKE
SICAMOUS
SALMONARM
CACHECREEK
CACHECREEK
LOGANLAKE
KAMLOOPS
CLINTON
CLINTON
ENDERBY
GRANDFORKS
WESTKELOWNA
OSOYOOS
OLIVER
PRINCETONHOPE
KENTMISSION
SQUAMISH
PEMBERTON
LILLOOET
VERNON
ARMSTRONG
VALEMOUNT
CLEARWATER
BARRIERE
RK 766.0
RK 1072.8RK1167.5
ClearwaterRiver
Watershed
Canoe ReachWatershed
Upper NorthThompson River
Watershed
ThompsonRiver
Watershed
FraserCanyon
Watershed
LowerNicola RiverWatershed
SquamishWatershed
Lower NorthThompson River
Watershed
Sources: Esri, USGS, NOAA
500000
500000
550000
550000
600000
600000
650000
650000
700000
700000
750000
750000
800000
800000
5450
000
5450
000
5500
000
5500
000
5550
000
5550
000
5600
000
5600
000
5650
000
5650
000
5700
000
5700
000
5750
000
5750
000
5800
000
5800
000
5850
000
5850
000
5900
000
5900
000
Although there is no reason to believe that there are any errorsassociated with the data used to generate this product or in theproduct itself, users of these data are advised that errors in the datamay be present.
0 5 10 15 20km
ZB MS
29 Nov 2013 A123110494_031_AQUATICENV_BC
78941:1,500,000
SHEET 2 OF 2
11x17 AQZB
MAP NUMBER
REVISION
DISCIPLINE
TERA REF.DATE
SCALE
PAGE
PAGE SIZE
DRAWN CHECKED DESIGN
ALL LOCATIONS APPROXIMATE
This document is provided by Kinder Morgan Canada Inc. (KMC) for use by the intended recipient only. This information is confidential and proprietary to KMC and is not to be provided to any other recipient without thewritten consent of KMC. It is not to be used for legal, engineering or surveying purposes, nor for doing any work on or around KMC's pipelines and facilities, all of which require KMC's prior written approval.
1:1,500,000SCALE: FIGURE: 4.3
AQUATIC ENVIRONMENTTRAVERSED BY THE TRANSMOUNTAIN EXPANSIONPROJECT INBRITISH COLUMBIA
References:International Border: ESRI, 2013Land of British Columbia: National Topographic Data Base, 2007Land of Washington State: Department of Ecology, State of Washington, 1994.Salish Sea Boundary: ESRI, 2013Westridge Marine Terminal: Moffatt and Nichol, 2012
¯
" Terminal!5 Representative Spill Location
Trans Mountain ExpansionProject Proposed PipelineCorridorExisting Trans MountainPipelineHighwayRailway
Watershed BoundaryCity / Town / DistrictMunicipalityNational ParkProvincial ParkProvincial Boundary

Trans Mountain Pipeline ULC Volume 7, Pipeline Facilities Technical Reports Trans Mountain Expansion Project Qualitative Ecological Risk Assessment of
Pipeline Spills Technical Report
December, 2013 REP-NEB-TERA-00019
Page 4-5
TABLE 4.1 SUMMARY OF WATERSHEDS AND MAJOR WATERCOURSE CROSSINGS IN THE NORTH SASKATCHEWAN RIVER BASIN
Watersheds Crossed by the Project Major Watercourses Crossed by the Project
Lower North Saskatchewan River Goldbar Creek
Mill Creek
Middle North Saskatchewan River Blackmud Creek
Whitemud Creek
North Saskatchewan River
Sturgeon River Dog Creek
Atim Creek
Kilini Creek
Upper North Saskatchewan River n/a
The Project traverses the upper and middle reaches of the North Saskatchewan River Basin. Land use in the upper reach (headwaters to Devon) is dominated by forestry and agriculture, with some industry (e.g., oil and gas, power generation) and municipal development (Alberta Environment 2007). In the middle reach (Devon to Pakan), land use is dominated by industrial and municipal development (i.e., Edmonton and Fort Saskatchewan) (Alberta Environment 2007).
Peak flows vary depending on the size and location of the watercourse. As shown in Table 4.2, lower elevation streams (e.g., Whitemud Creek) reach peak flows earlier (e.g., April) than higher elevation streams due to early spring snowmelt on the plains. Lowest flows occur just prior to freeze-up (e.g., October). In contrast, higher elevation streams such as the North Saskatchewan River reach peak flows later in the season (e.g., June) as a result of glacier and mountain snowmelt. Lowest flows occur in winter (e.g., February). Water flows in the North Saskatchewan River are also regulated by two large hydroelectric dams. The Bighorn Dam is located on the North Saskatchewan River at Abraham Lake in the foothills of the Rocky Mountains, and the Brazeau Dam is located on the Brazeau Reservoir near the Brazeau River‟s confluence with the North Saskatchewan River. The Bighorn and Brazeau dams are located upstream from the proposed pipeline corridor, approximately 330 km and 190 km, respectively. In general, these dams increase winter flows and decrease summer flows (Partners for the Saskatchewan River Basin 2009).
TABLE 4.2 STREAMFLOWS FROM HYDROLOGICAL STATIONS NEAR WATERCOURSE CROSSINGS IN THE NORTH SASKATCHEWAN RIVER BASIN
Station Name, Station Number
Approximate Location of Station Relative to the Project
Month and Mean Monthly Discharge (m3/s) during the
Lowest Flow Period
Month and Mean Monthly Discharge (m3/s) during the
Highest Flow Period
Whitemud Creek near Ellerslie 05DF006
10 km upstream October
0.03 m3/s April
2.3 m3/s
North Saskatchewan River at Edmonton 05DF001
10 km downstream February 69.1 m3/s
June 484.0 m3/s
Notes: Streamflow data from the Water Survey of Canada (Environment Canada 2013)
Water quality is rated as „good‟ (i.e., minor impairment relative to reference or natural conditions) in the upper reach of the North Saskatchewan River Basin and as „fair‟ (i.e., moderate impairment relative to reference or natural conditions) in the middle reach (as a result of nutrient enrichment); all reaches showed an increase in concentrations of dissolved solids over the period from the 1980s to 2004, possibly due to low river discharges (Alberta Environment 2007). Bottom substrates in the upper reach consist primarily of cobble, pebble and gravel, and are colonized by benthic invertebrates that prefer clean substrates, well-oxygenated water, and swift currents (e.g., mayflies, caddisflies, stoneflies) (Alberta Environment 2007). In the middle reach, sediments downstream of Edmonton tend to be higher in organic carbon and trace metals than those upstream, and benthic algae and invertebrate communities reflect changes associated with nutrient enrichment (Alberta Environment 2007).

Trans Mountain Pipeline ULC Volume 7, Pipeline Facilities Technical Reports Trans Mountain Expansion Project Qualitative Ecological Risk Assessment of
Pipeline Spills Technical Report
December, 2013 REP-NEB-TERA-00019
Page 4-6
Indicator fish species previously documented in the North Saskatchewan River Basin include lake sturgeon, bull trout, burbot, walleye and northern pike. Other species of management concern include lake trout, brook trout, brown trout, cutthroat trout, goldeye, mountain whitefish, sauger, spoonhead sculpin, silver redhorse, quillback and northern redbelly dace.
4.2. Athabasca River Basin
The Athabasca River originates in Jasper National Park, in an unnamed lake at the toe of the Athabasca Glacier at an elevation of approximately 1,500 masl. It flows for approximately 1,231 km in a generally northeast direction across the province and drains into Lake Athabasca, north of the City of Fort McMurray at an elevation of approximately 200 masl.
As shown in Table 4.3, the watersheds crossed by the Project within the Athabasca River Basin include the Pembina River, the Lower McLeod River, the Upper McLeod River and the Athabasca River watersheds. Major watercourses crossed by the proposed pipeline corridor include the Pembina, McLeod and Lobstick Rivers and Zeb-igler, Carrot, January, Brule, Little Brule, Wolf, Bench, Carrot, Rooster, Ponoka, Roundcroft, Sandstone, Hunt, Trail, Hardisty, Maskuta, Sundance and Little Sundance Creeks.
TABLE 4.3 SUMMARY OF WATERSHEDS AND WATERCOURSE CROSSINGS IN THE ATHABASCA RIVER BASIN
Watersheds Major Watercourses Crossed by the Project
Pembina River Zeb-igler Creek
Little Brule Creek
Brule Creek
Lobstick River
Pembina River
Lower McLeod River Carrot Creek
January Creek
Wolf Creek
Bench Creek
McLeod River
Upper McLeod River Little Sundance Creek
Sundance Creek
Athabasca River Rooster Creek
Ponoka Creek
Roundcraft Creek
Sandstone Creek
Hunt Creek
Trail Creek
Hardisty Creek
Maskuta Creek
The Project crosses the middle and upper reaches of the Athabasca River Basin. Land uses in these areas include agriculture, industry (e.g., pulp mills) and municipalities. The Athabasca River receives discharges from various pulp and paper mills and municipal wastewater treatment plants (i.e., in Jasper, Hinton, Whitecourt, Athabasca and Fort McMurray), which contribute to nutrient enrichment and lower dissolved oxygen concentrations (Alberta Environment 2007).
As shown in Table 4.4, water flows in the Athabasca River Basin show similar seasonal patterns. Flows are lowest during February and discharge begins to increase during the spring. Peak flows vary depending on the size and location of the waterbody; lower elevation streams reach peak flows earlier due to early spring snowmelt on the plains.

Trans Mountain Pipeline ULC Volume 7, Pipeline Facilities Technical Reports Trans Mountain Expansion Project Qualitative Ecological Risk Assessment of
Pipeline Spills Technical Report
December, 2013 REP-NEB-TERA-00019
Page 4-7
TABLE 4.4 STREAMFLOWS FROM HYDROLOGICAL STATIONS NEAR WATERCOURSE CROSSINGS IN THE ATHABASCA RIVER BASIN
Station Name, Station Number
Approximate Location of Station Relative to the Project
Month and Mean Monthly Discharge (m3/s) during the
Lowest Flow Period
Month and Mean Monthly Discharge (m3/s) during the
Highest Flow Period
Wolf Creek at Highway No. 16A 07AG003
500 m downstream February 0.52 m3/s
July 9.3 m3/s
Pembina River near Entwistle 07BB002
2 km downstream February 2.3 m3/s
May 49.6 m3/s
McLeod River near Whitecourt 07AG004
75 km downstream February 4.1 m3/s
June 110.0 m3/s
Notes: Streamflow data from the Water Survey of Canada (Environment Canada 2013)
Water quality is rated as „excellent‟ (i.e., no measurable impairment relative to reference or natural conditions) in the upper reach of the Athabasca River and as „good‟ in the middle reach (Alberta Environment 2007). Effluent discharges from pulp and paper mills and wastewater treatment plants result in increased nutrient concentrations downstream of these point sources. Sediment quality in the middle reach is rated as „fair‟ (i.e., contaminant concentrations show moderate degradation relative to reference or natural conditions) (Alberta Environment 2007). Sediments in both the upper and middle reaches are directly affected by the accumulation of organic contaminants from industrial and other human activity.
The McLeod River, a major tributary that is crossed by the Project, discharges large volumes of water and suspended sediment (and associated nutrient loads) to the Athabasca River. Water quality is rated as „fair‟ as a result of inputs from various sources including forestry operations, mining (e.g., selenium from coal mining), and agriculture (Alberta Environment 2007).
Nutrient enrichment in the naturally nutrient poor stretches of the Athabasca River results in increased benthic algal biomass and invertebrate abundance (i.e., midge larvae) downstream of point sources (Alberta Environment 2007).
Indicator fish species that have been previously documented in the Athabasca River Basin include bull trout, Arctic grayling, Athabasca rainbow trout, northern pike, walleye and burbot. Other species of management concern include brown trout, brook trout, rainbow trout (native populations), mountain whitefish, yellow perch, goldeye, spoonhead sculpin and northern redbelly dace.
The Athabasca Watershed Council (AWC) is an independent, non-profit organization that is a designated Watershed Planning and Advisory Council working in partnership with the Government of Alberta to assess the condition of the Athabasca watershed and prepare plans and solutions to address watershed issues to protect and improve water quality and ecosystem function (Government of Alberta 2013).
An Integrated Watershed Management Plan for the Athabasca River watershed is currently under development by the AWC (AWC 2013). The purpose of the plan, to be fully implemented over the next several years, is to provide a guide for the protection, maintenance and restoration of the Athabasca watershed that balances environmental, social and economic needs. Once complete, the plan will be presented to all sectors, communities and citizens who have interest and commitment to the ecological health and sustainability of the watersheds, for voluntary implementation of recommendations.
The AWC is currently working to identify environmental issues in the watershed by compiling, analyzing and interpreting scientific and technical information into a multi-phase Athabasca State of the Watershed Report. Recommended solutions to issues identified in the various phases of the report will be compiled into the Athabasca Integrated Watershed Management Plan (AWC 2013).
Human activities within the Athabasca River watershed pose risks to surface water quality. For example, agricultural runoff causes nutrient and chemical loading such as phosphorus, nitrogen, pesticides and fecal organisms. These can lead to algal blooms, increased pathogens and nitrates in drinking water, and

Trans Mountain Pipeline ULC Volume 7, Pipeline Facilities Technical Reports Trans Mountain Expansion Project Qualitative Ecological Risk Assessment of
Pipeline Spills Technical Report
December, 2013 REP-NEB-TERA-00019
Page 4-8
the emission of odors and gases into the air. Common industrial contaminants from oil sands, pulp mills, coal mining and municipal sewage treatment discharged or leaked into surface water can pose risks to animal and human health. Due to the potential risks posed by point and non-point source contamination of surface water, the maintenance of surface water quality is a high management priority in the Athabasca River Watershed (FIERA Biological Consulting 2012).
4.3. Columbia River Basin
The Columbia River originates in the Rocky Mountain Trench at an elevation of 820 masl. It flows northwest through the Columbia Valley to Kinbasket Lake, after which it flows south, eventually crossing the border into the United States of America before draining into the Pacific Ocean. The total length of the Columbia River is approximately 1,930 km, of which 668 km is located in Canada.
The main stem of the Columbia River is not crossed by the Project, although there are four crossings of watercourses that drain into the Columbia River Basin, including a proposed crossing of Canoe River and three crossings of Camp Creek (Table 4.5).
TABLE 4.5 SUMMARY OF WATERSHEDS AND NAMED WATERCOURSE CROSSINGS IN THE COLUMBIA RIVER BASIN
Watersheds Major Watercourses Crossed by the Project
Canoe Reach Canoe River
Camp Creek
Canoe River originates from the South Canoe Glacier near Mount Sir John Thompson in the Caribou Mountains and flows southeast for approximately 40 km to its confluence with Kinbasket Lake. This arm of Kinbasket Lake is referred to as Canoe Reach because it was previously the lower reach of the Canoe River. Canoe Reach was created when lower portions of the Canoe River were flooded during installation of the Mica Dam in 1973.
Within Canada, valley bottoms along the middle and lower reaches of the Columbia River Basin have been heavily modified by industrial development, hydroelectric dams, agriculture, transportation and communication networks, rural settlement and municipalities (BC MOE 2013a). The upper reach is located upstream of the Project and therefore not anticipated to be affected by the Project.
As shown in Table 4.6, water flows on Canoe River show peak flows during July (43.7 m3/s) and lowest flows during February (1.65 m3/s). These results are consistent with other mountain-fed watercourses in which flows correlate with delayed snowmelt in the mountains.
TABLE 4.6 STREAMFLOWS FROM HYDROLOGICAL STATIONS NEAR WATERCOURSE CROSSINGS IN THE COLUMBIA RIVER BASIN
Station Name, Station Number
Approximate Location of Station Relative to the Project
Month and Mean Monthly Discharge (m3/s) during the
Lowest Flow Period
Month and Mean Monthly Discharge (m3/s) during the
Highest Flow Period
Canoe River below Kimmel Creek 08NC004
9.4 km upstream February 1.7 m3/s
July 43.7 m3/s
Notes: Streamflow data from the Water Survey of Canada (Environment Canada 2013)
Important sportfish species found in Canoe River include bull trout, rainbow trout, mountain whitefish and pygmy whitefish. Non-sportfish species include longnose sucker and slimy sculpin. Kokanee also migrate through the lower reaches of the Canoe River to access Camp Creek, which is an important spawning and rearing tributary for sportfish including kokanee, bull trout and rainbow trout. Non-sportfish species in Canoe River and Camp Creek include slimy sculpin, prickly sculpin and lake chub.

Trans Mountain Pipeline ULC Volume 7, Pipeline Facilities Technical Reports Trans Mountain Expansion Project Qualitative Ecological Risk Assessment of
Pipeline Spills Technical Report
December, 2013 REP-NEB-TERA-00019
Page 4-9
4.4. Fraser River Basin
The Fraser River, which is the longest river in British Columbia (approximately 1,370 km), originates at the base of Cube Ridge in Mount Robson Provincial Park in the Rocky Mountains. It flows northwest to Prince George before heading south to the Lower Mainland, where it enters the Strait of Georgia near the City of Vancouver. The Fraser River has been proclaimed nationally as a Canadian Heritage River (Canadian Heritage Rivers System 2011).
As shown in Table 4.7, the watersheds traversed by the Project within the Fraser River Basin include the Upper Fraser River, Upper North Thompson River, Lower North Thompson River, Clearwater River, Thompson River, South Thompson River, Lower Nicola River, Fraser Canyon, Harrison River, Chilliwack River, Lower Fraser River and Squamish. Major watercourses crossed by the Project include the Fraser River, North Thompson River, Clearwater River, Thompson River, South Thompson River, Nicola River, Coldwater River, Coquihalla River, Lower Fraser River and Chilliwack River.
TABLE 4.7 SUMMARY OF WATERSHEDS AND MAJOR WATERCOURSE CROSSINGS IN THE FRASER RIVER BASIN
Watersheds Major Watercourses Crossed by the Project
Upper Fraser River Fraser River
Upper North Thompson River North Thompson River
Lower North Thompson River North Thompson River
Clearwater River Clearwater River
Thompson River Thompson River
South Thompson River South Thompson River
Lower Nicola River Nicola River
Coldwater River
Fraser Canyon Coquihalla River
Lower Fraser River
Harrison River Lower Fraser River
Chilliwack River Chilliwack River
Lower Fraser River
Lower Fraser River Lower Fraser River
Squamish Lower Fraser River
The Project traverses the middle of the Fraser River Basin; the corridor runs parallel to the Upper Fraser River, the North Thompson River and the Lower Fraser River from Hope to Surrey. Land uses in the river basin include forestry, agriculture, livestock grazing, industry (e.g., pulp and paper), transportation and utility corridors, municipalities and recreation (e.g., fishing, hiking, skiing).
Water flows within the Fraser River Basin vary depending on the size and location of the watercourse. As shown in Table 4.8, peak flows generally occur in spring/early summer (i.e., May and June). West of the Rocky Mountains, small watercourses (e.g., West Creek near Fort Langley) experience peak flows in early winter as a result of the heavy autumn and winter rains that result from the rain shadow effect of the Rocky Mountains. At higher elevations, lowest flows occur in the winter prior to freeze-up (e.g., January to March), whereas at lower elevations, lowest flows occur at the end of the dry season (e.g., August and September).

Trans Mountain Pipeline ULC Volume 7, Pipeline Facilities Technical Reports Trans Mountain Expansion Project Qualitative Ecological Risk Assessment of
Pipeline Spills Technical Report
December, 2013 REP-NEB-TERA-00019
Page 4-10
TABLE 4.8 STREAMFLOWS FROM HYDROLOGICAL STATIONS NEAR WATERCOURSE CROSSINGS IN THE FRASER RIVER BASIN
Station Name, Station Number
Approximate Location of Station Relative to the Project
Month and Mean Monthly Discharge (m3/s) during the
Lowest Flow Period
Month and Mean Monthly Discharge (m3/s) during the
Highest Flow Period
Fraser River at Red Pass 08KA007
25.3 km upstream March
5.3 m3/s June
153 m3/s
North Thompson River at Birch Island 08LB047
59.4 km downstream February 28.1 m3/s
June 446 m3/s
Clearwater River near Clearwater Station 08LA001
2.3 km upstream February 45.1 m3/s
June 717 m3/s
Thompson River at Kamloops 08LF023
5.7 km upstream February 137 m3/s
June 2070 m3/s
Nicola River at Outlet of Nicola Lake 08LG065
7.2 km upstream January 1.5 m3/s
June 16.6 m3/s
Coldwater River near Brookmere 08LG048
4.9 km downstream September
1.2 m3/s May
23.5 m3/s
Coquihalla River below Needle Creek 08MF062
13 km upstream September 0.83 m3/s
May 9.9 m3/s
Coquihalla River above Alexander Creek 08MF068
2.6 km upstream September
9.1 m3/s May
68.5 m3/s
Chilliwack River at Vedder Crossing 08MH001
4 km upstream September 34.4 m3/s
June 137 m3/s
West Creek near Fort Langley 08MH098
Within proposed pipeline corridor August
0.03 m3/s January
0.98 m3/s
Fraser River at Port Mann Pumping Station 08MH126
0.5 km upstream January
1,780 m3/s June
8,590 m3/s
Notes: Streamflow data from the Water Survey of Canada (Environment Canada 2013)
Major rivers to be crossed by the Project in the Fraser River Basin include the Fraser, Thompson (North, South and mainstem), Clearwater, Nicola, Coldwater and Coquihalla rivers.
The Fraser River Watershed provides spawning and rearing habitat for six species of Pacific salmon (including steelhead trout) and is the largest salmon producing river in British Columbia. Chinook salmon are the only known Pacific salmon species to spawn and rear in the Upper Fraser River mainstem and tributaries (Fedorenko et al. 1983). Other important sportfish species in the Upper Fraser River Watershed include rainbow trout, bull trout, lake whitefish, pygmy whitefish, mountain whitefish, burbot and white sturgeon. Non-sportfish species include slimy sculpin, lake chub, longnose dace, longnose sucker, northern pikeminnow, peamouth chub and redside shiner.
The lower Fraser River and its estuary provide critical rearing, staging and migratory habitat for adult and juvenile salmon. This section of the Fraser River is also important as resident salmon undergo physiological changes to acclimatize from a saline to freshwater environment (adult salmon) and from a freshwater to saline existence (juvenile salmon) (Langer 2010). Lower Fraser tributaries also provide key spawning areas for Pacific salmon.
The Fraser River is one of three major rivers on the Pacific coast that supports spawning populations of white sturgeon (Hanson and Cochnauer 1992). Key spawning and rearing areas for white sturgeon have been identified upstream from the proposed Fraser River crossing located between the district of Mission and the town of Yale (Perrin et al. 2000). One important spawning site is the Fraser mainstem downstream (0.5 km) from the confluence with the Coquihalla River (COSEWIC 2003). The lower reaches

Trans Mountain Pipeline ULC Volume 7, Pipeline Facilities Technical Reports Trans Mountain Expansion Project Qualitative Ecological Risk Assessment of
Pipeline Spills Technical Report
December, 2013 REP-NEB-TERA-00019
Page 4-11
of the Fraser River are used predominantly for feeding and migration which may also include lower portions of the Sumas and Chilliwack rivers. Green sturgeon observations are rare in freshwater and there are no known spawning sites in BC; however, there are some historical records in the lower Fraser River (the most recent was near Fort Langley in 2005) (McPhail 2007).
The North Thompson River flows east towards Highway 5 and south for approximately 325 km before joining up with the South Thompson River at Kamloops. The confluence between the North and South Thompson rivers marks the beginning of the mainstem Thompson River. The North Thompson River and tributaries provide important spawning and nursery habitat for coho and chinook salmon. Other species of management concern include pink salmon, bull trout, mountain whitefish, round whitefish and rainbow trout. Non-sportfish species include western brook lamprey, bridgelip sucker, largescale sucker, longnose sucker, prickly sculpin, slimy sculpin, torrent sculpin, lake chub, northern pikeminnow, peamouth chub, redside shiner, leopard dace and longnose dace. Mountain sucker is known to reside in the North Thompson River mainstem.
The South Thompson River flows from Little Shuswap Lake in east central BC, and travels 56 km in a southwest direction to its junction with the Thompson River at Kamloops. The South Thompson mainstem and tributaries provide important spawning and rearing habitat for sockeye, chinook, coho, steelhead and lake trout. Other sportfish species in the South Thompson River Watershed include rainbow trout and mountain whitefish. Non-sportfish include chub, sculpin, largescale sucker, dace, northern pikeminnow, redside shiner and sucker.
The mainstem Thompson River drains from Kamloops Lake near the Town of Savana and flows southwest for approximately 120 km before reaching its confluence with the Fraser River. The Thompson River is the largest tributary to the Fraser River and supports five species of Pacific salmon including chinook, coho, sockeye, pink and steelhead. Other important sportfish species include burbot, bull trout, kokanee, mountain whitefish and rainbow trout. White sturgeon have also been recorded in the Thompson River mainstem. Non-sportfish species include lamprey, redside shiner, peamouth chub, northern pikeminnow, longnose sucker, largescale sucker and prickly sculpin.
The Clearwater River is the largest tributary to the upper North Thompson River, flowing mainly south for 201 km from its headwaters to the confluence with the Upper North Thompson River. The Clearwater River is a major chinook spawning system and provides important spawning and rearing habitat for sockeye and coho. Resident sportfish species include rainbow trout, bull trout and mountain whitefish. Non-sportfish species include redside shiner, slimy sculpin and longnose dace.
The Nicola River is a major tributary to the Thompson River. It drains west from the Thompson Plateau and feeds both Douglas and Nicola lakes. From the outlet to Nicola Lake, the Nicola River meanders northwest for approximately 85 km to its confluence with the Thompson River near the Town of Spences Bridge. The Nicola River provides valuable spawning and rearing habitat for Pacific salmon including chinook, coho, sockeye, pink and steelhead. Other important sportfish species include burbot, bull trout, kokanee, mountain whitefish, lake whitefish, lake trout and rainbow trout. Non-sportfish species include western brook lamprey, river lamprey, Pacific lamprey, redside shiner, peamouth chub, northern pikeminnow, bridgelip sucker, longnose sucker, white sucker, chiselmouth, leopard dace, prickly sculpin and slimy sculpin. Chiselmouth is known to reside in the Nicola River mainstem.
The Coldwater River flows for approximately 95 km, mostly paralleling Highway 5, before draining into the Nicola River near the City of Merritt. Important sportfish species include coho, steelhead, bull trout, mountain whitefish and rainbow trout. Non-sportfish species include longnose dace, leopard dace, bridgelip sucker, longnose sucker, slimy sculpin, prickly sculpin, redside shiner and Pacific lamprey. The Coldwater River has been the focus of a number of salmon conservation initiatives in the past and was selected by the Pacific Salmon Endowment Fund Society as the first watershed to receive attention in the Thompson-Nicola region for recovery of coho and steelhead (LGL Ltd. Environmental Research Associates 2007).

Trans Mountain Pipeline ULC Volume 7, Pipeline Facilities Technical Reports Trans Mountain Expansion Project Qualitative Ecological Risk Assessment of
Pipeline Spills Technical Report
December, 2013 REP-NEB-TERA-00019
Page 4-12
The Coquihalla River flows through the Cascade Mountains, following Highway 5 and Old Coquihalla Road for approximately 56 km to its confluence with the Fraser River at the District of Hope. The Coquihalla River is a major tributary to the lower Fraser River and is known to support all six species of Pacific salmonids. Other important sportfish species include bull trout, mountain whitefish, cutthroat trout and rainbow trout; non-sportfish species include coastrange sculpin, largescale sucker and leopard dace.

Trans Mountain Pipeline ULC Volume 7, Pipeline Facilities Technical Reports Trans Mountain Expansion Project Qualitative Ecological Risk Assessment of
Pipeline Spills Technical Report
December, 2013 REP-NEB-TERA-00019
Page 5-1
5.0 QUALITATIVE ECOLOGICAL RISK ASSESSMENT FRAMEWORK
The primary focus of the ERA is the assessment of the potential negative effects on the health of ecological receptors from the dispersion of COPCs associated with a hypothetical spill of heavy crude oil to a freshwater environment during pipeline operations.
The ERA has been conducted according to accepted ecological risk assessment methods and guidance published by regulatory authorities, including the Canadian Council of Ministers of Environment (CCME 1996, 1997), Federal Contaminated Sites Action Plan (2012), and the United States Environmental Protection Agency (1998). It is important to note that the referenced guidance was developed to apply to sites where contamination with COPCs is present, and where the role of the ERA is to assess the significance of such contamination in the context of site remediation and environmental restoration. In the present context (i.e., as part of the ESA process for a proposed pipeline) the hypothetical releases of COPCs to the aquatic environment are considered to be unlikely accident scenarios.
Risk is often defined as being the product of the probability of an event occurring, and the magnitude of the consequences of that event. In ecological and human health risk assessment, a Venn diagram (Figure 5.1) is commonly used to illustrate the concept that risk involves the simultaneous presence (or overlap) of a hazard (e.g., spilled oil), a receptor (e.g., a fish or a grizzly bear), and a pathway allowing the receptor to become exposed to the hazard (e.g., oil deposition to sediment so that fish eggs are exposed to PAHs, or deposition of oil on a river bank so that a bear encounters and ingests some of the oil). A risk is deemed to be present when all three components occur simultaneously (i.e., at the intersection of the three circles in Figure 5.1). No risk is present if any one of the receptor, the hazard, or the pathway is not present (or can be controlled). In the present context, the probability of the initial accident is artificially deemed to be 1.0 (i.e., a pipeline failure leading to a release of diluted bitumen to the aquatic environment is assumed to have occurred). The ERA therefore assesses the consequences of the hypothetical accident given the assumption that the hazard (spilled heavy crude oil) is present in the environment.
FIGURE 5.1 ECOLOGICAL RISK ASSESSMENT FRAMEWORK
Receptor
Exposure Hazard
Risk

Trans Mountain Pipeline ULC Volume 7, Pipeline Facilities Technical Reports Trans Mountain Expansion Project Qualitative Ecological Risk Assessment of
Pipeline Spills Technical Report
December, 2013 REP-NEB-TERA-00019
Page 5-2
The ERA follows a standard protocol that is composed of the following steps:
Problem Formulation Exposure Assessment Hazard Assessment Risk Characterization Discussion of Certainty and Confidence.
The terminology and methodology of this framework follows that which has been laid out by the CCME (1996). The methodological framework of the ERA and the chronology of the process steps are presented in Figure 5.1. The framework and methods for the ERA are described in the following sub-sections.
This is a screening-level ERA, and will be carried out using qualitative methods. Risk to ecological receptors will be evaluated taking into consideration their likely degree of exposure to diluted bitumen either as a whole product, or as chemical constituents (e.g., PAHs) within the whole product. This measure of exposure will be integrated with the intrinsic sensitivity of the ecological receptors to crude oil or its chemical constituents. The ERA will consider a variety of lines of evidence regarding the environmental effects of and recovery from oil spills, including laboratory and field exposure studies, data from actual accidental oil spills, and results from other studies that have modelled or simulated the environmental effects of oil spills. Environmental effects of spilled oil will be described for each ecological receptor type in the context of the spatial extent, magnitude, direction and reversibility of the environmental effects.
5.1. Problem Formulation
The Problem Formulation is an information gathering and interpretation step that focuses the ERA on the primary areas of concern for the Project. The Problem Formulation defines the nature and scope of the work to be conducted, enables practical boundaries to be placed on the overall scope of work, and directs the ERA at the key areas and issues of concern.
The key tasks requiring evaluation within the Problem Formulation step include:
Identification of COPCs and mechanisms of COPC release to the environment Identification and characterization of ecological receptors Identification of exposure media and pathways.
The outcome of these tasks forms the basis for the approach taken for the ERA.
5.2. Exposure Assessment
The Exposure Assessment evaluates data related to the COPCs, ecological receptors and exposure pathways identified during the Problem Formulation. Previous studies on oil spills in similar environments provide a basis for evaluating the fate and transport and effects of hypothetical pipeline spills resulting from the Project. As such, a literature review was conducted to identify and acquire information on real-life and modelled oil spills in similar environments. From the scientific literature in peer reviewed journals, government reports and technical documents, case studies were selected and the information used to evaluate the potential consequences of a hypothetical diluted bitumen spill resulting from the Project.
5.3. Hazard Assessment
The Hazard Assessment identifies the potential negative effects associated with acute (short-term) and chronic (long-term) exposure of ecological receptors to COPCs resulting from a hypothetical pipeline spill.
The ecological effects of a COPC depend on the amount of oiling and/or the amount taken into the body (the dose) and the duration of exposure (i.e., the length of time the receptor is exposed). The toxicity of a COPC is dependent on:

Trans Mountain Pipeline ULC Volume 7, Pipeline Facilities Technical Reports Trans Mountain Expansion Project Qualitative Ecological Risk Assessment of
Pipeline Spills Technical Report
December, 2013 REP-NEB-TERA-00019
Page 5-3
Inherent properties that cause a biochemical or physiological response at the site of action Ability of the COPC to reach the site of action Unique sensitivities associated with the species being tested, its life-stage, and/or interactions with
other environmental or physiological conditions.
5.4. Risk Characterization
The Risk Characterization integrates the information from the Exposure Assessment and Hazard Assessment with the biophysical characteristics of the freshwater environments traversed by the Project to provide a qualitative estimate of risk for each receptor group. The risk estimates are expressed in terms of the likely spatial extent, magnitude (or degree of injury), direction and reversibility of the environmental effects for each ecological receptor type. Potential risks are characterized through a comparison of the predicted exposures derived from applicable case studies (from the Exposure Assessment) to the exposure information detailed in the Hazard Assessment.
In this ERA, which is being conducted in support of an ESA Report, specific terminology regarding environmental effects is adopted in order to meet those requirements. In an ESA, key considerations regarding environmental effects typically include:
Impact Balance of the Residual Environmental Effect: is it positive, neutral, or negative Spatial Boundaries of the Environmental Effects: usually limited to a defined footprint, a local study
area, a regional study area, or affecting larger areas such as a province, more than one province, or beyond the boundaries of Canada
Temporal Context: considering how long will a disturbance last, how frequently will a disturbance occur, and whether the disturbance is reversible
Effect Magnitude: considering whether the residual effects are negligible, low, medium or high in terms of existing baseline conditions and regulatory standards
Probability of Occurrence: considering whether an environmental effect is likely to occur, or unlikely to occur
Level of Confidence: an assessment of the degree of certainty related to the assessment of the environmental effect and its significance.
Accidents and malfunctions are evaluated using a slightly different approach than most other Project environmental effects, in the sense that environmental effects of construction of operation of the Project, and their duration, can usually be described with a moderate to high level of confidence. Accidents, on the other hand, may or may not occur, and serious accidents such as a pipeline rupture are expected to have a very low probability of occurring. All of the residual environmental effects of an accident leading to an oil spill will be construed as being negative in aspect. The effects assessment framework used in risk characterization will therefore focus on the following aspects of the effects of accidents and malfunctions:
Spatial Extent and Boundaries - pipeline oil spills do not fit within a conventional framework of Project Footprint, Local Study Area and Regional Study Area, as spilled oil could easily leave the defined right-of-way and be transported a considerable distance after reaching a watercourse. For this reason, the assessment of various oil spill scenarios will consider the spatial extent to which negative residual environmental effects could be expected to occur following full bore rupture oil spill scenarios under a range of environmental conditions.
Effect Magnitude - residual environmental effects will be considered in a qualitative manner, with rankings of Negligible, Low, Medium or High. Note that under the conditions of an oil spill, an environmental effect could be negligible or low in one area, but high in another nearby area; and that effects on one ecological receptor could be low, while effects on another ecological receptor in the same or a nearby environment could be high. Effect magnitude definitions are as follows:
o Negligible (a change from existing conditions that is difficult to detect; or a very low probability that an ecological receptor will be exposed to spilled oil),

Trans Mountain Pipeline ULC Volume 7, Pipeline Facilities Technical Reports Trans Mountain Expansion Project Qualitative Ecological Risk Assessment of
Pipeline Spills Technical Report
December, 2013 REP-NEB-TERA-00019
Page 5-4
o Low (a change that is detectable, but that remains well within regulatory standards; or a situation where an ecological receptor is exposed to spilled oil, but the exposure does not result in serious stress to the organism);
o Medium (a change from existing conditions that is detectable, and approaches without exceeding a regulatory standard; or a situation where an ecological receptor is stressed, but does not die as a result of exposure to spilled oil);
o High (a change from existing conditions that exceeds an environmental or regulatory standard such as a situation where a species of management concern dies as a result of exposure to spilled oil).
The temporal context of environmental effects is also important. In contrast to other Project environmental effects, which typically have defined duration (e.g., one year of construction), the duration of an accident as an initiator of environmental effects may be very short, and accidents by definition are unlikely events. Therefore, rather than focusing on the duration and frequency of accidents, the effects assessment will consider the reversibility, and in particular to the expected time to recovery for each ecological receptor in the event of exposure to spilled crude oil as a result of a pipeline accident.
5.5. Discussion of Certainty and Confidence
This ERA step includes a qualitative assessment of the level of confidence that can be placed in the analysis and results. Risk assessments normally include elements of uncertainty, and these uncertainties are addressed by incorporating conservative assumptions (i.e., assumptions that are likely to over-state rather than under-state the actual adversity of outcomes) into the analysis. Discussion of certainty and confidence in the analysis is provided in order to put these considerations into context, and to demonstrate that the conclusions are either not sensitive to key assumptions, or that the assumptions used are conservative.

Trans Mountain Pipeline ULC Volume 7, Pipeline Facilities Technical Reports Trans Mountain Expansion Project Qualitative Ecological Risk Assessment of
Pipeline Spills Technical Report
December, 2013 REP-NEB-TERA-00019
Page 6-1
6.0 QUALITATIVE ECOLOGICAL RISK ASSESSMENT
6.1. Problem Formulation
The objective of the Problem Formulation is to develop a focused understanding of how COPCs migrate from the source (i.e., the location of a hypothetical pipeline spill), travel overland to reach a watercourse, and ultimately contact or are taken up by ecological receptors associated with the aquatic environment. The main points addressed in the Problem Formation are the following:
Identification of chemicals of potential concern Identification of representative hypothetical spill scenarios Identification of ecological receptors (also referred to as indicators or valued ecosystem components) Identification of exposure pathways.
The results of these activities are then summarized in an ecological conceptual site model that provides a visual depiction of the relevant pathways linking the source of the COPCs in various environmental media and biota to the ecological receptors of interest.
6.1.1. Identification of Chemicals of Potential Concern
The proposed pipeline will transport crude oil from the Edmonton Terminal, located in Sherwood Park, Alberta, to storage facilities at the Burnaby Terminal in Burnaby, British Columbia, and from there to the Westridge Marine Terminal (also located in Burnaby, British Columbia). At the Westridge Marine Terminal, ships will be loaded with these hydrocarbon products. The proposed pipeline (Line 2) will consist of three new sections of 914 mm (NPS 36) outside diameter pipeline with a capacity of up to 540,000 barrels per day (bpd). The configuration of this line will include existing 762 mm (NPS 30) and 914.4 mm outside diameter pipeline loops from Edson, Alberta to Hargreaves, British Columbia, and from Darfield to Black Pines, British Columbia, as well as new 914 mm pipeline segments from Edmonton to Edson (335 km), Hargreaves to Darfield (275 km) and Black Pines to Burnaby (363 km). The final short section of new pipeline between the Burnaby and Westridge terminals (the Westridge delivery lines) will involve twin pipes of 762 mm (NPS 30) outside diameter. Further details of the existing and proposed expanded configuration of the Trans Mountain Pipeline can be found in the Trans Mountain NEB application. The primary type of hydrocarbon to be transported in the proposed pipeline is diluted bitumen, which is a form of heavy crude oil mixed with diluent to meet tariff specifications for viscosity, density and other physical properties. The qualitative ERA is therefore focused on the potential environmental effects of hypothetical releases of diluted bitumen to the environment.
Cold Lake Winter Blend (CLWB) was the formulation of diluted bitumen that was selected for evaluation in the ERA because it is currently transported by Trans Mountain and is expected to remain a major product transported by the new pipeline. In addition, the diluent in CLWB is condensate (a light hydrocarbon mixture derived from natural gas liquids), which is volatile and relatively water-soluble. Due to the higher level of risk associated with inhalation of volatiles and/or exposure to dissolved hydrocarbons, CLWB was considered to be a conservative choice for the ERA, as opposed to heavy crude oil mixed with alternative diluents such as synthetic oil, which contain fewer volatile and less water soluble constituents.
6.1.1.1. Physical Properties of Representative Cold Lake Winter Blend
A sample of the representative diluted bitumen to be evaluated in the ERA (i.e., CLWB) was provided by Trans Mountain. The sample was subsequently subjected to detailed physical and chemical analyses in order to gain an understanding of the particular hydrocarbon fractions present, as well as the individual COPCs present for the Project.
Example physical properties of CLWB are listed in Table 6.1. Note that all transported hydrocarbons will meet Trans Mountain pipeline quality specifications as outlined in (KMC 2013).

Trans Mountain Pipeline ULC Volume 7, Pipeline Facilities Technical Reports Trans Mountain Expansion Project Qualitative Ecological Risk Assessment of
Pipeline Spills Technical Report
December, 2013 REP-NEB-TERA-00019
Page 6-2
TABLE 6.1 PHYSICAL PROPERTIES FOR COLD LAKE WINTER BLEND DILUTED BITUMEN
Physical Property Units Cold Lake Winter Blend Diluted Bitumen
Interfacial Tension dyne/cm 42
Absolute Density @ 15°C kg/m3 926
Measured Relative Density @ 15°C N/A 0.9268
American Petroleum Institute (API) Gravity @ 15°C N/A 21.2
Closed Cup Flash Point °C <-35
Pour Point °C -33
Viscosity @ 5°C – kinematic cSt 542.1
Viscosity @ 10°C – kinematic cSt 371.2
Viscosity @ 15°C – kinematic cSt 261.6
Viscosity @ 30°C – kinematic cSt 105.9
Viscosity @ 40°C – kinematic cSt 64.09
Viscosity @ 60°C – kinematic cSt 28.63
Gas Equivalency Factor m3 gas / m3 liquid 86.6
Source: Analysis performed by Maxxam Analytics, with the exception of viscosity at 5, 10, and 15°C, which were calculated from the measured values at higher temperature following ASTM D-341 by C. Brown (pers. comm. 2013).
6.1.1.2. Chemical Properties of Representative Cold Lake Winter Blend
The majority of the chemical analysis carried out on the sample of CLWB was done by Maxxam Analytics, with confirmatory analysis for selected test groups carried out by Research and Productivity Council (Fredericton, New Brunswick). The following analytical packages were included:
Trace elements Petroleum hydrocarbons Polycyclic aromatic hydrocarbons (PAH) Alkylated PAH Pentachlorophenol and phenol Volatile organic compounds (VOC) Alkylated mono aromatic hydrocarbons (MAH).
Table 6.2 provides a full list of trace elements and organic compounds analyzed in the CLWB. Copies of the original laboratory certificates are provided in Appendix A of this report.
TABLE 6.2 CHEMICAL CONSTITUENTS OF COLD LAKE WINTER BLEND DILUTED BITUMEN
Analyte Concentration (mg/kg) Analyte Concentration (mg/kg)
Metals
Aluminum <1 Mercury 0.021
Barium <1 Molybdenum 5
Beryllium <1 Nickel 46.8
Boron 1 Phosphorus 0.8
Cadmium <1 Potassium 1
Calcium 2 Silicon 2
Chromium <1 Silver <1
Cobalt <1 Sodium 12
Copper <1 Strontium <1
Iron 3 Sulphur 37,100
Lead <1 Tin <1
Lithium <1 Titanium 1
Magnesium <1 Vanadium 135
Manganese <1 Zinc <1
Sulfur Compounds
Hydrogen Sulphide (H2S) <0.5 n-Propanethiol <0.5
Carbonyl Sulphide <0.5 Thiophene/sec-Butanethiol 2.9
Methanethiol <0.5 Diethyl Sulphide <0.5
Ethanethiol 1.1 Iso-Butanethiol <0.5
Dimethyl Sulphide 1.7 n-Butanethiol 0.5
Carbon Disulphide <0.5 Dimethyl Disulphide <0.5

Trans Mountain Pipeline ULC Volume 7, Pipeline Facilities Technical Reports Trans Mountain Expansion Project Qualitative Ecological Risk Assessment of
Pipeline Spills Technical Report
December, 2013 REP-NEB-TERA-00019
Page 6-3
TABLE 6.2 CHEMICAL CONSTITUENTS OF COLD LAKE WINTER BLEND DILUTED BITUMEN
Analyte Concentration (mg/kg) Analyte Concentration (mg/kg)
Iso-Propanethiol 2.5 n-Pentanethiol <0.5
t-Butanethiol <0.5 n-Hexanethiol 0.5
Methyl Ethyl Sulphide 0.9 n-Heptanethiol <0.5
SAPA (Saturates, Aromatics, Polars, Asphaltenes)
Saturates 318,000 Polars 398,000
Aromatics 203,000 Asphaltenes 80,000
Summary Composition
Methane <100 n-Butane 5,100
Ethane <100 Iso-Pentane 31,600
Propane 400 n-Pentane 34,200
Iso-Butane 1,000
BTEX (Benzene, Toluene, Ethylbenzene, Xylenes)
Benzene 1,800 Ethylbenzene 470
Toluene 3,900 Xylenes 3,500
PHCs (Petroleum Hydrocarbons)
F1 (C6-C10) - BTEX 110,000 Aliphatics >C21-C34 60,000
F2 (C10-C16) 82,000 Aliphatics >C34-C50 23,000
F3 (C16-C34) 260,000 Aromatics >C8-C10 <6,000
F4 (C34-C50) 110,000 Aromatics >C10-C12 4,100
Aliphatics C6-C8 55,000 Aromatics >C12-C16 22,000
Aliphatics >C8-C10 20,000 Aromatics >C16-C21 47,000
Aliphatics >C10-C12 16,000 Aromatics >C21-C34 120,000
Aliphatics >C12-C16 40,000 Aromatics >C34-C50 77,000
Aliphatics >C16-C21 46,000
SVOCs – PAHs (Semi Volatile Organic Compounds – PAHs)
Acenaphthene 12 Fluoranthene 7.3
C1-Acenaphthene <4.5 C1-fluoranthene/pyrene 75
Acenaphthylene <4.5 C2-fluoranthene/pyrene 200
Acridine 39 C3-fluoranthene/pyrene 340
Anthracene 6.6 C4-fluoranthene/pyrene 170
Benzo(a)anthracene 5.6 Fluorene 21
C1-benzo(a)anthracene/chrysene 59 C1-Fluorene 150
C2-benzo(a)anthracene/chrysene 230 C2-Fluorene 300
C3-benzo(a)anthracene/chrysene 110 C3-Fluorene 770
C4-benzo(a)anthracene/chrysene 37 Indeno(1,2,3-cd)pyrene <4.5
Benzo(b&j)fluoranthene 6.7 2-Methylnaphthalene 80
Benzo(k)fluoranthene <4.5 Naphthalene 34
C1-benzo(b,j,k)fluoranthene/benzo(a)pyrene 21 C1-Naphthalene 160
C2-benzo(b,j,k)fluoranthene/benzo(a)pyrene 37 C2-Naphthalene 600
Benzo(g,h,i)perylene 4.8 C3-Naphthalene 780
Benzo(c)phenanthrene <4.5 C4-Naphthalene 810
Benzo(a)pyrene 5.8 Phenanthrene 63
Benzo(e)pyrene 5.1 C1-phenanthrene/anthracene 310
Biphenyl 7.3 C2-phenanthrene/anthracene 550
C1-biphenyl 50 C3-phenanthrene/anthracene 660
C2-biphenyl 84 C4-phenanthrene/anthracene 230
Chrysene 8.6 Perylene 9
Dibenz(a,h)anthracene <4.5 Pyrene <13
Dibenzothiophene 44 Quinoline <8.9
C1-dibenzothiophene 330 Retene 43
C2-dibenzothiophene 910
C3-dibenzothiophene 700
C4-dibenzothiophene 440
SVOCs – Phenols (Semi Volatile Organic Compounds – Phenols)
Cresols <16 2,4-dinitrophenol <43
Phenol <8.1 2,6-dichlorophenol <8.5
3 & 4-chlorophenol <21 2-chlorophenol <4.3
2,3,5,6-tetrachlorophenol <4.3 2-methylphenol <8.7
2,3,4,6-tetrachlorophenol <4.3 2-nitrophenol <43
2,4,5-trichlorophenol <4.3 3 & 4-methylphenol 16

Trans Mountain Pipeline ULC Volume 7, Pipeline Facilities Technical Reports Trans Mountain Expansion Project Qualitative Ecological Risk Assessment of
Pipeline Spills Technical Report
December, 2013 REP-NEB-TERA-00019
Page 6-4
TABLE 6.2 CHEMICAL CONSTITUENTS OF COLD LAKE WINTER BLEND DILUTED BITUMEN
Analyte Concentration (mg/kg) Analyte Concentration (mg/kg)
2,4,6-trichlorophenol <4.3 4,6-dinitro-2-methylphenol <43
2,3,5-trichlorophenol <4.3 4-chloro-3-methylphenol <4.3
2,3,4-trichlorophenol <4.3 4-nitrophenol <43
2,4-dichlorophenol <6.3 Pentachlorophenol <4.3
2,4-dimethylphenol 29
VOCs (Volatile Organic Compounds)
Bromodichloromethane <150 Methyl methacrylate <200
Bromoform <250 Methyl-tert-butylether (MTBE) <150
Bromomethane <100 Styrene <100
Carbon tetrachloride <100 1,1,1,2-tetrachloroethane <500
Chlorobenzene <100 1,1,2,2-tetrachloroethane <250
Chlorodibromomethane <100 Tetrachloroethene <100
Chloroethane <100 1,2,3-trichlorobenzene <200
Chloroform <100 1,2,4-trichlorobenzene <200
Chloromethane <150 1,3,5-trichlorobenzene <200
1,2-dibromoethane <100 1,1,1-trichloroethane <100
1,2-dichlorobenzene <100 1,1,2-trichloroethane <100
1,3-dichlorobenzene <100 Trichloroethene <50
1,4-dichlorobenzene <100 Trichlorofluoromethane <100
1,1-dichloroethane <100 1,2,4-trimethylbenzene 300
1,2-dichloroethane <100 1,3,5-trimethylbenzene <2,500
1,1-dichloroethene <100 Vinyl chloride <50
cis-1,2-dichloroethene <100 neo-Hexane <100
trans-1,2-dichloroethene <100 Methylcyclopentane 8,000
Dichloromethane <150 Cyclohexane 10,000
1,2-dichloropropane <100 Methylcyclohexane 10,500
cis-1,3-dichloropropene <100
trans-1,3-dichloropropene <100
Source: Analysis performed by Maxxam Analytics.
Non-petroleum compounds in crude oils, such as metals, are seldom of environmental concern as primary pollutants. For example, after the discharge of an estimated 160 to 340 million gallons of crude oil during the 1991 Gulf War, trace metal concentrations in oiled intertidal and sub-tidal sediments remained below background levels (Fowler et al. 1993 in Hugenin et al. 1996). Similarly, the USEPA (2011a) concluded in response to a crude oil spill into the Yellowstone River in Montana that metal concentrations in the spilled oil were present only at very low levels, and as such were unlikely to pose any threat to human life or the environment. Likewise, Anderson (2006) concluded that there was no post-spill evidence of an increase in water or sediment metal concentrations at Wabamun Lake, Alberta, following a spill of bunker “C” fuel oil and pole treating oil in 2005.
As indicated in Table 6.2, the measured concentrations of trace metals in CLWB are generally very low (<1 mg/kg), with the exception of nickel (46.8 mg/kg) and vanadium (135 mg/kg). However, it is believed that these trace metals are likely to remain largely associated with the diluted bitumen following a spill. Therefore, the ERA focuses on the environmental effects of hydrocarbons (i.e., crude oil and its hydrocarbon constituents) released into the freshwater environment.
6.1.2. Identification of Representative Hypothetical Spill Scenarios
Four locations were selected as representative locations for hypothetical spill scenarios. The selection was guided by consideration of the following engineering and environmental/socio-economic risk factors:
Environmental and socio-economic considerations (where available):
Spill locations should be reflective of areas of expressed concern for spills by Aboriginal peoples or the general public.

Trans Mountain Pipeline ULC Volume 7, Pipeline Facilities Technical Reports Trans Mountain Expansion Project Qualitative Ecological Risk Assessment of
Pipeline Spills Technical Report
December, 2013 REP-NEB-TERA-00019
Page 6-5
Spill locations should support evaluation of potential effects to traditional use, other human use or infrastructure (e.g., potable water intakes or treatment facilities).
Spill locations should support evaluation of potential effects to environmentally sensitive resources (e.g., spawning grounds for salmon).
Spill locations should be located so that large spill volumes could potentially enter a watercourse. Spill locations should reflect a range of watercourse types.
Engineering considerations:
Spill locations should be based on the results of Quantitative Risk Assessment (QRA) so that locations can be linked to accurate failure probability estimates.
Spill volumes should be based on the predicted type of failure forecast from the QRA and Trans Mountain‟s existing risk algorithms, and should also be realistic in terms of site-specific drain-down volumes.
Based on discussions with Trans Mountain, potential hypothetical spill locations were narrowed to three general areas, including an inland river system in Alberta (i.e., the Athabasca River), an inland river system in British Columbia (i.e., the North Thompson River), and a coastal river system in British Columbia (i.e., the lower Fraser River). The ERA was therefore focused on the environmental effects that could result from hypothetical spill scenarios at locations on these rivers. Trans Mountain commissioned an independent outflow analysis based on preliminary valve spacing to quantify the oil volume that would be released in the event of an incident. Modeling assumed a full-bore rupture with hole on the bottom of the pipe, which provided worst-case outflows for the purpose of the ERA. Predicted outflow volumes for the four locations were used. Subsequent Quantitative Risk Assessment full-bore volume rupture estimates show slightly different predicted release volumes. The ERA has not been modified to reflect this refinement as the ecological consequences described below are still valid. Based on the Reference Kilometre (RK) posts for the proposed pipeline, the selected representative hypothetical spill scenarios include:
RK 309.0, which is located upstream of Hinton, Alberta, with potential for oil to flow into the Athabasca River. A worst-case oil spill volume of approximately 2,700 m3 was estimated at this location based upon a full-bore rupture scenario.
RK 766.0, which is located upstream of Darfield, British Columbia, with potential for oil to flow into the North Thompson River. A worst-case oil spill volume of approximately 1,400 m3 was estimated at this location based upon a full-bore rupture scenario.
RK 1072.8, which is located downstream of Hope, British Columbia, with potential for oil to flow into the Fraser River. A worst-case oil spill volume of approximately 1,300 m3 was estimated at this location based upon a full-bore rupture scenario.
RK 1167.5, which is located downstream of the Port Mann Bridge in Surrey, British Columbia, with potential for oil to flow into the lower Fraser River and thence to the Fraser River Estuary. A worst-case oil spill volume of approximately 1,250 m3 was estimated at this location based upon a full-bore rupture scenario.
At each location, the potential environmental effects of a full-bore pipeline rupture were evaluated. A full-bore rupture means that the pipeline is to all intents and purposes severed or burst, so that the opening is equivalent to the cross-sectional area of the pipe(regardless of the mechanism leading to the rupture), and that crude oil spills freely from an opening that is equivalent to the diameter of the pipeline. The change in flow characteristics due to the rupture would be detected at the control centre and the pipeline would be shut down. It was assumed that the location of the full-bore rupture was at a low point between two control valves, and that oil continues to drain by gravity from the pipeline, between the location of the rupture and the nearest valves. A full-bore rupture as described here was therefore considered to be a credible worst-case scenario.
Lesser damage to the pipeline, such as a 2 inch (5.08 cm) diameter hole punched into the pipeline could still result in a substantial spill of crude oil (estimated to be up to 65% of the volume of a full-bore rupture)

Trans Mountain Pipeline ULC Volume 7, Pipeline Facilities Technical Reports Trans Mountain Expansion Project Qualitative Ecological Risk Assessment of
Pipeline Spills Technical Report
December, 2013 REP-NEB-TERA-00019
Page 6-6
due to the additional time it would take for detection of the leak, and the potential for drainage of oil from the pipeline before the hole could be repaired. This type of damage could occur if a third party were to accidentally strike the line while excavating without proper authorization. Smaller leaks could be difficult to detect at the control centre, and would more likely be detected in the field during inspections. The release volume for such spills is difficult to predict; however, even very small spills, if they reached the surface water would be readily detected due to the presence of a visible sheen that could be traced back to the source.
For each hypothetical spill scenario, it was conservatively assumed that spilled oil would flow overland to the nearest watercourse, and that very little holdup of oil on land would occur, so that most of the estimated volume of spilled crude oil would enter the aquatic environment close to the point of release. Making the assumption that the damage to the pipeline occurred near a topographic low point maximizes the hypothetical spill volume (due to drain-down of the pipeline following the initial volume that was released under pressure before the pipeline was shut down), but also implies that the hypothetical spill occurred in proximity to a watercourse.
Therefore, while there would be environmental effects on land (i.e., effects on plants, soil invertebrates, soil quality, and terrestrial wildlife receptors that contacted the spilled oil), these effects would be small in the context of the terrestrial ecozone within which the spill occurred, and would be addressed, remediated and/or compensated through existing legislative frameworks as described in Section 2.0 of this report. This assumption is justified because the large spill volumes assumed here would occur only if the pipeline damage occurred near a topographic low point. Near topographic high points, that portion of the total spill volume that results from the drain-down of the line would be considerably reduced.
The characteristics of the aquatic environment close to and downstream from the representative hypothetical spill locations are described in the following sections.
6.1.2.1. Tributary to the Athabasca River near Hinton, Alberta at RK 309.0
The hypothetical spill location at RK 309.0 is located approximately 9 km northeast of Hinton, Alberta and approximately 2 km south of the Athabasca River, at an elevation of approximately 975 masl.
The Athabasca River originates in Jasper National Park, in an unnamed lake at the toe of the Athabasca Glacier. At the hypothetical spill location near Hinton, spilled oil would follow local terrain to a gully that leads to the river valley floor, and from there to the Athabasca River. The next major settlement downstream from Hinton is Whitecourt, approximately 190 km downstream as the river flows.
The proposed crossing of Trail Creek, a small tributary to the Athabasca River at RK 309.0 (defined as AB-169 in Volume 5C occurs within Alberta‟s Fish Management Zone, Eastern Slopes (ES) Watershed Unit ES3 (Alberta Sustainable Resource Development [ASRD] 2009). Trail Creek is a first order watercourse that flows northwesterly from the proposed pipeline corridor. The creek is an unmapped watercourse (Alberta Environment 2006) but inherits a Class C designation and has a September 1 to July 15 restricted activity period (AESRD 2013, Alberta Environment 2006). Land use throughout the reach of the Athabasca River between Hinton and Whitecourt is predominantly rural, with most of the land having forest cover. Development, including oil and gas infrastructure, is widespread in this region, and the network of roads and other corridors provide good access to the river at regular intervals.
Trail Creek comprises discontinuous sections of marginally defined channel upstream, at, and immediately downstream from the proposed pipeline crossing (TERA Environmental Consultants 2013). Channel definition becomes continuous and more apparent after its confluence with another unnamed tributary approximately 150 m downstream from the proposed pipeline corridor‟s theoretical centre line. In the local study area (LSA; approximately 100 m upstream to at least 300 m downstream and 30 m back from each bank edge) of the proposed pipeline crossing, the channel and wetted widths of Trail Creek average <1.0 m and water depths rarely exceed 0.2 m. Substrate is composed of embedded fines and organics, and banks, where defined, are generally vertical but low (i.e., <0.3 m). No previous information regarding fish species presence or absence exists for the watercourse and no fish were captured during

Trans Mountain Pipeline ULC Volume 7, Pipeline Facilities Technical Reports Trans Mountain Expansion Project Qualitative Ecological Risk Assessment of
Pipeline Spills Technical Report
December, 2013 REP-NEB-TERA-00019
Page 6-7
the Project‟s aquatic assessment. Fish habitat potential for all life stages of all species was rated as either „low‟ or „none‟. Discharge as measured in May 2013 was minimal (i.e., <0.003 m3/s), and it is expected that the channel may be frozen to bottom in winter. Gradient in the LSA ranged between 0.5% and 4%.
The crossing of Trail Creek occurs approximately 0.3 km from the main stem of the river. The potential presence of fish in the lower reaches of the tributary cannot be ruled out.
The Athabasca River near the hypothetical spill location is a seventh-order watercourse with high fish habitat value. Substrate composition near the confluence with the unnamed tributary is presumed to consist primarily of un-embedded coarse material (gravels and cobbles).
The Athabasca River in the vicinity of the hypothetical spill scenario supports several important fish species, including but not limited to bull trout, Arctic grayling, mountain whitefish and Athabasca rainbow trout. It is realistic to expect that suitable rearing, wintering, migration and spawning habitat for fish occurs in the Athabasca River near the confluence of the unnamed tributary.
The intervale in the area of the hypothetical spill location is downstream from Hinton, undeveloped, and forested. The elevation of the river at this location is approximately 955 masl. Near Hinton, the Athabasca River has a width of approximately 100 to 300 m and is gently meandering with gravel and cobble banks, and numerous gravel bars or islands that become exposed during periods of low flow. Many of the islands, which are typically 200 to 500 m in length and 100 to 200 m wide, are high enough to support forest cover similar to that found on the adjacent river banks. The islands and bars create side channels and may create backwaters where they are close to the river banks.
At a distance of 20 km downstream from Hinton, the river falls to an elevation of approximately 943 masl, with a generally steady gradient. By 40 km downstream, the river has an elevation of approximately 920 masl; by 60 km downstream, it has an elevation of approximately 885 masl, with the gradient increasing in the second half of this reach; by 80 km downstream, it has an elevation of approximately 856 masl; and by 100 km downstream, it has an elevation of approximately 811 masl. The river gradients range from approximately 0.1% to 0.3% throughout the last reach. Overall, the characteristics of the Athabasca River are relatively uniform throughout the Hinton to Whitecourt reach.
Only one major tributary, the Berland River, joins the Athabasca River within 100 km downstream of Hinton. The Berland River is not crossed by the proposed pipeline corridor but many small tributaries on the right bank of the Athabasca River are crossed by the Project.
The waters of the Athabasca River are turbid, reflecting their glacial origin; however, the concentrations of total suspended solids (TSS) in the river water do not appear to fall in a range that would trigger oil-mineral aggregation (OMA) formation.
The Water Survey of Canada maintains a hydrometric station on the Athabasca River at Hinton, Alberta (Station No. 07AD002) (Environment Canada 2011a). This station is located approximately 7 km upstream of the convergence with Trail Creek. Discharge at this station has been recorded for all years since 1961 and show that peak flows occur during freshet in June. During this period, the mean monthly flow is 489 m3/s. Flows typically diminish during the later summer months, through fall and winter. Low flows typically occur in March, when the monthly average is 32.5 m3/s. Data for this recording station, including maximum, minimum and mean monthly discharges, are summarized in Figure 6.1 and Table 6.3.

Trans Mountain Pipeline ULC Volume 7, Pipeline Facilities Technical Reports Trans Mountain Expansion Project Qualitative Ecological Risk Assessment of
Pipeline Spills Technical Report
December, 2013 REP-NEB-TERA-00019
Page 6-8
FIGURE 6.1 HISTORICAL MEAN MONTHLY STREAMFLOW (m3/s) SUMMARY FOR THE
ATHABASCA RIVER AT HINTON, ALBERTA (STATION 07AD002)
TABLE 6.3 HISTORICAL MEAN MONTHLY STREAMFLOW (m3/s) SUMMARY FOR THE
ATHABASCA RIVER AT HINTON, ALBERTA (STATION 07AD002)
Discharge Jan. Feb. Mar. Apr. May Jun. Jul. Aug. Sep. Oct. Nov. Dec.
Mean Discharge 36.1 32.6 32.5 43.9 174 489 469 341 208 119 60.7 42.3
Max. Discharge 68.3 46.6 42.2 60.6 310 752 672 544 359 231 98.6 100
Min. Discharge 22.5 18.7 16.9 29.7 66.4 308 316 234 131 69.6 34.4 24.1
Years of Streamflow Record: 1961 to 2011
Maximum Daily Discharge: 1,430 m³/s on June 7, 2007
Minimum Daily Discharge: 10.8 m³/s on March 14, 1963
Effective Drainage Area: 9,720 km2
Source: Environment Canada 2011a
The Water Survey of Canada also maintains a hydrometric station on the Athabasca River near Windfall, Alberta (Station No. 07AE001) (Environment Canada 2011b). This station is located approximately 156 km downstream of the convergence with Trail Creek. Larger tributaries downstream of the confluence with Trail Creek that contribute to the greater volume at this station include Berland River, Oldman Creek, Pass Creek and Windfall Creek. Discharge at this station has been recorded for all years since 1960. The annual high flow event typically occurs from June to August and flows gradually decline through late summer and fall. Mean monthly flows are lowest in March at 49.6 m³/s and mean flows are highest during the late spring freshet with a peak in June at 628.0 m³/s. Data for this monitoring station are summarized in Figure 6.2 and Table 6.4.
0
100
200
300
400
500
600
700
800
Jan. Feb. Mar. Apr. May June July Aug. Sept. Oct. Nov. Dec.
Mean DischargeMax. DischargeMin. Discharge

Trans Mountain Pipeline ULC Volume 7, Pipeline Facilities Technical Reports Trans Mountain Expansion Project Qualitative Ecological Risk Assessment of
Pipeline Spills Technical Report
December, 2013 REP-NEB-TERA-00019
Page 6-9
FIGURE 6.2 HISTORICAL MEAN MONTHLY STREAMFLOW (m3/s) SUMMARY FOR THE
ATHABASCA RIVER NEAR WINDFALL, ALBERTA (STATION 07AE001)
TABLE 6.4 HISTORICAL MEAN MONTHLY STREAMFLOW (m3/s) SUMMARY FOR THE
ATHABASCA RIVER NEAR WINDFALL, ALBERTA (STATION 07AE001)
Discharge Jan. Feb. Mar. Apr. May Jun. Jul. Aug. Sep. Oct. Nov. Dec.
Mean Discharge 53.7 50.2 49.6 100 290 628 613 434 277 172 93.6 65.1
Max. Discharge 102 65.3 88.3 171 534 1030 1090 690 484 301 151 136
Min. Discharge 36.4 35.7 28.1 45.5 162 404 378 267 155 95.8 56.2 40.9
Years of Streamflow Record: 1960 to 2011
Maximum Daily Discharge: 2,130 m³/s on July 10, 1965
Minimum Daily Discharge: 19.3 m³/s on November 23, 1977
Effective Drainage Area: 19,600 km2
Source: Environment Canada 2011b
6.1.2.2. North Thompson River near Darfield, British Columbia at RK 766.0
The hypothetical spill location at RK 766.0 is located approximately 3.5 km north of Darfield, British Columbia, and approximately 120 m west of the North Thompson River, at an elevation of approximately 409 masl.
The North Thompson River originates at the Thompson Glacier in the Cariboo Mountains west of Valemount, British Columbia and flows generally south towards Kamloops and its confluence with the South Thompson River. For most of its length, the North Thompson River is paralleled by Highway 5 and the Canadian National Railway (both of which cross the river at various locations), in addition to the existing Trans Mountain pipeline. The North Thompson River passes by small communities, the largest being Blue River, Clearwater and Barriere. The Clearwater River joins the North Thompson River as a tributary at the Town of Clearwater. The North Thompson and South Thompson rivers merge at Kamloops, British Columbia, forming the Thompson River. The Thompson River is the largest tributary of the Fraser River.
The hypothetical spill scenario near the North Thompson River represents a remote pipeline crossing at RK 766.0 within the Thompson-Nicola Region (Region 3) of British Columbia (Triton Environmental Consultants 2013). The North Thompson River has a British Columbia stream class of S1A (>100 m wide) and meanders sinuously in an occasionally confined channel. Near the hypothetical spill location riparian vegetation is moderately high with heavily cultivated areas.
0
200
400
600
800
1000
1200
Jan. Feb. Mar. Apr. May June July Aug. Sept. Oct. Nov. Dec.
Mean DischargeMax. DischargeMin. Discharge

Trans Mountain Pipeline ULC Volume 7, Pipeline Facilities Technical Reports Trans Mountain Expansion Project Qualitative Ecological Risk Assessment of
Pipeline Spills Technical Report
December, 2013 REP-NEB-TERA-00019
Page 6-10
The North Thompson River is a high-order watercourse with high fish and wildlife values. The main stem and its tributaries provide important spawning and rearing habitat for coho, chinook and sockeye salmon. Fish species of special concern in the North Thompson River include coho salmon (interior Fraser population) and provincially blue-listed bull trout and mountain sucker. Key mountain sucker distribution in the North Thompson River includes a section of river near Heffley, which is approximately 50 km downstream from the hypothetical spill location. Other fish species historically found in the area include pink salmon records from lower the North Thompson sub-basin only (Knapp et al. 1982), bull trout, mountain whitefish, round whitefish, rainbow trout, western brook lamprey, bridgelip sucker, largescale sucker, longnose sucker, prickly sculpin, slimy sculpin, torrent sculpin, lake chub, northern pikeminnow, peamouth chub, redside shiner, leopard dace and longnose dace.
The intervale in the area of the hypothetical spill location is under agricultural land use, with steep valley walls rising to over 900 m to the west, and over 1,500 m to the east. The hill slopes are predominantly forested and forestry is an important activity in the region. The elevation of the river at this location is approximately 381 masl. Near Darfield, the North Thompson River has a width of approximately 250 to 500 m and is gently meandering within the intervale of a well-defined valley, although constrictions at some locations force the river into a channel as narrow as 70 m. The river has gravel and cobble banks and occasional islands or gravel bars that become exposed during periods of low flow. The islands, which range in length from 200 m to 1 km, may support scattered shrubs, scrub, or forest cover similar to that found on the adjacent river banks. Many of the islands show evidence of being overwashed during periods of high flow. The islands and bars create side channels and may create backwaters where they are close to the river banks. Owing to the presence of Highway 5, there is good access to the river for most of this section of the proposed pipeline corridor.
At a distance of 20 km downstream from the hypothetical spill location, the river falls to an elevation of approximately 375 masl, with a generally steady gradient. By 40 km downstream, the river has an elevation of approximately 367 masl; by 60 km downstream, the river has an elevation of approximately 350 masl, with some steeper gradients occurring in the last 4 km of this reach; and by 80 km downstream, the river has an elevation of approximately 341 masl. Proceeding downstream, the river meets the South Thompson River and by 100 km downstream, the Thompson River has an elevation of approximately 335 masl and enters Kamloops Lake, which is a large water body approximately 30 km in length. The river gradients range from approximately 0.02% to 0.1% throughout this reach, although locally higher gradients are present. Overall, the characteristics of the North Thompson River are relatively uniform throughout the Darfield to Kamloops reach. Kamloops Lake provides a still-water section that would tend to trap any oil that was carried downstream, making it likely that any spill entering the lake would effectively terminate at this point.
Other than the junction with the South Thompson River, no major tributaries join the North Thompson River between Darfield and Kamloops. The waters of the North Thompson River are turbid, reflecting their glacial origin; however, the concentrations of TSS in the river water do not appear to fall in a range that would trigger OMA formation.
The Water Survey of Canada maintains a hydrometric station on the North Thompson River at McLure, BC (Station No. 08LB064) (Environment Canada 2011c). This station is located approximately 16 km downstream of the hypothetical spill location. Discharge at this station has been recorded for all years since 1958. The annual high flow event typically occurs from May to July and flows gradually decline through summer and fall. Mean monthly flows are lowest in February at 85.9 m³/s and highest during the spring freshet with a peak in June at 1,330 m³/s. Data for this monitoring station are summarized in Figure 6.3 and Table 6.5. Tributaries between the hypothetical spill site and the hydrometric station, such as Barrier River and Louis Creek, contribute to an incremental increase in volume at the station compared to flows at the hypothetical spill location.

Trans Mountain Pipeline ULC Volume 7, Pipeline Facilities Technical Reports Trans Mountain Expansion Project Qualitative Ecological Risk Assessment of
Pipeline Spills Technical Report
December, 2013 REP-NEB-TERA-00019
Page 6-11
FIGURE 6.3 HISTORICAL MEAN MONTHLY STREAMFLOW (m3/s) SUMMARY FOR THE NORTH
THOMPSON RIVER AT McLURE, BC (STATION 08LB064)
TABLE 6.5 HISTORICAL MEAN MONTHLY STREAMFLOW (m3/s) SUMMARY FOR THE NORTH
THOMPSON RIVER AT McLURE, BC (STATION 08LB064)
Discharge Jan. Feb. Mar. Apr. May Jun. Jul. Aug. Sep. Oct. Nov. Dec.
Mean Discharge 92.1 85.9 95.1 236 890 1,330 923 528 343 261 198 118
Max. Discharge 228 271 190 495 1,280 1,990 1,670 1,090 676 587 344 233
Min. Discharge 49.4 52.3 58 90.6 519 889 554 333 198 106 93 62.3
Years of Streamflow Record: 1958 to 2011
Maximum Daily Discharge: 2,740 m³/s on June 13, 1972
Minimum Daily Discharge: 36 m³/s on February 4, 1988
Gross Drainage Area: 19,600 km2
Source: Environment Canada 2011c
Water quality was monitored at the North Thompson River at North Kamloops by the British Columbia Ministry of Environment, Lands and Parks (BC MELP 1997) from 1987 to 1995 at site number 0600164. No environmentally relevant trends were observed over the testing period. Partial treatment and disinfection of drinking water was found to be needed due to frequent high fecal coliform, Escherichia coli (E. coli) and turbidity levels. Occasionally, naturally high levels of aluminum, copper, iron and zinc exceeding guidelines for aquatic life or drinking water were observed in winter and fall. During spring freshet, higher levels of aluminum, chromium, copper, iron, manganese and titanium were observed in conjunction with high levels of turbidity, suggesting that the metals were in particulate form, not biologically available. The study also found that guidelines were consistently met for most of the sampled variables, including nitrate/nitrite, pH, specific conductivity and dissolved sulphate, and that the water was well buffered against acid inputs (BC MELP 1997).
There were no substantial industrial discharges into the river at the time of the study. However, activities associated with agriculture, urbanization and forestry were notable stresses on water quality, particularly downstream from McLure, due to higher population and agricultural land uses (BC MELP 1997).
6.1.2.3. Fraser River near Hope, British Columbia at RK 1072.8
The proposed pipeline corridor approaches the Fraser River at Hope, British Columbia, and runs generally parallel to the river on the left bank until it reaches Surrey, close to its terminus at Burnaby. The Fraser River is the longest river in British Columbia, originating near Mount Robson in the Rocky Mountains, and discharging into the Strait of Georgia near Vancouver. The Fraser River is a major
0
500
1000
1500
2000
2500
Jan. Feb. Mar. Apr. May June July Aug. Sept. Oct. Nov. Dec.
Mean DischargeMax. DischargeMin. Discharge

Trans Mountain Pipeline ULC Volume 7, Pipeline Facilities Technical Reports Trans Mountain Expansion Project Qualitative Ecological Risk Assessment of
Pipeline Spills Technical Report
December, 2013 REP-NEB-TERA-00019
Page 6-12
watershed for the Rocky Mountains and flooding is a regular concern in the lower Fraser River valley because the spring freshet, a mixture of heavy rains and spring thaw, is unpredictable.
The hypothetical spill location at RK 1072.8 is approximately 5 km southeast of Agassiz, British Columbia, and on the opposite side of the Fraser River. The location is at an elevation of approximately 44 masl, near the toe of the hill slope at the edge of the floodplain of the Fraser River. The intervale in the area of the hypothetical spill location is quite narrow, but broadens out downstream in an area known as the Fraser Valley to include much of the arable and residential lands associated with the lower mainland of British Columbia (i.e., the areas around Abbotsford, Langley and Chilliwack). The elevation of the Fraser River near the hypothetical spill location is approximately 19 masl.
The Fraser River is a high-order watercourse with high fish and wildlife values. It has a British Columbia stream class of S1A (>100 m wide) and flows sinuously in an unconfined channel. Fish species of special concern previously recorded as present within the Fraser River include Species at Risk Act (SARA)-listed green and white sturgeon. White sturgeon is generally abundant and populations are stable, while green sturgeon observations are extremely rare in freshwater. Species listed by the Committee on the Status of Endangered Wildlife in Canada (COSEWIC) as being of conservation concern include sockeye (Cultus Lake population) and coho salmon (interior Fraser population), while Provincially-listed species include blue-listed bull trout and eulachon. SARA listed species of salish sucker and nootsack dace have been identified as present in key tributaries to the Fraser River, including Salmon River and Stoney, Semmihault, and Chilliwack creeks. Westslope cutthroat trout (SARA-listed and blue-listed as a species of Special Concern in BC) are also present in lower Fraser drainages, but have limited concern because they are introduced. Other species include coastal cutthroat trout, rainbow trout, mountain whitefish, pygmy whitefish, kokanee, burbot, black crappie, brown bullhead, brassy minnow, coastrange sculpin, slimy sculpin, pacific staghorn sculpin, carp, largescale sucker, emerald shiner, leopard dace, lake chub, longnose sucker, longnose dace, longfin smelt, northern pikeminnow, peamouth chub, Pacific lamprey, river lamprey, western brook lamprey, redside shiner, starry flounder, American shad, surf smelt and white sucker.
The area downstream from Hope includes abundant side channels. Large cultivated regions are also located adjacent to the river and moderate amounts of riparian vegetation are still in place. The section of habitat downstream from Hope is equally important for salmon and steelhead migration. Key mountain sucker (blue-listed) distribution includes the gravel deposition region of the lower Fraser River (near the District of Hope downstream to roughly the mouth of the Sumas River). This section of the Fraser River is critical for white sturgeon as key spawning and rearing areas have been identified between the district of Mission and the town of Yale (Perrin et al. 2000). Another important spawning site for white sturgeon is the Fraser River mainstem, which is located downstream (0.5 km) from the confluence with the Coquihalla River (COSEWIC 2003). White Sturgeon predominantly use the lower reaches of the Fraser River, as well as lower portions of the Sumas and Chilliwack rivers, for feeding and migration purposes.
At the hypothetical spill location of RK 1072.8, spilled oil would most likely follow local terrain to the ditch associated with Highway 1 (a distance of approximately 150 m) and then follow the ditch to a nearby creek that drains into the Fraser River floodplain. The floodplain at this location is characterized by a complex of old oxbows and former stream channels. Higher areas have forest cover, and forest harvesting is evident; lower areas would include seasonally fluctuating wetlands. The stream flow in this area appears to follow the left bank of the river for some distance (approximately 6 km) before entering the main stream near the settlement of Popkum, and it is likely that spilled oil would also exhibit this behavior. The next major settlements downstream from Popkum are the communities of Fairfield and Chilliwack, although these communities are set back from the Fraser River by approximately 1 km or more. Notwithstanding this setback distance, Chilliwack has been subject to serious flooding on more than one occasion over the past 150 years.
Near Agassiz, the Fraser River has a width that varies between approximately 300 m (where there is a single main channel) and 1.7 km (where there is braiding of the channel with islands). The river is gently meandering with many islands and gravel bars that become exposed during periods of low flow near Agassiz, although the channel becomes more defined and islands become fewer moving downstream.

Trans Mountain Pipeline ULC Volume 7, Pipeline Facilities Technical Reports Trans Mountain Expansion Project Qualitative Ecological Risk Assessment of
Pipeline Spills Technical Report
December, 2013 REP-NEB-TERA-00019
Page 6-13
Many of the islands, which are typically 200 to 500 m in length and 100 to 200 m wide, are high enough to support forest cover similar to that found on the adjacent river banks. The islands and bars create side channels and may create backwaters where they are close to the river banks. Near Mission, BC (approximately 50 km downstream from the hypothetical spill location), the river undergoes a transition from a wandering gravel-bedded river to a single-thread, sand-bedded channel. This transition also marks the upstream extent of tidal influence, although salt water intrusion does not extend past the head of the Delta at New Westminster.
At a distance of 20 km downstream from the hypothetical spill location, the river falls to an elevation of approximately 10 masl, with a generally steady gradient of approximately 0.05%. By 40 km downstream, the river has an elevation of approximately 6.5 masl, and the gradient over this reach is approximately 0.02%. By 60 km downstream, the river has an elevation of approximately 5 masl, and from this point on, the river approaches sea level with a gradient of 0.01% or less, and becomes tidal in its lower reaches.
The Fraser River is known to carry a high sediment load (Attard 2012), consisting mainly of fine quaternary glacial deposits eroded directly from river banks and terraces. Total suspended sediment concentrations were measured at Mission, BC by Attard (2012) where the river channel is almost 500 m wide and 7 to 8 m deep with a sand bottom. Most observed TSS concentrations were less than 100 mg/L, although the total range of values was from <10 mg/L to about 350 mg/L, the higher values being found close to the riverbed. Concentrations of TSS in the upper 5 m of the water column were low (around 20 mg/L) in April 2010, but increased with the freshet to values in the range of 100 mg/L near the surface of the river in May and June 2010 (Attard 2012). The TSS is dominated by fine sediment (fine silt and clay) during low flows, with increasing transport of coarser sediment (sand) during high flows. The coarser sediment; however, shows increasing concentrations towards the riverbed, whereas the finer silt and clay particles are relatively uniformly distributed throughout the water column (Attard 2012).
The Coquihalla River enters the Fraser River a short distance downstream from the hypothetical spill location. From the confluence with the Coquihalla River, the Fraser River flows west, draining into the Strait of Georgia approximately 145 km downstream. The Sumas River and one of its larger tributaries, the Vedder River, enter the Fraser River approximately 61 km downstream from the confluence with Coquihalla River. These tributaries have lower turbidity than the main stem of the Fraser River.
The Water Survey of Canada maintains a hydrometric station on the Fraser River at Hope, BC (Station No. 08MF005) (Environment Canada 2011d). This station is approximately 1 km downstream of the confluence with the Coquihalla River. Discharge at this station has been recorded for all years since 1912. The annual high flow event typically occurs from May to July and flows gradually decline through summer and fall. Mean monthly flows are lowest in March at 871 m³/s and highest during the spring freshet with a peak in June at 6,980 m³/s. Data for this watercourse are summarized in Figure 6.4 and Table 6.6.

Trans Mountain Pipeline ULC Volume 7, Pipeline Facilities Technical Reports Trans Mountain Expansion Project Qualitative Ecological Risk Assessment of
Pipeline Spills Technical Report
December, 2013 REP-NEB-TERA-00019
Page 6-14
FIGURE 6.4 HISTORICAL MEAN MONTHLY STREAMFLOW (m3/s) SUMMARY FOR THE FRASER
RIVER AT HOPE, BC (STATION 08MF005)
TABLE 6.6 HISTORICAL MEAN MONTHLY STREAMFLOW (m3/s) SUMMARY FOR THE
FRASER RIVER AT HOPE, BC (STATION 08MF005)
Discharge Jan. Feb. Mar. Apr. May Jun. Jul. Aug. Sep. Oct. Nov. Dec.
Mean Discharge 935 876 871 1,810 4,910 6,980 5,520 3,510 2,350 1,930 1,600 1,120
Max. Discharge 1,860 2,200 1,830 3,600 8,170 10,800 9,600 6,440 4,460 3,460 2,830 2,420
Min. Discharge 516 497 482 676 2,690 4,390 3,640 2,270 1,380 924 727 540
Years of Streamflow Record: 1912 to 2011
Maximum Daily Discharge: 15,200 m³/s on May 31, 1948
Minimum Daily Discharge: 340 m³/s on January 8, 1916
Gross Drainage Area: 217,000 km2
Source: Environment Canada 2011d
The Water Survey of Canada also maintains a hydrometric station on the lower Fraser River at Mission, BC (Station No. 08MH024) (Environment Canada 2011e). Discharge at this station has been recorded for 32 years since 1965; however, continuous monitoring was only recorded from 1965 to 1992. The annual high flow event typically occurs from May to July, then flows abruptly decline during mid to late summer, gradually declining through fall and remaining low during winter. Mean monthly flows are lowest in February at 1,400 m³/s and highest during the spring freshet with a peak in June at 8,110 m³/s. Data for this monitoring station are presented in Figure 6.5 and Table 6.7.
0
2000
4000
6000
8000
10000
12000
Jan. Feb. Mar. Apr. May June July Aug. Sept. Oct. Nov. Dec.
Mean DischargeMax. DischargeMin. Discharge

Trans Mountain Pipeline ULC Volume 7, Pipeline Facilities Technical Reports Trans Mountain Expansion Project Qualitative Ecological Risk Assessment of
Pipeline Spills Technical Report
December, 2013 REP-NEB-TERA-00019
Page 6-15
FIGURE 6.5 HISTORICAL MEAN MONTHLY STREAMFLOW (m3/s) SUMMARY FOR THE LOWER
FRASER RIVER AT MISSION, BC (STATION 08MH024)
TABLE 6.7 HISTORICAL MEAN MONTHLY STREAMFLOW (m3/s) SUMMARY FOR THE LOWER
FRASER RIVER AT MISSION, BC (STATION 08MH024)
Discharge Jan. Feb. Mar. Apr. May Jun. Jul. Aug. Sep. Oct. Nov. Dec.
Mean Discharge 1,440 1,400 1,450 2,370 5,560 8,110 6,420 4,220 2,890 2,360 2,270 1,640
Max. Discharge 2,730 2,520 2,460 3,330 7,460 12,400 8,810 7,170 5,160 3,250 3,640 2,990
Min. Discharge 881 889 973 1,290 3,240 5,720 4,490 2,880 2,090 1,370 1,240 1,040
Years of Streamflow Record: 1965 to 1992
Maximum Daily Discharge: 13,500 m³/s on June 22, 1967
Minimum Daily Discharge: 648 m³/s on February 15, 1980
Gross Drainage Area: 228,000 km2
Source: Environment Canada 2011e
The main influences affecting water quality of the Fraser River at Hope are treated effluent from pulp mills at Prince George, Quesnel and Kamloops, treated municipal wastewater effluent from Prince George, Quesnel, Williams Lake and Kamloops, and non-point sources of pollution from agriculture, forestry and urban areas (Environment Canada 2004).
In the Water Quality Assessment of Fraser River at Hope (1979-2004), it was determined that higher levels of certain parameters, including most metals, correlated with increased turbidity associated with increased flows. The study found that metal concentrations during periods of high turbidity that exceeded guidelines or site-specific water quality objectives were not biologically available and therefore of little concern (BC MOE 2007a).
In the latest Environmental Trends in British Columbia: 2007 report, water quality for the Fraser River at Hope for the 2002-2004 reporting period was given a CCME Water Quality Index rating of “Good” (i.e., water quality is protected with only a minor degree of threat or impairment; measurements rarely exceed water quality guidelines and, usually, by a narrow margin) (BC MOE 2007b). Water quality for the Fraser River at Hope is considered to be improving largely due to decreases in wastewater effluent at pulp mills (BC MOE 2007b).
0
2000
4000
6000
8000
10000
12000
14000
Jan. Feb. Mar. Apr. May June July Aug. Sept. Oct. Nov. Dec.
Mean DischargeMax. DischargeMin. Discharge

Trans Mountain Pipeline ULC Volume 7, Pipeline Facilities Technical Reports Trans Mountain Expansion Project Qualitative Ecological Risk Assessment of
Pipeline Spills Technical Report
December, 2013 REP-NEB-TERA-00019
Page 6-16
6.1.2.4. Fraser River and Delta near the Port Mann Bridge at RK 1167.5
The hypothetical spill location at RK 1167.5 is located close to the mouth of the Fraser River, between the Port Mann Bridge and the point at which the proposed pipeline will pass below the Fraser River on its way to the Burnaby Terminal. Below the Port Mann Bridge, the pipeline will be close to the river bank and adjacent to rail yards. In this area, the most likely failure scenario would be third-party damage to the pipeline, resulting in a puncture and leading to a loss of oil that would migrate to the river. From the area of the hypothetical spill to the open water at the mouth of the estuary is a distance of approximately 30 km. The elevation of the river in this reach would be very close to sea level and the river would be under tidal influence. Salt water intrusion would extend almost to the vicinity of the Port Mann Bridge, and water could be fresh at the surface, but saline below the surface. Riparian vegetation has been cleared in many areas and log decks and barges are frequently present.
The lower Fraser River main stem and its estuary provide critical rearing, staging and migratory habitat for adult and juvenile salmon. In addition, salmon undergo great physiological changes in this section of the Fraser River to acclimatize from a saline to freshwater environment (adult salmon) and from a freshwater to saline existence (juvenile salmon) (Langer 2010). Lower Fraser River tributaries also provide key spawning areas for Pacific salmon.
One major group of Fraser River coho salmon occupies coastal and lower Fraser River tributaries (Simpson et al. 2001) while the other is an interior population aggregate that use tributaries above the District of Hope (Irvine et al. 2001). Spawning for pink and chum salmon tends to be concentrated in Fraser River tributaries below the District of Hope and chum salmon have been reported to spawn in at least 120 tributaries to the lower Fraser River (Labelle 2009). A major fall-run Chinook salmon population spawns in the Chilliwack and Harrison rivers (DFO 1999). Sockeye salmon are distributed throughout much of the lower Fraser River; key habitat includes the Chilliwack River watershed and microhabitats within freshwater and tidal areas of the lower Fraser River that are used for rearing and migration (Johannes et al. 2011). Steelhead are also common to lower Fraser River tributaries and some key spawning areas include the Coquihalla River, Chilliwack River, Salmon River and Silverhope Creek (Lill 2002).
At the hypothetical spill location, oil would most likely travel overland until reaching a drainage ditch near the railway lands, where it could potentially follow storm drainage systems, culverts and other preferential pathways to the Fraser River.
Approximately 7.5 km below the hypothetical spill location, the river starts to split into multiple channels as it enters the Delta. Depending upon seasonal flow regimes and the tide, these channels provide multiple pathways by which spilled oil could reach the sea.
High suspended sediment loads tend to undergo flocculation as they transition from freshwater to sea water. This results in a larger effective particle size and a tendency for the flocculated particles to settle more rapidly than the non-flocculated particles. This deposition of sand, silt and clay is the process that built the Delta, and an ongoing supply of such particles is an important factor in sustaining both the Delta, and the biological productivity of the delta ecosystem.
The Water Survey of Canada maintains a hydrometric station on the Fraser River at Port Mann Pumping Station, BC (Station No. 08MH126) (Environment Canada 2011f). This station is within approximately 1 km of the proposed crossing location of the Fraser River at RK 1167.5. Discharge at this station was recorded for 18 years between 1965 and 1992. The annual high flow event typically occurs from May to July, then flows abruptly decline during mid to late summer, gradually declining through fall and remaining low during winter. Mean monthly flows are lowest in January at 1,780 m³/s and highest during the spring freshet with a peak in June at 8,590 m³/s. Data for this monitoring station are presented in Figure 6.6 and Table 6.8. In the lower sections of the Fraser River, flows are subject to semi-diurnal tidal movements. Surface water levels in this lower reach are subject to meso-tidal ranges, with differences of around 2 m between high and low water recorded adjacent to the Port Mann Bridge. A tidal bore associated with the daily tides extends approximately 45 km further upstream from the Port Mann Bridge.

Trans Mountain Pipeline ULC Volume 7, Pipeline Facilities Technical Reports Trans Mountain Expansion Project Qualitative Ecological Risk Assessment of
Pipeline Spills Technical Report
December, 2013 REP-NEB-TERA-00019
Page 6-17
FIGURE 6.6 HISTORICAL MEAN MONTHLY STREAMFLOW (m3/s) SUMMARY FOR THE FRASER
RIVER AT PORT MANN PUMPING STATION, BC (STATION 08MH126)
TABLE 6.8 HISTORICAL MEAN MONTHLY STREAMFLOW (M3/S) SUMMARY FOR THE
FRASER RIVER AT PORT MANN PUMPING STATION, BC (STATION 08MH126)
Discharge Jan. Feb. Mar. Apr. May Jun. Jul. Aug. Sep. Oct. Nov. Dec.
Mean Discharge 1,780 1,820 1,880 2,850 5,790 8,590 6,580 4,210 2,850 2,550 2,690 1,870
Max. Discharge 2,510 3,090 3,110 3,530 7,310 11,900 9,010 5,340 3,860 3,730 4,610 2,800
Min. Discharge 1,030 1,110 1,080 1,600 3,550 6,920 4,740 2,930 2,190 1,460 1,660 1,280
Years of Streamflow Record: 1965 to 1972 and 1983 to 1992
Maximum Daily Discharge: 13,700 m³/s on June 22, 1967
Minimum Daily Discharge: 621 m³/s on February 6, 1985
Gross Drainage Area: 232,000 km2
Source: Environment Canada 2011f
The Fraser River becomes increasingly complex as it enters the Delta area, due to interactions between fresh and salt water, increasing channel complexity, tidal variations with attendant effects on river currents, salinity, and areas of exposed mudflat, as well as the potential for spilled oil to be transported through the Delta and into the marine environment of the Strait of Georgia. Therefore, the potential fate and transport of crude oil that could be spilled in the lower reaches of the Fraser River was investigated using stochastic modeling (EBA 2013). The results of the stochastic modeling are summarized in blocks, each representing three months of the year, in Appendix B. To maximize the potential for crude oil from a hypothetical spill to reach the Delta, a spill location was selected near the location of the horizontal directional drill (HDD) passage beneath the Fraser River, from the south side to the north side. Because of the depth and degree of protection that is afforded to the pipeline in an HDD, as well as the thicker pipe walls, a full bore rupture of the pipeline at such a location is an extremely unlikely event. The more probable and credible accident scenario in the lower reaches of the Fraser River is therefore a third party damage to the line, such as could be caused by a backhoe or similar equipment striking the pipeline in an unauthorized excavation. Despite the very low probability of a full bore rupture, a spill volume of 1,250 m3 was selected for this assessment (Table 6.17). The more likely scenario of third-party damage to the pipeline was estimated to have a credible worst case spill volume of 812.5 m3.
The Fraser River at the hypothetical spill location is subject to semi-diurnal flow reversal caused by the rising tide, at least during periods of low river flow, so that spilled oil could be transported a short distance upstream with the rising tide and favourable winds. On the falling tide, spilled crude oil would be rapidly advected downstream, so that it could reach the river mouth in one to two days during winter (low river
0
2000
4000
6000
8000
10000
12000
14000
Jan. Feb. Mar. Apr. May June July Aug. Sept. Oct. Nov. Dec.
Mean DischargeMax. DischargeMin. Discharge

Trans Mountain Pipeline ULC Volume 7, Pipeline Facilities Technical Reports Trans Mountain Expansion Project Qualitative Ecological Risk Assessment of
Pipeline Spills Technical Report
December, 2013 REP-NEB-TERA-00019
Page 6-18
flow), or in less than one day or less in summer (high river flow). Variations in the time required for spilled crude oil to reach the river mouth in any season would depend primarily on the state of the tide at the time of spill initiation. Sediment substrates in the river are predominantly sandy, although muddy sediments can be found in more protected or backwater areas (VAFFC 2012a, Attard 2012).
From the Port Mann Bridge downstream to the George Massey Tunnel, the river banks are highly industrialized, with a shipping channel, rail yards, wharves, docks, barge traffic and log booms. The first major divide in the river channel occurs about 7.5 km downstream from the hypothetical spill location, at the upstream end of Annacis Island. Here the river divides into three channels, one forming the north shore of the large island that is occupied by the City of Richmond, the second forming the north shore of Annacis Island. The main river channel continues to the south of Annacis Island until it reaches the George Massey Tunnel. A short distance downstream from the tunnel, the main channel divides again so that the main flow of the river (forming the south shore of Richmond) passes to the north of a complex of mudflats and wetlands, while smaller channels loop southwards before dividing again on the upstream end of Westham Island. Some of this flow returns to the main channel along the north side of Westham Island, whereas some flow is diverted southwest around the south side of Westham Island. Westham Island is used primarily for farming, and is protected by dykes on its upstream side. The west side of Westham Island is more natural, and grades into Roberts Bank.
There are three large areas of intertidal mudflat associated with the Delta. On the west side of Richmond, Sturgeon Bank extends from the west end of Vancouver, past Vancouver International Airport, and Richmond, ending where the main channel of the Fraser River divides it from Roberts Bank. Roberts Bank comprises the outer edge of the Delta south of the main river channel, extending towards Tsawwassen, where coal and ferry terminals project into the Strait of Georgia. On the east side of the Tsawassen peninsula lies Boundary Bay, not directly in contact with the Fraser River, but also supporting extensive mudflats. The tip of the Tsawassen peninsula (Point Roberts) is US territory, whereas the interior of Boundary Bay is Canadian territory. Sediment substrates in the “mudflat” areas can be characterized as predominantly sandy, or predominantly muddy. Mud substrates predominate in the high mudflat areas, and in subtidal sediments of the Strait of Georgia; sand substrates predominate over most of intertidal zones of the Sturgeon and Roberts Banks. The Fraser River Delta and Boundary Bay have received designations as a Hemisphere Shorebird Reserve, and a globally Important Bird Area; and in addition are designated as a wetland of international important under the United Nations RAMSAR convention.
Beyond the Delta lies the Strait of Georgia, and associated islands such as Gabriola Island, Valdes Island and Galiano Island lying some 20 to 35 km distant, between Nanaimo and Victoria on Vancouver Island. These and others comprise the Gulf Islands on the Canadian side, whereas on the US side there are the San Juan Islands which together separate the Strait of Georgia from the Juan de Fuca Strait.
The river channels and mudflats associated with the Fraser River Delta, as well as areas of mudflat, salt marsh, and other wetlands along the Fraser River and associated islands in the river and Delta are regarded as important fish habitat (including migratory, spawning and rearing habitat), as well as providing habitat for birds (including migratory birds) and other wildlife species.
6.1.3. Identification of Ecological Receptors
For the purpose of this qualitative ERA, it was neither practical nor necessary to individually assess every receptor that may potentially be affected by a hypothetical spill. Instead, the potential negative effects of pipeline spills to the freshwater environment were assessed for different groups of ecological receptors that might be exposed to spilled oil as a result of their habitats and life cycles.
The environmental effects of a spill at the hypothetical scenario locations were considered to be representative of the environmental effects that could occur at almost any location along the proposed pipeline corridor, in the unlikely event of a large oil spill. In that context, the ecological receptors considered in this qualitative ERA were treated generically. Thus, they were not intended to be an exact representation of the species present at the hypothetical spill location; rather they were intended to be

Trans Mountain Pipeline ULC Volume 7, Pipeline Facilities Technical Reports Trans Mountain Expansion Project Qualitative Ecological Risk Assessment of
Pipeline Spills Technical Report
December, 2013 REP-NEB-TERA-00019
Page 6-19
representative of species that could be affected by an accidental oil spill affecting a watercourse or watercourses in Alberta or British Columbia.
A variety of organisms are found in the aquatic and shoreline environments along the proposed pipeline corridor. In addition to fish species, the rivers also support populations of aquatic and riparian vegetation, invertebrates, and wildlife. The ecological receptors assessed in the ERA are shown in Table 6.9 and described below.
TABLE 6.9 ECOLOGICAL RECEPTORS ASSESSED IN THE ERA
Aquatic Biota Terrestrial Biota
Fish and Fish Eggs and Larvae In-Water Amphibians Aquatic Invertebrates Aquatic Vegetation
Mammals Birds Reptiles and Air-Breathing Amphibians Soil Invertebrates Shoreline Vegetation
6.1.3.1. Fish and Fish Eggs and Larvae
Indicator fish species for Alberta are defined in the report “Fisheries Alberta Technical Report for the Trans Mountain Pipeline ULC, Trans Mountain Expansion Project” prepared by TERA Environmental Consultants (2013) and include the following:
Bull trout Arctic grayling Athabasca rainbow trout Northern pike Walleye Burbot.
Other species of management concern that could reasonably be encountered in watercourses along the Edmonton to Hinton segment include:
Lake sturgeon Sauger Brown trout Brook trout Rainbow trout (introduced) Cutthroat trout (introduced) Mountain whitefish Yellow perch Mooneye Goldeye Spoonhead sculpin Northern redbelly dace.
Indicator fish species for British Columbia are defined in the report “Fisheries Technical Report for the Trans Mountain Pipeline ULC, Trans Mountain Expansion Project” by Triton Environmental Consultants (2013) and include the following:
Chinook salmon Coho salmon Bull trout Dolly varden Rainbow trout / Steelhead

Trans Mountain Pipeline ULC Volume 7, Pipeline Facilities Technical Reports Trans Mountain Expansion Project Qualitative Ecological Risk Assessment of
Pipeline Spills Technical Report
December, 2013 REP-NEB-TERA-00019
Page 6-20
Cutthroat trout (coastal and westslope subspecies).
Other listed species that could reasonably be encountered in watercourses along the British Columbia portion of the proposed pipeline corridor include:
Green sturgeon White sturgeon Salish sucker Nootsack dace Eulachon Mountain sucker Cultus Lake sockeye salmon Interior Fraser coho salmon.
For the purposes of this qualitative ERA, fish will be addressed as an assemblage and will be represented by a generic salmonid species. This approach is reasonable because salmonids are among the more sensitive species to hydrocarbon exposure, and critical portions of their life cycle occur in fresh water. They are also among the species of highest management concern in both Alberta and British Columbia.
6.1.3.2. In-Water Amphibians
Amphibians, such as salamanders, frogs and toads, are likely present in the rivers, streams, ponds and wetlands along the proposed pipeline corridor, but their abundance would depend on the presence of surface water, breeding habitat, and prey items (e.g., insects). Some species of salamanders do not breed in water, but instead may lay eggs in damp places on land. The following species are likely to be found along ports or all of the proposed pipeline corridor in Alberta and British Columbia:
Long-toed salamander Wood frog Columbia spotted frog Boreal chorus frog Western toad North Pacific tree frog Red legged frog Great Basin spadefoot toad.
Many amphibian species are considered to be species at risk or sensitive species within their distributional ranges. For the purposes of the ERA, it is assumed that amphibian species may be present, and that they spend all or some of their life cycle in or around freshwater streams and rivers. Representing the aquatic portion of their life cycle, amphibian eggs and larvae are the most sensitive life stages. Owing to a general lack of toxicological information representing the effects of low-level hydrocarbon exposure on amphibian eggs, embryos and adults while in-water, these life stages will be assessed in conjunction with fish eggs and embryos, and fish generally.
6.1.3.3. Aquatic Invertebrates
The aquatic invertebrates prevalent along the pipeline corridor are likely typical of those found in freshwater streams. These include such species as mayflies, stoneflies, caddisflies, oligochaetes, chironomids, leeches, nematodes and beetles, freshwater bivalves, crustaceans and other benthic macro-invertebrates. The aquatic invertebrate community provides many important links in aquatic and terrestrial food webs, as well as providing a substantial food resource for many fish, amphibian, and bird species.
For the purposes of the ERA, aquatic invertebrates will be treated as a community. While individual species will vary in their sensitivity to hydrocarbon exposure, community metrics such as biomass, species richness and species diversity provide indicators of environmental effect and recovery.

Trans Mountain Pipeline ULC Volume 7, Pipeline Facilities Technical Reports Trans Mountain Expansion Project Qualitative Ecological Risk Assessment of
Pipeline Spills Technical Report
December, 2013 REP-NEB-TERA-00019
Page 6-21
6.1.3.4. Aquatic Vegetation
Along most stretches of the pipeline corridor, the aquatic vegetation (where present) will be assumed to consist of emergent and submerged plants, including riparian shrubs, sedges, grasses, rushes, submerged vascular plants, and non-vascular plants such as aquatic mosses and algae.
For the purposes of the ERA, aquatic vegetation will be treated as a community. While individual species will vary in their sensitivity to hydrocarbon exposure, community metrics such as biomass, species richness and species diversity, provide indicators of environmental effect and recovery.
6.1.3.5. Mammals
Since much of the proposed pipeline corridor is surrounded by forested land, a wide range of mammal species inhabit the area. Mammal species include large carnivores, such as grizzly, black bear and wolf; ungulates such as elk, deer and moose; and furbearer species such as marten, fisher, otter, mink, beaver and lynx. There are also numerous small mammals such as mice, voles, squirrels, rabbits and hares.
For the purposes of the ERA, individual species are selected as indicators of effects on mammals generally, and represent other mammal species that may be present and share similar habitat and dietary characteristics. Indicator species selected for their tendency to occupy habitat and use resources associated with rivers and streams include:
Grizzly Bear Moose Muskrat River Otter.
6.1.3.6. Birds
Since much of the proposed pipeline corridor is surrounded by forested land, a wide range of bird species inhabit the area, including a number of songbirds, such as the olive-sided flycatcher and the wood warbler, and raptor species such as the northern goshawk, barred owl and western screech-owl. Waterfowl prevalent in the area include the Canada goose, mallard and trumpeter swan. Other waterbirds, such as black tern and common snipe, often use adjacent wetlands for breeding and nesting activity.
For the purposes of the ERA, individual species are selected as indicators of effects on birds generally, and represent other avian species that may be present and share similar habitat and dietary characteristics. Indicator species selected for their tendency to occupy habitat and use resources associated with rivers and streams include:
Bald Eagle Canada Goose Great Blue Heron Mallard Duck Spotted Sandpiper Tree Swallow.
6.1.3.7. Reptiles and Air-Breathing Amphibians
Reptiles such as turtles and snakes, and amphibians such as toads are likely present in the rivers and streams, or in nearby terrestrial habitat along portions of the pipeline corridor. The degree to which turtles occupy aquatic habitat varies, but most turtles occupy aquatic habitat during at least part of their life cycle (e.g., either as a primary habitat during summer or as hibernacula during winter). The most likely turtle encounter would be with the Western painted turtle in riparian habitat or backwater ponds of portions of the Thompson and lower Fraser River drainages. Turtle encounters are unlikely in Alberta due to their limited distribution.

Trans Mountain Pipeline ULC Volume 7, Pipeline Facilities Technical Reports Trans Mountain Expansion Project Qualitative Ecological Risk Assessment of
Pipeline Spills Technical Report
December, 2013 REP-NEB-TERA-00019
Page 6-22
For the purposes of the ERA, reptiles and air-breathing amphibians will be represented by the Western painted turtle.
6.1.3.8. Soil Invertebrates
Soils along the proposed pipeline corridor and in the riparian zones of watercourses potentially affected by spilled oil support communities of soil invertebrates. Representative types of soil invertebrates include, but are not limited to, nematodes, earthworms, insects and other arthropods including mites and spiders, and mollusks such as slugs and snails. The soil invertebrate community provides many important links in the terrestrial food web, particularly with respect to the processing of detritus, as well as providing a substantial food resource for many amphibians, reptiles, mammals and birds.
For the purposes of the ERA, soil invertebrates will be treated as a community. While individual species will vary in their sensitivity to hydrocarbon exposure, community metrics such as biomass, species richness and species diversity provide indicators of environmental effect and recovery.
6.1.3.9. Shoreline Vegetation
Along most river reaches, the shoreline vegetation consists of a mixture of forest trees, shrubs and sedges, with potential for emergent, floating or submerged aquatic plants, including both vascular and non-vascular plants and fungi in the riparian and aquatic environments. Locally, however, agricultural or urbanized land may extend to the river edge. Depending upon the particular river and reach, the riparian zone may be narrow and confined by steep valley walls, or may represent an extensive zone of high biological richness and diversity, inundated seasonally or less frequently by high river flows.
For the purposes of the ERA, the shoreline and riparian vegetation will be treated as a community. While individual species will vary in their sensitivity to hydrocarbon exposure, community metrics such as percent cover, dominant species composition, species richness and species diversity provide indicators of environmental effect and recovery.
6.1.4. Identification of Exposure Pathways
An exposure pathway describes the movement of a COPC from a source to an eventual point of contact or intake (exposure) by an ecological receptor. Identifying the potential exposure pathways involves consideration of several factors. The life history traits of each receptor (e.g., habitat, diet), features of the affected environment (e.g., habitat suitability), and the environmental fate and transport properties of the COPCs (including weathering properties) comprise but a few of the components taken into account. Table 6.10 provides a summary of potential exposure pathways for the Project resulting from hypothetical pipeline spills of diluted bitumen into the freshwater environment.
TABLE 6.10 POTENTIAL EXPOSURE PATHWAYS RESULTING FROM HYPOTHETICAL PIPELINE SPILLS INTO THE FRESHWATER ENVIRONMENT
Source Exposure Pathways Exposure
Pathways Carried Forward?
Justification
Oiled upland soils and vegetation
Direct contact
Ingestion
Inhalation of vapours
No The area of upland soil affected by overland flow is expected to be very small and isolated in comparison with the area of aquatic and riparian habitat that is potentially affected. Further, upland soil was assumed to be remediated to Provincial Standards that are protective of all exposure pathways and receptors. Therefore, there will be no residual effects on receptors and this exposure pathway is not carried forward in the ERA.

Trans Mountain Pipeline ULC Volume 7, Pipeline Facilities Technical Reports Trans Mountain Expansion Project Qualitative Ecological Risk Assessment of
Pipeline Spills Technical Report
December, 2013 REP-NEB-TERA-00019
Page 6-23
TABLE 6.10 POTENTIAL EXPOSURE PATHWAYS RESULTING FROM HYPOTHETICAL PIPELINE SPILLS INTO THE FRESHWATER ENVIRONMENT
Source Exposure Pathways Exposure
Pathways Carried Forward?
Justification
Oiled shoreline or riparian soils and vegetation
Direct contact
Ingestion
Inhalation of vapours
Yes Shorelines are expected to become oiled if down-river transport of oil slicks results in shoreline stranding. Such stranding becomes more likely to occur and to account for more mass of oil if a spill occurs during a high flow event and receding flows allow oil to become trapped over a broad riparian zone. Ecological receptors may directly contact and/or ingest oiled soils. Although ecological receptors may inhale hydrocarbon vapours, dilution in the outdoor air is expected to result in negligible effects; therefore, the vapour inhalation pathway will not be carried forward in the ERA.
Accumulation of hydrocarbon COPCs by terrestrial plants, soil invertebrates, reptiles, air-breathing amphibians, mammals and birds
Ingestion of shoreline plants
Ingestion of terrestrial invertebrates
Ingestion of reptiles/air-breathing amphibians
Ingestion of bird/mammal prey
Yes Following shoreline oiling, soil invertebrates, reptiles, air-breathing amphibians, mammals and birds, may accumulate hydrocarbon COPCs as a result of ingesting contaminated plant, invertebrate or animal foods.
River water Direct contact
Ingestion
Inhalation of vapours
Yes River water will become contaminated with floating, dispersed, overwashed or dissolved hydrocarbon COPCs, if spilled oil enters the aquatic environment. Ecological receptors may come into direct contact with or be exposed to oil or oily water, or may ingest contaminated water. Although ecological receptors may inhale hydrocarbon vapours at the water surface, dilution in the outdoor air is expected to result in negligible effects; therefore, the vapour inhalation pathway will not be carried forward in the ERA.
River sediment Direct contact
Ingestion
Direct contact with pore water
Yes Some river sediments may become contaminated by trapping droplets or globules of dispersed or overwashed oil, by adsorbing dissolved oil, or if oil becomes mixed with denser materials such as sand, gravel or suspended sediment, resulting in the physical sinking of oil. Ecological receptors may come into direct contact with oil in sediment, or may ingest contaminated sediments. In addition, ecological receptors such as fish eggs and embryos or benthic invertebrates may be exposed to sediment pore water that contains dissolved hydrocarbon COPCs.
Accumulation of hydrocarbon COPCs by aquatic plants, aquatic invertebrates, in-water amphibians, fish, mammals and birds
Ingestion of aquatic plants
Ingestion of benthic invertebrates
Ingestion of in-water amphibians
Ingestion of fish
Yes Following release of oil to a river, aquatic invertebrates, in-water amphibians, fish, mammals and birds may accumulate hydrocarbon COPCs as a result of ingesting contaminated plant, invertebrate or animal foods.
6.1.5. Conceptual Site Model
Figure 6.7 provides a schematic representation of the interactions between receptors and the COPCs in relevant exposure media, via various potential exposure pathways. The potential exposure pathways are designated by arrows leading from the contaminant source media to each receptor. Relevant pathways for each receptor are identified with an “X” in the compartments within the matrix.

Trans Mountain Pipeline ULC Volume 7, Pipeline Facilities Technical Reports Trans Mountain Expansion Project Qualitative Ecological Risk Assessment of
Pipeline Spills Technical Report
December, 2013 REP-NEB-TERA-00019
Page 6-24
FIGURE 6.7 CONCEPTUAL EXPOSURE MODEL FOR ECOLOGICAL RECEPTORS AND SELECTED INDICATORS
Direct Contact X X X X X X X X X X X X X
Ingestion X X X X X X X X X X X X
Bird/Mammal prey Ingestion X X X X X
Shoreline Plants Ingestion X X X X X X X X
Soil Invertebrates Ingestion X X X X X
Direct Contact X X X X X X X X X X X X X
River Water
Ingestion X X X X X X X X X X X X X
Fish Ingestion X X X X X X X
Aquatic Plants Ingestion X X X X X
Direct Contact X X X X X X X X X X X X
Ingestion X X X X X X X X X X X X
Benthic Invertebrates Ingestion X X X X X X X
Pore Water Direct Contact X X X
Submerged Oil Direct Contact X X X X X X X X X X
Notes:
X - a potentially complete exposure pathway. No residual impacts. This media is assumed to be cleaned to Provincial Standards protective of all pathways.
Receptors (VECs)Source
Fis
h a
nd
In
-Wa
ter
Am
ph
ibia
ns
Fis
h a
nd
Am
ph
ibia
n
Eg
gs
Aq
ua
tic
In
ve
rte
bra
tes
Aq
ua
tic
Ve
ge
tatio
n
Ca
na
da
Go
ose
Gre
at Blu
e H
ero
n
Ma
llard
Du
ck
Sp
otte
d S
an
dp
ipe
r
Source of COPC Exposure MediaPotential Exposure
Pathways
Riv
er
Otte
r
Ba
ld E
ag
le
Tre
e S
wa
llow
Re
ptile
s a
nd
Air-
Bre
ath
ing
Am
ph
ibia
ns
River Water
River Sediment
Shoreline Soil
Grizz
ly B
ea
r
Mo
ose
Mu
skra
t
Submerged Oil
Sediment
Oiled Shorelines
Sh
ore
line
an
d R
ipa
ria
n
Ve
ge
tatio
n
So
il In
ve
rte
bra
tes

Trans Mountain Pipeline ULC Volume 7, Pipeline Facilities Technical Reports Trans Mountain Expansion Project Qualitative Ecological Risk Assessment of
Pipeline Spills Technical Report
December, 2013 REP-NEB-TERA-00019
Page 6-25
6.2. Exposure Assessment
The objectives of the Exposure Assessment are the following:
To gather information to support predictions about the fate and transport of hypothetical pipeline releases of diluted bitumen into the freshwater environment along the proposed pipeline corridor.
To gather information to qualitatively assess the ecological effects of COPC exposure resulting from hypothetical pipeline releases of diluted bitumen into the freshwater environment along the proposed pipeline corridor.
The qualitative ERA assesses both acute (short-term) and chronic (medium to long-term) risks to ecological receptors. The assessment of acute ecological risk focuses on the short-term effects of a pipeline release and the assessment of chronic risk begins after the acute exposure assessment.
6.2.1. Fate and Behaviour of Oil When Spilled in the Environment
Crude oils and refined petroleum products are complex mixtures of hydrocarbon compounds derived from naturally occurring geological formations. When released into the environment, various weathering processes work to break down the hydrocarbons into primarily carbon dioxide and water. The rate of these processes depends upon the type of oil (i.e., the specific mixture of hydrocarbon compounds present), characteristics of the receiving environment (e.g., location of the release, season, weather conditions, etc.), the volume spilled, and other factors.
Weathering, which results in changes to the chemical composition and physical characteristics of oil over time, occurs as a result of biological, chemical and physical processes. Upon being spilled, volatile hydrocarbons quickly (i.e., on a time scale of minutes to days, depending upon the volatility of the compound and the environmental conditions) evaporate into the atmosphere, leaving heavier components of the crude oil mixture behind. As the crude oil weathers, its density and viscosity tend to increase. On a slower time scale (i.e., days to weeks or longer), sunlight and microorganisms degrade hydrocarbons through photo-oxidation and biodegradation, which results in the gradual breakdown of larger molecules into smaller and simpler molecules that are themselves generally more amenable to further weathering.
If relatively fresh crude oil reaches water, some of the lighter hydrocarbon compounds that would otherwise evaporate may dissolve into the water, resulting in concentrations that may be toxic to aquatic organisms. In addition, physical processes such as dispersion (formation of oil droplets in water due to turbulent mixing), emulsification (formation of a water-in-oil suspension that may or may not be stable, and is denser than the crude oil alone), entrainment and overwashing (temporary submergence) of oil, sinking and sedimentation, and shoreline stranding, reduce the size of the surface oil slick and help the environment assimilate the spilled oil (National Research Council [NRC] 2003). Weathering rates are temperature and time dependent, increasing with increasing temperature (NRC 2003) and decreasing with time, as the remaining hydrocarbons are those that are less susceptible to weathering processes.
Because crude oils and petroleum products are composed of differing mixtures of hydrocarbon compounds, each have different physical properties (e.g., viscosity, density, solubility) that affect their fate and transport once released into the environment (NRC 2003). For example, highly viscous oils (i.e., those with a higher percentage of heavy fractions, or high asphaltene and resin content) tend to weather more slowly because they do not readily spread into thin oil slicks, and they contain a substantial number of chemical constituents that resist degradation.
The burial of pipelines typically slows the spread of oil from a release site. Depending on the rate of discharge from the pipeline (e.g., a pin-hole leak versus a full-bore rupture) and the oil properties (e.g., viscosity and pour point), oil may be forced to the surface through the pore spaces in soil. Frozen ground may limit the movement of oil from the spill site, and snow cover, if present, can also help to absorb or limit the spread of oil.

Trans Mountain Pipeline ULC Volume 7, Pipeline Facilities Technical Reports Trans Mountain Expansion Project Qualitative Ecological Risk Assessment of
Pipeline Spills Technical Report
December, 2013 REP-NEB-TERA-00019
Page 6-26
When a release is detected, emergency response preparedness and emergency response actions reduce the effects on the environment. The containment, recovery, and clean-up actions undertaken are specific to the affected receiving environment and include consideration of local sensitivities.
In the event of a full-bore rupture, the volume released would be made up of a dynamic (pressurized) and a static (gravity-based) drain-out volume. The dynamic release volume varies based on the volume of oil flowing through a pipeline, the time it takes to detect the loss of containment, and the time it takes to close the valves. The static release volume is based on the distance to the nearest pipeline valve, local topography, pipeline profile characteristics, and oil properties. The movement of oil would initially be dominated by the pressure differential as oil is forced out of the pipe by dynamic and static forces.
Oil spilled into the terrestrial environment undergoes physical, chemical and biological processes that weather the oil as it is transported away from the source (Figure 6.8). During the initial phase of a spill from a buried pipeline, oil can be forced to the surface, where it may flow over land. Portions of the oil may adhere to surface soil, debris and vegetation, pool in low lying areas, and/or infiltrate the soil. The rate of oil flow over land is a function of oil viscosity, ground and air temperature, slope of the terrain, and surface conditions (e.g., roughness, vegetation type and cover, soil type, permeability, snow cover) (Owens 2002).
After the initial period when the dynamic and static pressures from the release site subside and the oil has spread out, hydrocarbon movement tends to slow. Oil in or on soil may sink downward under gravity and spread horizontally in the subsurface as a result of capillary forces. If the oil were to encounter an impermeable or semi-permeable soil structure (e.g., bedrock, impermeable or frozen soil, water table), downward movement would halt or slow, and the oil would spread laterally. Unless the oil reached a watercourse (where further spreading would be likely), eventually the oil would stop moving and remain in local surface pools, be absorbed on vegetation and the litter layer, and be trapped in the void spaces within the soil structure. However, even when immobilized, hydrocarbons would remain subject to physical weathering and microbial biodegradation.
Oil spilled into the aquatic environment undergoes weathering processes similar to those described for the terrestrial environment, but they occur in a more dynamic system with a greater number of transport mechanisms (Figure 6.9). Upon entering a waterbody, oil spreads over the water surface forming an oil slick. Volatile hydrocarbons quickly evaporate into the atmosphere, and water-soluble components dissolve in the water at a rate that depends upon the turbulent energy present and the oil characteristics. Sunlight and microorganisms degrade hydrocarbon components through photo-oxidation and biodegradation. Physical processes (e.g., wind, waves and currents causing turbulent dispersion) may result in the formation of water-in-oil emulsions (mousse), which may cause the formation of small oil droplets that disperse in the water column, and enhance the rate of dissolution of soluble constituents. Depending upon the density of the oil, droplets may coalesce and resurface, or may combine with suspended particulate matter and remain in the water column. With sufficient turbulent energy, oil globules may become temporarily overwashed or entrained into the water column. Weathering may also result in the formation of tar balls, which are persistent discrete globs of oil with a weathered rind of material (Foght 2006, NOAA 2010).
Oil in aquatic environments may be horizontally transported via advection and spreading, or locally concentrated by Langmuir circulation. Oil can become stranded on shorelines as oil slicks are horizontally transported and make contact with shore, or if a spill occurs while river flow is in flood stage and water levels recede. Physical processes may also vertically transport the oil by driving oil droplets into the water column (dispersion). Oil spilled into a river will eventually weather (primarily by evaporation), strand on a shoreline, dissolve or disperse into the water column, or become associated with mineral grains and sink to the bottom in a relatively quiescent zone of the river.

Trans Mountain Pipeline ULC Volume 7, Pipeline Facilities Technical Reports Trans Mountain Expansion Project Qualitative Ecological Risk Assessment of
Pipeline Spills Technical Report
December, 2013 REP-NEB-TERA-00019
Page 6-27
FIGURE 6.8 OIL SPILLS IN TERRESTRIAL ENVIRONMENTS
FIGURE 6.9 OIL SPILLS IN AQUATIC ENVIRONMENTS

Trans Mountain Pipeline ULC Volume 7, Pipeline Facilities Technical Reports Trans Mountain Expansion Project Qualitative Ecological Risk Assessment of
Pipeline Spills Technical Report
December, 2013 REP-NEB-TERA-00019
Page 6-28
6.2.1.1. Oil-Mineral Aggregate Formation
Vertical mixing can cause oil from a surface slick to disperse into the water column as suspended droplets. Once in the water column, under certain conditions, suspended material can coat the oil droplets, forming oil-mineral aggregates (OMA) (Danchuk 2009). The formation rate of OMA depends upon suspended sediment characteristics and concentrations (Delvigne 1987, 2002, Guyomarch et al. 1999, Payne et al. 1989), droplet size and number (Khelifa et al. 2005a), temperature (Khelifa et al. 2002), salinity (Khelifa et al. 2005b, Le Floch et al. 2002, Payne et al. 1989), mixing energy (Cloutier et al. 2002), and oil characteristics (Khelifa et al. 2002). OMA stabilizes within 24 to 48 hours (Payne et al. 2003, Hill et al. 2002), and once stable, it does not re-coalesce with the slick or adhere to surfaces (Danchuk 2009).
The formation of OMA can be detrimental to oil spill recovery efforts, particularly if it leads to sinking or sedimentation of oil that would otherwise float and be more readily captured. On the other hand, OMA formation has also been found to enhance biodegradation rates in the water column, reduce the amount of oil adhering to shorelines (Lee 2002), and can render oil droplets neutrally or nearly neutrally buoyant, resulting in subsurface transportation of oil away from the spill location (Lee et al. 2003). In addition, it has been found that physical dispersion, enhanced dissolution, and biodegradation of oil resulting from OMA formation, lowers the concentrations of oil components to which biota are exposed (Lee 2002). To determine whether OMA formation could be an important process in the fate of spilled oil, a number of key factors were evaluated. These factors included (Lee 2002):
Mixing energy in the water column Temperature Oil characteristics Concentration, type and size distribution of suspended sediment Salinity.
During OMA formation, solid particles become associated with the outer surface of oil droplets in the water column. The oil droplet size associated with OMA formation ranges from approximately 0.2 to 4 µm, with a median value of about 0.6 to 1 µm (Khelifa et al. 2002). However, multiple droplet aggregates (where more than one droplet is present in a single OMA) and solid aggregates (elongated oil particles containing some mineral particles within the oil phase as well as on the outer surface) are also reported (Khelifa et al. 2002).
Mixing energy in the water column, oil characteristics (notably viscosity and density, which reflect the oil type, degree of weathering, and asphaltene/resin content) and temperature, all affect the tendency for oil droplets to form, and the size distribution of such droplets. OMA formation in light oils, which float on the water surface or rapidly re-surface and coalesce with floating oil, requires high mixing energy to maintain dispersed oil in the water column where OMA formation occurs. In contrast, relatively heavy oils can enter suspension in the water column at lower levels of mixing energy; however, they may also resist droplet formation due to associated higher viscosity. Similarly, viscosity increases at low temperatures, and again resistance to droplet formation can increase.
In addition to suitable oil droplet size, the potential for OMA formation increases with increasing sediment concentration (Ajijolaiya et al. 2006), decreasing sediment grain size (Ajijolaiya et al. 2006) and increasing organic content (Khelifa et al. 2008). Maximum OMA formation occurs when all droplets in suspension are coated by a film of sediment particles. As OMA classically takes the form of a monolayer of sediment particles coating an oil droplet, increased sediment concentrations, fine grained sediment particles and high organic content (although a secondary consideration after sediment grain size; Khelifa et al. 2008) have the potential to result in the greatest rates of OMA formation. Ajijolaiya et al. (2006) found that the amount of oil trapped in water was greater than one-half of the total oil for sediment mean diameters of 0.5 µm and 1 µm, approximately one-third for sediment mean diameters of 2 µm and 4 µm, and one-tenth for 16 µm. It was also determined that critical sediment concentrations for OMA formation increased linearly with increasing sediment sizes (Ajijolaiya et al. 2006).

Trans Mountain Pipeline ULC Volume 7, Pipeline Facilities Technical Reports Trans Mountain Expansion Project Qualitative Ecological Risk Assessment of
Pipeline Spills Technical Report
December, 2013 REP-NEB-TERA-00019
Page 6-29
Salinity also affects OMA formation because of its influence on surface chemistry. At low salinity, mineral particles and oil droplets are well dispersed because negative surface charges tend to counteract the van der Waals attraction forces (Huang and Elliot 1977). As salinity increases, attractive forces remain constant while the repelling negative surface charges tend to be neutralized. In a manner similar to the formation of flocculates when clay particles in river water enter brackish estuaries, OMA formation is also enhanced with increasing salinity, and inhibited in freshwater. Le Floch et al. (2002) found that some salinity is needed for OMA formation to occur. Below salinity levels of about 1 part per thousand (‰) (seawater having a salinity of 35‰, and freshwater typically having a salinity of less than 0.2‰), OMA formation is inhibited. Above salinity values of 2‰, OMA formation is no longer limited by a lack of salinity.
The foregoing considerations suggest that OMA formation involving diluted bitumen (which has high asphaltene and resin content) will be limited in inland waters, where the following conditions prevail:
Salinity is low There is low to moderate total suspended solids concentrations or turbidity Oils are viscous, or as oils weather so that viscosity increases Temperatures are low.
Conversely, higher potential for OMA formation can be expected where:
Salinity increases due to the presence of estuarine circulation Total suspended sediment concentrations are high Oil is fresh or only slightly weathered Temperatures are warm.
The formation of OMA does not dictate whether or not oil will sink. While the increased density of OMA will increase the density of the aggregate (relative to the oil droplet), OMA may remain positively or neutrally buoyant depending upon the characteristics of the oil and the ratio of oil to mineral in the aggregate (Le Floch et al. 2002). The formation of OMA is commonly regarded as beneficial for spilled oil, as it increases the natural dispersion of the oil, and promotes weathering and biodegradation processes (Lee 2002). In the estuarine environment, the density of the water increases with increasing salinity, so that OMA is more likely to remain suspended in the water column, and to disperse over a larger area, and may provide a net environmental benefit.
Danchuk (2009) evaluated the potential for OMA formation in the lower Mississippi River, a reach extending from Luling (river mile 119) to the Head of Passes (river mile 0). In this reach, the Mississippi River, although having mean annual flow about four times greater, shows marked similarities to the lower Fraser River with respect to channel dimensions, suspended sediment concentrations, the effects of tide and salinity from the nearby marine environment, and the presence of a delta.
In reviewing the fate of the DM 932 heavy fuel oil (No. 6 or Bunker “C” fuel) spill to the lower Mississippi River, Danchuk (2009) found that modelling of the potential OMA formation predicted that 0% to 36% of the oil could have been involved in this process. Salinity and availability of suspended sediments were both found to be limiting factors for OMA formation; suspended sediment would have had to reach 250 mg/L to not be a limiting factor. In a comparison with the known fate of oil from the DM 932 spill, OMA formation was estimated to remove only 2% to 5% of the spilled oil, suggesting that the models predicting OMA formation tended to over-estimate its role in the fate of spilled oil. However, including OMA formation in the spill evaluation also helped to explain the relatively low level of observed shoreline oiling. It was concluded that OMAs that formed would remain buoyant in the water column, reducing the potential for oil to beach and allowing some of the spilled oil to become dispersed into the Gulf of Mexico, beyond the Delta. These findings have considerable relevance to the likely fate of diluted bitumen, which is also a heavy oil, hypothetically spilled in the lower Fraser River.

Trans Mountain Pipeline ULC Volume 7, Pipeline Facilities Technical Reports Trans Mountain Expansion Project Qualitative Ecological Risk Assessment of
Pipeline Spills Technical Report
December, 2013 REP-NEB-TERA-00019
Page 6-30
6.2.2. Selected Case Studies
Previous studies of oil spills in similar environments provide a basis for evaluating the fate, transport and effects of hypothetical pipeline spills of diluted bitumen resulting from the Project. A literature review was conducted to identify and acquire information on simulated and actual oil spills in the freshwater environment. From the scientific literature in peer reviewed journals, government reports and technical documents, case studies of oil releases were selected using the following set of criteria:
Occurred in a freshwater environment Located in a cold temperate zone or subarctic location Spilled oil had similar physical and chemical properties as the diluted bitumen assessed in the ERA.
For each case study, an effort was made to collect the following information:
How much oil was spilled? What type of oil was spilled? How was the oil transported in the environment, and which factors contributed to spreading of the oil? What were the short-term and long-term environmental effects of the spilled oil? To what extent did the system recover from the oil spill, and what factors were important in achieving
that recovery?
Table 6.11 summarizes the case studies evaluated in the ERA. While it was not possible to match all three of the desired criteria for each case study, each case study was considered to have relevance to the Project. A brief description of each case study, along with the fate and transport and environmental effects of the each spill, follows.
TABLE 6.11 CASE STUDIES SELECTED IN THE ASSESSMENT OF OIL SPILLS IN THE FRESHWATER ENVIRONMENT
Oil Spill Location Year Release Platform Oil Type Volume
(m3)
Kalamazoo River Michigan, USA 2010 Pipeline Full-bore
Rupture Diluted Bitumen 3,200
Wabamun Lake Alberta, Canada 2005 Rail Accident Bunker “C” 712
East Walker River California/Nevada,
USA 2000 Truck Accident Bunker “C” 14
Pine River British Columbia,
Canada 2000
Pipeline Full-bore Rupture
Light Crude 985
Yellowstone River Montana, USA 2011 Pipeline Full-bore
Rupture Light Crude 240
OSSA II Bolivia, South
America 2000
Pipeline Full-bore Rupture
Mixed Crude 4,611
DM 932 Louisiana, USA 2008 Barge Accident Bunker “C” 1,070
Northern Gateway Project Alberta/British
Columbia, Canada N/A
(Oil Spill Simulations) Pipeline Full-bore
Ruptures
Diluted Bitumen, Synthetic Oil, Condensate
Various
Vancouver Airport Fuel Delivery Project
British Columbia, Canada
N/A (Oil Spill Simulations and Background Data
Collection) Various Jet “A” Various
6.2.2.1. Kalamazoo River Oil Spill
On July 25, 2010, Enbridge‟s Line 6 pipeline ruptured in a wetland near Marshall, Michigan. Approximately 3,200 m3 (843,444 US gallons) of heavy crude oil containing diluted bitumen was released over a period of about 17 hours. The pipeline contained two different batches of crude oil at the time of the spill, and it is estimated that the spilled oil comprised approximately 77% Cold Lake Winter Blend diluted bitumen and 23% Western Canadian Select crude oil (National Transportation Safety Board

Trans Mountain Pipeline ULC Volume 7, Pipeline Facilities Technical Reports Trans Mountain Expansion Project Qualitative Ecological Risk Assessment of
Pipeline Spills Technical Report
December, 2013 REP-NEB-TERA-00019
Page 6-31
[NTSB] 2012). Of this, approximately 1,300 m3 (337,386 US gallons) reached Talmadge Creek and the Kalamazoo River (Enbridge 2013a).
The rupture, a longitudinal tear adjacent to a seam weld approximately 2 m long and up to 13.5 cm wide, occurred during the last stages of a planned shut-down (NTSB 2012). It was not immediately recognized as being a pipeline failure due to the transient conditions associated with the shutdown procedure, and an incorrect interpretation of data that led to the assumption that column separation had occurred. Upon discovery, response activities immediately commenced to remove free oil and prevent its transport downstream. However, recent heavy rainfall in the region (10 to 14.5 cm over the preceding three days) had increased flows and water levels, hindering response efforts (Enbridge 2011, NTSB 2012). As a consequence, approximately 3.2 km of Talmadge Creek and 60 km of the Kalamazoo River (as far as the Morrow Lake delta) were affected by the spill (NTSB 2012).
As part of the response to the spill, Enbridge prepared a Conceptual Site Model (CSM, Enbridge 2011, 2013b) that was reviewed and approved by the Michigan Department of Environmental Quality. The CSM provides the best available description of the conditions at the time of the spill, and the behaviour and fate of the spilled crude oil in the environment. Much of the information presented below originates from the CSM.
At the spill site, crude oil was released below grade level. The crude oil was forced from the pipeline under pressure into the surrounding soils and emerged to the ground surface. The released oil flowed overland through forested scrub-shrub wetland, following local topography, to Talmadge Creek (Enbridge 2013b). Despite the proximity of the oil spill location to Talmadge Creek, only about 40% of the spilled oil entered the aquatic environment, the remainder being recovered at the spill site, or in the wetland between the spill site and Talmadge Creek.
Talmadge Creek was flowing with higher than normal flow due to recent heavy rains. The crude oil flowed down Talmadge Creek to the confluence with the Kalamazoo River, and then into the Kalamazoo River. Due to the elevated water level, the crude oil affected floodplain areas on both sides of Talmadge Creek. The river was also high at the time of the spill and had overflowed its banks in many areas. As a result, oil entered the floodplain areas. As water levels in the river receded, much of the crude oil flowed with the flooding water back within the banks of the Kalamazoo River, although crude oil also became stranded in hydrologically isolated areas such as depressions, cavities, burrows, and other traps within the riparian zone (Enbridge 2013b). The average gradient of the Kalamazoo River ranges from 0.025% to 0.075%.
Upon entering the water, the density of the crude oil was slightly less than that of water, and therefore it floated, forming an oil slick that flowed downstream. In low sinuosity segments of the river, crude oil floated on top of the river and moved in slicks parallel to the main river channel. Floating crude oil tended to be carried through the low sinuosity segments (not stranded), and oiling of the floodplain areas was mostly along the edges of the straight sections of the river, or in backwater areas where eddy currents could direct flow. In high sinuosity segments of the river (i.e., areas with more extensive floodplain), where flow had left the main channel, crude oil moved into the floodplain and was slowed and retained by vegetation. Slower flow encouraged collection of slicks in backwaters and eddies. Crude oil was subsequently trapped and stranded in low areas of the floodplain (Enbridge 2011).
High river flows entrained some of the oil into the water column (resulting in submerged oil) and transported it downstream. Dam spillways may have resulted in the formation of emulsions (mousse) that were also driven into the water column, or entrained further oil into the water column. Over time, weathering of the lighter components and interaction of the submerged oil with suspended sediments resulting in its sinking in the water column, and the sedimentation of some crude oil on the river bottom in quiescent or net-depositional areas of the riverbed once flows decreased (Enbridge 2011, 2013b).
As the crude oil interacted with water and air in the environment, the composition of the crude oil changed in predictable ways (Enbridge 2013b). Many compounds originating with the diluent are more volatile and more water soluble than compounds originating with the bitumen. Weathering therefore results in a selective reduction of contaminant mass and concentration in the bulk oil. Like any heavy crude oil, the

Trans Mountain Pipeline ULC Volume 7, Pipeline Facilities Technical Reports Trans Mountain Expansion Project Qualitative Ecological Risk Assessment of
Pipeline Spills Technical Report
December, 2013 REP-NEB-TERA-00019
Page 6-32
diluted bitumen in highly weathered form can resemble asphalt or thick tar, and can attain a density that approaches or slightly exceeds that of water. The inclusion of mineral particles in the weathered oil further adds to the aggregate density, and promotes settlement and sinking of oil (Enbridge 2013b). Although the sediment within the bed of Talmadge Creek contained residual oil, extensive remediation efforts in 2011 removed most if not all of this oil (Enbridge 2013b). In the Kalamazoo River, as the unrecovered oil was transported downstream in the water column, a portion of it incorporated suspended sediments causing it to become entrained in the water column. Oil-sediment aggregates are subject to periodic burial and subsequent exposure, in response to hydrological conditions in the river. Oil was entrained with sediments and debris, incorporated into river bedload, and transported toward geomorphological traps in the riverbed. Such traps are commonly found as silt deposits associated with local features (backwaters and behind islands), or as deltaic deposits at the upstream end of headponds associated with dams on the river (Enbridge 2013b). As of June 2013, the USEPA (2013) estimated that approximately 680,000 litres (180,000 gallons) of submerged oil remained in the river bottom sediment and ordered the removal of the recoverable portion (approximately 45,000 to 68,000 litres or 12,000 to 18,000 gallons), principally in relation to the headponds of the Ceresco and Morrow dams. Removal of the remainder would result in substantial damage to the river; therefore, it was to be left in place and monitored (USEPA 2013). These volumes, however, are subject to great uncertainty, and may substantially overestimate the quantity of oil residual in sediments. Biological surveys carried out as early as the fall of 2010 and summer of 2011 rarely encountered oil deposits in the riverbed that would release sheen, and where such deposits were found, they were associated with silt deposits and not with gravel or cobble bottom areas (Enbridge 2011, Badra 2011, Walterhouse 2012).
The long-term environmental effects of the crude oil are still being assessed through water, soil and sediment sampling, biological diversity assessment, submerged oil assessment, erosion tours, and situational awareness (USEPA 2012). However, preliminary results show that since mid-2011, there have been no exceedences of organics in surface water (USEPA 2012). Metals (i.e., nickel, vanadium, molybdenum, iron) were an ongoing concern as of the end of 2012; additional studies were being conducted to determine if elevated metal concentrations were the result of the oil spill or local background conditions (USEPA 2012).
As part of the Natural Resource Damage Assessment authorized under the Oil Pollution Act, the Kalamazoo River Oil Spill trustees have collected/are collecting data to assess environmental effects on behalf of the public. Data include the following (Winter et al. 2012):
Extent of oiling Vegetation Erosion Fish Aquatic macroinvertebrates Mussels Chemistry (source oil, water, sediment, biota) Wildlife.
An important point with respect to the Enbridge Line 6B incident near Marshall, Michigan, is that no fish kills were observed in the spill area (Winter et al. 2012). Available results to date show that although the Talmadge Creek fish community was reduced and its habitat greatly diminished in 2010 due to oil spill recovery efforts (Wesley 2011), it experienced some recovery in 2011 (Winter et al. 2012). In the Kalamazoo River, some declines in fish community diversity and abundance were observed at some, but not all sites in 2010 (Wesley 2011, Winter et al. 2012).
The diversity and abundance of aquatic macroinvertebrates in Talmadge Creek and the Kalamazoo River were reduced in 2010 (Walterhouse 2011 in Walterhouse 2012). By 2011, diversity and abundance had improved, although abundance was still affected (Walterhouse 2012). In addition, clean-up activities in Talmadge Creek, which resulted in decreased vegetative cover, exposed more of the stream channel to sunlight and altered community composition (Walterhouse 2012).
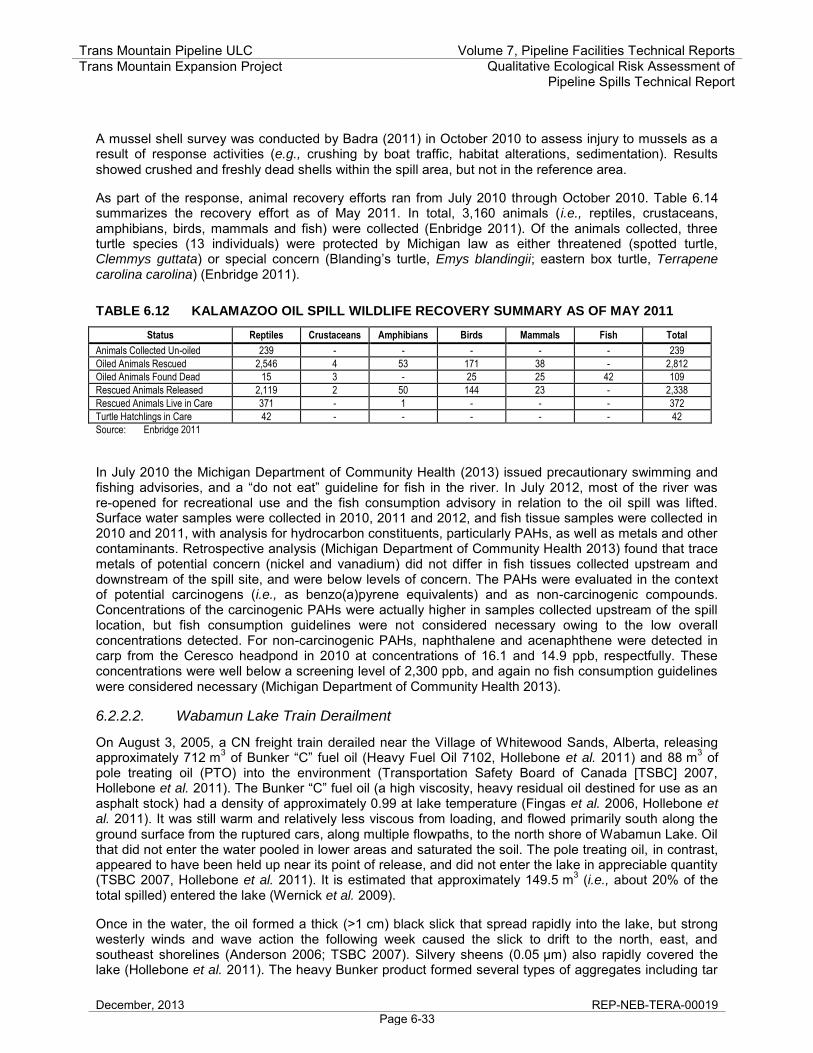
Trans Mountain Pipeline ULC Volume 7, Pipeline Facilities Technical Reports Trans Mountain Expansion Project Qualitative Ecological Risk Assessment of
Pipeline Spills Technical Report
December, 2013 REP-NEB-TERA-00019
Page 6-33
A mussel shell survey was conducted by Badra (2011) in October 2010 to assess injury to mussels as a result of response activities (e.g., crushing by boat traffic, habitat alterations, sedimentation). Results showed crushed and freshly dead shells within the spill area, but not in the reference area.
As part of the response, animal recovery efforts ran from July 2010 through October 2010. Table 6.14 summarizes the recovery effort as of May 2011. In total, 3,160 animals (i.e., reptiles, crustaceans, amphibians, birds, mammals and fish) were collected (Enbridge 2011). Of the animals collected, three turtle species (13 individuals) were protected by Michigan law as either threatened (spotted turtle, Clemmys guttata) or special concern (Blanding‟s turtle, Emys blandingii; eastern box turtle, Terrapene carolina carolina) (Enbridge 2011).
TABLE 6.12 KALAMAZOO OIL SPILL WILDLIFE RECOVERY SUMMARY AS OF MAY 2011
Status Reptiles Crustaceans Amphibians Birds Mammals Fish Total
Animals Collected Un-oiled 239 - - - - - 239
Oiled Animals Rescued 2,546 4 53 171 38 - 2,812
Oiled Animals Found Dead 15 3 - 25 25 42 109
Rescued Animals Released 2,119 2 50 144 23 - 2,338
Rescued Animals Live in Care 371 - 1 - - - 372
Turtle Hatchlings in Care 42 - - - - - 42
Source: Enbridge 2011
In July 2010 the Michigan Department of Community Health (2013) issued precautionary swimming and fishing advisories, and a “do not eat” guideline for fish in the river. In July 2012, most of the river was re-opened for recreational use and the fish consumption advisory in relation to the oil spill was lifted. Surface water samples were collected in 2010, 2011 and 2012, and fish tissue samples were collected in 2010 and 2011, with analysis for hydrocarbon constituents, particularly PAHs, as well as metals and other contaminants. Retrospective analysis (Michigan Department of Community Health 2013) found that trace metals of potential concern (nickel and vanadium) did not differ in fish tissues collected upstream and downstream of the spill site, and were below levels of concern. The PAHs were evaluated in the context of potential carcinogens (i.e., as benzo(a)pyrene equivalents) and as non-carcinogenic compounds. Concentrations of the carcinogenic PAHs were actually higher in samples collected upstream of the spill location, but fish consumption guidelines were not considered necessary owing to the low overall concentrations detected. For non-carcinogenic PAHs, naphthalene and acenaphthene were detected in carp from the Ceresco headpond in 2010 at concentrations of 16.1 and 14.9 ppb, respectfully. These concentrations were well below a screening level of 2,300 ppb, and again no fish consumption guidelines were considered necessary (Michigan Department of Community Health 2013).
6.2.2.2. Wabamun Lake Train Derailment
On August 3, 2005, a CN freight train derailed near the Village of Whitewood Sands, Alberta, releasing approximately 712 m3 of Bunker “C” fuel oil (Heavy Fuel Oil 7102, Hollebone et al. 2011) and 88 m3 of pole treating oil (PTO) into the environment (Transportation Safety Board of Canada [TSBC] 2007, Hollebone et al. 2011). The Bunker “C” fuel oil (a high viscosity, heavy residual oil destined for use as an asphalt stock) had a density of approximately 0.99 at lake temperature (Fingas et al. 2006, Hollebone et al. 2011). It was still warm and relatively less viscous from loading, and flowed primarily south along the ground surface from the ruptured cars, along multiple flowpaths, to the north shore of Wabamun Lake. Oil that did not enter the water pooled in lower areas and saturated the soil. The pole treating oil, in contrast, appeared to have been held up near its point of release, and did not enter the lake in appreciable quantity (TSBC 2007, Hollebone et al. 2011). It is estimated that approximately 149.5 m3 (i.e., about 20% of the total spilled) entered the lake (Wernick et al. 2009).
Once in the water, the oil formed a thick (>1 cm) black slick that spread rapidly into the lake, but strong westerly winds and wave action the following week caused the slick to drift to the north, east, and southeast shorelines (Anderson 2006; TSBC 2007). Silvery sheens (0.05 µm) also rapidly covered the lake (Hollebone et al. 2011). The heavy Bunker product formed several types of aggregates including tar

Trans Mountain Pipeline ULC Volume 7, Pipeline Facilities Technical Reports Trans Mountain Expansion Project Qualitative Ecological Risk Assessment of
Pipeline Spills Technical Report
December, 2013 REP-NEB-TERA-00019
Page 6-34
balls, larger tar “logs”, submerged sheets, large lumps, tar balls that sometimes reformed into oil slicks, and a “slurry” composed of finely divided organic matter and small oil droplets (Fingas et al. 2006, Hollebone et al. 2011).These aggregates also exhibited a multitude of behaviours including submergence, neutral buoyancy, and resurfacing (Fingas et al. 2006). Laboratory analyses concluded that the variety of aggregates were formed as a result of uptake of a variety of extraneous materials contacted while flowing over land and in the water including sand, coal, grass, insects, and sediment (Fingas et al. 2006). In addition, it is thought that density changes that resulted in the resurfacing of oil were likely attributable to the loss of sediment or loss of heavily sedimented portions of the oil aggregates (Fingas et al. 2006).
No dispersions of oil in water were observed in the lake, and no mousse formation was reported in the three years following the spill (Hollebone et al. 2011). Rather, the oil formed tar balls and other aggregates, with density-dependent behaviour. Most of the tar balls remained in relatively shallow water, and particularly became associated with reed beds that represented almost 50% of the shoreline habitat (Sergy pers. comm. in Foght 2006).
Chemically, the Heavy Fuel Oil 7102 was primarily composed of saturated hydrocarbons. It also contained a high content of aromatic hydrocarbons (48%) and had high PAH content (6.04%). The PAHs were predominantly alkylated naphthalenes, with smaller amounts of alkylated phenanthrene and fluorene homologs. The oil contained relatively little 4-ring or 5-ring PAHs, and no benzene, toluene, ethylbenzene or xylenes (BTEX) were detected (Hollebone et al. 2011). As a result, the spilled oil did not exhibit rapid initial weathering due to evaporation of volatiles, and rapid dissolution of the relatively water soluble BTEX compounds into the surface water was not an issue. In the longer term, the HFO 7102 was observed to undergo weathering and biodegradation, but at a relatively slow rate due to the largely recalcitrant nature of the oil. The presentation of the oil in tar balls (with limited surface area and relatively high internal volume) is also likely to retard biodegradation. Tar balls having a relatively weathered outer “skin” and relatively fresh product inside have often been observed.
Notwithstanding the initial distribution of oil on the water surface and tar balls in near-shore areas, monitoring of water quality in the lake found few indications of hydrocarbon contamination. Overall, the water in the open water area of the lake was reported not to be contaminated with spilled hydrocarbons or associated metals (Anderson 2006). This is consistent with the absence of BTEX components from the spilled oil, and the relatively low solubility in water of PAHs. Similarly, sediments beneath the open water portions of Wabamun Lake were reported not to have been contaminated with petroleum hydrocarbons, and to be similar in quality to concentrations measured shortly before the spill, or in 2002 (Anderson 2006). Conversely, the Wabamun Watershed Management Council published a report stating that “some PAH readings in Wabamun Lake exceeded human health toxicity guidelines just after the CN oil spill but have since reduced below guidelines” (Aldridge undated). It is not clear where these PAH readings were taken, but it is reasonable to assume that samples taken in near-shore areas could have presented in this manner. Much of the oil became entrained in the abundant reed beds (Schoenoplectus tabernaemontani) in the eastern basin of the lake. As such, clean-up activities included cutting of the vegetation and vacuum removal of submerged tar balls entrained in the reed bed detritus (Wernick et al. 2009). A two year study was conducted to assess regrowth. The study found that exposure to the oil, which was spilled in the late growing season, did not cause large-scale changes to these emergent plant communities (Wernick et al. 2009). Physical factors such as clean-up activities and vegetation management appeared to be responsible for reduced regrowth observed at some locations. Overall, however, post-spill measures of productivity (vegetated transect length, total cover, and biomass) were within the variability of pre-spill data collected in 2001.
Although some dead fish were observed along the shoreline after the spill, these numbers were within the natural range expected and Alberta Sustainable Resource Development determined that the oil spill had no short-term effect on fish (TSBC 2007). Three months after the spill (November 2005), DeBruyn et al. (2007) assessed deformities in lake whitefish larvae (Coregonus clupeaformis) incubated in situ in shallow water habitat in areas of the lake that were considered to be either oil-exposed, or not exposed and suitable as reference locations. The lake had been subjected to PAH contamination from various sources prior to the oil spill (e.g., coal mines, coal-fired power plants, marinas, recreational boat use) for

Trans Mountain Pipeline ULC Volume 7, Pipeline Facilities Technical Reports Trans Mountain Expansion Project Qualitative Ecological Risk Assessment of
Pipeline Spills Technical Report
December, 2013 REP-NEB-TERA-00019
Page 6-35
many years. Other workers (Schindler et al. 2004) had reported that lake whitefish had not reproduced successfully in the lake for several years prior to the derailment. DeBruyn et al. (2007) found complete mortality of lake whitefish eggs at one exposure site and one reference site in the lake. High egg mortality (60% to 70%) was also observed at the remaining one exposure and one reference site. While overall rates of deformity were similar at these two sites, the deformities exhibited at the oil-exposed site were judged to be more severe than those at the reference site.
Wabamun Lake is one of nine lakes in Alberta that was found to support western grebe colonies in 2006 (Kemper et al. 2008). The Alberta population is estimated at between 10,000 and 11,000 birds, representing approximately 10% of the North American population. With between 100 and 500 nests, the Wabamun Lake colony is considered to be regionally important (Kemper et al. 2008). From 2001 to 2005, western grebes at Wabamun Lake nested in one main colony (Rich‟s Point), and the lowest reported number of nests was 243 in 2005. Following completion of nesting that year, the oil spill occurred, killing an estimated 333 western grebes (about 69% of the adult population). A wildlife recovery centre set up immediately after the spill recovered more than 530 oiled birds within five days after the spill; 156 were either dead or euthanized (TSBC 2007). The following summer, the release of submerged oil resulted in the oiling of additional waterfowl (TSBC 2007). In 2006, western grebes returned to nest at Rich‟s Point, and in addition formed a second colony at the Ascot Beach reed bed. Together, the two sites contained 456 nests in 2006 (Kemper et al. 2008).
6.2.2.3. East Walker River Oil Spill
On December 30, 2000, a tanker truck overturned on California State Route 182, resulting in the release of approximately 13.66 m3 (3,608 gallons) of heavy fuel oil. The oil was described as comprising an equal mixture of desulfurized gas oil and PS 1500 Topped Crude (Reiter et al. 2002). In several publications, the oil is also described as a Bunker “C” fuel oil (No. 6 fuel oil). The oil was dense, tarry, and had to be warm in order for it to flow. The majority of the oil entered the East Walker River and formed an oil slick that flowed along the surface, visibly oiling approximately 16 km of river habitat (East Walker River Trustee Council [EWRTC] 2009).
The East Walker River is a steep gradient (1.26%), medium-sized stream located several kilometres below the Bridgeport Reservoir. Flows in the river are subject to regulation at the reservoir outlet. During the winter, the reservoir operates in storage mode, and therefore flows in the river are relatively low (a minimum flow of 20 cubic feet per second). During the spill response activity, a variance was obtained to allow flows of 10 to 15 cubic feet per second, although this resulted in the formation of anchor ice in the stream bed during cold periods, and may have caused secondary damage to fish, fish eggs, and benthic invertebrates. Fish species present below the reservoir include rainbow trout, mountain whitefish, Lahontan redside, Lahontan speckled dace, Tahoe and mountain sucker, tui chub, common carp, Paiute sculpin and brown trout (EWRTC 2009).
Low ambient temperatures, as well as the recalcitrant nature of the spilled oil, resulted in a low rate of weathering, and the formation of tar balls that settled on the riverbed (Higgins 2002). Degradation of the tar balls was delayed until the stream warmed up the following spring (Higgins 2002). Although visible oiling was limited to approximately 16 km of river, approximately 24 km of the river was judged to be affected by the spill (EWRTC 2009).
During the initial response, one Virginia Rail (Rallus limicola), two American Dippers (Cinclus mexicanus), one American mink (Mustela vison), six beavers (Castor canadensis), and approximately 21 fish, predominantly mountain whitefish (Prosopium williamsoni), were found dead within the first 16 km of the spill site (EWRTC 2009). In addition, one Common Merganser (Mergus merganser), one Great Blue Heron (Ardea herodias), one Bald Eagle (Haliaeetus leucocephalus) and an unspecified number of Canada geese (Branta canadensis) were observed alive but oiled (EWRTC 2009; Hampton et al. 2002). Owing to the low probability of finding dead wildlife, it was judged that nearly all of the birds and mammals that regularly came in contact with the water within the first 16 km of the spill zone were likely killed as a result of contacting the oil (EWRTC 2009).

Trans Mountain Pipeline ULC Volume 7, Pipeline Facilities Technical Reports Trans Mountain Expansion Project Qualitative Ecological Risk Assessment of
Pipeline Spills Technical Report
December, 2013 REP-NEB-TERA-00019
Page 6-36
Following the spill, river water sampling in January (one sample recording 4.9 µg TPAH/L and another recording 1.4 µg TPAH/L) revealed TPAH concentrations that were greater than the lethal toxicity thresholds for developmental effects on fish embryos. The remaining sample locations and dates showed concentrations lower than 1 µg/L. By May, 2001, the highest reported concentration in water was 0.035 µg TPAH/L (Higgins 2002).
For sediment, measured TPAH concentrations were greater than toxicity thresholds within three months after the spill, but were below levels of concern within five months. Hydrocarbon concentrations measured in sediment spiked upwards in March, 2001, possibly as a result of the residual oil in sediment becoming more fluid with increasing ambient temperatures (Higgins 2002). The highest reported sediment TPAH concentrations occurred in March, 2001, with values of 1.3 to 4.6 mg TPAH/kg sediment reported. By May, 2001, the highest reported concentration was 1.7 mg TPAH/kg, and most results were less than 0.1 mg TPAH/kg sediment.
Fish surveys conducted in 2001 by the California Department of Fish and Game and the Nevada Division of Wildlife showed a reduction of juvenile age classes and recruitment of rainbow trout (Hampton et al. 2002). However, as previously mentioned, the spill response required lower than normal water flows for safety and to slow downstream transport of the oil. The lower flows, in combination with exceptionally cold temperatures, resulted in the formation of anchor ice and a higher than normal winter fish kill (Hampton et al. 2002). Effects on the fish community, therefore, may have reflected either or both of the stresses imposed by oiling and lower than normal water levels with concomitant formation of anchor ice in the stream bed.
PAH concentrations were measured in fish tissues; concentrations were highest in suckers, which are bottom-feeding fish highly exposed to sediments (Higgins 2002). One sample reported a TPAH concentration in sucker (whole body) of 2.6 mg/kg, but all other samples reported values of less than 1 mg/kg. It was concluded that bioaccumulation factors (comparing concentrations in fish tissue to those in sediment) were indicative of low rates of uptake and retention of PAHs by fish in the East Walker river, in part due to the ability of fish to rapidly metabolize and excrete PAHs.
Benthic macroinvertebrates were surveyed by the California Department of Fish and Game to quantify the effects of the spill to aquatic biota. Results were interpreted as showing a 79% and 65% loss in abundance in January and March 2001, respectively, indicating that benthic invertebrates were affected by the spill (Hampton et al. 2002). However, the qualitative sampling methodology makes interpretation speculative at best, and decisions taken during data management (such as the exclusion of visibly “oiled” benthic invertebrates from the analysis on the assumption that they must have been dead at the time of collection) are questionable, considering that oiling of these organisms could have occurred as a consequence of the sampling event. Considering the cumulative number of taxa recovered, the cumulative number of Ephemeroptera, Trichoptera and Plecoptera (EPT taxa), the sensitive EPT index, and the Shannon Diversity, which show no compelling differences between upstream and downstream locations, it is difficult to interpret the results as showing impairment in the areas downstream of the spill. The benthic community would also have been subject to the same confounding influence of low stream flow and anchor ice formation as the fish community.
The East Walker River Trustee Council (2009) quantified the effects of the spill with respect to degree, duration and geographic area. The affected area was deemed to be limited to 24 km of stream, and the initial degree of injury was deemed to be 75% of resource services. The benthic community was considered to have recovered within one to two years of the accident. The Trustees estimated that full recovery of all resources from the spill would occur after five years.
6.2.2.4. Pine River Oil Spill
On August 1, 2000, a pipeline ruptured releasing approximately 985 m3 of light crude oil, of which an estimated 450 m3 entered into the Pine River approximately 110 km upstream of Chetwynd, British Columbia (BC MOE 2013b, Bustard and Miles 2011). The river was flowing at a low stage at the time of the spill (approximately 161 m3/s measured at a station 160 km downstream, as compared to flow rates

Trans Mountain Pipeline ULC Volume 7, Pipeline Facilities Technical Reports Trans Mountain Expansion Project Qualitative Ecological Risk Assessment of
Pipeline Spills Technical Report
December, 2013 REP-NEB-TERA-00019
Page 6-37
above 900 m3/s during late spring and early summer). The Pine River has a gradient of approximately 0.225% in the first 40 km downstream from the spill location, becoming moderate (0.1%) farther downstream.
Clean-up efforts over 2 months recovered most of the oil; however, despite the effective recovery action, approximately 80 m3 of the oil, with an uncertainty range of 48-113 m3 remained unaccounted for (BC MOE 2013b, Goldberg 2011). Most of this unaccounted oil was considered likely to be located in river sediments, or trapped in woody debris dams within the river. Clean-up activities included the use of berms and removal of woody debris jams (BC MOE 2000a; Goldberg 2011). Oil that had “beaded” (become entrained) in the cold water escaped the first containment system placed 22 km downstream of the spill location, resulting in another berm being set up a further 30 km downstream (BC MOE 2000a).
An angling closure was implemented on the Pine River following the spill (BC MOE 2000b). Residents of the Pine River were advised by the District of Chetwynd not to use water directly from the river (BC MOE 2000a). Monitoring was implemented on the river, and it subsequently became necessary to temporarily close the water intake at the town of Chetwynd.
Acute effects included direct mortality to fish. Approximately 1,600 including but not limited to mountain whitefish, Arctic grayling, bull trout and rainbow trout, were collected along a 30 km stretch of the river (Bustard and Miles 2011, Goldberg 2011). The estimated numbers of dead fish varied widely, with values of 15,000 to 20,100 over a 30 km river reach (Alpine Environmental and EBA Engineering 2001 in Goldberg 2011) to 25,000 to 250,000 over a 50 km river reach (Bacante 2000 in Goldberg 2011). The killed fish represented approximately 50% to 70% of the fish in the first 30 km downstream from the spill site (Alpine Environmental and EBA Engineering 2001 in Bustard and Miles 2011).
The acute effects of spilled oil on fish in the river lasted only a short time, with water quality in the Pine River returning to pre-spill conditions less than three weeks after the spill (de Pennart et al. 2004). Fish were reported to be returning to the main stem of the river from smaller streams away from the main channel within two weeks of the spill (BC MOE 2000b). The Pine River downstream of the spill site functions primarily as rearing habitat for fish, with most spawning and juvenile habitat occurring in tributary streams (Bustard and Miles 2011).
Snorkel surveys were consulted to evaluate the effects of the spill and recovery of the fish community in the river, based on surveys taken both before and after the spill, within an approximately 50 km reach of river most likely to have been affected (Goldberg 2011). Fish were less abundant in 2000 than they had been in 1993 (164 vs. 259 observed fish/km). However, surveys completed in 2005, 2006 and 2007 showed recovery to levels equal to or greater than in 1993 (Goldberg 2011).
Owing to the deposition of hydrocarbons in the river sediments, effects on benthic invertebrates were investigated as a means of evaluating biological effects (de Pennart et al. 2004). Semi-permeable membrane devices were used to monitor very low concentrations of PAHs in the river water in 2000 and 2001. Values reported upstream of the spill site were approximately 0.01 µg/L as total alklylated PAH, of which a considerable portion was methylnaphthalene. Concentrations measured in water downstream of the spill location in 2000 were all less than 1 µg TPAH/L, averaging around 0.1 µg TPAH/L. Concentrations measured during 2001 were approximately one order of magnitude lower than concentrations measured in 2000 (de Pennart et al. 2004). The commonly accepted benchmark for effects of TPAH on sensitive life stages of fish is 1 µg TPAH/L. Hydrocarbon concentrations in sediments up to 26 km downstream of the spill steadily decreased between one and two years after the spill (de Pennart et al. 2004). Beyond this point, contamination not related to the spill appeared to be entering the river from side streams. The collection of benthic invertebrate samples in the Pine River in 2000 showed a depletion of all guilds downstream of the spill site. In 2001, benthic populations had partially recovered in the most affected areas. No relationship was observed between sediment hydrocarbon concentrations and benthic community structure in a subsequent survey during 2003, indicating a recovery of the system (de Pennart et al. 2004).

Trans Mountain Pipeline ULC Volume 7, Pipeline Facilities Technical Reports Trans Mountain Expansion Project Qualitative Ecological Risk Assessment of
Pipeline Spills Technical Report
December, 2013 REP-NEB-TERA-00019
Page 6-38
A golden eagle and a hooded merganser were found oiled after the spill; the eagle was successfully released but the hooded merganser died in the wildlife rehabilitation centre (BC MOE 2000b). No other birds or mammals were found by staff of the BC Ministry of Environment, Lands and Parks despite daily walkover of the river. There were, however, other reports that some beaver, otter and mink were affected (BC MOE 2000b).
Removal of oiled woody debris and log jams as part of the oil spill recovery effort was reported to result in substantial long-term effects on the Pine River and associated riparian and instream habitat (Bustard and Miles 2011). Replacement structures were constructed, but the river shifted course and bank erosion resulted in a straighter, wider and less complex river channel (Bustard and Miles 2011).
6.2.2.5. Yellowstone River Oil Spill
On July 1, 2011, flood conditions in the Yellowstone River resulted in the rupture of the ExxonMobil Silvertip Pipeline carrying medium sour crude oil near Laurel, Montana. Riverbed erosion had exposed the 12 inch pipeline beneath the crossing, and debris caught on the washed-out pipeline caused excessive stress, resulting in a clean break. The failure was detected at the pipeline control centre, and the line was shut down within 10 minutes (United States Department of Transportation [USDOT] 2012). Approximately 240 m3 of crude oil (1,509 barrels) was released into the Yellowstone River (USDOT 2012). The affected reach of the Yellowstone River has an average gradient of 0.17%.
High flood flows carried the oil downstream and prevented it from settling on the river bottom. As water levels receded, oil settled in shallow areas and on flooded riverbanks. A pocket of emulsified oil was found approximately 130 km downstream (USEPA 2011b) but the majority of the oil spill effects were observed within 32 km of the spill location (USEPA 2011c).
The crude oil chemistry was measured on both fresh and weathered samples. The fresh oil was described as a medium weight sour crude (containing 2.94% sulphur, most likely as hydrogen sulphide). Volatile organic compounds such as benzene (142 mg/kg), toluene (1,060 mg/kg) and total xylenes (2,530 mg/kg) were present at levels expected in raw crude. Diesel range hydrocarbons were found at 369,000 mg/kg, and oil range hydrocarbons were found at 136,000 mg/kg. Total extractable hydrocarbon was 461,000 mg/kg. Metals analysis found only very low concentrations of iron, nickel and vanadium that were considered unlikely to pose any threat to human health or the environment (USEPA 2011a). Samples of slightly weathered oil collected four days after the release no longer contained detectable benzene, toluene or total xylenes, and all of the lighter aliphatic and semi-volatile constituents were reported to have been weathered (USEPA 2011a).
Surface water samples collected in the days after the spill showed that there were no petroleum-related compounds in the water, which was expected given the high flow conditions in the river (USEPA 2011d), and the rapid initial weathering of the oil. As of November 9, 2011, surface water samples from 164 locations and sediment samples from 146 locations were collected by the USEPA, Montana Department of Environmental Quality and ExxonMobil. With few exceptions, all samples were “non-detect” or below applicable (likely human health) standards or screening levels for petroleum hydrocarbons (Montana Department of Environmental Quality [MDEQ] 2013).
Operators of downstream public drinking water systems which drew water from the river were notified of the spill. Monitoring and testing of the water supply systems did not identify any exceedances of drinking water standards (USEPA 2011d). Similarly, while a precautionary fish consumption advisory was issued after the spill (Montana Fish, Wildlife and Parks 2011a), testing of fish tissue samples from the river did not identify any detection of petroleum hydrocarbon constituents in fish fillet, and only traces of hydrocarbons in organs of fish (Montana Fish, Wildlife and Parks 2011b).
The Montana Department of Environmental Quality described the oiling along the river as “varied and inconsistent”. Crude oil effects were heaviest (as shoreline oiling or overbank oiling) immediately downstream of the spill site (MDEQ 2012). According to the USEPA (2011b), oiled wildlife observed or captured included 4 toads, 2 garter snakes, 2 yellow warblers, 1 Cooper‟s hawk, 6 Canada geese,

Trans Mountain Pipeline ULC Volume 7, Pipeline Facilities Technical Reports Trans Mountain Expansion Project Qualitative Ecological Risk Assessment of
Pipeline Spills Technical Report
December, 2013 REP-NEB-TERA-00019
Page 6-39
3 mallards, 6 common mergansers, 1 pelican, 1 great blue heron, 1 American robin, 2 bald eagles, an unknown raptor and 1 white-tailed deer. There were no reports of dead fish.
Clean-up activities ended on November 8, 2011 and the site was transitioned from emergency clean-up into long-term monitoring, assessment and reclamation (MDEQ 2012).
6.2.2.6. OSSA II Oil Spill
On January 30, 2000, an estimated 4,611 m3 of mixed heavy crude oil and diluent (variously described as a kerosene range product, straight run condensate or straight run naphtha) was released from the OSSA II pipeline at the Rio Desaguadero river crossing in Bolivia (Lee et al. 2001, 2002, Owens and Henshaw 2002). Fresh oil collected from the pipeline had a relatively low density of approximately 0.8 g/mL, and a correspondingly low viscosity, due to the presence of the diluent (Lee et al. 2002). The spill occurred on the rising limb of a peak flood condition (with peak flows occurring on February 3, 2000, Owens and Henshaw 2002). Due to the very high river flow and water velocity conditions (on the order of 2.5 m/s or greater, Henshaw et al. 2001), oil was found up to 370 km downstream from the spill location. Altogether some 400 km of river bank, meander floodplain, irrigation ditch, and low-lying floodplains was oiled (Owens and Henshaw 2002). For the most part the surface oil was deposited in strips, generally 1 to 2 m wide and up to 2 to 3 cm thick. Many sections of river bank had a horizontal line of oil (a bathtub ring) indicating the water level at the time the oil was deposited or stranded (Owens and Henshaw 2002).
The Rio Desaguadero basin is described by Henshaw et al. (2001) as a high-altitude desert with elevations on the order of 3,750 m. Most of the annual rainfall occurs during the December to March summer period. The river originates at the regulated outlet of Lake Titicaca (elevation 3,815 m), and flows approximately 350 km to feed Lagos Uru-Uru and Poopó (elevation 3,685 m). The waters of the Rio Desaguadero are brackish, having a salinity of approximately 1.5‰ (Lee et al. 2002). Although the waters entering the river from Lake Titicaca have low suspended sediment concentration, there is a high suspended load input from the Rio Mauri tributary, a few kilometres upstream from the spill location. The actual suspended sediment load at the time of the oil spill appear to be unknown, but high water velocities, combined with a shallow riverbed created strong turbulence throughout the water column, and standing waves and boils were observed at the water surface.
High flows resulted in turbulent flow conditions, under which some of the oil would have been transported downstream on the surface, and some would have been entrained in the water column, likely as dispersed droplets (Lee et al. 2002). A budget of the fate of the oil indicated that the loss of oil due to evaporation, dissolution and other weathering and degradation processes was on the order of 60% of the total amount spilled (Douglas et al. 2002), leaving some 1,844 m3 of weathered oil. Of this, some 1,236 to 1,723 m3 could not be accounted for in a conventional mass balance. Residual concentrations of hydrocarbons in river sediments were generally not detectable (Henshaw et al. 2001). It was concluded, based on additional confirmatory research, that formation of OMAs likely dispersed a large amount of the spilled crude oil, and facilitated its dispersion and biodegradation (Lee et al. 2001, 2002).
Testing conducted after the spill using both water from the Rio Desaguadero and diluted seawater, and using suspended sediment derived from the river sediment, showed that OMA formed at all salinity levels tested, although in a salinity-dependent manner. Little OMA was formed below a salinity of approximately 0.3‰, however, OMA readily formed at higher salinity (Lee et al. 2001, 2002), with values of 20% to 70% of added oil participating in OMA formation in the laboratory tests. The residual oil also had a relatively high content of polar compounds, and this also may have promoted OMA formation (Henshaw et al. 2001). It was concluded that OMA formation occurred in the river immediately after the spill, and hypothesized that OMA formation was effecting in reducing the environmental effects of the spill by promoting widespread dispersion and dilution of the oil in the flood plains and enhancing the natural biodegradation rate of the oil (Lee et al. 2002).
The spilled oil appears to have had a total BTEX content of approximately 8,200 mg/kg oil, and a TPAH content of approximately 4,700 mg/kg oil (Douglas et al. 2002). The predominant PAHs were alkylated phenanthrenes, naphthalenes and chrysenes. The oil also appears to have weathered very rapidly after

Trans Mountain Pipeline ULC Volume 7, Pipeline Facilities Technical Reports Trans Mountain Expansion Project Qualitative Ecological Risk Assessment of
Pipeline Spills Technical Report
December, 2013 REP-NEB-TERA-00019
Page 6-40
release so that river bank samples showed a nearly complete loss of light diluent fractions (including BTEX and the C8 to C15 boiling range). River bank samples were also strongly depleted in PAHs, with virtually all of the naphthalenes lost, as well as a large part of the phenanthrenes. Altogether from 50% to 70% of the total oil, and from 54% to 91% of the TPAH was lost from residual oil samples collected after the spill (Douglas et al. 2002). Evaporative loss was identified as the primary mechanism influencing degradation of the spilled oil, with as much as 45% of the oil mass potentially having evaporated. Solubilization and photodegradation were also identified as important loss mechanisms, however, biodegradation was judged not to have been very important as a process reducing the mass of non-dispersed oil (Douglas et al. 2002), however, dispersion via the formation of OMA was acknowledged as a factor in the overall mass balance of the oil.
Despite the relatively high BTEX and TPAH content of the fresh oil, biological effects of the oil spill appear to have been modest. Water and sediment samples collected from the river soon after the spill showed no detectable concentrations of hydrocarbons (Henshaw et al. 2001), except where oil was clearly deposited along strand lines. Following an initial assessment, and despite repetitive ground and aerial surveys throughout the entire region, very few (on the order of tens) oiled birds were reported in the first days following the spill (Wasson et al. 2000 in Owens and Henshaw 2002), and no fish, birds, or other animals were found dead or oiled as a result of the spill by clean-up crews or other field personnel (Henshaw et al. 2001, Owens and Henshaw 2002). Testing of the weathered oil showed that it was highly depleted in many of the chemical constituents typically associated with toxicity. Therefore, although there was a large and labour intensive recovery and remedial operation mounted, the short-term conclusion was that ecological damage from the spill was minimal (Henshaw et al. 2001).
6.2.2.7. DM 932 Oil Spill
On July 23, 2008, a chemical tanker collided with the DM 932 fuel barge on the Mississippi River in New Orleans, Louisiana. The DM 932, which was carrying a load of 1,587 m3 of Bunker “C” (No. 6 fuel oil) was split in half by the impact. During subsequent salvage operations some of the oil on the barge was recovered, but it was estimated that approximately 1,070 m3 of oil was spilled to the river. Most was released at the time of the impact, but the barge also leaked oil continuously over the following two week period (United States Fish & Wildlife Service [USFWS] 2009, Danchuk 2009).
The river was closed to vessel traffic on the day of the spill, from mile marker 98, to the mouth of the shipping channel at Southwest Pass Sea Buoy, a distance of more than 160 km. For the protection of human health there was air monitoring early in the spill, and downstream drinking water intakes were closed. By July 30, all drinking water intakes were reopened (USFWS 2009).
The fuel oil had nearly the same density as water, and although spilled oil was seen floating throughout the response area, it later became clear that some of the oil also sank. A silver sheen covered 90% of the river, reaching 20 to 25 km downstream from the barge within the first six hours (Danchuk 2009). Oil was recovered during routine dredging operations near the Head of Passes (at the mouth of the Delta) on July 28. Observations made during the barge salvage operations (after August 3) indicated that the oil initially sank (presumably by mixing with suspended sediment), then re-surfaced downstream when it encountered turbulent flow. The result was patchy surface oiling throughout the spill area, with unknown amounts or effects of submerged oil (USFWS 2009).
The river fell during the response operations, stranding oil in pools between the river and levees (known as the batture area), on vegetation in the battures, river banks, and structures in the river. Oil recovery efforts focused on these areas, although one of the greatest operational challenges was recovery of oil trapped in riprap on shorelines (USFWS 2009). Approximately 220 km of the shoreline was oiled to varying degrees (Danchuk 2009).
The high viscosity of the oil caused it to persist in the environment, rather than evaporate. The overall mass balance for the oil suggested that 11% was lost to evaporation, 86% of the oil was recovered from water, as oiled sediment, or as oiled debris, and 2.5% of the oil remained unaccounted for in the

Trans Mountain Pipeline ULC Volume 7, Pipeline Facilities Technical Reports Trans Mountain Expansion Project Qualitative Ecological Risk Assessment of
Pipeline Spills Technical Report
December, 2013 REP-NEB-TERA-00019
Page 6-41
environment (Danchuk 2009). The oil interacted with suspended sediments forming OSA and small tar balls (Danchuk 2009).
Although the Mississippi River has high suspended sediment loads, and the oil was rich in resins and asphaltenes, formation of OMA may have been limited by a combination of the viscosity of the oil and the low level of turbulent energy in the river, as well as the low salinity in the surface water layer of the river. The Mississippi River at New Orleans can be characterized as a salt wedge estuary, with tidally influenced salt water moving in and out from the Gulf of Mexico at the bottom of the river, and fresher river water riding over the salt wedge to discharge at the mouth of the river. The salt wedge characteristic also has the potential to minimize contact between sinking oil and bed sediment, as sinking Bunker “C” oil, being less dense than the water of the salt wedge, would be expected to gather at the density interface between fresh and salt water. Danchuk (2009) concluded that OMA formation and subsequent oil dispersion could account for between 2% and 5% of the oil spilled from the DM 932 barge.
Recovery teams provided information on the distribution of stranded oil. Almost half of the affected shoreline habitat was described as scrub-shrub, and of this a large fraction was heavily oiled. The vegetation provided abundant opportunity for oil droplets and globules to become absorbed. Riprap also provided opportunities for trapping of oil due to the crevices between rocks. Mud and sand shorelines did not trap much oil, and oil did not penetrate into these substrates due to their water saturation (Danchuk 2009). On the surface of the river, lateral velocity vectors tended to move oil to the outside of bends where the velocities slow, and oil was retained on such shorelines. In addition, wind conditions from the south and southwest forced oil towards south-facing shorelines (Danchuk 2009).
Danchuk (2009) undertook detailed modelling of a range of crude oils in the lower Mississippi River. Oil fate and transport in this environment was described as follows: “As river velocities increase with flow rate, the time oil interacts with the shoreline is minimized. The oil slick elongates, tends to stay in the middle of the channel, and moves quickly past shorelines. However, if oil does reach the shoreline, it most likely will be retained due to the presence of vegetation at high flow rates; vegetation will retain oil for long periods of time due in part to the adhesiveness of the oil to organics, the large surface area exposed by leaves and stems, and the characteristic low elevation within vegetated areas behind the natural levees or rip rap. Thus, river geometry becomes an important factor as [a] way for oil to reach the shoreline. As current vectors change direction around the bend, oil parcels are moved towards the outside where velocities decrease and heavy oiling can result … At low and medium discharges, the shoreline type varies substantially down river. The presence of mud shorelines and sand bars, both with short re-flotation half-lives, encourage the distribution of oil to shift downstream over time. Re-flotation is a significant transport process in the Lower Mississippi River …”.
Recorded observations of oiled wildlife were mostly (96%) birds, although some mammals and reptiles were also reported as oiled. No information is available about possible fish kills, if indeed such kills occurred. However, the characteristics of the oil (viscous, and lacking a large component of monoaromatic or low-boiling aliphatic constituents) make acute mortality of fish an unlikely scenario.
The first documented bird mortality was on July 29, a completely oiled wood duck found about 40 km downstream from the spill location. Dozens of oiled birds were seen in areas heavily affected, although most of these were wading birds that were capable of flying and could not be captured. The total number of oiled birds observed was 813. Wading birds were seen oiled most frequently (about twenty percent of these were oiled), but waterfowl had the highest rates of oiling (about forty percent being oiled). In addition, 26 mammals and 13 reptiles were observed oiled (USFWS 2009).
Most of the oil spill clean-up was complete by early October, 2008; only a small team remained as of early November 2008 to manage the final inspection and shoreline clean-up sign-off process (NOAA 2008).
6.2.2.8. Gainford Trials of Diluted Bitumen Behaviour on Marine Waters
In June 2012, Trans Mountain commissioned O‟Brien‟s Response Management (now Witt O‟Brien‟s) to organize a study on diluted bitumen (dilbit) products. The purpose of the requested study was to further

Trans Mountain Pipeline ULC Volume 7, Pipeline Facilities Technical Reports Trans Mountain Expansion Project Qualitative Ecological Risk Assessment of
Pipeline Spills Technical Report
December, 2013 REP-NEB-TERA-00019
Page 6-42
the knowledge of dilbit in general and, more specifically, to investigate the behaviour of dilbit when spilled into a marine environment. The study findings are documented in a Technical Report (Witt O‟Brien‟s et al. 2013).
The overall study goal was to better understand and assess oil behavior, weathering, and oil spill response (OSR) countermeasures for spilled dilbit crude in a controlled simulated condition similar to the potential receiving environment of Burrard Inlet. The objectives of the applied research were multifaceted. One objective was to better understand and characterize the changes in physical and chemical properties of dilbit in an estuarine simulated condition over a 10‐day period. Another objective of the meso‐scale trials was to determine efficiency and effectiveness of dispersant, in‐situ burning, and shoreline cleaning agents as potential countermeasures for various stages of weathered oil. The third part of the study was to test various types of oil spill response equipment under similar weathering conditions and to assess their efficiencies over time. Air sampling and monitoring also was included with the objective of providing measured emission rates that could be used to ground‐truth numerical estimates modeled for accidental release/hazard assessment.
Both Access Western Blend (AWB) and Cold Lake Winter Blend (CLWB) dilbits exhibited properties typical of a heavy, “conventional” crude oil. In no instance was any oil observed to have sunk after being allowed to spread on the water surface, under static or agitated conditions. Visual observations of the surface of the oil in the various tanks showed that a crust, or armoring, formed as the oil weathered. In some instances, especially noted under static conditions, the lighter components of the oil came out of solution and bubbles formed within the slick. These bubbles rose to the surface and, in places, became trapped under the crusted layer. Weathered oil densities approached, and in several instances, exceeded that of freshwater but not that used to represent Burrard Inlet brackish water. Visual observations were made of weathered oil overwashing within tanks with agitation; however, the weathered oil did not submerge or sink in the tanks.
Chemical analyses of the weathered oils and of the water column showed that concentrations of BTEX diminished rapidly within 48 hours and that TPH in the water column only exceeded the detection limit (2 mg/L) during the first 48 hours in tanks with moderate surface agitation, despite the artificial confinement imposed by tanks relative to what may be expected in an open, natural setting.
Countermeasures tested included dispersant application, burning, and shoreline cleaners. The visual observations of the dispersant test revealed that Corexit 9500 was marginally effective on 6 hour weathered oil and not particularly effective for more weathered Cold Lake Winter Blend dilbit. The early test burn (6 hour weathered CLWB dilbit) was effective with a sustained burn of 2 L of oil lasting for more than 2 minutes with approximately 70% of oil removed through burning. Additional burn testing showed approximately 50% of 24 hour weathered oil was removed, but only after sustained effort to ignite. The 72 hour weathered oil was not successfully ignited. Tests with Corexit 9580 found the cleaning agent to be effective on oils weathered up to five days. Test observations noted that the time oil weathers on water before being placed on the tile was less important than the time the weathered oil was exposed to air.
Some key conclusions were as follows ((Witt O‟Brien‟s et al. 2013):
There was no two‐phase separation into bitumen and diluent Off‐gassing of light‐ends has safety implications for responders and the public during the initial hours
of exposure to a release, as is the case for most oil spills Both AWB and CLWB dilbits remained floating on brackish water during the 10 days of weathering Both AWB and CLWB weathered dilbits surpassed viscosities of 10,000 cSt within 48 hours and
exhibited strong tendencies to form a more continuous thick mat rather than a thin sheen on water which, with continued weathering and agitation, can be expected to produce tar balls.

Trans Mountain Pipeline ULC Volume 7, Pipeline Facilities Technical Reports Trans Mountain Expansion Project Qualitative Ecological Risk Assessment of
Pipeline Spills Technical Report
December, 2013 REP-NEB-TERA-00019
Page 6-43
6.2.2.9. Proposed Enbridge Northern Gateway Project
The Enbridge Northern Gateway Pipeline project proposes to build and operate two 1,175 km pipelines between Bruderheim, Alberta and a marine terminal at Kitimat, British Columbia. One pipeline will carry diluted bitumen or synthetic oil for export, and the other will import condensate to be used as a diluent.
As part of its application to the National Energy Board for approval to construct and operate the pipelines, Enbridge quantitatively assessed the risk of accidental releases along the pipeline corridor. In particular, the Technical Data Report, Ecological and Human Health Risk Assessment for Pipeline Spills (EHHRA; Stantec et al. 2012), assesses the acute and chronic risks to ecological receptors resulting from full-bore pipeline accident scenarios into four different rivers, representing a range of hydrological and geographic settings along the pipeline corridor.
The EHHRA evaluated hypothetical releases of three typical hydrocarbon products proposed to be carried by the twin pipelines (i.e., diluted bitumen, synthetic oil and condensate). The focus of the EHHRA was to predict the range of potential effects based on direct releases to the aquatic environment in a total of four representative watercourses along the pipeline corridor. Scenarios were evaluated for a range of site-specific release volumes, and seasonal variations corresponding to flow rates (low and high), wind speeds and ambient temperatures.
The selected release locations considered in the EHHRA were based on the following criteria:
Locations where Aboriginal peoples or the general public had expressed specific concerns about spills
Locations where a spill could affect traditional use, other human uses or infrastructure (e.g., potable water intakes or treatment facilities)
Locations which reflect environmentally sensitive resources (e.g., spawning grounds for salmon) Locations where the maximum volume of a spill could potentially enter a watercourse Locations which reflect a range of watercourse types Locations where there is limited access to the corridor, thereby increasing emergency response times
Based on these criteria, four representative watercourses were selected for site-specific modelling and assessment including:
Chickadee Creek: a low gradient interior river tributary discharging to the Athabasca River (gradient 0.13%) located up-gradient from a populated centre within the Southern Alberta Uplands region
Crooked River: a low gradient interior river with wetlands, entering a lake system within the Interior Plateau Region of British Columbia
Morice River: a moderate gradient (0.165%) river system along the western boundary of the Interior Plateau Region of British Columbia
Kitimat River near Hunter Creek: a high gradient (0.43%) coastal tributary discharging to a large watercourse with sensitive fisheries resources, downstream human occupation, and discharging to the Kitimat River estuary
The ERA component of the study evaluated potential short term (acute) effects as well as longer term (chronic effects) of hydrocarbon spills to these river systems. A total of 24 unique release scenarios were evaluated (3 hydrocarbon products, 4 river locations, 2 season variations). These analyses represent extreme spill scenarios based on the assumption of a full-bore rupture of a pipeline, with maximum draw-down of oil between valve locations being released to a nearby watercourse. Release volumes were specific to the release location. Hypothetical release volumes for the larger oil pipeline (carrying diluted bitumen or synthetic oil) ranged from 1,293 m3 to 3,321 m3. No credit was taken for possible mitigation of the spread of oil or recovery of spilled oil during the acute phase. The spill scenarios were therefore conservative with respect to both the physical extent of oiling and the hydrocarbon concentrations that could be present in the environment.

Trans Mountain Pipeline ULC Volume 7, Pipeline Facilities Technical Reports Trans Mountain Expansion Project Qualitative Ecological Risk Assessment of
Pipeline Spills Technical Report
December, 2013 REP-NEB-TERA-00019
Page 6-44
The ERA component of the report included separate assessments of the following:
Acute (short term) effects on fish, other aquatic receptors and wildlife receptors, based on environmental fate and transport modelling of the spill event(s).
Chronic (medium to long term) effects on the most sensitive aquatic receptors including the potential effects on developing fish embryos, such as salmonid eggs and spawning gravels, based on modelling of water and sediment quality following the initial spill event. Chronic risks to wildlife receptors were also evaluated, considering further modelling and distribution of hydrocarbons in water, sediment, fish, shoreline soils, vegetation, invertebrates and game animals.
The acute effects assessment utilized physical fate modelling to simulate the downstream transport of the spilled hydrocarbons over time, and of the partitioning of the products to various environmental media downstream of the release point including air, water, sediment and shoreline soil.
Acute effects for aquatic organisms were evaluated using two acute toxicity endpoints, assuming the toxicity resulting from exposure to dissolved aromatics is primarily due to the PAHs and substituted benzenes: the LC50 selected for average sensitivity species was 50 μg TPAH/L) and 5 μg TPAH/L for sensitive species (the 2.5th percentile) (French McCay 2002).
A slick thickness of 10 μm was assumed as a threshold thickness for oiling mortality for wildlife, given the sizes of the water bodies evaluated and likely exposure times of animals such as muskrat, beaver, mink, otter, reptiles and waterfowl (French McCay 2009). Threshold effects for emergent vegetation was set at a slick thickness of >100 µm (French McCay 2009).
The chronic effects assessment evaluated a number of specific COPC including trace metals, petroleum hydrocarbons, polycyclic aromatic hydrocarbons, alkylated PAH, pentachlorophenol and phenol, volatile organic compounds and alkylated mono aromatic hydrocarbons. Estimated exposure point concentrations (EPC) were calculated for various environmental media at time points of four weeks and one to two years following the end of the acute phase of each oil spill.
Potential risks were evaluated for a range of wildlife receptors including grizzly bear, mink, moose, muskrat, river otter, woodland caribou, bald eagle, belted kingfisher, Canada goose, herring gull, great blue heron, mallard, spotted sandpiper, tree swallow. Chronic effects to fish eggs and embryos were evaluated based on effect concentrations of 1 μg/L as total PAH (TPAH).
For the purposes of this discussion, the predicted effects from releases of diluted bitumen and synthetic oil were carried forward, as these are both relevant to the TMEP application.
Summary of Oil Spill Modelling Results from Enbridge Northern Gateway Project The predicted mass balances for each release scenario are summarized in Table 6.12. Owing to the nature of the modelling, little of the oil remained on the surface of the water at the end of the model runs. Therefore, two cases stand out, both arising at Crooked River under high flow conditions. In these scenarios, high flow resulted in oil being advected downstream to Davie Lake, where it remained on the surface of the water for an extended period of time. Lakes or large reservoirs can act as “catchers” for spilled oil, and this accounts for the high percentage of the spilled oil remaining on the water surface in those scenarios.
Atmospheric losses of hydrocarbon ranged from 2.1% to 16.8% of the spilled oil, and are a function of the composition of the oil (i.e., the amount of volatile hydrocarbons), as well as other fates of the oil that would prevent rapid evaporation of oil from the water surface. Examples of those other fates would include entrainment in the water column and sedimentation.
Dispersion of oil into the water column ranged from 0% to 80.1% of the spilled oil, and was a function of several factors including the viscosity of the oil (less viscous oil is more readily entrained and dispersed into the water column as small droplets that can remain submerged), as well as the amount of energy acting on the floating oil in the form of water turbulence, or wind shear. Thus, more oil is likely to become

Trans Mountain Pipeline ULC Volume 7, Pipeline Facilities Technical Reports Trans Mountain Expansion Project Qualitative Ecological Risk Assessment of
Pipeline Spills Technical Report
December, 2013 REP-NEB-TERA-00019
Page 6-45
dispersed in the water column at high flow (i.e., under more turbulent flow conditions), or in response to episodic or seasonal weather that has higher wind speeds.
Sedimentation of oil was also highly variable, ranging from 0% to 81.8% of the spilled oil. Any oil can become trapped in sediments under the right circumstances. However, sedimentation was an important fate for both the diluted bitumen and the synthetic oil, representing 25% to 50% of the spilled oil in most simulated cases. Factors that would normally lead to enhanced sedimentation of oil would include the initial dispersion of oil into the water and contact between oil droplets and suspended sediment or sand particles, as well as initial stranding of oil in contact with shoreline sediment, followed by remobilization of that oil by rising water levels, so that the oil/particulate aggregate re-enters the water column and has the potential to sink.
Stranding of oil accounted for 2.2% to 88.7% of the spilled oil. Stranding along shorelines is usually an important part of the mass balance for oil spilled in inland waterways. The diluted bitumen was more prone to stranding than the synthetic oil, in part due to its higher viscosity, which caused it to float on the surface until it encountered a shoreline, and upon contacting the shoreline having a tendency to form thicker coatings. In contrast, more of the synthetic oil tended to became entrained into the water column due to its lower viscosity, limiting the potential for the synthetic oil to strand.
Decay accounted for between 1.7% and 17.2% of the fate of the oil. This fate pathway was based on published microbial degradation rates for spilled crude oil fractions; however, under less than optimal conditions this pathway could also be a negligible fate pathway in the first few days following an oil spill.
To summarize the mass balance modelling results, dispersion into the water column can readily occur if an oil has low viscosity, and if the flow or wind conditions at the time of the spill generate high levels of turbulence. Flow conditions that would create turbulence include both high river slope, and high river flow rate. Once in the water column, hydrocarbons present in oil droplets may dissolve into the water, and the droplets themselves may re-surface, or sink, depending upon their state of weathering, and the potential for contact with mineral particles (silt, sand or gravel) that would increase the aggregate density so that it exceeded that of the water. This OMA would remain suspended in the water column or become part of the riverbed-load, coming to rest in areas with low water velocity. Sedimentation and shoreline stranding are both important fate pathways. Shoreline stranding is more likely to occur when oil remains floating on the surface of the river. However, in order to maintain mass balance, it is important to understand that when conditions are such that a particular oil fate is likely, other oil fates become diminished in importance.

Trans Mountain Pipeline ULC Volume 7, Pipeline Facilities Technical Reports Trans Mountain Expansion Project Qualitative Ecological Risk Assessment of
Pipeline Spills Technical Report
December, 2013 REP-NEB-TERA-00019
Page 6-46
TABLE 6.13 MASS BALANCE FATE OF SPILLED DILUTED BITUMEN AND SYNTHETIC OIL IN FOUR RIVERS, UNDER TWO FLOW CONDITIONS, BASED ON MODELLING CARRIED OUT FOR THE ENBRIDGE NORTHERN GATEWAY PROJECT
Scenario Surface Atmosphere Water Column Sediment Ashore Decay Exits Last Grid
CA-DB-HQ 0.1% 3.8% 3.4% 15.5% 64.8% 7.8% 4.7%
CA-DB-LQ 0.0% 4.5% 0.0% 0.0% 88.7% 6.7% 0.0%
CR-DB-HQ 21.0% 3.9% 32.4% 4.1% 27.6% 11.1% 0.0%
CR-DB-LQ 0.0% 2.1% 0.0% 81.8% 11.2% 4.8% 0.0%
MR-DB-HQ 0.0% 2.1% 42.0% 23.0% 23.4% 9.5% 46.5%
MR-DB-LQ 0.0% 3.1% 3.9% 51.0% 35.1% 7.0% 0.8%
KR-DB-HQ 0.0% 4.2% 2.3% 15.8% 66.7% 10.7% 0.3%
KR-DB-LQ 0.0% 5.4% 0.2% 31.3% 54.9% 8.2% 0.0%
CA-SO-HQ 0.0% 4.4% 17.3% 52.1% 3.5% 1.7% 21.0%
CA-SO-LQ 0.0% 11.2% 14.1% 63.4% 6.4% 3.2% 1.8%
CR-SO-HQ 10.2% 8.4% 35.0% 33.2% 6.1% 7.5% 0.0%
CR-SO-LQ 0.0% 8.1% 80.1% 0.5% 2.2% 9.0% 0.0%
MR-SO-HQ 0.0% 3.3% 59.9% 26.7% 2.3% 7.8% 58.9%
MR-SO-LQ 0.0% 7.6% 52.3% 22.2% 8.6% 9.2% 52.4%
KR-SO-HQ 0.0% 5.7% 12.1% 49.1% 6.1% 5.6% 21.5%
KR-SO-LQ 0.0% 16.8% 5.7% 20.7% 16.7% 17.2% 22.8%
Chickadee Creek / Athabasca River = CA, Crooked River = CR, Morice River = MR, Kitimat River = KR Diluted Bitumen = DB; Synthetic Oil = SO High Flow = HQ; Low Flow = LQ
Source: Stantec et al. 2012
Acute Effects to Aquatic Receptors, Vegetation, Birds and Mammals Acute effects to fish and other aquatic biota from spilled oil were summarized as the area of potential acute toxicity, represented by the summed area with various percent losses due to mortality where organisms are present. The percentage affected of each river section, as well as the distance down river where acute toxic effects could potentially occur, was provided for each hypothetical spill scenario. Acute effects assessments based on sensitive species presence are summarized in Table 6.13.
Effects on sensitive aquatic receptors, either as area affected or as percent of habitat present in the modelled reach, reflect river size, and oil type. Three of the four modelled rivers are rather small, with the Athabasca River being the largest. Large rivers have greater dilution flow, and as a result negative effects on fish and other aquatic life become less likely because the in-stream concentration of dissolved hydrocarbons is lower. The second factor is oil type. Two main considerations relate to oil type, namely the oil composition in terms of the availability of more water soluble hydrocarbons, and the oil viscosity, which affects the potential for the oil to become entrained into the water column as small droplets, accelerating the rate at which those hydrocarbons can dissolve into the water. Direct transfer of MAHs and other water soluble hydrocarbons from an oil slick to the water below is quite limited in the absence of water turbulence and oil entrainment, and oil floating on the water maximizes the opportunity for those hydrocarbons to evaporate instead of dissolving in the water. The conservative nature of the modelling completed also underscores that complete mortality of fish throughout an affected reach following an oil spill is unlikely, although localized mortality can be expected.

Trans Mountain Pipeline ULC Volume 7, Pipeline Facilities Technical Reports Trans Mountain Expansion Project Qualitative Ecological Risk Assessment of
Pipeline Spills Technical Report
December, 2013 REP-NEB-TERA-00019
Page 6-47
TABLE 6.14 ACUTE EFFECTS OF SPILLED OIL ON AQUATIC ECOLOGICAL RECEPTORS IN FOUR RIVERS, UNDER TWO FLOW CONDITIONS, BASED ON MODELLING CARRIED OUT FOR THE ENBRIDGE NORTHERN GATEWAY PROJECT
Scenario
Effects on Sensitive Aquatic Organisms Effects on Aquatic Plants Effects on Aquatic Wildlife
River Area (km2) % Affected Shoreline Length
(km) % Affected River Area (km2) % Affected
CA-DB-HQ 0.46 4.74 95.1 38.9 3.99 41.6
CA-DB-LQ 0.024 0.25 69.8 28.5 2.49 25.9
CR-DB-HQ 0.011 12.77 29.3 46 7.0 71
CR-DB-LQ 0.087 100 9.5 14.9 0.065 6.6
MR-DB-HQ 4.45 54.9 83.8 28.2 4.52 57.2
MR-DB-LQ 3.72 45.8 70.6 26.8 2.65 33.5
KR-DB-HQ 3.96 14.7 67.7 18.6 3.14 29
KR-DB-LQ 0.087 0.32 31.5 8.7 1.04 9.6
CA-SO-HQ 3.59 37.2 28.4 11.6 0.04 0.5
CA-SO-LQ 1.31 13.6 55.7 22.8 1.93 20.1
CR-SO-HQ 0.055 66.9 31.8 50 7.0 71
CR-SO-LQ 0.076 92.0 26.1 41.1 3.9 39.5
MR-SO-HQ 6.52 82.2 27.5 9.3 1.62 20.5
MR-SO-LQ 6.96 86.9 108 36.3 3.81 48.2
KR-SO-HQ 15.4 57.0 26.9 7.4 1.4 13
KR-SO-LQ 8.83 32.8 68.1 18.7 2.2 20.3
Chickadee Creek / Athabasca River = CA, Crooked River = CR, Morice River = MR, Kitimat River = KR Diluted Bitumen = DB; Synthetic Oil = SO High Flow = HQ; Low Flow = LQ
Source: Stantec et al. 2012
Effects on aquatic plants (if present) were forecast to occur and to affect between 7.4% and 50% of the reach. Similar values apply also to aquatic wildlife such as waterfowl and semi-aquatic mammals. These results underscore that while mortality of aquatic plants and wildlife receptors can be expected following an inland oil spill, complete population losses are unlikely to occur, and the survival of some of the potentially affected plants and animals will increase the rate of natural recovery.
Chronic Effects to Aquatic Receptors, Vegetation, Birds and Mammals Chronic toxicological effects of spilled crude oil were assessed at locations downstream of the four hypothetical spill locations along the pipeline corridor. Ecological risks were based on trajectory modelling of the hydrocarbons in the watercourses as well as fate and weathering modelling to predict what hydrocarbon constituents would be likely to occur at specific areas and specific times after the hypothetical spill. To consider worst-case effects associated with these hypothetical spills, modelling did not take into account containment or removal of spilled hydrocarbons, except to a limited extent that would be associated with shoreline clean-up activities.
Hazard index (HI) and hazard quotient (HQ) values are used to evaluate the potential for negative effects on ecological receptors. Individual HI values are calculated by dividing the exposure point concentration or ingested dose of a particular substance by a specific toxicity reference value. The HI values therefore represent exposure to a unique substance or fraction of hydrocarbons. The HQ values are calculated as the sum of two or more HI values, where the toxicity of two or more individual substances can be considered additive. Since this assumption applies widely to hydrocarbon compounds, it is very common to express the toxicity of hydrocarbon mixtures in terms of HQ values.
Both oil type and river characteristics were found to affect the outcomes of hydrocarbon spills. In particular, the physical dimensions, flow rates, and other characteristics of the rivers where the hydrocarbon spills occur help to explain the outcomes. Chronic effects tended to be more severe in the smaller watercourses (e.g., Chickadee Creek), and also in the slow-moving Crooked River, where organic soils and fine-grained sediments were predicted to trap and retain hydrocarbons. In contrast, little oil was

Trans Mountain Pipeline ULC Volume 7, Pipeline Facilities Technical Reports Trans Mountain Expansion Project Qualitative Ecological Risk Assessment of
Pipeline Spills Technical Report
December, 2013 REP-NEB-TERA-00019
Page 6-48
predicted to become entrained into river gravels, and this oil was subject to weathering so that chronic effects were minimal.
Although oiling of shorelines was considered likely to cause acute effects on shoreline plant communities and soil invertebrates, following shoreline clean-up activities, it was predicted that many shoreline plants, particularly perennial plants and shrubs, would quickly regenerate from either surviving root stock or seed stock. Soil invertebrates would also be present in nearby unaffected soils, so that re-colonization of soils could proceed quickly as soils recovered from the chemical effects of oiling. Chronic effects on shoreline soils would also be limited to the areas oiled as the hydrocarbons moved downstream.
It was predicted that fish and benthic invertebrate communities would be subject to toxicity during the acute phase of the hydrocarbon spills. However, after the initial phase of the spill, the expected hydrocarbon concentrations in river water were predicted to decrease substantially, to levels that would not even cause chronic effects to fish or other aquatic life. Similarly, even with the deposition of hydrocarbons to sediment, the average predicted sediment pore water concentrations of hydrocarbons and TPAH were, for the most part, below concentrations likely to cause negative effects to developing fish eggs in the gravel. The primary exception to this generalization was observed in Chickadee Creek, where fine-grained sediments were predicted to create conditions leading to higher hydrocarbon concentrations in sediment pore water, with greater potential for effects on benthic invertebrates or fish eggs. However, it remains that for the gravels most likely to be used by salmonid fish as spawning habitats, the expected average TPAH concentrations in sediment pore water were predicted to quickly fall below benchmarks established to identify the potential for blue sac disease or mortality of developing eggs. As a result of natural weathering processes, it was concluded that conditions harmful to developing fish eggs in gravel substrates could occur for a period of weeks following a major river oil spill, but that concentrations of TPAH would rapidly decline to concentrations below such effects thresholds. The most likely predicted outcome, therefore, was that a portion of the reproductive capacity of a single year-class of fish could be lost, but that recovery would occur in subsequent years.
The wildlife receptors evaluated in the ERA were selected in part to focus on species likely to live in and around rivers, which would be highly exposed to the effects of hydrocarbon spills, and which are of importance to Aboriginal peoples. Comparison of species such as the muskrat and spotted sandpiper with other species having larger ranges and less emphasis on aquatic or riparian habitat (such as grizzly bear or bald eagle) underscored this aspect of the risk assessment study. While local populations of smaller animals such as muskrat or waterfowl could be subject to chronic effects caused by hydrocarbon spills, it is unlikely that individuals of larger and more widely-ranging species such as grizzly bear, bald eagle or ungulates would suffer serious harm from chronic exposure scenarios.
6.2.2.10. Proposed Vancouver Airport Fuel Delivery Project
In 2011, the Vancouver Airport Fuel Facilities Corporation submitted an environmental assessment for a proposed fuel delivery project. As part of the application, oil spill fate and transport modelling was completed for Jet “A” fuel that focussed on the lower Fraser River, between the Port Mann Bridge and the mouth of the Fraser River Delta. In addition, supplemental research was conducted on the characteristics of the Fraser River Delta, its value as migratory bird habitat, and in particular the role of “biofilm” as a food source for migrating Western Sandpiper. These documents are available through the British Columbia Environmental Assessment Office website.
6.2.2.11. Summary of Findings from the Case Studies
The selected case studies provide information on the actual or expected behaviour of diluted bitumen and other heavy oil products in freshwater environments that are relevant or informative to the range of freshwater environments in proximity to the Trans Mountain Expansion Project. It is important to distinguish, however, between the crude oils that will be transported by the proposed pipeline, and the bunker type products that were spilled in some case studies. The proposed pipeline‟s tariff conditions require that crude oils shipped will have a density of 0.94 or lower, in addition to specifications for viscosity and other oil properties. Diluents are added to the bitumen to make it conform to the tariff

Trans Mountain Pipeline ULC Volume 7, Pipeline Facilities Technical Reports Trans Mountain Expansion Project Qualitative Ecological Risk Assessment of
Pipeline Spills Technical Report
December, 2013 REP-NEB-TERA-00019
Page 6-49
specifications. A bunker type product would not conform to the tariff, and so the scenario of spilled crude oil or diluted bitumen sinking on contact with water is not plausible. Spilled diluted bitumen such as CLWB would initially float, like any other crude oil having a density of 0.94 or lower. Weathering over time would progressively increase the density of spilled CLWB until it approached a density of 1. Testing carried out by Witt O‟Brien‟s et al. (2013) on behalf of Trans Mountain found that in some cases the density of weathered CLWB slightly exceeded 1.0, which would lead to sinking behaviour in fresh water. Interactions between the spilled oil and suspended or bed sediments could also increase the density of weathering CLWB, as it could for any crude oil, leading to oil sinking. Notwithstanding this potential for sinking behaviour, the primary fate of spilled diluted bitumen is expected to include weathering (including evaporative loss and dissolution into water) and shoreline stranding, with sinking expected to remain a minor loss pathway.
The case studies were also reviewed to obtain information on the recovery of aquatic and riparian ecosystems, and ecological receptors, following actual oil spills. The review is presented in Appendix C. Notwithstanding that some high profile and extensively researched oil spills, such as the Exxon Valdez oil spill (EVOS) incident, provide evidence for long-term negative effects, delayed recovery, or a failure to recover from a major oil spill on the part of some ecological receptors, the vast majority of oil spills to freshwater environments provide evidence of ecosystem recovery, often in a relatively short period of time. Two key factors serve to differentiate freshwater oil spills from marine spills such as the EVOS. The first is the volume of oil spilled, with the case study oil spills all involving much smaller volumes of oil than were spilled as a result of the EVOS. The second is a relatively intensive level of oil spill clean-up activity being brought to bear on a freshwater ecosystem that is usually well defined. While there are examples of oil spill recovery efforts that cause unintended negative consequences, such as the destabilization of the river channel of the Pine River caused by removal of logjams that had trapped oil, the purpose and objective of oil spill clean-up activity is to recover spilled oil, and to hasten ecosystem recovery, taking a net environmental benefit approach.
Biological effects of oil spills to freshwater environments vary widely in relation to the characteristics of spilled oil, the physical dimensions and other characteristics of the receiving waters, season, and other factors. Based upon the information reviewed in the case studies, these effects are summarized below, according to the general receptor groups.
Aquatic Vegetation Rivers may not always support important populations of aquatic plants. However, where they occur, floating aquatic plants would be expected to be killed if contacted by an oil slick. Submerged aquatic plants would be less vulnerable, as they would be exposed primarily to dissolved hydrocarbons, and are not considered likely to fall within the most sensitive groups of aquatic biota to such exposure. Emergent aquatic plants would generally be quite tolerant of moderate exposure to floating oil (such that a portion of the stem was oiled). Slow moving rivers with soft sediments, as well as backwaters and riparian wetland areas, are all high value habitats for aquatic plants, and such plants are important as habitat and as a source of food for many wildlife species. Other river types, however, may support very limited aquatic plant populations. Rivers draining mountainous areas in western Canada, where snow and glacial melt water dominates the hydrology, typically fall into this second group. High water levels and flow rates during the summer months may cause erosion and scour in gravel/cobble riverbeds which would damage delicate aquatic plant tissues. High turbidity levels also limit light penetration into the water column, further limiting the habitat quality for aquatic plants. As a result, aquatic plants are not expected to be an important part of the ecological structure of most of the larger rivers crossed or paralleled by the proposed pipeline corridor.
Aquatic Invertebrates Aquatic invertebrates are evaluated as a group, and as such exhibit a broad range of sensitivity to hydrocarbon exposure. Sensitive species such as stoneflies, mayflies and caddisflies would be expected to respond to dissolved hydrocarbon exposure at levels similar to sensitive fish species, while others are expected to be more tolerant. The case studies show that benthic invertebrate communities are affected by oil spills, but that they recover quickly. Effects on biomass and diversity are observed. A study of

Trans Mountain Pipeline ULC Volume 7, Pipeline Facilities Technical Reports Trans Mountain Expansion Project Qualitative Ecological Risk Assessment of
Pipeline Spills Technical Report
December, 2013 REP-NEB-TERA-00019
Page 6-50
unionid clams in the Kalamazoo River also provided evidence of mortality associated with both the oil spill and recovery efforts, although the clam communities did not appear to be extirpated by the spill. With the exception of a few long-lived species such as bivalves, most benthic invertebrates have annual life cycles, and are well adapted for population recovery following natural or anthropogenic losses. Benthic communities typically recover within one or two years. Examples are provided by the Kalamazoo, Pine, and East Walker river oil spills.
Fish and Fish Eggs and Larvae Few, if any, of the case studies provide direct evidence for effects on fish eggs in spawning gravels. Mortality of adult fish, however, is commonly but not always observed in association with inland oil spills. Factors that mitigate against fish kills include oil type (i.e., the availability of more water-soluble constituents of the oil, and density/viscosity relationships that facilitate or impede the formation of oil droplets); the turbulence of the receiving environment (which helps to determine the extent to which oil droplets form and accelerate the dissolution of light hydrocarbons into the water); and the volume of water flowing in the receiving environment, relative to the volume of spilled oil (which may limit the maximum dissolved hydrocarbon concentration that can be achieved). High levels of fish mortality were observed in the Pine River spill example, where a light crude oil was spilled into a relatively small, turbulent river. Some mortality was also observed in the East Walker and Kalamazoo River spills, although effects of flow regulation and cold winter weather were also implicated at the East Walker River.
In-Water Amphibians Little information is provided by the case studies with respect to amphibians. However, it is assumed that in-water amphibians, as eggs, juveniles or adults, will have sensitivity similar to that exhibited by sensitive fish and benthic invertebrate species.
Shoreline and Riparian Vegetation Shoreline and riparian vegetation are expected to be affected only in cases where rivers are in flood condition at the time of an oil spill, such that the riparian areas are overwashed by oil. Oiling of vegetation is expected to result in the death of annual plants, as well as the death of contacted foliage of perennials, shrubs and trees. Where contact is only with the stems of plants, particularly trees and shrubs, effects are usually minimal. As discussed elsewhere, areas subject to heavy oiling, such as the initial overland flowpath from a spill site to the aquatic environment, may require aggressive remedial actions, so that all habitat is initially destroyed, then reconstructed and seeded with appropriate native seed mixes. Outside of these areas, recovery is usually allowed to proceed via natural attenuation following appropriate oil spill clean-up procedures to remove the most visible oiling. Annual plant communities typically recover from moderate oiling within one or two years. Shrubs and trees in riparian habitat are generally not killed as a result of oil exposure, or removed during remediation activities. The Kalamazoo River oil spill provides a good example.
Soil Invertebrates Little information is provided by the case studies with respect to soil invertebrate communities. However, the assessment provided above for shoreline and riparian vegetation is believed to also be applicable to soil invertebrates.
Mammalian Wildlife Relatively few mammals are usually found dead following inland oil spills. The case studies suggest that tens, rather than hundreds, are typically found. In part, this reflects the generally low sensitivity and/or exposure of many mammalian wildlife species. However it may also reflect the low probability of finding all dead animals. . The species most likely to be affected are those that actively swim in water (e.g., muskrat, beaver, mink and otter), as opposed to those that occasionally visit streams and rivers or occupy riparian habitat, (e.g., bears, raccoons or ungulates). Mortality may be caused by loss of insulative function in oiled fur, leading to hypothermia; or to ingestion of oil while trying to clean the fur, leading to

Trans Mountain Pipeline ULC Volume 7, Pipeline Facilities Technical Reports Trans Mountain Expansion Project Qualitative Ecological Risk Assessment of
Pipeline Spills Technical Report
December, 2013 REP-NEB-TERA-00019
Page 6-51
haemorrhaging of the digestive tract; or to a combination of such stressors, but tends to be associated with the acute phase of the spill.
Avian Wildlife Like mammals, few dead birds are usually found following inland oil spills considering their known sensitivity to oiling. Again, the case studies suggest tens, to a few hundred mortalities in most cases, although the actual numbers are likely to be higher due to the low probability of finding the dead birds. Among inland bird species, waterfowl appear to be the most sensitive, due to their high level of exposure to oil slicks on the surface of the water. Wading birds, shorebirds and birds that live around the water generally have lower exposure, although some birds such as dippers which bob in and out of the water to take invertebrates, tadpoles and small fish may be an exception. As was observed for grebes following the Wabamun Lake oil spill, affected populations may appear to rebound quickly because of immigration of birds from other unaffected areas.
Reptiles and Air-Breathing Amphibians The Kalamazoo oil spill case study indicates that amphibians and reptiles (particularly turtles) may be particularly exposed to spilled oil (a large majority of the oiled wildlife that were captured, treated and released following that spill were reptiles, particularly turtles). Most of these animals were subsequently released alive. Turtles would have low sensitivity to external oiling, as they lack fur or feathers, and are cold-blooded. Similarly, as they have no grooming behaviour, their exposure to oil ingestion may also be lower than that of birds and mammals. The areas along the proposed pipeline corridor that would have the highest potential to support reptiles and amphibians would be found in the lower Fraser River valley. The abundance and diversity of reptiles and amphibians in the higher-elevation areas of British Columbia and most of the Alberta portion of the pipeline corridor is expected to be low.
6.3. Hazard Assessment
The purpose of the Hazard Assessment is to assess the fate and transport of oil spilled in the environment, to consider the pathways by which ecological receptors are exposed to (and hence potentially affected by) spilled oil and its constituents, and to identify the spatial extent, magnitude, and duration of potential negative effects associated with acute (short-term) and chronic (long-term) exposure of ecological receptors. The Hazard Assessment forms the basis for evaluating the effects of exposure to pipeline spills of diluted bitumen in the freshwater environment.
6.3.1. Ecological Effects of Spilled Oil
The ERA assesses both acute and chronic risks to ecological receptors resulting from hypothetical pipeline releases to the freshwater environment. The assessment of acute ecological risk focuses on the short-term effects of a pipeline release (i.e., exposure to fresh or unweathered oil and its constituents). During this period, the hydrocarbons would be relatively unweathered, large volumes would be transported downstream in the receiving river or stream, and more volatile hydrocarbons would be available to evaporate to the atmosphere, or to dissolve in water. The assessment of chronic risk (i.e., chronic toxic effects) begins after the acute exposure assessment and addresses the secondary fate of more weathered hydrocarbons, as well as the long-term risks to ecological receptors, including those that are higher-level consumers (e.g., bears, piscivorous birds) that may be chronically exposed to residual hydrocarbons present in shoreline soils, sediment and biota.
There is no evidence that petroleum hydrocarbons, including PAHs, biomagnify up food chains (Environment Canada and Health Canada 2011). After ingestion by vertebrates much of the total ingested hydrocarbon has low bioavailability, and simply passes through the digestive tract. Absorbed petroleum hydrocarbons may be metabolized, or modified into a more readily excretable form; therefore, they do not tend to accumulate in tissues. Petroleum hydrocarbons are also not readily absorbed into and accumulated by plant tissues. The net result is that consumption of either plants or prey animals does not tend to constitute the major component of exposure to petroleum hydrocarbons for aquatic biota.

Trans Mountain Pipeline ULC Volume 7, Pipeline Facilities Technical Reports Trans Mountain Expansion Project Qualitative Ecological Risk Assessment of
Pipeline Spills Technical Report
December, 2013 REP-NEB-TERA-00019
Page 6-52
However, some invertebrates (e.g., molluscs) lack enzyme systems capable of rapidly metabolizing PAHs and it is assumed that hydrocarbons can be accumulated by these animals.
Under the right conditions, spilled oil can become sequestered in the environment, so that weathering occurs very slowly over a long period of time (potentially decades). Sequestered oil is that which has become isolated from the environment, so that normal weathering processes are limited. While such oil can exhibit toxicity similar to that of freshly spilled oil, should it be disturbed and released back into the environment, it is generally considered to have been isolated from the environment and therefore harmless while sequestered. Sequestration of oil occurred on some beaches in Prince William Sound following the Exxon Valdez oil spill, at sites where it was possible for the oil to deeply penetrate into the interstitial spaces; however, sequestration did not play a substantial role in the overall mass balance of oil.
6.3.1.1. Aquatic Biota
Aquatic biota are here conceptualized as including aquatic plants, benthic invertebrates, fish and the aquatic life stages of amphibians.
Exposure of aquatic biota to hydrocarbons is considered to be primarily due to hydrocarbons present in dissolved form. Hydrocarbons are hydrophobic and partition strongly between water and other available non-polar media, including sediment organic matter and living organisms. Uptake of hydrocarbons from water by living organisms is considered to be regulated primarily by equilibrium exchange processes between water and lipids, and to take place across permeable or vascular surfaces such as gills or egg membranes. Once inside the organism, hydrocarbons become part of the generalized lipid pool where they disrupt cellular and tissue function (French McCay 2009), and may or may not be metabolized.
Three primary mechanisms of toxicity have been identified for fish and fish eggs exposed to hydrocarbons. These can be broadly summarized as including non-polar narcosis, blue sac disease (BSD) and phototoxicity. Due to similar habitats and behaviours, it is expected that amphibian in-water stages (i.e., eggs, juveniles) would experience toxic effects similar to those experienced by aquatic receptors (e.g., fish and fish eggs).
Non-polar narcosis is a toxic modality whereby hydrocarbons are reversibly accumulated by organisms principally from the dissolved phase in water, and come to reside in the lipid pool of the receptor organism. The toxic potential of individual hydrocarbon compounds is normalized on a µmol/g lipid basis, so that they can be considered additive in their toxic action. At some critical concentration (C*L) the presence of the hydrocarbon contaminants causes a negative effect on metabolic functioning at some target lipid site within the organism, resulting in an expression of toxicity. As outlined by Di Toro et al. (2000) a species sensitivity distribution has been defined for a broad range of aquatic biota, from algae and protozoa to fish and amphibians. While relatively few of the indicator fish species for Alberta and British Columbia are represented in the species sensitivity distribution, it is known that salmonid fish (including rainbow trout) are among the more sensitive species. For the purposes of this qualitative ERA, the 5th percentile species in the species sensitivity distribution will be taken as the appropriate benchmark to assure protection of the freshwater aquatic community, including fish, with respect to hydrocarbon exposure following a hypothetical spill of diluted bitumen. The chemical constituents of crude oil that contribute most to its acute toxicity include monoaromatic compounds (e.g., BTEX), as well as other low molecular weight hydrocarbons (e.g., VOCs) and some of the lighter PAHs such as napthalenes. Because these components weather rapidly, acute toxicity of spilled oil to fish and other aquatic life tends to be confined to the first hours or days following a spill.
Blue sac disease (BSD) refers to a suite of morphological abnormalities of fish embryos that may be associated with chemical, physical or thermal shock. Common symptoms include ocular, yolk sac, and pericardial edema, hemorrhaging, circulatory abnormalities, and spinal and craniofacial deformities (Fallahtafti et al. 2011). Yolk sac and/or pericardial edema appear to be the most sensitive morphological indicators of embryonic fish exposure to crude oil (Marty et al. 1997, Carls et al. 1999). However, the development of symptoms associated with BSD does not necessarily result in mortality of fish embryos.

Trans Mountain Pipeline ULC Volume 7, Pipeline Facilities Technical Reports Trans Mountain Expansion Project Qualitative Ecological Risk Assessment of
Pipeline Spills Technical Report
December, 2013 REP-NEB-TERA-00019
Page 6-53
The effects of PAH may range in severity from a complete cessation of embryo development and death before feeding begins, to minor reductions in growth (Hodson et al. 2011). Several studies have linked BSD in the early life stages of fish with crude oil exposure and/or exposure to PAHs, particularly 3- and 4-ring PAHs such as phenanthrenes and fluoranthenes. Many of these studies were initiated as a consequence of the 1989 EVOS in Prince William Sound, Alaska. However, there has been considerable controversy regarding the sensitivity of fish eggs and embryos to PAH exposure. While a total PAH concentration in water of 1 µg/L has often been cited as a threshold for onset of blue sac disease induction, the range of concentrations leading to effects appears to range from 1 to 100 µg TPAH/L, depending upon the suite of PAH compounds present, the specific exposure conditions, the receptor species, and the life stage of the receptor species.
Phototoxicity occurs when PAHs present in biological tissues are exposed to natural light including ultraviolet (UV) light, and a resulting reaction enhances the toxicity of PAHs in the tissues, potentially causing mortality or other harm to fish and other aquatic organisms (Logan 2007). The PAHs known to be involved with phototoxic responses are the three- to five-ring PAHs and similar heterocyclic compounds. Hodson et al. (2011) noted that UV photomodification of PAHs can create oxygenated derivatives such as quinones and anthroquinones, which are more water soluble but also more reactive and more toxic than the parent compounds. Hodson et al. (2011) identified anthracene, fluoranthene and pyrene as substances of particular concern. For most benthic species, exposure to light may be minimal, and therefore this mode of action is not a major source of concern. Likewise, for the toxicity benchmarks used here to evaluate negative effects on fish eggs, the damage to developing embryos occurs relatively early in the incubation period, while eggs (particularly salmonid eggs) are buried in spawning gravels and not exposed to light. Barron et al. (2003) tested juvenile pink salmon using weathered Alaska North Slope crude oil (a rich source of PAHs) to determine if it would be phototoxic under conditions of short-term exposure to high levels of oil that may occur during a spill. However, the responses observed were typical of the acute narcotic toxicity of petroleum, and there was no indication of photo-enhanced toxicity. It was concluded that pink salmon are at less risk from photo-enhanced toxicity than early life stages of several other (marine) species. Therefore, although the potential for photo-enhancement of PAH toxicity exists and has been demonstrated in laboratory studies, it is not considered to be of sufficient importance in the natural environment to merit special consideration. This conclusion is similar to that of McDonald and Chapman (2002) who questioned the ecological relevance of PAH phototoxicity, suggesting that it should not be used for environmental management decisions unless its ecological relevance is firmly established, and then only as part of a weight of evidence determination. Over time, hydrocarbon mixtures lose low molecular weight components due to volatilization, dissolution and biodegradation, some of the key processes involved in weathering. As weathering proceeds, the total abundance of all hydrocarbons is reduced, but the lighter hydrocarbons tend to be lost more rapidly. The result is a shift in the total hydrocarbon distribution towards heavier residual hydrocarbons, with a corresponding reduction in the total hydrocarbon concentration or mass remaining in the environment. Similar to other hydrocarbons, as weathering proceeds the total abundance of all PAH compounds is reduced, although some PAHs (notably high molecular weight PAHs, or those that have higher degrees of alkylation) weather more slowly than others. The result can be an apparent increase in the concentration of these PAHs in residual oil, while at the same time the total mass of hydrocarbons or PAHs (and therefore the toxic burden imposed on the environment) is decreasing. Studies that have used oiled gravel packed into columns to generate dissolved PAHs for toxicity studies typically find that the weathering process results in a rapid depletion of water soluble PAHs, so that the potential for toxic effects on fish, fish eggs or embryos persists for only a few months.
6.3.1.2. Terrestrial Biota
Terrestrial biota were conceptualized as including shoreline and riparian vegetation, soil invertebrates, air-breathing life stages of amphibians, reptiles, birds and mammals. The acute effects of oil spills on terrestrial biota are those arising from direct contact with unweathered or slightly weathered crude oil, as well as ingestion or inhalation of hydrocarbons during this initial period of time (i.e., hours to weeks) following an oil spill event. Chronic effects of oil spills on terrestrial biota include effects due to longer term (i.e., weeks to months) exposure to chemical constituents of the spilled oil (such as PAHs), due to ingestion of contaminated surface water, soil, plants, or animal food types. Oiling of wildlife can result in

Trans Mountain Pipeline ULC Volume 7, Pipeline Facilities Technical Reports Trans Mountain Expansion Project Qualitative Ecological Risk Assessment of
Pipeline Spills Technical Report
December, 2013 REP-NEB-TERA-00019
Page 6-54
decreased survival and reproductive success through a number of different mechanisms, including loss of waterproofing and insulating characteristics of feathers or fur, toxicity resulting from the transfer of oil from feathers to eggs during incubation or shoreline oiling of reptile eggs, toxicity through the skin, ingestion of toxins via grooming or feeding, and reduced mobility (NRC 2003, French McCay 2009).
In Canada, emphasis has been placed on exposure pathways based on direct contact between contaminated soils and both plant roots and soil invertebrates. This emphasis is based on the need to preserve the principal ecological functions performed by the soil resources and the low bioaccumulation rates of petroleum hydrocarbons, that would tend to limit exposure to birds and mammals. The Canada-Wide Standard for Petroleum Hydrocarbons in soil (CCME 2008) provides benchmark values for the protection of soil invertebrates and plants exposed to hydrocarbons. To develop these benchmark values protective of plants and soil invertebrates, available toxicity data were standardized at a 25-percent effect level (e.g., the concentration of petroleum hydrocarbons that results in a 25% reduction in invertebrate survival or plant growth). The 25th percentile of the species sensitivity distribution for test results was then used as the guideline for agricultural or residential land use. The Tier 1 guidelines are intended to be generally applicable and to apply to both weathered and fresh hydrocarbons; in general the guidelines were developed using fresh hydrocarbons including but not limited to gasoline and crude oil, and it is acknowledged that the toxicity of hydrocarbon mixtures may decrease as weathering progresses. The Canada-Wide Standard guidelines for hydrocarbons in soil (taking the lower of the values for fine or coarse-grained agricultural soil for the agricultural/residential land use) are as follows: F1, 210 mg/kg dry soil; F2, 150 mg/kg dry soil; F3, 300 mg/kg dry soil; F4, 2,800 mg/kg dry soil.
Plants with emergent parts extending out of the water surface would be affected by floating oil entering their habitats. Based on observations of oil spills affecting wetlands (French et al. 1996, French McCay 2009), oil coating on leaves during the growing season would affect growth and survival of emergent plants, whereas oiling of stems and stubble during the dormant winter period does not appear to affect subsequent vegetative growth. The threshold amount of floating oil where reduced growth or lethal effects on growing vegetation could occur is about 100 g/m2 (0.1 mm, heavy black or brown oil, French McCay 2009). Annual plants, or parts of plants, are likely to be killed outright following oiling of foliage. Perennial plants and shrubs may be damaged but are less likely to be killed outright, and may quickly regenerate from surviving root structures. Trees are unlikely to be negatively affected by oiling of trunks or branches. It is possible that clearing of trees could occur as part of clean-up activities on heavily oiled areas of land, such as the overland flowpath before oil contacts an aquatic environment. Clearing of trees from the riparian zone more generally is not a likely outcome, as trees are rarely killed in this context. Their importance as a key component of the ecosystem, in addition to the services they provide in stabilizing soil, shading watercourses, and providing food and shelter and habitat for other ecological receptors is such that there would rarely be a net environmental benefit to removing trees, and alternative, less intrusive means for soil remediation would be employed.
Potential environmental effects on wildlife in the spill-affected area are evaluated based on probability of encounter with floating and/or shoreline oil and the amount of oil likely accumulated on an individual animal. Jenssen and Ekker (1991a,b) studied eiders exposed to oil on their feathers at varying doses, finding that metabolism was affected following exposure to more than 20 mL of crude oil. However, their review of the literature revealed that a dose of an order of magnitude more oil (200 to 500 mL) is required for substantial and potentially lethal effects. Following French McCay (2009), 350 ml is assumed to be a lethal dose for many wildlife species in this ERA. Assuming a swimming animal has a width of 15 cm, it would need to swim through 230 m of oil of 10 μm thickness, or 2.3 km of oil at 1 μm thickness, to obtain a dose of 350 mL. This distance spent in oil need not be in a straight line. If an animal swims 10 m/min (0.17 m/sec), 230 m would be covered in 23 min (or 2.3 km would be covered in about 3.8 hours). Thus, a slick thickness of 10 μm is assumed as a threshold thickness for oiling mortality, given the sizes of the water bodies involved and likely exposure times of animals such as muskrat, beaver, mink, otter, reptiles and waterfowl within them (French McCay 2009).
Animals oiled above a threshold lethal dose would presumably die, given the remoteness of many of the areas considered, and the low probability that timely capture and rehabilitation would be possible. The likelihood of encounter with oil would be different for each wildlife type depending on its behaviour.

Trans Mountain Pipeline ULC Volume 7, Pipeline Facilities Technical Reports Trans Mountain Expansion Project Qualitative Ecological Risk Assessment of
Pipeline Spills Technical Report
December, 2013 REP-NEB-TERA-00019
Page 6-55
Terrestrial mammals and birds that do not feed in aquatic habitats would likely avoid or not contact oil, with the exception of those attracted to carrion (e.g., bears, foxes, coyotes, wolverines, bald eagles). Scavengers and wildlife that obtain part of their diet from aquatic habitats (e.g., otter, mink and moose) would have a moderate to high probability of becoming oiled. The acute environmental effects of an oil spill on wildlife (i.e., air-breathing vertebrates such as birds, mammals, reptiles and adult amphibians) are evaluated based on the probability of encounter with floating and/or stranded oil, and the amount of oil likely to accumulate on an individual animal.
Dose response studies have been carried out to determine oral-based toxicity reference values (TRVs), doses of oil below which negative effects are not expected to occur. TRVs for ecological risk assessment are generally based on either the lowest observed negative effects level (LOAEL) or the no observed negative effects level (NOAEL). LOAELs used for TRV derivation are usually based on long-term growth or survival, or sub-lethal reproductive effects determined from chronic exposure studies because these endpoints are relevant to the maintenance of wildlife populations. The LOAEL represents a threshold dose at which negative outcomes are likely to become evident.
Cattle will voluntarily ingest large doses of petroleum substances (Coppock et al. 1996). In such acute poisoning cases the lung is the target organ. Chemical pneumonia results when droplets of oil are inhaled. Another cause of chemical pneumonia is aspiration of hydrocarbons during vomiting, regurgitation, or eructation. Lung lesions have been reported following the voluntary ingestion of petroleum by cattle. Such lesions have been reported in cattle given 20 to 60 mL crude oil/kg body weight, and in sheep after a 1-day exposure to water contaminated with natural gas condensate, which also caused reddening and hemorrhage in the digestive tract. Kidneys can also be target organs of petroleum hydrocarbon toxicosis (Coppock et al. 1996).
CCME (2008) derives a value for the toxicity of petroleum hydrocarbons (with a focus on fresh crude oil) to livestock in which the lowest documented effects dose is 2.1 g fresh crude/kg body weight/day. This is divided by an uncertainty factor of 10 to obtain a daily threshold effects dose of 210 mg/kg body weight/day, which is then used to estimate the allowable concentration of whole fresh crude oil ingested in livestock drinking water. However, it is noted that the value for weathered crude oil could be 3.7 times higher, due to the lower toxicity of weathered crude oil (CCME 2008). A value of approximately 0.78 g/kg body weight/day could then be an appropriate toxicity reference value for chronic ingestion of weathered crude oil.
Other studies evaluating the toxicity of fresh or weathered crude oil to mammals are presented in Table 6.15. These studies include cattle, rats, and ferrets and therefore represent herbivores, omnivores, and carnivores. The results from these studies are highly consistent with respect to the dose ranges that have been shown to have negative effects on mammals. Based on the available information, it is concluded that mammals are generally quite tolerant of exposure to unweathered or weathered crude oil. Negative effects are considered unlikely at dose levels less than 0.5 g/kg body weight/day.
Among birds, the Alcids (a family of web-footed diving birds that includes auks, murres and puffins) are considered to be the most vulnerable to oil exposure, due to their tendency to form large flocks and spend much time floating on offshore waters. However, this group is notably absent from inland waters. Among waterfowl, populations of dabbling ducks are generally less exposed because (with some exceptions) they tend not to form large breeding colonies. Therefore, while individual adult mortality and effects on eggs are likely to occur, they are less likely to have high magnitude consequences at the population level due to the tendency for populations to be dispersed. Direct mortality rates for shorebirds are generally low because they spend less time in the water. Raptors become oiled primarily via consumption of oiled prey or carrion. Wading birds generally experience low mortality because they wade in shallow, sheltered waters to feed. However, plumage can become contaminated due to wading through oiled vegetation or exposure to oil slicks, and indirect effects can occur due to loss of prey, resulting in starvation or shifting to alternative foraging sites (Hugenin et al. 1996). Oil exposure of adult birds can cause reproductive effects on birds (e.g., oiling of eggs, as well as nest disturbance caused by shoreline clean-up operations.

Trans Mountain Pipeline ULC Volume 7, Pipeline Facilities Technical Reports Trans Mountain Expansion Project Qualitative Ecological Risk Assessment of
Pipeline Spills Technical Report
December, 2013 REP-NEB-TERA-00019
Page 6-56
Chronic low levels of oil pollution may have negative effects on aquatic bird populations. Small amounts of oil applied to the external surface of bird eggs were found to produce toxic effects (Leighton 1993). Single oral doses of oil have been demonstrated to cause lipid pneumonia, gastrointestinal irritation, and fatty livers. Pathological responses of birds examined after fatal exposure to Bunker “C” fuel oil include enteritis, hepatic fatty changes, and renal tubular nephrosis (Szaro et al. 1978).
Other studies evaluating the toxicity of fresh or weathered crude oil to birds are presented in Table 6.16. These studies focus on mallard, a common dabbling duck, which would be highly exposed to hydrocarbons in the event of a spill. Based on the available information, it is concluded that birds are generally quite tolerant of exposure to unweathered or weathered crude oil. The lowest reported negative effects on a reproductive endpoint are identified at a dose of approximately 0.2 g/kg body weight/day.
Reptiles are considered to have similar sensitivity to birds with respect to dietary exposure to hydrocarbons. Turtle eggs are assumed to be laid in riparian zone soils, but will likely be located above flood stage, and therefore are not likely to be laid in soils that are contaminated with hydrocarbon residues. In this context, turtle eggs are not likely to be more exposed to hydrocarbon residues than are bird eggs, which may be subject to external oiling through contact with oily residues on the feathers of parent birds.
Because petroleum hydrocarbons do not biomagnify up food chains (Environment Canada and Health Canada 2011), consumption of plants and/or other animals does not tend to constitute the major component of exposure to petroleum hydrocarbons for wildlife. Instead, toxic effects in birds, mammals, reptiles, and adult amphibians primarily results from direct ingestion (e.g., from grooming, preening, or ingestion of contaminated water, soil or sediment).

Trans Mountain Pipeline ULC Volume 7, Pipeline Facilities Technical Reports Trans Mountain Expansion Project Qualitative Ecological Risk Assessment of
Pipeline Spills Technical Report
December, 2013 REP-NEB-TERA-00019
Page 6-57
TABLE 6.15 TOXICOLOGICAL BENCHMARKS FOR MAMMALIAN ECOLOGICAL RECEPTORS EXPOSED TO CRUDE OIL
Study Design Effects Results Reference
Domestic cattle (8/group) were administered single oral doses of Pembina Cardium crude oil at 16.7, 33.4 and 67.4 g/kg body weight. Cattle were sacrificed at days 7 or 30 for pathological and histological examination, as well as measurement of a suite of enzyme activities.
No cattle died as a result of being dosed with crude oil. Cattle treated with 16.7 mg/kg body weight showed minimal signs of intoxication; cattle treated with higher doses exhibited tremors, nystagmus, regurgitation and vomiting, myoclonic seizures, depression, locomotor abnormalities, and pulmonary distress. On day 7, cattle in exposed groups showed alteration in enzyme activities in liver, kidney, and lung tissues. Cattle sacrificed on day 30 showed few statistically significant differences from control animals, and reduced differences in cytochrome P-450 activity.
Acute toxicity greater than 67.4 g/kg body weight.
Khan et al. (1996)
Sprague-Dawley rats were given doses of 0.25, 0.50 or 1.25 mL/kg Pembina Cardium crude oil, or 1.25 mL/kg commercial diesel fuel, on days 1, 3, 5 and 8 of the study, and were sacrificed on day 10. Tissue and blood samples were tested for a suite of enzyme activities, hematology and blood chemistry, and pathological examination.
No rats died as a result of being dosed with crude oil or diesel fuel, and there was no sign of distress or intoxication in the exposed animals. Dose-dependent changes were observed in levels of a suite of enzyme indicators (including EROD). The only statistically significant systemic change was a small increase in the liver somatic index of rats exposed to the highest dose of crude oil or diesel fuel.
No sign of distress or intoxication in rats exposed to crude oil at up to 1.25 mL/kg body weight.
Khan et al. (2001)
The toxicity of naturally weathered Exxon Valdez crude oil was tested in a battery of acute and subchronic tests using European ferrets. Young adult male and female ferrets were administered oil at a dose of 0.5, 1.0 or 5.0 g/kg body weight once daily for three days. Prior to the study and at termination, blood samples were taken for chemistry and enzyme testing, and the animals were weighed. At study termination (day 5) the animals were subject to gross necropsy examination and selected tissues were taken for histological examination.
No mortality of ferrets occurred as a consequence of being administered crude oil. No grossly observable signs of toxicity were noted. No effects on mean body weight were detected. No grossly observable signs of toxicity were noted during postmortem examination of the ferrets. Microscopic examination of tissues did not reveal lesions considered to be related to oil exposure. Significantly lower mean spleen to body weight ratios and raw spleen weights were noted in all female treatment groups. No other organ weight differences were noted. With the exception of lower mean serum albumin concentrations in the 5 g/kg female dose group, no significant differences among clinical chemistry parameters were noted. No significant differences in the hematological parameters were noted in any group.
Subacute toxicity of crude oil to European ferrets is >5 g/kg body weight/day.
Stubblefield et al. (1995a)

Trans Mountain Pipeline ULC Volume 7, Pipeline Facilities Technical Reports Trans Mountain Expansion Project Qualitative Ecological Risk Assessment of
Pipeline Spills Technical Report
December, 2013 REP-NEB-TERA-00019
Page 6-58
TABLE 6.16 TOXICOLOGICAL BENCHMARKS FOR AVIAN ECOLOGICAL RECEPTORS EXPOSED TO CRUDE OIL
Study Design Effects Results Reference
The toxicity of naturally weathered Exxon Valdez crude oil was tested in a battery of acute and subchronic tests using mallard ducks. Adult ducks were tested with an acute oral dose of 5 g/kg body weight and observed for up to 14 days following testing (acute oral toxicity). Five-day old ducklings were tested by feeding them a diet containing weathered crude oil at a concentration of 50 g/kg diet (subacute dietary toxicity) for five days, followed by a 3-day observation period on uncontaminated rations; food avoidance was tested using ducklings offered diet containing 0, 1.25, 2.5, 5, 10 and 20 g/kg diet for five days, followed by a 3-day observation period on uncontaminated rations; and ducks (16 weeks old) were fed a diet containing 0, 10, 30 or 100 g/kg weathered crude oil for 14 days.
No adult ducks died following single doses of 5 g/kg body weight; no grossly observable signs of toxicity were noted, and there were no significant effects on feed consumption or body weight. No treatment related abnormalities were noted on postmortem examination. No mortality or observable sign of toxicity was noted in ducklings fed crude oil in their diet at 50 g/kg body weight. Food consumption was not affected, and no significant differences in body weight or growth were noted. Post-mortem examination showed no evidence of systemic toxicity. Ducklings did not avoid food containing crude oil at up to 20 g/kg. No significant differences in body weight or growth were found, and no consistent grossly observable lesions were noted in postmortem examination. No mortalities or grossly observable signs of toxicity were noted in 14-day exposure to dietary concentrations of up to 100 g/kg diet. No significant treatment-related differences in clinical blood chemistry were noted between treatment and control birds. No consistent or substantive differences were noted among the histological appearance of the kidney, thymus, brain or bone marrow of high dose birds when compared to control birds. Spleens and livers of high dose birds were found to show some minor changes when compared to control birds.
Weathered Exxon Valdez crude oil presented little potential for acute toxicity to wildlife species from oral ingestion. Lethal concentrations and no-observed negative effect levels were greater than the maximum tested doses (>5 g/kg body weight in the oral study, and >50 g/kg diet in the subacute dietary tests). LD50 values for refined hydrocarbon products were reported to range from 7 to 20 mL/kg body weight.
Stubblefield et al. (1995a) Hartung and Hunt (1966) as cited by Stubblefield et al. (1995a).
A one-generation reproductive toxicity study and a direct eggshell application toxicity study were conducted using naturally weathered crude oil obtained following the Exxon Valdez oil spill. Mallard ducks, 16 weeks of age, were exposed to dietary concentrations of 0, 0.2, 2 and 20 g/kg diet for 22 weeks. Eggs laid between weeks 12 and 22 of exposure were incubated and hatched. Mallard eggs were also treated with either weathered crude oil or Vaseline (a non-toxic control) to determine the extent of coverage causing reduced viability.
No deaths of ducks occurred that were attributed to crude oil exposure. All surviving birds appeared healthy throughout the study, and no signs of toxicity were noted. No statistically significant differences in growth of birds or food consumption were noted. Consumption of diets containing crude oil at 20 g/kg feed resulted in changes in clinical chemistry parameters (i.e., serum phosphorus, total protein, albumin, bilirubin and calcium), reductions in eggshell thickness and strength (although the viability of embryos was not affected), and suggested liver and spleen weight changes. No significant effects were noted at dietary concentrations of 0.2 or 2 g/kg feed. Long-term ingestion of weathered crude oil at dietary concentrations of 20 g/kg feed may result in reduced egg fitness. Application of weathered crude oil to areas of up to 33% of the shell area had no appreciable effect on embryo survival, suggesting that not only is it substantially less toxic than unweathered crude oil, but that is not as effective as a shell sealant as Vaseline, which caused effects when 17% or greater of the egg shell was covered.
Weathered crude oil is substantially less toxic to mallard ducks than unweathered crude oil. Ingestion of a diet containing weathered crude oil at 20 g/kg caused reductions in eggshell thickness and strength, which could result in reduced hatching success of ducklings.
Stubblefield et al. (1995b)
Fresh South Louisiana crude oil was fed to mallard ducklings at concentrations of 0.025, 0.25, 2.5 and 5% of diet from hatching to 8 weeks of age.
Growth was depressed in birds receiving a diet containing 5% oil but there was no oil-related mortality. Diets containing as low as 0.25% oil caused behavioural response. Liver hypertrophy and splenic atrophy were evident in birds fed 2.5% or 5% oil. Some biochemical effects were noted, and tubular inflammation and degeneration in the kidney were noted in birds fed the 5% diet. High concentrations of oil in the diet impaired development of the wings and flight feathers and caused stunting.
Exposure to fresh crude oil over an 8 week period caused impaired development of mallard ducklings at a dose of 0.824 g/kg body weight/day.
Szaro et al. (1978)

Trans Mountain Pipeline ULC Volume 7, Pipeline Facilities Technical Reports Trans Mountain Expansion Project Qualitative Ecological Risk Assessment of
Pipeline Spills Technical Report
December, 2013 REP-NEB-TERA-00019
Page 6-59
TABLE 6.16 TOXICOLOGICAL BENCHMARKS FOR AVIAN ECOLOGICAL RECEPTORS EXPOSED TO CRUDE OIL
Study Design Effects Results Reference
Fresh South Louisiana crude oil was fed to mallard ducks at concentrations of 0.25 and 2.5% of diet for 26 weeks.
No birds died during the study, nor were body weights significantly depressed. Oviduct weight was greatly reduced on necropsy in ducks on the 2.5% diet, and was also significantly reduced in ducks on the 0.25% diet. Egg production was lower in ducks fed oil in the diet; however, the hatchability of eggs was not significantly different, and there was no effect on eggshell thickness. No significant effects were observed on liver weight, although spleen weight was reduced on the 2.5% diet.
Exposure to fresh crude oil over a 26 week period resulted in reduced egg production. The reduction was about 14% in ducks fed 0.25% oil in diet, and was accompanied by reduced oviduct weight. The 0.25% diet equates to a dose of approximately 0.2 g/kg body weight/day.
Coon and Dieter (1981)

Trans Mountain Pipeline ULC Volume 7, Pipeline Facilities Technical Reports Trans Mountain Expansion Project Qualitative Ecological Risk Assessment of
Pipeline Spills Technical Report
December, 2013 REP-NEB-TERA-00019
Page 6-60
6.3.1.3. Effects of Oiling
Terrestrial Wildlife The acute environmental effects of an oil spill on wildlife (i.e., air-breathing vertebrates such as birds, mammals, reptiles, and adult amphibians) are evaluated based on the probability of encounter with floating and/or stranded oil, and the amount of oil likely to accumulate on an individual animal.
Oiling of wildlife can result in decreased survival and reproductive success through a number of different mechanisms, including loss of waterproofing and insulating characteristics of feathers or fur, toxicity resulting from the transfer of oil from feathers to eggs during incubation or shoreline oiling of reptile eggs, toxicity through the skin, ingestion of toxins via grooming or feeding, and reduced mobility (NRC 2003, French McCay 2009).
The likelihood of oiling is proportional to the amount of time an animal spends on the water or shorelines. For example, wading birds, semi-aquatic mammals (e.g., mink, muskrats) and turtles spend much of their time in shallow water and shoreline habitats, resulting in high likelihoods of being oiled in the event of a spill. In contrast, terrestrial wildlife such as songbirds, terrestrial mammals (e.g., fox, deer) and some reptiles, spend almost all of their time on land and are unlikely to be exposed to oil.
Survival rates depend on the amount of oiling that occurs; the greater the amount of oiling, the less likely an animal will survive. Jenssen and Ekker (1991a,b) studied eiders exposed to oil on their feathers at varying doses, finding that metabolism was affected above 20 mL of (crude) oil. However, their review of the literature revealed that a dose of an order of magnitude more (200-500 mL; average of 350 mL) was required for substantial and potentially lethal effects.
Shoreline and Aquatic Vegetation Plants with emergent parts extending out of the water surface would be affected by floating oil entering their habitats. Based on observations of oil spills affecting wetlands (French et al. 1996, French McCay 2009), oil coating on leaves during the growing season would affect growth and survival of emergent plants, whereas oiling of stems and stubble during the dormant winter period does not appear to affect subsequent vegetative growth. Similarly, trees are unlikely to be negatively affected by oiling of trunks or branches. The threshold thickness of floating oil where reduced growth or lethal effects on growing vegetation could occur is approximately 1 mm (French McCay 2009).
Aquatic Wildlife Submerged oil may settle to the bottom of a waterbody and smother benthic resources (i.e., fish eggs, benthic invertebrates), resulting in reduced survival. Based on numerous studies reported in French McCay (2009), intertidal invertebrates are more sensitive to oiling than intertidal macrophytes, and the threshold thickness of oiling where lethal effects could occur is approximately 0.1 mm (based on the definition of oil “coat” by Owens and Sergy 1994).
6.4. Risk Characterization
The Risk Characterization section qualitatively assesses the extent and nature of the risk of oil spills along the proposed pipeline corridor, based on the information presented in the Problem Formulation, Exposure Assessment and Hazard Assessment sections of the ERA, and with reference to the case studies.
Information obtained from selected case studies (see the Exposure Assessment) was used to predict the fate and transport of diluted bitumen spilled in the freshwater environment along the proposed pipeline corridor. Predictions were made for the full range of watercourses crossed during both high and low flow periods.

Trans Mountain Pipeline ULC Volume 7, Pipeline Facilities Technical Reports Trans Mountain Expansion Project Qualitative Ecological Risk Assessment of
Pipeline Spills Technical Report
December, 2013 REP-NEB-TERA-00019
Page 6-61
The predictions with respect to fate and transport were then used in combination with the information obtained from the Exposure Assessment and the Hazard Assessment to evaluate the likely environmental effects of spilled CLWB on ecological receptors living in affected environments.
Acute effects of oil spills are evaluated following an assumption of no mitigation. This is not to say that effective oil spill response efforts would not be mounted. Rather it is a conservative assumption that reflects the fact that spills could occur at remote locations, and that substantial environmental effects could occur within 24 hours of a large oil spill occurring. Chronic effects of oil spills are evaluated following an assumption that shoreline clean-up and assessment techniques (SCAT) and other remedial measures would be applied in the days and weeks following a spill, and until additional efforts would cause more harm than good, based on net environmental benefit analysis. For the purposes of the ERA, it is assumed that remedial efforts remove most visible oil from shorelines and riparian zone soils, although a residual hydrocarbon loading on soils of up to 1 kg/m2 might be expected. The chronic assessments also assume that sunken oil, if any, is not recovered from the riverbed.
At each hypothetical spill location, a credible worst-case spill volume was estimated based on a full-bore rupture scenario, with the leak being detected at the control centre and the line being shut down within 15 minutes (Lind pers. comm.). The spill volumes for these full-bore rupture scenarios include the drain-down volume for oil present in the proposed pipeline between nearby topographic high points; therefore, the spill volumes are site-specific. A secondary estimate was also made of the volume of oil that might be released due to a less serious accident, such as a third-party strike of the line with heavy equipment causing a puncture with nominal 5 cm (2 in) diameter. In this scenario, the ability of the control room to detect changes in flow and pressure is more limited, and drain-down of the line can still occur. As a result, the estimated spill volumes for the contractor damage were 65% of the volume for the full-bore rupture scenario. This was considered to be similar enough to the spill volume for a full-bore rupture that the difference would be immaterial for this qualitative assessment of ecological consequences. The risk assessment scenarios in the following sections are therefore based on the credible worst-case spill volumes for full-bore rupture. Table 6.17 provides a summary of the estimated full-bore rupture and contractor damage spill volumes for the four identified hypothetical spill scenario locations.
TABLE 6.17 ESTIMATED SPILL VOLUMES FOR FULL-BORE RUPTURE AND CONTRACTOR DAMAGE TO THE PIPELINE
Reference Kilometre (RK) Based on Line V6 Credible Worst-Case Spill Volume for
Full-bore Rupture Credible Worst-Case Spill Volume for
5 cm Puncture
RK 309.0 2,700 m3 1,755 m3
RK 766.0 1,400 m3 910 m3
RK 1072.8 1,300 m3 845 m3
RK 1167.5 1,250 m3 812.5 m3
6.4.1. Tributary to the Athabasca River near Hinton, Alberta at RK 309.0
The hypothetical spill scenario involves a release of 2,700 m3 of CLWB at RK 309.0. Details of the local environment can be found in Section 6.1.2.1. The spilled oil would flow overland a short distance before entering Trail Creek, a tributary to the Athabasca River. Trail Creek is a first-order watercourse that does not represent fish habitat in its upper reaches, but likely does support fish in its lower (higher order) reaches, prior to entering the Athabasca River. The Athabasca River at this location is 100 to 300 m wide, with a gentle meander and cobble-gravel banks and riverbed. Flows are strongly seasonal, ranging from approximately 500 m3/s in June (during freshet), to 32.5 m3/s at low flow in March.
This spill example is evaluated with particular reference to four cases for comparison: the Kalamazoo River oil spill, since that oil spill involved a similar form of diluted bitumen; the Yellowstone River oil spill, as that river has similar gradients to the Athabasca River near Hinton; the modelling conducted by Enbridge for the Athabasca River near Whitecourt, Alberta, as this is a nearby reach of the Athabasca River with very similar characteristics; and the modelling conducted by Enbridge for the Morice River, as that river also has similar overall gradients to the Athabasca River.

Trans Mountain Pipeline ULC Volume 7, Pipeline Facilities Technical Reports Trans Mountain Expansion Project Qualitative Ecological Risk Assessment of
Pipeline Spills Technical Report
December, 2013 REP-NEB-TERA-00019
Page 6-62
Three sets of environmental conditions are considered for this spill example. These are:
A winter condition between December and March, with ice cover on the river and snow cover on the land. Air temperatures are assumed to be below freezing, and the river flow is in the low range (50 m3/s or less).
A summer condition between June and August, with air temperatures of 15ºC to 25ºC. The river is in freshet, with flow greater than 500 m3/s.
A spring or fall condition between April and June, or September and November. The river flow is moderate, at approximately 200 m3/s, and the air temperatures are cool, between 0ºC and 15ºC.
6.4.1.1. Winter Conditions
Under winter conditions, snow in the gully acts to absorb spilled CLWB, and although the gully bottom surrounding Trail Creek is heavily oiled, only a small amount of the CLWB reaches the Athabasca River. Water flow in the creek is negligible due to its small size and winter conditions. The low temperatures also help to limit the flow of CLWB as its viscosity increases as it cools. Some CLWB reaches the Athabasca River and spreads out on the ice, but the density of the oil is less than that of water, so relatively little penetrates cracks in the ice, and down-river transport of the CLWB is negligible. Owing to winter conditions, many of the ecological receptors that could potentially be exposed are absent or dormant.
Table 6.18 provides an evaluation of the likely spatial extent, magnitude, duration, and reversibility of environmental effects on each ecological receptor group that would be caused by an accidental spill of CLWB near RK 309.0 during winter. Due to winter conditions, overland flow of the oil is slowed, and some of the oil is absorbed into the snowpack. Following local terrain, crude oil would reach the creek, and then follow the thalweg of the creek down to the Athabasca River, where it would likely pool on the surface of the river ice. During winter conditions, most migratory birds would be at their wintering grounds, so acute effects on raptors, waterfowl, wading and shorebirds are unlikely to be of high magnitude. Similarly, some mammals such as bears would be hibernating, although others such as moose, muskrat and river otter remain active year-round. Due to the limited spatial extent of physical oiling, effects on these wildlife receptors would likely be limited to a few individuals, rather than larger numbers that would affect the viability of regional populations. Effects on fish and fish habitat, as well as benthic invertebrates and aquatic vegetation would likewise be limited in spatial extent. However, oil spill recovery effects on the overland flowpath and affected areas of Trail Creek would be substantial, likely requiring extensive excavation causing destruction of habitat, followed by reconstruction and habitat restoration. Depending upon the receptor group, this process of restoration and recovery could take anywhere from 18 months to five years.

Trans Mountain Pipeline ULC Volume 7, Pipeline FacilitiesTechnical Reports Trans Mountain Expansion Project Qualitative Ecological Risk Assessment of Pipeline Spills Technical Report
December, 2013 REP-NEB-TERA-00019
Page 6-63
TABLE 6.18 LIKELY ENVIRONMENTAL EFFECTS OF CLWB SPILL DURING WINTER TO THE ATHABASCA RIVER NEAR HINTON, ALBERTA
Athabasca River, Winter Season LIKELY OIL SPILL EFFECTS
Spatial Extent of Effects Effect Magnitude Time to Recovery
Aquatic Receptors
Aquatic Vegetation Aquatic vegetation is not contacted by spilled oil. Low. Aquatic vegetation is not actively growing at the time of the spill, and ice cover prevents contact between the spilled oil and aquatic vegetation. However, oil spill recovery activities result in the physical destruction, and then reconstruction of aquatic habitat in Trail Creek.
Spilled CLWB is prevented from entering, or is recovered from the frozen river surface, without materially affecting aquatic vegetation.
Aquatic Invertebrates Aquatic invertebrates are present in the substrates of Trail Creek and the river. Effects on the benthic community of the tributary are substantial, affecting the entire tributary as a result of oil spill recovery activities. Effects on the benthic community of the river are Low, because most of the spilled oil is recovered.
High although localized in Trail Creek. However, oil spill recovery activities result in the physical destruction, and then reconstruction of aquatic habitat in Trail Creek. Low in the Athabasca River.
Trail Creek is heavily disturbed by clean-up activities in the first year following the oil spill. Recovery of the benthic invertebrate community begins about 18 months after the spill, and is effectively complete after 30 months. Recovery of the benthic community in the Athabasca River is complete within 6 months of the spill.
Fish and Fish Eggs Few fish are present in the tributary, because of winter low flow conditions. Fish are present in the river, and salmonid eggs may be present in pockets of suitable habitat in the river bed downstream from the oil spill location. However, effects on fish and fish eggs are Low, because most of the spilled oil is recovered.
Low, because the fish habitat present in Trail Creek is minimal during the winter because of low flow conditions, and very little oil contacts the river water. However, oil spill recovery activities result in the physical destruction, and then reconstruction of aquatic habitat in Trail Creek.
Trail Creek is heavily disturbed by clean-up activities in the first year following the oil spill. Recovery of fish habitat begins about 18 months after the spill, and is effectively complete after 30 months. Recovery of fish habitat in the Athabasca River is complete within 6 months of the spill.
In-water Amphibians Juvenile amphibians are not present in the winter season. Adult amphibians may be overwintering in the sediments of Trail Creek, which is wholly affected, or in low energy areas of the Athabasca River, which is minimally affected.
Low, because overwintering amphibians will be buried in stream sediments, and are unlikely to be directly contacted by the spilled oil. However, oil spill recovery activities result in the physical destruction, and then reconstruction of aquatic habitat in Trail Creek.
Trail Creek is heavily disturbed by clean-up activities in the first year following the oil spill. Recovery of amphibian habitat begins about 18 months after the spill, and is effectively complete after 30 months. Recovery of amphibian habitat in the Athabasca River is complete within 6 months of the spill.
Terrestrial Receptors
Shoreline and Riparian Vegetation Shoreline and riparian vegetation is oiled along the overland flow path to Trail Creek, and along the creek to the Athabasca River, but annual plants are not present except as seeds, and perennial plants, shrubs and trees are in a dormant state. Little if any shoreline habitat of the Athabasca River is affected.
Low, because the plants are in a dormant state at the time of the spill. However, oil spill recovery activities result in the physical destruction, and then reconstruction of terrestrial habitat near Trail Creek.
The overland flow path and areas around Trail Creek are heavily disturbed by clean-up activities in the first year following the oil spill. Recovery of terrestrial habitat begins about 18 months after the spill, and is effectively complete after about 5 years.
Soil Invertebrates Soils are oiled along the overland flow path to Trail Creek, and along the creek to the Athabasca River, but soil invertebrates are in a dormant state. Little if any shoreline habitat of the Athabasca River is affected.
Low, because the soil invertebrates are in a dormant state at the time of the spill. However, oil spill recovery activities result in the physical destruction, and then reconstruction of terrestrial habitat near Trail Creek.
The overland flow path and areas around Trail Creek are heavily disturbed by clean-up activities in the first year following the oil spill. Recovery of terrestrial habitat begins about 18 months after the spill, and is effectively complete after about 5 years.
Mammals
Grizzly Bear Not likely to be directly affected as they hibernate during winter. Low, because the probability of a grizzly bear den being located within the overland flow path or proximal to Trail Creek is small. However, disturbance caused by oil spill recovery activities could cause an alteration of habitat use during the spring, summer and fall.
The overland flow path and areas around Trail Creek are heavily disturbed by clean-up activities in the first year following the oil spill. Recovery of terrestrial habitat begins about 18 months after the spill, and is effectively complete after about 5 years.
Moose Potentially affected but localized, as Trail Creek could provide sheltering habitat during cold periods. Moose tend to be solitary, so effects of external oiling on more than a few individual animals are unlikely.
Low, because moose have a large home range and oil spill recovery activity would quickly cause them to leave the area. However, disturbance caused by oil spill recovery activities could cause an alteration of habitat use during the spring, summer and fall.
The overland flow path and areas around Trail Creek are heavily disturbed by clean-up activities in the first year following the oil spill. Recovery of terrestrial habitat begins about 18 months after the spill, and is effectively complete after about 5 years.
Muskrat Potentially affected but localized, as the lower reaches of Trail Creek could provide suitable habitat, and muskrat remain active through the winter. However, effects on more than a few individual animals are unlikely.
Localized effects on muskrat could be High, up to and including mortality of individuals inhabiting Trail Creek. Disturbance caused by oil spill recovery activities would also eliminate their habitat.
The overland flow path and areas around Trail Creek are heavily disturbed by clean-up activities in the first year following the oil spill. Recovery of terrestrial and aquatic habitat begins about 18 months after the spill, and is effectively complete after about 5 years.
River Otter Potentially affected but localized, as otters remain active through the winter. Most otter habitat would be present around openings in the river ice, where access to fish is present. Effects on more than a few individual animals are unlikely.
Localized effects on river otter could be High, up to and including mortality of individuals if they occupy a den near Trail Creek or its confluence with the Athabasca River. Disturbance caused by oil spill recovery activities would also eliminate their habitat.
The overland flow path and areas around Trail Creek are heavily disturbed by clean-up activities in the first year following the oil spill. Recovery of terrestrial and aquatic habitat begins about 18 months after the spill, and is effectively complete after about 5 years.
Birds
Bald Eagle Not likely to be affected as the winter range is generally south of the pipeline corridor in Alberta. Low, because of lack of exposure. One to two years, if clean-up activities result in temporary avoidance of habitat use as a result of disturbance.
Canada Goose Not likely to be affected as the winter range is generally south of the pipeline corridor in Alberta. Low, because of lack of exposure. One to two years, if clean-up activities result in temporary avoidance of habitat use as a result of disturbance.
Great Blue Heron Not likely to be affected as the winter range is generally south of the pipeline corridor in Alberta. Low, because of lack of exposure. One to two years, if clean-up activities result in temporary avoidance of habitat use as a result of disturbance.
Mallard Not likely to be affected as the winter range is generally south of the pipeline corridor in Alberta. Low, because of lack of exposure. One to two years, if clean-up activities result in temporary avoidance of habitat use as a result of disturbance.
Spotted Sandpiper Not likely to be affected as the winter range is generally south of the pipeline corridor in Alberta. Low, because of lack of exposure. One to two years, if clean-up activities result in temporary avoidance of habitat use as a result of disturbance.
Tree Swallow Not likely to be affected as the winter range is generally south of the pipeline corridor in Alberta. Low, because of lack of exposure. One to two years, if clean-up activities result in temporary avoidance of habitat use as a result of disturbance.
Reptiles and air-breathing Amphibians
Western painted turtle range is not likely to extend to the Athabasca River. Adult amphibians could potentially be overwintering in the sediments of Trail Creek, which is wholly affected, or in quiescent areas of the Athabasca River, which is minimally affected.
Low, because overwintering amphibians will be buried in stream sediments, and are unlikely to be directly contacted by the spilled oil. However, disturbance caused by oil spill recovery activities would also eliminate their habitat.
Trail Creek is heavily disturbed by clean-up activities in the first year following the oil spill. Recovery of amphibian habitat begins about 18 months after the spill, and is effectively complete after about five years. Recovery of habitat in the Athabasca River is complete within 6 months.

Trans Mountain Pipeline ULC Volume 7, Pipeline Facilities Technical Reports Trans Mountain Expansion Project Qualitative Ecological Risk Assessment of
Pipeline Spills Technical Report
December, 2013 REP-NEB-TERA-00019
Page 6-64
6.4.1.2. Summer Conditions
Under summer season conditions, the spilled CLWB flows overland to the gully, resulting in oiled ground-level vegetation, some absorption of oil on vegetation and the soil litter layer, and some penetration of soil. Most of the spilled CLWB, however, enters Trail Creek and flows rapidly towards the Athabasca River.
Table 6.19 provides an evaluation of the likely spatial extent, magnitude, duration, and reversibility of environmental effects on each ecological receptor group that would be caused by an accidental spill of CLWB near RK 309.0 during summer. The short-term loading of oil to the creek is large (approximately 2,500 m3 over a period of several hours), in comparison with the water flow rate (<0.1 m3/s), and so the aquatic habitat in the tributary is severely affected, and oil overflows the banks of the creek, causing oiling of the riparian habitat. About half of the spilled oil reaches the Athabasca River which is at or near flood stage, entering on the south shoreline, and is advected downstream by the quickly moving water. Because the oil is unweathered, and has low viscosity and density less than that of the water, it spreads across the water surface, and is susceptible to entrainment in the water column due to turbulent flow conditions. Floating oil is trapped along shorelines, in particular where river flow is above the banks and vegetation is flooded. Unweathered oil that is entrained into the water column in the early stages enhances the dissolution of BTEX and other light-end hydrocarbons into the water column. Over time, much of the entrained oil re-surfaces, although some also undergoes interactions with suspended sediment to become neutrally buoyant or denser than the water, resulting in submergence and sinking, respectively. As the oil is transported downstream and weathers, it becomes more viscous and dense. Interactions between floating oil and shoreline sediments result in adhesion of sand and small gravel particles to oil globules, and some of this oil becomes submerged and sinks in quiescent areas such as eddy zones behind islands and in backwaters. Although the water of the Athabasca River is somewhat turbid, the suspended sediment load is not particularly high and the water has no appreciable salinity; thus OMA formation is not a dominant factor in the fate of the spilled oil. Most of the spilled oil has weathered, largely due to evaporation, and stranded along shoreline and in riparian zones within 35 to 50 km of the spill location. A small amount of oil is advected farther downstream as dissolved and entrained oil droplets, or as OMA that moves with bedload until becoming deposited in quiescent areas, potentially up to 100 km downstream.
6.4.1.3. Spring or Fall Conditions
Under spring and fall conditions, the spilled CLWB flows overland to the gully, resulting in oiled ground-level vegetation, some absorption of oil on vegetation and the soil litter layer, and some penetration of soil. Most of the spilled CLWB, however, enters Trail Creek and flows rapidly towards the Athabasca River.
Table 6.20 provides an evaluation of the likely spatial extent, magnitude, duration, and reversibility of environmental effects on each ecological receptor group that would be caused by an accidental spill of CLWB near RK 309.0 during spring or fall. The short-term loading of oil to Trail Creek is large (approximately 2,500 m3 over a period of several hours), in comparison with the water flow rate (<0.1 m3/s), and so the aquatic habitat in the tributary is severely affected, and oil overflows the banks of Trail Creek, causing oiling of the riparian habitat. About half of the spilled oil reaches the Athabasca River which is flowing normally, within its banks. The oil enters the river on the south shoreline, and is advected downstream by the moving water. Because the oil is unweathered, and has low viscosity and density less than that of the water, it spreads across the water surface. Floating oil is trapped along shorelines, particularly on gravel and cobble exposures, but does not penetrate these deeply due to the shallow slope of the shorelines and the presence of the water table at or near the surface. In the spring, water levels are generally rising with the onset of freshet, so stranded oil is likely to be re-floated and/or dispersed. In the fall, water levels are generally falling, so stranded oils is likely to remain stranded and continue weathering until winder, unless recovered by oil spill clean-up crews. The river flow is slower and less turbulent in spring and fall than under summer conditions, and owing to the cooler temperatures, the turbulence of the river flow is less likely to entrain droplets of the oil in the water. As a result, the concentrations of BTEX and other light-end hydrocarbons in the water column are lower, but the surface

Trans Mountain Pipeline ULC Volume 7, Pipeline Facilities Technical Reports Trans Mountain Expansion Project Qualitative Ecological Risk Assessment of
Pipeline Spills Technical Report
December, 2013 REP-NEB-TERA-00019
Page 6-65
slick tends to be thicker. As the oil is transported downstream and weathers, it becomes more viscous and dense. Interactions between floating oil and shoreline sediments result in adhesion of sand and small gravel particles to oil globules, and some of the oil becomes submerged and/or sinks in quiescent areas such as eddy zones behind islands and in backwaters. Although the water of the Athabasca River is somewhat turbid, the suspended sediment load is not particularly high, little oil is entrained in the water column, and the water has no appreciable salinity; thus OMA formation is not an important factor in the fate of the spilled oil. Most of the spilled oil has weathered, largely due to evaporation, or stranded along shoreline within 25 km of the spill location. A small amount of oil is advected farther downstream.
6.4.1.4. Environmental Effects Summary for Spill Scenarios at RK 309.0
A hypothetical spill scenario has been developed to describe the likely fate and behaviour of CLWB spilled as a result of a pipeline rupture near RK 309.0. Potential environmental effects likely to accrue to ecological receptors as a result of such hypothetical spills have been outlined in Table 6.18 through Table 6.20.
For Trail Creek and the Athabasca River in winter (Table 6.18), snow and ice conditions are likely to be such that much of the spilled CLWB is held up before reaching the river, and the presence of ice on the river prevents a large amount of oil from entering the water. Under these circumstances, the environmental effects of spilled oil may be minimized, because most of the oil is recoverable. Oil spill recovery efforts would still result in environmental effects along the overland flowpath, and in Trail Creek, but effects on the Athabasca River would be reduced or avoided. Many of the relevant ecological receptors would be dormant (e.g., plants, amphibians, reptiles, and mammals that hibernate) or absent (e.g., migratory birds). The spatial extent of oil spill effects would therefore be limited to the overland flowpath, and the lower portion of Trail Creek, on the order of several hundred metres, where the primary environmental effects would be those associated with oil spill recovery efforts. Recovery of the terrestrial environment and Trail Creek would take approximately 18 months to five years, assuming that the spill occurs in January, and physical works associated with oil spill recovery are ongoing through until the late summer.
For Trail Creek and the Athabasca River in summer (Table 6.19), flows in Trail Creek are seasonally low, but flow in the Athabasca River is peaking, due to snow melt in its mountain headwaters. Most of the spilled oil reaches and is rapidly advected downstream in the Athabasca River. Effect magnitude on the overland flowpath and riparian areas of Trail Creek is high but localized, and is addressed by physical remediation and re-seeding of affected areas. Effects on aquatic receptors, including vegetation, invertebrates, fish and amphibians, are high but localized in Trail Creek, and generally medium to low in the Athabasca River. Medium effects are observed within the first 10 km downstream from Trail Creek, and low magnitude effects are observed between 10 and 35 to 50 km downstream. Most of this oil becomes stranded along shorelines, and in riparian areas where vegetation is oiled. Effects on shoreline and riparian vegetation and soil invertebrates are high on the overland flowpath and along Trail Creek, but medium to low along the Athabasca River due to the patchy distribution of the oil. Whereas the overland flowpath and Trail Creek are subject to intensive oil spill clean-up which is initially destructive to habitat, areas riparian to the Athabasca River are remediated with less intrusive methods, and a greater emphasis on natural attenuation of spilled oil residues at low levels. Environmental effects on mammal populations are greatest for truly semi-aquatic species such as muskrat, beaver, otter and mink, for which it is assumed that mortality could occur throughout a river reach of up to 50 km. For mammals that are larger or that are less adapted to the aquatic environment, such as bears, raccoons and moose, effects are expected to be medium, and may arise from disturbance of habitat, as well as from oiling of fur, or ingestion of crude oil. For birds, guilds such as ducks and geese are considered to be most exposed to spilled oil, and effects on these species could be high (including mortality) to medium, including reproductive effects caused by transfer of oil to eggs, with resulting egg mortality, or effects on habitat quality caused by disturbance arising from oil spill response efforts. Other species, such as raptors, wading birds, shorebirds, and swallows could experience medium effect magnitudes, reflecting both oil exposure and disturbance of habitat following the oil spill. Recovery times for spills in the summer could be as short as 12 months for some receptors, or up to five years where effects occur at the population level.

Trans Mountain Pipeline ULC Volume 7, Pipeline Facilities Technical Reports Trans Mountain Expansion Project Qualitative Ecological Risk Assessment of
Pipeline Spills Technical Report
December, 2013 REP-NEB-TERA-00019
Page 6-66
TABLE 6.19 LIKELY ENVIRONMENTAL EFFECTS OF CLWB SPILL DURING SUMMER TO THE ATHABASCA RIVER NEAR HINTON, ALBERTA
Athabasca River, Summer Season LIKELY OIL SPILL EFFECTS
Spatial Extent Magnitude Time to Recovery
Aquatic Receptors
Aquatic Vegetation Submerged, floating and emergent aquatic vegetation in Trail Creek is likely to be killed by the flow of oil at the time of the spill, or by oil spill recovery efforts following the spill. Very little aquatic vegetation is present in the Athabasca River because of the high summer flows and cobble-gravel nature of most of the river bed. Effects are therefore likely to be limited to Trail Creek.
High in Trail Creek, as a result of clean-up activities which would result in the physical destruction, and then reconstruction of aquatic habitat. Low in the Athabasca River, because of the scarcity of aquatic vegetation generally.
Trail Creek is heavily disturbed by clean-up activities in the first year following the oil spill. Recovery of the aquatic plant community begins about 12 months after the spill, and is effectively complete after 5 years. Recovery of the aquatic plant community in the Athabasca River is complete within one year of the spill.
Aquatic Invertebrates Aquatic invertebrates are present in the substrates of Trail Creek and the river. Effects on the benthic community of the creek are substantial, affecting the entire creek as a result of oil spill recovery activities. Effects on the benthic community of the river range from moderate, as more sensitive species are killed by direct contact with oil droplets or by dissolved hydrocarbon concentrations near the confluence with the tributary, to Low, in downstream areas.
High in Trail Creek, with direct effects of oiling and hydrocarbon exposure as well as oil spill recovery activities resulting in the physical destruction, and then reconstruction of aquatic habitat in the creek. Medium to Low in the Athabasca River, depending upon exposure to dissolved hydrocarbons and oil droplets in the water column. Effects on the benthic community would be patchy, reflecting the hydrology of the river. Areas of oil accumulation in sediment would be most affected.
Trail Creek is heavily disturbed by clean-up activities in the first year following the oil spill. Recovery of the benthic invertebrate community begins about 12 months after the spill, and is effectively complete after 2 years. Recovery of the benthic community in the river is largely complete within 12 months of the spill, although isolated areas such as eddies and backwaters, where silty sediments potentially trap sunken oil, would take longer to recover fully.
Fish and Fish Eggs The lower reaches of Trail Creek may provide rearing habitat for various fish species, and such fish would likely be killed as a result of high dissolved hydrocarbon concentrations at the time of the spill. Turbulent flow in the Athabasca River further enhances dispersion and dissolution of hydrocarbons in the reaches below the confluence, so that fish mortality is likely within 10 km of the spill location, but unlikely with increasing distance.
High in Trail Creek, because of the confined nature of the habitat and the lack of dilution water, as well as the physical effects of oil spill clean-up on fish habitat in the tributary. Medium in the first 10 km of the river, and Low in more distant reaches, because of the rapid weathering of oil. The high summer flow of the river also provides abundant dilution water, which limits the dissolved concentrations.
Trail Creek is heavily disturbed by clean-up activities in the first year following the oil spill. Recovery of fish habitat begins about 12 months after the spill, and is effectively complete after 2 years. Recovery of fish habitat in the Athabasca River is complete within 12 months of the spill.
In-water Amphibians Both adult and juvenile amphibians are likely present in Trail Creek during the summer season, and could be killed. Adult amphibians in shoreline habitat as well as in quiescent areas of the Athabasca River could be killed if contacted by oil, or by exposure to dissolved hydrocarbons at high enough concentration, likely within the first 10 km, but potentially up to 35 to 50 km downstream.
High in Trail Creek, which likely provides good breeding and rearing habitat for amphibians. High in shoreline habitat of the Athabasca River within 10 km of the spill site, and Medium in areas up to 35 to 50 km downstream, because of the more patchy spatial distribution of stranded oil, and decreased dissolved hydrocarbon concentrations.
Trail Creek is heavily disturbed by clean-up activities in the first year following the oil spill. Recovery of amphibian habitat begins about 12 months after the spill, and is effectively complete after 2 years. Recovery of amphibian habitat in the Athabasca River is complete within 12 months of the spill.
Terrestrial Receptors
Shoreline and Riparian Vegetation Shoreline and riparian vegetation is oiled along the overland flow path to Trail Creek, and along the creek to the Athabasca River. Actively growing annual and perennial ground level vegetation is killed, but shrubs and trees are not. Similar effects are observed in the riparian areas of the Athabasca River, where high river flows cause flooding and terrestrial vegetation is contacted by oil.
High on the overland flow path and in Trail Creek, as a result of direct effects of oil on vegetation, and as a result of oil spill recovery efforts which result in physical destruction of habitat. Medium to Low in the riparian areas of the Athabasca River, because of the patchy distribution of oil, and with increasing distance from the spill site. In these areas, most oil spill recovery efforts have Low magnitude effect on habitat quality because of efforts to avoid physical damage to habitat, and to allow natural attenuation after recovery of visible oil.
The overland flow path and areas around Trail Creek are heavily disturbed by clean-up activities in the first year following the oil spill. Recovery of terrestrial habitat begins about 12 months after the spill, and is effectively complete after about 5 years. Natural attenuation in the riparian areas of the Athabasca River requires about two years, once visible oil has been recovered.
Soil Invertebrates Soils are oiled along the overland flow path to Trail Creek, and along the creek to the river. Oiling and oil spill recovery efforts result in the destruction of the soil invertebrate community in these areas. Effects on soil invertebrates are lower in riparian zones of the Athabasca River, in part because of the patchy nature of deposition. The heaviest oiling is noted in the first 10 km downstream from the spill location, but some oiling of riparian areas is observed as far as 35 to 50 km downstream.
High on the overland flow path and in Trail Creek, as a result of direct effects of oil on soil invertebrates, and as a result of oil spill recovery efforts which result in physical destruction of habitat. Medium to Low in the riparian areas of the Athabasca River, because of the patchy distribution of oil, and with increasing distance from the spill site. In these areas, most oil spill recovery efforts have Low magnitude effect on habitat quality because of efforts to avoid physical damage to habitat, and to allow natural attenuation after recovery of visible oil.
The overland flow path and areas around Trail Creek are heavily disturbed by clean-up activities in the first year following the oil spill. Recovery of terrestrial habitat begins about 12 months after the spill, and is effectively complete after about 5 years. Natural attenuation in the riparian areas of the Athabasca River requires about two years, once visible oil has been recovered.
Mammals
Grizzly Bear Oiling of individual bears could occur if they forage within Trail Creek, or along the shoreline of the Athabasca River up to 35 to 50 km downstream from the spill location in the days and weeks following the spill.
Medium. Partial oiling of the fur of a grizzly bear during summer is not likely to result in a breakdown of thermoregulation. Ingestion of slightly to highly weathered oil following grooming activity may cause temporary irritation of the digestive system, but is not likely to cause death.
The overland flow path and areas around Trail Creek are heavily disturbed by clean-up activities in the first year following the oil spill. Recovery of terrestrial habitat begins about 12 months after the spill, and is effectively complete after about 5 years. Oil spill response activities could have the beneficial side effect of “hazing” affected areas, temporarily reducing utilization of this habitat by bears.
Moose Oiling of individual moose could occur if they forage within Trail Creek, or along the shoreline of the Athabasca River up to 35 to 50 km downstream from the spill location in the days and weeks following the spill.
Medium. Partial oiling of the fur of a moose during summer is not likely to result in a breakdown of thermoregulation. Ingestion of slightly to highly weathered oil with vegetation or as a result of grooming activity may cause temporary irritation of the digestive system, but is not likely to cause death.
The overland flow path and areas around Trail Creek are heavily disturbed by clean-up activities in the first year following the oil spill. Recovery of terrestrial habitat begins about 12 months after the spill, and is effectively complete after about 5 years. Oil spill response activities could have the beneficial side effect of “hazing” affected areas, temporarily reducing utilization of this habitat by moose.
Muskrat Any muskrat present in Trail Creek are likely to be killed by direct contact with spilled oil, or inhalation of vapours at the water surface. Muskrat present in the Athabasca River are also likely to become oiled and die throughout the affected reach of 35 to 50 km.
Effects on muskrat would be High, including mortality of individuals inhabiting Trail Creek and up to 35 to 50 km downstream in the river. Disturbance caused by oil spill recovery activities would also eliminate their habitat in Trail Creek.
Areas around Trail Creek are heavily disturbed by clean-up activities in the first year following the oil spill. Recovery of terrestrial and aquatic habitat begins about 12 months after the spill, and is effectively complete after about 5 years. Muskrat populations recover as a result of re-colonization of affected areas from adjacent unaffected areas, likely within 5 years.
River Otter Any otters present in Trail Creek are likely to be killed by direct contact with spilled oil, or inhalation of vapours at the water surface. Otters present in the Athabasca River are also likely to become oiled and die throughout the affected reach of 35 to 50 km.
Effects on otter would be High, including mortality of individuals inhabiting Trail Creek and up to 35 to 50 km downstream in the river. Disturbance caused by oil spill recovery activities would also eliminate their habitat in Trail Creek.
Areas around Trail Creek are heavily disturbed by clean-up activities in the first year following the oil spill. Recovery of terrestrial and aquatic habitat begins about 12 months after the spill, and is effectively complete after about 5 years. Otter populations recover as a result of re-colonization of affected areas from adjacent unaffected areas, likely within 5 to 10 years.
Birds
Bald Eagle Bald eagle would be present during summer, and would likely contact spilled oil while taking fish at the water surface, or as a result of feeding on fish killed by the oil spill. These birds would be partially oiled, and would be further exposed to oil while preening to remove oil from feathers. Such effects could be seen up to 35 to 50 km downstream from the spill location.
Medium. Neither partial oiling of feathers nor incidental oil ingestion is likely to be sufficient to kill exposed bald eagles, but oiled birds may transfer oil to eggs, killing the embryos and resulting in reduced reproductive success. Clean-up activities could also lead to nest abandonment if nest locations are close to areas of high activity.
One year for physical effects of oil exposure, and one to two years for effects on habitat utilization, if clean-up activities result in temporary avoidance of habitat as a result of disturbance.
Canada Goose Nesting geese or other waterfowl could be exposed to oiling in riparian habitat up to 35 to 50 km downstream from the spill location.
High to Medium, depending upon the level of exposure to floating oil, or stranded oil in riparian habitat. Oiled birds could also transfer oil to eggs, resulting in embryo mortality. Clean-up activities could also lead to nest abandonment if nest locations are close to areas of high activity.
One year for physical effects of oil exposure, and one to two years for effects on habitat utilization, if clean-up activities result in temporary avoidance of habitat as a result of disturbance.
Great Blue Heron Herons and other wading birds could be exposed to oiling in shallow water or riparian habitat up to 35 to 50 km downstream from the spill location.
Medium. Neither partial oiling of feathers nor incidental oil ingestion is likely to be sufficient to kill exposed birds, but oiled birds may transfer oil to eggs, killing the embryos and resulting in reduced reproductive success. Clean-up activities could also lead to nest abandonment if nest locations are close to areas of high activity.
One year for physical effects of oil exposure, and one to two years for effects on habitat utilization, if clean-up activities result in temporary avoidance of habitat as a result of disturbance.
Mallard Nesting mallards or other waterfowl could be exposed to oiling in riparian habitat up to 35 to 50 km downstream from the spill location.
High to Medium, depending upon the level of exposure to floating oil, or stranded oil in riparian habitat. High mortality is likely to be observed in oiled ducks. Surviving lightly oiled birds could also transfer oil to eggs, resulting in embryo mortality. Clean-up activities could also lead to nest abandonment if nest locations are close to areas of high activity.
One year for physical effects of oil exposure, and one to two years for effects on habitat utilization, if clean-up activities result in temporary avoidance of habitat as a result of disturbance.

Trans Mountain Pipeline ULC Volume 7, Pipeline Facilities Technical Reports Trans Mountain Expansion Project Qualitative Ecological Risk Assessment of
Pipeline Spills Technical Report
December, 2013 REP-NEB-TERA-00019
Page 6-67
TABLE 6.19 LIKELY ENVIRONMENTAL EFFECTS OF CLWB SPILL DURING SUMMER TO THE ATHABASCA RIVER NEAR HINTON, ALBERTA
Athabasca River, Summer Season LIKELY OIL SPILL EFFECTS
Spatial Extent Magnitude Time to Recovery
Spotted Sandpiper Sandpipers and other shorebirds could be exposed to oiling in shallow water or riparian habitat up to 35 to 50 km downstream from the spill location.
Medium. Neither partial oiling of feathers nor incidental oil ingestion is likely to be sufficient to kill exposed birds, but oiled birds may transfer oil to eggs, killing the embryos and resulting in reduced reproductive success. Clean-up activities could also lead to nest abandonment if nest locations are close to areas of high activity.
One year for physical effects of oil exposure, and one to two years for effects on habitat utilization, if clean-up activities result in temporary avoidance of habitat as a result of disturbance.
Tree Swallow Tree swallows nest in cavities in trees located near the water, and forage over water. Tree swallows may also dip onto the water take emerging insects or drink, or bathe in shallow water pools. These birds could be affected up to 35 to 50 km from the spill location.
Medium. Neither partial oiling of feathers nor incidental oil ingestion is likely to be sufficient to kill exposed birds, but oiled birds may transfer oil to eggs, killing the embryos and resulting in reduced reproductive success. Clean-up activities could also lead to nest abandonment if nest locations are close to areas of high activity.
One to two years, if clean-up activities result in temporary avoidance of habitat use as a result of disturbance.
Reptiles and air-breathing Amphibians
Adult amphibians could be present in Trail Creek, or in riparian habitat or backwater areas along the Athabasca River. Such animals could be exposed to spilled oil for a distance of up to 35 to 50 km from the spill location.
High to Medium. Amphibians present in Trail Creek could be smothered by spilled oil or die from exposure to volatile hydrocarbons. Amphibians along the shoreline of the Athabasca River would be less exposed, and effect magnitude would decline with decreasing exposure. The risk of acute lethality would be greatest in the first 10 km downstream from Trail Creek.
Trail Creek is heavily disturbed by clean-up activities in the first year following the oil spill. Recovery of amphibian habitat begins about 12 months after the spill, and is effectively complete after 24 months. Recovery of habitat in the Athabasca River is complete within 12 months of the spill.

Trans Mountain Pipeline ULC Volume 7, Pipeline Facilities Technical Reports Trans Mountain Expansion Project Qualitative Ecological Risk Assessment of
Pipeline Spills Technical Report
December, 2013 REP-NEB-TERA-00019
Page 6-68
TABLE 6.20 LIKELY ENVIRONMENTAL EFFECTS OF CLWB SPILL DURING SPRING OR FALL TO THE ATHABASCA RIVER NEAR HINTON, ALBERTA
Athabasca River, Spring and Fall Season
LIKELY OIL SPILL EFFECTS
Spatial Extent Magnitude Time to Recovery
Aquatic Receptors
Aquatic Vegetation Submerged, floating and emergent aquatic vegetation in Trail Creek is likely to be killed by the flow of oil at the time of the spill, or by subsequent oil spill recovery efforts. Very little aquatic vegetation is present in the Athabasca River, because of the high summer flows and cobble-gravel nature of most of the river bed. Effects are therefore likely to be limited to Trail Creek.
High in the creek, because clean-up activities would result in the physical destruction and subsequent reconstruction of aquatic habitat. Low in the Athabasca River, because of the general scarcity of aquatic vegetation.
Trail Creek is heavily disturbed by clean-up activities in the first year following the oil spill. Recovery of the aquatic plant community begins about 12 months after the spill, and is effectively complete after 5 years. Recovery of the aquatic plant community in the Athabasca River is complete within one year of the spill.
Aquatic Invertebrates Aquatic invertebrates are present in the substrates of Trail Creek and the river. Effects on the benthic community of the tributary are substantial, affecting the entire creek as a result of oil spill recovery activities. Effects on the benthic community of the river range from moderate, as more sensitive species are killed by direct contact with oil droplets or by dissolved hydrocarbon concentrations near the confluence with the creek, to Low, in downstream areas.
High in Trail Creek, with direct effects of oiling and hydrocarbon exposure as well as oil spill recovery activities resulting in the physical destruction, and then reconstruction of aquatic habitat in the creek. Medium to Low in the Athabasca River, depending upon exposure to dissolved hydrocarbons and oil droplets in the water column. Effects on the benthic community would be patchy, reflecting the hydrology of the river. Areas of oil accumulation in sediment would be most affected.
Trail Creek is heavily disturbed by clean-up activities in the first year following the oil spill. Recovery of the benthic invertebrate community begins about 12 months after the spill, and is effectively complete after 2 years. Recovery of the benthic community in the river is largely complete within 12 months of the spill, although isolated areas such as eddies and backwaters, where silty sediments potentially trap sunken oil, would take longer.
Fish and Fish Eggs The lower reaches of Trail Creek may provide spawning habitat for various fish species, with most species spawning either in the spring or the fall. Such fish, and their eggs and larvae, would likely be killed as a result of high dissolved hydrocarbon concentrations during the spill. Flow in the Athabasca River is less turbulent than in the summer, but the lower flow also reduces the dilution potential. Fish mortality, as well as effects on eggs in spawning habitat, is likely to occur within 10 km of the spill location.
High in Trail Creek, because of the confined nature of the habitat and the lack of dilution water, as well as the physical effects of oil spill clean-up on fish habitat in the tributary. Moderate in the first 10 km of the Athabasca River, and Low in more distant reaches of the river, because of weathering of oil which causes more water soluble fractions to evaporate.
Trail Creek is heavily disturbed by clean-up activities in the first year following the oil spill. Recovery of fish habitat begins about 12 months after the spill, and is effectively complete after 2 years. Recovery of fish habitat in the Athabasca River is complete within 12 months of the spill.
In-water Amphibians Both adult amphibians and their eggs or larvae are likely present in Trail Creek during the spring season, and would be killed. Adults and juveniles could be present in the fall. Amphibians in shoreline habitat, as well as in quiescent areas of the Athabasca River, could be killed if contacted by oil, or by exposure to dissolved hydrocarbons at high enough concentration.
High in Trail Creek, which likely provides good breeding and rearing habitat for amphibians. Moderate in shoreline habitat of the Athabasca River within 10 km of the spill site, and Low in areas between 10 and 25 km downstream, because of the limited contact of oil with riparian habitat.
Trail Creek is heavily disturbed by clean-up activities in the first year following the oil spill. Recovery of amphibian habitat begins about 12 months after the spill, and is effectively complete after 2 years. Recovery of amphibian habitat in the Athabasca River is complete within 12 months of the spill.
Terrestrial Receptors
Shoreline and Riparian Vegetation Shoreline and riparian vegetation is oiled along the overland flow path to Trail Creek, and along the creek to the Athabasca River. Actively growing annual and perennial ground level vegetation is killed, but shrubs and trees are not. Lesser effects are observed in the riparian areas of the river, because flow is within the banks, and oil contact with the riparian areas is minimal.
High along the overland flow path and in Trail Creek, because of direct effects of oil on vegetation, and because of oil spill recovery efforts which result in physical destruction of habitat. Low in the riparian areas of the Athabasca River, because of minimal contact between spilled oil and riparian habitat.
The overland flow path and areas around Trail Creek are heavily disturbed by clean-up activities in the first year following the oil spill. Recovery of terrestrial habitat begins about 12 months after the spill, and is effectively complete after about 5 years. Natural attenuation in the shoreline areas of the Athabasca River requires about one year, once visible oil has been recovered.
Soil Invertebrates Soils are oiled along the overland flow path to Trail Creek, and along the creek to the Athabasca River. Oiling and oil spill recovery efforts result in the destruction of the soil invertebrate community in these areas. Lesser effects are observed in the riparian areas of the Athabasca River, because flow is within the banks of the river, and oil contact with the riparian areas is minimal.
High along the overland flow path and in Trail Creek, because of direct effects of oil on soil invertebrates, and because of oil spill recovery efforts which result in physical destruction of habitat. Low in the riparian areas of the Athabasca River, because of minimal contact between spilled oil and riparian habitat.
The overland flow path and areas around Trail Creek are heavily disturbed by clean-up activities in the first year following the oil spill. Recovery of terrestrial habitat begins about 12 months after the spill, and is effectively complete after about 5 years. Natural attenuation in the shoreline areas of the Athabasca River requires about one years, once visible oil has been recovered.
Mammals
Grizzly Bear Oiling of individual bears could occur if they forage within Trail Creek, or along the shoreline of the Athabasca River up to 25 km downstream from the spill location in the days and weeks following the spill.
Medium. Partial oiling of the fur of a grizzly bear during spring or fall is not likely to result in a breakdown of thermoregulation. Ingestion of slightly to highly weathered oil following grooming activity may cause temporary irritation of the digestive system, but is not likely to cause death.
The overland flow path and areas around Trail Creek are heavily disturbed by clean-up activities in the first year following the oil spill. Recovery of terrestrial habitat begins about 12 months after the spill, and is effectively complete after about 5 years. Oil spill response activities could have the beneficial side effect of “hazing” affected areas, temporarily reducing utilization of this habitat by bears.
Moose Oiling of individual moose could occur if they forage within Trail Creek, or along the shoreline of the Athabasca River up to 25 km downstream from the spill location in the days and weeks following the spill.
Medium. Partial oiling of the fur of a moose during spring or fall is not likely to result in a breakdown of thermoregulation. Ingestion of slightly to highly weathered oil following grooming activity may cause temporary irritation of the digestive system, but is not likely to cause death.
The overland flow path and areas around Trail Creek are heavily disturbed by clean-up activities in the first year following the oil spill. Recovery of terrestrial habitat begins about 12 months after the spill, and is effectively complete after about 5 years. Oil spill response activities could have the beneficial side effect of “hazing” affected areas, temporarily reducing utilization of this habitat by moose.
Muskrat Any muskrat present in Trail Creek are likely to be killed by direct contact with spilled oil, or inhalation of vapours at the water surface. Muskrat present in the Athabasca River are also likely to become oiled and die throughout the affected reach of 25 km.
Effects on muskrat would be High, including mortality of individuals inhabiting Trail Creek and up to 25 km downstream. Disturbance caused by oil spill recovery activities would also eliminate their habitat in Trail Creek.
Areas around Trail Creek are heavily disturbed by clean-up activities in the first year following the oil spill. Recovery of terrestrial and aquatic habitat begins about 12 months after the spill, and is effectively complete after about 5 years. Muskrat populations recover as a result of recolonization of affected areas from adjacent unaffected areas.
River Otter Any otters present in Trail Creek are likely to be killed by direct contact with spilled oil, or inhalation of vapours at the water surface. Otters present in the Athabasca River are also likely to become oiled and die throughout the affected reach of 25 km.
Effects on otter would be High, including mortality of individuals inhabiting Trail Creek and up to 25 km downstream. Disturbance caused by oil spill recovery activities would also eliminate their habitat in Trail Creek.
Areas around Trail Creek are heavily disturbed by clean-up activities in the first year following the oil spill. Recovery of terrestrial and aquatic habitat begins about 12 months after the spill, and is effectively complete after about 5 years. Otter populations recover as a result of recolonization of affected areas from adjacent unaffected areas.
Birds
Bald Eagle Bald eagle would be present during spring and fall, and would likely contact spilled oil while taking fish at the water surface, or as a result of feeding on fish killed by the oil spill. These birds would be partially oiled, and would be further exposed to oil while preening to remove oil from feathers. Such effects could be seen up to 25 km downstream from the spill location.
Medium. Neither partial oiling of feathers nor incidental oil ingestion is likely to be sufficient to kill exposed bald eagles, but oiled birds may transfer oil to eggs during the spring, killing the embryos and resulting in reduced reproductive success. Clean-up activities could also lead to nest abandonment if nest locations are close to areas of high activity.
One year for physical effects of oil exposure, and one to two years for effects on habitat utilization, if clean-up activities result in temporary avoidance of habitat as a result of disturbance.
Canada Goose Nesting geese or other waterfowl could be exposed to oiling in riparian habitat up to 25 km downstream from the spill location.
High to Medium, depending upon the level of exposure to floating oil, or stranded oil in riparian habitat. Oiled birds could also transfer oil to eggs during the spring, resulting in embryo mortality. Clean-up activities could also lead to nest abandonment if nest locations are close to areas of high activity.
One year for physical effects of oil exposure, and one to two years for effects on habitat utilization, if clean-up activities result in temporary avoidance of habitat as a result of disturbance.
Great Blue Heron Herons and other wading birds could be exposed to oiling in shallow water or riparian habitat up to 25 km downstream from the spill location.
Medium. Neither partial oiling of feathers nor incidental oil ingestion is likely to be sufficient to kill exposed birds, but oiled birds may transfer oil to eggs during the spring, killing the embryos and resulting in reduced reproductive success. Clean-up activities could also lead to nest abandonment if nest locations are close to areas of high activity.
One year for physical effects of oil exposure, and one to two years for effects on habitat utilization, if clean-up activities result in temporary avoidance of habitat as a result of disturbance.
Mallard Nesting mallards or other waterfowl could be exposed to oiling in riparian habitat up to 25 km downstream from the spill location.
High to Medium, depending upon the level of exposure to floating oil, or stranded oil in riparian habitat. High mortality is likely to be observed in oiled ducks. Surviving lightly oiled birds could also transfer oil to eggs during the spring, resulting in embryo mortality. Clean-up activities could also lead to nest abandonment if nest locations are close to areas of high activity.
One year for physical effects of oil exposure, and one to two years for effects on habitat utilization, if clean-up activities result in temporary avoidance of habitat as a result of disturbance.

Trans Mountain Pipeline ULC Volume 7, Pipeline Facilities Technical Reports Trans Mountain Expansion Project Qualitative Ecological Risk Assessment of
Pipeline Spills Technical Report
December, 2013 REP-NEB-TERA-00019
Page 6-69
TABLE 6.20 LIKELY ENVIRONMENTAL EFFECTS OF CLWB SPILL DURING SPRING OR FALL TO THE ATHABASCA RIVER NEAR HINTON, ALBERTA
Athabasca River, Spring and Fall Season
LIKELY OIL SPILL EFFECTS
Spatial Extent Magnitude Time to Recovery
Spotted Sandpiper Sandpipers and other shorebirds could be exposed to oiling in shallow water or riparian habitat up to 25 km downstream from the spill location.
Medium. Neither partial oiling of feathers nor incidental oil ingestion is likely to be sufficient to kill exposed birds, but oiled birds may transfer oil to eggs during the spring, killing the embryos and resulting in reduced reproductive success. Clean-up activities could also lead to nest abandonment if nest locations are close to areas of high activity.
One year for physical effects of oil exposure, and one to two years for effects on habitat utilization, if clean-up activities result in temporary avoidance of habitat as a result of disturbance.
Tree Swallow Tree swallows nest in cavities in trees located near the water, and forage over water. Tree swallows may also dip onto the water take emerging insects or drink, or bathe in shallow water pools. These birds could be affected up to 25 km from the spill location.
Medium. Neither partial oiling of feathers nor incidental oil ingestion is likely to be sufficient to kill exposed birds, but oiled birds may transfer oil to eggs, killing the embryos and resulting in reduced reproductive success. Clean-up activities could also lead to nest abandonment if nest locations are close to areas of high activity.
One to two years, if clean-up activities result in temporary avoidance of habitat use as a result of disturbance.
Reptiles and air-breathing Amphibians
Adult amphibians could be present in Trail Creek, or in riparian habitat or backwater areas along the Athabasca River. Such animals could be exposed to spilled oil for a distance of up to 25 km from the spill location.
High to Medium. Amphibians present in Trail Creek could be smothered by spilled oil, or die from exposure to volatile hydrocarbons. Amphibians along the shorelines of the Athabasca River would be less exposed, and effect magnitude would decline with decreasing exposure. The risk of mortality would be greatest in the first 10 km downstream from Trail Creek.
Trail Creek is heavily disturbed by clean-up activities in the first year following the oil spill. Recovery of amphibian habitat begins about 12 months after the spill, and is effectively complete after 24 months. Recovery of habitat in the Athabasca River is complete within 12 months of the spill.

Trans Mountain Pipeline ULC Volume 7, Pipeline Facilities Technical Reports Trans Mountain Expansion Project Qualitative Ecological Risk Assessment of
Pipeline Spills Technical Report
December, 2013 REP-NEB-TERA-00019
Page 6-70
For Trail Creek and the Athabasca River in spring and fall (Table 6.20), flows in Trail Creek are potentially high, but flow in the Athabasca River is at an intermediate level, typically rising in the spring due to the onset of freshet, or falling in the fall, as freshet recedes. Most of the spilled oil reaches and is advected downstream in the Athabasca River. Effect magnitude on the overland flowpath and riparian areas of Trail Creek is high but localized, and is addressed by physical remediation and re-seeding of affected areas. Effects on aquatic receptors, including vegetation, invertebrates, fish and amphibians, are high but localized in Trail Creek, and generally medium to low in the Athabasca River. Medium effects are observed within the first 10 km downstream from Trail Creek, and low magnitude effects are observed between 10 and 25 km downstream. Most of the oil becomes stranded along shorelines, but there is little contact with riparian areas due to the moderate water level in the river. Effects on shoreline and riparian vegetation and soil invertebrates are high on the overland flowpath and along Trail Creek, but low along the Athabasca River due to the low level of exposure. The overland flowpath and Trail Creek are subject to intensive oil spill clean-up which is initially destructive to habitat. Environmental effects on mammal populations are greatest for truly semi-aquatic species such as muskrat, beaver, otter and mink, for which it is assumed that mortality could occur throughout a river reach of up to 25 km. For mammals that are larger or that are less adapted to the aquatic environment, such as bears, raccoons and moose, effects are expected to be medium, and may arise from disturbance of habitat, as well as from oiling of fur, or ingestion of crude oil. For birds, guilds such as ducks and geese are considered to be most exposed to spilled oil, and effects on these species could be high (including mortality) to medium, including reproductive effects caused by transfer of oil to eggs in spring, with resulting egg mortality, or effects on habitat quality caused by disturbance arising from oil spill response efforts. Other species, such as raptors, wading birds, shorebirds, and swallows could experience medium effect magnitudes, reflecting both oil exposure and disturbance of habitat following the oil spill. Recovery times for spills in the spring and fall could be as short as 12 months for some receptors, or up to five years where effects occur at the population level.
6.4.2. North Thompson River near Darfield, British Columbia at RK 766.0
The hypothetical spill scenario involves a release of 1,400 m3 of CLWB at RK 766.0. Details of the local environment can be found in Section 6.1.2.2. Like the Athabasca River, the North Thompson River has a flow regime that is driven by glacial meltwater, with a strong mid-summer freshet. However, the North Thompson River experiences considerably higher summer flows than the Athabasca River, while having lower average gradient. The hypothetical spill location is within approximately 120 m of the river bank, just west and upgradient of the Southern Yellowhead Highway. Overland flow would cause oil to move towards the highway and potentially along a roadside ditch until encountering a culvert that would allow passage beneath the highway. Emerging on the east side of the highway, the oil would follow local drainage pathways to the river. Some holdup of spilled oil in pools and low areas between the spill site and the river is possible, but the overall proximity is such that most of the spilled oil (i.e., 1,000 m3 or greater) is assumed to reach the river. The North Thompson River at this location is approximately 300 m wide in unconstrained channel areas, although the hypothetical spill location is near the downstream end of a large island that causes the river to divide. Scour marks on the island and on nearby riparian habitat indicate that flood flows can extend over the island and a considerable distance across the intervale. Flows are strongly seasonal ranging from approximately 1,300 m3/s in June (during freshet, with peak flow potentially up to 2,000 m3/s), to low flows between December and March that are potentially less than 100 m3/s.
This spill example is evaluated with particular reference to four cases for comparison: the Kalamazoo River oil spill, since that oil spill involved a similar form of diluted bitumen, and the gradient of the Kalamazoo River is most similar to that of the North Thompson River; the modelling conducted by Enbridge for the Morice and Athabasca Rivers; and the Yellowstone River oil spill.
Three sets of environmental conditions are considered for this spill example. These are:
A winter condition between December and March, with ice cover on the river and snow cover on the land. Air temperatures are assumed to be below the freezing mark, and the river flow is in the low range (100 m3/s or less).

Trans Mountain Pipeline ULC Volume 7, Pipeline Facilities Technical Reports Trans Mountain Expansion Project Qualitative Ecological Risk Assessment of
Pipeline Spills Technical Report
December, 2013 REP-NEB-TERA-00019
Page 6-71
A summer condition between June and August, with air temperatures in the warm range (15 ºC to 25ºC). The river is in freshet, with flow greater than 1,250 m3/s.
A spring or fall condition between April and June, or September and November. The river flow is in a moderate range, at around 500 m3/s, and the air temperatures are cool, between the freezing point and 15ºC.
6.4.2.1. Winter Conditions
Under winter conditions, snow on the ground and in roadside ditches acts to absorb spilled CLWB; however, although the hills around the Kamploops region are noted for high snowfall, winter temperatures are not particularly cold. Therefore, although the North Thompson River can be ice covered for several months of the year, it responds quickly to snow melt or rain events, and the ice cover may not be reliable. Low temperatures also help to limit the flow of CLWB as its viscosity increases as it cools. Most of the spilled CLWB (approximately 1,000 m3) reaches the North Thompson River and spreads out on the ice. Open water patches in the ice allow some of the oil to become entrained in the river, and it moves downstream beneath the ice but still floats as its density is initially around 0.94. Owing to winter conditions, many of the ecological receptors that could potentially be exposed are absent, or dormant.
Table 6.21 provides an evaluation of the likely spatial extent, magnitude, duration, and reversibility of environmental effects on each ecological receptor group that would be caused by an accidental spill of CLWB near RK 766.0 during the winter. Due to winter conditions, overland flow of the oil is slowed, and some of the oil is absorbed into the snowpack. Following local terrain, crude oil would reach the roadside ditch on the west side of the Southern Yellowhead Highway, then move along the ditch until encountering a culvert. Emerging on the east side of the highway, the oil would follow local drainages to the river. During winter conditions, most migratory birds would be at their wintering grounds, so acute effects on raptors, waterfowl, wading and shorebirds are unlikely to be of high magnitude. Similarly, some mammals such as bears would be hibernating, although others such as moose, muskrat and river otter remain active year-round. Due to the limited spatial extent of physical oiling, effects on these wildlife receptors would likely be limited to a few individuals, rather than larger numbers that would affect the viability of regional populations. Effects on fish and fish habitat, as well as benthic invertebrates and aquatic vegetation would likewise be limited in spatial extent. However, oil spill recovery effects on the overland flowpath would be substantial, likely requiring extensive excavation causing destruction of habitat, followed by reconstruction and restoration of the terrestrial habitat. Depending upon the receptor group, this process of restoration and recovery could take anywhere from 18 months to five years.
6.4.2.2. Summer Conditions
Under summer conditions, the spilled CLWB flows overland to the west side of the Southern Yellowhead Highway, moves along the ditch until encountering a culvert, and emerges on the east side of the highway. The oil then follows local drainages to the North Thompson River. Some oil is held up in low areas, or absorbed onto vegetation and the soil litter layer, and some penetrates or is absorbed by soil. Most (approximately 1,300 m3) of the spilled CLWB is likely to reach the North Thompson River over a period of several hours.

Trans Mountain Pipeline ULC Volume 7, Pipeline Facilities Technical Reports Trans Mountain Expansion Project Qualitative Ecological Risk Assessment of Pipeline Spills Technical Report
December, 2013 REP-NEB-TERA-00019
Page 6-72
TABLE 6.21 LIKELY ENVIRONMENTAL EFFECTS OF CLWB SPILL DURING WINTER TO THE NORTH THOMPSON RIVER NEAR DARFIELD, BRITISH COLUMBIA
North Thompson River, Winter Season
LIKELY OIL SPILL EFFECTS
Spatial Extent Magnitude Time to Recovery
Aquatic Receptors
Aquatic Vegetation Aquatic vegetation is not contacted by spilled oil. Low. Aquatic vegetation is not actively growing at the time of the spill, and ice cover prevents contact between the spilled oil and aquatic vegetation.
Spilled CLWB is prevented from entering, or is recovered from the river surface, without materially affecting aquatic vegetation.
Aquatic Invertebrates Aquatic invertebrates are present in the substrates of the river. Effects on the benthic community of the river are Low, because most of the spilled oil is recovered.
Low, although localized areas of Medium effect magnitude may be present.
Recovery of the benthic community in the North Thompson River is complete within 6 months of the spill.
Fish and Fish Eggs Fish are present in the river, and salmonid eggs may be present in pockets of suitable habitat in the river bed downstream from the oil spill location. However, effects on fish and fish eggs are Low, because most of the spilled oil is recovered.
Low, because very little oil contacts the river water. Recovery of fish habitat in the North Thompson River is complete within 6 months of the spill.
In-water Amphibians Juvenile amphibians are not present in the winter season. Adult amphibians are unlikely to be wintering in the river sediments, although presence of individuals in protected locations is possible.
Low, because overwintering amphibians will be buried in sediments in protected locations, and are unlikely to be directly contacted by the spilled oil.
Recovery of amphibian habitat in the North Thompson River is complete within 6 months of the spill.
Terrestrial Receptors
Shoreline and Riparian Vegetation Shoreline and riparian vegetation is oiled along the overland flow path to the North Thompson River, but annual plants are not present except as seeds, and perennial plants, shrubs and trees are in a dormant state. Little if any shoreline habitat of the North Thompson River is affected.
Low, because plants are in a dormant state at the time of the spill. However, oil spill recovery activities result in the physical destruction, and then reconstruction of terrestrial habitat along the overland flow path and in some limited shoreline areas.
The overland flow path is heavily disturbed by clean-up activities in the first year following the oil spill. Recovery of terrestrial habitat begins about 18 months after the spill, and is effectively complete after about 5 years.
Soil Invertebrates Soils are oiled along the overland flow path to the North Thompson River, but soil invertebrates are in a dormant state. Little if any shoreline habitat of the North Thompson River is affected.
Low, because the soil invertebrates are in a dormant state at the time of the spill. However, oil spill recovery activities result in the physical destruction, and then reconstruction of terrestrial habitat along the overland flow path and in some limited shoreline areas.
The overland flow path is heavily disturbed by clean-up activities in the first year following the oil spill. Recovery of terrestrial habitat begins about 18 months after the spill, and is effectively complete after about 5 years.
Mammals
Grizzly Bear Not likely to be directly affected as they hibernate during winter. Low, because the probability of a grizzly bear den being located within the overland flow path is very small. However, disturbance caused by oil spill recovery activities could cause an alteration of habitat use during the spring, summer and fall.
The overland flow path is heavily disturbed by clean-up activities in the first year following the oil spill. Recovery of terrestrial habitat begins about 18 months after the spill, and is effectively complete after about 5 years.
Moose Potentially affected. Moose tend to be solitary, so effects of external oiling on more than a few individual animals are unlikely.
Low, because moose have a large home range, and oil spill recovery activity would quickly cause them to leave the area. However, disturbance caused by oil spill recovery activities could cause an alteration of habitat use during the spring, summer and fall.
The overland flow path is heavily disturbed by clean-up activities in the first year following the oil spill. Recovery of terrestrial habitat begins about 18 months after the spill, and is effectively complete after about 5 years.
Muskrat Potentially affected, as muskrat remain active through the winter. However, effects on more than a few individual animals are unlikely.
Low, because muskrat populations will be limited along the main stem of the North Thompson River, with occupancy mainly in protected areas such as tributaries where exposure to oil is unlikely.
Recovery of this habitat is complete within 6 months of the spill.
River Otter Potentially affected, as otters remain active through the winter. Most otter habitat would be present around openings in the river ice, where access to fish is present. Effects on more than a few individual animals are unlikely.
Low, because populations will be limited along the main stem of the North Thompson River, with occupancy mainly in protected areas such as tributary mouths with open water, where exposure to oil is unlikely.
Recovery of this habitat is complete within 6 months of the spill.
Birds
Bald Eagle Not likely to be affected as the winter range is generally south of the pipeline corridor in British Columbia, although individual birds may overwinter in areas with open water.
Low, as a result of lack of exposure. One to two years, if clean-up activities result in temporary avoidance of habitat use as a result of disturbance.
Canada Goose Not likely to be affected as the winter range is generally south of the pipeline corridor in British Columbia. Low, as a result of lack of exposure. One to two years, if clean-up activities result in temporary avoidance of habitat use as a result of disturbance.
Great Blue Heron Not likely to be affected as the winter range is generally south of the pipeline corridor in British Columbia. Low, as a result of lack of exposure. One to two years, if clean-up activities result in temporary avoidance of habitat use as a result of disturbance.
Mallard Not likely to be affected as the winter range is generally south of the pipeline corridor in British Columbia. Low, as a result of lack of exposure. One to two years, if clean-up activities result in temporary avoidance of habitat use as a result of disturbance.
Spotted Sandpiper Not likely to be affected as the winter range is generally south of the pipeline corridor in British Columbia. Low, as a result of lack of exposure. One to two years, if clean-up activities result in temporary avoidance of habitat use as a result of disturbance.
Tree Swallow Not likely to be affected as the winter range is generally south of the pipeline corridor in British Columbia. Low, as a result of lack of exposure. One to two years, if clean-up activities result in temporary avoidance of habitat use as a result of disturbance.
Reptiles and air-breathing Amphibians
Western painted turtle habitat extends into the North Thompson River. Adult turtles and amphibians could potentially be overwintering in the sediments of protected areas such as backwaters and tributaries, but these will be minimally affected.
Low, because overwintering turtles and amphibians will be buried in stream or pool and pond sediments, and are unlikely to be directly contacted by the spilled oil.
Recovery of turtle habitat in the North Thompson River is complete within 6 months of the spill.

Trans Mountain Pipeline ULC Volume 7, Pipeline Facilities Technical Reports Trans Mountain Expansion Project Qualitative Ecological Risk Assessment of
Pipeline Spills Technical Report
December, 2013 REP-NEB-TERA-00019
Page 6-73
Table 6.22 provides an evaluation of the likely spatial extent, magnitude, duration, and reversibility of environmental effects on each ecological receptor group that would be caused by an accidental spill of CLWB near RK 766.0 during the summer. The river is at or near flood stage, and as the oil enters on the western shoreline it is advected downstream by the quickly moving water. Because the oil is unweathered, and has low viscosity and density less than that of the water, it spreads across the water surface. Oil is trapped along shorelines, and in particular where river flow is above the banks and vegetation is flooded. Due to the high water, however, the river flow is turbulent, and in the early stages of the spill the turbulence of the river flow is sufficient to entrain droplets of the oil in the water, enhancing the dissolution of BTEX and other light-end hydrocarbons into the water column, although much of this oil also re-surfaces. As the oil is transported downstream and weathers, it becomes more viscous and dense. Interactions between floating oil and shoreline sediments result in adhesion of sand and small gravel particles to oil globules, and some of the oil becomes submerged and/or sinks in quiescent areas such as eddy zones behind islands and in backwaters. Although the water of the North Thompson River is somewhat turbid, the suspended sediment load is not particularly high and the water has no appreciable salinity; thus OMA formation is not a significant factor in the fate of the spilled oil. Most of the spilled oil has weathered, largely due to evaporation, or stranded along shoreline and in riparian zones within 60 km of the spill location. A small amount of oil is advected farther downstream primarily as submerged oil, and some traces of oil are subsequently found in silty sediment deposits at the upstream end of Kamloops Lake, below the confluence of the North and South Thompson Rivers.
6.4.2.3. Spring or Fall Conditions
Under spring or fall conditions, the spilled CLWB flows overland to the west side of the Southern Yellowhead Highway, moves along the ditch until encountering a culvert, and emerges on the east side of the highway. The oil then follows local drainages to the North Thompson River. Some oil is held up in low areas, or absorbed onto vegetation and the soil litter layer, and some penetrates or is absorbed by soil. Most (approximately 1,300 m3) of the spilled CLWB is likely to reach the North Thompson River over a period of several hours.
Table 6.23 provides an evaluation of the likely spatial extent, magnitude, duration, and reversibility of environmental effects on each ecological receptor group that would be caused by an accidental spill of CLWB near RK 766.0 during the winter. The river is flowing normally, and confined within its banks. As the oil enters on the western shoreline it is advected downstream by the moving water. Because the oil is unweathered, and has low viscosity and density less than that of the water, it spreads across the water surface. Floating oil is trapped along shorelines, particularly on gravel and cobble exposures, but does not penetrate these deeply due to the shallow slope of the shorelines and the presence of the water table at or near the surface. Due to the low gradient of the river and the moderate water flow, the turbulence in the river is rarely sufficient to entrain droplets of the oil in the water. As a result the concentrations of BTEX and other light-end hydrocarbons in the water column are lower, but the surface slick tends to be thicker. As the oil is transported downstream and weathers, it becomes more viscous and dense. Interactions between floating oil and shoreline sediments result in adhesion of sand and small gravel particles to oil globules, and some of the oil becomes submerged and sinks in quiescent areas such as eddy zones behind islands and in backwaters. As described for the Athabasca River, water levels are generally rising in the spring, and falling in the fall, and thus will influence the fate of oil that strands on shorelines. Although the water of the North Thompson River is somewhat turbid, the suspended sediment load is not particularly high and the water has no appreciable salinity; thus OMA formation is not a significant factor in the fate of the spilled oil. Most of the spilled oil has weathered, largely due to evaporation, or stranded along shoreline and in riparian zones within 25 km of the spill location. A small amount of oil is advected farther downstream primarily as submerged oil, but does not extend to the confluence of the South and North Thompson rivers.
6.4.2.4. Environmental Effects Summary for Spill Scenarios at RK 766.0
A hypothetical spill scenario has been developed to describe the likely fate and behaviour of CLWB spilled as a result of a pipeline rupture near RK 766.0. Potential environmental effects likely to accrue to

Trans Mountain Pipeline ULC Volume 7, Pipeline Facilities Technical Reports Trans Mountain Expansion Project Qualitative Ecological Risk Assessment of
Pipeline Spills Technical Report
December, 2013 REP-NEB-TERA-00019
Page 6-74
ecological receptors as a result of such hypothetical spills have been outlined in Table 6.21 through Table 6.23.
For the North Thompson River in winter (Table 6.21), snow and ice conditions are less reliable than those at the Athabasca River, due to generally milder winter conditions. However, conditions are still likely to be such that much of the spilled CLWB is held up before reaching the river, and the presence of ice on the river prevents a large amount of oil from entering the water. Under these circumstances, the environmental effects of spilled oil may be minimized, because most of the oil is recoverable. Oil spill recovery efforts would still result in environmental effects along the overland flowpath, but effects on the North Thompson River would be reduced. Many of the relevant ecological receptors would be dormant (e.g., plants, amphibians, reptiles, and mammals that hibernate) or absent (e.g., migratory birds), although some birds such as bald eagle may be present through the winter where open water occurs. The spatial extent of high magnitude oil spill effects would therefore be limited to the overland flowpath, where the primary environmental effects would be those associated with oil spill recovery efforts. Oil spill effect magnitudes for aquatic receptors in the North Thompson River would be low to medium, depending upon how much oil entered the river. Effect magnitudes on shoreline and riparian vegetation and soil invertebrates would be low, due partly to winter dormancy, and particularly to the low level of exposure given low winter water levels. Effect magnitudes for mammals and birds would generally be low due to lack of exposure for migratory birds or hibernating mammals, but also to the low level of exposure within the North Thompson River. Recovery of the terrestrial environment would take approximately 18 months to five years, assuming that the spill occurs in January, and physical works associated with oil spill recovery are ongoing through until the late summer.
For the North Thompson River in summer (Table 6.22), flow in the river is peaking, due to snow melt in its mountain headwaters. Most of the spilled oil reaches and is rapidly advected downstream in the North Thompson River. Effect magnitude on the overland flowpath is high but localized, and is addressed by physical remediation and re-seeding of affected areas. Effects on aquatic receptors, including vegetation, aquatic invertebrates, fish and amphibians are generally medium to low, except for amphibians which may be affected in breeding habitats riparian to the river, if these areas are subject to heavy oiling. High turbulence in the river water tends to increase the dissolution of hydrocarbons into the river water, but the high flow rate of the river provides dilution, and widespread mortality of fish in the North Thompson River is unlikely. Much of the spilled oil becomes stranded along shorelines, and in riparian areas where vegetation is oiled. Effects on shoreline and riparian vegetation and soil invertebrates are high on the overland flowpath, but medium to low along the North Thompson River due to the patchy distribution of the oil. Whereas the overland flowpath is subject to intensive oil spill clean-up which is initially destructive to habitat, areas riparian to the river are remediated with less intrusive methods, and a greater emphasis on natural attenuation of spilled oil residues at low levels. Environmental effects on mammal populations are high for truly semi-aquatic species such as muskrat, beaver, otter and mink, for which it is assumed that mortality could occur throughout a river reach of up to 60 km. For mammals that are larger or that are less adapted to the aquatic environment, such as bears, raccoons and moose, effects are expected to be medium, and may arise from disturbance of habitat, as well as from oiling of fur, or ingestion of crude oil. For birds, guilds such as ducks and geese are considered to be most exposed to spilled oil, and effects on these species could be high (including mortality) to medium, including reproductive effects caused by transfer of oil to eggs, with resulting egg mortality, or effects on habitat quality caused by disturbance arising from oil spill response efforts. These effects could extend for up to 60 km downstream. Other species, such as raptors, wading birds, shorebirds, and swallows could experience medium effect magnitudes, reflecting both oil exposure and disturbance of habitat following the oil spill. Recovery times for spills in the summer could be as short as 12 months for some receptors, or up to five years where effects occur at the population level.

Trans Mountain Pipeline ULC Volume 7, Pipeline Facilities Technical Reports Trans Mountain Expansion Project Qualitative Ecological Risk Assessment of Pipeline Spills Technical Report
December, 2013 REP-NEB-TERA-00019
Page 6-75
TABLE 6.22 LIKELY ENVIRONMENTAL EFFECTS OF CLWB SPILL DURING SUMMER TO THE NORTH THOMPSON RIVER NEAR DARFIELD, BRITISH COLUMBIA
North Thompson River, Summer Season
LIKELY OIL SPILL EFFECTS
Spatial Extent Magnitude Time to Recovery
Aquatic Receptors
Aquatic Vegetation Very little aquatic vegetation is present in the North Thompson River, because of the high summer flows, turbid water, and cobble-gravel nature of most of the river bed.
Low, because of the general scarcity of aquatic vegetation. Not Applicable
Aquatic Invertebrates Turbulent flow in the North Thompson River enhances dispersion and dissolution of hydrocarbons so effects on aquatic invertebrates are likely within 10 km of the spill location. Effects range from Medium, as more sensitive species are killed by direct contact with oil droplets or by dissolved hydrocarbon concentrations near spill location, to Low in downstream areas.
Medium to low, depending upon exposure to dissolved hydrocarbons and oil droplets in the water column. Effects on the benthic community would be patchy, reflecting the hydrology of the river. Areas of oil accumulation in sediment would be most affected, but these are localized, and tend to be silty sediments, rather than gravel/cobble areas.
Recovery of the benthic community is largely complete within 12 months of the spill, although isolated areas such as eddies and backwaters, where silty sediments potentially trap sunken oil, would take longer to recover fully.
Fish and Fish Eggs Turbulent flow in the North Thompson River enhances dispersion and dissolution of hydrocarbons so that fish mortality is likely within 10 km of the spill location. However, as the oil spreads across the surface of the river, and the dissolved hydrocarbons are diluted by the full flow of the river, lethal exposures to fish become unlikely.
Medium in the first 10 km of the river, and Low in more distant reaches of the river, as a result of the rapid weathering of oil which causes more water soluble fractions to evaporate. The high summer flow of the North Thompson River also provides abundant dilution water, which limits the dissolved concentrations in the river.
Recovery of fish habitat in the North Thompson River is complete within 12 months of the spill; the fish community is restored by immigration from nearby unaffected areas and tributaries.
In-water Amphibians Adult amphibians in shoreline habitat as well as in quiescent areas of the North Thompson River would be killed if contacted by oil, or by exposure to dissolved hydrocarbons at high enough concentration. Effects are most likely within 10 km of the spill site, but remain possible up to 60 km from the spill site.
High in shoreline habitat of the North Thompson River within 10 km of the spill site, and Medium in areas up to 60 km downstream, as a result of the more patchy spatial distribution of stranded oil, and decreased dissolved hydrocarbon concentrations.
Recovery of amphibian habitat in the North Thompson River is complete within 12 months of the spill.
Terrestrial Receptors
Shoreline and Riparian Vegetation Shoreline and riparian vegetation is oiled along the overland flow path to the North Thompson River. Actively growing annual and perennial ground level vegetation is killed, but shrubs and trees are not. Similar effects are observed in the riparian areas of the river, where high river flows cause flooding and terrestrial vegetation is contacted by oil.
High along the overland flow path, but Medium to Low in the riparian areas of the North Thompson River, as a result of the patchy distribution of oil, and decreasing with distance from the spill site. In these areas, most oil spill recovery efforts have Low magnitude effect on habitat quality because of efforts to avoid physical damage to habitat, and to allow natural attenuation after recovery of visible oil.
The overland flow path is heavily disturbed by clean-up activities in the first year following the oil spill. Recovery of terrestrial habitat begins about 12 months after the spill, and is effectively complete after about 5 years. Natural attenuation in the riparian areas of the North Thompson River requires about two years, once visible oil has been recovered.
Soil Invertebrates Soils are oiled along the overland flow path to the river. Oiling and oil spill recovery efforts result in the destruction of the soil invertebrate community in these areas. Effects on soil invertebrates are lower in riparian zones of the North Thompson River, in part because of the patchy nature of deposition. The heaviest oiling is noted in the first 10 km downstream from the spill location, but some oiling of riparian areas is observed as far as 60 km downstream.
Medium to Low in the riparian areas of the North Thompson River, as a result of the patchy distribution of oil, and with increasing distance from the spill site. In these areas, most oil spill recovery efforts have Low magnitude effect on habitat quality because of efforts to avoid physical damage to habitat, and to allow natural attenuation after recovery of visible oil.
The overland flow path is heavily disturbed by clean-up activities in the first year following the oil spill. Recovery of terrestrial habitat begins about 12 months after the spill, and is effectively complete after about 5 years. Natural attenuation in the riparian areas of the North Thompson River requires about two years, once visible oil has been recovered.
Mammals
Grizzly Bear Oiling of individual bears could occur if they forage along the shoreline of the North Thompson River up to 60 km downstream from the spill location in the days and weeks following the spill.
Medium. Partial oiling of the fur of a grizzly bear during summer is not likely to result in a breakdown of thermoregulation. Ingestion of slightly to highly weathered oil following grooming activity may cause temporary irritation of the digestive system, but is not likely to cause death.
The overland flow path is heavily disturbed by clean-up activities in the first year following the oil spill, but represents a very small area of habitat. Recovery of river riparian habitat begins about 12 months after the spill, and is effectively complete after about 5 years. Oil spill response activities could have the beneficial side effect of “hazing” affected areas, temporarily reducing utilization of this habitat by bears.
Moose Oiling of individual moose could occur if they forage along the shoreline of the North Thompson River up to 60 km downstream from the spill location in the days and weeks following the spill.
Medium. Partial oiling of the fur of a moose during summer is not likely to result in a breakdown of thermoregulation. Ingestion of slightly to highly weathered oil following grooming activity may cause temporary irritation of the digestive system, but is not likely to cause death.
The overland flow path is heavily disturbed by clean-up activities in the first year following the oil spill, but represents a very small area of habitat. Recovery of river riparian habitat begins about 12 months after the spill, and is effectively complete after about 5 years. Oil spill response activities could have the beneficial side effect of “hazing” affected areas, temporarily reducing utilization of this habitat by moose.
Muskrat Muskrat present in the North Thompson River are also likely to become oiled and die throughout the affected reach of up to 60 km.
Effects on muskrat would be High, including mortality of individuals up to 60 km downstream. Recovery of river and riparian habitat begins about 12 months after the spill, and is effectively complete after about 5 years. Muskrat populations recover as a result of recolonization of affected areas from adjacent unaffected areas.
River Otter Otters present in the North Thompson River are likely to become oiled and die, throughout the affected reach of up to 60 km.
Effects on otter would be High, including mortality of individuals up to 60 km downstream. Recovery of river and riparian habitat begins about 12 months after the spill, and is effectively complete after about 5 years. Otter populations recover as a result of recolonization of affected areas from adjacent unaffected areas.
Birds
Bald Eagle Bald eagle would be present during summer, and would likely contact spilled oil while taking fish at the water surface, or as a result of feeding on fish killed by the oil spill. These birds would be partially oiled, and would be further exposed to oil while preening to remove oil from feathers. Such effects could be seen up to 60 km downstream from the spill location.
Medium. Neither partial oiling of feathers, nor incidental oil ingestion is likely to be sufficient to kill exposed bald eagles, but oiled birds may transfer oil to eggs, killing the embryos and resulting in reduced reproductive success. Clean-up activities could also lead to nest abandonment if nest locations are close to areas of high activity.
One year for physical effects of oil exposure, and one to two years for effects on habitat utilization, if clean-up activities result in temporary avoidance of habitat as a result of disturbance.
Canada Goose Nesting geese or other waterfowl could be exposed to oiling in riparian habitat up to 60 km downstream from the spill location.
High to Medium, depending upon the level of exposure to floating oil, or stranded oil in riparian habitat. Oiled birds could also transfer oil to eggs, resulting in embryo mortality. Clean-up activities could also lead to nest abandonment if nest locations are close to areas of high activity.
One year for physical effects of oil exposure, and one to two years for effects on habitat utilization, if clean-up activities result in temporary avoidance of habitat as a result of disturbance.
Great Blue Heron Herons and other wading birds could be exposed to oiling in shallow water or riparian habitat up to 60 km downstream from the spill location.
Medium. Neither partial oiling of feathers, nor incidental oil ingestion is likely to be sufficient to kill exposed birds, but oiled birds may transfer oil to eggs, killing the embryos and resulting in reduced reproductive success. Clean-up activities could also lead to nest abandonment if nest locations are close to areas of high activity.
One year for physical effects of oil exposure, and one to two years for effects on habitat utilization, if clean-up activities result in temporary avoidance of habitat as a result of disturbance.
Mallard Nesting mallards or other waterfowl could be exposed to oiling in riparian habitat up to 60 km downstream from the spill location.
High to Medium, depending upon the level of exposure to floating oil, or stranded oil in riparian habitat. High mortality is likely to be observed in oiled ducks. Surviving lightly oiled birds could also transfer oil to eggs, resulting in embryo mortality. Clean-up activities could also lead to nest abandonment if nest locations are close to areas of high activity.
One year for physical effects of oil exposure, and one to two years for effects on habitat utilization, if clean-up activities result in temporary avoidance of habitat as a result of disturbance.
Spotted Sandpiper Sandpipers and other shorebirds could be exposed to oiling in shallow water or riparian habitat up to 60 km downstream from the spill location.
Medium. Neither partial oiling of feathers, nor incidental oil ingestion is likely to be sufficient to kill exposed birds, but oiled birds may transfer oil to eggs, killing the embryos and resulting in reduced reproductive success. Clean-up activities could also lead to nest abandonment if nest locations are close to areas of high activity.
One year for physical effects of oil exposure, and one to two years for effects on habitat utilization, if clean-up activities result in temporary avoidance of habitat as a result of disturbance.
Tree Swallow Tree swallows nest in cavities in trees located near the water, and forage over water. Tree swallows may also dip onto the water take emerging insects or drink, or bathe in shallow water pools. These birds could be affected up to 60 km from the spill location.
Medium. Neither partial oiling of feathers, nor incidental oil ingestion is likely to be sufficient to kill exposed birds, but oiled birds may transfer oil to eggs, killing the embryos and resulting in reduced reproductive success. Clean-up activities could also lead to nest abandonment if nest locations are close to areas of high activity.
One to two years, if clean-up activities result in temporary avoidance of habitat use as a result of disturbance.
Reptiles and air-breathing Amphibians
Adult turtles and amphibians could be present in riparian habitat or backwater areas along the North Thompson River. Such animals could be exposed to spilled oil for a distance of up to 60 km from the spill location.
High to Medium. Effect magnitude would decline with distance downstream and decreasing exposure. The risk of acute lethality would be greatest in the first 10 km downstream from spill location.
Recovery of turtle habitat in the North Thompson River is complete within 12 months of the spill.

Trans Mountain Pipeline ULC Volume 7, Pipeline Facilities Technical Reports Trans Mountain Expansion Project Qualitative Ecological Risk Assessment of Pipeline Spills Technical Report
December, 2013 REP-NEB-TERA-00019
Page 6-76
TABLE 6.23 LIKELY ENVIRONMENTAL EFFECTS OF CLWB SPILL DURING SPRING OR FALL TO THE NORTH THOMPSON RIVER NEAR DARFIELD, BRITISH COLUMBIA
North Thompson River, Spring and Fall Season
LIKELY OIL SPILL EFFECTS
Spatial Extent Magnitude Time to Recovery
Aquatic Receptors
Aquatic Vegetation Very little aquatic vegetation is present in the North Thompson River, as a result of the high summer flows, turbid water, and cobble-gravel nature of most of the river bed.
Low, as a result of the scarcity of aquatic vegetation generally. Not Applicable
Aquatic Invertebrates Spring and fall flows in the North Thompson River are less turbulent than in summer, limiting the dispersion and dissolution of hydrocarbons in the reaches below the spill site, so that most aquatic invertebrate mortality is limited to areas within the first 5 km. Effects on the benthic community range from Medium, as more sensitive species are killed by direct contact with oil droplets or by dissolved hydrocarbon concentrations within 5 km of the spill location, to Low, in downstream areas.
Medium to low, depending upon exposure to dissolved hydrocarbons and oil droplets in the water column. Effects on the benthic community would be patchy, reflecting the hydrology of the river. Areas of oil accumulation in sediment would be most affected, but these are localized, and tend to be silty sediments, rather than gravel/cobble areas.
Recovery of the benthic community is largely complete within 12 months of the spill, although isolated areas such as eddies and backwaters, where silty sediments potentially trap sunken oil, would take longer to recover fully.
Fish and Fish Eggs Spring and fall flows in the North Thompson River are less turbulent than in summer, limiting the dispersion and dissolution of hydrocarbons in the reaches below the spill site, so that most fish mortality is limited to areas within the first 5 km. As the oil spreads across the surface of the river, and the dissolved hydrocarbons are diluted by the full flow of the river, lethal exposures to fish become less likely.
Medium in the first 5 km of the river, and Low in more distant reaches of the river, as a result of the rapid weathering of oil which causes more water soluble fractions to evaporate. The North Thompson River provides abundant dilution water, which limits the dissolved concentrations in the river.
Recovery of fish habitat in the North Thompson River is complete within 12 months of the spill; the fish community is restored by immigration from nearby unaffected areas and tributaries.
In-water Amphibians Adult amphibians or amphibian eggs and larvae (in spring) in shoreline habitat as well as in quiescent areas of the North Thompson River would be killed if contacted by oil, or by exposure to dissolved hydrocarbons at high enough concentration. This would be most likely within 10 km of the spill site, although effects could be observed up to 25 km downstream.
High in shoreline habitat of the North Thompson River within 10 km of the spill site, and Medium in areas up to 25 km downstream, as a result of the more patchy spatial distribution of stranded oil, and decreased dissolved hydrocarbon concentrations.
Recovery of amphibian habitat in the North Thompson River is complete within 12 months of the spill.
Terrestrial Receptors
Shoreline and Riparian Vegetation Shoreline and riparian vegetation is oiled along the overland flow path to the North Thompson River. Actively growing annual and perennial ground level vegetation is killed, but shrubs and trees are not. Riparian areas of the river are not affected, as the river is flowing within its normal banks.
High on the overland flow path, as a result of aggressive clean-up activities on land, but Low to unaffected in riparian areas of the North Thompson River.
The overland flow path is heavily disturbed by clean-up activities in the first year following the oil spill. Recovery of terrestrial habitat begins about 12 months after the spill, and is effectively complete after about 5 years. Riparian areas along the river are essentially unaffected.
Soil Invertebrates Soils are oiled along the overland flow path to the river. Oiling and oil spill recovery efforts result in the destruction of the soil invertebrate community in these areas. Riparian areas of the river are not affected, as the river is flowing within its normal banks.
High on the overland flow path, as a result of aggressive clean-up activities on land, but Low to unaffected in riparian areas of the North Thompson River.
The overland flow path is heavily disturbed by clean-up activities in the first year following the oil spill. Recovery of terrestrial habitat begins about 12 months after the spill, and is effectively complete after about 5 years. Riparian areas along the river are essentially unaffected.
Mammals
Grizzly Bear Oiling of individual bears could occur if they forage along the shoreline of the North Thompson River up to 25 km downstream from the spill location in the days and weeks following the spill.
Medium. Partial oiling of the fur of a grizzly bear during summer is not likely to result in a breakdown of thermoregulation. Ingestion of slightly to highly weathered oil following grooming activity may cause temporary irritation of the digestive system, but is not likely to cause death.
The overland flow path is heavily disturbed by clean-up activities in the first year following the oil spill, but represents a very small area of habitat. River riparian habitat is minimally affected. Oil spill response activities focusing on shoreline areas could have the beneficial side effect of “hazing” affected areas, temporarily reducing utilization of this habitat by bears.
Moose Oiling of individual moose could occur if they forage along the shoreline of the North Thompson River up to 25 km downstream from the spill location in the days and weeks following the spill.
Medium. Partial oiling of the fur of a moose during summer is not likely to result in a breakdown of thermoregulation. Ingestion of slightly to highly weathered oil following grooming activity may cause temporary irritation of the digestive system, but is not likely to cause death.
The overland flow path is heavily disturbed by clean-up activities in the first year following the oil spill, but represents a very small area of habitat. River riparian habitat is minimally affected. Oil spill response activities focusing on shoreline areas could have the beneficial side effect of “hazing” affected areas, temporarily reducing utilization of this habitat by moose.
Muskrat Muskrat present in the North Thompson River are likely to become oiled and die, throughout the affected reach of up to 25 km.
Effects on muskrat would be substantial, including mortality of individuals up to 25 km downstream. Recovery of shoreline habitat begins about 12 months after the spill, and is effectively complete after 2 years. Muskrat populations recover as a result of recolonization of affected areas from adjacent unaffected areas.
River Otter Otters present in the North Thompson River are likely to become oiled and die, throughout the affected reach of up to 25 km.
Effects on otter would be substantial, including mortality of individuals up to 25 km downstream. Recovery of shoreline habitat begins about 12 months after the spill, and is effectively complete after 2 years. Otter populations recover as a result of recolonization of affected areas from adjacent unaffected areas.
Birds
Bald Eagle Bald eagle would be present during spring and fall, and would likely contact spilled oil while taking fish at the water surface, or as a result of feeding on fish killed by the oil spill. These birds would be partially oiled, and would be further exposed to oil while preening to remove oil from feathers. Such effects could be seen up to 25 km downstream from the spill location.
Medium. Neither partial oiling of feathers, nor incidental oil ingestion is likely to be sufficient to kill exposed bald eagles, but oiled birds may transfer oil to eggs, killing the embryos and resulting in reduced reproductive success. Clean-up activities could also lead to nest abandonment if nest locations are close to areas of high activity.
One year for physical effects of oil exposure, and one to two years for effects on habitat utilization, if clean-up activities result in temporary avoidance of habitat as a result of disturbance.
Canada Goose Nesting geese or other waterfowl could be exposed to oiling in riparian habitat up to 25 km downstream from the spill location.
High to Medium, depending upon the level of exposure to floating oil, or stranded oil on shoreline habitat. Oiled birds could also transfer oil to eggs, resulting in embryo mortality. Clean-up activities could also lead to nest abandonment if nest locations are close to areas of high activity.
One year for physical effects of oil exposure, and one to two years for effects on habitat utilization, if clean-up activities result in temporary avoidance of habitat as a result of disturbance.
Great Blue Heron Herons and other wading birds could be exposed to oiling in shallow water or riparian habitat up to 25 km downstream from the spill location.
Medium. Neither partial oiling of feathers, nor incidental oil ingestion is likely to be sufficient to kill exposed birds, but oiled birds may transfer oil to eggs, killing the embryos and resulting in reduced reproductive success. Clean-up activities could also lead to nest abandonment if nest locations are close to areas of high activity.
One year for physical effects of oil exposure, and one to two years for effects on habitat utilization, if clean-up activities result in temporary avoidance of habitat as a result of disturbance.
Mallard Duck Nesting mallards or other waterfowl could be exposed to oiling in riparian habitat up to 25 km downstream from the spill location.
High to Medium, depending upon the level of exposure to floating oil, or stranded oil in shoreline habitat. High mortality is likely to be observed in oiled ducks. Surviving lightly oiled birds could also transfer oil to eggs, resulting in embryo mortality. Clean-up activities could also lead to nest abandonment if nest locations are close to areas of high activity.
One year for physical effects of oil exposure, and one to two years for effects on habitat utilization, if clean-up activities result in temporary avoidance of habitat as a result of disturbance.
Spotted Sandpiper Sandpipers and other shorebirds could be exposed to oiling in shallow water or riparian habitat up to 25 km downstream from the spill location.
Medium. Neither partial oiling of feathers, nor incidental oil ingestion is likely to be sufficient to kill exposed birds, but oiled birds may transfer oil to eggs, killing the embryos and resulting in reduced reproductive success. Clean-up activities could also lead to nest abandonment if nest locations are close to areas of high activity.
One year for physical effects of oil exposure, and one to two years for effects on habitat utilization, if clean-up activities result in temporary avoidance of habitat as a result ofdisturbance.
Tree Swallow Tree swallows nest in cavities in trees located near the water, and forage over water. Tree swallows may also dip onto the water take emerging insects or drink, or bathe in shallow water pools. These birds could be affected up to 25 km from the spill location.
Medium. Neither partial oiling of feathers, nor incidental oil ingestion is likely to be sufficient to kill exposed birds, but oiled birds may transfer oil to eggs, killing the embryos and resulting in reduced reproductive success. Clean-up activities could also lead to nest abandonment if nest locations are close to areas of high activity.
One to two years, if clean-up activities result in temporary avoidance of habitat use as a result of disturbance.
Reptiles and air-breathing Amphibians
Turtles and adult amphibians could be present in shoreline habitat or backwater areas along the North Thompson River. Such animals could be exposed to spilled oil for a distance of up to 25 km from the spill location.
High to Medium. Turtles and adult amphibians along the shorelines of the river would be less exposed, and effect magnitude would decline, with distance downstream. The risk of mortality would be greatest in the first 10 km downstream from spill location.
Recovery of turtle and amphibian habitat in the North Thompson River is complete within 12 months of the spill.

Trans Mountain Pipeline ULC Volume 7, Pipeline Facilities Technical Reports Trans Mountain Expansion Project Qualitative Ecological Risk Assessment of
Pipeline Spills Technical Report
December, 2013 REP-NEB-TERA-00019
Page 6-77
For the North Thompson River in spring and fall (Table 6.23), flow in the river is at an intermediate level, typically rising in the spring due to the onset of freshet, or falling in the fall, as freshet recedes. Most of the spilled oil reaches and is advected downstream in the North Thompson River. Effect magnitude on the overland flowpath is high but localized, and is addressed by physical remediation and re-seeding of affected areas. Effects on aquatic receptors, including aquatic vegetation, invertebrates, fish and amphibians, are generally medium to low in the North Thompson River, except for effects on amphibians in spring, which could be high if oil enters habitat where amphibian eggs or larvae are present. Medium effects are observed within the first 10 km downstream from Trail Creek, and low magnitude effects are observed between 10 and 25 km downstream. Most of the oil becomes stranded along shorelines, but there is little contact with riparian areas due to the moderate water level in the river. Effects on shoreline and riparian vegetation and soil invertebrates are high on the overland flowpath, but low along the North Thompson River due to the low level of exposure. The overland flowpath is subject to intensive oil spill clean-up which is initially destructive to habitat. Environmental effects on mammal populations are greatest for truly semi-aquatic species such as muskrat, beaver, otter and mink, for which it is assumed that mortality could occur throughout a river reach of up to 25 km. For mammals that are larger or that are less adapted to the aquatic environment, such as bears, raccoons and moose, effects are expected to be medium, and may arise from disturbance of habitat, as well as from oiling of fur, or ingestion of crude oil. For birds, guilds such as ducks and geese are considered to be most exposed to spilled oil, and effects on these species could be high (including mortality) to medium, including reproductive effects caused by transfer of oil to eggs in spring, with resulting egg mortality, or effects on habitat quality caused by disturbance arising from oil spill response efforts. Other species, such as raptors, wading birds, shorebirds, and swallows could experience medium effect magnitudes, reflecting both oil exposure and disturbance of habitat following the oil spill. Recovery times for spills in the spring and fall could be as short as 12 months for some receptors, or up to five years where effects occur at the population level.
6.4.3. Fraser River near Hope, British Columbia at RK 1072.8
The hypothetical spill scenario involves a release of 1,300 m3 of CLWB at RK 1072.8. Details of the local environment can be found in Section 6.1.2.3. The hypothetical spill location is on the east side of the Fraser River, approximately 25 km southwest of Hope and 6 km east of Agassiz, British Columbia. At this location, the Fraser River is a large river entering the coastal lowlands, but still occupies a broad intervale with mountains on either side. The river is wide, having a main channel width of approximately 350 m, but is meandering and braided, with large islands and gravel bars that are overwashed during periods of high flow. Flow remains strongly seasonal, with freshet in June driven by meltwater in the mountainous terrain to the east and north, tailing off until the end of the year. Low flows are observed in January, February and March, as snow accumulates in the mountains. The water of the lower Fraser River has high turbidity. Winter low flow periods measured at Hope have monthly mean flows of 500 to 2,000 m3/s. Peak flow in June averages almost 7,000 m3/s, with maximum recorded monthly mean discharge of 10,800 m3/s.
The hypothetical spill location is just east of the eastbound lane of Highway 1, on a hillslope adjacent to a gully, approximately 500 m from a small side channel of the Fraser River. Crude oil emerging from the ground would rapidly flow downhill into the gully. The gully is the lower portion of a watercourse originating on the mountain side to the east of the highway and river. Water flows in the gully are highly variable, driven by local precipitation and snowmelt events, and the boulder/cobble substrates clearly show that episodic high flow rates are common. Due to the steep gradient and flashy nature of flows, the watercourse in the gully is not likely to provide fish habitat. The gully passes beneath the two divided lanes of Highway 1, and outwashes to a small side channel of the Fraser River. At low water levels, this channel is stranded, although water remains in pools. Moving downstream, the side channel remains confined to the shoreline for a distance of approximately 6.1 km before emerging from the protection of an island and complex of gravel bars to enter the main stem of the river, approximately 1.5 km upstream from the Agassiz Rosedale (Highway 9) Bridge. From this point, oil could spread across the width of the Fraser River, and would be transported downstream with the flowing water.

Trans Mountain Pipeline ULC Volume 7, Pipeline Facilities Technical Reports Trans Mountain Expansion Project Qualitative Ecological Risk Assessment of
Pipeline Spills Technical Report
December, 2013 REP-NEB-TERA-00019
Page 6-78
Three environmental conditions were considered for this spill example:
A winter condition between December and March. Air temperatures are assumed to be around the freezing mark, but snow cover is not guaranteed, and the river is ice-free. The river flow is in a low range (around 2,000 m3/s).
A summer condition between June and August, with air temperatures 15°C to 25°C. The river is in freshet, with flow greater than 6,000 m3/s, and potentially approaching 12,000 m3/s.
A spring or fall condition between April and June, or September and November. The river flow is in a moderate range, at around 5,000 m3/s, and the air temperatures are cool, between 0°C and 15°C.
This spill example is evaluated with particular reference to four cases for comparison: the Kalamazoo River oil spill, since that oil spill involved a similar form of diluted bitumen, and the gradient of the Kalamazoo River is most similar to that of the lower Fraser River; the modelling conducted by Enbridge for the Athabasca River near Whitecourt, Alberta; the Yellowstone River oil spill; the DM 932 oil spill; and the Wabamun Lake train derailment.
6.4.3.1. Winter Conditions
Under winter conditions, at this low elevation (no more than 50 masl), it is unlikely that sufficient (if any) snowpack would be present to influence the behaviour of the spilled CLWB. Owing to the frequently wet winter weather, however, it is likely that water is flowing rapidly down the gully towards the Fraser River. As a result of these factors, virtually all (1,250 m3) of the spilled CLWB reaches the side channel of the Fraser River within a few hours of the rupture event. Although the river stage is low, and waters of the Fraser River are not actively flowing in this portion of the river channel, the flow of water from the gully and other similar tributaries acts to transport spilled oil farther downstream, towards the main channel 6.1 km distant.
Frequent contact with sand and gravel bars acts to hold up some of the spilled oil, and it is possible that emergency responders could trap and recover much of the spilled oil before it entered the main channel of the Fraser River, which is ice free. Failing this, oil entering the main channel, now somewhat weathered, would be advected downstream initially following the left (south) bank of the river, before emerging and dispersing across the river channel between 4 and 7 km downstream of the Agassiz Rosedale Bridge. The river is at low flow, and has a low gradient, so the currents are weak and have low turbulence. Floating oil or slicks may be carried 30 to 50 km downstream from the point where it entered the main river channel, and globules or tar balls may be recovered up to 100 km downstream.
The spilled oil floats until it strands on gravel or sand bars, or other shorelines. As it weathers, it becomes more viscous and thicker, but strands before its density approaches or exceeds that of the water. Little oil is entrained in the water column due to the low turbulence. Although the river has relatively high turbidity, turbidity is at a seasonally low level due to low water flow. There is no appreciable salinity to the water, so OMA formation is limited by the low levels of suspended oil droplets, low suspended sediment concentration, and absence of salinity. There is a risk that oil stranded on shorelines will acquire additional density as a result of adhering or intermixed sand and gravel particles as the oil weathers, so that the weathered oil-mineral mixture may sink if it is subsequently eroded or flooded before it can be recovered. Owing to winter conditions, many of the ecological receptors that could potentially be exposed are absent, or dormant.
Table 6.24 provides an evaluation of the likely spatial extent, magnitude, duration, and reversibility of environmental effects on each ecological receptor group that would be caused by an accidental spill of CLWB near RK 1072.8 during the winter. Due to winter conditions, a considerable portion of the oil is retained in the side channel of the river, and does not reach the main channel. During winter conditions, most migratory birds would be at their wintering grounds, although it is likely that bald eagles and some waterfowl may be overwintering, particularly in sheltered habitat areas like the side channel. Similarly, some mammals such as bears would be hibernating, although others such as moose, muskrat and river otter remain active year-round. Effects on these wildlife receptors would likely be limited to a few individuals, rather than larger numbers that would affect the viability of regional populations. Effects on

Trans Mountain Pipeline ULC Volume 7, Pipeline Facilities Technical Reports Trans Mountain Expansion Project Qualitative Ecological Risk Assessment of
Pipeline Spills Technical Report
December, 2013 REP-NEB-TERA-00019
Page 6-79
fish and fish habitat, as well as benthic invertebrates and aquatic vegetation would likewise be limited in spatial extent. The gully does not provide fish habitat. The side channel of the Fraser River would provide fish habitat, and it is likely that, considering the large volume of spilled CLWB and the small amount of water present or flowing in the side channel, acute toxicity to fish would be observed. The main stem of the Fraser River, however, is not likely to experience fish kills due to the large volume of flowing water, the low turbulence and limited potential for oil droplet formation, and the partially weathered condition of the oil by the time it reaches the main channel. Oil spill recovery effects on the side channel of the Fraser River would be substantial. Depending upon the receptor group, the process of restoration and recovery could take anywhere from 18 months to five years.
6.4.3.2. Summer Conditions
Under summer conditions, it is assumed that water flow in the gully is low, and that as the oil moves down the gully, it displaces and overflows the water, causing accumulation and penetration of oil into the boulder and cobble outwash materials. This process results in some hold-up of oil that could otherwise reach the Fraser River. As a result, approximately 1,200 m3 of CLWB reaches the river, which is in flood condition. Water is flowing freely along the side channel, and most of the sand and gravel bars are submerged. The oil is rapidly transported to the confluence with the main river channel, and is swept downstream with oil and sheens being observed as far as 100 km downriver, approaching the greater Vancouver area.
As the river is flowing at a high stage, flows frequently wash over islands or riparian areas, with oil contacting vegetation and shoreline soils. Air and water temperatures are relatively warm, so the oil weathers quickly. The side channel is quiescent, but turbulent flow is encountered as the oil enters the main river channel, and some oil is entrained into the water column, locally enhancing concentrations of dissolved hydrocarbons at this point. The viscosity of the oil increases as it weathers, so most of the oil remains on the surface, in patchy slicks and sheens, until it strands on shorelines, often coating vegetation.
The river is turbulent and has high turbidity at this time of year. The turbulent flow tends to entrain oil droplets into the water column in the upper reaches of the spill-affected area, but there is no appreciable salinity to the water, so OMA formation is limited. Most of the oil becomes stranded on shorelines and vegetation, so as water levels drop, this oil remains stranded and little remains in the riverbed as sunken oil. The presence of residual oil in riparian areas leads to exposure for ecological receptors occupying terrestrial and shoreline habitat.
Table 6.25 provides an evaluation of the likely spatial extent, magnitude, duration, and reversibility of environmental effects on each ecological receptor group that would be caused by an accidental spill of CLWB near RK 1072.8 during the summer. Due to the summer conditions, the oil is rapidly advected as much as 100 km downstream, with oil becoming stranded on shorelines and coating shoreline vegetation. During summer conditions, most migratory birds would be present, and breeding. Similarly, mammals such as bears, moose, muskrat and river otter would be present and active. Effects on these wildlife receptors would likely be limited to a few individuals, rather than larger numbers that would affect the viability of regional populations. Effects on fish and fish habitat, as well as benthic invertebrates and aquatic vegetation would likewise be limited in spatial extent. The gully does not provide fish habitat. The side channel of the Fraser River would provide fish habitat, and it is possible that fish mortality might be observed in the side channel. The main stem of the Fraser River, however, is not likely to experience fish kills due to the large volume of flowing water, notwithstanding the turbulence and potential for oil droplet formation. Oil spill recovery effects would be greatest on riparian and shoreline habitat. Depending upon the receptor group, the process of restoration and recovery could take anywhere from 18 months to five years.

Trans Mountain Pipeline ULC Volume 7, Pipeline Facilities Technical Reports Trans Mountain Expansion Project Qualitative Ecological Risk Assessment of
Pipeline Spills Technical Report
December, 2013 REP-NEB-TERA-00019
Page 6-80
6.4.3.3. Spring or Fall Conditions
Under spring and fall conditions, it is assumed that water would be flowing down the gully, and that the spilled oil would quickly moves down the gully, displacing water and overflowing on the boulder and cobble substrates, with some accumulation and penetration of oil into the outwash materials. This process results in some hold-up of oil that could otherwise reach the Fraser River. Approximately 1,200 m3 of CLWB reaches the river, which is flowing normally, within its banks, between 2,000 and 4,000 m3/s. Some river water is flowing slowly along the side channel, but most of the sand and gravel bars remain visible. The oil flows along the side channel to the confluence with the main river channel, and is subsequently transported downstream with oil and sheens being observed as far as 60 km downriver.
As the river is flowing at a moderate stage, flows the river banks, islands and gravel bars provide abundant solid substrate that oil can adhere to. Oiling, however, is principally confined to sand and gravel shorelines, and little riparian habitat is oiled. Flow in the side channel is quiescent, but more turbulent flow is encountered as the oil enters the main river channel, and some oil is entrained into the water column, locally enhancing concentrations of dissolved hydrocarbons at this point. The viscosity of the oil increases as it weathers, so most of the oil remains on the surface, in patchy slicks and sheens, until it strands on shorelines.
The river has moderate turbulence and turbidity at this time of year. The turbulent flow tends to entrain some droplets of relatively unweathered oil into the water column in the upper reaches of the spill-affected area, but there is no appreciable salinity to the water, so OMA formation is limited. Most of the oil becomes stranded on shorelines. In the springtime, water levels tend to be steadily rising, so some of this oil may re-float, and some (if it has mixed with sand and gravel) may remain submerged or sink. In the fall, water levels tend to be steadily falling, so stranded oil will generally remain stranded and exposed to weathering on the shoreline through the winter months. This results in different exposure pathways for ecological receptors in spring and fall.
Table 6.26 provides an evaluation of the likely spatial extent, magnitude, duration, and reversibility of environmental effects on each ecological receptor group that would be caused by an accidental spill of CLWB near RK 1072.8 during the spring or fall. Due to the river flow condition, the oil is advected as much as 60 km downstream, with much of the oil becoming stranded on shorelines and gravel bars. As described for the Athabasca River, water levels are generally rising in the spring and falling in the fall, and this will influence the fate of oil that strands on shorelines. During the spring and fall conditions, many migratory birds would be present. Similarly, mammals such as bears, moose, muskrat and river otter would be present and active. Effects on these wildlife receptors would likely be limited to a few individuals, rather than larger numbers that would affect the viability of regional populations. Effects on fish and fish habitat, as well as benthic invertebrates and aquatic vegetation would likewise be limited in spatial extent. The gully does not provide fish habitat. The side channel of the Fraser River would provide fish habitat, and it is possible that fish mortality might be observed in the side channel. The main stem of the Fraser River, however, is not likely to experience fish kills due to the large volume of flowing water, notwithstanding the turbulence and potential for oil droplet formation. Oil spill recovery effects would be greatest on shoreline habitat. The potential for sunken oil is greatest in spring, as weathered oil that has contacted sand and gravel may be remobilized with rising waters and transported downriver as part of the bedload. Depending upon the receptor group, the process of restoration and recovery could take anywhere from 18 months to five years.

Trans Mountain Pipeline ULC Volume 7, Pipeline Facilities Technical Reports Trans Mountain Expansion Project Qualitative Ecological Risk Assessment of Pipeline Spills Technical Report
December, 2013 REP-NEB-TERA-00019
Page 6-81
TABLE 6.24 LIKELY ENVIRONMENTAL EFFECTS OF CLWB SPILL DURING WINTER TO THE FRASER RIVER NEAR HOPE, BRITISH COLUMBIA
Fraser River, Winter Season LIKELY OIL SPILL EFFECTS
Spatial Extent Magnitude Time to Recovery
Aquatic Receptors
Aquatic Vegetation The small side channel of the Fraser River is assumed to be ice-free, but river water levels are low. The aquatic habitat is mostly small interconnecting pools, with flow provided mainly from tributaries. The side channel, extending some 6 km before entering the main Fraser River, supports some aquatic vegetation, but this is senescent in winter.
High. Aquatic vegetation is not actively growing at the time of the spill. However, oil spill recovery activities result in damage to, and then reconstruction of aquatic habitat in the side channel.
Oil spill recovery efforts in the side channel result in extensive disturbance of this habitat, but erosion and deposition of sediment during and after the summer high flow period effectively restore this habitat, so that effects persist for 6 to 18 months.
Aquatic Invertebrates Aquatic invertebrates are present in the substrates of the side channel and the main Fraser River. Effects on the benthic community of the side channel (6 km) are substantial, affecting the entire channel as a result of initial toxicity as well as oil spill recovery activities. Effects on the benthic community of the main Fraser River are Low, because most of the spilled oil is recovered.
High although localized in the side channel. However, oil spill recovery activities result in damage to, and then reconstruction of aquatic habitat in the gully and side channel. Low in the main Fraser River, because of the partially weathered nature of the oil, and large size of the river.
The gully and side channel are heavily disturbed by clean-up activities in the first months following the oil spill. Recovery of the benthic invertebrate community begins between 6 and 18 months after the spill, and is effectively complete after 30 months. Recovery of the benthic community in the main Fraser River channel is complete within 6 months of the spill.
Fish and Fish Eggs Few fish are present in the side channel, because of winter low flow conditions; however such fish, or eggs, would likely be killed throughout the 6 km reach. Fish are present in the main Fraser River. It is not a major migratory period for salmon or eulachon, although steelhead could be migrating up the river during the winter period. Mortality of fish in the main Fraser River is unlikely because of weathering of the oil and the large volume of water flowing in the river.
High although localized in the side channel. However, oil spill recovery activities result in damage to, and then reconstruction of aquatic habitat in the side channel.
The side channel is heavily disturbed by clean-up activities in the first year following the oil spill. Recovery of fish habitat begins between 6 and 18 months after the spill, and is effectively complete after 30 months. Recovery of fish habitat in the main Fraser River is complete within 6 months of the spill.
In-water Amphibians Juvenile amphibians are not present in the winter season. Adult amphibians may be overwintering in the sediments of the side channel, which is wholly affected, or in quiescent areas of the main Fraser River where they are minimally affected.
Medium, because overwintering amphibians will be buried in stream sediments, and are unlikely to be directly contacted by the spilled oil. Oil spill recovery efforts, however, would result in damage to and then reconstruction of habitat in the side channel.
The side channel is heavily disturbed by clean-up activities in the first year following the oil spill. Recovery of fish habitat begins between 6 and 18 months after the spill, and is effectively complete after 30 months. Recovery of fish habitat in the main Fraser River is complete within 6 months of the spill.
Terrestrial Receptors
Shoreline and Riparian Vegetation Shoreline and riparian vegetation is oiled along the overland flow path, in the gully leading to the side channel, and potentially in places along the side channel to the main Fraser River, but annual plants are not present except as seeds. Perennial plants, shrubs and trees are in a dormant state. Little if any shoreline habitat of the Fraser River is affected because of low winter water levels.
High along the overland flow path, but Low elsewhere because the plants are in a dormant state at the time of the spill, and water levels are low during the winter. However, oil spill recovery activities result in damage to and then reconstruction of terrestrial habitat near the spill location.
The overland flow path and areas around the spill location are heavily disturbed by clean-up activities in the first year following the oil spill. Recovery of terrestrial habitat begins about 18 months after the spill, and is effectively complete after about 5 years.
Soil Invertebrates Soils are oiled along the overland flow path, in the gully leading to the side channel, and potentially in places along the side channel to the Fraser River. Little if any shoreline habitat of the main Fraser River is affected because of low winter water levels.
High along the overland flow path, but Low elsewhere even though soil invertebrates may remain active during the mild winter conditions. Water levels are low during the winter, so contact with riparian areas of the river is minimal. Oil spill recovery activities result in damage to and then reconstruction of terrestrial habitat near the spill location.
The overland flow path and areas around the spill location are heavily disturbed by clean-up activities in the first year following the oil spill. Recovery of terrestrial habitat begins about 18 months after the spill, and is effectively complete after about 5 years.
Mammals
Grizzly Bear The grizzly bear as a receptor is also intended to represent other omnivores and carnivores (such as raccoons), some of which may be winter-active in the lower mainland of British Columbia, even if grizzly bear are not present. A small number of individual animals might come into contact with spilled oil in the overland flow path, the gully, the side channel, or stranded along shorelines of the main Fraser River channel.
Low, because mild winter conditions reduce the probability that partially oiled animals would die as a result of exposure. However, disturbance caused by oil spill recovery activities could cause an alteration of habitat use during the spring, summer and fall.
The overland flow path and areas around the gully and side channel are heavily disturbed by clean-up activities in the first year following the oil spill. Recovery of terrestrial habitat begins about 18 months after the spill, and is effectively complete after about 5 years.
Moose Moose or other ungulates are potentially affected, as the gully and forested riparian areas of the side channel and river could provide sheltering habitat during cold periods. Moose tend to be solitary, so effects of external oiling on more than a few individual animals are unlikely.
Low, because moose have a large home range, oil spill recovery activity would quickly cause them to leave the area. However, disturbance caused by oil spill recovery activities could cause an alteration of habitat use during the spring, summer and fall.
The overland flow path and areas around the gully and side channel are heavily disturbed by clean-up activities in the first year following the oil spill. Recovery of terrestrial habitat begins about 18 months after the spill, and is effectively complete after about 5 years.
Muskrat Muskrat are potentially affected, as the side channel could provide suitable habitat, and muskrat remain active through the winter. However, effects on more than a few individual animals are unlikely.
Localized effects on muskrat could be High, up to and including mortality of individuals inhabiting the side channel, and possibly extending into the main Fraser River channel. Disturbance caused by oil spill recovery activities could also temporarily eliminate their habitat.
The overland flow path and areas around the gully and side channel are heavily disturbed by clean-up activities in the first year following the oil spill. Recovery of terrestrial and aquatic habitat begins about 18 months after the spill, and is effectively complete after about 5 years.
River Otter Otters are potentially affected, as they remain active through the winter. Effects on more than a few individual animals are unlikely.
Localized effects on river otter could be High, up to and including mortality of individuals if they occupy a den near the side channel, and possibly extending into the main Fraser River channel. Disturbance caused by oil spill recovery activities could also temporarily eliminate their habitat.
The overland flow path and areas around the gully and side channel are heavily disturbed by clean-up activities in the first year following the oil spill. Recovery of terrestrial and aquatic habitat begins about 18 months after the spill, and is effectively complete after about 5 years.
Birds
Bald Eagle Winter range of bald eagle could extend to the hypothetical spill location. Individual birds could become oiled through feeding on dead fish or other carrion, or by taking fish from the water surface through an oil slick.
Low. Partial oiling of plumage is not likely to result in mortality. Disturbance caused by oil spill recovery activities could also temporarily eliminate their habitat.
One to two years, if clean-up activities result in temporary avoidance of habitat use as a result of disturbance.
Canada Goose Not likely to be affected as the winter range is generally south of the pipeline corridor in British Columbia. Low, because of lack of exposure. One to two years, if clean-up activities result in temporary avoidance of habitat use as a result of disturbance.
Great Blue Heron Not likely to be affected as the winter range is generally south of the pipeline corridor in British Columbia. Low, because of lack of exposure. One to two years, if clean-up activities result in temporary avoidance of habitat use as a result of disturbance.
Mallard Duck Not likely to be affected as the winter range is generally south of the pipeline corridor in British Columbia. Low, because of lack of exposure. One to two years, if clean-up activities result in temporary avoidance of habitat use as a result of disturbance.
Spotted Sandpiper Not likely to be affected as the winter range is south of the pipeline corridor in British Columbia. Low, because of lack of exposure. One to two years, if clean-up activities result in temporary avoidance of habitat use as a result of disturbance.
Tree Swallow Not likely to be affected as the winter range is south of the pipeline corridor in British Columbia. Low, because of lack of exposure. One to two years, if clean-up activities result in temporary avoidance of habitat use as a result of disturbance.
Reptiles and air-breathing Amphibians
The only native turtle likely to be found along the Fraser River is the painted turtle, found in low numbers in parts of the Fraser Valley from Vancouver to Hope. A variety of amphibian species could be present in the side channel. Pools in the side channel could provide overwintering habitat for both turtles and amphibians, but these would be dormant and likely buried in sediments under winter conditions.
Low, because overwintering turtles and amphibians will be buried in sediments of the side channel, and are unlikely to be directly contacted by the spilled oil. Oil spill recovery activities, however, have the potential to disturb and possibly kill these animals.
The side channel is heavily disturbed by clean-up activities in the first year following the oil spill. Recovery of turtle and amphibian habitat begins about 18 months after the spill, and is effectively complete after 30 months.

Trans Mountain Pipeline ULC Volume 7, Pipeline Facilities Technical Reports Trans Mountain Expansion Project Qualitative Ecological Risk Assessment of Pipeline Spills Technical Report
December, 2013 REP-NEB-TERA-00019
Page 6-82
TABLE 6.25 LIKELY ENVIRONMENTAL EFFECTS OF CLWB SPILL DURING SUMMER TO THE FRASER RIVER NEAR HOPE, BRITISH COLUMBIA
Fraser River, Summer Season LIKELY OIL SPILL EFFECTS
Spatial Extent Magnitude Time to Recovery
Aquatic Receptors
Aquatic Vegetation The side channel of the Fraser River is flooded with water from the main river, and islands, sandbars, and some riparian habitat are inundated. Aquatic vegetation in the side channel has little exposure to floating oil, and generally low sensitivity to dissolved hydrocarbon constituents. Little of the oil sinks in this area.
Low. Aquatic vegetation is not directly exposed to the spilled oil, and oil spill recovery activities focus on riparian habitat, where oil has stranded.
Spilled CLWB enters the side channel of the Fraser River, moving along it quite rapidly because of the high river flow. Oil spill recovery efforts result in little disturbance of this habitat. Recovery is generally complete within 6 months.
Aquatic Invertebrates The side channel of the Fraser River is flooded with water from the main river, and islands, sandbars, and some riparian habitat are inundated. Aquatic invertebrates in the side channel have little exposure to floating oil, and exhibit a range of sensitivity to dissolved hydrocarbon constituents. Little of the oil sinks in this area. Some sensitive species are locally affected.
Low. Aquatic invertebrates are not directly exposed to the spilled oil, and oil spill recovery activities focus on riparian habitat, where oil has stranded.
Spilled CLWB enters the side channel of the Fraser River, moving along it quite rapidly because of the high river flow. Oil spill recovery efforts result in little disturbance of this habitat. Recovery is generally complete within 6 months.
Fish and Fish Eggs Fish, including potentially inward migrating salmon, could be present in the side channel. Eulachon are not likely to use spawning habitat this far up the Fraser River. Mortality of fish is possible in the side channel, because of its small dimensions and turbulent flow, with unweathered CLWB forming droplets in suspension in the river water. The same process will continue in the main Fraser River, but mortality of fish here is unlikely because of the high flow rate, and progressive weathering of the oil.
High although fish mortality is localized in the side channel. Acutely lethal conditions persist for only about one day. Oil spill recovery efforts result in little disturbance of this aquatic habitat. Recovery is generally complete within 6 months.
In-water Amphibians Amphibians may be spawning or juvenile amphibians may be present, but likely in protected areas not exposed to the high river flows. Turtles may be present and may be breeding, but also in more protected areas. Direct mortality is unlikely for turtles, although some limited mortality of amphibians in the side channel, or riparian areas of the main Fraser River is possible.
Low to Medium, because amphibians and turtles are likely to occupy protected areas, not exposed to the main flow of the Fraser River.
Spilled CLWB enters the side channel of the Fraser River, moving along it quite rapidly because of the high river flow. Oil spill recovery efforts result in little disturbance of this habitat. Recovery is generally complete within 6 months.
Terrestrial Receptors
Shoreline and Riparian Vegetation Shoreline and riparian vegetation is oiled along the overland flow path to the gully and side channel, and in riparian areas of the side channel and main Fraser River. Annual plants contacted by the spilled oil are likely to be killed. Leaves of perennial plants, shrubs and trees will also be killed, but these plants are likely to survive and regenerate. Effects extend throughout the riparian areas of the side channel, and where oil accumulates in riparian areas of the main Fraser River, up to 100 km downstream.
High. The combination of direct contact with spilled oil, as well as oil spill recovery activities result in the physical destruction, and then reconstruction of terrestrial habitat near the spill location. Effects on riparian habitat are patchy, but can extend up to 100 km downstream.
The overland flow path and areas around the spill location are heavily disturbed by clean-up activities in the first year following the oil spill. Recovery of terrestrial habitat begins between 12 and 24 months after the spill, and is effectively complete after about 5 years.
Soil Invertebrates Soils are oiled along the overland flow path to the side channel, and in riparian areas of the side channel and main Fraser River. Soil invertebrate communities may be affected by residual hydrocarbon concentrations. Effects extend throughout the riparian areas of the side channel, and where oil accumulates in riparian areas of the main Fraser River, up to 100 km downstream.
Medium, because residual hydrocarbon concentrations in soil are generally patchy, and recolonization from adjacent minimally affected areas proceeds rapidly.
The overland flow path and areas around the spill location are heavily disturbed by clean-up activities in the first year following the oil spill. Recovery of terrestrial habitat begins between 12 and 24 months after the spill, and is effectively complete after about 5 years.
Mammals
Grizzly Bear The grizzly bear as a receptor is also intended to represent other omnivore/carnivores (such as raccoons). A small number of individual animals might come into contact with spilled oil in the overland flow path, the gully, the side channel, or stranded along shorelines of the main Fraser River channel.
Low, because partially oiled animals would not be likely to die as a result of exposure. However, disturbance caused by oil spill recovery activities could cause an alteration of habitat use during the spring, summer and fall.
The overland flow path and areas around the spill location are heavily disturbed by clean-up activities in the first year following the oil spill. Recovery of terrestrial habitat begins between 12 and 24 months after the spill, and is effectively complete after about 5 years.
Moose Moose or other ungulates are potentially affected, as the gully and forested riparian areas of the river could provide sheltering and feeding habitat. Moose tend to be solitary, so effects of external oiling on more than a few individual animals are unlikely.
Low, because moose have a large home range, oil spill recovery activity would quickly cause them to leave the area. However, disturbance caused by oil spill recovery activities could cause an alteration of habitat use during the spring, summer and fall.
The overland flow path and areas around the spill location are heavily disturbed by clean-up activities in the first year following the oil spill. Recovery of terrestrial habitat begins between 12 and 24 months after the spill, and is effectively complete after about 5 years.
Muskrat Muskrat are potentially affected, as the side channel could provide suitable habitat. Muskrat in this habitat could be heavily oiled, causing death. However, effects on more than a few individual animals are unlikely. Mortality becomes less likely as the oil slick spreads on the main Fraser River, although oiling of individual animals may still occur, and mortality is possible.
Localized effects on muskrat could be High, up to and including mortality of individuals inhabiting the side channel, and possibly extending into the main Fraser River channel. Disturbance caused by oil spill recovery activities could also temporarily eliminate their habitat.
The overland flow path and areas around the spill location are heavily disturbed by clean-up activities in the first year following the oil spill. Recovery of terrestrial habitat begins between 12 and 24 months after the spill, and is effectively complete after about five years.
River Otter River otter are potentially affected, as the side channel could provide suitable habitat. Otters in this habitat could be heavily oiled, causing death. However, effects on more than a few individual animals are unlikely. Mortality becomes less likely as the oil slick spreads on the main Fraser River, although oiling of individual animals may still occur, and mortality is possible.
Localized effects on river otter could be High, up to and including mortality of individuals if they occupy a den near the side channel, and possibly extending into the main Fraser River channel. Disturbance caused by oil spill recovery activities could also temporarily eliminate their habitat.
The overland flow path and areas around the spill location are heavily disturbed by clean-up activities in the first year following the oil spill. Recovery of terrestrial habitat begins between 12 and 24 months after the spill, and is effectively complete after about 5 years.
Birds
Bald Eagle Bald eagle would be present during summer, and would likely contact spilled oil while taking fish at the water surface, or as a result of feeding on fish killed by the oil spill. These birds would be partially oiled, and would be further exposed to oil while preening to remove oil from feathers. Such effects could be seen up to 100 km downstream from the spill location.
Medium. Neither partial oiling of feathers, nor incidental oil ingestion is likely to be sufficient to kill exposed bald eagles, but oiled birds may transfer oil to eggs, killing the embryos and resulting in reduced reproductive success. Clean-up activities could also lead to nest abandonment, if nest locations are close to areas of high activity.
One to two years, if clean-up activities result in temporary avoidance of habitat use as a result of disturbance.
Canada Goose Nesting geese or other waterfowl could be exposed to oiling in riparian habitat up to 100 km downstream from the spill location.
High to Medium, depending upon the level of exposure to floating oil, or stranded oil on shoreline habitat. Oiled birds could also transfer oil to eggs, resulting in embryo mortality. Clean-up activities could also lead to nest abandonment, if nest locations are close to areas of high activity.
One to two years, if clean-up activities result in temporary avoidance of habitat use as a result of disturbance.
Great Blue Heron Herons and other wading birds could be exposed to oiling in shallow water or riparian habitat up to 100 km downstream from the spill location.
Medium. Neither partial oiling of feathers, nor incidental oil ingestion is likely to be sufficient to kill exposed birds, but oiled birds may transfer oil to eggs, killing the embryos and resulting in reduced reproductive success. Clean-up activities could also lead to nest abandonment, if nest locations are close to areas of high activity.
One to two years, if clean-up activities result in temporary avoidance of habitat use as a result of disturbance.
Mallard Duck Nesting mallards or other waterfowl could be exposed to oiling in riparian habitat up to 100 km downstream from the spill location.
High to Medium, depending upon the level of exposure to floating oil, or stranded oil in shoreline habitat. High mortality is likely to be observed in oiled ducks. Surviving lightly oiled birds could also transfer oil to eggs, resulting in embryo mortality. Clean-up activities could also lead to nest abandonment, if nest locations are close to areas of high activity.
One to two years, if clean-up activities result in temporary avoidance of habitat use as a result of disturbance.
Spotted Sandpiper Sandpipers and other shorebirds could be exposed to oiling in shallow water or riparian habitat up to 100 km downstream from the spill location.
Medium. Neither partial oiling of feathers, nor incidental oil ingestion is likely to be sufficient to kill exposed birds, but oiled birds may transfer oil to eggs, killing the embryos and resulting in reduced reproductive success. Clean-up activities could also lead to nest abandonment, if nest locations are close to areas of high activity.
One to two years, if clean-up activities result in temporary avoidance of habitat use as a result of disturbance.
Tree Swallow Tree swallows nest in cavities in trees located near the water, and forage over water. Tree swallows may also dip onto the water take emerging insects or drink, or bathe in shallow water pools. These birds could be affected up to 100 km from the spill location.
Medium. Neither partial oiling of feathers, nor incidental oil ingestion is likely to be sufficient to kill exposed birds, but oiled birds may transfer oil to eggs, killing the embryos and resulting in reduced reproductive success. Clean-up activities could also lead to nest abandonment, if nest locations are close to areas of high activity.
One to two years, if clean-up activities result in temporary avoidance of habitat use as a result of disturbance.

Trans Mountain Pipeline ULC Volume 7, Pipeline Facilities Technical Reports Trans Mountain Expansion Project Qualitative Ecological Risk Assessment of Pipeline Spills Technical Report
December, 2013 REP-NEB-TERA-00019
Page 6-83
TABLE 6.25 LIKELY ENVIRONMENTAL EFFECTS OF CLWB SPILL DURING SUMMER TO THE FRASER RIVER NEAR HOPE, BRITISH COLUMBIA
Fraser River, Summer Season LIKELY OIL SPILL EFFECTS
Spatial Extent Magnitude Time to Recovery
Reptiles and air-breathing Amphibians
Adult turtles and amphibians could be present in riparian habitat or backwater areas along the Fraser River. Such animals could be exposed to spilled oil for a distance of up to 100 km from the spill location.
High to Medium. Turtles and amphibians along the shorelines of the river would be less exposed, and effect magnitude would decline with distance downstream and decreasing exposure. The risk of mortality would be greatest in the first 6 km (i.e., the side channel).
The side channel is heavily disturbed by clean-up activities in the first year following the oil spill. Recovery of turtle and amphibian habitat begins about 18 months after the spill, and is effectively complete after 30 months.

Trans Mountain Pipeline ULC Volume 7, Pipeline Facilities Technical Reports Trans Mountain Expansion Project Qualitative Ecological Risk Assessment of Pipeline Spills Technical Report
December, 2013 REP-NEB-TERA-00019
Page 6-84
TABLE 6.26 LIKELY ENVIRONMENTAL EFFECTS OF CLWB SPILL DURING SPRING OR FALL TO THE FRASER RIVER NEAR HOPE, BRITISH COLUMBIA
Fraser River, Spring or Fall Season
LIKELY OIL SPILL EFFECTS
Spatial Extent Magnitude Time to Recovery
AQUATIC RECEPTORS
Aquatic Vegetation The side channel of the Fraser River is somewhat isolated from the main Fraser River because of intermediate water levels. Islands and sandbars are present and visible. Little if any riparian habitat is inundated. Aquatic vegetation in the side channel has little exposure to floating oil, and generally low sensitivity to dissolved hydrocarbon constituents. Little of the oil sinks in this area.
Medium. Some aquatic vegetation is contacted by the spilled oil. Oil spill recovery efforts in the side channel result in damage to the habitat. Oil exiting the side channel to enter the main channel is carried up to 60 km downstream, but little aquatic plant habitat is present in the main channel.
Spilled CLWB enters the side channel of the Fraser River, moving along it and entering the main channel. Because more of the oil is retained in the side channel, more habitat disturbance results from recovery efforts. Recovery is generally complete within 12 to 24 months.
Aquatic Invertebrates The side channel of the Fraser River is somewhat isolated from the main Fraser River because of intermediate water levels. Islands and sandbars are present and visible. Little if any riparian habitat is inundated. Aquatic invertebrates in the side channel have moderate exposure to dissolved hydrocarbon constituents. Little of the oil sinks in this area.
Medium. Some aquatic invertebrates are killed by exposure to dissolved hydrocarbons in the side channel. Oil spill recovery efforts in the side channel result in damage to the habitat. Oil exiting the side channel to enter the main channel is carried up to 60 km downstream, but flow in the river is such that acute toxicity to aquatic invertebrates is unlikely. Some oil sinks and is deposited to sediment in areas of low flow and silty sediment. This aquatic invertebrate habitat remains compromised.
Spilled CLWB enters the side channel of the Fraser River, moving along it and entering the main channel. Because more of the oil is retained in the side channel, more habitat disturbance results from recovery efforts. Efforts to recover sunken oil from backwater areas of silty sediments take longer, but the natural flow regime of the river tends to periodically erode and resuspend sediment in these areas. Recovery is generally complete within 12 to 24 months.
Fish and Fish Eggs Fish, including potentially inward migrating salmon in the fall, could be present in the side channel. Eulachon are not likely to use spring spawning habitat this far up the Fraser River. Mortality of fish is possible in the side channel, because of its small dimensions, but flow characteristics have low turbulence, so droplet formation is limited. Flow is more turbulent in the main Fraser River, but the oil is somewhat weathered by the time it leaves the side channel, and the flow volume is still large, limiting the potential for fish mortality.
Medium, and localized in the side channel. Acutely lethal conditions persist for only about one day. Oil spill recovery efforts result in disturbance of this aquatic habitat. Recovery is generally complete within 12 to 24 months.
In-water Amphibians Amphibians may be spawning in the spring, but likely in protected areas not exposed to the high summer river flows. Turtles may be present and may be breeding, but also in more protected areas. Direct mortality is unlikely for turtles, although some limited mortality of amphibians in the side channel, or riparian areas of the main Fraser River is possible.
Low to Medium, because amphibians and turtles are likely to occupy protected areas, not exposed to the main flow of the Fraser River.
Spilled CLWB enters the side channel of the Fraser River, moving along it with river flow. Oil spill recovery efforts result in disturbance of this habitat. Recovery is generally complete within 12 to 24 months.
TERRESTRIAL RECEPTORS
Shoreline and Riparian Vegetation Some shoreline and riparian vegetation is oiled along the overland flow path to the side channel, but little riparian habitat along the side channel or main Fraser River is contacted by oil, because of intermediate water levels. Annual plants contacted by the spilled oil are likely to be killed. Leaves of perennial plants, shrubs and trees will also be killed, but these plants are likely to survive and regenerate. Effects are largely confined to the overland flow path and the area where the oil enters the side channel.
Low. The combination of direct contact with spilled oil, as well as oil spill recovery activities result in the physical destruction, and then reconstruction of terrestrial habitat near the spill location. Effects on riparian habitat of the side channel and main Fraser River are minimal.
The overland flow path and areas around the spill location are heavily disturbed by clean-up activities in the first year following the oil spill. Recovery of terrestrial habitat begins between 12 and 24 months after the spill, and is effectively complete after about 5 years.
Soil Invertebrates Soils are oiled along the overland flow path to the side channel. Riparian areas of the side channel and main Fraser River are minimally affected.
Low. The combination of direct contact with spilled oil, as well as oil spill recovery activities result in the physical destruction, and then reconstruction of terrestrial habitat near the spill location. Effects on riparian habitat of the side channel and main Fraser River are minimal.
The overland flow path and areas around the spill location are heavily disturbed by clean-up activities in the first year following the oil spill. Recovery of terrestrial habitat begins between 12 and 24 months after the spill, and is effectively complete after about 5 years.
Mammals
Grizzly Bear The grizzly bear as a receptor is also intended to represent other omnivore/carnivores (such as raccoons). A small number of individual animals might come into contact with spilled oil in the overland flow path, the gully, the side channel, or stranded along shorelines of the main Fraser River channel.
Low, because partially oiled animals would not be likely to die as a result of exposure. However, disturbance caused by oil spill recovery activities could cause an alteration of habitat use during the spring, summer and fall.
The overland flow path and areas around the spill location are heavily disturbed by clean-up activities in the first year following the oil spill. Recovery of terrestrial habitat begins between 12 and 24 months after the spill, and is effectively complete after about 5 years.
Moose Moose or other ungulates are potentially affected, as the gully and forested riparian areas of the river could provide sheltering and feeding habitat. Moose tend to be solitary, so effects of external oiling on more than a few individual animals are unlikely.
Low, because moose have a large home range, oil spill recovery activity would quickly cause them to leave the area. However, disturbance caused by oil spill recovery activities could cause an alteration of habitat use during the spring, summer and fall.
The overland flow path and areas around the spill location are heavily disturbed by clean-up activities in the first year following the oil spill. Recovery of terrestrial habitat begins between 12 and 24 months after the spill, and is effectively complete after about 5 years.
Muskrat Muskrat are potentially affected, as the side channel could provide suitable habitat. Muskrat in this habitat could be heavily oiled, causing death. However, effects on more than a few individual animals are unlikely. Mortality becomes less likely as the oil slick spreads on the main Fraser River, although oiling of individual animals may still occur up to 60 km downstream, and mortality is possible.
Localized effects on muskrat could be High, up to and including mortality of individuals inhabiting the side channel, and possibly extending into the main Fraser River channel. Disturbance caused by oil spill recovery activities could also temporarily eliminate their habitat.
The overland flow path and areas around the spill location are heavily disturbed by clean-up activities in the first year following the oil spill. Recovery of terrestrial habitat begins between 12 and 24 months after the spill, and is effectively complete after about 5 years.
River Otter River otter are potentially affected, as the side channel could provide suitable habitat. Otters in this habitat could be heavily oiled, causing death. However, effects on more than a few individual animals are unlikely. Mortality becomes less likely as the oil slick spreads on the main Fraser River, although oiling of individual animals may still occur up to 60 km downstream, and mortality is possible.
Localized effects on river otter could be High, up to and including mortality of individuals if they occupy a den near the side channel, and possibly extending into the main Fraser River channel. Disturbance caused by oil spill recovery activities could also temporarily eliminate their habitat.
The overland flow path and areas around the spill location are heavily disturbed by clean-up activities in the first year following the oil spill. Recovery of terrestrial habitat begins between 12 and 24 months after the spill, and is effectively complete after about 5 years.
Birds
Bald Eagle Bald eagle would be present during spring and fall, and would likely contact spilled oil while taking fish at the water surface, or as a result of feeding on fish killed by the oil spill. These birds would be partially oiled, and would be further exposed to oil while preening to remove oil from feathers. Such effects could be seen up to 100 km downstream from the spill location.
Medium. Neither partial oiling of feathers, nor incidental oil ingestion is likely to be sufficient to kill exposed bald eagles, but oiled birds may transfer oil to eggs, killing the embryos and resulting in reduced reproductive success. Clean-up activities could also lead to nest abandonment in spring, if nest locations are close to areas of high activity.
One to two years, if clean-up activities result in temporary avoidance of habitat use as a result of disturbance.
Canada Goose Nesting geese or other waterfowl could be exposed to oil in slicks or stranded on shorelines up to 60 km downstream from the spill location.
High to Medium, depending upon the level of exposure to floating oil, or stranded oil on shoreline habitat. Oiled birds could also transfer oil to eggs in spring, resulting in embryo mortality. Clean-up activities could also lead to nest abandonment in spring, if nest locations are close to areas of high activity.
One to two years, if clean-up activities result in temporary avoidance of habitat use as a result of disturbance.
Great Blue Heron Herons and other wading birds could be exposed to oil in slicks or stranded on shorelines up to 60 km downstream from the spill location.
Medium. Neither partial oiling of feathers, nor incidental oil ingestion is likely to be sufficient to kill exposed birds, but oiled birds may transfer oil to eggs in spring, killing the embryos and resulting in reduced reproductive success. Clean-up activities could also lead to nest abandonment in spring, if nest locations are close to areas of high activity.
One to two years, if clean-up activities result in temporary avoidance of habitat use as a result of disturbance.
Mallard Duck Nesting mallards or other waterfowl could be exposed to oil in slicks or stranded on shorelines up to 60 km downstream from the spill location.
High to Medium, depending upon the level of exposure to floating oil, or stranded oil in shoreline habitat. High mortality is likely to be observed in oiled ducks. Surviving lightly oiled birds could also transfer oil to eggs, resulting in embryo mortality in spring. Clean-up activities could also lead to nest abandonment in spring, if nest locations are close to areas of high activity.
One to two years, if clean-up activities result in temporary avoidance of habitat use as a result of disturbance.
Spotted Sandpiper Sandpipers and other shorebirds could be exposed to oil stranded on shorelines up to 60 km downstream from the spill location.
Medium. Neither partial oiling of feathers, nor incidental oil ingestion is likely to be sufficient to kill exposed birds, but oiled birds may transfer oil to eggs in spring, killing the embryos and resulting in reduced reproductive success. Clean-up activities could also lead to nest abandonment in spring, if nest locations are close to areas of high activity.
One to two years, if clean-up activities result in temporary avoidance of habitat use as a result of disturbance.
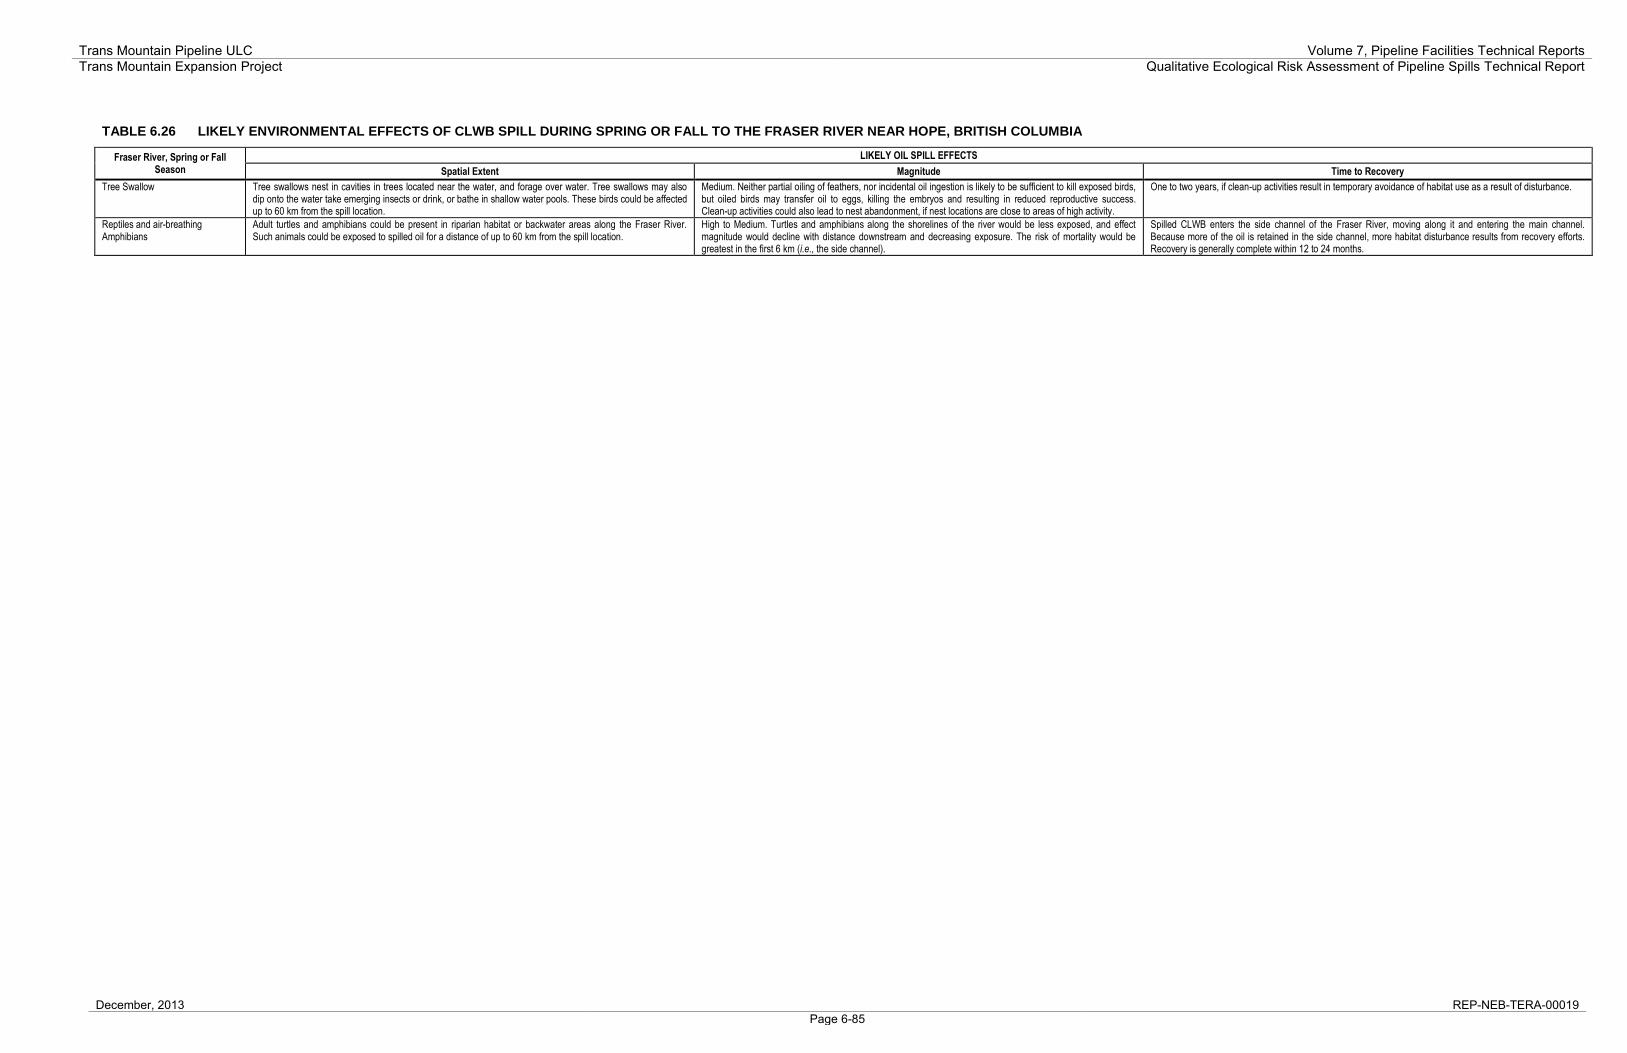
Trans Mountain Pipeline ULC Volume 7, Pipeline Facilities Technical Reports Trans Mountain Expansion Project Qualitative Ecological Risk Assessment of Pipeline Spills Technical Report
December, 2013 REP-NEB-TERA-00019
Page 6-85
TABLE 6.26 LIKELY ENVIRONMENTAL EFFECTS OF CLWB SPILL DURING SPRING OR FALL TO THE FRASER RIVER NEAR HOPE, BRITISH COLUMBIA
Fraser River, Spring or Fall Season
LIKELY OIL SPILL EFFECTS
Spatial Extent Magnitude Time to Recovery
Tree Swallow Tree swallows nest in cavities in trees located near the water, and forage over water. Tree swallows may also dip onto the water take emerging insects or drink, or bathe in shallow water pools. These birds could be affected up to 60 km from the spill location.
Medium. Neither partial oiling of feathers, nor incidental oil ingestion is likely to be sufficient to kill exposed birds, but oiled birds may transfer oil to eggs, killing the embryos and resulting in reduced reproductive success. Clean-up activities could also lead to nest abandonment, if nest locations are close to areas of high activity.
One to two years, if clean-up activities result in temporary avoidance of habitat use as a result of disturbance.
Reptiles and air-breathing Amphibians
Adult turtles and amphibians could be present in riparian habitat or backwater areas along the Fraser River. Such animals could be exposed to spilled oil for a distance of up to 60 km from the spill location.
High to Medium. Turtles and amphibians along the shorelines of the river would be less exposed, and effect magnitude would decline with distance downstream and decreasing exposure. The risk of mortality would be greatest in the first 6 km (i.e., the side channel).
Spilled CLWB enters the side channel of the Fraser River, moving along it and entering the main channel. Because more of the oil is retained in the side channel, more habitat disturbance results from recovery efforts. Recovery is generally complete within 12 to 24 months.

Trans Mountain Pipeline ULC Volume 7, Pipeline Facilities Technical Reports Trans Mountain Expansion Project Qualitative Ecological Risk Assessment of
Pipeline Spills Technical Report
December, 2013 REP-NEB-TERA-00019
Page 6-86
6.4.3.4. Environmental Effects Summary for Spill Scenarios at RK 1072.8
A hypothetical spill scenario has been developed to describe the likely fate and behaviour of CLWB spilled as a result of a pipeline rupture near RK 1072.8. Potential environmental effects likely to accrue to ecological receptors as a result of such hypothetical spills have been outlined in Table 6.24 through Table 6.26.
For the Fraser River in winter (Table 6.24), it is assumed that both the side channel and the main river channel will be ice free and most of the spilled oil is initially distributed along the side channel, a distance of approximately 6 km. Oil spill recovery efforts would result in environmental effects along the overland flowpath, and in the side channel to the Fraser River. Some of the relevant ecological receptors would be dormant (e.g., plants, amphibians, reptiles, and mammals that hibernate) or absent (e.g., some migratory birds), although birds such as bald eagle and potentially some waterfowl could be present through the winter due to the ice free conditions. High magnitude oil spill effects would therefore occur along the overland flowpath, where environmental effects associated with oil spill recovery efforts would follow the oil spill effects, and in the gully leading to the river, and in the side channel of the Fraser River, where heavy oiling of the water surface and shorelines would occur, due to the small dimensions of the channel. Oil spill effect magnitudes for aquatic receptors in the side channel would be high to medium, taking into consideration both oil effects and oil spill recovery effects. Mortality of fish in the main channel of the Fraser River is unlikely, due to weathering of the oil that would occur before it reached the main channel, as well as to the large flow volume in the river. Effect magnitudes on shoreline and riparian vegetation and soil invertebrates would be low, due partly to winter dormancy, and particularly to the low level of exposure given low winter water levels. Effect magnitudes for mammals and birds would generally be low due to lack of exposure for migratory birds or hibernating mammals, however, higher effect magnitudes would be seen for semi-aquatic mammals in the side channel and Fraser River due to oiling of fur. Higher effect magnitudes could also be seen for wintering birds such as ducks, depending upon the numbers present. Recovery of the terrestrial environment would take approximately 18 months to five years, assuming that the spill occurs in January, and physical works associated with oil spill recovery are ongoing through until the late summer. For the Fraser River in summer (Table 6.25), flow in the river is peaking, due to snow melt in its mountain headwaters. Most of the spilled oil reaches the side channel, and is advected downstream to the confluence with the main Fraser River. Effect magnitude on the overland flowpath and in the gully leading to the side channel is high but localized, and is addressed by physical remediation and re-seeding of affected areas. Effects on aquatic receptors are variable. Effects on aquatic vegetation are of low magnitude as the spilled oil largely floats on the surface of the side channel, so vegetation has little direct exposure. Similarly effects on benthic invertebrates are generally low. There is potential for effects on fish and amphibians in the side channel, due to expected high dissolved hydrocarbon concentrations. Widespread mortality of fish in the main Fraser River is unlikely though. Much of the spilled oil becomes stranded along shorelines, and in riparian areas where vegetation is oiled. Effects on shoreline and riparian vegetation and soil invertebrates are high on the overland flowpath, and along the side channel, becoming medium to low along the main Fraser River channel up to 100 km downstream, due to the patchy distribution of the oil. Whereas the overland flowpath is subject to intensive oil spill clean-up which is initially destructive to habitat, areas riparian to the Fraser river are remediated with less intrusive methods, and a greater emphasis on natural attenuation of spilled oil residues at low levels. Environmental effects on mammal populations are high for truly semi-aquatic species such as muskrat, beaver, otter and mink in the side channel, and it is assumed that some of these animals could also be sufficiently oiled to cause death in areas downstream in the main Fraser River channel. For mammals that are larger or that are less adapted to the aquatic environment, such as bears, raccoons and moose, effects are expected to be medium, and may arise from disturbance of habitat, as well as from oiling of fur, or ingestion of crude oil. For birds, guilds such as ducks and geese are considered to be most exposed to spilled oil, and effects on these species could be high (including mortality) to medium, including reproductive effects caused by transfer of oil to eggs, with resulting egg mortality, or effects on habitat quality caused by disturbance arising from oil spill response efforts. These effects could extend for up to 100 km downstream. Other species, such as raptors, wading birds, shorebirds, and swallows could experience medium effect magnitudes, reflecting both oil exposure and disturbance of habitat following the oil spill. Recovery times for spills in the summer could be as short as 12 months for some receptors, or up to five years where effects occur at the population level.

Trans Mountain Pipeline ULC Volume 7, Pipeline Facilities Technical Reports Trans Mountain Expansion Project Qualitative Ecological Risk Assessment of
Pipeline Spills Technical Report
December, 2013 REP-NEB-TERA-00019
Page 6-87
For the Fraser River in spring and fall (Table 6.26), flow is at an intermediate level, typically rising in the spring due to the onset of freshet, or falling in the fall, as freshet recedes. Most of the spilled oil reaches and is advected downstream in the side channel and enters the main Fraser River. Effect magnitude on the overland flowpath and in the gully leading to the side channel is high but localized, and is addressed by physical remediation and re-seeding of affected areas. Effects on aquatic receptors, including aquatic vegetation, invertebrates, fish and amphibians, are generally medium to low in the side channel, and low in the Fraser River, except for effects on amphibians in spring, which could be high if oil enters habitat where amphibian eggs or larvae are present. Effects farther downstream in the main Fraser River are generally low, due to increasing dilution and dispersion of the oil. Effects on shoreline and riparian vegetation and soil invertebrates are high on the overland flowpath, but low along the Fraser River due to the low level of exposure. The overland flowpath is subject to intensive oil spill clean-up which is initially destructive to habitat. Environmental effects on mammal populations are greatest for truly semi-aquatic species such as muskrat, beaver, otter and mink, for which it is assumed that mortality could occur throughout a river reach of up to 60 km. For mammals that are larger or that are less adapted to the aquatic environment, such as bears, raccoons and moose, effects are expected to be medium, and may arise from disturbance of habitat, as well as from oiling of fur, or ingestion of crude oil. For birds, guilds such as ducks and geese are considered to be most exposed to spilled oil, and effects on these species could be high (including mortality) to medium, including reproductive effects caused by transfer of oil to eggs in spring, with resulting egg mortality, or effects on habitat quality caused by disturbance arising from oil spill response efforts. Other species, such as raptors, wading birds, shorebirds, and swallows could experience medium effect magnitudes, reflecting both oil exposure and disturbance of habitat following the oil spill. Recovery times for spills in the spring and fall could be as short as 12 months for some receptors, or up to five years where effects occur at the population level.
6.4.4. Fraser River and Delta near the Port Mann Bridge at RK 1167.5
The hypothetical spill scenario involves a release of 1,250 m3 of CLWB at RK 1167.5. Details of the local environment can be found in Section 6.1.2.4. The hypothetical spill location for all of the stochastic model simulations was located adjacent to railway yards on the south side of the Fraser River, a short distance downstream from the Port Mann Bridge. At this location, the pipeline is within a few hundred metres of the river, and it is likely that culverts and other drainage systems would rapidly transport virtually all of the spilled oil from the spill location to the river. For this reason, there was assumed to be no hold-up of spilled crude oil on land, although it is possible that by blocking such culverts or ditches as an early emergency response action, a considerable amount of oil could be prevented from reaching the water. The Fraser River at this location is about 450 m wide, with a gentle meander and a sand bed. Shorelines are highly developed with wharves, pilings, log booms and rip-rap. Flows are strongly seasonal, ranging from approximately 7,000 to 12,000 m3/s in June (during freshet), to 2,000 m3/s or lower during winter.
This spill example is evaluated with particular reference to four cases for comparison: the Kalamazoo River oil spill, since that oil spill involved a similar form of diluted bitumen; the DM 932 spill in the lower Mississippi River, since that involved a heavy oil, and a large river/estuary system with high suspended sediment load. Consideration is also given to information that was developed during the Gainford experimental study (Witt O‟Brien‟s et al. 2013) and as part of the proposed Vancouver Airport Fuel Delivery Project (VAFFC 2012a).
Three sets of environmental conditions are considered for this spill example. These are:
A winter condition between December and March. Air temperatures are assumed to be around the freezing mark, but snow cover is not guaranteed, and the river is ice-free. The river flow is in the low range (around 2,000 m3/s).
A summer condition between June and August, with air temperatures in the warm range (15°C to 25°C). The river is in freshet, with flow greater than 6,000 m3/s, and potentially approaching 12,000 m3/s.
A spring or fall condition between April and June, or September and November. The river flow is in a moderate range, at around 5,000 m3/s, and the air temperatures are cool, between the freezing point and 15°C.

Trans Mountain Pipeline ULC Volume 7, Pipeline Facilities Technical Reports Trans Mountain Expansion Project Qualitative Ecological Risk Assessment of
Pipeline Spills Technical Report
December, 2013 REP-NEB-TERA-00019
Page 6-88
The ecological receptors considered previously for other hypothetical spill locations will also be considered in relation to potential crude oil spills affecting the Fraser River Delta. It is noted, however, that the potential for finding freshwater turtles and amphibians decreases as the river water becomes brackish. Two species of sea turtle (Pacific green turtle and Pacific leatherback turtle) are reported from British Columbia waters, but reproduce in more southerly areas, and would have a very low probability of being encountered in the Fraser River Delta. During the regulatory review of the proposed Vancouver Airport Fuel Delivery Project, which would have resulted in the construction of a marine terminal to receive imported aviation fuel near the mouth of the Fraser River, federal authorities expressed particular interest in the potential environmental effects of spilled aviation fuel on the Fraser River Estuary, and specifically the environmental effects of spilled fuel on biofilm and migratory birds. As a result, the proponents undertook investigations into the characteristics of the biofilm, conducted oil spill fate modeling to evaluate interactions between spilled aviation fuel and ecological receptors, and conducted investigations into the presence of western sandpiper in the Delta, as well as the feeding behaviour of the sandpipers, which are uniquely reliant upon the biofilm as a source of nutrition while migrating. These studies were reported by the proponents (VAFFC 2012a, b) and underwent regulatory review (Environment Canada 2012). Based on consultation with regulatory authorities carried out for the Trans Mountain Project, as well as consideration of concerns raised during the Vancouver Airport Fuel Delivery Project, consideration is also given here to two ecological receptors not specifically considered elsewhere, namely: biofilm, and Western sandpiper (Calidris mauri).
Biofilm (also sometimes referred to as microphytobenthos) is the name given to an assemblage of algal cells, rotifers, protozoans, bacteria and detritus found as a thin layer on the surface of mudflats. Forming a thin layer, biofilm is easily disturbed, although it may potentially help to stabilize the sediment surface from gentle wave action. Studies carried out in early 2012 described two types of organic films on the mudflat at Roberts Bank: a rusty-coloured organic film interpreted as diatoms, and a grey organic floc layer interpreted as extracellular polysaccharide material. Both types of films were observed on cleared plots within as little as 24 hours after clearing (VAFFC 2012a). The principal algal components of the biofilm were found to be pennate diatoms, including Navicula spp. And Pleurosigma spp. The biofilm and underlying mud also support benthic invertebrate species such as polychaete worms and small crustaceans.
The western sandpiper is a small shorebird, approximately 15 to 17 cm inches in length, with a wingspan of approximately 25 to 35 cm. It has white undersides, a long bill with a little droop at the end, long legs and slightly webbed feet. In the summer, its crown and upper back are a rusty brown. It has a black line on its rump that runs to its tail. In the winter, its crown and upper back are gray. Males and females look alike, but the female is a little larger and has a slightly longer bill (Natureworks 2013). The Western sandpiper nests on tundra in eastern Siberia and Alaska, and summers in the southern United States. Being one of the most abundant shorebirds in North America, its importance in the context of the Fraser River Delta is that during migration in spring. Roberts Bank can host over one million Western sandpiper over a 15 day period (Kuwae et al. 2008). During this stopover, the sandpipers feed heavily on biofilm, representing approximately 50% (±18%) of their caloric requirement, with the balance being provided by small invertebrates (Kuwae et al. 2008). While Western sandpiper can be found throughout the mudflat areas of Sturgeon and Roberts Banks and Boundary Bay, an area south of Brunswick Point appears to be particularly important as a congregating and feeding area (VAFFC 2012a).
6.4.4.1. Winter Condition
This spill condition is evaluated with primary reference to stochastic spill modeling results representing the months of November, December, January, February and March from EBA (2013). Spill summary information is presented in Appendix B. In winter conditions, at this low elevation and proximity to the ocean, it is unlikely that snowpack would be present to influence the behaviour of the spilled CLWB. It is assumed that culverts and ditching are present close to the pipeline, and that this drainage system quickly and effectively conveys virtually all of the spilled oil directly to the river over a period of several hours. Although the river stage is low, transit times for the spilled oil to reach the river mouth are short, on the order of one to two days, depending upon the tidal state at the time of spill initiation.

Trans Mountain Pipeline ULC Volume 7, Pipeline Facilities Technical Reports Trans Mountain Expansion Project Qualitative Ecological Risk Assessment of
Pipeline Spills Technical Report
December, 2013 REP-NEB-TERA-00019
Page 6-89
Frequent contact with shorelines acts to hold up some of the spilled oil, and it is possible that emergency responders could trap and recover some of the spilled oil, particularly in the main channel, before it reached the mouth of the Fraser River. Failing this, oil entering the main channel would be advected downstream. Most of the spilled oil remains confined to the main river channel, although a small amount enters the north channel but generally strands within a short distance.
The probability of oil presence on the surface of the river exceeds 90% between the Port Mann Bridge and a point downstream of Annacis Island. There is about a 50% probability of oil on the surface of the water reaching the islands and marshes near Port Guichon, and about a 5% to 10% probability of oil on the surface of the water exiting from the mouth of the river, into the Strait of Georgia. This represents a small amount of spilled crude oil, and the probability of oil stranding on Roberts Bank or other mudflats is low. As will be seen in other seasonal simulations, oil leaving via the main river channel tends to be swept out into the Strait of Georgia, and little if any strands in the immediate vicinity of the Delta.
The probability of shoreline oiling is high (generally 60% to 100% between the Port Mann Bridge and the upstream end of Annacis Island, and 60% to 90% along the west and south shorelines of Annacis Island), although lower on the south shoreline of the Fraser River in this area. Lower probability of shoreline oiling (20% to 60%) generally prevails between the middle of Annacis Island and the George Massey Tunnel. Beyond the George Massey Tunnel, the probability of shoreline oiling falls and is generally less than 10%, with most occurring along the main river channel. Some oil is also entrained into the river channels around the islands and marshes near Ladner and Port Guichon, but the probability of oil stranding in these areas is relatively low.
Mass balance plots (Appendix B) show that a large fraction of the spilled crude oil (>80%) has stranded along river shorelines within three days of spill initiation. About 11% of the crude oil has evaporated, and <5% remains on the surface of the water. Small amounts of the oil (generally <1%) also sink, undergo biodegradation, or dissolve into the water. Formation of OMA and dispersion of oil into the water are not predicted to occur to any meaningful extent (each representing <0.1% of the spilled oil).
Weathering CLWB is not likely to achieve a density greater than that of brackish water within 10 days of being spilled (Witt O‟Brien‟s et al. 2013). The spilled oil therefore floats until it strands on shorelines. As it weathers, it becomes more viscous and thicker, but strands before its density approaches or exceeds that of the water. Little oil is entrained in the water column due to the viscosity of the oil and the relatively low turbulence of the river flow. Although the river has relatively high turbidity, turbidity is at a seasonally low level due to low water flow. The water is brackish, so OMA formation is limited primarily by the low levels of suspended oil droplets, and low suspended sediment concentrations. There is a risk that oil stranded on shorelines will acquire additional density as a result of adhering or intermixed sand particles as the oil weathers, so that the weathered oil-sand mixture may sink if it is subsequently eroded or flooded before it can be recovered. Owing to winter conditions, many of the ecological receptors that could potentially be exposed are absent, or dormant.
Table 6.27 provides an evaluation of the likely spatial extent, magnitude, duration, and reversibility of environmental effects on each ecological receptor group that would be caused by an accidental spill of CLWB near RK 1167.5 during the winter. In the upper reaches, the river channel is bordered by rip-rap, rock, and beach (Harper 2013), although as noted by Danchuk (2009), the river stage may substantially alter the characteristics of exposed shorelines. At low river flows, little shoreline vegetation or rip-rap would be exposed to flowing water or oil, and most of the exposed shoreline would be sandy or muddy. The lower river reaches and Delta have a greater amount of fringing marsh (Harper 2013), with relatively less artificial shoreline. During winter conditions, most migratory birds would be at their wintering grounds, although the Delta is noted as high quality wintering habitat for raptors, waterfowl, and many shorebirds, particularly in sheltered habitat areas like side channels and wetland. It is less likely that large mammals (such as bear or moose) would be present in this predominantly urban landscape, however, other wildlife species such as raccoons, foxes, deer, otter and muskrat would be present and active year-round. Effects on these wildlife receptors would likely be limited to a few individuals, rather than larger numbers that would affect the viability of regional populations.

Trans Mountain Pipeline ULC Volume 7, Pipeline FacilitiesTechnical Reports Trans Mountain Expansion Project Qualitative Ecological Risk Assessment of Pipeline Spills Technical Report
December, 2013 REP-NEB-TERA-00019
Page 6-90
TABLE 6.27 LIKELY ENVIRONMENTAL EFFECTS OF CLWB SPILL DURING WINTER TO THE FRASER RIVER AND DELTA NEAR THE PORT MANN BRIDGE, BRITISH COLUMBIA
Fraser River Delta, Winter Conditions
LIKELY OIL SPILL EFFECTS
Spatial Extent and Boundaries of Effects Effect Magnitude Time to Recovery
Aquatic Receptors
Biofilm Biofilm of variable quality will be present wherever sediments are exposed and remain moist at low tide, along the Fraser River channels and on the Banks and mudflats, but particularly in more protected areas and on more stable substrates. Biofilm will not be present on the river bed, generally, as a result of poor light penetration and the shifting sand nature of the river bed. The probability of shoreline oiling in the river is greatest along the south shore between the Port Mann Bridge and Annacis Island, becoming medium in the vicinity of the island, medium to low between the downstream end of Annacis Island and the George Massey Tunnel, and low downstream of the George Massey Tunnel. Sturgeon Bank, Roberts Bank, and the mudflats of Boundary Bay are not significantly exposed to oiling.
Variable, with a High effect magnitude in areas along the river shorelines where oiling is heavy; becoming Low downstream of the George Massey tunnel, and Negligible on the Banks and Boundary Bay.
Short. Biofilm has been observed to re-form within 24 hours following removal from mudflats (VAFFC 2012a), and it is likely that once shoreline clean-up has taken place, biofilm will readily regenerate.
Aquatic Vegetation Aquatic vegetation is not expected to be a significant component in the main stem of the river, and will be senescent during the winter months in wetland areas that would otherwise be more productive.
Medium to Low. Aquatic vegetation is not actively growing at the time of the spill. However, oil spill recovery activities may result in some damage to oiled shorelines in the lower part of the river. The probability of shoreline oiling decreases substantially below the George Massey Tunnel.
Oil spill recovery efforts along the river channel and in wetland areas result in some disturbance of this habitat, but erosion and deposition of sediment during and after the summer high flow period effectively restore this habitat, so that effects persist for 6 to 18 months.
Aquatic Invertebrates Aquatic invertebrates are present in the substrates of the main Fraser River, and in wetland and side-channel areas. Effects on the benthic community are low, however, as a result of the small amount of spilled hydrocarbon that becomes dissolved in the river water, and the large river flow.
Low in the main Fraser River and downstream areas, as a result of the small amount of oil that becomes dissolved, and the large size of the river.
Short. Effects on the benthic community are minor, and rapidly reversible.
Fish and Fish Eggs Fish are present in the main Fraser River, but it is not a major migratory period for salmon or eulachon, although steelhead could be migrating up the river during the winter period. Mortality of fish in the main Fraser River is unlikely as a result of the large volume of water flowing in the river and the low probability of oil droplet formation.
Low in the main Fraser River and downstream areas, as a result of the small amount of oil that becomes dissolved, and the large size of the river.
Short. Effects on the fish community are minor, and rapidly reversible.
In-water Amphibians Juvenile amphibians are not present in winter conditions. Adult amphibians may be overwintering in the sediments of the protected areas in the upstream portion of the river, but are minimally affected. The presence of amphibians becomes less likely as the river becomes more brackish, downstream.
Low, as a result of the low numbers expected to be present in this habitat, and the overwintering dormancy of any animals that may be present.
Short. Effects on amphibians are minor, and rapidly reversible.
Terrestrial Receptors
Shoreline and Riparian Vegetation The overland flowpath comprises industrial lands, ditches and culverts. Little if any shoreline riparian habitat of the Fraser River is affected, as a result of low winter water flow rates. Water levels in the Delta and on the Banks remain within normal tidal ranges, so shoreline vegetation is not materially affected.
Low along the overland flowpath, as a result of the industrialized nature of the landscape. Low for shoreline communities along the river and in the Delta, as a result of lack of exposure to oiling.
Ditches and culverts of the overland flowpath are remediated and restored within weeks, with negligible effects on ecological receptors. No material effects on other shoreline soils or vegetation communities of the river and Delta.
Soil Invertebrates The overland flowpath comprises industrial lands, ditches and culverts. Little if any shoreline habitat of the Fraser River is affected, as a result of low winter water flow rates. Water levels in the Delta and on the Banks remain within normal tidal ranges, so shoreline soil invertebrate communities are not materially affected.
Low along the overland flowpath, as a result of the industrialized nature of the landscape. Low for shoreline communities along the river and in the Delta, as a result of lack of exposure to oiling.
Ditches and culverts of the overland flowpath are remediated and restored within weeks, with negligible effects on ecological receptors. No material effects on other shoreline soils or invertebrate communities of the river and Delta.
Mammals
Grizzly Bear The grizzly bear as a receptor is also intended to represent other omnivores and carnivores (such as raccoons and foxes), some of which may be winter-active in the lower mainland of British Columbia, even if grizzly bear are not present. A small number of individual animals might come into contact with spilled oil in the overland flowpath, or stranded along shorelines of the Fraser River and Delta.
Low, because mild winter conditions reduce the probability that partially oiled animals would die as a result of exposure. However, disturbance caused by oil spill recovery activities could cause an alteration of habitat use during the spring, summer and fall.
Ditches and culverts of the overland flowpath are remediated and restored within weeks, with negligible effects on ecological receptors. No material effects on other shoreline soils or invertebrate communities of the river and Delta.
Moose It is unlikely that moose would be exposed, but other ungulates such as deer could use habitat along the river or in the Delta. Effects of external oiling on more than a few individual animals are unlikely.
Low, because soil spill clean-up activities will largely be confined to SCAT, and disturbance of habitat where deer or other ungulates are present is likely to be short-term and intermittent.
Ditches and culverts of the overland flowpath are remediated and restored within weeks, with negligible effects on ecological receptors. No material effects on other shoreline soils and terrestrial habitats of the river and Delta.
Muskrat Muskrat are potentially affected, as they could be present along the river and in side channels and wetland areas downstream from the George Massey Tunnel. However, little of this habitat is predicted to be affected, and effects on more than a few individual animals are unlikely.
Localized effects on muskrat could be High, up to and including mortality of individuals inhabiting the main Fraser River channel or some side channels. Oil spill recovery activities and SCAT could also temporarily disturb their habitat.
Ditches and culverts of the overland flowpath are remediated and restored within weeks, with negligible effects on ecological receptors. Oiling of individual muskrat causes some mortality but such areas would be re-colonized within 12 to 24 months following shoreline clean-up.
River Otter Otters are potentially affected, as they could be present along the river and in side channels and wetland areas downstream from the George Massey Tunnel. However, little of this habitat is predicted to be affected, and effects on more than a few individual animals are unlikely.
Localized effects on river otter could be High, up to and including mortality of individuals if they occupy habitat in the main Fraser River channel, or some side channels. Oil spill recovery activities and SCAT could also temporarily disturb their habitat.
Ditches and culverts of the overland flowpath are remediated and restored within weeks, with negligible effects on ecological receptors. Oiling of individual otters causes some mortality but such areas would be re-colonized within 12 to 24 months following shoreline clean-up.
Birds
Bald Eagle Bald eagle, as well as many other raptors, are present year-round. Individual birds could become oiled through feeding on dead fish or other carrion, or by taking fish from the water surface through an oil slick. However, the probability of oil presence on the water surface is greatest in the main river channel, and much lower in side channels and sloughs near Ladner. Likewise, the probability of shoreline oiling decreases substantially downstream of the George Massey Tunnel.
Low. Partial oiling of plumage is not likely to result in mortality. Disturbance caused by oil spill recovery activities could also temporarily disrupt habitat utilization.
One to 2 years, if clean-up activities result in temporary avoidance of habitat use as a result of disturbance.
Canada Goose The Fraser River Delta provides important wintering habitat for a wide range of geese, ducks and swans. Individual birds could become oiled while swimming through an oil slick, or foraging along shorelines. However, the probability of oil presence on the water surface is greatest in the main river channel, and much lower in side channels and sloughs near Ladner. Likewise, the probability of shoreline oiling decreases substantially downstream of the George Massey Tunnel. Geese are likely to spend much of their time foraging in farmland on Westham Island and near Ladner.
Generally Low, as a result of low level of exposure, although individual birds could die if more heavily oiled. One to 2 years, if clean-up activities result in temporary avoidance of habitat use as a result of disturbance.
Great Blue Heron The Fraser River Delta provides important wintering habitat for herons. Individual birds could become oiled while foraging in shallow water or along shorelines. However, the probability of oil presence on the water surface is greatest in the main river channel, and much lower in side channels and sloughs near Ladner. Likewise, the probability of shoreline oiling decreases substantially downstream of the George Massey Tunnel. Herons also utilize terrestrial habitat and often hunt for voles in farmland during winter.
Generally Low, as a result of low level of exposure, although individual birds could die if more heavily oiled. One to 2 years, if clean-up activities result in temporary avoidance of habitat use as a result of disturbance.

Trans Mountain Pipeline ULC Volume 7, Pipeline FacilitiesTechnical Reports Trans Mountain Expansion Project Qualitative Ecological Risk Assessment of Pipeline Spills Technical Report
December, 2013 REP-NEB-TERA-00019
Page 6-91
TABLE 6.27 LIKELY ENVIRONMENTAL EFFECTS OF CLWB SPILL DURING WINTER TO THE FRASER RIVER AND DELTA NEAR THE PORT MANN BRIDGE, BRITISH COLUMBIA
Fraser River Delta, Winter Conditions
LIKELY OIL SPILL EFFECTS
Spatial Extent and Boundaries of Effects Effect Magnitude Time to Recovery
Mallard The Fraser River Delta provides important wintering habitat for a wide range of geese, ducks and swans. Individual birds could become oiled while swimming through an oil slick, or foraging along shorelines. However, the probability of oil presence on the water surface is greatest in the main river channel, and much lower in side channels and sloughs near Ladner. Likewise, the probability of shoreline oiling decreases substantially downstream of the George Massey Tunnel. Ducks and swans generally would have greater exposure to oil than geese, as a result of their more aquatic habits.
Generally Medium to High. Oil presence on the water surface and stranded along shorelines is most likely in the main river channel, and Low elsewhere, including side channels and sloughs, and in the more marine environment of Roberts and Sturgeon Banks. Individuals and groups of birds could die (giving a High effect magnitude) if heavily oiled in the main river channel. Mortality is less likely elsewhere as a result of lower exposure.
One to 2 years, if clean-up activities result in temporary avoidance of habitat use as a result of disturbance.
Spotted Sandpiper Not likely to be affected as the winter range is south of the pipeline corridor in British Columbia. Low, as a result of lack of exposure. Six months to 1 year, if clean-up activities result in temporary avoidance of habitat use as a result of disturbance.
Western Sandpiper Not likely to be affected as the winter range is south of the pipeline corridor in British Columbia. Low, as a result of lack of exposure. Not Applicable as a result of low probability of shoreline oiling in the Banks.
Tree Swallow Not likely to be affected as the winter range is south of the pipeline corridor in British Columbia. Low, as a result of lack of exposure. One to 2 years, if clean-up activities result in temporary avoidance of habitat use as a result of disturbance.
Reptiles and air-breathing Amphibians
The only native turtle likely to be found along the Fraser River is the Western painted turtle, found in low numbers in parts of the Fraser Valley from Vancouver to Hope. The presence of turtles and amphibians becomes less likely as the waters of the estuary become more brackish.
Low, as a result of lack of exposure. Six months to 1 year, if clean-up activities result in temporary avoidance of habitat use as a result of disturbance.

Trans Mountain Pipeline ULC Volume 7, Pipeline Facilities Technical Reports Trans Mountain Expansion Project Qualitative Ecological Risk Assessment of
Pipeline Spills Technical Report
December, 2013 REP-NEB-TERA-00019
Page 6-92
Effects on fish and fish habitat, as well as benthic invertebrates and aquatic vegetation would be limited in spatial extent. The Fraser River provides fish habitat and is a major migration route for Pacific salmon, but winter conditions are not the primary season for such migrations. The main stem of the Fraser River is not likely to experience fish kills due to the large volume of flowing water, the low turbulence and limited potential for oil droplet formation, as indicated by the very small fraction of the spilled CLWB predicted to become dissolved in the water.
Oil spill recovery effects on the main channel of the Fraser River, and in marsh areas near Ladner and Port Guichon, would likely be substantial, leading to physical habitat disturbance. Depending upon the receptor group, the process of restoration and recovery could take anywhere from 18 months to five years.
6.4.4.2. Summer Condition
This spill condition is evaluated with primary reference to stochastic spill modeling results representing the months of May, June and July from EBA (2013). Spill summary information is presented in Appendix B. In summer conditions, it is assumed that the river is at or near peak flow due to the freshet. It is assumed that culverts and ditching are present close to the pipeline, and that this drainage system quickly and effectively conveys virtually all of the spilled oil directly to the river over a period of several hours. Although the river stage is low, transit times for the spilled oil to reach the river mouth are short, on the order of one day. Tidal state is less important in summer than in winter, due to the high water level and flow rate which overwhelm the tidal influence in the upper part of the river.
Frequent contact with shorelines acts to hold up some of the spilled oil, but most of the oil would be rapidly advected downstream. Less of the oil is stranded along shorelines than under winter conditions, and more remains on the water surface, having been discharged into the Strait of Georgia. As in winter, most of the spilled oil is transported along the main river channel. Very little enters the north channel, and this oil generally strands within a short distance. Rather more oil, however, is transported into side channels near Ladner and Port Guichon, and most of this oil is likely to become stranded in the side channels, wetlands and sloughs.
The probability of oil presence on the surface of the river exceeds 90% between the Port Mann Bridge and a point downstream of the George Massey Tunnel. From there to the mouth of the river, the probability of oil on the surface is between 60% and 80%. There is about a 40% probability of oil on the surface of the water entering the side channels and marshes near Ladner and Port Guichon. Oil that reaches the mouth of the river is discharged into the Strait of Georgia with considerable momentum, so that it is likely to disperse to the north or south in the Strait and does not have a high probability of directly affecting the Sturgeon or Roberts Banks. It is more likely that this oil will affect shorelines on the opposite side of the Strait.
The probability of shoreline oiling is high (generally 60% to 100% along the south shore of the river between the Port Mann Bridge and the upstream end of Annacis Island), becoming moderate (40% to 60% along the west and south shorelines of Annacis Island, and along the north shoreline of the Fraser River from the lower end of Annacis Island to the George Massey Tunnel). Moderate probability of shoreline oiling (20% to 40%) generally prevails along the balance of the main channel, and low probability of oiling ((<10%) prevails in the side channels and wetlands near Ladner and Port Guichon. There is low probability of oiling shorelines along the Sturgeon and Roberts Banks, although some oiling occurs around Point Roberts.
Mass balance plots (Appendix B) show that less of the spilled crude oil (<60%) is likely to strand along river shorelines than during the winter. About 10% of the crude oil evaporates, and about 30% may remain on the surface of the water. Small amounts of the oil (generally <1%) also sink, undergo biodegradation, or dissolve into the water. Formation of OMA and dispersion of oil into the water are not predicted to occur to any meaningful extent (each representing <0.1% of the spilled oil).

Trans Mountain Pipeline ULC Volume 7, Pipeline Facilities Technical Reports Trans Mountain Expansion Project Qualitative Ecological Risk Assessment of
Pipeline Spills Technical Report
December, 2013 REP-NEB-TERA-00019
Page 6-93
Weathering CLWB is not likely to achieve a density greater than that of brackish water within 10 days of being spilled (Witt O‟Brien‟s et al. 2013). The spilled oil therefore floats until it strands on shorelines. As it weathers, it becomes more viscous and thicker, but mostly strands before its density approaches or exceeds that of the water. Little oil is entrained in the water column due to the viscosity of the oil and the relatively low turbulence of the river flow. Although the river has relatively high turbidity, due to the high flow rate, and the water is brackish, OMA formation remains low due to the low abundance of suspended oil droplets. There is a risk that oil stranded on shorelines will acquire additional density as a result of adhering or intermixed sand particles as the oil weathers, so that the weathered oil-sand mixture may sink if it is subsequently eroded or flooded before it can be recovered. In addition, there is a potential for reedbeds and salt marsh vegetation to trap floating or submerged oil being transported in the river if it enters the wetland habitats.
Table 6.28 provides an evaluation of the likely spatial extent, magnitude, duration, and reversibility of environmental effects on each ecological receptor group that would be caused by an accidental spill of CLWB near RK 1167.5 during the summer. In the upper reaches, the river channel is bordered by rip-rap, rock, and beach (Harper 2013), although as noted by Danchuk (2009), the river stage may substantially alter the characteristics of exposed shorelines. At high water levels, oil may enter and become trapped by rip-rap, or contact flooded riparian vegetation. The lower river reaches and Delta have a greater amount of fringing marsh (Harper 2013), with relatively less artificial shoreline. During summer conditions, most migrating birds (e.g., Western sandpiper) would already be at their summer breeding grounds farther north, although the Delta is noted as high quality habitat for raptors, waterfowl, and shorebirds. It is less likely that large mammals (such as bear or moose) would be present in this predominantly urban landscape, however, other wildlife species such as raccoons, foxes, deer, otter and muskrat would be present and active year-round. Effects on these wildlife receptors would likely be limited to a few individuals, rather than larger numbers that would affect the viability of regional populations.
Effects on fish and fish habitat, as well as benthic invertebrates and aquatic vegetation would be limited in spatial extent. The Fraser River and Delta provide important fish habitat and the river is a major migration route for Pacific salmon, and some of these fish would be moving through the river during summer. The river is also an important migratory route for Eulachon in spring, with spawning occurring in the river between Chilliwack and Mission. Late spawning adults or fry could be moving down the river in summer. The main stem of the Fraser River, however, is not likely to experience fish kills due to the large volume of flowing water, the low turbulence and limited potential for oil droplet formation, as indicated by the very small fraction of the spilled CLWB that becomes dissolved in the water.
Oil spill recovery effects on the main channel of the Fraser River, and in marsh areas near Port Guichon, would likely be substantial, leading to physical habitat disturbance. Depending upon the receptor group, the process of restoration and recovery could take anywhere from 12 months to five years.
6.4.4.3. Spring and Fall Condition
This spill condition is evaluated with primary reference to stochastic spill modeling results representing the months of April, August and September from EBA (2013). Spill summary information is presented in Appendix B. In spring and fall conditions, it is assumed that the river is on the rising or falling limbs of the freshet, but not at peak flow. It is assumed that culverts and ditching are present close to the pipeline, and that this drainage system quickly and effectively conveys virtually all of the spilled oil directly to the river over a period of several hours. Although the river stage is intermediate, transit times for the spilled oil to reach the river mouth are short, on the order of one or two days. The river is not flooding into riparian habitats, and is somewhat tidal, with flow reversal on high tides, as far upstream as the Port Mann Bridge.

Trans Mountain Pipeline ULC Volume 7, Pipeline Facilities Technical Reports Trans Mountain Expansion Project Qualitative Ecological Risk Assessment of Pipeline Spills Technical Report
December, 2013 REP-NEB-TERA-00019
Page 6-94
TABLE 6.28 LIKELY ENVIRONMENTAL EFFECTS OF CLWB SPILL DURING SUMMER TO THE FRASER RIVER AND DELTA NEAR THE PORT MANN BRIDGE, BRITISH COLUMBIA
Fraser River Delta, Summer Conditions
LIKELY OIL SPILL EFFECTS
Spatial Extent and Boundaries of Effects Effect Magnitude Reversibility and Time to Recovery
Aquatic Receptors
Biofilm Biofilm of variable quality will be present wherever sediments are exposed and remain moist at low tide, along the Fraser River channels and on the Banks and mudflats, but particularly in more protected areas and on more stable substrates. Biofilm will not be present on the river bed, generally, as a result of poor light penetration and the shifting sand nature of the river bed. In summer, with the river in freshet, the probability is high that oil will reach the river mouth and be discharged into the Strait of Georgia within 1 day of the spill. In the Strait, the oil is forced in a jet towards the open water and disperses, with very low probability (around 1%) of oil occurring on the water surface or stranding at Sturgeon or Roberts Banks. It is more likely that oil will disperse to the north and south in the Strait of Georgia, or cross the strait and strand along the shorelines of Gabriola, Valdes and Galiano Islands, although such oiling would be light and spatially discontinuous. The probability of shoreline oiling in the river is greatest along the south shore between the Port Mann Bridge and Annacis Island, becoming medium in the vicinity of the island, and medium to low between the downstream end of Annacis Island and the mouth of the river.
Variable, with a High effect magnitude in areas along the river shorelines where oiling is heavy; becoming Medium downstream of the George Massey tunnel, including areas of wetland near Ladner, Low along the shorelines of the Gulf Islands, and Negligible on Sturgeon and Roberts Banks and in Boundary Bay.
Short. Biofilm has been observed to re-form within 24 hours following removal from mudflats (VAFFC 2012a), and it is likely that once shoreline clean-up has taken place, biofilm will readily regenerate.
Aquatic Vegetation Aquatic vegetation is not expected to be a significant component in the main stem of the river. Wetland vegetation will be actively growing during the summer, and both floating and emergent vegetation may be exposed to oiling while the river is in freshet. Effects are likely to occur in the wetlands near Ladner.
Medium to High. Emergent aquatic vegetation is likely to survive low to moderate oiling of stems. However, reed beds and salt marsh are likely to trap and retain floating oil. Oil spill recovery activities may result in damage to these areas in the lower part of the river.
Oil spill recovery efforts along the river channel and in wetland areas result in some disturbance of this habitat, but most of the aquatic vegetation regenerates from buried root systems, so that recovery is essentially complete in the year following the spill.
Aquatic Invertebrates Aquatic invertebrates are present in the substrates of the main Fraser River, and in wetland and side-channel areas. Effects on the benthic community are low, however, as a result of the small amount of spilled hydrocarbon that becomes dissolved in the river water, and the large river flow.
Low in the main Fraser River and downstream areas, as a result of the small amount of oil that becomes dissolved, and the large size of the river.
Short. Effects on the benthic community are minor, and rapidly reversible.
Fish and Fish Eggs Fish are present in the main Fraser River. Some salmonids may be migrating through the river, and late spawning eulachon or juvenile eulachon may be out-migrating. Mortality of fish in the Fraser River or Delta is unlikely as a result of the large volume of water flowing in the river, and the low level of entrainment of oil droplets into the water column.
Low in the Fraser River and Delta, as a result of the small amount of oil that becomes dissolved, and the large size of the river.
Short. Effects on the fish community are minor, and rapidly reversible.
In-water Amphibians Juvenile and adult amphibians may be present in the upstream portion of the river, but are minimally affected. The presence of amphibians becomes less likely as the river becomes more brackish, downstream.
Low, as a result of the low numbers expected to be present in the affected habitat. Short. Effects on amphibians are minor, and rapidly reversible.
Terrestrial Receptors
Shoreline and Riparian Vegetation The overland flowpath comprises industrial lands, ditches and culverts. High water levels caused by freshet result in oil entering and stranding in shoreline riparian habitat of the Fraser River. Water levels in the Delta are also high, causing flooding of marshlands with some oil stranding. Water levels on the Banks remain within normal tidal ranges, and oiling is minimal, so shoreline vegetation there is not materially affected.
Low along the overland flowpath, as a result of the industrialized nature of the landscape. High to Medium for shoreline riparian habitat along the river, with greater effect magnitude on the south side of the river, between the spill location and the upstream end of Annacis Island. Medium to Low for shoreline communities farther downstream and in the Delta, as a result of lower exposure to oiling. Low to Negligible on near the Sturgeon and Roberts Banks, and Negligible along shorelines of Gabriola, Valdes and Galiano Islands, and near Point Roberts, as oil that initially dispersed in the Strait of Georgia becomes stranded in the upper intertidal zone.
Ditches and culverts of the overland flowpath are remediated and restored within weeks, with negligible effects on ecological receptors. Recovery efforts in riparian areas that were moderately to heavily oiled cause some damage to annual vegetation, but this regenerates in subsequent years.
Soil Invertebrates The overland flowpath comprises industrial lands, ditches and culverts. High water levels caused by freshet result in oil entering and stranding in shoreline riparian habitat of the Fraser River. Water levels in the Delta are also high, causing flooding of marshlands with some oil stranding. Water levels on the Banks remain within normal tidal ranges, and oiling is minimal, so shoreline vegetation there is not materially affected.
Low along the overland flowpath, as a result of the industrialized nature of the landscape. High to Medium for shoreline riparian habitat along the river, with greater effect magnitude on the south side of the river, between the spill location and the upstream end of Annacis Island. Medium to Low for shoreline communities farther downstream and in the Delta, as a result of lower exposure to oiling. Low to Negligible on near the Sturgeon and Roberts Banks, and Negligible along shorelines of Gabriola, Valdes and Galiano Islands, and near Point Roberts, as oil that initially dispersed in the Strait of Georgia becomes stranded in the upper intertidal zone.
Ditches and culverts of the overland flowpath are remediated and restored within weeks, with negligible effects on ecological receptors. Riparian areas that were moderately to heavily oiled may experience some harm to soil invertebrate communities, but these recover in subsequent years after clean-up.
Mammals
Grizzly Bear The grizzly bear as a receptor is also intended to represent other omnivores and carnivores (such as raccoons and foxes), some of which will be present in the lower mainland of British Columbia, even if bears are not present. A small number of individual animals might come into contact with spilled oil in the overland flowpath, or stranded along shorelines of the Fraser River and Delta.
Low, because it is unlikely that partially oiled animals would die as a result of exposure. However, disturbance caused by oil spill recovery activities could cause an alteration of habitat use during the spring, summer and fall.
Ditches and culverts of the overland flowpath are remediated and restored within weeks, with negligible effects on ecological receptors. Clean-up efforts in oiled riparian areas could cause disturbance of habitat use for several months.
Moose It is unlikely that moose would be exposed, but other ungulates such as deer could use habitat along the river or in the Delta. Effects of external oiling on more than a few individual animals are unlikely.
Low, because soil spill clean-up activities will largely be confined to SCAT, and disturbance of habitat where deer or other ungulates are present is likely to be short-term and intermittent.
Ditches and culverts of the overland flowpath are remediated and restored within weeks, with negligible effects on ecological receptors. Clean-up efforts in oiled riparian areas could cause disturbance of habitat use for several months.
Muskrat Muskrat are potentially affected, as they could be present along the river and in side channels and wetland areas downstream from the George Massey Tunnel. However, little of this habitat is predicted to be affected, and effects on more than a few individual animals are unlikely.
Localized effects on muskrat could be High, up to and including mortality of individuals inhabiting the main Fraser River channel or some side channels. Oil spill recovery activities and SCAT could also temporarily disturb their habitat.
Ditches and culverts of the overland flowpath are remediated and restored within weeks, with negligible effects on ecological receptors. Oiling of individual muskrat causes some mortality but such areas would be re-colonized within 12 to 24 months following shoreline clean-up.
River Otter Otters are potentially affected, as they could be present along the river and in side channels and wetland areas downstream from the George Massey Tunnel. However, little of this habitat is predicted to be affected, and effects on more than a few individual animals are unlikely.
Localized effects on river otter could be High, up to and including mortality of individuals if they occupy habitat in the main Fraser River channel, or some side channels. Oil spill recovery activities and SCAT could also temporarily disturb their habitat.
Ditches and culverts of the overland flowpath are remediated and restored within weeks, with negligible effects on ecological receptors. Oiling of individual otters causes some mortality but such areas would be re-colonized within 12 to 24 months following shoreline clean-up.
Birds
Bald Eagle Bald eagle, as well as many other raptors, are present year-round. Individual birds could become oiled through feeding on dead fish or other carrion, or by taking fish from the water surface through an oil slick. However, the probability of oil presence on the water surface is greatest in the main river channel, and lower in side channels and sloughs near Ladner.
Low to Medium. Partial oiling of plumage is not likely to result in mortality. Disturbance caused by oil spill recovery activities could also temporarily disrupt habitat utilization, including nest abandonment during summer. Transfer of oil from feathers to eggs could also result in egg mortality.
One to 2 years, if clean-up activities result in temporary avoidance of habitat use as a result of disturbance.
Canada Goose The Fraser River Delta provides important breeding habitat for a wide range of geese, ducks and swans. Individual birds could become oiled while swimming through an oil slick, or foraging along shorelines. However, the probability of oil presence on the water surface is greatest in the main river channel, and lower in side channels and sloughs near Ladner. Geese are likely to nest close to water, and could be exposed to oil on the surface of the water, or stranded along shorelines.
Generally Low to Medium, depending on the level of exposure, although individual birds could die if more heavily oiled. Disturbance caused by oil spill recovery activities could also temporarily disrupt habitat utilization, including nest abandonment during summer. Transfer of oil from feathers to eggs could also result in egg mortality.
One to 2 years, if clean-up activities result in temporary avoidance of habitat use as a result of disturbance.

Trans Mountain Pipeline ULC Volume 7, Pipeline Facilities Technical Reports Trans Mountain Expansion Project Qualitative Ecological Risk Assessment of Pipeline Spills Technical Report
December, 2013 REP-NEB-TERA-00019
Page 6-95
TABLE 6.28 LIKELY ENVIRONMENTAL EFFECTS OF CLWB SPILL DURING SUMMER TO THE FRASER RIVER AND DELTA NEAR THE PORT MANN BRIDGE, BRITISH COLUMBIA
Fraser River Delta, Summer Conditions
LIKELY OIL SPILL EFFECTS
Spatial Extent and Boundaries of Effects Effect Magnitude Reversibility and Time to Recovery
Great Blue Heron The Fraser River Delta provides important foraging habitat for herons. Individual birds could become oiled while foraging in shallow water or along shorelines. However, the probability of oil presence on the water surface is greatest in the main river channel, and lower in side channels and sloughs near Ladner.
Generally Low to Medium, as a result of low level of exposure, although individual birds could die if more heavily oiled. Disturbance caused by oil spill recovery activities could also temporarily disrupt habitat utilization, including nest abandonment during summer. Transfer of oil from feathers to eggs could also result in egg mortality.
One to 2 years, if clean-up activities result in temporary avoidance of habitat use as a result of disturbance.
Mallard The Fraser River Delta provides important breeding habitat for a wide range of geese, ducks and swans. Individual birds could become oiled while swimming through an oil slick, or foraging along shorelines. However, the probability of oil presence on the water surface is greatest in the main river channel, and lower in side channels and sloughs near Ladner. Ducks and swans generally would have greater exposure to oil than geese, as a result of their more aquatic habits.
Generally Medium to High, as individual birds could die if more heavily oiled. Oil presence on the water surface and stranded along shorelines is most likely in the main river channel, and lower elsewhere, including side channels and sloughs, and in the more marine environment of Roberts and Sturgeon Banks. Individuals and groups of birds could die if heavily oiled in the main river channel. Mortality is less likely elsewhere as a result of lower exposure. Oiling also extends out onto the Strait of Georgia, although it is patchy and discontinuous. This could result in negative effects including mortality to sea ducks, cormorants, and alcids. Disturbance caused by oil spill recovery activities could temporarily disrupt habitat utilization, including nest abandonment during summer. Transfer of oil from feathers to eggs could also result in egg mortality.
One to 2 years, if clean-up activities result in temporary avoidance of habitat use as a result of disturbance.
Spotted Sandpiper Shorebirds like the spotted sandpiper are likely to be present along the Fraser River channel, and throughout the Delta and Banks. They have a lower level of sensitivity to oiling than more aquatic birds such as ducks. Effects are likely to be related to the intensity of shoreline oiling, where there are shoreline types and/or adjacent upland habitats that are utilized by these birds.
Medium to low, depending upon the level of exposure. Exposure will be greatest along the main channel of the Fraser River, where mortality could occur in heavily oiled sections, and in the parts of the Delta. Negligible exposure is expected on Sturgeon and Roberts Banks, although low levels of exposure could be present on the shorelines of Gabriola, Valdes and Galiano Islands, as well as towards Point Roberts. Disturbance caused by oil spill recovery activities could temporarily disrupt habitat utilization, including nest abandonment during summer. Transfer of oil from feathers to eggs could also result in egg mortality.
Six months to 1 year, if clean-up activities result in temporary avoidance of habitat use as a result of disturbance.
Western Sandpiper Not likely to be affected as they would be occupying summer breeding grounds far north of the Fraser River Delta.
Low, as a result of lack of exposure. Not Applicable.
Tree Swallow Tree swallows could be breeding along the Fraser River and around the Delta, and could be exposed to oil while dipping to the water. Direct mortality is unlikely, but oil could be transferred to eggs, causing mortality of developing embryos. Spatial extent is determined by the presence of oil on the water surface, principally affecting the main Fraser River channel for a period of several days.
Low to Medium, depending upon the level of exposure. Transfer of oil from feathers to eggs could also result in egg mortality.
One to 2 years, if clean-up activities result in temporary avoidance of habitat use as a result of disturbance.
Reptiles and air-breathing Amphibians
The only native turtle likely to be found along the Fraser River is the Western painted turtle, found in low numbers in parts of the Fraser Valley from Vancouver to Hope. The presence of turtles and amphibians becomes less likely as the waters of the estuary become more brackish.
Low, as a result of low numbers present and lack of exposure. Six months to 1 year, if clean-up activities result in temporary avoidance of habitat use as a result of disturbance.

Trans Mountain Pipeline ULC Volume 7, Pipeline Facilities Technical Reports Trans Mountain Expansion Project Qualitative Ecological Risk Assessment of
Pipeline Spills Technical Report
December, 2013 REP-NEB-TERA-00019
Page 6-96
Frequent contact with shorelines acts to hold up some of the spilled oil, but most of the oil would be rapidly advected downstream. Less of the oil is stranded along shorelines than under winter conditions, and some remains on the water surface, having been discharged into the Strait of Georgia. As in winter and summer, most of the spilled oil is transported along the main river channel. Very little enters the north channel, and this oil generally strands within a short distance. Some oil, however, is transported into side channels near Ladner and Port Guichon, and may become stranded in the side channels, wetlands and sloughs.
The probability of oil presence on the surface of the river exceeds 90% between the Port Mann Bridge and a point approaching the George Massey Tunnel. From the George Massey Tunnel to the mouth of the river, the probability of oil on the surface is between 60% and 80%. There is about a 40% probability of oil on the surface of the water entering the side channels and marshes near Ladner and Port Guichon. Oil that reaches the mouth of the river is discharged into the Strait of Georgia with considerable momentum, so that it is likely to disperse to the north or south in the Strait and does not have a high probability of directly affecting the Sturgeon or Roberts Banks. It is more likely that this oil will affect shorelines on the opposite side of the Strait.
The probability of shoreline oiling is high (generally 60% to 100% along the south shore of the river between the Port Mann Bridge and the upstream end of Annacis Island), becoming moderate (40% to 60% along the west and south shorelines of Annacis Island, and along the north shoreline of the Fraser River from the lower end of Annacis Island to the George Massey Tunnel). Moderate probability of shoreline oiling (20% to 40%) generally prevails along the balance of the main channel, and low probability of oiling ((<10%) prevails in the side channels and wetlands near Ladner and Port Guichon. There is low probability of oiling shorelines along the Sturgeon and Roberts Banks, although some oiling occurs around Point Roberts.
Mass balance plots (Appendix B) show that rather more of the spilled crude oil (about 70%) is likely to strand along river shorelines than during the summer. About 10% of the crude oil evaporates, and about 20% may remain on the surface of the water. Small amounts of the oil (generally <1%) also sink, undergo biodegradation, or dissolve into the water. Formation of OMA and dispersion of oil into the water are not predicted to occur to any meaningful extent (each representing <0.1% of the spilled oil).
Weathering CLWB is not likely to achieve a density greater than that of brackish water within 10 days of being spilled (Witt O‟Brien‟s et al. 2013). The spilled oil therefore floats until it strands on shorelines. As it weathers, it becomes more viscous and thicker, but mostly strands before its density approaches or exceeds that of the water. Little oil is entrained in the water column due to the viscosity of the oil and the relatively low turbulence of the river flow. Although the river has relatively high turbidity, due to the flow rate, and the water is brackish, OMA formation remains low due to the low abundance of suspended oil droplets. There is a risk that oil stranded on shorelines will acquire additional density as a result of adhering or intermixed sand particles as the oil weathers, so that the weathered oil-sand mixture may sink if it is subsequently eroded or flooded before it can be recovered, as could easily occur in the springtime. In addition, there is a potential for reedbeds and salt marsh vegetation to trap floating or submerged oil being transported in the river if it enters the wetland habitats.
Table 6.29 provides an evaluation of the likely spatial extent, magnitude, duration, and reversibility of environmental effects on each ecological receptor group that would be caused by an accidental spill of CLWB near RK 1167.5 during spring or fall conditions. In the upper reaches, the river channel is bordered by rip-rap, rock, and beach (Harper 2013), although as noted by Danchuk (2009), the river stage may substantially alter the characteristics of exposed shorelines. At high water levels, oil may enter and become trapped by rip-rap, or contact flooded riparian vegetation. The lower river reaches and Delta would have a greater amount of fringing marsh (Harper 2013), with relatively less artificial shoreline. During spring and fall conditions, migrating birds (e.g., Western sandpiper) could be present, depending upon the exact timing of their migrations. The Delta is noted as high quality habitat for raptors, waterfowl, and shorebirds, and it is assumed that a large number of species would be present either as resident or migrating species. It is less likely that large mammals (such as bear or moose) would be present in this predominantly urban landscape, however, other wildlife species such as raccoons, foxes, deer, otter and

Trans Mountain Pipeline ULC Volume 7, Pipeline Facilities Technical Reports Trans Mountain Expansion Project Qualitative Ecological Risk Assessment of
Pipeline Spills Technical Report
December, 2013 REP-NEB-TERA-00019
Page 6-97
muskrat would be present and active year-round. Effects on these wildlife receptors would likely be limited to a few individuals, rather than larger numbers that would affect the viability of regional populations.
Effects on fish and fish habitat, as well as benthic invertebrates and aquatic vegetation would be limited in spatial extent. The Fraser River and Delta provide important fish habitat and the river is a major migration route for Pacific salmon, and some of these fish would be moving through the river during spring and fall. The river is also an important migratory route for Eulachon in spring, with spawning occurring in the river between Chilliwack and Mission. The main stem of the Fraser River, however, is not likely to experience fish kills due to the large volume of flowing water, the low turbulence and limited potential for oil droplet formation, as indicated by the very small fraction of the spilled CLWB that becomes dissolved in the water.
Oil spill recovery effects on the main channel of the Fraser River, and in marsh areas near Port Guichon, would likely be substantial, leading to physical habitat disturbance. Depending upon the receptor group, the process of restoration and recovery could take anywhere from 12 months to five years.
6.4.4.4. Environmental Effects Summary for Spill Scenarios at RK 1167.5
A hypothetical spill scenario has been developed to describe the likely fate and behaviour of CLWB spilled as a result of a pipeline rupture near RK 1167.5. Potential environmental effects likely to accrue to ecological receptors as a result of such hypothetical spills have been outlined in Table 6.27 through Table 6.29.
For the Fraser River in winter (Table 6.27), it is assumed that the spill occurs close to the river bank, and is quickly transported into the river, which is ice free, by ditches and culverts adjacent to and associated with the rail yards. Oil spill recovery efforts would result in environmental effects along the overland flowpath, but as these areas are industrial lands the effects on ecological receptors are minimal. Most of the oil becomes stranded along shorelines of the main Fraser River channel, with very little entering side channels and wetland areas near Ladner and Westham Island, and very little leaving the river to enter the Strait of Georgia. As a result, the potential for oiling of Sturgeon and Roberts Banks is also very low.
Some of the relevant ecological receptors would be dormant (e.g., plants, amphibians, reptiles, and mammals that hibernate) or absent (e.g., some migratory birds), although birds such as bald eagle and waterfowl could be present around the river through the winter due to the ice free conditions. The Delta is also noteworthy as a wintering area for large numbers of birds. Mortality of fish in the main channel of the Fraser River is unlikely, due to the low level of oil droplet entrainment and hydrocarbon dissolution into the water, and the large volume of flowing water in the river, even in winter. Effect magnitudes on shoreline and riparian vegetation and soil invertebrates would be low, due to low water levels and lack of oiling of riparian habitats, as well as to winter dormancy. Effect magnitudes for mammals and birds would generally be low to medium due to lack of exposure for migratory birds or hibernating mammals. However, higher effect magnitudes would be seen for semi-aquatic mammals in the Fraser River due to oiling of fur. Higher effect magnitudes could also be seen for wintering birds such as ducks, depending upon the numbers present. Recovery of the various ecological receptors from oil spill effects would take approximately 12 months to five years, assuming that the spill occurs in January, and physical works associated with oil spill recovery are ongoing through until the late summer.
For the Fraser River in summer (Table 6.28), flow in the river is peaking, due to snow melt in its headwaters. Most of the spilled oil is transported along the main river channel, although some is diverted to the south near Ladner and enters the islands and wetlands between Ladner and Westham Island. Effect magnitude on the overland flowpath is low, due to the industrial nature of the lands. More of the oil that reaches the river is rapidly transported down the main channel, with less stranding along shorelines, and a larger fraction exiting the river mouth to enter the Strait of Georgia. In the Strait of Georgia, the oil is carried with the momentum of the freshwater plume so that it is transported offshore and disperses in the Strait. Some of this oil subsequently strands along the shorelines of Gabriola, Valdes and Galiano Islands, or at Point Roberts, but very little strands on Sturgeon or Roberts Bank, or in Boundary Bay.

Trans Mountain Pipeline ULC Volume 7, Pipeline Facilities Technical Reports Trans Mountain Expansion Project Qualitative Ecological Risk Assessment of Pipeline Spills Technical Report
December, 2013 REP-NEB-TERA-00019
Page 6-98
TABLE 6.29 LIKELY ENVIRONMENTAL EFFECTS OF CLWB SPILL DURING SPRING OR FALL TO THE FRASER RIVER AND DELTA NEAR THE PORT MANN BRIDGE, BRITISH COLUMBIA
Fraser River Delta, Spring or Fall Conditions
LIKELY OIL SPILL EFFECTS
Spatial Extent Magnitude Duration
Aquatic Receptors
Biofilm Biofilm of variable quality will be present wherever sediments are exposed and remain moist at low tide, along the Fraser River channels and on the Banks and mudflats, but particularly in more protected areas and on more stable substrates. Biofilm will not be present on the river bed, generally, as a result of poor light penetration and the shifting sand nature of the river bed. In spring and fall, with the river at about average annual flow rate, the probability is high that oil will reach the river mouth and be discharged into the Strait of Georgia within 1 or 2 days of the spill. In the Strait, the oil is forced in a jet towards the open water and disperses, with very low probability (around 1%) of oil occurring on the water surface or stranding at Sturgeon or Roberts Banks. It is more likely that oil will disperse to the north and south in the Strait of Georgia, or cross the strait and strand along the shorelines of Gabriola, Valdes or Galiano Islands, although such oiling would be light and spatially discontinuous. The probability of shoreline oiling in the river is greatest along the south shore between the Port Mann Bridge and Annacis Island, becoming medium in the vicinity of the island, and medium to low between the downstream end of Annacis Island and the mouth of the river.
Variable, with a High effect magnitude in areas along the river shorelines where oiling is heavy; becoming Medium downstream of the George Massey tunnel, including areas of wetland near Ladner, Low along the shorelines of the Gulf Islands, and Negligible on Sturgeon and Roberts Banks and in Boundary Bay.
Short. Biofilm has been observed to re-form within 24 hours following removal from mudflats (VAFFC 2012a), and it is likely that once shoreline clean-up has taken place, biofilm will readily regenerate.
Aquatic Vegetation Aquatic vegetation is not expected to be a significant component in the main stem of the river. Wetland vegetation will be actively growing during the spring, becoming senescent in fall. Both floating and emergent vegetation will be exposed to oiling. Effects are likely to occur in the wetlands near Ladner.
Medium to High. Emergent aquatic vegetation is likely to survive low to moderate oiling of stems. However, reed beds and salt marsh are likely to trap and retain floating oil. Oil spill recovery activities may result in damage to these areas in the lower part of the river.
Oil spill recovery efforts along the river channel and in wetland areas result in some disturbance of this habitat, but most of the aquatic vegetation regenerates from buried root systems, so that recovery is essentially complete in the year following the spill.
Aquatic Invertebrates Aquatic invertebrates are present in the substrates of the main Fraser River, and in wetland and side-channel areas. Effects on the benthic community are low, however, as a result of the small amount of spilled hydrocarbon that becomes dissolved in the river water, and the large river flow.
Low in the main Fraser River and downstream areas, as a result of the small amount of oil that becomes dissolved, and the large size of the river.
Short. Effects on the benthic community are minor, and rapidly reversible.
Fish and Fish Eggs Fish are present in the main Fraser River. Some salmonids may be migrating through the river, and eulachon may be entering the river to spawn in spring. Mortality of fish in the Fraser River or Delta is unlikely as a result of the large volume of water flowing in the river, and the low level of entrainment of oil droplets into the water column.
Low in the Fraser River and Delta, as a result of the small amount of oil that becomes dissolved, and the large size of the river.
Short. Effects on the fish community are minor, and rapidly reversible.
In-water Amphibians Juvenile and adult amphibians may be present in the upstream portion of the river, but are minimally affected. The presence of amphibians becomes less likely as the river becomes more brackish, downstream.
Low, as a result of the low numbers expected to be present in this habitat. Short. Effects on amphibians are minor, and rapidly reversible.
Terrestrial Receptors
Shoreline and Riparian Vegetation The overland flowpath comprises industrial lands, ditches and culverts. Moderate water levels do not cause oil to enter or strand in riparian habitat.
Low along the overland flowpath, as a result of the industrialized nature of the landscape. Low in riparian habitat of the river and Delta as a result of lack of oil entering or stranding in such habitat.
Ditches and culverts of the overland flowpath are remediated and restored within weeks, with negligible effects on ecological receptors.
Soil Invertebrates The overland flowpath comprises industrial lands, ditches and culverts. Moderate water levels do not cause oil to enter or strand in riparian habitat.
Low along the overland flowpath, as a result of the industrialized nature of the landscape. Low in riparian habitat of the river and Delta as a result of lack of oil entering or stranding in such habitat.
Ditches and culverts of the overland flowpath are remediated and restored within weeks, with negligible effects on ecological receptors.
Mammals
Grizzly Bear The grizzly bear as a receptor is also intended to represent other omnivores and carnivores (such as raccoons and foxes), some of which will be present in the lower mainland of British Columbia, even if bears are not present. A small number of individual animals might come into contact with spilled oil in the overland flowpath, or stranded along shorelines of the Fraser River and Delta.
Low, because it is unlikely that partially oiled animals would die as a result of exposure. However, disturbance caused by oil spill recovery activities could cause an alteration of habitat use during the spring, summer and fall.
Ditches and culverts of the overland flowpath are remediated and restored within weeks, with negligible effects on ecological receptors. Clean-up efforts in oiled shoreline areas could cause disturbance of habitat use for several months.
Moose It is unlikely that moose would be exposed, but other ungulates such as deer could use habitat along the river or in the Delta. Effects of external oiling on more than a few individual animals are unlikely.
Low, because clean-up activities will largely be confined to SCAT, and disturbance of habitat where deer or other ungulates are present is likely to be short-term and intermittent.
Ditches and culverts of the overland flowpath are remediated and restored within weeks, with negligible effects on ecological receptors. Clean-up efforts in oiled shoreline areas could cause disturbance of habitat use for several months.
Muskrat Muskrat are potentially affected, as they could be present along the river and in side channels and wetland areas downstream from the George Massey Tunnel. However, little of this habitat is predicted to be affected, and effects on more than a few individual animals are unlikely.
Localized effects on muskrat could be High, up to and including mortality of individuals inhabiting the main Fraser River channel or some side channels. Oil spill recovery activities and SCAT could also temporarily disturb their habitat.
Ditches and culverts of the overland flowpath are remediated and restored within weeks, with negligible effects on ecological receptors. Oiling of individual muskrat causes some mortality but such areas would be re-colonized within 12 to 24 months following shoreline clean-up.
River Otter Otters are potentially affected, as they could be present along the river and in side channels and wetland areas downstream from the George Massey Tunnel. However, little of this habitat is predicted to be affected, and effects on more than a few individual animals are unlikely.
Localized effects on river otter could be High, up to and including mortality of individuals if they occupy habitat in the main Fraser River channel, or some side channels. Oil spill recovery activities and SCAT could also temporarily disturb their habitat.
Ditches and culverts of the overland flowpath are remediated and restored within weeks, with negligible effects on ecological receptors. Oiling of individual otters causes some mortality but such areas would be re-colonized within 12 to 24 months following shoreline clean-up.
Birds
Bald Eagle Bald eagle, as well as many other raptors, are present year-round. Individual birds could become oiled through feeding on dead fish or other carrion, or by taking fish from the water surface through an oil slick. However, the probability of oil presence on the water surface is greatest in the main river channel, and lower in side channels and sloughs near Ladner.
Low to Medium. Partial oiling of plumage is not likely to result in mortality. Disturbance caused by oil spill recovery activities could also temporarily disrupt habitat utilization, including nest abandonment during spring. Transfer of oil from feathers to eggs in spring could also result in egg mortality.
One to 2 years, if clean-up activities result in temporary avoidance of habitat use as a result of disturbance.
Canada Goose The Fraser River Delta provides important breeding habitat for a wide range of geese, ducks and swans. Individual birds could become oiled while swimming through an oil slick, or foraging along shorelines. However, the probability of oil presence on the water surface is greatest in the main river channel, and lower in side channels and sloughs near Ladner. Geese are likely to nest close to water, and could be exposed to oil in the surface of the water, or stranded along shorelines.
Generally Low to Medium, depending on the level of exposure, although individual birds could die if more heavily oiled. Disturbance caused by oil spill recovery activities could also temporarily disrupt habitat utilization, including nest abandonment during spring. Transfer of oil from feathers to eggs in spring could also result in egg mortality.
One to 2 years, if clean-up activities result in temporary avoidance of habitat use as a result of disturbance.
Great Blue Heron The Fraser River Delta provides important foraging habitat for herons. Individual birds could become oiled while foraging in shallow water or along shorelines. However, the probability of oil presence on the water surface is greatest in the main river channel, and lower in side channels and sloughs near Ladner.
Generally Low to Medium, as a result of low level of exposure, although individual birds could die if more heavily oiled. Disturbance caused by oil spill recovery activities could also temporarily disrupt habitat utilization, including nest abandonment during spring. Transfer of oil from feathers to eggs in spring could also result in egg mortality.
One to 2 years, if clean-up activities result in temporary avoidance of habitat use as a result of disturbance.

Trans Mountain Pipeline ULC Volume 7, Pipeline Facilities Technical Reports Trans Mountain Expansion Project Qualitative Ecological Risk Assessment of Pipeline Spills Technical Report
December, 2013 REP-NEB-TERA-00019
Page 6-99
TABLE 6.29 LIKELY ENVIRONMENTAL EFFECTS OF CLWB SPILL DURING SPRING OR FALL TO THE FRASER RIVER AND DELTA NEAR THE PORT MANN BRIDGE, BRITISH COLUMBIA
Fraser River Delta, Spring or Fall Conditions
LIKELY OIL SPILL EFFECTS
Spatial Extent Magnitude Duration
Mallard The Fraser River Delta provides important breeding habitat for a wide range of geese, ducks and swans. Individual birds could become oiled while swimming through an oil slick, or foraging along shorelines. However, the probability of oil presence on the water surface is greatest in the main river channel, and lower in side channels and sloughs near Ladner. Ducks and swans generally would have greater exposure to oil than geese, as a result of their more aquatic habits.
Generally Medium to High, as individual birds could die if more heavily oiled. Oil presence on the water surface and stranded along shorelines is most likely in the main river channel, and lower elsewhere, including side channels and sloughs, and in the more marine environment of Roberts and Sturgeon Banks. Individuals and groups of birds could die if heavily oiled in the main river channel. Mortality is less likely elsewhere as a result of lower exposure. Oiling also extends out onto the Strait of Georgia, although it is patchy and discontinuous. This could result in negative effects including mortality to sea ducks, cormorants, and alcids. Disturbance caused by oil spill recovery activities could also temporarily disrupt habitat utilization, including nest abandonment during spring. Transfer of oil from feathers to eggs in spring could also result in egg mortality.
One to 2 years, if clean-up activities result in temporary avoidance of habitat use as a result of disturbance.
Spotted Sandpiper Shorebirds like the spotted sandpiper are likely to be present along the Fraser River channel, and throughout the Delta and Banks. They have a lower level of sensitivity to oiling than more aquatic birds such as ducks. Effects are likely to be related to the intensity of shoreline oiling, where there are shoreline types and/or adjacent upland habitats that are utilized by these birds.
Medium to Low, depending upon the level of exposure. Exposure will be greatest along the main channel of the Fraser River, where mortality could occur in heavily oiled sections, and in the parts of the Delta. Negligible exposure is expected on Sturgeon and Roberts Banks, although low levels of exposure could be present on the shorelines of Gabriola, Valdes and Galiano Islands, as well as towards Point Roberts. Disturbance caused by oil spill recovery activities could also temporarily disrupt habitat utilization, including nest abandonment during spring. Transfer of oil from feathers to eggs in spring could also result in egg mortality.
Six months to 1 year, if clean-up activities result in temporary avoidance of habitat use as a result of disturbance.
Western Sandpiper Western sandpiper arrive at the Fraser River Delta in large numbers while migrating in spring and fall, feeding heavily on biofilm and benthic invertebrates on Roberts and Sturgeon Banks, and in Boundary Bay. These areas are predicted to have a very low level of exposure to floating or stranded crude oil.
Low, as a result of low level of exposure. Six months or less
Tree Swallow Tree swallows could be breeding along the Fraser River and around the Delta, and could be exposed to oil while dipping to the water. Direct mortality is unlikely, but oil could be transferred to eggs, causing mortality of developing embryos. Spatial extent is determined by the presence of oil on the water surface, principally affecting the main Fraser River channel for a period of several days.
Low to Medium, depending upon the level of exposure. Transfer of oil from feathers to eggs could also result in egg mortality.
One to 2 years, if clean-up activities result in temporary avoidance of habitat use as a result of disturbance.
Reptiles and air-breathing Amphibians
The only native turtle likely to be found along the Fraser River is the Western painted turtle, found in low numbers in parts of the Fraser Valley from Vancouver to Hope. The presence of turtles and amphibians becomes less likely as the waters of the estuary become more brackish.
Low, as a result of low numbers present and lack of exposure. Six months to 1 year, if clean-up activities result in temporary avoidance of habitat use as a result of disturbance.

Trans Mountain Pipeline ULC Volume 7, Pipeline Facilities Technical Reports Trans Mountain Expansion Project Qualitative Ecological Risk Assessment of
Pipeline Spills Technical Report
December, 2013 REP-NEB-TERA-00019
Page 6-100
Effects on aquatic receptors are variable. Effects on aquatic vegetation are of medium magnitude as the spilled oil largely floats on the surface of the water, and oil that enters salt marsh or reedbed areas may become trapped there. Although the physical effects of this oil on the vegetation may be low to medium, oil spill recovery effects may be equally damaging to the vegetation, as well as affecting habitat utilization by wildlife species. Effects on benthic invertebrates and fish are generally low, due to the low level of dissolved hydrocarbons and low level of droplet formation, combined with the high water flow in the river. There is also low potential for effects on amphibians and reptiles, due to the limited distribution of turtles, and expected decline in habitat quality as the river becomes more brackish.
A considerable amount of the spilled oil becomes stranded along shorelines, and in riparian areas where terrestrial vegetation is oiled. Effects on shoreline and riparian vegetation and soil invertebrates are low on the overland flowpath, due to the industrial nature of the land, becoming medium to high along the main Fraser River channel, and medium in the Delta as the probability of shoreline oiling decreases. Areas riparian to the Fraser River are remediated with relatively non-intrusive methods, and an emphasis on natural attenuation of spilled oil residues at low levels. Environmental effects on mammal populations are potentially high for truly aquatic species such as muskrat, beaver, otter and mink, and it is assumed that some of these animals could be sufficiently oiled to cause death. For mammals that are larger or that are less adapted to the aquatic environment, such as raccoons, foxes and deer, effects are expected to be medium, and may arise from disturbance of habitat, as well as from oiling of fur, or ingestion of crude oil. For birds, guilds such as ducks and geese are considered to be most exposed and sensitive to spilled oil, and effects on these species could be high (including mortality) to medium, including reproductive effects caused by transfer of oil to eggs, with resulting egg mortality, or effects on habitat quality caused by disturbance arising from oil spill response efforts. These effects could extend along the entire river channel, as well as affecting portions of the Delta. Other species, such as raptors, wading birds, shorebirds, and swallows could experience medium effect magnitudes, reflecting both oil exposure and disturbance of habitat following the oil spill. Recovery times for spills in the summer could be as short as 12 months for some receptors, or up to five years where effects occur at the population level. Some of the spilled oil would be swept into the Strait of Georgia, and could affect other seabirds, such as alcids, on summer feeding grounds.
For the Fraser River in spring and fall (Table 6.29), flow is at an intermediate level, typically rising in the spring due to the onset of freshet, or falling in the fall, as freshet recedes. Most of the spilled oil would rapidly reach and enter the main Fraser River channel. Effect magnitude on the overland flowpath is low, due to the industrialized nature of the land. In the river, the spilled crude oil is confined to the normal channels, due to the moderate water levels, and is transported down to the river mouth within one or two days. As in summer, a considerable amount of the spilled oil is transported into the Strait of Georgia, where it disperses. Some of this oil subsequently strands along the shorelines of Gabriola, Valdes and Galiano Islands, or at Point Roberts, but very little strands on Sturgeon or Roberts Bank, or in Boundary Bay.
Effects on aquatic receptors are variable. Effects on aquatic vegetation are of medium magnitude as the spilled oil largely floats on the surface of the water, and oil that enters salt marsh or reedbed areas may become trapped there. Although the physical effects of this oil on the vegetation may be low to medium, oil spill recovery effects may be equally damaging to the vegetation, as well as affecting habitat utilization by wildlife species. Effects on benthic invertebrates and fish are generally low, due to the low level of dissolved hydrocarbons and low level of droplet formation, combined with the high water flow in the river. There is also low potential for effects on amphibians and reptiles, due to the limited distribution of turtles, and expected decline in habitat quality as the river becomes more brackish.
A considerable amount of the spilled oil becomes stranded along shorelines, but not in riparian areas, so effects on terrestrial plants and soil invertebrates are negligible. Environmental effects on mammal populations are potentially high for truly aquatic species such as muskrat, beaver, otter and mink, and it is assumed that some of these animals could be sufficiently oiled to cause death. For mammals that are larger or that are less adapted to the aquatic environment, such as raccoons, foxes and deer, effects are expected to be medium, and may arise from disturbance of habitat, as well as from oiling of fur, or ingestion of crude oil. For birds, guilds such as ducks and geese are considered to be most exposed and

Trans Mountain Pipeline ULC Volume 7, Pipeline Facilities Technical Reports Trans Mountain Expansion Project Qualitative Ecological Risk Assessment of
Pipeline Spills Technical Report
December, 2013 REP-NEB-TERA-00019
Page 6-101
sensitive to spilled oil, and effects on these species could be high (including mortality) to medium, including reproductive effects caused by transfer of oil to eggs in spring, with resulting egg mortality, or effects on habitat quality caused by disturbance arising from oil spill response efforts. These effects could extend along the entire river channel, as well as affecting portions of the Delta. Other species, such as raptors, wading birds, shorebirds, and swallows could experience medium effect magnitudes, reflecting both oil exposure and disturbance of habitat following the oil spill. Recovery times for spills in the spring could be as short as 12 months for some receptors, or up to five years where effects occur at the population level. Some of the spilled oil would be swept into the Strait of Georgia, and could affect other seabirds, such as alcids.
Particular consideration was given in this scenario to Western sandpiper, which use the Sturgeon and Roberts Banks as a stopover and feeding area during spring and fall migrations. For short periods of time, hundreds of thousands of birds may congregate on the banks, feeding on biofilm and benthic invertebrates present in the mudflats. The stochastic analysis of oil spill fate and transport during winter, spring, summer and fall conditions (EBA 2013) has shown that the probability of oiling on Sturgeon and Roberts Banks is very low, either because the oil becomes stranded and does not exit from the Delta during periods of low flow, or because it is carried through and away from the Delta and into the Strait of Georgia by the momentum of the freshwater jet created by the Fraser River during periods of moderate or high flow. Once in the Strait of Georgia, the crude oil will continue to weather and disperse, and stranding does occur on the shorelines of Gabriola, Valdes and Galiano Islands and Point Roberts, but at low probability and intensity. The biofilm itself is not likely to be materially affected if weathered crude oil becomes stranded, and recovers quickly from disturbance. Therefore, neither the biofilm, nor Western sandpiper, are considered likely to be significantly affected in the event of a pipeline oil spill that results in crude oil entering the Fraser River near the Port Mann Bridge. In its review of the Vancouver Airport Fuel Delivery Project, Environment Canada agreed that the potential effects of a Jet A fuel spill on biofilm were unlikely to be high-magnitude and irreversible (Environment Canada 2012).
6.5. Certainty and Confidence in the Ecological Risk Assessment
This qualitative ecological risk assessment has been carried out using available information on the expected pipeline corridor in order to evaluate potential ecological consequences of hypothetical crude oil spills in the unlikely event of a full bore rupture event. Oil spill locations were selected using a risk-informed approach by considering large rivers that run parallel to the proposed new pipeline. All else being equal, the risk of a pipeline oil spill is cumulative, and depends upon the length of the pipeline. Therefore, a watershed that contains 100 km of pipeline has a proportionally greater risk of experiencing an oil spill accident than a watershed that contains 10 km of pipeline. The Athabasca River, North Thompson River and Fraser River all have relatively long reaches where the proposed pipeline corridor runs parallel to and in proximity to the rivers, and numerous small drainages that could convey spilled oil to the larger rivers. These rivers are also important to fish and wildlife, and are relied upon for traditional purposes and as sources of country food by Aboriginal peoples and others.
Oil spill volumes were based on an independent outflow analysis commissioned by Trans Mountain based on preliminary valve spacing to quantify the oil volume that would be released in the event of an incident. Modeling assumed a full-bore rupture with hole on the bottom of the pipe, which provided worst-case outflows for the purpose of the ERA. The potential spill volumes were estimated taking into consideration the expected response time for initiation and completion of valve closure upon detecting a leak, the distance between valve locations, and include both the volume of oil that would be released under pressure before the valves close, as well as the draindown volume for the line between valve locations. The volume of oil that could be released is therefore estimated with a high level of realism and confidence. Because the spill locations were selected to be in close proximity to a watercourse, the volume of oil that could enter a watercourse is conservatively estimated. If an oil spill were to take place at a greater distance from a watercourse, the volume reaching water could be substantially lower than has been assumed in this assessment.
The characteristics of spilled crude oil were based upon those of CLWB, a form of diluted bitumen that was selected for evaluation in the ERA because it is currently transported by Trans Mountain and is

Trans Mountain Pipeline ULC Volume 7, Pipeline Facilities Technical Reports Trans Mountain Expansion Project Qualitative Ecological Risk Assessment of
Pipeline Spills Technical Report
December, 2013 REP-NEB-TERA-00019
Page 6-102
expected to remain a major product transported by the new pipeline. In addition, the diluent in CLWB is condensate (a light hydrocarbon mixture derived from natural gas liquids), which is volatile and relatively water-soluble. Due to the higher level of risk associated with inhalation of volatiles and/or exposure to dissolved hydrocarbons, CLWB was considered to be a conservative choice for the ERA, as opposed to heavy crude oil mixed with alternative diluents such as synthetic oil, which contain fewer volatile and less water soluble constituents. Meso-scale experimental tests using CLWB were carried out in order to better understand the behavior of CLWB when spilled onto water (Witt O‟Brien‟s et al. 2013). A key finding of those tests was that the CLWB behaved on the water in much the same way as any other heavy (conventional) crude oil would. The chemical and physical characteristics and behavior of diluted bitumen on the surface of the water are therefore considered to be understood with a high level of confidence.
The potential fate and transport of spilled crude oil after entering a watercourse was evaluated taking into consideration the behavior of oil in actual spill events in similar types of watercourses, as well as modeling results for diluted bitumen and synthetic oil if spilled into similar types of watercourses. For the lower Fraser River and Delta, due to the complexity of the hydrodynamics of this ecosystem, stochastic oil spill modeling was undertaken to predict how far oil would be carried on the surface of the water during variable seasonal conditions, and the probability of oil stranding along river and wetland shorelines, as well as other fates of the spilled oil. This assessment is considered to have a moderate level of confidence. While the evaluation of oil fate and transport in this assessment is qualitative at the other hypothetical spill locations, that assessment is based on the fate and behavior of spilled oil in actual spill events, and is therefore also considered to have a moderate level of confidence.
The exposure of ecological receptors to oil is based upon the expected fate and transport of crude oil in the freshwater environment. Potential interactions between ecological receptors and spilled crude oil were evaluated in the context of winter, summer and spring or fall conditions. Under winter conditions, some ecological receptors will be absent from the local environment, or dormant, and may have little or no exposure to spilled oil. Under summer and spring or fall conditions, exposures were generally similar. There is no question that a large oil spill entering a watercourse will cause substantial negative environmental effects, including damage to vegetation, death of mammals and birds, and possibly death of fish and benthic invertebrates. The extent and magnitude of these negative effects will depend upon many factors including but not limited to: the type and volume of oil spilled; the proximity of the spill site to a watercourse; seasonal factors that may help to prevent oil from entering the water and affect stream flow rates and water levels; the size of the watercourse; seasonal factors that determine the presence or absence of ecological receptors; and the proximity of the ecological receptors to the spill site. Although not explicitly considered in this ERA, the specifics and effectiveness of spill clean-up, treatment and remediation activities will also determine the extent and magnitude of negative effects.
Section 6.4 has summarized, using tables, the Spatial Extent and Boundaries, Effect Magnitude, and Reversibility and Time to Recovery for hypothetical crude oil spills to the Athabasca River near Hinton, Alberta, the North Thompson River near Darfield, British Columbia, the Fraser River near Hope, British Columbia, and the Fraser River as it enters the Delta, for a suite of ecological receptors. This analysis is based upon effects that have been observed in actual oil spills, with an emphasis on heavy oils, and rivers with characteristics comparable to those that exist along the proposed pipeline corridor. This analysis is assigned a moderate level of confidence.
Taking all of these factors into consideration, it is clear that a crude oil spill into a freshwater environment could have substantial negative environmental effects that could be long-lasting if not effectively remediated. This confirms that the primary focus of the spill prevention and response activities must always be to reduce the probability of an oil spill to be as low as reasonably practical (ALARP), and to have adequate oil spill response plans and procedures in place.

Trans Mountain Pipeline ULC Volume 7, Pipeline Facilities Technical Reports Trans Mountain Expansion Project Qualitative Ecological Risk Assessment of
Pipeline Spills Technical Report
December, 2013 REP-NEB-TERA-00019
Page 7-1
7.0 SUMMARY AND CONCLUSIONS
The purpose of this ERA report is to evaluate the potential for ecological receptors (e.g., fish, fish eggs, invertebrates, amphibians, reptiles, birds, mammals, and plants) to experience negative environmental effects as a result of exposure to crude oil released to the environment as a result of the Project. The following summary is based upon the assumption that an oil spill as a result of construction of the Trans Mountain Pipeline will be a low probability event.
Because of the nature of spills to land (i.e., the limited spatial extent of environmental effects in the context of much larger habitat units) and the existence of legislative processes pertaining to environmental remediation following such spills, the ERA does not directly consider effects to terrestrial environments. Conversely, crude oil entering aquatic environments has the potential to spread or be advected rapidly downstream, and as a result has the potential to affect much more of the available habitat. Aquatic ecosystems are known to be sensitive to spilled oil, and therefore this ERA report focuses on spills that enter aquatic environments.
The proposed TMEP pipeline corridor crosses 474 defined watercourses between Edmonton, Alberta and Burnaby, British Columbia, and runs parallel to several large rivers for a considerable portion of its length. Where the pipeline runs parallel to a river, the potential for that river to be affected by oil in the unlikely event of an oil spill increases in proportion to the length of the pipeline corridor within the watershed, and the proximity of the corridor to the river. Based upon these and other criteria, hypothetical oil spill locations were selected in proximity to the Athabasca River near Hinton, Alberta; the North Thompson River near Darfield, British Columbia; the Fraser River near Hope, British Columbia; and the Fraser River near the Port Mann Bridge in greater Vancouver. This last location was selected to be as close as possible to the Fraser River Delta, in order to evaluate potential environmental effects of spilled oil on ecological receptors unique to the Delta, a tidal estuary.
Although the proposed TMEP pipeline will potentially carry a variety of crude oils, diluted bitumen is expected to comprise a large percentage of the oil shipped. For that reason, a sample of Cold Lake Winter Blend (CLWB) was procured and tested to provide information on the physical and chemical characteristics of a representative product. CLWB was selected because it is currently transported by Trans Mountain and is expected to remain a major product transported by the new pipeline. In addition, the diluent in CLWB is condensate (a light hydrocarbon mixture derived from natural gas liquids), which is volatile and relatively water-soluble. Due to the higher level of risk associated with inhalation of volatiles and/or exposure to dissolved hydrocarbons, CLWB was considered to be a conservative choice for the ERA, as opposed to heavy crude oil mixed with alternative diluents such as synthetic oil, which contain fewer volatile and less water soluble constituents.
A literature review was conducted to identify and acquire information on actual and modelled spills of heavy crude oils in the freshwater environment, and case studies were selected to inform predictions about the potential fate and transport and ecological effects of a diluted bitumen spill resulting from the Project. Actual spill case studies included the Kalamazoo River spill, East Walker River spill, Pine River spill, Wabamun Lake spill, Yellowstone River spill, OSSA II Pipeline spill, and the DM 932 barge spill, with crude oil types ranging from light crude oil to diluted bitumen and bunker type products. TMEP studies involving the behaviour of diluted bitumen on water in meso-scale experimental trials carried out at Gainford, Alberta (Witt O‟Brien‟s et al. 2013) were also reviewed. Finally, modelling studies of oil spill fate and ecological effects conducted for the Enbridge Northern Gateway Project, representing a diluted bitumen and a synthetic crude oil, with hypothetical spill locations on the Athabasca, Crooked, Morice and Kitimat rivers in Alberta and British Columbia, and predictions of oil spill fate and ecological effects of Jet “A” fuel released to the lower Fraser River near Vancouver.
When crude oil is spilled, volatile components quickly evaporate, and more water-soluble components can dissolve into the water. The amount of hydrocarbon that will dissolve into the water depends upon a number of factors, including the availability of relatively water soluble hydrocarbons, the amount of mixing energy in the water column, and the viscosity of the oil. If there is sufficient mixing energy to entrain droplets of oil into the water column, then the rate of dissolution is increased in comparison to the case

Trans Mountain Pipeline ULC Volume 7, Pipeline Facilities Technical Reports Trans Mountain Expansion Project Qualitative Ecological Risk Assessment of
Pipeline Spills Technical Report
December, 2013 REP-NEB-TERA-00019
Page 7-2
when oil is simply floating on the water surface. High oil viscosity increases the amount of mixing energy required. The resulting concentration of dissolved hydrocarbon also depends upon the amount of oil released, relative to the amount of water flowing in the river. Therefore, high potential for acute effects to aquatic organisms occurs when light oils containing a high percentage of MAH and other light hydrocarbons are released into streams or small rivers with high gradients leading to high energy mixing. Lower potential for such effects is observed as oils become more viscous, with lower percentages of MAH present, and as the level of turbulence decreases as river size increases, or river gradient decreases.
Once in the water column, oil droplets may be exposed to suspended sediments; if there is adequate contact, the particulate matter may adhere to the oil droplets and the resulting oil-mineral aggregate (OMA) may become neutrally to negatively buoyant and remain submerged or sink in the water column. Formation of substantial quantities of OMA requires high suspended sediment concentrations, and is enhanced by salinity, which is not normally present in freshwater ecosystems. Oil may also contact sand and gravel particles along shorelines, resulting in initial stranding of oil that may sink if it later re-enters the water column. In high flows, submerged oil is transported downstream and prevented from settling on the riverbed. In contrast, low flows have the potential to result in high levels of sedimentation of submerged oil, particularly in quiescent areas where silty sediments accumulate.
For spills in winter, direct environmental effects of spilled oil may depend upon the amount of snow and ice cover, as snow can absorb spilled oil, and ice cover on watercourses can prevent or limit contact between the oil and running water. Many ecological receptors are absent or dormant during the winter, and would not be exposed to the spilled oil. For such spills, there is a high potential to recover most of the spilled oil so that oil spill effects on ecological receptors can be minimal. Spills to rivers that are not ice covered in winter, however, would have environmental effects similar to the environmental effects of spills at other times of the year.
For the four locations considered in this study (the Athabasca River near Hinton, Alberta; the North Thompson River near Darfield, British Columbia; the Fraser River near Hope, British Columbia and the Fraser River as it enters the Delta, near Vancouver), seasonal flow regimes are such that high flows are observed during the summer, as snow and ice melt in the mountain headwater regions. Low flows are typically observed in winter, as water equivalents build up in snowpack. Spring and fall represent shoulder seasons when flows are intermediate. Using information from the actual spill events and modelling case studies, the likely behaviour of spilled heavy crude oil, and extent of oiling, was predicted for each river system. Stochastic modeling was used to predict the fate and transport of oil for the Fraser River Delta, due to the unique nature and complexity of this environment. For the other three spill examples, professional judgement was used, based upon the case studies.
From the predicted distribution of crude oil in the environment in each of the rivers, for winter, summer, and spring and fall seasons, interactions between spilled oil and ecological receptor groups were evaluated. Ecological receptor groups included aquatic biota (vegetation, benthic invertebrates, fish including eggs and larvae, and amphibians), terrestrial plant and soil invertebrate communities in riparian areas, mammals (with grizzly bear, moose, muskrat and river otter selected as representative types), birds (with bald eagle, Canada goose, great blue heron, mallard, spotted sandpiper and tree swallow selected as representative types) and reptiles (with the Western painted turtle selected as a representative) for the Delta oil spill scenario, two additional ecological receptors (biofilm and Western sandpiper) were evaluated.
For each river, season and ecological receptor type, the expected spatial extent, magnitude, duration and reversibility of negative environmental effects was evaluated, again with reference to case studies. The spatial extent of environmental effects was found to vary, depending upon the season and river characteristics, and both the spatial extent and magnitude of environmental effects was often rated as “high”. However, effect durations were typically less than five years, and often 12 to 24 months, and all rated negative environmental effects were considered to be “reversible”. Evidence from the case studies showed overwhelmingly that freshwater ecosystems can recover from oil spills, often within relatively short periods of time.

Trans Mountain Pipeline ULC Volume 7, Pipeline Facilities Technical Reports Trans Mountain Expansion Project Qualitative Ecological Risk Assessment of
Pipeline Spills Technical Report
December, 2013 REP-NEB-TERA-00019
Page 7-3
Taking all of these factors into consideration, it is clear that a crude oil spill into a freshwater environment could have substantial negative environmental effects that could be long-lasting if not effectively remediated. This confirms that the primary focus of spill prevention and response activities must always be to reduce the probability of an oil spill to be as low as reasonably practical (ALARP), and to have adequate oil spill response plans and procedures in place.

Trans Mountain Pipeline ULC Volume 7, Pipeline Facilities Technical Reports Trans Mountain Expansion Project Qualitative Ecological Risk Assessment of
Pipeline Spills Technical Report
December, 2013 REP-NEB-TERA-00019
Page 8-1
8.0 CLOSURE
This report has been prepared by Stantec Consulting Ltd. (Stantec) for the sole benefit of Trans Mountain Pipeline ULC (Trans Mountain). The report may not be relied upon by any other person or entity, other than for its intended purposes, without the express written consent of Stantec and Trans Mountain.
This report was undertaken exclusively for the purpose outlined herein and was limited to the scope and purpose specifically expressed in this report. This report cannot be used or applied under any circumstances to another location or situation or for any other purpose without further evaluation of the data and related limitations. Any use of this report by a third party, or any reliance on decisions made based upon it, are the responsibility of such third parties. Stantec accepts no responsibility for damages, if any, suffered by any third party as a result of decisions made or actions taken based on this report.
Stantec makes no representation or warranty with respect to this report, other than the work was undertaken by trained professional and technical staff in accordance with generally accepted engineering and scientific practices current at the time the work was performed. Any information or facts provided by others and referred to or used in the preparation of this report were assumed by Stantec to be accurate. Conclusions presented in this report should not be construed as legal advice.
The information provided in this report was compiled from existing documents and data provided by Trans Mountain and by applying currently accepted industry standard mitigation and prevention principles. This report represents the best professional judgement of Stantec personnel available at the time of its preparation. Stantec reserves the right to modify the contents of this report, in whole or in part, to reflect the any new information that becomes available. If any conditions become apparent that differ significantly from our understanding of conditions as presented in this report, we request that we be notified immediately to reassess the conclusions provided herein.
STANTEC CONSULTING LTD.
Ulysses Klee, Ph.D., M.Sc., H.B.Sc., Ecotoxicologist and Risk Assessment Specialist Kitchener, Ontario Phone: (519) 585-7317
Malcolm Stephenson, Ph.D. Principal, National Practice Lead Risk Assessment Fredericton, New Brunswick Phone: (506) 452-7000

Trans Mountain Pipeline ULC Volume 7, Pipeline Facilities Technical Reports Trans Mountain Expansion Project Qualitative Ecological Risk Assessment of
Pipeline Spills Technical Report
December, 2013 REP-NEB-TERA-00019
Page 9-1
9.0 REFERENCES
9.1. Literature Cited
Ajijolaiya, L.O., P.S. Hill, A. Khelifa, R.M. Islam and K. Lee. 2006. Laboratory investigation of the effects of mineral size and concentration on the formation of oil-mineral aggregates. Marine Pollution Bulletin, 52(2006):920-927.
Alberta Environment and Sustainable Resource Development. 2013. Guide to the Code of Practice for Watercourse Crossings, Including Guidelines for Complying with the Code of Practice. Revised April 2001. Government of Alberta. Edmonton, AB. 29 pp.
Alberta Environment. 1999. Alberta Environment Surface Water Quality Guidelines for Use in Alberta. Environmental Assurance Division, Science and Standards Branch. November 1999.
Alberta Environment. 2006. Edson Management Area. Water Act Code of Practice Management Area Maps. Prepared by Alberta Environment and Alberta Sustainable Resource Development, Finance and Administration Division, Resource Information Management Branch, Government of Alberta. Edmonton, AB.
Alberta Environment. 2007. Summary Report on the Initial Assessment of Ecological Health of Aquatic Ecosystems in Alberta: Water Quality, Sediment Quality and Non-fish Biota. Prepared for Alberta Environment by North/South Consultants Inc. October 2007.
Alberta Environment. 2010. Alberta Tier 1 or Tier 2 Soil and Groundwater Remediation Guidelines. Air, Land and Waste Policy Branch, Environmental Assurance Division. December, 2010.
Alberta Sustainable Resource Development. 2009. Fish Management Zones. Restricted Activity Periods (RAPs) for Fish Species in the 10 Fish Management Zones of Alberta. Resource Data Management, Fish and Wildlife Division. Website: http://srd.alberta.ca/FishWildlife/FishResearchLicence/documents/RestrictedActivityPeriodsForFishSpeciesInThe-10-FishManagementZonesOfAlberta-Jan-2010.pdf. Accessed January 2013.
Aldridge, K. undated. Wabamun Lake Water Quality Overview. Wabamun Watershed Management Council. 10 pp.
Anderson A.M. 2006. Wabamun Lake Oil Spill August 2005: Data report for Water and Sediment Quality in the Pelagic Area of the Lake (August 4-5 to September 15, 2005). Environmental Monitoring and Evaluation Branch, Environmental Assurance Division, Alberta Environment. April 2006.
Athabasca Watershed Council. 2013. Athabasca Watershed Council homepage. Website: http://www.awc-wpac.ca/. Accessed: March 2013.
Attard, M.E. 2012. Evaluation of aDcps for Suspended Sediment Transport Monitoring, Fraser River, British Columbia. M.Sc. Thesis submitted to Simon Fraser University, Summer, 2012. 118 pp.
Badra, P. 2011. Mussel Shell Survey Report: Kalamazoo River Unionid Mussel Shell Survey in the Marshall and Battle Creek Area, October 2010. Prepared for Stephanie Millsap, United States Fish & Wildlife Service and Kalamazoo River Enbridge Line 6B Oil Spill Trustee Council. June 2, 2011.
Baker, J. M. 1997. Differences in risk perception: How clean is clean? Proc. International Oil Spill Conference, Technical Report IOSC-006, American Petroleum Institute, Pub. No. 4652C.Washington, DC.
Baker, J.M. 1995. Net environmental benefit analysis for oil spill response. Proc. International Oil Spill Conference, American Petroleum Institute, Pub. No. 4620. Washington, DC.

Trans Mountain Pipeline ULC Volume 7, Pipeline Facilities Technical Reports Trans Mountain Expansion Project Qualitative Ecological Risk Assessment of
Pipeline Spills Technical Report
December, 2013 REP-NEB-TERA-00019
Page 9-2
Barron, M.G., M. Carls, J. Short, S. Rice, R. Heintz, M. Rau and R. Di Guilio. 2003. Assessment of the phototoxicity of weathered Alaska North Slope crude oil to juvenile pink salmon. Report prepared for Prince William Sound Regional Citizen‟s Advisory Council. December 2, 2003.
British Columbia Ministry of Environment, Lands and Parks. 1997. State of Water Quality of North Thompson River at North Kamloops: 1985 – 1995. Canada-British Columbia Water Quality Monitoring Agreement. May 1997. Website: http://www.env.gov.bc.ca/wat/wq/quality/nthompson/index.htm. Accessed: March 2013.
British Columbia Ministry of Environment. 2000a. Ministry Working to Contain Oil Spill Near Chetwynd. Information Bulletin. Ministry of Environment, Lands and Parks. August 1, 2000.
British Columbia Ministry of Environment. 2000b. Pine River Oil Spill Response: Update #6. Information Bulletin. Ministry of Environment, Lands and Parks. August 11, 2000.
British Columbia Ministry of Environment. 2007a. Water Quality Assessment of Fraser River at Hope (1979-2004). Canada-British Columbia Water Quality Monitoring Agreement. Prepared for: BC Ministry of Environment and Environment Canada. January 2007. Website: http://www.env.gov.bc.ca/wat/wq/quality/hope/wq_fraser_riv_hope_2004.pdf. Accessed: March 2013.
British Columbia Ministry of Environment. 2007b. Environmental Trends in British Columbia: 2007. Website: http://www.env.gov.bc.ca/soe/archive/reports/et07/EnvironmentalTrendsBC_2007_fullreport.pdf. Accessed: March 2013.
British Columbia Ministry of Environment. 2009a. Remediation of Sites Contaminated by a Spill. Facts on Contaminated Sites. June 2009.
British Columbia Ministry of Environment. 2009b. Environmental Quality Standards, Technical Guidance on Contaminated Sites. February 2009.
British Columbia Ministry of Environment. 2013a. British Columbia Heritage Rivers Program. Government of British Columbia. Accessed online July 18, 2013 at: http://www.env.gov.bc.ca/bcparks/heritage_rivers_program/bc_rivers.html.
British Columbia Ministry of Environment. 2013b. Pine River Oil Spill. Environmental Emergency Management Program, Incident Overviews. Accessed online at: http://www.env.gov.bc.ca/eemp/incidents/earlier/pembina_00.htm.
Bustard, D. and M. Miles. 2011. Potential Effects of an Oil Pipeline Rupture on Reach 2 of Morice River. A Submission to the Joint Review Panel, Enbridge Northern Gateway Project. December 2011.
Canadian Council of Ministers of the Environment. 1996. A Framework for Ecological Risk Assessment: General Guidance. CCME Subcommittee on Environmental Quality Criteria for Contaminated Sites. 32 pp.
Canadian Council of Ministers of the Environment. 1997. A Framework for Ecological Risk Assessment: Technical Appendices.
Canadian Council of Ministers of the Environment. 2008. Canada-Wide Standard for Petroleum Hydrocarbons (PHC) in Soil: Scientific Rationale Supporting Technical Document. PN 1399 ISBN 978-1-896997-77-3 PDF.
Canadian Heritage Rivers System. 2011. The Canadian Heritage Rivers System. Website: http://www.chrs.ca/en/rivers.php. Accessed: March 2013.

Trans Mountain Pipeline ULC Volume 7, Pipeline Facilities Technical Reports Trans Mountain Expansion Project Qualitative Ecological Risk Assessment of
Pipeline Spills Technical Report
December, 2013 REP-NEB-TERA-00019
Page 9-3
Carls, Mark G., Rice, Stanley D., and Hose, Jo Ellen. 1999. Sensitivity of fish embryos to weathered crude oil: Part I. Low-level exposure during incubation causes malformations, genetic damage, and mortality in larval pacific herring (Clupea pallasi). Environmental Toxicology and Chemistry, Vol. 18, No. 3, pp. 481–493, 1999.
Cloutier, D., Hill, P. R., Amos, C. L., and Lee K. 2002. Annular flume experiments on oil-mineral aggregates: an oil spill countermeasure on low energy shorelines. In: Proceedings of the 2nd International Symposium on Contaminates Sediments, 129-134.
Committee on the Status of Endangered Wildlife in Canada. 2003. COSEWIC assessment and update status report on the white sturgeon Acipenser transmontanus in Canada. Committee on the Status of Endangered Wildlife in Canada. Ottawa. vii + 51 pp. Website: www.sararegistry.gc.ca/status/status_e.cfm.
Coon, N.C. and M.P. Dieter. 1981. Responses of adult mallard ducks to ingested South Louisiana crude oil. Environmental Research 24: 309-314.
Coppock R.W., Mostrom, M.S., Stair, E.L., Semalulu, S.S. 1996. Toxicopathology of oilfield poisoning in cattle: A review. Vet. Human Toxicology No. 38 (1) February 1996.
Danchuk, S.N. 2009. The Fate and Transport of Light Petroleum Hydrocarbons in the Lower Mississippi River Delta. A Dissertation Submitted to the Graduate Faculty of the Louisiana State University and Agricultural and Mechanical College in partial fulfillment of the requirements for the degree of Doctor of Philosophy in the Department of Civil and Environmental Engineering. May 2009.
Debruyn, A.M., B.G. Wernick, C. Stefura, B.G. McDonald, B.L. Rudolph, L. Patterson and P.M. Chapman. 2007. In situ experimental assessment of lake whitefish development following a freshwater oil spill. Environmental Science and Technology 41(20):6983-9.
Delvigne, G.A.L. 1987. Droplet size distribution of naturally dispersed oil. In Proceedings of the 1987 Oil Spill Conference. Amsterdam, The Netherlands, 29-40.
Delvigne, G.A.L. 2002. Physical appearance of oil in coil-contaminated sediment. Spill Science and Technology Bulletin 8(1):55-63.
Department of Fisheries and Oceans. 1999. Fraser River Chinook Salmon. DFO Science Stock Status Report, D6-11. Website: http://www.dfo-mpo.gc.ca/csas/Csas/status/1999/D6-11e.pdf. Accessed: January 2013.
DePennart, H., R. Crowther, T. Taylor, M. Morden and S. Mattison. 2004. The Use of Risk Assessment for Regional Management of Aquatic Impacts. In Remediation Technologies Symposium. 2004.
Di Toro, D.M., J. A. McGrath and D. J. Hansen. 2000. Technical basis for narcotic chemicals and polycyclic aromatic hydrocarbon criteria. I. water and tissue. Environmental Toxicology and Chemistry 19(8): 1951–1970.
Douglas, G.S., E.H. Owens, J. Hardenstine and R.C. Prince. 2002. The OSSA II pipeline oil spill: the character and weathering of the spilled oil. Spill Science & Technology bulletin, 7(3-4):135-148.
East Walker River Trustee Council. 2009. Advanced Fuel Filtration Systems East Walker River Oil Spill. Final Restoration Plan/Environmental Assessment. California Department of Fish and Game, Nevada Department of Wildlife, Nevada Division of Environmental Protection, United States Fish and Wildlife Service. August 2009.
EBA Engineering. 2013. Modeling the Fate and Behaviour of Marine Oil Spills for the Trans Mountain Expansion Project. November, 2013.

Trans Mountain Pipeline ULC Volume 7, Pipeline Facilities Technical Reports Trans Mountain Expansion Project Qualitative Ecological Risk Assessment of
Pipeline Spills Technical Report
December, 2013 REP-NEB-TERA-00019
Page 9-4
Efroymson, R.A., J.P. Nicolette and G.W. Suter II. 2003. A Framework for Net Environmental Benefit Analysis for Remediation or Restoration of Petroleum-Contaminated Sites. Prepared by the Oak Ridge National Laboratory for the United States Department of Energy. January 2003.
Enbridge. 2011. Conceptual Site Model. Enbridge Energy, Limited Partnership, Line 6B Incident, Marshall, Michigan. Prepared May 10, 2011. Approved July 8, 2011.
Enbridge. 2013a. Frequently Asked Questions. Line 6B Response. Website accessed July 16, 2013 at: http://response.enbridgeus.com/response/main.aspx?id=12783.
Enbridge. 2013b. Conceptual Site Model – 2013. Enbridge Energy, Limited Partnership, Line 6B Incident, Marshall, Michigan. Originally Submitted April 1, 2013. Approved April 25, 2011.
Environment Canada and Health Canada. 2011. Screening Assessment, Petroleum Sector Stream Approach. Gas Oil [Site-Restricted]. Chemical Abstracts Service Registry Number 68333-25-5. September, 2011.
Environment Canada. 2004. Fraser River at Hope Federal-Provincial Monitoring Station. Website: http://waterquality.ec.gc.ca/WaterQualityWeb/stationOverview.aspx?stationId=BC08MF0001. Accessed: March 2013.
Environment Canada. 2011a. Archived Hydrometric Data for Athabasca River at Hinton (Station No. 07AD0021) Monthly Mean Discharge (m3/s). Website: http://www.wsc.ec.gc.ca/applications/H2O/graph-eng.cfm?yearb=&yeare=&station=07AD002&report=daily&year=2011. Accessed: March 2013.
Environment Canada. 2011b. Archived Hydrometric Data for Athabasca River near Windfall (Station No. 07AE001) Monthly Mean Discharge (m3/s). Website: http://www.wsc.ec.gc.ca/applications/H2O/report-eng.cfm?station=07AE001&report=peak&data=flow&year=2011&yearb=&yeare=. Accessed: March 2013.
Environment Canada. 2011c. Archived Hydrometric Data for North Thompson River at McLure (Station No. 08LB064) Monthly Mean Discharge (m3/s). Website: http://www.wsc.ec.gc.ca/applications/H2O/graph-eng.cfm?station=08LB064&report=daily&year=2011. Accessed: March 2013.
Environment Canada. 2011d. Archived Hydrometric Data for Fraser River at Hope (Station No. 08MF005) Monthly Mean Discharge (m3/s). Website: http://www.wsc.ec.gc.ca/applications/H2O/graph-eng.cfm?station=08MF005&report=daily&year=2011. Accessed: March 2013.
Environment Canada. 2011e. Archived Hydrometric Data for Fraser River at Mission (Station No. 08MH024) Monthly Mean Discharge (m3/s). Website: http://www.wsc.ec.gc.ca/applications/H2O/report-eng.cfm?yearb=&yeare=&station=08MH024&report=monthly&data=flow&year=2011. Accessed: March 2013.
Environment Canada. 2011f. Archived Hydrometric Data for Fraser River at Port Mann Pumping Station (Station No. 08MH126) Monthly Mean Discharge (m3/s). Website: http://www.wsc.ec.gc.ca/applications/H2O/report-eng.cfm?yearb=&yeare=&station=08MH126&report=monthly&data=flow&year=1992. Accessed: March 2013.

Trans Mountain Pipeline ULC Volume 7, Pipeline Facilities Technical Reports Trans Mountain Expansion Project Qualitative Ecological Risk Assessment of
Pipeline Spills Technical Report
December, 2013 REP-NEB-TERA-00019
Page 9-5
Environment Canada. 2012. Letter from Harp Gill, Senior Environmental Assessment Officer, Environment Canada, to Rachel Shaw, Project Assessment Director, British Columbia Environmental Assessment Office, and Carrie Brown, Manager Environmental Programs, Port Metro Vancouver. Environmental Assessment of the Proposed Vancouver Airport Fuel Delivery Project – Environment Canada Comments on the Biofilm Sensitivity Studies. November 13, 2012. http://a100.gov.bc.ca/appsdata/epic/documents/p346/1353362740413_313f19506b8b3b976ab0c3e05820522873c6bf1a51ac654fa8b0ce8483eac91d.pdf
Environment Canada. 2013. Archived Hydrometric Data. Accessed online at: http://www.wsc.ec.gc.ca/applications/H2O/index-eng.cfm.
Fallahtafti, Shirin, Toni Rantanenb, Stephen R. Browna, Victor Snieckusb, Peter V. Hodson. 2011. Toxicity of hydroxylated alkyl-phenanthrenes to the early life stages of Japanese medaka (Oryzias latipes). Aquatic Toxicology 106– 107 (2012) 56– 64.
Federal Contaminated Sites Action Plan. 2012. Ecological Risk Assessment Guidance. Prepared by Azimuth Consulting Group for Environment Canada. March 2012.
Fedorenko, A.Y., P.E.I. Fee and A.L. Kahl. 1983. Trapping and coded wire tagging of wild juvenile Chinook Salmon in the Upper Fraser River. Canadian Manuscript Report of Fisheries and Aquatic Sciences, 1733.
FIERA Biological Consulting. 2012. Athabasca State of the Watershed Report: Phase 2. Prepared for: Athabasca Watershed Council. March 31, 2012. Website: http://www.awc-wpac.ca/sites/default/files/Athabasca_State_of_the_Watershed_Phase_2_FINAL-April23-2012.pdf. Accessed: March 2013.
Fingas, M., B. Hollebone, and B. Fieldhouse. 2006. The Density Behaviour of Heavy Oils in Freshwater: The Example of the Lake Wabamun Spill. Emergencies Science and Technology Division, Environment Canada, Environmental Technology Centre, Ottawa, Ontario.
Foght, J. 2006. Potential for Biodegradation of Sub-Littoral Residual Oil by Naturally Occurring Microorganisms following the Lake Wabamun Train Derailment. A report submitted July 14, 2006 to Leanne Zrum, Alberta Environment, and Gary Sergy, Environment Canada. Department of Biological Sciences, University of Alberta.
French McCay, D.P. 2002. Development and application of an oil toxicity and exposure model, OilToxEx. Environmental Toxicology and Chemistry 21(10): 2080-2094.
French McCay, D.P. 2009. State-of-the-art and research needs for oil spill impact assessment modelling. In Proceedings of the 32nd AMOP Technical Seminar on Environmental Contamination and Response, Emergencies Science Division, Environment Canada, Ottawa, ON, Canada, pp. 601-653.
French, D., M. Reed, K. Jayko, S. Feng, H. Rines, S. Pavignano, T. Isaji, S. Puckett, A. Keller, F. W. French III, D. Gifford, J. McCue, G. Brown, E. MacDonald, J. Quirk, S. Natzke, R. Bishop, M. Welsh, M. Phillips and B.S. Ingram. 1996. The Comprehensive Environmental Response, Compensation and Liability Act of 1980 (CERCLA) type A natural resource damage assessment model for coastal and marine environments (NRDAM/CME), Technical Documentation. Final Report, submitted to the Office of Environmental Policy and Compliance, United States Department of the Interior, Washington, DC, April, 1996, Contract No. 14-0001-91-C-11.
Goldberg, H. 2011. Pine River 2011 Fisheries Update: Status of Recovery Post-2000 Pipeline Rupture. Submitted to Enbridge. November 2011.
Government of Alberta. 2013. Watershed Planning and Advisory Councils (WPACs). Website: http://www.waterforlife.alberta.ca/01261.html. Accessed: March 2013.

Trans Mountain Pipeline ULC Volume 7, Pipeline Facilities Technical Reports Trans Mountain Expansion Project Qualitative Ecological Risk Assessment of
Pipeline Spills Technical Report
December, 2013 REP-NEB-TERA-00019
Page 9-6
Guyomarch, J., Merlin, F., and Bermanose, P. 1999. Oil interaction with mineral fines and chemical dispersion: behaviour of the dispersed oil in coastal or estuarine condition. In: Environment Canada‟s 22nd Arctic and Marine Oil Spill (AMOP) Technical Seminar, Calgary, Alberta, Canada, pp. 137–149.
Hampton, S., A. Montalvo, D. Higgins and P. Sollberger. 2002. Assessment of Natural Resources Damages as a Result of the East Walker River Oil Spill on December 20 2000. Edited by the California Department of Fish and Game – Office of Spill Prevention and Response, United States Fish and Wildlife Service and the Nevada Division of Wildlife.
Hanson, D.L. and T. Cochnauer. 1992. White Sturgeon Management Framework Plan. Pacific States Marine Fisheries Commission. Portland, OR.
Harper, John R. 2013. Methods for Estimating Shoreline Oil Retention. Prepared for EBA Engineering, Vancouver, BC. Prepared by Coastal and Ocean Resources, Victoria, BC. COR: 13-08. May 2013.
Henshaw, T., E. H. Owens, V. Copeman and A. Mianzan. 2001. The OSSA II Pipeline Spill, Bolivia: Clean-up Criteria, Clean-up Operations, Environmental Monitoring, and Community Issues. IOSC Proceedings.
Higgins, D.K. 2002. Assessment of Damages to Natural Resources in the East Walker River from the Advanced Fuel Filtration Spill: Water, Sediment, and Fish Tissue Analysis. United States Fish and Wildlife Service, Nevada Fish and Wildlife Office, Division of Environmental Quality, Reno, Nevada.
Hill, P.S., A. Khelifa and K. Lee. 2002. Time scale for oil droplet stabilization by mineral particles in turbulent suspensions. Spill Science & Technology Bulletin, 8(1), 73–81.
Hodson, Peter V., Collier, Tracy K., Martin, Jonathan D. 2011. Technical Data Report: Toxicity to Fish – Potential Effects of an Oil Spill into the Kitimat River from a Northern gateway Pipeline Rupture. Enbridge Northern Gateway Project. Report + Appendices, 113 p.
Hollebone B.P., B.Fieldhouse, G. Sergey, P. Lambert, Z. Wang, C. Yang and M. Landirault. 2011. The behaviour of heavy oil in fresh water lakes. In Proceedings of the 34th Arctic and Marine Oil Spill Program (AMOP) Technical Seminar, Banff, Alberta: Emergencies Science and Technology Division, Environment Canada.
Huang, C.P. and H.A. Elliot. 1977. The Stability of Emulsified Crude Oils as Affected by Suspended Particles. In D. A. Wolfe (Ed.), Fate and effect of petroleum hydrocarbons on marine organisms and ecosystems, Pergamon Press, New York, pp. 413–420.
Hugenin, M.T., D.H. Haury, J.C. Weiss, D. Helton, C.-A. Manen, E. Reinharz and J. Michel. 1996. Injury Assessment. Guidance document for natural resource damage assessment under the Oil Pollution Act of 1990. Prepared for the Damage Assessment and Restoration Program. National Oceanic and Atmospheric Administration. Appendix D. Negative Effects from Oil.
Irvine, J.R., C.K. Parken, D.G. Chen, J. Candy, T. Ming, J. Supernault, W. Shaw and R.E. Bailey. 2001. 2001 Assessment of Stock Status for Coho Salmon from the Interior Fraser River. Canadian Science Advisory Secretariat Research Document, 2001/083.
Jenssen, B. M. and M. Ekker. 1991a. Dose dependent effects of plumage-oiling on thermoregulation of common eiders Somateria mollissima residing in water. Polar Research, 10:579-84.
Jenssen, B. M. and M. Ekker. 1991b. Effects of plumage contamination with crude oil dispersant mixtures on thermoregulation in common eiders and mallards. Archives of Environmental Contamination and Toxicology, 20:398-403.

Trans Mountain Pipeline ULC Volume 7, Pipeline Facilities Technical Reports Trans Mountain Expansion Project Qualitative Ecological Risk Assessment of
Pipeline Spills Technical Report
December, 2013 REP-NEB-TERA-00019
Page 9-7
Johannes, M.R., L.H. Nikl, R.J. Hoogendoorn and R.E. Scott. 2011. Fraser River Sockeye Habitat Use in the Lower Fraser and Strait of Georgia. Golder Associated Ltd. Cohen Commission Technical Report, 12.
Kemper, C., H. Wollis, C. Found, D. Prescott, and M. Heckbert. 2008. Western Grebes (Aechmophorus occidentalis) in Alberta: 2006 Field Summary. Alberta Species at Risk Report No. 121. Alberta Sustainable Resource Development, Fish and Wildlife Division, Edmonton, AB. 17pp.
Khan, A.A., R.W. Coppock and M.M. Schuler. 2001. Effects of multiple exposures of small doses of Pembina Cardium crude oil and diesel in rats. Arch. Environ. Contam. Toxicol. 40: 418-424.
Khan, A.A., R.W. Coppock, M.M. Schuler, L.Z. Florence, L.E. Lillie and M.S. Mostrom. 1996. Biochemical effects of Pembina Cardium crude oil exposure in cattle. Arch. Environ. Contam. Toxicol. 30: 349-355.
Khelifa, A., M. Fingas and C. Brown. 2008. Effects of dispersants on oil-SPM aggregation and fate in US coastal waters. NOAA/UNH Coastal Response Research Center. Final Report Grant Number: NA04NOS4190063.
Khelifa, A., P.S. Hill and K. Lee. 2005a. A comprehensive numerical approach to predict oil-mineral aggregate (OMA) formation following oil spills in aquatic environments. In Proceedings of the 2005 International Oil Spill Conference, pp. 1-6.
Khelifa, A., P.S. Hill, P. Stoffyn-Egli and K. Lee. 2005b. Effects of salinity and clay composition on oil–clay aggregations. Marine Environmental Research, 59, 235–254.
Khelifa, A., Stoffyn-Egli, P., Hill, P.S., and Lee, K. 2002. Characteristics of oil droplets stabilized by mineral particles: effect of oil types and temperature. Spill Science and Technology Bulletin, 8(1), 19–30.
Kinder Morgan Canada Inc. (KMC). 2013. Trans Mountain Pipeline ULC Petroleum Tariff Rules and Regulations Governing the Transportation of Petroleum. Tariff No. 92. Compiled by Brenda McClellan and Issued by Heather Mark, Kinder Morgan Canada Inc. Issued May 14, 2013; Effective July 16, 2013.
Knapp, W.D., M.D. Nassichuk, J.J. Turner and I.K. Birtwell. 1982. The Thompson River Basin: Pacific salmon resources and Environmental Issues. Canadian Manuscript Report of Fisheries and Aquatic Sciences, 1668.
Kuwae, Tomohiro, Peter G. Beninger, Priscilla Decottignies, Kimberley J. Mathot, Dieta R. Lund and Robert W. Elner. 2008. Biofilm Grazing in a Higher Vertebrate: The Western Sandpiper, Calidris Mauri. Copyright 2008 by the Ecological Society of America. Ecology, 89(3), 2008, pp. 599–606.
Labelle, M. 2009. Status of pacific salmon resources in southern British Columbia and the Fraser River Basin. Pacific Fisheries Resource Conservation Council.
Langer, O.E. 2010. Juvenile sockeye use of the Lower Fraser River and its estuary. A note for submission to the Cohen Commission.
Le Floch, S., Guyomarch, J., Merlin, F. X., Stoffyn-Egli P., Dixon, J., and Lee, K. 2002. The influence of salinity on oil-mineral aggregate formation. Spill Science & Technology Bulletin, 8, 1, 65-71.
Lee, K. 2002. Oil-particle interactions in aquatic environments: influence on the transport, fate, effect and remediation of oil spills. Spill Science and Technology Bulletin, 8(1), 3-8.

Trans Mountain Pipeline ULC Volume 7, Pipeline Facilities Technical Reports Trans Mountain Expansion Project Qualitative Ecological Risk Assessment of
Pipeline Spills Technical Report
December, 2013 REP-NEB-TERA-00019
Page 9-8
Lee, K., P. Stoffyn-Egli and E.H. Owens. 2001. Natural Dispersion of Oil in a Freshwater Ecosystem: Desaguadero Pipeline Spill, Bolivia. Proceedings, 2001 International Oil Spill Conference. American Petroleum Institute, Washington, D.C.
Lee, K., P. Stoffyn-Egli and E.H. Owens. 2002. The OSSA II pipeline spill: natural mitigation of a riverine oil spill by oil-mineral aggregate formation. Spill Science & Technology Bulletin, 7(3-4):149-154.
Lee, K., P. Stoffyn-Egli, G.H. Tremblay, E.H. Owens, G.A. Sergy, C.C. Guenette and R.C. Prince. 2003. Oil-mineral aggregate formation on oiled beaches: natural attenuation and sediment relocation. Spill Science and Technology Bulletin, 8(3):285-296.
Leighton, F.A. 1993. The toxicity of petroleum oils to birds. Envrion. Rev., 1:92-103.
LGL Ltd. Environmental Research Associates. 2007. Development of an annual Salmonid Productivity Assessment Program for the Nicola River Watershed. M. Mathews, B. Bocking, G. Glova, N. Todd and T. Sampson. Prepared for the Pacific Salmon Foundation. Website: http://www.thinksalmon.com/reports/FSWP_07_D2_NTA_FINAL_REPORT.pdf. Accessed: January 2013.
Lill, A.F. 2002. Greater Georgia Basin Steelhead Recovery Action Plan. Prepared for the Pacific Salmon Foundation in conjunction with the Ministry of Water, Land and Air Protection.
Logan, D.T. 2007. Perspective on ecotoxicology of PAHs to fish. Human and Ecological Risk Assessment 13: 302-316.
Marty, G.D., Ronald A. Heintz, and David E. Hinton. 1997. Histology and teratology of pink salmon larvae near the time of emergence from gravel substrate in the laboratory. Canadian Journal of Zoololgy. 75: 978-988 (1997).
McDonald, B.G. and P.M. Chapman. 2002. PM. PAH phototoxicity--an ecologically irrelevant phenomenon? Marine Pollution Bulletin 44:1321-1326.
McPhail. J.D. 2007. The Freshwater Fishes of British Columbia. The University of Alberta Press, Ring House 2. Edmonton, AB.
Michigan Department of Community Health. 2013. Kalamazoo River/Enbridge Spill: Evaluation of Kalamazoo River surface water and fish after a crude oil release. Public Comment Release. Prepared under a Cooperative Agreement with the United States Department of Health and Human Services and the Agency for Toxic Substances and Disease Registry.
Montana Department of Environmental Quality. 2012. Silvertip Pipeline Crude Oil Release. Site Update. November 2012. Accessed online at: http://www.deq.mt.gov/statesuperfund/silvertipoilspill/default.mcpx.
Montana Department of Environmental Quality. 2013. Letter to Tom Henson (ARCADIS) Re: Silvertip Public Surface Water Supply Sampling – No Further Sampling Required. May 16, 2013. Accessed online at: http://www.deq.mt.gov/statesuperfund/silvertipoilspill/default.mcpx.
Montana Fish, Wildlife and Parks. 2011a. FWP issues fish-consumption advisory below oil spill. Monday, July 25, 2011. Accessed online at: http://fwp.mt.gov/news/newsReleases/fishAndWildlife/nr_0291.html.
Montana Fish, Wildlife and Parks. 2011b. Tests completed on fish caught below oil spill. Friday, August 26, 2011. Accessed online at: http://fwp.mt.gov/news/newsReleases/fishAndWildlife/nr_0302.html.

Trans Mountain Pipeline ULC Volume 7, Pipeline Facilities Technical Reports Trans Mountain Expansion Project Qualitative Ecological Risk Assessment of
Pipeline Spills Technical Report
December, 2013 REP-NEB-TERA-00019
Page 9-9
National Energy Board. 2011. Remediation Process Guide. Her Majesty the Queen in Right of Canada as represented by the National Energy Board 2011.
National Oceanic and Atmospheric Administration. 2008. New Orleans Spill Incident: Barge DM 932. Accessed online at: http://archive.orr.noaa.gov/topic_subtopic_entry.php?RECORD_KEY(entry_subtopic_topic)=entry_id,subtopic_id,topic_id&entry_id(entry_subtopic_topic)=749&subtopic_id(entry_subtopic_topic)=2&topic_id(entry_subtopic_topic)=1.
National Oceanic and Atmospheric Administration. 2010. NOAA‟s Oil Spill Response, Understanding Tar Balls. United States Department of Commerce. May 24, 2010.
National Research Council. 2003. Oil in the Sea III: Inputs, Fates, and Effects. Committee on Oil in the Sea: Inputs, Fates, and Effects, Ocean Studies Board and Marine Board, Divisions of Earth and Life Studies and Transportation Research Board, National Research Council of the National Academies. The National Academy Press, Washington, D.C. 446p.
National Transportation Safety Board. 2012. Enbridge Incorporated Hazardous Liquid Rupture and Release, Marshall, Michigan, July 25, Accident Report. NTSB/PA-12/01, PB2012-916501. Adopted July 10, 2012.
Natureworks. 2013. Western Sandpiper – Calidris mauri. Nature Files. © 2013 New Hampshire Public Television Durham, NH 03824. Accessed online at: http://www.nhptv.org/natureworks/westernsandpiper.htm.
Owens, E. 2002. Response strategies for spills on land. Spill Science & Technology Bulletin, Vol. 7(3-4):115–117.
Owens, E.H. and Sergy, G.A. 1994. Field Guide to the Documentation and Description of Oiled Shorelines. Environmental Technology Centre, Environment Canada.
Owens, E.H. and Sergy, G.A. 2007. Guidelines for Selecting Shoreline Treatment Endpoints for Oil Spill Response. Emergencies Science and Technology Division, Environment Canada. Ottawa, ON. 30pp.
Owens, E.H. and Sergy, G.A., 2003. Treatment Criteria and Endpoint Standards for Oiled Shorelines and Riverbanks. Manuscript Report EE-171, Environmental Protection Service, Environment Canada.Ottawa, ON.
Owens, E.H. and T. Henshaw. 2002. The OSSA II pipeline oil spill: the distribution of oil, clean-up criteria, and clean-up operations. Spill Science & Technology Bulletin 7(3/4):119-134.
Partners for the Saskatchewan River Basin. 2009. From the Mountains to the Sea: The State of the Saskatchewan River Basin. Partners for the Saskatchewan River Basin.
Payne, J.R., J.R. Clayton Jr. and B.E. Kirstein. 2003. Oil/suspended particulate material interactions and sedimentation. Spill Science & Technology Bulletin 8(2):201-221.
Payne, J.R., J.R. Clayton Jr., G.D. McNabb Jr., B.E. Kirstein, C.L. Clary, R.T. Redding, J.S. Evans, E. Reimnitz and E.W. Kempema. 1989. Oil–ice–sediment interactions during freeze-up and break-up. Final Report 64, US Department of Commerce, NOAA, OCSEAP, 382.
Perrin, C.J., A. Heaton and M.A. Laynes. 2000. White Sturgeon (Acipenser transmontanus) Spawning Habitat in the Lower Fraser River, 1999. Report prepared by Limnotek Research and Development Inc. for BC Fisheries.

Trans Mountain Pipeline ULC Volume 7, Pipeline Facilities Technical Reports Trans Mountain Expansion Project Qualitative Ecological Risk Assessment of
Pipeline Spills Technical Report
December, 2013 REP-NEB-TERA-00019
Page 9-10
Reiter, G.A., K. McCleneghan, P. McGovern, and J. Hardwick. 2002. The East Walker River Spill: Clean-up in a Severe Winter Environment! Report prepared by response management consultants and the California Department of Fish and Game, Office of Spill Prevention and Response, Sacramento, California.
Schindler, D.W., A.M. Anderson, J. Brzustowski, W.F. Donahue, G. Goss, J. Nelson, V. St. Louis, M. Sullivan and S. Swanson. 2004. Lake Wabamun: A Review of Scientific Studies and Environmental Impacts. Prepared for the Minister of Alberta Environment, Edmonton, Alberta. Publ. No. T769.
Simpson, K., D. Dobson, R. Semple, S. Lehmann, S. Baillie and I. Matthews. 2001. Status in 2000 of Coho Stock Adjacent to the Strait of Georgia. Canadian Science Advisory Secretarial Research Document, 2001/144.
Stantec Consulting Ltd., RPS ASA, and AMEC Environment & Infrastructure. 2012. Ecological and Human Health Risk Assessment for Pipeline Spills, Technical Data Report. Enbridge Northern Gateway Project. Prepared for Enbridge Northern Gateway Pipelines. July 2012.
Stubblefield, W.A., G.A. Hancock, H.A. Prince and R.K. Ringer. 1995b. Effects of naturally weathered Exxon Valdex crude oil on mallard reproduction. Environ. Toxicol. Chem. 14: 1951-1960.
Stubblefield, W.A., G.A. Hancock, W.H. Ford and R.K. Ringer. 1995a. Acute and subchronic toxicity of naturally weathered Exxon Valdex crude oil in mallards and ferrets. Environ. Toxicol. Chem. 14: 1941-1950.
Szaro, R.C., M.P. Dieter and G. H. Heintz. 1978. Effects of chronic ingestion of South Louisiana crude oil on mallard ducklings. Environmental Research 17: 426-436.
TERA Environmental Consultants. 2013. Fisheries Alberta Technical Report for the Trans Mountain Pipeline ULC, Trans Mountain Expansion Project. November 2013.
Trans Mountain Pipeline ULC. 2013. Project Description for the Proposed Trans Mountain Expansion Project. Submitted to the National Energy Board by Trans Mountain Pipeline ULC. May 2013.
Transportation Safety Board of Canada. 2007. Derailment, Canadian National Freight Train M30351-03 Mile 49.4, Edson Subdivision, Wabamun, Alberta, 03 August 2005. Railway Investigation Report R05E0059.
Triton Environmental Consultants. 2013. Fisheries Technical Report for the Trans Mountain Pipeline ULC, Trans Mountain Expansion Project. November 2013.
United States Department of Transportation. 2012. ExxonMobil Silvertip Pipeline Crude Oil Release into the Yellowstone River in Laurel, MT on 7/1/2011. United States Department of Transportation, Pipelines and Hazardous Materials Safety Administration, and Office of Pipeline Safety, Western Region. October 30, 2012.
United States Environmental Protection Agency. 1998. Guidelines for Ecological Risk Assessment. EPA/630/R-95/002F.
United States Environmental Protection Agency. 2011a. Yellowstone River Spill: Data. Yellowstone River Spill, Region 8. Revised August 17 2011. Accessed online at: http://www.epa.gov/yellowstoneriverspill/data/index.htm.
United States Environmental Protection Agency. 2011b. Questions and Answers. Yellowstone River Spill, Region 8. Revised July 15, 2011. Accessed online at: http://www.epa.gov/yellowstoneriverspill/qanda.htm.

Trans Mountain Pipeline ULC Volume 7, Pipeline Facilities Technical Reports Trans Mountain Expansion Project Qualitative Ecological Risk Assessment of
Pipeline Spills Technical Report
December, 2013 REP-NEB-TERA-00019
Page 9-11
United States Environmental Protection Agency. 2011c. Silvertip Pipeline Incident: Update. July 23, 2011.
United States Environmental Protection Agency. 2011d. Silvertip Pipeline Spill, Summary of Pure and Weathered Crude Oil Samples. Accessed online at: http://www.epa.gov/yellowstoneriverspill/factsheets/SilvertipPipelineCrudeOilFactSheet080411.pdf.
United States Environmental Protection Agency. 2012. Two Years after the Enbridge Pipeline Rupture. USEPA Situation Report, October 19, 2012. Presentation prepared by Steven Noble, MDEQ-WRD, Enbridge Response Unit.
United States Environmental Protection Agency. 2013. Fact Sheet: Oil Clean-up Continues on Kalamazoo River. June 2013.
United States Fish & Wildlife Service. 2008. ACL Barge DM 932-New Orleans, LA Oil Spill. FWS Report: R4-EC-RST-7/26/08 to 7/27/08 Operational Period.
United States Fish & Wildlife Service. 2009. Barge DM 932 Oil Spill, Mississippi River, New Orleans, Louisiana. After Action Report. Summer 2009.
VAFFC. 2012a. Appendices A to H. Vancouver Airport Fuel Delivery Project Environmental Assessment Certificate Application Supplement 5: Fraser River Delta Biofilm: Sensitivity to Jet A Fuel Spills - Summary Report. Accessed online at: http://a100.gov.bc.ca/appsdata/epic/documents/p346/1350411653093_7e7029d7baa81ba5c7762cd0459ac1c6af1bd9dcfc35b56262a3c8644c96a193.pdf
VAFFC. 2012b. Spill Risk Report Vancouver Airport Fuel Delivery Project Application for an Environmental Assessment Certificate Additional Information – Spill Risk in the South Arm of the Fraser River. Accessed online at: http://a100.gov.bc.ca/appsdata/epic/documents/p346/1353363964954_313f19506b8b3b976ab0c3e05820522873c6bf1a51ac654fa8b0ce8483eac91d.pdf
Walterhouse, M. 2012. A Biological Survey of Sites on the Kalamazoo River and Talmadge Creek Near the Enbridge Oil Spill in Marshall, Calhoun County, Michigan, August 2011. Michigan Department of Environmental Quality, Water Resources Division. February 2012.
Wernick, B.G., A.M.H. deBruyn, L. Patterson and P.M. Chapman. 2009. Effects of an oil spill on the regrowth of emergent vegetation in a northern Alberta lake. Archives of Environmental Contamination and Toxicology 57:697-706.
Wesley, J. 2011. Summary Report, A Fish Survey of Sites on the Kalamazoo River and Talmadge Creek near the Enbridge Oil Spill in Marshall Calhoun and Kalamazoo Counties, Michigan, September 2010. Michigan Department of Natural Resources, Fisheries Division. April 2011.
Winter, J. et al. 2012. Assessing Natural Resource Impacts from the Enbridge Pipeline Spill into the Kalamazoo River. Presentation by Jessica Winter, National Oceanic and Atmospheric Administration. Hosted by the Center for Spills in the Environment, December 4-5, 2012, Portland, ME.
Witt O‟Brien‟s, Polaris Applied Sciences, and Western Canada Marine Response Corporation. 2013. A Study of Fate and Behavior of Diluted Bitumen Oils on Marine Waters Dilbit Experiments – Gainford, Alberta. Draft Report dated, November 22, 2013.

Trans Mountain Pipeline ULC Volume 7, Pipeline Facilities Technical Reports Trans Mountain Expansion Project Qualitative Ecological Risk Assessment of
Pipeline Spills Technical Report
December, 2013 REP-NEB-TERA-00019
Page 9-12
9.2. Personal Communications
Stantec wishes to acknowledge those people identified in the Personal Communications for their assistance in supplying information and comments incorporated into this report.
Lind, A. Trans Mountain Expansion Project, Senior Pipeline Engineer, Calgary, Alberta.
Brown, C. A. Colpat Pipeline Consulting Inc., Edmonton, Alberta
9.3. Data Sources Cited in Figures
AltaLIS. 2010. Alberta Settlements (digital file). Calgary, AB. Available: http://www.altalis.com/prod_base_bound.html. Acquired: February 2011. Last Update Check: May 15, 2013.
AltaLIS. 2012. Alberta Provincial Parks (digital file). Calgary, AB. Available: http://www.altalis.com/prod_base_bound.html. Acquired: August 2012. Last Update Check: May 15, 2013.
AltaLIS. 2013. Alberta Municipal Boundaries (digital file). Calgary, AB. Available: http://www.altalis.com/prod_base_bound.html. Acquired: August 2012. Last Update Check: May 15, 2013.
British Columbia Forests, Lands and Natural Resource Operations. 2008. Freshwater Atlas Lakes (digital file). Victoria, BC. Available: https://apps.gov.bc.ca/pub/dwds/home.so. Acquired: August 2011. Last Update Check: October 10, 2013.
British Columbia Forests, Lands and Natural Resource Operations. 2012. Digital Road Atlas (DRA) - Master Partially Attributed Road Data (digital file). Victoria, BC. Available: https://apps.gov.bc.ca/pub/dwds/home.so. Acquired: December 2012. Last Update Check: December 17, 2012.
British Columbia Ministry of Forests, Lands and Natural Resource Operations. 2008a. Tantalis Conservancy Areas (digital file). Victoria, BC. Available: https://apps.gov.bc.ca/pub/dwds/home.so. Acquired: May 2013. Last Update Check: May 21, 2013.
British Columbia Ministry of Forests, Lands and Natural Resource Operations. 2008b. Tantalis Parks, Ecological Reserves and Protected Areas (digital file). Victoria, BC. Available: https://apps.gov.bc.ca/pub/dwds/home.so. Acquired: August 2013. Last Update Check: August 1, 2013.
IHS Inc. 2004a. IHS Hydro Line Data (digital file). Calgary, AB. Available: http://energy.ihs.com/Solutions/Regions/Canada/. Acquired: June 2011. Last Update Check: October 23, 2013.
IHS Inc. 2004b. IHS Hydro Region Data (digital file). Calgary, AB. Available: http://energy.ihs.com/Solutions/Regions/Canada/. Acquired: June 2011. Last Update Check: October 23, 2013.
Natural Resources Canada. 2010a. North American Atlas – Hydrography (digital file). Ottawa, ON. Available: http://geogratis.cgdi.gc.ca/geogratis/en/download/northamerica.html. Acquired: June 2012. Last Update Check: January 3, 2013.
Natural Resources Canada. 2010b. North American Atlas – Hydrography (digital file). Ottawa, ON. Available: http://geogratis.gc.ca/api/en/nrcan-rncan/ess-sst/4a778c9f-00b1-5fce-aa2f-42a90d19eb24.html. Acquired: June 2012. Last Update Check: June 20, 2013.

Trans Mountain Pipeline ULC Volume 7, Pipeline Facilities Technical Reports Trans Mountain Expansion Project Qualitative Ecological Risk Assessment of
Pipeline Spills Technical Report
December, 2013 REP-NEB-TERA-00019
Page 9-13
Natural Resources Canada. 2012. CanVec -Transportation - 1020009 Railway (digital file). Sherbrooke, QC. Available: http://geogratis.cgdi.gc.ca/geogratis/en/download/topographic.html. Acquired: June 2012. Last Update Check: November 2012.
Natural Resources Canada. 2013a. Canada Lands Administrative Boundaries Level 1 (digital file). Ottawa, ON. Available: http://geogratis.gc.ca/api/en/nrcan-rncan/ess-sst/eb3757cc-d08b-5e62-9a44-3a8534ff3249.html. Acquired: June 2013. Last Update Check: June 13, 2013.
Natural Resources Canada. 2013b. National Road Network – Alberta (digital file). Sherbrooke, QC. Available: http://www.geobase.ca/geobase/en/data/nrn/index.html. Acquired: June 2013. Last Update Check: September 6, 2013.
Natural Resources Canada. 2013c. National Road Network - British Columbia (digital file). Sherbrooke, QC. Available: http://www.geobase.ca/geobase/en/data/nrn/index.html. Acquired: September 2013. Last Update Check: September 6, 2013.
TERA Environmental Consultants. 2008. Hillshade. Derived from Natural Resources Canada, Earth Sciences Sector, Centre for Topographic Information. 2000-2008. Canadian Digital Elevation Data 250k (digital files). Sherbrooke, QC. Available: http://www.geobase.ca/geobase/en/data/cded/index.html. Acquired: 2008. Last Update Check: December 2010.Watersheds: source unknown

Trans Mountain Pipeline ULC Volume 7, Pipeline Facilities Technical Reports Trans Mountain Expansion Project Qualitative Ecological Risk Assessment of
Pipeline Spills Technical Report
December, 2013 REP-NEB-TERA-00019
Page A
Appendix A: Laboratory Certificates

Your P.O. #: 806743-0-KMCASite Location: EHA & HHRA PROJECTPO # 806743-0-KMCA
Attention: TAMMY SAUERKINDER MORGAN CANADABOX 3198SHERWOOD PARK, ABCANADA T8A 2A6
Report Date: 2013/05/06This report supersedes all previous reports with the same Maxxam job number
Job/Sample Analysis Type Well Name/Sample ID Sample Point
B311691/ FP1881 Trace Sulphur TRANSMOUNTAIN TERMINAL AWBB311691/ FP9840 Trace Sulphur TRANSMOUNTAIN TERMINAL CLB311691/ GA9052 Trace Sulphur KINDER MORGAN EDMONTON TERMINAL AHSB311691/ GB5489 Certificate of Analysis TRANSMOUNTAIN TERMINAL AWBB311691/ GB5490 Certificate of Analysis TRANSMOUNTAIN TERMINAL CLB311691/ GB5491 Certificate of Analysis KINDER MORGAN EDMONTON TERMINAL AHSB311691/ GB6705 Certificate of Analysis TRANSMOUNTAIN TERMINAL AWBB311691/ GB6706 Certificate of Analysis TRANSMOUNTAIN TERMINAL CLB311691/ GB6707 Certificate of Analysis KINDER MORGAN EDMONTON TERMINAL A H S
The test Interfacial Tension (ASTM D971) was sent for analysis to Exova, 7217 Roper Rd., Edmonton, AB, Canada, T6B 3J4.The test SAPA - Bitumen Samples (ASTM D4124) was sent for analysis to Alberta Innovates, 250 Karl Clark Rd, Edmonton, AB, Canada, T
Validated by :Alex UrsoSenior Analyst
Report Distribution0 Reports(B311691)TAMMY SAUER KINDER MORGAN CANADA BOX 3198 SHERWOOD PARK, CANADA
Page 1 of 19Date of Issue: 2013/05/06
All analyses are performed according to internal procedures that are based on current published reference methods.

TRACE SULPHUR ANALYSIS
MaxxID Client ID Meter Number
B311691:FP1881Laboratory Number
KINDER MORGAN CANADAOperator Name LSD Well ID
TRANSMOUNTAIN TERMINALWell Name
AL/PKInitials of Sampler
MAXXAM ANALYTICSSampling Company
Field or Area Pool or Zone
AWBSample Point
BLACK CANContainer Identity Percent Full
Test Recovery Sample Gathering Point Solution Gas
Test Type No. Multiple Recovery
I n t e r v a lFrom:
To:
Elevations (m)
KB GRDWell Fluid Status Well Status Mode
Well Status Type Well Type
Gas or Condensate Project Licence No.
Production Rates
Water m3/d Oil m3/d Gas 1000m3/d
Gauge Pressures kPa
Source As Received
Temperature °C
Source
23.0As Received
2013/02/11Date Sampled Start Date Sampled End
2013/04/03Date Received
2013/04/25Date Reported
2013/05/06Date Reissued
GS1Analyst
COMPOSITIONComponent Common Name
BoilingPt. (°C)
Sulphurmole ppm
Sulphurmass ppm
Hydrogen SulphideCarbonyl SulphideMethanethiolEthanethiolDimethyl SulphideCarbon DisulphideIso-Propanethiolt-ButanethiolMethyl Ethyl Sulphiden-PropanethiolUnknownThiophene/sec-ButanethiolDiethyl SulphideIso-Butanethioln-ButanethiolUnknownDimethyl Disulphiden-PentanethiolUnknownn-HexanethiolUnknownn-HeptanethiolUnknown
Total Sulphur
H2SCOSMethyl mercaptanEthyl mercaptanDMSCS2Iso-propyl mercaptantert-butyl mercaptanMESPropyl mercaptan
Thiophene/sec-Butyl mercaptanDESIso-butyl mercaptanButyl mercaptan
DMDSPentyl mercaptan
Hexyl mercaptan
Heptyl mercaptan
-60.4-506.23538
46.558646770
36-6984/9092.19998
71-97110127
100-126151
127-150177
152-176
<0.5<0.5
3.38.25.32.3
14.15.48.73.11.59.01.26.11.02.71.11.4
15.85.0
26.114.137.4
<0.5<0.5
0.92.21.40.63.71.42.30.8
<0.52.4
<0.51.6
<0.50.7
<0.5<0.5
4.21.36.93.79.9
Mercaptan Sulphur on Naphtha fraction (IBP 204°C) ASTM D3227 (mass%)Naphtha IBP 204°C (volume %)Elemental Sulphur (mass ppm)
PROPERTIES
Molecular Wt. (g/mole)Measured
Molecular Wt. (g/mole)Calculated
Onsite H2S
ppm(mole) mole%
** In fo r m at io n n o t s u p p l ied b y c l ien t -- d a ta d er iv ed f r o m L S D in fo r m at io n R es u l t s r e la te o n ly to i t em s tes ted
Remarks:
E D M O N TO N 6744-50 S t r ee t , E d m o n to n , C an ad a T6B 3M 9 Te l : (780) 378-8500 Fax (780) 378-86992013/05 /06 13 :52Page 2 of 19

TRACE SULPHUR ANALYSIS
MaxxID Client ID Meter Number
B311691:FP9840Laboratory Number
KINDER MORGAN CANADAOperator Name LSD Well ID
TRANSMOUNTAIN TERMINALWell Name
AL/PKInitials of Sampler
MAXXAM ANALYTICSSampling Company
Field or Area Pool or Zone
CLSample Point
BLACK CANContainer Identity Percent Full
Test Recovery Sample Gathering Point Solution Gas
Test Type No. Multiple Recovery
I n t e r v a lFrom:
To:
Elevations (m)
KB GRDWell Fluid Status Well Status Mode
Well Status Type Well Type
Gas or Condensate Project Licence No.
Production Rates
Water m3/d Oil m3/d Gas 1000m3/d
Gauge Pressures kPa
Source As Received
Temperature °C
Source
23.0As Received
2013/02/14Date Sampled Start Date Sampled End
2013/04/03Date Received
2013/04/25Date Reported
2013/05/06Date Reissued
GS1Analyst
COMPOSITIONComponent Common Name
BoilingPt. (°C)
Sulphurmole ppm
Sulphurmass ppm
Hydrogen SulphideCarbonyl SulphideMethanethiolEthanethiolDimethyl SulphideCarbon DisulphideIso-Propanethiolt-ButanethiolMethyl Ethyl Sulphiden-PropanethiolUnknownThiophene/sec-ButanethiolDiethyl SulphideIso-Butanethioln-ButanethiolUnknownDimethyl Disulphiden-PentanethiolUnknownn-HexanethiolUnknownn-HeptanethiolUnknown
Total Sulphur
H2SCOSMethyl mercaptanEthyl mercaptanDMSCS2Iso-propyl mercaptantert-butyl mercaptanMESPropyl mercaptan
Thiophene/sec-Butyl mercaptanDESIso-butyl mercaptanButyl mercaptan
DMDSPentyl mercaptan
Hexyl mercaptan
Heptyl mercaptan
-60.4-506.23538
46.558646770
36-6984/9092.19998
71-97110127
100-126151
127-150177
152-176
<0.5<0.5
3.08.6
13.83.3
19.43.37.3
<0.5<0.522.6
3.3<0.5
4.2<0.5<0.5<0.531.9
4.3111.5<0.5
154.3
<0.5<0.5<0.5
1.11.7
<0.52.5
<0.50.9
<0.5<0.5
2.9<0.5<0.5
0.5<0.5<0.5<0.5
4.00.5
14.2<0.519.6
Mercaptan Sulphur on Naphtha fraction (IBP 204°C) ASTM D3227 (mass%)Naphtha IBP 204°C (volume %)Elemental Sulphur (mass ppm)
PROPERTIES
Molecular Wt. (g/mole)Measured
Molecular Wt. (g/mole)Calculated
Onsite H2S
ppm(mole) mole%
** In fo r m at io n n o t s u p p l ied b y c l ien t -- d a ta d er iv ed f r o m L S D in fo r m at io n R es u l t s r e la te o n ly to i t em s tes ted
Remarks:
E D M O N TO N 6744-50 S t r ee t , E d m o n to n , C an ad a T6B 3M 9 Te l : (780) 378-8500 Fax (780) 378-86992013/05 /06 13 :52Page 3 of 19

TRACE SULPHUR ANALYSIS
MaxxID Client ID Meter Number
B311691:GA9052Laboratory Number
KINDER MORGAN CANADAOperator Name LSD Well ID
KINDER MORGAN EDMONTON TERMINALWell Name
N/AInitials of Sampler
KINDER MORGANSampling Company
EDMONTONField or Area Pool or Zone
AHSSample Point
RED CANContainer Identity Percent Full
Test Recovery Sample Gathering Point Solution Gas
Test Type No. Multiple Recovery
I n t e r v a lFrom:
To:
Elevations (m)
KB GRDWell Fluid Status Well Status Mode
Well Status Type Well Type
Gas or Condensate Project Licence No.
Production Rates
Water m3/d Oil m3/d Gas 1000m3/d
Gauge Pressures kPa
Source As Received
Temperature °C
Source
23.0As Received
2013/03/31Date Sampled Start Date Sampled End
2013/04/03Date Received
2013/04/25Date Reported
2013/05/06Date Reissued
GS1Analyst
COMPOSITIONComponent Common Name
BoilingPt. (°C)
Sulphurmole ppm
Sulphurmass ppm
Hydrogen SulphideCarbonyl SulphideMethanethiolEthanethiolDimethyl SulphideCarbon DisulphideIso-Propanethiolt-ButanethiolMethyl Ethyl Sulphiden-PropanethiolUnknownThiophene/sec-ButanethiolDiethyl SulphideIso-Butanethioln-ButanethiolUnknownDimethyl Disulphiden-PentanethiolUnknownn-HexanethiolUnknownn-HeptanethiolUnknown
Total Sulphur
H2SCOSMethyl mercaptanEthyl mercaptanDMSCS2Iso-propyl mercaptantert-butyl mercaptanMESPropyl mercaptan
Thiophene/sec-Butyl mercaptanDESIso-butyl mercaptanButyl mercaptan
DMDSPentyl mercaptan
Hexyl mercaptan
Heptyl mercaptan
-60.4-506.23538
46.558646770
36-6984/9092.19998
71-97110127
100-126151
127-150177
152-176
<0.50.52.16.92.7
<0.56.51.01.71.9
<0.54.9
<0.50.61.1
<0.51.2
<0.55.22.6
14.5<0.519.8
<0.5<0.5
0.51.70.6
<0.51.6
<0.5<0.5
0.5<0.5
1.2<0.5<0.5<0.5<0.5<0.5<0.5
1.20.63.5
<0.54.8
Mercaptan Sulphur on Naphtha fraction (IBP 204°C) ASTM D3227 (mass%)Naphtha IBP 204°C (volume %)Elemental Sulphur (mass ppm)
PROPERTIES
Molecular Wt. (g/mole)Measured
Molecular Wt. (g/mole)Calculated
Onsite H2S
ppm(mole) mole%
** In fo r m at io n n o t s u p p l ied b y c l ien t -- d a ta d er iv ed f r o m L S D in fo r m at io n R es u l t s r e la te o n ly to i t em s tes ted
Remarks:
E D M O N TO N 6744-50 S t r ee t , E d m o n to n , C an ad a T6B 3M 9 Te l : (780) 378-8500 Fax (780) 378-86992013/05 /06 13 :52Page 4 of 19

CERTIFICATE OF ANALYSIS
MaxxID Client ID Meter Number
B311691:GB5489Laboratory Number
KINDER MORGAN CANADAOperator Name LSD Well ID
TRANSMOUNTAIN TERMINALWell Name
AL/PKInitials of Sampler
MAXXAM ANALYTICSSampling Company
Field or Area Pool or Zone
AWBSample Point
BLACK CANContainer Identity Percent Full
Test Recovery Sample Gathering Point Solution Gas
Test Type No. Multiple Recovery
I n t e r v a lFrom:
To:
Elevations (m)
KB GRDWell Fluid Status Well Status Mode
Well Status Type Well Type
Gas or Condensate Project Licence No.
Production Rates
Water m3/d Oil m3/d Gas 1000m3/d
Gauge Pressures kPa
Source As Received
Temperature °C
Source
23.0As Received
2013/02/11Date Sampled Start Date Sampled End
2013/04/03Date Received
2013/04/25Date Reported
2013/05/06Date Reissued
MS7,HF ,WH ,SK1,BC2,KL9,MN2Analyst
PARAMETER DESCRIPTION Result unit Method MDL
Industrial
Interfacial Tension 35 dyne/cm 0.01
Metals
Mercury (Hg) 10 ppb ASTM D6722 1
Composition
Saturates 30.2 mass% 0.1Aromatics 18.9 mass% 0.1Polars 42.6 mass% 0.1Asphaltenes 8.3 mass% 0.1
Density Analysis
Absolute Density @ 15 °C 921.5 kg/m3 ASTM D5002 0.1Measured Relative Density @ 15 °C 0.9223 N/A ASTM D5002API Gravity @ 15 °C 21.9 N/A
Elements
Dissolved Aluminum (Al) <1 mg/kg ASTM D5708A 1Dissolved Barium (Ba) <1 mg/kg ASTM D5708A 1Dissolved Beryllium (Be) <1 mg/kg ASTM D5708A 1Dissolved Boron (B) 4 mg/kg ASTM D5708A 1Dissolved Cadmium (Cd) <1 mg/kg ASTM D5708A 1Dissolved Calcium (Ca) 2 mg/kg ASTM D5708A 1Dissolved Chromium (Cr) <1 mg/kg ASTM D5708A 1Dissolved Cobalt (Co) <1 mg/kg ASTM D5708A 1Dissolved Copper (Cu) <1 mg/kg ASTM D5708A 1Dissolved Iron (Fe) 1 mg/kg ASTM D5708A 1Dissolved Lead (Pb) <1 mg/kg ASTM D5708A 1Dissolved Lithium (Li) <1 mg/kg ASTM D5708A 1Dissolved Magnesium (Mg) <1 mg/kg ASTM D5708A 1Dissolved Manganese (Mn) <1 mg/kg ASTM D5708A 1Dissolved Molybdenum (Mo) 5 mg/kg ASTM D5708A 1Dissolved Nickel (Ni) 47.2 mg/kg ASTM D5708A 0.5Dissolved Phosphorus (P) 0.5 mg/kg ASTM D5708A 0.5Dissolved Potassium (K) 1 mg/kg ASTM D5708A 1Dissolved Silicon (Si) 1 mg/kg ASTM D5708A 1
** In fo r m at io n n o t s u p p l ied b y c l ien t -- d a ta d er iv ed f r o m L S D in fo r m at io n R es u l t s r e la te o n ly to i t em s tes ted
Remarks:
Unable to perform Naphthenic Acid due to sample matrix.
E D M O N TO N 6744-50 S t r ee t , E d m o n to n , C an ad a T6B 3M 9 Te l : (780) 378-8500 Fax (780) 378-86992013/05 /06 13 :52Page 5 of 19

CERTIFICATE OF ANALYSIS
MaxxID Client ID Meter Number
B311691:GB5489Laboratory Number
KINDER MORGAN CANADAOperator Name LSD Well ID
TRANSMOUNTAIN TERMINALWell Name
AL/PKInitials of Sampler
MAXXAM ANALYTICSSampling Company
Field or Area Pool or Zone
AWBSample Point
BLACK CANContainer Identity Percent Full
Test Recovery Sample Gathering Point Solution Gas
Test Type No. Multiple Recovery
I n t e r v a lFrom:
To:
Elevations (m)
KB GRDWell Fluid Status Well Status Mode
Well Status Type Well Type
Gas or Condensate Project Licence No.
Production Rates
Water m3/d Oil m3/d Gas 1000m3/d
Gauge Pressures kPa
Source As Received
Temperature °C
Source
23.0As Received
2013/02/11Date Sampled Start Date Sampled End
2013/04/03Date Received
2013/04/25Date Reported
2013/05/06Date Reissued
MS7,HF ,WH ,SK1,BC2,KL9,MN2Analyst
PARAMETER DESCRIPTION Result unit Method MDL
Elements
Dissolved Silver (Ag) <1 mg/kg ASTM D5708A 1Dissolved Sodium (Na) 3 mg/kg ASTM D5708A 1Dissolved Strontium (Sr) <1 mg/kg ASTM D5708A 1Dissolved Sulphur (S) 34500 mg/kg ASTM D5708A 1Dissolved Tin (Sn) <1 mg/kg ASTM D5708A 1Dissolved Titanium (Ti) <1 mg/kg ASTM D5708A 1Dissolved Vanadium (V) 136 mg/kg ASTM D5708A 1Dissolved Zinc (Zn) <1 mg/kg ASTM D5708A 1
Physical Properties
Closed Cup Flash point <-35 °C ASTM D93Pour Point -33 °C ASTM D5853
Simulated Dist ASTM D7169
D7169 Distillation Initial Boiling Point 34.1 °C ASTM D7169D7169 Distillation 1 % off 34.9 °C ASTM D7169D7169 Distillation 2 % off 35.3 °C ASTM D7169D7169 Distillation 3 % off 35.9 °C ASTM D7169D7169 Distillation 4 % off 36.3 °C ASTM D7169D7169 Distillation 5 % off 37.0 °C ASTM D7169D7169 Distillation 6 % off 38.1 °C ASTM D7169D7169 Distillation 7 % off 39.5 °C ASTM D7169D7169 Distillation 8 % off 41.8 °C ASTM D7169D7169 Distillation 9 % off 46.1 °C ASTM D7169D7169 Distillation 10 % off 54.8 °C ASTM D7169D7169 Distillation 11 % off 63.8 °C ASTM D7169D7169 Distillation 12 % off 68.6 °C ASTM D7169D7169 Distillation 13 % off 70.7 °C ASTM D7169D7169 Distillation 14 % off 74.4 °C ASTM D7169D7169 Distillation 15 % off 78.8 °C ASTM D7169D7169 Distillation 16 % off 83.9 °C ASTM D7169D7169 Distillation 17 % off 89.4 °C ASTM D7169D7169 Distillation 18 % off 97.0 °C ASTM D7169D7169 Distillation 19 % off 99.8 °C ASTM D7169D7169 Distillation 20 % off 103.2 °C ASTM D7169D7169 Distillation 21 % off 115.5 °C ASTM D7169D7169 Distillation 22 % off 132.3 °C ASTM D7169D7169 Distillation 23 % off 147.7 °C ASTM D7169
** In fo r m at io n n o t s u p p l ied b y c l ien t -- d a ta d er iv ed f r o m L S D in fo r m at io n R es u l t s r e la te o n ly to i t em s tes ted
Remarks:
Unable to perform Naphthenic Acid due to sample matrix.
E D M O N TO N 6744-50 S t r ee t , E d m o n to n , C an ad a T6B 3M 9 Te l : (780) 378-8500 Fax (780) 378-86992013/05 /06 13 :52Page 6 of 19

CERTIFICATE OF ANALYSIS
MaxxID Client ID Meter Number
B311691:GB5489Laboratory Number
KINDER MORGAN CANADAOperator Name LSD Well ID
TRANSMOUNTAIN TERMINALWell Name
AL/PKInitials of Sampler
MAXXAM ANALYTICSSampling Company
Field or Area Pool or Zone
AWBSample Point
BLACK CANContainer Identity Percent Full
Test Recovery Sample Gathering Point Solution Gas
Test Type No. Multiple Recovery
I n t e r v a lFrom:
To:
Elevations (m)
KB GRDWell Fluid Status Well Status Mode
Well Status Type Well Type
Gas or Condensate Project Licence No.
Production Rates
Water m3/d Oil m3/d Gas 1000m3/d
Gauge Pressures kPa
Source As Received
Temperature °C
Source
23.0As Received
2013/02/11Date Sampled Start Date Sampled End
2013/04/03Date Received
2013/04/25Date Reported
2013/05/06Date Reissued
MS7,HF ,WH ,SK1,BC2,KL9,MN2Analyst
PARAMETER DESCRIPTION Result unit Method MDL
Simulated Dist ASTM D7169
D7169 Distillation 24 % off 165.1 °C ASTM D7169D7169 Distillation 25 % off 186.6 °C ASTM D7169D7169 Distillation 26 % off 211.0 °C ASTM D7169D7169 Distillation 27 % off 231.3 °C ASTM D7169D7169 Distillation 28 % off 249.1 °C ASTM D7169D7169 Distillation 29 % off 263.2 °C ASTM D7169D7169 Distillation 30 % off 276.0 °C ASTM D7169D7169 Distillation 31 % off 288.0 °C ASTM D7169D7169 Distillation 32 % off 298.3 °C ASTM D7169D7169 Distillation 33 % off 307.5 °C ASTM D7169D7169 Distillation 34 % off 316.4 °C ASTM D7169D7169 Distillation 35 % off 325.1 °C ASTM D7169D7169 Distillation 36 % off 333.5 °C ASTM D7169D7169 Distillation 37 % off 342.0 °C ASTM D7169D7169 Distillation 38 % off 349.9 °C ASTM D7169D7169 Distillation 39 % off 357.5 °C ASTM D7169D7169 Distillation 40 % off 365.2 °C ASTM D7169D7169 Distillation 41 % off 372.7 °C ASTM D7169D7169 Distillation 42 % off 380.4 °C ASTM D7169D7169 Distillation 43 % off 388.2 °C ASTM D7169D7169 Distillation 44 % off 395.9 °C ASTM D7169D7169 Distillation 45 % off 403.4 °C ASTM D7169D7169 Distillation 46 % off 410.8 °C ASTM D7169D7169 Distillation 47 % off 417.5 °C ASTM D7169D7169 Distillation 48 % off 423.8 °C ASTM D7169D7169 Distillation 49 % off 430.2 °C ASTM D7169D7169 Distillation 50 % off 436.8 °C ASTM D7169D7169 Distillation 51 % off 443.8 °C ASTM D7169D7169 Distillation 52 % off 450.9 °C ASTM D7169D7169 Distillation 53 % off 457.9 °C ASTM D7169D7169 Distillation 54 % off 465.1 °C ASTM D7169D7169 Distillation 55 % off 472.4 °C ASTM D7169D7169 Distillation 56 % off 479.9 °C ASTM D7169D7169 Distillation 57 % off 487.7 °C ASTM D7169D7169 Distillation 58 % off 495.6 °C ASTM D7169D7169 Distillation 59 % off 503.0 °C ASTM D7169D7169 Distillation 60 % off 510.6 °C ASTM D7169D7169 Distillation 61 % off 518.6 °C ASTM D7169D7169 Distillation 62 % off 526.9 °C ASTM D7169D7169 Distillation 63 % off 535.4 °C ASTM D7169
** In fo r m at io n n o t s u p p l ied b y c l ien t -- d a ta d er iv ed f r o m L S D in fo r m at io n R es u l t s r e la te o n ly to i t em s tes ted
Remarks:
Unable to perform Naphthenic Acid due to sample matrix.
E D M O N TO N 6744-50 S t r ee t , E d m o n to n , C an ad a T6B 3M 9 Te l : (780) 378-8500 Fax (780) 378-86992013/05 /06 13 :52Page 7 of 19

CERTIFICATE OF ANALYSIS
MaxxID Client ID Meter Number
B311691:GB5489Laboratory Number
KINDER MORGAN CANADAOperator Name LSD Well ID
TRANSMOUNTAIN TERMINALWell Name
AL/PKInitials of Sampler
MAXXAM ANALYTICSSampling Company
Field or Area Pool or Zone
AWBSample Point
BLACK CANContainer Identity Percent Full
Test Recovery Sample Gathering Point Solution Gas
Test Type No. Multiple Recovery
I n t e r v a lFrom:
To:
Elevations (m)
KB GRDWell Fluid Status Well Status Mode
Well Status Type Well Type
Gas or Condensate Project Licence No.
Production Rates
Water m3/d Oil m3/d Gas 1000m3/d
Gauge Pressures kPa
Source As Received
Temperature °C
Source
23.0As Received
2013/02/11Date Sampled Start Date Sampled End
2013/04/03Date Received
2013/04/25Date Reported
2013/05/06Date Reissued
MS7,HF ,WH ,SK1,BC2,KL9,MN2Analyst
PARAMETER DESCRIPTION Result unit Method MDL
Simulated Dist ASTM D7169
D7169 Distillation 64 % off 543.7 °C ASTM D7169D7169 Distillation 65 % off 552.6 °C ASTM D7169D7169 Distillation 66 % off 561.6 °C ASTM D7169D7169 Distillation 67 % off 570.3 °C ASTM D7169D7169 Distillation 68 % off 579.0 °C ASTM D7169D7169 Distillation 69 % off 587.9 °C ASTM D7169D7169 Distillation 70 % off 596.6 °C ASTM D7169D7169 Distillation 71 % off 605.4 °C ASTM D7169D7169 Distillation 72 % off 614.1 °C ASTM D7169D7169 Distillation 73 % off 623.0 °C ASTM D7169D7169 Distillation 74 % off 631.1 °C ASTM D7169D7169 Distillation 75 % off 639.0 °C ASTM D7169D7169 Distillation 76 % off 646.9 °C ASTM D7169D7169 Distillation 77 % off 654.1 °C ASTM D7169D7169 Distillation 78 % off 661.3 °C ASTM D7169D7169 Distillation 79 % off 669.9 °C ASTM D7169D7169 Distillation 80 % off 677.9 °C ASTM D7169D7169 Distillation 81 % off 686.3 °C ASTM D7169D7169 Distillation 82 % off 693.8 °C ASTM D7169D7169 Distillation 83 % off 701.4 °C ASTM D7169D7169 Distillation 84 % off 708.1 °C ASTM D7169D7169 Distillation 85 % off 715.5 °C ASTM D7169D7169 Distillation Residue @ 720°C 14.38 mass% ASTM D7169 0.01
Viscosity Analysis
Viscosity @ 30°C 112.5 cSt ASTM D7042 0.01000Viscosity @ 40°C 67.50 cSt ASTM D7042 0.01000Viscosity @ 50°C 43.76 cSt ASTM D7042 0.01000
** In fo r m at io n n o t s u p p l ied b y c l ien t -- d a ta d er iv ed f r o m L S D in fo r m at io n R es u l t s r e la te o n ly to i t em s tes ted
Remarks:
Unable to perform Naphthenic Acid due to sample matrix.
E D M O N TO N 6744-50 S t r ee t , E d m o n to n , C an ad a T6B 3M 9 Te l : (780) 378-8500 Fax (780) 378-86992013/05 /06 13 :52Page 8 of 19

CERTIFICATE OF ANALYSIS
MaxxID Client ID Meter Number
B311691:GB5490Laboratory Number
KINDER MORGAN CANADAOperator Name LSD Well ID
TRANSMOUNTAIN TERMINALWell Name
AL/PKInitials of Sampler
MAXXAM ANALYTICSSampling Company
Field or Area Pool or Zone
CLSample Point
BLACK CANContainer Identity Percent Full
Test Recovery Sample Gathering Point Solution Gas
Test Type No. Multiple Recovery
I n t e r v a lFrom:
To:
Elevations (m)
KB GRDWell Fluid Status Well Status Mode
Well Status Type Well Type
Gas or Condensate Project Licence No.
Production Rates
Water m3/d Oil m3/d Gas 1000m3/d
Gauge Pressures kPa
Source As Received
Temperature °C
Source
23.0As Received
2013/02/14Date Sampled Start Date Sampled End
2013/04/03Date Received
2013/04/25Date Reported
2013/05/06Date Reissued
MS7,LG5,WH ,SK1,BC2,KL9,MN2Analyst
PARAMETER DESCRIPTION Result unit Method MDL
Industrial
Interfacial Tension 42 dyne/cm 0.01
Metals
Mercury (Hg) 21 ppb ASTM D6722 1
Composition
Saturates 31.8 mass% 0.1Aromatics 20.3 mass% 0.1Polars 39.8 mass% 0.1Asphaltenes 8.0 mass% 0.1
Density Analysis
Absolute Density @ 15 °C 926.0 kg/m3 ASTM D5002 0.1Measured Relative Density @ 15 °C 0.9268 N/A ASTM D5002API Gravity @ 15 °C 21.2 N/A
Elements
Dissolved Aluminum (Al) <1 mg/kg ASTM D5708A 1Dissolved Barium (Ba) <1 mg/kg ASTM D5708A 1Dissolved Beryllium (Be) <1 mg/kg ASTM D5708A 1Dissolved Boron (B) 1 mg/kg ASTM D5708A 1Dissolved Cadmium (Cd) <1 mg/kg ASTM D5708A 1Dissolved Calcium (Ca) 2 mg/kg ASTM D5708A 1Dissolved Chromium (Cr) <1 mg/kg ASTM D5708A 1Dissolved Cobalt (Co) <1 mg/kg ASTM D5708A 1Dissolved Copper (Cu) <1 mg/kg ASTM D5708A 1Dissolved Iron (Fe) 3 mg/kg ASTM D5708A 1Dissolved Lead (Pb) <1 mg/kg ASTM D5708A 1Dissolved Lithium (Li) <1 mg/kg ASTM D5708A 1Dissolved Magnesium (Mg) <1 mg/kg ASTM D5708A 1Dissolved Manganese (Mn) <1 mg/kg ASTM D5708A 1Dissolved Molybdenum (Mo) 5 mg/kg ASTM D5708A 1Dissolved Nickel (Ni) 46.8 mg/kg ASTM D5708A 0.5Dissolved Phosphorus (P) 0.8 mg/kg ASTM D5708A 0.5Dissolved Potassium (K) 1 mg/kg ASTM D5708A 1Dissolved Silicon (Si) 2 mg/kg ASTM D5708A 1
** In fo r m at io n n o t s u p p l ied b y c l ien t -- d a ta d er iv ed f r o m L S D in fo r m at io n R es u l t s r e la te o n ly to i t em s tes ted
Remarks:
Unable to perform Naphthenic Acid due to sample matrix.
E D M O N TO N 6744-50 S t r ee t , E d m o n to n , C an ad a T6B 3M 9 Te l : (780) 378-8500 Fax (780) 378-86992013/05 /06 13 :52Page 9 of 19

CERTIFICATE OF ANALYSIS
MaxxID Client ID Meter Number
B311691:GB5490Laboratory Number
KINDER MORGAN CANADAOperator Name LSD Well ID
TRANSMOUNTAIN TERMINALWell Name
AL/PKInitials of Sampler
MAXXAM ANALYTICSSampling Company
Field or Area Pool or Zone
CLSample Point
BLACK CANContainer Identity Percent Full
Test Recovery Sample Gathering Point Solution Gas
Test Type No. Multiple Recovery
I n t e r v a lFrom:
To:
Elevations (m)
KB GRDWell Fluid Status Well Status Mode
Well Status Type Well Type
Gas or Condensate Project Licence No.
Production Rates
Water m3/d Oil m3/d Gas 1000m3/d
Gauge Pressures kPa
Source As Received
Temperature °C
Source
23.0As Received
2013/02/14Date Sampled Start Date Sampled End
2013/04/03Date Received
2013/04/25Date Reported
2013/05/06Date Reissued
MS7,LG5,WH ,SK1,BC2,KL9,MN2Analyst
PARAMETER DESCRIPTION Result unit Method MDL
Elements
Dissolved Silver (Ag) <1 mg/kg ASTM D5708A 1Dissolved Sodium (Na) 12 mg/kg ASTM D5708A 1Dissolved Strontium (Sr) <1 mg/kg ASTM D5708A 1Dissolved Sulphur (S) 37100 mg/kg ASTM D5708A 1Dissolved Tin (Sn) <1 mg/kg ASTM D5708A 1Dissolved Titanium (Ti) 1 mg/kg ASTM D5708A 1Dissolved Vanadium (V) 135 mg/kg ASTM D5708A 1Dissolved Zinc (Zn) <1 mg/kg ASTM D5708A 1
Physical Properties
Closed Cup Flash point <-35 °C ASTM D93Pour Point -33 °C ASTM D5853
Simulated Dist ASTM D7169
D7169 Distillation Initial Boiling Point 35.0 °C ASTM D7169D7169 Distillation 1 % off 35.3 °C ASTM D7169D7169 Distillation 2 % off 36.2 °C ASTM D7169D7169 Distillation 3 % off 37.9 °C ASTM D7169D7169 Distillation 4 % off 41.0 °C ASTM D7169D7169 Distillation 5 % off 49.1 °C ASTM D7169D7169 Distillation 6 % off 62.2 °C ASTM D7169D7169 Distillation 7 % off 69.3 °C ASTM D7169D7169 Distillation 8 % off 72.9 °C ASTM D7169D7169 Distillation 9 % off 82.3 °C ASTM D7169D7169 Distillation 10 % off 91.9 °C ASTM D7169D7169 Distillation 11 % off 100.0 °C ASTM D7169D7169 Distillation 12 % off 107.7 °C ASTM D7169D7169 Distillation 13 % off 120.1 °C ASTM D7169D7169 Distillation 14 % off 135.5 °C ASTM D7169D7169 Distillation 15 % off 149.6 °C ASTM D7169D7169 Distillation 16 % off 165.2 °C ASTM D7169D7169 Distillation 17 % off 183.7 °C ASTM D7169D7169 Distillation 18 % off 201.9 °C ASTM D7169D7169 Distillation 19 % off 217.2 °C ASTM D7169D7169 Distillation 20 % off 229.6 °C ASTM D7169D7169 Distillation 21 % off 241.3 °C ASTM D7169D7169 Distillation 22 % off 251.9 °C ASTM D7169D7169 Distillation 23 % off 261.4 °C ASTM D7169
** In fo r m at io n n o t s u p p l ied b y c l ien t -- d a ta d er iv ed f r o m L S D in fo r m at io n R es u l t s r e la te o n ly to i t em s tes ted
Remarks:
Unable to perform Naphthenic Acid due to sample matrix.
E D M O N TO N 6744-50 S t r ee t , E d m o n to n , C an ad a T6B 3M 9 Te l : (780) 378-8500 Fax (780) 378-86992013/05 /06 13 :52Page 10 of 19

CERTIFICATE OF ANALYSIS
MaxxID Client ID Meter Number
B311691:GB5490Laboratory Number
KINDER MORGAN CANADAOperator Name LSD Well ID
TRANSMOUNTAIN TERMINALWell Name
AL/PKInitials of Sampler
MAXXAM ANALYTICSSampling Company
Field or Area Pool or Zone
CLSample Point
BLACK CANContainer Identity Percent Full
Test Recovery Sample Gathering Point Solution Gas
Test Type No. Multiple Recovery
I n t e r v a lFrom:
To:
Elevations (m)
KB GRDWell Fluid Status Well Status Mode
Well Status Type Well Type
Gas or Condensate Project Licence No.
Production Rates
Water m3/d Oil m3/d Gas 1000m3/d
Gauge Pressures kPa
Source As Received
Temperature °C
Source
23.0As Received
2013/02/14Date Sampled Start Date Sampled End
2013/04/03Date Received
2013/04/25Date Reported
2013/05/06Date Reissued
MS7,LG5,WH ,SK1,BC2,KL9,MN2Analyst
PARAMETER DESCRIPTION Result unit Method MDL
Simulated Dist ASTM D7169
D7169 Distillation 24 % off 270.3 °C ASTM D7169D7169 Distillation 25 % off 279.6 °C ASTM D7169D7169 Distillation 26 % off 288.4 °C ASTM D7169D7169 Distillation 27 % off 296.4 °C ASTM D7169D7169 Distillation 28 % off 304.1 °C ASTM D7169D7169 Distillation 29 % off 311.6 °C ASTM D7169D7169 Distillation 30 % off 318.8 °C ASTM D7169D7169 Distillation 31 % off 326.3 °C ASTM D7169D7169 Distillation 32 % off 333.6 °C ASTM D7169D7169 Distillation 33 % off 341.0 °C ASTM D7169D7169 Distillation 34 % off 348.1 °C ASTM D7169D7169 Distillation 35 % off 355.1 °C ASTM D7169D7169 Distillation 36 % off 362.2 °C ASTM D7169D7169 Distillation 37 % off 369.3 °C ASTM D7169D7169 Distillation 38 % off 376.6 °C ASTM D7169D7169 Distillation 39 % off 384.0 °C ASTM D7169D7169 Distillation 40 % off 391.4 °C ASTM D7169D7169 Distillation 41 % off 398.9 °C ASTM D7169D7169 Distillation 42 % off 406.2 °C ASTM D7169D7169 Distillation 43 % off 413.2 °C ASTM D7169D7169 Distillation 44 % off 419.6 °C ASTM D7169D7169 Distillation 45 % off 425.8 °C ASTM D7169D7169 Distillation 46 % off 432.2 °C ASTM D7169D7169 Distillation 47 % off 439.0 °C ASTM D7169D7169 Distillation 48 % off 445.9 °C ASTM D7169D7169 Distillation 49 % off 452.8 °C ASTM D7169D7169 Distillation 50 % off 459.7 °C ASTM D7169D7169 Distillation 51 % off 466.8 °C ASTM D7169D7169 Distillation 52 % off 474.0 °C ASTM D7169D7169 Distillation 53 % off 481.2 °C ASTM D7169D7169 Distillation 54 % off 488.8 °C ASTM D7169D7169 Distillation 55 % off 496.5 °C ASTM D7169D7169 Distillation 56 % off 503.5 °C ASTM D7169D7169 Distillation 57 % off 510.8 °C ASTM D7169D7169 Distillation 58 % off 518.5 °C ASTM D7169D7169 Distillation 59 % off 526.5 °C ASTM D7169D7169 Distillation 60 % off 534.7 °C ASTM D7169D7169 Distillation 61 % off 542.7 °C ASTM D7169D7169 Distillation 62 % off 551.2 °C ASTM D7169D7169 Distillation 63 % off 559.9 °C ASTM D7169
** In fo r m at io n n o t s u p p l ied b y c l ien t -- d a ta d er iv ed f r o m L S D in fo r m at io n R es u l t s r e la te o n ly to i t em s tes ted
Remarks:
Unable to perform Naphthenic Acid due to sample matrix.
E D M O N TO N 6744-50 S t r ee t , E d m o n to n , C an ad a T6B 3M 9 Te l : (780) 378-8500 Fax (780) 378-86992013/05 /06 13 :52Page 11 of 19

CERTIFICATE OF ANALYSIS
MaxxID Client ID Meter Number
B311691:GB5490Laboratory Number
KINDER MORGAN CANADAOperator Name LSD Well ID
TRANSMOUNTAIN TERMINALWell Name
AL/PKInitials of Sampler
MAXXAM ANALYTICSSampling Company
Field or Area Pool or Zone
CLSample Point
BLACK CANContainer Identity Percent Full
Test Recovery Sample Gathering Point Solution Gas
Test Type No. Multiple Recovery
I n t e r v a lFrom:
To:
Elevations (m)
KB GRDWell Fluid Status Well Status Mode
Well Status Type Well Type
Gas or Condensate Project Licence No.
Production Rates
Water m3/d Oil m3/d Gas 1000m3/d
Gauge Pressures kPa
Source As Received
Temperature °C
Source
23.0As Received
2013/02/14Date Sampled Start Date Sampled End
2013/04/03Date Received
2013/04/25Date Reported
2013/05/06Date Reissued
MS7,LG5,WH ,SK1,BC2,KL9,MN2Analyst
PARAMETER DESCRIPTION Result unit Method MDL
Simulated Dist ASTM D7169
D7169 Distillation 64 % off 568.4 °C ASTM D7169D7169 Distillation 65 % off 576.7 °C ASTM D7169D7169 Distillation 66 % off 585.3 °C ASTM D7169D7169 Distillation 67 % off 593.9 °C ASTM D7169D7169 Distillation 68 % off 602.4 °C ASTM D7169D7169 Distillation 69 % off 611.1 °C ASTM D7169D7169 Distillation 70 % off 619.9 °C ASTM D7169D7169 Distillation 71 % off 628.4 °C ASTM D7169D7169 Distillation 72 % off 636.4 °C ASTM D7169D7169 Distillation 73 % off 644.7 °C ASTM D7169D7169 Distillation 74 % off 652.6 °C ASTM D7169D7169 Distillation 75 % off 660.1 °C ASTM D7169D7169 Distillation 76 % off 669.3 °C ASTM D7169D7169 Distillation 77 % off 677.8 °C ASTM D7169D7169 Distillation 78 % off 686.8 °C ASTM D7169D7169 Distillation 79 % off 694.5 °C ASTM D7169D7169 Distillation 80 % off 702.5 °C ASTM D7169D7169 Distillation 81 % off 709.7 °C ASTM D7169D7169 Distillation 82 % off 717.3 °C ASTM D7169D7169 Distillation Residue @ 720°C 17.65 mass% ASTM D7169 0.01
Viscosity Analysis
Viscosity @ 30°C 105.9 cSt ASTM D7042 0.01000Viscosity @ 40°C 64.09 cSt ASTM D7042 0.01000Viscosity @ 60°C 28.63 cSt ASTM D7042 0.01000
** In fo r m at io n n o t s u p p l ied b y c l ien t -- d a ta d er iv ed f r o m L S D in fo r m at io n R es u l t s r e la te o n ly to i t em s tes ted
Remarks:
Unable to perform Naphthenic Acid due to sample matrix.
E D M O N TO N 6744-50 S t r ee t , E d m o n to n , C an ad a T6B 3M 9 Te l : (780) 378-8500 Fax (780) 378-86992013/05 /06 13 :52Page 12 of 19

CERTIFICATE OF ANALYSIS
MaxxID Client ID Meter Number
B311691:GB5491Laboratory Number
KINDER MORGAN CANADAOperator Name LSD Well ID
KINDER MORGAN EDMONTON TERMINALWell Name
N/AInitials of Sampler
KINDER MORGANSampling Company
EDMONTONField or Area Pool or Zone
AHSSample Point
RED CANContainer Identity Percent Full
Test Recovery Sample Gathering Point Solution Gas
Test Type No. Multiple Recovery
I n t e r v a lFrom:
To:
Elevations (m)
KB GRDWell Fluid Status Well Status Mode
Well Status Type Well Type
Gas or Condensate Project Licence No.
Production Rates
Water m3/d Oil m3/d Gas 1000m3/d
Gauge Pressures kPa
Source As Received
Temperature °C
Source
23.0As Received
2013/03/31Date Sampled Start Date Sampled End
2013/04/03Date Received
2013/04/25Date Reported
2013/05/06Date Reissued
MS7,LG5,WH ,SK1,BC2,KL9,MN2Analyst
PARAMETER DESCRIPTION Result unit Method MDL
Industrial
Interfacial Tension 74 dyne/cm 0.01
Metals
Mercury (Hg) 7 ppb ASTM D6722 1
Composition
Saturates 31.2 mass% 0.1Aromatics 25.2 mass% 0.1Polars 35.4 mass% 0.1Asphaltenes 8.2 mass% 0.1
Density Analysis
Absolute Density @ 15 °C 935.4 kg/m3 ASTM D5002 0.1Measured Relative Density @ 15 °C 0.9362 N/A ASTM D5002API Gravity @ 15 °C 19.6 N/A
Elements
Dissolved Aluminum (Al) 13 mg/kg ASTM D5708A 1Dissolved Barium (Ba) <1 mg/kg ASTM D5708A 1Dissolved Beryllium (Be) <1 mg/kg ASTM D5708A 1Dissolved Boron (B) 2 mg/kg ASTM D5708A 1Dissolved Cadmium (Cd) <1 mg/kg ASTM D5708A 1Dissolved Calcium (Ca) 7 mg/kg ASTM D5708A 1Dissolved Chromium (Cr) <1 mg/kg ASTM D5708A 1Dissolved Cobalt (Co) <1 mg/kg ASTM D5708A 1Dissolved Copper (Cu) <1 mg/kg ASTM D5708A 1Dissolved Iron (Fe) 28 mg/kg ASTM D5708A 1Dissolved Lead (Pb) <1 mg/kg ASTM D5708A 1Dissolved Lithium (Li) <1 mg/kg ASTM D5708A 1Dissolved Magnesium (Mg) <1 mg/kg ASTM D5708A 1Dissolved Manganese (Mn) 1 mg/kg ASTM D5708A 1Dissolved Molybdenum (Mo) 7 mg/kg ASTM D5708A 1Dissolved Nickel (Ni) 37.3 mg/kg ASTM D5708A 0.5Dissolved Phosphorus (P) 1.3 mg/kg ASTM D5708A 0.5Dissolved Potassium (K) 2 mg/kg ASTM D5708A 1Dissolved Silicon (Si) 10 mg/kg ASTM D5708A 1
** In fo r m at io n n o t s u p p l ied b y c l ien t -- d a ta d er iv ed f r o m L S D in fo r m at io n R es u l t s r e la te o n ly to i t em s tes ted
Remarks:
Unable to perform Naphthenic Acid due to sample matrix.
E D M O N TO N 6744-50 S t r ee t , E d m o n to n , C an ad a T6B 3M 9 Te l : (780) 378-8500 Fax (780) 378-86992013/05 /06 13 :52Page 13 of 19

CERTIFICATE OF ANALYSIS
MaxxID Client ID Meter Number
B311691:GB5491Laboratory Number
KINDER MORGAN CANADAOperator Name LSD Well ID
KINDER MORGAN EDMONTON TERMINALWell Name
N/AInitials of Sampler
KINDER MORGANSampling Company
EDMONTONField or Area Pool or Zone
AHSSample Point
RED CANContainer Identity Percent Full
Test Recovery Sample Gathering Point Solution Gas
Test Type No. Multiple Recovery
I n t e r v a lFrom:
To:
Elevations (m)
KB GRDWell Fluid Status Well Status Mode
Well Status Type Well Type
Gas or Condensate Project Licence No.
Production Rates
Water m3/d Oil m3/d Gas 1000m3/d
Gauge Pressures kPa
Source As Received
Temperature °C
Source
23.0As Received
2013/03/31Date Sampled Start Date Sampled End
2013/04/03Date Received
2013/04/25Date Reported
2013/05/06Date Reissued
MS7,LG5,WH ,SK1,BC2,KL9,MN2Analyst
PARAMETER DESCRIPTION Result unit Method MDL
Elements
Dissolved Silver (Ag) <1 mg/kg ASTM D5708A 1Dissolved Sodium (Na) 5 mg/kg ASTM D5708A 1Dissolved Strontium (Sr) <1 mg/kg ASTM D5708A 1Dissolved Sulphur (S) 23600 mg/kg ASTM D5708A 1Dissolved Tin (Sn) <1 mg/kg ASTM D5708A 1Dissolved Titanium (Ti) 4 mg/kg ASTM D5708A 1Dissolved Vanadium (V) 74 mg/kg ASTM D5708A 1Dissolved Zinc (Zn) 1 mg/kg ASTM D5708A 1
Physical Properties
Closed Cup Flash point <-35 °C ASTM D93Pour Point -33 °C ASTM D5853
Simulated Dist ASTM D7169
D7169 Distillation Initial Boiling Point 34.0 °C ASTM D7169D7169 Distillation 1 % off 34.2 °C ASTM D7169D7169 Distillation 2 % off 35.3 °C ASTM D7169D7169 Distillation 3 % off 36.2 °C ASTM D7169D7169 Distillation 4 % off 37.8 °C ASTM D7169D7169 Distillation 5 % off 41.0 °C ASTM D7169D7169 Distillation 6 % off 48.6 °C ASTM D7169D7169 Distillation 7 % off 59.9 °C ASTM D7169D7169 Distillation 8 % off 68.5 °C ASTM D7169D7169 Distillation 9 % off 71.4 °C ASTM D7169D7169 Distillation 10 % off 77.6 °C ASTM D7169D7169 Distillation 11 % off 84.0 °C ASTM D7169D7169 Distillation 12 % off 89.4 °C ASTM D7169D7169 Distillation 13 % off 96.8 °C ASTM D7169D7169 Distillation 14 % off 99.9 °C ASTM D7169D7169 Distillation 15 % off 108.3 °C ASTM D7169D7169 Distillation 16 % off 122.9 °C ASTM D7169D7169 Distillation 17 % off 135.8 °C ASTM D7169D7169 Distillation 18 % off 149.2 °C ASTM D7169D7169 Distillation 19 % off 160.4 °C ASTM D7169D7169 Distillation 20 % off 172.5 °C ASTM D7169D7169 Distillation 21 % off 185.6 °C ASTM D7169D7169 Distillation 22 % off 211.3 °C ASTM D7169D7169 Distillation 23 % off 245.1 °C ASTM D7169
** In fo r m at io n n o t s u p p l ied b y c l ien t -- d a ta d er iv ed f r o m L S D in fo r m at io n R es u l t s r e la te o n ly to i t em s tes ted
Remarks:
Unable to perform Naphthenic Acid due to sample matrix.
E D M O N TO N 6744-50 S t r ee t , E d m o n to n , C an ad a T6B 3M 9 Te l : (780) 378-8500 Fax (780) 378-86992013/05 /06 13 :52Page 14 of 19

CERTIFICATE OF ANALYSIS
MaxxID Client ID Meter Number
B311691:GB5491Laboratory Number
KINDER MORGAN CANADAOperator Name LSD Well ID
KINDER MORGAN EDMONTON TERMINALWell Name
N/AInitials of Sampler
KINDER MORGANSampling Company
EDMONTONField or Area Pool or Zone
AHSSample Point
RED CANContainer Identity Percent Full
Test Recovery Sample Gathering Point Solution Gas
Test Type No. Multiple Recovery
I n t e r v a lFrom:
To:
Elevations (m)
KB GRDWell Fluid Status Well Status Mode
Well Status Type Well Type
Gas or Condensate Project Licence No.
Production Rates
Water m3/d Oil m3/d Gas 1000m3/d
Gauge Pressures kPa
Source As Received
Temperature °C
Source
23.0As Received
2013/03/31Date Sampled Start Date Sampled End
2013/04/03Date Received
2013/04/25Date Reported
2013/05/06Date Reissued
MS7,LG5,WH ,SK1,BC2,KL9,MN2Analyst
PARAMETER DESCRIPTION Result unit Method MDL
Simulated Dist ASTM D7169
D7169 Distillation 24 % off 271.0 °C ASTM D7169D7169 Distillation 25 % off 293.9 °C ASTM D7169D7169 Distillation 26 % off 312.9 °C ASTM D7169D7169 Distillation 27 % off 330.1 °C ASTM D7169D7169 Distillation 28 % off 345.6 °C ASTM D7169D7169 Distillation 29 % off 358.3 °C ASTM D7169D7169 Distillation 30 % off 369.6 °C ASTM D7169D7169 Distillation 31 % off 379.6 °C ASTM D7169D7169 Distillation 32 % off 388.5 °C ASTM D7169D7169 Distillation 33 % off 396.4 °C ASTM D7169D7169 Distillation 34 % off 403.6 °C ASTM D7169D7169 Distillation 35 % off 410.2 °C ASTM D7169D7169 Distillation 36 % off 415.9 °C ASTM D7169D7169 Distillation 37 % off 421.2 °C ASTM D7169D7169 Distillation 38 % off 426.1 °C ASTM D7169D7169 Distillation 39 % off 430.9 °C ASTM D7169D7169 Distillation 40 % off 435.9 °C ASTM D7169D7169 Distillation 41 % off 440.7 °C ASTM D7169D7169 Distillation 42 % off 445.5 °C ASTM D7169D7169 Distillation 43 % off 450.1 °C ASTM D7169D7169 Distillation 44 % off 454.4 °C ASTM D7169D7169 Distillation 45 % off 458.6 °C ASTM D7169D7169 Distillation 46 % off 462.8 °C ASTM D7169D7169 Distillation 47 % off 466.9 °C ASTM D7169D7169 Distillation 48 % off 471.0 °C ASTM D7169D7169 Distillation 49 % off 475.0 °C ASTM D7169D7169 Distillation 50 % off 479.0 °C ASTM D7169D7169 Distillation 51 % off 483.0 °C ASTM D7169D7169 Distillation 52 % off 487.1 °C ASTM D7169D7169 Distillation 53 % off 491.1 °C ASTM D7169D7169 Distillation 54 % off 495.2 °C ASTM D7169D7169 Distillation 55 % off 499.0 °C ASTM D7169D7169 Distillation 56 % off 502.8 °C ASTM D7169D7169 Distillation 57 % off 506.6 °C ASTM D7169D7169 Distillation 58 % off 510.4 °C ASTM D7169D7169 Distillation 59 % off 514.4 °C ASTM D7169D7169 Distillation 60 % off 518.4 °C ASTM D7169D7169 Distillation 61 % off 522.5 °C ASTM D7169D7169 Distillation 62 % off 526.7 °C ASTM D7169D7169 Distillation 63 % off 531.0 °C ASTM D7169
** In fo r m at io n n o t s u p p l ied b y c l ien t -- d a ta d er iv ed f r o m L S D in fo r m at io n R es u l t s r e la te o n ly to i t em s tes ted
Remarks:
Unable to perform Naphthenic Acid due to sample matrix.
E D M O N TO N 6744-50 S t r ee t , E d m o n to n , C an ad a T6B 3M 9 Te l : (780) 378-8500 Fax (780) 378-86992013/05 /06 13 :52Page 15 of 19

CERTIFICATE OF ANALYSIS
MaxxID Client ID Meter Number
B311691:GB5491Laboratory Number
KINDER MORGAN CANADAOperator Name LSD Well ID
KINDER MORGAN EDMONTON TERMINALWell Name
N/AInitials of Sampler
KINDER MORGANSampling Company
EDMONTONField or Area Pool or Zone
AHSSample Point
RED CANContainer Identity Percent Full
Test Recovery Sample Gathering Point Solution Gas
Test Type No. Multiple Recovery
I n t e r v a lFrom:
To:
Elevations (m)
KB GRDWell Fluid Status Well Status Mode
Well Status Type Well Type
Gas or Condensate Project Licence No.
Production Rates
Water m3/d Oil m3/d Gas 1000m3/d
Gauge Pressures kPa
Source As Received
Temperature °C
Source
23.0As Received
2013/03/31Date Sampled Start Date Sampled End
2013/04/03Date Received
2013/04/25Date Reported
2013/05/06Date Reissued
MS7,LG5,WH ,SK1,BC2,KL9,MN2Analyst
PARAMETER DESCRIPTION Result unit Method MDL
Simulated Dist ASTM D7169
D7169 Distillation 64 % off 535.2 °C ASTM D7169D7169 Distillation 65 % off 539.4 °C ASTM D7169D7169 Distillation 66 % off 543.6 °C ASTM D7169D7169 Distillation 67 % off 548.1 °C ASTM D7169D7169 Distillation 68 % off 552.7 °C ASTM D7169D7169 Distillation 69 % off 557.4 °C ASTM D7169D7169 Distillation 70 % off 562.1 °C ASTM D7169D7169 Distillation 71 % off 566.8 °C ASTM D7169D7169 Distillation 72 % off 571.3 °C ASTM D7169D7169 Distillation 73 % off 576.0 °C ASTM D7169D7169 Distillation 74 % off 581.0 °C ASTM D7169D7169 Distillation 75 % off 586.1 °C ASTM D7169D7169 Distillation 76 % off 591.3 °C ASTM D7169D7169 Distillation 77 % off 596.5 °C ASTM D7169D7169 Distillation 78 % off 601.9 °C ASTM D7169D7169 Distillation 79 % off 607.7 °C ASTM D7169D7169 Distillation 80 % off 613.4 °C ASTM D7169D7169 Distillation 81 % off 619.6 °C ASTM D7169D7169 Distillation 82 % off 625.9 °C ASTM D7169D7169 Distillation 83 % off 632.0 °C ASTM D7169D7169 Distillation 84 % off 638.6 °C ASTM D7169D7169 Distillation 85 % off 645.6 °C ASTM D7169D7169 Distillation 86 % off 652.6 °C ASTM D7169D7169 Distillation 87 % off 659.7 °C ASTM D7169D7169 Distillation 88 % off 668.9 °C ASTM D7169D7169 Distillation 89 % off 678.1 °C ASTM D7169D7169 Distillation 90 % off 688.4 °C ASTM D7169D7169 Distillation 91 % off 698.2 °C ASTM D7169D7169 Distillation 92 % off 708.1 °C ASTM D7169D7169 Distillation 93 % off 719.4 °C ASTM D7169D7169 Distillation Residue @ 720°C 6.95 mass% ASTM D7169 0.01
Viscosity Analysis
Viscosity @ 20°C 142.5 cSt ASTM D7042 0.01000Viscosity @ 30°C 79.26 cSt ASTM D7042 0.01000Viscosity @ 40°C 47.16 cSt ASTM D7042 0.01000
** In fo r m at io n n o t s u p p l ied b y c l ien t -- d a ta d er iv ed f r o m L S D in fo r m at io n R es u l t s r e la te o n ly to i t em s tes ted
Remarks:
Unable to perform Naphthenic Acid due to sample matrix.
E D M O N TO N 6744-50 S t r ee t , E d m o n to n , C an ad a T6B 3M 9 Te l : (780) 378-8500 Fax (780) 378-86992013/05 /06 13 :52Page 16 of 19

CERTIFICATE OF ANALYSIS
MaxxID Client ID Meter Number
B311691:GB6705Laboratory Number
KINDER MORGAN CANADAOperator Name LSD Well ID
TRANSMOUNTAIN TERMINALWell Name
AL/PKInitials of Sampler
MAXXAM ANALYTICSSampling Company
Field or Area Pool or Zone
AWBSample Point
BLACK CANContainer Identity Percent Full
Test Recovery Sample Gathering Point Solution Gas
Test Type No. Multiple Recovery
I n t e r v a lFrom:
To:
Elevations (m)
KB GRDWell Fluid Status Well Status Mode
Well Status Type Well Type
Gas or Condensate Project Licence No.
Production Rates
Water m3/d Oil m3/d Gas 1000m3/d
Gauge Pressures kPa
Source As Received
Temperature °C
Source
23.0As Received
2013/02/11Date Sampled Start Date Sampled End
2013/04/03Date Received
2013/04/25Date Reported
2013/05/06Date Reissued
MM1Analyst
PARAMETER DESCRIPTION Result unit Method MDL
Industrial
Attachment SEE BELOW N/A
** In fo r m at io n n o t s u p p l ied b y c l ien t -- d a ta d er iv ed f r o m L S D in fo r m at io n R es u l t s r e la te o n ly to i t em s tes ted
Remarks:
See Attached Extended Condensate Analysis.
E D M O N TO N 6744-50 S t r ee t , E d m o n to n , C an ad a T6B 3M 9 Te l : (780) 378-8500 Fax (780) 378-86992013/05 /06 13 :52Page 17 of 19

CERTIFICATE OF ANALYSIS
MaxxID Client ID Meter Number
B311691:GB6706Laboratory Number
KINDER MORGAN CANADAOperator Name LSD Well ID
TRANSMOUNTAIN TERMINALWell Name
AL/PKInitials of Sampler
MAXXAM ANALYTICSSampling Company
Field or Area Pool or Zone
CLSample Point
BLACK CANContainer Identity Percent Full
Test Recovery Sample Gathering Point Solution Gas
Test Type No. Multiple Recovery
I n t e r v a lFrom:
To:
Elevations (m)
KB GRDWell Fluid Status Well Status Mode
Well Status Type Well Type
Gas or Condensate Project Licence No.
Production Rates
Water m3/d Oil m3/d Gas 1000m3/d
Gauge Pressures kPa
Source As Received
Temperature °C
Source
23.0As Received
2013/02/14Date Sampled Start Date Sampled End
2013/04/03Date Received
2013/04/25Date Reported
2013/05/06Date Reissued
MM1Analyst
PARAMETER DESCRIPTION Result unit Method MDL
Industrial
Attachment SEE BELOW N/A
** In fo r m at io n n o t s u p p l ied b y c l ien t -- d a ta d er iv ed f r o m L S D in fo r m at io n R es u l t s r e la te o n ly to i t em s tes ted
Remarks:
See Attached Extended Condensate Analysis.
E D M O N TO N 6744-50 S t r ee t , E d m o n to n , C an ad a T6B 3M 9 Te l : (780) 378-8500 Fax (780) 378-86992013/05 /06 13 :52Page 18 of 19

CERTIFICATE OF ANALYSIS
MaxxID Client ID Meter Number
B311691:GB6707Laboratory Number
KINDER MORGAN CANADAOperator Name LSD Well ID
KINDER MORGAN EDMONTON TERMINALWell Name
N/AInitials of Sampler
KINDER MORGANSampling Company
EDMONTONField or Area Pool or Zone
AHSSample Point
RED CANContainer Identity Percent Full
Test Recovery Sample Gathering Point Solution Gas
Test Type No. Multiple Recovery
I n t e r v a lFrom:
To:
Elevations (m)
KB GRDWell Fluid Status Well Status Mode
Well Status Type Well Type
Gas or Condensate Project Licence No.
Production Rates
Water m3/d Oil m3/d Gas 1000m3/d
Gauge Pressures kPa
Source As Received
Temperature °C
Source
23.0As Received
2013/03/31Date Sampled Start Date Sampled End
2013/04/03Date Received
2013/04/25Date Reported
2013/05/06Date Reissued
MM1Analyst
PARAMETER DESCRIPTION Result unit Method MDL
Industrial
Attachment SEE BELOW N/A
** In fo r m at io n n o t s u p p l ied b y c l ien t -- d a ta d er iv ed f r o m L S D in fo r m at io n R es u l t s r e la te o n ly to i t em s tes ted
Remarks:
See Attached Extended Condensate Analysis.
E D M O N TO N 6744-50 S t r ee t , E d m o n to n , C an ad a T6B 3M 9 Te l : (780) 378-8500 Fax (780) 378-86992013/05 /06 13 :52Page 19 of 19


Your P.O. #: 806743-0-KMCAPO # 806743-0-KMCA
Attention: TAMMY SAUERKINDER MORGAN CANADABOX 3198SHERWOOD PARK, ABCANADA T8A 2A6
Report Date: 2013/05/31This report supersedes all previous reports with the same Maxxam job number
CERTIFICATE OF ANALYSIS
MAXXAM JOB #: B327917Received: 2013/04/10, 08:00
Sample Matrix: Soil# Samples Received: 3
Date DateAnalyses Quantity Extracted Analyzed Laboratory Method Analytical MethodAromatic Fraction >C8-C10 in Soil ( 1 ) 3 2013/04/10 2013/05/31 CAL SOP-00256 CCME, RBCATotal Cresols Calculation ( 1 ) 3 N/A 2013/04/17 CAL SOP-00164 EPA 8270DCCME Hydrocarbons (F2-F4 in soil) ( 1 ) 3 2013/04/15 2013/04/20 AB SOP-00040 CCME PHC-CWS
AB SOP-00036Aliphatic Fractions C6-C10 in Soil ( 1 ) 3 2013/04/10 2013/05/31 CAL SOP-00256 CCME, RBCABTEX/F1/Fractionation of C6-C10 in Soil ( 1 ) 3 2013/05/30 2013/05/31 CAL SOP-00256 CCME, RBCAAliphatic & Aromatic Fractions >C10-C50 ( 1 ) 3 2013/04/15 2013/04/20 CAL SOP-00184 CCME, RBCAAlkylated PAH in soil by GC/MS ( 1,2 ) 3 2013/04/11 2013/05/10 AB SOP-00003 EPA 3540C/8270D
CAL SOP-00250Benzo[a]pyrene Equivalency ( 1 ) 3 N/A 2013/04/17 AB SOP-00003 EPA 8270DPAH in Soil by GC/MS ( 1 ) 3 2013/04/11 2013/04/12 AB SOP-00003 EPA 3540C/8270D
AB SOP-00036Phenols (semivolatile) ( 1 ) 3 2013/04/11 2013/04/16 CAL SOP-00164 EPA 3510C, EPA 8270DVOCs in Soil by HS GC/MS (Std List) ( 1 ) 3 2013/04/11 2013/04/11 AB SOP-00056 EPA 5021A/8260C
* RPDs calculated using raw data. The rounding of final results may result in the apparent difference.
(1) This test was performed by Maxxam Calgary Environmental(2) Alkylated PAH results are semiquantitative
Encryption Key
Please direct all questions regarding this Certificate of Analysis to your Project Manager.
Kristopher Beaudet, B.Sc., P.Chem, Scientific SpecialistEmail: [email protected]# (780) 577-7100
====================================================================
Page 1 of 18

Your P.O. #: 806743-0-KMCAPO # 806743-0-KMCA
Attention: TAMMY SAUERKINDER MORGAN CANADABOX 3198SHERWOOD PARK, ABCANADA T8A 2A6
Report Date: 2013/05/31This report supersedes all previous reports with the same Maxxam job number
CERTIFICATE OF ANALYSIS-2-
Maxxam has procedures in place to guard against improper use of the electronic signature and have the required "signatories", as per section5.10.2 of ISO/IEC 17025:2005(E), signing the reports. For Service Group specific validation please refer to the Validation Signature Page.
Total cover pages: 2
Maxxam Analytics International Corporation o/a Maxxam Analytics Edmonton: 9331 - 48th Street T6B 2R4 Telephone(780)577-7100 Fax(780)450-4187
Page 2 of 18

KINDER MORGAN CANADAMaxxam Job #: B327917Report Date: 2013/05/31
Your P.O. #: 806743-0-KMCA
PETROLEUM HYDROCARBONS (CCME)
Maxxam ID G C 7 5 8 4 G C 7 5 8 5 G C 7 5 8 6Sampling Date
U N I T S GB5489 GB5490 GB5491 RDL QC Batch
Ext. Pet. Hydrocarbon
F2 (C10-C16 Hydrocarbons) mg/kg 50000 82000 36000 250 6738100
F3 (C16-C34 Hydrocarbons) mg/kg 210000 260000 240000 1300 6738100
F4 (C34-C50 Hydrocarbons) mg/kg 99000 110000 220000 1300 6738100
Reached Baseline at C50 mg/kg No No No N/A 6738100
Hydrocarbons
>C10 - C12 Aliphatic mg/kg 8100 16000 8600 130 6738108
>C10 - C12 Aromatic mg/kg 2200 4100 3500 130 6738108
>C12 - C16 Aliphatic mg/kg 24000 40000 15000 250 6738108
>C12 - C16 Aromatic mg/kg 9100 22000 7200 250 6738108
>C16 - C21 Aliphatic mg/kg 31000 46000 19000 250 6738108
>C16 - C21 Aromatic mg/kg 33000 47000 22000 250 6738108
>C21 - C34 Aliphatic mg/kg 48000 60000 70000 250 6738108
>C21 - C34 Aromatic mg/kg 100000 120000 170000 250 6738108
>C34 Aliphatic (up to C50) mg/kg 18000 23000 45000 250 6738108
>C34 Aromatic (up to C50) mg/kg 65000 77000 170000 250 6738108
Surrogate Recovery (%)
DECANE (sur) % 96 98 113 N/A 6738108
N/A = Not ApplicableRDL = Reportable Detection Limit
Page 3 of 18

KINDER MORGAN CANADAMaxxam Job #: B327917Report Date: 2013/05/31
Your P.O. #: 806743-0-KMCA
SEMIVOLATILE ORGANICS BY GC-MS (SOIL)
Maxxam ID G C 7 5 8 4 G C 7 5 8 5 G C 7 5 8 6Sampling Date
U N I T S GB5489 RDL GB5490 RDL GB5491 RDL QC Batch
Polycyclic Aromatics
Acenaphthene mg/kg <4.2 4.2 12 4.5 <5.4 5.4 6728236
Benzo[a]pyrene equivalency mg/kg 7.52 0.10 9.49 0.10 54.0 0.10 6726337
Acenaphthylene mg/kg <4.2 4.2 <4.5 4.5 <5.4 5.4 6728236
Acridine mg/kg 15 8.3 39 8.9 13 11 6728236
Anthracene mg/kg <3.3 3.3 6.6 3.6 <4.3 4.3 6728236
Benzo(a)anthracene mg/kg <4.2 4.2 5.6 ( 1 ) 5.6 22 5.4 6728236
Benzo(b&j)fluoranthene mg/kg 5.3 4.2 6.7 4.5 18 5.4 6728236
Benzo(k)fluoranthene mg/kg <4.2 4.2 <4.5 4.5 <5.4 5.4 6728236
Benzo(g,h,i)perylene mg/kg <4.2 4.2 4.8 ( 1 ) 4.8 81 5.4 6728236
Benzo(c)phenanthrene mg/kg <4.2 4.2 <4.5 4.5 <5.4 5.4 6728236
Benzo(a)pyrene mg/kg 4.2 4.2 5.8 4.5 33 5.4 6728236
Benzo[e]pyrene mg/kg 5.6 4.2 5.1 4.5 49 5.4 6728236
Chrysene mg/kg <4.2 4.2 8.6 4.5 24 5.4 6728236
Dibenz(a,h)anthracene mg/kg <4.2 4.2 <4.5 4.5 14 5.4 6728236
Fluoranthene mg/kg 4.6 4.2 7.3 4.5 11 5.4 6728236
Fluorene mg/kg 7.2 4.2 21 4.5 6.1 5.4 6728236
Indeno(1,2,3-cd)pyrene mg/kg <4.2 4.2 <4.5 4.5 16 5.4 6728236
2-Methylnaphthalene mg/kg 72 4.2 80 4.5 25 5.4 6728236
Naphthalene mg/kg 33 4.2 34 4.5 14 5.4 6728236
Phenanthrene mg/kg 18 4.2 63 4.5 31 5.4 6728236
Perylene mg/kg 12 4.2 9.0 4.5 22 5.4 6728236
Pyrene mg/kg 9.7 4.2 <13 ( 1 ) 13 98 5.4 6728236
C3-fluorene mg/kg 610 4.2 770 4.5 300 5.4 6803862
Quinoline mg/kg <8.3 8.3 <8.9 8.9 <11 11 6728236
Retene mg/kg 27 4.2 43 4.5 15 5.4 6803862
C1-Naphthalene mg/kg 250 4.2 160 4.5 46 5.4 6803862
C2-Naphthalene mg/kg 460 4.2 600 4.5 140 5.4 6803862
C3-Naphthalene mg/kg 310 4.2 780 4.5 180 5.4 6803862
C4-Naphthalene mg/kg 410 4.2 810 4.5 210 5.4 6803862
Biphenyl mg/kg 13 4.2 7.3 4.5 <5.4 5.4 6803862
C1-biphenyl mg/kg 84 4.2 50 4.5 13 5.4 6803862
C2-biphenyl mg/kg 83 4.2 84 4.5 19 5.4 6803862
RDL = Reportable Detection Limit( 1 ) Detection limits raised due to matrix interference.
Page 4 of 18

KINDER MORGAN CANADAMaxxam Job #: B327917Report Date: 2013/05/31
Your P.O. #: 806743-0-KMCA
SEMIVOLATILE ORGANICS BY GC-MS (SOIL)
Maxxam ID G C 7 5 8 4 G C 7 5 8 5 G C 7 5 8 6Sampling Date
U N I T S GB5489 RDL GB5490 RDL GB5491 RDL QC Batch
C1-fluorene mg/kg 76 4.2 150 4.5 42 5.4 6803862
C2-fluorene mg/kg 210 4.2 300 4.5 100 5.4 6803862
Dibenzothiophene mg/kg 15 4.2 44 4.5 11 5.4 6803862
C1-dibenzothiophene mg/kg 130 4.2 330 4.5 110 5.4 6803862
C2-dibenzothiophene mg/kg 300 4.2 910 4.5 390 5.4 6803862
C3-dibenzothiophene mg/kg 450 4.2 700 4.5 340 5.4 6803862
C4-dibenzothiophene mg/kg 600 4.2 440 4.5 280 5.4 6803862
C1 phenanthrene/anthracene mg/kg 160 4.2 310 4.5 170 5.4 6803862
C2 phenanthrene/anthracene mg/kg 410 4.2 550 4.5 310 5.4 6803862
C3 phenanthrene/anthracene mg/kg 790 4.2 660 4.5 340 5.4 6803862
C4 phenanthrene/anthracene mg/kg 420 4.2 230 4.5 250 5.4 6803862
C1 fluoranthene/pyrene mg/kg 100 4.2 75 4.5 250 5.4 6803862
C2 fluoranthene/pyrene mg/kg 320 4.2 200 4.5 400 5.4 6803862
C3 fluoranthene/pyrene mg/kg 740 4.2 340 4.5 760 5.4 6803862
C4 fluoranthene/pyrene mg/kg 530 4.2 170 4.5 870 5.4 6803862
C1 benzo(a)anthracene/chrysene mg/kg 110 4.2 59 4.5 350 5.4 6803862
C2 benzo(a)anthracene/chrysene mg/kg 460 4.2 230 4.5 860 5.4 6803862
C3 benzo(a)anthracene/chrysene mg/kg 260 4.2 110 4.5 450 5.4 6803862
C4 benzo(a)anthracene/chrysene mg/kg 66 4.2 37 4.5 210 5.4 6803862
C1benzobjkfluoranthene/benzoapyrene mg/kg 72 4.2 21 4.5 310 5.4 6803862
C2benzobjkfluoranthene/benzoapyrene mg/kg 64 4.2 37 4.5 260 5.4 6803862
C1-Acenaphthene mg/kg <4.2 4.2 <4.5 4.5 <5.4 5.4 6803862
Phenols
Cresols mg/kg <11 11 <16 16 <6.9 6.9 6727549
Phenol mg/kg <12 ( 1 ) 12 <8.1 ( 1 ) 8.1 <3.2 ( 1 ) 3.2 6730070
3 & 4-chlorophenol mg/kg <12 ( 1 ) 12 <21 ( 1 ) 21 <11 ( 1 ) 11 6730070
2,3,5,6-tetrachlorophenol mg/kg <5.0 5.0 <4.3 4.3 <4.6 4.6 6730070
2,3,4,6-tetrachlorophenol mg/kg <5.0 5.0 <4.3 4.3 <4.6 4.6 6730070
2,4,5-trichlorophenol mg/kg <5.0 5.0 <4.3 4.3 <4.6 4.6 6730070
2,4,6-trichlorophenol mg/kg <5.0 5.0 <4.3 4.3 <4.6 4.6 6730070
2,3,5-trichlorophenol mg/kg <5.0 5.0 <4.3 4.3 <4.6 4.6 6730070
2,3,4-trichlorophenol mg/kg <5.0 5.0 <4.3 4.3 <4.6 4.6 6730070
2,4-dichlorophenol mg/kg <3.1 ( 1 ) 3.1 <6.3 ( 1 ) 6.3 <3.1 ( 1 ) 3.1 6730070
RDL = Reportable Detection Limit( 1 ) Detection limits raised due to matrix interference.
Page 5 of 18

KINDER MORGAN CANADAMaxxam Job #: B327917Report Date: 2013/05/31
Your P.O. #: 806743-0-KMCA
SEMIVOLATILE ORGANICS BY GC-MS (SOIL)
Maxxam ID G C 7 5 8 4 G C 7 5 8 5 G C 7 5 8 6Sampling Date
U N I T S GB5489 RDL GB5490 RDL GB5491 RDL QC Batch
2,4-dimethylphenol mg/kg <23 ( 1 ) 23 29 4.3 <13 ( 1 ) 13 6730070
2,4-dinitrophenol mg/kg <50 50 <43 43 <46 46 6730070
2,6-dichlorophenol mg/kg <5.0 5.0 <8.5 ( 1 ) 8.5 <4.6 4.6 6730070
2-chlorophenol mg/kg <5.0 5.0 <4.3 4.3 <4.6 4.6 6730070
2-methylphenol mg/kg <5.0 5.0 <8.7 ( 1 ) 8.7 <4.6 4.6 6730070
2-nitrophenol mg/kg <50 50 <43 43 <46 46 6730070
3 & 4-methylphenol mg/kg <11 ( 1 ) 11 16 ( 1 ) 16 <6.9 ( 1 ) 6.9 6730070
4,6-dinitro-2-methylphenol mg/kg <50 50 <43 43 <46 46 6730070
4-chloro-3-methylphenol mg/kg <5.0 5.0 <4.3 4.3 <4.6 4.6 6730070
4-nitrophenol mg/kg <50 50 <43 43 <46 46 6730070
Pentachlorophenol mg/kg <5.0 5.0 <4.3 4.3 <4.6 4.6 6730070
RDL = Reportable Detection Limit( 1 ) Detection limits raised due to matrix interference.
Page 6 of 18

KINDER MORGAN CANADAMaxxam Job #: B327917Report Date: 2013/05/31
Your P.O. #: 806743-0-KMCA
VOLATILE ORGANICS BY GC-MS (SOIL)
Maxxam ID G C 7 5 8 4 G C 7 5 8 5 G C 7 5 8 6Sampling Date
U N I T S GB5489 GB5490 GB5491 RDL QC Batch
Volatiles
(C6-C10) mg/kg 200000 120000 160000 6000 6859127
Calculated >C8-C10 Aromatics (-EX) mg/kg <6000 <6000 <6000 6000 6859501
Calculated Aliphatic >C8-C10 mg/kg 26000 20000 41000 6000 6858571
Calculated Aliphatic C6-C8 mg/kg 74000 55000 77000 6000 6858571
Benzene mg/kg 2200 1800 940 2.5 6859127
Bromodichloromethane mg/kg <150 <150 <150 150 6729879
Toluene mg/kg 4400 3900 2400 10 6859127
Bromoform mg/kg <250 <250 <250 250 6729879
Ethylbenzene mg/kg 430 470 670 5.0 6859127
Bromomethane mg/kg <100 <100 <100 100 6729879
Xylenes (Total) mg/kg 3500 3500 2600 20 6859127
Carbon tetrachloride mg/kg <100 <100 <100 100 6729879
m & p-Xylene mg/kg 2800 2800 1900 20 6859127
Chlorobenzene mg/kg <100 <100 <100 100 6729879
o-Xylene mg/kg 710 790 720 10 6859127
Chlorodibromomethane mg/kg <100 <100 <100 100 6729879
C6-C8 mg/kg 81000 61000 81000 6000 6859127
Chloroethane mg/kg <100 <100 <100 100 6729879
>C8-C10 mg/kg 26000 20000 41000 6000 6859127
Chloroform mg/kg <100 <100 <100 100 6729879
Aromatic >C8-C10 mg/kg <6000 <6000 <6000 6000 6859127
Chloromethane mg/kg <150 <150 <150 150 6729879
1,2-dibromoethane mg/kg <100 <100 <100 100 6729879
F1 (C6-C10) - BTEX mg/kg 190000 110000 160000 6000 6859127
1,2-dichlorobenzene mg/kg <100 <100 <100 100 6729879
1,3-dichlorobenzene mg/kg <100 <100 <100 100 6729879
1,4-dichlorobenzene mg/kg <100 <100 <100 100 6729879
1,1-dichloroethane mg/kg <100 <100 <100 100 6729879
1,2-dichloroethane mg/kg <100 <100 <100 100 6729879
1,1-dichloroethene mg/kg <100 <100 <100 100 6729879
cis-1,2-dichloroethene mg/kg <100 <100 <100 100 6729879
trans-1,2-dichloroethene mg/kg <100 <100 <100 100 6729879
Dichloromethane mg/kg <150 <150 <150 150 6729879
RDL = Reportable Detection Limit
Page 7 of 18

KINDER MORGAN CANADAMaxxam Job #: B327917Report Date: 2013/05/31
Your P.O. #: 806743-0-KMCA
VOLATILE ORGANICS BY GC-MS (SOIL)
Maxxam ID G C 7 5 8 4 G C 7 5 8 5 G C 7 5 8 6Sampling Date
U N I T S GB5489 GB5490 GB5491 RDL QC Batch
1,2-dichloropropane mg/kg <100 <100 <100 100 6729879
cis-1,3-dichloropropene mg/kg <100 <100 <100 100 6729879
trans-1,3-dichloropropene mg/kg <100 <100 <100 100 6729879
Methyl methacrylate mg/kg <200 <200 <200 200 6729879
Methyl-tert-butylether (MTBE) mg/kg <150 <150 <150 150 6729879
Styrene mg/kg <100 <100 <100 100 6729879
1,1,1,2-tetrachloroethane mg/kg <500 <500 <500 500 6729879
1,1,2,2-tetrachloroethane mg/kg <250 <250 <250 250 6729879
Tetrachloroethene mg/kg <100 <100 <100 100 6729879
1,2,3-trichlorobenzene mg/kg <200 <200 <200 200 6729879
1,2,4-trichlorobenzene mg/kg <200 <200 <200 200 6729879
1,3,5-trichlorobenzene mg/kg <200 <200 <200 200 6729879
1,1,1-trichloroethane mg/kg <100 <100 <100 100 6729879
1,1,2-trichloroethane mg/kg <100 <100 <100 100 6729879
Trichloroethene mg/kg <50 <50 <50 50 6729879
Trichlorofluoromethane mg/kg <100 <100 <100 100 6729879
1,2,4-trimethylbenzene mg/kg <2500 <2500 <2500 2500 6729879
1,3,5-trimethylbenzene mg/kg <2500 <2500 <2500 2500 6729879
Vinyl chloride mg/kg <50 <50 <50 50 6729879
Surrogate Recovery (%)
1,4-Difluorobenzene (sur.) % 97 97 95 N/A 6859127
4-BROMOFLUOROBENZENE (sur.) % 107 106 106 N/A 6859127
D4-1,2-DICHLOROETHANE (sur.) % 98 97 87 N/A 6859127
1,4-Difluorobenzene (sur.) % 103 103 103 N/A 6729879
4-BROMOFLUOROBENZENE (sur.) % 94 93 94 N/A 6729879
D4-1,2-DICHLOROETHANE (sur.) % 87 85 87 N/A 6729879
N/A = Not ApplicableRDL = Reportable Detection Limit
Page 8 of 18

KINDER MORGAN CANADAMaxxam Job #: B327917Report Date: 2013/05/31
Your P.O. #: 806743-0-KMCA
General Comments
Due to the sample matrix ,sample required dilution ,detection limit was adjusted accordingly.
SEMIVOLATILE ORGANICS BY GC-MS (SOIL) Comments
Sample GC7584-02 PAH in Soil by GC/MS: Due to the sample matrix, sample required dilution. Detection limit was adjusted accordingly. Samplediluted not extracted therefore no surrogate was added.
Sample GC7585-02 PAH in Soil by GC/MS: Due to the sample matrix, sample required dilution. Detection limit was adjusted accordingly. Samplediluted not extracted therefore no surrogate was added.
Sample GC7586-02 PAH in Soil by GC/MS: Due to the sample matrix, sample required dilution. Detection limit was adjusted accordingly. Samplediluted not extracted therefore no surrogate was added.
Sample GC7584-02 Alkylated PAH in soil by GC/MS: Due to the matrix, sample was diluted and not extracted, therefore no surrogate wasadded. Detection limit was adjusted accordingly.
Sample GC7585-02 Alkylated PAH in soil by GC/MS: Due to the matrix, sample was diluted and not extracted, therefore no surrogate wasadded. Detection limit was adjusted accordingly.
Sample GC7586-02 Alkylated PAH in soil by GC/MS: Due to the matrix, sample was diluted and not extracted, therefore no surrogate wasadded. Detection limit was adjusted accordingly.
Sample GC7584-01 Phenols (semivolatile): Due to the sample matrix sample was diluted not extracted, therefore no surrogate was added.Detection limit was adjusted accordingly.
Sample GC7585-01 Phenols (semivolatile): Due to the sample matrix sample was diluted not extracted, therefore no surrogate was added.Detection limit was adjusted accordingly.
Sample GC7586-01 Phenols (semivolatile): Due to the sample matrix sample was diluted not extracted, therefore no surrogate was added.Detection limit was adjusted accordingly.
VOLATILE ORGANICS BY GC-MS (SOIL) Comments
Sample GC7584-03 BTEX/F1/Fractionation of C6-C10 in Soil: Due to sample matrix, sample required dilution, detection limit was adjustedaccordingly
Sample GC7585-03 BTEX/F1/Fractionation of C6-C10 in Soil: Due to sample matrix, sample required dilution, detection limit was adjustedaccordingly
Sample GC7586-03 BTEX/F1/Fractionation of C6-C10 in Soil: Due to sample matrix, sample required dilution, detection limit was adjustedaccordingly
Sample GC7584-03 VOCs in Soil by HS GC/MS (Std List): Due to sample matrix, sample required dilution, detection limit was adjustedaccordingly.
Sample GC7585-03 VOCs in Soil by HS GC/MS (Std List): Due to sample matrix, sample required dilution, detection limit was adjustedaccordingly.
Sample GC7586-03 VOCs in Soil by HS GC/MS (Std List): Due to sample matrix, sample required dilution, detection limit was adjustedaccordingly.
Results relate only to the items tested.
Page 9 of 18

KINDER MORGAN CANADAAttention: TAMMY SAUERClient Project #:P.O. #: 806743-0-KMCASite Location:
Quality Assurance ReportMaxxam Job Number: EB327917
QA/QC DateBatch AnalyzedNum Init QC Type Parameter yyyy/mm/dd Value Recovery UNITS QC Limits
6728236 PM4 Matrix Spike Acenaphthene 2013/04/11 84 % 50 - 130Acenaphthylene 2013/04/11 84 % 50 - 130Acridine 2013/04/11 73 % 50 - 130Anthracene 2013/04/11 78 % 50 - 130Benzo(a)anthracene 2013/04/11 97 % 50 - 130Benzo(b&j)fluoranthene 2013/04/11 101 % 50 - 130Benzo(k)fluoranthene 2013/04/11 87 % 50 - 130Benzo(g,h,i)perylene 2013/04/11 82 % 50 - 130Benzo(c)phenanthrene 2013/04/11 94 % 50 - 130Benzo(a)pyrene 2013/04/11 96 % 50 - 130Benzo[e]pyrene 2013/04/11 96 % 50 - 130Chrysene 2013/04/11 93 % 50 - 130Dibenz(a,h)anthracene 2013/04/11 82 % 50 - 130Fluoranthene 2013/04/11 92 % 50 - 130Fluorene 2013/04/11 85 % 50 - 130Indeno(1,2,3-cd)pyrene 2013/04/11 82 % 50 - 1302-Methylnaphthalene 2013/04/11 89 % 50 - 130Naphthalene 2013/04/11 82 % 50 - 130Phenanthrene 2013/04/11 85 % 50 - 130Perylene 2013/04/11 79 % 50 - 130Pyrene 2013/04/11 92 % 50 - 130Quinoline 2013/04/11 112 % 50 - 130
Spiked Blank Acenaphthene 2013/04/11 79 % 50 - 130Acenaphthylene 2013/04/11 74 % 50 - 130Acridine 2013/04/11 59 % 50 - 130Anthracene 2013/04/11 68 % 50 - 130Benzo(a)anthracene 2013/04/11 79 % 50 - 130Benzo(b&j)fluoranthene 2013/04/11 88 % 50 - 130Benzo(k)fluoranthene 2013/04/11 88 % 50 - 130Benzo(g,h,i)perylene 2013/04/11 77 % 50 - 130Benzo(c)phenanthrene 2013/04/11 82 % 50 - 130Benzo(a)pyrene 2013/04/11 79 % 50 - 130Benzo[e]pyrene 2013/04/11 86 % 50 - 130Chrysene 2013/04/11 85 % 50 - 130Dibenz(a,h)anthracene 2013/04/11 77 % 50 - 130Fluoranthene 2013/04/11 83 % 50 - 130Fluorene 2013/04/11 79 % 50 - 130Indeno(1,2,3-cd)pyrene 2013/04/11 74 % 50 - 1302-Methylnaphthalene 2013/04/11 82 % 50 - 130Naphthalene 2013/04/11 76 % 50 - 130Phenanthrene 2013/04/11 79 % 50 - 130Perylene 2013/04/11 74 % 50 - 130Pyrene 2013/04/11 81 % 50 - 130Quinoline 2013/04/11 111 % 50 - 130
Method Blank Acenaphthene 2013/04/11 <0.0050 mg/kgAcenaphthylene 2013/04/11 <0.0050 mg/kgAcridine 2013/04/11 <0.010 mg/kgAnthracene 2013/04/11 <0.0040 mg/kgBenzo(a)anthracene 2013/04/11 <0.0050 mg/kgBenzo(b&j)fluoranthene 2013/04/11 <0.0050 mg/kgBenzo(k)fluoranthene 2013/04/11 <0.0050 mg/kgBenzo(g,h,i)perylene 2013/04/11 <0.0050 mg/kgBenzo(c)phenanthrene 2013/04/11 <0.0050 mg/kgBenzo(a)pyrene 2013/04/11 <0.0050 mg/kgBenzo[e]pyrene 2013/04/11 <0.0050 mg/kg
Maxxam Analytics International Corporation o/a Maxxam Analytics Edmonton: 9331 - 48th Street T6B 2R4 Telephone(780)577-7100 Fax(780)450-4187
Page 10 of 18

KINDER MORGAN CANADAAttention: TAMMY SAUERClient Project #:P.O. #: 806743-0-KMCASite Location:
Quality Assurance Report (Continued)Maxxam Job Number: EB327917
QA/QC DateBatch AnalyzedNum Init QC Type Parameter yyyy/mm/dd Value Recovery UNITS QC Limits
6728236 PM4 Method Blank Chrysene 2013/04/11 <0.0050 mg/kgDibenz(a,h)anthracene 2013/04/11 <0.0050 mg/kgFluoranthene 2013/04/11 <0.0050 mg/kgFluorene 2013/04/11 <0.0050 mg/kgIndeno(1,2,3-cd)pyrene 2013/04/11 <0.0050 mg/kg2-Methylnaphthalene 2013/04/11 <0.0050 mg/kgNaphthalene 2013/04/11 <0.0050 mg/kgPhenanthrene 2013/04/11 <0.0050 mg/kgPerylene 2013/04/11 <0.0050 mg/kgPyrene 2013/04/11 <0.0050 mg/kgQuinoline 2013/04/11 <0.010 mg/kg
RPD Acenaphthene 2013/04/11 NC % 50Acenaphthylene 2013/04/11 NC % 50Acridine 2013/04/11 NC % 50Anthracene 2013/04/11 NC % 50Benzo(a)anthracene 2013/04/11 NC % 50Benzo(b&j)fluoranthene 2013/04/11 NC % 50Benzo(k)fluoranthene 2013/04/11 NC % 50Benzo(g,h,i)perylene 2013/04/11 NC % 50Benzo(c)phenanthrene 2013/04/11 NC % 50Benzo(a)pyrene 2013/04/11 NC % 50Benzo[e]pyrene 2013/04/11 NC % 50Chrysene 2013/04/11 NC % 50Dibenz(a,h)anthracene 2013/04/11 NC % 50Fluoranthene 2013/04/11 NC % 50Fluorene 2013/04/11 NC % 50Indeno(1,2,3-cd)pyrene 2013/04/11 NC % 502-Methylnaphthalene 2013/04/11 NC % 50Naphthalene 2013/04/11 NC % 50Phenanthrene 2013/04/11 NC % 50Perylene 2013/04/11 NC % 50Pyrene 2013/04/11 NC % 50Quinoline 2013/04/11 NC % 50
6729879 PK1 Matrix Spike 1,4-Difluorobenzene (sur.) 2013/04/11 104 % 60 - 1404-BROMOFLUOROBENZENE (sur.) 2013/04/11 98 % 60 - 140D4-1,2-DICHLOROETHANE (sur.) 2013/04/11 91 % 60 - 140Bromodichloromethane 2013/04/11 97 % 60 - 140Bromoform 2013/04/11 122 % 60 - 140Bromomethane 2013/04/11 93 % 60 - 140Carbon tetrachloride 2013/04/11 120 % 60 - 140Chlorobenzene 2013/04/11 104 % 60 - 140Chlorodibromomethane 2013/04/11 122 % 60 - 140Chloroethane 2013/04/11 78 % 60 - 140Chloroform 2013/04/11 96 % 60 - 140Chloromethane 2013/04/11 55 ( 1 ) % 60 - 1401,2-dibromoethane 2013/04/11 97 % 60 - 1401,2-dichlorobenzene 2013/04/11 97 % 60 - 1401,3-dichlorobenzene 2013/04/11 96 % 60 - 1401,4-dichlorobenzene 2013/04/11 97 % 60 - 1401,1-dichloroethane 2013/04/11 89 % 60 - 1401,2-dichloroethane 2013/04/11 86 % 60 - 1401,1-dichloroethene 2013/04/11 97 % 60 - 140cis-1,2-dichloroethene 2013/04/11 89 % 60 - 140trans-1,2-dichloroethene 2013/04/11 95 % 60 - 140Dichloromethane 2013/04/11 98 % 60 - 140
Maxxam Analytics International Corporation o/a Maxxam Analytics Edmonton: 9331 - 48th Street T6B 2R4 Telephone(780)577-7100 Fax(780)450-4187
Page 11 of 18

KINDER MORGAN CANADAAttention: TAMMY SAUERClient Project #:P.O. #: 806743-0-KMCASite Location:
Quality Assurance Report (Continued)Maxxam Job Number: EB327917
QA/QC DateBatch AnalyzedNum Init QC Type Parameter yyyy/mm/dd Value Recovery UNITS QC Limits
6729879 PK1 Matrix Spike 1,2-dichloropropane 2013/04/11 87 % 60 - 140cis-1,3-dichloropropene 2013/04/11 87 % 60 - 140trans-1,3-dichloropropene 2013/04/11 83 % 60 - 140Methyl methacrylate 2013/04/11 101 % 60 - 140Methyl-tert-butylether (MTBE) 2013/04/11 87 % 60 - 140Styrene 2013/04/11 106 % 60 - 1401,1,1,2-tetrachloroethane 2013/04/11 119 % 60 - 1401,1,2,2-tetrachloroethane 2013/04/11 90 % 60 - 140Tetrachloroethene 2013/04/11 117 % 60 - 1401,2,3-trichlorobenzene 2013/04/11 99 % 60 - 1401,2,4-trichlorobenzene 2013/04/11 106 % 60 - 1401,3,5-trichlorobenzene 2013/04/11 103 % 60 - 1401,1,1-trichloroethane 2013/04/11 104 % 60 - 1401,1,2-trichloroethane 2013/04/11 90 % 60 - 140Trichloroethene 2013/04/11 99 % 60 - 140Trichlorofluoromethane 2013/04/11 94 % 60 - 1401,2,4-trimethylbenzene 2013/04/11 102 % 60 - 1401,3,5-trimethylbenzene 2013/04/11 105 % 60 - 140Vinyl chloride 2013/04/11 67 % 60 - 140
Spiked Blank 1,4-Difluorobenzene (sur.) 2013/04/11 103 % 60 - 1404-BROMOFLUOROBENZENE (sur.) 2013/04/11 97 % 60 - 140D4-1,2-DICHLOROETHANE (sur.) 2013/04/11 94 % 60 - 140Bromodichloromethane 2013/04/11 100 % 60 - 140Bromoform 2013/04/11 132 % 60 - 140Bromomethane 2013/04/11 103 % 60 - 140Carbon tetrachloride 2013/04/11 116 % 60 - 140Chlorobenzene 2013/04/11 107 % 60 - 140Chlorodibromomethane 2013/04/11 121 % 60 - 140Chloroethane 2013/04/11 82 % 60 - 140Chloroform 2013/04/11 96 % 60 - 140Chloromethane 2013/04/11 60 % 60 - 1401,2-dibromoethane 2013/04/11 103 % 60 - 1401,2-dichlorobenzene 2013/04/11 101 % 60 - 1401,3-dichlorobenzene 2013/04/11 104 % 60 - 1401,4-dichlorobenzene 2013/04/11 99 % 60 - 1401,1-dichloroethane 2013/04/11 90 % 60 - 1401,2-dichloroethane 2013/04/11 92 % 60 - 1401,1-dichloroethene 2013/04/11 98 % 60 - 140cis-1,2-dichloroethene 2013/04/11 97 % 60 - 140trans-1,2-dichloroethene 2013/04/11 97 % 60 - 140Dichloromethane 2013/04/11 89 % 60 - 1401,2-dichloropropane 2013/04/11 94 % 60 - 140cis-1,3-dichloropropene 2013/04/11 95 % 60 - 140trans-1,3-dichloropropene 2013/04/11 92 % 60 - 140Methyl methacrylate 2013/04/11 107 % 60 - 140Methyl-tert-butylether (MTBE) 2013/04/11 91 % 60 - 140Styrene 2013/04/11 109 % 60 - 1401,1,1,2-tetrachloroethane 2013/04/11 123 % 60 - 1401,1,2,2-tetrachloroethane 2013/04/11 92 % 60 - 140Tetrachloroethene 2013/04/11 116 % 60 - 1401,2,3-trichlorobenzene 2013/04/11 107 % 60 - 1401,2,4-trichlorobenzene 2013/04/11 112 % 60 - 1401,3,5-trichlorobenzene 2013/04/11 108 % 60 - 1401,1,1-trichloroethane 2013/04/11 105 % 60 - 1401,1,2-trichloroethane 2013/04/11 95 % 60 - 140
Maxxam Analytics International Corporation o/a Maxxam Analytics Edmonton: 9331 - 48th Street T6B 2R4 Telephone(780)577-7100 Fax(780)450-4187
Page 12 of 18

KINDER MORGAN CANADAAttention: TAMMY SAUERClient Project #:P.O. #: 806743-0-KMCASite Location:
Quality Assurance Report (Continued)Maxxam Job Number: EB327917
QA/QC DateBatch AnalyzedNum Init QC Type Parameter yyyy/mm/dd Value Recovery UNITS QC Limits
6729879 PK1 Spiked Blank Trichloroethene 2013/04/11 106 % 60 - 140Trichlorofluoromethane 2013/04/11 92 % 60 - 1401,2,4-trimethylbenzene 2013/04/11 106 % 60 - 1401,3,5-trimethylbenzene 2013/04/11 107 % 60 - 140Vinyl chloride 2013/04/11 76 % 60 - 140
Method Blank 1,4-Difluorobenzene (sur.) 2013/04/11 104 % 60 - 1404-BROMOFLUOROBENZENE (sur.) 2013/04/11 94 % 60 - 140D4-1,2-DICHLOROETHANE (sur.) 2013/04/11 88 % 60 - 140Bromodichloromethane 2013/04/11 <0.030 mg/kgBromoform 2013/04/11 <0.050 mg/kgBromomethane 2013/04/11 <0.020 mg/kgCarbon tetrachloride 2013/04/11 <0.020 mg/kgChlorobenzene 2013/04/11 <0.020 mg/kgChlorodibromomethane 2013/04/11 <0.020 mg/kgChloroethane 2013/04/11 <0.020 mg/kgChloroform 2013/04/11 <0.020 mg/kgChloromethane 2013/04/11 <0.030 mg/kg1,2-dibromoethane 2013/04/11 <0.020 mg/kg1,2-dichlorobenzene 2013/04/11 <0.020 mg/kg1,3-dichlorobenzene 2013/04/11 <0.020 mg/kg1,4-dichlorobenzene 2013/04/11 <0.020 mg/kg1,1-dichloroethane 2013/04/11 <0.020 mg/kg1,2-dichloroethane 2013/04/11 <0.020 mg/kg1,1-dichloroethene 2013/04/11 <0.020 mg/kgcis-1,2-dichloroethene 2013/04/11 <0.020 mg/kgtrans-1,2-dichloroethene 2013/04/11 <0.020 mg/kgDichloromethane 2013/04/11 <0.030 mg/kg1,2-dichloropropane 2013/04/11 <0.020 mg/kgcis-1,3-dichloropropene 2013/04/11 <0.020 mg/kgtrans-1,3-dichloropropene 2013/04/11 <0.020 mg/kgMethyl methacrylate 2013/04/11 <0.040 mg/kgMethyl-tert-butylether (MTBE) 2013/04/11 <0.030 mg/kgStyrene 2013/04/11 <0.020 mg/kg1,1,1,2-tetrachloroethane 2013/04/11 <0.10 mg/kg1,1,2,2-tetrachloroethane 2013/04/11 <0.050 mg/kgTetrachloroethene 2013/04/11 <0.020 mg/kg1,2,3-trichlorobenzene 2013/04/11 <0.040 mg/kg1,2,4-trichlorobenzene 2013/04/11 <0.040 mg/kg1,3,5-trichlorobenzene 2013/04/11 <0.040 mg/kg1,1,1-trichloroethane 2013/04/11 <0.020 mg/kg1,1,2-trichloroethane 2013/04/11 <0.020 mg/kgTrichloroethene 2013/04/11 <0.010 mg/kgTrichlorofluoromethane 2013/04/11 <0.020 mg/kg1,2,4-trimethylbenzene 2013/04/11 <0.50 mg/kg1,3,5-trimethylbenzene 2013/04/11 <0.50 mg/kgVinyl chloride 2013/04/11 <0.010 mg/kg
RPD Bromodichloromethane 2013/04/11 NC % 50Bromoform 2013/04/11 NC % 50Bromomethane 2013/04/11 NC % 50Chlorodibromomethane 2013/04/11 NC % 50Chloroethane 2013/04/11 NC % 50Chloromethane 2013/04/11 NC % 501,2-dichlorobenzene 2013/04/11 NC % 501,3-dichlorobenzene 2013/04/11 NC % 501,4-dichlorobenzene 2013/04/11 NC % 50
Maxxam Analytics International Corporation o/a Maxxam Analytics Edmonton: 9331 - 48th Street T6B 2R4 Telephone(780)577-7100 Fax(780)450-4187
Page 13 of 18

KINDER MORGAN CANADAAttention: TAMMY SAUERClient Project #:P.O. #: 806743-0-KMCASite Location:
Quality Assurance Report (Continued)Maxxam Job Number: EB327917
QA/QC DateBatch AnalyzedNum Init QC Type Parameter yyyy/mm/dd Value Recovery UNITS QC Limits
6729879 PK1 RPD 1,1-dichloroethane 2013/04/11 NC % 501,1-dichloroethene 2013/04/11 NC % 50cis-1,2-dichloroethene 2013/04/11 NC % 50trans-1,2-dichloroethene 2013/04/11 NC % 50Dichloromethane 2013/04/11 NC % 501,2-dichloropropane 2013/04/11 NC % 50cis-1,3-dichloropropene 2013/04/11 NC % 50trans-1,3-dichloropropene 2013/04/11 NC % 50Methyl methacrylate 2013/04/11 NC % 50Methyl-tert-butylether (MTBE) 2013/04/11 NC % 50Styrene 2013/04/11 NC % 501,1,1,2-tetrachloroethane 2013/04/11 NC % 501,1,2,2-tetrachloroethane 2013/04/11 NC % 50Tetrachloroethene 2013/04/11 NC % 501,2,3-trichlorobenzene 2013/04/11 NC % 501,2,4-trichlorobenzene 2013/04/11 NC % 501,3,5-trichlorobenzene 2013/04/11 NC % 501,1,1-trichloroethane 2013/04/11 NC % 501,1,2-trichloroethane 2013/04/11 NC % 50Trichloroethene 2013/04/11 NC % 50Trichlorofluoromethane 2013/04/11 NC % 501,2,4-trimethylbenzene 2013/04/11 NC % 501,3,5-trimethylbenzene 2013/04/11 NC % 50
6730070 SJ1 Spiked Blank Phenol 2013/04/15 65 % 30 - 1302,3,5,6-tetrachlorophenol 2013/04/15 62 % 30 - 1302,3,4,6-tetrachlorophenol 2013/04/15 66 % 30 - 1302,4,5-trichlorophenol 2013/04/15 67 % 30 - 1302,4,6-trichlorophenol 2013/04/15 63 % 30 - 1302,4-dichlorophenol 2013/04/15 64 % 30 - 1302,4-dimethylphenol 2013/04/15 65 % 30 - 1302,4-dinitrophenol 2013/04/15 35 % 30 - 1302,6-dichlorophenol 2013/04/15 70 % 30 - 1302-chlorophenol 2013/04/15 64 % 30 - 1302-methylphenol 2013/04/15 67 % 30 - 1302-nitrophenol 2013/04/15 60 % 30 - 1303 & 4-methylphenol 2013/04/15 69 % 30 - 1304,6-dinitro-2-methylphenol 2013/04/15 49 % 30 - 1304-chloro-3-methylphenol 2013/04/15 72 % 30 - 1304-nitrophenol 2013/04/15 58 % 30 - 130Pentachlorophenol 2013/04/15 63 % 30 - 130
Method Blank Phenol 2013/04/15 <0.0010 mg/kg3 & 4-chlorophenol 2013/04/15 <0.0050 mg/kg2,3,5,6-tetrachlorophenol 2013/04/15 <0.0050 mg/kg2,3,4,6-tetrachlorophenol 2013/04/15 <0.0050 mg/kg2,4,5-trichlorophenol 2013/04/15 <0.0050 mg/kg2,4,6-trichlorophenol 2013/04/15 <0.0050 mg/kg2,3,5-trichlorophenol 2013/04/15 <0.0050 mg/kg2,3,4-trichlorophenol 2013/04/15 <0.0050 mg/kg2,4-dichlorophenol 2013/04/15 <0.0010 mg/kg2,4-dimethylphenol 2013/04/15 <0.0050 mg/kg2,4-dinitrophenol 2013/04/15 <0.050 mg/kg2,6-dichlorophenol 2013/04/15 <0.0050 mg/kg2-chlorophenol 2013/04/15 <0.0050 mg/kg2-methylphenol 2013/04/15 <0.0050 mg/kg2-nitrophenol 2013/04/15 <0.050 mg/kg
Maxxam Analytics International Corporation o/a Maxxam Analytics Edmonton: 9331 - 48th Street T6B 2R4 Telephone(780)577-7100 Fax(780)450-4187
Page 14 of 18

KINDER MORGAN CANADAAttention: TAMMY SAUERClient Project #:P.O. #: 806743-0-KMCASite Location:
Quality Assurance Report (Continued)Maxxam Job Number: EB327917
QA/QC DateBatch AnalyzedNum Init QC Type Parameter yyyy/mm/dd Value Recovery UNITS QC Limits
6730070 SJ1 Method Blank 3 & 4-methylphenol 2013/04/15 <0.0050 mg/kg4,6-dinitro-2-methylphenol 2013/04/15 <0.050 mg/kg4-chloro-3-methylphenol 2013/04/15 <0.0050 mg/kg4-nitrophenol 2013/04/15 <0.050 mg/kgPentachlorophenol 2013/04/15 <0.0050 mg/kg
RPD [ G C 7 5 8 6 - 0 1 ] Phenol 2013/04/16 NC % 503 & 4-chlorophenol 2013/04/16 NC % 502,3,5,6-tetrachlorophenol 2013/04/16 NC % 502,3,4,6-tetrachlorophenol 2013/04/16 NC % 502,4,5-trichlorophenol 2013/04/16 NC % 502,4,6-trichlorophenol 2013/04/16 NC % 502,3,5-trichlorophenol 2013/04/16 NC % 502,3,4-trichlorophenol 2013/04/16 NC % 502,4-dichlorophenol 2013/04/16 NC % 502,4-dimethylphenol 2013/04/16 NC % 502,4-dinitrophenol 2013/04/16 NC % 502,6-dichlorophenol 2013/04/16 NC % 502-chlorophenol 2013/04/16 NC % 502-methylphenol 2013/04/16 NC % 502-nitrophenol 2013/04/16 NC % 503 & 4-methylphenol 2013/04/16 NC % 504,6-dinitro-2-methylphenol 2013/04/16 NC % 504-chloro-3-methylphenol 2013/04/16 NC % 504-nitrophenol 2013/04/16 NC % 50Pentachlorophenol 2013/04/16 NC % 50
6738100 NK3 Spiked Blank F2 (C10-C16 Hydrocarbons) 2013/04/20 92 % 70 - 130F3 (C16-C34 Hydrocarbons) 2013/04/20 97 % 70 - 130F4 (C34-C50 Hydrocarbons) 2013/04/20 98 % 70 - 130
Method Blank F2 (C10-C16 Hydrocarbons) 2013/04/20 <10 mg/kgF3 (C16-C34 Hydrocarbons) 2013/04/20 <50 mg/kgF4 (C34-C50 Hydrocarbons) 2013/04/20 <50 mg/kg
RPD [ G C 7 5 8 5 - 0 2 ] F2 (C10-C16 Hydrocarbons) 2013/04/20 3.4 % 50F3 (C16-C34 Hydrocarbons) 2013/04/20 1.9 % 50F4 (C34-C50 Hydrocarbons) 2013/04/20 1.7 % 50
6738108 NK3 Spiked Blank DECANE (sur) 2013/04/20 75 % 30 - 130>C10 - C12 Aliphatic 2013/04/20 125 % 60 - 130>C12 - C16 Aliphatic 2013/04/20 113 % 60 - 130>C12 - C16 Aromatic 2013/04/20 117 % 60 - 130>C16 - C21 Aliphatic 2013/04/20 110 % 60 - 130>C16 - C21 Aromatic 2013/04/20 118 % 60 - 130>C21 - C34 Aliphatic 2013/04/20 117 % 60 - 130>C21 - C34 Aromatic 2013/04/20 130 % 60 - 130
Method Blank DECANE (sur) 2013/04/20 92 % 30 - 130>C10 - C12 Aliphatic 2013/04/20 <5.0 mg/kg>C10 - C12 Aromatic 2013/04/20 <10 ( 2 ) mg/kg>C12 - C16 Aliphatic 2013/04/20 <10 mg/kg>C12 - C16 Aromatic 2013/04/20 <10 mg/kg>C16 - C21 Aliphatic 2013/04/20 <10 mg/kg>C16 - C21 Aromatic 2013/04/20 <10 mg/kg>C21 - C34 Aliphatic 2013/04/20 <10 mg/kg>C21 - C34 Aromatic 2013/04/20 <10 mg/kg>C34 Aliphatic (up to C50) 2013/04/20 <10 mg/kg>C34 Aromatic (up to C50) 2013/04/20 <10 mg/kg
RPD [ G C 7 5 8 5 - 0 2 ] >C10 - C12 Aliphatic 2013/04/20 2.6 % 50>C10 - C12 Aromatic 2013/04/20 25.7 % 50
Maxxam Analytics International Corporation o/a Maxxam Analytics Edmonton: 9331 - 48th Street T6B 2R4 Telephone(780)577-7100 Fax(780)450-4187
Page 15 of 18

KINDER MORGAN CANADAAttention: TAMMY SAUERClient Project #:P.O. #: 806743-0-KMCASite Location:
Quality Assurance Report (Continued)Maxxam Job Number: EB327917
QA/QC DateBatch AnalyzedNum Init QC Type Parameter yyyy/mm/dd Value Recovery UNITS QC Limits
6738108 NK3 RPD [ G C 7 5 8 5 - 0 2 ] >C12 - C16 Aliphatic 2013/04/20 1.4 % 50>C12 - C16 Aromatic 2013/04/20 15.6 % 50>C16 - C21 Aliphatic 2013/04/20 3.9 % 50>C16 - C21 Aromatic 2013/04/20 14.4 % 50>C21 - C34 Aliphatic 2013/04/20 2.4 % 50>C21 - C34 Aromatic 2013/04/20 18.1 % 50>C34 Aliphatic (up to C50) 2013/04/20 2.0 % 50>C34 Aromatic (up to C50) 2013/04/20 20.1 % 50
6803862 DM Method Blank C3-fluorene 2013/05/10 <0.0050 mg/kgRetene 2013/05/10 <0.0050 mg/kgC1-Naphthalene 2013/05/10 <0.0050 mg/kgC2-Naphthalene 2013/05/10 <0.0050 mg/kgC3-Naphthalene 2013/05/10 <0.0050 mg/kgC4-Naphthalene 2013/05/10 <0.0050 mg/kgBiphenyl 2013/05/10 <0.0050 mg/kgC1-biphenyl 2013/05/10 <0.0050 mg/kgC2-biphenyl 2013/05/10 <0.0050 mg/kgC1-fluorene 2013/05/10 <0.0050 mg/kgC2-fluorene 2013/05/10 <0.0050 mg/kgDibenzothiophene 2013/05/10 <0.0050 mg/kgC1-dibenzothiophene 2013/05/10 <0.0050 mg/kgC2-dibenzothiophene 2013/05/10 <0.0050 mg/kgC3-dibenzothiophene 2013/05/10 <0.0050 mg/kgC4-dibenzothiophene 2013/05/10 <0.0050 mg/kgC1 phenanthrene/anthracene 2013/05/10 <0.0050 mg/kgC2 phenanthrene/anthracene 2013/05/10 <0.0050 mg/kgC3 phenanthrene/anthracene 2013/05/10 <0.0050 mg/kgC4 phenanthrene/anthracene 2013/05/10 <0.0050 mg/kgC1 fluoranthene/pyrene 2013/05/10 <0.0050 mg/kgC2 fluoranthene/pyrene 2013/05/10 <0.0050 mg/kgC3 fluoranthene/pyrene 2013/05/10 <0.0050 mg/kgC4 fluoranthene/pyrene 2013/05/10 <0.0050 mg/kgC1 benzo(a)anthracene/chrysene 2013/05/10 <0.0050 mg/kgC2 benzo(a)anthracene/chrysene 2013/05/10 <0.0050 mg/kgC3 benzo(a)anthracene/chrysene 2013/05/10 <0.0050 mg/kgC4 benzo(a)anthracene/chrysene 2013/05/10 <0.0050 mg/kgC1benzobjkfluoranthene/benzoapyrene 2013/05/10 <0.0050 mg/kgC2benzobjkfluoranthene/benzoapyrene 2013/05/10 <0.0050 mg/kgC1-Acenaphthene 2013/05/10 <0.0050 mg/kg
6859127 RSA Spiked Blank 1,4-Difluorobenzene (sur.) 2013/05/31 72 % 60 - 1404-BROMOFLUOROBENZENE (sur.) 2013/05/31 92 % 60 - 140D4-1,2-DICHLOROETHANE (sur.) 2013/05/31 96 % 60 - 140(C6-C10) 2013/05/31 130 % 60 - 140Benzene 2013/05/31 108 % 60 - 140Toluene 2013/05/31 110 % 60 - 140Ethylbenzene 2013/05/31 109 % 60 - 140m & p-Xylene 2013/05/31 113 % 60 - 140o-Xylene 2013/05/31 113 % 60 - 140C6-C8 2013/05/31 109 % 60 - 140>C8-C10 2013/05/31 108 % 60 - 140Aromatic >C8-C10 2013/05/31 77 % 60 - 140
Method Blank 1,4-Difluorobenzene (sur.) 2013/05/30 83 % 60 - 1404-BROMOFLUOROBENZENE (sur.) 2013/05/30 97 % 60 - 140D4-1,2-DICHLOROETHANE (sur.) 2013/05/30 94 % 60 - 140(C6-C10) 2013/05/30 <12 mg/kg
Maxxam Analytics International Corporation o/a Maxxam Analytics Edmonton: 9331 - 48th Street T6B 2R4 Telephone(780)577-7100 Fax(780)450-4187
Page 16 of 18

KINDER MORGAN CANADAAttention: TAMMY SAUERClient Project #:P.O. #: 806743-0-KMCASite Location:
Quality Assurance Report (Continued)Maxxam Job Number: EB327917
QA/QC DateBatch AnalyzedNum Init QC Type Parameter yyyy/mm/dd Value Recovery UNITS QC Limits
6859127 RSA Method Blank Benzene 2013/05/30 <0.0050 mg/kgToluene 2013/05/30 <0.020 mg/kgEthylbenzene 2013/05/30 <0.010 mg/kgXylenes (Total) 2013/05/30 <0.040 mg/kgm & p-Xylene 2013/05/30 <0.040 mg/kgo-Xylene 2013/05/30 <0.020 mg/kgC6-C8 2013/05/30 <12 mg/kg>C8-C10 2013/05/30 <12 mg/kgAromatic >C8-C10 2013/05/30 <12 mg/kgF1 (C6-C10) - BTEX 2013/05/30 <12 mg/kg
Duplicate: Paired analysis of a separate portion of the same sample. Used to evaluate the variance in the measurement.Matrix Spike: A sample to which a known amount of the analyte of interest has been added. Used to evaluate sample matrix interference.Spiked Blank: A blank matrix sample to which a known amount of the analyte, usually from a second source, has been added. Used to evaluate methodaccuracy.Method Blank: A blank matrix containing all reagents used in the analytical procedure. Used to identify laboratory contamination.Surrogate: A pure or isotopically labeled compound whose behavior mirrors the analytes of interest. Used to evaluate extraction efficiency.NC (RPD): The RPD was not calculated. The level of analyte detected in the parent sample and its duplicate was not sufficiently significant to permit areliable calculation.( 1 ) Recovery or RPD for this parameter is outside control limits. The overall quality control for this analysis meets acceptability criteria.( 2 ) Detection limit raised due to extraction interference.
Maxxam Analytics International Corporation o/a Maxxam Analytics Edmonton: 9331 - 48th Street T6B 2R4 Telephone(780)577-7100 Fax(780)450-4187
Page 17 of 18

Validation Signature Page
Maxxam Job #: B327917
The analytical data and all QC contained in this report were reviewed and validated by the following individual(s).
Kristopher Beaudet, B.Sc., P.Chem, Scientific Specialist
Veronica Falk, Scientific Specialist
====================================================================Maxxam has procedures in place to guard against improper use of the electronic signature and have the required "signatories", as per section 5.10.2 ofISO/IEC 17025:2005(E), signing the reports. For Service Group specific validation please refer to the Validation Signature Page.
Page 18 of 18
Your Project #: B327917 PRODUCTSYour C.O.C. #: NA
Attention:Calgary Customer ServiceMaxxam Analytics2021 41st Ave NECalgary, ABT2E 6P2
Report Date: 2013/06/14
CERTIFICATE OF ANALYSIS
MAXXAM JOB #: B385868Received: 2013/06/04, 08:57
Sample Matrix: Oil# Samples Received: 1
Date Date MethodAnalyses Quantity Extracted Analyzed Laboratory Method ReferencePAHs in Soil by HRMS (CARB429mod) 1 2013/06/07 2013/06/08 BRL SOP-00418 CARB429 MOD
* RPDs calculated using raw data. The rounding of final results may result in the apparent difference.
Encryption Key
Please direct all questions regarding this Certificate of Analysis to your Project Manager.
Marsela Wijaya, Project Manager AssistantEmail: [email protected]# (905) 817-5700
====================================================================Maxxam has procedures in place to guard against improper use of the electronic signature and have the required "signatories", as per section5.10.2 of ISO/IEC 17025:2005(E), signing the reports. For Service Group specific validation please refer to the Validation Signature Page.
Total cover pages: 1
Page 1 of 8

Maxxam AnalyticsMaxxam Job #: B385868 Client Project #: B327917 PRODUCTSReport Date: 2013/06/14
RESULTS OF ANALYSES OF OIL
Maxxam ID R T 4 9 8 3Sampling DateCOC Number NA
U n i t s GC7585-03 EDL RDL QC BatchGB5490
Naphthalene ng/g 30300 20000 910 3240038
2-Methylnaphthalene ng/g 102000 ( 1 ) 28000 910 3240038
Acenaphthylene ng/g <14000 14000 910 3240038
Acenaphthene ng/g 21700 5200 910 3240038
Fluorene ng/g 25200 5900 910 3240038
Phenanthrene ng/g 78300 23000 910 3240038
Anthracene ng/g <25000 25000 910 3240038
Fluoranthene ng/g <9700 9700 910 3240038
Pyrene ng/g 10700 9100 910 3240038
Benzo(a)anthracene ng/g 4070 3400 910 3240038
Chrysene ng/g 10400 5400 910 3240038
Benzo(b)fluoranthene ng/g 4670 1500 910 3240038
Benzo(k)fluoranthene ng/g <2800 2800 910 3240038
Benzo(e)pyrene ng/g 6850 2200 910 3240038
Benzo(a)pyrene ng/g 4420 3400 910 3240038
Perylene ng/g 13300 1800 910 3240038
Indeno(1,2,3-cd)pyrene ng/g 1880 1700 910 3240038
Dibenz(a,h)anthracene ng/g <1500 1500 910 3240038
Benzo(g,h,i)perylene ng/g 3280 1700 910 3240038
1-Methylnaphthalene ng/g 77800 31000 910 3240038
1-Methylphenanthrene ng/g 79000 15000 910 3240038
2,6-Dimethylnaphthalene ng/g 137000 ( 1 ) 10000 910 3240038
2,3,5-Trimethylnaphthalene ng/g 171000 5000 910 3240038
Dibenzothiophene ng/g 41800 1600 910 3240038
Surrogate Recovery (%)
2,6-Dimethylnaphthalene-2H12 % 97 N/A N/A 3240038
2-Methylnaphthalene-2H10 % 94 N/A N/A 3240038
Acenaphthylene-2H8 % 84 N/A N/A 3240038
Benz(a)anthracene-2H12 % 147 N/A N/A 3240038
Benzo(a)pyrene-2H12 % 85 N/A N/A 3240038
Benzo(b)fluoranthene-2H12 % 112 N/A N/A 3240038
N/A = Not ApplicableRDL = Reportable Detection LimitEDL = Estimated Detection LimitQC Batch = Quality Control Batch( 1 ) EMCL - Exceeds Maximum Calibration Limit
Page 2 of 8

Maxxam AnalyticsMaxxam Job #: B385868 Client Project #: B327917 PRODUCTSReport Date: 2013/06/14
RESULTS OF ANALYSES OF OIL
Maxxam ID R T 4 9 8 3Sampling DateCOC Number NA
U n i t s GC7585-03 EDL RDL QC BatchGB5490
Benzo(g,h,i)perylene-2H12 % 69 N/A N/A 3240038
Benzo(k)fluoranthene-2H12 % 92 N/A N/A 3240038
Chrysene-2H12 % 108 N/A N/A 3240038
Dibenzo(a,h)anthracene-2H14 % 65 N/A N/A 3240038
Fluoranthene-2H10 % 95 N/A N/A 3240038
Indeno(1,2,3-c,d)pyrene-2H12 % 81 N/A N/A 3240038
Naphthalene-2H8 % 103 N/A N/A 3240038
Perylene-2H12 % 86 N/A N/A 3240038
Phenanthrene-2H10 % 76 N/A N/A 3240038
N/A = Not ApplicableRDL = Reportable Detection LimitEDL = Estimated Detection LimitQC Batch = Quality Control Batch
Page 3 of 8

Maxxam AnalyticsMaxxam Job #: B385868 Client Project #: B327917 PRODUCTSReport Date: 2013/06/14
Test Summary
Maxxam ID RT4983 CollectedSample ID GC7585-03 GB5490 Shipped
Matrix Oil Received 2013/06/04
Test Description Instrumentation Batch Extracted Analyzed AnalystPAHs in Soil by HRMS (CARB429mod) HRMS/MS 3240038 2013/06/07 2013/06/08 Branko Vrzic
Page 4 of 8

Maxxam AnalyticsMaxxam Job #: B385868 Client Project #: B327917 PRODUCTSReport Date: 2013/06/14
Package 1 7.7°CEach temperature is the average of up to three cooler temperatures taken at receipt
GENERAL COMMENTS
Results relate only to the items tested.
Page 5 of 8

Maxxam AnalyticsAttention: Calgary Customer ServiceClient Project #: B327917 PRODUCTSP.O. #:Site Location:
Quality Assurance ReportMaxxam Job Number: GB385868
QA/QC DateBatch AnalyzedNum Init QC Type Parameter yyyy/mm/dd Value %Recovery Units QC Limits
3240038 BY Spiked Blank 2,6-Dimethylnaphthalene-2H12 2013/06/08 91 % 50 - 1502-Methylnaphthalene-2H10 2013/06/08 91 % 50 - 150Acenaphthylene-2H8 2013/06/08 81 % 50 - 150Benz(a)anthracene-2H12 2013/06/08 72 % 50 - 150Benzo(a)pyrene-2H12 2013/06/08 66 % 50 - 150Benzo(b)fluoranthene-2H12 2013/06/08 99 % 50 - 150Benzo(g,h,i)perylene-2H12 2013/06/08 78 % 50 - 150Benzo(k)fluoranthene-2H12 2013/06/08 70 % 50 - 150Chrysene-2H12 2013/06/08 70 % 50 - 150Dibenzo(a,h)anthracene-2H14 2013/06/08 52 % 50 - 150Fluoranthene-2H10 2013/06/08 80 % 50 - 150Indeno(1,2,3-c,d)pyrene-2H12 2013/06/08 57 % 50 - 150Naphthalene-2H8 2013/06/08 91 % 50 - 150Perylene-2H12 2013/06/08 64 % 50 - 150Phenanthrene-2H10 2013/06/08 91 % 50 - 150Naphthalene 2013/06/08 81 % 60 - 140Acenaphthylene 2013/06/08 84 % 60 - 140Acenaphthene 2013/06/08 84 % 60 - 140Fluorene 2013/06/08 91 % 60 - 140Phenanthrene 2013/06/08 91 % 60 - 140Anthracene 2013/06/08 88 % 60 - 140Fluoranthene 2013/06/08 108 % 60 - 140Pyrene 2013/06/08 93 % 60 - 140Benzo(a)anthracene 2013/06/08 86 % 60 - 140Chrysene 2013/06/08 92 % 60 - 140Benzo(b)fluoranthene 2013/06/08 71 % N/ABenzo(k)fluoranthene 2013/06/08 178 ( 1 ) % 60 - 140Benzo(a)pyrene 2013/06/08 103 % 60 - 140Indeno(1,2,3-cd)pyrene 2013/06/08 91 % 60 - 140Dibenz(a,h)anthracene 2013/06/08 79 % 60 - 140Benzo(g,h,i)perylene 2013/06/08 85 % 60 - 140
Method Blank 2,6-Dimethylnaphthalene-2H12 2013/06/12 89 % 50 - 1502-Methylnaphthalene-2H10 2013/06/12 102 % 50 - 150Acenaphthylene-2H8 2013/06/12 101 % 50 - 150Benz(a)anthracene-2H12 2013/06/12 71 % 50 - 150Benzo(a)pyrene-2H12 2013/06/12 44 ( 1 ) % 50 - 150Benzo(b)fluoranthene-2H12 2013/06/12 85 % 50 - 150Benzo(g,h,i)perylene-2H12 2013/06/12 105 % 50 - 150Benzo(k)fluoranthene-2H12 2013/06/12 84 % 50 - 150Chrysene-2H12 2013/06/12 53 % 50 - 150Dibenzo(a,h)anthracene-2H14 2013/06/12 46 ( 1 ) % 50 - 150Fluoranthene-2H10 2013/06/12 99 % 50 - 150Indeno(1,2,3-c,d)pyrene-2H12 2013/06/12 72 % 50 - 150Naphthalene-2H8 2013/06/12 111 % 50 - 150Perylene-2H12 2013/06/12 82 % 50 - 150Phenanthrene-2H10 2013/06/12 88 % 50 - 150Naphthalene 2013/06/12 <260 ng/g2-Methylnaphthalene 2013/06/12 <170 ng/gAcenaphthylene 2013/06/12 <150 ng/gAcenaphthene 2013/06/12 <370 ng/gFluorene 2013/06/12 <99 ng/gPhenanthrene 2013/06/12 <130 ng/gAnthracene 2013/06/12 <140 ng/gFluoranthene 2013/06/12 <120 ng/gPyrene 2013/06/12 <110 ng/g
Page 6 of 8

Maxxam AnalyticsAttention: Calgary Customer ServiceClient Project #: B327917 PRODUCTSP.O. #:Site Location:
Quality Assurance Report (Continued)Maxxam Job Number: GB385868
QA/QC DateBatch AnalyzedNum Init QC Type Parameter yyyy/mm/dd Value %Recovery Units QC Limits
3240038 BY Method Blank Benzo(a)anthracene 2013/06/12 <570 ng/gChrysene 2013/06/12 <610 ng/gBenzo(b)fluoranthene 2013/06/12 <160 ng/gBenzo(k)fluoranthene 2013/06/12 <300 ng/gBenzo(e)pyrene 2013/06/12 <450 ng/gBenzo(a)pyrene 2013/06/12 <570 ng/gPerylene 2013/06/12 <170 ng/gIndeno(1,2,3-cd)pyrene 2013/06/12 <160 ng/gDibenz(a,h)anthracene 2013/06/12 <360 ng/gBenzo(g,h,i)perylene 2013/06/12 141, RDL=500 ng/g1-Methylnaphthalene 2013/06/12 <200 ng/g1-Methylphenanthrene 2013/06/12 <91 ng/g2,6-Dimethylnaphthalene 2013/06/12 <150 ng/g2,3,5-Trimethylnaphthalene 2013/06/12 <200 ng/gDibenzothiophene 2013/06/12 <28 ng/g
Spiked Blank: A blank matrix sample to which a known amount of the analyte, usually from a second source, has been added. Used to evaluate methodaccuracy.Method Blank: A blank matrix containing all reagents used in the analytical procedure. Used to identify laboratory contamination.Surrogate: A pure or isotopically labeled compound whose behavior mirrors the analytes of interest. Used to evaluate extraction efficiency.( 1 ) Recovery or RPD for this parameter is outside control limits. The overall quality control for this analysis meets acceptability criteria.
Page 7 of 8

Validation Signature Page
Maxxam Job #: B385868
The analytical data and all QC contained in this report were reviewed and validated by the following individual(s).
Owen Cosby, BSc.C.Chem, Supervisor, HRMS Services
====================================================================Maxxam has procedures in place to guard against improper use of the electronic signature and have the required "signatories", as per section 5.10.2 ofISO/IEC 17025:2005(E), signing the reports. For Service Group specific validation please refer to the Validation Signature Page.
Page 8 of 8


Trans Mountain Pipeline ULC Volume 7, Pipeline Facilities Technical Reports Trans Mountain Expansion Project Qualitative Ecological Risk Assessment of
Pipeline Spills Technical Report
December, 2013 REP-NEB-TERA-00019
Page B
Appendix B: Results of the Stochastic Modeling

CLIENT
PROJECT NO. DWN CHK APVD REV
DATEOFFICESTATUS
ISSUED FOR REVIEW
- The wind stick represent winds at Pitt Meadows.
- The bottom graph represents the Fraser River discharge at Hope.
V13203022 AH JAS JAS 0
October 2013 EBA-VANC
TRANS MOUNTAIN OIL SPILL STUDYNOTES
Environmental Conditions: Winter 2012 Site FR
Stochastic Modelling
Figure I.1-1
TRANS MOUNTAIN
Thu Oct 24 16:57:55 2013:V:\V13203022 Trans Mountain\working\AH\02-SPILLCALC\Tsplot
-10-8
-6-4
-20
24
6810
[m/s]
1Jan2 3 4 5 6 7 8 9 10 11 12 13 14 15 16 17 18 19 20 21 22 23 24 25 26 27 28 29 30
-10-8
-6-4
-20
24
6810
[m/s]
1Feb2 3 4 5 6 7 8 9 10 11 12 13 14 15 16 17 18 19 20 21 22 23 24 25 26 27 28
-10-8
-6-4
-20
24
6810
[m/s]
1Mar2 3 4 5 6 7 8 9 10 11 12 13 14 15 16 17 18 19 20 21 22 23 24 25 26 27 28 29 30
02000
4000
6000
8000
10000
12000
[m3/s]
02000
4000
6000
8000
10000
12000
[m3/s]
Oct
2011
Nov Dec Jan
2012
Feb Mar Apr May Jun Jul Aug Sep


NOTES
DATE
CLIENT
PROJECT NO.V13203022
EBA-VANCOFFICE
DWN
October 24, 2013
JASAH
APVD REV0
ISSUED FOR REVIEW
Figure FR.1-3
TRANS MOUNTAIN OIL SPILL STUDY
24 Oct 2013 17:14:02T:\TMEP\working\AH\02-SPILLCALC\560-Stochastic_Fraser\Results_Winter\Tecplot\03-shore_prob.lay
Stochastic SimulationWinter 2012, Site FR (1,250 m3)
Shoreline Oiled Probability
-
CKD
STATUS
- Statistical results based on independent spills occuring every 6 hours from January 01 00:00to March 31 23:00, for a total of 364 independant spills.
- Probability of oil presence is the percentage of simulations in which oil was present at a given location.
- Tracking time for each spill was 3 days.
Longitude
-123.30 -123.20 -123.10 -123.00 -122.90 -122.80
49.05
49.10
49.15
49.20
49.25
95
90
80
60
40
20
10
5
1
Probabilityfor Shoreto be Oiled
(%)
ReleaseLocation

NOTES
DATE
CLIENT
PROJECT NO.V13203022
EBA-VANCOFFICE
DWN
October 24, 2013
JASAH
APVD REV0
ISSUED FOR REVIEW
Figure FR.1-4
TRANS MOUNTAIN OIL SPILL STUDY
24 Oct 2013 17:14:17T:\TMEP\working\AH\02-SPILLCALC\560-Stochastic_Fraser\Results_Winter\Tecplot\04-shore_firstcontact.lay
Stochastic SimulationWinter 2012, Site FR (1,250 m3)Shoreline Time to First Contact
-
CKD
STATUS
- Statistical results based on independent spills occuring every 6 hours from January 01 00:00to March 31 23:00, for a total of 364 independant spills.
- Time to first contact is the minimum time, over all simulations, for oil to reach a given shore segment.
- Tracking time for each spill was 3 days.
Longitude
-123.20 -123.00 -122.80
49.05
49.10
49.15
49.20
49.25
3.0
2.5
2.0
1.5
1.0
0.5
0.0
Time to FirstContact(days)
ReleaseLocation

NOTES
DATE
CLIENT
PROJECT NO.V13203022
EBA-VANCOFFICE
DWN
October 24, 2013
JASAH
APVD REV0
ISSUED FOR REVIEW
Figure FR.1-5
TRANS MOUNTAIN OIL SPILL STUDY
24 Oct 2013 10:18:44T:\TMEP\working\AH\02-SPILLCALC\560-Stochastic_Fraser\Results_Winter\Tecplot\05-shore_km.lay
Stochastic SimulationWinter 2012, Site FR (1,250 m3)Length of Shoreline Contacted
-
CKD
STATUS
- Statistical results based on independent spills occuring every 6 hours from January 01 00:00to March 31 23:00, for a total of 364 independant spills.
- Tracking time for each spill was 3 days.

NOTES
DATE
CLIENT
PROJECT NO.V13203022
EBA-VANCOFFICE
DWN
October 24, 2013
JASAH
APVD REV0
ISSUED FOR REVIEW
Figure FR.1-6
TRANS MOUNTAIN OIL SPILL STUDY
24 Oct 2013 11:27:44T:\TMEP\working\AH\02-SPILLCALC\560-Stochastic_Fraser\Results_Winter\Tecplot\06-shore_class_km.lay
Stochastic Simulation - Winter 2012Site FR (1,250 m3): Length of
Shoreline Contacted Per Coastal Class
-
CKD
STATUS
- Statistical results based on independent spills occuring every 6 hours from January 01 00:00to March 31 23:00, for a total of 364 independant spills.
- Tracking time for each spill was 3 days.

NOTES
DATE
CLIENT
PROJECT NO.V13203022
EBA-VANCOFFICE
DWN
October 24, 2013
JASAH
APVD REV0
ISSUED FOR REVIEW
Figure FR.1-7
TRANS MOUNTAIN OIL SPILL STUDY
24 Oct 2013 10:19:02T:\TMEP\working\AH\02-SPILLCALC\560-Stochastic_Fraser\Results_Winter\Tecplot\07-dissolution_TS.lay
Stochastic SimulationWinter 2012, Site FR (1,250 m3)
Amount of Dissolved Oil
-
CKD
STATUS
- Statistical results based on independent spills occuring every 6 hours from January 01 00:00to March 31 23:00, for a total of 364 independant spills.
- Tracking time for each spill was 3 days.

NOTES
DATE
CLIENT
PROJECT NO.V13203022
EBA-VANCOFFICE
DWN
October 24, 2013
JASAH
APVD REV0
ISSUED FOR REVIEW
Figure FR.1-8
TRANS MOUNTAIN OIL SPILL STUDY
24 Oct 2013 09:49:13T:\TMEP\working\AH\02-SPILLCALC\560-Stochastic_Fraser\Results_Winter\Tecplot\08-statistics_MB_1.lay
Stochastic SimulationWinter 2012, Site FR (1,250 m3)
Major Components of the Mass Balance
-
CKD
STATUS
- Statistical results based on independent spills occuring every 6 hours from January 01 00:00to March 31 23:00, for a total of 364 independant spills.
- Tracking time for each spill was 3 days.
- The major components of the mass balance are shown above.
Time (Days)
3
0 20 0
200 200
400 400
600 600
800 800
1000 1000
1200 1200
Average on water
Average on shore
Average evaporated
Total
2.9 %
84.2 %
11.0 %

NOTES
DATE
CLIENT
PROJECT NO.V13203022
EBA-VANCOFFICE
DWN
October 24, 2013
JASAH
APVD REV0
ISSUED FOR REVIEW
Figure FR.1-9
TRANS MOUNTAIN OIL SPILL STUDY
24 Oct 2013 09:49:27T:\TMEP\working\AH\02-SPILLCALC\560-Stochastic_Fraser\Results_Winter\Tecplot\09-statistics_MB_2.lay
Stochastic SimulationWinter 2012, Site FR (1,250 m3)
Minor Components of the Mass Balance
-
CKD
STATUS
- Statistical results based on independent spills occuring every 6 hours from January 01 00:00to March 31 23:00, for a total of 364 independant spills.
- Tracking time for each spill was 3 days.
- The minor components of the mass balance are shown above.
Time (Days)
3
0 20 0
2 2
4 4
6 6
8 8
10 10
12 12
14 14
Average dispersed
Average biodegraded
Average OMAs
Average sunk
Average dissolved
0.9 %
Dispersed: << 0.1 %OMAs : << 0.1 %
0.5 %
0.5 %

NOTES
DATE
CLIENT
PROJECT NO.V13203022
EBA-VANCOFFICE
DWN
October 24, 2013
JASAH
APVD REV0
ISSUED FOR REVIEW
Figure FR.1-10
TRANS MOUNTAIN OIL SPILL STUDY
24 Oct 2013 09:49:46T:\TMEP\working\AH\02-SPILLCALC\560-Stochastic_Fraser\Results_Winter\Tecplot\10-statistics_thk.lay
Stochastic SimulationWinter 2012, Site FR (1,250 m3)
Statistics on Area and Thickness
-
CKD
STATUS
- Statistical results based on independent spills occuring every 6 hours from January 01 00:00to March 31 23:00, for a total of 364 independant spills.
- The average thickness is based on a full coverage of each grid cell that contains oil.
Time (days)
2
0 0.5 1 1.5 2 2.5 30
1
2
3
4
5
0
2000
4000
6000
8000
10000Average Area (km2)
Average thickness (microns)

CLIENT
PROJECT NO. DWN CHK APVD REV
DATEOFFICESTATUS
ISSUED FOR REVIEW
- The wind stick represent winds at Pitt Meadows.
- The bottom graph represents the Fraser River discharge at Hope.
V13203022 AH JAS JAS 0
October 2013 EBA-VANC
TRANS MOUNTAIN OIL SPILL STUDYNOTES
Environmental Conditions: Summer 2012 Site FR
Stochastic Modelling
Figure I.3-1
TRANS MOUNTAIN
Thu Oct 24 16:56:54 2013:V:\V13203022 Trans Mountain\working\AH\02-SPILLCALC\Tsplot
-10-8
-6-4
-20
24
6810
[m/s]
1Jul2 3 4 5 6 7 8 9 10 11 12 13 14 15 16 17 18 19 20 21 22 23 24 25 26 27 28 29 30
-10-8
-6-4
-20
24
6810
[m/s]
1Aug2 3 4 5 6 7 8 9 10 11 12 13 14 15 16 17 18 19 20 21 22 23 24 25 26 27 28 29 30
-10-8
-6-4
-20
24
6810
[m/s]
1Sep2 3 4 5 6 7 8 9 10 11 12 13 14 15 16 17 18 19 20 21 22 23 24 25 26 27 28 29
02000
4000
6000
8000
10000
12000
[m3/s]
02000
4000
6000
8000
10000
12000
[m3/s]
Oct
2011
Nov Dec Jan
2012
Feb Mar Apr May Jun Jul Aug Sep
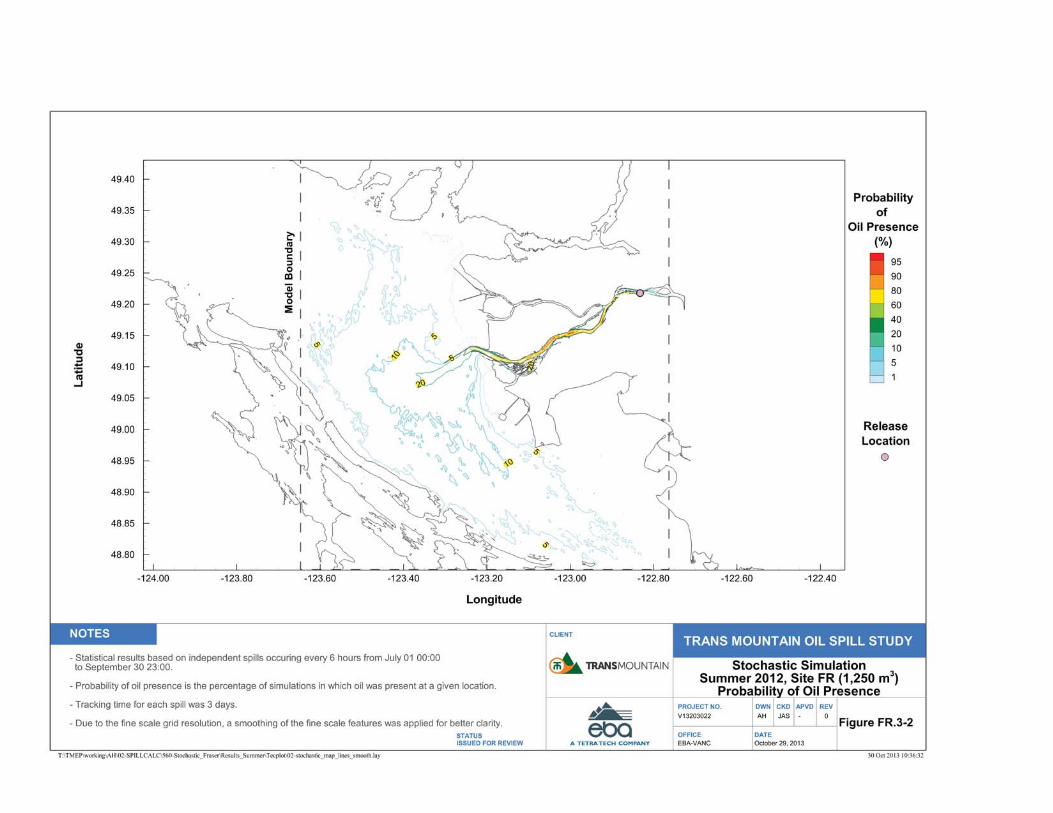


NOTES
DATE
CLIENT
PROJECT NO.V13203022
EBA-VANCOFFICE
DWN
October 30, 2013
JASAH
APVD REV0
ISSUED FOR REVIEW
Figure FR.3-3
TRANS MOUNTAIN OIL SPILL STUDY
30 Oct 2013 09:14:33T:\TMEP\working\AH\02-SPILLCALC\560-Stochastic_Fraser\Results_Summer\Tecplot\03-shore_prob_all.lay
Stochastic SimulationSummer 2012, Site FR (1,250 m3)
Shoreline Oiled Probability
-
CKD
STATUS
- Statistical results based on independent spills occuring every 6 hours from July 01 00:00to September 30 23:00.
- Probability of oil presence is the percentage of simulations in which oil was present at a given location.
- Tracking time for each spill was 3 days.
Longitude
-124.00 -123.50 -123.00 -122.50
48.70
48.80
48.90
49.00
49.10
49.20
49.30
49.40
95
90
80
60
40
20
10
5
1
Probabilityfor Shoreto be Oiled
(%)
ReleaseLocation

NOTES
DATE
CLIENT
PROJECT NO.V13203022
EBA-VANCOFFICE
DWN
October 24, 2013
JASAH
APVD REV0
ISSUED FOR REVIEW
Figure FR.3-3
TRANS MOUNTAIN OIL SPILL STUDY
24 Oct 2013 12:13:39T:\TMEP\working\AH\02-SPILLCALC\560-Stochastic_Fraser\Results_Summer\Tecplot\03-shore_prob.lay
Stochastic SimulationSummer 2012, Site FR (1,250 m3)
Shoreline Oiled Probability
-
CKD
STATUS
- Statistical results based on independent spills occuring every 6 hours from July 01 00:00to September 30 23:00, for a total of 368 independant spills.
- Probability of oil presence is the percentage of simulations in which oil was present at a given location.
- Tracking time for each spill was 3 days.
Longitude
-123.30 -123.20 -123.10 -123.00 -122.90 -122.80
49.05
49.10
49.15
49.20
49.25
95
90
80
60
40
20
10
5
1
Probabilityfor Shoreto be Oiled
(%)
ReleaseLocation

NOTES
DATE
CLIENT
PROJECT NO.V13203022
EBA-VANCOFFICE
DWN
October 24, 2013
JASAH
APVD REV0
ISSUED FOR REVIEW
Figure FR.3-4
TRANS MOUNTAIN OIL SPILL STUDY
24 Oct 2013 12:13:54T:\TMEP\working\AH\02-SPILLCALC\560-Stochastic_Fraser\Results_Summer\Tecplot\04-shore_firstcontact.lay
Stochastic SimulationSummer 2012, Site FR (1,250 m3)Shoreline Time to First Contact
-
CKD
STATUS
- Statistical results based on independent spills occuring every 6 hours from July 01 00:00to September 30 23:00, for a total of 368 independant spills.
- Time to first contact is the minimum time, over all simulations, for oil to reach a given shore segment.
- Tracking time for each spill was 3 days.
Longitude
-123.20 -123.00 -122.80
49.05
49.10
49.15
49.20
49.25
3.0
2.5
2.0
1.5
1.0
0.5
0.0
Time to FirstContact(days)
ReleaseLocation

NOTES
DATE
CLIENT
PROJECT NO.V13203022
EBA-VANCOFFICE
DWN
October 24, 2013
JASAH
APVD REV0
ISSUED FOR REVIEW
Figure FR.3-5
TRANS MOUNTAIN OIL SPILL STUDY
24 Oct 2013 12:14:06T:\TMEP\working\AH\02-SPILLCALC\560-Stochastic_Fraser\Results_Summer\Tecplot\05-shore_km.lay
Stochastic SimulationSummer 2012, Site FR (1,250 m3)Length of Shoreline Contacted
-
CKD
STATUS
- Statistical results based on independent spills occuring every 6 hours from July 01 00:00to September 30 23:00, for a total of 368 independant spills.
- Tracking time for each spill was 3 days.

NOTES
DATE
CLIENT
PROJECT NO.V13203022
EBA-VANCOFFICE
DWN
October 24, 2013
JASAH
APVD REV0
ISSUED FOR REVIEW
Figure FR.3-6
TRANS MOUNTAIN OIL SPILL STUDY
24 Oct 2013 12:14:20T:\TMEP\working\AH\02-SPILLCALC\560-Stochastic_Fraser\Results_Summer\Tecplot\06-shore_class_km.lay
Stochastic Simulation - Summer 2012Site FR (1,250 m3): Length of
Shoreline Contacted Per Coastal Class
-
CKD
STATUS
- Statistical results based on independent spills occuring every 6 hours from July 01 00:00to September 30 23:00, for a total of 368 independant spills.
- Tracking time for each spill was 3 days.

NOTES
DATE
CLIENT
PROJECT NO.V13203022
EBA-VANCOFFICE
DWN
October 24, 2013
JASAH
APVD REV0
ISSUED FOR REVIEW
Figure FR.3-7
TRANS MOUNTAIN OIL SPILL STUDY
24 Oct 2013 12:14:34T:\TMEP\working\AH\02-SPILLCALC\560-Stochastic_Fraser\Results_Summer\Tecplot\07-dissolution_TS.lay
Stochastic SimulationSummer 2012, Site FR (1,250 m3)
Amount of Dissolved Oil
-
CKD
STATUS
- Statistical results based on independent spills occuring every 6 hours from July 01 00:00to September 30 23:00, for a total of 368 independant spills.
- Tracking time for each spill was 3 days.

NOTES
DATE
CLIENT
PROJECT NO.V13203022
EBA-VANCOFFICE
DWN
October 24, 2013
JASAH
APVD REV0
ISSUED FOR REVIEW
Figure FR.3-8
TRANS MOUNTAIN OIL SPILL STUDY
24 Oct 2013 12:14:45T:\TMEP\working\AH\02-SPILLCALC\560-Stochastic_Fraser\Results_Summer\Tecplot\08-statistics_MB_1.lay
Stochastic SimulationSummer 2012, Site FR (1,250 m3)
Major Components of the Mass Balance
-
CKD
STATUS
- Statistical results based on independent spills occuring every 6 hours from July 01 00:00to September 30 23:00, for a total of 368 independant spills.
- Tracking time for each spill was 3 days.
- The major components of the mass balance are shown above.
Time (Days)
3
0 0.5 1 1.5 2 2.5 30 0
200 200
400 400
600 600
800 800
1000 1000
1200 1200
Average on water
Average on shore
Average evaporated
Total
9.8 %
69.1 %
19.3 %

NOTES
DATE
CLIENT
PROJECT NO.V13203022
EBA-VANCOFFICE
DWN
October 24, 2013
JASAH
APVD REV0
ISSUED FOR REVIEW
Figure FR.3-9
TRANS MOUNTAIN OIL SPILL STUDY
24 Oct 2013 12:14:54T:\TMEP\working\AH\02-SPILLCALC\560-Stochastic_Fraser\Results_Summer\Tecplot\09-statistics_MB_2.lay
Stochastic SimulationSummer 2012, Site FR (1,250 m3)
Minor Components of the Mass Balance
-
CKD
STATUS
- Statistical results based on independent spills occuring every 6 hours from July 01 00:00to September 30 23:00, for a total of 368 independant spills.
- Tracking time for each spill was 3 days.
- The minor components of the mass balance are shown above.
Time (Days)
3
0 0.5 1 1.5 2 2.5 30 0
2 2
4 4
6 6
8 8
10 10
12 12
14 14
Average dispersed
Average biodegraded
Average OMAs
Average sunk
Average dissolved0.8 %
Dispersed: << 0.1 %OMAs : << 0.1 %
0.6 %
0.4 %

NOTES
DATE
CLIENT
PROJECT NO.V13203022
EBA-VANCOFFICE
DWN
October 24, 2013
JASAH
APVD REV0
ISSUED FOR REVIEW
Figure FR.3-10
TRANS MOUNTAIN OIL SPILL STUDY
24 Oct 2013 12:15:05T:\TMEP\working\AH\02-SPILLCALC\560-Stochastic_Fraser\Results_Summer\Tecplot\10-statistics_thk.lay
Stochastic SimulationSummer 2012, Site FR (1,250 m3)Statistics on Area and Thickness
-
CKD
STATUS
- Statistical results based on independent spills occuring every 6 hours from July 01 00:00to September 30 23:00, for a total of 368 independant spills.
- The average thickness is based on a full coverage of each grid cell that contains oil.
Time (days)
2
0 0.5 1 1.5 2 2.5 30
1
2
3
4
5
0
2000
4000
6000
8000
10000Average Area (km2)
Average thickness (microns)

CLIENT
PROJECT NO. DWN CHK APVD REV
DATEOFFICESTATUS
ISSUED FOR REVIEW
- The wind stick represent winds at Pitt Meadows.
- The bottom graph represents the Fraser River discharge at Hope.
V13203022 AH JAS JAS 0
October 2013 EBA-VANC
TRANS MOUNTAIN OIL SPILL STUDYNOTES
Environmental Conditions: Spring 2012 Site FR
Stochastic Modelling
Figure I.2-1
TRANS MOUNTAIN
Thu Oct 24 16:56:22 2013:V:\V13203022 Trans Mountain\working\AH\02-SPILLCALC\Tsplot
-10-8
-6-4
-20
24
6810
[m/s]
1Apr2 3 4 5 6 7 8 9 10 11 12 13 14 15 16 17 18 19 20 21 22 23 24 25 26 27 28 29
-10-8
-6-4
-20
24
6810
[m/s]
1May2 3 4 5 6 7 8 9 10 11 12 13 14 15 16 17 18 19 20 21 22 23 24 25 26 27 28 29 30
-10-8
-6-4
-20
24
6810
[m/s]
1Jun2 3 4 5 6 7 8 9 10 11 12 13 14 15 16 17 18 19 20 21 22 23 24 25 26 27 28 29
02000
4000
6000
8000
10000
12000
[m3/s]
02000
4000
6000
8000
10000
12000
[m3/s]
Oct
2011
Nov Dec Jan
2012
Feb Mar Apr May Jun Jul Aug Sep


NOTES
DATE
CLIENT
PROJECT NO.V13203022
EBA-VANCOFFICE
DWN
October 30, 2013
JASAH
APVD REV0
ISSUED FOR REVIEW
Figure FR.2-3
TRANS MOUNTAIN OIL SPILL STUDY
30 Oct 2013 09:11:03T:\TMEP\working\AH\02-SPILLCALC\560-Stochastic_Fraser\Results_Spring\Tecplot\03-shore_prob.lay
Stochastic SimulationSpring 2012, Site FR (1,250 m3)
Shoreline Oiled Probability
-
CKD
STATUS
- Statistical results based on independent spills occuring every 6 hours from April 01 00:00to June 30 23:00.
- Probability of oil presence is the percentage of simulations in which oil was present at a given location.
- Tracking time for each spill was 3 days.
Longitude
-124.00 -123.50 -123.00 -122.50
48.70
48.80
48.90
49.00
49.10
49.20
49.30
49.40
95
90
80
60
40
20
10
5
1
Probabilityfor Shoreto be Oiled
(%)
ReleaseLocation

NOTES
DATE
CLIENT
PROJECT NO.V13203022
EBA-VANCOFFICE
DWN
October 24, 2013
JASAH
APVD REV0
ISSUED FOR REVIEW
Figure FR.2-3
TRANS MOUNTAIN OIL SPILL STUDY
24 Oct 2013 11:41:47T:\TMEP\working\AH\02-SPILLCALC\560-Stochastic_Fraser\Results_Spring\Tecplot\03-shore_prob.lay
Stochastic SimulationSpring 2012, Site FR (1,250 m3)
Shoreline Oiled Probability
-
CKD
STATUS
- Statistical results based on independent spills occuring every 6 hours from April 01 00:00to June 30 23:00, for a total of 364 independant spills.
- Probability of oil presence is the percentage of simulations in which oil was present at a given location.
- Tracking time for each spill was 3 days.
Longitude
-123.30 -123.20 -123.10 -123.00 -122.90 -122.80
49.05
49.10
49.15
49.20
49.25
95
90
80
60
40
20
10
5
1
Probabilityfor Shoreto be Oiled
(%)
ReleaseLocation

NOTES
DATE
CLIENT
PROJECT NO.V13203022
EBA-VANCOFFICE
DWN
October 24, 2013
JASAH
APVD REV0
ISSUED FOR REVIEW
Figure FR.2-4
TRANS MOUNTAIN OIL SPILL STUDY
24 Oct 2013 11:42:00T:\TMEP\working\AH\02-SPILLCALC\560-Stochastic_Fraser\Results_Spring\Tecplot\04-shore_firstcontact.lay
Stochastic SimulationSpring 2012, Site FR (1,250 m3)Shoreline Time to First Contact
-
CKD
STATUS
- Statistical results based on independent spills occuring every 6 hours from April 01 00:00to June 30 23:00, for a total of 364 independant spills.
- Time to first contact is the minimum time, over all simulations, for oil to reach a given shore segment.
- Tracking time for each spill was 3 days.
Longitude
-123.20 -123.00 -122.80
49.05
49.10
49.15
49.20
49.25
3.0
2.5
2.0
1.5
1.0
0.5
0.0
Time to FirstContact(days)
ReleaseLocation

NOTES
DATE
CLIENT
PROJECT NO.V13203022
EBA-VANCOFFICE
DWN
October 24, 2013
JASAH
APVD REV0
ISSUED FOR REVIEW
Figure FR.2-5
TRANS MOUNTAIN OIL SPILL STUDY
24 Oct 2013 11:42:13T:\TMEP\working\AH\02-SPILLCALC\560-Stochastic_Fraser\Results_Spring\Tecplot\05-shore_km.lay
Stochastic SimulationSpring 2012, Site FR (1,250 m3)Length of Shoreline Contacted
-
CKD
STATUS
- Statistical results based on independent spills occuring every 6 hours from April 01 00:00to June 30 23:00, for a total of 364 independant spills.
- Tracking time for each spill was 3 days.

NOTES
DATE
CLIENT
PROJECT NO.V13203022
EBA-VANCOFFICE
DWN
October 24, 2013
JASAH
APVD REV0
ISSUED FOR REVIEW
Figure FR.2-6
TRANS MOUNTAIN OIL SPILL STUDY
24 Oct 2013 11:42:29T:\TMEP\working\AH\02-SPILLCALC\560-Stochastic_Fraser\Results_Spring\Tecplot\06-shore_class_km.lay
Stochastic Simulation - Spring 2012Site FR (1,250 m3): Length of
Shoreline Contacted Per Coastal Class
-
CKD
STATUS
- Statistical results based on independent spills occuring every 6 hours from April 01 00:00to June 30 23:00, for a total of 364 independant spills.
- Tracking time for each spill was 3 days.

NOTES
DATE
CLIENT
PROJECT NO.V13203022
EBA-VANCOFFICE
DWN
October 24, 2013
JASAH
APVD REV0
ISSUED FOR REVIEW
Figure FR.2-7
TRANS MOUNTAIN OIL SPILL STUDY
24 Oct 2013 11:42:43T:\TMEP\working\AH\02-SPILLCALC\560-Stochastic_Fraser\Results_Spring\Tecplot\07-dissolution_TS.lay
Stochastic SimulationSpring 2012, Site FR (1,250 m3)
Amount of Dissolved Oil
-
CKD
STATUS
- Statistical results based on independent spills occuring every 6 hours from April 01 00:00to June 30 23:00, for a total of 364 independant spills.
- Tracking time for each spill was 3 days.

NOTES
DATE
CLIENT
PROJECT NO.V13203022
EBA-VANCOFFICE
DWN
October 24, 2013
JASAH
APVD REV0
ISSUED FOR REVIEW
Figure FR.2-8
TRANS MOUNTAIN OIL SPILL STUDY
24 Oct 2013 12:08:25T:\TMEP\working\AH\02-SPILLCALC\560-Stochastic_Fraser\Results_Spring\Tecplot\08-statistics_MB_1.lay
Stochastic SimulationSpring 2012, Site FR (1,250 m3)
Major Components of the Mass Balance
-
CKD
STATUS
- Statistical results based on independent spills occuring every 6 hours from April 01 00:00to June 30 23:00, for a total of 364 independant spills.
- Tracking time for each spill was 3 days.
- The major components of the mass balance are shown above.
Time (Days)
3
0 0.5 1 1.5 2 2.5 30 0
200 200
400 400
600 600
800 800
1000 1000
1200 1200
Average on water
Average on shore
Average evaporated
Total
8.8 %
58.7 %
30.7 %

NOTES
DATE
CLIENT
PROJECT NO.V13203022
EBA-VANCOFFICE
DWN
October 24, 2013
JASAH
APVD REV0
ISSUED FOR REVIEW
Figure FR.2-9
TRANS MOUNTAIN OIL SPILL STUDY
24 Oct 2013 12:08:01T:\TMEP\working\AH\02-SPILLCALC\560-Stochastic_Fraser\Results_Spring\Tecplot\09-statistics_MB_2.lay
Stochastic SimulationSpring 2012, Site FR (1,250 m3)
Minor Components of the Mass Balance
-
CKD
STATUS
- Statistical results based on independent spills occuring every 6 hours from April 01 00:00to June 30 23:00, for a total of 364 independant spills.
- Tracking time for each spill was 3 days.
- The minor components of the mass balance are shown above.
Time (Days)
3
0 0.5 1 1.5 2 2.5 30 0
2 2
4 4
6 6
8 8
10 10
12 12
14 14
Average dispersed
Average biodegraded
Average OMAs
Average sunk
Average dissolved
1.0 %
Dispersed: << 0.1 %OMAs : << 0.1 %
0.5 %
0.3 %

NOTES
DATE
CLIENT
PROJECT NO.V13203022
EBA-VANCOFFICE
DWN
October 24, 2013
JASAH
APVD REV0
ISSUED FOR REVIEW
Figure FR.2-10
TRANS MOUNTAIN OIL SPILL STUDY
24 Oct 2013 12:07:46T:\TMEP\working\AH\02-SPILLCALC\560-Stochastic_Fraser\Results_Spring\Tecplot\10-statistics_thk.lay
Stochastic SimulationSpring 2012, Site FR (1,250 m3)
Statistics on Area and Thickness
-
CKD
STATUS
- Statistical results based on independent spills occuring every 6 hours from April 01 00:00to June 30 23:00, for a total of 364 independant spills.
- The average thickness is based on a full coverage of each grid cell that contains oil.
Time (days)
2
0 0.5 1 1.5 2 2.5 30
1
2
3
4
5
0
2000
4000
6000
8000
10000Average Area (km2)
Average thickness (microns)

CLIENT
PROJECT NO. DWN CHK APVD REV
DATEOFFICESTATUS
ISSUED FOR REVIEW
- The wind stick represent winds at Pitt Meadows.
- The bottom graph represents the Fraser River discharge at Hope.
V13203022 AH JAS JAS 0
October 2013 EBA-VANC
TRANS MOUNTAIN OIL SPILL STUDYNOTES
Environmental Conditions: Fall 2011 Site FR
Stochastic Modelling
Figure I.4-1
TRANS MOUNTAIN
Thu Oct 24 16:54:15 2013:V:\V13203022 Trans Mountain\working\AH\02-SPILLCALC\Tsplot
-10-8
-6-4
-20
24
6810
[m/s]
1Oct2 3 4 5 6 7 8 9 10 11 12 13 14 15 16 17 18 19 20 21 22 23 24 25 26 27 28 29 30
-10-8
-6-4
-20
24
6810
[m/s]
1Nov2 3 4 5 6 7 8 9 10 11 12 13 14 15 16 17 18 19 20 21 22 23 24 25 26 27 28 29
-10-8
-6-4
-20
24
6810
[m/s]
1Dec2 3 4 5 6 7 8 9 10 11 12 13 14 15 16 17 18 19 20 21 22 23 24 25 26 27 28 29 30
02000
4000
6000
8000
10000
12000
[m3/s]
02000
4000
6000
8000
10000
12000
[m3/s]
Oct
2011
Nov Dec Jan
2012
Feb Mar Apr May Jun Jul Aug Sep


NOTES
DATE
CLIENT
PROJECT NO.V13203022
EBA-VANCOFFICE
DWN
October 24, 2013
JASAH
APVD REV0
ISSUED FOR REVIEW
Figure FR.4-3
TRANS MOUNTAIN OIL SPILL STUDY
24 Oct 2013 14:16:00T:\TMEP\working\AH\02-SPILLCALC\560-Stochastic_Fraser\Results_Fall\Tecplot\03-shore_prob.lay
Stochastic SimulationFall 2011, Site FR (1,250 m3)Shoreline Oiled Probability
-
CKD
STATUS
- Statistical results based on independent spills occuring every 6 hours fromOctober 01 00:00to December 31 23:00, for a total of 368 independant spills.
- Probability of oil presence is the percentage of simulations in which oil was present at a given location.
- Tracking time for each spill was 3 days.
Longitude
-123.30 -123.20 -123.10 -123.00 -122.90 -122.80
49.05
49.10
49.15
49.20
49.25
95
90
80
60
40
20
10
5
1
Probabilityfor Shoreto be Oiled
(%)
ReleaseLocation

NOTES
DATE
CLIENT
PROJECT NO.V13203022
EBA-VANCOFFICE
DWN
October 24, 2013
JASAH
APVD REV0
ISSUED FOR REVIEW
Figure FR.4-4
TRANS MOUNTAIN OIL SPILL STUDY
24 Oct 2013 14:15:42T:\TMEP\working\AH\02-SPILLCALC\560-Stochastic_Fraser\Results_Fall\Tecplot\04-shore_firstcontact.lay
Stochastic SimulationFall 2011, Site FR (1,250 m3)
Shoreline Time to First Contact
-
CKD
STATUS
- Statistical results based on independent spills occuring every 6 hours fromOctober 01 00:00to December 31 23:00, for a total of 368 independant spills.
- Time to first contact is the minimum time, over all simulations, for oil to reach a given shore segment.
- Tracking time for each spill was 3 days.
Longitude
-123.20 -123.00 -122.80
49.05
49.10
49.15
49.20
49.25
3.0
2.5
2.0
1.5
1.0
0.5
0.0
Time to FirstContact(days)
ReleaseLocation

NOTES
DATE
CLIENT
PROJECT NO.V13203022
EBA-VANCOFFICE
DWN
October 24, 2013
JASAH
APVD REV0
ISSUED FOR REVIEW
Figure FR.4-5
TRANS MOUNTAIN OIL SPILL STUDY
24 Oct 2013 14:15:27T:\TMEP\working\AH\02-SPILLCALC\560-Stochastic_Fraser\Results_Fall\Tecplot\05-shore_km.lay
Stochastic SimulationFall 2011, Site FR (1,250 m3)
Length of Shoreline Contacted
-
CKD
STATUS
- Statistical results based on independent spills occuring every 6 hours fromOctober 01 00:00to December 31 23:00, for a total of 368 independant spills.
- Tracking time for each spill was 3 days.

NOTES
DATE
CLIENT
PROJECT NO.�13203022
���-����OFFICE
DWN
October 2�, 2013
��S��
APVD REV0
ISSUED FOR REVIEW
Figure FR.4-6
TRANS MOUNTAIN OIL SPILL STUDY
24 Oct 2013 14:15:14T:\TMEP\working\AH\02-SPILLCALC\560-Stochastic_Fraser\Results_Fall\Tecplot\06-shore_class_km.lay
Stochastic Simulation - Fall 2011Site FR (1,250 m3): Length of
Shoreline Contacted Per Coastal Class
-
CKD
STATUS
- Statistical results based on independent spills occuring every 6 hours fromOctober 01 00:00to December 31 23:00, for a total of 368 independant spills.
- Tracking time for each spill was 3 days.

NOTES
DATE
CLIENT
PROJECT NO.�13203022
���-����OFFICE
DWN
October 2�, 2013
��S��
APVD REV0
ISSUED FOR REVIEW
Figure FR.4-7
TRANS MOUNTAIN OIL SPILL STUDY
24 Oct 2013 14:14:59T:\TMEP\working\AH\02-SPILLCALC\560-Stochastic_Fraser\Results_Fall\Tecplot\07-dissolution_TS.lay
Stochastic SimulationFall 2011, Site FR (1,250 m3)
Amount of Dissolved Oil
-
CKD
STATUS
- Statistical results based on independent spills occuring every 6 hours from October 01 00:00to December 31 23:00, for a total of 368 independant spills.
- Tracking time for each spill was 3 days.

NOTES
DATE
CLIENT
PROJECT NO.�13203022
���-����OFFICE
DWN
October 2�, 2013
��S��
APVD REV0
ISSUED FOR REVIEW
Figure FR.4-8
TRANS MOUNTAIN OIL SPILL STUDY
24 Oct 2013 14:14:40T:\TMEP\working\AH\02-SPILLCALC\560-Stochastic_Fraser\Results_Fall\Tecplot\08-statistics_MB_1.lay
Stochastic SimulationFall 2011, Site FR (1,250 m3)
Major Components of the Mass Balance
-
CKD
STATUS
- Statistical results based on independent spills occuring every 6 hours from October 01 00:00to December 31 23:00, for a total of 368 independant spills.
- Tracking time for each spill was 3 days.
- The ma�or components of the mass balance are shown above.
Time (Days)
3
0 0.� 1 1.� 2 2.� 30 0
200 200
�00 �00
600 600
800 800
1000 1000
1200 1200
Average on water
Average on shore
Average evaporated
Total
�.��
83.1 �
10.��

NOTES
DATE
CLIENT
PROJECT NO.�13203022
���-����OFFICE
DWN
October 2�, 2013
��S��
APVD REV0
ISSUED FOR REVIEW
Figure FR.4-9
TRANS MOUNTAIN OIL SPILL STUDY
24 Oct 2013 14:14:25T:\TMEP\working\AH\02-SPILLCALC\560-Stochastic_Fraser\Results_Fall\Tecplot\09-statistics_MB_2.lay
Stochastic SimulationFall 2011, Site FR (1,250 m3)
Minor Components of the Mass Balance
-
CKD
STATUS
- Statistical results based on independent spills occuring every 6 hours from October 01 00:00to December 31 23:00, for a total of 368 independant spills.
- Tracking time for each spill was 3 days.
- The minor components of the mass balance are shown above.
Time (Days)
3
0 0.� 1 1.� 2 2.� 30 0
2 2
� �
6 6
8 8
10 10
12 12
1� 1�
Average dispersed
Average biodegraded
Average OMAs
Average sunk
Average dissolved
0.7 %
Dispersed: << 0.1 %OMAs : << 0.1 %
0.6 %
0.4 %

NOTES
DATE
CLIENT
PROJECT NO.�13203022
���-����OFFICE
DWN
October 2�, 2013
��S��
APVD REV0
ISSUED FOR REVIEW
Figure FR.4-10
TRANS MOUNTAIN OIL SPILL STUDY
24 Oct 2013 14:12:14T:\TMEP\working\AH\02-SPILLCALC\560-Stochastic_Fraser\Results_Fall\Tecplot\10-statistics_thk.lay
Stochastic SimulationFall 2011, Site FR (1,250 m3)
Statistics on Area and Thickness
-
CKD
STATUS
- Statistical results based on independent spills occuring every 6 hours fromOctober 01 00:00to December 31 23:00, for a total of 368 independant spills.
- The average thickness is based on a full coverage of each grid cell that contains oil.
Time (days)
2
0 0.� 1 1.� 2 2.� 30
1
2
3
�
�
0
2000
�000
6000
8000
10000Average Area (km2)
Average thickness (microns)

Trans Mountain Pipeline ULC Volume 7, Pipeline Facilities Technical Reports Trans Mountain Expansion Project Qualitative Ecological Risk Assessment of
Pipeline Spills Technical Report
December, 2013 REP-NEB-TERA-00019
Page C
Appendix C: Recovery Assessment

Trans Mountain Pipeline ULC Volume 7, Pipeline Facilities Technical Reports Trans Mountain Expansion Project Qualitative Ecological Risk Assessment of
Pipeline Spills Technical Report
December, 2013 REP-NEB-TERA-00019
Page C.1-1
C.1. Recovery Assessment
The objective of the Recovery Assessment is to assess the likelihood of recovery of ecosystem components or ecological receptors in the event of an accidental pipeline release of heavy crude oil as a result of the Project. The definition of recovery after an oil spill is subject to interpretation. Science and policy must be integrated to define desirable system endpoints. For the purposes of this report, the definition of recovery used is the return of the ecosystem component or ecological receptor to a state that “would have been” if the spill had not occurred.
Previous studies on the recovery of the freshwater environment after an oil spill provide a basis for evaluating the likelihood of recovery following a hypothetical pipeline spill resulting from the Project. Similar to the approach described in the Exposure Assessment (Section 6.2), a literature review was conducted to identify and acquire information on the recovery of the freshwater environment for simulated and actual oil spills. From the scientific literature in peer reviewed journals, government reports and technical documents, case studies of oil releases were selected using the following set of criteria:
Occurred in a freshwater environment Located in a cold temperate zone or subarctic location Spilled oil had similar physical and chemical properties as the product assessed in the ERA
For each case study, an effort was made to collect the following information:
Which ecological receptors were affected? What was the reported effect? Was recovery reported? If the ecological receptor recovered, what processes were involved? Were there obstacles or complicating factors that impeded recovery? Were there attempts to intervene to accelerate recovery? How long did the recovery take?
While it was not possible to match all three of the desired criteria for each case study, each case study was considered to have relevance to the Project (Table C.1). The Recovery Assessment is organized to evaluate recovery potential and timelines using the same ecosystem components and ecological receptors as for the Effects Assessment.
TABLE C.1 CASE STUDIES SELECTED IN THE ASSESSMENT OF THE RECOVERY OF THE FRESHWATER ENVIRONMENT AFTER AN OIL SPILL
Oil Spill Location Year Release Platform Oil Type Volume
(m3)
Northern Gateway Project Alberta/British Columbia,
Canada
N/A (Oil Spill
Simulations)
Pipeline Full-bore Ruptures
Diluted Bitumen, Synthetic Oil, Condensate
Various
Kalamazoo River Michigan, USA 2010 Pipeline Full-bore
Rupture Diluted Bitumen 3,200
Wabamun Lake Alberta, Canada 2005 Rail Accident Bunker “C” 712
East Walker River California/Nevada, USA 2000 Truck Accident Bunker “C” 14
Pine River British Columbia, Canada 2000 Pipeline Full-bore
Rupture Light Crude 985
Yellowstone River Montana, USA 2011 Pipeline Full-bore
Rupture Light Crude 240
OSSA II Bolivia, South America 2000 Pipeline Full-bore
Rupture Mixed Crude 4,611
DM 932 Louisiana, USA 2008 Barge Accident Bunker “C” 1,070

Trans Mountain Pipeline ULC Volume 7, Pipeline Facilities Technical Reports Trans Mountain Expansion Project Qualitative Ecological Risk Assessment of
Pipeline Spills Technical Report
December, 2013 REP-NEB-TERA-00019
Page C.1-2
C.1.1. Water Quality
After an oil spill in the aquatic environment, evaporation of the volatile components and dispersion of oil into the water column removes oil from the water surface. Once in the water column, oil has three general fates: first, hydrocarbons dissolve or are entrained in the water column to be diluted and degraded by microbial action; second, droplets dispersed by waves or turbulent conditions may coalesce into larger droplets and float back to the water surface; or third, dispersed oil droplets may accumulate suspended particulate matter in the water column becoming submerged oil, or sinking to the sediments.
Modelling conducted for the Enbridge Northern Gateway Project found that after the acute phase of a spill (days to 2 weeks), hydrocarbon concentrations in river water rapidly declined so that they would not be expected to cause acute or chronic effects to aquatic biota (Stantec et al. 2012). Water quality in larger rivers recovered faster than smaller rivers, which were more affected by chronic residual hydrocarbon concentrations. The highest chronic TPH concentration in river water (0.16 mg/L) was predicted for a release of synthetic oil into Crooked River under a high flow conditions at a distance of 3.9 km downstream from the spill location. Due to its higher viscosity and greater resistance to dispersion, spilled diluted bitumen resulted in lower predicted chronic hydrocarbon concentrations in river water than synthetic oil.
The Kalamazoo River oil spill in July 2010 released approximately 3,200 m3 of heavy crude oil (primarily a CLWB) into the Kalamazoo River under turbulent conditions, which resulted in high rates of entrainment into the water column. Within two months of the spill thousands of surface water samples had been collected and analyzed. The majority of these samples showed non-detectable concentrations of hydrocarbon constituents. Only the following chemicals exceeded applicable human health-based guidelines (Michigan Department of Community Health [MDCH] 2013), and it was by no means certain that the spilled oil was the source of the detected chemicals:
1,2,4-Trimethylbenzene (2 out of 1,686 samples) Benzo(a)anthracene (1 out of 1,957 samples) Benzo(a)pyrene (2 out of 1,957 samples) Bis(2-ethylhexyl)phthalate (30 out of 1,671 samples) Chromium (25 out of 1,425 samples) Chrysene (1 out of 1,957 samples) Lead (2 out of 1,098 samples) n-Nitrosodi-n-propylamine (1 out of 1,671 samples).
Samples collected up to five months after the spill (i.e., October through December 2010) were all below applicable guidelines (MDCH 2013). Two samples collected one year after the spill (May to August 2011) were above guidelines for benzo(a)pyrene; however, results indicate that overall water quality had recovered within five months after the spill.
Following the August 2005 Wabamun Lake oil spill, notwithstanding the initial distribution of oil on the water surface and tar balls in near-shore areas, monitoring of water quality in the lake found few indications of hydrocarbon contamination in the water column within six weeks. Overall, the water in the open water area of the lake was reported not to be contaminated with spilled hydrocarbons or heavy metals (Anderson 2006).
Immediately after the December 2000 release of Bunker “C” fuel oil into the East Walker River, water sampling revealed TPAH concentrations in the river that were greater than toxicity thresholds for developmental effects on fish embryos (one sample recording 4.9 µg/L and another recording 1.4 µg/L). However, within five months (May 2001), dissolved TPAH in the water column had decreased to near background concentrations; the highest reported concentration was 0.035 µg/L (Higgins 2002).
Following the August 2000 release of light crude oil into the Pine River, analytical results from surface water samples showed that water quality had returned to pre-spill conditions within three weeks after the

Trans Mountain Pipeline ULC Volume 7, Pipeline Facilities Technical Reports Trans Mountain Expansion Project Qualitative Ecological Risk Assessment of
Pipeline Spills Technical Report
December, 2013 REP-NEB-TERA-00019
Page C.1-3
spill (de Pennart et al. 2004). In addition, fish were reported to be returning to the main stem of the river within two weeks of the spill (BC MOE 2000b).
Surface water samples collected in the days following the July 2011 Yellowstone River spill showed there were no petroleum-related compounds remaining in the water (USEPA 2011a). These results were expected given the high flow conditions and rapid initial weathering of the oil. As of November 9, 2011, surface water samples from 164 locations were collected by the USEPA, Montana Department of Environmental Quality and ExxonMobil. With few exceptions, all samples were “non-detect” or below applicable water quality standards or screening levels for petroleum hydrocarbons (MDEQ 2013). In addition, operators of downstream public drinking water systems, which drew water from the river, were notified of the spill; however, monitoring and testing of the water supply systems did not identify any exceedances of drinking water standards (USEPA 2011d).
Water samples collected from the Rio Desaguadero after the January 2000 release of mixed heavy crude oil and diluent from the OSSA II pipeline showed no detectable concentrations of hydrocarbons within one month of the spill (Henshaw et al. 2001), indicating that water quality had recovered from the release.
Following the July 2008 collision of a chemical tanker with the DM 932 fuel barge, the Mississippi River was closed to vessel traffic. For the protection of human health, downstream drinking water intakes were closed; however, all drinking water intakes were reopened by July 30 (USFWS 2009), indicating that water quality was below applicable human health-based guidelines.
The evidence shows that water quality typically recovers within days to weeks following an oil spill to inland waters.
C.1.2. Sediment Quality
Hydrocarbons are hydrophobic and partition strongly between water and other available non-polar media, including sediment organic matter. Once dispersed in the water column, oil droplets may accumulate enough suspended particulate matter to become as dense as, or denser than water, becoming submerged oil. Sedimentation results when this oil settles out of the water column onto the riverbed, usually in quiescent areas of silty sediment. Contaminated sediments have the potential to negatively affect water quality in sediment pore water, which can affect benthic invertebrates, rooted aquatic plants, and developing fish eggs. Oil can also re-contaminate the water, if the sediment is disturbed.
Modelling results for the Enbridge Northern Gateway Project show that hydrocarbon concentrations in sediment vary greatly as a function of distance from the release; river size (small or low-gradient rivers generally experience greater oil sedimentation than larger or high-gradient rivers); sediment characteristics (high organic content and fine-grained sediments trap and retain more hydrocarbons); and oil type (diluted bitumen and synthetic oil were both predicted to have the potential to load heavily to sediments) (Stantec et al. 2012).
Modelling conducted by Stantec et al. (2012) was completed without taking credit for hydrocarbon containment or recovery during the acute phase of spill modelling, although removal of visible oil on shorelines was assumed during the chronic assessment of spills. The highest hydrocarbon concentrations in sediment were predicted for a release of diluted bitumen into Crooked River under low flow conditions. Very high loadings to sediment were forecast, with concentrations ranging from 430,000 mg/kg at 4 weeks to 270,000 mg/kg at one to two years post release (Stantec et al. 2012). The Crooked River represents an extreme case of slow flowing water and organic sediments, such that oil that sank to the sediments was retained, similar to the situation observed in Talmadge Creek following the Kalamazoo River oil spill. Such residual hydrocarbon contamination would require intensive remedial action. Importantly, however, deposition of hydrocarbons to sediment in other aquatic habitats (e.g., flowing waters with gravel or cobble substrates) was estimated to be low, rarely exceeding toxicity thresholds for developing fish eggs and embryos, and recovering within weeks to a few months due to weathering out of more soluble hydrocarbon constituents.

Trans Mountain Pipeline ULC Volume 7, Pipeline Facilities Technical Reports Trans Mountain Expansion Project Qualitative Ecological Risk Assessment of
Pipeline Spills Technical Report
December, 2013 REP-NEB-TERA-00019
Page C.1-4
Weathering of the crude oil released in the Kalamazoo River oil spill resulted in sedimentation of a portion of the released oil in both Talmadge Creek and the Kalamazoo River. In Talmadge Creek, extensive removal of sediment in 2011 removed most if not all of the oil (Enbridge 2013b). In the Kalamazoo River, as the unrecovered oil was transported downstream in the water column, a portion of it incorporated suspended sediments. This oil became part of the river bedload, and was transported toward geomorphological traps in the riverbed, such as silt deposits near in-stream dams (Enbridge 2013b). As of June 2013, the USEPA (2013) estimated that approximately 680,000 litres (180,000 gallons) of submerged oil remained in the river bottom sediment, although this estimate seems improbably large in light of other mass balance estimates of the fate of the spilled oil. Removal of the recoverable portion (approximately 45,000-68,000 litres or 12,000-18,000 gallons) was ordered, principally in relation to the headponds of the Ceresco and Morrow dams. Removal of the remainder was considered likely to result in substantial further damage to the river, so it was to be left in place and monitored (USEPA 2013).
Following the release of Bunker “C” fuel oil into Wabamun Lake in August 2005, the released oil formed tar balls and other aggregates instead of incorporating into the lakebed sediment. Consequently, sediments beneath the open water portions of Wabamun Lake were reported not to have been contaminated with petroleum hydrocarbons, and to be similar in quality to concentrations measured shortly before the spill, or in 2002 (Anderson 2006). In contrast, tarballs and more finely divided oil particles tended to accumulate in reedbeds, where presumably the natural water circulation of the lake was weakest.
Eleven days following the December 30, 2000, East Walker River oil spill, TPAH concentrations measured in sediments ranged from 0.034 to 0.26 mg/kg. Measured concentrations increased substantially in March 2001 (three months after the spill), ranging from 1.3 to 4.6 mg/kg, a phenomenon that was attributed to warming water temperatures and increasing mobilization of the Bunker “C” type oil, which solidified at low temperature. However, by May, 2001 (five months after the spill), measured concentrations ranged from 0.025 to 1.7 mg/kg, and were generally below levels of concern (Higgins 2002).
Clean-up efforts over two months recovered most of the oil released into the Pine River in August 2000, with approximately 450 m3 removed from the river and 415 m3 removed with contaminated soil. Despite the effective recovery action, approximately 80 m3 of the oil, with an uncertainty range of 48 to 113 m3 remained unaccounted for (BC MOE 2013b, Goldberg 2011). Most of this unaccounted oil was considered likely to be located in river sediments or trapped in woody debris dams within the river. Two years after the August 2000 oil spill in Pine River, although concentrations had decreased over time, hydrocarbons were still detectable in river sediments (de Pennart et al. 2004).
Within four months after the July 2011 release of light crude oil in Yellowstone River, sediment samples collected from 146 locations were collected by the USEPA, Montana Department of Environmental Quality and ExxonMobil. With few exceptions, all samples were “non-detect” or below applicable standards or screening levels for petroleum hydrocarbons (MDEQ 2013). These results were expected given the high flow conditions and rapid initial weathering of the oil.
Following the January 2000 release of mixed crude oils into the Rio Desaguadero, sediment samples collected within five months of the spill showed no detectable concentrations of hydrocarbons, except where oil was clearly deposited along strand lines (Henshaw et al. 2001). Upon release, high flows resulted in extremely turbulent flow conditions, under which some of the oil would have been transported downstream on the surface, and some would have been entrained in the water column, likely as dispersed droplets (Lee et al. 2002). A budget of the fate of the oil indicated that the loss of oil due to evaporation, dissolution and other weathering and degradation processes was on the order of 60% of the total amount spilled (Douglas et al. 2002), leaving approximately 1,844 m3 of weathered oil to account for. Of this, some 1,236 to 1,723 m3 could not be accounted for in a conventional mass balance. It was concluded, based on additional confirmatory research, that formation of OMAs likely dispersed a large amount of the spilled crude oil, and enhanced the biodegradation of this oil. The Rio Desaguadero is a brackish system, with very high suspended sediment loads. These factors would facilitate the formation of OMAs (Lee et al. 2001, 2002).

Trans Mountain Pipeline ULC Volume 7, Pipeline Facilities Technical Reports Trans Mountain Expansion Project Qualitative Ecological Risk Assessment of
Pipeline Spills Technical Report
December, 2013 REP-NEB-TERA-00019
Page C.1-5
Information with respect to hydrocarbon concentrations in sediments after the DM 932 oil spill in July 2008 could not be located. However, five days after the spill occurred, routine dredging operations at the Head of Passes were halted upon the discovery of sunken oil in the dredged material (NOAA 2008, USFWS 2009). The high viscosity and low volatile content of the released oil (Bunker “C”) caused it to persist in the environment, rather than evaporate. The overall mass balance for the oil suggested that 11% was lost to evaporation, 86% was recovered, and 2.5% of the oil remained unaccounted for in the environment (Danchuk 2009). It was determined that the oil likely interacted with suspended sediments to form OMA and small tar balls, which facilitated its dispersion and biodegradation (Danchuk 2009).
The evidence shows that oil can persist in aquatic sediments when deposited in slow moving areas of water, in silty sediments. Physical recovery of such oil is usually the preferred option. Formation of OMA can increase the density of oil droplets in the water, increasing the fraction that sinks, but OMA formation is not usually a major process in inland oil spills due to limiting low salinity values, or limiting suspended sediment concentrations, or both. OMA formation also has potential benefits as it maintains the dispersed characteristic of affected oil, and enhances rates of biodegradation. Relatively little oil appears to become entrained into riverbed gravels, and such oil remains subject to weathering as water passes through the gravels, so that recovery of lightly or moderately oiled substrates will occur over a period of weeks to months.
C.1.3. Soil Quality
As oil slicks come into contact with shorelines and floodplains, a portion of the oil may become stranded on shoreline soils. When oil comes into contact with soil, it interacts with the soil matrix in a number of ways, which can result in deleterious effects to soil biota. In addition to being toxic via direct contact with plants, invertebrates and microbes, the oil also has the potential to:
Occupy the pore space between the soil particles, excluding air and water Coat soil particles and create a hydrophobic layer that prevents the absorption and retention of water Retard the exchange of air and water within the soil matrix, leaving the soil deficient in both of these
components, along with the nutrients that would otherwise be leached into the soil from the surface Increase the carbon content of the soil and subsequently promote microbial growth that depletes
oxygen and available nutrients.
Modelling results for the Enbridge Northern Gateway Project show that oiling of shorelines would likely result in acute effects to shoreline vegetation and soil invertebrates. After the acute phase of the spill (days to 2 weeks), it was assumed that visible oiling on shorelines would be cleaned-up, reducing the initial total hydrocarbon loading to shoreline soils to a maximum of 1,000 g/m2. Results found that weathering of hydrocarbons resulted in decreasing TPH concentrations in shoreline soils after 1 to 2 years (Stantec et al. 2012).
Following the 2010 release of crude oil into Talmadge Creek and the Kalamazoo River, oil and visually affected soils were excavated from the source area and along riverbanks. Contaminated soils were removed, clean organic soils were backfilled into excavated areas, and soil erosion controls were implemented (Enbridge 2011). Although mat roads were used in sensitive areas, temporary roads and heavy equipment movement may have resulted in soil compaction (Enbridge 2011). In Talmadge Creek, soil confirmation samples were collected in the interim restoration areas: 19 out of 465 samples exceeded applicable criteria for VOCs, PAH, and TPH (Enbridge 2011). As of April 2013, residual oil still resided in overbank soil; however, acute toxicity studies concluded that the residual oil was nontoxic (Enbridge 2013a).
The August 2005 train derailment near Wabamun Lake resulted in the release of warm (from recent loading) Bunker “C” fuel oil from the tank cars onto lawns of cottages adjacent to Wabamun Lake. The oil flowed into the lake along many paths along a front approximately 0.5 km wide, picking up various materials (e.g., grass, insects) along the way (Fingas et al. 2006). Soils along these flowpaths were subject to excavation and replacement with clean soil.

Trans Mountain Pipeline ULC Volume 7, Pipeline Facilities Technical Reports Trans Mountain Expansion Project Qualitative Ecological Risk Assessment of
Pipeline Spills Technical Report
December, 2013 REP-NEB-TERA-00019
Page C.1-6
It was reported that the Bunker “C” fuel oil released from the DM 932 did not strand substantially along the mud and sand shorelines of Mississippi River, nor did the oil penetrate into these substrates due to their water saturation (Danchuk 2009). However, riprap along the shorelines provided opportunities for trapping of the oil due to the crevices between rocks, and oil droplets and globules to become absorbed to shoreline vegetation (Danchuk 2009).
No information was available with respect to the effects of the East Walker River; however, as a result of winter, low flow would have minimized contact between the oil and riparian soils.
The evidence shows that although weathering processes decrease hydrocarbon concentrations over time, hydrocarbon residues can persist in soils for years. Physical removal of oil saturated soils and replacement with clean fill is usually the preferred option; with surface removal of oily residues where oil has not penetrated deeply, also preferred. These physical remediation practices promote shorter recovery times for shoreline and riparian environments.
C.1.4. Aquatic Vegetation
A hydrocarbon spill into a water body may result in effects to aquatic vegetation. Hydrocarbons have the potential to affect aquatic vegetation by:
Physically smothering plants Exposing them to acute or chronic toxicity Altering habitat.
Modelling results for the Enbridge Northern Gateway Project show that aquatic biota (i.e., fish, amphibian, aquatic invertebrate and aquatic plant communities) are subject to toxicity during the acute phase of hydrocarbon spills. However, after the initial phase of the spill (a few days to 2 weeks), hydrocarbon concentrations in river water decrease to levels that would not be expected to cause chronic effects to aquatic life (Stantec et al. 2012). Chronic effects on aquatic plants were not directly assessed due to a lack of chronic toxicity information. Instead, it was assumed that while those portions of aquatic plants that can be directly exposed to hydrocarbons are susceptible to being killed (i.e., an acute effect), below-ground roots and rhizomes would generally be capable of surviving and sending out new shoots. Aquatic plant communities would also be able to restore themselves from other nearby sources of seed or vegetative propagules.
The release of crude oil in the Kalamazoo River oil spill resulted in negative effects to aquatic vegetation, particularly in the impoundments (i.e., Ceresco, Mill Pond Dam, and Morrow Lake) where submerged oil affected submerged vegetation (Enbridge 2013a). Clean-up activities included the cutting of submerged vegetation when the risk of oiled vegetation contaminating wildlife was greater than the value of the vegetation and there was no less destructive method to remove or reduce risk to acceptable levels (Enbridge 2013a). Vegetation was cut below the water surface and roots were left to allow regrowth.
As of June 2013, the USEPA (2013) estimated that approximately 680,000 litres (180,000 gallons) of submerged oil remained in the river bottom sediment and ordered the removal of the recoverable portion (approximately 45,000-68,000 litres or 12,000-18,000 gallons), principally in relation to the headponds of the Ceresco and Morrow dams. Removal of the remainder would result in substantial damage to the river; therefore, it was to be left in place and monitored (USEPA 2013). It is possible that the submerged oil left in situ is resulting in chronic effects to aquatic vegetation either through toxic effects or smothering.
Following the August 2005 Wabamun Lake train derailment, much of the Bunker “C” fuel oil became entrained in the abundant reed beds (Schoenoplectus tabernaemontani) in the eastern basin of the lake. As such, clean-up activities included cutting of the vegetation and vacuum removal of submerged tar balls entrained in the reed bed detritus (Wernick et al. 2009). A two year study was conducted to assess regrowth. The study found that exposure to the oil, which was spilled in the late growing season, did not cause large-scale changes to these emergent plant communities (Wernick et al. 2009). Physical factors such as clean-up activities and vegetation management appeared to be responsible for reduced regrowth

Trans Mountain Pipeline ULC Volume 7, Pipeline Facilities Technical Reports Trans Mountain Expansion Project Qualitative Ecological Risk Assessment of
Pipeline Spills Technical Report
December, 2013 REP-NEB-TERA-00019
Page C.1-7
observed at some locations. Overall, however, post-spill measures of productivity (vegetated transect length, total cover, and biomass) were within the variability of pre-spill data collected in 2001.
The evidence shows that while oil spills can result in acute toxic effects to aquatic vegetation, it is expected that below-ground roots and rhizomes would generally be capable of surviving and sending out new shoots once hydrocarbon concentrations in the water column decreased below effect thresholds (days to weeks). Aquatic plant communities would also recolonize from nearby sources of seed or vegetative propagules. Recovery of aquatic vegetation affected by submerged oil and hydrocarbons retained in sediments could take years to recover. However, physical recovery of such oil is usually the preferred option. Recovery of most aquatic plant communities can be expected within 1 to 2 years of a spill.
C.1.5. Aquatic Invertebrates
A hydrocarbon spill into a water body may result in acute (lethal) and chronic or sub-lethal effects on aquatic invertebrates. Aquatic invertebrates are critical components of aquatic ecosystems because of their role in converting non-living organic matter into energy resources accessible to other aquatic organisms. Hydrocarbons have the potential to affect aquatic invertebrates and the habitat upon which they depend, by:
Physically smothering organisms Exposing them to acute or chronic toxicity Altering essential habitat.
Modelling results for the Enbridge Northern Gateway Project show that aquatic biota (i.e., fish, amphibian, aquatic invertebrate and aquatic plant communities) are subject to toxicity during the acute phase of hydrocarbon spills. However, after the initial phase of the spill (a few days to 2 weeks), hydrocarbon concentrations in river water decrease to levels that would not be expected to cause chronic effects to fish or other aquatic life (Stantec et al. 2012).
The assessment of negative effects on aquatic biota included the assessment of benthic invertebrates, which were considered to be similar in sensitivity, or less sensitive than fish eggs and larvae. As described in Section C.1.6, the average predicted sediment pore water concentrations of hydrocarbons and TPAH were, for the most part, below concentrations likely to cause negative effects to developing fish eggs (and by extension aquatic invertebrates). The exception was in Chickadee Creek where fine-grained sediments were predicted to retain hydrocarbons and lead to higher hydrocarbon concentrations in sediment pore water. In most cases, however, and with particular reference to gravel bed habitats, it was concluded that although a portion of a single year-class of fish (and by extension, aquatic invertebrates) could be lost, recovery would occur in subsequent years (Stantec et al. 2012).
Available results show that although diversity and abundance of aquatic macroinvertebrates in Talmadge Creek and the Kalamazoo River were reduced as a result of the Kalamazoo River oil spill in July 2010 (Walterhouse 2011 in Walterhouse 2012), by 2011, they had improved, although abundance was still affected (Walterhouse 2012). Recovery in Talmadge Creek was attributable to physical remediation of the habitat, which involved removal of oiled substrates and reconstruction with clean materials. In the Kalamazoo River, overall condition at Station K2 (below the confluence of Talmadge Creek) was scored as “acceptable” shortly after the spill in 2010, but was rated “excellent” in 2011. Farther downstream, degradation was observed at some stations, but may have been attributable to siltation caused by increased rates of shoreline erosion as a result of recovery efforts, rather than to residual hydrocarbon contamination.
Following the December 2000 oil spill into the East Walker River, benthic macroinvertebrates were surveyed by the California Department of Fish and Game to quantify the effects of the spill to aquatic biota. Results purport to show a 79% and 65% loss in abundance in January and March 2001, respectively, indicating that benthic invertebrates were affected by the spill (Hampton et al. 2002). However, the qualitative sampling methodology makes interpretation speculative at best, and decisions

Trans Mountain Pipeline ULC Volume 7, Pipeline Facilities Technical Reports Trans Mountain Expansion Project Qualitative Ecological Risk Assessment of
Pipeline Spills Technical Report
December, 2013 REP-NEB-TERA-00019
Page C.1-8
taken during data management (such as the exclusion of visibly “oiled” benthic invertebrates from the analysis on the assumption that they must have been dead at the time of collection) are questionable, considering that oiling of these organisms could have occurred as a consequence of the sampling activity. Considering the cumulative number of taxa recovered, the cumulative number of Ephemeroptera, Trichoptera and Plecoptera (EPT taxa), the sensitive EPT index, and the Shannon Diversity, which show no compelling differences between upstream and downstream locations, it is difficult to interpret the results as showing impairment in the areas downstream of the spill. The benthic community would also have been subject to the same confounding influence of low stream flow and anchor ice formation as the fish community. Notwithstanding these issues, the East Walker River Trustee Council (EWRTC 2009) quantified the effects of the spill with respect to degree, duration and geographic area. The affected area was deemed to extend to 24 km of stream habitat, and the benthic community was considered to have recovered within one to two years of the accident.
Owing to the deposition of hydrocarbons in the river sediments resulting from the Pine river oil spill in August 2000, effects on benthic invertebrates were investigated as a means of evaluating biological effects (de Pennart et al. 2004). The collection of benthic invertebrate samples in the Pine River in 2000 showed a depletion of all guilds downstream of the spill site; however, in 2001, benthic populations had partially recovered in the most affected areas. No relationship was observed between sediment hydrocarbon concentrations and benthic community structure in a subsequent survey during 2003 indicated recovery of the system (de Pennart et al. 2004).
The evidence shows that while oil spills can result in acutely toxic effects to aquatic invertebrates, causing change in community structure, populations and communities start to recover within 1 year after a spill, and recovery within two years is not unusual.
C.1.6. Fish and Fish Eggs and Larvae
A hydrocarbon spill into a waterbody has a high potential to affect fish, fish eggs and larvae. Hydrocarbons may have lethal and non-lethal effects on aquatic biota, depending on the sensitivity of the species or life stage exposed, and the degree and duration of exposure. Hydrocarbons have the potential to affect fish species and the habitat upon which they depend, by:
Altering essential habitat Physically smothering organisms Exposing them to acute or chronic toxicity.
Modelling results for the Enbridge Northern Gateway Project show that aquatic biota (i.e., fish, amphibian, aquatic invertebrate and aquatic plant communities) are subject to toxicity during the acute phase of hydrocarbon spills. However, results show that after the initial phase of the spill (a few days to 2 weeks), hydrocarbon concentrations in river water decreased to levels that would not be expected to cause chronic effects to fish or other aquatic life (Stantec et al. 2012).
Similarly for aquatic biota exposed to sediment pore water (i.e., fish eggs), the average predicted sediment pore water concentrations of hydrocarbons and TPAH were, for the most part, below concentrations likely to cause negative effects to developing fish eggs. The exception was in Chickadee Creek where fine-grained sediments were predicted to retain hydrocarbons and lead to higher hydrocarbon concentrations in sediment pore water. In most cases, however, and with particular reference to gravel bed habitats that would be of greatest relevance to spawning salmonid fish, it was concluded that although a portion of a single year-class of fish could be lost, recovery would occur in subsequent years (Stantec et al. 2012).
Available results for the Kalamazoo River oil spill show that although the Talmadge Creek fish community was reduced and its habitat greatly diminished due to oil spill recovery efforts (Wesley 2011) after the release in 2010, it experienced some recovery in 2011 (Winter et al. 2012). In the Kalamazoo River, some declines in fish community diversity and abundance were observed at some, but not all, sites in 2010 (Wesley 2011, Winter et al. 2012). No fish kills were observed in the spill area (Winter et al. 2012). In

Trans Mountain Pipeline ULC Volume 7, Pipeline Facilities Technical Reports Trans Mountain Expansion Project Qualitative Ecological Risk Assessment of
Pipeline Spills Technical Report
December, 2013 REP-NEB-TERA-00019
Page C.1-9
July 2010 the Michigan Department of Community Health issued precautionary fishing advisories, and a “do not eat” guideline for fish in the river (MDCH 2013). In July 2012, most of the river was re-opened for recreational use and the fish consumption advisory in relation to the oil spill was lifted. Fish tissue samples were collected in 2010 and 2011, with analysis for hydrocarbon constituents, particularly PAHs, as well as metals and other contaminants. Retrospective analysis (MDCH 2013) found that trace metals of potential concern (i.e., nickel and vanadium) did not differ in fish tissues collected upstream and downstream of the spill site, and were below levels of concern. The PAHs were evaluated in the context of potential carcinogens (i.e., as benzo(a)pyrene equivalents) and as non-carcinogenic compounds. Concentrations of the carcinogenic PAHs were actually higher in samples collected upstream of the spill location, but fish consumption guidelines were not considered necessary owing to the low overall concentrations detected. For non-carcinogenic PAHs, naphthalene and acenaphthene were detected in carp from the Ceresco headpond in 2010 at concentrations of 16.1 and 14.9 ppb, respectively. These concentrations were well below the applicable screening level of 2,300 ppb, and again no fish consumption guidelines were considered necessary (MDCH 2013).
Although some dead fish were observed along the shoreline after the Wabamun Lake train derailment, these numbers were within the natural range expected and Alberta Sustainable Resource Development determined that the release of Bunker “C” fuel oil had no short-term effect on fish (TSBC 2007). Three months after the spill (November 2005), DeBruyn et al. (2007) assessed deformities in lake whitefish larvae incubated in situ in shallow water habitat in areas of the lake that were considered to be either oil-exposed, or not exposed and suitable as reference locations. The lake had been subjected to PAH contamination from various sources prior to the oil spill (e.g., coal mines, coal-fired power plants, marinas, recreational boat use) for many years, and Schindler et al. 2004 reported that lake whitefish had not reproduced successfully in the lake for several years prior to the derailment. DeBruyn et al. (2007) found complete mortality of lake whitefish eggs at one exposure site, but also at one reference site in the lake. High egg mortality (60 to 70%) was also observed at the remaining exposure and reference sites. While overall rates of deformity were similar at these two sites, the deformities exhibited at the oil-exposed site were judged to be more severe than those at the reference site, indicating potential ongoing chronic effects resulting from the spill.
During the initial response following the December 2000 East Walker River oil spill, approximately 21 fish, predominantly mountain whitefish, were found dead within the first 16 km of the spill site (EWRTC 2009). Fish surveys conducted in 2001 by the California Department of Fish and Game and the Nevada Division of Wildlife showed a reduction of juvenile age classes and recruitment of rainbow trout (Hampton et al. 2002). However, the spill response required lower than normal water flows for safety and to slow downstream transport of the oil. The lower flows, in combination with exceptionally cold temperatures, resulted in the formation of anchor ice and a higher than normal winter fish kill (Hampton et al. 2002). Effects on the fish community, therefore, may have reflected either or both of the stresses imposed by oiling and lower than normal water levels with concomitant formation of anchor ice in the stream bed. PAH concentrations were measured in fish tissues collected three months after the spill (March 2001); concentrations were highest in suckers, which are bottom-feeding fish highly exposed to sediments (Higgins 2002). One sample reported a TPAH concentration in sucker (whole body) of 2.6 mg/kg, but all other samples reported values of less than 1 mg/kg. There were no fish survey data available with respect to the recovery of fish and fish eggs and larvae for the East Walker River oil spill. However, water and sediment samples collected within five months of the release were below aquatic toxicity thresholds, indicating that conditions were suitable for recovery of the fish community.
Acute effects of the August 2000 oil spill in Pine River included direct mortality to fish. Approximately 1,600 fish, including but not limited to mountain whitefish, Arctic grayling, bull trout and rainbow trout, were collected along a 30 km stretch of the river (Bustard and Miles 2011, Goldberg 2011). The estimated numbers of dead fish varied widely, with values of 15,000 to 20,100 over a 30 km river reach (Alpine Environmental and EBA Engineering 2001 in Goldberg 2011) to 25,000 to 250,000 over a 50 km river reach (Bacante 2000 in Goldberg 2011). However, the acute effects of spilled oil on fish in the river lasted only a very short time, as water quality in the Pine River had returned to pre-spill conditions less than three weeks after the spill (de Pennart et al. 2004) and fish were reported to be returning to the main stem

Trans Mountain Pipeline ULC Volume 7, Pipeline Facilities Technical Reports Trans Mountain Expansion Project Qualitative Ecological Risk Assessment of
Pipeline Spills Technical Report
December, 2013 REP-NEB-TERA-00019
Page C.1-10
of the river from smaller streams away from the main channel within two weeks of the spill (BC MOE 2000b).
Removal of oiled woody debris and log jams as part of the Pine River oil spill recovery effort was reported to result in substantial long-term effects on the Pine River and associated riparian and instream habitat (Bustard and Miles 2011). Replacement structures were constructed, but the river shifted course and bank erosion resulted in a straighter, wider and less complex river channel (Bustard and Miles 2011). Snorkel surveys were consulted to evaluate the effects of the spill and recovery of the fish community in the river, based on surveys taken both before and after the spill, within an approximately 50 km reach of river most likely to have been affected (Goldberg 2011). Fish were less abundant in 2000 than they had been in 1993 (164 vs. 259 observed fish/km). However, surveys completed in 2005, 2006 and 2007 showed recovery to levels equal to or greater than in 1993 (Goldberg 2011).
There were no reports of dead fish after the July 2011 oil spill in Yellowstone River. Although a precautionary fish consumption advisory was issued after the spill (Montana Fish, Wildlife and Parks 2011a), testing of fish tissue samples from the river did not identify any detection of petroleum hydrocarbon constituents in fish fillet, and only traces of hydrocarbons in organs of fish (Montana Fish, Wildlife and Parks 2011b). Water and sediment samples collected within four months of the spill showed that with few exceptions, all samples were “non-detect” or below applicable (likely human health) standards or screening levels for petroleum hydrocarbons (MDEQ 2013).
Following the January 2000 OSSA II pipeline rupture, no fish were found dead as a result of the spill (Henshaw et al. 2001). Testing of the weathered oil showed that it was highly depleted in many of the chemical constituents typically associated with toxicity. Additionally, water and sediment samples collected up to five months after the spill showed no detectable concentrations of hydrocarbons, except where oil was clearly deposited along strand lines (Henshaw et al. 2001). These results indicate that the spill of mixed crude oil did not substantially affect fish and fish eggs and larvae in the Rio Desaguadero.
No information is available about possible fish kills, if indeed such kills occurred after the release of Bunker “C” fuel oil from the DM 932 in July 2008. However, the characteristics of the oil (viscous, and lacking a large component of monoaromatic or low-boiling aliphatic constituents) make acute mortality of fish an unlikely scenario.
The evidence shows that recovery of fish and fish eggs and larvae could occur within a few years after a release. Water concentrations are likely to decrease below effects thresholds within days to weeks after a spill and relatively little oil appears to become entrained into riverbed gravels, where it would remain subject to weathering so that recovery would occur over a period of weeks to months. In contrast, oil can persist for long periods of time in silty sediments when deposited in slow moving areas of water. Although the uneven distribution of hydrocarbons in sediment could result in some areas where effects on developing fish eggs could occur, it is equally likely that areas with lower deposition would remain unaffected. As a result of natural weathering processes, concentrations of TPAH would decline to concentrations below effects thresholds. The most likely outcome, depending upon the type of oil spilled, and the characteristics of the receiving environment, is that a portion of the reproductive capacity of a single year-class of fish could be lost, but that recovery would occur in subsequent years.
C.1.7. In-Water Amphibians
A hydrocarbon spill into a waterbody has the potential to result in lethal and non-lethal effects on amphibian eggs and larvae. Many amphibian species are considered to be species at risk or sensitive species within their distributional ranges. Representing the aquatic portion of an amphibian life cycle, amphibian eggs and larvae are considered to be the most sensitive life stages.
Few oil spills document the effect of oil spills on in-water amphibians. However, modelling results for the Enbridge Northern Gateway Project show that aquatic biota, which included the assessment of amphibian communities, are subject to toxicity during the acute phase of hydrocarbon spills. However, after the initial phase of the spill (a few days to 2 weeks), hydrocarbon concentrations in river water decrease to levels that would not be expected to cause chronic effects to aquatic life (Stantec et al. 2012). The assessment

Trans Mountain Pipeline ULC Volume 7, Pipeline Facilities Technical Reports Trans Mountain Expansion Project Qualitative Ecological Risk Assessment of
Pipeline Spills Technical Report
December, 2013 REP-NEB-TERA-00019
Page C.1-11
of negative effects on aquatic biota included the assessment of amphibians because they were included in the species sensitivity distribution used to determine effects thresholds for sensitive species, and thus would to experience similar effects as fish, fish eggs and benthic invertebrates under acute or chronic exposure to hydrocarbons.
The evidence suggests that effects on and recovery of in-water amphibian populations would be similar to the timeframes for recovery of fish and fish eggs and larvae. After a release, hydrocarbon concentrations in the water column rapidly decrease below effects thresholds (days to weeks), and concentrations of TPAH in sediment pore water would rapidly decline to concentrations below effects thresholds. The most likely outcome, therefore, is that a portion of the reproductive capacity of a single year-class of amphibians could be lost, but that recovery would occur in subsequent years.
C.1.8. Shoreline and Riparian Vegetation
Direct contact of vegetation with spilled oil could result in physical smothering, habitat modification and toxicity to shoreline and riparian vegetation, which could lead to ecosystem changes, including loss of overall diversity, rare species and rare ecological communities. In addition, response and remediation activities can disrupt habitat and provide an opportunity for invasion by non-native or weedy species.
Modelling results for the Enbridge Northern Gateway Project show that oiling of shorelines causes acute and chronic effects to shoreline vegetation. However, following recovery of visible hydrocarbon contamination from oiled shorelines, it was concluded that moderately tolerant perennial or biennial vegetation will rapidly regenerate from surviving root systems (Stantec et al. 2012).
Following the 2010 release of crude oil into Talmadge Creek and the Kalamazoo River, clearing and grubbing of trees and vegetation was conducted, primarily in the heavily oiled section of Talmadge Creek, to allow completion of free-phase crude oil removal (Enbridge 2011). Although mat roads were used in sensitive areas, temporary roads and heavy equipment movement may have resulted in trampling of vegetation (Enbridge 2011). Disturbed areas were seeded and stabilized using native seed mixes (Enbridge 2011).
As part of the emergency response following the Pine River oil spill, oiled woody debris and log jams were removed. Replacement structures were constructed, but the river shifted course and bank erosion resulted in a straighter, wider and less complex river channel (Bustard and Miles 2011). In addition, the extensive use of heavy equipment in the river led to habitat disturbance and effects to riparian areas.
Four months after the January 2000 OSSA II oil spill, 10 oiled vegetation samples were collected and analyzed. Laboratory analyses determined that none of them contained toxic elements of petroleum (Comisión de Forraje 2000 in Henshaw et al. 2001).
Following the DM 932 oil spill, a large fraction of the scrub-shrub shoreline habitat was heavily oiled; shoreline vegetation provided abundant opportunity for oil droplets and globules to become absorbed. Riprap also provided opportunities for trapping of oil due to the crevices between rocks. Mud and sand shorelines did not trap much oil, and oil did not penetrate into these substrates due to their water saturation (Danchuk 2009).
The evidence suggests that recovery of shoreline and riparian vegetation from an oil spill and its associated response can take years. However, remediation measures including the removal of oiled soils and vegetation, and reseeding of excavated areas would promote recovery. Moderately tolerant perennial or biennial vegetation will rapidly regenerate from surviving root systems and indigenous plant species would recolonize from neighbouring populations not affected by the release.
C.1.9. Soil Invertebrates
As oil slicks come into contact with shorelines and floodplains, a portion of the oil may become stranded on shoreline soils and result in effects to soil invertebrates by:

Trans Mountain Pipeline ULC Volume 7, Pipeline Facilities Technical Reports Trans Mountain Expansion Project Qualitative Ecological Risk Assessment of
Pipeline Spills Technical Report
December, 2013 REP-NEB-TERA-00019
Page C.1-12
Physically smothering organisms Exposing them to acute or chronic toxicity Altering essential habitat.
Modelling results for the Enbridge Northern Gateway Project show that oiling of shorelines would likely result in acute effects to soil invertebrates. After the acute phase of the spill (days to 2 weeks), it was assumed that visible oiling on shorelines would be cleaned-up, reducing the initial total hydrocarbon loading to shoreline soils to a maximum of 1,000 g/m2. Results showed that weathering of hydrocarbons resulted in decreased risks (about half) to soil invertebrates after one to two years (as compared to four weeks post-spill).
Following the 2010 release of crude oil into Talmadge Creek and the Kalamazoo River, oil and affected soils were excavated from the source area and along riverbanks (Enbridge 2011), which would have affected soil invertebrate populations. Clean organic soils were backfilled into excavated areas (Enbridge 2011).
Recovery of soil invertebrate populations would be similar to the recovery time for shoreline and riparian vegetation. Oil spills have the potential to chronically affect soil invertebrates through soil contamination; however, remediation measures including the removal of oiled soils, would promote recovery. Soil invertebrate populations would recolonize from neighbouring areas not affected by the release.
C.1.10. Mammalian Wildlife
Oil spills to the freshwater environment can result in lethal and sub-lethal effects to terrestrial and semi-aquatic mammals. These effects can result from oiling of fur (which reduces thermoregulatory capacity), inhalation of VOCs, dermal exposure, ingestion of hydrocarbons during preening, and chronic exposure from ingestion of contaminated food. Mammals may also experience habitat loss and a decline in food availability through decreased prey abundance.
Modelling results for the Enbridge Northern Gateway Project assessed the potential for acute environmental effects on terrestrial biota (i.e., mammals, birds, reptiles and shoreline vegetation) based on the probability of encounter with floating oil and/or shoreline oil, and the amount of oil likely to be accumulated by an individual animal. Results showed that semi-aquatic mammals (such as muskrat, mink or otter) were likely to be negatively affected by oiling in the event of an accidental pipeline release. Potential chronic effects of oil exposure were assessed by comparing estimated daily ingestion doses from dietary exposure against chronic exposure benchmarks for the grizzly bear, mink, moose, muskrat, river otter and woodland caribou. Results showed that while populations of smaller mammals such as muskrat (which were highly exposed and have small home range) may be subject to chronic risks, it is unlikely that individuals of larger and more widely-ranging species such as grizzly bear or moose would suffer serious harm from chronic exposure. Effects on mammal populations were considered reversible with the effects on terrestrial biota persisting from months to years.
As part of the Kalamazoo River oil spill response, animal recovery efforts ran from July 2010 through October 2010. As of May 2011, a total of 3,160 animals (i.e., reptiles, crustaceans, amphibians, birds, mammals and fish) were collected (Enbridge 2011). Of these, a total of 63 oiled mammals (mainly beaver and muskrat) were either rescued or found dead; 23 were cleaned and released, for a survival rate of 36.5% (Enbridge 2011).
Following the East Walker River oil spill, 1 American mink and 6 beaver were found dead within the first 16 km of the spill site (EWRTC 2009). Owing to the low probability of finding dead wildlife, it was judged that nearly all of the birds and mammals that regularly came in contact with the water within the first 16 km of the spill zone were likely killed as a result of contacting the oil (EWRTC 2009).
Following the Pine River oil spill in August 2000, there were reports that some beaver, otter and mink were affected by the spill (BC MOE 2000b). However, no mammals were found by staff of the BC Ministry of Environment, Lands and Parks despite daily walkover of the river (BC MOE 2000b).

Trans Mountain Pipeline ULC Volume 7, Pipeline Facilities Technical Reports Trans Mountain Expansion Project Qualitative Ecological Risk Assessment of
Pipeline Spills Technical Report
December, 2013 REP-NEB-TERA-00019
Page C.1-13
According to the USEPA (2011a), oiled mammals observed or captured after the Yellowstone river oil spill consisted of 1 white-tailed deer.
No mammals were found dead or oiled as a result of the OSSA II oil spill, despite repetitive ground and aerial surveys throughout the entire region, (Henshaw et al. 2001). Testing of the weathered oil showed that it was highly depleted in many of the chemical constituents typically associated with toxicity. Therefore, although there was a large and labour intensive recovery and remedial operation mounted, the short-term conclusion was that ecological damage from the spill was minimal (Henshaw et al. 2001).
Following the DM 932 oil spill, 26 mammals were observed oiled (USFWS 2009). As of July 27, 2008, these numbers included 2 muskrats and 2 beavers (USFWS 2008).
The evidence suggests that while accurate counts of mammals killed by oil spills are unlikely to be obtained, relatively few dead mammals are usually observed. Consistent with the results of risk assessment models, those dead animals that are found are typically the semi-aquatic mammals that have the highest exposure, and the greatest potential to suffer as a result of hypothermia. Large mammals with more terrestrial habitat, such as bears and moose, are rarely if ever observed to be seriously harmed. It is concluded that individuals of more terrestrial species would be unlikely to suffer serious harm from acute or chronic exposure to oil spills in the aquatic environment. Individuals and populations of smaller semi-aquatic mammal species (e.g., muskrat, beaver, otter and mink) would be more likely to experience negative effects. Recovery would likely occur within months to five years, depending upon the extent of the injuries, and the reproductive capacity of the affected population.
C.1.11. Avian Wildlife
Oil spills to the freshwater environment can result in lethal and sub-lethal effects to birds. These effects can result from contamination of feathers (which reduces thermoregulatory capacity), inhalation of VOCs, dermal exposure, ingestion of hydrocarbons during preening, chronic exposure from ingestion of contaminated food, and external oiling of bird eggs through contact with oily residues on the feathers of parent birds. Birds may also experience habitat loss and a decline in food availability through decreased prey abundance due to contamination.
Modelling results for the Enbridge Northern Gateway Project assessed acute potential environmental effects on terrestrial biota (i.e., mammals, birds, reptiles and shoreline vegetation) based on the probability of encounter with floating oil and/or shoreline oil and the amount of oil likely accumulated on an individual. Results showed that terrestrial biota (including birds) were likely to be negatively affected in the event of an accidental pipeline release. Potential chronic effects were assessed by comparing estimated doses ingested with food against exposure benchmarks for the bald eagle, belted kingfisher, Canada goose, herring gull, great blue heron, mallard duck, spotted sandpiper and tree swallow. Results showed that while populations of smaller birds such as waterfowl may be subject to chronic risks, it is unlikely that individuals of larger and more widely-ranging species such as bald eagle would suffer serious harm from chronic exposure. Effects were considered reversible with the effects on terrestrial biota persisting from months to years.
As part of the Kalamazoo River oil spill response, animal recovery efforts ran from July 2010 through October 2010. As of May 2011, a total of 3,160 animals (i.e., reptiles, crustaceans, amphibians, birds, mammals and fish) were collected (Enbridge 2011). Of these, a total of 196 oiled birds were either rescued or found dead; 144 were cleaned and released, for a survival rate of 73.5% (Enbridge 2011).
A wildlife recovery centre set up immediately after the Wabamun Lake train derailment recovered more than 530 oiled birds within five days after the spill; 156 were either dead or euthanized (TSBC 2007). The following summer, the release of submerged oil in the lake resulted in the oiling of additional waterfowl (TSBC 2007). Wabamun Lake is one of nine lakes in Alberta that was found to support western grebe colonies in 2006 (Kemper et al. 2008). The Alberta population is estimated at between 10,000 and 11,000 birds, representing approximately 10% of the North American population. With between 100 and 500 nests, the Wabamun Lake colony is considered to be regionally significant (Kemper et al. 2008). From 2001 to 2005, western grebes at Wabamun Lake nested in one main colony (Rich‟s Point), and the

Trans Mountain Pipeline ULC Volume 7, Pipeline Facilities Technical Reports Trans Mountain Expansion Project Qualitative Ecological Risk Assessment of
Pipeline Spills Technical Report
December, 2013 REP-NEB-TERA-00019
Page C.1-14
lowest reported number of nests was 243 in 2005, prior to the spill. The oil spill occurred following completion of nesting in 2005 and resulted in the mortality of an estimated 333 western grebes (about 69% of the adult population at Wabamun Lake). However, in 2006, western grebes returned to nest at Rich‟s Point, and formed a second colony at the Ascot Beach reed bed. Together, the two sites contained 456 nests in 2006 (Kemper et al. 2008), indicating that bird populations at Wabamun Lake had recovered from the effects of the spill.
During the initial response after the East Walker River oil spill, 1 Virginia rail and 2 American dippers were found dead within the first 16 km of the spill site (EWRTC 2009). In addition, 1 common merganser, 1 great blue heron, 1 bald eagle and an unspecified number of Canada geese were observed alive but oiled (EWRTC 2009, Hampton et al. 2002).
Following the Pine River oil spill, a golden eagle and a hooded merganser were found oiled; the eagle was successfully released but the hooded merganser died in the wildlife rehabilitation centre (BC MOE 2000b). No other birds were found by staff of the BC Ministry of Environment, Lands and Parks despite daily walkover of the river.
According to the USEPA (2011a), oiled birds observed or captured after the Yellowstone River oil spill included 2 yellow warblers, 1 Cooper‟s hawk, 6 Canada geese, 3 mallards, 6 common mergansers, 1 pelican, 1 great blue heron, 1 American robin, 2 bald eagles, and an unknown raptor.
After the OSSA II oil spill, despite repetitive ground and aerial surveys throughout the entire region, very few (on the order of tens) oiled birds were reported in the first days following the spill (Wasson et al. 2000 in Owens and Henshaw 2002). Testing of the weathered oil showed that it was highly depleted in many of the chemical constituents typically associated with toxicity. Therefore, although there was a large and labour intensive recovery and remedial operation mounted, the short-term conclusion was that ecological damage from the spill was minimal (Henshaw et al. 2001).
Following the July 2008 DM 932 oil spill, 96% of recorded observations of oiled wildlife were birds, although some mammals and reptiles were also reported as oiled. The first documented bird mortality was on July 29, when a completely oiled wood duck was found about 40 km downstream from the spill location. Dozens of oiled birds were seen in areas of heavy effects, although most of these were wading birds that were capable of flying and could not be captured. The total number of oiled birds observed was 813. Wading birds were seen oiled most frequently (about 20% of these were oiled), but waterfowl had the highest rates of oiling (about 40% being oiled) (USFWS 2009).
The evidence suggests that a wide variety of bird species would be exposed to oiling following a large oil spill to a river. While many birds would likely die undetected, the experience based on various oil spill response operations suggests that waterfowl are among the most exposed birds, and that many bird species (such as wading birds and raptors) are less exposed and can tolerate light to moderate oiling without becoming incapacitated. Recovery would likely occur within months to five years, depending upon the extent of the injuries, and the reproductive capacity of the affected population.
C.1.12. Reptiles and Air-Breathing Amphibians
Oil spills in the freshwater environment can result in lethal and sub-lethal effects to reptiles and air-breathing amphibians (i.e., adult frogs, toads and salamanders). These effects can result from dermal exposure, chronic exposure from ingestion of contaminated food, and external oiling of reptile and salamander eggs by oil stranded on floodplains. Reptiles and air-breathing amphibians may also experience habitat loss and a decline in food availability through decreased prey abundance due to contamination.
Modelling results for the Enbridge Northern Gateway Project assessed acute potential environmental effects on terrestrial biota (i.e., mammals, birds, reptiles and shoreline vegetation) based on the probability of encounter with floating oil and/or shoreline oil and the amount of oil likely accumulated on an individual animal. Results showed that terrestrial biota (including reptiles) were likely to be negatively affected in the event of an accidental pipeline release. Reptiles (i.e., snakes and turtles) were considered

Trans Mountain Pipeline ULC Volume 7, Pipeline Facilities Technical Reports Trans Mountain Expansion Project Qualitative Ecological Risk Assessment of
Pipeline Spills Technical Report
December, 2013 REP-NEB-TERA-00019
Page C.1-15
to have similar sensitivity to birds with respect to both oiling and dietary exposure to hydrocarbons. Turtle eggs were assumed to be laid in riparian zone soils, but would likely be located above flood stage, and therefore are not likely to be laid in soils that are contaminated with hydrocarbon residues. In this context, turtle eggs were not thought likely to be more exposed to hydrocarbon residues than bird eggs, which may be subject to external oiling through contact with oily residues on the feathers of parent birds. As discussed in Section C.1.11, results showed that populations of smaller birds (and by extension, reptiles) may be subject to chronic risks. Effects were considered reversible with the effects persisting from months to years.
As part of the Kalamazoo River oil spill response, animal recovery efforts ran from July 2010 through October 2010. As of May 2011, a total of 3,160 animals (i.e., reptiles, crustaceans, amphibians, birds, mammals and fish) were collected (Enbridge 2011). Of these, a total of 2,561 oiled reptiles and 53 oiled amphibians were either rescued or found dead. In addition, 239 unoiled reptiles were collected. Three of the turtle species collected (13 individuals) were protected by Michigan law as either threatened (spotted turtle, Clemmys guttata) or special concern (Blanding‟s turtle, Emys blandingii; eastern box turtle, Terrapene carolina carolina) (Enbridge 2011).
As of May 2011, 2,119 reptiles had been cleaned and released, and 371 rescued reptiles and 42 turtle hatchlings were live in care, for a survival rate of 97.5% (Enbridge 2011). As of May 2011, 50 amphibians had been cleaned and released and one toad was live in care, for a survival rate of 96.2% (Enbridge 2011).
According to the USEPA (2011a), oiled wildlife observed or captured after the Yellowstone River oil spill included 4 toads and 2 garter snakes.
Recorded observations of oiled wildlife after the DM 932 oil spill included reptiles (USFWS 2009). As of July 27, 2008, 2 oiled American alligators had been observed (USFWS 2008).
Following the OSSA II oil spill, despite repetitive ground and aerial surveys throughout the entire region, very few (on the order of tens) oiled birds were reported in the first days following the spill (Wasson et al. 2000 in Owens and Henshaw 2002), and no fish or other animals were found dead or oiled as a result of the spill by clean-up crews or other field personnel (Henshaw et al. 2001, Owens and Henshaw 2002). Testing of the weathered oil showed that it was highly depleted in many of the chemical constituents typically associated with toxicity. Therefore, although there was a large and labour intensive recovery and remedial operation mounted, the short-term conclusion was that ecological damage from the spill was minimal (Henshaw et al. 2001).
The evidence suggests that reptiles (particularly turtles) and air-breathing amphibians are moderately to highly exposed to oiling following oil spills. However, although amphibians are presumed to be highly sensitive as a result of having permeable and delicate epidermal tissue, the epidermis of reptiles is impermeable, and in the case or turtles, largely armoured. Therefore turtles would appear to have generally lower sensitivity to oil exposure than many birds or mammals. In the event of harm, recovery of amphibian populations would be fairly rapid (i.e., one or two breeding cycles), due to their high reproductive potential. On the other hand, turtles tend to be long lived and have lower reproductive potential, so recovery from serious harm at the population level could take longer, potentially five years or more.

ECOLOGICAL RISK ASSESSMENT
OF WESTRIDGE MARINE TERMINAL SPILLS
Technical Report for the Trans Mountain Pipeline ULC
Trans Mountain Expansion Project
December 2013
Document #REP-NEB-TERA-00020
Prepared for:
Trans Mountain Pipeline ULC Kinder Morgan Canada Inc. Suite 2700, 300 – 5th Avenue S.W. Calgary, Alberta T2P 5J2 Ph: 403-514-6400
Prepared by:
Stantec Consulting Ltd.
845 Prospect Street
Fredericton, New Brunswick E3B 2T7 Ph: 506-452-7000

Trans Mountain Pipeline ULC Volume 7, Pipeline Facilities Technical Reports Trans Mountain Expansion Project Ecological Risk Assessment of Westridge Marine
Terminal Spills Technical Report
December 2013 REP-NEB-TERA-00020
Page i
EXECUTIVE SUMMARY Stantec Consulting Ltd. was retained by the project consultant, TERA Environmental Consultants, to evaluate ecological risks that could arise following an accidental crude oil spill at the Westridge Marine Terminal (WMT). This document is a Preliminary Quantitative Ecological Risk Assessment (PQERA) Technical Report prepared for background information for the Section 52 Application for the Trans Mountain Expansion Project (referred to as “TMEP” or “the Project”). In particular, this Technical Report provides support to Volume 7 of the Application. The primary focus of this PQERA is the evaluation of the potential negative environmental effects to marine ecological receptors resulting from hypothetical accidental crude oil spills of Cold Lake Winter Blend (CLWB, a representative diluted bitumen) during marine vessel loading at the WMT. This included the evaluation of a range of hypothetical spill scenarios including a credible worse case (CWC) spill of 160 m3 or a smaller spill that could occur at the WMT during product loading and consideration of a range of weather and marine conditions that could prevail during the spill event, including season-specific behaviour, trajectories, and fate.
Spatial boundaries for this PQERA included the geographic extent where potential effects are expected to be measurable and considered the oil spill footprint as well as the RSA defined as the area of English Bay, Vancouver Harbour, and Burrard Inlet east of the First Narrows, including Indian Arm and Port Moody Arm. Two hypothetical oil spill scenarios were evaluated as part of this PQERA. These include scenarios representing two crude oil spill volumes: a CWC spill of 160 m3 due to a large break in a loading arm (with assumption that 80% is retained by a boom placed around the vessel being loaded); and a smaller volume of 10 m3 (which remains within the containment boom). The credible worst case spill at the Westridge Terminal resulting from an incident during loading of a tanker was assessed, assuming a volume of 160 m3. At 160 m3, this spill is larger than the credible worst case spill resulting from a rupture of a loading arm. It is also substantially smaller than the over 1,500 m3 capacity of the precautionary boom that will be deployed around each berth while any cargo transfer activities are taking place and it is reasonable to expect that the spill would be entirely contained within the boom. In addition, observed weak currents (Modeling the Fate and Behaviour of Marine Oil Spills for the Trans Mountain Expansion Project [Volume 8B]) at the Terminal support the full containment of the oil within the pre-deployed boom. However, as a conservative approach to this scenario, it was deemed that, for oil spill modelling purposes, 20% of the oil released would escape the containment boom (i.e., 32 m3). This condition was chosen to ensure a conservative approach to spill response requirements at the site and does not reflect Trans Mountain's expectation for performance of the precautionary boom which will be in place to fully contain such a release at the terminal. For information of the reader, the credible worst case oil spill volume resulting from this scenario has been calculated by DNV as 103 m3 and deemed as a low probability event with likelihood of occurring once every 234 years.
Each hypothetical spill scenario was evaluated using stochastic fate and transport modeling under a range of environmental conditions, including winter, spring, summer and fall. CLWB was selected as the representative crude oil because it is already transported by Trans Mountain, and is expected to remain a major product transported by the new line. In addition, the diluent in CLWB is condensate (a light hydrocarbon mixture derived from natural gas liquids). As such CLWB was considered to be a conservative choice for the ERA because the volatile and relatively water-soluble hydrocarbons associated with the condensate would present a higher level of risk than would synthetic oil, which is also used as a diluent, but contains fewer volatile and less water soluble constituents.
Separate exposure assessments were conducted for each hypothetical spill scenario. The exposure and hazard/effects assessment steps involved considering first, what the probability of oiling would be for any given location within the RSA. The potential risks of negative environmental effects from crude oil exposure from each spill scenario were evaluated for four main ecological receptor group/habitat combinations including, shoreline and near shore habitats, marine fish and supporting habitat, marine birds and supporting habitat, and marine mammals and supporting habitat. Each of the four ecological receptor groups contains a variety of habitats and/or individual receptor types of differing sensitivity to crude oil exposure (ranked on a scale of low to very high). The potential ecological consequence of crude oil exposure at any given location was considered to be defined by the overlap of the likelihood of crude oil presence, and the sensitivity of ecological habitat or receptors that may be present at that location.

Trans Mountain Pipeline ULC Volume 7, Pipeline Facilities Technical Reports Trans Mountain Expansion Project Ecological Risk Assessment of Westridge Marine
Terminal Spills Technical Report
December 2013 REP-NEB-TERA-00020
Page ii
The first scenario considered the hypothetical CWC scenario for the WMT. For this scenario, there is a high to very high probability of water surface oiling and/or shoreline oiling at the confluence of Indian Arm and Burrard Inlet and a low probability of water surface oiling and/or shoreline oiling from a single individual crude oil spill to reach farther into Indian Arm and towards Port Moody, as well as west past Second Narrows. The overall results for each season were very similar, although some slight seasonal differences in the spill trajectories were identified these were mainly attributed to variations in predominant current direction and speed, and/or predominant wind direction and speed. As a result of federal regulations regarding fish habitat and migratory bird habitat, it is considered that any release of crude oil to the marine environment would justify an effect magnitude rating of High. The following sections provide some additional context regarding effects of spilled crude oil on the four ecological receptor types.
For shoreline and near shore habitats, the affected areas generally represent a small fraction of total amount of shoreline belonging to each sensitivity class within the RSA. The area with the highest probability of oiling and negative effects is located near the confluence of Indian Arm and Burrard Inlet. Although salt marsh and eelgrass habitats are considered to be highly sensitive to crude oil exposure, these habitats are not found in proximity to the WMT and have a very low probability of oiling. Shoreline and near shore habitats classes with low exposure cobble/boulder veneer over sand would be most affected. Very little of the potentially affected shoreline and near shore habitats in Burrard Inlet is of a type that would tend to sequester spilled crude oil. It is expected that shoreline clean-up and assessment techniques could be effectively applied to the spilled crude oil that reached shorelines and that most of this oil would be recovered. Biological recovery from spilled oil, where shoreline communities were contacted by and harmed by the oil or by subsequent clean-up efforts, would be expected to lead to recovery of the affected habitat within two to five years.
For marine fish and supporting habitat, the affected areas can represent a substantial fraction (up to 30%) of total amount of some of the habitat types evaluated, however, the potential for negative effects is generally low, due to the limited fetch of Burrard Inlet, and the low potential for dissolved hydrocarbon concentrations in water to reach thresholds that would cause mortality of fish or other aquatic life. This potential would be greatest in shallow water areas under weather conditions causing spilled oil to be driven into shallow areas with wave action, leading to localized high concentrations of dissolved hydrocarbons and hydrocarbon droplets in the water. This could result in the death of fish as a result of narcosis, or could cause abnormalities or death in developing embryos if spawn was present. Shallow water habitat located in proximity to the WMT would have the highest potential to be affected. As a result of the limited spatial extent of potential effects of spilled oil on fish and fish habitat, and the generally low potential for the CWC scenario to cause acute lethality to fish, recovery of marine fish and supporting habitat would be rapid. Even under a worst-case outcome event where a localized fish kill might be observed, it is expected that the lost biological productivity would be compensated for by natural processes within one to two years.
For marine birds and supporting habitat as well as marine mammals and supporting habitat, the affected areas would be small in comparison to the total available habitat present within Burrard Inlet. For birds, less than 15% of the Burrard Inlet Important Bird Area would have a high or very high probability of oiling whereas for mammals this would represent less than 20% of the RSA. Bird colonies and marine mammals located in proximity to the WMT would be most affected. While there is potential for oiling and mortality of seabirds and marine mammals following an accidental spill of crude oil at the WMT, the degree to which this potential would be realized would depend upon the size of the oil spill, the efficacy of measures intended to promptly contain and recover spilled oil, the ability of oil spill responders to capture and treat oiled animals, and the intrinsic sensitivity of the animals to crude oil exposure. Taking into consideration the oil spill recovery and wildlife protection actions that would follow an accidental oil spill, it remains likely that birds and mammals could be harmed (and hence the effect magnitude would be High), but it is also likely that the numbers would be small. At the population level, the lost individuals would likely be compensated for by natural processes within one to two years.
The second scenario considered a smaller volume of spilled oil that would be completely retained within the containment boom, and would not spread across the water surface outside of the boom or impinge directly on the adjacent shoreline. Standard operating procedures in place at the terminal would result in

Trans Mountain Pipeline ULC Volume 7, Pipeline Facilities Technical Reports Trans Mountain Expansion Project Ecological Risk Assessment of Westridge Marine
Terminal Spills Technical Report
December 2013 REP-NEB-TERA-00020
Page iii
immediate shut-down of transfer operations, and implementation of spill response plans including immediate recovery of the oil using pre-deployed equipment. This mitigation was considered when evaluating potential environmental effects from smaller spills. Based on existing spill response plans, recovery operations for such smaller spills would be expected to be complete within a few days.
Results indicate that the smaller release of CLWB at the WMT during loading operations would not likely affect sediment quality, but could result in a short-term and localized effect on water quality. Acute lethality to aquatic biota is not likely to result. Birds and mammals in direct contact with the oil at the water surface could also be affected. However, due to the presence of the containment boom, and the expected recovery of the oil within a few days, the number of affected animals would be low, and ecological effects would not be persistent at population levels. Therefore, the magnitude of environmental effects on marine ecological receptors of a smaller spill of crude oil at the WMT which remains confined within the containment boom, could be Negligible to Low, provided direct mortality of fish, birds and mammals did not occur.

Trans Mountain Pipeline ULC Volume 7, Pipeline Facilities Technical Reports Trans Mountain Expansion Project Ecological Risk Assessment of Westridge Marine
Terminal Spills Technical Report
December 2013 REP-NEB-TERA-00020
Page iv
TABLE OF CONTENTS
Page EXECUTIVE SUMMARY ............................................................................................................................... I TABLE OF CONTENTS ............................................................................................................................... IV
LIST OF APPENDICES ............................................................................................................................... VI LIST OF FIGURES ....................................................................................................................................... VI LIST OF TABLES ........................................................................................................................................ VII DEFINITIONS AND ACRONYM LIST ........................................................................................................ VIII 1.0 INTRODUCTION ........................................................................................................................... 1-1
1.1 Project Overview .............................................................................................................. 1-1 1.2 Context of this Preliminary Quantitative Ecological Risk Assessment ............................ 1-2 1.3 Scope of the Preliminary Quantitative Ecological Risk Assessment ............................... 1-3 1.4 Objectives ........................................................................................................................ 1-3 1.5 Regulatory Standards ...................................................................................................... 1-3 1.6 Organization of the ERA Report ...................................................................................... 1-4
2.0 CONSULTATION AND ENGAGEMENT ....................................................................................... 2-1
2.1 Public Consultation, Aboriginal Engagement and Landowner Relations......................... 2-1 2.2 Regulatory Consultation ................................................................................................... 2-1
3.0 ECOLOGICAL RISK ASSESSMENT FRAMEWORK ................................................................... 3-1
3.1 Overview .......................................................................................................................... 3-1 3.2 Problem Formulation ........................................................................................................ 3-2 3.3 Exposure Assessment ..................................................................................................... 3-2 3.4 Hazard/Effects Assessment ............................................................................................. 3-2 3.5 Risk Characterization ....................................................................................................... 3-3 3.6 Certainty and Confidence ................................................................................................ 3-4
4.0 PROBLEM FORMULATION ......................................................................................................... 4-1
4.1 Overview of Westridge Marine Terminal Operations ....................................................... 4-1 4.2 Spatial Boundaries of the PQERA ................................................................................... 4-1 4.3 Hypothetical Oil Spill Scenarios ....................................................................................... 4-2 4.4 Selection of Representative Hydrocarbons ..................................................................... 4-3
4.4.1 Physical Properties of Representative Hydrocarbons ........................................ 4-4 4.5 Environmental Setting of Burrard Inlet ............................................................................. 4-4
4.5.1 Physical Setting................................................................................................... 4-4 4.5.2 Existing Water and Sediment Quality Conditions near the Westridge
Terminal .............................................................................................................. 4-4 4.5.3 Effects Assessment and Recovery – July 2007 Spill near the Westridge
Marine Terminal .................................................................................................. 4-6 4.6 Seasonal Distribution and Variability of Biological Resources in Burrard Inlet ................ 4-7
4.6.1 Shoreline and Intertidal Habitats and Resources ............................................... 4-8 4.6.2 Subtidal Habitat ................................................................................................... 4-9 4.6.3 Marine Fish ....................................................................................................... 4-11 4.6.4 Marine Birds and Bird Habitat ........................................................................... 4-19 4.6.5 Marine Mammals and Protected Habitat .......................................................... 4-21
4.7 Aboriginal Traditional Use of Marine Resources within Burrard Inlet ............................ 4-23
5.0 EXPOSURE AND HAZARD/EFFECTS ASSESSMENTS ............................................................ 5-1
5.1 Effects Assessment Approach ......................................................................................... 5-1 5.2 Marine Oil Spill Modelling Framework ............................................................................. 5-2

Trans Mountain Pipeline ULC Volume 7, Pipeline Facilities Technical Reports Trans Mountain Expansion Project Ecological Risk Assessment of Westridge Marine
Terminal Spills Technical Report
December 2013 REP-NEB-TERA-00020
Page v
5.3 Sensitivity Ranking of Ecological Resources for Assessment ......................................... 5-3 5.3.1 Shoreline and Near Shore Habitats .................................................................... 5-3 5.3.2 Marine Fish and Supporting Habitat ................................................................... 5-5 5.3.3 Marine Birds and Supporting Habitat .................................................................. 5-6 5.3.4 Marine Mammals and Supporting Habitat .......................................................... 5-7
6.0 RISK CHARACTERIZATION RESULTS – CREDIBLE WORST CASE AT WESTRIDGE MARINE TERMINAL ..................................................................................................................... 6-1
6.1 Summary of Stochastic Modelling Results ...................................................................... 6-1 6.1.1 Probability of Surface Oiling ................................................................................ 6-1 6.1.2 Probability of Shoreline Oiling ............................................................................. 6-2
6.2 Potential Environmental Effects to Shoreline and Near Shore Habitats .......................... 6-2 6.3 Potential Environmental Effects to Marine Fish and Supporting Habitat ......................... 6-3 6.4 Potential Environmental Effects to Marine Birds and Supporting Habitat ........................ 6-5 6.5 Potential Environmental Effects to Marine Mammals and Supporting Habitat ................ 6-7 6.6 Risk Characterization Summary for a Credible Worst Case Spill .................................... 6-8
7.0 QUALITATIVE ASSESSMENT OF SMALLER SPILLS ................................................................ 7-1
7.1 Summary of Stochastic Modelling Results ...................................................................... 7-1 7.2 Oil Fate and Potential Effects on Shoreline and Near Shore Habitats ............................ 7-1 7.3 Potential Effects to Marine Fish and Supporting Habitat ................................................. 7-2 7.4 Potential Effects to Marine Birds or Marine Mammals and Supporting Habitat ............... 7-2 7.5 Risk Characterization Summary for a Smaller Spill ......................................................... 7-2
8.0 CERTAINTY AND CONFIDENCE ................................................................................................ 8-1
8.1 Environmental fate Modelling ........................................................................................... 8-1 8.2 Biological Sensitivity Factors ........................................................................................... 8-1 8.3 Exposure and Hazard Assessment.................................................................................. 8-1 8.4 Recovery Assessment ..................................................................................................... 8-2
9.0 SUMMARY AND CONCLUSIONS ................................................................................................ 9-1
9.1 Potential Effects and Recovery of Shoreline and Near Shore Habitats ........................... 9-1 9.2 Potential Effects and Recovery of Marine Fish and Supporting Habitat .......................... 9-1 9.3 Potential Effects and Recovery of Marine Birds and Supporting Habitat ........................ 9-2 9.4 Potential Effects and Recovery of Marine Mammals and Supporting Habitat ................. 9-2
10.0 CLOSURE ................................................................................................................................... 10-1
11.0 REFERENCES ............................................................................................................................ 11-1

Trans Mountain Pipeline ULC Volume 7, Pipeline Facilities Technical Reports Trans Mountain Expansion Project Ecological Risk Assessment of Westridge Marine
Terminal Spills Technical Report
December 2013 REP-NEB-TERA-00020
Page vi
LIST OF APPENDICES
APPENDIX A BIOLOGICAL SENSITIVITY FACTOR FIGURES .............................................................. A
Figure A.1 Biological Sensitivity Factors for Shoreline and Near Shore Habitats ................... A Figure A.2 Biological Sensitivity Factors for Fish and Fish Habitat ......................................... A Figure A.3 Biological Sensitivity Factors for Marine Birds and Bird Habitat ............................ A Figure A.4 Biological Sensitivity Factors for Marine and Terrestrial Mammals ....................... A
APPENDIX B OUTPUT FROM EBA (EBA 2013) CREDIBLE WORST CASE (CWC) 160 m3 SPILL B
APPENDIX C OUTPUT FROM EBA (EBA 2013) 10 M3 SMALLER SPILLS ............................................ C
APPENDIX D PROBABILITY OF SURFACE AND SHORELINE OILING FOR A 160 m3 SPILL ............. D
Figure D.1 Probability of oiling Stochastic Simulation 160 m3 Spill Winter Season ................ D Figure D.2 Probability of oiling Stochastic Simulation 160 m3 Spill Spring Season ................ D Figure D.3 Probability of oiling Stochastic Simulation 160 m3 Spill Summer Season ............. D Figure D.4 Probability of oiling Stochastic Simulation 160 m3 Spill Fall Season ..................... D
LIST OF FIGURES
Figure 3.1 Conceptual Diagram of the PQERA Framework ............................................................. 3-1 Figure 4.1 Regional Study Area ........................................................................................................ 4-2

Trans Mountain Pipeline ULC Volume 7, Pipeline Facilities Technical Reports Trans Mountain Expansion Project Ecological Risk Assessment of Westridge Marine
Terminal Spills Technical Report
December 2013 REP-NEB-TERA-00020
Page vii
LIST OF TABLES
Table 1.1 Organization of the Ecological Risk Assessment Technical Report ................................ 1-4 Table 4.1 Summary of Hypothetical Oil Spill Scenarios for the Westridge Marine
Terminal ........................................................................................................................... 4-3 Table 4.2 Data Sources for Biological Resource Evaluation ........................................................... 4-8 Table 4.3 Distribution, Seasonal Timing and Conservation Status for Dungeness Crab .............. 4-11 Table 4.4 Distributionn, Seasonal Timing and Conservation Status for Pacific Salmon
and Steelhead Trout....................................................................................................... 4-13 Table 4.5 Distribution, Seasonal Timing and Conservation Status for Rockfish ........................... 4-18 Table 4.6 Distribution and Seasonal Timing for Marine Birds ........................................................ 4-20 Table 4.7 Distribution and Seasonal Timing for Harbour Seal ....................................................... 4-22 Table 4.8 Relevant Distribution and Seasonal Timing for Marine Mammals – Harbour
Porpoise ......................................................................................................................... 4-23 Table 5.1 Summary of Modelling Outputs for Evaluating Effects .................................................... 5-2 Table 5.2 Shore Types defined for Project ...................................................................................... 5-4 Table 5.3 Shoreline and Near Shore Habitat Types and Biological Sensitivity Factors .................. 5-5 Table 5.4 Biological Sensitivity Classification for the Marine Fish and Supporting
Habitat .............................................................................................................................. 5-6 Table 5.5 Biological Sensitivity Factors for Marine Birds and Supporting Habitat ........................... 5-7 Table 5.6 Biological Sensitivity Classification for Marine Mammals and Supporting
Habitat .............................................................................................................................. 5-8 Table 6.1 Area of Surface Oiling (by Probability of Oiling) .............................................................. 6-1 Table 6.2 Length of Shoreline Oiling (by Probability of Oiling) ........................................................ 6-2 Table 6.3 Summary of Effects Analysis for Shoreline and Near Shore Habitats,
Credible Worst Case Scenario ......................................................................................... 6-3 Table 6.4 Summary of Effects Analysis for Marine Fish and Supporting Habitat,
Credible Worst Case Scenario ......................................................................................... 6-4 Table 6.5 Summary of Effects Analysis for Marine Birds and Supporting Habitat,
Credible Worst Case Scenario ......................................................................................... 6-6 Table 6.6 Summary of Effects Analysis for Marine Mammals and Supporting Habitat,
Credible Worst Case Scenario ......................................................................................... 6-8

Trans Mountain Pipeline ULC Volume 7, Pipeline Facilities Technical Reports Trans Mountain Expansion Project Ecological Risk Assessment of Westridge Marine
Terminal Spills Technical Report
December 2013 REP-NEB-TERA-00020
Page viii
DEFINITIONS AND ACRONYM LIST
Definition/Acronym Full Name
AB Alberta
acute short-term
ADEC State of Alaska Department of Environmental Conservation
AIRA Aleutian Islands Risk Assessment
ATK Aboriginal Traditional Knowledge
Avoidance a means to prevent a potential adverse effect through routing/siting of the Project, changes to Project design or construction timing
BC British Columbia
BC CDC British Columbia Conservation Data Centre
BC CSN British Columbia Cetacean Sightings Network
BC MCA British Columbia Marine Conservation Analysis
BC MFLNRO British Columbia Ministry of Forest, Land and Natural Resource Operations
BC MOE British Columbia Ministry of Environment
BC MWLAP British Columbia Ministry of Water, Land and Air Protection
BIEAP Burrard Inlet Environmental Action Program
BSD Blue Sac Disease, a developmental syndrome of fish embryos caused by PAH exposure.
BSD Blue Sac Disease
BSF biological sensitivity factors
BTEX Benzene, Toluene, Ethylbenzene and Xylenes
CCME Canadian Council of Ministers of the Environment
CEA Canadian Environmental Assessment
CEA Act Canadian Environmental Assessment Act
CEA Agency Canadian Environmental Assessment Agency
CEPA Canadian Environmental Protection Act
chronic long-term

Trans Mountain Pipeline ULC Volume 7, Pipeline Facilities Technical Reports Trans Mountain Expansion Project Ecological Risk Assessment of Westridge Marine
Terminal Spills Technical Report
December 2013 REP-NEB-TERA-00020
Page ix
Definition/Acronym Full Name
CLWB Cold Lake Winter Blend
Compensation a means intended to compensate unavoidable and potentially significant or unacceptable effects any may consist of offsets (no net loss), research, education programs, and financial compensation (considered only when all other options have been exhausted)
COPC Chemical of Potential Concern
COSEWIC Committee on the Status of Endangered Wildlife in Canada
CPCN Certificate of Public Convenience & Necessity
CSAS Canadian Science Advisory Secretariat
CWC credible worst case
CWS Canadian Wildlife Services
DFO Fisheries and Oceans Canada
dilbit diluted bitumen
DNV Det Norske Veritas (U.S.A.), Inc.
DQERA Detailed Quantitative Ecological Risk Assessment
DWT deadweight tonnage
EBA EBA Engineering Consultants Ltd., operating as EBA, A Tetra Tech Company
Element a technical discipline or discrete component of the biophysical or human environment identified in the NEB Filing Manual.
EPH extractable petroleum hydrocarbon
EPP Environmental Protection Plan
ERA Ecological Risk Assessment
ERM Environmental Resources Management
ESA Environmental and Socio-economic Assessment
EVOS Exxon Valdez Oil Spill
EVOSTC Exxon Valdez Oil Spill Trustee Council
GHG greenhouse gas
GIS geographic information system

Trans Mountain Pipeline ULC Volume 7, Pipeline Facilities Technical Reports Trans Mountain Expansion Project Ecological Risk Assessment of Westridge Marine
Terminal Spills Technical Report
December 2013 REP-NEB-TERA-00020
Page x
Definition/Acronym Full Name
HHRA Human Health Risk Assessment
HHWM Higher High Water Mark
IBA Important Bird Area
IFMP Integrated Fisheries Management Plan
Indicator a biophysical, social, or economic property or variable that society considers to be important and is assessed to predict Project-related changes and focus the effects assessment on key issues. One or more indicators are selected to describe the present and predicted future condition of an element. Societal views are understood by the assessment team through published information such as management plans and engagement with regulators, public, Aboriginal, and other interested groups.
IPCC International Panel on Climate Change
ISGOTT International Safety Guide for Oil Tankers and Terminals
ISQG interim sediment quality guideline
KMC Kinder Morgan Canada Inc.
MAH Monocyclic Aromatic Hydrocarbon
Measurement Endpoint one or more 'measurement endpoints' are identified for each indicator to allow quantitative or qualitative measurement of potential Project effects. The degree of change in these measurable parameters is used to characterize and evaluate the magnitude of Project-related environmental and socio-economic effects. A selection of the measurement endpoints may also be the focus of monitoring and follow-up programs, where applicable.
Mitigation Measures mean measures for the elimination, reduction or control of a project’s adverse environmental effects, including restitution for any damage to the environment caused by such effects through replacement, restoration, compensation or any other means.
MLLW Mean Lower Low Water
MSERA Marine Spill Ecological Risk Assessment
NEB National Energy Board
NEB Act National Energy Board Act
NOAA National Oceanic and Atmospheric Administration
NOAA ESI National Oceanic and Atmospheric Administration Environmental Sensitivity Index
NPS nominal pipe size
NRC National Research Council
OD outside diameter
PAH Polycyclic Aromatic Hydrocarbon

Trans Mountain Pipeline ULC Volume 7, Pipeline Facilities Technical Reports Trans Mountain Expansion Project Ecological Risk Assessment of Westridge Marine
Terminal Spills Technical Report
December 2013 REP-NEB-TERA-00020
Page xi
Definition/Acronym Full Name
PCB Polychlorinated Biphenyl
PEL probable effects level
PMV Port Metro Vancouver
PNCIMA Pacific North Coast Integrated Management Area
Post-construction monitoring A type of monitoring program that may be used to verify that mitigation measures effectively mitigated the predicted adverse environmental effects.
PQERA Preliminary Quantitative Ecological Risk Assessment
Proposed pipeline corridor Generally a 150 m wide corridor encompassing the pipeline construction right-of-way, temporary workspace, and valves.
QRA Quantitative Risk Analysis
RCA Rockfish Conservation Areas
RSA (Regional Study Area) The area extending beyond the Local Study Area boundary where the direct and indirect influence of other activities could overlap with Project-specific effects and cause cumulative effects on the environmental or socio-economic indicator.
SARA Species at Risk Act
SCAT Shoreline Clean-up Assessment Technique
SEP Salmonid Enhancement Program
Stantec Stantec Consulting Ltd.
Supplemental studies studies to be conducted post submission of the application to confirm the effects assessment conclusions and gather site-specific information for the implementation of mitigation from the Project-specific environmental protection plans
TEH total extractable hydrocarbons
TEK Traditional Ecological Knowledge
TERMPOL Marine Terminal Systems and Trans-shipment
TEX Toluene, Ethylbenzene, Xylenes
the Project the Trans Mountain Expansion Project
TMEP Trans Mountain Expansion Project
TMPL system Trans Mountain pipeline system
TOC Total Organic Carbon

Trans Mountain Pipeline ULC Volume 7, Pipeline Facilities Technical Reports Trans Mountain Expansion Project Ecological Risk Assessment of Westridge Marine
Terminal Spills Technical Report
December 2013 REP-NEB-TERA-00020
Page xii
Definition/Acronym Full Name
Trans Mountain Trans Mountain Pipeline ULC
TSS Total Suspended Solids
US United States
USCG United States Coast Guard
USEPA United States Environmental Protection Agency
USNFWF United States National Fish & Wildlife Foundation
VOC Volatile Organic Compound
WCMRC Western Canada Marine Response Corporation
WMT Westridge Marine Terminal
YVR Vancouver International airport

Trans Mountain Pipeline ULC Volume 7, Pipeline Facilities Technical Reports Trans Mountain Expansion Project Ecological Risk Assessment of Westridge Marine
Terminal Spills Technical Report
December 2013 REP-NEB-TERA-00020
Page 1-1
1.0 INTRODUCTION 1.1 Project Overview
Trans Mountain Pipeline ULC (Trans Mountain) is a Canadian corporation with its head office located in Calgary, Alberta. Trans Mountain is a general partner of Trans Mountain Pipeline L.P., which is operated by Kinder Morgan Canada Inc. (KMC), and is fully owned by Kinder Morgan Energy Partners, L.P. Trans Mountain is the holder of the National Energy Board (NEB) certificates for the Trans Mountain pipeline system (TMPL system).
The TMPL system commenced operations 60 years ago and now transports a range of crude oil and petroleum products from Western Canada to locations in central and southwestern British Columbia (BC), Washington State and offshore. The TMPL system currently supplies much of the crude oil and refined products used in BC. The TMPL system is operated and maintained by staff located at Trans Mountain‟s regional and local offices in Alberta (Edmonton, Edson, and Jasper) and BC (Clearwater, Kamloops, Hope, Abbotsford, and Burnaby).
The TMPL system has an operating capacity of approximately 47,690 m3/d (300,000 bbl/d) using 23 active pump stations and 40 petroleum storage tanks. The expansion will increase the capacity to 141,500 m3/d (890,000 bbl/d).
The proposed expansion will comprise the following:
Pipeline segments that complete a twinning (or “looping”) of the pipeline in Alberta and BC with about 987 km of new buried pipeline.
New and modified facilities, including pump stations and tanks. Three new berths at the Westridge Marine Terminal in Burnaby, BC, each capable of handling
Aframax class vessels.
The expansion has been developed in response to requests for service from Western Canadian oil producers and West Coast refiners for increased pipeline capacity in support of growing oil production and access to growing West Coast and offshore markets. NEB decision RH-001-2012 reinforces market support for the expansion and provides Trans Mountain the necessary economic conditions to proceed with design, consultation, and regulatory applications.
Application is being made pursuant to Section 52 of the National Energy Board Act (NEB Act) for the proposed Trans Mountain Expansion Project (referred to as “TMEP” or “the Project”). The NEB will undertake a detailed review and hold a Public Hearing to determine if it is in the public interest to recommend a Certificate of Public Convenience and Necessity (CPCN) for construction and operation of the Project. Subject to the outcome of the NEB Hearing process, Trans Mountain plans to begin construction in 2016 and go into service in 2017.
Trans Mountain has embarked on an extensive program to engage Aboriginal communities and to consult with landowners, regulatory authorities, stakeholders, and the general public. Information on the Project is also available at www.transmountain.com.
While Trans Mountain does not own or operate the vessels calling at the Westridge Marine Terminal, it is responsible for ensuring the safety of the terminal operations. In addition to Trans Mountain‟s own screening process and terminal procedures, all vessels calling at Westridge must operate according to rules established by the International Maritime Organization, Transport Canada, the Pacific Pilotage Authority, and Port Metro Vancouver. Although Trans Mountain is not responsible for vessel operations, it is an active member in the maritime community and works with BC maritime agencies to promote best practices and facilitate improvements to ensure the safety and efficiency of tanker traffic in the Salish Sea. Trans Mountain is a member of the Western Canada Marine Response Corporation (WCMRC), and works closely with WCMRC and other members to ensure that WCMRC remains capable of responding to spills from vessels loading or unloading product or transporting it within their area of jurisdiction.

Trans Mountain Pipeline ULC Volume 7, Pipeline Facilities Technical Reports Trans Mountain Expansion Project Ecological Risk Assessment of Westridge Marine
Terminal Spills Technical Report
December 2013 REP-NEB-TERA-00020
Page 1-2
Currently, in a typical month, five vessels are loaded with heavy crude oil (diluted bitumen) or synthetic crude oil at the terminal. The expanded system will be capable of serving 34 Aframax class vessels per month, with actual demand driven by market conditions. The maximum size of vessels (Aframax class) served at the terminal will not change as part of the Project. Similarly, the future cargo will continue to be crude oil, primarily diluted bitumen or synthetic crude oil. Of the 141,500 m3/d (890,000 bbl/d) capacity of the expanded system, up to 100,200 m3/d (630,000 bbl/d) may be delivered to the Westridge Marine Terminal for shipment.
In addition to tanker traffic, the terminal typically loads three barges with oil per month and receives one or two barges of jet fuel per month for shipment on a separate pipeline system that serves Vancouver International Airport (YVR). Barge activity is not expected to change as a result of the expansion.
1.2 Context of this Preliminary Quantitative Ecological Risk Assessment
The evaluation of environmental effects arising from potential accidents and malfunctions resulting from the Project is required for the NEB Application. Section A.2.6 of the NEB Filing Manual outlines the requirements for the Effects Assessment and includes the following:
1. Describe the methods used to predict the effects of the Project on the biophysical and socio-economic elements, and the effects of the environment on the Project.
2. The application must also predict the effects associated with the proposed Project, including those that could be caused by construction, operations, decommissioning or abandonment, as well as accidents and malfunctions.
Additional application filing requirements related to the potential environmental and socio-economic effects of increased marine shipping activities were also outlined in correspondence from the NEB to Trans Mountain in a letter dated September 10, 2013, as presented below:
“The assessment of accidents and malfunctions related to the increase in marine shipping activities must include an assessment of potential accidents and malfunctions at the Terminal and at representative locations along the marine shipping routes. Selection of locations should be risk informed considering both probability and consequence. The assessment must include a description of:
measures to reduce the potential for accidents and malfunctions to occur, including an overview of relevant regulatory regimes;
credible worst case spill scenarios and smaller spill scenarios; the fate and behaviour of any hydrocarbons that may be spilled; potential environmental and socio-economic effects of credible worst case spill scenarios
and of smaller spill scenarios, taking into account the season-specific behaviour, trajectory, and fate of hydrocarbons spilled, as well as the range of weather and marine conditions that could prevail during the spill event;
ecological and human health risk assessments for credible worst case spill scenarios and smaller spill scenarios, including justification of the methodologies used; and
preparedness and response planning and measures, including an overview of the relevant regulatory regimes.
The assessment of accidents and malfunctions must also provide a description of the liability and compensation regime that would apply in the case of a spill.”
This Preliminary Quantitative Ecological Risk Assessment (PQERA) is intended to evaluate and report on the range of environmental effects from hypothetical spills that could potentially occur as a result of accidents during terminal loading operations. The nature of the hypothetical spills (location and release volume) evaluated is based on failure/risk analysis completed by Det Norske Veritas (DNV 2013). The report conclusions are based on the results of crude oil spill fate and transport modelling completed by EBA Engineering Consultants Ltd., (EBA 2013). The crude oil spill scenarios presented here consider

Trans Mountain Pipeline ULC Volume 7, Pipeline Facilities Technical Reports Trans Mountain Expansion Project Ecological Risk Assessment of Westridge Marine
Terminal Spills Technical Report
December 2013 REP-NEB-TERA-00020
Page 1-3
both a credible worst case spill and a smaller spill, as well as season-specific behaviour, weather, marine conditions and trajectories.
This report presents the evaluation of effects to ecological resources resulting from loading spills originating at the Westridge Marine Terminal (WMT). The effects from spills at other locations along the marine transportation shipping lanes have been evaluated and are provided under separate cover.
1.3 Scope of the Preliminary Quantitative Ecological Risk Assessment
This PQERA presents an effects assessment consistent with the approach used for the Aleutian Islands Risk Assessment (AIRA, ERM 2011). The PQERA discusses the range of potential effects to various ecological resources by considering the probability of exposure to predicted surface oil slicks and affected aquatic and shoreline habitats within the study area. This interpretation is realized by overlaying GIS data layers containing information on biological resources, sensitive habitats and other areas of ecological importance with the results of stochastic oil spill modelling completed for each of four seasons including winter (January to March), spring (April to June), summer (July to September) and fall (October to December). Each set of stochastic modelling results represents 360 or more individual simulations for each season, and considers season specific behaviour (wind direct and speed, temperature, etc.), trajectories, and oil fate (refer to Section 5.2 for additional details on the stochastic modelling). Biological data sources used in the assessment are summarized in Section 4.6.7.
A Detailed Quantitative Ecological Risk Assessment (DQERA) for a credible worst case spill and a smaller spill for one selected spill location will be filed as supplemental information in early 2014. The DQERA will evaluate the toxicologically-induced changes in health of biological resources that might be exposed to chemicals of potential concern (COPC) from a spill of CLWB.
1.4 Objectives
This PQERA is designed to meet the requirements of Trans Mountain‟s application under Section 52 of the NEB Act, as outlined in the NEB Filing Manual (2013), and the other specified filing requirements outlined above.
The objectives of the PQERA are to:
Evaluate the potential environmental effects of hypothetical spills of crude oil which is expected to be carried by the pipeline. In this case, Trans Mountain has selected Cold Lake Winter Blend (CLWB) as a representative diluted bitumen product for the purposes of the assessment of an accidental crude oil spill
Evaluate a range of hypothetical spill scenarios including a credible worse case spill and smaller spills that could occur at the Westridge Marine Terminal during product loading
Evaluate hypothetical spills under a range of weather and marine conditions that could prevail during the spill event, including season-specific behaviour, trajectories, and fate
Support the Human Health Risk Assessment (HHRA) as required Advise the Environmental and Socio-Economic Assessment (ESA) document and support the
NEB Application filing process.
1.5 Regulatory Standards
The NEB Filing Manual does not outline specific requirements or methodologies to be completed for the ERA to evaluate spills and malfunctions. Therefore, the general methodologies utilized in the PQERA follow the accepted guidance published by standards and regulatory authorities, including the Canadian Council of Ministers of Environment (i.e., CCME 1996, 1997) and the United States Environmental Protection Agency (USEPA 1998).
The specific approach used for the evaluation of effects based on stochastic oil spill analysis is consistent with the methodology established in the AIRA (ERM 2011). This methodology was developed by the United States National Research Council (2008).

Trans Mountain Pipeline ULC Volume 7, Pipeline Facilities Technical Reports Trans Mountain Expansion Project Ecological Risk Assessment of Westridge Marine
Terminal Spills Technical Report
December 2013 REP-NEB-TERA-00020
Page 1-4
1.6 Organization of the ERA Report
This Marine Terminal Spills PQERA Technical Data Report is organized into sections as described in Table 1.1.
TABLE 1.1 ORGANIZATION OF THE ECOLOGICAL RISK ASSESSMENT TECHNICAL REPORT
Report Section Content
Executive Summary A non-technical summary of key findings to assist the reader in quickly understanding the most important aspects of this PQERA.
Section 1 – Introduction An introductory section that provides an overview of the Project and describes the context, scope and objectives of the PQERA in the Environmental and Socio-economic Assessment (ESA) process. Also introduces regulatory standards used in the PQERA.
Section 2 – Consultation and Engagement A description of the regulatory and stakeholder consultation and engagement process.
Section 3 – Ecological Risk Assessment Framework
A description of ERA framework and methods.
Section 4 – Problem Formulation A description of various components related to problem formulation. Includes a description of the activities which are undertaken at Westridge Marine Terminal, the spatial boundaries of the assessment and the Regional Study Area, the environmental setting, identification of community-level resources being assessed, and the aboriginal traditional use of marine resources in the RSA.
Section 5 – Exposure and Hazard/Effects Assessments
An outline of the exposure and hazard/effects assessments including approach to determine exposure and effects of the spilled crude oil.
Section 6 – Risk Characterization Results – Credible Worst Case at Westridge Marine Terminal
The risk characterization step integrates the exposure and hazard/effects assessments to provide a conservative assessment of effects.
Section 7 – Qualitative Assessment of Smaller Spills
A qualitative evaluation of ecological effects resulting from smaller spills which could potentially occur during loading operations at the WMT.
Section 8 – Ecological Risk Assessment – Certainty and Confidence
A qualitative discussion of the implications of uncertainties and conservatism in the PQERA.
Section 9 – Summary and Conclusions An outline of potential effects and recovery for community-level resources that were assessed.
Section 10 – Closure A closure statement
Section 11 – References A list of references cited throughout the PQERA.

Trans Mountain Pipeline ULC Volume 7, Pipeline Facilities Technical Reports Trans Mountain Expansion Project Ecological Risk Assessment of Westridge Marine
Terminal Spills Technical Report
December 2013 REP-NEB-TERA-00020
Page 2-1
2.0 CONSULTATION AND ENGAGEMENT Trans Mountain and its consultants have conducted a number of engagement activities to inform Aboriginal communities, stakeholders, the public and regulatory authorities about the approach to assessing potential environmental and socio-economic effects of the Project, and to seek input throughout the Project planning process.
2.1 Public Consultation, Aboriginal Engagement and Landowner Relations
Trans Mountain has implemented and continues to conduct open, extensive and thorough public consultation and Aboriginal engagement programs. These programs were designed to reflect the unique nature of the Project as well as the diverse and varied communities along the proposed pipeline and marine corridors. These programs were based on Aboriginal communities, landowner and stakeholder groups‟ interests and inputs, knowledge levels, time and preferred methods of engagement. In order to build relationships for the long-term, these programs were based on the principles of accountability, communication, local focus, mutual benefit, relationship building, respect, responsiveness, shared process, sustainability, timeliness, and transparency.
Feedback related to the Project that was raised through various Aboriginal engagement and public consultation activities including public open houses, ESA Workshops, Community Workshops and one-on-one meetings, is summarized below and was considered in the development of this technical report, and the description of effects of spills from loading accidents in Volume 7:
effect of spills on land, water, fish and wildlife.
The full description of the public consultation, Aboriginal engagement and landowner relations programs are located in Volumes 3A, 3B and 3C, respectively. Section 3.0 of Volumes 5A and 5B summarizes the consultation and engagement activities that have focused on identifying and assessing potential issues and concerns related to accidental spills from loading accidents which may be affected by the construction and operation of the Project. Information collected through the public consultation and Aboriginal engagement programs for the Project was considered in the development of this technical report, and the assessment of spills from loading accidents in Volume 7.
2.2 Regulatory Consultation
Regulatory consultation with the applicable subject matter experts was conducted to present and discuss the proposed assessment methods and approaches for the various ERA studies. Consultation was completed in two phases with various expert groups including 1) consultation on the selection of ecological receptors for the ERA studies, and 2) consultation on the proposed oil spill fate modelling and assessment methods for assessing hypothetical spills.
Consultation on the selection of Key indicators for the ESA, and receptors for the ERA was completed in conjunction with the other ESA disciplines during a meeting held on April 16, 2013. The TMEP project team met with representatives from Environment Canada including members of the Canadian Wildlife Service (CWS) and the Environmental Assessment Office, as well as one external advisor to CWS. No specific comments or concerns were identified by the regulators during the consultation sessions, or through subsequent follow-up discussions.

Trans Mountain Pipeline ULC Volume 7, Pipeline Facilities Technical Reports Trans Mountain Expansion Project Ecological Risk Assessment of Westridge Marine
Terminal Spills Technical Report
December 2013 REP-NEB-TERA-00020
Page 3-1
3.0 ECOLOGICAL RISK ASSESSMENT FRAMEWORK 3.1 Overview
The primary focus of this PQERA was the evaluation of the potential effects to marine ecological receptors resulting from hypothetical accidental crude oil spills of a representative diluted bitumen (CLWB) during marine vessel loading. The assessment has been completed by overlaying GIS data layers containing information on biological resources, sensitive habitats and other areas of ecological importance with the results of seasonal stochastic crude oil spill modelling.
The PQERA was conducted according to accepted methodologies and guidance published by regulatory authorities, including the Canadian Council of Ministers of Environment (CCME 1996, 1997) and the United States Environmental Protection Agency (USEPA 1998), and in addition is patterned on an approach that was developed to support the Aleutian Islands Risk Assessment (ERM 2011).
The PQERA followed a standard protocol that is composed of the following steps:
Problem formulation Exposure assessment Hazard assessment Risk characterization Discussion of certainty and confidence in the predictions Conclusions and recommendations.
The terminology and methodology of this framework followed that laid out by CCME (1996). The framework and methodology for the PQERA are described in Figure 3.1 and in the following sub-sections.
FIGURE 3.1 CONCEPTUAL DIAGRAM OF THE PQERA FRAMEWORK
Publ
ic C
omm
unic
atio
n Uncertainty A
nalysis
Problem Formulation
Are there Project-related chemicals in the environment that could cause health effects? What are the ecological receptors that could be exposed? How would
they come into contact with the chemicals?
Risk Characterization
Do the predicted exposure levels present an increased risk?
Hazard/Effects Assessment
What amount of chemical exposure is linked to health effects?
Exposure Assessment
To what degree are receptors exposed to these chemicals?

Trans Mountain Pipeline ULC Volume 7, Pipeline Facilities Technical Reports Trans Mountain Expansion Project Ecological Risk Assessment of Westridge Marine
Terminal Spills Technical Report
December 2013 REP-NEB-TERA-00020
Page 3-2
3.2 Problem Formulation
The problem formulation stage is an information gathering and interpretation stage that focuses the study on areas of primary concern for the Project. Problem formulation defines the nature and scope of the work to be conducted, and enables practical boundaries to be placed on the overall scope of work, so the PQERA is directed at the key areas and issues of concern. The gathered data provides information regarding the general characteristics of the study area, the crude oil products being considered, possible release points and mechanisms for the crude oil, potential ecological receptors and any other specific areas or issues of concern to be addressed.
The key components of the problem formulation step include:
Characterization of the geographic areas where the PQERA is being conducted Identification of representative crude oil products, and mechanisms of release to the environment Identification of exposure media and pathways Identification and characterization of representative ecological receptors.
The outcome of these components forms the basis of the PQERA.
3.3 Exposure Assessment
The purpose of the exposure assessment step is to evaluate data related to the crude oil product, ecological receptors and exposure pathways identified during the problem formulation phase. Using site-specific data and a series of conservative assumptions, the exposure assessment predicts the behaviour and distribution of crude oil in the environment, and the extent to which ecological receptors would be exposed via exposure scenarios and pathways identified in the problem formulation. The magnitude of exposure depends on the interaction(s) of a number of parameters, including:
Extent of oiling in various environmental media following a hypothetical spill Physical-chemical characteristics of the crude oil, which affect environmental fate and transport and
determine such factors as efficiency of absorption into the body and rate of metabolic breakdown or excretion
Influence of site-specific environmental characteristics (e.g., shoreline geology, sediment type, topography, hydrology, and hydrogeology on the crude oil‟s behaviour within environmental media)
Physiological and behavioural characteristics of the ecological receptors which affect their exposure and susceptibility to crude oil exposure.
Separate exposure assessments are conducted for each hypothetical spill scenario. Exposure assessments result from stochastic crude oil spill modelling and are based on the properties of the representative hydrocarbons, and an assumed release volume for each scenario.
3.4 Hazard/Effects Assessment
The purpose of the hazard/effects assessment step is to identify the physical and/or toxic effects of spilled crude oil. The ecological effects of crude oil exposure depend on the amount of oiling and/or the amount taken into the body (the dose) and the duration of exposure (i.e., the length of time the receptor is exposed). The toxicity of the oil is dependent on:
Inherent properties of the oil that cause a biochemical or physiological effect Ability of the components of the oil to reach the site of action Unique sensitivities associated with the species being evaluated, its life-stage, and/or interactions
with other environmental or physiological conditions.
This PQERA is based on stochastic modeling that provides information on how spilled crude oil would behave in the environment under a range of environmental conditions. Ecological receptors are assumed to be exposed to spilled crude oil if they occupy habitat where crude oil may be present. However, the stochastic modelling provides little information about the chemical characteristics of spilled crude oil, or

Trans Mountain Pipeline ULC Volume 7, Pipeline Facilities Technical Reports Trans Mountain Expansion Project Ecological Risk Assessment of Westridge Marine
Terminal Spills Technical Report
December 2013 REP-NEB-TERA-00020
Page 3-3
concentrations of individual chemical constituents of the spilled crude oil in environmental media (i.e., air, water, soil, sediment, or biological tissues). Although the acute effects of spilled crude oil can be predicted on the basis of direct exposure, the more subtle and chronic effects of spilled crude oil on ecological receptors will be addressed in a detailed quantitative ecological risk assessment to be submitted as a supplemental study in 2014.
3.5 Risk Characterization
The risk characterization step integrates the exposure and hazard/effects assessments with the biophysical characteristics of the marine environment to provide a conservative assessment of effects on each ecological receptor type. The potential negative effects of crude oil exposure are evaluated for four main ecological receptor group/habitat combinations including: shoreline and near shore habitats; marine mammals and supporting habitat; marine birds and supporting habitat; and marine fish and supporting habitat. Each of the four main receptor groups contains a variety of ecological receptors of differing sensitivity to crude oil exposure. The risk estimates are expressed in terms of the likely spatial extent, magnitude (or degree of injury), direction and reversibility of the environmental effects for each ecological receptor type. Potential risks are characterized through a comparison of the predicted exposures derived from applicable case studies (from the Exposure Assessment) to the exposure information detailed in the Hazard Assessment. The potential ecological consequence of crude oil exposure at any given location was considered to be defined by the overlap of the probability of crude oil presence, and the sensitivity of ecological habitat or receptors that may be present at that location. In the preliminary quantitative ERA, the assumption is that exposure may result in negative environmental effects and results are considered through probability ranges for exposure.
Accidents are evaluated using a slightly different approach than most other Project environmental effects, in the sense that environmental effects of construction or operation of the Project, and their duration, can usually be described with a high level of confidence. Accidents, on the other hand, may or may not occur, and serious accidents such as a marine oil spill are expected to have a very low probability of occurring. All of the residual environmental effects of an accident leading to a crude oil spill will be construed as being negative in aspect. The effects assessment framework used in risk characterization will therefore focus on the following aspects of the effects of accidents:
Spatial Extent and Boundaries – oil spills do not fit within a conventional framework of the Project Footprint and Regional Study Area (RSA), as spilled oil could easily be transported a considerable distance. For this reason, the assessment of various oil spill scenarios will consider the spatial extent to which negative residual environmental effects could be expected to occur following a crude oil spill accident under a range of environmental conditions.
Effect Magnitude – residual environmental effects will be considered in a qualitative manner, with rankings of Negligible, Low, Medium or High. Note that under the conditions of an oil spill, an environmental effect could be Negligible or Low in one area, but High in another nearby area; and that effects on one ecological receptor could be Low, while effects on another ecological receptor in the same or a nearby environment could be High. Effect magnitude definitions are as follows:
o Negligible (a change from existing conditions that is difficult to detect; or a very low probability that an ecological receptor will be exposed to spilled oil)
o Low (a change that is detectable, but that remains well within regulatory standards; or a situation where an ecological receptor is exposed to spilled oil, but the exposure does not result in serious stress to the organism)
o Medium (a change from existing conditions that is detectable, and approaches without exceeding a regulatory standard; or a situation where an ecological receptor is stressed, but does not die as a result of exposure to spilled oil)
o High (a change from existing conditions that exceeds an environmental or regulatory standard such as a situation where a species of management concern dies as a result of exposure to spilled oil).
The temporal context of environmental effects is also important. In contrast to other Project environmental effects, which typically have defined duration (e.g., one year of construction), the duration of an accident as an initiator of environmental effects may be very short, and accidents by definition are unlikely events.

Trans Mountain Pipeline ULC Volume 7, Pipeline Facilities Technical Reports Trans Mountain Expansion Project Ecological Risk Assessment of Westridge Marine
Terminal Spills Technical Report
December 2013 REP-NEB-TERA-00020
Page 3-4
Therefore, rather than focusing on the duration and frequency of accidents, the effects assessment will consider the reversibility, and in particular to the expected time to recovery for each ecological receptor in the event of exposure to spilled crude oil as a result of a loading arm breakage or leakage.
Limitations associated with the administrative boundaries and uncertainties of the risk assessment, in addition to conservative assumptions used in the modelling, are identified and discussed to provide perspective on the certainty and confidence that should be placed on the predictions.
3.6 Certainty and Confidence
This ERA step includes a qualitative assessment of the level of confidence that can be placed in the analysis and results. Risk assessments normally include elements of uncertainty, and these uncertainties are addressed by incorporating conservative assumptions (i.e., assumptions that are likely to over-state rather than under-state the actual adversity of outcomes) into the analysis. Discussion of certainty and confidence in the analysis is provided in order to put these considerations into context, and to demonstrate that the conclusions are either not sensitive to key assumptions, or that the assumptions used are conservative. The assumptions and uncertainty associated with the PQERA are discussed in Section 8.

Trans Mountain Pipeline ULC Volume 7, Pipeline Facilities Technical Reports Trans Mountain Expansion Project Ecological Risk Assessment of Westridge Marine
Terminal Spills Technical Report
December 2013 REP-NEB-TERA-00020
Page 4-1
4.0 PROBLEM FORMULATION 4.1 Overview of Westridge Marine Terminal Operations
The following overview description of the Westridge Marine Terminal (WMT) operations is taken from the ESA Volume 4C Section 6.1.10.
The WMT is situated on the south shore of Burrard Inlet, in Vancouver Harbour. The existing facility performs two primary functions: loading crude oil onto tankers and barges for transportation to the US and elsewhere; and offloading jet fuel for onshore pipeline transport to Vancouver Airport.
The current terminal facilities include one (1) berth structure and associated mooring dolphins, articulated loading arms, facility control room and systems, fire suppression system and mobile equipment, and vapour destruction system. The expanded terminal proposed in the application will consist of terminal control room, three (3) vessel berth structures each capable of accommodating tankers up to approximately 120,000 deadweight tonnage (DWT), with associated mooring dolphins, articulated loading arms for each ship berth, a vapour handling system for each berth and fire suppression facilities.
Currently five tankers and three barges (i.e., two barges outbound with crude oil shipments and one inbound with jet fuel) are typically handled each month at the WMT. It is expected that this will increase to the equivalent of 34 partially loaded Aframax tankers and three barges, an increase of about 30 vessels per month. Crude oil and jet fuel barge traffic is not expected to increase as a result of the Project.
Vessels calling at the WMT will follow procedures as recommended in the latest version of the International Safety Guide for Oil Tankers and Terminals (ISGOTT) and all other applicable rules and regulations. All vessels arriving at the terminal will be assisted by tugs during berthing operations. Once a tanker has been assisted to its assigned berth by the tugs, the vessel‟s mooring lines will be secured by trained terminal personnel. A containment boom will also be deployed prior to, and throughout, all oil loading operations, including loading arm connection, cargo loading and disconnection procedures.
The vessel loading process at Westridge is a closed system, with oil loading via loading arms and displaced vapour being transmitted to onshore processing facilities via the vapour piping system. After loading operations are completed, the terminal personnel drain and disconnect the loading arms and vapour line in accordance with written terminal procedures. Once final departure procedures and documentation have been completed, Pilots then board the vessel, tugs are made fast, the gangway is removed, and the ship‟s main propulsion and steering system are tested for operational readiness. In coordination with the ship's crew, the shore-side mooring crew will then release the mooring hooks as directed by the vessel master and mooring lines will be taken aboard the vessel, after which it will be ready for departure with the assistance of the tugs.
4.2 Spatial Boundaries of the PQERA
Spatial boundaries of the PQERA for crude oil spills originating from the WMT include the geographic extent where potential effects are expected to be measurable (i.e., the modelling domain of for the stochastic crude oil spill model). The areas considered in the PQERA are identified as follows:
Oil spill footprint: the area predicted to be directly affected by floating oil resulting from an individual release of crude oil at WMT; and
Regional Study Area (RSA): The area of ecological relevance where effects could potentially result from spills. This area is effectively established by the physical limits of modelling domain for the stochastic crude oil spill modelling and includes the area of Vancouver Harbour, and Burrard Inlet east of the First Narrows, including Indian Arm and Port Moody Arm
Selection of the RSA boundaries considered the confined nature of this system of inlets and the fact that effects associated with spills originating at the Westridge Marine Terminal are not expected to extend westward beyond the mouth of English Bay.
The Regional Study Area for the PQERA is shown in Figure 4.1.

Trans Mountain Pipeline ULC Volume 7, Pipeline Facilities Technical Reports Trans Mountain Expansion Project Ecological Risk Assessment of Westridge Marine
Terminal Spills Technical Report
December 2013 REP-NEB-TERA-00020
Page 4-2
FIGURE 4.1 REGIONAL STUDY AREA
4.3 Hypothetical Oil Spill Scenarios
Det Norske Veritas (DNV) completed a marine transport Quantitative Risk Analysis (QRA) as part of the Marine Terminal Systems and Transshipment (TERMPOL) review process for the Trans Mountain Expansion Project. The QRA examined the probability of certain events occurring en route to the marine terminal or during marine terminal transhipment operations, and the likelihood of an event causing an uncontrolled release of crude oil.
In addition to the risk of various releases from ship based accidents, the QRA also examined the risk and probabilities of cargo transfer incidents at the Westridge Terminal to determine credible worse case (CWC) and smaller spill scenarios for evaluation in the PQERA. Risks from loading accidents included the following:
Overfilling cargo tanks (e.g., caused by technical failures or operator errors) Damage to loading arms/hoses or piping from external impacts (e.g., caused by excessive vessel
movements, mooring failure, operator errors, etc.) Leaks from loading arms/hoses or piping from internal damages (e.g., caused by wear and tear,
corrosion, fatigue, etc.).
The bases for frequencies of a release during the loading operations were accident statistics from Europe and are explained in detail in DNV 2013, “General Risk Analysis and Intended Methods of Reducing Risks” Technical Report Volume 8C. The highest failure frequencies were identified for two operations.

Trans Mountain Pipeline ULC Volume 7, Pipeline Facilities Technical Reports Trans Mountain Expansion Project Ecological Risk Assessment of Westridge Marine
Terminal Spills Technical Report
December 2013 REP-NEB-TERA-00020
Page 4-3
These were: 1) releases of crude oil resulting from defects in a loading arm; and 2) overfilling of a cargo tank.
The spill volume for a release during loading operations depends on the product transfer rate, spill detection time, and shut down time of the loading process and is calculated using the formula as follows:
Volume of spill = Transfer rate * (Detection time + Emergency Shutdown Time)
The credible worst case spill at the Westridge Terminal resulting from an incident during loading of a tanker was assessed, assuming a volume of 160 m3. At 160 m3, this spill is larger than the credible worst case spill resulting from a rupture of a loading arm. It is also substantially smaller than the over 1,500 m3 capacity of the precautionary boom that will be deployed around each berth while any cargo transfer activities are taking place and it is reasonable to expect that the spill would be entirely contained within the boom. In addition, observed weak currents (Modeling the Fate and Behaviour of Marine Oil Spills for the Trans Mountain Expansion Project [Volume 8B]) at the Terminal support the full containment of the oil within the pre-deployed boom. However, as a conservative approach to this scenario, it was deemed that, for oil spill modelling purposes, 20% of the oil released would escape the containment boom (i.e., 32 m3). This condition was chosen to ensure a conservative approach to spill response requirements at the site and does not reflect Trans Mountain's expectation for performance of the precautionary boom which will be in place to fully contain such a release at the terminal. For information of the reader, the credible worst case oil spill volume resulting from this scenario has been calculated by DNV as 103 m3 and deemed as a low probability event with likelihood of occurring once every 234 years (DNV 2013).
Two hypothetical oil spill scenarios were evaluated as part of this PQERA and are summarized in Table 4.1. These include scenarios representing two crude oil spill volumes: a credible worst case spill of 160 m3 as a result of a large break in a loading arm; and a smaller volume of 10 m3 as a result of a leaking in a loading arm for each four seasons (DNV 2013). The credible worst case oil spill during transfer operation has more recently been estimated to be 103 m3 (see ection 9.2). However, the spill volume applied in the oil spill modeling for this PQERA is 160 m3. The reason for the higher volume in the spill modeling is that it was conducted before the dock optimization and risk assessment were complete. The value of 160 m3 is therefore conservative. Each hypothetical spill scenario was evaluated under a range of environmental conditions, including winter, spring, summer and fall.
TABLE 4.1 SUMMARY OF HYPOTHETICAL OIL SPILL SCENARIOS FOR THE WESTRIDGE MARINE TERMINAL
Scenario Season Incident Volume (m3) Product
1
Winter
Large break in loading arm (Credible Worst Case)
Total: 160 Released across boom: 32 (20%)
Retained by boom: 128 (80%)
Cold Lake Winter Blend
Spring
Summer
Fall
2
Winter
Leaking in loading arm Total: 10
Released across boom: 0 Retained by boom: 10 (100%)
Cold Lake Winter Blend
Spring
Summer
Fall
4.4 Selection of Representative Hydrocarbons
For the purposes of the various ERA studies, a sample of the representative diluted bitumen (i.e., Cold Lake Winter Blend, abbreviated CLWB) was provided by Trans Mountain, and subjected to detailed physical and chemical analysis in order to gain an understanding of the particular hydrocarbon fractions present, as well as individual chemicals of potential concern (COPC) for the Project. CLWB was selected because it is already transported by Trans Mountain, and is expected to remain a major product transported by the new line. In addition, the diluent in CLWB is condensate (a light hydrocarbon mixture derived from natural gas liquids). As such the Cold Lake Winter Blend was considered to be a conservative choice for the ecological and human health risk assessments as the volatile and relatively water-soluble hydrocarbons associated with the condensate would present a higher level of risk as a

Trans Mountain Pipeline ULC Volume 7, Pipeline Facilities Technical Reports Trans Mountain Expansion Project Ecological Risk Assessment of Westridge Marine
Terminal Spills Technical Report
December 2013 REP-NEB-TERA-00020
Page 4-4
result of inhalation of volatiles or exposure to dissolved hydrocarbons than would synthetic oil, which is also used as a diluent, but contains fewer volatile and less water soluble constituents.
4.4.1 Physical Properties of Representative Hydrocarbons
The measured physical properties and chemical characteristics of fresh CLWB are provided in Tables 6.1 and 6.2 of the Stantec Pipeline Ecological Risk Assessment Technical Report – Volume 7. Additional information on the characteristics of weathering CLWB is provided by Witt O‟Brien‟s et al. (2013) Technical Report – Volume 8C. All transported hydrocarbons will meet Trans Mountain pipeline quality specifications as outlined in NEB Tariff No. 92 (KMC 2013).
4.5 Environmental Setting of Burrard Inlet
The following descriptions of the physical and biological setting of Burrard Inlet have been extracted with some modification from the Marine Resources – Westridge Marine Terminal Technical Report (Stantec 2013a) Volume 5C.
4.5.1 Physical Setting
Burrard Inlet is a glacial fjord located on the south coast of British Columbia. It is bordered by the cities of Vancouver and Burnaby to the south and by North Vancouver and the North Shore Mountains (Coast Range) to the north. Burrard Inlet can be divided into three sub-areas: English Bay (comprising False Creek and the area between Point Grey, Point Atkinson, and the First Narrows); the Harbour (comprising the area between the First Narrows and Port Moody); and Indian Arm (from Belcarra and North Vancouver to the Indian River estuary). The Harbour area can be further divided into three sub-areas: the Central Harbour (between the First and Second Narrows); the Inner Harbour (extending from the Second Narrows to Barnet Marine Park); and Port Moody Arm (between Barnet Marine Park and Port Moody).
Burrard Inlet is approximately 50 km in length and ranges from 0.5 to 3 km in width. It includes over 11,000 ha of water and seabed, 190 km of shoreline, and a drainage basin of 98,000 ha (Stantec 2009). The maximum water depth in Burrard Inlet is approximately 220 m, which is found in the deep basin of Indian Arm. English Bay and the Harbour are much shallower, with typical water depths of 25 to 35 m and a maximum depth of about 65 m. The mean tidal range within Burrard Inlet is 3.3 m. Currents vary according to location, with the highest velocities occurring at locations where the inlet narrows, constricting water movement. Maximum currents at the First Narrows are on the order of 5.5 knots.
The main freshwater inputs into Burrard Inlet are from the Seymour River in the Inner Harbour (monthly mean discharges of 3.8 to 24.9 m3/s) and the Capilano River, located just west of the First Narrows (5.7 to 42.8 m3/s) (Nijman 1990). Other important sources of freshwater inflow include Lynn Creek, Mosquito Creek, and MacKay Creek in the Inner Harbour and Noons Creek in Port Moody Arm. Surface waters salinities in Burrard Inlet are strongly influenced by local and regional freshwater inputs, ranging from 20‰ to 25‰ during the winter to less than 10‰ during the summer (Nijman 1990). Low summer salinities are largely as a result of runoff from the Fraser River. In deeper waters of Burrard Inlet, salinities are typically 29‰ to 30‰ (Nijman 1990). Surface water temperatures vary seasonally, from as low as 5ºC in the winter to over 20ºC in the summer (Marine Resources – Westridge Marine Terminal Technical Report, Volume 5C).
4.5.2 Existing Water and Sediment Quality Conditions near the Westridge Terminal
Information on existing water and sediment quality near the Westridge Terminal was obtained from the following sources:
BCG Engineering Inc. 2006. Westridge Terminal Burnaby, British Columbia, Environmental & Geotechnical Study – Final Report prepared for Kinder Morgan. 16 pp + drawings and appendices. In Stantec Consulting Ltd. 2013a.
British Columbia Ministry of Water, Land and Air Protection (BC MWLAP). 2004. Water Quality Objectives Attainment Monitoring in Burrard Inlet in 2002. Ministry of Water Land and Air Protection, Lower Mainland Region. July 2004.

Trans Mountain Pipeline ULC Volume 7, Pipeline Facilities Technical Reports Trans Mountain Expansion Project Ecological Risk Assessment of Westridge Marine
Terminal Spills Technical Report
December 2013 REP-NEB-TERA-00020
Page 4-5
Stantec Consulting Ltd. 2010a. Environmental Impact Statement, Divisions B and D: Sewers, Foreshore, and Marine Environment – Westridge Hydrocarbon Accidental Release. Final Report. Prepared for Kinder Morgan Canada Inc. May 2010.
Stantec Consulting Ltd. 2013b. Marine Sediment and Water Quality, Westridge Marine Terminal, Technical Report for the Trans Mountain Pipeline ULC Project. Preliminary Draft. Prepared for Kinder Morgan Canada Inc. October 2013.
Stantec Consulting Ltd. 2012a. Long-term Monitoring Program – 2012 Report. Foreshore Environment. Westridge Hydrocarbon Accidental Release. Prepared for Trans Mountain Pipeline ULC. In Stantec Consulting Ltd. 2013a.
Stantec Consulting Ltd. 2013c. Westridge Marine Terminal for the Trans Mountain Pipeline ULC Project, 2013 Sediment Quality Data Report. Prepared for Trans Mountain Pipeline ULC. September 2013.
4.5.2.1 Existing Water Quality
Water samples collected as part of the Marine Sediment and Water Quality Report (Stantec 2013b) and the Sediment Quality Data Report (Stantec 2013c) were collected at 1 m depth (shallow) and 1 m above the bottom (deep) on ebb and flow tides in four locations within 500 m of the terminal. Analytical results were all below British Columbia Ministry of Environment (BC MOE) Marine Water Quality Guidelines for the Protection of Aquatic Life and CCME Marine Water Quality Guidelines for the Protection of Aquatic Life, with the exception of zinc in shallow ebb tide water, which was slightly above the BC MOE guidelines.
Nutrients, total suspended solids and metal concentrations were higher in deep samples than in shallow samples. For surface samples, the highest salinity, nutrient and metal levels occurred at flood tide; lower concentrations at ebb tide suggest freshwater influence. For deep samples, metals tended to be higher at ebb than flood tide, but less markedly than for surface samples.
Literature/desktop review of available information shows that monthly monitoring of treated WMT stormwater for total extractable hydrocarbons (TEH) has met effluent discharge permit requirements of <5.0 mg/L in the 2010 and 2011 (most recent) annual monitoring reports and were less than detection limits (0.08 to 0.20 mg/L) in all monthly samples (Stantec 2013c).
Extractable petroleum hydrocarbon (EPH) and polycyclic aromatic hydrocarbon (PAH) levels in surface water were sampled at several locations one and two weeks after the July 2007 oil spill when a pipeline was ruptured by a backhoe conducting sewer work for the City of Burnaby. This ruptured pipeline resulted in oil entering Burrard Inlet via the storm drain system (Stantec 2010a). At all sample locations, EPH concentrations were below detection limits. Levels of PAH compounds were above detection limits in a few locations but did not exceed applicable water quality guidelines (Stantec 2010a).
For metals, data from the Water Quality Objectives Attainment Monitoring in Burrard Inlet in 2002 report (BC MWLAP 2004) showed that chromium and cobalt levels were below or marginally above detection limits in all samples collected, and copper, iron, lead, manganese and zinc levels were below British Columbia guidelines in all samples collected at the Shellburn location, which is the sample location closest to Westridge Terminal. At Shellburn, total suspended solids (TSS) ranged from below the detection limit (4 mg/L) in November to 22 mg/L in October (BC MWLAP 2004).
4.5.2.2 Existing Sediment Quality
Sediment samples collected as part of the Marine Sediment and Water Quality Report (Stantec 2013b) and Sediment Quality Data Report (Stantec 2013c) were collected at 29 locations within 500 m of Westridge Terminal, from varying depths to a maximum of 2 m; a total of 59 samples were analyzed.
Although there was spatial variability, surface sediment (top 7.5 cm) consisted on average of sand (61%) with some silt (30%) and clay (8.6%). Sediment collected using a corer (0 to 2 m depth) differed from surface samples with lower sand (39%) and higher silt (45%) and clay (16%) content. Total organic carbon (TOC) content, measured as %TOC, ranged from 0.36 to 2.9%, with an average of 1.95%.

Trans Mountain Pipeline ULC Volume 7, Pipeline Facilities Technical Reports Trans Mountain Expansion Project Ecological Risk Assessment of Westridge Marine
Terminal Spills Technical Report
December 2013 REP-NEB-TERA-00020
Page 4-6
All EPH and BTEX (benzene, toluene, ethylbenzene, xylenes) levels were below detection limits. Total non-alkylated PAH concentrations in surface and core samples (0 to 1 m depth) ranged from below the detection limit (0.20 mg/kg) to 3.66 mg/kg. Only one sample was above the Disposal at Sea Regulations screening criterion of 2.5 mg/kg. Concentrations of some individual PAH compounds exceeded the CCME interim sediment quality guideline (ISQG); however, those concentrations were below the probable effects level (PEL). Mean PAH levels were highest in the surface grab samples (1.47 mg/kg), intermediate in the 0 to 0.5 m cores (1.26 mg/kg) and lowest in the 0.5 to 1.0 m cores (0.39 mg/kg).
For metals, zinc and chromium concentrations were below the Disposal at Sea Regulations screening criteria and CCME ISQGs. Mercury exceeded the ISQG but not the Disposal at Sea screening criterion in 14 of 53 samples, and arsenic, cadmium, copper and lead exceeded both the screening criteria and ISQGs in several samples. Elevated levels of arsenic were noted at all depths sampled and throughout the sampling area, suggesting natural sediment conditions. In contrast, elevated levels of cadmium and lead occurred in core samples from 0 to 0.5 m depth only (not in surface grabs), suggesting anthropogenic sources unrelated to Westridge Terminal operations. Copper exceedances occurred at all depths and throughout the sampling area but were highest in core samples taken from 0 to 0.5 m depth, suggesting a combination of natural sediment and anthropogenic sources.
Concentrations of polychlorinated biphenyl (PCB) compounds were below detection limits, with the exception of PCB 1254, which was above its detection limit in six surface samples and ten core samples from the 0 to 0.5 m range. Total PCBs were marginally above the detection limit in the majority of these samples, but were above the Disposal at Sea Regulations screening level in one sample.
Literature/desktop review of available information indicates that concentrations of hydrocarbons and some metals in sediment have historically been elevated near Westridge Terminal. In samples collected prior to dredging activities in 2005 at the Terminal (BGC 2006 in Stantec 2013b), total non-alkylated PAH concentrations ranged from below detection limits to 130 mg/kg, and in 15 samples the concentrations were higher than the Disposal at Sea Regulations screening criterion (2.5 mg/kg). Concentrations were higher in the surface 0.6 m than in deeper sediment, and highest at the pier itself. BTEX and volatile petroleum hydrocarbons were not detected in 46 of 48 samples analyzed, and PCBs were not detected in 36 of 38 samples analyzed. There were no exceedances of the Disposal at Sea Regulations screening criterion for cadmium but there were 11 exceedances for mercury. Exceedances of total non-alkylated PAHs and metals were all below screening criteria after the dredge program in 2005 (BGC 2006 in Stantec 2013b).
The total non-alkylated PAH level in subtidal sediment collected from the Shellburn location as part of the Water Quality Objectives Attainment Monitoring in Burrard Inlet in 2002 was 1.0 mg/kg and total PCB was below the detection limit (BC MWLAP 2004). Subtidal sediment levels were above the Disposal at Sea Regulations screening criteria for arsenic, copper, and lead (BC MWLAP 2004).
Intertidal sediment sampling for PAHs conducted in 2007 following the accidental release of oil during the July 2007 pipeline rupture showed that total non-alkylated PAH levels were higher than the Burrard Inlet sediment quality guideline (1.68 mg/kg) and the Disposal at Sea Regulations screening criterion (2.5 mg/kg) at several locations near where released oil entered Burrard Inlet (Stantec 2010a). Following remediation in 2007 and 2008, total non-alkylated PAH levels were notably reduced, with no further exceedences of the Disposal at Sea Regulations screening criterion in 2010 or 2011; several individual PAH compounds had levels above Burrard Inlet sediment quality guidelines at two locations (Stantec 2012a in Stantec 2013b).
4.5.3 Effects Assessment and Recovery – July 2007 Spill near the Westridge Marine Terminal
In the 2007 case study near the WMT, the pipeline carrying crude oil between the Burnaby Terminal and the WMT was accidentally punctured by City of Burnaby workers while conducting sewer work. The incident resulted in the release of approximately 224,000 litres (224 m3) of crude oil onto the ground surface, of which approximately 100,000 litres (100 m3) entered the local storm drain system, and

Trans Mountain Pipeline ULC Volume 7, Pipeline Facilities Technical Reports Trans Mountain Expansion Project Ecological Risk Assessment of Westridge Marine
Terminal Spills Technical Report
December 2013 REP-NEB-TERA-00020
Page 4-7
discharged into Burrard Inlet. In this case, subsequent response operations recovered all but an estimated 6,000 litres (6 m3) of the spilled oil (Stantec 2010).
Surface water samples were collected at several locations one and two weeks after the incident. All sample results were below detection limits for extractable petroleum hydrocarbons (EPHs). In addition, while concentrations of PAHs were above detection limits at a few locations, none exceeded water quality guidelines which are protective of the marine environment. The follow-up monitoring and assessment report concluded that oil concentrations in the water column likely peaked soon after the release, but decreased to background levels within days (Stantec 2010).
Sediment tests indicated some areas with PAH concentrations above applicable guidelines. A comparison of PAH composition in sediment samples and released oil indicates that sediment in the Westridge area has likely been affected by the oil release, as well as by historic shipping activity and other sources of PAH. Sediment from sites further away (e.g., Maplewood Flats, Deep Cove, Cates Park, Belcarra, Port Moody flats, Barnet Marine Park) also contained measurable PAHs, but their chemical fingerprint did not match that of the released oil.
A biophysical assessment of the affected marine areas, using Shoreline Clean-up Assessment Technique (SCAT) protocols, indicated effects in the intertidal area. Of the 50 km of shoreline assessed during SCAT surveys, approximately 15 km, east of Second Narrows, was affected by the accidental release. The most heavily affected area was 2.5 km of shoreline between the Shell Jetty Marine Terminal and Barnet Beach at Barnet Marine Park. This heavily oiled area was extensively remediated through removal of oiled seaweed (Fucus), agitation of soft sediments (sand, mud) and application of the shoreline treatment agent Corexit 9580 (a biodegradable cleanser that contains surfactant). As a result of the oil release and remediation, this area experienced habitat loss and death or removal of marine plants (primarily Fucus) as well as a likely loss of intertidal fauna such as starfish, barnacles and limpets. An analysis of mussels collected throughout the eastern part of the inlet indicated that only in the Westridge area was there an amount and distribution pattern (fingerprint) of PAHs that could be associated with the release.
Subtidal organisms may also have been affected by the release, but these effects appear to be limited and localized. Red rock crabs from the Westridge area showed elevated PAH levels and a similar pattern of PAH to the released oil. However, none of the Dungeness crabs sampled at Westridge or crabs of either species from Barnet Marine Park and Berry Point and elsewhere in the Inlet (Indian Arm and Port Moody Arm) showed evidence of having taken up oil from the release. There was no evidence for direct effects on fin-fish species.
Effects of the release were noted for some marine birds and mammals. Fifteen Canada geese, two gulls and one pelagic cormorant were captured as a result of oiling. All but two Canada geese were cleaned and released, one of the two not released was transferred to a different facility and the other was euthanized as a result of an injured eye. Effects on other species of marine birds were minimal, largely because overwintering birds had not yet returned from their northern breeding ranges. Three dead harbour seal pups were found in Burrard Inlet following the release, but cause of death could not be determined, and only one had signs of oil exposure. No other effects on marine mammals, including otters, were reported in Burrard Inlet.
4.6 Seasonal Distribution and Variability of Biological Resources in Burrard Inlet
This section describes the major biological resources present in Burrard inlet, in order to support the development of a consolidated set of Ecological Receptors for the ERA, in Section 5.3 of this report.
Burrard Inlet is a productive marine environment, supporting a diverse assemblage of algae, invertebrates, fish, marine mammals and birds. Over 100 taxa of invertebrates and over 75 species of fish have been documented to inhabit intertidal and subtidal habitats in Burrard Inlet (Renyard 1988, Hanrahan 1994, Richoux et al. 2006). Species diversity is strongly influenced by habitat type, with the highest diversity typically associated with rocky intertidal and shallow subtidal areas.

Trans Mountain Pipeline ULC Volume 7, Pipeline Facilities Technical Reports Trans Mountain Expansion Project Ecological Risk Assessment of Westridge Marine
Terminal Spills Technical Report
December 2013 REP-NEB-TERA-00020
Page 4-8
The biological features of Burrard Inlet and Indian Arm characterized throughout this report were based on a variety of information sources and databases. Table 4.2 lists the data sources and types of data used for each resource.
TABLE 4.2 DATA SOURCES FOR BIOLOGICAL RESOURCE EVALUATION
Resource / Receptor Data Source Data Type
Marine Fish and Supporting Habitat
Bathymetry NOAA National Geophysics Data Centre GIS Raster, converted to polygon
Herring Spawning Areas (Canada) British Columbia Marine Conservation Analysis GIS Raster, converted to polygon
Herring Spawning and Holding Areas (US) Washington Department of Fish and Wildlife GIS Polygon
Rock Fish Conservation Area (Canada) British Columbia Land and Resources Data Warehouse
GIS Polygon
Marine Birds and Supporting Habitat
Important Bird Areas (Canada) Canada Wildlife Services GIS Polygon
Important Bird Areas (US) Audubon Society GIS Polygon
Shorebird nesting/breeding sites (Canada) Bird Studies Canada GIS Point
Shorebird nesting/breeding sites (US) Washington Department of Fish and Wildlife GIS Point
Migratory Bird Sanctuary (Canada) Environment Canada GIS Polygon
Marine Mammals and Supporting Habitat
Bathymetry NOAA National Geophysics Data Centre GIS Raster, converted to polygon
Northern and Southern Resident Killer whale critical habitat
Department of Fisheries and Oceans GIS Polygon
Humpback whale proposed protected habitat for Humpback whale
Department of Fisheries and Oceans GIS Polygon
Haulouts (Canada) British Columbia Marine Conservation Analysis GIS Point
Haulouts (US) Washington Department of Fish and Wildlife GIS Point
Shoreline and Near Shore Habitats
Classification EBA, as adapted from Harper (2013) GIS Polyline
Eel grass and kelp beds (Canada) British Columbia Marine Conservation Analysis GIS Polygon
Eel grass and kelp beds (US) Washington Department of Natural Resources GIS Polygon
Other Habitats
National Parks (Canada) Government of British Columbia GIS Polygon
Marine Protected Areas (Canada) Department of Fisheries and Oceans GIS Polygon
Marine Protected Areas (US) NOAA GIS Polygon
Aboriginal reserves (Canada) Geogratis GIS Polygon
Aboriginal reserves (US) Washington Department of Transportation GIS Polygon
Ecological Reserves (Canada) Government of British Columbia GIS Polygon
National Marine Conservation Areas (Canada) Government of British Columbia GIS Polygon
Provincial Parks (BC) Government of British Columbia GIS Polygon
National Wildlife Areas Government of British Columbia GIS Polygon
Sea Turtle Critical Habitat NOAA Fisheries GIS Polygon
4.6.1 Shoreline and Intertidal Habitats and Resources
The following descriptions of the habitat and fish community of Burrard Inlet have been extracted with some modification from the Marine Resources - Westridge Marine Terminal Technical Report (Stantec 2013a) Volume 5C.
The intertidal zone is defined as the area between the Highest High Water Mark (HHWM) line and Mean Lower Low Water (MLLW) line for spring tides (Williams 1993). Intertidal habitat is strongly influenced by a range of physical and biological factors including substrate type, slope, wave exposure, shore width, tidal range, salinity, light, temperature, and species assemblages (Burd et al. 2008, Howes et al. 1997, Levings et al. 1983; Williams 1993). Differences in the relative degree of influence among these factors can result in different species assemblages in similar intertidal habitats (Burd et al. 2008). Common intertidal species assemblages in British Columbia include marsh plants, seaweeds and other algae, eelgrass, invertebrates, and fish (Williams 1993).
British Columbia‟s intertidal zone provides spawning, rearing, migration and foraging habitat for a diverse range of marine organisms including algae, invertebrates, and fish. Pacific salmon are known to use the intertidal zone of estuaries as rearing and migration habitat (Healey 1980; Levings and Thom 1994;

Trans Mountain Pipeline ULC Volume 7, Pipeline Facilities Technical Reports Trans Mountain Expansion Project Ecological Risk Assessment of Westridge Marine
Terminal Spills Technical Report
December 2013 REP-NEB-TERA-00020
Page 4-9
Levings and Jamieson 2001). Pacific salmon also feed on organisms that originate in seagrass and algae in the intertidal zone (Levings and Thom 1994, Levings and Jamieson 2001). Pacific herring (Clupea harengus pallasi) use intertidal seagrass and algae as spawning substrate for their eggs (Humphreys and Hourston 1978, Levings and Thom 1994). Surf smelt (Hypomesus pretious) and Pacific sand lance (Ammodytes hexapterus) spawn on intertidal sand and gravel substrates (Penttila 1997, 2002, Robards et al. 1999). Certain species of gunnels and sculpins use the low to mid intertidal zone for nesting and incubation (Hart 1973, Levings and Jamieson 2001). Larvae of Dungeness crabs and Manila clams settle in intertidal areas with shell, gravel, and eelgrass substrates (Burd et al. 2008).
The dominant species of algae in intertidal habitats throughout Burrard Inlet are rockweeds. With its gas filled bladders, rockweed becomes suspended in the water column when submerged, and provides a three dimensional matrix within which juvenile fish and invertebrates can forage and avoid predators. At low tide, rockweed provides refuge and protection against desiccation for many of the same organisms. Other common species of algae include sea lettuce (Ulva spp.), Turkish washcloth (Mastocarpus papillatus), sugar kelp (Laminaria saccharina) and five-ribbed kelp (Costaria costata) (Druehl and Hsiao 1977, Stantec 2012a). All of these species have been previously identified within the study area.
Eelgrass beds (Zostera marina) have been mapped in the vicinity of Maplewood Flats, and may occur at other locations in Burrard Inlet as well. Eelgrass beds are essential habitats for a number of economically, culturally and ecologically important species including juvenile salmon (Oncorhynchus spp.), Pacific herring (Clupea pallasii), rockfish (Sebastes spp.), and Dungeness crab (Metacarcinus magister) (Wilson and Atkinson 1995, Nelson and Waaland 1997).
Invertebrate surveys conducted throughout Burrard Inlet have identified over 100 taxa inhabiting a wide range of habitat types (Burd and Brinkhurst 1990, Richoux et al. 2006). Common intertidal species include blue mussel (Mytilus edulis), acorn barnacle, purple ochre stars (Pisaster ochraceus), snails (Littorina spp.), shore crabs (Hemigrapsus spp.) and limpets (Lottia spp.) (Foreshore 1996 in Haggarty 2001, Richoux et al. 2006, Stantec 2012a). Common subtidal species include Dungeness crab (Cancer magister), red rock crab (Cancer productus), anemones, tube worms, sea cucumbers, and shrimps (Foreshore 1996 in Haggarty 2001, Richoux et al. 2006, Stantec 2012a). In addition to these more conspicuous species, a large number of infaunal organisms (i.e., those living beneath the seafloor) have been identified in Burrard Inlet. These include species from the following groups: polychaeta; oligochaeta; bivalvia; aplacophora; scaphopoda; isopoda; cumacea; decapoda; mysidacea; amphipoda; sipunculida; nemertean; holothuroidea; and ophiuroidea (Burd and Brinkhurst 1990, Richoux et al. 2006).
Since 2007, Stantec has conducted an annual survey of intertidal habitat and communities at six sites in Burrard Inlet, including the Westridge Marine Terminal, as part of a long-term monitoring program initiated after the accidental hydrocarbon release at the Westridge Terminal in July 2007. A total of 7 species of algae and 11 species of marine invertebrates were identified in the intertidal zone of Burrard Inlet between 2007 and 2012 (Stantec 2010a, b; 2011; 2012a, b). Rockweed, Turkish washcloth, and sea lettuce were the common macroalgae species observed, while barnacles (Balanus glandula), blue mussels, periwinkles and limpets were the most common invertebrate species. Richoux et al. (2006) identified a total of 103 taxa of invertebrates during a survey of 29 intertidal sites in Burrard Inlet.
4.6.2 Subtidal Habitat
Subtidal habitat is strongly influenced by physical factors of the seabed including topography (macro relief), roughness (micro relief), sediment type and distribution, grain size and shape, patchiness, rock composition, and sediment thickness (Fader et al. 1998, Levings et al. 1983, Todd and Kostylev 2010). Oceanographic factors such as oxygen saturation, temperature variability, water stratification, and chlorophyll-a concentration also influence subtidal habitat (Todd and Kostylev 2010).
Shallow subtidal habitats (<20 m) cover an estimated 1,245 km2 or 18% of the surface area of the Strait of Georgia (Levings et al. 1983). Sand and mud are the dominant substrate types in the Strait and represent an estimated 67% of the total subtidal habitat in the region (Levings et al. 1983). Subtidal habitats of Burrard Inlet are dominated by shallow (<30 m) mud substrates in inner portions of the Inlet, mid-depth (30 to 100 m) mud substrates in outer areas of the Inlet, and mid-depth silt/sand substrates in

Trans Mountain Pipeline ULC Volume 7, Pipeline Facilities Technical Reports Trans Mountain Expansion Project Ecological Risk Assessment of Westridge Marine
Terminal Spills Technical Report
December 2013 REP-NEB-TERA-00020
Page 4-10
the vicinity of the First Narrows bridge and near the south side of the mouth of the Inlet (Burd et al. 2008, Burd 1990). Shallow and mid-depth mud substrates tend to be protected from wave exposure and are typically associated with low tidal currents (Burd et al. 2008). Information about marine sediment and water quality in Burrard Inlet and the Strait of Georgia is provided in the Westridge Marine Terminal Marine Sediment and Water Quality Technical Report.
Benthic substrates provide habitat for a diverse range of infauna, epifauna, and bottom-dwelling fish. Subtidal species assemblages in British Columbia may include algae and seaweeds, eelgrass, invertebrates and fish (Williams 1993). According to Levings and Thom (1994), studies of kelp beds in the southern Strait of Georgia have identified only two kelp beds in Burrard Inlet at Coal Harbour and Brockton Point.
Benthic communities in shallow to mid-depth soft substrates in the Strait of Georgia typically comprise bivalves, polychaetes, amphipods, bottom shrimp, gastropods, mud stars, brittle stars, heart urchins, spoon worms, and fish (Burd et al. 2008). Extensive bacterial and/or algal mats are common in these habitats as a result of the considerable particulate organic matter contained in soft substrates (Burd et al. 2008). Studies on macrobenthic infauna in Burrard Inlet indicate that the most abundant species include bivalves, gastropods, and polychaetes (Burd 1990). The abundance and species richness of macrobenthic infauna in Port Moody Arm appear to be more temporally variable and much lower relative to the rest of Burrard Inlet (Burd et al. 2008, Burd 1990).
Common subtidal invertebrate species include Dungeness crab (Metacarcinus magister), red rock crab (Cancer productus), anemones, tube worms, sea cucumbers, and shrimps (Foreshore 1996 in Haggerty 2001, Richoux et al. 2006, Stantec 2012a). In addition to these more conspicuous species, a large number of infaunal organisms (i.e., those living beneath the seafloor) have been identified in Burrard Inlet. These include species from the following groups: Polychaeta; Oligochaeta; Bivalvia; Aplacophora; Scaphopoda; Isopoda; Cumacea; Decapoda; Mysidacea; Amphipoda; Sipunculida; Nemertean; Holothuroidea; and Ophiuroidea (Burd and Brinkhurst 1990, Richoux et al. 2006).
4.6.2.1 Dungeness Crab
Dungeness crab ranges from the Aleutian Islands in Alaska to Magdalena Bay, Mexico, and can be found at depths ranging from the intertidal, to 230 m (DFO 2012a, Fong and Gillespie 2008). They are usually found on sandy bottoms less than 50 m deep with moderate to strong current (DFO 2000).
Dungeness crabs grow periodically rather than continuously by molting, a process by which they produce a new shell and shed their old shell (DFO 2000, Fong and Gillespie 2008). The new shell quickly swells with water to a size 15% to 30% larger and remains soft for several weeks (DFO 2012a). The molting frequency depends on temperature, size, sex and sexual maturity (Fong and Gillespie 2008). Immature crabs may molt several times a year while mature crabs may molt once a year or every two years. Dungeness crabs reach sexual maturity at about 2 to 3 years of age which corresponds to 10 or 11 molts (Fong and Gillespie 2008). Males have a carapace width of approximately 116 mm at maturity, and females have a carapace width of approximately 100 mm at maturity (MacKay 1942, Fong and Gillespie 2008). In British Columbia, male Dungeness crabs reach a maximum size of 215 mm carapace width and a maximum weight of 2 kg, and have a lifespan of approximately 6 to 9 years (DFO 2000, DFO 2012a, Fong and Gillespie 2008).
Dungeness crabs mate immediately after the female molts and the fertilized eggs are carried on the underside of the female‟s abdomen. During its lifetime, a female Dungeness crab produces approximately three to five million eggs (MacKay 1942, Fong and Gillespie 2008). In British Columbia, mating occurs from April to September and hatching occurs from December to June, with a peak in March (MacKay 1942, Fong and Gillespie 2008). The larvae develop for 3 to 4 months and become dispersed by currents before settling on the bottom (DFO 2000).
The diet of a Dungeness crab depends on its life stage. Larvae feed offshore in the water column on zooplankton and phytoplankton; juveniles forage in littoral habitats for clams and mussels, small fish,

Trans Mountain Pipeline ULC Volume 7, Pipeline Facilities Technical Reports Trans Mountain Expansion Project Ecological Risk Assessment of Westridge Marine
Terminal Spills Technical Report
December 2013 REP-NEB-TERA-00020
Page 4-11
molluscs, shrimp, and other crabs (DFO 2012a); and adult crabs feed on clams and mussels, crustaceans, worms, and fish (DFO 2012a).
Dungeness crabs have great social, cultural, and economic importance in British Columbia and are harvested by commercial, recreational, and Aboriginal fisheries (Fong and Gillespie 2008). As a result of the high natural variability in Dungeness crab populations caused by changing marine environmental conditions, it is difficult to obtain reliable abundance estimates from year to year (Fong and Gillespie 2008). All major Dungeness crab fishing areas in British Columbia are considered to be fully exploited and the demand and competition among the various fishing sectors is increasing (DFO 2000, Fong and Gillespie 2008). In 2010, 4,543 tonnes of Dungeness crab was landed by the commercial fishery in British Columbia with a value of $32.2 million (DFO 2012a). The 2010 landings marked the fourth consecutive year of harvest decline (DFO 2012a). In 2005, over 800,000 pounds of Dungeness crab was harvested in British Columbia‟s recreational fishery, with 63% of this total harvested from the Strait of Georgia (DFO 2012a).
DFO maintains a database of Important Areas that are considered relevant to a species in terms of uniqueness, aggregation, and/or fitness (DFO 2013). DFO‟s Important Areas for Dungeness crab in Burrard Inlet are shown in the Marine Resources – Westridge Marine Terminal Technical Report, (Stantec 2013a) Volume 5C. Several areas in eastern Burrard Inlet have been identified as Important Areas for Dungeness crab: this includes portions of the Inner Harbour, Port Moody Arm and Indian Arm (Jamieson and Levesque 2012a, b). The distribution, seasonal timing and conservation status for the Dungeness crab are summarized in Table 4.3.
TABLE 4.3 DISTRIBUTION, SEASONAL TIMING AND CONSERVATION STATUS FOR DUNGENESS CRAB
Species Relevant Distribution and Seasonal Timing
Conservation Status
SARA BC COSEWIC
Dungeness crab
Dungeness crabs mate immediately after the female moults and the fertilized eggs are carried on the underside of the female’s abdomen. During its lifetime, a female Dungeness crab produces approximately three to five million eggs (MacKay 1942, Fong and Gillespie 2008). In British Columbia, mating occurs from April to September and hatching occurs from December to June, with a peak in March (MacKay 1942, Fong and Gillespie 2008). The larvae develop for 3 to 4 months and become dispersed by currents before settling on the bottom (DFO 2000).
No Status No Status No Status
Source: Conservation Status (BC CDC 2013)
4.6.3 Marine Fish
At least 75 species of fish are known to use Burrard Inlet (Renyard 1988, Hanrahan 1994). Common species found throughout the inlet include the shiner surfperch (Cymatogaster aggregate), starry flounder (Platichthys stellatus), English sole (Pleuronectes vetulus), rock sole (Lepidospetta bilineata), Dover sole (Microstomus pacificus) and staghorn sculpin (Leptocottus armatus) (Renyard 1988). Commercially important species include Pacific herring (Culpea pallasii), anchovy (Engaulis mordax), lingcod (Ophiodon elongatus), copper rockfish (Sebastes caurinus), quillback rockfish (Sebastes maliger) and kelp greenling (Hexagrammos decagrammus) (Renyard 1988). All five species of Pacific salmon, including chum (Oncorhynchus keta), chinook (O. tshawytscha), pink (O. gorbuscha), coho (O. kisutch), and sockeye (O. nerka) utilize near shore habitats in Burrard Inlet from spring through fall (Levy 1996, Macdonald and Chang 1993, Naito and Hwang 2000). Adult salmon have been observed to return to at least 17 streams in Burrard Inlet (Haggarty 2001, BC MOE 2013). Juvenile salmon migrating out of these streams are also expected to use near shore habitats within the study area for rearing and migration. Additional information on some of the marine fish species of Burrard Inlet is provided below.

Trans Mountain Pipeline ULC Volume 7, Pipeline Facilities Technical Reports Trans Mountain Expansion Project Ecological Risk Assessment of Westridge Marine
Terminal Spills Technical Report
December 2013 REP-NEB-TERA-00020
Page 4-12
4.6.3.1 Pacific Salmon
Pacific salmon belong to the family Salmonidae, which includes whitefishes, graylings, salmon, trout, and char. There are five species of Pacific salmon in Canada belonging to the genus Oncorhynchus including pink, chum, sockeye, coho, and Chinook; and in addition steelhead (rainbow) trout (Oncorhynchus mykiss) can be considered alongside the salmon species. The range of Pacific salmon includes the North Pacific Ocean, Bering Strait, southwestern Beaufort Sea, and surrounding freshwater rivers and streams (DFO 2012b). Pacific salmon occur in an estimated 1,300 to 1,500 rivers and streams in British Columbia and the Yukon (DFO 2012b). The most important rivers for Pacific Salmon in British Columbia include the Skeena River and Nass River in the north and the Fraser River in the south which together account for 75% of the salmon population in the province (DFO 2012b). The Fraser River system, which drains into the RSA, is considered the largest single salmon production system in the world (Northcote and Larkin 1988) and accounts for, on average, about 50% of salmon production in British Columbia (Henderson and Graham 1998). Burrard Inlet has been identified by DFO as an Important Area for Pacific salmon (Jamieson and Levesque 2012a, b) and 17 salmon-bearing rivers and streams draining into Burrard Inlet have been identified (BC MOE 2013). The location of the salmon-bearing rivers and streams in the RSA are shown in the Marine Resources - Westridge Marine Terminal Technical Report (Stantec 2013a), Volume 5C.
Pacific salmon are of great cultural and economic importance in British Columbia and all species are harvested in commercial, recreational, and Aboriginal fisheries. They are also ecologically important species because they support oceanic, estuarine, freshwater, and terrestrial food webs by providing nutrients to the ecosystem during their migration from the ocean to rivers and streams to spawn (DFO 2012b).
Nearly 10,000 salmon stocks have been identified in Canadian Pacific waters (DFO 2001). The vast number of stocks and the complex life cycles of Pacific salmon present a substantial assessment and management challenge (DFO 2012b). Fisheries for Pacific salmon are managed by DFO under the Fisheries Act and Canada's Policy for Conservation of Wild Pacific Salmon (Wild Salmon Policy). Under the Wild Salmon Policy, wild salmon populations are managed by conservation units that reflect their geographic and genetic diversity. Each year, DFO prepares a Southern BC Salmon Integrated Fisheries Management Plan (IFMP) to guide the management of the salmon fishery. The IFMP provides a context to the management of the Pacific salmon fishery and the interrelationships of all fishing sectors involved in the fishery (DFO 2012b). The IFMP outlines management objectives, access and allocation, decision guidelines, and management measures. DFO also administers the Salmonid Enhancement Program (SEP) which is comprised of over 300 projects involving hatcheries, fishways, spawning and rearing channels, and small classroom incubators (DFO 2012b).
Pacific salmon are anadromous, meaning that they spawn in fresh water but spend a good portion of their lives in marine waters, where they feed until maturity (DFO 2012b). The life span of Pacific salmon ranges from two years for pink salmon, to seven or eight years for sockeye, chinook, and chum salmon (DFO 2012b, DFO 2001). Depending on the species, salmon will spend one to seven years in marine waters before returning to their natal streams to spawn from spring to fall (DFO 2012b, DFO 2001). All Pacific salmon (but not steelhead) are semelparous, meaning that individual fish spawn once in their lifetime and then die.
Spawning female salmon seek out stream beds with gravel substrate to create a nest, known as a redd, where they deposit their eggs. Waiting male fertilizes the eggs by releasing a cloud of milt. The female then covers up the redd with gravel to protect it, constructs a second nest, and repeats the process until all of her eggs are deposited. After fertilization, eggs are buried in gravel substrate on the river/stream bed. The eggs hatch into alevins in mid-winter and emerge as fry in spring where they stay in freshwater streams and lakes for periods ranging from 1 week to 2 years, depending on species (DFO 2012b).
Pacific salmon are sensitive to changes in both marine and freshwater ecosystems (DFO 2012b). Fishing pressure and loss of habitat from human activities such as logging and agriculture are the key threats to Pacific salmon populations (COSEWIC 2006, 2003a, 2003b, 2002, DFO 2012b, 2001). Four populations of Pacific salmon have been designated as species of conservation concern by COSEWIC including one

Trans Mountain Pipeline ULC Volume 7, Pipeline Facilities Technical Reports Trans Mountain Expansion Project Ecological Risk Assessment of Westridge Marine
Terminal Spills Technical Report
December 2013 REP-NEB-TERA-00020
Page 4-13
coho population, one chinook population, and two sockeye populations. No Pacific salmon populations are currently listed under SARA. DFO‟s 2012 salmon outlook identified a number of Pacific salmon stocks of conservation concern (DFO 2012b).
The physical characteristics, life histories, and spawning habits vary from species to species. This information is summarized below for each of the five Pacific salmon species. Pacific salmon generally return to their natal streams in the late summer early fall to December, with the exception of the Chinook salmon which tends to return earlier. Steelhead trout, in contrast, are spring spawners, but are noted for their highly variable life history. The distribution, seasonal timing and conservation status for the five Pacific salmon species and steelhead trout are summarized in Table 4.4. Additional details for each Pacific salmon species are presented in corresponding sub-sections below.
TABLE 4.4 DISTRIBUTIONN, SEASONAL TIMING AND CONSERVATION STATUS FOR PACIFIC SALMON AND STEELHEAD TROUT
Species Relevant Distribution and Seasonal Timing
Conservation Status
SARA BC COSEWIC
Pink salmon
Pink salmon are the least dependent on fresh water of all the Pacific salmon and trout species and they have the ability to spawn in the lower reaches of coastal streams that are tidally inundated (Holtby and Ciruna 2007). Pink salmon display a high fidelity to spawning in their native streams (Heard 1991, Hard et al. 1996), but larger populations of pink salmon may also colonize new habitat (Holtby and Ciruna 2007). Pink fry begin migrating to the sea in April and May where they remain for approximately 18 months before returning to their natal streams to spawn in September and October (DFO 2012b, DFO 2001, Hart 1973).
No Status Yellow No Status
Chum salmon Chum fry emerge in spring and begin migrating to feeding grounds in the Pacific Ocean (DFO 2012b, DFO 2001).
No Status Yellow No Status
Sockeye salmon Fry emerge in spring, rear in freshwater lakes for 1 to 3 years, and then migrate to the ocean for another 2 to 3 years before returning to their natal stream to spawn (DFO 2001, Hart 1973).
No Status Yellow Endangered
Coho salmon
Mature coho salmon migrate to their natal streams from October to December to spawn (DFO 2012b, DFO 2001). Juvenile coho remain in their spawning stream for 1 to 2 years before migrating to marine waters in the spring (DFO 2012b, DFO 2001).
No Status Yellow Endangered
Chinook salmon
Chinook salmon populations are categorized based on two major life-cycle types: stream and ocean (DFO 2001). Stream-type chinook typically spend 1 to 2 years in fresh water before migrating to marine waters, while ocean-type chinook typically spend no more than 90 days in fresh water before migrating to sea (DFO 2012b, DFO 2001). Spawning times for chinook vary among stocks. They are often referred to as “spring salmon” because they spawn earlier than other Pacific salmon species. Chinook generally migrate upstream to the middle to upper regions of large rivers in British Columbia from the spring through fall to spawn (DFO 2012b, DFO 2001, Hart 1973). These upstream migrations can be as far as 1,500 km inland (DFO 2012b). The majority of chinook salmon in British Columbia come from the Fraser River watershed where spawning occurs from August to December (DFO 2001). Fry emerge in the spring.
No Status Yellow Threatened
Steelhead trout
The Fraser and other British Columbia rivers support anadromous stocks of rainbow trout known as steelhead. Run timing for steelhead is usually late summer in Juan de Fuca strait, although there are some spring-run populations. They typically spawn in the winter and spring. Juvenile fish may stay in fresh water from 1 to 3 years, often mixing with freshwater populations of rainbow trout before migrating to sea. Steelhead differ from other Pacific Oncorhynchus species in being able to spawn more than once, after returning to the sea.
No Status Yellow No Status
Source: Conservation Status (BC CDC 2013)
Pink Salmon Pink salmon are the smallest and most abundant of the five species of Pacific salmon. Adult pink salmon weigh an average of 1 to 3 kg but can reach a maximum size of 76 cm in length and weigh up to 6.8 kg (DFO 2012b, DFO 2001, Lamb and Edgell 2010). Mature pink salmon are silver with bluish backs and

Trans Mountain Pipeline ULC Volume 7, Pipeline Facilities Technical Reports Trans Mountain Expansion Project Ecological Risk Assessment of Westridge Marine
Terminal Spills Technical Report
December 2013 REP-NEB-TERA-00020
Page 4-14
large oval spots on their tail fin and back (DFO 2001; Lamb and Edgell 2010). Spawning pink salmon develop a pale grey back and a white to yellowish body (DFO 2001). Spawning males also develop a distinctive humped back and are sometimes referred to as “humpbacks” or “humpies”.
Pink salmon have a life span of only two years; most of which is spent feeding at sea (DFO 2012b, DFO 2001). Their diet consists primarily of plankton, euphausiids, coepods, amphipods, fish, and squid (DFO 2012b, Hart 1973). In North America, pink salmon demonstrate a fixed two-year life cycle where even-year fish and odd-year fish are completely reproductively isolated (DFO 2001, Heard 1991, Holtby and Ciruna 2007). As adults, pink salmon leave the ocean in the late summer and early fall and usually spawn in streams a short distance from the sea (DFO 2012b, Hart 1973, Holtby and Ciruna 2007). Pink salmon are the least dependent on fresh water of all the Pacific salmon and trout species and they have the ability to spawn in the lower reaches of coastal streams that are tidally inundated (Holtby and Ciruna 2007). Pink salmon display a high fidelity to spawning in their native streams (Heard 1991, Hard et al. 1996), but larger populations of pink salmon may also colonize new habitat (Holtby and Ciruna 2007). Pink fry begin migrating to the sea in April and May where they remain for approximately 18 months before returning to their natal streams to spawn in September and October (DFO 2012b, DFO 2001, Hart 1973).
The abundance of Pacific salmon populations is difficult to assess from year to year as a result of the random variability in annual survival rates (Grant and MacDonald 2012). In 2010, the abundance of Fraser pink salmon fry was estimated at 1 billion, which was the largest abundance of out-migrating fry on record and was more than double the long-term average of 376 million fry. While there was a high degree of uncertainty associated with the 2011 forecast, the estimated Fraser River pink salmon run size was between 9.2 million and 37.5 million fish (Grant and MacDonald 2012).
Even-year and odd-year pink salmon generally occur in equal abundance throughout British Columbia waters, but there are some geographic patterns in their relative abundance (Holtby and Ciruna 2007). Even-year pink salmon are either absent or rare in Puget Sound, southeast Vancouver Island, and the Fraser River, but are the dominant brood in Haida Gwaii (Holtby and Ciruna 2007). As a result of the dominance of odd-year pink salmon in the Fraser River system, there is relatively low abundance of pink salmon that return to the Fraser River in even numbered years (DFO 2012b). Pink salmon on British Columbia‟s south coast belong to a regional group whose range includes mainland portions around the Strait of Georgia and northeast Vancouver Island (Beacham et al. 1988, Holtby and Ciruna 2007). Odd-year pink salmon in Burrard Inlet are managed under the East Howe Sound-Burrard Inlet Conservation Unit (Holtby and Ciruna 2007).
Pink salmon populations in British Columbia are considered relatively stable and the 2012 salmon outlook did not identify any pink salmon stocks of conservation concern (DFO 2012b).
Chum Salmon Adult chum salmon can weigh up to 20 kg and measure more than 100 cm (DFO 2001, Lamb and Edgell 2010). Chum salmon are metallic blue and silver in colour and may have black speckling on their backs (DFO 2001). They also have dark tips on their pectoral, anal, and caudal fins (Hart 1973). Mature fish have reddish to purplish bars across the sides and dark edges on their fins (DFO 2001, Lamb and Edgell 2010).
Chum salmon have a maximum life span of eight years and their age at maturity ranges from three to five years (DFO 2012b). Chum fry emerge in spring and begin migrating to feeding grounds in the Pacific Ocean (DFO 2012b, DFO 2001). At sea, their diet consists primarily of plankton and crustaceans such as shrimp (DFO 2012b). After 2 to 7 years in the ocean, chum salmon return to their natal rivers to spawn in late fall and early winter (DFO 2012b, Hart 1973). Chum salmon prefer lower tributaries near the coast and rarely migrate more than 150 km inland to spawn (DFO 2012b).
Nearly 900 moderate-sized chum spawning streams have been identified in British Columbia (DFO 2001). Over 400 populations of chum salmon have been identified in the Johnstone Strait, Strait of Georgia, and Fraser River watersheds with the majority of production (85%) occurring in the Fraser River system

Trans Mountain Pipeline ULC Volume 7, Pipeline Facilities Technical Reports Trans Mountain Expansion Project Ecological Risk Assessment of Westridge Marine
Terminal Spills Technical Report
December 2013 REP-NEB-TERA-00020
Page 4-15
(DFO 1999, DFO 2001). These chum stocks are grouped into a single unit known as the Inner South Coast chum stock which spawn between September to January (DFO 2001).
The status of the Inner South Coast chum stock has varied over time. The stock declined sharply between the early 1950s and mid 1960s but had recovered by 1973 following closure of the chum fishery in 1965 and 1966 (DFO 1999). The stock declined again between 1974 and 1981, but recovered through the 1980s and 1990s following the implementation of new management strategies (DFO 1999). The 2012 salmon outlook did not identify any chum stocks of conservation concern (DFO 2012b).
Sockeye Salmon Sockeye salmon are the most commercially valuable of the five Pacific salmon species as a result of the superior quality of their flesh (DFO 2001). Sockeye can weigh up to 7 kg and reach a maximum length of 84 cm (DFO 2001, Hart 1973, Lamb and Edgell 2010). Adult sockeye are silver with blue-green backs with fine black specks on the dorsal surface and turn bright red when spawning (DFO 2001, Lamb and Edgell 2010).
Sockeye salmon have a lifespan of five to eight years (DFO 2001). Fry emerge in spring, rear in freshwater lakes for 1 to 3 years, and then migrate to the ocean for another 2 to 3 years before returning to their natal stream to spawn (DFO 2001, Hart 1973). Their diet consists primarily of plankton and crustaceans such as shrimp (DFO 2012b). Sockeye are preyed upon by seals, bears, and gulls during migration and spawning (Hart 1973). Major sockeye runs in British Columbia include watersheds drained by the Fraser, Skeena, and Nass rivers and those of Rivers and Smith Inlets (DFO 2001, Hart 1973). Some sockeye spawn in rivers and streams along the coast but most make long migrations upstream to and through inland lakes (Hart 1973). Fraser River sockeye typically mature and spawn at four years of age and have a four-year life cycle with a dominant year every four years (DFO 2001). During dominant years, the abundance of some population can be many times larger than that of other years (DFO 2012b). Historically, the Adams River sockeye has been the largest spawning population in the Fraser River watershed (DFO 2001).
Cultus Lake and Sakinaw Lake sockeye stocks were identified as stocks of conservation concern in the 2012 salmon outlook (DFO 2012b). Returns of these stocks are particularly low compared to historic levels and a number of management measures have been implemented to support rebuilding of these stocks. The Cultus and Sakinaw sockeye populations have been designated as Endangered by COSEWIC (2003a, b).
Fraser River sockeye stocks experienced a steady and profound decline between 1990 and 2009 (Cohen 2012). In 2009, the pre-season forecast was for a return of 11.4 million Fraser River sockeye but only 1.36 million fish returned (Cohen 2012). In 2010 and 2011, 29 million and 5 million sockeye returned to the Fraser River respectively (Cohen 2012). Following the dismal return in 2009, the federal government established the Commission of Inquiry into the Decline of Sockeye Salmon in the Fraser River, known as the „Cohen Commission‟ after the Commissioner Bruce Cohen, to investigate the causes of the decline. The final report of the Cohen Commission concluded that it was likely a combination of multiple Fraser River-specific and region-wide influences and stressors that contributed to the long-term decline of the Fraser River sockeye (Cohen 2012).
Coho Salmon Adult coho have silver sides, metallic blue backs, white gums, and irregular black spots on their back and the upper lobe of their tail fin (DFO 2001, Hart 1973, Lamb and Edgell 2010). Spawning males may develop bright red colouration on their sides, bright green on their backs and heads, and dark colouration on their bellies (DFO 2001). Coho salmon can weigh up to 18 kg and reach lengths of 108 cm (Lamb and Edgell 2010).
The age at maturity of coho salmon is typically three years (DFO 2012b). Juvenile coho remain in their spawning stream for 1 to 2 years before migrating to marine waters in the spring (DFO 2012b, DFO 2001). While at sea, coho remain in surface waters near the coast (DFO 2001). Many coho remain in the Strait of Georgia, but some migrate offshore up to 1,600 km into the Pacific Ocean (Hart 1973).

Trans Mountain Pipeline ULC Volume 7, Pipeline Facilities Technical Reports Trans Mountain Expansion Project Ecological Risk Assessment of Westridge Marine
Terminal Spills Technical Report
December 2013 REP-NEB-TERA-00020
Page 4-16
Their diet consists of plankton, small fish such as herring, and crustaceans such as shrimp (DFO 2012b, DFO 2001). Mature coho salmon migrate to their natal streams from October to December to spawn (DFO 2012b, DFO 2001). Coho primarily spawn in small streams, but some spawning takes place in large rivers (Hart 1973).
In the Strait of Georgia, coho are found in more than 350 streams including the lower Fraser River system (DFO 2001). The 2012 salmon outlook has identified the Interior Fraser River, Lower Fraser River, Strait of Georgia coho stocks as stocks of conservation concern (DFO 2012b). COSEWIC has designated the Interior Fraser coho population as Endangered (COSEWIC 2002). Poor marine survivals and impacts to freshwater habitat are ongoing concerns for these stocks.
Chinook Salmon Chinook salmon are the largest of the Pacific salmon species and can weigh up to 61 kg and reach lengths of 160 cm (Lamb and Edgell 2010). Chinook salmon are greenish blue to black, have black spots on their back, dorsal fin, and tail fin, and have black gums (Hart 1973, Lamb and Edgell 2010). Spawning fish have a darker colouration and a reddish hue around their fins and bellies (DFO 2001). Spawning males develop enlarged teeth and hooked snouts (DFO 2001).
Chinook salmon have a maximum life span of eight years and their age at maturity ranges from three to seven years (DFO 2012b). Chinook salmon populations are categorized based on two major life-cycle types: stream and ocean (DFO 2001). Stream-type chinook typically spend 1 to 2 years in fresh water before migrating to marine waters, while ocean-type chinook typically spend no more than 90 days in fresh water before migrating to sea (DFO 2012b, DFO 2001). Some chinook will travel up to 1,600 km into the Pacific Ocean where they tend to remain well below the surface (Hart 1973). Chinook salmon feed primarily on plankton, small fish such as herring, and crustaceans such as shrimp (DFO 2012b). Both stream and ocean types will then spend anywhere from 1 to 6 years in the ocean before returning to freshwater streams to spawn (DFO 2001). Most chinook return to spawn in their fourth or fifth year (Hart 1973).
pawning times for chinook vary among stocks. They are often referred to as “spring salmon” because they spawn earlier than other Pacific salmon species. Chinook generally migrate upstream to the middle to upper regions of large rivers in British Columbia from the spring through fall to spawn (DFO 2012b, DFO 2001, Hart 1973). These upstream migrations can be as far as 1,500 km inland (DFO 2012b). The majority of chinook salmon in British Columbia come from the Fraser River watershed where spawning occurs from August to December (DFO 2001). Fry emerge in the spring.
The 2012 salmon outlook has identified the Lower Strait of Georgia and Fraser River chinook stocks as stocks of conservation concern (DFO 2012b). Escapement of the Lower Strait of Georgia chinook stock is currently at low levels due in large part to poor marine survival (DFO 2012b). A number of the Fraser River chinook stocks have demonstrated poor survival rates and poor spawning escapements in recent years and are well below the long-term average (DFO 2012b). COSEWIC has designated the Okanagan chinook population as Threatened (COSEWIC 2006).
Steelhead Trout Steelhead are the anadromous form of rainbow trout (Oncorhynchus mykiss), belonging to the same genus as the five species of Pacific salmon, but displaying some important differences. Rainbow trout is the common name for a species that displays remarkable plasticity and adapatiblity. In general, this species is more adapted to the freshwater environment than the other species of its genus, and many populations are fully adapted to fresh water. Like many salmonids, however, it remains capable of anadromous life history, and steelhead populations are the result. Spawning usually occurs in spring (February through to June), or later depending upon water temperature and location. The eggs hatch in 3 to 4 weeks at temperatures of 10ºC to 15ºC, and the fry emerge from stream gravels approximately 2 to 3 weeks after hatching. In fresh water, the diet comprises drifting organisms, primarily aquatic insects and crustaceans. Anadromous strains typically spend 3 years in fresh water before migrating to the sea, and may undertake migrations of hundreds of kilometres. At sea for two or three years, steelhead occur throughout the North Pacific, but are most abundant in the Gulf of Alaska and the eastern part of the

Trans Mountain Pipeline ULC Volume 7, Pipeline Facilities Technical Reports Trans Mountain Expansion Project Ecological Risk Assessment of Westridge Marine
Terminal Spills Technical Report
December 2013 REP-NEB-TERA-00020
Page 4-17
North Pacific, occupying habitat with temperatures between 10ºC and 15ºC. While in the ocean, their diet is primarily small fish and crustaceans. Returning to freshwater through the summer and autumn, adult fish spawn in the spring, but differ from other Pacific salmon species in that they can survive spawning and return to the sea to feed, potentially spawning more than once. Most adult steelhead weigh between 2.5 and 5 kg; larger fish are likely to have spent more than one period at sea.
4.6.3.2 Rockfish
There are 102 species of rockfish belonging to the genus Sebastes, of which 36 species are known to occur in Canadian Pacific waters (COSEWIC 2009). Rockfish have long lifespans and are slow to mature. Rockfish eggs are fertilized internally and females provide nutrients to the developing embryos (COSEWIC 2009, DFO 2006; Hart 1973). Juveniles are born as larvae which undergo a pelagic phase before settling in benthic habitats (COSEWIC 2009). Rockfish populations may display episodic recruitment during periods of favourable environmental conditions every 15 to 20 years (COSEWIC 2009; Yamanaka and Lacko 2001).
The life history traits of rockfish such as their late age-at-maturity, slow growth, and episodic recruitment make them inherently vulnerable to human activities and overexploitation in fisheries (COSEWIC 2009). Rockfish are targeted in commercial, recreational, and Aboriginal fisheries in British Columbia. They are also caught incidentally in the hook and line fishery and as bycatch in the prawn trap, groundfish trawl, and shrimp trawl fisheries (DFO 2012c). A number of rockfish populations in British Columbia have been overfished and fishing is the primary threat to rockfish. There is a lack of information about the overall status of rockfish habitat in British Columbia, but their relatively deep subtidal habitat (14 to 143 m deep) remains largely unchanged since the last glaciation (COSEWIC 2009, DFO 2012c).
Eight species of rockfish that occur in Canadian Pacific waters have been identified as species of conservation concern by COSEWIC and three have been listed under SARA. The quillback rockfish has been designated as Special Concern by COSEWIC but is not currently listed under SARA. The copper rockfish has not been identified as a species of conservation concern.
In an effort to conserve inshore rockfish populations in Canadian Pacific waters, DFO (2002) developed a Rockfish Conservation Strategy. The strategy is focused on monitoring catch levels, reducing harvest levels, stock assessment, and the establishment of Rockfish Conservation Areas (RCAs). RCAs are areas where commercial and recreational fishing activities that negatively impact rockfish are prohibited year-round (DFO 2011). A total of 164 RCAs have been established in British Columbia to date, which together account for an estimated 30% of inshore rockfish habitat in the province (COSEWIC 2009).
Quillback rockfish (S. maliger) and copper rockfish (S. caurinus) are relatively common and prefer shallow water habitat in inlets. Therefore, these two species are among the most likely to be found in Burrard Inlet. The relevant distribution, seasonal timing and conservation status for these two rockfish species are summarized in Table 4.5. Additional species-specific details are presented below. The Marine Resources - Westridge Marine Terminal Technical Report (Stantec 2013a) Volume 5C shows the location of three RCAs in the RSA including Indian Arm – Crocker Island RCA; Indian Arm – Twin Islands RCA; and Eastern Burrard Inlet RCA. The WMT is located in proximity to the boundaries of the Eastern Burrard Inlet RCA, however, rockfish are not expected to be abundant in that general area, because the subtidal habitat is dominated by soft, muddy substrate rather than the hard substrate preferred by rockfish.

Trans Mountain Pipeline ULC Volume 7, Pipeline Facilities Technical Reports Trans Mountain Expansion Project Ecological Risk Assessment of Westridge Marine
Terminal Spills Technical Report
December 2013 REP-NEB-TERA-00020
Page 4-18
TABLE 4.5 DISTRIBUTION, SEASONAL TIMING AND CONSERVATION STATUS FOR ROCKFISH
Species Distribution and Seasonal Timing
Conservation Status
SARA BC COSEWIC
Quillback rockfish
Quillback rockfish mate from November to February and are born between March and July with a subsequent pelagic larval phase lasting 1 to 2 months (COSEWIC 2009). Quillback rockfish range from the Gulf of Alaska to southern California (COSEWIC 2009; Lamb and Edgell 2010). They occur in depths ranging from 16 to 182 m but are most common between 50 to 100 m (COSEWIC 2009, DFO 2012c, DFO 2006).
No Status No Status Threatened
Copper rockfish
Like the quillback, copper rockfish mate in the fall and are born in the spring with a subsequent pelagic larval phase lasting 1 to 2 months. Copper rockfish range from Baja California to the Gulf of Alaska (Hart 1973, Lamb and Edgell 2010). Copper rockfish are found from the subtidal to depths of 180 m but are most common in shallow waters less than 40 m deep (DFO 2006).
No Status No Status No Status
Source: Conservation Status (BC CDC 2013)
Quillback Rockfish Quillback rockfish range from the Gulf of Alaska to southern California (COSEWIC 2009, Lamb and Edgell 2010). They have a distinctive high, spiny dorsal fin with deeply notched spines (COSEWIC 2009; Lamb and Edgell 2010). Adult fish are primarily brown with yellow or light tan toward the front of their body, dark fins, and a light coloured saddle patches extending into the dorsal fin (COSEWIC 2009, Hart 1973).
Quillback rockfish occur in depths ranging from 16 to 182 m but are most common between 50 to 100 m in depth (COSEWIC 2009, DFO 2012c, DFO 2006). This species prefers habitat with hard substrates such as rock reefs and ridges, steep relief, and high benthic complexity (COSEWIC 2009, DFO 2012c). They are often found in inlets near rocky reefs and in shallow rock piles (DFO 2006, Hart 1973). Quillback rockfish can live as long as 95 years in British Columbia and can reach lengths of 61 cm (COSEWIC 2009, DFO 2006, Hart 1973, Yamanaka and Lacko 2001). Approximately half of all fish will reach maturity at age 11 (COSEWIC 2009). Quillback rockfish mate from November to February and are born between March and July with a subsequent pelagic larval phase lasting 1 to 2 months (COSEWIC 2009). Larvae and juvenile rockfish are found in the water column at depths of <300 m where they are dispersed by oceanographic processes (COSEWIC 2009). At 6 to 9 months of age, juvenile rockfish will settle in benthic habitats where they feed on small invertebrates (COSEWIC 2009, DFO 2001c). The diet of adult rockfish consists of fish and invertebrates (COSEWIC 2009).
Visual surveys in the Strait of Georgia estimated the abundance of quillback rockfish to be 2.23 million individuals in the 527 km2 survey area (COSEWIC 2009). Studies on quillback rockfish populations in British Columbia indicate they have declined 50% to 75% since the mid-1980s (DFO 2012c).
Copper Rockfish Copper rockfish range from Baja California to the Gulf of Alaska (Hart 1973, Lamb and Edgell 2010) and are found from the subtidal to depths of 180 m but are most common in shallow waters less than 40 m deep (DFO 2006). They prefer rocky habitats and kelp beds and are often found around pilings and jetties (DFO 2006, Lamb and Edgell 2010). Copper rockfish are known to prey on crab, squid, octopus, spiny dogfish, sand lance, herring, anchovy, surf perches, sculpins, greenlings, and other rockfishes (Alaska Marine Fisheries Center 2013, Lamb and Edgell 2010). The overall status of copper rockfish populations in British Columbia is unknown although they are relatively common on rocky reefs in shallow waters of the Strait of Georgia (Hart 1973).
Biological information about copper rockfish is limited (DFO 2001). Copper rockfish have olive brown to copper colouration with pink and yellow blotches, white undersides, and a clear, whitish, or pink lateral line (Hart 1973, Lamb and Edgell 2010). This species has a maximum life span of 45 to 50 years and can

Trans Mountain Pipeline ULC Volume 7, Pipeline Facilities Technical Reports Trans Mountain Expansion Project Ecological Risk Assessment of Westridge Marine
Terminal Spills Technical Report
December 2013 REP-NEB-TERA-00020
Page 4-19
reach a length of 66 cm (DFO 2006, DFO 2001). Like the quillback, copper rockfish mate in the fall and are born in the spring with a subsequent pelagic larval phase lasting 1 to 2 months.
4.6.4 Marine Birds and Bird Habitat
The following descriptions of the marine bird community of Burrard Inlet have been extracted with some modification from the Marine Birds, Westridge Marine Terminal Technical Report (Stantec 2013b) Volume 5C.
Burrard Inlet has been designated as an Important Bird Area (IBA020 - English Bay & Burrard Inlet) by BirdLife International, a partnership of Nature Canada and BC Nature (Bird Studies Canada and Nature Canada 2013, Birdlife International 2012). Approximately 110 of the 307 species recorded in the IBA throughout the year are marine birds and waterfowl. The area attracts tens of thousands of migratory birds along the Pacific Flyway, is globally important habitat for western grebes, Barrow‟s goldeneye, and surf scoter, and is nationally important habitat for great blue herons (BIEAP 2002, Bird Studies Canada and Nature Canada 2013, BirdLife International 2012). Bird abundance in the inlet has been recorded at more than 24,000 birds during peak spring months (Breault and Watts 1996, BIEAP 2002). The marine areas of Central Harbour have the greatest abundance of waterbirds recorded here. The highest diversity of marine bird species is recorded near Port Moody, First Narrows and Second Narrows (Breault and Watts 1996).
Endangered or Threatened bird species known to use Burrard Inlet seasonally or year-round include the marbled murrelet, surf scoter, red-necked phalarope, western grebe, Clarke‟s grebe, pelagic cormorant, double-crested cormorant, California gull, great blue heron and purple martin (BC CDC 2013, BIEAP 2002, Breault and Watts 1996).
Long term data sets compiled to characterize marine bird distribution and abundance in the study area indicated a total of 121 different waterbird species (813,647 individuals) recorded between 1962 and 2012. These data were derived from the following sources (NatureCounts 2013):
British Columbia Breeding Bird Atlas (2008 – 2012) British Columbia Breeding Bird Atlas, Rare Occurrences (2008 – 2012) British Columbia Coastal Waterbird Surveys (1999 – 2012) eBird (1962 – 1963; 1966 – 1971; 1976 – 2012) Great Backyard Bird Count (1998 – 2012).
The British Columbia Breeding Bird Atlas documented 32 different species between 2008 and 2012. The greatest number of species was recorded by eBird (710,269 individuals; 118 species). Most observations were of mallard (23.3%), Canada goose (9.6%), northwestern crow (8.8%) and glaucous-winged gull (8.7%)
Of the 121 species recorded in the study area, 17 are designated as Blue (special concern) and four are designated as Red (endangered or threatened) under the British Columbia Wildlife Act. The red-listed species include black-crowned night heron (1 individual), Brandt‟s cormorant (97 individuals), pelagic cormorant (10,196 individuals) and the western grebe (3,431 individuals). Marbled murrelets are protected under SARA and designated as Threatened. Only 25 marbled murrelets were recorded by eBird and no other survey recorded the presence of marbled murrelets in the study area.
A summary of the distribution, seasonal timing and conservation status for marine birds considered to be likely present around the WMT is presented in Table 4.6.

Trans Mountain Pipeline ULC Volume 7, Pipeline Facilities Technical Reports Trans Mountain Expansion Project Ecological Risk Assessment of Westridge Marine
Terminal Spills Technical Report
December 2013 REP-NEB-TERA-00020
Page 4-20
TABLE 4.6 DISTRIBUTION AND SEASONAL TIMING FOR MARINE BIRDS
Species Distribution and Seasonal Timing
Conservation Status
SARA BC COSEWIC
Pelagic cormorant
There are two subspecies of pelagic cormorant which occur in this region: Phalacrocorax pelagicus pelagicus in winter (provincially Red-listed in British Columbia [BC CDC 2013]); and the resident P. p. resplendens which breeds from southern British Columbia northwards (Campbell et al. 1990a). Pelagic cormorants prefer rocky coasts and sheltered habitat such as harbours and coves, and are rarely found far within inlets. Cliffs, reefs, unvegetated rocky islets and human-made structures, such as bridges and wharves, provide roosting habitat (Campbell et al. 1990a). Breeding colonies are located on rocky cliffs of islands or headlands, in caves, and on bridge pylons, towers, navigational beacons and other human-made structures (Campbell et al. 1990a). Within Haro Strait, they have been recorded on Mandarte, Great Chain Islands, Five Finger Island, Gabriola Island cliffs, Galiano Island cliffs, Hudson Rocks and Snake Island, North Pender Island cliffs, and Arbutus Island (Chatwin et al. 2002). Between 1955 and 2000, the number of pelagic cormorant nests within the Strait of Georgia declined by approximately 55% (Chatwin et al. 2002); however, in recent years populations have been stable (Crewe et al. 2012). Pelagic cormorants are divers that select prey from the littoral-benthic zone and are bottom feeders of solitary fish and invertebrates that live in rocky areas (Hobson 1997, Campbell et al. 1990a, Ainley et al. 1981).
P. p. pelagicus
No Status Red No Status
P. p. resplendens
No Status Yellow No Status
Great blue heron
The great blue heron is widely distributed along the coast throughout the year, breeding mainly along southeastern Vancouver Island, the Southern Gulf Islands, the Fraser Lowlands, and east towards Hope (Campbell et al. 1990a). There are two subspecies of great blue heron in this region: Ardea herodias Herodias; and A. h. fannini (Vennesland 2004). It is primarily the fannini subspecies that breeds in the Strait of Georgia, with the herodias subspecies inhabiting the British Columbia interior (Vennesland 2004). Both subspecies are Blue-listed in British Columbia (BC CDC 2013), and the fannini subspecies is listed as a species of Special Concern under Schedule 1 of SARA (COSEWIC 2008).
A. h. fannini
Special Concern
Schedule 1 Blue
Special Concern
A. h. herodias
No Status Blue No Status
Barrow’s goldeneyes
Barrow’s goldeneyes are widely distributed along the British Columbia coast; less common in summer than in winter. Breeding occurs in the British Columbia interior with departure from winter ranges beginning in March. Wintering birds arrive on the coast in October (Campbell et al. 1990a).
No Status Yellow No Status
Bald eagle
The bald eagle is a widely distributed resident raptor present year round on the southwest coast (Campbell et al. 1990b). Within Burrard Inlet, the largest numbers of bald eagles are reported from Indian Arm with population spikes corresponding to peak fish runs and sightings of 75 individuals at once (Breault and Watts 1996). Bald eagles are culturally important to Aboriginal communities (Miller 1957). Nesting occurs mostly in large old-growth or mature conifers primarily near lakes, large rivers, seashores, creeks, marshes or other bodies of water (Buehler 2000, Campbell et al. 1990b, Anthony et al. 1982, Keister 1981). There are several nest sites documented along the shores of Burrard Inlet and Indian Arm.
No Status Yellow Not At Risk
Glaucous-winged gulls
Glaucous-winged gulls are abundant and widespread along much of the Pacific coast maintaining a presence year round in a broad range of habitats (Hayward and Verbeek 2008, Campbell et al. 1990b).
No Status Yellow No Status
Spotted sandpiper
The spotted sandpiper is widespread along much of the coast from late spring to early fall. It breeds from northern Alaska southward through most of Canada, wintering from southwestern British Columbia to northern Chile (Campbell et al. 1990b). It is typically found in sparsely vegetated habitats near water but uses a variety of habitats including grasslands and forest. It inhabits the shorelines of virtually all waterways at all elevations, frequenting areas where small streams drain across tidal mud (Guiguet 1955). Other habitats include rain pools, sewage lagoons, and seaweed flotsam on sandy beaches (Campbell et al. 1990b).
No Status Yellow No Status

Trans Mountain Pipeline ULC Volume 7, Pipeline Facilities Technical Reports Trans Mountain Expansion Project Ecological Risk Assessment of Westridge Marine
Terminal Spills Technical Report
December 2013 REP-NEB-TERA-00020
Page 4-21
TABLE 4.6 DISTRIBUTION AND SEASONAL TIMING FOR MARINE BIRDS
Species Distribution and Seasonal Timing
Conservation Status
SARA BC COSEWIC
Surf scoters
Surf scoters are medium-distance migrants that are widely distributed along the entire British Columbia coastline, especially during spring migration. The Strait of Georgia and the Burrard Inlet are particularly important winter and spring staging grounds. Southward migration from inland breeding areas occurs from late August to October (BC CDC 2013) and is usually at night (Butler and Savard 1985). Large aggregations occur from a few hundred to several thousand individuals. Wintering surf scoters usually forage within 1 km of the shore (Vermeer 1981). Non-breeding habitat includes sheltered freshwater and marine bays, harbours and lagoons. At these sites, birds prefer shallow marine waters, less than 10 m deep, with substrates of pebbles and sand (Goudie et al. 1994, Campbell et al. 1990b). This species rarely uses estuaries except during migration (Campbell et al. 1990b; Savard et al.1998). Large numbers forage near steep shores of fjords where food resources (e.g., mollusks) are abundant on submarine rocky walls (Vermeer 1981; Vermeer and Bourne 1984). Surf scoters eat aquatic invertebrates on its breeding grounds and mollusks in spring, fall, and winter (Savard et al. 1998).
No Status Blue No Status
Pigeon guillemot Pigeon guillemots are found along rocky coasts of the northern Pacific. Pigeon guillemots nest in burrows or rock cavities feeding near shore on fish and aquatic invertebrates (Ewins 1993).
No Status Yellow No Status
Source: Conservation Status (BC CDC 2013)
4.6.5 Marine Mammals and Protected Habitat
The following description of marine mammals in Burrard Inlet have been extracted with some modification from the Marine Resources - Westridge Marine Terminal Technical Report (Stantec 2013a) Volume 5C.
Marine mammal diversity and abundance in Burrard Inlet is generally considered low. The most abundant and commonly observed species by far is the harbour seal (Phoca vitulina), which is resident within the inlet and throughout the coastal waters of British Columbia. Over the years, there have been occasional but rare sightings of other marine mammal species such as Steller sea lion (Eumetopias jubatus monteriensis) and California sea lion (Zalophus californianus), northern fur seal (Callorhinus ursinus), and harbour porpoise (Phocoena phocoena) (Marine Mammal Research Unit 2012). Killer whale (Orcinus orca), Pacific white-sided dolphin (Lagenorhynchus obliquidens), false killer whale (Pseudorca crassidens), grey whale (Eschrichtius robustus), humpback whale (Megaptera novaeangliae) and minke whale (Balaenoptera acutorostrata) have also made occasional appearances in Burrard Inlet or nearby waters (BC Cetacean Sightings Network 2013), although their use of this habitat is limited, and sightings are relatively uncommon.
4.6.5.1 Harbour seal
Harbour seals belong to the Family Phocidae (true seals) and are among the most widely distributed pinnipeds (i.e., seal or sea lion) in the northern hemisphere. In Canada, they are found in Pacific, Atlantic, and Arctic waters. Harbour seals on the Pacific coast belong to a separate sub-species (Pacific harbour seal; subspecies richardsi). Their range in the northeast Pacific Ocean extends from Baja California north to Bristol Bay, Alaska and west through the Aleutian Islands (DFO 2010b).
Harbour seals use both aquatic and terrestrial environments and do not migrate but instead reside in British Columbia‟s coastal waters and inlets year-round (Baird 2001, Bigg 1981). They are likely the most commonly sighted marine mammal in British Columbia and prefer near shore habitats including sounds, inlets, straits, marinas and harbours, and have also been known to occur in river estuaries (Baird 2001). Terrestrial haulout sites, used for resting, mating, and pupping include isolated rocks or islets, sandbars, log booms, and recreational floats (Baird 2001).

Trans Mountain Pipeline ULC Volume 7, Pipeline Facilities Technical Reports Trans Mountain Expansion Project Ecological Risk Assessment of Westridge Marine
Terminal Spills Technical Report
December 2013 REP-NEB-TERA-00020
Page 4-22
As a true seal, harbour seals lack external ear flaps and have short flippers. Their coats vary in colour from light grey to dark brown or black with spots, rings, and blotches. Harbour seals average 0.8 m in length at birth and 1.5 m as adults; males are slightly larger than females (Baird 2001, Bigg 1981, McLaren 1993). Male and female harbour seals reach maturity at about 3 to 5 years of age (DFO 2010b). Harbour seals give birth to a single pup per year within a 1 to 2 month pupping season which varies geographically (Bigg 1981). In British Columbia, pups are born on land from mid-May to early-July in northern British Columbia, and from early-July to mid-August in southern British Columbia (DFO 2010b).
The diet of harbour seals varies between seasons, geographic areas, age, and habitat (Baird 2001). In the Strait of Georgia, their diet consists primarily of Pacific hake (Merluccius productus), Pacific herring, plainfin midshipman (Porichthys notatus), salmon, and lingcod (Ophidon elogatus) (Baird 2001, Olesiuk 1993).
Harbour seals in British Columbia were commercially harvested for pelts from 1879 to 1914 and 1962 to 1968 (Baird 2001, DFO 2010b). From 1914 to 1964, harbour seals were also harvested as part of a predator control program. DFO estimates that half a million seals were killed in British Columbia between the 1879 and 1968 (DFO 2010b). In 1970, harbour seals were legally protected by the Government of Canada under the Seal Protection Regulations. These regulations were later incorporated into the Marine Mammal Regulations in 1993 under the Fisheries Act. These regulations prohibit the unauthorized killing, hunting, and disturbance of harbour seals in Canada. Since these regulations came into effect, the Pacific coast population of harbour seals has returned to or exceeded historic levels. As such, they are not listed on SARA and were last designated by COSEWIC as Not at Risk in 1999 (COSEWIC 2011).
DFO has conducted aerial surveys of harbour seals in British Columbia since the early 1970s to determine abundance and distribution and to monitor population trends (DFO 2010b). As of 2009, approximately 82% of British Columbia‟s 27,200 km coastline had been surveyed, with nearly 1,400 haulout sites identified. Data from these surveys indicate that the harbour seal population grew exponentially during the 1970s and 1980s at a rate of about 11.5% per year, before slowing in the 1990s (DFO 2010b). In 2008, the harbour seal population in British Columbia was estimated to be 105,000 individuals and appears to have stabilized (DFO 2010b). Highest densities were observed in the Strait of Georgia, with an average of 3.1 seals per kilometre of shoreline. DFO estimates that the British Columbia population represents about 29% of the 360,000 harbour seals estimated to inhabit the Northeast Pacific Ocean (DFO 2010b).
Harbour seals show high site fidelity (Baird 2001, DFO 2010b). They gather in groups as large as several hundred to several thousand individuals at haulout sites, but they are usually solitary or in small groups in the water and do not congregate to breed (Baird 2001, Bigg 1981). The mean haulout group size in the Strait of Georgia is 22 individuals (Baird 2001, Bigg 1981). Estimated seal densities in Burrard Inlet are moderate (BC Marine Conservation Analysis 2010) and seals may be observed year-round. Important Areas identified by DFO for harbour seals are in the Marine Resources - Westridge Marine Terminal Technical Report (Stantec 2013a) Volume 5C. The relevant distribution, seasonal timing and conservation status for harbor seals are summarized in Table 4.7.
TABLE 4.7 DISTRIBUTION AND SEASONAL TIMING FOR HARBOUR SEAL
Species Relevant Distribution and Seasonal Timing
Conservation Status
SARA BC COSEWIC
Harbour seal
Estimated seal densities in and around Burrard Inlet are moderate (BC Marine Conservation Analysis 2010) and seals may be observed year-round. Harbour seals use both aquatic and terrestrial environments and do not migrate but instead reside in British Columbia’s coastal waters and inlets year-round (Baird 2001, Bigg 1981). Male and female harbour seals reach maturity at about 3 to 5 years of age (DFO 2010b). Harbour seals give birth to a single pup per year within a 1 to 2 month pupping season which varies geographically (Baird 1981). In British Columbia, pups are born on land from mid-May to early-July in northern British Columbia, and from early-July to mid-August in southern British Columbia (DFO 2010b).
--- Yellow Not At Risk
Source: Conservation Status (BC CDC 2013)

Trans Mountain Pipeline ULC Volume 7, Pipeline Facilities Technical Reports Trans Mountain Expansion Project Ecological Risk Assessment of Westridge Marine
Terminal Spills Technical Report
December 2013 REP-NEB-TERA-00020
Page 4-23
4.6.5.2 Harbour Porpoise
Harbour porpoises belong to the Family Phocoena and are generally recognized as the smallest cetacean species. In Canada they are found primarily over Pacific and Northwestern Atlantic continental shelves and divided into two populations: the Pacific Ocean population and the North Atlantic population. They can be found throughout British Columbia coastal waters (COSEWIC 2003c). Based on the available information, harbour porpoise do not migrate but instead reside in British Columbia‟s coastal waters and inlets (excluding deep water fjords) year-round (Baird and Guenther 1995). They prefer shallower waters (less than 200 m depth) and areas of lower current flow (COSEWIC 2003c).
Harbor porpoises are generally dark grey to black on the dorsal surface with white bellies. They average 0.8 to 0.9 m in length at birth and close to 2 m as adults; with females generally slightly larger than males (Baird and Guenther 1995, Read and Tolley 1997). The diet of harbour porpoises consists primarily of schooling fish. Stomach content studies of individuals from southern British Columbia indicate a diverse diet with common prey items such as market squid (Loligo opalescens), Pacific herring and Pacific hake (COSWEIC 2003c). Information on the reproduction of the Pacific Ocean population is mainly based on stranded animals with some inference from other populations. For example, mean age to sexual maturity has not been determined for the Pacific Ocean population, but is estimated to be three to four years for the North Atlantic population. In British Columbia, pups are born from May to September (COSEWIC 2003c). The relevant distribution, seasonal timing and conservation status for harbor porpoise is summarized in Table 4.8.
TABLE 4.8 RELEVANT DISTRIBUTION AND SEASONAL TIMING FOR MARINE MAMMALS – HARBOUR PORPOISE
Species Relevant Distribution and Seasonal Timing
Conservation Status
SARA BC COSEWIC
Harbour porpoise
(Pacific Ocean population)
Based on the available information, harbour porpoise do not migrate but instead reside in British Columbia’s coastal waters and inlets (excluding deep water fjords) year-round (Baird and Guenther 1995). They prefer shallower waters (less than 200 m depth) and areas of lower current flow (COSEWIC 2003c). In British Columbia, calves are born from May to September (COSEWIC 2003c).
Special Concern
Schedule 1 Blue
Special Concern
Source: Conservation Status (BC CDC 2013)
4.7 Aboriginal Traditional Use of Marine Resources within Burrard Inlet
The following description of Aboriginal Traditional Use within the RSA has been extracted from the Marine Resources - Westridge Marine Terminal Technical Report (Stantec 2013a) Volume 5C, and Marine Birds - Westridge Marine Terminal Technical Report (Stantec 2013d) Volume 5C. Further information may also be obtained from the Marine Resources - Marine Transportation Technical Report Volume 8A.
Traditional marine resource harvesting remains an important activity for coastal Aboriginal communities, sometimes defined in terms of spiritual, emotional, mental and physical components (Gardner 2009). Coastal communities traditionally and actively managed the marine environment to maintain ecological integrity and to protect and preserve biodiversity; an example reported by Gardner (2009) described how “shellfish resources were managed by transplanting shellfish from one area to another, digging over beaches and modifying intertidal zones to increase clam and oyster growing grounds to increase production.” Marine resources are used culturally to highlight special events such as feasts while an extensive recorded vocabulary for sustainable management of marine resources demonstrates an historical understanding of the economic implications of marine subsistence, the food chain, the location and movement of food sources and currents (Gardner 2009).
Marine resources traditionally harvested within the study area include barnacles, butterclams, cockle clams, manila clams, horse clams, littleneck clams, Dungeness and red rock crab, giant red chiton, green and red sea urchin, mussels, oysters, northern abalone, octopus, prawns, sea cucumber and herring roe. Sandy, exposed shorelines were important habitats for harvesting clams, oysters and mussels, and eelgrass beds were locations for harvesting crabs (Jacques Whitford Ltd. 2006).

Trans Mountain Pipeline ULC Volume 7, Pipeline Facilities Technical Reports Trans Mountain Expansion Project Ecological Risk Assessment of Westridge Marine
Terminal Spills Technical Report
December 2013 REP-NEB-TERA-00020
Page 4-24
Aboriginal communities traditionally practiced duck, goose, grouse and waterfowl hunting as well as snaring of mudhen, mallard and crane (DFO and EC 2006). Duck species would be hunted by net and spear whereby nets would be baited and anchored underwater and then thrown over the flock in order to take a large number of ducks at a time (Suttles 2006). Duck species often hold cultural importance to coastal communities, and their feathers were used to insulate clothing (DFO and EC 2006, Suttles 2006).

Trans Mountain Pipeline ULC Volume 7, Pipeline Facilities Technical Reports Trans Mountain Expansion Project Ecological Risk Assessment of Westridge Marine
Terminal Spills Technical Report
December 2013 REP-NEB-TERA-00020
Page 5-1
5.0 EXPOSURE AND HAZARD/EFFECTS ASSESSMENTS The effects assessment methodology presented in this section is based on an approach used for the Aleutian Islands Risk Assessment (AIRA, ERM 2011). The AIRA is an ongoing program being carried out on behalf of the US National Fish & Wildlife Foundation (NFWF), Coast Guard (USCG) and State of Alaska Department of Environmental Conservation (ADEC) to evaluate the likely characteristics and consequences of vessel accidents and spills in the Aleutian Islands. The specific methods used here are modified slightly, chiefly to reflect differences in the availability and format of data; and in addition to reflect the purpose of the present study, which is to support the NEB Application and the information needs and requirements of the NEB and Canadian Environmental Assessment Act (CEA Act).
Likelihood refers to a probabilistic assessment of some defined outcome having occurred or occurring in the future. In this report, when discussing the likelihood of certain outcomes, a set of associated meanings are as follows as defined by the International Panel on Climate Change (IPCC 2013) should be considered. The introduction of the terminology below it is not intended to restrictively apply the definitions to the associated probability values; rather it is intended to associate language with probability ranges in order to facilitate discussion more generally.
Virtually certain >99% probability of occurrence Very likely 90 to 99% probability Likely 66 to 90% probability About as likely as not 33 to 66% probability Unlikely 10 to 33% probability Very unlikely 1 to 10% probability Exceptionally unlikely <1% probability.
5.1 Effects Assessment Approach
The exposure and hazard/effects assessment steps involve considering first, what the probability of oiling would be for any given location within the RSA in the event of an accidental oil spill. This information was obtained from the stochastic modeling results at four levels of intensity. A low probability of oil exposure was assigned to areas having <10% probability. Areas having a probability of ≥10% but <50% were assigned a medium level of intensity. A high level of intensity was assigned to areas having a probability of oiling ≥50% but <90%, and a very high level of intensity was assigned to areas having a probability of oiling ≥90%. These exposure levels are illustrated for the winter, spring, summer and fall season stochastic modeling results.
The potential consequences in terms of negative environmental effects from crude oil exposure from each spill scenario are evaluated for four main ecological receptor group/habitat combinations including the following
Shoreline and Near Shore Habitats Marine Fish and Supporting Habitat Marine Birds and Supporting Habitat Marine Mammals and Supporting Habitat.
These four ecological receptor groups are intended to broadly represent all of the marine resources of the RSA, as previously described, comprising ecological resources and supporting habitat, including water, sediment and air quality. Each of the four ecological receptor groups contains a variety of habitats and/or individual receptor types of differing sensitivity to crude oil exposure. The potential ecological consequences of crude oil exposure at any given location are considered to be defined by the overlap of the likelihood of crude oil presence in the event of an accidental spill, and the sensitivity of ecological habitat or receptors that may be present at that location.
The effects assessment considers both the probability of oiling, and the sensitivity of the ecological resources present. By superimposing the probability of oiling onto the ecological resource sensitivity maps, this overlap can be visualized, and using GIS tools, quantified. Depending upon the types of

Trans Mountain Pipeline ULC Volume 7, Pipeline Facilities Technical Reports Trans Mountain Expansion Project Ecological Risk Assessment of Westridge Marine
Terminal Spills Technical Report
December 2013 REP-NEB-TERA-00020
Page 5-2
ecological resources, this quantification process can evaluate either the length of shoreline (km) or the area of a particular habitat type (km2) that is potentially affected at low, medium, high or very high probability levels. Because a low probability of oiling indicates that oil exposure is unlikely, this analysis will focus on areas having medium, high or very high probability of oil exposure. The analysis is presented in tabular format, so that the amount of habitat exposed to different probabilities of oiling can be quantified, and then put into context by comparing this amount of habitat with the quantity of such habitat present within the RSA. This analysis is completed for ecological receptors having a range of biological sensitivity levels, for each season.
In addition to evaluating and ranking the intrinsic sensitivity to oiling or crude oil exposure of individual ecological receptors, receptor groups and/or the supporting habitat, where a receptor has status as an endangered species, this status will be considered as an additional factor when evaluating the importance of negative environmental effects caused by each hypothetical crude oil spill scenario. Likewise, the presence of provincial and national parks or other designated conservation areas represents an additional factor to consider (i.e., societal values) on top of the intrinsic biological sensitivities.
An overview of the modelling framework and the presentation of results are provided in Sections 5.2 and 5.3. Details of the sensitivity ranking scheme for the various ecological receptor groups are provided in Section 5.4.
5.2 Marine Oil Spill Modelling Framework
Stochastic crude oil spill modelling simulations were completed by EBA (2013) to support this PQERA and to inform the oil spill response planning for the Project. The stochastic simulations were based on the hypothetical spill scenarios developed by DNV as outlined in Section 4.
Stochastic simulations were performed for a complete annual cycle to take into consideration seasonal variations in winds and currents, with hypothetical accidental releases of CLWB at the WMT being initiated every three hours throughout the year. All hypothetical spill simulations were allowed to run for up to 15 days, 360 or more stochastic runs being performed for each simulation. No consideration was given to possible mitigation, such as oil spill response activities, except in the context of biological recovery from harm caused by spilled oil. Details of the stochastic modelling completed by EBA are provided in the Modelling the Fate and Behaviour of Diluted Bitumen Spills in the Marine Environment, at Westridge Terminal and in the Lower Fraser River for the Trans Mountain Expansion Project - Technical Report – Volume 8C.
EBA provided a data package for the results of each spill scenario including wind speed and direction charts, probability contours for surface water oiling, probability contours for shoreline oiling, time to first contact and length of shoreline oiling, length of shoreline contacted per coastal class, amount of dissolved oil, mass balance results (including on-water and on-shore oiling, oil evaporated, dispersed, biodegraded, and dissolved), as well as average slick area and thickness. Table 5.1 provides a summary of each of the modelling outputs and how the data was utilized in the PQERA.
TABLE 5.1 SUMMARY OF MODELLING OUTPUTS FOR EVALUATING EFFECTS
Model Output Description Use for Evaluating Effects Examples of Ecological
Receptor Groups
Monthly wind speed and direction charts
Stick chart of daily wind speeds and direction for each month.
An aid to understanding differences between seasons.
n/a
Probability contours for overall surface water oiling
Probability of oil presence at a location at some point in time during the duration of a simulation, evaluated using 360 or more individual crude oil spill simulations per season.
Calculated total area of surface water oiling for each scenario according to probability ranges. • 0 - <10 • 10 - <50 • 50 - <90 • 90 – 100
Marine Fish and Supporting Habitat
Marine Birds and
Supporting Habitat
Marine Mammals and Supporting Habitat

Trans Mountain Pipeline ULC Volume 7, Pipeline Facilities Technical Reports Trans Mountain Expansion Project Ecological Risk Assessment of Westridge Marine
Terminal Spills Technical Report
December 2013 REP-NEB-TERA-00020
Page 5-3
TABLE 5.1 SUMMARY OF MODELLING OUTPUTS FOR EVALUATING EFFECTS
Model Output Description Use for Evaluating Effects Examples of Ecological
Receptor Groups
Probability contours for shoreline oiling (end of
simulation)
Probability of oil contacting and adhering to a shoreline segment during the duration of a simulation, evaluated using approximately 360 or more individual crude oil spill simulations per season.
Calculated total length of shoreline oiling for each scenario according to probability ranges. • 0 - <10 • 10 - <50 • 50 - <90 • 90 – 100
Shoreline and near shore habitats
Time to first shoreline contact
Estimated time (in days) to first contact with the shoreline
An indicator of whether shorelines would be contacted by fresh or weathered crude oil.
n/a
Length of Shoreline Contacted
Estimated total length of shoreline contacted at the end of the simulation.
Limited use in the PQERA. To be considered in deterministic scenario evaluation.
Marine Birds and Supporting Habitat
Marine Mammals and
Supporting Habitat
Length of Shoreline Contacted by Shoreline
Type
Estimated length of shoreline contacted for each shoreline type.
Used to evaluate effects on shorelines of differing sensitivity to crude oil exposure.
Shoreline and Near Shore Habitats
Amount of dissolved oil Daily amount of dissolved oil in m3 over the duration
of the spill Limited use in the PQERA. To be considered in deterministic scenario evaluation.
Marine Fish and Supporting Habitat
Mass Balance Estimated distribution of the crude oil in each environmental media (e.g., water surface, water column, shoreline, evaporated) according to time elapsed from the hypothetical spill.
Considered and discussed in the PQERA. To be considered in detail for the deterministic scenario evaluation.
n/a
Slick area and thickness Average daily slick area and thickness over the duration of the spill
Not used in the PQERA. To be considered in deterministic scenario evaluation.
n/a
Selected oil spill modelling output files are provided in Appendix B for the 160 m3 spill, and in Appendix C for the smaller 10 m3 spill.
5.3 Sensitivity Ranking of Ecological Resources for Assessment
The following sections provide the definition of the four ecological receptor group/habitat combinations and the rationale for the corresponding sensitivity ranking scheme for each.
5.3.1 Shoreline and Near Shore Habitats
Shoreline and near shore habitats are considered to include the intertidal or littoral zone, the area of the foreshore and seabed that is exposed at low tide, and submerged at high tide. Shoreline and near shore habitat types reflect their exposure to wind and wave action. Low-energy or protected shorelines found within the RSA almost always have a fine subsurface substrate (sand or mud), even though the surface veneer may be coarse pebble, cobble or boulder. The presence of a water-saturated fine subsurface layer is important because it provides a barrier that limits oil penetration of sub-surface sediment. In contrast, coarse (pebble, cobble or boulder) shorelines that are highly exposed to wind and wave action may be coarse to considerable depth, increasing permeability and the potential for retention or sequestration of stranded oil.
Tidal marshes are often associated with river mouths and estuaries, behind barrier islands, or on tidal flats where low-energy wave action and fine-grained sediment accumulation provides an elevated surface where marsh vegetation can become established. Eelgrass beds are typically found in subtidal areas with soft sediments, such as protected bays, inlets and lagoons.
Shoreline and near shore habitat characteristic data for the study area was available from existing coastal habitat mapping datasets. These are collectively referred to as the ShoreZone datasets and are managed

Trans Mountain Pipeline ULC Volume 7, Pipeline Facilities Technical Reports Trans Mountain Expansion Project Ecological Risk Assessment of Westridge Marine
Terminal Spills Technical Report
December 2013 REP-NEB-TERA-00020
Page 5-4
by the Integrated Land Management Branch in British Columbia, and by the Department of Natural Resources in Washington State. The data were collected and compiled by Coastal & Ocean Resources, resulting in a single data layer for the study area that represented shoreline characteristics. The total length of shoreline in the modeling area is approximately 15,900 km, and this is represented by 172,000 individual shore segments. The shorelines of the RSA for the WMT represent a small portion of this larger dataset.
A total of thirteen different shore types were defined for the Project, based upon descriptive information available in the ShoreZone datasets. These were classified based on the degree of exposure (either low or high), and then by the upper intertidal substrate types. The selected attributes from the dataset considered by the spill modeling team are summarized in the following Table 5.2. The substrate types range from sand through to rock, with additional classes for marsh, as well as rip rap or wood bulkheads or pilings such as may be used for shoreline protection. In addition, areas of eelgrass were also considered to fall within the “shoreline and near shore” habitat, giving a total of fourteen different shoreline and near shore habitat types.
TABLE 5.2 SHORE TYPES DEFINED FOR PROJECT
Exposure Upper Intertidal
Substrates No Code Spill Shore Type
Low (VP, P, SP)
Rock 1 LE_R Rock, low energy: assumed to be impermeable
Rock with pebble, cobble veneer
2 LE_VR Rock with veneer, low energy; a discontinuous veneer of pebble, cobble or boulder over rock
Pebble veneer 3 LE_V Pebble veneer over sand; a single layer of pebbles overlying sand, typical of low energy shorelines; stranded oil may attach to pebble but sand in subsurface limits penetration.
Cobble or boulder veneer 4 LE_CV Coarse veneer over sand; a single layer of cobbles or boulders overlying sand; sand limit subsurface penetration
Sand or mud 5 LE_S Sand or mud which typically has high water content and limits viscous oil penetration.
Rip Rap 6 LE_RR Course boulders or sometime concrete rubble that is commonly used as shore protection.
Marsh 7 LE_M Marsh
Wood 8 LE_W Wood bulkheads, generally assumed to be pilings and therefore somewhat porous.
High (VE, E, SE)
Rock 9 HE_R Impermeable rock surfaces; joint and fracture patterns may allow some oil retention
Rock with coarse veneer 10 HE_VR Boulder and cobble overlying bedrock creates potential for stranded oil retention
Boulder, cobble beaches (also includes few rip-rap sections)
11 HE_C Coarse boulder or cobble beaches assumed to have high penetration potential; may include coarse beaches associated with rock platforms; although high energy, penetration may result in lengthy persistence.
Sand with pebble, cobble or boulder
12 HE_SG Combinations of sand and various forms of gravel (pebble, cobble, boulder); and matrix is assumed to minimize penetration.
Sand 13 HE_S High energy sand beaches; sand will limit viscous oil penetration; sand is likely to be highly mobile so has the potential to bury stranded oil.
Source: Methods of Estimating Shoreline Oil Retention - Harper (2013), Volume 8C.
The fourteen shoreline and near shore habitat types were assigned to four biological sensitivity factors (BSF), on a scale of BSF = 1 (low sensitivity) to BSF = 4 (very high sensitivity). While the BSF are somewhat correlated with the tendency for shoreline types to absorb or retain spilled crude oil, they are based primarily on a consideration of habitat complexity and the ability of the different habitat types to sustain biodiversity and productivity. In this sense, exposed bedrock or sand substrates are considered to be subject to high levels of natural disturbance and have relatively low levels of biodiversity and productivity, whereas sheltered rocky substrates, marsh, and eelgrass beds have high biodiversity and productivity.

Trans Mountain Pipeline ULC Volume 7, Pipeline Facilities Technical Reports Trans Mountain Expansion Project Ecological Risk Assessment of Westridge Marine
Terminal Spills Technical Report
December 2013 REP-NEB-TERA-00020
Page 5-5
Table 5.3 provides a summary of the shoreline and near shore habitat types, and the rationale supporting their assignment to BSF classes. Biological sensitivity factors assigned to the various shoreline and near shore habitats are shown in Figure A.1 in Appendix A.
TABLE 5.3 SHORELINE AND NEAR SHORE HABITAT TYPES AND BIOLOGICAL SENSITIVITY FACTORS
Shoreline and Near Shore Habitat Type Comments Biological Sensitivity
Factor
Low exposure, rock Low exposure, sand
Low exposure, rip rap Low exposure, wood bulkheads
High exposure, rock High exposure, sand
High exposure, sand and gravel
• This is the least sensitive classification. A shoreline that has regular exposure to wave and tidal energy, no or low potential for subsurface oil penetration, and low oil retention.
• Because of the impermeable substrate and its exposure to waves, oil remains on the surface, thus allowing natural forces to remove the oil. Little or no clean-up is usually required.
• As a result of low habitat complexity, high exposure, or the artificial nature of some of the habitat types (e.g., rip rap, bulkheads), biological sensitivity is considered to be low.
1
Low exposure, veneer over rock Low exposure, pebble veneer over sand
High exposure, cobble/boulder veneer over rock High exposure, cobble/boulder
• These shorelines comprise low-sloping, well compacted substrates, often with underlying fine-grained sediment which limit oil penetration.
• Biological sensitivity is generally reduced as a result of low complexity or high exposure.
2
Low exposure, cobble/boulder veneer over sand • This shoreline has low exposure and higher complexity, giving greater
opportunity for higher levels of biodiversity. Underlying fine-grained sediments limit oil penetration.
3
Low exposure, salt marsh Low exposure, eelgrass
• These habitat types are considered to have the highest levels of complexity and productivity and to be important nursery and rearing areas for fish, in addition to being known to be highly sensitive to oil exposure.
4
5.3.2 Marine Fish and Supporting Habitat
Marine fish and supporting habitat are defined here as including marine fish, as well as marine invertebrates (e.g., mollusks and crustaceans), but not mammals and birds which are addressed elsewhere. Acute effects of spilled crude oil on fish and marine invertebrates are rarely observed, except in situations where crude oil is confined and dispersed into shallow water, such as may occur if crude oil is driven onto a shoreline or into a confined bay.
Acute effects of hydrocarbon exposure on fish are generally caused by exposure to relatively soluble components of the crude oil. Monocyclic aromatic hydrocarbons (MAHs) such as benzene, toluene, ethylbenzene or xylenes (BTEX compounds) or light polycyclic aromatic hydrocarbons (PAHs) such as naphthalenes, are usually considered to be the most likely contributors to acute toxicity, although some light aliphatic hydrocarbons may also contribute to toxicity. These compounds also tend to be volatile and are rapidly lost to the atmosphere, so the initial 24 to 48 hours following an oil spill represent the timeframe when acute toxicity is most likely to occur.
Two major mechanisms of toxicity to fish are recognized (although other more specific mechanisms may also exist). These are:
Non-polar narcosis, whereby reversible exposure to and accumulation of hydrocarbons from the water column causes interference with intracellular functioning at a target lipid site, potentially causing death if a critical hydrocarbon concentration is exceeded in the target lipid. Salmonid fish are among the more sensitive to the narcosis mode of action, and small fish are more sensitive than large fish.
Blue sac disease (BSD), whereby exposure to 3- and 4-ring PAH compounds results in a syndrome of cardiac, craniofacial, and/or spinal deformity and death in developing embryos. Sensitivity to BSD is greatest in newly fertilized eggs, and decreases with the hardening of the egg membrane, and with increasing developmental stage. Embryos of herring and salmon species are among the more sensitive to BSD.

Trans Mountain Pipeline ULC Volume 7, Pipeline Facilities Technical Reports Trans Mountain Expansion Project Ecological Risk Assessment of Westridge Marine
Terminal Spills Technical Report
December 2013 REP-NEB-TERA-00020
Page 5-6
As a result of the behaviour of crude oil spilled on water, the potential for toxicity to marine fish and supporting habitat is greatest in the surface water, where more soluble hydrocarbons can dissolve from the floating fresh crude oil, or from droplets that have been temporarily dispersed down in to the water column by wave action. The potential for acutely toxic concentrations of hydrocarbons to extend down into deep water is very low, as a result of the limited solubility of hydrocarbons, and the dilution that would accompany mixing into deep water.
Four BSF are defined for marine fish and supporting habitat, on a scale of BSF = 1 (low sensitivity) to BSF = 4 (very high sensitivity) as in Table 5.4. Marine fish and supporting habitat are assumed to comprise a wide variety of species, each of which has its own sensitivity to hydrocarbon exposure. For the non-polar narcosis mode of toxic action, it is usual to consider the toxicity of hydrocarbons to a sensitive species, defined as representing the 5‟th percentile on a species sensitivity distribution (Di Toro et al. 2000). Assuming that this synthetic sensitive species is the same regardless of the specific habitat under consideration, the sensitivity of the community becomes a function of the degree of exposure of the particular habitat to dissolved hydrocarbons. Therefore, the low end of the sensitivity scale is occupied by deep water habitat (BSF = 1), whereas the higher end of the sensitivity scale is occupied by shallow water habitat (BSF = 3). The highest biological sensitivity class is reserved for developing eggs and embryos in shallow water habitat represented here by herring spawning areas which are assigned to BSF = 4. Table 5.4 provides a summary of marine fish and supporting habitat, and the rationale supporting their assignment to BSF classes. Biological sensitivity factors assigned to the various habitats are shown in Figure A.2 in Appendix A.
TABLE 5.4 BIOLOGICAL SENSITIVITY CLASSIFICATION FOR THE MARINE FISH AND SUPPORTING HABITAT
Marine Fish and Supporting Habitat Comments Biological
Sensitivity Class
Water column and seabed (>30 m) • All life stages of transient, pelagic or bottom fish species, including mollusks and
crustaceans, found at depths >30 m. 1
Water column and seabed (>10 to <30 m) • All life stages of transient, pelagic or bottom fish species, including mollusks and
crustaceans, found at depths of 10 to 30 m 2
Water column and seabed (<10 m) • All life stages of transient, pelagic or bottom fish species, including mollusks and
crustaceans, found at depths of <10 m. 3
Herring Spawning Areas Rockfish Conservation Areas
Eulachon Critical Habitat Dungeness Crab Important Habitat
Salmon Streams and Important Areas
• Eggs, larvae, juveniles of Pacific herring or similar species, subject to developmental abnormalities such as BSD.
4
5.3.3 Marine Birds and Supporting Habitat
Seabirds are highly sensitive to spilled crude oil, due principally to the effects of oiling on feathers (i.e., loss of insulative properties and buoyancy), as well as to ingestion of crude oil or contaminated food. In addition, birds that are gregarious are potentially at greater risk of population-level effects if crude oil affects an area where they congregate or feed. The waters of the Strait of Georgia, Haro Strait, Juan de Fuca Strait and the Gulf Islands provide migratory, nesting, feeding and wintering habitat for a wide variety of shorebirds, gulls, waterfowl and alcids (auks). Many of these species can also be expected to be present within the RSA for the WMT.
The literature on the effects of spilled crude oil on birds is extensive. Table 5.5 provides a summary of the BSF classification for major groups or guilds of seabirds based on ERM (2011) and Williams et al. (1995). The classification scheme reflects guild membership, as is appropriate considering the similar lifestyle, behaviour, and exposure mechanisms that accompany the guilds. Biological sensitivity factors assigned to marine birds and supporting habitat in Burrard Inlet are shown in Figure A.3 in Appendix A

Trans Mountain Pipeline ULC Volume 7, Pipeline Facilities Technical Reports Trans Mountain Expansion Project Ecological Risk Assessment of Westridge Marine
Terminal Spills Technical Report
December 2013 REP-NEB-TERA-00020
Page 5-7
TABLE 5.5 BIOLOGICAL SENSITIVITY FACTORS FOR MARINE BIRDS AND SUPPORTING HABITAT
Marine Birds and Supporting Habitat Comments Biological
Sensitivity Factor
Waders and Shorebirds • Species are not present in large numbers and are widely distributed. • Shoreline dwelling species and waders have lower probability of oiling.
1
Gulls and Terns • Gulls and terns tend not to be fully marine in their lifestyle, and in addition tend to be coastal in distribution.
2
Ducks and Cormorants • Ducks and other waterfowl tend to be moderately sensitive to crude oil exposure, and may congregate.
• Cormorants also tend to be coastal in distribution. 3
Auks and Divers • Auks tend to be highly reliant on the marine environment, often coming to shore only to breed.
• Auks are highly sensitive to crude oil exposure as well as being highly exposed in open water areas.
• Auks often form breeding colonies and may congregate on the water in feeding areas.
4
5.3.4 Marine Mammals and Supporting Habitat
The marine waters of the study area provide habitat for a variety of marine and semi-aquatic mammals:
Terrestrial mammals, such as bears and moose, may at times frequent shoreline areas, depending upon the availability of food resources they may be seeking
Pinnipeds, including harbour seal and potentially other species Cetaceans, including harbour porpoise, as well as occasional southern resident killer whale,
humpback whale, and other species River otter, mink and occasional sea otter (sea otter are more common along the west coast of
Vancouver Island, but the presence of occasional individuals in the study area cannot be discounted).
The different types of mammals will have differing levels of exposure to spilled crude oil, as well as having differential sensitivity if exposed. Aquatic mammals such as sea otter, river otter and mink that rely upon fur for insulation in cold ocean water are extremely sensitive to oiling, as well as having potentially high exposure to crude oil ingestion, if coastal habitat is oiled. Mammals that rely upon blubber for insulation are less sensitive to external oiling, although the potential for mortality cannot be ruled out as a result of other exposure pathways or mechanisms.
Whales and seals may or may not avoid exposure to crude oil on the surface of the water. Inhalation of vapours is a potentially important exposure pathway during the early stages of an oil spill, as is potential ingestion of oil as a result of consuming oiled prey. Experience during the Exxon Valdez oil spill (EVOS) was equivocal (Exxon Valdez Oil Spill Trustee Council, EVOSTC 2013). While whales were observed swimming in areas close to the spill site, and were undoubtedly exposed to fumes from fresh oil, only circumstantial evidence links acute or chronic exposure to spilled oil with the disappearance of whales belonging to the AB (resident, fish-eating) and AT1 (transient, seal-eating) killer whale pods. Eight resident killer whale pods use Prince William Sound as part of their range, but of these, only the AB pod exhibited higher individual mortality rates following the EVOS. Members of this pod were also known to be subject to shooting by fishermen, as a result of conflicts associated with the longline fishery. Oil ingestion remains a potentially important exposure pathway, and fouling of baleen plates can have negative effects on baleen whales, although this would not be a problem for toothed whales. The potential for mortality of marine mammals as a result of acute exposure to hydrocarbon vapours will be considered quantitatively in the detailed quantitative ERA to be submitted as a supplemental study.
Wildlife species that are normally terrestrial (such as bear and moose) could be exposed to crude oil that strands along shorelines, or accumulates in coastal marshes or estuaries. External oiling and oil ingestion are a possibility for these animals, although they are not likely to result in mortality.

Trans Mountain Pipeline ULC Volume 7, Pipeline Facilities Technical Reports Trans Mountain Expansion Project Ecological Risk Assessment of Westridge Marine
Terminal Spills Technical Report
December 2013 REP-NEB-TERA-00020
Page 5-8
Table 5.6 provides a summary of the biological sensitivity factors applied to different types of marine mammals and supporting habitat that may be exposed to spilled crude oil. Biological sensitivity factors assigned to the various habitats are shown in Figure A.4 in Appendix A.
TABLE 5.6 BIOLOGICAL SENSITIVITY CLASSIFICATION FOR MARINE MAMMALS AND SUPPORTING HABITAT
Marine Mammals and Supporting Habitat
Comments Biological
Sensitivity Factor
Terrestrial Mammals • Terrestrial wildlife species that might use the upper intertidal zone, or species migrating through the area. Examples would include bear, moose, fox or raccoon
1
Pinnipeds • Pinnipeds include seals and sea lions. Seals such as the harbour seal would be common in Burrard Inlet. Sea lions would be most commonly observed along the marine transportation route. In addition to strictly marine habitat, sea lion haulouts are an important habitat feature. With their reliance on fat or blubber for insulation, seals are not as sensitive to external oiling as many sea birds or otters.
2
Whales • A variety of toothed and baleen whales, including harbor porpoise, southern resident killer whale, humpback whale, and other whales. The southern resident killer whale population is considered to be endangered. Although not particularly sensitive to the thermal effects of oiling (as a result of the role of blubber as insulation rather than fur), whales may be sensitive to inhalation of hydrocarbon vapours, and baleen may be fouled by exposure to crude oil.
3
Otters • Sea otters are unlikely to frequent the study area, except as occasional or transient animals, however, river otters are common in near shore areas, and around river mouths. Mink and otter would also be common along the coastline, foraging in the intertidal zone. It is assumed that otters could be found primarily in near shore areas, in water depths of 10 m or less. With their reliance on fur for insulation, otters are highly sensitive to crude oil exposure.
4
The potential for terrestrial mammal species and otters to be present along shoreline areas that could potentially become oiled following a hypothetical oil spill is considered to be similar throughout the marine study area. Likewise, the potential for pinnipeds and cetaceans to be present is considered to be essentially uniform throughout the study area. For pinnipeds, haulout areas are also known to be important, and shoreline oiling in proximity to known haulout areas is considered to be potentially important in terms of pinniped exposure to oil.
The marine mammal knowledge base is derived from a review of relevant scientific literature, publications, and technical reports (e.g., COSEWIC status reports and DFO‟s Canadian cience Advisory Secretariat [CSAS] reports), as well as local and regional data (e.g., BC Cetacean Sightings Network [BC CSN], BC Conservation Data Centre [BC CDC], British Columbia Marine Conservation Analysis [BC MCA]). The collection of information from these sources focused on marine mammal life history, broad habitat use, distribution, abundance, and effects of underwater noise.

Trans Mountain Pipeline ULC Volume 7, Pipeline Facilities Technical Reports Trans Mountain Expansion Project Ecological Risk Assessment of Westridge Marine
Terminal Spills Technical Report
December 2013 REP-NEB-TERA-00020
Page 6-1
6.0 RISK CHARACTERIZATION RESULTS – CREDIBLE WORST CASE AT WESTRIDGE MARINE TERMINAL
6.1 Summary of Stochastic Modelling Results
This section summarizes the evaluation of ecological effects resulting from a credible worst case spill which could potentially occur at the WMT during loading operations. The spill scenario considered here is based on the failure of a loading arm resulting in a release of 160 m3 of CLWB. Taking into consideration the standard procedure of deploying containment boom around the ship prior to the start of loading, it was assumed that 80% of the spilled oil (132 m3) would be retained within the boom, and 20% (28 m3) would escape and disperse into Burrard Inlet, subject to seasonal weather and oceanographic conditions. Four seasonal conditions were modelled, representing winter, spring, summer and fall.
For the hypothetical 160 m3 crude oil release considered for the WMT, while there is a high to very high probability of water surface oiling and/or shoreline oiling at the confluence of Indian Arm and Burrard Inlet, the probability of water surface oiling and/or shoreline oiling from a single individual crude oil spill to reach farther into Indian Arm and towards Port Moody, as well as west past Second Narrows is considered to be low. The overall results for each season were very similar, although some slight seasonal differences in the spill trajectories were identified, which are primarily as a result of variations in predominant current direction and speed, and/or predominant wind direction and speed.
6.1.1 Probability of Surface Oiling
Table 6.1 provides a summary of the spatial extent of surface oiling (km2) within the RSA for each season. Results are presented for each of three probability ranges (≥10%, ≥50% and ≥90%). The release location and probability contours for seasonal stochastic surface oiling are shown in Figures D.1 to D.4 in Appendix D.
Predictions indicate that between 14 and 17 km2 of the water surface near the WMT has a high to very high probability (≥50%) of being exposed to oiling, with the greatest spatial extent (17 km2) predicted during the spring season. The Regional Study Area (RSA) has a total water surface area of 115 km2. As such, the stochastic results indicate that approximately 15% of the RSA has a high probability of being oiled based upon this hypothetical scenario.
TABLE 6.1 AREA OF SURFACE OILING (BY PROBABILITY OF OILING)
Scenario Spill Volume (m3) Seasonal Condition
Maximum Average Slick Area (km2)
Total Affected Surface Area (km2) by Probability of Oiling
≥10% ≥50% ≥90%
1 Credible Worst Case 16,500 m3
Winter 4 32 15 2.9
Spring 4.4 35 17 3.1
Summer 4.6 33 15 2.8
Fall 4 28 14 5.3
It is important to correctly understand the data presented in Table 6.1. The values presented under the column headed “Maximum Average Slick Area (km2)” indicate, for the average simulated spill, the largest surface area of sea that was occupied by spilled oil at any given time step within the duration of the model run. When oil is spilled, the surface area of the slick increases rapidly to a maximum value, and then decreases as oil evaporates and strands on shorelines. However, the oil slick is not static, it is moved around by tides and winds, so that the total area swept or affected by the moving oil slick is greater than the surface area of the slick at any given time. The values presented under the columns headed “Total Affected Surface Area (km2)” indicate the probability, based on the stochastic oil spill model output, that particular grid squares in the marine oil spill model, each representing a unit of sea surface area, contained crude oil at the water surface during at least one time step within the duration of the model run. The three columns indicate the total area of sea surface swept by oil over the length of the oil spill simulation, at probability levels of ≥10%, ≥50% and ≥90%, respectively. It is important to understand that

Trans Mountain Pipeline ULC Volume 7, Pipeline Facilities Technical Reports Trans Mountain Expansion Project Ecological Risk Assessment of Westridge Marine
Terminal Spills Technical Report
December 2013 REP-NEB-TERA-00020
Page 6-2
the areas presented in these columns of Table 6.1, and the same data as represented by contour outlines in Figures D.1 to D.4 do not represent the surface area of a single, continuous oil slick.
Mass balance results showed that, at the end of the stochastic simulations (15 days), escaped oil is no longer present on the water surface; approximately 90% of the escaped oil would strand on shoreline, with the highest amount in the fall with the rest undergoing weathering processes on the water surface. Mass balance results from the EBA modelling output for the 160 m3 spill are presented in Appendix B.
6.1.2 Probability of Shoreline Oiling
Table 6.2 provides a summary of the spatial extent of shoreline oiling within the RSA. Results indicate a high to very high probability (≥50%) of between 8.3 km and 11 km of shoreline oiling, with the greatest spatial extent of oiling occurring during summer conditions. The RSA includes approximately 200 km of shoreline, therefore overall it is predicted that only about 5% of the shoreline habitat within the RSA has a high to very high probability of being oiled in the unlikely event of an accidental oil spill. The average length of shoreline oiling for each seasonal condition ranged between 15 km and 19 km. These lengths are larger than the ≥50% probability value, but less than the length represented by the 10% probability of shoreline oiling.
TABLE 6.2 LENGTH OF SHORELINE OILING (BY PROBABILITY OF OILING)
Scenario Spill Volume (m3) Seasonal Condition
Average length of Affected Shoreline (km)
Total Affected Shoreline Length (km) by Probability of Oiling
≥10% ≥50% ≥90%
1 Credible Worst Case 160 m3
Winter 15 33 8.3 0.9
Spring 17 38 8.6 1.3
Summer 19 35 11 0.7
Fall 15 30 8.7 1.5
6.2 Potential Environmental Effects to Shoreline and Near Shore Habitats
Of the 200 km of shoreline and near shore habitats in the RSA, 64% (128 km) is comprised of low and high exposures rock and sand, low exposure rip rap and wood bulkheads and high exposure sand and gravel and has been assigned a low biological sensitivity ranking (BSF = 1). Shorelines including low exposure veneer over rock, low exposure pebble veneer over sand, high exposure cobble/boulder veneer over rock and high exposure cobble/boulder represent almost 24% (48 km) of the coastline and are assigned a biological sensitivity ranking of medium (BSF = 2). Approximately 10% (20 km) of the RSA has a high biological sensitivity ranking (BSF = 3) and includes low exposure cobble/boulder veneer over sand. The highest biological sensitivity ranking (BSF = 4) is generally limited to more sheltered embayments located in proximity to Port Moody and represents less than 2% (4 km) of the shoreline in the RSA. The overlays of shoreline oiling probability for each shoreline and near shore sensitivity class are summarized in Table 6.3.
Shorelines with a high to very high probability of oiling (≥50%) generally represent less than 10% of the available habitat belonging to that BSF within the RSA. The worst case effects are seen for shoreline with a high sensitivity rating, where between 4.8% (spring) and 17% (summer) of the available habitat may be affected.
Stochastic results indicate that shoreline and near shore habitat types with highest biological sensitivity factor (i.e., 4) have a very low probability of being oiled, and that it is unlikely that any individual crude oil spill would result in oiling of these areas, which are located near Port Moody. Areas with high probability of oiling (≥50%) are limited to shoreline and near shore habitat types having biological sensitivity factors of 1 to 3, and are located in close proximity to the WMT. Areas of high probability of oiling (≥50%) represent only 3.7% to 4.5% of the total shoreline within the RSA assigned to BSF = 1; 3.8% to 5.5% of the total shoreline within the RSA assigned to BSF = 2; and 4.8% to 17% of the total shoreline within the RSA assigned to BSF = 3.

Trans Mountain Pipeline ULC Volume 7, Pipeline Facilities Technical Reports Trans Mountain Expansion Project Ecological Risk Assessment of Westridge Marine
Terminal Spills Technical Report
December 2013 REP-NEB-TERA-00020
Page 6-3
tochastic results also indicate areas with a high probability of oiling (≥50%) in proximity to the First Nation Reserves at Burrard Inlet 3 (Tsleil-Waututh First Nation) and Seymour Creek 2 (Squamish First Nation), both of which are located on the northern shoreline of Burrard Inlet. Contours indicating a high probability of oiling generally do not contact Provincial Parks, National Parks or Ecological Reserves, with the exception of the spring condition, when there is a high probability of surface water oiling extending to Racoon Island which is part of Indian Arm Provincial Park.
TABLE 6.3 SUMMARY OF EFFECTS ANALYSIS FOR SHORELINE AND NEAR SHORE HABITATS, CREDIBLE WORST CASE SCENARIO
Season Biological Sensitivity
Factor
Shoreline Length in RSA
(km)
Affected Shoreline and Near Shore Habitats (by Shoreline Oiling Probabilities)
Affected Length According to
Sensitivity Factor (km)
Percent Length According to Sensitivity Factor (%)
Medium (≥10%)
High (≥50%) Very High
(≥90%) Medium (≥10%)
High (≥50%) Very High
(≥90%)
Winter
1 130 15 4.7 0.9 12 3.7 0.7
2 47 11 1.8 --- 23 3.8 ---
3 21 7.3 1.8 --- 34 8.5 ---
4 3.7 --- --- --- --- --- ---
Spring
1 130 18 5.0 1.3 14 4.0 1.0
2 47 13 2.5 --- 27 5.5 ---
3 21 7.3 1.0 --- 34 4.8 ---
4 3.7 --- --- --- --- --- ---
Summer
1 130 17 5.6 0.7 14 4.5 0.6
2 47 11 1.3 --- 23 2.7 ---
3 21 7.2 3.7 --- 34 17 ---
4 3.7 --- --- --- --- --- ---
Fall
1 130 14 5.2 1.2 11 4.1 1.0
2 47 8.9 0.6 --- 19 1.3 ---
3 21 7.3 2.9 0.3 34 14 1.3
4 3.7 --- --- --- --- --- ---
In summary, the PQERA indicates that the shoreline and near shore habitats would be affected by spilled oil following the credible worst case oil spill event at the WMT. This is based upon the assumption of a 160 m3 oil spill, of which 80% is retained by a boom placed around the vessel being loaded. The affected areas generally represent a small fraction of total amount of shoreline belonging to each shoreline and near shore habitats sensitivity class within the RSA. The area with the highest probability of oiling and negative effects is located near the confluence of Indian Arm and Burrard Inlet. Although salt marsh and eelgrass habitats are considered to be highly sensitive to crude oil exposure, these habitats have a very low probability of oiling. Shoreline and near shore habitats classes with low exposure cobble/boulder veneer over sand would be most affected.
Very little of the potentially affected shoreline and near shore habitats in Burrard Inlet is of a type that would tend to sequester spilled crude oil. It is expected that shoreline clean-up and assessment techniques (SCAT) would be applied to the spilled crude oil that reached shorelines and that most of this oil would be recovered. Biological recovery from spilled oil, where shoreline communities were contacted by and harmed by the oil or by subsequent clean-up efforts, would be expected to lead to recovery of the affected habitat within two to five years.
6.3 Potential Environmental Effects to Marine Fish and Supporting Habitat
The RSA comprises approximately 115 km2 of habitat for marine fish and supporting habitat and includes habitats and species representing all four of the BSF classifications. Habitats classified by BSF = 1 (low) to BSF = 3 (high) are based on water depth, and are deemed to be exclusive with no overlap in area. However, BSF = 4 (very high) is based on critical habitats and important areas for specific species (such

Trans Mountain Pipeline ULC Volume 7, Pipeline Facilities Technical Reports Trans Mountain Expansion Project Ecological Risk Assessment of Westridge Marine
Terminal Spills Technical Report
December 2013 REP-NEB-TERA-00020
Page 6-4
as herring spawning areas), and can overlap areas with other sensitivity factors. Areas with a water depth of 30 m or more (BSF = 1) represent slightly more than 40% of the RSA (46 km2). Areas represented by BSF = 2 (water depths between 10 and 30 m deemed to have medium sensitivity), and areas with BSF = 3 (water depths less than 10 m, deemed to have high sensitivity) represent approximately 30% (34.5 km2) and 26.5% (30.5 km2) of the RSA, respectively. Critical habitats for herring, rockfish and Dungeness crab are combined as BSF = 4 (very high), and overlap with other areas. Overall the BSF = 4 areas represent approximately 15% (34.5 km2) of the RSA. The overlay of water surface oiling probability onto the marine fish and supporting habitat sensitivity classes is shown in Table 6.4.
Results indicate that areas with a high to very high (≥50%) probability of oiling represent 6.4% to 11% of the total area with water depths >30 m, 22% to 24% of the total area with water depths between 10 m and 30 m (BSF = 2), 11% to 13% of the total area with depths <10 m (BSF = 3) and 19% to 21% of the important habitat for rockfish and crab with the highest values typically encountered in the spring.
TABLE 6.4 SUMMARY OF EFFECTS ANALYSIS FOR MARINE FISH AND SUPPORTING HABITAT, CREDIBLE WORST CASE SCENARIO
Season Biological Sensitivity
Factor
Area in RSA (km2)
Affected Surface Water (by Surface Water Oiling Probabilities)
Area According to
Sensitivity Factor (km2)
Percent Area According to
Sensitivity Factor (%)
Medium (≥10%)
High (≥50%) Very High
(≥90%) Medium (≥10%)
High (≥50%) Very High
(≥90%)
Winter
1 49 11 3.8 0.2 22 7.6 0.4
2 35 12 7.8 2.2 35 22 6.3
3 30 9.0 3.4 0.5 29 11 1.7
4 18 7.6 3.3 1.2 43 19 7.0
Spring
1 49 12 5.2 0.1 25 11 0.2
2 35 12 8.3 2.4 36 24 6.7
3 30 9.9 3.9 0.6 32 13 2.1
4 18 8.3 3.7 0.6 47 21 3.5
Summer
1 49 11 3.2 0.3 22 6.4 0.7
2 35 14 8.5 2.1 40 24 6.0
3 30 7.6 3.3 0.4 25 11 1.3
4 18 6.5 3.3 1.4 37 19 7.8
Fall
1 49 9.2 3.2 1.6 19 6.4 3.3
2 35 13 8.1 2.9 36 23 8.3
3 30 6.7 3.2 0.8 22 11 2.5
4 18 6.0 3.3 2.1 34 19 12
Of a total of 49 km2 of deep water habitat in the RSA (with a low BSF ranking), between 3.2 and 5.2 km2 has a high or very high (≥50%) probability of oil exposure, representing between 6.4% and 11% of this habitat type within the RSA. Given the limited fetch of Burrard Inlet, and the low potential for oil droplets to become dispersed in the water column, it is very unlikely that fish would be harmed by exposure to crude oil in this habitat type.
Of a total of 35 km2 of intermediate depth habitat in the RSA (with a medium BSF ranking), between 7.8 and 8.5 km2 has a high or very high (≥50%) probability of oil exposure, representing approximately 22 to 24% of this habitat type within the RSA. Given the limited fetch of Burrard Inlet, and the low potential for oil droplets to become dispersed in the water column, it is very unlikely that fish would be harmed by exposure to crude oil in this habitat type.
Of a total of 30 km2 of shallow water habitat in the RSA (with a high BSF ranking), between 3.2 and 3.9 km2 has a high or very high (≥50%) probability of oil exposure, representing between 11 and 13% of this habitat type within the RSA. Given the limited fetch of Burrard Inlet, and the low potential for oil droplets to become dispersed in the water column, it is unlikely that fish would be harmed by exposure to

Trans Mountain Pipeline ULC Volume 7, Pipeline Facilities Technical Reports Trans Mountain Expansion Project Ecological Risk Assessment of Westridge Marine
Terminal Spills Technical Report
December 2013 REP-NEB-TERA-00020
Page 6-5
crude oil in this habitat type, however, in circumstances where crude oil is driven into shallow water habitat by strong winds, there would be a greater potential for negative effects, including potential mortality of fish, crustaceans and shellfish.
Of a total of 18 km2 of critical fish habitat in the RSA (with a very high sensitivity BSF = 4), between 3.3 and 3.7 km2 has a high or very high (≥50%) probability of oil exposure, representing between 19% and 21% of this habitat type within the RSA. Given the limited fetch of Burrard Inlet, and the low potential for oil droplets to become dispersed in the water column, it is unlikely that fish would be harmed by exposure to crude oil in this habitat type. However, where such high-sensitivity habitat overlaps with shallow water areas, the potential for negative effects would be greater. Critical time periods for herring spawn would be in the spring, when exposure to polycyclic aromatic hydrocarbons in the crude oil could cause developmental effects on fish embryos. As noted for shallow water habitat, the potential for negative effects would be greatest if the spill occurred at a time when strong winds caused the oil to be driven into shallow water that could be spawning or nursery areas for herring or crab.
In summary, the PQERA indicates that marine fish and supporting habitat would be affected by spilled oil following the credible worst case oil spill event at the WMT. This is based upon the assumption of a 160 m3 oil spill, of which 80% is retained by a boom placed around the vessel being loaded. The affected areas can represent a substantial fraction (up to 25%) of total amount of some of the habitat types evaluated, however, the potential for negative effects is generally low, as a result of the limited fetch of Burrard Inlet, and the low potential for dissolved hydrocarbon concentrations in water to reach thresholds that would cause mortality of fish or other aquatic life. This potential would be greatest in shallow water areas under weather conditions that caused spilled oil to be driven into shallow areas with wave action, leading to localized high concentrations of dissolved hydrocarbons in the water. This could result in the death of fish as a result of narcosis, or could cause abnormalities in developing embryos if spawn was present. The area with the highest probability of effects is located near the confluence of Indian Arm and Burrard Inlet. Critical habitats and spawning areas as well as developing eggs and embryos in shallow water habitat located in proximity to the WMT would be most affected.
As a result of the limited spatial extent of potential effects of spilled oil on marine fish and supporting habitat, and the generally low potential for the credible worst case scenario to cause acute lethality to fish, recovery of marine fish and supporting habitat would be rapid. Even under a worst-case outcome event where a localized fish kill might be observed, it is expected that the lost biological productivity would be compensated for by natural processes within one to two years.
6.4 Potential Environmental Effects to Marine Birds and Supporting Habitat
For marine birds and supporting habitat, the entire regional study area (representing an area 115 km2, including all of English Bay, Vancouver Harbour and Burrard Inlet) has been assigned to BSF = 4 (very high) as a result of its designation as an important bird area (IBA). The IBA designation is specific to western grebe and Barrow‟s goldeneye, which winter in the area. Other notable bird species present in the area include colonies of pigeon guillemot, pelagic cormorant and glaucous-winged gull, as well as many other recorded bird species.
Stochastic results identify areas of medium, high and very high probability of oiling for shorelines and the water surface that overlap the distribution of marine birds and supporting habitat. Although these areas demonstrate some seasonal variation, the extent of these areas is generally similar. Results (Table 6.5) indicate that less than 15% of the water surface within the IBA (BSF = 4) has a high or very high probability (≥50%) of being swept by an oil slick following the credible worst case spill. The areas with a very high probability of oiling (90% or higher) are located in close proximity to the terminal and generally extend less than 2 km away from it.

Trans Mountain Pipeline ULC Volume 7, Pipeline Facilities Technical Reports Trans Mountain Expansion Project Ecological Risk Assessment of Westridge Marine
Terminal Spills Technical Report
December 2013 REP-NEB-TERA-00020
Page 6-6
TABLE 6.5 SUMMARY OF EFFECTS ANALYSIS FOR MARINE BIRDS AND SUPPORTING HABITAT, CREDIBLE WORST CASE SCENARIO
Season Biological Sensitivity
Factor
Area in RSA (km2)
Affected Surface Water (by Surface Water Oiling Probabilities)
Area According to
Sensitivity Factor (km2)
Percent Area According
to Sensitivity Factor (%)
Medium (≥10%)
High (≥50%) Very High
(≥90%) Medium (≥10%)
High (≥50%) Very High
(≥90%)
Winter
1 --- --- --- --- --- --- ---
2 --- --- --- --- --- --- ---
3 --- --- --- --- --- --- ---
4 115 32 15 2.9 28 13 2.6
Spring
1 --- --- --- --- --- --- ---
2 --- --- --- --- --- --- ---
3 --- --- --- --- --- --- ---
4 115 35 17 3.1 30 15 2.7
Summer
1 --- --- --- --- --- --- ---
2 --- --- --- --- --- --- ---
3 --- --- --- --- --- --- ---
4 115 33 15 2.8 28 13 2.5
Fall
1 --- --- --- --- --- --- ---
2 --- --- --- --- --- --- ---
3 --- --- --- --- --- --- ---
4 115 28 14 5.3 25 13 4.6
The presence of seabirds and shorebirds is strongly seasonal, and each season will offer different species that could be negatively affected by spilled oil. Whereas there are relatively few nesting colonies, perhaps due in part to the largely urban characteristic of much of the shoreline, migrating birds will visit the area in spring and fall, and the mild winters support populations of waterfowl and other birds.
Burrard Inlet contains habitat for glaucous-winged gull, pelagic cormorant and surf scoter; however, it should be noted that the areas with high or very high probability of oiling (50% or higher) are generally located away from these bird colonies. Exceptions include two colonies of glaucous-winged gull and one colony of pelagic cormorant. The glaucous-winged gull is present year round in the IBA, and is not a species of management concern. However, one subspecies of pelagic cormorant which is present in this region, (Phalacrocorax pelagicus pelagicus) is provincially Red-listed and is present in the winter. The other pelagic cormorant species (P. p. resplendens) is considered a year round resident. (Campbell et al. 1990a). Surf scoters are widely distributed along the British Columbia coastline, especially during spring migration and Burrard Inlet is a particularly important staging ground in the winter and spring.
In summary the PQERA indicates that marine birds and supporting habitat would be affected by the CWC spill, however, the affected area would be small in comparison to the total available supporting habitat present within Burrard Inlet. Less than 15% of the IBA would have a high or very high probability of oiling. The area with the highest probability of oiling is located at the confluence of Indian Arm and Burrard Inlet. Bird colonies located in proximity to the WMT would be most affected.
There is clearly potential for oiling and mortality of seabirds following an accidental spill of crude oil at the WMT. The degree to which this potential is realized would depend upon the size of the oil spill, the efficacy of measures intended to promptly contain and recover spilled oil, and the ability of oil spill responders to capture and treat oiled birds. The present analysis has evaluated the spreading and fate of spilled oil that escapes from the containment boom without consideration of any further mitigation. Under this pessimistic scenario, modeling showed that less than 15% of the area of the Burrard Inlet IBA would be swept by crude oil at some time during the 15 day period following the spill. Taking into consideration the oil spill recovery and wildlife protection actions that would follow an accidental oil spill, it remains likely that birds would be harmed, but it is also likely that the numbers would be small. At the population level, the lost individuals would likely be compensated for by natural processes within one to two years.

Trans Mountain Pipeline ULC Volume 7, Pipeline Facilities Technical Reports Trans Mountain Expansion Project Ecological Risk Assessment of Westridge Marine
Terminal Spills Technical Report
December 2013 REP-NEB-TERA-00020
Page 6-7
6.5 Potential Environmental Effects to Marine Mammals and Supporting Habitat
Several categories of mammals, and their supporting habitats were considered in the PQERA. Terrestrial mammals that may frequent the shoreline were assigned a BSF = 1 (low). The potential for terrestrial mammal exposure to oil was evaluated on the basis of the length of oiled shoreline (km), and that length as a percentage of the total shoreline in the RSA. Pinnipeds and whales, which rely on blubber for insulation and are generally somewhat tolerant of oil exposure were assigned BSF = 2 (medium), and BSF = 3 (high), respectively. It was assumed that pinnipeds (principally harbour seal in the vicinity of the WMT) would occupy marine habitat generally less than 30 m in depth. Conversely, it was assumed that whales (principally harbour porpoise in the vicinity of the WMT) would occupy marine habitat generally greater than 10 m in depth. Furred marine mammals (e.g., otters) that are particularly susceptible to hypothermia and ingestion of crude oil as a result of grooming activity following exposure were assigned a BSF = 4 (very high). It was assumed that these mammals would generally occupy habitat less than 10 m in depth. The overlays of habitat oiling probability for each of the marine mammals and supporting habitat sensitivity classes are summarized in Table 6.6.
For terrestrial mammals (e.g., bears, moose, raccoons, etc., BSF = 1) potential exposure is determined by the 8.3 to 11 km of shoreline that is predicted to have a high or very high probability of oiling. This represents about 5% of the available shoreline habitat. These animals have generally low sensitivity to oiling, and it is unlikely that oiled individuals would die as a result of exposure. It is very unlikely that such exposure would result in a population level effect.
For pinnipeds such as harbour seal (BSF = 2), between 11 and 12 km2 of habitat is estimated to be exposed to surface oil at some time during the 15 day simulations. This represents between 17% and 19% of the available habitat. Therefore there is a relatively high probability of exposure for harbour seal inhabiting Burrard Inlet in the unlikely event of an accidental crude oil spill. Some level of negative effect would be expected for animals exposed to crude oil, but the effects would not likely be lethal, except in the case of weaker animals such as pups or older and diseased animals.
For whales such as the harbour porpoise (BSF = 3), between 11 and 14 km2 of habitat is estimated to be exposed to surface oil at some time during the 15 day simulations. This represents between 13% and 16% of the available habitat. Therefore there is a relatively high probability of exposure for harbour porpoise inhabiting Burrard Inlet in the unlikely event of an accidental crude oil spill. Some level of negative effect would be expected for animals exposed to crude oil, but the effects would not likely be lethal, except in the case of weaker animals such as calves or older and diseased animals.
For furred marine mammals such as the river otter (BSF = 4), between 3.2 and 3.9 km2 of habitat is estimated to be exposed to surface oil at some time during the 15 day simulations. This represents between 11% and 13% of the available habitat. Therefore there is a relatively high probability of exposure for some of the otters inhabiting Burrard Inlet in the unlikely event of an accidental crude oil spill. Some level of negative effect would be expected for animals exposed to crude oil. Exposure during the winter season would be more stressful than exposure during the summer, but in either case, the combination of hypothermia and damage to the gastro-intestinal system caused by crude oil ingested through grooming the fur would have the potential to cause death. The overlay of oiling probability onto the marine mammals and supporting habitat sensitivity factors is shown in Table 6.6.

Trans Mountain Pipeline ULC Volume 7, Pipeline Facilities Technical Reports Trans Mountain Expansion Project Ecological Risk Assessment of Westridge Marine
Terminal Spills Technical Report
December 2013 REP-NEB-TERA-00020
Page 6-8
TABLE 6.6 SUMMARY OF EFFECTS ANALYSIS FOR MARINE MAMMALS AND SUPPORTING HABITAT, CREDIBLE WORST CASE SCENARIO
Season Biological Sensitivity
Factor
Area or Length in RSA
(km2 or km*)
Affected Surface Water (by Surface Water Oiling Probabilities)
Area or Length According
to Sensitivity Factor (km2 or km
Percent Area According
to Sensitivity Factor (%)
Medium (≥10%)
High (≥50%) Very High
(≥90%) Medium (≥10%)
High (≥50%) Very High
(≥90%)
Winter
1* 200* 33* 8.3* 0.92* 17 4.2 0.46
2 66 21 11 2.7 33 17 4.2
3 84 23 12 2.4 28 14 2.9
4 30 9.0 3.4 0.52 29 11 1.7
Spring
1* 200* 38* 8.6* 1.3* 19 4.3 0.65
2 66 22 12 3.0 34 19 4.6
3 84 25 14 2.4 29 16 2.9
4 30 9.9 3.9 0.63 32 13 2.1
Summer
1* 200* 35* 11* 0.74* 18 5.4 0.38
2 66 22 12 2.5 33 18 3.8
3 84 25 12 2.4 30 14 2.9
4 30 7.6 3.3 0.41 25 11 1.3
Fall
1* 200* 30* 8.7* 1.5* 15 4.4 0.76
2 66 19 11 3.7 29 17 5.6
3 84 22 11 4.6 26 13 5.4
4 30 6.7 3.2 0.77 22 11 2.5
NOTE: * For terrestrial mammals (BSF = 1), environmental effects are estimated as length (km) of shoreline subject to oiling, rather than the area (km2) of affected habitat.
In summary, the PQERA indicates that marine mammals and supporting habitat would be affected, however the affected areas would be modest in comparison to the overall habitat present within Burrard Inlet. Less than 20% of the RSA would have a high or very high probability of oiling. The area with the highest probability of oiling is located at the confluence of Indian Arm and Burrard Inlet. Marine mammals and supporting habitat located in proximity to the WMT would be most affected.
There is clearly potential for oiling of marine mammals and supporting habitat following an accidental spill of crude oil at the WMT. The degree to which this potential is realized would depend upon the size of the oil spill, the efficacy of measures intended to promptly contain and recover spilled oil, the ability of oil spill responders to capture and treat oiled animals, and the intrinsic sensitivity of the animals to exposure. The present analysis has evaluated the spreading and fate of spilled oil that escapes from the containment boom without consideration of any further mitigation. Under this pessimistic scenario, modeling showed that less than 20% of the available marine mammal habitat within the RSA would be swept by crude oil at some time during the 15 day period following the spill. Taking into consideration the oil spill recovery and wildlife protection actions that would follow an accidental oil spill, it remains likely that some animals would be harmed, but it is also likely that the numbers would be small. Animals like otter would be most at risk, with lower potential for mortality of harbour porpoise and harbour seals. Exposure of other whales and pinnipeds is quite unlikely as a result of their low occupancy in Burrard Inlet. At the population level, lost individuals would likely be compensated for by natural processes within one to two years.
6.6 Risk Characterization Summary for a Credible Worst Case Spill
A credible worst case spill involving the release of 160 m3 of CLWB from the WMT would potentially cause negative environmental effects on shoreline and near shore habitats, marine fish, marine birds and marine mammals, as well as their supporting habitat, within the RSA. However, the affected areas would be modest in consideration of all available habitat within the RSA. Based on the stochastic simulations for this scenario, areas with highest probability of oiling are located around the WMT and near the confluence of Indian Arm and Burrard Inlet. Acute lethality of fish is an unlikely scenario, although damage to oiled

Trans Mountain Pipeline ULC Volume 7, Pipeline Facilities Technical Reports Trans Mountain Expansion Project Ecological Risk Assessment of Westridge Marine
Terminal Spills Technical Report
December 2013 REP-NEB-TERA-00020
Page 6-9
shoreline and intertidal communities is likely, although localized. There is potential for mortality of seabirds, but numbers are likely to be low. There is a low potential for mortality to terrestrial mammals exposed to oil on shorelines, and also a low potential for mortality of seals or porpoises. A higher potential exists for mortality of otters. While negative environmental effects are likely to occur within a portion of Burrard Inlet, most of the negative environmental effects would be expected to be reversible within one to two years.
This conclusion is supported by the results of samples collected after a crude oil release which occurred near the WMT in July, 2007 (Stantec 2010a). That accident, which was due to third-party damage to a pipeline resulted in approximately 100 m3 of CLWB entering Burrard Inlet near the WMT. Surface water samples were collected at several locations one and two weeks after the incident. All sample results were below detection limits for extractable petroleum hydrocarbons (EPHs). In addition, while concentrations of PAHs were above detection limits at a few locations, none exceeded water quality guidelines which are protective of the marine environment. The follow-up monitoring and assessment report concluded that oil concentrations in the water column likely peaked soon after the release, but decreased to background levels within days (Stantec 2010a). Sediment tests indicated some areas with PAH concentrations above applicable guidelines. A comparison of PAH composition in sediment samples and released oil indicates that sediment in the Westridge area has likely been affected by the oil release, as well as by historic shipping activity and other sources of PAH. Sediment from sites further away (e.g., Maplewood Flats, Deep Cove, Cates Park, Belcarra, Port Moody flats, Barnet Marine Park) also contained measurable PAHs, but their chemical fingerprint did not match that of the released oil.
Approximately 15 km of shoreline east of Second Narrows was affected by the accidental release (Stantec 2010a). The most heavily affected area was 2.5 km of shoreline between the Shell Jetty Marine Terminal and Barnet Beach at Barnet Marine Park. This heavily oiled area was extensively remediated through removal of oiled seaweed (Fucus), agitation of soft sediments (sand, mud) and application of the shoreline treatment agent Corexit 9580 (a biodegradable cleanser that contains surfactant). As a result of the oil release and remediation, this area experienced habitat loss and death or removal of marine plants (primarily Fucus) as well as a likely loss of intertidal fauna such as starfish, barnacles and limpets. An analysis of mussels collected throughout the eastern part of the inlet indicated that only in the Westridge area was there an amount and distribution pattern (fingerprint) of PAHs that could be associated with the release. Subtidal organisms may also have been affected by the release, but these effects appear to be limited and localized. Red rock crabs from the Westridge area showed elevated PAH levels and a similar pattern of PAH to the released oil. However, none of the Dungeness crabs sampled at Westridge or crabs of either species from Barnet Marine Park and Berry Point and elsewhere in the Inlet (Indian Arm and Port Moody Arm) showed evidence of having taken up oil from the release. There was no evidence for direct effects on fin-fish species.
Effects of the release were noted for some marine birds and mammals (Stantec 2010b). Fifteen Canada geese, two gulls and one pelagic cormorant were captured due to oiling. All but two Canada geese were cleaned and released, one of the two not released was transferred to a different facility and the other was euthanized due to an injured eye. Effects on other species of marine birds were minimal, largely because overwintering birds had not yet returned from their northern breeding ranges. Three dead harbour seal pups were found in Burrard Inlet following the release, but cause of death could not be determined, and only one had signs of oil exposure. No other effects on marine mammals, including otters, were reported in Burrard Inlet.

Trans Mountain Pipeline ULC Volume 7, Pipeline Facilities Technical Reports Trans Mountain Expansion Project Ecological Risk Assessment of Westridge Marine
Terminal Spills Technical Report
December 2013 REP-NEB-TERA-00020
Page 7-1
7.0 QUALITATIVE ASSESSMENT OF SMALLER SPILLS This section summarizes the evaluation of environmental effects to ecological receptors resulting from smaller spills which could potentially occur at the WMT during loading operations. The spill scenario considered here was developed by DNV (2013), and is summarized as leak from a loading arm resulting in a release of 10 m3 of CLWB. Based on the standard procedure of deploying containment boom around the ship prior to the start of loading, as well as the smaller spill volume, this scenario considered that the spilled oil would be completely retained within the boom, and would not spread across the water surface outside of the boom, or impinge directly on the adjacent shoreline.
While stochastic simulations for all four seasons were completed, no oil spill trajectory was modelled as the spilled crude oil would remain within the containment boom. Standard operating procedures in place at the terminal would result in immediate shut-down of transfer operations, and implementation of spill response plans including immediate recovery of the oil using pre-deployed equipment, and this mitigation was also considered when evaluating potential environmental effects from smaller spills. Based on existing spill response plans, recovery operations for such smaller spills would be expected to be complete within a few days.
7.1 Summary of Stochastic Modelling Results
The stochastic modelling for smaller spills was completed over a 5-day tracking period, and did not consider any mitigation or recovery of the spilled oil other than its effective containment within the pre-deployed boom. Results of the seasonal stochastic simulations were very similar with only small differences related to seasonal variations in temperature, predominant current direction and speed and/or predominant wind direction and speed.
Mass balance results showed that approximately 22% to 23% of the oil would evaporate, with the highest amount in the fall and lowest amount in winter, approximately 2% would dissolve and 3% would biodegrade, leaving approximately 72% to 73% on the water surface inside the boom after 5 days, with the highest amount in summer and lowest amount in the fall. However, in reality the spilled crude oil would be expected to be recovered from the boom within this time frame. Mass balance results from the EBA modelling output for the 10 m3 spill are presented in Appendix C.
Given that the oil spill fate modelling results were similar across all seasons, results are discussed in the context of the summer spill scenario only. The environmental effects of the smaller spills in other seasons (i.e., winter, spring and fall) are expected to be qualitatively similar to those in the summer season.
7.2 Oil Fate and Potential Effects on Shoreline and Near Shore Habitats
After being released to the water surface, some of the more water-soluble constituents of the crude oil would dissolve into the water column. These constituents are also relatively volatile, and there is a limited window of time when the spilled oil is relatively unweathered so that these constituents are available. Approximately 22% of the oil evaporates and disperses in the atmosphere. Less than 2% of the crude oil dissolves into the water column. The protected nature of Burrard Inlet, and the additional protection afforded by the pre-deployed boom would limit the effects of wind or waves on the spilled oil, so that the dispersion of oil droplets beneath the slick is highly unlikely. This limitation also strongly limits the dissolution of the more water-soluble constituents, such as BTEX and light PAHs.
Any dissolved hydrocarbons resulting from the spill would be quickly diluted by the surrounding marine water. Tidal action would ensure that the hydrocarbons dissolving into the water did not have an opportunity to reach saturation, and would also help to dilute the dissolved hydrocarbons, resulting in only a short-term negative effect on water quality. It is highly unlikely that dissolved hydrocarbon concentrations would be sufficiently high for long enough to cause acute lethality to fish or other aquatic life.
Sedimentation of oil can occur when dispersed oil enters the water column, if it combines with suspended particulate matter, and settles to the bottom. Testing carried out in support of the Project showed that CLWB did not sink by itself after ten days exposure on brackish water (Witt O‟Brien et al. 2013). Oil spill

Trans Mountain Pipeline ULC Volume 7, Pipeline Facilities Technical Reports Trans Mountain Expansion Project Ecological Risk Assessment of Westridge Marine
Terminal Spills Technical Report
December 2013 REP-NEB-TERA-00020
Page 7-2
modeling indicated that negligible amounts of oil would become suspended as droplets in the water column, as a result of the sheltered nature of Burrard Inlet and the relatively viscous characteristic of the oil. Very little suspended sediment is present in the waters of Burrard Inlet. Taking these factors into consideration, formation of OMA and sinking of oil is an unlikely scenario. Therefore, it is unlikely that a smaller spill of CLWB would have a substantial negative effect on sediment quality.
7.3 Potential Effects to Marine Fish and Supporting Habitat
Because hydrocarbons are hydrophobic, they partition strongly between water and living organisms. Uptake of hydrocarbons from water by living organisms is regulated primarily by equilibrium exchange processes between water and lipids, and occurs primarily across permeable or vascular surfaces such as gills or egg membranes. Once inside the organism, hydrocarbons become part of the generalized lipid pool where they can disrupt cellular and tissue function (French McCay 2009).
While short-term (acute) exposure to dissolved hydrocarbons in the water column could potentially be lethal to aquatic biota (e.g., fish, invertebrates, aquatic vegetation), as a result of the relatively small spill volume, and short duration of exposure, lethality is not expected as an outcome of the smaller spill, which remains confined within the containment boom. Sub-lethal effects to aquatic receptors would not be persistent at population levels, and recovery would be expected to occur quickly.
7.4 Potential Effects to Marine Birds or Marine Mammals and Supporting Habitat
Because the spilled oil would be completely retained within the containment boom, it would not come into contact with the adjacent shoreline, and thus there would be no exposure of terrestrial mammals. Acute environmental effects of an oil spill on birds and aquatic mammals could however result either from direct contact with floating oil within the boom, or through inhalation of vapours by an individual animal (e.g., birds, or aquatic mammals surfacing in an oil slick).
Direct oiling of wildlife can result in decreased survival and reproductive success through a number of mechanisms, including loss of waterproofing and insulating characteristics of feathers or fur, toxicity from transfer of oil from feathers to eggs during incubation, absorption through the skin, ingestion of toxins via grooming or feeding, and reduced mobility (USNRC 2003; French McCay 2009). However, given the relatively small amount of spilled oil, and the level of human activity that the oil spill response would quickly engender, the probability of a direct encounter between birds or mammals and floating oil would be low.
While volatile components of the oil (e.g., BTEX) can concentrate vapours on the surface of an oil slick as they evaporate into the surrounding air and potentially create narcotic effects on wildlife, these vapours would likely be dispersed quickly.
Therefore, although individual birds or mammals may be exposed to the direct effects of oiling or inhalation of vapours, the effects would not be expected to be lethal, or to persist at the population level.
7.5 Risk Characterization Summary for a Smaller Spill
In summary, a hypothetical release of 10 m3 of CLWB at the Westridge terminal during loading operations would not likely affect shoreline habitat or sediment quality, but would result in a short-term and localized effect on water quality. Acute lethality to aquatic biota is not likely to result. Birds and mammals in direct contact with the oil at the water surface could also be affected. However, as a result of the presence of the containment boom, and the expected recovery of the oil within a few days, ecological effects would not be persistent at population levels. Therefore, the environmental effects on marine ecological receptors of a smaller spill of crude oil at the WMT, which remains confined within the containment boom, are expected to be Negligible.

Trans Mountain Pipeline ULC Volume 7, Pipeline Facilities Technical Reports Trans Mountain Expansion Project Ecological Risk Assessment of Westridge Marine
Terminal Spills Technical Report
December 2013 REP-NEB-TERA-00020
Page 8-1
8.0 CERTAINTY AND CONFIDENCE Administrative boundaries and uncertainties are inherent to many aspects of predicting risks to ecological receptors. The extent of these boundaries is dictated by the availability and quality of information, as well as the variability associated with many of the exposure processes and factors being considered. When conducting risk assessments, it is standard practice to implement conservative assumptions (i.e., to make assumptions that are inherently biased towards safety) when uncertainty is encountered. This strategy generally results in an overestimation of actual risk. For this PQERA, prediction confidence is based on the following factors:
Environmental fate modeling Selection of marine ecological receptors and derivation/assignment of biological sensitivity factors Exposure and hazard assessment.
8.1 Environmental fate Modelling
Models used in the stochastic oil spill modelling have been developed over many years to include as much information as possible to simulate the fate and effects of oil spills in a realistic manner. However, there are limits to the complexity of processes that can be modelled, as well as gaps in knowledge regarding the environment that is affected, and the behaviour of specific organisms and ecosystems.
In the unlikely event of an oil spill, the fate and effects would be strongly determined by specific characteristics of the oil, environmental conditions, and the precise locations and types of organisms exposed. Thus, the results presented here are a function of the scenarios simulated and the accuracy of the input data used. The goal of this study is not to forecast every situation that could potentially occur, but to describe a range of possible consequences so that an informed analysis can be made as to the likely effects of oil spills under various scenarios. The model inputs are designed to provide representative conditions to inform such an analysis. Thus, the modelling is used to provide quantitative guidance in the analysis of the scenarios considered in the ERA.
The outcomes of the oil spill stochastic simulations are consistent with the behaviour and fate of crude oil that was accidentally released to Burrard Inlet in 2007.
8.2 Biological Sensitivity Factors
Biological sensitivity factors were established through consideration of marine biota receptors with anticipated exposure to the oil with particular attention to species believed to be sensitive to disturbance, and which act as indicators of overall environmental health. For each receptor category, four biological sensitivity classes were defined on a scale of 1 (low sensitivity) to 4 (very high sensitivity). For shoreline and near shore habitats, biological sensitivity factors were based on consideration of habitat complexity and ability of different habitat types to sustain high levels of biodiversity and productivity, as well as the way in which spilled crude oil would interact with and persist on such habitat. For marine fish and supporting habitat, biological sensitivity factors were based on water depth with the highest biological sensitivity class reserved for developing eggs and embryos in shallow water habitat. For marine birds and marine mammals and their habitats, the classification scheme considers lifestyle, behaviour, and exposure mechanisms, and in particular the role of fur or feathers in providing thermal insulation for warm-blooded animals in a cold environment. These factors are well understood in terms of their importance to the sensitivity of different types of wildlife when exposed to spilled oil.
8.3 Exposure and Hazard Assessment
Ecological receptors were assumed to be exposed to spilled crude oil to the extent that their habitat overlapped with three probability boundaries for oil presence on water, or oiling of shorelines (i.e., ≥10%; ≥50% and ≥90% probability of oiling). It is conservatively assumed that any contact between a marine ecological receptor and crude oil is potentially harmful, regardless of the amount of oil present, or the duration of the exposure. This approach is likely to overstate, rather than understate the potential consequences of spilled crude oil.

Trans Mountain Pipeline ULC Volume 7, Pipeline Facilities Technical Reports Trans Mountain Expansion Project Ecological Risk Assessment of Westridge Marine
Terminal Spills Technical Report
December 2013 REP-NEB-TERA-00020
Page 8-2
8.4 Recovery Assessment
The recovery assessment was carried out with primary consideration being given to the recovery of ecological receptors following the EVOS of 1989. That oil spill, while a major disaster caused by the grounding of a large single-hulled oil tanker, shows that marine ecosystems do recover from the effects of oil spills. Most of the instances of delayed recovery are associated with the effects of lingering or sequestered oil affecting a small area of habitat, or relate to effects on specific groups of whales which experienced harm from which they may not fully recover, but which are compensated for by gains made by other groups in the region. The EVOS was also a defining learning experience in terms of oil spill response, and some of the oil spill response strategies that were employed at that time were found to be inappropriate. Current oil spill response planning and deployment incorporates those learned lessons, so that better outcomes can be expected than were observed at some sites following the EVOS. For the four ecological receptor groups considered here, including shoreline and near shore habitats, marine fish and supporting habitat, marine birds and supporting habitat, and marine mammals and supporting habitat, recovery predictions and time to recovery are based upon relevant real-world experience, and are accorded a high level of confidence.

Trans Mountain Pipeline ULC Volume 7, Pipeline Facilities Technical Reports Trans Mountain Expansion Project Ecological Risk Assessment of Westridge Marine
Terminal Spills Technical Report
December 2013 REP-NEB-TERA-00020
Page 9-1
9.0 SUMMARY AND CONCLUSIONS This PQERA indicates that while shoreline and near shore habitats within Burrard Inlet could be negatively affected by crude oil in the event of an accidental spill during loading operations at the WMT, the magnitude of such effects would largely depend upon the quantity of crude oil that escaped from the containment boom within which such operations are carried out. Crude oil that remains confined within the containment boom would not have the potential to harm shoreline and near shore habitats, and would be unlikely to cause mortality of fish, marine birds or marine mammals. Contained crude oil would also be amenable to recovery operations.
Crude oil that escaped from such confinement would have much greater potential to cause harm to shoreline and near shore habitats, shallow-water fish habitats, and marine birds and mammals. The extent to which such negative effects would be realized (i.e., effect magnitude), and the length of time required for biological recovery to occur, would depend upon the quantity of such fugitive oil, as well as seasonal factors influencing weather, and biological resources. These and other factors are summarized by ecological receptor type in the following sections.
9.1 Potential Effects and Recovery of Shoreline and Near Shore Habitats
While shoreline and near shore habitats within Burrard Inlet could be affected by crude oil that escaped from confinement under the CWC scenario, the affected areas generally represent a small fraction of the total amount of shoreline within the RSA belonging to each shoreline and near shore habitats sensitivity class. For the CWC scenario, the maximum spatial extent of affected shorelines with high to very high probability of oiling is 4.5% of the available habitat within the RSA assigned to BSF = 1; 5.5% of the available habitat within the RSA assigned to BSF = 2; and 17% of the available habitat within the RSA assigned to BSF = 3. Shoreline types with highest biological sensitivity factor (BSF = 4) have a very low probability of being oiled, and it is unlikely that any individual crude oil spill would result in oiling of these areas, which are located near Port Moody. In the context of effect magnitude, any crude oil spill that entered habitat for fish or migratory birds would be a violation of federal and/or provincial regulations respecting such habitat, and would be assigned an effect magnitude rating of “High”.
Results also indicate areas with a high probability of oiling in proximity to the First Nation Reserves at Burrard Inlet 3 (Tsleil-Waututh First Nation) and Seymour Creek 2 (Squamish First Nation), both of which are located on the northern shoreline of Burrard Inlet. Contours indicating a high probability of oiling generally do not contact Provincial Parks, National Parks or Ecological Reserves, with the exception of the spring condition, when there is a high probability of surface water oiling extending to Racoon Island which is part of Indian Arm Provincial Park.
Very little of the potentially affected shoreline habitat in Burrard Inlet is of a type that would tend to sequester spilled crude oil. It is expected that shoreline clean-up and assessment techniques (SCAT) would be applied to spilled crude oil that reached shorelines and that most of this oil would be recovered. Biological recovery from spilled oil, where shoreline communities were contacted by and harmed by the oil or by subsequent clean-up efforts, would be expected to lead to recovery of the affected habitat within two to five years, as was the case for an accidental spill of CLWB that entered Burrard Inlet in 2007.
9.2 Potential Effects and Recovery of Marine Fish and Supporting Habitat
Fish habitat within Burrard Inlet would be negatively affected by any crude oil spill to the marine environment at the WMT. For the CWC scenario, the areas affected by spilled crude oil that escaped from confinement represent a spatial extent less than 25% of the total amount of each habitat type available within the RSA. The maximum spatial extent of affected fish habitat with high to very high probability of oiling is 11% of the available habitat within the RSA assigned to BSF = 1; 24% of the available habitat within the RSA assigned to BSF = 2; 13% of the available habitat within the RSA assigned to BSF = 3; and 21% of the available habitat within the RSA assigned to BSF = 4, which includes important habitat for rockfish and crab.
As noted for shoreline and near shore habitats, any spill of crude oil to the water surface would be a violation of federal and/or provincial regulations respecting such habitat for fish, and would therefore be

Trans Mountain Pipeline ULC Volume 7, Pipeline Facilities Technical Reports Trans Mountain Expansion Project Ecological Risk Assessment of Westridge Marine
Terminal Spills Technical Report
December 2013 REP-NEB-TERA-00020
Page 9-2
assigned an effect magnitude rating of “High”. However, the potential for negative effects to marine fish and supporting habitat is generally low, due to the limited fetch of Burrard Inlet, and the low potential for dissolved hydrocarbon concentrations in water to reach thresholds that would cause mortality of fish or other aquatic life. This potential would be greatest in shallow water areas under weather conditions causing spilled oil to be driven into shallow areas with wave action, leading to localized high concentrations of dissolved hydrocarbons and hydrocarbon droplets in the water column. This could result in the death of fish as a result of narcosis, or could cause abnormalities in developing embryos if spawn was present. The area with the highest probability of negative effects is located near the confluence of Indian Arm and Burrard Inlet. Critical habitats and spawning areas as well as developing eggs and embryos in shallow water habitat located in proximity to the WMT would be most likely to be affected.
Due to the limited spatial extent of potential effects of spilled oil on fish and fish habitat, and the generally low potential for the credible worst case scenario to cause acute lethality to fish, recovery of marine fish and fish habitat would be rapid. Even under a worst-case outcome event where a localized fish kill might be observed, it is expected that the lost biological productivity would be compensated for by natural processes within one to two years.
9.3 Potential Effects and Recovery of Marine Birds and Supporting Habitat
Marine bird habitat would be negatively affected by any crude oil spill to the marine environment at the WMT. For marine birds and supporting habitat, the entire regional study area (representing an area 115 km2, including all of English Bay, Vancouver Harbour and Burrard Inlet) has been assigned to BSF = 4 (very high) due to its designation as an important bird area (IBA). Any spill of crude oil to the water surface would be a violation of federal regulations respecting such habitat for migratory birds, and potentially federal and/or provincial regulations regarding species at risk, and would therefore be assigned an effect magnitude rating of “High”. Any spill of crude oil that resulted in the death of a migratory bird would also be assigned an effect magnitude of “High”.
For the CWC scenario the maximum spatial extent of affected bird habitat with high to very high probability of oiling is less than 15% of the available habitat within the RSA. The areas with a very high probability of oiling (90% or higher) are located in close proximity to the terminal and generally extend less than 2 km away from it. As such, bird colonies located in proximity to the WMT would be most likely affected.
There is potential for oiling and mortality of seabirds following any accidental spill of crude oil at the WMT. The degree to which this potential is realized would depend upon the size of the oil spill, the efficacy of measures intended to promptly contain and recover spilled oil, and the ability of oil spill responders to capture and treat oiled birds. Taking into consideration the oil spill recovery and wildlife protection actions that would follow an accidental oil spill, it remains likely that birds would be harmed, but it is also likely that the numbers would be small. At the population level, the lost individuals would likely be compensated for by natural processes within one to two years.
9.4 Potential Effects and Recovery of Marine Mammals and Supporting Habitat
Marine mammal habitat within Burrard Inlet would be negatively affected by any crude oil spill to the marine environment at the WMT. As noted for marine birds and supporting habitat, any spill of crude oil to the water surface could potentially violate federal and/or provincial regulations regarding species at risk, and would therefore be assigned an effect magnitude rating of “High”. Likewise, any spill of crude oil that resulted in the death of a marine mammal would be assigned an effect magnitude of “High”.
For the CWC scenario the maximum spatial extent of affected marine mammals and supporting habitat with high to very high probability of oiling is about 5% of the available habitat within the RSA assigned to BSF = 1; 19% of the available habitat within the RSA assigned to BSF = 2; 16% of the available habitat within the RSA assigned to BSF = 3; and 3% of the available habitat within the RSA assigned to BSF = 4. Marine mammals and supporting habitat present in the vicinity of the WMT would be most likely to be affected.

Trans Mountain Pipeline ULC Volume 7, Pipeline Facilities Technical Reports Trans Mountain Expansion Project Ecological Risk Assessment of Westridge Marine
Terminal Spills Technical Report
December 2013 REP-NEB-TERA-00020
Page 9-3
There is potential for oiling of marine mammals following an accidental spill of crude oil at the WMT. The degree to which this potential is realized would depend upon the size of the oil spill, the efficacy of measures intended to promptly contain and recover spilled oil, the ability of oil spill responders to capture and treat oiled animals, and the intrinsic sensitivity of the animals to exposure. Taking into consideration the oil spill recovery and wildlife protection actions that would follow an accidental oil spill, it remains likely that some animals would be harmed, but it is also likely that the numbers would be small. Animals like otters would be most at risk, with lower potential for mortality of harbour porpoise and harbour seals. Exposure of other whales and pinnipeds is unlikely due to the low frequency of their presence in Burrard Inlet. At the population level, lost individuals would likely be compensated for by natural processes within one to two years.

Trans Mountain Pipeline ULC Volume 7, Pipeline Facilities Technical Reports Trans Mountain Expansion Project Ecological Risk Assessment of Westridge Marine
Terminal Spills Technical Report
December 2013 REP-NEB-TERA-00020
Page 10-1
10.0 CLOSURE This report has been prepared by Stantec Consulting Ltd. (Stantec) for the sole benefit of Trans Mountain Pipeline ULC (Trans Mountain). The report may not be relied upon by any other person or entity, other than for its intended purposes, without the express written consent of Stantec and Trans Mountain.
This report was undertaken exclusively for the purpose outlined herein and was limited to the scope and purpose specifically expressed in this report. This report cannot be used or applied under any circumstances to another location or situation or for any other purpose without further evaluation of the data and related limitations. Any use of this report by a third party, or any reliance on decisions made based upon it, are the responsibility of such third parties. Stantec accepts no responsibility for damages, if any, suffered by any third party as a result of decisions made or actions taken based on this report.
Stantec makes no representation or warranty with respect to this report, other than the work was undertaken by trained professional and technical staff in accordance with generally accepted engineering and scientific practices current at the time the work was performed. Any information or facts provided by others and referred to or used in the preparation of this report were assumed by Stantec to be accurate. Conclusions presented in this report should not be construed as legal advice.
The information provided in this report was compiled from existing documents and data provided by Trans Mountain and by applying currently accepted industry standard mitigation and prevention principles. This report represents the best professional judgement of Stantec personnel available at the time of its preparation. Stantec reserves the right to modify the contents of this report, in whole or in part, to reflect the any new information that becomes available. If any conditions become apparent that differ significantly from our understanding of conditions as presented in this report, we request that we be notified immediately to reassess the conclusions provided herein.
STANTEC CONSULTING LTD.
Annick St-Amand, Ph.D. Ecological Risk Assessor, Organic Chemistry Fredericton, New Brunswick Phone: (506) 452-7000
Malcolm Stephenson, Ph.D. Principal, National Practice Lead Risk Assessment Fredericton, New Brunswick Phone: (506) 452-7000

Trans Mountain Pipeline ULC Volume 7, Pipeline Facilities Technical Reports Trans Mountain Expansion Project Ecological Risk Assessment of Westridge Marine
Terminal Spills Technical Report
December 2013 REP-NEB-TERA-00020
Page 11-1
11.0 REFERENCES Ainley, D.G., D.W. Anderson, and P.R. Kelly. 1981. Feeding sormorants in Southwestern North America.
The Condor 83(2):120-131.
Alaska Fisheries Science Center. 2013. Copper rockfish. National Marine Fisheries Service. Website: http://www.afsc.noaa.gov/Rockfish-Game/description/copper.htm# Accessed: May 2013.
Anthony, R.G., R.L. Knight, G.T. Allen, B.R. McClelland and J.I. Hodges. 1982. Habitat Use by Nesting and Roosting Bald Eagles in the Pacific Northwest.US Fish & Wildlife Publications. Paper 34. In Transactions of the Forty-Seventh North American Wildlife and Natural Resources Conference, ed. Kenneth Sabol (Washington, DC, 1982).
Baird, R.W. 2001. Status of harbour seals, Phoca vitulina, in Canada. The Canadian Field Naturalist 115: 663-675.
Baird, R.W. 2001. Status of harbour seals, Phoca vitulina, in Canada. The Canadian Field Naturalist 115:663-675.
Baird, R.W. and T.J. Guenther. 1995. Account of harbour porpoise (Phocoena phocoena) strandings and bycatches along the coast of British Columbia. Reports of the International Whaling Commission Special Issue 16:159-168. In: Committee on the Status of Endangered Wildlife in Canada (COSEWIC). 2003c. COSEWIC assessment and update status report on the harbour porpoise Phocoena phocoena (Pacific Ocean Population) in Canada. Committee on the Status of Endangered Wildlife in Canada. Ottawa. vi + 22 pp.
BC Marine Conservation Analysis. 2009. Physical Representation - Benthic Classes. BC Marine Conservation Analysis Atlas. Website: http://BC MCA.ca/datafeatures/eco_physical_benthicclasses/ Accessed: May 2013
BC Marine Conservation Analysis. 2010. Marine Mammals – Harbour Seal Distribution. BC Marine Conservation Analysis Atlas. Website: http://bcmca.ca/datafiles/individualfiles/bcmca_eco_mammals_harboursealdist_atlas.pdf. Accessed: February 2013.
BCG Engineering Inc. 2006. Westridge Terminal Burnaby, British Columbia, Environmental & Geotechnical Study – Final Report prepared for Kinder Morgan. 16 pp + drawings and appendices. In Stantec Consulting Ltd. 2013a.
Beacham, T.D., R.E. Withler, C.B. Murray, and L.W. Barner. 1988. Variation in body size, morphology, egg size, and biochemical genetics of pink salmon in British Columbia. Transactions of the American Fisheries Society 117: 109-126.
Bigg, M.A. 1981. Harbour seal Phoca vitulina Linnaeus, 1758 and Phoca largha Pallas, 1811. In: Handbook of Marine Mammals Volume 2 Seals. Ridgway, SH and Harrison, RJ. (Eds.). Academic Press. pp. 1-27.
Bird Studies Canada and Nature Canada. 2013. 2004-2012 Important Bird Areas of Canada Database. Port Rowan, ON. Bird Studies Canada. Website: http://www.ibacanada.com Accessed: May 2013.
BirdLife International. 2012. Important Bird Areas of Canada Database. Website: http://www.birdlife.org/datazone/site/search Accessed: November 15, 2013.
Breault, A. and P. Watts. 1996. Burrard Inlet Environmental Action Plan (BIEAP) Bird Survey Project: Seasonal and Spatial Trends in the Distribution and Abundance of Water Birds in Burrard Inlet. Burrard Inlet Environmental Action Plan Technical Report.

Trans Mountain Pipeline ULC Volume 7, Pipeline Facilities Technical Reports Trans Mountain Expansion Project Ecological Risk Assessment of Westridge Marine
Terminal Spills Technical Report
December 2013 REP-NEB-TERA-00020
Page 11-2
British Columbia Cetacean Sightings Network. 2013. Marine Mammal Sightings Data from 1975-2013. Data received: April 2013.
British Columbia Conservation Data Centre (BC CDC). 2013a. BC Species and Ecosystems Explorer. BC Ministry of Environment. Victoria, BC. Website: http://a100.gov.bc.ca/pub/eswp/ Accessed: January 2013.
British Columbia Ministry of the Environment. 2013. Habitat Wizard Stream Reports. Website: http://www.env.gov.bc.ca/habwiz/ Accessed: February 2013.
British Columbia Ministry of Water, Land and Air Protection (BC MWLAP). 2004. Water Quality Objectives Attainment Monitoring in Burrard Inlet in 2002. Ministry of Water Land and Air Protection, Lower Mainland Region. July 2004.
Buehler, D.A. 2000. Bald Eagle (Haliaeetus leucocephalus), The Birds of North America Online (A. Poole, Ed.). Ithaca: Cornell Lab of Ornithology; Retrieved from the Birds of North America Online: http://bna.birds.cornell.edu/bna/species/506 Accessed: February 2013.
Burd, B.J and R.O. Brinkhurst. 1990. Vancouver Harbour and Burrard Inlet Benthic Infaunal Sampling Program, October 1987. Canadian Technical Report of Hydrography and Ocean Sciences No. 122. Fisheries and Oceans Canada, Sidney, BC.
Burd, B.J. 1990. Vancouver Harbour and Burrard Inlet Benthic Infaunal Sampling Program, October 1987. Canadian Technical Report of Hydrography and Ocean Sciences No. 122. Fisheries and Oceans Canada, Sidney, BC.
Burd, B.J., P.A.G. Barnes, C.A. Wright, and R.E Thomson. 2008. A review of subtidal benthic habitats and invertebrate biota of the Strait of Georgia, British Columbia. Marine Environmental Research 66: S3 – S38.
Burrard Inlet Environmental Action Program (BIEAP). 2002 (updated 2011) Consolidated Environmental Action Plan for Burrard Inlet. Website: http://www.bieapfremp.org/pdf/burrard_inlet_2011_cemp_web_use.pdf Accessed: February 2013.
Butler, R.W. and J. P. L. Savard. 1985. Monitoring of the spring migration of waterbirds throughout British Columbia: a pilot study. Canadian Wildlife Service, Pacific and Yukon Region.
Campbell, R.W., N.K. Dawe, I. McTaggart-Cowan, J.M. Cooper, G.W. Kaiser and M.C.E. McNall. 1990a. The Birds of British Columbia. Volume I. Nonpasserines: Introduction and Loons through Waterfowl. Published by University of British Columbia Press. Vancouver, BC.
Campbell, R.W., N.K. Dawe, I. McTaggart-Cowan, J.M. Cooper, G.W. Kaiser and M.C.E. McNall. 1990b. The Birds of British Columbia, Volume Two: Nonpasserines, Dirunal Bird of Prey Through Woodpeckers. Published by University of British Columbia Press. Vancouver, BC.
Canadian Council of Ministers of the Environment (CCME). 1996. A Framework for Ecological Risk Assessment: General Guidance.
Canadian Council of Ministers of the Environment (CCME). 1997. A Framework for Ecological Risk Assessment: Technical Appendices.
Chatwin, T.A., M.H. Mather and T. Giesbrecht. 2002. Changes in pelagic and double-crested cormorant nesting populations in the Strait of Georgia, British Columbia. Northwestern Naturalist 83 (3): 109-117.

Trans Mountain Pipeline ULC Volume 7, Pipeline Facilities Technical Reports Trans Mountain Expansion Project Ecological Risk Assessment of Westridge Marine
Terminal Spills Technical Report
December 2013 REP-NEB-TERA-00020
Page 11-3
Cohen, B.I. 2012. The Uncertain Future of Fraser River Sockeye Volume 2 – Causes of Decline. Final Report - October 2012, Commission of Inquiry into the Decline of Sockeye Salmon in the Fraser River. Minister of Public Works and Government Services Canada. Ottawa, ON. Website: http://www.cohencommission.ca/en/FinalReport/ Accessed: May 2013.
Committee on the Status of Endangered Wildlife in Canada (COSEWIC). 2002. COSEWIC assessment and status report on the coho salmon Oncorhynchus kisutch (Interior Fraser population) in Canada. Committee on the Status of Endangered Wildlife in Canada. Ottawa. viii + 34 pp.
Committee on the Status of Endangered Wildlife in Canada (COSEWIC). 2003a. COSEWIC assessment and status report on the Sockeye Salmon Oncorhynchus nerka Sakinaw population in Canada. Committee on the Status of Endangered Wildlife in Canada. Ottawa. ix + 35 pp.
Committee on the Status of Endangered Wildlife in Canada (COSEWIC). 2003b. COSEWIC assessment and status report on the sockeye salmon Oncorhynchus nerka (Cultus population) in Canada. Committee on the Status of Endangered Wildlife in Canada. Ottawa. ix + 57 pp.
Committee on the Status of Endangered Wildlife in Canada (COSEWIC). 2003c. COSEWIC assessment and update status report on the harbour porpoise Phocoena phocoena (Pacific Ocean Population) in Canada. Committee on the Status of Endangered Wildlife in Canada. Ottawa. vi + 22 pp.
Committee on the Status of Endangered Wildlife in Canada (COSEWIC). 2006. COSEWIC assessment and status report on the chinook salmon Oncorhynchus tshawytscha (Okanagan population) in Canada. Committee on the Status of Endangered Wildlife in Canada. Ottawa. vii + 41 pp.
Committee on the Status of Endangered Wildlife in Canada (COSEWIC). 2008. COSEWIC assessment and update status report on the Great Blue Heron fannini subspecies Ardea herodias fannini in Canada. Committee on the Status of Endangered Wildlife in Canada. Ottawa, ON. vii + 39 pp.
Committee on the Status of Endangered Wildlife in Canada (COSEWIC). 2009. COSEWIC assessment and status report on the Quillback Rockfish Sebastes maliger in Canada. Committee on the Status of Endangered Wildlife in Canada. Ottawa. vii + 71 pp.
Committee on the Status of Endangered Wildlife in Canada (COSEWIC). 2011. Status of Harbour seal, Pacific subspecies - Last examination and change April 1999.
Crewe, T., K. Barry, P. Davidson and D. Lepage. 2012. Coastal Waterbird Trends in the Strait of Georgia 1999-2011: Results from the First 12 Years of the British Columbia Coastal Waterbird Survey. BC Birds, Journal of the British Columbia Field Ornithologists 22:8-35.
Det Norske Veritas (DNV). 2013. General Risk Analysis and Intended Methods of Reducing Risks Trans Mountain Pipeline Expansion Project – Report dated November 8, 2013 (Rev. 0)
Di Toro, D.M., J.A. McGrath and D.J. Hansen. 2000. Technical basis for narcotic chemicals and polycyclic aromatic hydrocarbon criteria. I. Water and tissue. Environmental Toxicology and Chemistry 19:1951-1970.
Druehl, L.D. and S.I.C. Hsiao. 1977. Intertidal kelp response to seasonal environmental changes in a British Columbia Inlet. Journal of the Fisheries Research Board of Canada 34(8):1207-1211.
EBA Engineering Consultants Ltd. 2013. Modelling the Fate and Behaviour of Diluted Bitumen Spills in the Marine Environment, at Westridge Terminal and in the Lower Fraser River for the Trans Mountain Expansion Project. December 2013.

Trans Mountain Pipeline ULC Volume 7, Pipeline Facilities Technical Reports Trans Mountain Expansion Project Ecological Risk Assessment of Westridge Marine
Terminal Spills Technical Report
December 2013 REP-NEB-TERA-00020
Page 11-4
Environmental Resources Management (ERM). 2011. Consequence Analysis Report. Aleutian Islands Risk Assessment. Phase A – Preliminary Risk Assessment, Aleutian Islands, Alaska. Tasks 3 and 4. Report prepared for the National Fish and Wildlife Foundation, United States Coastguard, and Alaska Department of Enviornmental Conservation. Project No. 0105563. July, 2011. Website: http://www.aleutiansriskassessment.com/documents.htm Accessed: October 2013.
Ewins, P.J. 1993. Pigeon Guillemot (Cepphus columba), The Birds of North America Online (A. Poole, Ed.). Ithaca: Cornell Lab of Ornithology; Retrieved from the Birds of North America Online: http://bna.birds.cornell.edu/bna/species/049 Accessed: November 2013.
Exxon Valdez Oil Spill Trustee Council (EVOSTC). 2013. Killer Whales. Website: http://www.evostc.state.ak.us/recovery/status_orca.cfm Accessed: October 2013.
Fader, G.B.J., Pickrill, R.A., Todd, B.J., Courtney, R.C. and Parrott, D.R. 1998. The Emerging Role of Marine Geology in Benthic Ecology. In: DFO. 1998. Science Review 1996 and 1997. Bedford Institute of Oceanography, Gulf Fisheries Centre, the Halifax Fisheries Research Laboratory, and the St. Andrews Biological Station.
Fisheries and Oceans Canada (DFO). 1999. Inner South Coast Chum Salmon. DFO Science Stock Status Report D6-09 (1999).
Fisheries and Oceans Canada (DFO). 2000. Dungeness Crab, Coastal Fisheries, Areas B, E, G, H, I, & J. DFO Science Stock Status Report C6-14 (2000). Fisheries and Oceans Canada, Pacific Region.
Fisheries and Oceans Canada (DFO). 2001. Fish Stocks of the Pacific Coast. Fisheries and Oceans Canada. 152 pp.
Fisheries and Oceans Canada (DFO). 2002. Toward an Inshore Rockfish Conservation Plan. A Structure for Continued Consultation. Website: http://www.pac.dfo-mpo.gc.ca/consultation/fisheries-peche/ground-fond/intdial/consstrat/index-eng.htm Accessed: May 2013.
Fisheries and Oceans Canada (DFO). 2006. Rockfish Conservation Areas - Protecting British Columbia's Rockfish. Fisheries and Oceans Canada, Pacific Region. Website: http://www.pac.dfo-mpo.gc.ca/fm-gp/maps-cartes/rca-acs/booklet-livret/index-eng.htm Accessed: May 2013.
Fisheries and Oceans Canada (DFO). 2010b. Population Assessment Pacific Harbour Seal (Phoca vitulina richardsi). DFO Canadian Science Advisory Secretariat Science Advisory Report 2009/011.
Fisheries and Oceans Canada (DFO). 2012a. Pacific Region Integrated Fisheries Management Plan: Crab by Trap, January 1, 2012 to December 31, 2012. Fisheries and Oceans Canada, Pacific Region.
Fisheries and Oceans Canada (DFO). 2012b. Pacific Region Integrated Fisheries Management Plan: Salmon, Southern BC June 1, 2012 to May 31, 2012. Website: http://www.dfo-mpo.gc.ca/Library/346918.pdf Accessed: February 2013.
Fisheries and Oceans Canada (DFO). 2012c. Stock Assessment and Recovery Potential Assessment For Quillback Rockfish (Sebastes Maliger) Along The Pacific Coast Of Canada. DFO Canadian Science Advisory Secretariat Science Advisory Report. 2011/072.
Fisheries and Oceans Canada (DFO). 2013. Evaluation of proposed ecologically and biologically significant areas in marine waters of British Columbia. DFO Canadian Science Advisory Secretariat Science Advisory Report. 2012/075.
Fisheries and Oceans Canada and Environment Canada (DFO and EC). 2006. Deltaport Third Berth Expansion Project Comprehensive Study Report.

Trans Mountain Pipeline ULC Volume 7, Pipeline Facilities Technical Reports Trans Mountain Expansion Project Ecological Risk Assessment of Westridge Marine
Terminal Spills Technical Report
December 2013 REP-NEB-TERA-00020
Page 11-5
Fisheries and Oceans Canada. 2011a. Interim Guide to Information Requirements for Environmental Assessment of Marine Finfish Aquaculture Projects. Website: http://www.dfo-mpo.gc.ca/aquaculture/ref/AAPceaafin-eng.htm. Accessed: Feb 2013.
Fong, K.H. and G.E. Gillespie. 2008. Abundance-Based Index Assessment Options for Dungeness Crab, (Cancer magister) and Spot Prawn, (Pandalus platyceros). Canadian Science Advisory Secretariat Research Document 2008/049. Fisheries and Oceans Canada. Nanaimo, BC.
French McCay, D.P. 2009. State-of-the-Art and Research Needs for Oil Spill Impact Assessment Modeling. In Proceedings of the 32nd AMOP Technical Seminar on Environmental Contamination and Response, Emergencies Science Division, Environment Canada, Ottawa, ON, Canada, pp. 601-653.
Gardner, J., Ph.D. 2009. First Nations and Marine Protected Areas Discussion Paper. Prepared for Canadian Parks and Wilderness Society. Vancouver, BC.
Goudie, R.I., S. Brault, B. Conant, A.V. Kondratyev, Petersen, and K. Vermeer. 1994. In The status of sea ducks in the north Pacific rim: toward their conservation and management. Transaction 59th North American Wildlife and Natural Resources Conference: 27-49.
Grant, S.C.H. and B.L. MacDonald. 2011. Pre-season run size forecasts for Fraser River Sockeye (Oncorhynchus nerka) and Pink (O. gorbuscha) Salmon in 2011. Canadian Science Advisory Secretariat Research Document 2011/134.
Guiguet, C.J. 1955. The Birds of British Columbia: (3) The Shorebirds. British Columbia Provincial Museum Handbook No. 8, Victoria. 54 pp.
Haggarty, D.R. 2001. An evaluation of fish habitat in Burrard Inlet, British Columbia. MSc Thesis, Department of Zoology, University of British Columbia. 161 pp.
Haggarty, D.R. 2001. An evaluation of fish habitat in Burrard Inlet, British Columbia. MSc Thesis, Department of Zoology, University of British Columbia. 161 pp.
Hanrahan, C. 1994. Wildlife inventory of the shoreline park system, Port Moody, BC. Burke Mountain Naturalists.
Hard, J.J., R.G. Kope, W.S. Grant, F.W. Waknitz, L.T. Parker and R.S. Waples. 1996. Status review of pink salmon from Washington, Oregon, and California. US Department of Commerce, Seattle, Washington.
Harper, J.R. 2013. Methods for Estimating Shoreline Oil Retention. Prepared for EBA Engineering.
Hart, J.L. 1973. Pacific Fishes of Canada. Fisheries Research Board of Canada, Ottawa, ON.
Hayward, J.L. and N.A. Verbeek. 2008. Glaucous-winged Gull (Larus glaucescens), The Birds of North America Online (A. Poole, Ed.). Ithaca: Cornell Lab of Ornithology; Retrieved from the Birds of North America Online: http://bna.birds.cornell.edu/bna/species/059 Accessed: February 2013.
Healey, M.C. 1980. Utilization of the Nanaimo River estuary by juvenile chinook salmon, Oncorhynchus tshawytscha. Fishery Bulletin 77(3): 653 – 668.
Heard, W.R. 1991. Life history of pink salmon (Oncorhynchus gorbuscha). In: Pacific Salmon Life Histories. Groot, C. and L. Margolis (eds.). UBC Press, Vancouver. pp. 120-230.
Henderson, M.A. and C.C. Graham. 1998. History and current status of Pacific salmon in British Columbia. North Pacific Anadromous Fish Commission Bulletin. No.1: 13-22

Trans Mountain Pipeline ULC Volume 7, Pipeline Facilities Technical Reports Trans Mountain Expansion Project Ecological Risk Assessment of Westridge Marine
Terminal Spills Technical Report
December 2013 REP-NEB-TERA-00020
Page 11-6
Hobson, K.A. 1997. Pelagic Cormorant (Phalacrocorax pelagicus), The Birds of North America Online (A. Poole, Ed.). Ithaca: Cornell Lab of Ornithology; Retrieved from the Birds of North America Online: http://bna.birds.cornell.edu/bna/species/282 Accessed: February 2013.
Holtby, L.B. and K.A. Ciruna. 2007. Conservation Units for Pacific Salmon under the Wild Salmon Policy. Canadian Science Advisory Secretariat Research Document 2007/070. 350 pp. Fisheries and Oceans Canada. Sidney, BC.
Howes, D.E., M.A. Zacharias and J.R. Harper. 1997. British Columbia Marine Ecological Classification: Marine Ecosections and Ecounits. Prepared for The Resource Inventory Committee Coastal Task Force. Website: http://ilmbwww.gov.bc.ca/cis/coastal/mris/mec.htm. Accessed: February, 2013.
Humphreys, R.D. and A.S. Hourston. 1978. British Columbia herring spawn deposition survey manual. Fisheries and Marine Service Miscellaneous Special Publication No. 38. 40 pp.
Intergovernmental Panel on Climate Change (IPCC). 2013. Contribution of Working Group I to the Fourth Assessment Report of the Intergovernmental Panel on Climate Change, 2007. Section 1.6 The IPCC Assessments of Climate Change and Uncertainties. Solomon, S., D. Qin, M. Manning, Z. Chen, M. Marquis, K.B. Averyt, M. Tignor and H.L. Miller (eds.). Available online at: http://www.ipcc.ch/publications_and_data/ar4/wg1/en/ch1s1-6.html. Accessed November 29, 2013.
Jacques Whitford Ltd. 2006. Environmental Assessment Certificate Application Vancouver Island Transmission Reinforcement Project First Nations Interests. Prepared for the British Columbia Transmission Corporation. Burnaby, BC.
Jamieson, G. and C. Levesque. 2012a. Identification of ecologically and biologically significant areas in the Strait of Georgia and off the west coast of Vancouver Island: Phase I – Identification of Important Areas. CSAP Working Paper 2012/P51.
Jamieson, G. and C. Levesque. 2012b. Identification of ecologically and biologically significant areas on the west coast of Vancouver Island and the Strait of Georgia ecoregions, and in some nearshore areas on the North Coast: Phase II – Designation of EBSAs. CSAP Working Paper 2012/P58.
Keister, G.P. 1981. Characteristics of Winter Roosts and Populations of Bald Eagles in the Klamath Basin. MSc Thesis, Oregon State University.
Kinder Morgan Canada Inc. (KMC). 2013. Trans Mountain Pipeline ULC Petroleum Tariff Rules and Regulations Governing the Transportation of Petroleum. Tariff No. 92. Compiled by Brenda McClellan and Issued by Heather Mark, Kinder Morgan Canada Inc. Issued May 14, 2013; Effective July 16, 2013.
Kinder Morgan. 2012. Emergency Response Plan – E.R.P., Trans Mountain Pipeline. Revised 10/2012.
Lamb, A. and P. Edgell. 2010. Coastal Fishes of the Pacific Northwest. Harbour Publishing Co. Ltd. Madeira, B.C.
Levings, C. and G. Jamieson. 2001. Marine and Estuarine Riparian Habitats and Their Role in Coastal Ecosystem, Pacific Region. Canadian Science Advisory Secretariat Research Document 2001/109. Fisheries and Oceans Canada. 41 p.
Levings, C.D. and R.M. Thom. 1994. Habitat Changes in Georgia Basin: Implications for Resource Management and Restoration. In: Wilson, R.C.H., Beamish, R.J., Aitkens, F. and Bell, J. (Eds.). 1994. Review of the Marine Environment and Biota of Strait of Georgia, Puget Sound and Juan de Fuca Strait. Proceedings of the BC/Washington Symposium on the Marine Environment, January 13 & 14, 1994. Canadian Technical Report of Fisheries and Aquatic Sciences No. 1948.

Trans Mountain Pipeline ULC Volume 7, Pipeline Facilities Technical Reports Trans Mountain Expansion Project Ecological Risk Assessment of Westridge Marine
Terminal Spills Technical Report
December 2013 REP-NEB-TERA-00020
Page 11-7
Levings, C.D., R.E. Foreman, and V.J. Tunnicliffe. 1983. Review of the benthos of the Strait of Georgia and contiguous fjords. Canadian Journal of Fisheries and Aquatic Sciences. 40: 1120 – 1141.
Levy, D.A. 1996. Juvenile salmon utilization of Burrard Inlet foreshore habitats. Prepared for the Department of Fisheries and Oceans Canada. New Westminster.
Macdonald, J.S. and B.D. Chang. 1993. Seasonal use by fish of nearshore areas in an urbanized inlet in Southwestern British Columbia. Northwest Science 67:63-77.
MacKay, D.C.G. 1942. The Pacific edible crab, Cancer magister. Bulletin of the Fisheries Research Board of Canada. 62.
Marine Mammal Research Unit. 2012. Open Water Research Station – Sea Lion Research. Question from Jennifer: Have you ever had wild sea lions or other wild animals come visit the lab? Website: http://www.sealionresearch.org/2012/03/question-from-jennifer-have-you-ever-had-wild-sea-lions-or-other-wild-animals-come-visit-the-lab/ Accessed: May 2013.
McLaren, I.A. 1993. Growth in pinnipeds. Biological Review 68:1-79.
Miller, L. 1957. Bird remains from an Oregon Indian midden. The Condor 59(1):59-63.
Naito, B.G. and J. Hwang. 2000. Timing and distribution of juvenile salmonids in Burrard Inlet: February to August 1992. Canadian Data Report of Fisheries and Aquatic Sciences 1069.
National Energy Board (NEB). 2013. NEB Filing Manual. Inclusive of Release 2013-03 (August 2013). Calgary, AB.
NatureCounts. 2013. A partner of the Avian Knowledge Network. Bird Studies Canada.
Nelson, T. and J.R. Waaland. 1997. Seasonality of eelgrass, epiphyte and grazer biomass and productivity in subtidal eelgrass meadows subjected to moderate tidal amplitude. Aquatic Botany 56:51-74
Nijman, R.A. 1990. Coquitlam-Pitt River area, Burrard Inlet water quality assessment and objectives. Ministry of Environment, Canada. Water Management Division. Website: http://www.env.gov.bc.ca/wat/wq/objectives/burrard/burrard.html#figure1 Accessed: February 2013
Northcote, T.G. and P.A. Larkin. 1989. The Fraser River: A major salmonine production system. In: Proceedings of the Large River Symposium. Edited by D.P. Dodge. Can. Spec. Publ. Fish. Aquat. Sci. 106: 172-204.
Olesiuk, P.F. 1993. Annual prey consumption by harbour seals (Phoca vitulina) in the Strait of Georgia, British Columbia. Fishery Bulletin 91:491-515.
Penttila, D.E. 1997. Investigation of intertidal spawning habitats of surf smelt and Pacific sand lance in Puget Sound, Washington, p. 395 – 407. In: Forage Fishes in Marine Ecosystems, American Fisheries Society. Lowell Lakefield Fisheries Symposium No. 14.
Penttila, D.E. 2002. Effects of shading upland vegetation on egg survival for summer-spawning surf smelt on upper intertidal beaches in Puget Sound. In: Puget Sound Research-2001 Conference Proceedings, Puget Sound Water Quality Action Team, Olympia, Washington. 9 p.Piatt, J.F., W.J. Sydeman, and F. Wiese. 2007. Introduction: a modern role for seabirds as indicators. Marine Ecology Progress Series. Vol. 352: 199-204.

Trans Mountain Pipeline ULC Volume 7, Pipeline Facilities Technical Reports Trans Mountain Expansion Project Ecological Risk Assessment of Westridge Marine
Terminal Spills Technical Report
December 2013 REP-NEB-TERA-00020
Page 11-8
Read, A.J., and K.A. Tolley. 1997. Postnatal growth and allometry of harbour porpoises from the Bay of Fundy. Canadian Journal of Zoology 75:122-130. In: Committee on the Status of Endangered Wildlife in Canada (COSEWIC). 2003c. COSEWIC assessment and update status report on the harbour porpoise Phocoena phocoena (Pacific Ocean Population) in Canada. Committee on the Status of Endangered Wildlife in Canada. Ottawa. vi + 22 pp.
Renyard, T.S. 1988. The fishes of Burrard Inlet. Discovery 17:126-129.Richoux, N.B., C.D. Levings, L. Lu and G.E. Piercey. 2006. Preliminary survey of indigenous, non-indigenous and cryptogenic benthic invertebrates in Burrard Inlet, Vancouver, British Columbia. Canadian Data Report of Fisheries and Aquatic Sciences 1183. 20 pp.
Richoux, N.B., C.D. Levings, L. Lu and G.E. Piercey. 2006. Preliminary survey of indigenous, non indigenous and cryptogenic benthic invertebrates in Burrard Inlet, Vancouver, British Columbia. Canadian Data Report of Fisheries and Aquatic Sciences 1183. 20 pp.
Robards, M.D., J.F. Piatt, and G.A. Rose. 1999. Maturation, fecundity, and intertidal spawning of Pacific sand lance in the northern Gulf of Alaska. Journal of Fish Biology 54: 1050 -1068.
Savard, J.P.L., D. Bordage, and A. Reed. 1998. Surf Scoter (Melanitta perspicillata). In The Birds of North America, No. 363. A. Poole and F. Gill Eds. The Birds of North America, Inc., Philadelphia, Pennsylvania.
Stantec Consulting Limited (Stantec). 2009. Burrard Inlet Shoreline Change – Baseline Assessment. Report prepared for Burrard Inlet Environmental Action Program.Stantec Consulting Limited (Stantec). 2010a. Long Term Monitoring Program – 2008 Report. Foreshore Environment. Westridge Hydrocarbon Accidental Release. Prepared for Kinder Morgan Canada Inc.
Stantec Consulting Limited (Stantec). 2010a. Environmental Impact Statement, Divisions B and D: Sewers, Foreshore, and Marine Environment – Westridge Hydrocarbon Accidental Release. FINAL REPORT. Prepared for Kinder Morgan Canada Inc. May 2010.
Stantec Consulting Limited (Stantec). 2010b. Long Term Monitoring Program – 2009 Report. Foreshore Environment. Westridge Hydrocarbon Accidental Release. Prepared for Kinder Morgan Canada Inc..
Stantec Consulting Limited (Stantec). 2011. Long Term Monitoring Program – 2010 Report. Foreshore Environment. Westridge Hydrocarbon Accidental Release. Prepared for Kinder Morgan Canada Inc.
Stantec Consulting Limited (Stantec). 2012a. Long Term Monitoring Program – 2012 Report. Foreshore Environment. Westridge Hydrocarbon Accidental Release. Prepared for Kinder Morgan Canada Inc.
Stantec Consulting Limited (Stantec). 2012b. Long Term Monitoring Program – 2011 Report. Foreshore Environment. Westridge Hydrocarbon Accidental Release. Prepared for Kinder Morgan Canada Inc.
Stantec Consulting Ltd. (Stantec). 2013a. Marine Resources, Westridge Marine Terminal Technical Report. Prepared for Trans Mountain Pipeline ULC, November 2013.
Stantec Consulting Ltd. (Stantec). 2013b. Marine Sediment and Water Quality, Westridge Marine Terminal, Technical Report for the Trans Mountain Pipeline ULC Project. PRELIMINARY DRAFT. Prepared for Kinder Morgan Canada Inc. October 2013.
Stantec Consulting Ltd. (Stantec). 2013c. Westridge Marine Terminal for the Trans Mountain Pipeline ULC Project, 2013 Sediment Quality Data Report. DRAFT REPORT. Prepared for Kinder Morgan Canada Inc. September 2013.

Trans Mountain Pipeline ULC Volume 7, Pipeline Facilities Technical Reports Trans Mountain Expansion Project Ecological Risk Assessment of Westridge Marine
Terminal Spills Technical Report
December 2013 REP-NEB-TERA-00020
Page 11-9
Stantec Consulting Ltd. (Stantec). 2013d. Marine Birds, Westridge Marine Terminal, Technical Report. Prepared for Trans Mountain Pipeline ULC, November 2013.
Suttles, Wayne P. 2006. The Economic Life of the Coast Salish of Haro and Rosario Straits, Vol. 5. Garland Publishing Inc. New York and London.
Todd, B.J. and V.E. Kostylev. 2010. Surficial geology and benthic habitat of the German Bank seabed, Scotian Shelf, Canada. Continental Shelf Research 31(2) Suppl. 1: S54-S68.
United States Environmental Protection Agency (USEPA). 1998. Guidelines for Ecological Risk Assessment. EPA/630/R-95/002F.
United States National Research Council (USNRC). 2003. Oil in the Sea III: Inputs, Fates, and Effects. Committee on Oil in the Sea: Inputs, Fates, and Effects, Ocean Studies Board and Marine Board, Divisions of Earth and Life Studies and Transportation Research Board, National Research Council of the National Academies. The National Academy Press, Washington, D.C. 446p.
United States National Research Council (USNRC). 2008. Transportation Research Board 2008. Committee on the Risk of Vessel Accidents and Spills in the Aleutian Islands: A Study to Design a Comprehensive Assessment. Transportation Research Board special report 293.
Vennesland, R.G. 2004. Great Blue Heron Ardea herodias. In: Identified Wildlife Strategy: Accounts and Measures for Managing Identified Wildlife – Coast Forest Region. BC Ministry of Water, Land, and Air Protection. Website: http://www.env.gov.bc.ca/wld/frpa/iwms/documents/Accounts_and_Measures_Coast.pdf Accessed: February 2013.
Vermeer, K. 1981. Food and populations of Surf Scoters in British Columbia. Wildfowl 32:107-116.
Vermeer, K. and N. Bourne. 1984. The White-winged Scoter diet in British Columbia waters: resource partitioning with other scoters. In: Nettleship, D.N., Sanger, G.A. & Springer, P.F. (Eds). Marine birds: their feeding ecology and commercial fisheries relationships. Ottawa: Canadian Wildlife Service Special Publication. pp. 62–73.
Williams, G.L. 1993. Coastal/estuarine Fish Habitat Description and Assessment Manual, Part II, Habitat Description Procedures H. M. D. Department of Fisheries and Oceans, Pacific Region. Nanaimo, BC.
Williams, J.M., M.L. Tasker, I.C. Carter and A. Webb. 1995. A method of assessing seabird vulnerability to surface pollutants. IBIS. 137: S147-S152.
Wilson, U.W. and J.B. Atkinson. 1995. Black brant winter and spring-stages use at two Washington coastal areas in relation to eelgrass abundance. The Condor 97:91-98.
Witt O‟Brien‟s, Polaris Applied ciences, and Western Canada Marine Response Corporation. 2013. A Study of Fate and Behavior of Diluted Bitumen Oils on Marine Waters Dilbit Experiments – Gainford, Alberta. Draft Report dated, November 22, 2013.
Yamanaka, K.L. and L.C. Lacko. 2001. Inshore Rockfish (Sebastes ruberrimus, S. maliger, S. caurinus, S. melanops, S. nigrocinctus, and S. nebulosus) Stock Assessment for the West Coast of Canada and Recommendations for Management. DFO Canadian Science Advisory Secretariat Research Document 2001/139.

Trans Mountain Pipeline ULC Volume 7, Pipeline Facilities Technical Reports Trans Mountain Expansion Project Ecological Risk Assessment of Westridge Marine
Terminal Spills Technical Report
December 2013 REP-NEB-TERA-00020
Page A
Appendix A Biological Sensitivity Factor Figures
Figure A.1 Biological Sensitivity Factors for Shoreline and Near Shore Habitats Figure A.2 Biological Sensitivity Factors for Fish and Fish Habitat Figure A.3 Biological Sensitivity Factors for Marine Birds and Bird Habitat Figure A.4 Biological Sensitivity Factors for Marine and Terrestrial Mammals

HW AS, PM
Nov 2013 A
123110494_064
REF
SHEET 1 OF 1
8.5 x 11 ERA
MS, HW
MAP NUMBER
REVISION
DISCIPLINE
TERA REF.DATE
SCALE
PAGE
PAGE SIZE
DRAWN CHECKED DESIGN
ALL LOCATIONS APPROXIMATE
_̂
PINECONE BURKE PARK
CYPRESS PARK
MOUNT SEYMOUR PARK
INDIAN ARM PARK
INDIAN ARM PARK
HALKETT BAY PARK
BOWEN ISLANDECOLOGICAL RESERVE
APODACA PARK
COQUITLAM 2
BURRARD INLET 3
CAPILANO 5MISSION 1
SEYMOUR CREEK 2
KITSILANO 6
INLAILAWATASH 4A
920000
920000
940000
940000
5480
000
5480
000
5500
000
5500
000
0 1.5 3 4.5 6km
1:200,000
_̂ Westridge Marine Terminal
Regional Study Area Boundary
Land of British Columbia
Waterbody
Protected Area
Aboriginal Reserve
Biological Risk Factor - Shoreline1234
¯
This document is provided by Kinder Morgan Canada Inc. (KMC) for use by the intended recipient only. This information is confidential and proprietary to KMC and is not to be provided to any other recipient without the written consent of KMC. It is not to be used for
legal, engineering or surveying purposes, nor for doing any work on or around KMC's pipelines and facilities, all of which require KMC's prior written approval.
Although there is no reason to believe that there are any errors associated with the data used to generate this product or in the product itself, users of these data are advised that errors in the data may be present.
BIOLOGICAL SENSITIVITYFACTORS FOR
NEAR SHORE HABITATS
FIGURE: A.1
Vancouver Burnaby
Port MoodyWestridge
MarineTerminal
West Vancouver
District ofNorth Vancouver
MediumLow
HighVery High

HW AS, PM
Nov 2013 A
123110494_062
REF
SHEET 1 OF 1
8.5 x 11 ERA
MS, HW
MAP NUMBER
REVISION
DISCIPLINE
TERA REF.DATE
SCALE
PAGE
PAGE SIZE
DRAWN CHECKED DESIGN
ALL LOCATIONS APPROXIMATE
_̂
920000
920000
940000
940000
5480
000
5480
000
5500
000
5500
000
0 1.5 3 4.5 6km
1:200,000
_̂ Westridge Marine Terminal
Regional Study Area Boundary
Land of British Columbia
Waterbody
Salmon-bearing Streams
Biological Risk Factor - Fish123
4
¯
This document is provided by Kinder Morgan Canada Inc. (KMC) for use by the intended recipient only. This information is confidential and proprietary to KMC and is not to be provided to any other recipient without the written consent of KMC. It is not to be used for
legal, engineering or surveying purposes, nor for doing any work on or around KMC's pipelines and facilities, all of which require KMC's prior written approval.
Although there is no reason to believe that there are any errors associated with the data used to generate this product or in the product itself, users of these data are advised that errors in the data may be present.
BIOLOGICAL SENSITIVITY FACTORS FOR
FISH AND FISH HABITAT
FIGURE: A.2
Vancouver Burnaby
Port MoodyWestridge
MarineTerminal
West Vancouver
District ofNorth Vancouver
LowMediumHigh
Very High

HW AS, PM
Nov 2013 A
123110494_063
REF
SHEET 1 OF 1
8.5 x 11 ERA
MS, HW
MAP NUMBER
REVISION
DISCIPLINE
TERA REF.DATE
SCALE
PAGE
PAGE SIZE
DRAWN CHECKED DESIGN
ALL LOCATIONS APPROXIMATE
(
((
(((
(
(
(
((
(((
(
(
((
(
(
(
(((
(
(
(
(
(
!(
!(
!(
!(
!(
!( EE
E
E
EE
E
_̂
920000
920000
940000
940000
5480
000
5480
000
5500
000
5500
000
0 1.5 3 4.5 6km
1:200,000
_̂ Westridge Marine Terminal
Regional Study Area Boundary
Land of British Columbia
Waterbody
EBlack OystercatcherBreeding Areas
!( Pigeon Guillemot Colony
( Pelagic Cormorant Colony
( Glaucous-winged Gull Colony
Important Bird Area
¯
This document is provided by Kinder Morgan Canada Inc. (KMC) for use by the intended recipient only. This information is confidential and proprietary to KMC and is not to be provided to any other recipient without the written consent of KMC. It is not to be used for
legal, engineering or surveying purposes, nor for doing any work on or around KMC's pipelines and facilities, all of which require KMC's prior written approval.
Although there is no reason to believe that there are any errors associated with the data used to generate this product or in the product itself, users of these data are advised that errors in the data may be present.
BIOLOGICAL SENSITIVITYFACTORS FOR
MARINE BIRDS AND BIRD HABITAT
FIGURE: A.3
Vancouver Burnaby
Port MoodyWestridge
MarineTerminal
West Vancouver
District ofNorth Vancouver

HW AS, PM
Nov 2013 A
123110494_065
REF
SHEET 1 OF 1
8.5 x 11 ERA
MS, HW
MAP NUMBER
REVISION
DISCIPLINE
TERA REF.DATE
SCALE
PAGE
PAGE SIZE
DRAWN CHECKED DESIGN
ALL LOCATIONS APPROXIMATE
_̂
920000
920000
940000
940000
5480
000
5480
000
5500
000
5500
000
0 1.5 3 4.5 6km
1:200,000
_̂ Westridge Marine Terminal
Regional Study Area Boundary
Land of British Columbia
Waterbody
Biological Risk Factor - Mammals1234
¯
This document is provided by Kinder Morgan Canada Inc. (KMC) for use by the intended recipient only. This information is confidential and proprietary to KMC and is not to be provided to any other recipient without the written consent of KMC. It is not to be used for
legal, engineering or surveying purposes, nor for doing any work on or around KMC's pipelines and facilities, all of which require KMC's prior written approval.
Although there is no reason to believe that there are any errors associated with the data used to generate this product or in the product itself, users of these data are advised that errors in the data may be present.
BIOLOGICAL SENSITIVITY FACTORS FOR MARINE AND
TERRESTRIAL MAMMALS
FIGURE: A.4
Vancouver Burnaby
Port MoodyWestridge
MarineTerminal
West Vancouver
District ofNorth Vancouver
LowMediumHighVery High

Trans Mountain Pipeline ULC Volume 7, Pipeline Facilities Technical Reports Trans Mountain Expansion Project Ecological Risk Assessment of Westridge Marine
Terminal Spills Technical Report
December 2013 REP-NEB-TERA-00020
Page B
Appendix B Output from EBA (EBA 2013) Credible Worst Case (CWC) 160 m3 Spill

NOTES
DATE
CLIENT
PROJECT NO.V13203022
EBA-VANCOFFICE
DWN
August 21, 2013
JASAHAPVD REV
0
ISSUED FOR REVIEW
Figure A.1-3
TRANS MOUNTAIN OIL SPILL STUDY
26 Aug 2013 11:04:15V:\V13203022 Trans Mountain\working\AH\02-SPILLCALC\510-Stochastic_Westridge\Results_Winter2012\Tecplot\03-stochastic_map_lines.lay
Stochastic SimulationWinter 2012, Site A
Probability of Oil Presence
-CKD
STATUS
- Statistical results based on independent spills occuring every 3 hours from January 01 00:00to March 31 23:00, for a total of 728 independant spills.
- Probability of oil presence is the percentage of simulations in which oil was present at a given location.
- Spills were tracked until no oil left on water. Tracking time for each spill varied, based on the duration of oil on water.
- A 32 m3 release was modelled, corresponding to a 160 m3 operational spill at berth with 20%, i.e. 32 m3
distribution across the spill boom.
11
5
510
20
20
20
40
40
40
60
60
60
6080
Longitude
-123.20 -123.10 -123.00 -122.90
49.30
49.35
49.409590806040201051
Probabilityof
Oil Presence(%)
ReleaseLocation

NOTES
DATE
CLIENT
PROJECT NO.V13203022
EBA-VANCOFFICE
DWN
August 21, 2013
JASAHAPVD REV
0
ISSUED FOR REVIEW
Figure A.1-4
TRANS MOUNTAIN OIL SPILL STUDY
26 Aug 2013 11:04:01V:\V13203022 Trans Mountain\working\AH\02-SPILLCALC\510-Stochastic_Westridge\Results_Winter2012\Tecplot\04-shore_prob.lay
Stochastic SimulationWinter 2012, Site A
Shoreline Oiled Probability
-CKD
STATUS
- Statistical results based on independent spills occuring every 3 hours from January 01 00:00to March 31 23:00, for a total of 728 independant spills.
- Probability of oil presence is the percentage of simulations in which oil was present at a given location.
- Spills were tracked until no oil left on water. Tracking time for each spill varied, based on the duration of oil on water.
- A 32 m3 release was modelled, corresponding to a 160 m3 operational spill at berth with 20%, i.e. 32 m3
distribution across the spill boom.
Longitude
-123.25 -123.20 -123.15 -123.10 -123.05 -123.00 -122.95 -122.90 -122.85
49.30
49.35
49.40
95
90
80
60
40
20
10
5
1
Probabilityfor Shoreto be Oiled
(%)
ReleaseLocation

NOTES
DATE
CLIENT
PROJECT NO.V13203022
EBA-VANCOFFICE
DWN
August 22, 2013
JASAHAPVD REV
0
ISSUED FOR REVIEW
Figure A.1-9
TRANS MOUNTAIN OIL SPILL STUDY
26 Aug 2013 11:00:54V:\V13203022 Trans Mountain\working\AH\02-SPILLCALC\510-Stochastic_Westridge\Results_Winter2012\Tecplot\09-statistics_MB_1.lay
Stochastic SimulationWinter 2012, Site A
Major Components of the Mass Balance
-CKD
STATUS
- Statistical results based on independent spills occuring every 3 hours from January 01 00:00to March 31 23:00, for a total of 728 independant spills.
- Tracking time for each spill was a maximum of 15 days.
- The major components of the mass balance are shown above.
Time (Days)
3
0 2 4 6 8 10 12 140 0
5 5
10 10
15 15
20 20
25 25
30 30
Average on water
Average on shore
Average evaporated
Total
4.1 %
90.3 %

NOTES
DATE
CLIENT
PROJECT NO.V13203022
EBA-VANCOFFICE
DWN
August 22, 2013
JASAHAPVD REV
0
ISSUED FOR REVIEW
Figure A.1-10
TRANS MOUNTAIN OIL SPILL STUDY
26 Aug 2013 11:00:44V:\V13203022 Trans Mountain\working\AH\02-SPILLCALC\510-Stochastic_Westridge\Results_Winter2012\Tecplot\10-statistics_MB_2.lay
Stochastic SimulationWinter 2012, Site A
Minor Components of the Mass Balance
-CKD
STATUS
- Statistical results based on independent spills occuring every 3 hours from January 01 00:00to March 31 23:00, for a total of 728 independant spills.
- Tracking time for each spill was a maximum of 15 days.
- The minor components of the mass balance are shown above.
Time (Days)
3
0 2 4 6 8 10 12 140 0
1 1
2 2
3 3
Average dispersed
Average biodegraded
Average dissolved
5.5 %
0.1 %

NOTES
DATE
CLIENT
PROJECT NO.V13203022
EBA-VANCOFFICE
DWN
August 21, 2013
JASAHAPVD REV
0
ISSUED FOR REVIEW
Figure A.2-3
TRANS MOUNTAIN OIL SPILL STUDY
26 Aug 2013 11:44:41V:\V13203022 Trans Mountain\working\AH\02-SPILLCALC\510-Stochastic_Westridge\Results_Spring2012\Tecplot\03-stochastic_map_lines.lay
Stochastic SimulationSpring 2012, Site A
Probability of Oil Presence
-CKD
STATUS
- Statistical results based on independent spills occuring every 3 hours from April 01 00:00to June 30 23:00, for a total of 728 independant spills.
- Probability of oil presence is the percentage of simulations in which oil was present at a given location.
- Spills were tracked until no oil left on water. Tracking time for each spill varied, based on the duration of oil on water.
- A 32 m3 release was modelled, corresponding to a 160 m3 operational spill at berth with 20%, i.e. 32 m3
distribution across the spill boom.
1 1
1
1
11
1
5
55
10
10
10
1010 10
20
20
40
40
40 40
60 6060
60
6060
80 80
80
Longitude
-123.20 -123.10 -123.00 -122.90
49.30
49.35
49.409590806040201051
Probabilityof
Oil Presence(%)
ReleaseLocation

NOTES
DATE
CLIENT
PROJECT NO.V13203022
EBA-VANCOFFICE
DWN
August 21, 2013
JASAHAPVD REV
0
ISSUED FOR REVIEW
Figure A.2-4
TRANS MOUNTAIN OIL SPILL STUDY
26 Aug 2013 11:44:31V:\V13203022 Trans Mountain\working\AH\02-SPILLCALC\510-Stochastic_Westridge\Results_Spring2012\Tecplot\04-shore_prob.lay
Stochastic SimulationSpring 2012, Site A
Shoreline Oiled Probability
-CKD
STATUS
- Statistical results based on independent spills occuring every 3 hours from April 01 00:00to June 30 23:00, for a total of 728 independant spills.
- Probability of oil presence is the percentage of simulations in which oil was present at a given location.
- Spills were tracked until no oil left on water. Tracking time for each spill varied, based on the duration of oil on water.
- A 32 m3 release was modelled, corresponding to a 160 m3 operational spill at berth with 20%, i.e. 32 m3
distribution across the spill boom.
Longitude
-123.25 -123.20 -123.15 -123.10 -123.05 -123.00 -122.95 -122.90 -122.85
49.30
49.35
49.40
95
90
80
60
40
20
10
5
1
Probabilityfor Shoreto be Oiled
(%)
ReleaseLocation

NOTES
DATE
CLIENT
PROJECT NO.V13203022
EBA-VANCOFFICE
DWN
August 22, 2013
JASAHAPVD REV
0
ISSUED FOR REVIEW
Figure A.2-9
TRANS MOUNTAIN OIL SPILL STUDY
26 Aug 2013 11:43:33V:\V13203022 Trans Mountain\working\AH\02-SPILLCALC\510-Stochastic_Westridge\Results_Spring2012\Tecplot\09-statistics_MB_1.lay
Stochastic SimulationSpring 2012, Site A
Major Components of the Mass Balance
-CKD
STATUS
- Statistical results based on independent spills occuring every 3 hours from April 01 00:00to June 30 23:00, for a total of 728 independant spills.
- Tracking time for each spill was a maximum of 15 days.
- The major components of the mass balance are shown above.
Time (Days)
3
0 2 4 6 8 10 12 140 0
5 5
10 10
15 15
20 20
25 25
30 30
Average on water
Average on shore
Average evaporated
Total
4.1 %
90.3 %

NOTES
DATE
CLIENT
PROJECT NO.V13203022
EBA-VANCOFFICE
DWN
August 22, 2013
JASAHAPVD REV
0
ISSUED FOR REVIEW
Figure A.2-10
TRANS MOUNTAIN OIL SPILL STUDY
26 Aug 2013 11:43:23V:\V13203022 Trans Mountain\working\AH\02-SPILLCALC\510-Stochastic_Westridge\Results_Spring2012\Tecplot\10-statistics_MB_2.lay
Stochastic SimulationSpring 2012, Site A
Minor Components of the Mass Balance
-CKD
STATUS
- Statistical results based on independent spills occuring every 3 hours from April 01 00:00to June 30 23:00, for a total of 728 independant spills.
- Tracking time for each spill was a maximum of 15 days.
- The minor components of the mass balance are shown above.
Time (Days)
3
0 2 4 6 8 10 12 140 0
1 1
2 2
3 3
Average dispersed
Average biodegraded
Average dissolved
5.5 %
0.1 %

NOTES
DATE
CLIENT
PROJECT NO.V13203022
EBA-VANCOFFICE
DWN
October 16, 2013
JASAHAPVD REV
0
ISSUED FOR REVIEW
Figure A.3-3
TRANS MOUNTAIN OIL SPILL STUDY
16 Oct 2013 14:28:00V:\V13203022 Trans Mountain\working\AH\02-SPILLCALC\510-Stochastic_Westridge\Results_Summer2012\Tecplot\03-stochastic_map_lines.lay
Stochastic SimulationSummer 2012, Site A
Probability of Oil Presence
-CKD
STATUS
- Statistical results based on independent spills occuring every 3 hours from July 01 00:00to September 30 23:00, for a total of 736 independant spills.
- Probability of oil presence is the percentage of simulations in which oil was present at a given location.
- Spills were tracked until no oil left on water. Tracking time for each spill varied, based on the duration of oil on water.
- A 32 m3 release was modelled, corresponding to a 160 m3 operational spill at berth with 20%, i.e. 32 m3
distribution across the spill boom.
1
1
1 1 1
111
11
1
5 5
55
10
10
10
20
20 20
40
40
40
60
6060
60
80
95
95
Longitude
-123.20 -123.10 -123.00 -122.90
49.30
49.35
49.40
9590806040201051
Probabilityof
Oil Presence(%)
ReleaseLocation

NOTES
DATE
CLIENT
PROJECT NO.V13203022
EBA-VANCOFFICE
DWN
October 16, 2013
JASAHAPVD REV
0
ISSUED FOR REVIEW
Figure A.3-4
TRANS MOUNTAIN OIL SPILL STUDY
16 Oct 2013 14:29:10V:\V13203022 Trans Mountain\working\AH\02-SPILLCALC\510-Stochastic_Westridge\Results_Summer2012\Tecplot\04-shore_prob.lay
Stochastic SimulationSummer 2012, Site A
Shoreline Oiled Probability
-CKD
STATUS
- Statistical results based on independent spills occuring every 3 hours from July 01 00:00 toSeptember 30 23:00 for a total of 736 independant spills.
- Probability of oil presence is the percentage of simulations in which oil was present at a given location.
- Spills were tracked until no oil left on water. Tracking time for each spill varied, based on the duration of oil on water.
- A 32 m3 release was modelled, corresponding to a 160 m3 operational spill at berth with 20%, i.e. 32 m3
distribution across the spill boom.
Longitude
-123.25 -123.20 -123.15 -123.10 -123.05 -123.00 -122.95 -122.90 -122.85
49.30
49.35
49.40
95
90
80
60
40
20
10
5
1
Probabilityfor Shoreto be Oiled
(%)
ReleaseLocation

NOTES
DATE
CLIENT
PROJECT NO.V13203022
EBA-VANCOFFICE
DWN
October 16, 2013
JASAHAPVD REV
0
ISSUED FOR REVIEW
Figure A.3-9
TRANS MOUNTAIN OIL SPILL STUDY
16 Oct 2013 14:38:37V:\V13203022 Trans Mountain\working\AH\02-SPILLCALC\510-Stochastic_Westridge\Results_Summer2012\Tecplot\09-statistics_MB_1.lay
Stochastic SimulationSummer 2012, Site A
Major Components of the Mass Balance
-CKD
STATUS
- Statistical results based on independent spills occuring every 3 hours from July 01 00:00to September 30 23:00, for a total of 736 independant spills.
- Tracking time for each spill was a maximum of 15 days.
- The major components of the mass balance are shown above.
Time (Days)
3
0 2 4 6 8 10 12 140 0
5 5
10 10
15 15
20 20
25 25
30 30
Average on water
Average on shore
Average evaporated
Total
4.2 %
90.0 %

NOTES
DATE
CLIENT
PROJECT NO.V13203022
EBA-VANCOFFICE
DWN
October 16, 2013
JASAHAPVD REV
0
ISSUED FOR REVIEW
Figure A.3-10
TRANS MOUNTAIN OIL SPILL STUDY
16 Oct 2013 14:38:59V:\V13203022 Trans Mountain\working\AH\02-SPILLCALC\510-Stochastic_Westridge\Results_Summer2012\Tecplot\10-statistics_MB_2.lay
Stochastic SimulationSummer 2012, Site A
Minor Components of the Mass Balance
-CKD
STATUS
- Statistical results based on independent spills occuring every 3 hours from July 01 00:00to September 30 23:00, for a total of 736 independant spills.
- Tracking time for each spill was a maximum of 15 days.
- The minor components of the mass balance are shown above.
Time (Days)
3
0 2 4 6 8 10 12 140 0
1 1
2 2
3 3
Average dispersed
Average biodegraded
Average dissolved
5.7 %
0.1 %

NOTES
DATE
CLIENT
PROJECT NO.V13203022
EBA-VANCOFFICE
DWN
August 21, 2013
JASAHAPVD REV
0
ISSUED FOR REVIEW
Figure A.4-3
TRANS MOUNTAIN OIL SPILL STUDY
26 Aug 2013 13:54:19V:\V13203022 Trans Mountain\working\AH\02-SPILLCALC\510-Stochastic_Westridge\Results_Fall2011\Tecplot\03-stochastic_map_lines.lay
Stochastic SimulationFall 2011, Site A
Probability of Oil Presence
-CKD
STATUS
- Statistical results based on independent spills occuring every 3 hours from October 01 01:00to December 31 23:00, for a total of 728 independant spills.
- Probability of oil presence is the percentage of simulations in which oil was present at a given location.
- Spills were tracked until no oil left on water. Tracking time for each spill varied, based on the duration of oil on water.
- A 32 m3 release was modelled, corresponding to a 160 m3 operational spill at berth with 20%, i.e. 32 m3
distribution across the spill boom.
1
1
1
11
11
1
1
5
5
5
5
5
10
10
20
20 40
4040
60
80
8090
90
95
Longitude
-123.20 -123.10 -123.00 -122.90
49.30
49.35
49.409590806040201051
Probabilityof
Oil Presence(%)
ReleaseLocation

NOTES
DATE
CLIENT
PROJECT NO.V13203022
EBA-VANCOFFICE
DWN
August 21, 2013
JASAHAPVD REV
0
ISSUED FOR REVIEW
Figure A.4-4
TRANS MOUNTAIN OIL SPILL STUDY
26 Aug 2013 13:54:04V:\V13203022 Trans Mountain\working\AH\02-SPILLCALC\510-Stochastic_Westridge\Results_Fall2011\Tecplot\04-shore_prob.lay
Stochastic SimulationFall 2011, Site A
Shoreline Oiled Probability
-CKD
STATUS
- Statistical results based on independent spills occuring every 3 hours from October 01 01:00to December 31 23:00, for a total of 728 independant spills.
- Probability of oil presence is the percentage of simulations in which oil was present at a given location.
- Spills were tracked until no oil left on water. Tracking time for each spill varied, based on the duration of oil on water.
- A 32 m3 release was modelled, corresponding to a 160 m3 operational spill at berth with 20%, i.e. 32 m3
distribution across the spill boom.
Longitude
-123.25 -123.20 -123.15 -123.10 -123.05 -123.00 -122.95 -122.90 -122.85
49.30
49.35
49.40
95
90
80
60
40
20
10
5
1
Probabilityfor Shoreto be Oiled
(%)
ReleaseLocation

NOTES
DATE
CLIENT
PROJECT NO.V13203022
EBA-VANCOFFICE
DWN
August 22, 2013
JASAHAPVD REV
0
ISSUED FOR REVIEW
Figure A.4-9
TRANS MOUNTAIN OIL SPILL STUDY
26 Aug 2013 13:51:26V:\V13203022 Trans Mountain\working\AH\02-SPILLCALC\510-Stochastic_Westridge\Results_Fall2011\Tecplot\09-statistics_MB_1.lay
Stochastic SimulationFall 2011, Site A
Major Components of the Mass Balance
-CKD
STATUS
- Statistical results based on independent spills occuring every 3 hours from October 01 01:00to December 31 23:00, for a total of 728 independant spills.
- Tracking time for each spill was a maximum of 15 days.
- The major components of the mass balance are shown above.
Time (Days)
3
0 2 4 6 8 10 12 140 0
5 5
10 10
15 15
20 20
25 25
30 30
Average on water
Average on shore
Average evaporated
Total
4.1 %
90.5 %

NOTES
DATE
CLIENT
PROJECT NO.V13203022
EBA-VANCOFFICE
DWN
August 22, 2013
JASAHAPVD REV
0
ISSUED FOR REVIEW
Figure A.4-10
TRANS MOUNTAIN OIL SPILL STUDY
26 Aug 2013 13:51:14V:\V13203022 Trans Mountain\working\AH\02-SPILLCALC\510-Stochastic_Westridge\Results_Fall2011\Tecplot\10-statistics_MB_2.lay
Stochastic SimulationFall 2011, Site A
Minor Components of the Mass Balance
-CKD
STATUS
- Statistical results based on independent spills occuring every 3 hours from October 01 01:00to December 31 23:00, for a total of 728 independant spills.
- Tracking time for each spill was a maximum of 15 days.
- The minor components of the mass balance are shown above.
Time (Days)
3
0 2 4 6 8 10 12 140 0
1 1
2 2
3 3
Average dispersed
Average biodegraded
Average dissolved
5.3 %
0.1 %

Trans Mountain Pipeline ULC Volume 7, Pipeline Facilities Technical Reports Trans Mountain Expansion Project Ecological Risk Assessment of Westridge Marine
Terminal Spills Technical Report
December 2013 REP-NEB-TERA-00020
Page C
Appendix C Output from EBA (EBA 2013) 10 m3 Smaller Spills

NOTES
DATE
CLIENT
PROJECT NO.V13203022
EBA-VANCOFFICE
DWN
October 23, 2013
JASAHAPVD REV
0
ISSUED FOR REVIEW
Figure A.1-2
TRANS MOUNTAIN OIL SPILL STUDY
21 Oct 2013 15:20:11T:\TMEP\working\AH\02-SPILLCALC\512-Stochastic_Westridge_10m3_Boom\Results_Winter\Tecplot\08-statistics_MB_1.lay
Stochastic SimulationWinter 2012, Site A (10 m3)
Major Components of the Mass Balance
-CKD
STATUS
- Statistical results based on independent spills occuring every 6 hours from January 01 00:00to March 31 23:00.
- Tracking time for each spill was 5 days.
- The major components of the mass balance are shown above.
Time (Days)
3
0 0.5 1 1.5 2 2.5 3 3.5 4 4.5 50 0
2 2
4 4
6 6
8 8
10 10
Average on water
Average evaporated
Total
72.3 %
22.7 %

NOTES
DATE
CLIENT
PROJECT NO.V13203022
EBA-VANCOFFICE
DWN
October 23, 2013
JASAHAPVD REV
0
ISSUED FOR REVIEW
Figure A.1-3
TRANS MOUNTAIN OIL SPILL STUDY
21 Oct 2013 15:20:29T:\TMEP\working\AH\02-SPILLCALC\512-Stochastic_Westridge_10m3_Boom\Results_Winter\Tecplot\09-statistics_MB_2.lay
Stochastic SimulationWinter 2012, Site A (10 m3)
Minor Components of the Mass Balance
-CKD
STATUS
- Statistical results based on independent spills occuring every 6 hours from January 01 00:00to March 31 23:00.
- Tracking time for each spill was 5 days.
- The minor components of the mass balance are shown above.
Time (Days)
3
0 0.5 1 1.5 2 2.5 3 3.5 4 4.5 50 0
0.2 0.2
0.4 0.4
0.6 0.6
0.8 0.8
1 1
Average dispersed
Average On Bank
Average biodegraded
Average dissolved
3.2 %
1.8 %

NOTES
DATE
CLIENT
PROJECT NO.V13203022
EBA-VANCOFFICE
DWN
October 23, 2013
JASAHAPVD REV
0
ISSUED FOR REVIEW
Figure A.2-2
TRANS MOUNTAIN OIL SPILL STUDY
21 Oct 2013 15:29:39T:\TMEP\working\AH\02-SPILLCALC\512-Stochastic_Westridge_10m3_Boom\Results_Spring\Tecplot\08-statistics_MB_1.lay
Stochastic SimulationSpring 2012, Site A (10 m3)
Major Components of the Mass Balance
-CKD
STATUS
- Statistical results based on independent spills occuring every 6 hours from April 01 00:00to June 30 23:00.
- Tracking time for each spill was 5 days.
- The major components of the mass balance are shown above.
Time (Days)
3
0 0.5 1 1.5 2 2.5 3 3.5 4 4.5 50 0
2 2
4 4
6 6
8 8
10 10
Average on water
Average evaporated
Total
72.6 %
22.4 %

NOTES
DATE
CLIENT
PROJECT NO.V13203022
EBA-VANCOFFICE
DWN
October 23, 2013
JASAHAPVD REV
0
ISSUED FOR REVIEW
Figure A.2-3
TRANS MOUNTAIN OIL SPILL STUDY
21 Oct 2013 15:30:04T:\TMEP\working\AH\02-SPILLCALC\512-Stochastic_Westridge_10m3_Boom\Results_Spring\Tecplot\09-statistics_MB_2.lay
Stochastic SimulationSpring 2012, Site A (10 m3)
Minor Components of the Mass Balance
-CKD
STATUS
- Statistical results based on independent spills occuring every 6 hours from April 01 00:00to June 30 23:00.
- Tracking time for each spill was 5 days.
- The minor components of the mass balance are shown above.
Time (Days)
3
0 0.5 1 1.5 2 2.5 3 3.5 4 4.5 50 0
0.2 0.2
0.4 0.4
0.6 0.6
0.8 0.8
1 1
Average dispersed
Average On Bank
Average biodegraded
Average dissolved
3.2 %
1.8 %

NOTES
DATE
CLIENT
PROJECT NO.V13203022
EBA-VANCOFFICE
DWN
October 23, 2013
JASAHAPVD REV
0
ISSUED FOR REVIEW
Figure A.3-2
TRANS MOUNTAIN OIL SPILL STUDY
21 Oct 2013 15:26:55T:\TMEP\working\AH\02-SPILLCALC\512-Stochastic_Westridge_10m3_Boom\Results_Summer\Tecplot\08-statistics_MB_1.lay
Stochastic SimulationSummer 2012, Site A (10 m3)
Major Components of the Mass Balance
-CKD
STATUS
- Statistical results based on independent spills occuring every 6 hours from July 01 00:00to September 30 23:00.
- Tracking time for each spill was 5 days.
- The major components of the mass balance are shown above.
Time (Days)
3
0 0.5 1 1.5 2 2.5 3 3.5 4 4.5 50 0
2 2
4 4
6 6
8 8
10 10
Average on water
Average evaporated
Total
73.1 %
21.7 %

NOTES
DATE
CLIENT
PROJECT NO.V13203022
EBA-VANCOFFICE
DWN
October 23, 2013
JASAHAPVD REV
0
ISSUED FOR REVIEW
Figure A.3-3
TRANS MOUNTAIN OIL SPILL STUDY
21 Oct 2013 15:34:17T:\TMEP\working\AH\02-SPILLCALC\512-Stochastic_Westridge_10m3_Boom\Results_Summer\Tecplot\09-statistics_MB_2.lay
Stochastic SimulationSummer 2012, Site A (10 m3)
Minor Components of the Mass Balance
-CKD
STATUS
- Statistical results based on independent spills occuring every 6 hours from July 01 00:00to September 30 23:00.
- Tracking time for each spill was 5 days.
- The minor components of the mass balance are shown above.
Time (Days)
3
0 0.5 1 1.5 2 2.5 3 3.5 4 4.5 50 0
0.2 0.2
0.4 0.4
0.6 0.6
0.8 0.8
1 1
Average dispersed
Average On Bank
Average biodegraded
Average dissolved
3.3 %
1.9 %

NOTES
DATE
CLIENT
PROJECT NO.V13203022
EBA-VANCOFFICE
DWN
October 23, 2013
JASAHAPVD REV
0
ISSUED FOR REVIEW
Figure A.4-2
TRANS MOUNTAIN OIL SPILL STUDY
21 Oct 2013 15:33:25T:\TMEP\working\AH\02-SPILLCALC\512-Stochastic_Westridge_10m3_Boom\Results_Fall\Tecplot\08-statistics_MB_1.lay
Stochastic SimulationFall 2011, Site A (10 m3)
Major Components of the Mass Balance
-CKD
STATUS
- Statistical results based on independent spills occuring every 6 hours from October 01 00:00to December 31 23:00.
- Tracking time for each spill was 5 days.
- The major components of the mass balance are shown above.
Time (Days)
3
0 0.5 1 1.5 2 2.5 3 3.5 4 4.5 50 0
2 2
4 4
6 6
8 8
10 10
Average on water
Average evaporated
Total
72.1 %
22.9 %

NOTES
DATE
CLIENT
PROJECT NO.V13203022
EBA-VANCOFFICE
DWN
October 23, 2013
JASAHAPVD REV
0
ISSUED FOR REVIEW
Figure A.4-3
TRANS MOUNTAIN OIL SPILL STUDY
21 Oct 2013 15:33:39T:\TMEP\working\AH\02-SPILLCALC\512-Stochastic_Westridge_10m3_Boom\Results_Fall\Tecplot\09-statistics_MB_2.lay
Stochastic SimulationFall 2011, Site A (10 m3)
Minor Components of the Mass Balance
-CKD
STATUS
- Statistical results based on independent spills occuring every 6 hours from October 01 00:00to December 31 23:00.
- Tracking time for each spill was 5 days.
- The minor components of the mass balance are shown above.
Time (Days)
3
0 0.5 1 1.5 2 2.5 3 3.5 4 4.5 50 0
0.2 0.2
0.4 0.4
0.6 0.6
0.8 0.8
1 1
Average dispersed
Average On Bank
Average biodegraded
Average dissolved
3.2 %
1.8 %

Trans Mountain Pipeline ULC Volume 7, Pipeline Facilities Technical Reports Trans Mountain Expansion Project Ecological Risk Assessment of Westridge Marine
Terminal Spills Technical Report
December 2013 REP-NEB-TERA-00020
Page D
Appendix D Probability of Surface and Shoreline Oiling for a 160 m3 Spill
Figure D.1 Probability of oiling Stochastic Simulation 160 m3 Spill Winter Season Figure D.2 Probability of oiling Stochastic Simulation 160 m3 Spill Spring Season Figure D.3 Probability of oiling Stochastic Simulation 160 m3 Spill Summer Season Figure D.4 Probability of oiling Stochastic Simulation 160 m3 Spill Fall Season

NOTES
DATE
CLIENT
PROJECT NO.V13203022
EBA-VANCOFFICE
DWN
December 9, 2013
JASAHAPVD REV
0
ISSUED FOR USE
Figure D.1
TRANS MOUNTAIN OIL SPILL STUDY
09 Dec 2013 08:54:15V:\V13203022 Trans Mountain\working\AH\02-SPILLCALC\510-Stochastic_Westridge\Results_Winter2012\Tecplot\03-stochastic_map_lines_4Stantec.lay
Probability of OilingWestridge Terminal Stochastic Simulation
160 m3 Spill Winter Season
MSCKD
STATUS
- Statistical results based on independent spills occuring every 3 hours from January 01 00:00to March 31 23:00, for a total of 728 independant spills.
- Probability of oil presence is the percentage of simulations in which oil was present at a given locationon shoreline or water surface.
- Spills were tracked until no oil left on water. Tracking time for each spill varied, based on the duration of oil on water.
- A 32 m3 release was modelled, corresponding to a 160 m3 operational spill at berth with 20%, i.e. 32 m3
distribution across the spill boom.
1
10
901 50
50
50
1
10
Longitude
Latit
ude
-123.35 -123.30 -123.25 -123.20 -123.15 -123.10 -123.05 -123.00 -122.95 -122.90 -122.85
49.26
49.28
49.30
49.32
49.34
49.36
49.38
49.40
49.42
49.44Probability
ofOil Presence
(%)
1 - 10
>90 - 100
>50 - 90
>10 - 50
ReleaseLocation

NOTES
DATE
CLIENT
PROJECT NO.V13203022
EBA-VANCOFFICE
DWN
December 9, 2013
JASAHAPVD REV
0
ISSUED FOR USE
Figure D.2
TRANS MOUNTAIN OIL SPILL STUDY
09 Dec 2013 09:04:35V:\V13203022 Trans Mountain\working\AH\02-SPILLCALC\510-Stochastic_Westridge\Results_Spring2012\Tecplot\03-stochastic_map_lines_4Stantec.lay
Probability of OilingWestridge Terminal Stochastic Simulation
160 m3 Spill Spring Season
MSCKD
STATUS
- Statistical results based on independent spills occuring every 3 hours from April 1 00:00to June 30 23:00, for a total of 728 independant spills.
- Probability of oil presence is the percentage of simulations in which oil was present at a given locationon shoreline or water surface.
- Spills were tracked until no oil left on water. Tracking time for each spill varied, based on the duration of oil on water.
- A 32 m3 release was modelled, corresponding to a 160 m3 operational spill at berth with 20%, i.e. 32 m3
distribution across the spill boom.
1
901 10
10
50
50
Longitude
Latit
ude
-123.35 -123.30 -123.25 -123.20 -123.15 -123.10 -123.05 -123.00 -122.95 -122.90 -122.85
49.26
49.28
49.30
49.32
49.34
49.36
49.38
49.40
49.42
49.44Probability
ofOil Presence
(%)
1 - 10
>90 - 100
>50 - 90
>10 - 50
ReleaseLocation

NOTES
DATE
CLIENT
PROJECT NO.V13203022
EBA-VANCOFFICE
DWN
December 9, 2013
JASAHAPVD REV
0
ISSUED FOR USE
Figure D.3
TRANS MOUNTAIN OIL SPILL STUDY
09 Dec 2013 09:16:04V:\V13203022 Trans Mountain\working\AH\02-SPILLCALC\510-Stochastic_Westridge\Results_Summer2012\Tecplot\03-stochastic_map_lines_4Stantec.lay
Probability of OilingWestridge Terminal Stochastic Simulation
160 m3 Spill Summer Season
MSCKD
STATUS
- Statistical results based on independent spills occuring every 3 hours from July 1 00:00to September 30 23:00, for a total of 736 independant spills.
- Probability of oil presence is the percentage of simulations in which oil was present at a given locationon shoreline or water surface.
- Spills were tracked until no oil left on water. Tracking time for each spill varied, based on the duration of oil on water.
- A 32 m3 release was modelled, corresponding to a 160 m3 operational spill at berth with 20%, i.e. 32 m3
distribution across the spill boom.
1
10
1
10
10
50
5 0
90
Longitude
Latit
ude
-123.35 -123.30 -123.25 -123.20 -123.15 -123.10 -123.05 -123.00 -122.95 -122.90 -122.85
49.26
49.28
49.30
49.32
49.34
49.36
49.38
49.40
49.42
49.44Probability
ofOil Presence
(%)
1 - 10
>90 - 100
>50 - 90
>10 - 50
ReleaseLocation

NOTES
DATE
CLIENT
PROJECT NO.V13203022
EBA-VANCOFFICE
DWN
December 9, 2013
JASAHAPVD REV
0
ISSUED FOR USE
Figure D.4
TRANS MOUNTAIN OIL SPILL STUDY
09 Dec 2013 09:20:38V:\V13203022 Trans Mountain\working\AH\02-SPILLCALC\510-Stochastic_Westridge\Results_Fall2011\Tecplot\03-stochastic_map_lines_4Stantec.lay
Probability of OilingWestridge Terminal Stochastic Simulation
160 m3 Spill Fall Season
MSCKD
STATUS
- Statistical results based on independent spills occuring every 3 hours from October 1 00:00to December 31 23:00, for a total of 736 independant spills.
- Probability of oil presence is the percentage of simulations in which oil was present at a given locationon shoreline or water surface.
- Spills were tracked until no oil left on water. Tracking time for each spill varied, based on the duration of oil on water.
- A 32 m3 release was modelled, corresponding to a 160 m3 operational spill at berth with 20%, i.e. 32 m3
distribution across the spill boom.
9010
1
1
10
5010
Longitude
Latit
ude
-123.35 -123.30 -123.25 -123.20 -123.15 -123.10 -123.05 -123.00 -122.95 -122.90 -122.85
49.26
49.28
49.30
49.32
49.34
49.36
49.38
49.40
49.42
49.44Probability
ofOil Presence
(%)
1 - 10
>90 - 100
>50 - 90
>10 - 50
ReleaseLocation

QUALITATIVE HUMAN HEALTH RISK ASSESSMENT
OF WESTRIDGE MARINE TERMINAL SPILLS TECHNICAL REPORT
FOR THE TRANS MOUNTAIN PIPELINE ULC
TRANS MOUNTAIN EXPANSION PROJECT
December 2013
REP-NEB-TERA-00033
Prepared for:
Trans Mountain Pipeline ULC Kinder Morgan Canada Inc. Suite 2700, 300 – 5th Avenue S.W. Calgary, Alberta T2P 5J2 Ph: 403-514-6400
Prepared by:
Intrinsik Environmental Sciences Inc. Suite 1060, 736 - 8th Avenue S.W.
Calgary, Alberta T2P 1H4 Ph: 403-237-0275

Trans Mountain Pipeline ULC
Qualitative Human Health Risk Assessment of Westridge Marine Terminal Spills Technical
Report Trans Mountain Expansion Project
EXECUTIVE SUMMARY This report outlines the methods that were used, the findings that emerged and the conclusions that were reached as part of a preliminary qualitative human health risk assessment (QHHRA) of two simulated scenarios involving oil spills during tanker loading at the Westridge Marine Terminal:
1) A credible worst case (CWC) oil spill scenario of 160 m3 in which 80% of the spilled oil was assumed to be contained with the boom at the berth and 20% of the spilled oil escaped the boom and entered the Burrard Inlet; and,
2) A smaller 10 m3 spill scenario, totally contained within the boom.
The QHHRA focused on the potential health effects that could occur among people present in the area surrounding the Westridge Marine Terminal, whether on shore or on the water in pleasure craft or other boats.
The QHHRA focused on the acute inhalation exposures to hydrocarbons vapours emitted from the surface of the oil slick that people could experience during the early stages of the oil spill. No other relevant exposure pathways by which people in the area could be exposed to the hydrocarbons were identified.
The QHHRA revealed some prospect for people’s health to be affected from acute inhalation exposure to the hydrocarbon vapours under the CWC simulated spill scenario. Based on the types of chemicals that might be encountered, the potential health effects experienced by these people would likely be dominated by irritation of the eyes and/or breathing passages, possibly accompanied by symptoms consistent with central nervous system (CNS) involvement, such as nausea, headache, light headedness and/or dizziness. The effects could range from barely noticeable to quite noticeable, depending on the actual exposure circumstances and the sensitivity of the individuals exposed.
The QHHRA revealed no obvious prospect for people’s health to be affected from acute inhalation exposure to the hydrocarbon vapours under the smaller simulated oil spill scenario.
The QHHRA provided no indication that health effects would be experienced by people living in communities along the Burrard Inlet under either of the simulated oil spill scenarios.
A more focused and detailed human health risk assessment (HHRA) will be completed and submitted to the National Energy Board (NEB) in early 2014.
7894/December 2013 REP-NEB-TERA-00033
Page i

Trans Mountain Pipeline ULC
Qualitative Human Health Risk Assessment of Westridge Marine Terminal Spills Technical
Report Trans Mountain Expansion Project
TABLE OF CONTENTS
Page EXECUTIVE SUMMARY ............................................................................................................................... I 1.0 INTRODUCTION ........................................................................................................................... 1-1
1.1 Project Overview .............................................................................................................. 1-1 1.2 Objectives ........................................................................................................................ 1-2
2.0 CONSULTATION .......................................................................................................................... 2-1 2.1 Public Consultation, Aboriginal Engagement and Landowner Relations......................... 2-1 2.2 Regulatory Consultation ................................................................................................... 2-1
3.0 METHODS .................................................................................................................................... 3-1 3.1 Overall Approach ............................................................................................................. 3-1 3.2 Spill Scenario Selection ................................................................................................... 3-1
3.2.1 CWC Simulated Oil Spill Scenario ...................................................................... 3-2 3.2.2 Smaller Simulated Oil Spill Scenario .................................................................. 3-3
3.3 Exposure Scenario and Pathway Selection ..................................................................... 3-4 3.4 Receptor Selection ........................................................................................................... 3-5 3.5 Selection of Chemicals of Potential Concern ................................................................... 3-5 3.6 Health Effects Characterization ....................................................................................... 3-6
4.0 RESULTS ...................................................................................................................................... 4-1 4.1 CWC Simulated Oil Spill Scenario ................................................................................... 4-1 4.2 Smaller Simulated Oil Spill Scenario ............................................................................... 4-2
5.0 DISCUSSION ................................................................................................................................ 5-1 6.0 SUMMARY .................................................................................................................................... 6-1 7.0 DISCLAIMER ................................................................................................................................ 7-1 8.0 REFERENCES .............................................................................................................................. 8-1
8.1 Literature Cited ................................................................................................................. 8-1
LIST OF TABLES TABLE 2.1 SUMMARY OF CONSULTATION ACTIVITIES RELATED TO THE HUMAN
HEALTH RISK ASSESSMENT ........................................................................................ 2-2 TABLE 3.1 LIST OF COPC EXAMINED AS PART OF THE QHHRA ...................................................... 3-7
7894/December 2013 REP-NEB-TERA-00033
Page ii

Trans Mountain Pipeline ULC
Qualitative Human Health Risk Assessment of Westridge Marine Terminal Spills Technical
Report Trans Mountain Expansion Project
DEFINITIONS AND ACRONYM LIST
Definition/Acronym Full Name bbl/d barrel(s) per day BC British Columbia BTEX Benzene, toluene, ethylbenzene and xylenes CLWB Cold Lake Winter Blend CNS Central nervous system COPC Chemical(s) of potential concern CPCN Certificate of Public Convenience and Necessity CWC Credible worst-case EBA EBA Engineering Consultants Ltd., a Tetra Tech Company ESA Environmental and Socio-economic Assessment FHA Fraser Health Authority FVRD Fraser Valley Regional District HHRA Human health risk assessment Intrinsik Intrinsik Environmental Sciences Inc. km kilometre(s) KMC Kinder Morgan Canada Inc. m³ cubic metre(s) m³/d cubic metre(s) per day NEB National Energy Board NEB Act National Enegry Board Act PAH Polycyclic aromatic hydrocarbon PPE Personal protection equipment QHHRA Qualitative human health risk assessment SLHHRA Screening level human health risk assessment the Project The Trans Mountain Expansion Project TMEP Trans Mountain Expansion Project TMPL Trans Mountain pipeline Trans Mountain Trans Mountain Pipeline ULC TMPL system Trans Mountain pipeline system WCMRC Western Canada Marine Response Corporation
7894/December 2013 REP-NEB-TERA-00033
Page iii

Trans Mountain Pipeline ULC
Qualitative Human Health Risk Assessment of Westridge Marine Terminal Spills Technical
Report Trans Mountain Expansion Project
1.0 INTRODUCTION This technical report describes a preliminary qualitative human health risk assessment (QHHRA) that was completed in order to identify and understand the nature and extent of the potential human health effects that could occur in the event of an oil spill during tanker loading at the Westridge Marine Terminal that forms part of the Trans Mountain Expansion Project (the Project). Two hypothetical spill scenarios were examined:
1) A scenario corresponding to credible worst-case (CWC) conditions involving a simulated spill of 160 m³ of Cold Lake Winter Blend (CLWB) diluted bitumen while loading a tanker at berth; and,
2) A smaller simulated spill of 10 m³ of CLWB while loading a tanker at berth.
The QHHRA encompassed a preliminary qualitative examination of the potential health effects that might be experienced under each spill scenario by members of the general public who might be present in the area at the time of the spill. The assessment was conducted as a screening-level exercise to understand the overall likelihood, nature and extent to which people’s health might be affected under each spill scenario, with the findings used to determine if potential health risks exist, and if so, the need for further, more detailed investigation of these risks.
This report outlines the methods that were followed, the results that emerged and the conclusions that were reached as part of the preliminary QHHRA.
1.1 Project Overview
Trans Mountain Pipeline ULC (Trans Mountain) is a Canadian corporation with its head office located in Calgary, Alberta. Trans Mountain is a general partner of Trans Mountain Pipeline L.P., which is operated by Kinder Morgan Canada Inc. (KMC), and is fully owned by Kinder Morgan Energy Partners, L.P. Trans Mountain is the holder of the National Energy Board (NEB) certificates for the Trans Mountain pipeline system (TMPL system).
The TMPL system commenced operations 60 years ago and now transports a range of crude oil and petroleum products from Western Canada to locations in central and southwestern British Columbia (BC), Washington State and offshore. The TMPL system currently supplies much of the crude oil and refined products used in BC. The TMPL system is operated and maintained by staff located at Trans Mountain’s regional and local offices in Alberta (Edmonton, Edson, and Jasper) and BC (Clearwater, Kamloops, Hope, Abbotsford, and Burnaby).
The TMPL system has an operating capacity of approximately 47,690 m³/d (300,000 bbl/d) using 23 active pump stations and 40 petroleum storage tanks. The expansion will increase the capacity to 141,500 m³/d (890,000 bbl/d).
The proposed expansion will comprise the following:
• Pipeline segments that complete a twinning (or “looping”) of the pipeline in Alberta and BC with about 987 km of new buried pipeline.
• New and modified facilities, including pump stations and tanks.
• Three new berths at the Westridge Marine Terminal in Burnaby, BC, each capable of handling Aframax class vessels.
The expansion has been developed in response to requests for service from Western Canadian oil producers and West Coast refiners for increased pipeline capacity in support of growing oil production and access to growing West Coast and offshore markets. NEB decision RH 001 2012 reinforces market support for the expansion and provides Trans Mountain the necessary economic conditions to proceed with design, consultation, and regulatory applications.
7894/December 2013 REP-NEB-TERA-00033
Page 1-1

Trans Mountain Pipeline ULC
Qualitative Human Health Risk Assessment of Westridge Marine Terminal Spills Technical
Report Trans Mountain Expansion Project
Application is being made pursuant to Section 52 of the National Energy Board Act (NEB Act) for the proposed Trans Mountain Expansion Project (referred to as “TMEP” or “the Project”). The NEB will undertake a detailed review and hold a Public Hearing to determine if it is in the public interest to recommend a Certificate of Public Convenience and Necessity (CPCN) for construction and operation of the Project. Subject to the outcome of the NEB Hearing process, Trans Mountain plans to begin construction in 2016 and go into service in 2017.
Trans Mountain has embarked on an extensive program to engage Aboriginal communities and to consult with landowners, government agencies (e.g., regulators and municipalities), stakeholders, and the general public. Information on the Project is also available at www.transmountain.com.
1.2 Objectives
The primary objectives of the QHHRA were to:
• Identify and understand the potential health effects that might be experienced by people under each of the simulated oil spill scenarios examined, with an emphasis on the effects that could potentially occur from short-term exposure to the chemical vapours that might be released from the surface of the oil slick formed during the early stages of the incident before the arrival of first reposinders and the implementation of emergency and spill response measures.
• Address the information requirements outlined in Guide A.2 of the NEB Filing Manual for completion of an Environmental and Socio-economic Assessment (ESA) in support of a facilities application (NEB 2013a).
• Address information requirements outlined in NEB’s (2013b) Filing Requirements Related to the Potential Environmental and Socio-Economic Effects of Increased Marine Shipping Activities, Trans Mountain Expansion Project (September 10, 2013).
• Address concerns expressed by Aboriginal communities and stakeholders, including the public and regulatory authorities at the federal, provincial and regional levels, over the potential health effects of accidents and malfunctions associated with the Project. These concerns included the possible effects of oil spills on people’s health.
• Provide information to Trans Mountain, the Project team and spill response authorities on the nature, extent and likelihood of occurrence of potential human health effects that could result from oil spills under the simulated spill scenarios in order to help inform emergency response preparedness and planning and other programs aimed at the protection of public health and safety.
7894/December 2013 REP-NEB-TERA-00033
Page 1-2

Trans Mountain Pipeline ULC
Qualitative Human Health Risk Assessment of Westridge Marine Terminal Spills Technical
Report Trans Mountain Expansion Project
2.0 CONSULTATION Trans Mountain and its consultants have conducted a number of activities to inform Aboriginal communities, stakeholders, the public and regulatory authorities about the approach to assessing potential environmental and socio-economic effects of the Project, and to seek input throughout the Project planning process.
2.1 Public Consultation, Aboriginal Engagement and Landowner Relations
Trans Mountain has implemented and continues to conduct open, extensive and thorough public consultation, Aboriginal engagement and landowner relations programs. These programs were designed to reflect the unique nature of the Project as well as the diverse and varied communities along the proposed pipeline and marine corridor. These programs were based on Aboriginal communities, landowner and stakeholder groups’ interests and inputs, knowledge levels, time and preferred methods of engagement. In order to build relationships for the long-term, these programs were based on the principles of accountability, communication, local focus, mutual benefit, relationship building, respect, responsiveness, shared process, sustainability, timeliness, and transparency.
Feedback, related to the Project that was raised through various Aboriginal engagement and public consultation activities, including public open houses, ESA Workshops, Community Workshops and one-on-one meetings, is summarized below and was considered in the development of this technical report, and the assessment of human health risks in Volume 5A and Volume 5B:
• Potential human health effects associated with the inhalation of chemical emissions from a pipeline spill.
• Potential human health effects that could occur if an accidental oil spill was to happen on water as a result of the Project.
• Potential human health effects of a pipeline spill on Aboriginal health.
In addition, concerns related to the potential effects of spills on traditional activities were also raised and detailed information on pipeline spills is provided in Volume 7.
The full description of the Public Consultation, Aboriginal Engagement and Landowner Relations programs are located in Volumes 3A, 3B and 3C, respectively. Section 3.0 of Volume 5A and Volume 5B summarizes the consultation and engagement activities that have focused on identifying and assessing potential issues and concerns related to the QHHRA which may be affected by the Project. Information collected through the public consultation, Aboriginal engagement and landowner relations programs for the Project was considered in the development of this technical report, and the assessment of human health in Volume 5A and Volume 5B.
2.2 Regulatory Consultation
The human health risk assessment (HHRA) team met with federal, provincial and regional regulatory authorities to discuss the overall scope and nature of the planned work. The consultative activities are shown in Table 2.1.
7894/December 2013 REP-NEB-TERA-00033
Page 2-1

Trans Mountain Pipeline ULC
Qualitative Human Health Risk Assessment of Westridge Marine Terminal Spills Technical
Report Trans Mountain Expansion Project
TABLE 2.1
SUMMARY OF CONSULTATION ACTIVITIES RELATED TO THE HUMAN HEALTH RISK
ASSESSMENT
Stakeholder Group / Agency Name
Name and Title of Contact
Method of
Contact
Date of Consultation
Activity Reason For Engagement Issues / Concerns
Commitments / Follow-up Actions /
Comments FEDERAL CONSULTATION
Health Canada (BC Region)
Dr. Carl Alleyne, BC Regional Environmental Assessment Coordinator Dr. Gladis Lemus, BC Regional Manager
Meeting January 28, 2013 Project introduction. Discussion of the planned HHRA methodology.
Health Canada advised that they will be directing particular attention to Aboriginal health. Health Canada expressed an interest in knowing the potential health effects associated with any accidents and malfunctions. Health Canada will be interested in knowing the potential short-term as well as long-term health effects associated with the Project, with consideration given to all relevant exposure pathways.
None
PROVINCIAL CONSULTATION - ALBERTA Alberta Health Dr. Karina Thomas,
Environmental Health Scientist, Health Protection Branch Dr. James Talbot, Chief Medical Officer of Health for Alberta
Meeting February 4, 2013 Project introduction. Discussion of the planned HHRA methodology.
No specific issues / concern regarding the planned HHRA methodology were identified.
Alberta Health requested that the HHRA team keep them informed of progress as the HHRA is completed.
LOCAL CONSULTATION - BRITISH COLUMBIA Fraser Health Authority (FHA)
Dr. Paul Van Buynder, Chief Medical Health Officer Dr. Nadine Loewen, Medical Health Officer Dr. Goran Krstic, Human Health Risk Assessment Specialist, Health Protection Tim Shum, Regional Director
Meeting January 28, 2013 Project introduction. Discussion of the planned HHRA methodology.
FHA and VCHA expressed an interest in knowing whether any long-term monitoring of health is planned. FHA and VCHA expressed an interest in knowing the historical effects of the Legacy Line. FHA and VCHA expressed an interest in knowing the potential health effects associated with a spill to an urban environment. FHA and VCHA is interested in knowing the potential short-term as well as long-term health effects associated with the Project, with consideration given to all relevant exposure pathways.
None
Vancouver Coastal Health Authority (VCHA)
Dr. Patricia Daly, Chief Medical Health Officer Dr. James Lu, Medical Health Officer, Richmond Public Health Dr. Richard Taki, Regional Director, Health Protection
7894/December 2013 REP-NEB-TERA-00033
Page 2-2

Trans Mountain Pipeline ULC
Qualitative Human Health Risk Assessment of Westridge Marine Terminal Spills Technical
Report Trans Mountain Expansion Project
Stakeholder Group / Agency Name
Name and Title of Contact
Method of
Contact
Date of Consultation
Activity Reason For Engagement Issues / Concerns
Commitments / Follow-up Actions /
Comments Fraser Valley Regional District (FVRD)
Alison Stewart, Senior Planner, Strategic Planning and Initiatives
Telephone call
March 20, 2013 Project introduction. Discussion of the planned HHRA methodology.
FVRD expressed an interest in knowing the potential effects of the Project on air quality, and subsequently human health, in the FVRD. From a health perspective, Ms. Stewart indicated that the FVRD would be taking their direction from FHA.
None
7894/December 2013 REP-NEB-TERA-00033
Page 2-3

Trans Mountain Pipeline ULC
Qualitative Human Health Risk Assessment of Westridge Marine Terminal Spills Technical
Report Trans Mountain Expansion Project
3.0 METHODS 3.1 Overall Approach
The approach followed for the preliminary QHHRA differed from that routinely adopted for the assessment of the potential health risks associated with chemical exposures, including the screening level human health risk assessment (SLHHRA) of the routine pipeline and facilities operations that also forms part of the Trans Mountain Application for Approval (see Volume 5D, Screening Level Human Health Risk Assessment of Pipeline and Facilities Technical Report). Unlike routine operations, which consist of planned activities for which chemical exposures and any associated health risks can be anticipated and assessed on the basis of known or reasonably well-defined exposure scenarios, spills represent low probability, unpredictable events for which the exposures and risks must necessarily be forecast on the basis of strictly hypothetical scenarios. Accordingly, rather than following a conventional HHRA paradigm with an emphasis on quantifying the potential risks involved, the present assessment was designed to provide a preliminary indication of the prospect for people’s health to be affected under different hypothetical spill scenarios, together with an indication of the types of health effects, if any, that might be experienced, with both elements addressed from a qualitative perspective at a screening level. The results of this preliminary qualitative assessment were then used to determine the need for a more comprehensive assessment to better determine the prospect for people’s health to be affected and to better define the nature and extent of any health effects that they might experience.
The preliminary QHHRA examined the likelihood and extent to which people’s health potentially could potentially be affected under each of the two simulated spill scenarios of interest. Consideration was not given to the probability of occurrence of either spill scenario nor to the various design, engineering, maintenance and inspection, and other preventative programs that Trans Mountain will have in place to reduce the likelihood of a spill occurring during tanker loading at the Westridge Marine Terminal, details of which are provided elsewhere (Volume 7, Section 2.0). Instead, the assessment was conducted based on the premise that the spill(s) had occurred despite these programs existing.
The overall approach followed for the QHHRA included consideration of the following:
• the type and volume of oil spilled; • the types of chemicals contained in the spilled oil to which people could be exposed; • the extent to which people could be exposed based on predictions of how the spilled oil and the
chemicals would likely behave in the environment; • the manner and pathways by which people might be exposed to the chemicals; • the types of health effects known to be caused by the chemicals as a function of the amount and
duration of exposure; • the responsiveness and sensitivity of the people who could potentially be exposed to the
chemicals; and, • the emergency response measures that will be taken by Trans Mountain and other spill response
authorities to limit people’s exposure to the chemicals in the event of a spill.
Details with respect to each of the above items are presented in the sections that follow.
3.2 Spill Scenario Selection
Descriptions of each of the two simulated spill scenarios that were examined and the basis of their selection are presented below. Additional details surrounding each scenario can be found in Volume 7, Section 8.1. Each scenario involved a spill during tanker loading at the Westridge Marine Terminal, with the principal differences between the scenarios being:
• The CWC spill at the Westridge Terminal resulting from an incident during loading of a tanker was assessed assuming a volume of 160 m3. At 160 m3, this spill is larger than the CWC spill resulting from a rupture of a loading arm. It is also substantially smaller than the over 1,500 m3 capacity of the precautionary boom that will be deployed around each berth while any cargo transfer activities are
7894/December 2013 REP-NEB-TERA-00033
Page 3-1

Trans Mountain Pipeline ULC
Qualitative Human Health Risk Assessment of Westridge Marine Terminal Spills Technical
Report Trans Mountain Expansion Project
taking place and it is reasonable to expect that the spill would be entirely contained within the boom. In addition, observed weak currents (Modeling the Fate and Behaviour of Marine Oil Spills for the Trans Mountain Expansion Project [Volume 8B]) at the Terminal support the full containment of the oil within the pre-deployed boom. However, as a conservative approach to this scenario, it was deemed that, for oil spill modelling and risk assessment purposes, 20% of the oil released would escape the containment boom (i.e., 32 m3). This condition was chosen to ensure a conservative approach to spill response requirements at the site and does not reflect Trans Mountain’s expectation for performance of the precautionary boom which will be in place to fully contain such a release at the terminal. For information of the reader, the credible worst case oil spill volume resulting from this scenario has been calculated by DNV as 103 m3 and deemed as a low probability event with likelihood of occurring once every 234 years..
• A smaller release of 10 m3 was also evaluated, consistent with the NEB’s letter of September 10, 2013 Filing Requirements Related to the Potential Environmental and Socio-Economic Effects of Increased Marine Shipping Activities, Trans Mountain Expansion Project. This smaller release was assumed to result from a loading arm leak, and be totally contained within the boom placed around all tankers during loading.
EBA completed stochastic oil spill modeling for the hypothetical scenarios to describe the expected fate and behaviour of the spilled oil (EBA Tetra Tech 2013). Modelling results were used to derive estimates of the chemical exposures that people might experience under each scenario. The modelling accounted for a number of different parameters affecting the fate and movement of the oil slick, including time of year, weather patterns, ocean currents and tides, and wave action. As the modelling evolved, further parameters such as the thickness of the oil slick, the time the oil would be expected to remain on the water surface, the time to first contact with the shoreline, and the extent of shoreline oiling were added to refine the CWC spill scenario. Consideration also was given to the manner in which the spilled oil and its chemical constituents would partition between the water column and the air in order to develop estimates of the air-borne concentrations that could occur as a function of elapsed time, with these concentrations serving as proxies for the chemical exposures that people might potentially experience. The key steps in the selection process are outlined below. Full details concerning the spill modelling can be found in EBA Tetra Tech (2013).
3.2.1 CWC Simulated Oil Spill Scenario
The modelling proceeded step-wise.
As a first step, approximately 720 stochastic model simulations were completed for each of four seasons: winter (January–March), spring (April–June), summer (July–September) and fall (October–December). The combined simulations for any given season tracked the behaviour and fate of the spilled oil over a 15-day period, beginning from moment the spill occurred. Each simulation comprised a three-hour snapshot of the movement of the oil slick, with the movement forecast on the basis of weather, ocean currents and tide data drawn from records compiled for 2011 and 2012. The mass balance of the spilled oil also was forecast, with the distribution of the hydrocarbon components of the oil between the ocean water column, the overlying air and the shoreline determined for each three-hour interval. The series of approximately 2,900 simulations served to represent the behaviour and fate of the spilled oil as a function of time across the four seasons of the year.
As a second step, one of the 2,900 independent model simulations from the stochastic dataset was selected for more comprehensive deterministic modelling in order to compute the fate of the individual chemical components of the spilled oil. The simulation chosen ultimately served to represent the circumstances under which people could potentially be exposed to the chemical components of the spilled oil, with a focus on exposures that could be experienced under circumstances corresponding to credible worst-case conditions. The selection process proceeded as follows:
a) First, consideration was given to the four seasons that were modeled stochastically. Selection centered on the summer season as warmer water and air temperatures facilitate more rapid dissolution and volatilization of lighter hydrocarbons into water and air, respectively. At the same
7894/December 2013 REP-NEB-TERA-00033
Page 3-2

Trans Mountain Pipeline ULC
Qualitative Human Health Risk Assessment of Westridge Marine Terminal Spills Technical
Report Trans Mountain Expansion Project
time, generally lower wind speeds during the summer months result in less wave action (and hence, less vertical mixing of the water column and higher concentrations of dissolved hydrocarbons in the surface water layer) as well as less dilution of any hydrocarbon vapours released from the surface of the oil slick into the air. These factors will contribute to greater opportunity for people to be exposed to the hydrocarbon components of the spilled oil during the summer months compared to other seasons of the year. In addition, people are more likely to be outdoors and possibly in the neighbourhood of the Westridge Marine Terminal during the summer months compared to other seasons, again contributing to a greater potential for people to be exposed to the hydrocarbon components during the summer in the event that an oil spill was to occur. Thus, a simulation chosen from the summer season was considered best fit-for-purpose in terms of representing conditions corresponding to credible worst-case exposure circumstances.
b) Second, consideration was given to the predicted length of shoreline oiled since oil spill effects on shorelines are among the more obvious and profound environmental effects of spills (both with respect to people and organisms). The median length of shoreline oiled was identified as a selection criterion in order to balance the need to address the potential effects that could be experienced by:
• aquatic organisms, for which effects are primarily driven by the amount of oil remaining in
water; • terrestrial organisms, for which effects are primarily driven by the length of shoreline oiled;
and, • people who might be on the water close to the oil slick itself and potentially at risk of
exposure versus people who might be on-shore at or near the oiled shoreline at the time of the spill.
The median length of shoreline oiled as a result of the spill was determined based on the 736 summer stochastic simulations. The specific simulations resulting in a length of oiled shoreline corresponding to this median value were then identified and examined. Twenty simulations meeting this criterion were identified. The following additional criteria were then factored into the selection of the single simulation to be used for deterministic modelling:
• the maximum thickness of the oil modelled on water during the simulation; • the time elapsed to first contact with the shoreline; • the exposure duration for the oil on water; and, • the distribution of total hydrocarbons between water, shore and air (i.e., the mass balance).
c) As the third step of the selection process, each of the 20 stochastic simulations was ranked (high,
moderate or low) according to how well the final four selection criteria were satisfied. Higher weighting was given to those simulations that demonstrated greater thickness of the oil reaching the shoreline, shorter time to first contact with the shoreline, longer exposure time on water, and higher percentage of hydrocarbons in air. On this basis, the list was narrowed to two simulations.
d) As the final step of the selection process, visual examination of the outputs for these two simulations and the outputs for the entire summer season stochastic modelling revealed one of the simulations to be more representative of the movement of the oil slick. This simulation was chosen for the more detailed deterministic modelling, with these modelling results serving as inputs to the QHHRA. More specifically, the modelling results consisted of hour-by-hour estimates of the concentrations of hydrocarbon vapours at progressively increasing distances from the oil slick that people in the area might encounter.
3.2.2 Smaller Simulated Oil Spill Scenario
The simulated oil spill modelling that was completed for the smaller oil spill scenario resembled that performed for the CWC spill scenario, except that fewer steps were involved since no need existed for determining the extent of shoreline oiling since the smaller spill scenario assumed that all of the spilled oil would be contained within the boom at the berth. 7894/December 2013 REP-NEB-TERA-00033
Page 3-3

Trans Mountain Pipeline ULC
Qualitative Human Health Risk Assessment of Westridge Marine Terminal Spills Technical
Report Trans Mountain Expansion Project
Reliance was placed on the results of the deterministic modelling of the same stochastic simulation selected for use in the CWC spill scenario, with the model outputs again consisting of hour-by-hour estimates of the airborne concentrations of the hydrocarbon vapours at progressively increasing distances from the oil slick that people in the area might encounter over a 15-day period beginning from the time the spill started. These predicted concentrations served as proxies of the acute inhalation exposures that the people might experience during the early stages of the smaller oil spill, before the arrival of first responders and the implementation of spill isolation, containment, recovery and other emergency response measures.
3.3 Exposure Scenario and Pathway Selection
The QHHRA focused on the potential health effects that could occur among people either on-shore or in pleasure craft or other boats in the neighbourhood of the Westridge Marine Terminal from inhalation exposure to the hydrocarbon vapours released from the surface of the spilled oil, with a specific focus on exposures that could be received on a short-term (or acute) basis during the early stages of the oil spill. The choice of this exposure scenario was based on the following:
• In the event of a spill into the Burrard Inlet, emergency response measures will be taken by Trans Mountain, Coast Guard authorities, the Western Canada Marine Response Corporation (WCMRC) and other spill response agencies to protect people’s health, the marine environment, and the coastal shoreline. Details of the emergency response measures are discussed elsewhere (see Volume 7, Section 4), and will include securing the area as well as the isolation, surveillance, monitoring, containment, and clean-up and recovery of the spilled oil. Local, provincial and federal authorities responsible for the protection of public health, fisheries, and the marine environment and resources will be notified so that additional resources can be deployed and any further needed protective measures can be implemented. Other response measures would include notifying the public to avoid the spill area, restricting access to the spill area, and possibly evacuating people from the area if public health and safety was deemed to be threatened. The exact emergency response measures taken will be dictated, in part, by the circumstances and real-time events surrounding the spill, including the size, behaviour and immediate hazards presented by the oil slick. The measures will serve not only to limit any opportunities for exposure of the general public to chemical vapours released from the spilled oil in the short-term, but also will act to preclude any reasonable opportunity for people to be exposed on a longer-term basis either by inhalation or other exposure pathways such as physical contact with the chemicals.
• If warranted, local, provincial and/or federal authorities can implement controls or issue advisories to protect public health. Examples of such controls include closure of commercial and recreational fisheries, beach closures, forced evacuation of people off-shore and/or on-shore if public health and safety is threatened, and the issuance of fish, shellfish or other seafood consumption advisories. These measures further reduce the potential opportunities for exposure of people to the chemicals released during a spill through either inhalation or other pathways on both a short-term and long-term basis.
• The potential exists for people located downwind of the oil to be exposed to chemical vapours released from the surface of the slick during the early stages of the incident because some time will elapse between the first reporting of a spill, the arrival of first responders and the implementation of the emergency response measures. Exposure to the vapours would be via inhalation on a short-term basis, with the likelihood of exposure declining as responders arrive on scene and emergency response measures are taken. It is expected that the WCMRC and other first responders will arrive on-scene within as little as one hour after receiving notification.
• Direct physical contact with the spilled oil was considered unlikely, especially in the case of the smaller oil spill in which the oil slick will be completely contained within the boom. The actions taken by first responders will include securing the area, restricting access, and containing the oil slick. Appropriate regulatory authorities will be immediately notified and the public will be advised to avoid the area. In the case of the CWC spill scenario, in which oiling of the shoreline is possible based on the simulated oil spill modelling, beach and shoreline closures will be announced, if conditions
7894/December 2013 REP-NEB-TERA-00033
Page 3-4

Trans Mountain Pipeline ULC
Qualitative Human Health Risk Assessment of Westridge Marine Terminal Spills Technical
Report Trans Mountain Expansion Project
warrant. These actions will limit any exposure of the general public to the spilled oil through physical contact with the chemicals.
• In some cases, exposure of people might reasonably be expected to be self-limiting owing to the irritant properties of a number of the hydrocarbon components of the spilled oil as well as the odours that might be noticed. Both of these properties would provide warning of the presence of the chemicals such that people could quickly take action to remove themselves from the source, thereby limiting the amount and duration of any exposure that might be experienced.
3.4 Receptor Selection
The selection of the human receptors to be assessed as part of the QHHRA was based on consideration of the following:
• Emergency response measures will be taken by Trans Mountain, Coast Guard authorities, the WCMRC and other spill response agencies to protect people’s health, the marine environment, and the coastal shoreline. It is expected that response personnel arriving at the scene will be trained in emergency preparedness and response, will be equipped with appropriate personal protective equipment (PPE), will be trained and prepared for such situations, and will take appropriate precautions to avoid physical contact with the oil slick itself as well as to limit exposure to any chemical vapours that might be present. These measures will act to limit any chemical exposures and corresponding health effects that might be experienced by first responders and other response personnel. Accordingly, these people were not included among the human receptors selected for assessment.
• It was considered reasonable to assume that members of the general public could potentially be in the neighbourhood of the Westridge Marine Terminal at the time of the oil spill, and might remain in the area unaware of the spill during its early stages before emergency responders arrive on scene and emergency response measures are implemented. These people could include individuals on the water in pleasure craft or other boats, residents living in communities downwind of the Marine Terminal, and bystanders located on or near the shoreline while frequenting the area for work, recreation or other purposes. Given that opportunity exists for these people to be exposed to hydrocarbon vapours originating from the spilled oil, they were chosen as the human receptors to be assessed.
It was recognized that the general public includes sub-populations who may be especially responsive to chemical exposures, including young children, the elderly and people with compromised health. The QHHRA necessarily allowed for the fact that the human receptors to be assessed, being bystanders found in the area at the time of the spill, could include these types of individuals.
3.5 Selection of Chemicals of Potential Concern
The nature and extent to which people’s health might be affected by exposure to the chemical vapours released during the oil spill will be governed, in part, by the characteristics of the oil itself as well as by the properties of the hydrocarbon components of the oil, particularly the ease with which the components can volatilize from the surface of the oil slick. For the purposes of the assessment, Cold Lake Winter Blend (CLWB) diluted bitumen was chosen to represent the type of oil spilled. The selection of the CLWB was based, in part, on the following:
• CLWB is currently, and is expected to remain, a major product carried by the TMEP. Accordingly, in the unlikely event of a spill occurring, there is a strong possibility the spilled product will be CLWB.
• The diluent in CLWB is a liquid condensate that is rich in light-end hydrocarbons that are volatile or semi-volatile in nature. These hydrocarbon components could potentially be released as vapours from the surface of the oil slick, which would then disperse in a downwind direction, possibly reaching human receptors who could inhale them.
7894/December 2013 REP-NEB-TERA-00033
Page 3-5

Trans Mountain Pipeline ULC
Qualitative Human Health Risk Assessment of Westridge Marine Terminal Spills Technical
Report Trans Mountain Expansion Project
The choice of the actual chemicals to be examined as part of the preliminary QHHRA (hereafter referred to as the chemicals of potential concern or COPC) followed a step-wise process, which is described in detail in Screening Level Human Health Risk Assessment of Pipeline and Facilities, Volume 5D. Briefly, the steps included:
• First, the results of a bulk liquid analysis of the CLWB that identified the chemical components present in the diluted bitumen were examined.
• Second, the physical properties and characteristics of the chemical components were reviewed, notably those properties, such as vapour pressure and Henry’s Law Constant, that determine their tendency to partition into air and provide an indication of the ease with which they might volatilize from the surface of the oil slick.
• Third, a series of pseudo-components of the spilled oil identified by EBA Tetra Tech as part of the spill simulation modelling and comprised of aliphatic and aromatic hydrocarbons, some of which were grouped according to carbon chain length, was reviewed, with “surrogate” chemicals or chemical groups assigned to represent those pseudo-components that would be expected to volatilize from the surface of the oil slick during the early stages of the oil spill.
The COPC consisted principally of lighter-end, volatile and semi-volatile hydrocarbons (C1 to C16), including both aliphatic and aromatic constituents. The latter constituents included BTEX (benzene, toluene, ethylbenzene and xylenes), alkyl substituted benzenes, and polycyclic aromatic hydrocarbons (PAHs), including naphthalene. Trace amounts of sulphur-containing chemicals made up the remainder of the COPC. A listing of the COPC, along with a summary of the health effects associated with acute exposures for these COPC, is provided in Table 3.1.
3.6 Health Effects Characterization
The potential health effects that people in the area might experience from acute inhalation exposure to the hydrocarbon vapours released from the surface of the oil slick during the initial stages of the oil spill were characterized on a qualitative basis for each of the two simulated spill scenarios examined. The characterization was reliant on preliminary modelled predictions of the COPC concentrations that might be encountered by people at varying distances from the oil slick that were derived from the deterministic spill simulation modelling completed by EBA Tetra Tech (2013). The model outputs consisted of hour-by-hour predictions of the maximum concentrations of the COPC that people might encounter as the incident evolved. These preliminary modelled estimates served as proxies for the acute inhalation exposures that the general public, including residents and bystanders in the area, might experience during the early stages of the incident before the arrival of first responders and the implementation of emergency response measures. These exposure estimates were then qualitatively compared to exposures associated with health effects in humans and/or other animal species for each of the COPC to gauge the nature and extent to which people’s health could be affected. The intent was to obtain a preliminary indication of whether or not the potential exposures that could be received under each of the simulated spill scenarios would be expected to cause health effects, and if so, what types of symptoms could potentially be experienced by people in the area. For the purposes of the preliminary QHHRA, the health effects of interest were those known to be associated with acute exposure to the COPC, with these effects shown in Table 3.1.
7894/December 2013 REP-NEB-TERA-00033
Page 3-6

Trans Mountain Pipeline ULC
Qualitative Human Health Risk Assessment of Westridge Marine Terminal Spills Technical
Report Trans Mountain Expansion Project
TABLE 3.1
LIST OF COPC EXAMINED AS PART OF THE QHHRA
Chemicals of Potential Concern
CLWB Pseudo-Components and Other Analytes1
Health Effects Associated with Acute Over-Exposure
Aliphatic C1-C4 Iso-Butane, n-Butane, Propane Neurological effects Aliphatic C5-C8 iso-Pentane; n-Pentane, Aliphatic C6-C8 Possible cognitive performance
deficits Aromatic C9-C16 Aromatics >C8-C10; Aromatics >C10-C12; Aromatics
>C12-C16, Naphthalene Eye irritation
Benzene Benzene Hematological/immunological effects. Ethanethiol group Ethanethiol Iso-Propanethiol; Thiophene/sec-
Butanethiol; n-Butanethiol; n-Hexanethiol Respiratory irritation, odour perception.
Ethylbenzene Ethylbenzene Effects on auditory function. Toluene Toluene Irritation of the eyes and throat CNS
effects, including headache, dizziness and feeling of intoxication.
Trimethylbenzenes 1,2,4-Trimethylbenzene Neurological effects, including impaired balance. Effects on respiratory function.
Xylenes Xylenes Irritation of the eyes, nose and throat. CNS effects, including fatigue, headache, dizziness and light headedness.
Notes: 1 Consist of hydrocarbon components identified by EBA Tetra Tech (2013), which were represented by the COPC shown in the opposite column.
7894/December 2013 REP-NEB-TERA-00033
Page 3-7

Trans Mountain Pipeline ULC
Qualitative Human Health Risk Assessment of Westridge Marine Terminal Spills Technical
Report Trans Mountain Expansion Project
4.0 RESULTS 4.1 CWC Simulated Oil Spill Scenario
The preliminary QHHRA of the CWC simulated spill scenario revealed some prospect for people’s health to be affected from acute inhalation exposure to the chemical vapours that could be released from the oil slick during the early stages of this spill scenario. Based on the health effects that can follow acute exposure to the COPC, the potential symptoms that could be experienced by people in the area would likely be dominated by irritation of the eyes and/or breathing passages, possibly accompanied by symptoms consistent with central nervous system (CNS) involvement, such as nausea, headache, light headedness and/or dizziness. In this regard, a number of the COPC are capable of acting as irritants and CNS depressants (see Table 3.1). The effects could range from barely noticeable to quite noticeable, depending on the actual exposure circumstances and the sensitivity of the individuals exposed. Based on the modelled exposure estimates for this spill scenario, which showed the concentrations of the COPC to decline relatively quickly with elapsed time, the opportunity for people’s health to be affected would be rather limited. Odours could be apparent, dominated by a hydrocarbon-like smell, with some potential for other distinct odours due to the presence of sulphur-containing chemicals in the vapour mix. The odours themselves could contribute to discomfort, irritability and anxiety.
Effects would be confined to bystanders in pleasure craft or other boats close to the spill area, and possibly to people on the shoreline immediately adjacent to the Westridge Marine Terminal. There is no indication that people living in communities along the Burrard Inlet, including Westridge and Capitol Hill would be affected.
The exact nature and severity of any health effects will depend on several factors, including:
• The circumstances surrounding the spill, including the time of year and the meteorological conditions in effect at the time. These circumstances will affect the extent to which chemical vapours are released from the surface of the spilled oil and the manner in which these vapours disperse. For the purposes of the QHHRA, the potential exposures to the COPC that people in the area could experience were based on estimates derived using the deterministic spill simulation modelling that captured seasonal and weather conditions favouring the volatilization of the hydrocarbons from the oil slick.
• The person’s whereabouts in relation to the spill, including their distance from the oil slick and their orientation to the slick with respect to wind direction. The preliminary modelled estimates of the exposures that could be received revealed that exposures would be highest at distances closest to the slick, declining with increasing distance. The prospect for health effects to occur as well as the severity of any effects will follow the same pattern. The prospect for people’s health to be affected also will be greatest downwind of the oil slick, where the maximum concentrations of the COPC will be encountered.
• The timeliness of emergency response measures. Measures taken to either remove the hazard from the general public (e.g., spill isolation, containment) or to remove the general public from the hazard (e.g., securing the spill area, restricting access, notifying the public to avoid the area, evacuation of people from the area) will reduce exposure and the probability of any associated health effects. The sooner these measures can be implemented, the lower the likelihood of any effects. Prompt measures taken by Trans Mountain, the Coast Guard authorities, the WCMRC and other spill response agencies will act to reduce the potential for health effects.
• A person’s sensitivity to chemical exposures. The manner and extent to which people in the area may respond to the COPC exposures will depend, in part, on their age, health status and other characteristics, with the young, the elderly and people with compromised health possibly showing heightened sensitivity.
7894/December 2013 REP-NEB-TERA-00033
Page 4-1

Trans Mountain Pipeline ULC
Qualitative Human Health Risk Assessment of Westridge Marine Terminal Spills Technical
Report Trans Mountain Expansion Project
4.2 Smaller Simulated Oil Spill Scenario
The preliminary QHHRA for this spill scenario revealed no obvious prospect for people’s health to be affected from acute inhalation exposure to the chemical vapours released from the surface of the oil slick. The preliminary modelled estimates of the exposures to the COPC that the general public might potentially experience appeared to fall below the levels known to be associated with health effects. The absence of health effects is attributable to both the small size of the spill and the fact that the oil slick will remain within the boomed area where access will be restricted. Under these circumstances, little opportunity, if any, exists for people in the area to be exposed, whether on shore or on the water in boats.
Odours could be noticeable depending on the person’s keenness of smell and their proximity to the oil slick. In all likelihood, the odours would be dominated by a hydrocarbon-like smell, with some potential for other distinct odours to be noticed due to the presence of sulphur-containing chemicals in the vapour mix. The odours themselves could contribute to discomfort, irritability and anxiety.
7894/December 2013 REP-NEB-TERA-00033
Page 4-2

Trans Mountain Pipeline ULC
Qualitative Human Health Risk Assessment of Westridge Marine Terminal Spills Technical
Report Trans Mountain Expansion Project
5.0 DISCUSSION The QHHRA was completed in order to obtain an understanding of potential effects to people’s health from exposure to the hydrocarbon vapours emitted from the surface of the oil slick under two simulated oil spill scenarios involving the loading of a tanker at the Westridge Marine Terminal: a credible worst-case spill scenario (i.e., 160 m3) which assumed that some of the spilled oil would escape the boom at the berth and entering the Burrard Inlet, and a smaller spill scenario (i.e., 10 m3), with all of the spilled oil assumed to be contained within the boom. For each scenario, hour-by-hour predictions of the airborne concentrations of the COPC at progressively increasing distances from the oil slick were derived on the basis of spill simulation modelling, with the predicted concentrations serving as proxies for the acute inhalation exposures that might be experienced by people located in the neighbourhood of the terminal, whether on the water in boats or on shore during the early stages of the spill before the arrival of first responders and the implementation of emergency response measures. The principal findings of the QHHRA were:
• There was no indication that the health of people residing in communities located along the Burrard Inlet would be affected by exposure to the COPC under either of the two simulated oil spill scenarios examined.
• Similarly, no obvious prospect for the health of people in the area to be affected by exposure to the COPC emitted from the surface of the oil slick under the small spill scenario was shown to exist.
• Some potential for people’s health to be affected by exposure to the COPC under the CWC spill scenario was revealed by the assessment, with the effects likely to be dominated by irritation of the eyes and/or breathing passages, with or without CNS effects, including fatigue, headache and/or dizziness. The effects could range from barely noticeable to quite noticeable depending on the person’s actual exposure circumstances. The people at risk would include bystanders located relatively close to the oil spill, either on the water in pleasure craft or other boats near the berth or on-shore adjacent to the Terminal.
Interpretation of the latter findings must necessarily consider the following:
• The QHHRA did not consider the probability of occurrence of either of the oil spill scenarios. Both scenarios represented simulations only. The QHHRA simply assumed that the spill had occurred, without allowance for the fact that spill prevention programs will be in place to guard against the occurrence of oil spills.
• Consistent with a screening-level approach, a number of conservative elements were incorporated into the QHHRA as a means to avoid overlooking or understating any potential health effects that might occur under either of the spill scenarios. For example, estimates of the exposures that people in the area might experience were derived on the basis of spill simulation modelling which provided hour-by-hour predictions of the airborne concentrations of the COPC at progressively increasing distances from the oil slick. The specific model simulation used to predict the concentrations was deliberately selected to capture conditions with respect to the time of year, weather, ocean currents and tides and other influences that would contribute to rapid and near complete volatilization of the COPC from the oil slick to which the people could be exposed. As a further example, the proxy exposures that were used to gauge whether or not people’s health might be affected were based on the maximum predicted concentrations of the COPCs that the people might encounter on an hour-by-hour basis during the early stages of the spill. Because of the conservatism involved, the actual prospect for people’s health to be affected could much lower than that revealed by the QHHRA.
• The prospect for people’s health to be affected is limited to a relatively narrow window of time, in part, because: i) first responders will arrive on scene within as little as one hour after receiving notification of the spill and will begin to take emergency response actions aimed at isolating, containing and recovering the spilled oil as well as ensuring the health and safety of the public; and, ii) the spill simulation modelling revealed that the concentrations of the COPC will decline relatively quickly with elapsed time.
7894/December 2013 REP-NEB-TERA-00033
Page 5-1

Trans Mountain Pipeline ULC
Qualitative Human Health Risk Assessment of Westridge Marine Terminal Spills Technical
Report Trans Mountain Expansion Project
Notwithstanding the above items, the QHHRA revealed that some potential exists for people’s health to be affected under the CWC simulated spill scenario. This potential will be explored in a more focused and detailed HHRA. The results of this more detailed assessment will be used to inform emergency response and preparedness and other programs intended to protect public health and safety.
7894/December 2013 REP-NEB-TERA-00033
Page 5-2

Trans Mountain Pipeline ULC
Qualitative Human Health Risk Assessment of Westridge Marine Terminal Spills Technical
Report Trans Mountain Expansion Project
6.0 SUMMARY This report outlines the methods that were used, the findings that emerged and the conclusions that were reached as part of a preliminary QHHRA of two simulated scenarios involving oil spills during tanker loading operations at the Westridge Marine Terminal:
1) A CWC oil spill scenario of 160 m3 in which 80% of the spilled oil was assumed to be contained with the boom at the berth and 20% of the spilled oil escaped the boom and entered the Burrard Inlet; and,
2) A smaller 10 m3 spill scenario, totally contained within the boom.
The QHHRA focused on the potential health effects that could occur among people present in the area surrounding the Westridge Marine Terminal, whether on shore or the water in pleasure craft or other boats.
The QHHRA focused on the acute inhalation exposures to hydrocarbons vapours emitted from the surface of the oil slick that people could experience during the early stages of the oil spill. No other relevant exposure pathways by which people in the area could be exposed to the hydrocarbons were identified.
The QHHRA revealed some prospect for people’s health to be affected from acute inhalation exposure to the hydrocarbon vapours under the CWC simulated spill scenario. Based on the types of chemicals that might be encountered, the potential health effects experienced by these people would likely be dominated by irritation of the eyes and/or breathing passages, possibly accompanied by symptoms consistent with central nervous system involvement, such as nausea, headache, light headedness and/or dizziness. The effects could range from barely noticeable to quite noticeable depending on the actual exposure circumstances and sensitivity of the individual.
The QHHRA revealed no obvious prospect for people’s health to be affected from acute inhalation exposure to the hydrocarbon vapours under the smaller simulated oil spill scenario.
The QHHRA provided no indication that health effects would be experienced by people living in communities along the Burrard Inlet under either of the simulated oil spill scenarios.
A more focused and detailed HHRA will be completed and submitted to the NEB in early 2014.
7894/December 2013 REP-NEB-TERA-00033
Page 6-1

Trans Mountain Pipeline ULC
Qualitative Human Health Risk Assessment of Westridge Marine Terminal Spills Technical
Report Trans Mountain Expansion Project
7.0 DISCLAIMER Intrinsik Environmental Sciences Inc. (Intrinsik) provided this report for Trans Mountain Pipeline ULC (Trans Mountain) solely for the purpose stated in the report. Intrinsik does not accept any responsibility for the use of this report for any purpose other than as specifically intended by Trans Mountain. Intrinsik does not have, and does not accept, any responsibility or duty of care whether based in negligence or otherwise, in relation to the use of this report in whole or in part by any third party. Any alternate use, including that by a third party, or any reliance on or decision made based on this report, are the sole responsibility of the alternative user or third party. Intrinsik does not accept responsibility for damages, if any, suffered by any third party as a result of decisions made or actions based on this report.
Intrinsik makes no representation, warranty or condition with respect to this report or the information contained herein other than that it has exercised reasonable skill, care and diligence in accordance with accepted practice and usual standards of thoroughness and competence for the profession of toxicology and environmental assessment to assess and evaluate information acquired during the preparation of this report. Any information or facts provided by others, and referred to or utilized in the preparation of this report or otherwise used as input for the Intrinsik assessment, is believed to be accurate without any independent verification or confirmation by Intrinsik. Intrinsik makes no claims with respect to the veracity or accuracy of such input. This report is based upon and limited by circumstances and conditions stated herein, and upon information available at the time of the preparation of the report.
7894/December 2013 REP-NEB-TERA-00033
Page 7-1

Trans Mountain Pipeline ULC
Qualitative Human Health Risk Assessment of Westridge Marine Terminal Spills Technical
Report Trans Mountain Expansion Project
8.0 REFERENCES 8.1 Literature Cited
EBA Tetra Tech. 2013. Modelling the Fate and Behaviour of Diluted Bitumen Spills in the Marine Environment, at Westridge Terminal and in the Lower Fraser River for the Trans Mountain Expansion Project. December 2013.
National Energy Board. 2013a. NEB Filing Manual. Inclusive of Release 2013-03 (August 2013). Calgary, AB.
National Energy Board. 2013b. Trans Mountain Pipeline ULC – Trans Mountain Expansion Project Filing Requirements Related to the Potential Environmental and Socio-Economic Effects of Increased Marine Shipping Activities. Calgary, AB.
7894/December 2013 REP-NEB-TERA-00033
Page 8-1