Volume 62 - Number 3 July - September 2018 - Indian Journal ...
112
Volume 62 - Number 3 July - September 2018 IJPPAZ 62 (3) 278–385 (2018) Original Article 278. Comparison of Baroreflex Responses to Lower Body Negative Pressure and Valsalva Maneuver in Healthy Subjects Shival Srivastav, Dinu S Chandran, Ashok Kumar Jaryal and Kishore Kumar Deepak 286. Histomorphological and Biochemical Analysis of Large Goitres in Iodine Replete Gangetic Plains of West Bengal, India: Is The Spectrum Shifting Towards Graves’ Disease? Amar K Chandra, Mainak Dutta, Sohag Kundu, Arijit Chakraborty, Chiranjit Mondal and Deotima Sarkar 298. Prevalence of Cardiovascular Risk Factors in Engineering and Medical Students in Madurai, Tamil Nadu B. N. Vallish, N. Shreedher Priyan, J. Mohan, Raj Kishore Mahato and M. Brahadeesh 306. Study of Inflammatory Marker IL-6 and Sympathetic Activity Among WHR Matched Prehypertensive & Normotensive Males Archana Pandey, Yogesh Saxena, Soumen Manna and Aarti Kotwal 314. The Lack of Validity of Predictive Equations for Calculating Resting Energy Expenditure in Asian Indian Patients with Type 1 and Type 2 Diabetes Mellitus 2 Riddhi Dasgupta, Padmanaban Venkatesan, Akankasha Goyal, Anneka Wickramanayake, K. Chaithanya Murthy, Mercy Inbakumari, Meredith Hawkins and Nihal Thomas 320. Pattern and Prevalence of Cardiovascular Autonomic Neuropathy (CAN) in Alcoholic Liver Disease Patients in Gauhati Medical College & Hospital, Assam : A Cross-sectional Study Jyotismita Deka, Anupi Das and Gayatri Bora 327. Protective Effect of A2B Receptor Antagonist (TRP 2) on Acetic Acid Induced Ulcerative Colitis in Rats: In vitro, in vivo and in silico Methods P. Praveen Kumar, G. Santhosh, M. Sri Chandana, K. Prasad, M. Raghu Prasad and S. Khasim 339. Effect of Bacopa Monnieri on Ethanol-induced Anxiolysis and Withdrawal Anxiety in Wistar Rats Bhuvaneshwari Sudershan, Mukta N. Chowta, Sheetal D. Ullal, S. Rajeshwari, Vinay Kumar Sayeli, Sudhishma Shivaprasad and Pragati Srivastava 347. Gastroprotective Effect of Ethanolic Extract of Vigna Subterranea in Ethanol-induced Gastric Mucosal Ulceration in Rats Morufu E. Balogun,Elizabeth E. Besong, Jacinta N. Obimma, Serges F. A. Djobissie and Ogochukwu S. Mbamalu Medical Education / Original Article 359. Creating Valid Multiple-Choice Questions (MCQs) Bank with Faculty Development of Pharmacology Shalini Chandra, Rashmi Katyal, Sameer Chandra, Kashmir Singh, Arun Singh and H. S. Joshi Short Communication 367. Electronic Stethoscope Designing and Use in Resource Limited Indian Setting Noorin Bhimani and Zaki Shaikh 372. Peak Expiratory Flow Rate Changes with Relevant Variables in a Population of Eastern India Sujoy Mukherjee, Goutam Banerjee and Anil Baran Singha Mahapatra 380. Combined Effects of Vitamin C and Tomato Extract (Lycopersicon Esculentum) on Carbimazole-induced Alterations in the Testes of Male Albino Rats O. C. Orji, I. K. Uchendu, C. E. Agu, E. B. Nnedu, A. N. Okerrekeand G. C. Orji Letter to Editor 385. Vitamin D, Neutrophil-to-Lymphocyte Ratio and Cognitive Function Mahantayya Math and Yashoda Kattimani
-
Upload
khangminh22 -
Category
Documents
-
view
0 -
download
0
Transcript of Volume 62 - Number 3 July - September 2018 - Indian Journal ...

Volume 62 - Number 3 July - September 2018
IJPPAZ 62 (3) 278–385 (2018)
Registered with Registrar of Newspapers for India under No. 6271/61
Original Article
278.� Comparison of Baroreflex Responses to Lower Body Negative Pressure and Valsalva Maneuver in Healthy Subjects
� Shival Srivastav, Dinu S Chandran, Ashok Kumar Jaryal and Kishore Kumar Deepak
286.� Histomorphological and Biochemical Analysis of Large Goitres in Iodine Replete Gangetic Plains of West Bengal, India: Is The Spectrum Shifting Towards Graves’ Disease?
� Amar K Chandra, Mainak Dutta, Sohag Kundu, Arijit Chakraborty, Chiranjit Mondal and Deotima Sarkar
298.� Prevalence of Cardiovascular Risk Factors in Engineering and Medical Students in Madurai, Tamil Nadu
� B. N. Vallish, N. Shreedher Priyan, J. Mohan, Raj Kishore Mahato and M. Brahadeesh
306.� Study of Inflammatory Marker IL-6 and Sympathetic Activity Among WHR Matched Prehypertensive & Normotensive Males
� Archana Pandey, Yogesh Saxena, Soumen Manna and Aarti Kotwal
314.� The Lack of Validity of Predictive Equations for Calculating Resting Energy Expenditure in Asian Indian Patients with Type 1 and Type 2 Diabetes Mellitus
2� Riddhi Dasgupta, Padmanaban Venkatesan, Akankasha Goyal, Anneka Wickramanayake , K. Chaithanya Murthy, Mercy Inbakumari, Meredith Hawkins and Nihal Thomas
320.� Pattern and Prevalence of Cardiovascular Autonomic Neuropathy (CAN) in Alcoholic Liver Disease Patients in Gauhati Medical College & Hospital, Assam : A Cross-sectional Study
� Jyotismita Deka, Anupi Das and Gayatri Bora
327.� Protective Effect of A2B Receptor Antagonist (TRP 2) on Acetic Acid Induced Ulcerative Colitis in Rats: In vitro, in vivo and in silico Methods
� P. Praveen Kumar, G. Santhosh, M. Sri Chandana, K. Prasad, M. Raghu Prasad and S. Khasim
339.� Effect of Bacopa Monnieri on Ethanol-induced Anxiolysis and Withdrawal Anxiety in Wistar Rats
� Bhuvaneshwari Sudershan, Mukta N. Chowta, Sheetal D. Ullal, S. Rajeshwari, Vinay Kumar Sayeli, Sudhishma Shivaprasad and Pragati Srivastava
347.� Gastroprotective Effect of Ethanolic Extract of Vigna Subterranea in Ethanol-induced Gastric Mucosal Ulceration in Rats � Morufu E. Balogun,Elizabeth E. Besong, Jacinta N. Obimma, Serges F. A. Djobissie and Ogochukwu S. Mbamalu
Medical Education / Original Article
359.� Creating Valid Multiple-Choice Questions (MCQs) Bank with Faculty Development of Pharmacology
� Shalini Chandra, Rashmi Katyal, Sameer Chandra, Kashmir Singh, Arun Singh and H. S. Joshi
Short Communication
367.� Electronic Stethoscope Designing and Use in Resource Limited Indian Setting
� Noorin Bhimani and Zaki Shaikh
372.� Peak Expiratory Flow Rate Changes with Relevant Variables in a Population of Eastern India
� Sujoy Mukherjee, Goutam Banerjee and Anil Baran Singha Mahapatra
380.� Combined Effects of Vitamin C and Tomato Extract (Lycopersicon Esculentum) on Carbimazole-induced Alterations in the Testes of Male Albino Rats
� O. C. Orji, I. K. Uchendu, C. E. Agu, E. B. Nnedu, A. N. Okerrekeand G. C. Orji
Letter to Editor
385.� Vitamin D, Neutrophil-to-Lymphocyte Ratio and Cognitive Function
� Mahantayya Math and Yashoda Kattimani


278 Srivastav, Chandran, Kumar Jaryal and Deepak Indian J Physiol Pharmacol 2018; 62(3)
Original Article
Comparison of Baroreflex Responses to Lower Body NegativePressure and Valsalva Maneuver in Healthy Subjects
Shival Srivastav, Dinu S Chandran, Ashok Kumar Jaryaland Kishore Kumar Deepak*
Department of Physiology,All India Institute of Medical Sciences,New Delhi
Abstract
Lower body negative pressure (LBNP) technique has been used for simulating orthostasis by producingpreload reduction. Valsalva maneuver (VM), a commonly employed test for autonomic function evaluation,operates on similar principle. Previous literature recommends LBNP as a substitute to VM but has notcompared them from a baroreflex perspective. We have compared baroreflex responses to VM and LBNP inapparently healthy adult male subjects (n=22) by assessment of baroreflex sensitivity (BRS). BRS valuesduring Phase II and IV of VM and during suction (dLBNP) and immediate post suction (pLBNP) phases ofLBNP were compared. There was no significant difference between Phase IIVM and dLBNP (4.598 (2.945-5.917) ms/mm Hg versus 4.228 (2.199-5.266) ms/mm Hg, p=0.84, Wilcoxon signed rank test). Also, therewas no significant difference between Phase IVVM and pLBNP (4.892 (4.165-5.921) ms/mm Hg versus 7.650(4.278-9.354) ms/mm Hg, p=0.11, Wilcoxon signed rank test). While there was no significant differenceamongst the BRS values obtained, Bland Altman analysis revealed existence of bias between BRS derivedusing VM and LBNP. It may be concluded that the two maneuvers operate via different mechanisms andinterchangeable use of Valsalva maneuver and Lower body negative pressure for BRS assessment may notbe tenable.
Indian J Physiol Pharmacol 2018; 62(3) : 278–285
*Corresponding author :
Kishore Kumar Deepak, Professor and Head, Departmentof Physiology, All India Institute of Medical Sciences, NewDelhi, E-mail: [email protected]
(Received on January 1, 2018)
pressure. The perturbation brought about by thedecrem ent in venous re turn engages re f lexcardiovascular regulatory mechanisms leading torestoration of blood pressure and heart rate to restinglevels.
The baroref lex is one of the key mechanismsresponsible for modulation of blood pressure. Efficacyof the baroreceptors to buffer oscillations in bloodpressure can be assessed using Baroreflex sensitivity(BRS) which quantifies the relationship between heartrate and blood pressure. BRS estimation may bedone by studying spontaneous fluctuations in systolic
Introduction
The reduction of preload serves as a potent stimulusto engage the cardiovascular system. It may bebrought about by different maneuvers such as Headup tilt, Valsalva maneuver and Lower body negative

Indian J Physiol Pharmacol 2018; 62(3) BRS Responses to LBNP and VM 279
morbidities l ikely to affect autonomic function.Before inclusion in the study, detailed history of thesubjects was taken to ensure that there was nocontraindication for performance of Valsalva maneuveri.e. any history suggestive of retinopathy, elevatedintraocular pressure, intra-ocular lens implantationor any surgical scar on the abdomen. W ritteninformed consent was obtained from all participantsafter detailed explanation of the study protocol.
The subjects were requested to abstain from tea/coffee on the morning of the test. Abstinence fromtobacco, heavy exercises and any medication likelyto affect the autonomic nervous system was alsoensured. All the subjects were fit to perform Valsalvamaneuver, as described earlier. They were requestedto wear loose fitting and comfortable clothing on theday of the test.
The recordings were done in a noise and temperaturecontrolled environment at Autonomic and Vascularfunction laboratory at the Department of Physiologyat All India Institute of Medical Sciences, New Delhi.All the recordings were performed between 09.00 amand 1.00 pm. Upon arrival to the lab, the subjectswere asked to empty their bladder and were providedsupine rest for 10 minutes to allow vital parameterssuch as heart rate, blood pressure and respiratoryrate to come to the baseline.
Valsalva maneuver: VM was performed in supineposition. The subjects were requested to blow into ad isposab le m outh p iece connec ted to asphygmomanometer to maintain an expiratorypressure of 40 mm Hg for 15 seconds, as describedpreviously (6, 7). A small leak was created in themouthpiece to ensure open glottis and sustainedeffort throughout the maneuver. Post maneuver, thesubjects were requested to breathe as normally aspossible.
Lower body negative pressure: The lower half of thebody of the subject was sealed in the LBNP device(Vacusport™, Weyergans High care AG, Germany)at the level of the iliac crests, as recommended inliterature (2). Lower body suction of -40 mm Hg wasapplied for 15 seconds in supine position. Thesubjects were requested to breathe as normally as
blood pressure (SBP) and heart rate or by inducingperturbations using drugs or maneuvers such as Headup tilt or Valsalva maneuver. The relationship betweenchange in RR intervals in response to SBPfluctuations helps to quantify BRS (1).
Lower body negative pressure (LBNP) has beenemployed to simulate orthostatic stress by passivesuction on the lower half of the body. Different gradesand time durations have been reported in literature(2,3). While low intensity LBNP (upto-20 mm Hg) issaid to selectively unload cardiopulmonary receptors,higher intensities are reported to additionally engageaortic and carotid baroreceptors (4). Therefore LBNPdemonstrates potential utili ty in assessment ofbaroreflex integrity.
Previous literature has suggested use of LBNP as asubstitute to Valsalva maneuver (VM) (5). It has beenreported that passive suction employed in LBNPmitigates the reflexes activated by other maneuversfor preload reduction such as Valsalva maneuver andHead up tilt. This may be useful for elderly subjectsand patients with neurological disorders who maynot be able to perform VM (5). Description ofhemodynamic changes brought about by LBNP hasbeen documented. But the efficacy of LBNP toassess BRS is not adequately addressed by previousliterature.
We conducted the present study to examine thepotential of LBNP as a tool for baroreflex evaluation.We also assessed cardiovascular responses toValsalva maneuver to compare both maneuvers froma baroreflex perspective.
Methods
Our study was a cross sectional, observational studyconducted at Autonomic and Vascular functionlaboratory, Department of Physiology, All IndiaInstitute of Medical Sciences (AIIMS), New Delhi. Thestudy was approved by Institute Ethics committee.Twenty two healthy male volunteers (mean age =26.6±6.23 years, BMI = 21.5±2.65 kg/m2) of Delhi-NCR region were recruited for the study. All subjectswere apparently healthy and did not have any co
280 Srivastav, Chandran, Kumar Jaryal and Deepak Indian J Physiol Pharmacol 2018; 62(3)
possible during and after the suction period. A shamtrial of LBNP was given before the start of protocolduring which no data acquisition was performed. Thepurpose of sham exposure was to familiarize thesubjects with LBNP suction and prevent undue anxietyduring the actual trial.
Beat to Beat Blood pressure and ECG: Beat tobeat b lood pressure was recorded by f ingerplethysmography using volume clamp technique(Finometer™ model 2, Finapres Medical Systems,Amsterdam, Netherlands). The technique provides areliable non invasive estimate of blood pressure andis comparable to intra-arterial recordings (8, 9). LeadII ECG was sampled after amplif ication usingbioamplifier and application of band pass filter of 0.5and 35 Hz. RR intervals were derived in real timeusing the raw signal. A digital data acquisitionsystem, Power Lab™ system (AD Instruments,Australia) was used to acquire the blood pressureand ECG signals at sampling rate of 1 kHz. LabChart Pro™ version 7 Software (AD Instruments,Australia) was used for data acquisition and storagefor subsequent offline analysis.
Baroreflex Sensitivity analysis: Analysis of baroreflexsensitivity (BRS) was performed for VM and LBNP.Phase II and IV of VM were chosen for BRSassessment as they entail active engagement ofbaroreflex. The systolic blood pressure (SBP) valuesfrom peak to nadir were identified during Phase II.The s lope o f the regress ion curve betweencorresponding RR interval and SBP values from peakto nadir was computed as a measure of BRS (10–13). Similarly, the nadir to peak values of SBP werechosen during Phase IV of VM and regressed againstsubsequent RR intervals. The slope of the regressioncurve was taken as a measure of BRS. These valueshelp to estimate the vagal component of BRS(BRS_v and BRS_v) (10, 12, 13). We designatedthem as PhaseIIVM and PhaseIVVM respectively.The slope was chosen for only those regressioncurves with r values 0.5 or better.
We utilized a similar methodology for evaluation ofBRS using LBNP. Identification of SBP values duringsuction phase (from peak to nadir) and immediatepost suction phase (from nadir to peak) were
performed. Subsequent RR intervals were regressedaga ins t these SBP va lues and s lopes weredetermined as measures of BRS. The values thusderived were designated as dLBNP and pLBNP(representing ‘during’ LBNP and ‘immediate post’LBNP respectively). Since BRS using LBNP has notbeen reported adequately in literature, we choosetwo arbitrary criteria for describing the baroreflexresponse to LBNP as adequate – fall of atleast 10mm Hg in SBP and r value of 0.5 or better for theregression curve. dLBNP and pLBNP were evaluatedfor subjects, only if both criteria were met.
Statistical analysis: Gaussian fit of data was checkedusing D’Agostino and Pearson Omnibus normalitytest. Values were expressed as Mean±SD or Median(Interquartile range) depending on gaussian fit.Wilcoxon signed rank test was used for statisticalcomparison between BRS values. The level ofstatistical significance was set at p value of <0.05.
Bland Altman test was used to check the biasand agreement between BRS values derived usingPhase IIVM and dLBNP & Phase IVVM and pLBNPrespectively.
Results
Twenty two healthy male subjects (mean age =26.6±6.23 years, BMI = 21.5±2.65 kg/m2) participatedin the study. All subjects were able to performValsalva maneuver at 40 mm Hg for 15 seconds.Also, all subjects were able to tolerate LBNP suctionof -40 mm Hg for 15 seconds. None of them reportedany d iscomfor t or presyncopal symptoms onapplication of LBNP suction.
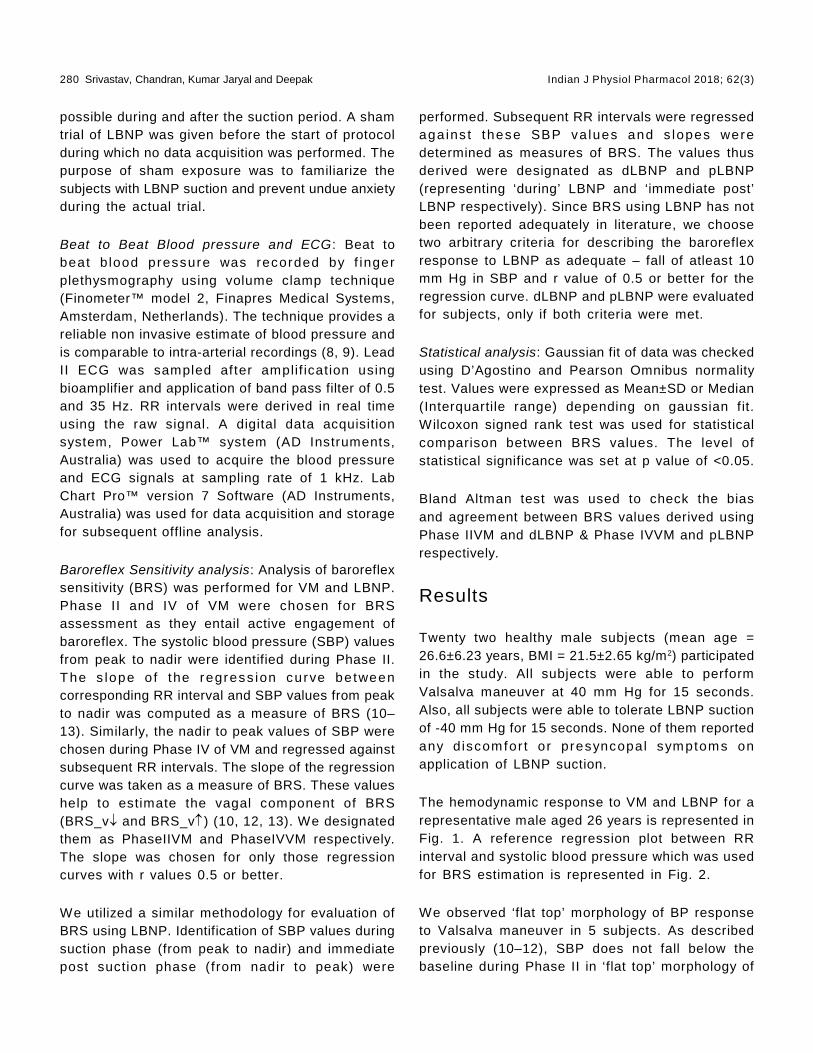
The hemodynamic response to VM and LBNP for arepresentative male aged 26 years is represented inFig. 1. A reference regression plot between RRinterval and systolic blood pressure which was usedfor BRS estimation is represented in Fig. 2.
We observed ‘flat top’ morphology of BP responseto Valsalva maneuver in 5 subjects. As describedpreviously (10–12), SBP does not fall below thebaseline during Phase II in ‘flat top’ morphology of
Indian J Physiol Pharmacol 2018; 62(3) BRS Responses to LBNP and VM 281
(A)
(B)
Fig. 1 : Representative records of Valsalva maneuver and LBNP in a male subject aged 26 years.
The above pictures show representative records from a 26 year old male performing Valsalva maneuver (A) and whenexposed to LBNP (B). The channels 1 and 2 show raw signals of continuous beat to beat blood pressure and LeadII ECG while channels 3,4 and 5 show Systolic BP, Diastolic BP and RR interval derived in real time using raw signalsin 1 and 2. The inset boxes show magnified views of raw BP and ECG signals. The black bar at the bottom showsthe duration of the maneuvers (15 seconds each).
VM. BRS evaluation is not recommended in thesesubjects and therefore we excluded them from BRSanalysis. Also, we observed that 7 subjects did notfit our criteria for BRS evaluation using LBNP i.e.fall of at least 10 mm Hg in SBP and r value of 0.5or better for the regression curve. Therefore BRS(dLBNP and pLBNP) could not be computed for thesesubjects. Therefore statistical comparison of BRSvalues of 17 subjects for Valsalva maneuver and 15subjects for LBNP was finally performed.
Baroreflex sensitivity assessed by VM (Phase IIVMand Phase IVVM) and LBNP (dLBNP and pLBNP)are depicted in Figure 3. There was no significantdifference between Phase IIVM and dLBNP (4.598(2.945-5.917) ms/mm Hg versus 4.228 (2.199-5.266)ms/mm Hg, p=0.84, Wilcoxon signed rank test). Also,there was no significant difference between PhaseIVVM and pLBNP (4.892 (4.165-5.921) ms/mm Hgversus 7.650 (4.278-9.354) ms/mm Hg, p=0.11,Wilcoxon signed rank test).

282 Srivastav, Chandran, Kumar Jaryal and Deepak Indian J Physiol Pharmacol 2018; 62(3)
Fig. 2 : Representative linear regression curve used for estimation of Baroreflex sensitivity.
The above graph depicts linear regression of RR intervals (ms) against Systolic blood pressure (mm Hg) for dLBNPfor the representative subject in Figure 1. The slope of the regression curve (2.169 ms/mm Hg) is an estimate ofBaroreflex sensitivity.
Fig. 3 : Comparison of Baroreflex sensitivity (BRS) valuesderived using Valsalva maneuver and LBNP.
Baroreflex sensitivity values derived using Valsalvamaneuver (Phase IIVM and Phase IVVM) and LBNP(dLBNP and pLBNP). Data expressed as Median(Interquart i le Range) . There was no s ign i f i cantdifference between Phase IIVM & dLBNP and PhaseIV & pLBNP, as assessed by Wilcoxon Signed Ranktest (p=0.84 and 0.11 respectively).
Bland Altman analysis revealed bias in both positiveand negative directions between BRS derived fromboth maneuvers (Fig. 4). The mean bias between
dLBNP and Phase IIVM & pLBNP and Phase IVVMwere 0.094 and 2.064 ms/mm Hg respectively.
Discussion
Baroreflex sensitivity has demonstrated efficacy asa parameter for assessment of autonomic nervoussystem integrity. BRS assessment has value to aclinician, as impairment may have prognostic valuein various disorders. Previous literature has shownimpaired BRS to be related to prognosis in heartfailure and myocardial infarction (14). Therefore BRSassessment can offer useful information both inhealth and disease.
The gold standard method for BRS assessment ispharmacological method which involves ser ialinjections of phenylephrine and nitroprusside to bringabout blood pressure increments and decrements.Simultaneous assessment of heart rate responseshelps us quantify BRS. Other commonly usedmethods for BRS quantif ication are Sequencemethod, Head up tilt and Valsalva maneuver (1).
The common mechanism operant in Head up tilt,Valsalva maneuver and Lower Body Negative pressure

Indian J Physiol Pharmacol 2018; 62(3) BRS Responses to LBNP and VM 283
(A) (B)
Fig. 4 : Bland Altman agreement analysis between BRS derived from Valsalva maneuver and LBNP.
Above figures show Bland Altman agreement analysis between dLBNP and Phase IIVM (A) and pLBNP and Phase IVVM(B). The mean bias in (A) and (B) are 0.094 and 2.064 ms/mm Hg respectively.
is preload reduction. The reduced venous return tothe heart engages compensatory baroreflex mediatedchanges to maintain cardiovascular homeostasis.Valsalva maneuver has been regularly employed inautonomic function assessment as a strategy forpre load reduct ion and barore f lex sens i t iv i t yassessment. The maneuver can be divided into 4different phases based on the hemodynamic profile(15, 16). Phase II and IV of the maneuver lead toactive engagement of the baroreflex and thereforehave been used for BRS estimation in literature (17).Our BRS values (PhaseIIVM and Phase IVVM) showgood agreement with previously described values (10,17, 18). Though we observed ‘flat top’ responses insome subjects (n=5), the same has been describedas a normal variant of Valsalva maneuver and isobserved in healthy subjects performing VM in supineposition (18,19).
We observed that BRS values for Phase IIVM anddLBNP and Phase IVVM and pLBNP were statisticallycomparable. But since we also wanted to validateLBNP as a substitute to VM for BRS assessment,Bland Altman analysis was performed to evaluatethe agreement and bias between BRS values. Weobserved considerable bias between BRS valuesderived using both maneuvers. The bias extended inboth positive and negative directions. This supportedthe concept tha t VM and LBNP may not besubstituted for each other for purpose of BRSassessment.
Another interesting observation in our study was thatapproximately one-third of our subject population didnot show typical hypotensive response to LBNPsuction of -40 mm Hg for 15 seconds duration. Thisobservation may be attr ibuted to the followingreasons. Previously authors used LBNP suction of-40 mm Hg for 30 seconds with seal at the level oflower border of xiphisternum (5). But we used theseal location at the level of iliac crests, in accordancewith recommendations in previous literature (2). Ithas been suggested seal at level of xiphisternummay create severe hemodynamic alterations and mayimpede with diaphragm movement interfering withrespiration (20). Therefore we preferred seal aroundiliac crest in our study. Seal around iliac crestsspares the highly compliant splanchnic and renalvascular beds. Also, we applied suction for durationof 15 seconds to ensure comparability of VM andLBNP on a temporal scale. This shorter duration ofsuction along with sparing of splanchnic and renalvascular beds may be responsible for the absenceof hypotensive response to LBNP in a subset of ourstudy population.
Our study has several novelty factors. Though LBNPhas been used widely for study of cardiovascularand hemodynamic regulatory mechanisms, we cameacross only few reports of BRS evaluation usingLBNP. BRS evaluation has been done in thesereports by sequence method (21) or frequencydomain approach (22) using LBNP application for
284 Srivastav, Chandran, Kumar Jaryal and Deepak Indian J Physiol Pharmacol 2018; 62(3)
prolonged durations. Ours is the first study to reportBRS using blood pressure oscillations produced byLBNP leading directly to baroreflex engagement. Inaddition to the above novelty, our data investigatedthe previous notion of LBNP being a substitute forVM, especially with respect to BRS estimation. LBNPis a passive suction on the lower half of the bodywhile VM involves active patient effort. Active volitionby the subject is likely to engage central command.As pointed out previously (5), interaction betweenneural centers due to inherent active subject effortmay influence the end response. Also concomitantactivation of mechanoreceptors and thoracic stretchreceptors (23) is likely to have a bearing on theoverall hemodynamic response. Therefore, while it ist rue tha t p re load reduc t ion is the com m onmechanism underlying baroreflex activation in VMand LBNP, concurrent engagement of abovementioned physiological factors may be probablereason for the bias between BRS values betweenVM and LBNP. So, we may infer that LBNP and VMmay not be interchangeably used when assessingbaroreflex function.
There are few limitations to our study. A larger samplesize with subjects across the age spectra may yieldmore insight into the differences between VM andLBNP. We chose a safe suction limit of -40 mm Hgto avoid any syncopal episodes in our subjects. Alsowe included only male subjects as there arecontradictory reports of the effect of menstrual cyclephases on BRS (24,25).
Conclusion
Our study serves as a pilot investigation for usingLBNP to produce blood pressure perturbations toengage the baroreflex. The use of LBNP may beextended to patient groups, especially those withbaroreflex impairment, to establish its utility as atechnique for autonomic and baroreflex assessment.We compared baroreflex sensitivity as assessed byValsalva maneuver and Lower body negative pressureand observed that though both maneuvers aresimilar from a preload reduction standpoint, theyare essentially different with respect to engagemento f o ther re f lex m echan ism s. There fore , theexchangeable use of the techniques from a baroreflexsensitivity evaluation standpoint may not be plausible.Further investigations into these maneuvers may helpus differentiate them with respect to underlyingregulatory mechanisms.
Acknowledgements
The authors express their thanks to the staff ofAutonomic and Vascular function laboratory atDepartment of Physiology, All India Institute ofMedical Sciences, New Delhi for their assistance inconducting the study.
Conflict of Interest
The authors declare that no conflict of interest,financial or otherwise, exists.
References
1. La Rovere MT, Pinna GD, Raczak G. Baroreflex sensitivity:measurement and clinical implications. Ann NoninvasiveElectrocardiol. 2008 Apr; 13(2): 191–207.
2. Goswami N, Loeppky JA, Hinghofer-Szalkay H. LBNP:pas t p ro toco l s and techn ic a l c ons idera t ions f orexperimental design. Aviat Space Environ Med 2008 May;79(5): 459–471.
3. Hisdal J, Toska K, Walløe L. Beat-to-beat cardiovascularresponses to rapid, low-level LBNP in humans. Am JPhysiol Regul Integr Comp Physiol 2001 Jul; 281(1):R213–R221.
4. Brown CM, Hecht MJ, Neundörfer B, Hilz MJ. Effects oflower body negative pressure on cardiac and vascularresponses to carotid baroreflex stimulation. Physiol Res2003; 52(5): 637–645.
5. Patel AR, Engstrom JE, Tusing LD, McNeeley KJ, Chelimsky
TC. Lower body nega t ive pres su re: a t es t o fcardiovascular autonomic function. Muscle Nerve 2001Apr; 24(4): 481–487.
6. Piha SJ. Autonomic responses to the Valsalva manoeuvrein healthy subjects. Clin Physiol 1995 Jul; 15(4): 339–347.
7. Looga R. The Valsalva manoeuvre—cardiovascular effectsand performance technique: a crit ical review. RespirPhysiol Neurobiol 2005 May 12; 147(1): 39–49.
8. Langewouters GJ, Settels JJ, Roelandt R, Wesseling KH.Why use Finapres or Portapres rather than intra-arterialor intermittent non-invasive techniques of blood pressuremeasurement? J Med Eng Technol 1998 Feb; 22(1): 37–43.
9. Imholz BP, van Montfrans GA, Settels JJ, van der HoevenGM, Karemaker JM, Wieling W. Continuous non-invasive
Indian J Physiol Pharmacol 2018; 62(3) BRS Responses to LBNP and VM 285
blood pressure monitoring: reliability of Finapres deviceduring the Valsalva manoeuvre. Cardiovasc Res 1988Jun; 22(6): 390–397.
10. Wada N, Singer W, Gehrking TL, Sletten DM, SchmelzerJD, Kihara M, et al. Determination of vagal baroreflexsensitivity in normal subjects. Muscle Nerve 2014 Oct;50(4): 535–540.
11. Sharabi Y, Dendi R, Holmes C, Goldstein DS. Baroreflexfailure as a late sequela of neck irradiation. Hypertension2003 Jul; 42(1): 110–116.
12. Huang C-C, Sandroni P, Sletten DM, Weigand SD, LowPA. Effect of age on adrenergic and vagal baroreflexsensitivity in normal subjects. Muscle Nerve 2007 Nov;36(5): 637–642.
13. Schrezenmaier C, Singer W, Swift NM, Sletten D, TanabeJ, Low PA. Adrenergic and vagal baroreflex sensitivity inautonomic failure. Arch Neurol 2007 Mar; 64(3): 381–386.
14. La Rovere MT, Pinna GD, Maestri R, Robbi E, CaporotondiA, Guazzotti G, et al. Prognostic implications of baroreflexsensitivity in heart failure patients in the beta-blockingera. J Am Coll Cardiol 2009 Jan 13; 53(2): 193–199.
15. Pstras L, Thomaseth K, Waniewski J, Balzani I, BellavereF. The Valsalva manoeuvre: physiology and c l inicalexamples. Acta Physiol (Oxf). 2016 Jun; 217(2): 103–119.
16. Goldstein DS, Cheshire WP. Beat-to-beat blood pressureand heart rate responses to the Valsalva maneuver. ClinAuton Res 2017 Dec; 27(6): 361–367.
17. Wada N, Singer W, Gehrking TL, Sletten DM, SchmelzerJD, Low PA. Comparison of baroreflex sensitivity with afall and rise in blood pressure induced by the Valsalva
manoeuvre. Clin Sci 2014 Sep; 127(5): 307–313.
18. Singer W, OpferGgehrking TL, McPhee BR, Hilz MJ, LowPA. Influence of posture on the Valsalva manoeuvre. ClinSci 2001 Apr; 100(4): 433–440.
19. Vogel ER, Corfits JL, Sandroni P, Sletten DM, BenarrochEE, Fealey RD, et al. Effect of posit ion on valsalvamaneuver: supine versus 20 degree posit ion. J ClinNeurophysiol 2008 Oct; 25(5): 313–316.
20. Dikshi t MB. Lower-body suct ion and cardiovascularreflexes: physiological and applied considerations. IndianJ Physiol Pharmacol 1990 Jan; 34(1): 3–12.
21. Goulopoulou S, Deruisseau KC, Carhart R, Kanaley JA.Limb venous compliance responses to lower body negativepressure in humans with high blood pressure. J HumHypertens 2012 May; 26(5): 306–314.
22. Selvaraj N, Shelley KH, Silverman DG, Stachenfeld N,Chon KH. Autonomic control mechanism of maximal lowerbody negative pressure application. Conf Proc IEEE EngMed Biol Soc 2012; 2012: 3120–3123.
23. Goldstein DS, Horwitz D, Keiser HR. Comparison oftechniques for measuring baroreflex sensitivity in man.Circulation 1982 Aug; 66(2): 432–439.
24. Brooks VL, Cassaglia PA, Zhao D, Goldman RK. Baroreflexfunction in females: changes with the reproductive cycleand pregnancy. Gend Med 2012 Apr; 9(2): 61–67.
25. Brunt VE, Miner JA, Kaplan PF, Halliwill JR, Strycker LA,Minson CT. Short-term administration of progesterone andestradiol independently alter carotid-vasomotor, but notcarotid-cardiac, baroreflex function in young women. AmJ Physiol Heart Circ Physiol 2013 Oct 1; 305(7): H1041–H1049.
286 Chandra, Dutta, Kundu, Chakraborty, Mondal and Sarkar Indian J Physiol Pharmacol 2018; 62(3)
Original Article
Histomorphological and Biochemical Analysis of Large Goitresin Iodine Replete Gangetic Plains of West Bengal, India:Is The Spectrum Shifting Towards Graves’ Disease?
Amar K Chandra1*, Mainak Dutta2, Sohag Kundu2, Arijit Chakraborty1,Chiranjit Mondal1 and Deotima Sarkar1
1Endocrinology and Reproductive Physiology LaboratoryDepartment of Physiology, University of CalcuttaWest Bengal, India
2Department of Otorhinolaryngology and Head-Neck SurgeryMedical College and Hospital88, College Street, KolkataWest Bengal, India
Abstract
Background and Objective: Endemic goitre is the most important clinical manifestation of iodine deficiencydisorders (IDDs). To prevent IDDs, universal salt iodisation (USI) has been implemented, irrespective of theenvironmental iodine content of the region that might not necessarily be iodine-deficient, like the Gangeticplains of West Bengal (WB), India. In this study, surgical specimens of goitrous thyroids from patients ofthe Gangetic plains of WB were investigated with the objective to explore the aetiology of large goitres.
Materials and Methods: Seven specimens of thyroid tissue of large goitrous subjects after their thyroidectomywere collected during June 2014 - May 2015. To know their thyroid functional status, serum total thyroxine(TT4), total triiodothyronine (TT3) and thyroid stimulating hormone (TSH) were assayed prior to their surgery; to understand their thyroid gland status, histology of thyroid as well as the activity of thyroid hormonesynthesizing enzymes as sodium-potassium adenosine triphosphatase (Na-K-ATPase), thyroid peroxidase(TPO) and deiodinase (5’DI) from excised specimen were assayed.
Results: The pre-operative serum TT3, TT4 and TSH levels were within normal range in all patients. In thyroidtissue specimen, activities of enzymes (Na+-K+-ATPase, TPO, 5’-DI) were noted. The follicles were distendedwith colloids as found in colloid goitre, with flattened lining epithelial cells. Further involution was almostcomplete. However, there were areas having smaller follicles with peripheral vacuolations and scallopingwithin the thin colloids, showing that resorption of colloid continued to occur as found in Graves’ disease.
Conclusion: Large goitres in patients belonging to iodine replete Gangetic plains of West Bengal histologicallymimic Graves’ disease apparently developed for the consumption of dietary goitrogens, including excessiodine for USI programme.
Indian J Physiol Pharmacol 2018; 62(3) : 286–297
*Corresponding author :
Dr. Amar K Chandra, UGC Emeritus Professor, Endocrinology and Reproductive Physiology Laboratory, Department of Physiology,University of Calcutta, University College of Science and Technology, 92, APC Road, Kolkata 700 009, West Bengal, India,Tel: (033) 2350 8386 (Extn. 223), Fax: 91-033-2351 9755, E-mail: [email protected], [email protected]
(Received on January 1, 2018)

Indian J Physiol Pharmacol 2018; 62(3) Large Goitre and Graves’ Disease 287
and allied human practices. For example, thiocyanate(SCN–) from the cyanogenic plant-foods (2, 8) thatcompetes with iodide for entry within the thyroidfollicles, exposure to excessive dietary calcium (9),microbial and other contaminants in drinking water(10), and even tobacco-smoke inhalation (11) mightact as goitrogens and aggravate the consequencesof iodine deficiency that might be existing in its givenextent at the population level. On the other hand,even excess iodine has been found to increase theprevalence of thyroid disorders including goitre (12).
It needs to be emphasised that iodine deficiencyalone might not be enough for goitrogenesis due tothe efficient adaptability of human physiology wherebythe thyroid’s iodine trapping capacity is increased(13, 14). This has been observed in experimentalgoitrogenesis in animal models too (15). In bothhuman subjects and experimental animals, there washigh iodine uptake with rapid turnover, increasedthyroid stimulating hormone (TSH) level, low TT4 andnormal TT3 levels in plasma. Thyroids of iodine-deficient rats showed glandular hypertrophy with greatincrease in vascularity and small follicles with muchdecreased luminal spaces. However this pattern ofiodine dynamics, with a high turnover of thyroid iodine,disappears with age (16). Therefore, by increasingiodine uptake with minimal dietary supply, utilisingendogenous iodine, and increasing the potentialityof thyroid hormone synthesis by shifting the synthesistowards T3, the thyroid compensates successfullyfor low dietary iodine. Further, increased generationof T3 by thyroid, which decreases the loss of T4 andiodine through rT3 pathway, occurs in endemic iodine-deficient areas (8, 17). The occurrence of goitres inrelatively iodine-sufficient areas therefore implies thatthe environmental goi t rogens overwhelm thecom pensatory m echanism o f hum an thyro idphysiology and result in thyroid swellings which oftenattain large size. Large goitres are not an adaptationto iodine deficiency but rather an overreaction ofthyroid just as the keloid is an overreaction in thescarring process.
In the setting of goitrogenesis in iodine-sufficientareas where the implicating factors include variousenv i ronm enta l goi t rogens a long wi th iod inesupplementation in salt, the need arises to evaluate
Introduction
The major manifestations of iodine def iciencydisorders (IDDs) are endemic goitre, mental defects,deaf-mutism, still-birth and miscarriages, weaknessand paralysis of muscles as well as lesser degreesof mental and physical dysfunctional states (1).Prevalence of visible goitre has been reported fromthe Sundarban delta covering the districts of 24-Paraganas of coastal West Bengal. Results from ourearlier survey on endemic goitre in the Sundarbandelta of North and South 24-Paragana districtsrevealed that school-children in the age-group of 6-12 years from both sexes were severely affected byendemic goitre (2, 3). School children in the agegroup 6-12 years from both sexes were selected forthe study, because of their high vulnerability to goitre,easy access ib i l i t y, and tha t they are therepresentative of their community (4). This age groupreflected the correct status of iodine nutrition in thegeneral population (5). Goitre survey was conductedin those areas during 2001–2006 in post saltiodization period (which till continued) under thefinancial assistance of DST (Govt. of West Bengal).After that no such study has been organised andthus the results of our study might be considered asthe last published report (2, 3).
Although the intake of iodised salt in this region waslittle more than 65%, the median urinary iodine levelsin these children was more than adequate as iodinecontent in drinking water indicates that the region isiodine replete and thus there was no biochemicaliodine deficiency of the population. The study areais in the coastal region of West Bengal and theiodine content in drinking water was measured andfound that it is 48.9±30.7 ug/l (6) Zeltser et al (7)categorised the iodine deficient zones having lessthan 4 ug/l of water; moderate deficient zone withiodine level 4-10 ug/l and the relative deficient zonehaving iodine level 20 ug/l of water. According tothese criteria, the region might be considered asiodine replete zone as evident by iodine content indrinking water. A positive correlation was foundbetween iodine content in drinking water and urinaryiodine level (6). The prevalence of goitre inspite ofthis should therefore be explained by factors otherthan iodine deficiency, like regional diet, environment

288 Chandra, Dutta, Kundu, Chakraborty, Mondal and Sarkar Indian J Physiol Pharmacol 2018; 62(3)
the histologic and biochemical behaviour of largegoitre and to note any shift in the known pattern ofthe disease pathology. In the present observational(considering the sample size and non availability ofnormal values of the investigated parameters) study,the pathophysiology of thyroids of individualsbelonging to the Gangetic plains of West Bengalhaving large goitres that were surgically removed havebeen investigated by studying their histology,hormone synthesising capacity as evident by theac t iv i t ies o f sod ium –potass ium adenos inetriphosphatase (Na+-K+-ATPase], thyroid peroxidase(TPO), and deiodinase (5’-DI) as well as serumthyroid hormone profile assessed prior to surgery.
Materials and Methods
Subject selection
All the patients who have large goitre were fromiodine- replete Gangetic plains of West Bengal, Indiagot admitted in Medical College & Hospital, Kolkataduring June 2014 – May 2015 for removal of enlargedthyroid. The age, sex, domicile and physical stateof the thyroid gland are shown in Table I. Necessaryapproval of the Institutional Ethical Committee of theDepartment of Physiology, University of Calcutta hasbeen obtained for the present investigation.
Clinical examination of goitre/large goitre
A thyroid gland is considered goitrous when eachlateral lobe has a volume greater than the terminalphalanx of the thumbs of the subject being examined.
Simplified Classification of goitre by palpation (18)
Grade 0: No palpable or visible goitre
Grade 1: A goitre that is palpable but not visiblewhen the neck is in the normal position (i.e. thethyroid is not visibly enlarged). Thyroid nodules in athyroid which is otherwise not enlarged fall into thiscategory.
Grade 2: A swelling in the neck that is clearly visiblewhen the neck is in a normal posit ion and is
consistent with an enlarged thyroid when the neckis palpated.
All the dissected thyroids were distinct visible goitreof Grade 2 as per above mentioned classification.Goitre size of the patients was so large producingsymptoms and signs of mechanical obstruction andcompression, namely difficulty of breathing, stridor,hoarseness and dysphagia collectively termed asmass effects and their thyroid gland was thusremoved.
Collection of large goitrous tissue
Small portions from surgically removed thyroid glandsof patients, who underwent surgery in the Departmentof Otorhinolaryngology and Head-Neck Surgery,Medical College and Hospital, Kolkata, were collectedjust after surgery in iceboxes and immediatelytransfer red to the Department of Physio logy,University of Calcutta. Prior to surgery, informedconsent was obtained from the patients that part oftheir surgically removed thyroid tissue would beanalysed for certain histo-biochemical investigations.Details of the patients viz, age, sex, place ofresidence, drugs they used, physical status of thyroidgland and pre-operative serum thyroid hormone profilewere recorded from the hospital records. In thelaboratory, portions of the collected thyroid glandwere preserved at -20°C for further processing. Thesamples were collected during the period of June2014 to May 2015.
Histology of the thyroid gland
The surgically removed portion of the thyroid glandwas fixed in 10% neutral buffered formalin fixativeand embedded in paraffin. Sections were stained withhaematoxylin and eosin and were examined underlight compound microscope (Model: CH20i Olympus;serial no. 8A06177) at ×100 and ×400 magnificationsfor histopathology. The photomicrographs were takenusing Nikon Cool Pix P1500 digital camera.
Assay of thyroid hormone synthesising activities
Thyroid peroxidase (TPO) activity
In this study, the TPO activity was measured by the

Indian J Physiol Pharmacol 2018; 62(3) Large Goitre and Graves’ Disease 289
method introduced by Alexander in 1962 (19). A 10%homogenate was prepared using pooled thyroidtissues (i.e., thyroid tissue from different areas ofectomised thyroid gland in a particular patient)obtained from the surgically resected sample inphosphate buffer (pH 7.2, 100 mM) and sucrosesolution (500 mM) at 4°C. Homogenisation wascarried out in a glass homogeniser (Potter-Elvehjem)for 45-60s at 4400×g and about 15 strokes/min. Thehomogenate was centrifuged at 1000×g for 10 min.This low-speed supernatant was further centrifugedat 10,000×g for 10 min at 4°C to get the mitochondrialf rac t ion. Immediate ly af ter centr i fugat ion theprecipitate was solubilised in phosphate buffer (pH7.2). TPO activity was measured in a 1ml cuvettecontaining 0.9 ml acetate buffer (pH 5.2, 50 mM), 10µl potassium iodide (1.7 mM) and 20 µl microsomalfraction of thyroid tissue. Finally, freshly prepared20 µl hydrogen peroxide (0.3 mM) was added tostart the reaction for assaying the TPO activity (OD/min/mg protein) in spectrophotometer (UV-1240Shimadzu) at 353 nm. The pooled sample wasassayed in duplicate.
Na+-K+-ATPase activity
Thyroidal Na+-K+-ATPase activity was measured bythe method of Esmann (20) with slight modificationas described by Sarkar (21). In brief, microsomalfraction of thyroid tissue homogenate was incubatedin react ion m ix tures of ( i ) 30 mM im idazolehydrochloric acid (HCl), 130 mM sodium chloride(NaCl), 20 mM potassium chloride (KCl), 4 mMmagnesium chloride (MgCl
2) and (ii) 30 mM imidazole
HCl, 4 mM MgCl2 and 1 mMouabain (Sigma Chemical
Co., USA) at pH 7.4 for 60 minutes at 0°C. Thereaction was started by addition of 4 mMTris-ATP(hydroxym ethylam ionoethane hydroch lor ideadenosine triphosphate) at 37%C and stopped with0.1 ml of 20% SDS (sodium dodecyl sulphate) after10 minutes. The inorganic phosphate (Pi) liberatedwas determined by reading the absorbance at 850nm in a UV-mini1240, Shimadzu, Japan following themethod of Baginski et al. (22). The enzyme activitywas expressed as “nmol of Pi liberated per hour permg protein” calculated from a standard curve ofpotassium dihydrogen phosphate. The pooled samplewas assayed in duplicate.
Deiodinase activity
Deiodinase (5’-DI) activity has been measuredaccording to the method of Ködding et al. (23) withslight modification. Briefly, a substrate solution of0.1 M Tris-HCl buffer (pH 7.4), 3 mM ethylenediamninetetrachloro acetic acid (EDTA) and 150 mMdithioerythritol (DTE) containing 0.4 µM T4 and100-150 µg pooled thyroid tissue protein in a final volumeof 400 µl was incubated at 37°C for 30 minutes. Themonodeiodination reaction of T4 to T3 was terminatedby the addition of 800 µl ice-cold absolute ethanol,followed by shaking for 8 minutes at 4°C. Thereactants were then centrifuged at 10,500×g at 4°Cfor 8 minutes and the ethanol supernatants werecollected for measurement of T3 content. For allsamples, values for zero time were prepared by addingthe tissue to the substrate containing T4 after theaddition of alcohol. The concentration of T3 in theethanolic extract after 0 and 30 minutes of incubationwere estimated by ELISA. The activity of 5’-DI wascalculated as the difference of the 0 and 30 minutevalues and expressed in terms of “pmoles T3 formedper mg of protein”. The pooled sample was assayedin duplicate. The validity of the method of assay hasbeen justified by the pre-incubation of the samplewith the 5’-DI inhibitor, propylthiouracil (PTU) thatresulted in >50% inhibition of the enzyme activity. Itneeds to be mentioned here that conversion of T4 torT3 by 5’-DI cannot proceed under such simulatedconditions, as rT3 formation can occur only under ahigh pH and substrate concentration, unlike T4 to T3monodeiodination, as found in our experimentalcondition.
Protein estimation
For the assay of thyroid peroxidase (TPO) activitytotal protein in thyroid tissue was estimated by themethod of Lowry et al. (24) using bovine serumalbumin (BSA) as the standard protein. The resultsof TPO activity is expressed in terms of ODchange/min/mg protein. In goitrous subjects there isincreased level of TSH, low level of T4 and normallevel of T3 in plasma (16).
ELISA of serum total thyroxine (TT4)
All the samples for measurement were preserved at

290 Chandra, Dutta, Kundu, Chakraborty, Mondal and Sarkar Indian J Physiol Pharmacol 2018; 62(3)
-20°C. Circulating TT4 level was assayed using ELISATT4 kit obtained from RFCL Limited, India [Code no.HETT 908 T4]. The sensitivity of the TT4 assay was0.4 µg/dl.
ELISA of serum total triiodothyronine (TT3)
All the samples for measurement were preserved at–20°C. Circulating TT3 level was assayed usingELISA. TT3 kit obtained from RFCL Limited, India[Code no. HETT 1028]. The sensitivity of the tT3assay was 0.04 ng/ml.
ELISA of serum thyroid stimulating hormone (TSH)
Serum samples were preserved at -20°C formeasurement of TSH. Circulating TSH level wasassayed using ELISA TSH kit obtained from PhoenixPharmaceuticals, Inc [Cat no. EK-310-01]. Thesensitivity of the TSH assay was 0.2 µIU/ml.
For assay of TT4, TT3 and TSH in serum 2.5-3 mlblood was collected from individual patient in sterilesyringe. Automated analyzers were not available inthe Institute where the study was conducted andmeasured TT4 and TT3 using ELISA for thyroidfunctional tests and not free T4 and free T3 thoughit is known that thyroid binding proteins (TBP) mightinterfere in the assessment of total thyroid hormoneprofile.
Results
The particulars of the patients along with theirdemographic details and physical nature of thegoitres have been summarised in Table I. All seven
patients were women with an average age of 33 years(range: 18-53 years). All of them belonged to thesouthern districts of West Bengal in the Gangeticp la ins , and had la rge go i t res (grade 2) a tpresentation. Goitre sizes of the patients were solarge that that these were producing mass effect tothe affected subjects and thus their glands wereremoved.
Histology of the thyroid gland
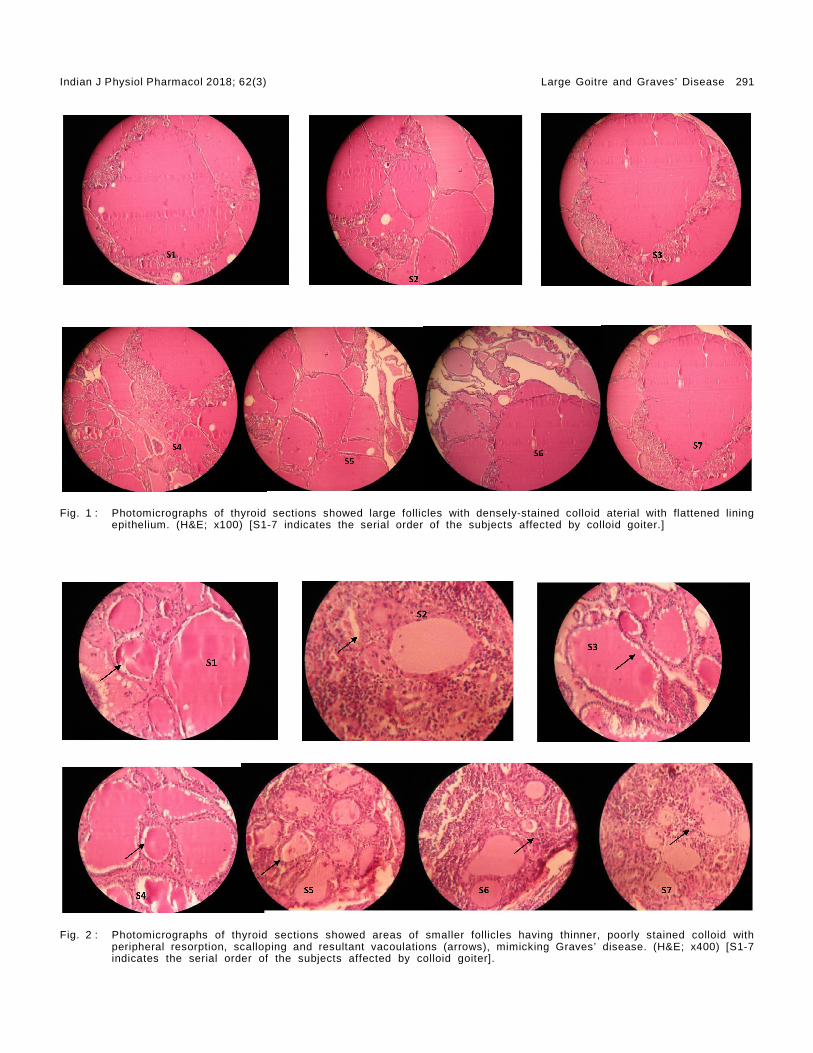
Most of the thyroid follicles were embedded withinprominent fibrous stroma and were found to be largeand distended with well-stained colloids, with almostcomplete involution. The lining epithelium wasintensely hyperplastic with flattened epithelial cellsthat comprised of tall columnar cells with prominentvesicular nuclei showing a marked tendency to formpapilliferous projections into the lumen. In lowermagnification (x100), the whole of the goitrous thyroidhad a gross histologic picture similar to that foundin colloid goitre (Fig. 1).
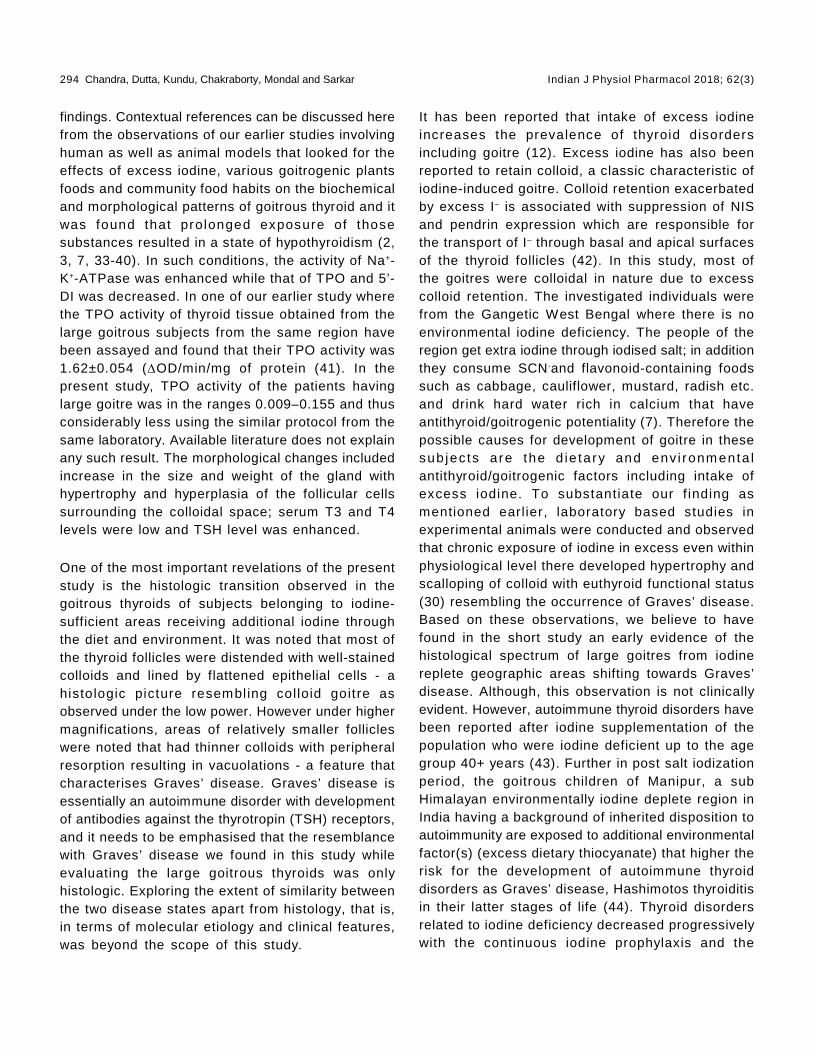
No lymphocytic proliferation was noted. However,there were areas with numerous proportionatelysmaller follicles that could be visible under highermagnification (x400) throughout the gland. Someareas of col loid within these fol l ic les stainedrelatively pale, and the portion towards the edges ofthe fo l l ic les were excessively scal loped. Thecentrifugal resorption of the colloid material resultedin peripheral vacuolations (Fig. 2). Rest of the lumenhad only strands of pale-staining secretions. Thehistologic picture comprising of aggregates of thesesmaller follicles closely resembled that of Graves’disease.
TABLE I : Baseline characteristics of subjects having large goitres.
Serial No. Age (years) Sex Domici le Physical state of the enlarged thyroid
S1 24 Female South 24-Paraganas Colloid goitreS2 25 Female South 24-Paraganas Colloid goitreS3 38 Female North 24-Paraganas Colloid goitreS4 45 Female Howrah Colloid goitreS5 24 Female PurbaMedinipur Colloid goitreS6 18 Female North 24 Paraganas Colloid goitreS7 53 Female South 24-Paraganas Nodular colloid goitre
S1-7 indicate the serial order of the subjects affected by colloid goitre.
Indian J Physiol Pharmacol 2018; 62(3) Large Goitre and Graves’ Disease 291
Fig. 2 : Photomicrographs of thyroid sections showed areas of smaller follicles having thinner, poorly stained colloid withperipheral resorption, scalloping and resultant vacoulations (arrows), mimicking Graves’ disease. (H&E; x400) [S1-7indicates the serial order of the subjects affected by colloid goiter].
Fig. 1 : Photomicrographs of thyroid sections showed large follicles with densely-stained colloid aterial with flattened liningepithelium. (H&E; x100) [S1-7 indicates the serial order of the subjects affected by colloid goiter.]

292 Chandra, Dutta, Kundu, Chakraborty, Mondal and Sarkar Indian J Physiol Pharmacol 2018; 62(3)
Thyroid hormone synthesising enzymes activit ies
It was observed that the surgically resected goitrousthyroid glands had Na+-K+-ATPase, TPO and 5’-DIactivities (Table II). To compare the effect of theseenzymes activities with normal was not possiblebecause of non-availability of control data.
Thyroid hormone profi les
In this study, all the patients affected with largegoitre were inherently euthyroid at presentation asevident by their pre-operative blood TFT level asserum TSH, TT4 and TT3 levels except one (S5) whohad raised serum TT3 (Table II). All the studiedindividuals were within their reproductive age groupand hai led f rom rura l a reas. Pr io r to the i rthyroidectomy in Medical College and Hospital,Kolkata, detai led history as a part of rout ineinvestigation regarding their food habits as well asthe use of drugs if any were obtained. The drughistory specifically included the use of contraceptivepills, and also any other medication that couldadversely affect the thyroid physiology, and it wasrevealed that none of them had such practice in thepast. However, it must be stated that estimating theestrogen level in the blood was certainly not a routinepre-operative investigation, and hence was not done.Considering the intrinsic variability of hormonal levelsin human body that is essentially physiologic, it canbe speculated that the particular woman (S5) couldhave had her estrogen level at a higher normal level,that might have caused the high serum T3 value.However, we bel ieve that this should not beconsidered as representative throughout the samplepopulation, and would in no way threaten the
interpretation we obtained in our study.Based on theobservation of the present study it is difficult toexplain the cause of high serum T3 of that patient.There are factors that can influence the molecularaffinity in thyroid homeostasis. High estrogen levellowers the affinity of thyroid binding protein (TBP) tobind with T3. Reproductive periodicity of the patient(S5) may be one such factor (25).
The normal range of T3 is 0.6-1.81 ng/ml, of T4 is4.0-11.0 µg/dl, and of TSH is 0.32-6.1 µIU/ml (Asper manufacturer’s protocol)
Discussions
The present article has attempted to explore theeffects of excess iodine from food (including edibleiodised salt) and water on the thyroid physiology ina region where there is no dearth of environmentaliodine as evident from our earlier studies (2, 3), interms of histologic changes and activities of theintrinsic thyroid enzymes. All the studied subjectshad large goitre were from the same rural geographicregion having low-socioeconomic status and theiriodine consumption was adequate. North and South24-Parganas districts are mostly rural, located inthe coastal belt of Gangetic West Bengal, accountfor the major populous distr ic ts in the state.Agriculture is the main profession of the rural peoplehowever they are also engaged in other activitiesl ike f ishing, carpentry and in var ious jobs inunorganized sectors. Both the districts have similarsex ratio and literacy rate. The women in the ruralareas are mostly engaged in their household workand they also helped their families in the agricultural
TABLE II : Thyroid hormone profiles and the activity status of thyroidhormone-synthesising enzymes (Na+-K+-ATPase, TPO, 5’-DI)
Serial T3 T4 TSH TPO activity 5’-DI activity Na+-K+-ATPase activityNo. (ng/ml) (µg/dl) (µIU/ml) (OD/min/mg protein) (pmolT3/ng protein) (µmol Pi/hr/mg protein)
S1 1.700 5.850 0.890 0.037 0.506 0.80029S2 1.400 4.910 1.020 0.033 1.006 0.6200S3 1.710 6.650 0.950 0.020 0.467 1.1966S4 1.800 9.420 1.300 0.009 2.500 1.795S5 2.720 7.630 1.070 0.023 1.119 1.43S6 0.970 9.580 1.360 0.056 0.756 1.338S7 1.230 8.910 1.060 0.155 1.483 1.2673
S1-7indicatethe serial order of the subjects affected by colloid goitre.

Indian J Physiol Pharmacol 2018; 62(3) Large Goitre and Graves’ Disease 293
activities. They are mostly literate and belong to lowsocio-economic group. The intake of iodine of thepeople in the region is adequate however endemicgoitre among the school children found prevalent (2,3, 26). The urinary iodine excretions of those patientshave not been assayed because they visited thehospital in different time during the study period 2014-2015. Further there is no significance to measureurinary iodine excretion of individual subject as thesame vary from day to day, and within a given day.However such variation tends to even out amongpopulation (18). Chromatographic studies have shownthat most of the intra-thyroidal iodine in large goitrespresent as iodotyrosines. There is an increase ofmonoiodotyrosine (MIT) percentage and a reductionof diiodotyrosine (DIT) and principally of the T4fractions. Most of the iodine stores seem to besequestered into poorly iodinated tyrosine that failsto take part in iodothyronine synthesis (27). Reducedcapacity of synthesis and secretion of thyroidhormones in large goitres is evidenced when theserum concentrations of TT4 and fT4 are significantlyreduced and TSH level increased in both goitrousand non-goitrous subjects from severely goitre-endemic areas (28). However in the presentinvestigation, the TT3, TT4 and TSH levels of allsubjects were within normal range. The patients weretested for thyroid functions (only TT4 / TT3 and TSH)once only in the pre-operative period (except for thoserare patients who were found to have deranged TFT),and these patients had no previous lab data. This isbecause that a large goitre takes years, evendecades to develop. Due to the low-socioeconomiccondition and poor health awareness in the rurala reas, m os t o f the sub jects cont inue wi thprogressively enlarging thyroid for years, and seekmedical advice only when it starts causing masseffects. So the routine hospital visits are not theconventional practice, and when they do visit, thesubsequent surgical work-up includes a one-timeTFT. All the patients in this study with large goitrewere euthyroid only came to the notice of theinvestigators when they were tested for TFT. TFTwhich is mandatory for all individual who wouldundergo any thyroid surgery. Except enlargement ofthe thyroid gland, most specific features for hypo-and hyper thyroidism including any eye signs werenot observed. If it was found that their serum T4, T3
and TSH levels were not in normal range (i.e.euthyroid) they were provided proper medicalt rea tm ent to m ake them euthyro id which isconsidered mandatory for surgery. In these patientsonly follow-up TFT was done at repeated intervalsuntil it comes within normal range. The euthyroidstate of all the large goitrous subjects would beexplained on the fact that their large thyroid sizewas not for iodine deficiency but for the intake ofiodine in excess within physiological level where TT3,TT4 and TSH levels remain normal (29) but theiroccurred hypertrophy and scalloping of the colloidas observed in experimental animals (30).
The activities of the thyroid hormone-synthesisingenzymes were measured from the surgical specimensavailable, and it was observed that the large goitrousthyroids showed activities for Na+-K+-ATPase thatactively transport iodide (I–) into the thyroid glandwhich is a crucial and rate-limiting step in thebiosynthesis of thyroid hormones and plays animportant role in the metabol ism, growth andmaturation of a variety of organ systems (31). Na+/I– symporter (NIS) is a key plasma membrane proteinthat catalyses the active accumulation of I– in thethyroid gland; it co-transports two Na+ along withone I– ion, with the transmembrane Na+ gradientserving as the driving force for I– uptake. The sodiumgradient, providing the energy for this transfer, isgenerated by the ouabain-sensitive Na+-K+-ATPase;TPO which is a heme-containing enzyme, is foundin the apical membrane of thyroid follicular cells thatcatalyses the biosynthesis of thyroid hormones, i.e.,oxidation of inorganic iodide (I–) to reactive iodine forbinding iodine to tyrosyl residues in thyroglobulin(19); iodothyronine 5-deiodinase type I (5’-DI) is am em ber of a group o f seleno-enzym es tha tmetabolise thyroid hormones and thus modulate theiractions. 5’-DI is predominantly found in liver, kidneyand thyroid and is responsible for generating mostof the circulat ing T3. 5’-DI can catalyse bothactivation of T4 by outer-ring deiodination andinactivation of T4 by inner-ring deiodination to producerT3 ( 32). However, due to non-availability of controlvalues it is difficult to indicate whether their activitystatuses in vitro as observed from the surgicalspecimens were within normal ranges, or to assignany physiologic and/or clinical significance to these
294 Chandra, Dutta, Kundu, Chakraborty, Mondal and Sarkar Indian J Physiol Pharmacol 2018; 62(3)
findings. Contextual references can be discussed herefrom the observations of our earlier studies involvinghuman as well as animal models that looked for theeffects of excess iodine, various goitrogenic plantsfoods and community food habits on the biochemicaland morphological patterns of goitrous thyroid and itwas found that prolonged exposure of thosesubstances resulted in a state of hypothyroidism (2,3, 7, 33-40). In such conditions, the activity of Na+-K+-ATPase was enhanced while that of TPO and 5’-DI was decreased. In one of our earlier study wherethe TPO activity of thyroid tissue obtained from thelarge goitrous subjects from the same region havebeen assayed and found that their TPO activity was1.62±0.054 (OD/min/mg of protein (41). In thepresent study, TPO activity of the patients havinglarge goitre was in the ranges 0.009–0.155 and thusconsiderably less using the similar protocol from thesame laboratory. Available literature does not explainany such result. The morphological changes includedincrease in the size and weight of the gland withhypertrophy and hyperplasia of the follicular cellssurrounding the colloidal space; serum T3 and T4levels were low and TSH level was enhanced.
One of the most important revelations of the presentstudy is the histologic transition observed in thegoitrous thyroids of subjects belonging to iodine-sufficient areas receiving additional iodine throughthe diet and environment. It was noted that most ofthe thyroid follicles were distended with well-stainedcolloids and lined by flattened epithelial cells - ahistologic picture resembling colloid goitre asobserved under the low power. However under highermagnifications, areas of relatively smaller follicleswere noted that had thinner colloids with peripheralresorption resulting in vacuolations - a feature thatcharacterises Graves’ disease. Graves’ disease isessentially an autoimmune disorder with developmentof antibodies against the thyrotropin (TSH) receptors,and it needs to be emphasised that the resemblancewith Graves’ disease we found in this study whileevaluating the large goitrous thyroids was onlyhistologic. Exploring the extent of similarity betweenthe two disease states apart from histology, that is,in terms of molecular etiology and clinical features,was beyond the scope of this study.
It has been reported that intake of excess iodineincreases the prevalence of thyroid disordersincluding goitre (12). Excess iodine has also beenreported to retain colloid, a classic characteristic ofiodine-induced goitre. Colloid retention exacerbatedby excess I– is associated with suppression of NISand pendrin expression which are responsible forthe transport of I– through basal and apical surfacesof the thyroid follicles (42). In this study, most ofthe goitres were colloidal in nature due to excesscolloid retention. The investigated individuals werefrom the Gangetic West Bengal where there is noenvironmental iodine deficiency. The people of theregion get extra iodine through iodised salt; in additionthey consume SCN-and flavonoid-containing foodssuch as cabbage, cauliflower, mustard, radish etc.and drink hard water rich in calcium that haveantithyroid/goitrogenic potentiality (7). Therefore thepossible causes for development of goitre in thesesub jects are the d ie tary and env i ronm enta lantithyroid/goitrogenic factors including intake ofexcess iodine. To substantiate our f inding asmentioned earlier, laboratory based studies inexperimental animals were conducted and observedthat chronic exposure of iodine in excess even withinphysiological level there developed hypertrophy andscalloping of colloid with euthyroid functional status(30) resembling the occurrence of Graves’ disease.Based on these observations, we believe to havefound in the short study an early evidence of thehistological spectrum of large goitres from iodinereplete geographic areas shifting towards Graves’disease. Although, this observation is not clinicallyevident. However, autoimmune thyroid disorders havebeen reported after iodine supplementation of thepopulation who were iodine deficient up to the agegroup 40+ years (43). Further in post salt iodizationperiod, the goitrous children of Manipur, a subHimalayan environmentally iodine deplete region inIndia having a background of inherited disposition toautoimmunity are exposed to additional environmentalfactor(s) (excess dietary thiocyanate) that higher therisk for the development of autoimmune thyroiddisorders as Graves’ disease, Hashimotos thyroiditisin their latter stages of life (44). Thyroid disordersrelated to iodine deficiency decreased progressivelywith the continuous iodine prophylaxis and the

Indian J Physiol Pharmacol 2018; 62(3) Large Goitre and Graves’ Disease 295
increased iodine intake. An adverse effect resultingfrom iodine prophylaxis may be induction of thyroidautoimmunity. Experiments performed in animalmodels suggest that iodine cou ld in i t ia te orexacerbate thyroid autoimmunity; the role of iodinein humans remains controversial (45).
Limitations of the study
The study examined the surgically resected thyroidspecimens from seven patients who underwentthyroidectomy in a tertiary-level teaching hospital. Astronger and more extensive l iaison with theconcerned department and also involving the othermedical colleges of the city, and extending the periodof sample collection to a period greater than a yearcould have fetched us with more samples. However,we intended to observe the initial trend in thebehaviour of large goitrous thyroids of subjectsbelonging to the iodine-sufficient areas with intakeof excess iodine. Nevertheless, our findings need tobe validated through a larger study with greatersample size. Another major drawback of the presenteffort is the lack of control that precluded us tocomment on the nature of the activities of Na+-K+-ATPase, TPO and 5’-DI in the resected thyroidspecimens. To some extent, feasibility of suchcomparisons would be beyond the scope of thisstudy. For an effective interpretation of the enzymeactivities, the study model needs to be a case-controlone, where ultrasonography-guided fine needleaspiration biopsy from non-goitrous thyroids ofsubjects belonging to the same geographic areas as
that of the cases (patients with large goitrousthyroids in the Gangetic West Bengal) would serveas the specimen sample from the controls.
Conclusions
The study has dealt with surgically resected thyroidtissues from women having large goitres andbelonging to the Gangetic West Bengal where thereis no environmental iodine deficiency. Regular intakeof relatively excess iodine through food, water andiodised salt as well as consumption of goitrogenicfoods were perhaps responsible for the developmentof goitre in these patient cohorts. The TT3, TT4 andTSH levels in the pre-operative period were withinnormal range. The in-vitro Na+-K+-ATPase, TPO and5’-DI activities were measured and showed that thegoitrous thyroid tissues possessed the capacity forsynthesis of thyroid hormones. All the goitres werecolloid in nature as evidenced by their excessivecolloid retention. However, there were areas withsmaller follicles that had peripheral vacuolations dueto resorption and scalloping of thinner and poorly-stained colloid matter. The histologic picture insections of such large goitrous thyroids showedevidence of Graves’ disease, indicating a possibleshift in the clinico-pathologic presentation of subjectswith goitre inhabiting iodine-sufficient areas andexposed to excess iodine - a preliminary observationthat needs to be corroborated in future studies oflarger scale. The observations of this study are basedon regional findings but have important impact inpost salt iodisation scenario.
References
1. Hetzel BS. Iodine deficiency disorders (IDD) and theireradication. Lancet 1983; 2: 1126-1129. https://doi.org/10.1016/S0140-6736(83)90636-0, PMID: 6138653
2. Chandra AK , T r i pa thy S , Ghos h D, Debnath A ,Mukhopadhyay S. Goitre Prevalence and the state ofiodine nutrition in Sundarban delta of North 24- Parganasin West Bengal. Asia Pac J Clin Nutr 2006; 15: 357–361.PMID: 16837428
3. Chandra AK , T r i pa thy S , Ghos h D, Debnath A ,Mukhopadhyay S. Iodine nutritional status & prevalenceof goitre in Sundarban delta of South 24-Parganas, WestBengal. Indian J Med Res 2005; 122: 419–424. PMID:16456256
4. WHO/UNICEF/ICCIDD. Indicators for assessing IDD andtheir control through salt iodization, WHO/NUT/94.6,1994
5. WHO/UNICEF/ICCIDD. Methods for measuring iodine in urine.Wageningen: International Council for the Control of IodineDeficiency Disorders; 1993.
6. Chandra AK , T r i pa thy S , Debnath A , Ghos h D.Bioavailability of iodine and hardness (magnesium andcalcium salt) in drinking water in the etiology of endemicgoitre in Sundarban delta of West Bengal (India). Journalof Environ Scie & Engin 2007; 49(2): 139–142.
7. Zeltser ME, Aldarkhanov BA, Berezhnaya IM, SpernaskyGG, Bazarbek ova RB, Nurbekova AA , Lev ina SA,Mandrovnaya NV, Aripova AA. Iodine deficiency and itsclinical manifestation in Kazakhastan. IDD Newsletter1992: 8(1): 5–6.
8. Delange F. The disorders induced by iodine deficiency.Thyroid 1994; 4: 107–128. PMID: 8054857

296 Chandra, Dutta, Kundu, Chakraborty, Mondal and Sarkar Indian J Physiol Pharmacol 2018; 62(3)
9. Chandra AK, Goswami H, Sengupta P. Dietary calciuminduced cytological and biochemical changes in thyroid.Environ Tox icol Pharmacol 2012; 34: 454-465. doi :10.3389/fendo.2013.00174. PMCID: PMC3826086
10. Gaitan E, Medina P, DeRouen TA, Sun Zia M. Goiterprevalence and bacterial contamination of water supplies.J Cl in Endocrinol Metab 1980; 51: 957–961. PMID:6999009 DOI: 10.1210/jcem-51-5-957
11. Knobel M. Etiopathology, clinical features, and treatmentof diffuse and multinodular nontoxic goiters. J EndocrinolInvest 2016; 39: 357–373.
12. Camargo RY, Tomimori EK, Neves SC, G S Rubio I, GalrãoL, Knobel M, et al. Thyroid and the environment: exposureto excessive nutritional iodine increases the prevalenceof thyroid disorders in Sao Paulo, Brazil. Eur J Endocrinol2008; 159: 293–299. PMID: 18586897 DOI: 10.1530/EJE-08-0192
13. Choufoer, JC, Rhijn Van M, Kassenaar AAH, Querido A.Endemic goiter in Western New Guinea: Iodine metabolismin goitrous and nongoitrous subjects. J Clin EndocrinolMetab 1963; 23: 1203–1217. PMID: 14087600 DOI:10.1210/jcem-23-12-1203
14. Delange F, Hershman JM, Ermans AM. Relat ionshipbetween the serum thyrotropin level, the prevalence ofgoiter and the pattern of iodine metabolism in Idjwiisland.J Clin Endocrinol Metab 1971; 33: 261–268.
15. Denef JF, Ovaert C, Many MC. Experimental goitrogenesis[article in French]. Ann Endocrinol (Paris) 1989; 50: 1–15. PMID:2658730
16. Delange F, Bourdoux P, Laurence M, et al. Neonatal thyroidfunction in iodine deficiency. In: Delange F, Dunn JT,Glinoer D, eds. Iodine deficiency in Europe.A continuingconcern. New York: Plenum Press, 1993; 199–210.
17. Patel YC, Pharoah PO, Hornabrook RW, Hetzel BS.Serum triiodothyronine, thyroxine and thyroid-stimulatinghormone in endemic goiter: a comparison of goitrous andnongoitrous subjects in New Guinea. J Clin EndocrinolMetab 1973; 37: 783-789. PMID:4749452.DOI:10.1210/jcem-37-5-783
18. WHO/UNICEF/ICCIDD. Assessment of iodine deficiencydisorders and monitoring their elimination: a guide forprogramme managers. 3rd ed. Geneva, Switzerland: WorldHealth Organization 2007.
19. Alexander NM. A spectrophotometric assay for iodideoxidation by thyroid peroxidase. Anal Biochem 1962; 4:341–345. PMID: 14011968.
20. Esmann M. Precipitation of solubilized Na+/K+-ATPase bydivalent cations. Biochim Biophys Acta 1988; 940: 71–76.PMID: 2835103.
21. Sarkar PK. A quick assay for Na+-K+-ATPase specificac t iv i ty. Z Naturforsch C 2002; 57:562-564. PMID:12132703.
22. Baginski ES, Foà PP, Zak B. Determination of phosphate:study of a labile organic phosphate interference. ClinChim Acta 1967; 15: 155–158.
23. Ködding R, Fuhrmann H, von zurMühlen A. Investigationson iodothyronine deiodinase activity in the maturing ratbrain. Endocr inology 1986; 118: 1347–1352. PMID:3948784 DOI: 10.1210/endo-118-4-1347.
24. Lowry OH, Rosebrough NJ, Farr AL, Randall RJ. Proteinmeasurement with the Folin phenol reagent. J Biol Chem1951; 193: 265–275. PMID: 14907713.
25. Ain KB, Refetof f S, Sarne DH, Murata Y. Effect ofestrogen on the synthesis and secretion of thyroxine-binding globulin by a human hepatoma cell line, Hep G2.Mol Endocrinol 1988; 2: 313-323. PMID: 2837662 DOI:10.1210/mend-2-4-313.
26. Chandra AK, Debnath A, Tripathy S. Iodine nutrit ionalstatus among school children in selected areas of Howrahdistrict in West Bengal, India. J Trop Pediatr 2008; 54:54-57. PMID: 18003667 DOI: 10.1093/tropej/fmm063.
27. Dumont JE, Ermans AM, Bastenie PA. Thyroid function ina goiter endemic. Mechanism of thyroid failure in the Ueleendemic cretins. J Clin Endocrinol Metab 1963; 23: 847–860. PMID: 14064130 DOI: 10.1210/jcem-23-9-847.
28. Bourdoux P , Ermans A . Thyro t rop ic regu la t ion bycirculating thyroxine in endemic goiter. Endocrinology1982; 111: 6.
29. Bürgi H. Iodine excess. Best Pract Res Clin EndocrinolMetab 2010; 24: 107-115. PMID: 20172475 DOI: 10.1016/j.beem.2009.08.010.
30. Mandal J, Chakraborty A, Chandra AK. Altered Acetylcholinesterase and Na+-K+ATPase activities in differentareas of brain in relation to thyroid gland function andmorphology under the influence of excess iodine. Int JPharm Clin Res 2016; 8: 1564–1573.
31. Carrasco N. Iodide transport in the thyroid gland. BiochimBiophys Acta 1993; 1154: 65–82. PMID: 8507647.
32. Köhrle J. Local act ivat ion and inactivation of thyroidhormones: the deiodinase family. Mol Cell Endocrinol1999; 151: 103–119. PMID: 10411325.
33. Chandra AK, Mondal C, Sinha S, Chakraborty A, PearceEN. Synergic actions of polyphenols and cyanogens ofpeanut seed coat (Arachis hypogaea) on cytological,biochemical and functional changes in thyroid. Indian JExp Biol 2015; 53: 143–151.
34. Chandra AK, De N. Catechin induced modulation in theactivities of thyroid hormone synthesizing enzymes leadingto hypothyroidism. Mol Cell Biochem 2013; 374: 37-48.PMID: 23117228 DOI: 10.1007/s11010-012-1503-8.
35. Chandra AK, De N, Choudhury SR. Effect of differentdoses of un-fractionated green and black tea extracts onthyroid physiology. Hum Exp Toxicol 2011; 30: 884-896.PMID: 20801949 DOI: 10.1177/0960327110382563.
36. Chandra AK, De N. Goitrogenic/antithyroidal potential ofgreen tea extract in relation to catechin in rats. FoodChem Toxicol 2010; 48: 2304-2311. PMID: 20561943 DOI:10.1016/j.fct.2010.05.064.
37. Chandra AK, Ghosh D, Tripathy S. Effect of maize (Zeamays) on thyroid status under conditions of varying iodineintake in rats. J Endocrinol Reprod 2009; 13: 17–26.
38. Chandra AK, Mukhopadhyay S, Ghosh D, Tripathy S. Effectof radish (Raphanus sativus Linn.) on thyroid status underconditions of varying iodine intake in rats. Indian J ExpBiol 2006; 44: 653-661. PMID: 16924836.
39. Chandra AK, Ghosh D, Mukhopadhyay S, Tripathy S. Effectof cassava (Manihot Esculenta Crentz) on thyroid statusunder conditions of varying iodine intake in rats. Afr JTradit Complement Altern Med 2006; 3: 87–99.
40. Chandra AK, Singh LH, Ghosh S. Pearce EN. Role ofbamboo-shoot in the pathogenesis of endemic goiter inManipur, north east India .Endocr Prac 2013; 19: 36–45.PMID: 23186959 DOI: 10.4158/EP12162.OR.

Indian J Physiol Pharmacol 2018; 62(3) Large Goitre and Graves’ Disease 297
41. Chandra AK, Mukhopadhyay S, Lahari D and Tripathy S.Goitrogenic content of Indian cyanogenic plant foods &their in vitro anti-thyroidal activity. Indian J Med Res2004; 119: 180–185. PMID: 15218979
42. Chen XY, Lin CH, Yang LH, Li WG, Zhang JW, ZhengWW, Wang X, Qian J, Huang JL, Lei YX. The effect onsodium/iodide symporter and pendrin in thyroid colloidretention developed by excess iodide intake. Biol TraceElem Res 2016; 172: 193–200. PMID: 26660892 DOI:10.1007/s12011-015-0580-4.
43. Leung AM, Braverman LE. Consequences of excess
iodine. Nat Rev Endocrinol 2014; 10: 136–142. PMID:24342882 PMCID: PMC3976240 DOI : 10 .1038/nrendo.2013.251.
44. Chandra AK, S ingh LH. S tud ies on t he Poss ib leOccurrence of Autoimmune Thyroid Disorders in GoitrousChildren of Manipur in North-East India. Ind J PhysiolAllied Sci 2012; 66: 51–57.
45. Papanastasiou L, Vatalas IA, Koutras DA, Mastorakos G:Thyroid autoimmunity in the current iodine environment.Thyroid 2007; 17: 729–739. PMID: 17725430 DOI: 10.1089/thy.2006.0299.

298 Vallish, Priyan, Mohan, Mahato and Brahadeesh Indian J Physiol Pharmacol 2018; 62(3)
Original Article
Prevalence of Cardiovascular Risk Factors in Engineering andMedical Students in Madurai, Tamil Nadu
B. N. Vallish1*, N. Shreedher Priyan2, J. Mohan1, Raj Kishore Mahato1
and M. Brahadeesh3
1Department of Pharmacology,2Velammal Medical College Hospital & Research Institute,Anuppanadi, Madurai – 625009. TN, India
3Department of Pharmacology,Govt. Thoothukudi Medical College,Thoothukudi – 628 008
Abstract
Background : Cardiovascular risk factors are increasingly seen in college-going student population in India
Objectives: To estimate the prevalence of cardiovascular risk factors in medical and engineering students,and to examine gender-wise and stream-wise risk factor distribution
Methods: Consenting students (N=200; 100 medical and 100 engineering students, 50 males and 50 femaleswithin each stream) were administered a validated, structured questionnaire to capture data about age,family history and physical activity. Physical examination was done to determine BP, height, weight, waistcircumference (WC) and hip circumference. Indian cut-offs were used for BMI (body mass index), WC, andWHR (waist-hip ratio) categories. Chi-square test and Fischer’s exact tests were used to analyze significance.
Results: Mean age of participants was 18.57±0.78 years. Overweight and obese BMI was observed in 31%students (29% engineering, 33% medical, 31% male and 31% female students). Number of participantsclassified under high-risk WC category was significantly higher in engineering stream (38 engineering vs 18medical students, p=0.001) and female students (38 female vs 18 male students, p=0.001). Hypertensionwas significantly more prevalent in engineering stream (15 engineering vs 6 medical students, p=0.031) andmale students (18 male vs 3 female students, p<0.001). Significantly more female students had inadequatephysical activity (82 female vs 50 male students; p<0.001).
Conclusions: Proper education about cardiovascular risk factors and lifestyle modification is essential forreducing and postponing the development of cardiovascular diseases in this population. Further studies withlarger population and inclusion of more risk factors are essential.
Indian J Physiol Pharmacol 2018; 62(3) : 298–305
*Corresponding author :
Dr. B N Vallish, Associate Professor, Department of Pharmacology,Velammal Medical College Hospital & Research Institute,Anuppanadi, Madurai – 625009. TN, India
(Received on January 1, 2018)
Introduction
W orldwide, approximately 17.7 mil l ion peopleworldwide died from cardiovascular diseases (CVDs)

Indian J Physiol Pharmacol 2018; 62(3) CV Risk Factors in Engg & Medical Students 299
Materials and Methods
This cross-sect ional, observat ional study wasconducted between April and July 2015, and involvedadministering a validated and structured questionnairecontaining questions (both objective and open-ended,the former being more) that cater to the objectivesof the study to consenting medical and engineeringstudents in Madurai, TN aged 18-24 years. Samplesize included 100 medical and 100 engineeringstudents; within each stream, 50 male and 50 femalestudents were recruited in the study.
After obtaining ethics committee clearance whichworked in accordance with the Helsinki Declarationof 1975, as revised in 2000, permission was alsoobtained from the relevant college authorities. A listof all students attending respective courses wasobtained. Using a random number generator table inMS excel, 50 male and 50 female students aged 18-24 years within each stream were selected. Thesestudents were briefly explained about the study andinformed consent was obtained. The questionnairewas given to these students, and subsequentlyphysical examination was performed. Variablesmeasured included sitting BP, height, weight, waistand hip circumference; variables derived includedbody mass index (BMI) and waist-hip ratio (WHR).For measuring physical activity, the WHO GlobalPhysical Activity Questionnaire (GPAQ) was used,with suitable modifications (11).
He ight was m easured us ing a s tadiom eter(indosurgicals) to the nearest 0.5 cm, and weightwas measured by a standard weighing machine (GVCVirgo Fitness Weighing Scale), to the nearest 0.5kg, with the student having removed his/her footwearfor both measurements. BMI was calculated bydividing weight (kg) by square of height (m). Waistcircumference was measured using a non-stretchabletape, to the nearest 0.1 cm, at the midpointbetween tip of iliac crest and last costal margin inthe back, and at umbilicus in the front, at the endof normal expiration, with subject standing erectin a relaxed position. BP was measured as perthe JNC-7 recommendations, using a mercurysphygmomanometer (Diamond) by applying the cuff
in 2015 (31% of all global deaths) according to theWorld Health Organization (WHO); among these, 7.4million were due to coronary heart disease (CHD).Almost 75% of deaths due to CVDs take place inlow- and middle-income countries. The major riskfactors of CVD include tobacco use, unhealthy dietand obesity, physical inactivity and harmful use ofalcohol, hypertension, diabetes and hyperlipidemia(1).
Even in India, CVDs have been the leading cause ofmorbidity and mortality (2). It has been reported thatthe prevalence of CVDs is rising in India (3). Further,the prevalence of many cardiovascular risk factorssuch as d iabetes mel l i tus , hyper tens ion anddyslipidemia has markedly increased in India in thepast 30 years (4).
Recent studies indicate a dangerous trend that thedisease has started to affect younger individuals aswell. A high prevalence of cardiovascular risk factorssuch as obesity, hypertension, and low physicalactivities has been observed among the college-goingstudent population in countries such as Poland, USA,and Greece (5-7). Studies have shown that CVDsaffecting people in developing countries have earlierage of onset and greater mortality (8). It has beenrepeatedly reported that CVDs manifest at least adecade earlier in South Asians when compared topeople in the Western World (9, 10). In addition,various CVD risk factors also start early in childhoodand youth and these risk factors magnify with age(8). Due to the unhealthy lifestyle of the youngerpopulation, various CVD risk factors are increasinglyseen in young college going student population ofour country.
Preventive and interventional strategies to haltthis dangerous progression are the need of the hour.As a first step, the prevalence of various CVDrisk factors should be known. There is a dearth ofstudies which estimate the prevalence of variouscardiovascular r isk fac tors (such as obesi ty,hypertension, smoking, family history and inactivity)in m edica l and engineer ing s tudents in th isgeographical region, which prompted us to undertakethis study.

300 Vallish, Priyan, Mohan, Mahato and Brahadeesh Indian J Physiol Pharmacol 2018; 62(3)
on the right arm, with the student in sitting positionafter five minutes of rest. BP was measured threetimes with an interval of 30 seconds, and the averageof the three measurements was used in analysis(12).
For the purpose of this study, the definition of BMIselected was <18.0 kg/m2: underweight; 18.0-22.9kg/m2: normal; 23.0-24.9 kg/m2: overweight; 25 kg/m2: obese (13). The cut-offs selected for waistcircumference (WC) was 85 cm for men and 80cm for women as having low risk, and for waist-hipratio (WHR) was 0.89 for men and 0.81 for womenas having low risk (14). The JNC-7 classification ofhypertension was used to determine cut-offs forhypertension (systolic blood pressure (SBP) 140mmHg and/or diastolic blood pressure (DBP) 90mmHg) (12). For analysing the physical activity, theWHO GPAQ analysis guidelines were used. Thephysical, recreational and sports activities wereclassified as ‘vigorous’ and ‘moderate’ based on theelevation of heart rate they produced according tothe students, and details of the minutes per week inwhich the student was involved in such activitieswas collected. Information about whether the studentwalked or used a bicycle for at least 10 minutes aday was collected under ‘transport’ activities. Thetotal weekly duration (in minutes) of ‘vigorous’activities was multiplied by 8, and the total weeklyduration (in minutes) of ‘moderate’ and ‘transport’activities was multiplied by 4 to obtain the final MET(metabolic equivalent) score of the student. A MET
score <600 was considered to be inadequate physicalactivity (11).
All data was electronically recorded. Chi-square testand Fischer’s exact test were used to analyzesignificance between various groups of participantsbelonging to different stream of study and gender.Statistical software used was SPSS version 22.0.Values were expressed as Mean±SD, and p value<0.05 was considered as significant for all the testsapplied.
Results
The mean age of the participants was 18.57±0.787years (range 17-21 years; median age = 18 years).The anthropometric data is summarised in Table I.Significantly more engineering students than medicalstudents belonged to high WC risk category andhad hypertension, and significantly more femalestudents than male students belonged to high riskWC and WHR categories, and had hypertension(p<0.05 in all cases). None of the students withhypertension were on any treatment for the same.Physical inactivity was similar between medical andengineering students, but was significantly higher infemale students than males (p<0.001).
Family history of CV risk factors:
More medical students reported family history of
TABLE I : Anthropometric values and their comparison between engineeringand medical students, and between male and female students.
Total Engineering Medical P Male Female PRisk factor (n=200) students students value students students value
(%) (n=100) (%) (n=100) (%) (n=100) (%) (n=100) (%)
Obese BMI 30 (15%) 15 (15%) 15 (15%) 15 (15%) 15 (15%)Overweight BMI 32 (16%) 14 (14%) 18 (18%) 0.182 16 (16%) 16 (16%) 0.338Normal BMI 107 (53.5%) 50 (50%) 57 (57%) 49 (49%) 58 (58%)High risk WC (>85 cm for men, 56 (28%) 38 (38%) 18 (18%) 0.001 18 (18%) 38 (38%) 0.001>80 cm for women)High risk WHR (>0.89 for men, 180 (90%) 91 (91%) 89 (89%) 0.407 84 (84%) 96 (96%) 0.004>0.81 for women)Hypertension 21 (10.5%) 15 (15%) 6 (6%) 0.031 18 (18%) 3 (3%) <0.001Physical inactivity 132 (66%) 64 (64%) 68 (68%) 0.327 50 (50%) 82 (82%) <0.001(<600 MET score)
Note: WC: waist circumference; WHR: waist-hip ratio; MET: metabolic equivalent

Indian J Physiol Pharmacol 2018; 62(3) CV Risk Factors in Engg & Medical Students 301
hypertension (28/42, 66.67%), type 2 diabetes (47/73, 64.38%), and obesity (14/17, 82.35%) thanengineering students; all three were significantlyhigher than those in engineering students (p=0.012,0.02 and 0.05 respectively). However, a significantdifference was not obtained in family history of ‘anycardiac disease’ (Fig. 1). There was no statisticallysignificant difference in the distribution of familyhistory of CV risk factors between male and femaleparticipants.
Smoking and passive smoking:
Only one participant gave history of smoking, andonly two participants (one each in medical andengineering streams, and one each in either gender)admitted to being affected by passive smoking. Noneof these values was statistically significant.
Subgroup analyses:
We analysed the distribution of risk factors among
subgroups of par t ic ipants , namely: (a) m aleengineer ing students ; (b) female engineer ingstudents; (c) male medical students; and (d) femalemedical students. We excluded smoking and passivesmoking from subgroup analyses due to less numberof responses. The significant results are explainedbelow:
1. BMI : There was no significant difference in thedistribution of BMI categories between medicaland engineering students, or between male andfemale students.
2. Waist Circumference : More female engineeringstudents were classified under the high risk waistcircumference category than other subgroups(Fig. 2).
3. Waist-Hip Ratio : When WHR was taken forclassifying participants under risk categories, 180out of 200 participants were classified as havinga higher CV risk. Females were at a higher risk
Fig. 1 : Family history of cardiovascular risk among medical and engineering students.
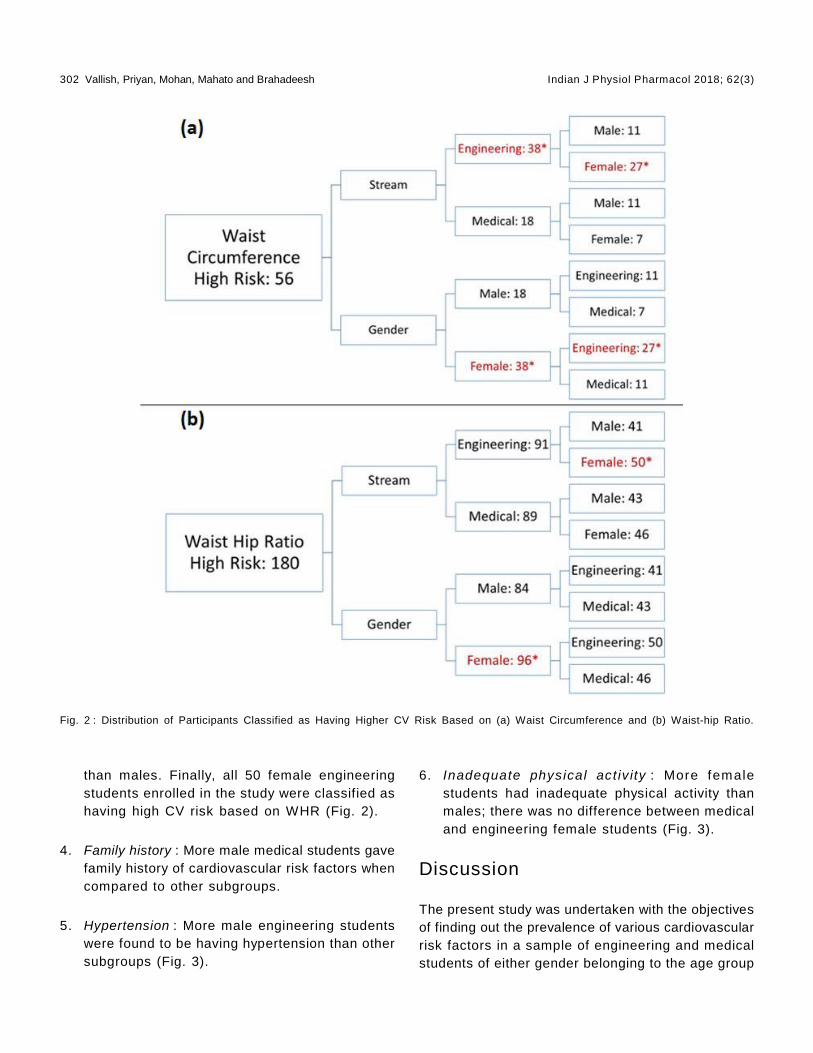
302 Vallish, Priyan, Mohan, Mahato and Brahadeesh Indian J Physiol Pharmacol 2018; 62(3)
than males. Finally, all 50 female engineeringstudents enrolled in the study were classified ashaving high CV risk based on WHR (Fig. 2).
4. Family history : More male medical students gavefamily history of cardiovascular risk factors whencompared to other subgroups.
5. Hypertension : More male engineering studentswere found to be having hypertension than othersubgroups (Fig. 3).
6. Inadequate physical act iv ity : More femalestudents had inadequate physical activity thanmales; there was no difference between medicaland engineering female students (Fig. 3).
Discussion
The present study was undertaken with the objectivesof finding out the prevalence of various cardiovascularrisk factors in a sample of engineering and medicalstudents of either gender belonging to the age group
Fig. 2 : Distribution of Participants Classified as Having Higher CV Risk Based on (a) Waist Circumference and (b) Waist-hip Ratio.

Indian J Physiol Pharmacol 2018; 62(3) CV Risk Factors in Engg & Medical Students 303
of 18-24 years in the city of Madurai. A total of 200consenting apparently healthy students (100 medical,100 engineering; 50 males and 50 females withineach stream) were involved in the study. Thoughsome studies in the past have evaluated theprevalence of CV risk factors in medical students invarious regions of India, to our best knowledge nostudy published till date has evaluated the prevalenceof CV risk factors in engineering students in India,and in medical students in this region.
We found that 32% of participants (29% engineeringstudents, 33% medical students, 31% male students
Fig. 3 : Distribution of Participants with (a) Hypertension and (b) inadequate physical activity.
and 31% female students) had BMI of more than 23.There was no statistically significant difference inthe distribution of BMI categories between studentsbelonging to different streams of study or differentgenders . In contras t , a s tudy repor ted f romKerala had found that signif icantly more malemedical students were having a BMI of more than 25(15).
We also found that more female students, and moreengineering students were classified under the highrisk waist circumference category. In comparison,the study by Kurian S et al also reported that more

304 Vallish, Priyan, Mohan, Mahato and Brahadeesh Indian J Physiol Pharmacol 2018; 62(3)
female medical students belonged to a higher WCrisk category (15).
When WHR was taken as the parameter for assessingrisk, we found that 90% of the participants wereclassif ied as having a high r isk of developingcardiovascular diseases. Further, the incidence ofhigh-risk WHR was significantly higher among femalestudents, and all 50 female engineering students wereclassified as having high risk WHR. This contrastingresults between WC and WHR categories has to beinterpreted cautiously because it has been reportedthat WC is more sensitive than WHR as an index ofupper body adiposity, (14) and that Asian Indianshave higher upper body adiposity and higher visceralfat for a given BMI than the Western population (16).With this background, our study revealed that in theselected populat ion sample, female students,especially those studying engineering, have a higherdegree of upper body adiposity and thus are at ahigher cardiovascular risk than other subgroups.
More male students were found to be havinghypertension than females. This result is similar tothat reported in previous studies (15). Interestingly,among the streams, the engineering students had ahigher prevalence of hypertension than the medicalstudents. While it is known that both engineeringand medical studies can be considerably stressful,this finding needs to be confirmed by repeating asimilar study with a higher sample size. It is alsorequired to investigate the factors contributing to thishigh prevalence of hypertension in engineeringstudents, and preventive and/or corrective actionsare to be planned.
More male medical students gave significant familyhistory of cardiovascular risk factors than othersubgroups. This may be explained on the basis thatmedica l s tudents are more aware about theimportance of risk factors, and how to look for themin their immediate surroundings.
We found that more female students had inadequatephysical activity than male students. This findingwas similar in both engineering and medical streamsof study. Similar results have been reported inprevious studies (15, 17).
A prominent factor in our study is that only one outof the 200 students gave history of smoking, andonly two s tudents (one each in medical andengineering streams, and one each in either gender)admitted to being affected by passive smoking. Themajor contributor for this outcome is the fact thatboth the campuses where this study was conductedwere strictly smoking-free campuses. Further, apossibility of wilfully withholding information due tothe stigma associated with smoking cannot be ruledout confidently.
Studies similar to ours have been reported fromoutside India as well , wi th somewhat s imilaroutcomes. Among pharmacy students from Poland,the preva lence of obes i ty, overwe ight BMI ,hypertension and smoking was higher among males,whereas female students reported lower physicalactivity.[5]Among third year medical students fromGreece, male students had higher BMI (overweightand obese) than female students, and the presenceof obesity was correlated to the presence ofhypertension and dyslipidaemia (7).
Limitations of the present study include insufficientsample size and omission of risk factors such asglycemic status, lipid profile, and diet. Further studiesof longer duration and involving larger sample sizewill provide a more comprehensive outcome.
Conclusions
Prevalence of adolescent students having overweightand obese BMI according to Indian standards in theselected sample was ranged from 29% to 33%. Morefemale students, and more engineering studentswere classified under the high-risk WC category.Hypertension was more prevalent among malestudents and engineering students, and more femalestudents had inadequate physical activity than males.
Proper education about cardiovascular risk factorsand lifestyle modification is essential to reducemodifiable cardiovascular risk factors and thereby topostpone the development of cardiovascular diseasesin this population, thus paving way for a healthierpopulation. Further studies with larger population andinclusion of more risk factors are essential.

Indian J Physiol Pharmacol 2018; 62(3) CV Risk Factors in Engg & Medical Students 305
1. W orld Health Organizat ion. Cardiovascular diseases(CVDs) Fact sheet. [Online]. 2017 May [cited 2018 Jan23]; Available from: URL:http://www.who.int/mediacentre/factsheets/fs317/en/]
2. Park K. Parks textbook of preventive and social medicine.24th Ed. Jabalpur (MP): Banarsidas Bhanot; 2017
3. Chauhan S, Aeri BT. Prevalence of cardiovascular diseasein India and its economic impact - a review. Intl J ofScientific and Research Publications [serial online] 2013October [cited 2018 Jan 23]; 3(10);1-5. Available from:URL:ht tp : / /www. i j s rp .o rg / res earc h-paper-1013 / i j s rp -p2234.pdf
4. Kasl iwal RR, Kulshreshtha A, Agrawal S, Bansal M,Trehan N. Prevalence of cardiovascular risk factors inInd ian pat ients undergoing coronary artery bypasssurgery. J Assoc Physicians India 2006; 54: 371–375.
5. Ilow R, Róaska D, Regulska-Ilow B. Prevalence ofcardiovascular disease risk factors among pharmacystudents from Wroclaw Medical University (Poland). AdvClin Exp Med 2017; 26: 843–850.
6. So WY, Swearingin B, Robbins J, Lynch P, Ahmedna M.Relat ionships between Body Mass Index and SocialSupport, Physical Activity, and Eating Habits in AfricanAmerican University Students. Asian Nurs Res (KoreanSoc Nurs Sci) 2012; 6: 152–157.
7. Ber t s i as G, Mam mas I , L i na rdak i s M, Ka fa tos A .Overweight and obesity in relat ion to cardiovasculardisease risk factors among medical students in Crete,Greece. BMC Public Health 2003; 3: 3.
8. Gupta R, Misra A, Vikram NK, Kondal D, Gupta SS, AgrawalA, et al. Younger age of escalation of cardiovascular riskfactors in Asian Indian subjects. BMC Cardiovasc Disord2009; 9: 28.
9. Gupta R, Joshi P, Mohan V, Reddy KS, Yusuf S .
Epidemiology and causation of coronary heart diseaseand stroke in India. Heart 2008; 94: 16–26.
10. Prasad DS, Kabir Z, Dash AK, Das BC. Cardiovascularrisk factors in developing countries: A review of clinico-epidemiological evidence. CVD Prev Control 2010; 5: 115–123.
11. WHOGlobal Physical Activity Questionnaire. [Online]. [cited2015 Jan 22]; Available from: URL:http://www.who.int/chp/steps/resources/GPAQ_Analysis_Guide.pdf.
12. Chobanian AV, Bakris GL, Black HR, Cushman WC, GreenLA, Izzo JL Jr, et al. The Seventh Report of the JointNational Committee on Prevention, Detection, Evaluation,and Treatment of High Blood Pressure: the JNC 7 report.JAMA 2003; 289: 2560–2572.
13. Misra A, Chowbey P, Makkar BM, Vikram NK, Wasir JS,Chadha D, et al. Consensus statement for diagnosis ofobesity, abdominal obesity and the metabolic syndromefor Asian Indians and recommendations for physicalact ivi ty, medical and surgical management. J AssocPhysicians India 2009; 57: 163–170.
14. Snehalatha C, Viswanathan V, Ramachandran A.Cutoffvalues for normal anthropometric variables in Asian Indianadults. Diabetes Care 2003; 26: 1380–1384.
15. Kurian S, Manjula VD, Annamma, Zakariah J. A study oncardiovascular risk factor profile of medical students ina tertiary care hospital of Central Kerala. Natl J Med Res2015; 5: 11–17.
16. Banerji MA, Faridi N, Atluri R, Chaiken RL, Lebovitz HE.Body composition, visceral fat, leptin and insulin resistancein Asian Indian men. J Clin Endocrinol Metab 1999; 84:137–144.
17. Rao CR, Darshan B, Das N, Rajan V, Bhogun M, Gupta A.Practice of Physical Activity among Future Doctors: ACross Sectional Analysis. Int J Prev Med 2012; 3: 365–369.
References

306 Pandey, Saxena, Manna and Kotwal Indian J Physiol Pharmacol 2018; 62(3)
Original Article
Study of Inflammatory Marker IL-6 and Sympathetic Activity AmongWHR Matched Prehypertensive & Normotensive Males
Archana Pandey1*, Yogesh Saxena1, Soumen Manna2
and Aarti Kotwal3
1Departments of 1Physiology and 3Microbiology,Swami Rama Himalayan University,Swami Ram Nagar, Jolly Grant,Dehradun, Uttarakhand, 248 140
2Department of Physiology,Vardhman Mahavir Medical College and Safdarjang Hospital,Ansari Nagar East, New Delhi, Delhi – 110 029
Abstract
Background: Evidence suggests that Prehypertension is an inflammatory process and cardiovascular damagedue to the inflammation is initiated by sympathetic activity. Therefore this study was conducted with theobjective to measure IL-6 and sympathetic function in Prehypertensive.
Material and methods: A Case-control study was conducted on 40 prehypertensive (as per JNC VII criteria)male subjects between 20 to 40 years. Equal numbers of age and WHR matched normotensive males weretaken for comparison. They were investigated for serum IL6 and sympathetic reactivity by sustained handgrip (SHG) test.
Results: SerumIL-6 level was higher in prehypertensive than in normotensive, though insignificantly (p=0.17).Significantly higher resting heart rate (RHR) (p=.001) and significantly lower change in diastolic bloodpressure ( DBP, p=0.000) following SHG test were observed in prehypertensive. No significant associationwas observed between IL-6 and DBP in Prehypertensive.
Conclusion:.Although the sympathetic reactivity is elevated in prehypertensive, its contribution in initiationof inflammatory process in prehypertensive was not observed in our study.
Indian J Physiol Pharmacol 2018; 62(3) : 306–313
*Corresponding author :
Dr. Archana Pandey JR3, Department of Physiology, SwamiRama Himalayan University, Swami Ram Nagar, Jolly Grant,Dehradun, Uttarakhand, 248140
(Received on January 1, 2018)
Introduction
Prehypertension is a category designated by theseventh Report of the Joint National Committee onPrevention Detection, Evaluation, and Treatment of

Indian J Physiol Pharmacol 2018; 62(3) IL-6 & Sympathetic System in Prehypertensive 307
department of Physiology, Swami Rama HimalayanUnivers i ty af ter obta in ing approval f rom theInst i tu t ional Eth ical Commit tee of HimalayanInstitute of Medical Sciences. A sample size of 38in each group was calculated based on the formulafor difference in mean of inflammatory marker IL-6(12) with the power of 80% and an alpha error of0.05.
Screening of a representative group of male residents,employees and students of the university between20 to 40 years was carried out. Blood pressure wastaken in the resting condition three times with a gapof 3 minutes as per the standardized protocol (1)and those with systolic blood pressure 120-139 mmHg and (or) diastolic blood pressure 80-89 mm Hgwere recruited for the study after obtaining theirinformed, written consent.
The recruited subjects were asked to report to thedepartment of Physiology between 9:00 am and 10:00am in all working days. The subjects were measuredfor waist circumference and hip circumference usingstandard procedure (13) and WHR was calculated.40age and WHR matched (±1SD) normotensive werealso recruited for comparison. Volunteers wereinterviewed for recording of demographic indicesincluding name, age, address, occupation andrelevant history of present illness, past illness,personal history, drug history, family history, andhistory of allergic reactions. The following two groupswere formed according to the JNC VII classification(1), and their inclusion and exclusion criteriawere asfollows.
1. Normotensive Group (n=40)
Inclusion Criteria
• Apparently healthy subjects with BloodPressure systolic < 120 mm Hg and diastolic< 80 mm Hg ( per JNC VII criteria)
2. Prehypertensive group (n=40)
Inclusion Criteria
• Apparently healthy subjects with the BloodPressure-systolic 120-139 mm Hg and/or a
High Blood Pressure (JNC VII) in 2003(1). It isestimated that about 37% of the prehypertensivebelow the age of 65 years are likely to becomehypertensive over a period of 4 years (2). Individualswith prehypertension also have high risk of targetorgan damage, cardiovascular related morbidity andmortality (3). The prevalence of prehypertension isincreasing worldwide and in developing country likeIndia the cross sectional surveys have reportedprehypertension in 46.6% of men and 49.8% ofwomen (4).
A l though severa l fac tors cont r ibu te to thepathogenesis of elevated blood pressure includinggenetic predisposition, diet, high salt intake, obesity,insulin resistance, rennin-angiotensin system, andsympathetic nervous system (5), evidence suggeststhe immunological and inflammatory pathways tobe the final common pathway in pathophysiologyof e levated B lood Pressure (6) . S ince theprehypertension is a fore runner of hypertensionseveral of the pathophysiological mechanisms thatplay role in development of hypertension are likelyto be deranged in pre-hypertensive subjects includingan increase in sympathetic nervous system activityand deranged inf lammatory pathways. In mostsubjects with elevated blood pressure up-regulationof sympathetic nerve activity (7) with exaggeratedgeneralized sympathetic efferent to end organs likekidney & heart (8) contributes to increased mortalityand morbidity (9). There is increasing evidence thatcardiovascular damage caused by excess ivestimulation of the sympathetic nervous system andrennin angiotensin system and their receptors (á andâ-adrenergic and angiotensin 2 AT1 receptorsrespectively) is mediated through a pro-inflammatoryactivation of the immune system (10). Abdominalobesity is also one of the independent risk factorsfor cardiovascular diseases and is associated withconcomitant release of proinflammatory cytokines(11). Therefore this study was planned with the aimof assessing the level of inf lammatory markerinterleukin-6 and sympathetic activity in non- obeseprehypertensive.
Materials and Methods
This case-control study was conducted at the

308 Pandey, Saxena, Manna and Kotwal Indian J Physiol Pharmacol 2018; 62(3)
diastolic 80-89 mm Hg (as per JNC VIIcriteria).
Exclusion criteria were common for bothNormotensive and Prehypertensive groupsand consisted of history of: coronary arterydisease, kidney disease, hepatic disease,chronic pulmonary obstructive disease,inflammatory bowel disease, autoimmunedisease, diabetes mellitus, osteoarthritis,postural orthostatic tachycardia syndrome,orthostatic hypotension, and chronic skininfection. Chronic smokers and chronicalcoholics were also excluded. Clinicalexamination was carried out to rule out anyactive or chronic infection. Recruitment ofthe study subjects were continued till thetotal sample in each group was collected.
Selected volunteers were instructed to comeon next visit following a good night rest anda light breakfast. They were also instructedto avoid caffeinated drinks and any kind ofheavy exercise during last 24 hours.
Following Baseline parameters were thenmeasured in both the groups
• Anthropometric indices measurement.
Standing height:
Height was measured in centimeters (cm),without shoes and with light clothes againstthe wall mounted measuring tape in cm tothe nearest of 1 cm.
Weight was measured in kg nearest to100 gm by using Krups weighing machine.
• Cardio vascular parameters: Basal systolicand diastolic blood pressure, resting heartrate were recorded using automated BPapparatus (model no. EW 254 DC6V) in asitting position after rest of at least 15minutes. Recording was done at an ambienttemperature of 25OC.
• Experimental procedure for SHG test wasused to assess reactivity of sympatheticnervous system. Procedure for the same wasexplained to the subject to remove anyapprehension. Baseline BP and HR wererecorded in sitting position. The subject wasasked to hold the dynamometer in the non-dominant hand, with the arm by the side ofthe body, with the pointer on the dial adjustedat zero and the base rested on the palm.Before the tes t Max im um VoluntaryContraction (MVC) was recorded. The subjectwas instructed to squeeze the dynamometerwith maximum isometric effort for at least5 seconds and the result was recorded,no other body movement was al lowed.After this the subject was asked to presshandgrip dynamometer at 30% of MVC for3 minutes. The alteration in the BP andHR just before the release of hand grip wastaken as the index of response to hand-griptest.
• Test for Inflammatory markers.
Blood sampling for serum interleukin 6 (IL6)was done in the morning hours after takingall aseptic precautions. The samples werecol lec ted f rom cubita l ve in in a pla inyellow top vaccutainer for estimation ofIL6. The freshly collected samples werecentrifuged for 15 minutes at 3000 RMP;serum was separated and stored in aseparate container at -70C° until furtheranalysis. Quantitative measurements of IL6were performed by immunoassay method;using Diaclone IL-6 kit in Bio Rad i Markmicro plate reader within two months fromsample collection.
Statistical analysis:
Statistical analysis was done using the softwareSPSS (Statistical Package for the Social Sciences)version 20.0 for Windows. Descriptive summarystatistics were presented as Mean±SD for continuousvariables. Baseline characteristics, variables of

Indian J Physiol Pharmacol 2018; 62(3) IL-6 & Sympathetic System in Prehypertensive 309
sympathetic reactivity and inflammatory markers ofnormotensive and pre-hypertensive groups werecompared using unpaired t-test. The Pearsoncorrelation coefficient test was used to analyzerelation of IL-6 with sympathetic nervous systemreactivity. Logistic Regression analysis was carriedout to f ind the % of accuracy in predicting theprehypertension and odds of prediction by differentvariables.
P value <0.05 was considered statistically significant.
Results
Table I shows comparison of demographic &anthropometric parameters among normotensive andprehypertensive. Difference in age, height, weight andWHR among two groups was insignificant.
In this study both Systolic and Diastolic bloodpressures showed a strong positive relationship withresting heart rate (r=0.371, p=0.001; r=0.369, p=0.001respec t ive ly) and negat ive re lat ionsh ip wi thsympathetic system reactivity (DBP, r=-0.303,p=0.006; r=-0.344, p=0.002 respectively) in overallvolunteers. IL-6 was positively but insignificantlyrelated to both Systolic and Diastolic blood pressure.Possible explanation to this can be insufficient risein IL-6 levels to elicit the significant correlation inthis range of blood pressure.
Table III : positive correlation between DBP and
TABLE I : Demographic & anthropometric parameters amongprehypertensive and normotensive male adults.
Parameters Prehypertensive Normotensive P(n=40) (n=40) value
Age (yrs) 30.6±7.2 30.2±7 0.79Height (cm) 169.7±5.2 170.59±6.7 0.52Weight (kg) 72.9±11.8 68.4±12.5 0.095WHR (ratio) 0.92±0.05 0.92±0.09 0.91
Data presented as Mean±Standard deviation (SD); p value< 0.05 is significant; WHR: waist hip ratio; t-test.
TABLE III : Correlation between parameters of sympatheticsystem activity and inflammation in prehypertensive.
RHR beats/ SBP DBP IL-6 DBPmin mmHg mmHg pg/ml mmHg
RHR 1 .000 .064 .008 .140beats/min (.998) (.697) (.963) (.389)
SBP mmHg 1 .062 .072 .099(.705) (.658) (.545)
DBP mmHg 1 .020 –.259(.904) (.106)
IL-6 pg/ml 1 .311(.050)
DBP mmHg 1
Values are presented as: r (p-value).
TABLE II : Comparison of Cardiovascular, Sympathetic systemactivity and IL-6 levels between normotensive andprehypertensive groups.
Parameters Prehypertensive Normotensive P(n=40) (n=40) value
Cardiovascular parameters
RHR beats/min 74.28±8.59 68.45±6.53 0.001SBP mm Hg Baseline 129.7±4.48 113.1±3.97 0.001DBP mm Hg Baseline 81.43±5.9 72±5.28 0.001
SHG parameters : resting DBP was recorded before the SHG testwas used
Resting DBP (mmHg) 81.03±6.31 70.55±5.76 0.000Maximum DBP (mmHg) 97.2±12.045 97.18±12.87 0.993DBP (mmHg) 16.13±11.69 26.50±10.61 0.000Inflammatory MarkerIL-6pg/ml 1.85±0.86 1.57±0.93 0.17
Data is presented as Mean±Standard deviat ion (SD);p value < 0.05 is considered statistically significant; HR:heart rate; SBP: systolic blood pressure; DBP: diastolicblood pressure; LF: low frequency; HF: high frequency;IL-6: interleukin 6; p value < 0.05 is considered statisticallysignificant; t test.
Table II shows baseline cardiovascular parametersand param eters o f sym pathet ic ac t iv i ty inprehypertensive and normotensive groups. There iss ign i f icant inc rease is res t ing hear t ra te o fprehypertensive subjects. The change in diastolicblood pressure following SHG test was significantlylower in p re-hyper tens ive as com pared tonormotensives. These findings show that rise inDBP declines as blood pressure increases whichindirectly shows an already raised sympatheticactivity among prehypertensive as compared tonorm otens ive sub jec ts . I t a lso shows tha thigher mean value of inflammatory markers IL-6 isobserved in prehypertensive as compared tonormotensive, though the difference is not statisticallysignificant.

310 Pandey, Saxena, Manna and Kotwal Indian J Physiol Pharmacol 2018; 62(3)
inflammatory marker IL-6 was found to be nonsignificant.
Fig. 1 83% prediction probability of developingprehypertension could be explained by resting heartrate and change in DBP after controlling for age,weight, WHR. Binary logistic regression analysisobserved significant contribution by RHR (-0.103;p=.009) and sympathetic reactivity represented bychange in DBP (0.152; p=.001) to predict thedevelopment of prehypertension.
Discussion
The current study invest igates association ofinflammatory marker interleukin-6 with sympatheticreactivity in prehypertensive male subjects of 20 to40 years of age. The groups were matchedfor ageand WHR (±1SD) and no significant difference inheight & weight was observed between the groupssuggesting that the groups were homogenous withrespect to height & weight (Table I).
In resting conditions heart rate is mainly dependanton the vagal tone. But the increase in heart rate inprehypertensive subjects can be attributed to both:inc rease in sym pathet ic and decrease inparasympathetic tone (7). In the present study asignif icantly increase in resting heart rate wasobserved in the prehypertensive subjects as comparedto norm otens ive (74 .28±8.59Vs68.45±6.53) ,(p=0.001). Signi f icant ly h igher hear t rates inprehypertensive, as compared to normotensive, werealso observed by studies done by GK Pal et al (14),Thiyagarajan et al. (12) and Maple M Fung et al.(15).
Evidence suggests that elevated blood pressure isinitiated and maintained by increased sympathetictone, generated by RVLM and influenced by corticaland hypothalamic impulses along with several bloodborne gases and chemicals including cytokines (8).It has been demonstrated that elevated sympatheticdrive is not only essential for hypertensive patients,but also for milder stages of disease process as
Fig. 1 : Regression analysis of variables significantly different between prehypertensive and normotensive.
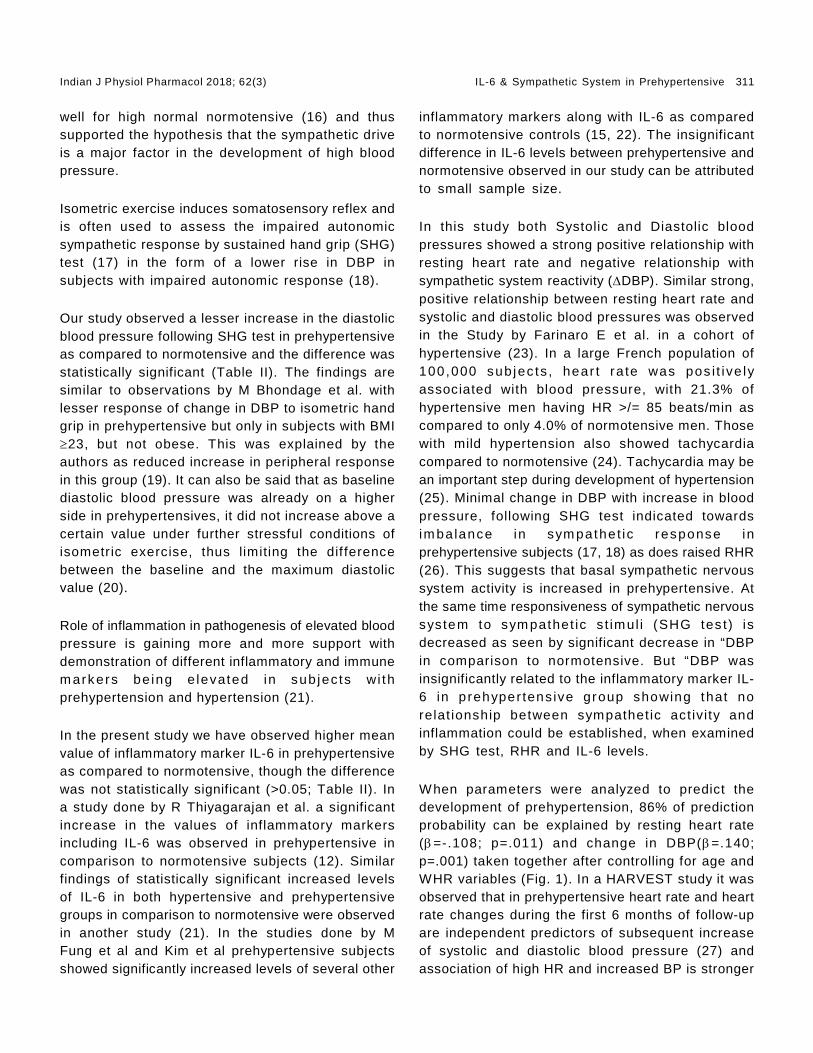
Indian J Physiol Pharmacol 2018; 62(3) IL-6 & Sympathetic System in Prehypertensive 311
well for high normal normotensive (16) and thussupported the hypothesis that the sympathetic driveis a major factor in the development of high bloodpressure.
Isometric exercise induces somatosensory reflex andis often used to assess the impaired autonomicsympathetic response by sustained hand grip (SHG)test (17) in the form of a lower rise in DBP insubjects with impaired autonomic response (18).
Our study observed a lesser increase in the diastolicblood pressure following SHG test in prehypertensiveas compared to normotensive and the difference wasstatistically significant (Table II). The findings aresimilar to observations by M Bhondage et al. withlesser response of change in DBP to isometric handgrip in prehypertensive but only in subjects with BMI23, but not obese. This was explained by theauthors as reduced increase in peripheral responsein this group (19). It can also be said that as baselinediastolic blood pressure was already on a higherside in prehypertensives, it did not increase above acertain value under further stressful conditions ofisometric exercise, thus limiting the dif ferencebetween the baseline and the maximum diastolicvalue (20).
Role of inflammation in pathogenesis of elevated bloodpressure is gaining more and more support withdemonstration of different inflammatory and immunem arkers be ing e levated in sub jects wi thprehypertension and hypertension (21).
In the present study we have observed higher meanvalue of inflammatory marker IL-6 in prehypertensiveas compared to normotensive, though the differencewas not statistically significant (>0.05; Table II). Ina study done by R Thiyagarajan et al. a significantincrease in the values of inflammatory markersincluding IL-6 was observed in prehypertensive incomparison to normotensive subjects (12). Similarfindings of statistically significant increased levelsof IL-6 in both hypertensive and prehypertensivegroups in comparison to normotensive were observedin another study (21). In the studies done by MFung et al and Kim et al prehypertensive subjectsshowed significantly increased levels of several other
inflammatory markers along with IL-6 as comparedto normotensive controls (15, 22). The insignificantdifference in IL-6 levels between prehypertensive andnormotensive observed in our study can be attributedto small sample size.
In this study both Systolic and Diastolic bloodpressures showed a strong positive relationship withresting heart rate and negative relationship withsympathetic system reactivity (DBP). Similar strong,positive relationship between resting heart rate andsystolic and diastolic blood pressures was observedin the Study by Farinaro E et al. in a cohort ofhypertensive (23). In a large French population of100,000 sub jec ts , hear t ra te was pos i t ive lyassociated with blood pressure, with 21.3% ofhypertensive men having HR >/= 85 beats/min ascompared to only 4.0% of normotensive men. Thosewith mild hypertension also showed tachycardiacompared to normotensive (24). Tachycardia may bean important step during development of hypertension(25). Minimal change in DBP with increase in bloodpressure, following SHG test indicated towardsim balance in sym pathet ic response inprehypertensive subjects (17, 18) as does raised RHR(26). This suggests that basal sympathetic nervoussystem activity is increased in prehypertensive. Atthe same time responsiveness of sympathetic nervoussystem to sym pathet ic s t imul i (SHG tes t) isdecreased as seen by significant decrease in “DBPin comparison to normotensive. But “DBP wasinsignificantly related to the inflammatory marker IL-6 in prehyper tens ive group showing that norelat ionship between sympathet ic act ivi ty andinflammation could be established, when examinedby SHG test, RHR and IL-6 levels.
When parameters were analyzed to predict thedevelopment of prehypertension, 86% of predictionprobability can be explained by resting heart rate(=-.108; p=.011) and change in DBP(=.140;p=.001) taken together after controlling for age andWHR variables (Fig. 1). In a HARVEST study it wasobserved that in prehypertensive heart rate and heartrate changes during the first 6 months of follow-upare independent predictors of subsequent increaseof systolic and diastolic blood pressure (27) andassociation of high HR and increased BP is stronger
312 Pandey, Saxena, Manna and Kotwal Indian J Physiol Pharmacol 2018; 62(3)
in individuals with elevated sympathetic activity (28).Our study is also supported by a study by R HChaney et al, which observed that the best predictionfor development of high BP was by the interactionbetween resting diastolic BP × handgrip diastolicBP (29).
Resting heart rate was elevated in prehypertensiveas compared to age and WHR matched normotensivewith significantly impaired sympathetic reactivity to
SHG in them. Though the level of inflammatory markerIL-6 were elevated (although ins ignif icant) inprehypertensive no significant relation to sympatheticactivity (DBP, RHR) was observed.
Limitations:
Sample size taken was small so larger study isrecommended to see the significant difference in thegroups.
References
1. Chobanian AV, Bakris GL, Black HR, Cushman WC, GreenLA, Izzo JL et al. The Seventh Report of the Joint NationalCommittee on Prevent ion, Detect ion, Evaluation, andTreatment of High Blood Pressure: the JNC 7 report.Journal of the American Medical Assoc iat ion 2003;289(19): 2560–2572.
2. Vasan RS, Larson MG, Leip EP, Kannel WB, Levy D.Assessment of frequency of progression to hypertensionin non-hypertensive participants in the Framingham HeartStudy: A cohort study. Lancet 2001; 358: 1682–1686.
3. Vasan RS, Larson MG, Leip EP, Evans JC, O’Donnell CJ,Kannel WB, et al. Impact of high-normal blood pressureon the risk of cardiovascular disease. The New EnglandJournal of Medicine 2001; 345(18): 1291–1297.
4. Chockalingam A, Ganeshan N, Venkateshan S, GnanaveluG, Subramaniam T, Jaganathan V, et al. Patterns andpredictors of prehypertension among healthy urban adultsin India. Angiology 2005; 56(5): 557–563.
5. Beevers G, Lip GY, O’Brien E. The pathophysiology ofhypertension. BMJ 2001; 322: 912–916
6. Harrison DG, Guzik TJ, Lob HE, Madhur MS, Marvar PJ,Thabet SR et al. Inflammation, immunity and hypertension.Hypertension 2011; 57: 132–140.
7. Davis JT, Rao F, Naqshbandi D, Fung MM, Zhang K, SchorkAJ e t a l . Au tonom ic and hemodynamic or i g ins o fprehypertension: Central role of heredity. Journal of theAmerican College of Cardiology 2012; 59(24): 2206–2216.
8. Guyenet PG. The sympathetic control of blood pressure.Nature Reviews. Neuroscience 2006; 7: 335–346.
9. Cohn JN, Levine TB, Olivari MT, Garberg V, Lura D, FrancisGS et al. Plasma norepinephrine as a guide to prognosisin patients with chronic congest ive heart failure. TheNew England Journal of Medicine 1984; 27; 311(13):819–823.
10. Zubcevic J, Waki H, Raizada MK, Paton JFR. Autonomic-Immune-Vascular Interaction: An Emerging Concept forNeurogenic Hypertension. Hypertension 2011; 57(6): 1026–1033.
11. Bagby SP. Obesity –initiated metabolic syndrome and thekidney: a recipe for chronic kidney disease. J Am SocNephrol 2004; 15(11): 2775–2791.
12. R Thiyagarajana, P Pala, GK Pala, SK Subramanianb, MTrakrooc, Z Bobbyd et al. Markers of inflammation andinsulin resistance in age and body mass index matched
subjec ts wi th p rehyper tens ion and normotens ion.In te rnat i ona l Journa l o f Sc ien t i f i c and ResearchPublications 2014 June; 4(6): 1–6.
13. World Health Organization. Waist circumference and waist-hip ratio. Report of a WHO expert consultation, Geneva:WHO, 2008.
14. Pal GK, Chandrasekaran A, Hariharan AP, Dutta TK, PalP, Nanda N et a l . Body mass index contr ibutes tosympathovagal imbalance in prehypertens ives. BMCCardiovasc Disord 2012; 12: 54–60.
15. Fung M M, Rao F, Poddar S,Mahata M, Khandrika S, MahataS K. Ear ly inf lammatory and metabol ic changes inassociation with AGTR1polymorphisms in prehypertensivesubjects. Am J Hypertens 2011; 24(2): 225–233.
16. Greenwood JP, John B, Stoker JB, Mary D. Single-UnitSympathetic Discharge. Quantitative Assessment in HumanHypertensive Disease. Circulation 1999; 100: 1305–1310.
17. Ewing DJ, Campbell IW, Clarke BF. The natural history ofdiabetic autonomic neuropathy. Q J Med 1980; 49(193):95–108.
18. Khurana RK, Setty A. The value of the isometric hand-grip test–studies in various autonomic disorders. ClinicalAutonomic Research 1996; 6: 211–218.
19. Bhongade M, Navare A. The study of cardiovascularsympathetic reactivity in prehypertensives with normaland higher BMI. Int J Res Med Sci 2017; 5: 1033–1038.
20. Moinuddin A, Gupta R, Saxena Y. Autonomic FunctionTes t s in Prehyper t ens ive Young Adu l t Ma les o fUttarakhand Region. Indian J Physiol Pharmacol 2016;60(1): 45–51.
21. Bhaskar V, Rao P, Mahendran B. Correlative associationof Interleukin-6 with malondialdehyde in prehypertensiveand hypertensive subjects. Journal of Dental and MedicalSciences 2015; 14(7): 53–57.
22. Kim M, Jung S, Kim SY, Lee S-H, Lee JH. Prehypertension-associated elevation in circulating lysophosphatidlycholines,Lp-PLA
2 activity, and oxidative stress. Plos one. 2014;
9(5):e96735. Https://doi.org/10.1371/journal.pone 0096735
23. Farinaro E, Stranges S, Guglielmucci G, Iermano P,Celentano E, Cajafa A. Heart rate as a risk factor inhypertensive individuals. The Italian Tensio Pulse Study.Nutr Metab Cardiovasc Dis 1999; 9(4): 196–202.
24. Morcet JF, Safar M, Thomas F, Guize L, Benetos A.Associations between heart rate and other risk factors

Indian J Physiol Pharmacol 2018; 62(3) IL-6 & Sympathetic System in Prehypertensive 313
in a large French population. J Hypertens 1999; 17(12 Pt1): 1671–1676.
25. Dickhout JG, Lee RMKW. Blood pressure and heart ratedevelopment in young spontaneously hypertensive rats.American Journal of Physiology-Heart and CirculatoryPhysiology 1998; 274(3): 794–800.
26. Pal GK, Adithan C, Dutta TK, Amudharaj D, Pravati P,Nandan PG, et al: Assessment of sympathovagal imbalanceby s pec t ra l ana lys is o f hea r t ra te var iab i l i t y inprehypertensive and hypertens ive pat ients in Indianpopulation. Clin Experiment Hypertens 2011; 33(7): 478–483.
27. Palatini P, Dorigatti F, Zaetta V, Mormino P, Mazzer A,Bor t o l azz i A , e t a l . Hear t ra te as a p red ic to r o fdevelopment of susta ined hypertens ion in sub jec tsscreened for stage 1 hypertension. The HARVEST Study.J Hypertens 2006; 24: 1873–1880.
28. Narkiewicz K, Somers VK. Interactive effect of heart rateand muscle sympathetic nerve activity on blood pressure.Circulation 1999; 100: 2514–2518.
29. Chaney RH, Eyman RK. Blood pressure at rest and duringmaximal dynamic and isometric exercise as predictors ofsys tem ic hyper t ens ion. The Amer ic an Journa l o fCardiology 1988; 62(16): 1058–1061.
314 Dasgupta, Venkatesan, Goyal, Wickramanayake, Murthy,Inbakumari, Hawkins and Thomas Indian J Physiol Pharmacol 2018; 62(3)
Original Article
The Lack of Validity of Predictive Equations for Calculating RestingEnergy Expenditure in Asian Indian Patients with Type 1and Type 2 Diabetes Mellitus
Riddhi Dasgupta1, Padmanaban Venkatesan1, Akankasha Goyal2,Anneka Wickramanayake2, K. Chaithanya Murthy1,Mercy Inbakumari1, Meredith Hawkins2
and Nihal Thomas1*
1Department of Endocrinology,Diabetes and Metabolism,Christian Medical College,Vellore, India
2Division of Endocrinology,Department of Medicine,Albert Einstein College of Medicine,Bronx, New York, USA
Abstract
Introduction: Predictive equations are used routinely to calculate resting energy expenditure and administerappropriate nutrition to patients. Validity of routinely used equations for calculating resting energy expenditurewas not verified in Asian Indian population. In this study we aim to compare the predictive equations withindirectly calorimetry to test their validity in Indian population.
Methods: The study included 45 male Indian subjects divided into following groups: 16 patients with Type1 diabetes mellitus, 13 patients with Type 2 Diabetes mellitus and 16 normoglycemic subjects. All underwentanthropometric measurements, body composition measurement by DEXA scan and indirect calorimetry. REEcalculated from routinely used equations and a body composition based equation was compared with REEmeasured by indirect calorimetry by means of Bland-Altman plot analysis. Total and mean error was alsocalculated for the predictive equations. Statistical analysis was done in R programming language version3.2.4.
Results: Total error of different predictive equations when compared with indirect calorimetry ranged from 375kcal/day to 726 kcal/day across the studied groups. Bland-Altman plot analysis showed negative proportionalbias i.e. equations overestimate at lower values and underestimate at higher values of measured REE.
Conclusion: Routinely used predictive equations and recently introduced body composition based equationwere all poor in accuracy as reflected from their high total error for estimating resting energy expenditurein Indian population when compared with indirect calorimetry. We conclude that a predictive equation forestimating resting energy expenditure must be established for use in Indian population.
Indian J Physiol Pharmacol 2018; 62(3) : 314–319
*Corresponding author :
Dr. Nihal Thomas, Professor and Head, Department of Endocrinology, diabetes and Metabolism, Christian Medical College,Vellore – 632 004, India, Ph: 0416-2282694, 0416-4200844; Email: [email protected]
(Received on January 1, 2018)
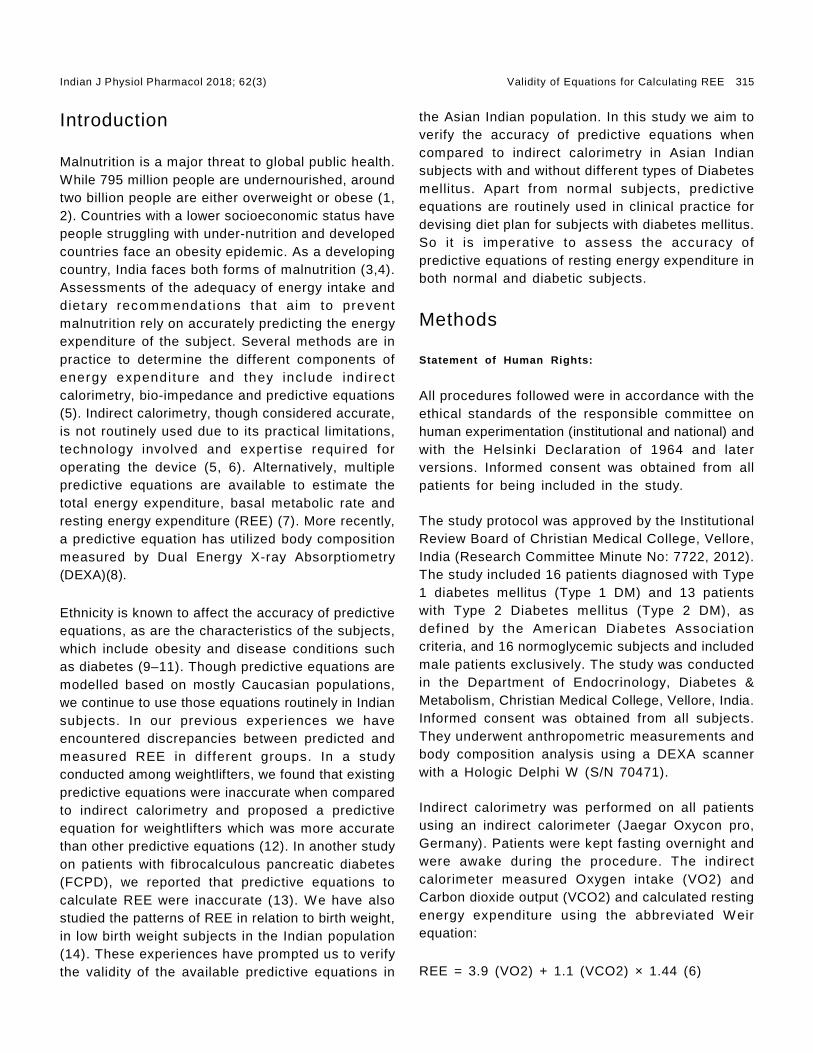
Indian J Physiol Pharmacol 2018; 62(3) Validity of Equations for Calculating REE 315
the Asian Indian population. In this study we aim toverify the accuracy of predictive equations whencompared to indirect calorimetry in Asian Indiansubjects with and without different types of Diabetesmellitus. Apart from normal subjects, predictiveequations are routinely used in clinical practice fordevising diet plan for subjects with diabetes mellitus.So it is imperative to assess the accuracy ofpredictive equations of resting energy expenditure inboth normal and diabetic subjects.
Methods
Statement of Human Rights:
All procedures followed were in accordance with theethical standards of the responsible committee onhuman experimentation (institutional and national) andwith the Helsinki Declaration of 1964 and laterversions. Informed consent was obtained from allpatients for being included in the study.
The study protocol was approved by the InstitutionalReview Board of Christian Medical College, Vellore,India (Research Committee Minute No: 7722, 2012).The study included 16 patients diagnosed with Type1 diabetes mellitus (Type 1 DM) and 13 patientswith Type 2 Diabetes mellitus (Type 2 DM), asdef ined by the American Diabetes Associationcriteria, and 16 normoglycemic subjects and includedmale patients exclusively. The study was conductedin the Department of Endocrinology, Diabetes &Metabolism, Christian Medical College, Vellore, India.Informed consent was obtained from all subjects.They underwent anthropometric measurements andbody composition analysis using a DEXA scannerwith a Hologic Delphi W (S/N 70471).
Indirect calorimetry was performed on all patientsusing an indirect calorimeter (Jaegar Oxycon pro,Germany). Patients were kept fasting overnight andwere awake during the procedure. The indirectcalorimeter measured Oxygen intake (VO2) andCarbon dioxide output (VCO2) and calculated restingenergy expenditure using the abbreviated Weirequation:
REE = 3.9 (VO2) + 1.1 (VCO2) × 1.44 (6)
Introduction
Malnutrition is a major threat to global public health.While 795 million people are undernourished, aroundtwo billion people are either overweight or obese (1,2). Countries with a lower socioeconomic status havepeople struggling with under-nutrition and developedcountries face an obesity epidemic. As a developingcountry, India faces both forms of malnutrition (3,4).Assessments of the adequacy of energy intake anddietary recommendations that aim to preventmalnutrition rely on accurately predicting the energyexpenditure of the subject. Several methods are inpractice to determine the different components ofenergy expendi ture and they include indirectcalorimetry, bio-impedance and predictive equations(5). Indirect calorimetry, though considered accurate,is not routinely used due to its practical limitations,technology involved and expertise required foroperating the device (5, 6). Alternatively, multiplepredictive equations are available to estimate thetotal energy expenditure, basal metabolic rate andresting energy expenditure (REE) (7). More recently,a predictive equation has utilized body compositionmeasured by Dual Energy X-ray Absorptiometry(DEXA)(8).
Ethnicity is known to affect the accuracy of predictiveequations, as are the characteristics of the subjects,which include obesity and disease conditions suchas diabetes (9–11). Though predictive equations aremodelled based on mostly Caucasian populations,we continue to use those equations routinely in Indiansubjects. In our previous experiences we haveencountered discrepancies between predicted andmeasured REE in dif ferent groups. In a studyconducted among weightlifters, we found that existingpredictive equations were inaccurate when comparedto indirect calorimetry and proposed a predictiveequation for weightlifters which was more accuratethan other predictive equations (12). In another studyon patients with fibrocalculous pancreatic diabetes(FCPD), we reported that predictive equations tocalculate REE were inaccurate (13). We have alsostudied the patterns of REE in relation to birth weight,in low birth weight subjects in the Indian population(14). These experiences have prompted us to verifythe validity of the available predictive equations in

316 Dasgupta, Venkatesan, Goyal, Wickramanayake, Murthy,Inbakumari, Hawkins and Thomas Indian J Physiol Pharmacol 2018; 62(3)
Resting energy expenditure was defined as theenergy spent by the body in 24 hours under resting(awake) conditions (5).
Table I depicts the predictive equations that wereused to calculate REE in this study. The list includesone of the equations that were published morerecently that utilizes body composition results fromDEXA. This is a mechanistic model which is basedon the principle that different tissues of the bodyspend energy at different rates (15). The mass ofeach tissue was calculated utilizing DEXA. Thecalculated tissue components are bone mass (BM),adipose tissue mass (AT), skeletal muscle mass(SM) and residual mass (RM). Bone mass andadiposetissue mass are calculated from DEXA as describedby previous authors (16).
Skeletal muscle mass was calculated using apredictive formula published by Kim et. al. (17). Theresidual mass was defined as the difference betweentotal body weight and the sum of the four othercomponents. Once the mass of individual componentswas calculated, whole body REE is calculated bymultiplying the mass of each component with itsenergy expenditure as expressed as kcal/kg/day.W ang et.al. used previously published data toarrive at the energy expenditure of each tissuecomponent and it is used by subsequent researchers(8, 15).
Statistical analysis was done in R programminglanguage version 3.2.4.
Results
Table II shows the age and anthropometric details ofsubjects in each group. The study included 45 malesubjects divided into Normoglycemic, Type 1 DM andType 2DM. Participants were generally younger andof normal weight except for Type 2DM subjects. Type2 DM subjects had an average BMI of 25.5 kg/ m2.Insulin resistance was measured by HOMA-IR (18).Type 2 DM subjects had higher HOMA-IR values thanother groups.
Table III shows body composition parameters in eachgroup as measured by DEXA.
Table IV shows the mean and total error of predictedREE by various methods with measured REE. REEvalue from indirect calorimetry is considered asmeasured REE.
Mean error and the standard deviation of error havebeen calculated as the average and the standarddeviation of the difference between predicted andmeasured REE in each group for different methods.
The total error is the root mean squared error (RMSE)calculated as:
Square root of ((predicted REE – measured REE)2/N), where N is the number of samples.
The total error or RMSE is an estimate of the accuracy
TABLE I : Equations to predict REE.
Equation Formulaafor REE (kcal/day)
Harris-Benedict (21) 66.437 + (13.752* weight) + (5.03* height) – (6.755* age)
Schofield (22) 18-29 years: 15.057* (weight) + 692.230-59 years: 11.472* (weight) + 873.1
WHO/FAO/UNU (23) 18-30 years: 15.4* weight – 27* (height/100) + 71731-60 years: 11.3* weight + 16* (height/100) + 901
Mifflin-St Jeor (24) 9.99* weight + 6.25* height – 4.92* age + 5
REE from DEXAb (16) 2.3*BM + 4.5*AT + 13*SM + 54*RM
a-Weight in kg, height in cm, age in yearsb-BM is bone mass, AT is adipose tissue mass, SM is skeletal muscle mass, RM is residual mass. All are calculated fromDEXA according to a previously published method.

Indian J Physiol Pharmacol 2018; 62(3) Validity of Equations for Calculating REE 317
TABLE II : Basic characteristics of the study participants.
Group Number of Age in Height Weight BMI in Duration of HOMA-subjects years in cm in Kg Kg/m2 diabetes in years IR
(Mean±SD) (Mean±SD) (Mean±SD) (Mean±SD) (Mean±SD) (Mean±SD)
Normoglycemic 16 34.1±8 169.4±7 63.7±11 22.2±4 1.2±0.8Type 1 DM 16 28.6±6 166.3±7 56.8±5 20.6±2 9.9±6 3.0±1.9Type 2 DM 13 36.9±6 168.2±7 71.9±5 25.5±2 2.9±5 3.6±2.5
TABLE III : Body composition of the study participants from DEXA.
Group Weight Kg Bone mineral content in g Total fat in g(Mean±SD) (Mean±SD) (Mean±SD)
Normoglycemic 63.7±11 2414.07±292.54 11580.00±5946.03Type 1 DM 56.8±5 2803.72±529.29 8925.3±2685.63Type 2 DM 71.9±5 2663.32±799.55 17896.98±3459.25
TABLE IV : Total and mean error of predictive equations.
Group Method REE (Mean±SD) Mean error (Mean±SD) Total errorkcal/day kcal/day kcal/day
Normoglycemic Indirect calorimetry 1701±398REE from DEXA 1273±247 –428±361 448Harris Benedict 1564±174 –137±361 375Schofield 1624±139 –77±388 384WHO/FAO/UNU 1648±139 –53±397 388Mifflin-St Jeor 1532±139 201±335 382
Type 1 DM Indirect calorimetry 1983±383REE from DEXA 1344±132 –639±357 726Harris Benedict 1492±86 –491±377 612Schofield 1536±61 –447±375 576WHO/FAO/UNU 1555±68 –428±376 562Mifflin-St Jeor 1472±74 511±375 627
Type 2 DM Indirect calorimetry 1919±551REE from DEXA 1539±214 –380±511 621Harris Benedict 1652±101 –267±541 584Schofield 1705±71 –214±529 551WHO/FAO/UNU 1745±66 –174±530 538Mifflin-St Jeor 1593±87 326±546 618
of the methods. All the methods to predict REEhad poor accuracy as evident from the table.Tota l er ror worsens fu r ther in subjects wi thdiabetes mellitus. However among the predictiveequations, the Harris Benedict equation had the leasterror in normoglycemic subjects. In case of othergroups, the WHO/FAO/UNU equation had the leasterror.
Table V shows results from Bland Altman analysis.There is no statistically significant fixed bias in anyof the methods studied in all groups. The confidenceintervals for fixed bias were too wide, indicating the
inaccuracy of the methods studied. However thereis a statistically significant negative proportionalbias in almost all methods in every group studied.A negative proportional bias means predictedequations overestimate REE at lower values andunderestimate at higher values of measured REE.Most of the methods had a significant negativeproportional bias.
Discussion
Predictive equations for REE have been widely usedin Indians in both health and disease without ever

318 Dasgupta, Venkatesan, Goyal, Wickramanayake, Murthy,Inbakumari, Hawkins and Thomas Indian J Physiol Pharmacol 2018; 62(3)
verifying the accuracy of these equations. In thisstudy we analysed the accuracy of various predictiveequation of REE in use in 45 male subjects of age19 to 49 years d iv ided into th ree groups :Normoglycemic, Type 1 DM and Type 2 DM.
The results of the study revealed that predictedequat ions are fa r f rom accura te , even innormoglycemic subjects ; predicted equat ionsincluding DEXA were inaccurate by around 22% to26% of measured REE on average. The total errorfor the normoglycemic subjects were around 400 kcalfor all equations. If the predictive equations areinaccurate by 400 kcal on average, they may notserve any practical purpose for their intended use.
Predictive equations performed even more poorly insubjects with diabetes in all studied types as thetotal error was around 30% of measured REE for allpredictive equations. This might be due to increasedinsulin resistance among subjects with diabetesmellitus since insulin resistance is known to alterresting energy expenditure (19). Moreover predictiveequations are known to perform poorly among obesesubjects and Type 2 DM subjects had higher BMIthan other groups (10).
These equations were not specific to the Indianpopulation. Ethnicity is known to influence REE andthe accuracy of predictive equations. Indian subjects
are known to have a lower REE when compared toother populations (20). Also, differences in bodycomposition in Indians might affect the accuracy ofpredictive equations. Along with ethnicity, underlyingdiseases state, especially different forms of Diabetesmellitus could affect the accuracy of these equations.
The Bland-Altman plot analysis shows that there wasno fixed bias for any of the equations in all groups.However, there was significant proportional bias,particularly a negative bias in most equations amongall groups. This indicates that these equationsoverestimate at lower values and underestimate athigher values of measured REE.
Interestingly the total error was highest for DEXA-derived REE in all groups.
REE has been predicted from body compositionmeasurements done by DEXA (16). As each organexpends energy at particular rate, calculating themass of various tissue compartments such as thebrain, muscle, fat, skeletal muscle and bone massand multiplying each mass with a term correspondingto the energy expenditure by the organ can predictresting energy expenditure (15). The prediction ofREE by DEXA was found to be more accurate thanother simpler predictive equations (16). However therate at which each organ expends energy used inthe formula of DEXA-predicted REE and the equationsto calculate the mass of tissue components fromDEXA are not specific for Indian subjects. This mightlead to inaccuracy of the DEXA-predicted REE inIndian subjects.
Interestingly, the ‘mechanistic’ model of predictingREE from DEXA is inaccurate in Indian subjects.This might be due to several reasons. Previouslypublished methods for calculating mass of tissuecomponents from DEXA may not be appropriate forIndian subjects. Also we cannot exclude thepossibility of energy expenditure of individual tissuecomponents in Indian subjects being different fromthe one used for calculating the DEXA basedequation.
Though our sample size is small and did not includefemale subjects, our results have shown that
TABLE V : Bland-Altman plot analysis.
Group Method Fixed bias ProportionalCI 95% bias
Lower Upper r Plimit limit value
Normo- DEXA –1010 561 0.69 0.030glycemic Harris Benedict –845 571 –0.71 0.002
Schofield –838 684 –0.79 <0.001WHO/FAO/UNO –831 726 –0.79 <0.001Mifflin-St-Jeor –863 526 0.71 0.002
Type 1 DM DEXA –1338 60 –0.81 <0.001Harris Benedict –1231 249 –0.91 <0.001Schofield –1182 288 –0.95 <0.001WHO/FAO/UNO –1166 310 –0.08 0.774Mifflin-St-Jeor –1246 224 0.93 <0.001
Type 2 DM DEXA –1381 621 –0.76 0.003Harris Benedict –1327 793 –0.94 <0.001Schofield –1251 823 –0.97 <0.001WHO/FAO/UNO –1212 863 –0.29 0.324Mifflin-St-Jeor –1397 745 0.95 <0.001

Indian J Physiol Pharmacol 2018; 62(3) Validity of Equations for Calculating REE 319
pred ic t ive equat ions inc lud ing DEXA basedmeasurements were not appropriate for use in theIndian population due to a high degree of inaccuracy.Therefore, we conclude that there is a need toestablish a predictive equation appropriate for use inthe Indian population. To use DEXA for measuringREE, the methods for calculating mass of tissuecomponents using DEXA must be verified with thewhole body MRI measurement of tissue componentsand energy expend i tu re o f ind iv idua l t i ssue
components must be established.
Acknowledgments
Funding: Support was provided by a grant from theAlbert Einstein Medical College, New York, NY.
Disclosure: All authors declare that they have noconflict of interest.
References
1. FAO, editor. Meeting the 2015 international hunger targets:taking stock of uneven progress. Rome: FAO; 2015. 56p. (The state of food insecurity in the world).
2. Nguyen DM, El-Serag HB. The Epidemiology of Obesity.Gastroenterol Clin North Am 2010 Mar; 39(1): 1–7.
3. Kalra S, Unnikrishnan AG, others. Obesity in India: Theweight of the nation. J Med Nutr Nutraceuticals 2012; 1(1): 37.
4. Radhakrishna R, Ravi C. Malnutrition in India: Trends anddeterminants. Econ Polit Wkly 2004; 671–676.
5. Pinheiro Volp AC, Esteves de Oliveira FC, Duarte MoreiraAlves R, Esteves EA, Bressan J. Energy expenditure:components and evaluation methods. Nutr Hosp 2011 Jun;26(3): 430–440.
6. Matarese LE. Indirect calorimetry: technical aspects. JAm Diet Assoc 1997; 97(10): S154–S160.
7. Frankenfield D, Roth-Yousey L, Compher C, Group EAW,others. Comparison of predictive equations for restingmetabolic rate in healthy nonobese and obese adults: asystematic review. J Am Diet Assoc 2005; 105(5): 775–789.
8. Usui C, Taguchi M, Ishikawa-Takata K, Higuchi M. TheValidity of Body Composition Measurement Using DualEnergy X-Ray Absorpt iometry for Est imating Rest ingEnergy Expenditure. In: El Maghraoui A, editor. Dual EnergyX-Ray Absorptiometry (Internet). In Tech; 2012 (cited 2016Jun 1). Available from: http://www.intechopen.com/books/dual-energy-x-ray-absorpt iometry/ the-val id i ty-of -body-c ompos i t i on-m eas uremen t -us ing -dua l -ene rgy-x- ray -absorptiometry-for-estimating-r
9. Hasson RE, Howe CA, Jones BL, Freedson PS. Accuracyof four resting metabolic rate prediction equations: effectsof sex, body mass index, age, and race/ethnicity. J SciMed Sport 2011; 14(4): 344–351.
10. Madden AM, Mulrooney HM, Shah S. Estimation of energyexpenditure using prediction equations in overweight andobese adults: a systematic review. J Hum Nutr Diet OffJ Br Diet Assoc 2016 Feb 29.
11. Martin K, Wallace P, Rust PF, Garvey WT. Estimation ofresting energy expenditure considering effects of raceand diabetes status. Diabetes Care 2004; 27(6): 1405–1411.
12. Joseph M, Prema L, Jacob KM, Kumar R, Inbakumari M,Thomas N. Nutritional Status of South Indian ProfessionalWeightlifters. Indian J Nutr Diet 2012 Oct 1; 49(10): 433–441.
13. Behera KK, Joseph M, Shetty SK, Chacko A, Sahoo MK,Mahendri NV, Nair V, Nadig S, Thomas N. Resting energyexpenditure in subjects with fibro-calculous pancreaticdiabetes. J Diabetes 2014 Mar 1; 6(2): 158–163.
14. Thomas N, Spurgeon R, Mercy B, Christopher S, Paul T,Babu LN. Insulin resistance, body composition and energyexpenditure in young south indian males with normal andlow birth weight. In Harrogate, UK: Endocrine Abstracts;2009 (cited 2016 May 31). p. 152. Available from: http://www.endocrine-abstracts.org/ea/0019/ea0019p152.htm
15. Wang Z, Ying Z, Bosy-Westphal A, Zhang J, Schautz B,Later W, Heymsfield SB, Müller MJ. Specific metabolicrates of major organs and tissues across adulthood:eva luat ion by mechanis t ic model of rest ing energyexpenditure. Am J Clin Nutr 2010; 92(6): 1369–1377.
16. Usui C, Taguchi M, Ishikawa-Takata K, Higuchi M. Theval idity of body composition measurement using dualenergy X-Ray absorptiometry for estimating resting energyexpenditure. Dual Energy X-ray Absorptiometry 2011; 45.
17. Kim J, Wang Z, Heymsfield SB, Baumgartner RN, GallagherD. Total-body skeletal muscle mass: estimation by a newdual-energy X-ray absorptiometry method. Am J Clin Nutr2002; 76(2): 378–383.
18. Mat thews DR, Hosker JP, Rudenski AS, Naylor BA,Treacher DF, Turner RC. Homeostasis model assessment:insulin resistance and -cell function from fasting plasmaglucose and insulin concentrations in man. Diabetologia1985 Jul 1; 28(7): 412–419.
19. Ten S, Bhangoo A, Ramchandani N, Mueller C, Vogiatzi M,New M, Les ser M, Mac la ren N. Res t ing energyexpenditure in insulin resistance falls with decompensationof insulin secretion in obese children. J Pediatr EndocrinolMetab JPEM 2008 Apr; 21(4): 359–367.
20. Song LLT, Venkataraman K, Gluckman P, Chong YS, CheeM-WL, Khoo CM, Leow M-K, Lee YS, Tai ES, Khoo EYH.Smaller size of high metabolic rate organs explains lowerresting energy expenditure in Asian-Indian Than Chinesemen. Int J Obes 2016 Apr 1; 40(4): 633–638.
21. Harris JA, Benedict FG. A Biometric Study of Human BasalMetabolism. Proc Natl Acad Sci USA 1918 Dec; 4(12): 370–373.
22. Schof ield W N. Predict ing basal metabol ic rate, newstandards and review of previous work. Hum Nutr ClinNutr 1985; 39 Suppl 1: 5–41.
23. Un ivers i t y UN, Organ i za t ion W H. Hum an EnergyRequirements: Report of a Joint FAO/WHO/UNU ExpertConsultation: Rome, 17-24 October 2001 (Internet). Food& Agriculture Org.; 2004 (cited 2016 Apr 29).
24. Mifflin MD, St Jeor ST, Hill LA, Scott BJ, Daugherty SA,Koh YO. A new predictive equation for resting energyexpenditure in healthy individuals. Am J Clin Nutr 1990Feb; 51(2): 241–247.

320 Deka, Das and Bora Indian J Physiol Pharmacol 2018; 62(3)
Original Article
Pattern and Prevalence of Cardiovascular Autonomic Neuropathy(CAN) in Alcoholic Liver Disease Patients in Gauhati MedicalCollege & Hospital, Assam : A Cross-sectional Study
Jyotismita Deka1*, Anupi Das2 and Gayatri Bora3
1Department of Physiology,Silchar Medial College & Hospital, Ghungoor,Silchar, Assam
2Department of Physiology,Jorhat Medical College & Hospital,Jorhat, Assam
3Department of Physiology,Adichunchanagiri Institute of Medical Sciences,B.G. Nagar, Mandya, Karnataka
Abstract
Background and objectives: Alcoholic liver disease is on the rise all over the globe. Cardiovascularautonomic neuropathy is the underlying cause of sudden death in alcoholic liver disease patients. Thepresent study was started with an objective to evaluate the pattern and prevalence of CAN in the alcoholiccirrhosis patients of Assam.
Methods: Heart rate response to lying to standing (30:15 ratio), Deep breathing and Valsalva maneuver wereobserved to study parasympathetic functions while Blood pressure response to lying to standing and Handgrip test were used for sympathetic functions. For categorization of CAN, two scoring systems were used;the Ewing’s criteria and Bellavere’s criteria.
Results: The most affected is the heart rate response to lying to standing, 40% of cases showed abnormal30:15 ratio and Blood pressure response to Handgrip test is the least affected one with abnormality percentageof 13%. Bellavere’s criteria scored 76.66% of patients to have CAN but all of the cases (100%) were showedto have CAN when Ewing’s criteria were used.
Interpretation and conclusion: CAN develops in alcoholic liver disease which increases the morbidity andmortality in these patients.
Indian J Physiol Pharmacol 2018; 62(3) : 320–326
*Corresponding author :
Jyotismita Deka, MD, Associate Professor of Physiology, Silchar Medical Colllege, Ghungoor, Silchar – 788 014, District-Cachar, Assam, India; Phone :+919678001711, E-mail: [email protected]
(Received on January 1, 2018)

Indian J Physiol Pharmacol 2018; 62(3) Cardiovascular Autonomic Neuropathy in Alcoholics 321
patients admitted in various medical wards in GauhatiMedical College & Hospital in Assam, India.
Objectives
To assess the pat tern and preva lence o fcardiovascular autonomic neuropathy in alcoholic liverdisease patients of Assam.
Hypothesis
Cardiovascular autonomic neuropathy is highlyprevalent among chronic alcoholics with alcoholic liverdisease.
Materials and Methods
This is a Cross-sectional study, carried out in theDepartment of Physiology, Gauhati Medical College,Guwahati, Assam. 60 chronic alcoholics, alreadydiagnosed with alcoholic liver disease, who wereadmitted in various medical wards of Gauhati MedicalCollege & Hospital, were enrolled in the study.Pat ients from var ious parts of Assam and itsneighbouring states are referred to Gauhati MedicalCollege & Hospital. The patients were diagnosed ashaving alcoholic liver disease on the basis of clinical,biochemical and ultrasonographic findings. All ofthese patients showed deranged liver function testsfor more than six months and some of them for evenmore. Their present liver function test reports wereobtained from the laboratories.
Approval from the Institutional Ethical Committee wasobtained and informed written consent was takenfrom each patient.
All the patients considered for the study were in theage group of 35 to 55 years to exclude any old agerelated abnormality of the cardiovascular or neuralsystem. Since no female patient was reported duringthe study period, all the cases in our study weremales. A detailed clinical history was taken fromeach patient and their attendants. All of them gavea strong history of regular consumption of alcoholfor more than ten years. Also, thorough general aswell as systemic examinations including neurologicalexamination were performed to exclude any other
Introduction
Alcohol ic l i ver d isease is the most dreadedcomplication of alcohol abuse. The prevalence ofalcoholic liver disease is alarmingly rising all overthe world (1), including the North-Eastern part ofIndia, especially in Assam. Alcohol is thought to beone of the commonest factors in today’s world tocause autonomic imbalance (2). The patients withalcoholic liver disease show various signs andsymptoms of autonomic imbalance at times; someof them complain of light headedness on standing,while others complain of exercise intolerance andsome others also complain of erectile dysfunction(3) . Unfor tunate ly, many a t imes, autonomicneuropathy causes sudden death in alcoholic patientswho rem ain und iagnosed (4, 5 ) . Autonom icneuropathy is often an ignored complication ofalcoholic liver disease as the symptoms associatedwith it are usually mild and seem to be not lifethreatening.
Keeping in mind the risk of development of suddendeath in alcoholic l iver disease patients, earlydiagnosis and effective management are very muchnecessary to improve survival and progress in thesepatients.
Diagnosis of cardiovascular autonomic neuropathy(CAN) in Alcoholic liver disease (ALD) is done onthe basis of Autonomic function tests, which testthe autonomic reactivity. The criteria for diagnosishad been put forward by Ewing (6) and Bellavere (7).According to Ewing’s criteria, five tests are performedfor bo th parasym pathet ic and sym pathet iccomponents, while Bellavere’s criteria are based onlyon the three tests for parasympathetic components.The autonomic functions in alcoholic liver diseasehave been a matter of research (5, 8–11), especiallyin the last three decades or so in many parts of theworld but no study regarding cardiovascular autonomicneuropathy in alcoholic liver disease in the Northeastern part of India have been reported till now asper the best of our knowledge. Since the number ofalcoholic liver disease patients is rising higher andhigher with time, this study has been undertaken toassess the pattern and prevalence of cardiovascularautonomic neuropathy in alcoholic liver disease

322 Deka, Das and Bora Indian J Physiol Pharmacol 2018; 62(3)
factor which might affect the autonomic reactivity ofthe patients. Blood glucose was estimated in allthese patients to exclude diabetic patients. Patientswith liver disease of non-alcoholic origin wereexcluded from the study.
A group of 40 healthy, non-alcoholic, non-diabeticindividuals within the same age group as the patientswere involved in the study as controls.
To assess the cardiovascular autonomic functions,all five standard autonomic function tests describedby Ewing were done. Immediate heart rate responseto standing (30:15 ratio), heart rate variation duringdeep breathing and heart rate response to Valsalvamaneuver test the parasympathetic system whileblood pressure response to standing and bloodpressure response to sustained hand grip test thesympathet ic system. The cr i ter ia for Normal,Borderline or Abnormal for each test along with theirscores are shown in Table II.
Immediate heart rate response to standing (30:15 ratio)
The heart rate was being recorded continuously inthe supine position with an Electrocardiogram (BPL).The subject was asked to stand unaided within 3seconds. The ECG was continuously recorded duringthe procedure. The point at starting to stand wasmarked on the ECG. The characteristic heart rateresponse was expressed as 30:15 ratio. It wascalculated from the shortest R-R interval at or aroundthe 15th beat and the longest R-R interval at or aroundthe 30th beat after starting to stand up.
Deep breathing test (DBT)
The patient was asked to take slow and deepinspiration followed by slow and deep expiration sothat each breathing cycle is of 10 seconds (5seconds inspiration and 5 second expiration). ECGwas continuously recorded throughout the procedureand onset of each inspiration and expiration wasmarked on the ECG paper. The difference betweenthe maximal and minimal heart rate during inspirationand expiration respectively averaged for 6 cycles(Delta heart rate) was calculated.
Valsalva maneuver
This maneuver was performed in sitting position. Thepatient was asked to blow into a mouthpieceattached to Sphygmomanometer. The expiratorypressure was maintained at 40 mmHg for 15 seconds(or till the patient could bear the strain). At the endof 15 seconds the patient was asked to release thepressure. A continuous ECG was recorded throughoutthe maneuver. Valsalva Ratio (VR) was calculatedfrom the longest R-R interval during Phase IV andthe shortest R-R interval during phase II.
Blood Pressure response to sustained handgrip
The baseline Blood Pressure was taken before themaneuver. A LABOMED handgrip dynamometer wasused to determine the maximum voluntary contraction(MVC). The patient was asked to maintain thehandgrip at 30% of his MVC for 4 minutes. The bloodpressure was recorded at the 1st, 2nd and 4th minuteof contraction. The rise in the diastolic bloodpressure above the baseline was noted.
Blood Pressure response to standing
This test was conducted after 10 minutes of supinerest. The basal blood pressure was measured andthen the patient was asked to attain standing posturewithin 3 seconds without any support. Blood pressurewas measured at 0.5th, 1st, 2nd, 2.5th and 5th minute.The fall in Systolic blood pressure was calculated.
Scoring and categorization of the patients
1. Ewing’s method (6)
Five tests as shown in Table II were used for scoring.CAN was classified into Normal, Early and Severeon the basis of the scoring.
Normal – all tests normal or 1 test Borderline
Early – 1 of the parasympathetic tests Abnormal or2 Borderline
Definite – 2 heart rate tests Abnormal

Indian J Physiol Pharmacol 2018; 62(3) Cardiovascular Autonomic Neuropathy in Alcoholics 323
Severe – 2 heart rate tests Abnormal + 1 or both BPtests Abnormal
2. Bellavere’s method (7)
Only the 3 tests done for parasympathetic systemwere used for scoring (Table I)
I. Deep breathing test (Delta HR)
II. Valsalva maneuver (Valsalva ratio)
III. Lying to standing test (30:15 ratio)
Scoring was done by adding the scores for eachtest and CAN was classified as follows :
0 – 1 = no CAN
2 – 3 = early CAN
4 – 6 = definite CAN
Results
Different cardiovascular autonomic function testsmentioned above have been carried out in GauhatiMedical College & Hospital and the different scoreshave been recorded. Mean, standard deviationetc. were calculated using MS Excel. To makecomparison between the case and control groupswith respect to the different parameters, p-value wasdeterm ined by applying Z- tes t. The value ofsignificance was found to be at p<0.05.
Table I shows the significant difference of autonomicfunction test results between the case and the controlgroups.
The results of each of the five autonomic functiontests on the patients are shown in Table III. Themost affected function in our study is the heart rateresponse to lying to standing, 40% of the casesshowed abnormal 30:15 ratio. Similarly, Blood
TABLE II : Cardiovascular Autonomic function tests with cut-off limits and scores (6, 7, 14).
Test Parameter Criteria Category Score
Heart rate response to 30:15 ratio >1.04 Normal 0Lying to standing 1.01-1.03 Borderline 1
<1.01 Abnormal 2
Deep breathing test (DBT) Delta heart rate (bpm) >15 Normal 011-14 Borderline 1<10 Abnormal 2
Valsalva Maneuver Valsalva ratio (VR) >1.2 Normal 011.11-1.20 Borderline 1
<1.10 Abnormal 2
BP response to lying to standing Fall in systolic pressure (mmHg) <10 Normal 011-29 Borderline 1>30 Abnormal 2
Handgrip test (HGT) Change in diastolic pressure (mmHg) >16 Normal 011-15 Borderline 1<10 Abnormal 2
TABLE I : Mean distribution of different Autonomic parameters among case and control groups.
Parameters Case (n=60) Control (n=40) Value of Z-test Statistical significance
Heart rate response to standing (30:15 ratio) 0.95±0.15 1.27±0.31 6.07 SignificantDeep breathing test (breaths/min) 13.53±5.71 18.80±3.16 5.92 SignificantValsalva ratio 1.17±0.09 1.25±0.02 6.64 SignificantBlood pressure response to standing (mmHg) 13.30±11.0 5.65±2.53 5.19 SignificantHand grip test (mmHg) 17.0±5.45 19.2±2.56 2.71 significant
All values of case and controls are expressed in Mean±SD.

324 Deka, Das and Bora Indian J Physiol Pharmacol 2018; 62(3)
pressure response to Handgrip test was found to bethe least affected one with abnormality percentageof 13%. Our study did not find any pure sympatheticabnormality.
The scoring and categorization of CAN on the basisof Ewing’s and Bellavere’s criteria are shown in TableIV and Table V respectively. It has been shown thatonly 46 patients (76.66%) were found to have CANwhen we used Bellavere’s criteria but all of the 60patients (100%) were diagnosed as having CAN whenwe used Ewing’s criteria. This f inding can beattributed to the fact that Bellavere’s criteria consideronly the results of the parasympathetic function tests,while Ewing’s criteria consider both Sympathetic and
parasympathetic function tests.
The lates t L iver funct ion tes t repor ts of thepatients as collected from the laboratory werestudied and various deranged results were found tobe present. Table VI shows the LFT profile of thepatients.
Discussion
The present s tudy evaluates the pattern andprevalence of CAN among alcoholic liver diseasepatients of Assam, which is the first of its kind fromthe North east India as per the best of our knowledge.In contrast to diabetic autonomic neuropathy, whichhas been inves t iga ted in num erous s tud ies ,cardiovascular autonomic neuropathy (CAN) inalcohol ics has at t rac ted l i t t le at tent ion (12) .Published figures on the frequency of CAN amongstalcoholics vary between 16 and 77% (12). A studyby Bajaj et al (13) on 20 CLD patients showed that16 out of 20 (80%) had autonomic dysfunction.In their study, 40% had combined parasympatheticand sym pathet ic damage and 40% had onlyparasym pathet ic dam age. Another s tudy bySingh et al (11) found autonomic dysfunction canoccur in patients with liver damage, irrespective ofthe etiology. They found autonomic dysfunction in80% alcoholic and 70% of non-alcoholic liver diseasepatients.
Khandelwal et al (14) studied the pattern andprevalence of cardiovascular autonomic neuropathyin diabetic patients. They used three different scoringsystems for CAN; the Ewing’s criteria, Bellavere’scriteria and the criteria used at the AFT Lab in AIIMS,New Delhi. They found 53 of total 124 patients hadCAN when Bellavere’s criteria was used but with
TABLE III : Results of each of the Autonomic function tests of the patients (on the basis of criteria mentioned in Table I).
Test Parameter Total (n) Normal Borderline Abnormal Ab%
HR response to lying to standing 30:15 ratio 60 30 6 24 40Deep breathing test Delta HR 60 21 22 17 28Valsalva maneuver VR 60 27 15 18 30BP response to lying to standing Fall in Systolic BP 60 42 3 15 25Handgrip test Rise in Diastolic BP 60 49 3 8 13
Ab% = percentage of patients showing abnormal test result.
TABLE VI : LFT profile of the patients.
Parameters Patients (n=60)
Total Bilirubin (mg/dl) 2.31±1.45SGOT (U/L) 143.07±75.88SGPT(U/L) 108.40±45.82Alkaline phosphatase(U/L) 265.70±125.12Albumin (gm/dl) 2.43±0.63Hb (%) 8.44±1.03
All values expressed in Mean±SD
TABLE IV : Categorization as per Ewing’s criteria.
Category Number of patients
Normal 00Early 17Definite 25Severe 18
TABLE V : Categorization as per Bellavere’s criteria.
Category Number of patients
Normal (Score 0-1) 14Early (Score 2-3) 11Definite (Score 4-5) 35

Indian J Physiol Pharmacol 2018; 62(3) Cardiovascular Autonomic Neuropathy in Alcoholics 325
Ewing’s criteria 100 patients showed evidence of CANwhile 69 could not be categorized. The criteriafo l lowed in AFT Lab, AIIMS showed iso latedparasympathetic, sympathetic and combined CANin these patients. The present study is similar totheir study. W e have used both Ewing’s andBellavere’s criteria for the scoring of the alcoholicliver disease patients. We found 46 out of 60 patientshad CAN when Bellavere’s criteria was used but withEwing’s criteria all the 60 patients were showed tohave CAN.
Another study by Jain et al (5) observed themagnitude and pattern of autonomic neuropathy inliver cirrhosis where they involved cirrhotic patientsi r respect ive of et io logy. They used only theBellavere’s cr i teria for scor ing the autonomicneuropathy. They found that 70.9% of the cirrhoticpatients had autonomic neuropathy.
The patients with Alcoholic liver disease involved inthis study were randomly selected from the hospitalirrespective of the duration of disease symptoms andseverity of the disease, as there are conflictingrepor ts about the assoc ia t ion o f au tonom icneuropathy and severity of liver disease (5). So, weconcluded with our findings that CAN may developin any stage of liver cirrhosis and increases themorbidity and mortality in alcoholic patients. One ofthe commonest cause of sudden death in alcoholicsis occurrence of CAN which may lead to silent
myocardial infarction, cardio-respiratory arrest,prolongation of QT interval and arrhythmia (5).
It is recommended that all patients with a diagnosiso f a lcohol ic l i ver d isease shou ld a lways betes ted fo r CAN to avo id i ts l i f e th reaten ingcomplications.
Limitation of the study
This study evaluated only the pattern and prevalenceof cardiovascular autonomic neuropathy in alcoholicliver disease patients but could not comment whetherthe actual cause leading to CAN is the liver damageor its etiology, ie. Alcohol. Further study with largersample size with cirrhotic patients of various etiologycan throw more light on this matter.
Acknowledgements
We sincerely acknowledge Professor Biju Choudhuryof Department of Physiology and Professor SangitDutta of Department of Medicine, Gauhati MedicalCollege and Hospital for their constant guidance andencouragement during the study. We also expressour gratitude to Dr. Bidula Sarma for her help in thestatistical analysis of the data. We cannot pen downwithout acknowledging the cooperation of the patientsand their attendants in spite of their physical andmental agony.
References
1. Gururaj G, Pratima Murthy, Girish N & Benegal V. Alcoholrelated harm: Implications for public health and policy inIndia, Publication No. 73, NIMHANS, Bangalore, India 2011.
2. Merritt’s Textbook of Neurology. In: Lewis O Rowland. 9th
Edition.
3. Ravaglia S, Marchioni E, Costa A, Maurelli M and MogliaA. E rec t i l e impotence as a s en t i ne l s ym ptom forcardiovascular autonomic neuropathy in heavy- drinkers.J Peripheral Nervous System 2004; 9(4): 209–214.
4. Kempler P, Varadi A, Szalay F. Autonomic neuropathy inliver disease. Lancet, 1989 Dec 2; 2(8675): 1332.
5. Jain J, Banait S, Singh R, Udan V and Rao T. Magnitudeand pattern of Autonomic neuropathy in Cirrhosis of Liver:A cross- sect ional study f rom Central rural India. JMahatma Gandhi Institute of Med Sci. March 2015; 20(1):66–73.
6. Ewing DJ, Clarke BF. Diagnosis and management ofdiabetic autonomic neuropathy. Br Med J (Clin Res Ed)1982; 285(6346): 916–918.
7. Bellavere F, Bosello G, Fedele D, Cardone C, Ferri M.Diagnos is and management o f d iabet ic autonom icneuropathy. Br Med J (Clin Res Ed) 1983; 287(6384): 61
8. Thuluvath PJ, Triger DR. Autonomic neuropathy andchronic liver disease. Q J Med 1989 Aug; 72(268): 737–747.
9. Hendrickse MT, Thuluvath PJ, and Triger DR. Natural historyof autonomic neuropathy in chronic liver disease. Lancet1992 Jun 13; 339(8807): 1462–1464.
10. Lindgren S, Lil ja B, Verbaan H, Sundkvist G. Alcoholabuse exaggerates autonomic dysfunction in chronic liverdisease. Scand J Gastroenterol 1996 Nov; 31(11): 1120–1124.

326 Deka, Das and Bora Indian J Physiol Pharmacol 2018; 62(3)
11. Singh G, Singh K, Manchanda KC, Sharma RS. Assessmentof Autonomic Nervous Activity in Chronic Liver Disease.Biomedical Research 2011; 22(1): 85–89.
12. Agelink MW, Malessa R, Weisser U, Lemmer W, Zeit T,Majewski T and Kle isser E . A lcohol ism , per ipheralneuropathy (PNP) and Cardiovascular neuropahy (CAN).J Neurol Sci 1998 Dec; 161(2): 135–142.
13. Bajaj BK, Agarwal MP and Ram BK. Autonomic neuropathyin patients with hepatic cirrhosis. Postgrad Med J 2003Jul; 79(933): 408–411.
14. Khandelwal E, Jaryal AK, Deepak KK. Pat tern andPrevalence of Cardiovascular Autonomic Neuropathy inDiabetics visiting a Tertiary Care Referral centre in India.Indian J Physiol Pharmacol 2011; 55(2): 119–127.
Indian J Physiol Pharmacol 2018; 62(3) Effect of Adenosine Antagonist on Ulcerative Colitis Rats 327
Original Article
Protective Effect of A2B Receptor Antagonist (TRP 2) onAcetic Acid Induced Ulcerative Colitis in Rats: In vitro,in vivo and in silico Methods
P. Praveen Kumar1*, G. Santhosh2, M. Sri Chandana2,K. Prasad2, M. Raghu Prasad3 and S. Khasim3
1Department of Pharmacology,CES College of Pharmacy,Kurnool – 518 218
2Department of Pharmacology,Shri Vishnu College of Pharmacy,Bhimavaram, Andhra Pradesh – 534 202
3Department of Pharmaceutical Chemistry,Shri Vishnu College of Pharmacy,Bhimavaram, Andhra Pradesh – 534 202
Abstract
Present study was designed to elucidate the protective effect of pyridinone derivatives such as 7-amino-5-oxo- 2- (4-hydroxy-phenyl) -5H,8H-dihydro-[1,2,4] triazolo [1,5-] pyridine - 6- carbonitril (TRP 2) againstacetic acid induced ulcerative colitis in rats by In vitro, in vivo and in silico methods. In vitro, Radioligandbinding assay on human adenosine receptors (A2B) revealed that at a concentration of 3000nm thesereceptors were antagonized. TRP 2 significantly neutralizes the free radicals of DPPH, SO, NO and LPO atIC
50 300 µg/ml, 100 µg/ml, 50 µg/ml and 5 µg/ml respectively. In vivo, Intra rectal administration of acetic acid
caused a significant increase on macroscopic score, colon weight, colonic MPO, TNF-, IL 6 and IL 1levels, while TRP 2 treated colitis rats has exhibited improved glutathione and catalase antioxidant activity,furthermore TRP 2 exhibited inhibitory action on TNF , IL 1, IL 6 and the myeloperoxidase activity. Insilico, IC
50 of TRP 2 against IL 1, IL 6 and TNF- were 3.04 mM, 39.21 mM and 48.35 mM respectively.
TRP 2 treatment improved clinical score in acetic acid induced colitis in rats by reducing the inflammatorymediators and subsequent improvement of antioxidant activity in colitis rats through A2B receptor antagonistproperty.
Indian J Physiol Pharmacol 2018; 62(3) : 327–338
*Corresponding author :
Dr. Praveen Kumar P., Department of Pharmacology / CESCollege of Pharmacy, Kurnool 518218 / Contribute experimentalpart; E-mail: [email protected]
(Received on January 1, 2018)
Introduction
IBD, including Crohn’s disease (CD) and ulcerativecolitis (UC), is a lifelong disabling gastrointestinaldisease (1). Although etiology of inflammatory bowel

328 Kumar, Santhosh, Chandana, Prasad, R. Prasad and Khasim Indian J Physiol Pharmacol 2018; 62(3)
the present study was undertaken to determine thepossible mechanism of action of TRP 2 on the aceticacid induced ulcerative colitis in Wistar rats.
Materials and Methods
Mater ia ls
Adult male Wistar rats (200-250 g) were purchasedfrom Mahaveer enterprises, Hyderabad. The animalroom was maintained at 22oC–24oC and a lightingregimen of 12 hour light/12 hour dark. Rats were fedwith standard house chow and water ad libitum. Allanimal experiments were performed after getting priorapproval f rom the Ins t i tut ional Animal EthicsCommittee (439/PO/01/a/CPCSEA). TRP 2 procuredfrom Chemistry department (Shri Vishnu college ofPharmacy), acetic acid (Loba Chemie), NBT- (LobaChemie), reduced glutathione (Otto Chemie), trichloroacetic acid (Loba Chemie). ethylenediamino tetraacetic acid (Loba Chemie). O-Dianisidine (LobaChemie) . 2,2 Dipheny p ic ryl hydrazyl (SiacoResearch laboratory Pvt.Ltd.), 5, 5 DithioBis 2 Nitrobenzoic acid -Siaco Research laboratory Pvt. Ltd,TNF , IL-1 and IL-6 (Ray Biotech inc.). [3H] CCPA([3H]2-chloro-N6-cyclopentyladenosine) was obtainedfrom NEN Life Sciences (48.6 Ci/mmol),. All otherchemicals used were of analytical grade.
In vitro Studies
Radioligand binding studies
Binding at human A1, A
2A and A
3 ARs Binding studies
at hA1, hA
2A, and hA
3 ARs were carried out by method
of Klotz KN et al., 1997 (15). Chinese hamster ovary(CHO) cells stably transfected with human (h) A
1,
A2A
, and A3 ARs subtypes were used for the
preparation of membranes for radioligand bindingstudies, 10 nM [3H]-5’-N-ethylcarboxamido adenosine( [3H] NECA) used as rad io l igands for hA
2B.
Nonspecific binding of [3H]CCPA was determined inpresence of 1 mM theophylline, while 100 µM (R)-N6-phenyliso-propyladenosine (R-PIA) was used for[3H]NECA. Calculation of Ki values from competitionexperiments was carried out by using the programSCIFIT (38).
disease (IBD) is unknown it appears that an abnormalresponse of the mucosal innate immune system toluminal bacteria may trigger inflammation which isperpetual by disregulation of cellular immunity (2)and imbalances between proinflammatory cytokines,such as TNF-, IFN-, IL-1, IL-6, and IL-12, andanti-inflammatory cytokines like IL-4, IL-10, IL-11.Therapeutic agents for IBD which include anti-inflammatory agents such as 5-aminosalicylates(5-ASA) and cort icosteroids a long with someim m unomodula tors l ike azath iopr ine , 6 -mercaptopurine were used. However treatments areassociated with severe adverse events includingdiarrhea, cramps, abdominal pain accompanied byfever and high blood pressure (2). Thus, there is aneed to develop new therapeutic options with lowtoxicity and minimal side effects. In the search fornovel therapeutic options, increasing attention isbeing paid to the adenos ine system and i tsinvolvement in the pathophys io logy of IBDs.Extracellular adenosine binds to adenosine receptors(AR) 1, 2A, 2B and 3, which are expressed on thesurface of immune cells. A
2B R are highly expressed
in the cecum and colon, esophagus, stomach, andjejunum but appears to be absent in the ileum (3).Inflammatory mediators like TNF, IL6 are increasedin the intestinal mucosa, serum and stools ofpatients with IBD through up regulation and overexpression of A
2B receptors (4, 5, 6). Past scientific
s tudies suppor ted that fused pyr id inone r ingder iva t ives were found to be a versa t i lepharmacophore with wide range of useful biologicalactivities due to adenosine receptors antagonizingproperty (7, 8, 9) and the ameliorated inflammatoryrate (10). Hence A2
B R are great deal of interest, its
primary molecular target and its mechanism of actionremain to be clarified.
The present study evaluated the protective effect ofpyridinone derivatives like 7-amino-5-oxo- 2- (4-hydroxy-phenyl) -5H,8H-dihydro-[1,2,4] triazolo [1,5-] pyridine - 6- carbonitril on colitis rats. Currently,few of the experimental animal models are used tostudy the pathogenesis and pathophysiology of theinflammatory bowel disease. Acetic acid inducedcolitis in rats is one of the common models in IBDresearch and resembles human ulcerative colitis inhistology (11, 12, 13, 14). to test our hypothesis,

Indian J Physiol Pharmacol 2018; 62(3) Effect of Adenosine Antagonist on Ulcerative Colitis Rats 329
Ki = IC
50 (1+Ak/K
p)
IC50
Is the concentration of antagonist producing 50%inhibition; A is the concentration of agonist againstwhich the IC
50 is being determined; K
p is the apparent
equilibrium constant of the agonist.
Adenylyl cyclase activity:
Adenylyl cyclase activity due to the lack of a highaffinity radioligand for A
2B AR adenylyl cyclase
experiments were carried out as a measure of affinityfor hA
2B AR by model of Cheng HC 2001 (38).
Membranes were prepared from CHO cells stablytransfected with hA
2B ARs followed by incubation with
100 nM NECA as well as 150,000 cpm of [-32P]ATP. All the target compounds were tested atdifferent concentration for 20 min in the incubationm ix ture wi thout us ing EGTA (e thyleneglycoltetraacetic acid) and NaCl. None of thecompounds showed measureable interaction with thehA
2B AR (IC50 values > 90 µM; data not shown).
Antioxidant activity
Antioxidant activity was tested by scavenging ofDPPH* assay by method of Blois MS 1958 (16),NO* assay by method of Sreejayan N et al., 1997(17), SO* assay by method of Liu F et al., 1997(18), Fe+2 ascorbate induced lipid peroxidation assayby method of Ohkawa H et al., 1997(19).
Estimation in anti inflammatory activity using humanred blood cells (HRBC) method of Azeem AK et al., 2010(20)
Blood was collected from the healthy volunteers andmixed with equal volume of sterilized Alseverssolut ion (composit ion Glucose 20.5 g, Sodiumchloride 4.2, Tri-sodium citrate 8.0 g, citric acid0.55 g, distilled water 1000 mL). Blood solution wascentrifuged at 3000 rpm and the packed cells wereseparated, then washed with isosaline (0.85%; PH7.2) solution and a 10% v/v suspension was madewith isosaline. This HRBC suspension was used forthe estimation of anti-inflammatory property. Differentconcentrations of TRP-2 (100 ng/ml, 1 µg/ml, 10 µg/m l , 100 µg/m l and 1000 µg/m l ) , s tandardSulfasalazine and control were separately mixed with
1 ml of phosphate buffer (0.15 M, pH 7.4), 2 mL ofhyposaline (0.36%) and 0.5 mL of HRBC suspension.All the assay mixtures were incubated at 37°C for30 min and centrifuged at 3000 rpm. The supernatantliquid was decanted and the hemoglobin content wasestimated by a spectrophotometer at 560 nm. Thepercentage hemolysis was estimated by assuring thehemolysis produced in the control as 100%. Insteadof hyposaline 2 mL of distilled water was employedas control. The anti inflammatory potency wasestimated by measuring % of inhibition of hemolysis
% of Hemolysis = [1- (ABSsample
/ ABScontrol
)] x 100.
Acute toxicity
The acute oral toxicity was carried out as per theguidelines set by Organization for Economic Co-operation and Development (OECD), revised draftguidelines 423, received from Committee for thePurpose of Control and Supervision of Experimentson Animals (CPCSEA), Ministry of Social Justiceand Empowerment, Government of India.
In vivo studies
Study the protective effect of TRP 2 on acetic acidinduced ulcerative colitis by method of Rashidian A etal., 2014 (21).
Animals were divided into five groups (n = 6). In thisstudy Sulfasalazine used as standard compound dueto their potential anti inflammatory activity againstulcerative colitis in rats and also used clinically (22).
Group I: Serve as sham control
Group II: Rats were pretreated with DMSO for 14thdays and 2 ml of 3.0% acetic acid administeredintra rectally on 14th day
Group III: Rats were pretreated with Sulfasalazine(360 mg/kg bd.wt. p.o.) for 14 days and 2 ml of3.0% acetic acid administered intra rectally on 14th
day.
Groups IV Rats were pretreated with TRP 2 (1 mg/kg bd.wt. p.o) for 14 days and 2 ml of 3.0% aceticacid administered intrarectally on 14th day.

330 Kumar, Santhosh, Chandana, Prasad, R. Prasad and Khasim Indian J Physiol Pharmacol 2018; 62(3)
Groups V Rats were pretreated with TRP 2 (10 mg/kg bd.wt.p.o) for 14 days and 2 ml of 3.0% aceticacid administered intra rectally on 14th day.
Assessments of col i t is
Animals were scarified at the end of treatment, thedistal 10 cm portions of the colon were removed andcut longitudinally, cleaned with physiological salineto remove fecal residues.
Macroscopic inflammation scores are assigned basedon the clinical features of the colon using an arbitraryscale ranging from 0 to10 as follows :
0 = No damage,
1 = Focal hyperemia (water oozes out),
2 = Ulcerization without hyperemia or bowel wallthickness,
3 = Ulcerization with inflammation at one site,
4 = Ulcerization with inflammation at two sites,
5 = Major sites of inflammation >1 cm along theorgan with redness,
6 = Major sites of inflammation >2 cm along theorgan with redness,
7 = Major sites of inflammation >3 cm along theorgan with redness,
8 = Major sites of inflammation > 4 cm along theorgan with redness,
9 = Major sites of inflammation >5 cm along theorgan with redness and bleeding, and
10 = Major sites of inflammation >6cm along theorgan with redness, swelling, and bleeding (23).
Biochemical assays
The colorectal tissue was collected, homogenized in10 mM Tris-HCl buffer (pH7.1). The homogenate wasused for the measurement of antioxidant enzyme
levels such as catalase (24), glutathione (25), colonicMPO activity (26), inflammatory cytokines such asTNF-, IL-1 and IL-6 (Ray Biotech Inc., US) usingstandard sandwich enzyme-linked immune sorbentassay (ELISA) kit specific for rat cytokines accordingto the manufacturer’s instruction.
Histopathological assessment of colitis
Colonic specimens were fixed in 10% formalin inphosphate buffered saline, embedded in paraffin, afterseveral steps to induce dehydration in alcohol,sections of 4-ìm thickness were prepared and stainedwith hematoxylin and eosin (H&E). Thereafter,histopathological analysis was carried out using aEVOS-xl CORE light microscope (AMG, Bothell,WA).All samples were analyzed in a blinded manner. Acertified histopathologist performed all analyses/interpreted the observed outcomes.
In silico method
To evaluate the compound TRP 2 binding capacityby using AUTODOCK 4.2 version and the imagesare rendered using Accelry’s Discovery studiovizualizer v4.0 interface.
Statistical analysis
All data values are expressed as Mean±SD.Statistical analyses were performed using a one-way analysis of variance (ANOVA) followed byDunnett’s test, using (Graph pad version 5.0)*P<0.05, **P<0.01, ***P<0.001 were considered asstatistically significant.
Results
Effect on human adenosine receptors by radio ligandbinding studies
Table I shows that the compound TRP 2 exhibited
TABLE I : Act ivity of the compound TRP 2 on radioligandbinding affinity towards human adenosine receptors.
S. No. Compound hA2B(k1nm)
1 TRP 2 30,000

Indian J Physiol Pharmacol 2018; 62(3) Effect of Adenosine Antagonist on Ulcerative Colitis Rats 331
inhibitory concentration toward A2B receptors at 30nM.
Effect on human RBC lysis using HRBC membranestabil ization.
Table II, Fig. 1 shows that at the dose of 1000 µg/ml of TRP 2 exhibited 42.3±1.3% protection of HRBCin hypotonic solution. All results were compared withSulfasalazine which showed 49.8±2% protection.
Effect on free radical scavenging activity:
Table III, Fig. 2 showed that, TRP 2 exhibited EC50
for DPPH* (300 µg/ml), NO* (100 µg/ml), SO* (50µg/ml) and LPO (5 µg/ml).
Acute toxicity:
TRP 2 treated rats were safe upto the dose level
2000 mg/kg bd.wt. as per OECD guidance 423. Atthe dose level of 300 mg/kg bd.wt. and 2000 mg/kgbd.wt. treatnent exhibited sedation.
Effect on colon parameters.
Table IV, Figs. 3, 7 shows that the end of thetreatment, acetic acid administered rats exhibitedsevere macroscopic edematous inflammation in thecolon. The inflammation score and weight of colonwere significantly (***P<0.001) increased in colitisrats 8.3±0.7, 2.9±0.3. Pre treatment of TRP 2 at thedose (10 mg/kg bd.wt.) showed significant decreasein (*P<0.05) in inflammation score and weight ofcolon. Intrarectal administration of acetic acid treatedrats showed significant increase in content of MPO(43±1.28, **P <0.01) and decrease colonic catalase(19± 0.31, **P<0.01) when compared to normal rats.At the dose of 10 mg/kg bd.wt. TRP 2 significantly( *P<0.05) reduces the a l te ra t ion in these
TABLE II : In vitro anti inflammatory activity of TRP 2 by using HRBC membrane stabilization method.
S. No. Sample µg/ml
0.1 1 10 100 1000
1 Sulfasalazine 11.2±1.3 13.1±1.2 20.3±1.45 32.3±2.3 39.8±3.12 TRP 2 9.3±0.32 14.3±0.76 16.8±0.34 20.65±0.76 42.3±1.3
Sulfasa
lazin
e
TRP 2
0
10
20
30
40
500.1 µg/ml1 µg/ml10 µg/ml100 µg/ml1000 µg/ml
% o
f Hem
olys
is
Fig. 1 : In vitro anti inflammatory activity of TRP 2 by using HRBC membrane stabilization method.

332 Kumar, Santhosh, Chandana, Prasad, R. Prasad and Khasim Indian J Physiol Pharmacol 2018; 62(3)
TABLE III : Effect of TRP 2 on free radicals scavenging activity.
S. No. Concentrations DPPH* free radicals NO* free radicals SO* free radical Lipid peroxidation activity(µg/ml) (% of Inhibition) (% of Inhibition) (% of Inhibition) (% of Inhibition)
1 0.1 24.5±1.7 15±0.5 35±0.21 27±2.02 1 32±1.04 25±1.32 40±1.0 46±1.323 10 45.6±1 45±1.52 45±1.20 51±1.254 100 47±0.5 50±2.5 55±1.52 57±1.925 1000 52±1.5 62±1.2 60±1.32 63±2.08
IC50
300 µg/ml 100 µg/ml 50 µg/ml 5 µg/ml
TABLE IV : Effect of TRP 2 on colon parameters in acetic acid induced colitis rats.
S. No. Treatment Inflammation Weight of Colonic MPO Colonic Catalase Colonic GSHgroup score colon (gm) Levels (U/ml) levels (U/ml) levels (µg/ml)
1 Sham control 0±0 1.6±0.11 16.9±0.24 29.3±1.14 9.2±0.172 Diseased group 8.3±0.70***a 2.9±0.13***a 43±1.25***a 19.1±0.51***a 2.9±0.16***a
3 Sulfasalazine (360 mg/kg bd. wt.) 3.9±0.4*b 1.4±0.5*b 22.08±0.8*b 24.5±0.3*b 4.2±0.1*b
4 TRP 2 (1 mg/kg bd. wt.) 6.3±0.52 2.4±0.08 35.9±0.80 22±0.55 4.1±0.135 TRP 2 (10 mg/kg bd. wt.) 4.3±0.57**b 2.1±0.07**b 25.7±0.88**b 24.5±0.85**b 5.4±0.08**b
Data are expressed as Mean±SD, from six groups of rats and analyze by one way ANOVA fallowed by Dennett’s test.*P<0.05, **P<0.1, ***P<0.001; a compare with sham control, b compared with disease group.
0.1
µg/m
l
1 µg
/ml
10 µ
g/ml
100
µg/m
l
1000
µg/m
l0
20
40
60
80DPPH* free radicalsNO* free radicalsSO* free radicals
lipid peroxidation activity
Con.
% o
f fr
ee r
adic
als
inhi
biti
on
Fig. 2 : Effect of TRP 2 on free radicals scavenging activity.
biochemicals parameters when compared to colitisrats.
Effect on cytokines TNF- , IL-1 and IL-6 levels.
Pro inflammatory cytokines TNF-, IL 1 and IL-6
levels were significantly increased in acetic acidtreated rats compared with those in the sham controlgroup (***P<0.001). TRP 2 treated rats significantlyreduced increased TNF-, IL 1 and IL-6 in colitisrats. TRP 2 (1 and 10 mg/kg) decreases the level ofTNF- from 3800±54.9 pg/g tissue to 2700±42.8
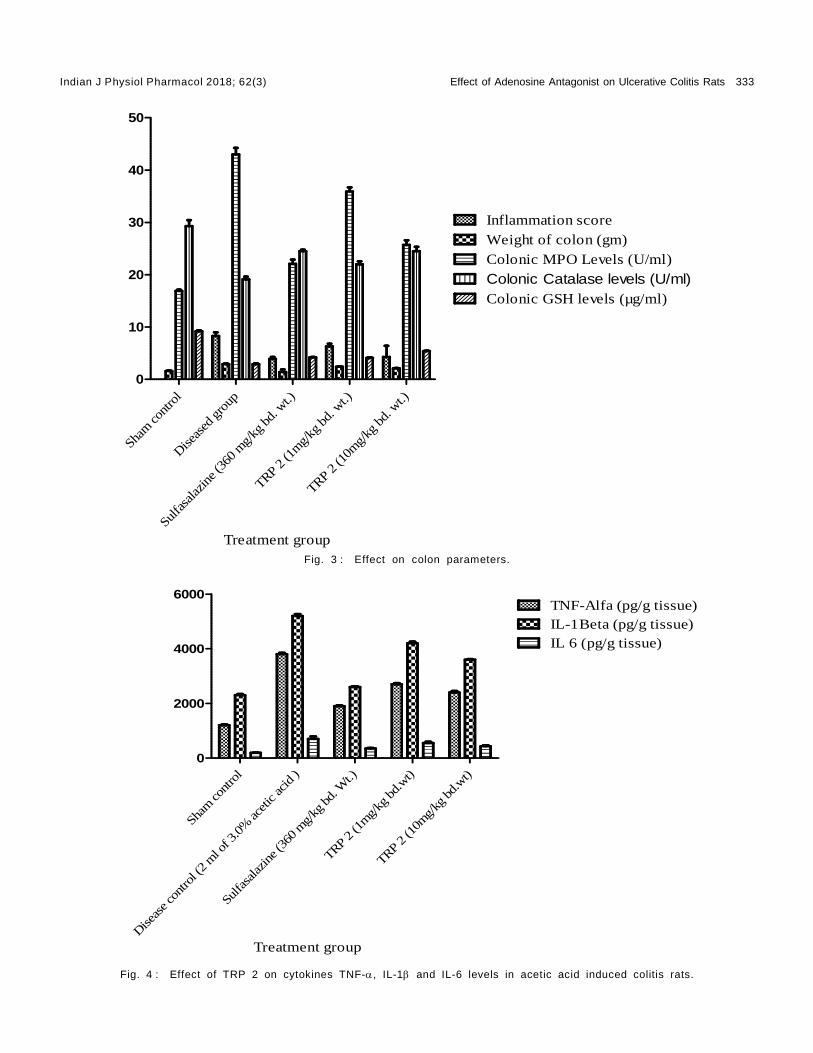
Indian J Physiol Pharmacol 2018; 62(3) Effect of Adenosine Antagonist on Ulcerative Colitis Rats 333
Sham
cont
rol
Diseas
ed gro
up
Sulfa
salaz
ine (
360
mg/
kg bd.
wt.)
TRP 2 (1
mg/
kg bd. w
t.)
TRP 2 (1
0mg/
kg bd. w
t.)0
10
20
30
40
50
Inflammation scoreWeight of colon (gm)Colonic MPO Levels (U/ml)
Colonic Catalase levels (U/ml)Colonic GSH levels (µg/ml)
Treatment groupFig. 3 : Effect on colon parameters.
Sham
cont
rol
Diseas
e con
trol (
2 m
l of 3
.0%
aceti
c acid
)
Sulfa
salaz
ine (
360 m
g/kg
bd. W
t.)
TRP 2 (1
mg/
kg bd.wt)
TRP 2 (1
0mg/
kg bd.wt)
0
2000
4000
6000TNF-Alfa (pg/g tissue)IL-1Beta (pg/g tissue)IL 6 (pg/g tissue)
Treatment group
Fig. 4 : Effect of TRP 2 on cytokines TNF-, IL-1 and IL-6 levels in acetic acid induced colitis rats.
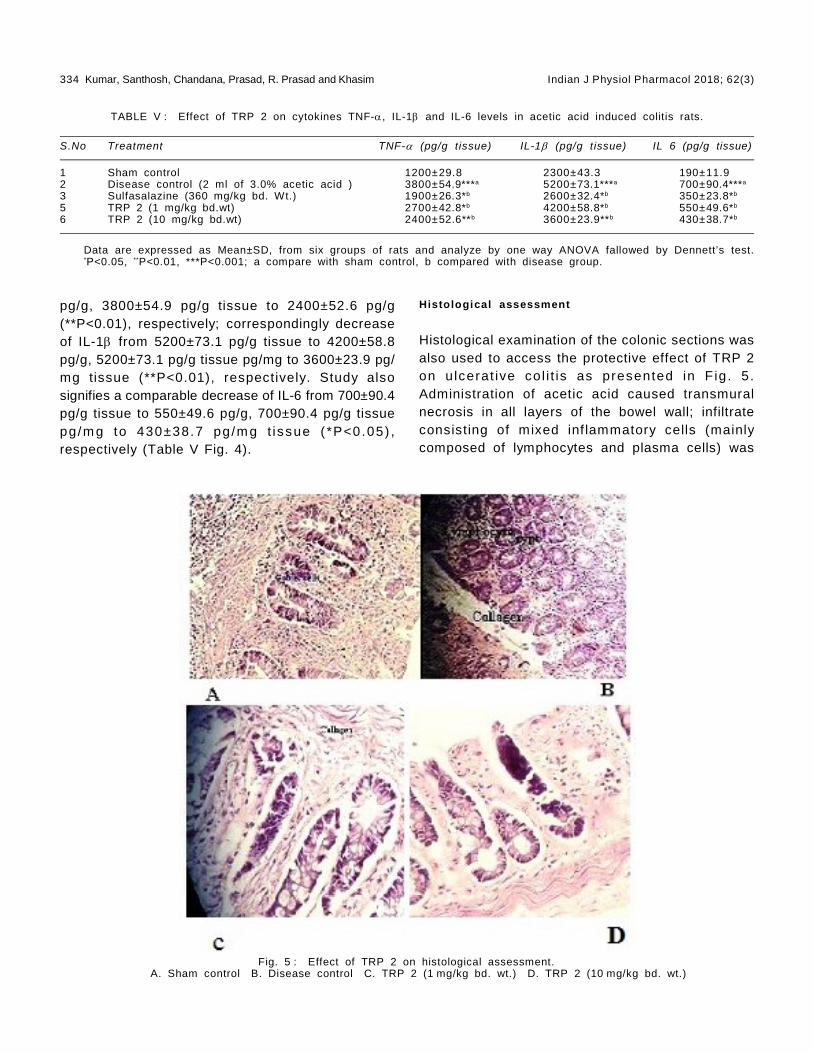
334 Kumar, Santhosh, Chandana, Prasad, R. Prasad and Khasim Indian J Physiol Pharmacol 2018; 62(3)
pg/g, 3800±54.9 pg/g tissue to 2400±52.6 pg/g(**P<0.01), respectively; correspondingly decreaseof IL-1 from 5200±73.1 pg/g tissue to 4200±58.8pg/g, 5200±73.1 pg/g tissue pg/mg to 3600±23.9 pg/mg tissue (**P<0.01), respectively. Study alsosignifies a comparable decrease of IL-6 from 700±90.4pg/g tissue to 550±49.6 pg/g, 700±90.4 pg/g tissuepg/m g to 430±38.7 pg/m g t issue ( *P<0.05) ,respectively (Table V Fig. 4).
TABLE V : Effect of TRP 2 on cytokines TNF-, IL-1 and IL-6 levels in acetic acid induced colitis rats.
S.No Treatment TNF- (pg/g tissue) IL-1 (pg/g tissue) IL 6 (pg/g tissue)
1 Sham control 1200±29.8 2300±43.3 190±11.92 Disease control (2 ml of 3.0% acetic acid ) 3800±54.9***a 5200±73.1***a 700±90.4***a
3 Sulfasalazine (360 mg/kg bd. Wt.) 1900±26.3*b 2600±32.4*b 350±23.8*b
5 TRP 2 (1 mg/kg bd.wt) 2700±42.8*b 4200±58.8*b 550±49.6*b
6 TRP 2 (10 mg/kg bd.wt) 2400±52.6**b 3600±23.9**b 430±38.7*b
Data are expressed as Mean±SD, from six groups of rats and analyze by one way ANOVA fallowed by Dennett’s test.*P<0.05, **P<0.01, ***P<0.001; a compare with sham control, b compared with disease group.
Histological assessment
Histological examination of the colonic sections wasalso used to access the protective effect of TRP 2on u lcerat ive col i t is as presented in F ig. 5.Administration of acetic acid caused transmuralnecrosis in all layers of the bowel wall; infiltrateconsisting of mixed inf lammatory cells (mainlycomposed of lymphocytes and plasma cells) was
Fig. 5 : Effect of TRP 2 on histological assessment.A. Sham control B. Disease control C. TRP 2 (1 mg/kg bd. wt.) D. TRP 2 (10 mg/kg bd. wt.)

Indian J Physiol Pharmacol 2018; 62(3) Effect of Adenosine Antagonist on Ulcerative Colitis Rats 335
observed. Oral administration of TRP 2 treatedanimals significantly attenuated the histological signsof the cell damage, reduction in mucosal injury,edema and reduced infiltration of inflammatorycells lamina propria in comparison with the colitisgroup.
Binding energy and inhibition of IL1-beta, IL6 and TNF-
by in silico.
Docking is widely used in modern drug discoveryprocess and effective tool for quickly and accuratelypredicting biomolecular conformation with bindingenergy of protein ligand complex. Compound TRP 2exhibited potent inhibition on IL-1 (-7.53 Kcal/mol,3.04 mM), TNF (-5.89 Kcal/mol, 48.35 mM) and IL6 (-6.01 Kcal/mol, 39.21 mM) (Table VI).
Discussion
Compound TRP2 has demonstrated to have protectiveeffect against acetic acid induced ulcerative colitis.Adenosine plays prominent role in maintaining tissueintegrity by modulation of immune functions, down-regulation of phlogistic reactions, interference withthe biosynthesis of proinflammatory cytokines andinhibition of neutrophil adhesion, degranulation andanti-oxidant activity (27). Many studies reported thatthe adenosine agonists trigger proinf lammatoryresponses and neutrophile inf i lt ration throughstimulation of Adenosine receptors on neutrophilsand lymphocytes (28). Previous studies reveal thatupregulation of A2B receptors, contributing in colitispathology (4) which was attenuated by Adenosinereceptor antagonists (29). Hence blocking of A2Breceptor is a novel approach in the treatment of IBD.The present study demonstrated that compound TRP2 antagonize the A2B receptors which is proved inradioligand binding studies and also exhibited antiinflammatory activity by in vitro. Oxidative stressplays an important role in pathophysiology ofulcerative colitis and there is direct evidence thatgeneration of reactive oxygen species attack thecellular macromolecules, disrupt epithelial cell
TABLE VI : Binding energy of TRP 2 and inhibition of IL1-beta, IL6 and TNF- by in silico.
S. No. Compound Drug Binding PredictedTarget Energy in IC
50 value
Ki cal/mol in mM
1 TRP 2 IL1-Beta –7.53 3.042 IL6 –6.01 39.213 TNF-Alpha –5.89 48.35
Fig. 6 : Colonic macroscopic studies.

336 Kumar, Santhosh, Chandana, Prasad, R. Prasad and Khasim Indian J Physiol Pharmacol 2018; 62(3)
integrity (30). Acetic acid exerts damaging effect byan acute inflammatory response following colonicinjury, accompanied by widespread hemorrhage,release of mediators, and formation of lesions. Theprotonated form of the acid liberates protons withinthe int race l lu lar space, caus ing a mass iveintracellular acidification resulting in an immenseepithelial damage (22, 31). The weight of the inflamedcolonic t issue is considered as a reliable andsensitive indicator for the severity, extent of intestinalinflammation, over production of TNF , IL-1 andIL-6 on intrarectal administration of acetic acid (32,33). Consistent with this notion, the results revealthat, acetic acid treated rats has shown significantincrease in colon weight and macroscopic damagescore, indicative of formation of ulcers, edema andincreased inflammatory cytokines levels such as TNF, IL-1 and IL-6. Pretreatment with TRP 2 in aceticacid induced colitis significantly reduced the weightof inflamed colon weight, macroscopic damagecompare with colitis rats and reverse elevated TNF, IL-1 and IL-6 levels, indicating its protective effectfrom ulcerative colitis. Indeed, the in vitro DPPHassay, Hydrogen perox ide scavenging assay,superoxide free radical scavenging assay, Fe2+
ascorbate induced lipid peroxidation assay wereperformed to evaluate antioxidant potential of TRP 2,results indicated that compound to be endowed withfree radical inhibitory activity. In silico studies alsoconcluded that TRP 2 showed potent inhibition onIL1, IL6 and TNF- proteins.
MPO is an enzyme present in neutrophil, the levelsof MPO activity proport ional to the neutrophilconcent ra t ion in f lam ed t issue. There foremeasurement of MPO activity has been consideredas a sensitive assay for acute intestinal inflammation.In addition increased MPO activity has been reportedas an index of neutrophil infiltration and inflammation(34) and also enzyme catalyzes the formation of
potent cytotoxic oxidants such as hypochlorous acidfrom H
2O
2 and chloride ions (35). MPO activity was
increased by acute administration of acetic acidthrough rectal route (36) and its activity significantlyreduces in TRP 2 treated colitis rats. Suppressionof MPO activity by compound TRP 2 indicatesinhibition of neutrophil infiltration in the colonicmucosa.
GSH and catalase plays a vital role in protectingtissues against damage by scavenging oxidantproducts. Earlier studies revealed that GSH level hasbeen reduced in t issues when antioxidant wasneutralized by liberated oxygen derived free radicals(37) . Severa l s tud ies revea l that in t rarec ta ladministration of acetic acid decrease antioxidantdefensive system such as GSH and catalase activity(14). Similarly current scientific study was observedto increase GSH and catalase act ivi ty in thecompound TRP 2 treated colitis groups. Hence theresults suggest that the defense system wasimproved by the treatment of TRP 2.
Conclusions
TRP 2 exhibited antagonist property on A2B receptors,possess anti inflammatory activity and reducesinflammatory mediator levels, enhanced antioxidantactivity in acetic acid induced colitis in rats. All theabove scientific evidence suggested that the TRP 2improve clinical score in acetic acid induced colitisrats.
Acknowledgements
Authors thanks to UGC (university grant commission)for providing f inancial assistance to carry outthis project (F.No: 4-4/2014-15 (MRP-SEM/UGC-SERO).
References
1. Lakatos PL. Recent t rends in the ep idem io logy o finflammatory bowel diseases: up or down. World Journalof Gastroenterology 2006; 12(38): 6102–6108.
2. Xu CT, Meng SY, Pan BR. Drug therapy for ulcerativecolitis. World journal of gastroenterology. 2004; 10(16):
2311–2317.
3. Kolachala V, Asamoah V, Wang L, Obertone TS, ZieglerTR, Merlin D, Sitaraman SV. TNF-á upregulates adenosine2b (A2B) receptor expression and signaling in intestinalepithelial cells: a basis for A2
BR overexpression in colitis.

Indian J Physiol Pharmacol 2018; 62(3) Effect of Adenosine Antagonist on Ulcerative Colitis Rats 337
Cellular and Molecular Life Sciences 2005; 62(22): 2647–2657.
4. Ryzhov S, Zaynagetdinov R, Goldstein AE, Novitskiy SV,Dikov MM, Blackburn MR, Biaggioni I, Feoktistov I. Effecto f A2B adenos ine rec ep to r gene ab la t ion on p roinf lammatory adenosine signal ing in mast cel ls. TheJournal of Immunology 2008; 180(11): 7212–7220.
5. Sachdeva S, Gupta M. Adenosine and its receptors astherapeutic targets: an overview. Saudi PharmaceuticalJournal 2013; 21(3): 245–253.
6. Merighi S, Borea PA, Gessi S. Adenosine receptors anddiabetes: focus on the A 2B adenosine receptor subtype.Pharmacological Research 2015; 99: 229–236.
7. Fossa P, Pestarino M, Menozzi G, Mosti L, Schenone S,Ranise A, Bondavalli F, Trincavelli ML, Lucacchini A,Martini C. New pyrazolo [3, 4-b] pyridones as selectiveA 1 adenosine receptor antagonists: synthesis, biologicalevaluation and molecular modelling studies. Organic &Biomol Chem 2005; 3(12): 2262–2270.
8. Squarcialupi L, Catarzi D, Varano F, Betti M, Falsini M,Vincenzi F, Ravani A, Ciancetta A, Varani K, Moro S,Colotta V. Structural ref inement of pyrazolo [4, 3-d]pyrimidine derivatives to obtain highly potent and selectiveantagonists for the human A 3 adenosine receptor. EuroJ of Med Chem 2016; 108: 117–133.
9. Ferguson GD, Delgado M, Plantevin-Krenitsky V, Jensen-Pergakes K, Bates RJ, Torres S, Celeridad M, Brown H,Burnett K, Nadolny L, Tehrani L. A novel triazolopyridine-based spleen tyrosine kinase inhibitor that arrests jointinflammation. PloS one. 2016; 11(1): e0145705.
10. Hajhashemi V, Saghaei L, Fassihi A, Mojiri-Froshani H. Astudy on the analgesic effects of four new derivativesof 3-hydroxy pyridine-4-one. Res in Pharma Sci 2011;7(1): 37–42.
11. Patil MV, Kandhare AD, Bhise SD. Effect of aqueousextract of Cucumis sativus Linn. fruit in ulcerative colitisin laboratory animals. Asian Pacific Journal of TropicalBiomedicine 2012; 2(2): S962–S929.
12. Hartmann RM, Martins MI, Tieppo J, Fillmann HS, MarroniNP. Effect of Boswellia serrata on antioxidant status inan experimental model of colitis rats induced by aceticacid. Digest ive Diseases and Sciences 2012; 57(8):2038–2044.
13. Sakthivel KM, Guruvayoorappan C. Amentoflavone inhibitsiNOS, COX-2 expression and modulates cytokine profile,NF-êB signal transduction pathways in rats with ulcerativecolitis. International Immunopharmacology 2013; 17(3):907–916.
14. Krishnan M, Jayaraj RL, Megala J, Elangovan N. Antioxidantmediated antiulcer effect of Eupatorium triplinerve Vahlagainst acetic acid induced ulcerative colit is in mice.Biomedicine & Aging Pathology 2014; 4(2): 153–160.
15. Klotz KN, Hessling J, Hegler J, Owman C, Kull B, FredholmBB, Lohse MJ. Comparative pharmacology of humanadenosine receptor subtypes characterization of stablyt rans fec ted rec eptors in CHO ce l l s . NaunynSchmiedeberg’s archives of pharmacology. 1997; 357(1):1–9.
16. Blois MS. Antioxidant determinations by the use of astable free radical. Nature 1958; 181(4617): 1199–1200.
17. Sreejayan N, Rao MN, Priyadarsini KI, Devasagayam TP.Inhibi t ion of rad iat ion- induced l ip id peroxidat ion bycurcumin. International Journal of Pharmaceutics 1997;151(1): 127–130.
18. Liu F, Ooi VE, Chang ST. Free radical scavenging activitiesof mushroom polysaccharide extracts. Life Sciences 1997;60(10): 763–771.
19. Ohkawa H, Ohishi N, Yagi K. Assay for lipid peroxides inanimal tissues by thiobarbituric acid reaction. AnalyticalBiochemistry 1979; 95(2): 351–358.
20. Azeem AK, Dilip C, Prasanth SS, Shahima VJ, Sajeev K,Naseera C. Anti inflammatory activity of the glandularextracts of Thunnus alalunga. Asian Pacific Journal ofTropical Medicine 2010; 3(10): 794–796.
21. Rashidian A, Mehrzadi S, Ghannadi AR, Mahzooni P, SadrS, Minaiyan M. Protective effect of ginger volatile oilaga ins t acet ic ac id- induced co l i t i s in ra ts : a l igh tmicroscopic evaluation. Journal of Integrative Medicine2014; 12(2): 115–120.
22. Medhi B, Prakash A, Avti PK, Saikia UN, Pandhi P, KhandujaKL . E f f ec t o f Manuka honey and s u l fas a laz ine incombination to promote antioxidant defense system inexperimentally induced ulcerative colitis model in rats.Indian Journal of Experimental Biology 2008; 46: 583–590.
23. Jagtap AG, Shirke SS, Phadke AS. Effect of polyherbalformulation on experimental models of inflammatory boweldiseases. Journal of Ethnopharmacology 2004; 90(2):195–204.
24. Aebi H. [13] Catalase in vitro. Methods in Enzymology.1984; 105: 121–126.
25. E l lman GL. T iss ue su l fhydry l g roups . Arc h ives o fbiochemistry and biophysics. 1959; 82(1): 70–77.
26. Krawisz JE, Sharon P, Stenson WF. Quantitative assayfor acute intestinal inflammation based on myeloperoxidaseactivity. Gastroenterology 1984; 87(6): 1344–1350.
27. Rahimian R, Fakhfouri G, Daneshmand A, Mohammadi H,Bahremand A, Rasouli MR, Mousavizadeh K, Dehpour AR.Adenosine A
2A receptors and uric acid mediate protective
effects of inosine against TNBS-induced colitis in rats.European Journal of Pharmacology 2010; 649(1): 376–381.
28. Antonioli L, Csóka B, Fornai M, Colucci R, Kókai E,Blandizzi C, Haskó G. Adenosine and inflammation: what’snew on the hor izon. Drug Discovery Today. 2014;19(8):1051-68. Sandborn WJ, Targan SR. Biologic therapyof inflammatory bowel disease. Gastroenterology 2002;122(6): 1592–1608.
29. Takahashi HK, Iwagaki H, Hamano R, Kanke T, Liu K,Sadamori H, Yagi T, Yoshino T, Sendo T, Tanaka N,Nishibor i M. Ef fect of adenosine receptor subtypesst imulat ion on mixed lymphocyte react ion. EuropeanJournal of Pharmacology 2007; 564(1): 204–210.
30. Otari KV, Gaikwad PS, Shete RV, Upasani CD. Protectiveeffect of aqueous extract of Spinacia oleracea leaves inexperimental paradigms of inflammatory bowel disease.Inflammopharmacology 2012; 20(5): 277–287.
31. Kannan N, Guruvayoorappan C. Protect ive ef fect ofBauhinia tomentosa on acetic acid induced ulcerativecolitis by regulating antioxidant and inflammatory mediators.International Immunopharmacology 2013; 16(1): 57–66.
32. Sotn ikova R, Nosa lova V , Navarova J . E f f icacy ofquercetin derivatives in prevention of ulcerative colitis inrats. Interdisciplinary Toxicology 2013; 6(1): 9–12.
33. Palla AH, Iqbal NT, Minhas K, Gilani AH. Flaxseed extractexhibits mucosal protective effect in acetic acid inducedcolitis in mice by modulating cytokines, antioxidant and

338 Kumar, Santhosh, Chandana, Prasad, R. Prasad and Khasim Indian J Physiol Pharmacol 2018; 62(3)
anti inflammatory mechanisms. International Immunopharmacology2016; 38: 153–166.
34. Martín AR, Villegas I, SánchezHidalgo M, La Lastra D,Alarcón C. The effects of resveratrol, a phytoalexinderived from red wines, on chronic inflammation inducedin an experimentally induced colitis model. British Journalof Pharmacology 2006; 147(8): 873–885.
35. Talero E, Sánchez-Fidalgo S, de la Lastra CA, Illanes M,Calvo JR, Mot i lva V. Acute and chronic responsesas soc ia ted wi th ad renom edul l in adm in i s t ra t ion inexperimental colitis. Peptides 2008; 29(11): 2001–2012.
36. Kandhare AD, Raygude KS, Ghosh P, Ghule AE, Gosavi
TP, Badole SL, Bodhankar SL. Effect of hydroalcoholicext rac t o f H ib is cus ros as inens is L i nn . leaves inexperimental col i t is in rats. Asian Pacif ic Journal ofTropical Biomedicine 2012; 2(5): 337–344.
37. Berkhout M, Friederich P, van Krieken JH, Peters WH,Nagengast FM. Low detoxification capacity in the ilealpouc h muc os a o f pa t i en ts wi th u lce ra t i ve co l i t i s .Inflammatory Bowel Diseases 2006; 12(2): 112–126.
38. Cheng HC. The power issue: Determination of KB or Kifrom IC50: A closer look at the Cheng–Prusoff equation,the Schild plot and related power equations. Journal ofPharmacological and Toxicological Methods 2001; 46(2):61–71.
Indian J Physiol Pharmacol 2018; 62(3) Effect of Bacopa Monnieri on Ethanol-induced Anxiolysis 339
Original Article
Effect of Bacopa Monnieri on Ethanol-induced Anxiolysis andWithdrawal Anxiety in Wistar Rats
Bhuvaneshwari Sudershan1, Mukta N. Chowta1*, Sheetal D. Ullal1,S. Rajeshwari1, Vinay Kumar Sayeli2, Sudhishma Shivaprasad1
and Pragati Srivastava1
1Department of Pharmacology,Kasturba Medical College,Mangalore, Maniapl Academy of Higher Education,Manipal – 576 104, Karnataka, India
2Apollo Medical College,Chittor, Andhra Pradesh
Abstract
Background & Objective: Bacopa Monnieri (BM) is known to have general anxiolytic properties. However,its possible anxiolytic effect in ethanol withdrawal induced anxiety is not yet identified. This study was doneto evaluate the effect of BM on ethanol-induced anxiolysis and withdrawal anxiety in Wistar rats.
Methods: A total of 126 rats were included in the study. Elevated plus maze and bright and dark arena wereused to assess the anxiolytic action. Actophotometer paradigm was used to assess the locomotor activityin rats. BM was given orally in doses of 50, 100, 200, 400 mg/kg & ethanol was given in dose 0.5, 1 and1.5 g/kg to evaluate the anxiolytic effect of single doses of BM and ethanol. Ethanol withdrawal was inducedin rats by giving ethanol as the sole drinking solution at 5% solution and gradually increasing to 10%solution for 15 days followed by 3-day withdrawal period. A similar cycle of ethanol withdrawal was repeatedto increase the intensity of ethanol withdrawal symptoms.
Results: Anxiolytic action seen with BM 100, 200, 400 mg/kg doses and ethanol 0.5 g/kg dose. Beneficialeffect of BM 100, 200, 400 mg/kg seen even in ethanol withdrawal induced anxiety. CNS depressant actionwas observed with ethanol at doses 1 and 1.5 g/kg, but not with BM 400 mg/kg dose as demonstrated inactophotometer paradigm.
Conclusion: BM in doses 100, 200, 400 mg/kg showed anxiolytic action in ethanol withdrawal inducedanxiety in rats with no CNS depressant action even at 400 mg/kg. Ethanol at 1 and 1.5 g/kg doses showedCNS depressant action.
Indian J Physiol Pharmacol 2018; 62(3) : 339–346
*Corresponding author :
Dr. Mukta N Chowta, Professor & Head, Department of Pharmacology, Kasturba Medical College, Light House Hill Road,Mangalore, Maniapl Academy of Higher Education, Manipal – 576 104, Karnataka, India; Email: [email protected]
(Received on January 1, 2018)

340 Sudershan, Chowta, Ullal, Rajeshwari, Sayeli, Shivaprasad and Srivastava Indian J Physiol Pharmacol 2018; 62(3)
this study was planned to elicit the action of BM inethanol withdrawal-induced anxiety-like behaviour inrats.
Methods
This experimental study was conducted in maleWistar rats weighing 150- 200 grams. A total of 126rats were included in the study. Animals wereprocured from the central animal house of KasturbaMedical College, Mangalore. All animals were allowedto acclimatize to the laboratory conditions for fivedays before starting the study. Animals were housedin standard polycarbonate cages as three per cageduring the initial period of acclimatization. Roomswere controlled for temperature and animals werekept at 12 hours each of bright and dark period.Animals were allowed to have free access to foodand water (except when ethanol is substituted forwater). To reduce the effect of circadian rhythms,tests were performed during the first half of the day.This study was conducted after obtaining the approvalfrom the Institutional Animals Ethics Committee(IAEC). Care of animals was taken as per theguidel ines of CPCSEA, Department of AnimalWelfare, Government of India.
Drugs and drinking solution:
Ethanol : The ethanol solutions were prepared from99.9% ethanol (Manufactured by CHANGSHUYANGYUAN CHEMICALS CHINA).
Study drug:
BM (Brahmi tablets) were obtained from HimalayaHerbals. Tablets were initially crushed to make apowder and then mixed with 0.5 in 10 dilutions(distilled water) of tween 80 solutions and were givenby oral route.
Standard drug:
Injection Diazepam
All drugs were administered 60 min (oral) and 15minutes (IP) prior to the experiment.
Introduction
Ethanol consumption in humans for a long periodleads to the derangement of the neurotransmitters inthe brain, which may play a part in subjectivesymptoms of stress and anxiety during withdrawalof ethanol and this may be a precipitating factor inrelapse of ethanol drinking. The manifestations ofethanol withdrawal include anxiety, insomnia,illusions, hallucination, paranoid ideas, nausea,vomiting, irritability and signs like elevated bloodpressure, tachycardia, elevated body temperature,dilated pupils, disorientation, tremor, hyperarousal,and grand-m al -seizure (1) . The underac t iveGABAergic system is involved in ethanol withdrawal-induced anxiety. Anxiety like behaviour during thedrug free intervals in the later phase of ethanolwi thdrawal is decreased or increased by theadministration of agents that increase or decreasethe activity of benzodiazepine GABA receptors,respectively (2).
Bacopa monnieri (BM), also known as Brahmi is amedicinal Ayurvedic herb, traditionally used in variousdisorders. Its memory and cognition enhancingproperties were demonstrated in various studies. Ithas also been reported to possess anti- ulcerogenic,anti- oxidant, antidepressant, hepatoprotective,neuroprotective and anti-anxiety properties. BMcontains several phytochemicals, the most importantbeing triterpenoidsaponins called as bacosides (3).The mechanisms involved in the beneficial effects ofBM include acetylcholinesterase inhibition, cholineacetyltransferase activation, -amyloid reduction,increased cerebral blood flow, and monoaminepotentiation (4).
Currently, benzodiazepines are the agents used inthe management of ethanol withdrawal inducedanxiety. BM is known to have general anxiolyticproperties and it may have additional advantages overbenzodiazepines as an antianxiety agent in view ofside effects like retrograde amnesia and drowsinessassociated with benzodiazepines (5). However, athorough search of the literature did not provide anysupporting evidence for the possible beneficial effectof BM in ethanol withdrawal induced anxiety. Hence,

Indian J Physiol Pharmacol 2018; 62(3) Effect of Bacopa Monnieri on Ethanol-induced Anxiolysis 341
Experiment 1: To study the effect of BM on anxiolyticeffect of acute administration of ethanol
Animals were divided into various groups with 6animals in each group as follows :
Group 1: Normal control (Tween 80)
Group 2: Diazepam (1 mg/kg, IP)
Group 3: BM (50 mg/kg, oral)
Group 4: BM (100 mg/kg, oral)
Group 5: BM (200 mg/kg, oral)
Group 6: BM (400 mg/kg, oral)
Group 7: Ethanol (0.5 g/kg, IP)
Group 8: Ethanol (1 g/kg, IP)
Group 9: Ethanol (1.5 g/kg, IP)
Group 10: BM (400 mg/kg, oral) + Ethanol (0.5 g/kg,IP)
A single dose of different strengths/dose levels ofBM and ethanol was administered to animals as pertheir grouping. These animals were subjected toanxiety test one hour after oral administration or 15minutes after IP administration of the study drugs.Throughout the study, animals were allowed to havefree access to food.
Bright and dark arena was used to evaluate anxietyin all the study groups. This apparatus consisted ofan open top wooden box, consisting of two distinctchambers, a black chamber (25×35×35 cm, a brightchamber 25×35×35 cm). A 40W white light sourcewas placed at a height of 15 cm above the brightchamber. The two chambers are connected througha small open doorway (7.5×5 cm) situated on thefloor level at the center of partition. The apparatuswas cleaned before the procedure and every timebefore evaluating anxiety in a new rat. The animalswere kept for overnight fasting before the procedure.Various parameters in Bright and Dark box (numberof bright chamber entries, time spent in the brightchamber and number of rears in the bright chamber)were observed for five minutes.
Elevated plus maze was also used for evaluation ofanxiety for the experiment no. 1. But, the model didnot provide us reliable results.
Experiment 2: To study the effect of BM on ethanolwithdrawal induced anxiety
Group 1: Normal control (Tween 80)
Group 2: Diazepam (1 mg/kg, IP)
Group 3: BM (50 mg/kg, oral)
Group 4: BM (100 mg/kg, oral)
Group 5: BM (200 mg/kg, oral)
Animals were housed singly in polypropylene cages.Ethanol 5-10% was given gradually as the soledrinking fluid for 15 days i.e. 5% on the first day,7.5% on the second day and then maintained on10% ethanol until the 15th day. For the next 3 days(16th to 18th day) animals were allowed to have freeaccess to drinking fluid free of ethanol. Similarly,another cycle of Ethanol 5-10% was given graduallyas the sole drinking fluid for the next 15 days.Animals were allowed to have free access to drinkingfluid free of ethanol from the day 49 to day 51. Drugswere administered on the 51st day. These animalswere subjected to anxiety test using Bright & darkbox arena, one hour after the oral administrationor 15 minutes after the IP administration of drugs.Throughout the study, animals were allowed to havefree access to food.
Experiment 3: To study the CNS depressant actionof best effective dose of BM as well as ethanol(locomotor activity):
Group 1: Normal control (Tween 80)
Group 2: Diazepam (1 mg/kg, IP)
Group 3: BM (400 mg/kg, oral)
Group 4: Ethanol (0.5 g/kg, IP)
Group 5: Ethanol (1 g/kg, IP)
Group 6: Ethanol (1.5 g/kg, IP)

342 Sudershan, Chowta, Ullal, Rajeshwari, Sayeli, Shivaprasad and Srivastava Indian J Physiol Pharmacol 2018; 62(3)
Animals were administered a single dose of the besteffective dose of BM monnieri and ethanol as pertheir grouping. These animals were subjected tospontaneous motor activity test in actophotometer,one hour after the oral administration and 15 minutesafter the IP administration of the drugs.
The Actophotometer test apparatus consisted of asquare box with a closed lid. Inside the box are thearrays of light that fall on the photo electric cells.Once the rat is placed inside the box, the locomotionof the rat cuts each beam of light that falls onphotoelectric cell and that will be recorded digitallyas a count. The apparatus was cleaned before theprocedure and every t ime before evaluat ingspontaneous motor activity in a new rat. The animalswere kept for overnight fasting before the procedure.The number of counts was observed for each rat fora period of five minutes.
Statistical analysis:
The data obtained were analyzed using one-wayanalysis of variance (ANOVA) followed by Post- HocLSD test. p<0.05 was considered stat is t ical lysignificant.
Results
The Table I shows the effects of BM on the anxiolyticeffect of ethanol in the bright and dark arena.
Diazepam 1 mg/kg (P = 0.001), BM 100, 200, 400mg/kg (p<0.05), alcohol 0.5 g/kg (p<0.001) and BM400 mg/kg + alcohol 0.5 g/kg showed increasednumber of bright arm entries as compared to normalcontrol (p<0.001). Diazepam 1 mg/kg group showedincreased number of bright arm entries compared toBM 50 mg/kg and alcohol 1.5 g/kg (p<0.05). Ethanol0.5 g/kg group showed increased number of brightarm entries compared to BM 50 (p<0.001), 100, 200mg/kg (p<0.05), ethanol 1 g/kg (p<0.05), 1.5 g/kg(p<0.001). BM 400 mg/kg + ethanol 0.5 g/kg showedincreased number of bright arm entries compared todiazepam 1 mg/kg (p<0.05), BM 50, 100, 200, 400(p<0.001), ethanol 1 g/kg, 1.5 g/kg (p<0.001). Almostsimilar findings were seen with regard to the analysesof other behavioural parameters such as time spentin the bright chamber and the number of rears in thebright arm, as shown in Table I.
Table II shows the effect of BM on the anxiolyticeffect of ethanol in elevated plus maze. Antianxietyeffects of diazepam as well as different doses of BMcould not be elicited in this model. Only BM 400 +ethanol 0.5 g/kg group showed a s ignif icantantianxiety effects with regard to all the behaviouralparameters assessed in this model. There was astatistically significant increase in the number of openarm entries, increased time spent in open arm andincreased number of rears in the open arm with BM400 + ethanol 0.5 g/kg group when compared to thecontrol group whereas ethanol 0.5 g/kg showed astatistically significant increase in the duration spent
TABLE I : Effect of BM on the anxiolytic effects of ethanol (bright and dark arena test).
Groups Number of bright Time spent in Number of rears inarm entries bright arm bright arm
Normal control 1.67±0.21 10.33±1.28 0.33±.21Diazepam (1 mg/kg), ip 4.50±0.22*&@ 99.50±12.61*@ 7.17±1.40*@
BM 50 mg/kg, oral 2.17±0.31$#& 38.00±5.35$#&^ 5.33±0.72*#@
BM 100 mg/kg, oral 3.50±0.56*#& 65.17±17.76*# 7.0±1.92*#@
BM 200 mg/kg, oral 3.67±0.803*#& 79.17±15.02*# 9.17±2.21*@
BM 400 mg/kg, oral 3.33±0.62*& 97.33±5.36*@ 9.67±1.05*@
Ethanol 0.5 g/kg, ip 5.33±0.67*@ 129.67±11.04*@ 11.5±2.62*@
Ethanol 1 g/kg, ip 3.17±0.60#& 67.17±23.11*# 7.17±2.27*@
Ethanol 1.5 g/kg, ip 2.17±0.60 44.33±31.27 0.00±0.00BM 400 mg/kg, oral + Ethanol 0.5 g/kg, ip 6.83±0.87*@ 103±4.03*@ 9.67±0.21*@
ANOVAAll values expressed as Mean±SEM*p<0.05 compared to control $p<0.05 compared to diazepam#p<0.05 compared to ethanol 0.5 g/kg @p<0.05 compared to ethanol 1.5 g/kg&p<0.05 compared to BM 400 mg/kg + ethanol 0.5 g/kg ^p<0.05 compared to BM 400 mg/kg
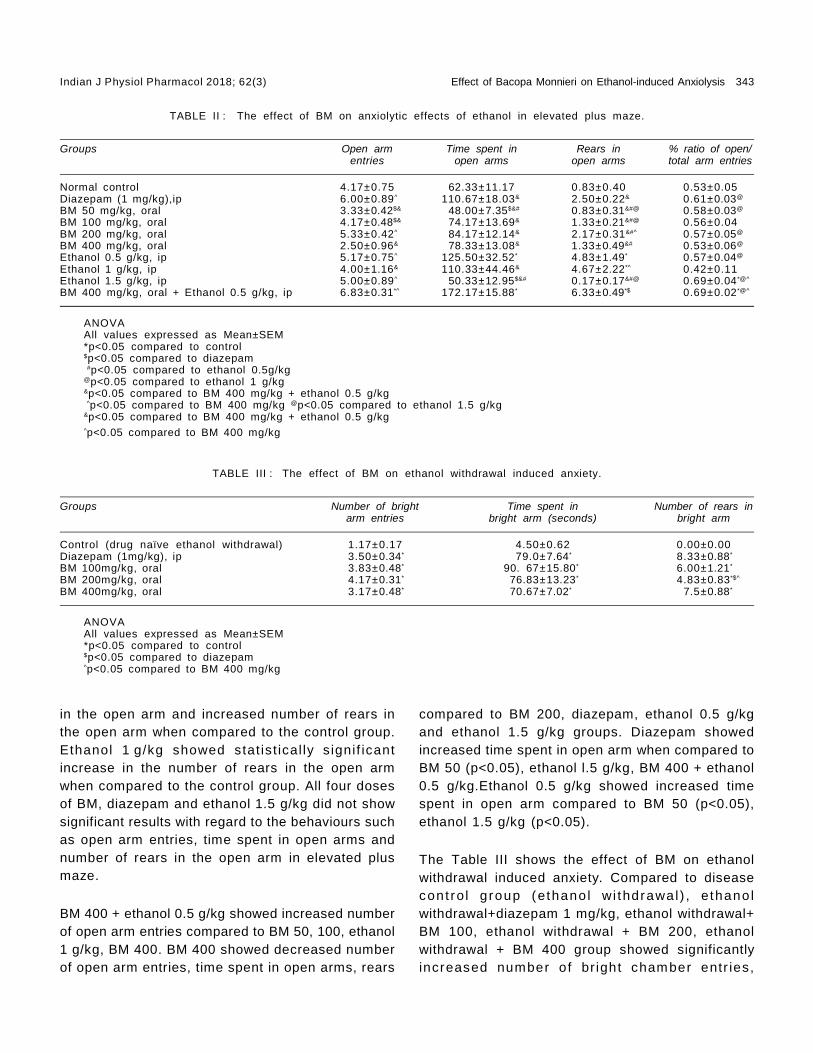
Indian J Physiol Pharmacol 2018; 62(3) Effect of Bacopa Monnieri on Ethanol-induced Anxiolysis 343
in the open arm and increased number of rears inthe open arm when compared to the control group.Ethanol 1 g/kg showed stat is t ical ly s ignif icantincrease in the number of rears in the open armwhen compared to the control group. All four dosesof BM, diazepam and ethanol 1.5 g/kg did not showsignificant results with regard to the behaviours suchas open arm entries, time spent in open arms andnumber of rears in the open arm in elevated plusmaze.
BM 400 + ethanol 0.5 g/kg showed increased numberof open arm entries compared to BM 50, 100, ethanol1 g/kg, BM 400. BM 400 showed decreased numberof open arm entries, time spent in open arms, rears
compared to BM 200, diazepam, ethanol 0.5 g/kgand ethanol 1.5 g/kg groups. Diazepam showedincreased time spent in open arm when compared toBM 50 (p<0.05), ethanol l.5 g/kg, BM 400 + ethanol0.5 g/kg.Ethanol 0.5 g/kg showed increased timespent in open arm compared to BM 50 (p<0.05),ethanol 1.5 g/kg (p<0.05).
The Table III shows the effect of BM on ethanolwithdrawal induced anxiety. Compared to diseasecont ro l g roup (ethano l wi thdrawal ) , e thano lwithdrawal+diazepam 1 mg/kg, ethanol withdrawal+BM 100, ethanol withdrawal + BM 200, ethanolwithdrawal + BM 400 group showed significantlyincreased number of br ight chamber entr ies,
TABLE III : The effect of BM on ethanol withdrawal induced anxiety.
Groups Number of bright Time spent in Number of rears inarm entries bright arm (seconds) bright arm
Control (drug naïve ethanol withdrawal) 1.17±0.17 4.50±0.62 0.00±0.00Diazepam (1mg/kg), ip 3.50±0.34* 79.0±7.64* 8.33±0.88*
BM 100mg/kg, oral 3.83±0.48* 90. 67±15.80* 6.00±1.21*
BM 200mg/kg, oral 4.17±0.31* 76.83±13.23* 4.83±0.83*$^
BM 400mg/kg, oral 3.17±0.48* 70.67±7.02* 7.5±0.88*
ANOVAAll values expressed as Mean±SEM*p<0.05 compared to control$p<0.05 compared to diazepam^p<0.05 compared to BM 400 mg/kg
TABLE II : The effect of BM on anxiolytic effects of ethanol in elevated plus maze.
Groups Open arm Time spent in Rears in % ratio of open/entries open arms open arms total arm entries
Normal control 4.17±0.75 62.33±11.17 0.83±0.40 0.53±0.05Diazepam (1 mg/kg),ip 6.00±0.89^ 110.67±18.03& 2.50±0.22& 0.61±0.03@
BM 50 mg/kg, oral 3.33±0.42$& 48.00±7.35$&# 0.83±0.31&#@ 0.58±0.03@
BM 100 mg/kg, oral 4.17±0.48$& 74.17±13.69& 1.33±0.21&#@ 0.56±0.04BM 200 mg/kg, oral 5.33±0.42^ 84.17±12.14& 2.17±0.31&#^ 0.57±0.05@
BM 400 mg/kg, oral 2.50±0.96& 78.33±13.08& 1.33±0.49&# 0.53±0.06@
Ethanol 0.5 g/kg, ip 5.17±0.75^ 125.50±32.52* 4.83±1.49* 0.57±0.04@
Ethanol 1 g/kg, ip 4.00±1.16& 110.33±44.46& 4.67±2.22*^ 0.42±0.11Ethanol 1.5 g/kg, ip 5.00±0.89^ 50.33±12.95$&# 0.17±0.17&#@ 0.69±0.04*@^
BM 400 mg/kg, oral + Ethanol 0.5 g/kg, ip 6.83±0.31*^ 172.17±15.88* 6.33±0.49*$ 0.69±0.02*@^
ANOVAAll values expressed as Mean±SEM*p<0.05 compared to control$p<0.05 compared to diazepam #p<0.05 compared to ethanol 0.5g/kg@p<0.05 compared to ethanol 1 g/kg&p<0.05 compared to BM 400 mg/kg + ethanol 0.5 g/kg ^p<0.05 compared to BM 400 mg/kg @p<0.05 compared to ethanol 1.5 g/kg&p<0.05 compared to BM 400 mg/kg + ethanol 0.5 g/kg^p<0.05 compared to BM 400 mg/kg
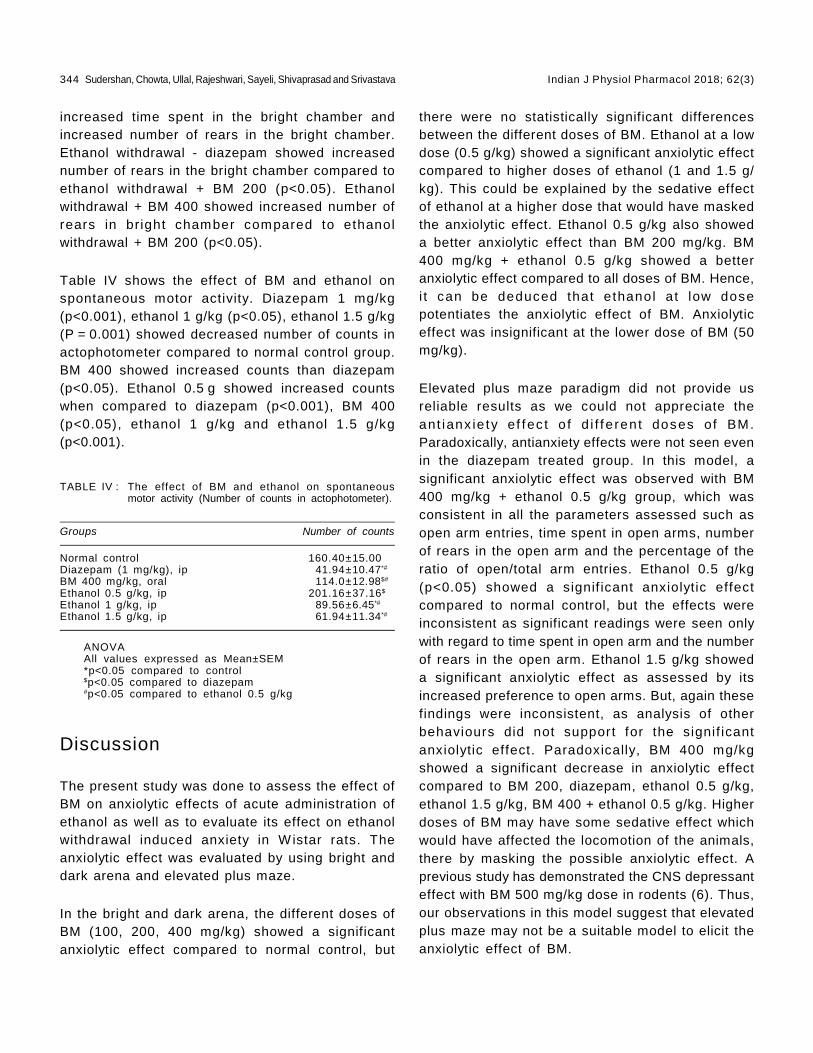
344 Sudershan, Chowta, Ullal, Rajeshwari, Sayeli, Shivaprasad and Srivastava Indian J Physiol Pharmacol 2018; 62(3)
increased time spent in the bright chamber andincreased number of rears in the bright chamber.Ethanol withdrawal - diazepam showed increasednumber of rears in the bright chamber compared toethanol withdrawal + BM 200 (p<0.05). Ethanolwithdrawal + BM 400 showed increased number ofrears in bright chamber compared to ethanolwithdrawal + BM 200 (p<0.05).
Table IV shows the effect of BM and ethanol onspontaneous motor activity. Diazepam 1 mg/kg(p<0.001), ethanol 1 g/kg (p<0.05), ethanol 1.5 g/kg(P = 0.001) showed decreased number of counts inactophotometer compared to normal control group.BM 400 showed increased counts than diazepam(p<0.05). Ethanol 0.5 g showed increased countswhen compared to diazepam (p<0.001), BM 400(p<0.05), ethanol 1 g/kg and ethanol 1.5 g/kg(p<0.001).
there were no statistically significant differencesbetween the different doses of BM. Ethanol at a lowdose (0.5 g/kg) showed a significant anxiolytic effectcompared to higher doses of ethanol (1 and 1.5 g/kg). This could be explained by the sedative effectof ethanol at a higher dose that would have maskedthe anxiolytic effect. Ethanol 0.5 g/kg also showeda better anxiolytic effect than BM 200 mg/kg. BM400 mg/kg + ethanol 0.5 g/kg showed a betteranxiolytic effect compared to all doses of BM. Hence,i t can be deduced that ethanol at low dosepotentiates the anxiolytic effect of BM. Anxiolyticeffect was insignificant at the lower dose of BM (50mg/kg).
Elevated plus maze paradigm did not provide usreliable results as we could not appreciate theant ianx ie ty ef fec t o f d i f f e rent doses of BM.Paradoxically, antianxiety effects were not seen evenin the diazepam treated group. In this model, asignificant anxiolytic effect was observed with BM400 mg/kg + ethanol 0.5 g/kg group, which wasconsistent in all the parameters assessed such asopen arm entries, time spent in open arms, numberof rears in the open arm and the percentage of theratio of open/total arm entries. Ethanol 0.5 g/kg(p<0.05) showed a signif icant anxiolytic effectcompared to normal control, but the effects wereinconsistent as significant readings were seen onlywith regard to time spent in open arm and the numberof rears in the open arm. Ethanol 1.5 g/kg showeda significant anxiolytic effect as assessed by itsincreased preference to open arms. But, again thesefindings were inconsistent, as analysis of otherbehaviours did not support for the signif icantanxiolytic effect. Paradoxically, BM 400 mg/kgshowed a significant decrease in anxiolytic effectcompared to BM 200, diazepam, ethanol 0.5 g/kg,ethanol 1.5 g/kg, BM 400 + ethanol 0.5 g/kg. Higherdoses of BM may have some sedative effect whichwould have affected the locomotion of the animals,there by masking the possible anxiolytic effect. Aprevious study has demonstrated the CNS depressanteffect with BM 500 mg/kg dose in rodents (6). Thus,our observations in this model suggest that elevatedplus maze may not be a suitable model to elicit theanxiolytic effect of BM.
TABLE IV : The effect of BM and ethanol on spontaneousmotor activity (Number of counts in actophotometer).
Groups Number of counts
Normal control 160.40±15.00Diazepam (1 mg/kg), ip 41.94±10.47*#
BM 400 mg/kg, oral 114.0±12.98$#
Ethanol 0.5 g/kg, ip 201.16±37.16$
Ethanol 1 g/kg, ip 89.56±6.45*#
Ethanol 1.5 g/kg, ip 61.94±11.34*#
ANOVAAll values expressed as Mean±SEM*p<0.05 compared to control$p<0.05 compared to diazepam#p<0.05 compared to ethanol 0.5 g/kg
Discussion
The present study was done to assess the effect ofBM on anxiolytic effects of acute administration ofethanol as well as to evaluate its effect on ethanolwithdrawal induced anxiety in Wistar rats. Theanxiolytic effect was evaluated by using bright anddark arena and elevated plus maze.
In the bright and dark arena, the different doses ofBM (100, 200, 400 mg/kg) showed a significantanxiolytic effect compared to normal control, but

Indian J Physiol Pharmacol 2018; 62(3) Effect of Bacopa Monnieri on Ethanol-induced Anxiolysis 345
The anxiolytic effect of ethanol is due to increase inGABA mediated inhibition in the brain as well as adecrease in glutamate mediated excitation in thebrain. The exact mechanism of anxiolytic action ofBM is unknown. Previous studies indicate possiblemechanisms as GABA modulation, antioxidantproperties, modulation of brain stress hormones,serotonin agonism, inhibit ion of inf lammatorycytokines in the brain (3, 4). We did not observesignificant differences between the different doses ofBM in contrast to a previous study that haddemonstrated dose dependent anxiolytic effect withthe smaller doses of BM 5, 10 and 20 mg/kg (7).Previous studies have also shown the anxiolytic effectof BM in rats and humans (7-10).
Our study also evaluated the effect of BM on ethanolwithdrawal induced anxiety. Both diazepam and BM(100, 200, 400 mg/kg doses) were effective inreducing the ethanol withdrawal induced anxiety. But,there was no significant differences between thedifferent doses of BM. Ethanol consumption andstress increase the brain levels of known innateimmune molecules that are responsible for thechange in the behaviour, anxiety and subsequentdevelopment of ethanol use disorders (11). Ethanolwithdrawal induced anxiety is due to an imbalanceof GABA & glutamate levels in the brain, leading todecreased GABA activity due to the down regulationof GABA receptors and increased g lutamateactivity due to the up regulation of NMDA receptorson chronic exposure to alcohol. Also specif icchanges in 5HT2c- receptor signalling in the brainleads to hyper-excitabil ity and stress (12, 13).Chronic intermittent exposure to ethanol up regulates5HT2c-receptor signalling, leading to increasedexcitabi l i ty which may be responsible for theincreased anxiety- l ike behavior during ethanolwithdrawal (12).
The possible mechanisms for the anxiolytic effect ofBM in ethanol withdrawal induced anxiety could beby reversing the imbalance between GABA andglutamate levels in the brain, regulation of serotoninor by decreasing inflammatory cytokines in the brainor by neuroprotective action (8, 14, 15).
As we presumed that sedative effect might be
responsible for the absence of appreciable antianxietyeffect of higher doses of ethanol and variableantianxiety effect of BM especially at a higher dosein elevated plus maze, we evaluated the effect ofthese agents on spontaneous motor activity by usingactophotometer. A significant decrease in locomotionwas observed with diazepam, ethanol 1 g/kg & 1.5g/kg, indicating that higher doses of ethanol havecaused CNS depression (sedation). However, therewas no significant decrease in locomotor activity evenat a higher dose of BM (400 mg/kg), indicating thatBM has not caused CNS depression or sedation.Paradoxically, BM 400 mg/kg showed a significantincrease in the locomotor activity compared todiazepam treated group, indicating that BM is not aCNS depressant like diazepam. This observation iscontradictory to the previous study which shows CNSdepressant effect with higher doses of BM (7).Ethanol 0.5 g showed a significant increase inlocomotor act ivi ty compared to other groups,suggesting that this dose of ethanol has not producedsedation.
The limitations of this study should be considered.Though we planned to use two models for theevaluation of the anxiety, we did not get reliableresults in the elevated plus maze. Further, we haveincluded only one species of animals in the presentstudy. Incorporating many models as well as morethan one animal species may be helpful to drawmore authentic conclusions. We did not performphytochemical analysis to identify the active principlepresent in the BM. Our study did not plan to evaluatethe possible mechanism of action of BM in anxietyincluding ethanol withdrawal induced anxiety. Allthese aspects can be incorporated in future studies,thereby providing a valuable evidence to plan humanstudies with BM in ethanol withdrawal inducedanxiety.
Conclusion
BM in doses (100, 200, 400 mg/kg) showed ananxiolytic effect in general as well as in ethanolwithdrawal induced anxiety in rats and its antianxietyef fects were comparable with diazepam. CNSdepressant action was observed with ethanol 1and 1.5 g/kg, but not with BM 400 mg/kg. The

346 Sudershan, Chowta, Ullal, Rajeshwari, Sayeli, Shivaprasad and Srivastava Indian J Physiol Pharmacol 2018; 62(3)
possible mechanism of BM in ethanol withdrawalinduced anx ie ty cou ld be by cor rec t ing theneurotransmitter imbalance in the brain of ethanolwithdrawal rats.
Acknowledgements
Authors are grateful to ICMR for financial assistancegiven to conduct the study.
References
1. Kattimani S, Bharadwaj B. Clinical management of alcoholwithdrawal: A systematic review. Ind Psychiatry J 2013;22: 100–108.
2. Knapp DJ, Overstreet DH, Breese GR. Modulation ofethanol withdrawal-induced anxiety-like behavior duringlater withdrawals by treatment of early withdrawals withbenzodiazepine/gamma-aminobutyric acid ligands. AlcoholClin Exp Res 2005; 29: 553–563.
3. Aguiar S, Borowski T. Neuropharmacological Review ofthe Nootropic Herb BM monnieri. Rejuvenation Res 2013;16: 313–326.
4. Massaad CA. Neuronal and vascular oxidative stress inAlzheimer’s disease. Curr Neuropharmacol 2011; 9: 662–673.
5. Verwey B, Muntendam A, Ensing K, Essink G, Pasker-deJong PCM, Wi l lekens FLA, et al . Cl inical ly relevantanterograde amnesia and its relationship with blood levelsof benzodiazepines in suicide attempters who took anoverdos e. Prog Neuro -Psy chopharmac ology B io lPsychiatry 2005; 29: 47–53.
6. Bhat tacharya SK, Ghosal S. Anxiolyt ic act iv i ty of astandardized extract of BM monniera: an experimentalstudy. Phytomedicine 1998; 5: 77–82.
7. Achliya G, Wadodkar S, Dorle A. Evaluation of CNS activityof BramhiGhrita. Indian J Pharmacol 2005; 37: 33.
8. Calabrese C, Gregory WL, Leo M, Kraemer D, Bone K,Oken B. Effects of a standardized BM monnieri extract oncognitive performance, anxiety, and depression in theelderly: a randomized, double-blind, placebo-controlledtrial. J Altern Complement Med 2008; 14: 707–713.
9. Nemetchek MD, Stierle AA, Stierle DB, Lurie DI. TheAyurved ic p lant BM monnier i inh ibi t s in f lammatorypathways in the brain. J Ethnopharmacol 2017; 197: 92–100.
10. Sathyanarayanan V, Thomas T, Einöther SJL, Dobriyal R,Joshi MK, Krishnamachari S. Brahmi for the better? Newfindings challenging cognition and anti-anxiety effects ofBrahmi (BM monniera) in healthy adults. Psychopharmacology(Berl) 2013; 227: 299–306.
11. Crews FT, Lawrimore CJ, Walter TJ, Coleman LG. Therole of neuroimmunesignaling in alcoholism. Neuropharmacology2017; 122: 56–73.
12. Marcinkiewcz CA, Dorrier CE, Lopez AJ, Kash TL. Ethanolinduced adaptations in 5-HT2c receptor signaling in thebed nucleus of the stria terminalis: implications for anxietyduring ethanol withdrawal. Neuropharmacology 2015; 89:157–167.
13. Sachdeva A , Choudhary M, Chandra M. A lc oho lWithdrawal Syndrome: Benzodiazepines and Beyond. JClin DIAGNOSTIC Res 2015; 9: 01–7.
14. Mathew J, Balakrishnan S, Antony S, Abraham PM,Paulose CS. Decreased GABA receptor in the cerebralcortex of epi lept ic rats : ef fec t of BM monnier i andBacoside-A. J Biomed Sci 2012; 19: 25.
15. Rajan KE, Preethi J, Singh HK. Molecular and FunctionalCharacter izat ion of BM monniera/ : A Retrospect iveReview. Evidence-Based Complement Altern Med 2015;2015: 1–12.Chon KH. Autonomic control mechanism ofmaximal lower body negative pressure application. ConfProc IEEE Eng Med Biol Soc 2012; 2012: 3120–3123.
Indian J Physiol Pharmacol 2018; 62(3) Gastroprotective Effect of Ethanolic Extract of Vigna Subterranea 347
Original Article
Gastroprotective Effect of Ethanolic Extract of Vigna Subterraneain Ethanol-induced Gastric Mucosal Ulceration in Rats
Morufu E. Balogun*, Elizabeth E. Besong, Jacinta N. Obimma,Serges F. A. Djobissie and Ogochukwu S. Mbamalu
Department of Physiology,Faculty of Medicine,Ebonyi State University,Abakaliki, Nigeria
Abstract
Objective(s): The aim of the study was to investigate the gastroprotective effects of ethanolic seed extractof V. subterranea (EEVS) in ethanol-induced gastric mucosal ulceration in rats.
Methods: Gastric ulceration was induced experimentally using ethanol. Group 1 was the vehicle (normal)group and was fed with normal rat chow and water ad libitum; groups 2 was given normal rat chow and waterwhile group 3 was pre-treated with 20 mg/kg omeprazole. Groups 4 and 5 were pre-treated with 200 and 400mg/kg body weight of EEVS respectively once daily for 21 days. Ulcer index and gastric secretion indiceswere determined.
Results: The extract significantly (P<0.05) reduced the ulcer index from 9.2±2.14 (ulcer control) to 1.4±1.02(400 mg/kg). Pre-treatment with the EEVS significantly (P<0.05) increased gastric mucus secretion ascompared to the ulcerated control. The EEVS also produced a significant (P<0.05) and dose-dependentreduction in the level of gastric juice volume and acidity in comparison to ulcer control group.
Conclusion: The results suggest that the EEVS possesses significant gastroprotective effects againstethanol-induced gastric mucosal damage in rats which could be attributed to increase in gastric mucussecretion and also decrease in the level of gastric juice volume and acidity.
Indian J Physiol Pharmacol 2018; 62(3) : 347–358
*Corresponding author :
Email: [email protected]
(Received on January 1, 2018)
civilization constraints. It remains a major healthproblem in developed and developing countries thatposes economic challenges due to number ofhospitalization from complications and mortality rates(1). Gastric ulcer is a benign lesion on the stomachmucosal layer. It is one of the most prevalentgastrointestinal disorders. Epidemiological studieshave shown that the prevalence is increasing rapidlyamong the populations (about 3 to 10%) in underdeveloped countries (2, 3). Gastric ulcers in most
Introduction
The incidence of gastric ulcer disease globally hasbeen on the increase due to rapid development and

348 Balogun,Besong, Obimma, Djobissie and Mbamalu Indian J Physiol Pharmacol 2018; 62(3)
and vomiting in pregnant women (18). According toprevious reports, V. Subterranea seed extracts havebeen shown to possess some biological propertiessuch as antioxidant (19) and hepatoprotective (20)activities in animal studies. In spite of multi-functionalproperties of V. subterranea, its gastroprotectiveeffect has not been explored. This study thereforeseeks to investigate the gastroprotective effect ofethanolic seed extract of V. subterranea (EEVS) inethanol-induced gastric ulceration in rats.
Materials and Methods
Chemicals and reagents
Analytical grade chemicals and reagents were usedin this study. Tween 80, ethanol and diethyl etherwere purchased f rom Sigma-Aldrich ChemicalCompany (St. Louis Missouri, USA).
Drug preparation
Omeprazole: Omeprazole (Micro Lab India) ,procured from Godal pharmacy Abakaliki, Nigeria,was used as reference antiulcer drug in this study.The drug was dissolved in 3% Tween-80 (2 ml/kg)and administered to the animals orally in a dose of20 mg/kg body weight prior to gastric ulcer induction(21). The reference drug was freshly prepared beforeuse.
Experimental animals
Male albino rats weighing 184.7±1.53 g were usedfor the study. The animals were obtained from theCentral Animal House of Faculty of Medicine, EbonyiState University, Abakaliki. They animals were keptunder standard laboratory conditions and fed withstandard rat pellets (Vital feed: growers grandcereals, Jos, Plateau state) and water ad libitum.The animals were allowed one week acclimatizationbefore the experiment commenced.
Ethical issues
This research protocol was approved by the ethicscommittee for animal experimentation of the Facultyof Medicine, Ebonyi State University, Abakaliki (Ethic
cases occur due to imbalance of activity betweenthe aggressive factors (acid and pepsin) andprotective factors (mucus and bicarbonate) (4).
The pathogenesis of gastric ulcer is multifactorial innature, these inc lude: increased ac id-peps insecretion (5), impaired bicarbonate neutralization andreduced mucus secretion (6). Also poor feeding habits,too much consum pt ion o f nons tero idal an t i -inflammatory drugs (NSAIDs) (7), stress (8), smoking(9), and infection by Helicobacter pylori (10) havealso been implicated in the pathogenesis of gastriculcer. Numerous antiulcer drugs (such as protonpump inhibitors, histamine receptor antagonists andantibiotics) are available behind the counter fortreatment and management of gastric ulcers. Butthe major challenges remain the high cost, adverseeffects and resistance of these drugs with prolongeduse (11). These prompted the renewed interest inidentifying new antiulcer drugs from natural sources.Num erous m edic ina l p lan ts used in an im alexperiments have shown to possess antiulcer effects(12). One of the medicinal plants that may have agreat potential as an antiulcer agent is Vignasubterranea.
Vigna subterranea (V. subterranea) commonly knownas Bambara groundnut, is an emerging plant ofinterest in the treatment, management and preventionof gastric ulcer. It is a legume belonging to the familyof Fabaceae, and genus of Vigna. It has its origin inWest Africa (13) and exists in both wild and cultivatedforms. The plant is known as jugo beans in SouthAfrica, aboboi in Ghana and nzama in Malawi. InNigeria, different tribal groups have their indigenousnames as “Okpa” among the Igbos in Eastern part ofNigeria; “Gurjiya or Kwaruru” among the Hausas inNorthern Nigeria and “Epiroro” by the Yorubas inWestern part of Nigeria (14).
The seed extracts of V. subterranea have manytherapeutic applications in folkloric medicine owingto their effective secondary metabolites such asa lka lo ids , f lavono ids , sapon ins, res ins , andglycosides (15). In Africa, infusions and decoctionsof the seeds are used to treat venereal diseases,diarrhoea, cataract, beriberi and polymenorrhea (16,17). The raw seeds are chewed to alleviate nausea

Indian J Physiol Pharmacol 2018; 62(3) Gastroprotective Effect of Ethanolic Extract of Vigna Subterranea 349
No. EBSU/REC/MPC/15012/07) and animal handlingwas according to accepted guidelines for laboratoryanimal use and care by the National Institute ofHealth (22).
Collection and authentication of plant materials
Dry seeds of V. subterranea were purchased fromAbakpa market, Abakaliki, Ebonyi State. They wereidentified and authenticated by Chijioke Onyeukwu,a botanist in the department of Plant Science andBiotechnology, University of Nigeria, Nsukka, EnuguState. A voucher specimen (UNH 154a) was depositedin the herbarium of the same department for futurereference.
Preparation of ethanolic extract
The dry seeds of V. subterranea were dehulled andground into flour using a suitable grinder. The seedpowder (1000 g) was extracted with absolute ethanol(96%, v/v) in a soxhlet extractor at 70°C. The mixturewas vacuum-filtered through Whatman No. 1 filterpaper and the filtered extract was concentrated usinga vacuum rotary evaporator (Eyla N-1000, Japan)maintained at 45°C. The resulting residue whichweighed 93.4 g (recovery 9.3%) was later storedunder 4°C before use. Prior to oral administration,the extract was reconstituted in 3% Tween-80 togive required doses of 200 and 400 mg/kg bodyweight (23).
Qualitative phytochemical analysis
The ethanolic extract of V. Subterranea (EEVS) wassubjected to qualitative phytochemical screening toidenti fy the secondary consti tuents (alkaloids,saponins, terpenoids, anthraquinones, flavonoids,tannins, resins, glycosides, steroids and phenols)present in the seed using standard phytochemicalmethods described by Siddiqui and Ali (24) andHarborne (25).
Experimental design and animal treatment
In this study, ethanol-induced ulcer model wasemployed to induce ulceration experimentally. The
rats were divided randomly into five groups of fiverats in each. Group 1 (vehicle) received 3% Tween-80 (2 ml/kg) only. Group 2 (ulcer control) received3% Tween-80. Group 3 (standard) received 20 mg/kgbody weight of omeprazole while groups 4 and 5(test groups) received 200 and 400 mg/kg body weightof EEVS respectively. All the groups were pre-treatedfor 21 days between 08.00 am and 09.00 am dailyby oral gavage.
Ethanol induced gastric ulceration
This was carried out according to the methoddescribed by Mahmood et al. (26). Following 21 daysof drug and extract pre-treatment, gastric ulcer wasinduced in 18 h fasted rats by oral administration of1 ml of absolute ethanol (96%) from groups (2 to 5).After 1 h of ethanol administration, the animalswere sacrificed by an overdose of diethyl etheranaesthetization. The gastric content was collectedfor determination of gastric juice volume, pH, freeand total acidity, acid output, and mucus level (27).The stomachs were then dissected and analysed forulcer index.
Quantification of ulceration and percentage inhibition
The mucosal layer of each stomach was viewed undera magnifying lens (x10) to quantify the gastriculcerations. The severity of ulcerations was countedand scored using the method of Kulkarni (28) asdescribed below:
00: Normal colouration 0.5: Red colouration
1.0: Spot ulcers 1.5: Haemorrhagic streaks
2.0: Deep ulcers 3.0: perforations
The ulcer index was expressed as the sum of scoresgiven to gastric lesions (29).
Percentage of ulcer inhibition (%I) was calculatedaccording to Hojage et al. (30) using the formula:
%I = (Control mean ulcer index – Test mean ulcer index)×100%
Control mean ulcer index

350 Balogun,Besong, Obimma, Djobissie and Mbamalu Indian J Physiol Pharmacol 2018; 62(3)
Determination of gastric juice volume and pH
The content obtained from each rat stomach wascentrifuged at 2000 rpm for 10 mins. The supernatantfluid volume was measured in millilitre (ml) usingmicro syringe (31). The pH of gastric juice wasdetermined using a digital pH meter.
Determination of free and total acidity and gastric acidoutput
Free and total acidity were determined by themethod of Grossman (32). One ml of gastr icjuice was titrated with 0.01N NaOH in a conicalflask using phenolphthalein (two drops) as indicatoruntil l ight pink solution indicating pH 7.0 wasobtained.
Acid output was expressed as micro equivalents perhour (µEq/hr) and calculated by multiplying the totalacidity in mEq/L by the volume of gastric juice in ml(33). The result was divided by 4 to give output perhour.
Acid output (µEq/hr) = Acidity (mEq/L) x Volume ofgastric juice (ml) / 4 hr.
Determination of gastric wall mucus secretion
This was determined by the method of Corne et al(34). After the rats had been sacrificed, the glandularportion of each rat stomach was weighed and soakedin 1% alcian blue solution in 10% sucrose. Theglandular mucus was allowed to bind to alcian bluefor 10 mins. The uncomplexed dye which adhered tothe stomach tissue was removed by rinsing withsucrose solution. The complexed dye with mucuswas extracted for 15 mins in 5 ml of 5% magnesiumchloride solution. The resulting blue solutions wereshaken with equal volume of diethyl ether. Theresulting emulsions were centrifuged at 3000 rpm for10 mins and the absorbancies of the supernatantwere measured a t 580 nm us ing UV-spectrophotometer. The amount of alcian blueconcentrated for every gram of wet glandular tissuewas afterwards calculated.
Macroscopic examinat ion of the gast r ic m ucosalulceration
The gastric mucosal layer of the stomach of eachrat was rinsed with normal saline to remove bloodclot if any. The stomach was then pinned to a flatboard to observe any changes in the physicalappearance of the mucosa. Photographs of thegastric lesions were taken for proper observation anddocumentation.
Histological studies of the gastric mucosa
Histopathological studies were conducted using themethod described by Bancroft and Stevens (35). Aftergastric content collection and scoring of gastriclesions, samples from the stomachs representingeach group were fixed in 10% formalin for 24 h. Theformalin fixed specimens were embedded in paraffinwax and sections of 5 mm thick were cut in amicrotome, fixed in 20% alcohol and mounted onglass slides using standard techniques. The slideswere viewed under a light microscope (x10, x20 andx40 magnification) after staining the tissues withhaematoxylin-eosin stain. Photographs of the gastriclesions were taken with a photo microscope for properobservation and documentation of histopathologicallesions.
Statistical analysis
The values were expressed as Mean±Standard errorof mean (SEM). For data comparison, one wayanalysis of variance (ANOVA) was used followed byTukey’s multiple comparison tests. Dif ferencesbetween groups were considered stat is t ica l lysignificant at P<0.05 using Graph pad Prism Version6.0 for Windows (GraphPad® Software, San Diego,CA, USA).
Results
Qualitative phytochemical analysis
The result of the preliminary qualitative phytochemicalstudies of EEVS is presented in Table I.

Indian J Physiol Pharmacol 2018; 62(3) Gastroprotective Effect of Ethanolic Extract of Vigna Subterranea 351
Effect of EEVS on ulcer index and inhibition
Table II showed the effects of EEVS on ulcer indexand % ulcer inhibition in the experimental animals.Oral administration of ethanol caused a significant(P<0.05) increase in ulcer index compared to vehiclecontrol group. The results show that the EEVSsignificantly (P<0.05) reduced the ulcer index from9.2±2.14 (ulcer control) to 1.4±1.02 (400 mg/kg) inthe ethanol-induced ulcerated rats. Pre-treatment witheither omeprazole or the extract s ignif icant ly(P<0.05) reduced the severity of ethanol-inducedgastric lesions. The extract exhibited a dose-dependent inhibit ion against ulceration in rats.However, maximum inhibit ion was observed inomeprazole pre-treated group.
gastric juice volume with corresponding significant(P<0.05) decrease in pH when compared to vehiclecontrol group. Pre-treatment with either the extractor omeprazole caused a s igni f icant (P<0.05)decrease in gastric volume coupled with significant(P<0.05) increase in pH value in comparison to ulcercontrol group. However, the extract exhibited dose-dependent effects on gastric juice volume and pHagainst ethanol-induced ulcerated rats.
TABLE I : Qualitative phytochemical analysis of EEVS.
Secondary metabolites EEVS
Saponins +Tannins –Flavonoids +Glycosides +Alkaloids +Steroids –Terpenoids +Phenols –Anthraquinones –Resins +
Keywords: EEVS = Ethanolic extract of V. Subterranea;+ = present; – = absent.
TABLE IV : Effects of EEVS on free and total acidity inethanol-induced ulcerated rats.
Groups Treatment & dose Free acidity Total acidity
(mEq/L) (mEq/L)
1 (vehicle) Tween 80 (2 ml/kg) 12.63±0.70 21.38±0.51
2 (ulcer control) Ethanol (1 ml) 49.25±1.34# 78.33±0.09#
3 (standard) Omeprazole (20 mg/kg) 17.01±0.26* 23.64±0.35*
4 (test) Extract (200 mg/kg) 28.32±0.59* 48.02±0.66*
5 (test) Extract (400 mg/kg) 20.57±0.82* 39.30±1.58*
All values are expressed as Mean±SEM (n = 5 in eachgroup), #P<0.05 vs vehicle; *P<0.05 vs ulcer control.
TABLE II : Effects of EEVS on ulcer index and ulcer inhibitionin ethanol-induced ulcerated rats.
Groups Treatment & Ulcer Ulcerdose index inhibition (%)
1 (vehicle) Tween 80 (2 ml/kg) 0.0±0.00 1002 (ulcer control) Ethanol (1 ml) 9.2±2.14# 0.003 (standard) Omeprazole (20 mg/kg) 0.6±0.33* 93.484 (test) Extract (200 mg/kg) 2.0±0.59* 78.265 (test) Extract (400 mg/kg) 1.4±1.02* 84.78
All values are expressed as Mean±SEM (n = 5 in eachgroup), #P<0.05 vs vehicle; *P<0.05 vs ulcer control.
TABLE III : Effects of EEVS on gastric juice volume and pHin ethanol-induced ulcerated rats.
Groups Treatment & dose Gastric pHvolume (ml)
1 (vehicle) Tween 80 (2 ml/kg) 1.58±0.75 6.05±0.882 (ulcer control) Ethanol (1 ml) 7.23±0.11# 2.71±0.50#
3 (standard) Omeprazole (20 mg/kg) 2.31±0.84* 5.48±0.96*4 (test) Extract (200 mg/kg) 4.06±0.59* 4.40±0.37*5 (test) Extract (400 mg/kg) 3.12±0.63* 5.26±0.13*
All values are expressed as Mean±SEM (n = 5 in eachgroup), #P<0.05 vs vehicle; *P<0.05 vs ulcer control.
Effects of EEVS on gastric juice volume and pH
The effects of EEVS on gastric juice volume and pHvalue are reported in Tables III, the ulcer controlgroup showed a significant (P<0.05) increase in
Effects of EEVS on free and total acidity
Table IV showed the effects of EEVS on free andtotal acidity in ethanol-induced ulcerated rats. Oraladministration of ethanol caused a signif icant(P<0.05) increase in free and total acidity incomparison to vehicle control group. Omeprazolegroup showed a significant (P<0.05) decrease infree and total acidity as compared to ulcer controlgroup. Pre-treatment with the extract produced asignificant (P<0.05) and dose-dependent reductionin free and total acidity in comparison to ulcer controlgroup.

352 Balogun,Besong, Obimma, Djobissie and Mbamalu Indian J Physiol Pharmacol 2018; 62(3)
Effect of EEVS on gastric acid output
The effect of EEVS on gastric acid output is shownin Fig. 1, the ulcer control group showed a significant(P<0.05) increase in acid output in comparison tovehicle control group. Omeprazole group produced asignificant (P<0.05) decrease in gastric acid outputas compared to ulcer control group. The extractproduced a significant (P<0.05) and dose-dependentdecrease in acid output in comparison to ulcer controlgroup.
Fig. 1: Effect of EEVS on gastric acid output in ethanol-induced ulcerated rats. Values are expressed asMean±SEM (n = 5 in each group), aP<0.05 vs. vehiclegroup; bP<0.05 vs. ulcer control group.
Effect of EEVS on gastric mucus secretion
Fig. 2 showed the effect EEVS on gastric mucussecretion in ethanol-induced ulcerated rats. The ulcercontrol group showed a significant decrease (P<0.05)in gastric mucus secretion compared to vehiclecontrol group. Omeprazole group produced asignif icant (P<0.05) increase in gastr ic mucussecretion as compared to ulcer control group. Pre-treatment with the extract also significantly (P<0.05)increase gastric mucus secretion when compared toulcer control group in a dose-dependent effect.
Macroscopic evaluation of the gastric lesions
In Fig. 3, the vehicle control group showed normalgastric mucosal architecture. Ulcer control groupshowed severe injuries with extensive haemorrhagic
Fig. 2: Effect of EEVS on gastric mucus secretion in ethanol-induced ulcerated rats. Values are expressed asMean±SEM (n = 5 in each group), m—P<0.05 vs. vehiclegroup; #P<0.05 vs. ulcer control group.
necrosis of the gastric mucosa (white arrow) areseen. Groups pre-treated with EEVS (200 and 400mg/kg) exhibited a fairly protected mucosa in ethanol-induced ulceration model.
Microscopic evaluation of the gastric lesions
In Fig. 4, histological evaluation of ethanol-inducedgastric ulceration showed severe disruption to theepithelial surface of the gastric mucosa, oedema ofthe submucosa with leucocytes infiltration in ulcercontrol groups. Rats pre-treated with EEVS (200 and400 mg/kg) and omeprazole had better gastricmucosal protection which is manifested through milddisruption to the epithelial surface with reduced orabsence of submucosal oedema and leucocytesinfiltration.
Discussion
The available research data from this study clearlydem ons t ra te the pro tec t ive e f fec t of o ra ladministrat ion of ethanolic seed extract of V.subterranea against gastric mucosal ulcerationinduced experimentally by ethanol in rats. Thefindings from the study indicated that EEVS offeredsignificant protection against experimentally inducedmucosal ulceration. The extract at low and high doselevels of fered 78.26% and 84.78% protect ion

Indian J Physiol Pharmacol 2018; 62(3) Gastroprotective Effect of Ethanolic Extract of Vigna Subterranea 353
Fig. 3: Macroscopic appearance of the gastric mucosa in ethanol-induced ulcerated rats. A: vehicle control group. Has noinjury of gastric mucosa. B: ulcer control group. Severe mucosal injuries with extensive haemorrhagic streaks (yellowarrow) are seen. C: omeprazole group. No mucosal injury is seen. D: EEVS (200 mg/kg). Milder mucosal injury (yellowarrow) compared to that seen in ulcer control rats with flattening of gastric mucosal folds (black arrow). E: EEVS(400 mg/kg). No mucosal injury is seen but there is flattening of the gastric mucosal fold (black arrow).

354 Balogun,Besong, Obimma, Djobissie and Mbamalu Indian J Physiol Pharmacol 2018; 62(3)
Fig. 4: Histological evaluation of ethanol-induced gastric mucosal damage in rats. A: vehicle group. Normal mucosal epithelium(yellow arrow) and submucosal layer (black arrow) are seen. B: ulcer control group. Severe damage to the epithelialsurface with deep mucosal penetration of necrot ic lesions (yellow arrow), submucosal oedema and leucocytesinfiltration (black arrow) are present. C: omeprazole group. There is absence of epithelial surface disruption, submucosaloedema and leucocytes infiltration. D: EEVS (200 mg/kg). There is moderate disruption of the epithelial surface withno deep mucosal damage (yellow arrow). Submucosal oedema and leucocytes infiltration is reduced (black arrow). E:EEVS (400 mg/kg). Has no mucosal epithelial surface disruption (yellow arrow). Submucosal oedema and leucocytesinfiltration is absent (black arrow).

Indian J Physiol Pharmacol 2018; 62(3) Gastroprotective Effect of Ethanolic Extract of Vigna Subterranea 355
respectively against ethanol-induced gastric mucosaldamage. It is interesting to note that the extract atboth doses, showed an increase in gastric mucussecretion over omeprazole. This is an indicative ofbetter activity than omeprazole. Nevertheless, themechanisms behind these antiulcer effects of EEVSin rats have not yet been established.
Ethanol penetrates the stomach mucosa rapidly,damaging the plasma and cell membrane which leadsto increase in the permeability of intracellularmembrane to water and sodium resulting to damageof the gastric mucosa (36). Ethanol in the stomachdisrupts the mucosal barrier by dissolving the gastricmucus thereby causing backflow of acid (37). Itstimulates the production of free radicals whichcauses increase in lipid peroxidation destroying themucosal membrane. Ethanol also depletes the levelof protein in the gastric tissues leading to stasis inmucosal blood flow which is responsible for thehaemorrhage and necrosis of the gastric mucosa(38) . In the present s tudy, f o l lowing ora ladministration of ethanol to the rats, hemorrhagicred streaks of various sizes were observed on thegastric mucosa of the control group. Groups pre-treated with EEVS significantly decrease the rate ofdamage induced by ethanol to the gastric mucosa incomparison to the control group. The ulcer indexwas significantly reduced and mucus productionsignificantly increased in EEVS pre-treated groupscom pared wi th the cont ro l g roup. Th isgastroprotective effect of the extract may be mediatedpartly by gastric mucus restoration. That is, theextract prevents mucus dissolution induced byethanol.
The pathogenic effects of ethanol-induced gastricmucosal lesions has been established to includeincreased secretion of gastric acid, which resultedin increased gastr ic volume, reduced pH, andincreased free and total acidity, acid output and ulcerindex (39). The auto digestion of the mucosal wallby accumulated gastric juice causes mucosal barrierbreakdown leading to gastric ulcer formation (40).Findings from the current study demonstrate that inethanol-induced gastric ulceration method, the EEVSpre-treated groups produced a significant decreasein free and total acidity, acid output and volume of
gastric fluid with a corresponding increase in pHcompared to the ulcer control group. This decreasein gastric juice volume in the extract pre-treatedgroups may be due to a decrease in acid productionas evidenced from the gastric juice free and totalacidity. This is an indication that EEVS containssome biological active compounds that reduce theacidity of gastric secretions which was increased byethanol-induced ulceration.
Oxidative stress has been implicated in pathogenesisof many diseases such as gastric ulcer. Antioxidantshave been reported to protect the gastric mucosaagainst different ulcerogens (41). Antioxidants protectcells from oxidative damage while improving thebody’s im mune system against degenerat ivediseases. The antioxidant level in the stomach isdecreased by ethanol leading to release andaccumulation of free radicals which is toxic to thestructure and function of the membrane. Ethanolmetabolism has been found to involve the release ofhydroperoxy and superoxide free radicals as oxygenderived free radicals which play a role in acute andchronic gastric ulceration (42). Large amounts ofantioxidant compounds have been reported to bepresent in the seeds of V. subterranea (19). Theactive compounds flavonoids and glycosides whichare present in the seeds have been reported by Motaet al. (43) and Gill and Bali (44) as antioxidantmaterials. Flavonoids have been found to displayantioxidant properties by scavenging the free radicalsand reactive oxygen species produced by ethanol(45). Therefore, it is suggested that the antiulcerproperty of this extract could be attributed to itsantioxidant potential which offers a f irst line ofdefence against any ulcerogenic agent by bolsteringthe mucosal defence system.
The gastric mucosal folds were observed to beflattened in rats pre-treated with low and high dosesof EEVS. In rat’s stomach, ethanol can cause thecircular muscles to contract resulting in compressionof the mucosa at the crests of mucosal folds. Thismucosal compression can lead to necrosis andulceration. Flattening of mucosal folds relaxes thecircular muscles and increases the area of themucosa exposed to ulcerogens. This reduces thevolume of the gastric irritants at the apex of mucosal

356 Balogun,Besong, Obimma, Djobissie and Mbamalu Indian J Physiol Pharmacol 2018; 62(3)
folds and hence protects the mucosa. Takeuchi etal. (46) reported that changes in gastric motility maybe responsible for the prevention and formation ofexperimental gastric ulcers. This suggests that bydecreasing gastric motility the extract is manifestingits gastroprotective potential.
Histological evaluation revealed that the gastricmucosa is protected and infiltration of leucocytesinto the submucosa is inhibited in rats pre-treatedwith EEVS. The gastric mucosa would extensivelybe damaged by ethanol leading to increasedinf i lt rat ion of neutrophi ls into the submucosa.Inf lammatory mediators are mainly formed byneutrophils that can release free radicals which areharmful to cells and tissues (47). According toShimizu et al. (48), a decrease in infiltration ofneutrophils into ulcerated gastric tissue enhancesgastric ulcer healing in rats. This suggests that V.subterranea extract possess ant i- inf lammatoryproperty which could also play a role in gastric ulcerprevention as reported by Swarnakar et al. (49).
Ethanolic seed extract of V. subterranea has beenrepor ted to conta in phytochemica ls such asflavonoids, glycosides and terpenoids which areamong the cytoprotective materials known to possessant iulcer (43, 50) , ant iox idant (44) and ant i-inf lammatory (51) act ivi t ies respect ively. I t issuggested that these secondary metabolites couldenhance bicarbonate, mucus and prostaglandinsecretion and attenuate the damaging effects of freeradicals in gastrointestinal lumen (52). Therefore, itis pertinent that the decrease in gastric lesions,
decrease in volume and acidity of gastric fluid andincrease in gastric mucus secretion produced byEEVS in this study could be due to the presence ofthese active components or some other mechanismsyet to be unravelled. Therefore, further studies arerequired to establish the exact mechanism of actionand isolate the active ingredients in the seedsresponsible for the observed gastroprotective effectsso as to open the gateway for potential drugdevelopment in the future.
Conclusion
Findings f rom th is s tudy suggest that EEVSpossesses significant gastroprotective effects againstethanol- induced gastric ulceration in rats. Thisobserved gastroprotective effect could be attributedto decrease in the level of gastric juice volume andacidity with corresponding increase in gastric mucussecret ion. Our f indings may have benef ic ia lapplication in the management of gastric mucosallesions associated with ethanol-induced gastriculceration.
Acknowledgements
The authors are grateful to the Physiology departmentof Ebonyi State University, Abakaliki, Nigeria forproviding ample support and access to researchfacilities.
Conflict of interest
The authors declare that no conflict of interest exists.
References
1. Sonnenberg A. Geographic and temporal variations in theoccurrence of peptic ulcer disease. Scand J GastroenterolSuppl 1996; 110: 11–12.
2. Rosa SD, Vishwanath GD. Gastric cytoprotection. IndianJ Physiol Pharmacol 1991; 35: 88–98.
3. Falk GW. Cecil Essentials of Medicine, 5th ed. Edinburgh:W.B. Saunders; 2001. p. 334–343.
4. Choi E, Hwang H, Kim I, Nam T. Protective effects of apolysaccharide from Hizikia fusiformis against ethanoltoxicity in rats. Food Chem Toxicol 2009; 47: 134–139.
5. Kumar V, Abbas AK, Fausto N. Robbins and CotranPathologic Basis of Diseases (7th ed). New Delhi: ElsevierSaunders publishers; 2004. p. 817.
6. Tulassay Z, Hersnzenyl L. Gastric mucosal defense andcytoprotection: Best practice research. Clin Gastroenterol2010; 24: 99–108.
7. Musumba C, Pritchard DM, Pirmohamed M. Review article:Cellular and molecular mechanisms of NSAID- induced pepticulcers. Alimentary Pharmacol Therap 2009; 30: 517–531.
8. Sairam K, Rao CV, Goel RK. Effect of Convolvuluspluricaulis chois on gastric ulceration and secretion inrats. Indian J Exp Biol 2001; 39: 350–357.
9. Ikuko K, Nomura AMY, Stemmermann GN, Chyou P. Aprospective study of gastric and duodenal ulcer and itsrelation to smoking, alcohol and diet. Am J Epidemiol1992; 135: 521–530.

Indian J Physiol Pharmacol 2018; 62(3) Gastroprotective Effect of Ethanolic Extract of Vigna Subterranea 357
10. Marcus EA, Vagin O, Tokhtaeva E. Helicobacter pyloriimpedes acid–induced t ightening of gastric epithelialjunct ion. Am J Physiol Gastrointestinal Liver Physiol2013; 305: 731–739.
11. Alaribe CS, Adesegun S, Idowu AO, Egere O, Ihemedu C,Coker HAB et al. Heal ing, cytoprotect ive and ant i–helicobacter pylori activities of stem bark extracts andbutanol fraction of Nauclea latifolia. J Nat Prod 2014; 7:184–195.
12. Balogun ME, Nwachukwu DC, Salami SA, Besong EE, ObuDC, Djobissie SFA. Assessment of antiulcer efficacy ofstem bark extract of Nauclea latifolia (African peach) inrats. Am J Biomed Res 2016; 4: 13–17.
13. Swaneve lder CJ . Bambara f ood fo r A f r i c a . ( v ignasuberranea –bambara groundnut) South Africa : NationalDepartment of Agriculture; 1998. p. 1–16.
14. Bamishaiye OM, Adegbola JA, Bamishaiye EI. Bambaragroundnut: an under–util ized nut in Africa. Adv AgricBiotechnol 2011; 1: 60–72.
15. Andzouana M, Mombouli JB, Attibayeba A. Chemical andphytochemical compositions of Voandzeia subterraneaseeds. Pakistan J Biol Sci 2014; 1: 1–6.
16. Brink M, Belay G. Plant Resource of Tropical Africa;Cereals and Pulses. PROTA Foundation Netherlands:Backclays publishers; 2006. p. 214.
17. Basu S, Roberts JA, Azam–ALI SN, Mayes S. Bambaragroundnut. Genome mapping and molecular breeding ofplants 2007; 3: 157–173.
18. Directorate Plant Production. Production guidelines forBambara groundnuts. Pretoria, South Africa: Departmentof Agriculture, Forestry and fisheries; 2011; p. 1–10.
19. Nyau V, Praakash S, Rodrigues J, Farrant J. Antioxidantactivities of Bambara groundnut as assessed by FRAPand DPPH assays. Am J Food Nutri 2015; 3: 7–11.
20. Iweala EJ, Elekwa I. Hepatic status and lipid peroxidationin rats fed Bambara groundnut (Voandzeia subterranea)and pigeon pea (Cajanus cajan). J Health Visual Sci2001; 3: 147–154.
21. Abdulla M.A, AL–Bayaty FH, Younis LT, Abu Hassan MI.Ant i–ulcer act ivi ty of Centel la as iat ica leaf ext ractsagainst ethanol–induced gastric mucosal injury in rats. JMed Plants Res 2010; 4: 1253–1259.
22. National Institute of Health. Principles of laboratory animaluse and care; 1985. Publication No. 85–123.
23. Nwajiobi OJ, Ogbunugafor HA, Ezenwelu CO, Oche B,Nwokeke CC, Ogoke JT. The effect of a combination ofD. dumetorum and V. subterranea feed on blood glucoselevel and serum Lipid profile in alloxan–induced diabeticrats. Inter J Agri Biosci 2016; 5: 109–112.
24. Siddiqui AA, Ali M. Practical Pharmaceutical Chemistry 1st
ed. New Delhi: CBS publishers and distributors; 1997;p. 126–131.
25. Harborne JB. Phytochemical Methods: A guide to moderntechniques of plant analysis 3rd edn. Berlin, Germany:Sringer Verlag; 1998. p. 302.
26. Mahmood AA, Mariod AA, Al–Bayaty F, Abdel–Wahab SI.Antiulcerogenic activity of Gynura procumbens leaf extractagainst experimentally–induced gastric lesions in rats. JMed Plant Res 2010; 5: 5577–5583.
27. Shay H, Sun DCH, Gruenstein M. A quantitative method ofmeas ur ing s pontaneous gas t r i c sec re t i on in ra t s .Gastroenterol 1954; 26: 906.
28. Kulkarni SK. Handbook of Experimental Pharmacology. NewDelhi: Vallabh Prakashan; 2002. p. 148–150.
29. Tan PV, Nditafon NG, Yewah MP, Dimo T, Ayafor FL.Eremomoatax speciosa: effect of leaf aqueous extracton ulcer format ion and gast r ic secret ion in rats . JEthnopharmacol 1996; 54: 139–142.
30. Hojage MG, Hriprassanna RC, Patil KS, Mathapati S, WadkarG, Rao KP. Antiulcer effect of alcoholic extracts of Murusalba linn. leaves in rodents. Indian Drugs 2010; 47: 64–68.
31. Bickel M. Activity on gastrointestinal tract. In: Vogel G.H.,Vogel W.H., Scholkens B.A., Sandow J., Muller G. andVoge l W .F. (eds ) Drug d i sc overy and eva luat ion:Pharmacological assays 2nd edn. Germany: Spr ingerpublications; 2002; p. 867–872.
32. Grossman MI . Phys iology for phys ic ian. A Month lyPublication of the American Physiological Society 1963; 1:1–5.
33. D.A. Brodi, KF. Hooke, The effect of vasoactive agentson stress–induced gastric hemorrhage in rats. Dig 1971;4: 193–195.
34. Corne SJ, Monisey SM, Wood RJ. Proceedings; A methodfor the quantitative estimation of gastric barrier mucus.Physiol 1974; 242: 116–117.
35. Banc ro f t JD , S tevens A . Theory and prac t i c e o fhistological techniques. J Am Med Assoc 1977; 238: 2730–2733.
36. Dashputre N, Naikwade N. Evaluation of antiulcer activityof methanolic extract of Abutilon indicum Linn leaves inexperimental rats. Intern J Pharma Sci Drug Res 2011;p. 97–100.
37. Darbar S, Chattopadhyay S. Antiulcer effect of Livina, aherbal formulation against ethanol induced acute gastriculcer in mice. Intern J Pharm Res Dev 2010; p. 93–100.
38. Surendar S. Evaluation of gastric antiulcer activity offixed oils of thulasi and possible mechanism. Indian JExp Biol 1999; 36: 253–257.
39. Zayachkivska OS, Konturek SJ, Drozdowicz D, KonturekPC, Brzozowski T, Ghegotsky MR. Gastroprotect iveef fec ts o f f lavono ids i n p lant ext rac t s . J Phys io lPharmacol 2005; 56: 219–231.
40. Sini K, Sinha B, Rajasekaran A. Protective effects ofCapparis zeylanica Linn. leaf extract on gastric lesionsin experimental animals. Avicenna J Med Biotechnol 2011;10: 31–35.
41. Trivedi NP, Rawal UM. Hepatoprotective and antioxidantproperty Andrographis paniculata Nees in BHC–inducedliver damage in mice. Indian J Exp Biol 2001; 39: 41–46.
42. Kore KJ, Bramhakule PP, Rachhadiya RM, Shete RV.Evaluation of antiulcer activi ty of protocatechuic acidethylester in rats. Intern J Pharm Life Sci 2011; 2: 909–915.
43. Mota KSL, Dias GEN, Pinto MEF, Luiz-Ferreira A, Souza-Br i t o ARM, Hi ruma– L im a CA . F lavono ids wi thgastroprotective activity. Molecules 2009; 14: 979–1101.
44. Gill NS, Bali M. Evaluation of antioxidant, antiulcer activityof 9-beta-methyl-19-norlanostat-5-ene type glycosidesfrom Cucumis sativus seeds. Res J Med Plants 2012; 6:309–317.
45. Martin MJ, Marhuenda E, Perez-Guerrero C, Franco JM.Antiulcer effect of naringin on gastric lesion induced byethanol in rats. Pharmacol 1994; 49: 144–150.

358 Balogun,Besong, Obimma, Djobissie and Mbamalu Indian J Physiol Pharmacol 2018; 62(3)
46. Takeuchi K, Nishiwakki K, Okabe S. Effect of dopamineon gastric mucosal lesion induced by ethanol in rats-possible involvement of antigastric motor activity mediatedwith alpha 2 adrenoreceptors. Dig Disciplinary Sci 1987;31: 1100–1107.
47. Cheng CL, Koo MW. Effect of Centella asiatica on ethanolinduced gastric mucosal lesions in rats. Life Sci 2000;67: 2647–2653.
48. Shimizu N, Watanabe T, Arakawa T, Fujiwara Y, HiguchiK, Kuroki T. Pentoxifyline accelerates gastric ulcer healingin ra t s : ro les o f tum or nec ros is fac tor a lpha andneutrophils during the early phase of ulcer healing. Dig2000; 6: 157–164.
49. Swarnakar S, Ganguly K, Kundu P, Banerjee A, Maity P,Sharma AV. Curcmin regulates expression and activity of
matrix metalloprotinases 9 and 2 during prevention andhealing of indomethacin-induced gastric ulcer. J Biol Chem2005; 280: 9409–9415.
50. Zayachkivska OS, Konturek SJ, Drozdowicz D, KonturekPC, Brzozowski T, Ghegotsky MR. Gastroprotect iveef fec ts o f f lavono ids i n p lant ext rac t s . J Phys io lPharmacol 2005; 56: 219–231.
51. Kobayashi T, Ohta Y, Yoshino J, Nakazawa S. Teprenonepromotes the heal ing of acet ic acid–induced chronicgastric ulcers in rats by inhibiting neutrophil infiltrationand l ip id peroxidat ion in u lcerated gas t r i c t issues.Pharmacol Res 2001; 43: 23–30.
52. Sakat SS, Juvekar RA. Antiulcer activity of methanolextract of Erythrina indica Lam. Leaves in experimentalanimals. Pharmacogn Res 2009; 1: 396–401.
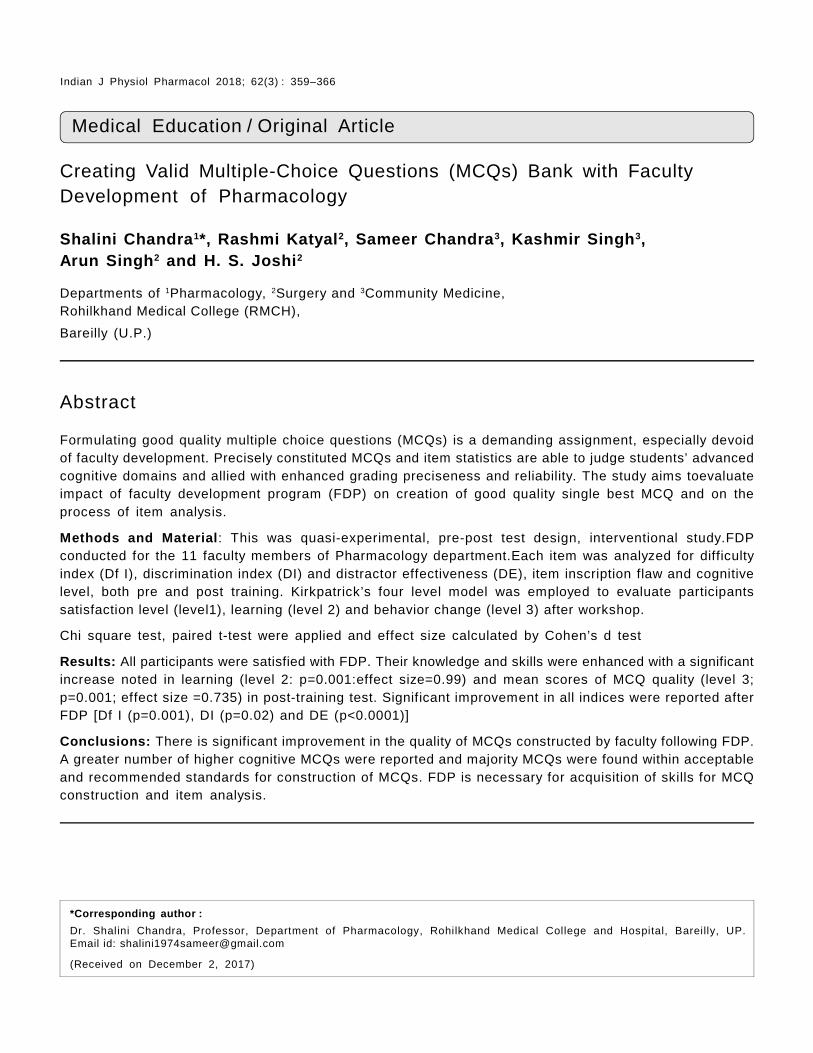
Indian J Physiol Pharmacol 2018; 62(3) Valid MCQ Bank with Faculty Development 359
Medical Education / Original Article
Creating Valid Multiple-Choice Questions (MCQs) Bank with FacultyDevelopment of Pharmacology
Shalini Chandra1*, Rashmi Katyal2, Sameer Chandra3, Kashmir Singh3,Arun Singh2 and H. S. Joshi2
Departments of 1Pharmacology, 2Surgery and 3Community Medicine,Rohilkhand Medical College (RMCH),
Bareilly (U.P.)
Abstract
Formulating good quality multiple choice questions (MCQs) is a demanding assignment, especially devoidof faculty development. Precisely constituted MCQs and item statistics are able to judge students’ advancedcognitive domains and allied with enhanced grading preciseness and reliability. The study aims toevaluateimpact of faculty development program (FDP) on creation of good quality single best MCQ and on theprocess of item analysis.
Methods and Material: This was quasi-experimental, pre-post test design, interventional study.FDPconducted for the 11 faculty members of Pharmacology department.Each item was analyzed for difficultyindex (Df I), discrimination index (DI) and distractor effectiveness (DE), item inscription flaw and cognitivelevel, both pre and post training. Kirkpatrick’s four level model was employed to evaluate participantssatisfaction level (level1), learning (level 2) and behavior change (level 3) after workshop.
Chi square test, paired t-test were applied and effect size calculated by Cohen’s d test
Results: All participants were satisfied with FDP. Their knowledge and skills were enhanced with a significantincrease noted in learning (level 2: p=0.001:effect size=0.99) and mean scores of MCQ quality (level 3;p=0.001; effect size =0.735) in post-training test. Significant improvement in all indices were reported afterFDP [Df I (p=0.001), DI (p=0.02) and DE (p<0.0001)]
Conclusions: There is significant improvement in the quality of MCQs constructed by faculty following FDP.A greater number of higher cognitive MCQs were reported and majority MCQs were found within acceptableand recommended standards for construction of MCQs. FDP is necessary for acquisition of skills for MCQconstruction and item analysis.
Indian J Physiol Pharmacol 2018; 62(3) : 359–366
*Corresponding author :
Dr. Shalini Chandra, Professor, Department of Pharmacology, Rohilkhand Medical College and Hospital, Bareilly, UP.Email id: [email protected]
(Received on December 2, 2017)

360 Chandra, Katyal, Chandra, K. Singh, A. Singh and Joshi Indian J Physiol Pharmacol 2018; 62(3)
is more possibility of error in framing items if theirs ta f f m em bers are not we l l sens i t ized andprofessionally trained enough for the development oftest items (8) which leads to lack of quality of manyexaminations.
Steinert et al. (9) in their systematic review in healthprofessions education reported that faculty trainingwere found to be associated positively with teachingeffectiveness both immediate and long term. FDPsfor that reason is crucial for development of validand re l iab le assessm ent m ater ia l . Very fewresearches have been carr ied out for facultydevelopment particularly for item writing and it’sanalysis in India.
We at our department have been executing MCQbased internal exams for undergraduate medicalstudents but faculty members are not trained eitherin item writing or item analysis. Hence this studywas undertaken with the aim of creating valid MCQsbank with the faculty development and the objectivesto be achieved were assessment of the impact ofFDP and overall satisfaction of the participants. Thiswas the first effort of this kind at our institute.
Methodology
The study was approved by Ethical committee of theinstitution. The aim was to assess the impact oftraining on developing high quality single best MCQsand on the process of item analysis. The targetpopulation was eleven faculty members of departmentof Pharmacology. The secondary purpose was toevaluate the perception on these training workshops.We made use of Kirkpatrick’s level of evaluationwhich comprised of four levels: the trainee’s reactionor level of satisfaction with the workshop ( level 1),their learning (level 2), their behavior change (level3) and long term impact of workshop (level 4) (10).
Study design
This was a quasi experimental, pre-post test design,interventional study. Preceding to the set up of studythe validated faculty satisfaction questionnaire weredeveloped (alpha =0.7196) as per AIMME (11). Eightpre and post short answer questions were developed
Introduction
Multiple-choice questions (MCQs) are one of thepopular and accepted means of evaluation in medicaleducation. MCQ test items are advantageous as theycan cover wider section of lessons and scrutinizelarge num bers of s tudents in lesser t im esimultaneously. The tests can be employed for bothparadigms of assessment (formative and summative).Colleges are incorporating MCQs tests in theirexaminations as there is rising trend of adoptingMCQs for pos tgraduate m edica l en t ranceexaminat ions. I ts acceptance is based on i tsobjectivity, feasibility, high internal consistency andaccuracy.
Good quality MCQs compel students to applyadvanced level of cognitive processing rather recallingthe solitary information (1). Numerous studies havereported that the quality of MCQ test items thatmedical institutes built are often of poor quality (2).Creating good MCQs are time consuming, challengingand difficult to construct but are effortlessly andconsistently scored (3). Characteristics of goodquality MCQs are mentioned in terms of item, thestem, and the distractors. MCQs having imperfectstem and unconvincing distractors hinder accurateassessment (4).
Item analysis provides quantitative data at the item-level through knowledge about item statistics and isused extensively to improve test value (5). Difficultyindex or facility value (Df I), Discrimination index(DI) and distractor (DE) are the foremost itemstatistics relevant for estimating the quality of MCQs(6) Abundance of MCQ books of diverse subjectsare existing in the market. Many of us either built uptest items by ourselves or trusted on questionsspecified in these books. Nonetheless Shah et al (7)in scrutiny of such MCQs taken straight from suchbooks reported that these MCQs might not be ofbetter-quality and need to be to be analyzed prior totheir use for assessment.
Medical faculties often perform those duties for whichno formal training has been received by them. Itemdevelopment and its analysis are one of the dutiesin which they have no experience and training. There

Indian J Physiol Pharmacol 2018; 62(3) Valid MCQ Bank with Faculty Development 361
regarding MCQ creation and item analysis which werevalidated by the medical education unit of theinstitution.
We used structured checklists (12) to review thequa l i t y o f MCQ i tem s before and a f te r theintervent ions to reduce the subject ivi ty whi leassessing test items. The checklist consisted of 21markers for assessing MCQ scores. Each markerwas allotted one mark thus total marks came out tobe twenty one. Each item was scored according tothe checklist and scores were calculated out of tenby diving the scores obtained by twenty one andthen mult iplied by ten. Interventions on threesuccessive days for a period of 3 hours were plannedin the department during this project. Before theinterventions, departmental meeting was organizedand all the faculties were requested to select 30MCQs on the topic Autonomic nervous system(ANS), what they considered as the best MCQs givenin the exam examination with common consensus.
Day 1: Pretest (8 short answer questions SAQs)was administered to the participants to assess theirknowledge, attitude and perception regarding MCQframing and item analysis. This was followed bysession on MCQ item developing guidelines byimpar t ing theoret ical background and al l theparticipants were taught to construct good qualitysingle best answer MCQs.
Day 2: Participants were divided into 2 groups. Eachgroup was requested to frame five single best MCQsfor practice, and checklist was provided to bothgroups followed by demonstration by each groupwhich was subsequently peer reviewed by secondgroup and feedback was given.
Day 3: Session on item analysis was organized viashort interactive lecture. Subsequently participantswere requested to fill up the faculty perceptionquestionnaire to evaluate level 1 and post-test wasadministered to assess learning (level 2)
Following training, the participants were againrequested to frame at least 5 MCQs each based onthe guidelines discussed in the workshop and submita total of 30 new MCQs on ANS with final agreement
among themselves. Consequently sample of 30MCQs each before and after the workshop wereobtained and analyzed for item quality and itemstatistics. The results were measured in terms ofitems of recall and higher cognitive domain, stemflaw, Df I, DI and DE or NFDs.
For interpretation MCQs test paper was administeredto second professional M.B.B.S students. Studentswere divided into two groups. All odd roll numbersare allocated in group A (n=100) and even rollnum bers in group B (n=100) . Group A wasadministered 30 MCQs (pre-training) which weresubmitted by the participants earlier attendingworkshop .Group B was administered 30 recentlyframed MCQs (post-training).
Each MCQ comprised of a stem and four choices(one key and three distractors) and students were toopt for one best answer from these four alternatives.Each right answer was allotted one mark and nonegative marking for incorrect answer. The answersheets were collected and grouped according to meritin descending order into three groups. The first groupwas from the top of the merit (high achiever group,33%) and third group was bottom of the students(low achiever group, 33%,). The middle 33% wereexcluded and not used in the item analysis.
Working Definition formula
(i) Difficulty Index (Df I) or facility value (FV) : It iscalculated using the formula :
FV = (HAG + LAG) × 100 / N
HAG = number of students answering the itemcorrectly in the high achiever group, LAG = numberof students answering the item correctly in the lowachiever group, N = Total number of students
(ii) Discrimination index (DI): This index signifies theability of a question to discriminate between ahigher and a lower achiever student. This iscalculated by applying the formula: DI = 2 X (HAG -LAG)/N where the symbols HAG, LAG and Nrepresent the same values as mentioned above.In general, the recommended DI value is >0.25
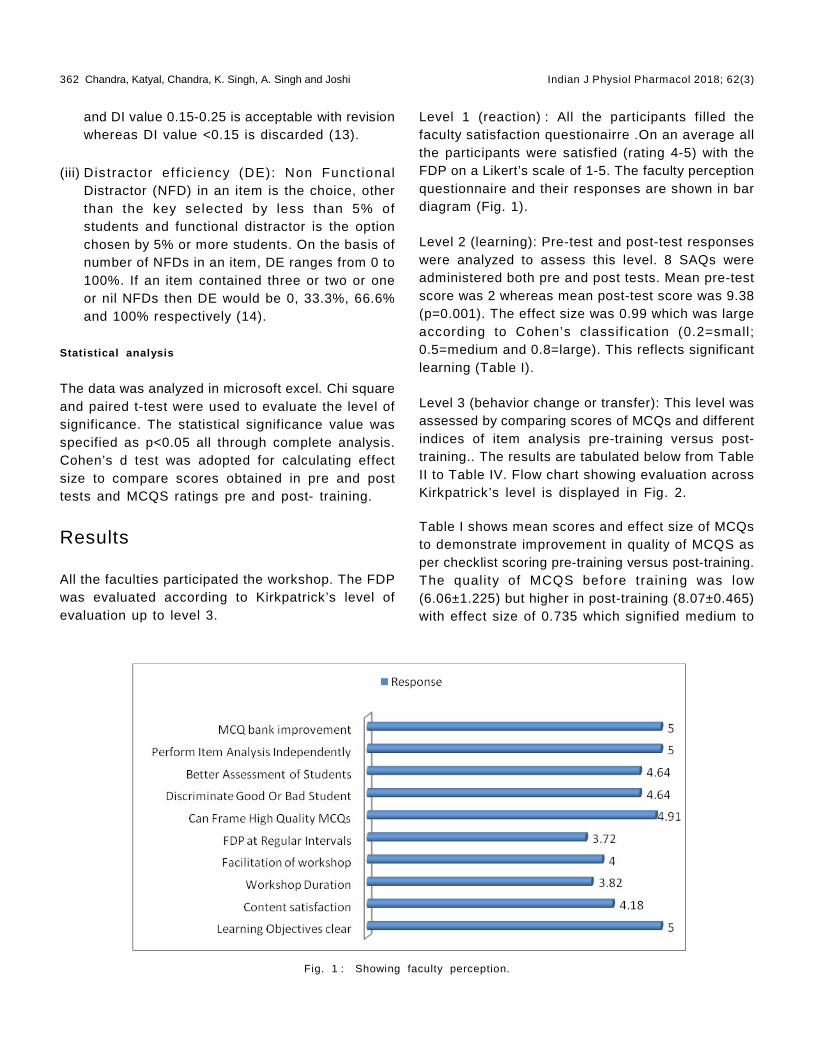
362 Chandra, Katyal, Chandra, K. Singh, A. Singh and Joshi Indian J Physiol Pharmacol 2018; 62(3)
and DI value 0.15-0.25 is acceptable with revisionwhereas DI value <0.15 is discarded (13).
(iii) Dis tractor ef f ic iency (DE): Non Funct ionalDistractor (NFD) in an item is the choice, otherthan the key selected by less than 5% ofstudents and functional distractor is the optionchosen by 5% or more students. On the basis ofnumber of NFDs in an item, DE ranges from 0 to100%. If an item contained three or two or oneor nil NFDs then DE would be 0, 33.3%, 66.6%and 100% respectively (14).
Statistical analysis
The data was analyzed in microsoft excel. Chi squareand paired t-test were used to evaluate the level ofsignificance. The statistical significance value wasspecified as p<0.05 all through complete analysis.Cohen’s d test was adopted for calculating effectsize to compare scores obtained in pre and posttests and MCQS ratings pre and post- training.
Results
All the faculties participated the workshop. The FDPwas evaluated according to Kirkpatrick’s level ofevaluation up to level 3.
Level 1 (reaction) : All the participants filled thefaculty satisfaction questionairre .On an average allthe participants were satisfied (rating 4-5) with theFDP on a Likert’s scale of 1-5. The faculty perceptionquestionnaire and their responses are shown in bardiagram (Fig. 1).
Level 2 (learning): Pre-test and post-test responseswere analyzed to assess this level. 8 SAQs wereadministered both pre and post tests. Mean pre-testscore was 2 whereas mean post-test score was 9.38(p=0.001). The effect size was 0.99 which was largeaccording to Cohen’s classif ication (0.2=small;0.5=medium and 0.8=large). This reflects significantlearning (Table I).
Level 3 (behavior change or transfer): This level wasassessed by comparing scores of MCQs and differentindices of item analysis pre-training versus post-training.. The results are tabulated below from TableII to Table IV. Flow chart showing evaluation acrossKirkpatrick’s level is displayed in Fig. 2.
Table I shows mean scores and effect size of MCQsto demonstrate improvement in quality of MCQS asper checklist scoring pre-training versus post-training.The quality of MCQS before training was low(6.06±1.225) but higher in post-training (8.07±0.465)with effect size of 0.735 which signified medium to
Fig. 1 : Showing faculty perception.

Indian J Physiol Pharmacol 2018; 62(3) Valid MCQ Bank with Faculty Development 363
TABLE I : Participants’ pre-test and post–test scores to assess learning and mean MCQscores as per checklist to assess quality of MCQs pre and post training.
Pre-test and post–test scores to assess learningNumber of participantsN=11 Pre-test mean Post-test mean P value Effect size
2.00±0.632 9.36±0.203 0.001* 0.99
Mean MCQ scores as per checklist
Mean MCQ score Mean MCQ score P value Effect sizePre-training Post-training
6.06±1.225 8.07±0.465 0.001* 0.735
Fig. 2 : Showing flow chart showing evaluation across Kirkpatrick’s levels of evaluation.
there is highly significant improvement in DE (chiSquare=35; 9<0.001).
Table III shows the matrix of the number of itemsfal l ing in dif ferent ranges of dif f iculty versusdiscrimination indices both pre and post-training. Wefound that in post-training 15 out of 30 items weresuch that they were in the acceptable ranges ofboth Df I and DI as compared to pre-training in whichonly 5 out of 30 items were in acceptable range ofboth DfI and DI . All other items need revision eitherfor Df I and DI.
Table IV shows post-training higher domains MCQswere more (n=22) as compared to pre-training(n=6),whereas recall MCQs were reduced from 24 to 8after training (chi square=17.14; p<0.001). The MCQs
large effect size.
Table II shows that the number of moderate MCQSwere more (n=23) in post-training as compared topre-training (n=11). The number of easy and difficultMCQs were reduced. There is overall improvement inthe Df I with significant p value (chi square=8.93;p=0.01). There is increase in number of MCQs havingrecommended DI (n=12) post-training as comparedto pre-training (n=3). Discarded and negative DIMCQs have been reduced (n=6 and n=1 respectively)post- training than pre-training (n=12 and n=6respectively). The overall DI showed signif icantimprovement (chi square=7.73; p=0.02). Table 2 alsodepicts that the number of NFDs were also reducedpost-training and MCQs having 100% DE wereincreased to 25(84%) as compared to 6 (20%) and
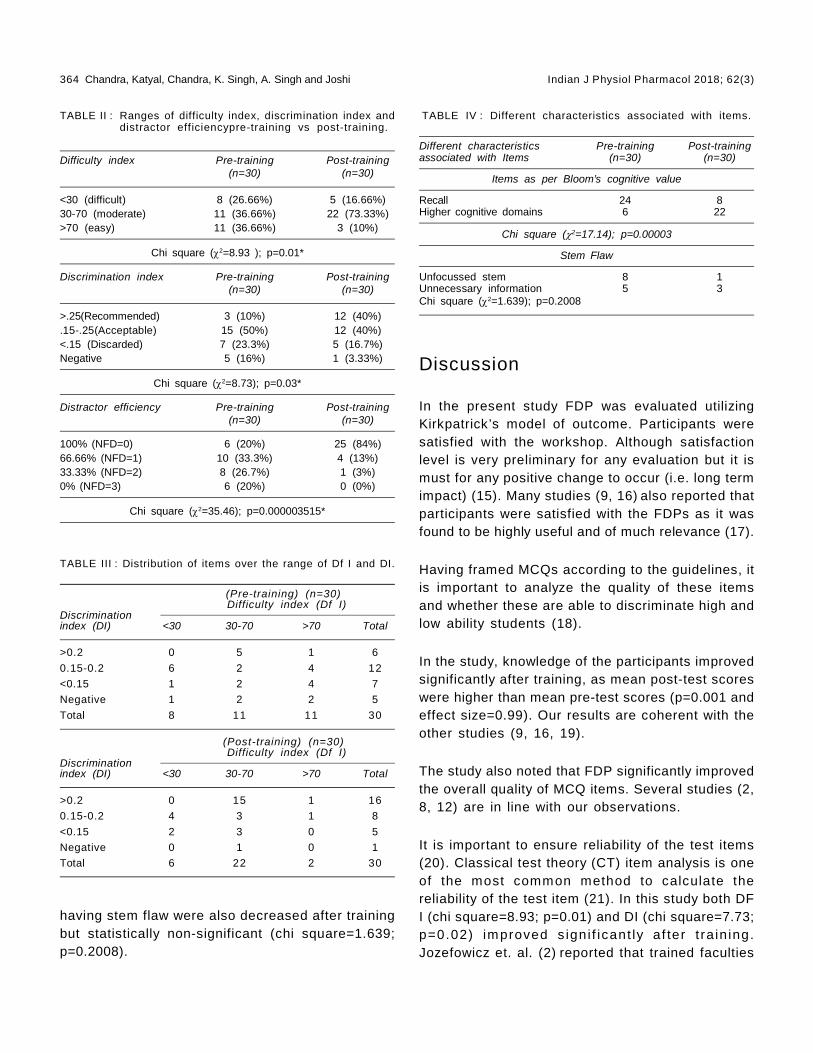
364 Chandra, Katyal, Chandra, K. Singh, A. Singh and Joshi Indian J Physiol Pharmacol 2018; 62(3)
Discussion
In the present study FDP was evaluated utilizingKirkpatrick’s model of outcome. Participants weresatisfied with the workshop. Although satisfactionlevel is very preliminary for any evaluation but it ismust for any positive change to occur (i.e. long termimpact) (15). Many studies (9, 16) also reported thatparticipants were satisfied with the FDPs as it wasfound to be highly useful and of much relevance (17).
Having framed MCQs according to the guidelines, itis important to analyze the quality of these itemsand whether these are able to discriminate high andlow ability students (18).
In the study, knowledge of the participants improvedsignificantly after training, as mean post-test scoreswere higher than mean pre-test scores (p=0.001 andeffect size=0.99). Our results are coherent with theother studies (9, 16, 19).
The study also noted that FDP significantly improvedthe overall quality of MCQ items. Several studies (2,8, 12) are in line with our observations.
It is important to ensure reliability of the test items(20). Classical test theory (CT) item analysis is oneof the most common method to calculate thereliability of the test item (21). In this study both DFI (chi square=8.93; p=0.01) and DI (chi square=7.73;p=0.02) improved s igni f icant ly af ter t ra in ing.Jozefowicz et. al. (2) reported that trained faculties
TABLE II : Ranges of difficulty index, discrimination index anddistractor efficiencypre-training vs post-training.
Difficulty index Pre-training Post-training(n=30) (n=30)
<30 (difficult) 8 (26.66%) 5 (16.66%)30-70 (moderate) 11 (36.66%) 22 (73.33%)>70 (easy) 11 (36.66%) 3 (10%)
Chi square (2=8.93 ); p=0.01*
Discrimination index Pre-training Post-training(n=30) (n=30)
>.25(Recommended) 3 (10%) 12 (40%).15-.25(Acceptable) 15 (50%) 12 (40%)<.15 (Discarded) 7 (23.3%) 5 (16.7%)Negative 5 (16%) 1 (3.33%)
Chi square (2=8.73); p=0.03*
Distractor efficiency Pre-training Post-training(n=30) (n=30)
100% (NFD=0) 6 (20%) 25 (84%)66.66% (NFD=1) 10 (33.3%) 4 (13%)33.33% (NFD=2) 8 (26.7%) 1 (3%)0% (NFD=3) 6 (20%) 0 (0%)
Chi square (2=35.46); p=0.000003515*
TABLE III : Distribution of items over the range of Df I and DI.
(Pre-training) (n=30) Difficulty index (Df I)
Discriminationindex (DI) <30 30-70 >70 Total
>0.2 0 5 1 6
0.15-0.2 6 2 4 12
<0.15 1 2 4 7
Negative 1 2 2 5
Total 8 11 11 30
(Post-training) (n=30) Difficulty index (Df I)
Discriminationindex (DI) <30 30-70 >70 Total
>0.2 0 15 1 16
0.15-0.2 4 3 1 8
<0.15 2 3 0 5
Negative 0 1 0 1
Total 6 22 2 30
having stem flaw were also decreased after trainingbut statistically non-significant (chi square=1.639;p=0.2008).
TABLE IV : Different characteristics associated with items.
Different characteristics Pre-training Post-trainingassociated with Items (n=30) (n=30)
Items as per Bloom’s cognitive value
Recall 24 8Higher cognitive domains 6 22
Chi square (2=17.14); p=0.00003
Stem Flaw
Unfocussed stem 8 1Unnecessary information 5 3Chi square (2=1.639); p=0.2008

Indian J Physiol Pharmacol 2018; 62(3) Valid MCQ Bank with Faculty Development 365
had higher mean scores in comparison to untrainedfaculties when they drafted the United State MedicalLicensing Examination (USMLE) Step-1 questions.Items which discriminate poorly or having high andlow Df I should be reviewed by content experts as itdecreases the validity of the test (22).
DI gives us information about items which effectivelydiscriminated students who were of higher ability orwho were of lower ability. Higher the DI more it aneffectively discriminate. In our study 16% of the pre-training MCQs were of negative DI while post-trainingit decreased to 3.33%. Few studies reported negativeDI in 20% and 4% of the test items (11, 23). Theexplanation of negative DI might be ambiguousframing of questions, wrong selection of distractors,besides poor preparation of students (21). Itemshaving negative DI must be removed from the questionbank as it decreases the validity of the test.
When we analyzed distribution of items over therange of Df I and DI, it was observed that maximumdiscrimination occurred (n=12, DI>0.25) occured withthe acceptable difficulty level (30%-70%) in post-training MCQ items. While in pre-training MCQ itemsonly 5 items discriminated maximally betweenacceptable range of Df I. Si Mui Sim et.al (24)also supported our observation that maximumdiscrimination had occurred between 40-70% Df I.
Teachers often spend much time and concentrationin framing stem than choosing plausible distractors.However the most difficult task in framing MCQs isselecting appropriate distractors other than theanswer key. With the help of distractor analysis wecan easily identify the student’s responses to differentoptions and any NFD should be removed, revised orreplaced from the item (25). In this study thepercentage of NFDs in pre-training MCQ was 80%which reduced to 16% post-training. Items havingzero NFD were 20% pre-training which increased to
84% post-training. Items with three NFDs weredecreased to 0% from 20% post-training. Our findingsare supported by the results by Abgulghani et al (8).
We also analyzed the quality of MCQs in terms ofcognitive level and item writing flaws. Because ofsimplicity we followed the taxonomy by Tarrant et.al(26). In the current study, higher cognitive domainMCQs (22) were more post-training in comparison topre-training (8) whereas recall type MCQs werereduced to 6 from 24 after training (chi square=17.14;p<0.001; statistically significant). The MCQs withitem writing flaws (IWFs) were reduced to 4 from 13(chi square=1.639; p=0.2008; however statisticallynon significant. Our findings are supported by anumber of studies (8, 12, 18). Vyas and Supe (27)stated that lack of faculty training and less timedevoted by faculty in MCQ framing mainly contributedto item writing flaws. In the present study we alsoscored the MCQs pre-training against post-trainingwith structured checklist. There was signif icantincrease in the mean scores of MCQs subsequentto training (p=0.001and effect size=0.74). Formerresearches supported our observations (12, 28, 29).
Limitations
One limitation of the study is the smaller samplesize. Another limitation is that the FDP was focussedmainly on MCQs, so future workshop is required forother assessment tools. Internal consistency wasalso not calculated. Moreover, long term impact (level4) of FDP was not assessed.
Conclusion
FDP had significantly improved faculty’s competenceto develop valid MCQs. Kirkpatrick ’s model ofevaluation provided an effective framework for the FDP.However further research is required to interpret longterm impact of the program.
References
1. Kolte V. Item analysis of multiple choice questions inphysiology examination. IJBAMR 2015; 4: 320–326.
2. Jozefowicz RF, Koeppen BM, Case S, Galbraith R,Swanson D, Glew RH. The quality of in-house medical
school examinations. Acad Med 2002; 77: 156–161.
3. Cronbach LJ, Shavelson RJ. My current thoughts oncoefficient alpha and successor procedures. Educ PsycolMeas 2004; 64: 391–418.
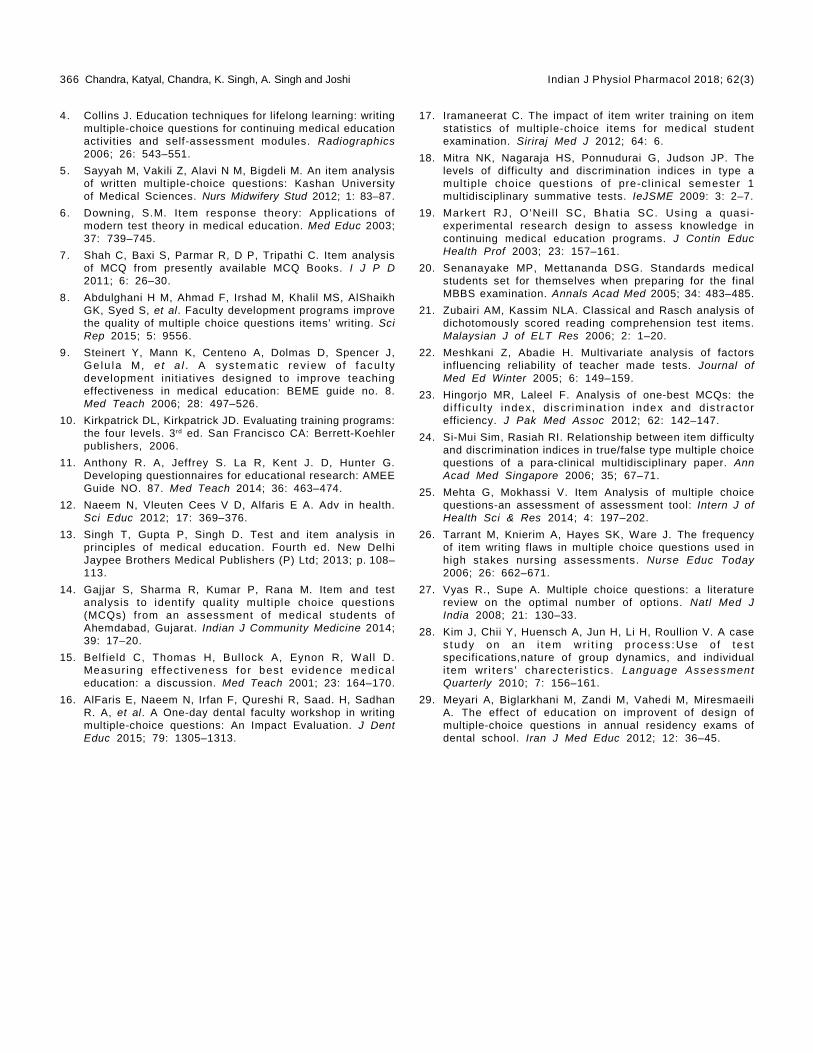
366 Chandra, Katyal, Chandra, K. Singh, A. Singh and Joshi Indian J Physiol Pharmacol 2018; 62(3)
4. Collins J. Education techniques for lifelong learning: writingmultiple-choice questions for continuing medical educationactivities and self-assessment modules. Radiographics2006; 26: 543–551.
5. Sayyah M, Vakili Z, Alavi N M, Bigdeli M. An item analysisof written multiple-choice questions: Kashan Universityof Medical Sciences. Nurs Midwifery Stud 2012; 1: 83–87.
6. Downing, S.M. Item response theory: Appl icat ions ofmodern test theory in medical education. Med Educ 2003;37: 739–745.
7. Shah C, Baxi S, Parmar R, D P, Tripathi C. Item analysisof MCQ from presently available MCQ Books. I J P D2011; 6: 26–30.
8. Abdulghani H M, Ahmad F, Irshad M, Khalil MS, AlShaikhGK, Syed S, et al. Faculty development programs improvethe quality of multiple choice questions items’ writing. SciRep 2015; 5: 9556.
9. Steinert Y, Mann K, Centeno A, Dolmas D, Spencer J,Ge lu la M, et a l . A sys tem at i c rev i ew of f ac u l t ydevelopment ini t iatives designed to improve teachingeffectiveness in medical education: BEME guide no. 8.Med Teach 2006; 28: 497–526.
10. Kirkpatrick DL, Kirkpatrick JD. Evaluating training programs:the four levels. 3rd ed. San Francisco CA: Berrett-Koehlerpublishers, 2006.
11. Anthony R. A, Jeffrey S. La R, Kent J. D, Hunter G.Developing questionnaires for educational research: AMEEGuide NO. 87. Med Teach 2014; 36: 463–474.
12. Naeem N, Vleuten Cees V D, Alfaris E A. Adv in health.Sci Educ 2012; 17: 369–376.
13. Singh T, Gupta P, Singh D. Test and item analysis inprinciples of medical education. Fourth ed. New DelhiJaypee Brothers Medical Publishers (P) Ltd; 2013; p. 108–113.
14. Gajjar S, Sharma R, Kumar P, Rana M. Item and testanalysis to ident i fy qual i ty mult iple choice quest ions(MCQs) from an assessment of medical students ofAhemdabad, Gujarat. Indian J Community Medicine 2014;39: 17–20.
15. Belf ield C, Thomas H, Bul lock A, Eynon R, Wall D.Measuring e f fect i veness for best ev idence medicaleducation: a discussion. Med Teach 2001; 23: 164–170.
16. AlFaris E, Naeem N, Irfan F, Qureshi R, Saad. H, SadhanR. A, et al. A One-day dental faculty workshop in writingmultiple-choice questions: An Impact Evaluation. J DentEduc 2015; 79: 1305–1313.
17. Iramaneerat C. The impact of item writer training on itemstatistics of multiple-choice items for medical studentexamination. Siriraj Med J 2012; 64: 6.
18. Mitra NK, Nagaraja HS, Ponnudurai G, Judson JP. Thelevels of difficulty and discrimination indices in type amul t iple choice quest ions of pre-cl in ical semester 1multidisciplinary summative tests. IeJSME 2009: 3: 2–7.
19. Markert RJ, O’Neil l SC, Bhat ia SC. Using a quasi -experimental research design to assess knowledge incontinuing medical education programs. J Contin EducHealth Prof 2003; 23: 157–161.
20. Senanayake MP, Mettananda DSG. Standards medicalstudents set for themselves when preparing for the finalMBBS examination. Annals Acad Med 2005; 34: 483–485.
21. Zubairi AM, Kassim NLA. Classical and Rasch analysis ofdichotomously scored reading comprehension test items.Malaysian J of ELT Res 2006; 2: 1–20.
22. Meshkani Z, Abadie H. Multivariate analysis of factorsinfluencing reliability of teacher made tests. Journal ofMed Ed Winter 2005; 6: 149–159.
23. Hingorjo MR, Laleel F. Analysis of one-best MCQs: thedi f f i cu l ty index, discr im inat ion index and dis t ractorefficiency. J Pak Med Assoc 2012; 62: 142–147.
24. Si-Mui Sim, Rasiah RI. Relationship between item difficultyand discrimination indices in true/false type multiple choicequestions of a para-clinical multidisciplinary paper. AnnAcad Med Singapore 2006; 35; 67–71.
25. Mehta G, Mokhassi V. Item Analysis of multiple choicequestions-an assessment of assessment tool: Intern J ofHealth Sci & Res 2014; 4: 197–202.
26. Tarrant M, Knierim A, Hayes SK, Ware J. The frequencyof item writing flaws in multiple choice questions used inhigh stakes nursing assessments. Nurse Educ Today2006; 26: 662–671.
27. Vyas R., Supe A. Multiple choice questions: a literaturereview on the optimal number of options. Natl Med JIndia 2008; 21: 130–33.
28. Kim J, Chii Y, Huensch A, Jun H, Li H, Roullion V. A cases tudy on an i t em wr i t ing p rocess :Us e o f tes tspecifications,nature of group dynamics, and individuali tem wri ters ’ charecter is t ics . Language AssessmentQuarterly 2010; 7: 156–161.
29. Meyari A, Biglarkhani M, Zandi M, Vahedi M, MiresmaeiliA. The effect of education on improvent of design ofmultiple-choice questions in annual residency exams ofdental school. Iran J Med Educ 2012; 12: 36–45.
Indian J Physiol Pharmacol 2018; 62(3) Electronic Stethoscope Designing and Use 367
Short Communication
Electronic Stethoscope Designing and Use in Resource LimitedIndian Setting
Noorin Bhimani* and Zaki Shaikh
Department of Physiology,Lokmanya Tilak Municipal Medical College,Sion, Mumbai – 22
Abstract
Introduction: In the Indian Medical Educational Curriculum, clinical examination of a person is introducedto students of Ist M.B.B.S. in the physiology laboratory. Generally an acoustic stethoscope available in themarket is used for auscultation. It will be, however, interesting to teach auscultation with the help ofelectronic stethoscope, where they can amplify, record and playback various sounds. Moreover there isscope for use of electronic stethoscope in rural setup and telemedicine.As learning auscultation with electronicstethoscope will better equip them for future and the cost of available digital stethoscope is high, we decidedto construct electronic stethoscope and use it in our educational setting. Materials andMethod: Acousticstethoscope, rubber tubing, condenser mic, headphone cable with 3.5 mm jack, laptop and audacity softwarewhich is a freeware. Results: The undergraduate students were demonstrated with recording and playbackof various sounds with electronic stethoscope thus constructed. The students were quite interested inknowing about the design and construction of the stethoscope. Conclusion: We found that electronicstethoscope can be easily constructed in resource-limited settings and may be used for undergraduateteaching in a medical college.
Indian J Physiol Pharmacol 2018; 62(3) : 367–371
*Corresponding author :
Dr. Noorin Bhimani, Assistant Professor, GSMC FAIMER Fellow,Department of Physiology, Lokmanya Tilak Municipal MedicalCollege, Sion, Mumbai – 22; Email: [email protected]
(Received on January 1, 2018)
Introduction
Recently, we have seen an increased use of smartphones by healthcare professionals as well as thegeneral public (1-3). The smartphone is a newtechnology that combines mobile communication andcomputation in a handheld-sized device, facilitatingmobile computing at the point of care.
In the Indian Medical Educational Curriculum, clinicalexamination is introduced to students of Ist M.B.B.S.in the physiology laboratory. The clinical examinationof any system is mostly taught under the headingsof Inspection, Palpation, Percussion & Auscultation.Generally an acoustic stethoscope available in themarket is used for teaching the auscultation and thevarious sounds are described by the teacher. So,generally the comprehension and perception of thesounds by the students is only presumptive.
In some institutes, to better explain the sounds tobe auscultated, the audio files on internet websitesof stethoscope manufacturer such as Thinklab &Litmann are incorporated in teaching. To enhance

368 Bhimani and Shaikh Indian J Physiol Pharmacol 2018; 62(3)
• Condenser mic can be purchased at localelectronic store or mic from computer headsetalong with its wire can be used.
• If mic is locally purchased the headphone cablewith its 3.5 mm jack is to be soldered to the micterminals.
• The electronic stethoscope is now ready and canbe plugged into the mic port of the laptop.
• Laptop should be installed with audacity softwarewhich is a freeware on internet.
further understanding and clinical importance,auscultation assistant website of University ofCalifornia, Los-Angeles is also a superb resource. Itwill be, however, interesting to teach auscultationwith the help of electronic stethoscope, where theycan amplify, record and playback various sounds.Moreover, there is scope for use of electronicstethoscope in rural setup and telemedicine. Thecost of digital stethoscope is quite high and thesophisticated instruments like phonocardiogram;echocardiograms are not only costly but also requiretrained manpower and specialized setup.
In a resource limited setting, it is prudent to useelectronic stethoscope as it is cost-effective, easyto m ake, hand le and m anage. As learn ingauscultation with electronic stethoscope will betterequip medical students for future and the cost ofavailable digital stethoscope is high, we decided toconstruct electronic stethoscope and use it in oureducational setting.
Materials and Methods
To demonstrate the construct ion of electronicstethoscope and its use in medical education itrequires the following :
Materials required :
1) Acoustic stethoscope
2) Rubber tubing
3) Condenser mic
4) Headphone cable with 3.5 mm jack
5) Laptop
6) Audacity software which is a freeware
Construction:
• The chest piece of acoustic stethoscope is tobe detached.
• One end of rubber tubing is attached to chestpiece and to the other end condenser mic isfitted.
Assembled Electronic Stethoscope
Methodology
• After the construction is complete, plug the 3.5mm jack into the mic port of the laptop and startthe audacity software.

Indian J Physiol Pharmacol 2018; 62(3) Electronic Stethoscope Designing and Use 369
• Place the chest piece on the required part torecord the desired sounds, just click the recordbutton and the recording is started, the waveformsof the recorded sounds can be seen on thescreen.
• To hear the recorded sounds click on the playbutton, the sounds are better heard on earphones.
• Audacity software also has various options toamplify, edit, and apply various filters in the areaof interest of the recorded sounds as per need.
• I t is bet ter to record the sounds wi thoutconnecting the charger to the laptop to avoidelectric interference and for safety precautions.
• The recorded sound can be saved and sharedwith any number of people.
Results
The undergraduate students were demonstrated withrecording and playback of various sounds withelect ronic stethoscope thus construc ted. Thestudents were quite interested in knowing about thedesign and construction of the stethoscope. SomeParts of Electronic Stethoscope

370 Bhimani and Shaikh Indian J Physiol Pharmacol 2018; 62(3)
of the recordings obtained during demonstration are:
In the physiology departments which are lacking withthe sophisticated instruments like phonocardiogramand echocardiogram, this, simple to construct, costeffective tool will definitely benefit the undergraduatelearning of auscultation of various sounds and helpthem to clinically correlate.
Discussion
The stethoscope is an acoustic medical device forauscultation of an animal or human body, often usedto auscultate lung and heart sounds. It is used toauscultate peristaltic sounds and blood flow in
ar te r ies and ve ins . I t i s com m only used incombination with a sphygmomanometer to measureblood pressure. It is familiar, harmless, portable, andinexpensive, but the sound heard through thestethoscope depends on three main factors: actualsound (vibrations) produced by organs, perception ofsound by the human ear (psychoacoustics), andacoustics of the stethoscope itself. (4, 5). Theprinciple of stethoscope was first applied in the 19thcentury by Rene Theophile Hyacinthe Laënnec, aFrench phys ic ian, who in 1816 invented thestethoscope (6-10) as an experimental creation toavoid an embarrassing situation while examining afemale patient (6). Using this new instrument, heinvestigated the sounds made by the heart and lungsand established that his diagnoses were supported

Indian J Physiol Pharmacol 2018; 62(3) Electronic Stethoscope Designing and Use 371
by the observations made during autopsies (9, 11).Despite its late invention, the importance of listeningto a patient’s chest was first noted in 370 BC byHippocrates and described by two others prior to theinvention of the stethoscope (11). It has sinceundergone several modifications with the noteworthyinventions of the diaphragm by Rober Bowles (1926)and the bell in 1961 by Lithmann (12) with manydifferent types including the electronic or digital oneexisting today (9). Over the years, stethoscope hasbecome more than just a tool used for examinationbut serves as a symbol of identity associated withthe physician (5, 6).
Several authors have reported that merely readingtextbooks and lectures do not improve performanceon acquiring auscultatory skills (13). Currently,although the curricular theory of medicine coursesassociates theoretical to practical training, thelearning process has been increasingly focused ontheory and assessment of learning through writtentests, leaving little space to practice on the bedside(14).
Electronic stethoscope is simple to construct, it canbe used to record various sounds like from heart,lungs, bowel etc. The similar idea of electronic
stethoscope was floated by Dr. Anand Bhaskar whonot only designed one such stethoscope but alsofound it useful for undergraduate teaching (15).
I t i s a very usefu l too l where sophis t icatedinstruments like phonocardiogram and echocardiogramare not available. We can record the sounds or thepre – recorded heart, korotkoff’s, bowel, lung soundscan be demonstrated to undergraduate students in asimple way. This will help the students for betterunderstanding of the auscultatory sounds before theyactual ly l is ten to them. Hence the elec tronicstethoscope can be easily constructed and used inroutine teaching of auscultation to the undergraduatestudents in resource limited settings.
However, the students and faculty perception shouldbe studied regarding their use in teaching andpractice in Indian setting to better understand itsimplications and challenges.
Conclusion
We found that electronic stethoscope can be easilyconstructed in resource-limited settings and maybe used for undergraduate teaching in a medicalcollege.
References
1. Garritty C, El Emam K. Who’s using PDAs? Estimates ofPDA use by healthcare providers: a systematic review ofsurveys. Journal of Medical Internet Research 2006;8:e7.
2. Physician smartphone adoption rate to reach 81% in 2012.2012 [http:/ /manhattanresearch.com/News-and-Events/Press Releases/physiciansmartphones-2012].
3. comScore Reports May 2011 U.S. Mobile Subscriber MarketShare. [http://www.comscore.com/Press_Events/Press_Releases/2011/7/comScore_Reports_May_2011_U.S._Mobile_Subscriber_Market_Share].
4. Ammenwerth E, Buchauer A, Bludau B, Haux R: Mobileinformation andcommunicat ion tools in the hospital .International Journal of Medical Informatics 2000; 57: 21–40.
5. Welsby PD, Earis JE. Some high pitched thoughts onchest examination. Postgrad Med J 2001; 77(912): 617–620.
6. Roguin AR. Theophile Hyacinthe Laënnec (1781–1826):the man behind the stethoscope. Clin Med Res 2006;4(3): 230–235.
7. Majumdar SK. History of the stethoscope an overview.
Bull Indian Inst Hist Med Hyderabad 2002; 32(2): 137–150.
8. Demetriades AK. Laennec’s legacy. J R Soc Med 2004;97(5): 257–258.
9. Dalmay F, Antonini MT, Marquet P, Menier R. Acousticproperties of the normal chest. Eur Respir J 1995; 8(10):1761–1769.
10. Bishop PJ. Evolution of the stethoscope. J R Soc Med1980; 73(6): 448–456.
11. Weinberg FW. The history of stethoscope. Can FamPhysician 1993; 39: 2223–2224.
12. Mangion K. The stethoscope. MMJ 2007; 19(2): 41–44.
13. Barret MJ, Lacey CS, Sekara AE, Linden EA, Gracely EJ.Mastering Cardiac Murmurs: The Power of Repetit ion.Chest 2004; 126(2): 470–475.
14. Mangione S, Peitzman SJ, Gracely E, Nieman LZ. Creationand assessment of a structured review course in physicaldiagnosis for medical residents. J Gen Intern Med 1994;9(4): 213–218.
15. A simple electronic stethoscope for recording and playbackof heart sounds. Adv Physiol Educ 2012; 36: 360–362.
372 Mukherjee, Banerjee and Mahapatra Indian J Physiol Pharmacol 2018; 62(3)
Short Communication
Peak Expiratory Flow Rate Changes with Relevant Variablesin a Population of Eastern India
Sujoy Mukherjee*, Goutam Banerjee andAnil Baran Singha Mahapatra
Department of Physiology,R. G. Kar Medical College,1, Khudiram Bose Sarani,Kolkata – 700 004
Abstract
Introduction: Peak expiratory flow rate (PEFR) is the sole screening parameter use for mass assessmentof lung function in community level, although the normal value of PEFR varies with geographical, climaticand socioeconomic conditions. However available data regarding variation in PEFR in healthy eastern Indianadult population is very limited till date. This study was undertaken to analyse the changes in PEFR withvarious factors in a population of eastern India with normal spirometry.
Methodology: A retrospective study was conducted on 762 subjects aged 15 to 75 years with normalspirometry results. Their percent predicted values of PEFR were compared with variables like gender, height,weight, age and smoking habits. All data were obtained from database of spirometry laboratory at Physiologydepartment, R.G. Kar Medical College and Hospital, Kolkata from August 2016 to February 2017. Appropriateadministrative approval was obtained prior to the test. The spirometry was done following ATS/ERS protocol(2005) using 80% ethnic correction. The instrument used was HELIOS 702 spirometer. Statistical analysiswas done by z-test, fischer’s exact test and significance was assigned at p<0.05.
Results: Mean PEFR value of the study population was 86.017±2.042%. Mean value for male and femalesubjects were 89.041±23.943 and 84.706±21.667 respectively. PEFR values was lower in ever-smokerscompared to never-smokers. PEFR value became higher with increase in height and weight but lower withincrease in age.
Conclusion: The study evaluated PEFR of eastern Indian population in respect to various influencing factorsand suggested normative values for PEFR for eastern Indian population to be used for routine respiratoryevaluation.
Indian J Physiol Pharmacol 2018; 62(3) : 372–379
*Corresponding author :
Residential Address : 253/1, Ground Floor, Block-B, Bangur Avenue, P.S-Laketown. Kolkata-700055; Contact No: 9476254561 /8620937923, Email: [email protected]
(Received on January 1, 2018)

Indian J Physiol Pharmacol 2018; 62(3) Peak Expiratory Flow Rate Changes with Relevant Variables 373
February 2017 were selected for the study. All studysubjects were legal residence of the state of WestBengal. Therefore they could be assigned as Bengaliby ethnicity. According to inclusion criteria of thestudy all of them were having normal spirometryvalues {FVC and FEV
180% predicted, FEV1/FVC
ratio 0.7, forced expiratory flow in the middle halfof the FVC (FEF
25–75) of 50% of predicted (10) and
PEFR >60% predicted (11)}.
Exclusion criteria of the study were:
1) Restrictive impairment (FEV1 and FVC each< 80% of predicted, with FEV1/FVC ratio 0.7with FEV1 <80% of predicted) and obstructiveimpairment (FEV1/FVC ratio <0.7 with FEV1<80% of predicted) test results (12)
2) PEFR value <60% of predicted
3) Subjects with any cardiac ailments (as written intheir OPD cards)
4) Test that had been done using 100% ethniccorrections.
5) Age <15 years and >75 years.
Data regarding parameters like age, sex, height,weight and smoking habit (smoking status definedas ever/never smoker of cigarette, beeri, huqqa etc.An ever-smoker was anyone who smoked regularlyfor at least one year. Never-smokers were definedas those who never smoked regularly for one year ormore) were already obtained prior to the test. Atevery time the test was performed by RMS HELIOS-702 spirometer following American Thoracic Society/European Respiratory Society (ATS/ERS) latestguidel ine of 2005 (13) and using 80% ethniccorrection (it had been customary to equate 80%predicted with the lower limit of normal as we hadconsidered percent predicted values for statisticalanalysis (10, 14-16).
Daily calibration of the spirometer was done using acalibrated syringe according to latest ATS/ERSguidelines (13) during the tenure of the study. Theauthor checked the syringe for leaks and damage
Introduction
Peak expiratory flow rate (PEFR) is the largestexpiratory flow rate achieved with a maximally forcedeffort from a position of maximal inspiration. This iseffort dependent and reflects mainly the calibre ofthe bronchi and larger bronchioles (1). The PEFR isone of the simplest parameter for measuring lungfunctions in untrained individuals and therefore canbe used as a screening tool in population basedsurveys for assessment of lung function (2-4). It iswell established that variations in gender, age,anthropometric indices such as height, weight, bodymass index (BMI) and also lifestyle changes likesmoking habits are the main factors affecting PEFR(5). PEFR also varies considerably among populationbelonging to different regions and ethnic groups (6).Reference values of PEFR for Indian adult populationwere obtained with respect to the above mentionedvariables but mainly from Northern, Western andSouthern region of the country (7-9). There is paucityof data on PEFR of healthy adult population ofeastern India.
Aims & Objectives:
The aim of the study was to analyse the changes inPEFR with various factors like gender, smoking habit,height, weight and age in a population of easternIndia with normal spirometry.
Materials and Methods
Appropriate administrative approval was taken for theproposed study. As it was a retrospective study withthe data already col lected and s tored in thespirometry laboratory of Physiology department, therewas no scope for approval of the Ethics committee.Written informed consent from every patient wasalready taken prior to the test.
Experimental Protocol:
762 subjects aged between 15 and 75 years whowere referred from different outpatient departmentsof RGKMCH, Kolkata with chief complaint ofshortness of breath (SOB) between August 2016 and

374 Mukherjee, Banerjee and Mahapatra Indian J Physiol Pharmacol 2018; 62(3)
prior the procedure and kept the syringe next to thespirometer. The largest observed values of FEV
1 and
FVC available from among at least three acceptableand reproducible tests were taken as the keyparameters for interpretation.
Statistical Analysis:
The data were expressed in Mean±Standard Deviation(SD). Two-sided z-test was used to compare betweentwo groups and fischer’s exact test had done forcategorical analysis. Mean, standard deviation andz values were calculated using Microsoft excel sheetwhereas statistical analysis of Fischer’s test andcalculation of p values were done using Graph padQuickcals software, California, USA. Differences wereconsidered statistically significant at p value < 0.05.
Results
Table I had shown:
1) The mean age of the study population was around
40 years and female subjects were not belongingto ever-smokers group.
2) All the mean values of spirometry variables werehigher than the lower limit of normal range.
Table II had shown that
The mean value of BMI was significantly higher andPEFR was significantly lower in middle aged femalesubjects compared to males.
Table III had shown that:
The present study had shown mean PEFR wassignificantly higher in never-smokers (89.041±23.943)compared to ever-smokers (84.385±19.531) amongmales (p value: 0.029).
Table IV had shown that:
1) The mean PEFR in the height range of 156-165cm (84.882±20.54) was significantly lower than
TABLE I : Anthropometric and spirometric profile of the study population (n=762).
Parameters Analysed data
Age (years) (Mean±SD) 39.646±15.803
Gender [n (%)] Male Female414 (54.33) 348 (45.67)
Height (cm) (Mean±SD) 158.182±9.089Weight (kg) (Mean±sd) 56.347±12.895
Addiction [n (%)] (smoking) Ever-smokers Never-smokers171 (22.44) 591 (77.56)
Male Female Male Female100% 0% 28.93% 71.07%
FVC(%) (Mean±SD) 102.821±12.057FEV
1(%) (Mean±SD) 104.771±12.833
FEV1/FVC (%) (Mean±SD) 102.622±9.647
FEF25-75
(%) (Mean±SD) 77.016±16.671PEFR (%) (Mean±SD) 86.012±22.042
TABLE II : Gender variance of PEFR value.
Variables Male (n=243) Female (n=348) z value p value
Age (years) (Mean±SD) 38.139±17.426 37.324±14.54 0.598 0.549BMI (kg/m2) (Mean±SD) 22.084±4.555 23.086±5.058 –2.513 0.011*PEFR (%) (Mean±SD) 89.041±23.943 84.706±21.667 2.251 0.024*

Indian J Physiol Pharmacol 2018; 62(3) Peak Expiratory Flow Rate Changes with Relevant Variables 375
Bar diagram showing gender variance ofMean & SD of PEFR of study subjects.
TABLE IV : Comparison of Mean & SD of PEFR according toheight intervals of the study subjects.
Group Height No. of Mean±SD ofno. (in cm) subjects PEFR (%)
I 136-155 299 83.963±22.71II 156-165 289 84.882±20.54III 166-191 174 91.431±22.53
Statistical analysis of Table IV.
Comparison z value p value Significance
I and II –0.515 0.606 NSII and III –3.13 0.001* HSI and III –3.466 0.0005* HS
Bar diagram showing Mean & SD of PEFRaccording to smoking status of male subjects.
Bar diagram showing Mean PEFR in studysubjects according to height intervals.
TABLE III : Comparison of PEFR according to smoking status in males.
Variable never Smoker (n=243) Ever smoker (n=171) z value p value
PEFR (%) (Mean±SD) 89.041±23.943 84.385±19.531 2.173 0.029*
Bar diagram showing Mean PEFR in studysubjects according to weight groups.
Bar diagram showing Mean PEFR in studysubjects according to age groups.
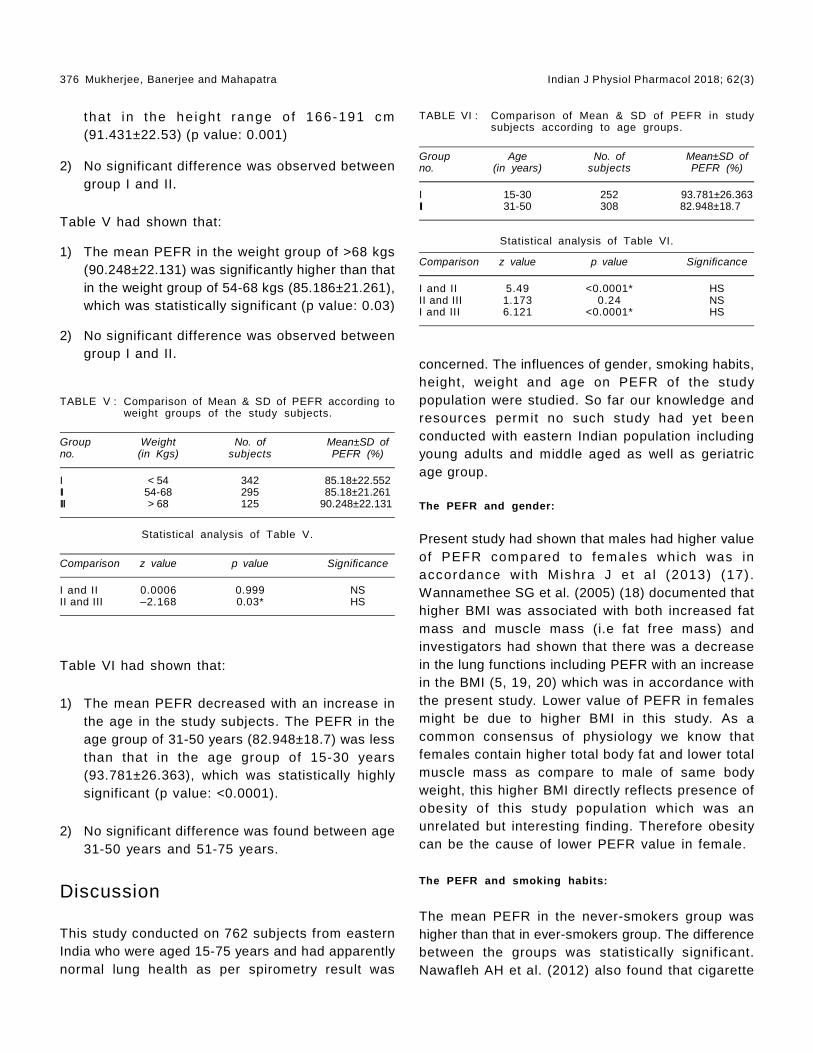
376 Mukherjee, Banerjee and Mahapatra Indian J Physiol Pharmacol 2018; 62(3)
concerned. The influences of gender, smoking habits,height, weight and age on PEFR of the studypopulation were studied. So far our knowledge andresources permit no such study had yet beenconducted with eastern Indian population includingyoung adults and middle aged as well as geriatricage group.
The PEFR and gender:
Present study had shown that males had higher valueof PEFR compared to females which was inaccordance with Mishra J et a l (2013) (17) .Wannamethee SG et al. (2005) (18) documented thathigher BMI was associated with both increased fatmass and muscle mass (i.e fat free mass) andinvestigators had shown that there was a decreasein the lung functions including PEFR with an increasein the BMI (5, 19, 20) which was in accordance withthe present study. Lower value of PEFR in femalesmight be due to higher BMI in this study. As acommon consensus of physiology we know thatfemales contain higher total body fat and lower totalmuscle mass as compare to male of same bodyweight, this higher BMI directly reflects presence ofobesity of this study population which was anunrelated but interesting finding. Therefore obesitycan be the cause of lower PEFR value in female.
The PEFR and smoking habits:
The mean PEFR in the never-smokers group washigher than that in ever-smokers group. The differencebetween the groups was statistically significant.Nawafleh AH et al. (2012) also found that cigarette
TABLE V : Comparison of Mean & SD of PEFR according toweight groups of the study subjects.
Group Weight No. of Mean±SD ofno. (in Kgs) subjects PEFR (%)
I < 54 342 85.18±22.552II 54-68 295 85.18±21.261III > 68 125 90.248±22.131
Statistical analysis of Table V.
Comparison z value p value Significance
I and II 0.0006 0.999 NSII and III –2.168 0.03* HS
that in the he ight range o f 166-191 cm(91.431±22.53) (p value: 0.001)
2) No significant difference was observed betweengroup I and II.
Table V had shown that:
1) The mean PEFR in the weight group of >68 kgs(90.248±22.131) was significantly higher than thatin the weight group of 54-68 kgs (85.186±21.261),which was statistically significant (p value: 0.03)
2) No significant difference was observed betweengroup I and II.
Table VI had shown that:
1) The mean PEFR decreased with an increase inthe age in the study subjects. The PEFR in theage group of 31-50 years (82.948±18.7) was lessthan that in the age group of 15-30 years(93.781±26.363), which was statistically highlysignificant (p value: <0.0001).
2) No significant difference was found between age31-50 years and 51-75 years.
Discussion
This study conducted on 762 subjects from easternIndia who were aged 15-75 years and had apparentlynormal lung health as per spirometry result was
TABLE VI : Comparison of Mean & SD of PEFR in studysubjects according to age groups.
Group Age No. of Mean±SD ofno. (in years) subjects PEFR (%)
I 15-30 252 93.781±26.363II 31-50 308 82.948±18.7
Statistical analysis of Table VI.
Comparison z value p value Significance
I and II 5.49 <0.0001* HSII and III 1.173 0.24 NSI and III 6.121 <0.0001* HS
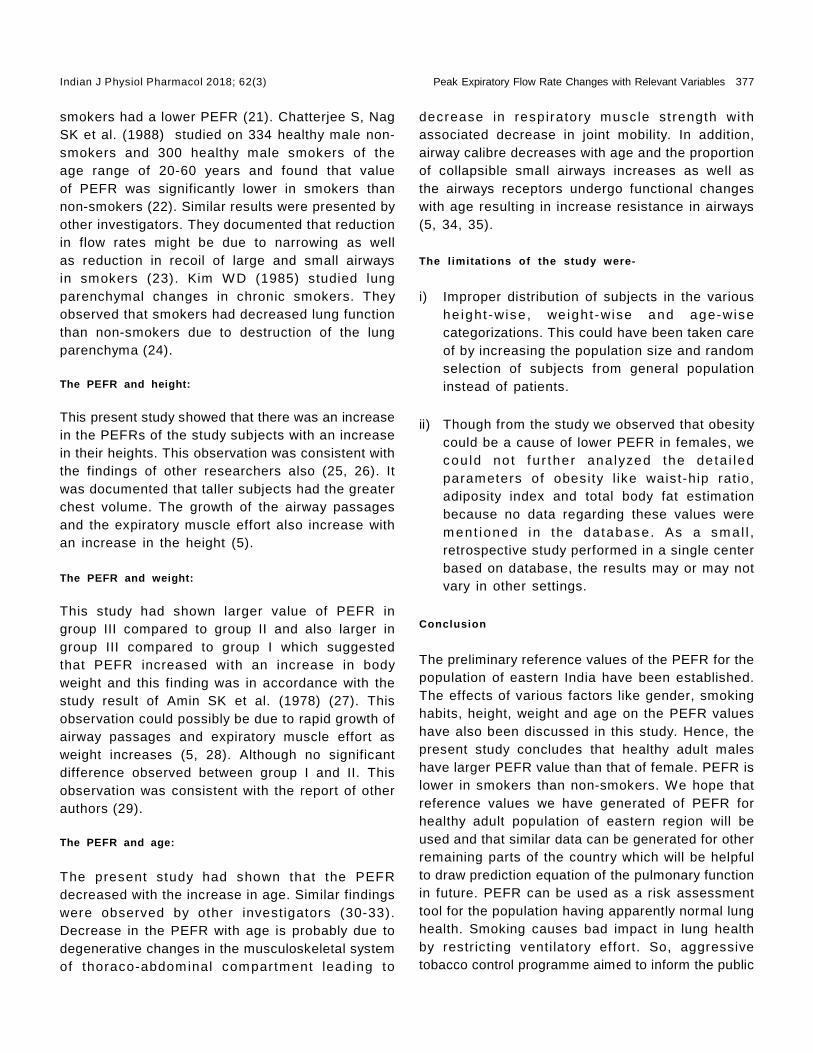
Indian J Physiol Pharmacol 2018; 62(3) Peak Expiratory Flow Rate Changes with Relevant Variables 377
decrease in respiratory musc le st rength wi thassociated decrease in joint mobility. In addition,airway calibre decreases with age and the proportionof collapsible small airways increases as well asthe airways receptors undergo functional changeswith age resulting in increase resistance in airways(5, 34, 35).
The l imitations of the study were-
i) Improper distribution of subjects in the varioushe ight -wise , we ight -wise and age-wisecategorizations. This could have been taken careof by increasing the population size and randomselection of subjects from general populationinstead of patients.
ii) Though from the study we observed that obesitycould be a cause of lower PEFR in females, wecou ld not f u r ther ana lyzed the deta i ledparameters of obesity l ike waist-hip rat io,adiposity index and total body fat estimationbecause no data regarding these values werem ent ioned in the database. As a sm al l ,retrospective study performed in a single centerbased on database, the results may or may notvary in other settings.
Conclusion
The preliminary reference values of the PEFR for thepopulation of eastern India have been established.The effects of various factors like gender, smokinghabits, height, weight and age on the PEFR valueshave also been discussed in this study. Hence, thepresent study concludes that healthy adult maleshave larger PEFR value than that of female. PEFR islower in smokers than non-smokers. We hope thatreference values we have generated of PEFR forhealthy adult population of eastern region will beused and that similar data can be generated for otherremaining parts of the country which will be helpfulto draw prediction equation of the pulmonary functionin future. PEFR can be used as a risk assessmenttool for the population having apparently normal lunghealth. Smoking causes bad impact in lung healthby restr icting ventilatory effort. So, aggressivetobacco control programme aimed to inform the public
smokers had a lower PEFR (21). Chatterjee S, NagSK et al. (1988) studied on 334 healthy male non-smokers and 300 healthy male smokers of theage range of 20-60 years and found that valueof PEFR was significantly lower in smokers thannon-smokers (22). Similar results were presented byother investigators. They documented that reductionin flow rates might be due to narrowing as wellas reduction in recoil of large and small airwaysin smokers (23). Kim W D (1985) studied lungparenchymal changes in chronic smokers. Theyobserved that smokers had decreased lung functionthan non-smokers due to destruction of the lungparenchyma (24).
The PEFR and height:
This present study showed that there was an increasein the PEFRs of the study subjects with an increasein their heights. This observation was consistent withthe findings of other researchers also (25, 26). Itwas documented that taller subjects had the greaterchest volume. The growth of the airway passagesand the expiratory muscle effort also increase withan increase in the height (5).
The PEFR and weight:
This study had shown larger value of PEFR ingroup III compared to group II and also larger ingroup III compared to group I which suggestedthat PEFR increased with an increase in bodyweight and this finding was in accordance with thestudy result of Amin SK et al. (1978) (27). Thisobservation could possibly be due to rapid growth ofairway passages and expiratory muscle effort asweight increases (5, 28). Although no significantdifference observed between group I and II. Thisobservation was consistent with the report of otherauthors (29).
The PEFR and age:
The present study had shown that the PEFRdecreased with the increase in age. Similar findingswere observed by other investigators (30-33).Decrease in the PEFR with age is probably due todegenerative changes in the musculoskeletal systemof thoraco-abdominal compartment leading to
378 Mukherjee, Banerjee and Mahapatra Indian J Physiol Pharmacol 2018; 62(3)
about the hazards of tobacco use and to providerestriction on the use of or purchase of tobacco mustbe started.
Disclosure
No conflicts of interest, financial or otherwise aredeclared by the authors.
15. Quanjer PH, Tammeling GJ, Cotes JE, et al. Lung volumesand forced ventilatory flows. Official statement of theEuropean respiratory society. Eur Respir J 1993; 6: 5–40.
16. Pellegrino R, Viegi G, Brusasco, et al. Interpretativestrategies for lung function tests. Eur Respir J 2005; 26:948–968.
17. Mishra J, Mishra S, Satpathy S, Manjareeka M, Nayak PK,Mohanty P. Variations in PEFR among Males and FemalesWith Respect To Anthropometric Parameters. IOSR Journalof Dental and Medical Sciences 2013; 5(1): 47–50.
18. Wannamethee SG, Shaper AG, Whincup PH. Body fatdistribution, body composition, and respiratory function inelderly men. Am J Clin Nutr 2005; 82: 996–1003.
19. Lazarus R, Gore CJ, Booth M, Owen N. Effects of bodycomposition and fat distribution on ventilatory function inadults. Am J Clin Nutr 1998; 68: 35–41.
20. Cotes JE, Chinn DJ, Reed JW. Body mass, fat percentageand fat free mass as reference variables for lung function:effects on terms for age and sex. Thorax 2001; 56: 839–844.
21. Nawafleh AH, Zead SAA, Al-maghaire DF. PulmonaryFunction Test: The value among smokers and nonsmokers.2012; 6(4): 703–713.
22. Chatterjee S, Nag SK, Dey SK. Spirometric Standards forNon-Smokers and Smokers of India (Eastern Region).Japanese Journal of Physiology 1988; 38: 283–298.
23. Polatlý M, Erdinç M, Erdinç E.The Early Effect of Smokingon Spirometry and Transfer Factor. Turkish RespiratoryJournal 2000; 1: 31–34.
24. K im W D, saet tam M, Ghezzo H. Loss o f a lveo larattachmentsin smokers. A morphometric correlate of lungfunctionimpairment. Am Rev Respir Dis 1985; 132: 814–900.
25. Jain A, Singh M. Effect of occupational exposure topollutants on peak expiratory flow rate of healthy non-smoking bus drivers in the age group of 20-55 years.Journal of Clinical and Diagnostic Research 2012; 6:176–179.
26. Jepegnanam V, Amritharaj, Sulochana, Swamy D, RaoVM. Peak expiratory flow rate in a random healthy adultpopulation of Coimbatore. Indian J Physiol Pharmacol1996; 40(2): 127–133.
27. Amin SK, Pande RS. Peak expiratory flow rate in normalsubjects. Indian Journal of Chest Diseases 1978; 20: 81–83.
28. Bedi U, Dang BK. A study of peak expiratory flow ratein normal healthy children of Punjab. IJMDS 2016; 5(1):1042–1047.
Acknowledgements
The authors are thankful to the Principal, all facultymembers and staffs of dept. of Physiology, R. G.Kar Medical College and Hospital, Kolkata for givingsuch scope to do research work related to clinicalrespiratory physiology
References
1. Standardization of spirometry, 1994 update. AmericanThoracic Society. Am J Respir Cri t Care Med 1995;152(3): 1107–1136.
2. Badaruddin M, Uddin MB, Khatin MF, Ahmad K. Study ofpeak expiratory flow rate in different positions. DinajpurMed Coll J 2010; 3(1): 17–18.
3. Perks WH, Tams IP, Thompson DA, Prowse K. Anevaluation of mini-Wright peak flow meter. Thorax 1979;34(1): 79–81.
4. Malik SK, Jindal SK, Sharda PK, Banga N. Peak expiratoryflow rates of healthy school girls from Punjab. IndianPediatr 1982; 18: 161–164.
5. Kaur, H Singh J, Makkar M, Singh K, Garg R wasVariations in the Peak Expiratory Flow Rate with VariousFactors in a Population of Healthy Women of the MalwaRegion of Punjab, India. J of Clin and Diagn Res 2013;7(6): 1000–1003.
6. Paramesh H. Normal peak expiratory flow rate in urbanand rural children. Indian J Pediatr 2003; 70(5): 375–377.
7. Prasad R, Verma SK, Agrawal GG, Mathur N. Predictionmodel for peak expiratory flow in North Indian population.Indian J Chest Dis Allied Sci 2006; 48: 103–106.
8. Sharma M, Sharma RB, Choudhary R. Peak ExpiratoryFlow Rate in children of Western Rajasthan 7-14 yearsof age. Pak J Physiol 2012; 8(1).
9. Ray D, Rajaratnam A, Richard J. Peak expiratory flow inrural residents of Tamil Nadu, India. Thorax 1993; 48:163–166.
10. Amer ican Thorac ic Soc ie ty . Lung func t ion test ing:se lec t ion o f re f erence va lues and i n t erpre ta t i vestrategies. Am Rev Respir Dis 1991; 144(5): 1202–1218.
11. Nunn AJ, Gregg I.New regression equations for predictingpeak expiratory flow in adults. Br Med J 1989; 298:1068–1070.
12. Wise RA, Kanner RE, Lindgren P, Connett JE, Altose MD,Enright PL, Tashkin DP; Lung Health Study ResearchGroup. The effect of smoking intervention and an inhaledbronchodilator on airways reactivity in COPD: the LungHealth Study. Chest 2003; 124(2): 449–458.
13. Miller MR, Hankinson J, Brusasco V, Burgos F, CasaburiR, Coates A,et al. Standardisation of spirometry. EurRespir J 2005; 26: 319–338.
14. Quanjer PH, Lebowitz MD, Gregg I, et al. Peak expiratoryflow: conclusions and recommendations of a workingparty of the European respiratory society. Eur Respir J1997; 10: 2S–8S.

Indian J Physiol Pharmacol 2018; 62(3) Peak Expiratory Flow Rate Changes with Relevant Variables 379
29. Maiolo C, Mohamed EI, Carbonelli MG. Body compositionand respiratory function. Acta Diabetol 2003; 40(1): S32–S38.
30. Bhardwaj P, Poonam K, Jha K, Bano M. Effect of age andbody mass index on peak expiratory flow rate in Indianpopulation. Indian J Physiol Pharmacol 2014; 58(2): 166–169.
31. Yan SC. Re-evaluation of the ventilatory function in normalChinese: compar ison wi th the resu l t s o f a surveyconducted 15 years ago. J Formos Med Assoc 1993;92(3): S152–S159.
32. Shyamala KV, Ganaraja B, Prabha Adhikari , RavichandraV, Ramesh Bhat M. Contro l led exerc ise increases
pulmonary efficacy in elderly. Thai J Physiol Sci 2008;21(1): 14–17.
33. Srinivas P, Chia YC, Poi PJ, Ebrahim S. Peak expiratoryflow rate in elderly Malaysians. Med J Malaysia 1999;54(1): 11–21.
34. Sharma G,Goodwin J .Ef fect of aging on respi ratorysystem physiology and immunology. Clin Interv Aging2006; 1(3): 253–260.
35. Sandhu PK, Bajaj D, Mehta K. Correlation of peak expiratoryflow rate with age and anthropometric parameters inelderly (>65 years). National Journal of Physiology,Pharmacy and Pharmacology 2016; 6(1): 89–92.

380 Orji, Uchendu, Agu, Nnedu, Okerreke and Orji Indian J Physiol Pharmacol 2018; 62(3)
Short Communication
Combined Effects of Vitamin C and Tomato Extract (LycopersiconEsculentum) on Carbimazole-induced Alterations in theTestes of Male Albino Rats
O. C. Orji1, I. K. Uchendu1*, C. E. Agu3, E. B. Nnedu2, A. N. Okerreke1
and G. C. Orji4
1Division of Clinical Chemistry,Department of Medical Laboratory Science,University of Nigeria, Enugu Campus, Nigeria.
2Division of Immunology,Department of Medical Laboratory Science,University of Nigeria, Enugu Campus, Nigeria.
3Prime Health Response Initiative(PHRI), Kwara State,Nigeria-Global Fund HIV/AIDS, Nigeria.
4Department of Nutrition and Dietetics,University of Nigeria Nsukka, Enugu, Nigeria
Abstract
Carbimazole administration, in excess, is associated with various pathological conditions, which includestesticular damage. Generation of oxidative stress is one of the plausible mechanisms of carbimazole-inducedtesticular damage. The aim of the present study was to investigate the effects of carbimazole on testicularfunction in male albino rats, as well as assess the ameliorative role of the combination of Vitamin C andtomato extracts treatments. Phytochemical analyses of the tomato extracts were performed. A total of 25male albino rats weighing 200-250 g were randomly divided into five groups (I-V), with five rats in each group.Group I served as normal control and received no treatment. Group II served as the negative control andreceived only carbimazole (60 mg/kg, oral). Groups III, IV and V served as the treatment groups. They allreceived carbimazole, and then Vitamin C only (200 mg/kg, oral), tomato extract only (30 mg/kg, oral), andvitamin C plus tomato extract respectively for 3 weeks. Oral administration of carbimazole (60 mg/kg) for3 weeks resulted in the reduction of serum testosterone level in the negative control rats (group II) from amean baseline of 0.05±0.00 ng/dl to 0.03±0.00 ng/dl. Histopathological results concomitantly revealed severelyeroded seminiferous epithelia and increased interstitial space in this group. However, groups that receiveddaily doses of Vitamin C or tomato extracts alone, or a combination of both, showed attenuated testiculardamage, as evidenced by their testosterone levels which differed significantly compared to the negativecontrol (P<0.05): 0.05±0.01 ng/dl, 0.09±0.07 ng/dl and 0.04±0.00 ng/dl) for groups III, IV and V respectively.Therefore, a combination of Vitamin C and tomato extract has protective effects against carbimazole-inducedtesticular damage.
Indian J Physiol Pharmacol 2018; 62(3) : 380–384
*Corresponding author :
Ikenna Kingsley Uchendu, Division of Clinical Chemistry, Department of Medical Laboratory Science, University of NigeriaEnugu Campus; Mobile number: +2347068199556; Email: [email protected]
(Received on January 1, 2018)

Indian J Physiol Pharmacol 2018; 62(3) Combined Effects of Vitamin C and Tomato Extract 381
pore size sieve, and were subsequently preserved inthe refrigerator at a temperature between 4-6°C for24 hours.
Phytochemical Analysis of the tomato fruits:
Preliminary phytochemical screening of the tomatof ru i ts was carr ied out at the Depar tment ofPharmacognosy, Faculty of Pharmaceutical Science,University of Nigeria Nsukka. Procedures outlinedby Trease and Evans (5) were employed for theanalysis.
Chemical reagents:
ELISA Ki ts f o r serum tes tos terone assay(Elabscience, Texas, USA); Vitamin C (EmzorPharmaceuticals, Nigeria), to serve as an antioxidant;and carbimazole (Hovid, Malaysia) for induction oftesticular damage were utilized for the experiment.
Induction of Testicular Damage
Each experimental rat was administered with highdose carbimazole (60 mg/kg, oral), daily for 21 days.
Experimental animals and maintenance
Twenty-five (25) adult male albino wistar rats, withaverage weight of (200-250 g), were used in thisstudy. They were obtained from the animal house ofthe College of Veterinary Medicine, University ofNigeria, Nsukka, Enugu state, Nigeria. The animalexper imentat ion was carr ied out according toInstitutional guidelines describing the use of rats,and approved by the institutional animal researchethical committee (UNTH/CSA. 827/VOL. 17).
Experimental design
The rats were randomly allocated to five (5) groups(I-V) of five (5) animals per group in well ventilatedcages. The experimental animals received thefollowing treatments on a daily basis for three weekstogether with the stipulated feed and water.
• Group I (Normal Control): No treatment was givento this group.
Introduction
Oxidative stress is defined as a disruption of theequilibrium between oxidant and antioxidant systems.An imbalance between oxidants and antioxidants toproduce excess reactive oxygen species (ROS) cancause oxidative damage in vulnerable targets suchas unsaturated fatty acids in membranes, thiol groupsin proteins, and nucleic acid bases in DNA. Oxidativedamage, accumulating during the life cycle, plays akey role in the development of many diseases,testicular disease being one of them. Superoxidedismutase (SOD), malondialdehyde (MDA) andprotein disulfide isomerase (PDI) have often beenused to demonstrate oxidative damage in tissues (1,2) . 8 -hydroxy-2-deoxyguanos ine (8OHdG) , acompound produced by the oxidation of guanine atthe e igh th carbon in the nuc leus, has beendemonstrated immunohistochemically as a specificmarker of oxidative stress in rat testes (2)
There are few literatures or researches on theprotective effect of antioxidant-rich food and foodproducts on the testis, and there is currently noliterature on the effect of tomato extracts againsttesticular damage induced by toxicant xenobiotics.However, the tomato fruit has been reported to be arich source of antioxidants such as vitamin C, vitaminE, carotenoids etc (3). Owing to the deleterious andoxidant stress on the testes induced by carbimazole,as extensively reported by Saber et al. (1, 4); weevaluated for the comparat ive ef fects of twoantioxidants (tomato fruit and vitamin C), so as toknow if there is synergy in their ability to protect thetestes against oxidant injury by carbimazole.
Materials and Methods
Collection and processing of Tomato fruits
Fresh samples of tomato f ru i t (Lycopersconesculentum) were purchased at Akwata, Ogbete mainmarket in Enugu, Nigeria. The tomato fruits wereprocessed by washing thoroughly in clean water.After washing, they were ground in an electric blender(Saisho, China) at maximum speed for 5 minutes.The extracts obtained were passed through a 52 mm

382 Orji, Uchendu, Agu, Nnedu, Okerreke and Orji Indian J Physiol Pharmacol 2018; 62(3)
• Group II (Negative Control) were administered withonly carbimazole (60 mg/kg b. wt, oral) for 21days.
• Group III were administered with carbimazole andthe standard drug Vitamin C (200 mg/kg b. wt,oral) for 21 days.
• Group IV were administered with carbimazole andtomato extract (30 mg/kg b. wt, oral) for 21 days.
• Group V received carbimazole, Vitamin C, andtomato extract for 21 days.
Biochemical analysis:
Measurement of serum testosterone level was byELISA method as described in the ELISA Kits(Elabscience, Texas, USA); and as reported byEngvall et al. (6)
Histopathological studies:
The excised testes were fixed in 10% formal salinefor 24 hours and further processed using theconventional paraffin wax embedding technique forlight microscopic examination. The paraffin-embeddedtesticular tissues were sectioned at 5 microns andstained using the Haematoxylin and Eosin [H and E]Staining procedure (7). The histological sections wereexamined using an Olympus TM light microscope.
Statistical analysis:
Data were analyzed using SPSS Inc. Released 2009.PASW Stat ist ics for W indows, Vers ion 18.0.Chicago: SPSS Inc. All data were expressed asMean±SEM. Level Of Significance was determinedby the one way analysis of variance (ANOVA) followedby the Tukey’s Post-HOC multiple comparison tests.P<0.05, P<0.01 or P<0.001 was cons ideredsignificant.
Results
Phytochemical results
The result of the preliminary phytochemical analysis
of tomato fruit revealed abundant presence of reducingsugar and alkaloids (+++); moderate presence offlavonoids (++); and presence (in trace amount) ofcarbohydrate and resins (+). However glycosides,saponins, tannins, proteins, oils, acidic compounds,terpenoids and steroids were absent.
Biochemical results
Carbimazole (60 mg/kg, oral) administration for 3weeks resulted in the reduction of testosterone levelin the rats (0.03±0.00 ng/dl) in the negative controlrats (group II). Daily administration of Vitamin Calone, tomato extracts alone or the combination ofVitamin C and tomato extract attenuated testiculardamage in the rats as evidenced by the serumtestosterone levels: 0.05±0.01 ng/dl, 0.09±0.07 ng/dl and 0.04±0.00 ng/dl for groups III, IV and Vrespectively compared to the negative control whichreceived no treatment (P<0.05). There was howeverno s tat is t ica l ly s ign i f icant d i f f e rence in thetestosterone levels among the treatment groups.
Discussion
Although the blood testes barrier functions as a“gatekeeper” to prohibit harmful substances fromaltering the normal function of the testes and thepositive antioxidant status of the testes, previousstudies have shown that some factors (drugsinclusive) are known to disturb these defenses andcause a state of oxidative stress.
Carbimazole, an antithyroid hormone drug, has beenscientifically and extensively reported by Saber et al(1, 4) to induce testicular damage and oxidativestress; and this is evident in their assay forantioxidant status of the testes, of superoxided ism utase (SOD) and ca ta lase, a f te r o ra ladministration of carbimazole (1.35 mg/kg) for 8weeks. Furthermore, hypothyroidism has beenreported to alter antioxidant defense system in rat(8, 9). Hence, carbimazole has been scientificallyproven to cause oxidant stress, at toxic levels, inthe system.
Based on this scientific evidence, in this present

Indian J Physiol Pharmacol 2018; 62(3) Combined Effects of Vitamin C and Tomato Extract 383
SE
S
S
NS
IT
IT
NS
I II
ET
ET
ST
III
ST
SESE ST
ST
ST
IV
ITIT
NSNS NS
V
Histopathological resultsFig. 1 : Sections of the testes of a representative animal from Group (I-V). In (I), most of the seminiferous tubules appear normal with evenly
distributed germinal cells (arrows) in the seminiferous epithelium (SE). Semen and flagella tufts (S) are seen in the lumen of the tubulesindicative of complete spermatogenesis. In (II), seminiferous tubules appear shrunken with severely eroded seminiferous epithelium(arrows) and increased interstitial tissue space (IT). A few of the tubules are still normal (NS). In (III), the seminiferous tubules appearnormal but their epithelium appears to have scanty germinal cells (block arrow). Some tubules have mature spermatids (seen by thetufts (ST) in their lumen) while others are empty (ET). In (IV), the tubules appear normal with well distributed germinal cells (arrows)in the seminiferous epithelium (SE). Most tubules have mature spermatids (ST). In (V), most of the seminiferous tubules are normal(NS). Others appear to have disrupted basal laminae (arrows). Parts of the interstitial tissue (IT) are also eroded. Stain: Haematoxylinand Eosin, magnification (x100).

384 Orji, Uchendu, Agu, Nnedu, Okerreke and Orji Indian J Physiol Pharmacol 2018; 62(3)
study, we administered an overdose of carbimazole(60 m g/kg, oral), over 40 tim es the dosage Saber etal. administered, for 3 weeks. We didn’t intend todirectly evaluate for the antioxidant properties of thecombined effects of Vitamin C and tomato; ratherwe investigated for their protective ability against thetox ic impacts (h is toarchi tec tura l damage) bycarbimazole on the testicles in albino rats, as evidentin our biochemical and histological findings.
The active phytochemicals present in this tomatoextract are the flavonoids, and alkaloids. Flavonoidsconstitute the largest group of naturally occurringphenolics in tomatoes (3). They demonstrateantioxidant activities and have also been shown topossess many health promoting properties. Most ofthe known alkaloids are related to tissue protection.
Alkaloids are a class of naturally occurring organicnitrogen containing bases which have importantphysiological effect on both humans and otheranimals. Lycopene is an antioxidant found abundantlyin tomatoes. It has the abil ity to destroy freeradicals, thereby preventing their harmful effects oncells and the immune system (10). Lycopene hasalso been reported to be very active against prostatecancer (10, 11).
Oral administration of high dose carbimazole (60 mg/kg) daily, to the rats for 3 weeks, caused a decrease
in serum testosterone level, and the seminiferoustubules appeared shrunken with severely erodedseminiferous epithelium (Fig. 2II). These results agreewith the observations of Saber et al. (4), where theydemonstrated the cytotoxic effect of carbimazole ontesticular tissues.
The carbimazole-induced histological and biochemicalalterations in the rats treated with Vitamin C alone(group III) were remarkably improved; the sameapplied to groups IV and group V which were treatedwith tomato extracts only and a combination ofvitamin C and tomato extracts respectively. VitaminC and the tomato extracts evident ly acted asantioxidants. In these groups, the distribution ofgerminal cells in the seminiferous tubules appearedbetter (group III), and normal in (groups IV and V).The improved testicular architecture in these groupscould be due to the protective effects of theantioxidants. From the foregoing observations,Vi tam in C and tomato extract synergis t ical lyprotected the testicles of the albino rats in group V.
Conclusion
This study has shown that testicular damage can beinduced by the anti thyroid drug, carbimazole.However, the combination of Vitamin C and tomatoextract has protective effect against carbimazole-induced testicular damage.
References
1. Saber AS, Hoda AM, Amany EN. Effects of selenium oncarbimazole-induced testicular damage and oxidative stressin albino rats. J Trace Elem Med Biol; 2010, 25(1): 59-66.
2. Sakai Y, Aminaka M, Takata A, Kuduo Y,Yamauchi H,Aizawa Y, Sakagami H. Oxidative stress in mature rattest is and i ts developmental changes. Development,Growth & Differentiation 2010; 52(7): 657–663.
3. D’Introno A., Paradiso A., Scoditti E. (2009) Antioxidantand an t i - in f l am matory proper t ies o f tomato f ru i t ssynthes iz ing d i f fe rent amounts o f s t i lbenes . PlantBiotechnology Journal 2009; 7(5): 422–429.
4. Saber AS, Sobhy EE, Yosry AO, Ahmed ME. Impact ofginger aqueous extract on carbimazole induced testiculardegenerative alterations and oxidative stress in albinorats. Journal of Costal Life Medicine 2017; 5(4): 167–173.
5. Trease GE, Evans W C. Pharmac ognosy . 13 th ed.Philadelphia: Bailliere Tindall. 1989.
6. Engvall E, Perlmann P. Enzyme-linked immunosorbent assay(ELISA) . Quant i ta t i ve assay o f immunoglobu l in G.
Immunochemistry 1971; 8(9): 871–874.
7. Baker FJ, Silverton RE, Pallister CJ. Baker and Silverton’sin t roduc t ion to labo ra tory technology . 7 th ed i t i on ,But terwor th-Heinemann, W oburn, MA, USA.ISBN –13978075621908 1998; Page. 448.
8. Jena S, Bhanja S. Hypothyroidism alters ant ioxidantdefence system in rat bra ins tem dur ing post nataldevelopment and adulthood. Neurol Sci 2014; 35(8), 1269–1274.
9. Saber AS, Mahran HA, Nofal AE. Effect of selenium oncarbimazole-induced histopathological and histochemicalalterations in prostate of albino rats. American Journal ofMedicine and Medical Sciences 2012; 2(1): 5–11.
10. Qui X, Yuan Y, Vaishnav A, Tessel MA, Nonn L, vanBreemen RB. Effect of lycopene on protein expression inhuman primary prostatic epithelial cells. Cancer Prev Res2013; 419–427.
11. Sporn MB, Liby KT. Is lycopene an effective agent forpreventing prostate cancer? Cancer Prev Res 2013; 384–386.

Indian J Physiol Pharmacol 2018; 62(3) Letter to Editor 385
Letter to Editor
Dear Sir,
Vitamin D, Neutrophil-to-Lymphocyte Ratio and Cognitive Function
Indian J Physiol Pharmacol 2018; 62(3) : 385
*Corresponding author and **Supporting author :
*Dr. Mahantayya Math; Department of Physiology, MGM, Medical College, Navi Mumbai, Email: [email protected]**Dr. Yashoda Kattimani, Department of Physiology, MGM, Medical College, Navi Mumbai, Email: [email protected]
(Received on January 1, 2018)
We have read the nice article by Dr. Sasirekha andcolleagues in the recent issue of your journal (IJPP2018; 62(1) : 74–79) They have observed overallprevalence of cognitive impairment in 30% of Type IIDiabetes Mel l i tus pat ients. Authors have notmentioned about occupation of participants. Thepeople who are engaged in occupat ion wi thmathematical skills will have reduced cognitivedecline even after retirement (1). Vitamin D deficiencyis common in cities of India and other countries.Vitamin D deficiency is identified as a risk factor
for type 2 diabetes and its complications (2).Vitamin D has a significant negative correlationwith Neutrophi l - to -Lymphocyte rat io (3) . Thelower v i tam in D concentrat ions in b lood areassociated with poorer cognitive function (4). Theintake of diet with high percentage of energy fromfat and prote in, and low-energy in take f romcarbohydrate have been associated with cognitivedecline (5). The balanced diet with adequate VitaminD helps to maintain normal N-L ratio and cognitivefunction.
References
1. Kajitani S, Sakata K, McKenzie C. Occupation, retirementand cognitive functioning. Ageing Soc 2017; 37: 1568–1596.
2. Dhas Y, Mishra N1, Banerjee J. Vitamin D Deficiency andOxidative Stress in Type 2 Diabetic Population of India.Cardiovasc Hematol Agents Med Chem 2017; 14(2): 82–89. doi: 10.2174/1871525714666160426150233.
3. Akbas EM1, Gungor A2, Ozcicek A3, Akbas N4, Askin S4,Polat M5. Vitamin D and inflammation: evaluation withneutrophil-to-lymphocyte ratio and platelet-to-lymphocyteratio. Arch Med Sci 2016 Aug 1; 12(4): 721–727. doi:
10.5114/aoms.2015.50625. Epub 2016 Jul 1.
4. Balion C1, Griffith LE, Strifler L, Henderson M, PattersonC, Heckman G, Llewellyn DJ, Raina P. Vitamin D, cognition,and dementia: a systematic review and meta-analysis.Neurology 2012 Sep 25; 79(13): 1397–1405.
5. Ding B1, Xiao R2, Ma W2, Zhao L3, Bi Y1, Zhang Y4. Theassociation between macronutrient intake and cognitionin individuals aged under 65 in China: a cross-sectionalstudy. BMJ Open 2018 Jan 9;8(1): e018573. doi: 10.1136/bmjopen-2017-018573.
Mahantayya Math* and Yashoda Kattimani**
Department of Physiology,MGM, Medical College,
Navi Mumbai

Volume 62 - Number 3 July - September 2018
IJPPAZ 62 (3) 278–385 (2018)
Registered with Registrar of Newspapers for India under No. 6271/61
Original Article
278.� Comparison of Baroreflex Responses to Lower Body Negative Pressure and Valsalva Maneuver in Healthy Subjects
� Shival Srivastav, Dinu S Chandran, Ashok Kumar Jaryal and Kishore Kumar Deepak
286.� Histomorphological and Biochemical Analysis of Large Goitres in Iodine Replete Gangetic Plains of West Bengal, India: Is The Spectrum Shifting Towards Graves’ Disease?
� Amar K Chandra, Mainak Dutta, Sohag Kundu, Arijit Chakraborty, Chiranjit Mondal and Deotima Sarkar
298.� Prevalence of Cardiovascular Risk Factors in Engineering and Medical Students in Madurai, Tamil Nadu
� B. N. Vallish, N. Shreedher Priyan, J. Mohan, Raj Kishore Mahato and M. Brahadeesh
306.� Study of Inflammatory Marker IL-6 and Sympathetic Activity Among WHR Matched Prehypertensive & Normotensive Males
� Archana Pandey, Yogesh Saxena, Soumen Manna and Aarti Kotwal
314.� The Lack of Validity of Predictive Equations for Calculating Resting Energy Expenditure in Asian Indian Patients with Type 1 and Type 2 Diabetes Mellitus
2� Riddhi Dasgupta, Padmanaban Venkatesan, Akankasha Goyal, Anneka Wickramanayake , K. Chaithanya Murthy, Mercy Inbakumari, Meredith Hawkins and Nihal Thomas
320.� Pattern and Prevalence of Cardiovascular Autonomic Neuropathy (CAN) in Alcoholic Liver Disease Patients in Gauhati Medical College & Hospital, Assam : A Cross-sectional Study
� Jyotismita Deka, Anupi Das and Gayatri Bora
327.� Protective Effect of A2B Receptor Antagonist (TRP 2) on Acetic Acid Induced Ulcerative Colitis in Rats: In vitro, in vivo and in silico Methods
� P. Praveen Kumar, G. Santhosh, M. Sri Chandana, K. Prasad, M. Raghu Prasad and S. Khasim
339.� Effect of Bacopa Monnieri on Ethanol-induced Anxiolysis and Withdrawal Anxiety in Wistar Rats
� Bhuvaneshwari Sudershan, Mukta N. Chowta, Sheetal D. Ullal, S. Rajeshwari, Vinay Kumar Sayeli, Sudhishma Shivaprasad and Pragati Srivastava
347.� Gastroprotective Effect of Ethanolic Extract of Vigna Subterranea in Ethanol-induced Gastric Mucosal Ulceration in Rats � Morufu E. Balogun,Elizabeth E. Besong, Jacinta N. Obimma, Serges F. A. Djobissie and Ogochukwu S. Mbamalu
Medical Education / Original Article
359.� Creating Valid Multiple-Choice Questions (MCQs) Bank with Faculty Development of Pharmacology
� Shalini Chandra, Rashmi Katyal, Sameer Chandra, Kashmir Singh, Arun Singh and H. S. Joshi
Short Communication
367.� Electronic Stethoscope Designing and Use in Resource Limited Indian Setting
� Noorin Bhimani and Zaki Shaikh
372.� Peak Expiratory Flow Rate Changes with Relevant Variables in a Population of Eastern India
� Sujoy Mukherjee, Goutam Banerjee and Anil Baran Singha Mahapatra
380.� Combined Effects of Vitamin C and Tomato Extract (Lycopersicon Esculentum) on Carbimazole-induced Alterations in the Testes of Male Albino Rats
� O. C. Orji, I. K. Uchendu, C. E. Agu, E. B. Nnedu, A. N. Okerrekeand G. C. Orji
Letter to Editor
385.� Vitamin D, Neutrophil-to-Lymphocyte Ratio and Cognitive Function
� Mahantayya Math and Yashoda Kattimani