Hong Kong Shipping Statistics (July - September 1990)
111
COMPLIMENTARY ell MW HONG KONG SHIPPING STATISTICS · " 1 JULY - SEPT. 1990 TRADE SURVEYS AN'D SHIPPING STATISi'I' CS SECTION CENSUS AND STATISTICS DEPARTMENT, HONG KONG
-
Upload
khangminh22 -
Category
Documents
-
view
3 -
download
0
Transcript of Hong Kong Shipping Statistics (July - September 1990)

COMPLIMENTARY
ell MW
HONG KONG SHIPPING STATISTICS · "
1 JULY - SEPT. 1990
TRADE SURVEYS AN'D SHIPPING STATISi'I'CS SECTION
CENSUS AND STATISTICS DEPARTMENT, HONG KONG

這份刊物的 PDF 版本的文字是從印刷版掃描而成,再利用光學字符識別軟件轉換成電子格式。由於原印刷版本已印製
並保存多年,光學字符識別技術未必能準確地識別某些文字或數字。因此,搜索或複製此 PDF 檔案內的文字時應加以
注意。 The text of this PDF publication was scanned from its printed version and then converted to electronic text using Optical Character Recognition (OCR) software. Because of the age and condition of the original printed copy, the OCR may not recognise certain characters or figures accurately. Caution should therefore be taken when searching or copying text from this PDF publication.

PARr A.
PARr B
PART C
PART D
HONG KONG SHIPprnG STATISTICS
CONTml'S
Explanatory Note.
Terms and claaeiticationa
Commodity classitication
Port list
General ReTie"
Shippiag stati.tic.
Port and cargo stati.tic.
Direct .hipaent (or seaborne imports/exports)
Tranahi~t cargo
Shippiag Statistics Summary Table.
1. Incolling/outgoing .hips analysed by region
....
2. Incoadng/outgoing ships analYl!led by selected country and port of call
3. InCOming/outgoing ships analysed by type of shipping service
4. Incolling/outgoing ships analysed by ship type
5. Incoldng/outgoing ships analysed by nas 6. Incoa1ng/outgoing ships analysed by deadweight tonnage (DWT)
7. Outgoing ships anal,..ed by length of time in port
Port and Cargo Statistics Tables
Direct shipment.
8. Seaborne cargo discharged/loaded anal,..ed by selected country and port of loading/discharge
9. Seaborne cargo discharged/loaded analysed by selected country and port of loading/discharge by containerization
10. : Seaborne cargo discharged/loaded. ~ed. by principal commodity
11. Seaborne cargo di.charged/loaded anal,..ed by principal commodity by containerization
12. Seaborne cargo discharged/loaded analysed by selected country of loading/discharge by principal commodity
13. Seaborne cargo discharged/load.ed. analysed. by selected. port of loading/di.charge by priJI.cipal. commodity
14. Seaborne cargo discharged/loaded analysed by principal commodity by selected port of loading/discharge
15. Seaborne cargo discharged/loaded anal,..ed by selected port of loading/discharge by selected ship type
Transhipments
16. Inward/outward transhipment cargo analysed by selected country and port ·of ·loading/discharge
17. Inward/outward transhipment cargo anal,..ed by selected country and port of loading/discharge by containerization
18. Inward/outward transhipment cargo analysed by principal coaaodity
19. Inward/outward transhipment cargo analysed by principal commodity by containerization
20. Inward/outward transhipment cargo analysed by selected country of 10adiJI.g/discharge by principal cOlllDOdity
21. Outward transhipment cargo analysed by . • elected country of discharge by selected country of loading
...
4
7
9
14
16
17
21
26
28
34 36 38
42
46
47
51
57 61
69
73 77 81
85
89
95
97 102
106

PAR T A
EXPLANATORY N(Jl'ES
I. Introduction
The Hong Kong Shipping Statistics System was set up in 1983, based on the '~niform System for Collecting Economic Statistics of Shipping" recommended by the United Nations Economic and Social Commission for Asia and the Pacific~ Shipping statistics are compiled primarily from general declarations submitted to the Marine Department by ship masters or shipping agents, and port and cargo statistics from ocean cargo manifests supplied by shipping companies or agents to the Census and Statistics Department.
Shipping statistics cover all oceangoing vessels entering and leaving Hong Kong, excluding yachts and pleasure craft, on a full enumeration basis. However, because of resource constraints, only a sample of all consignments listed in the manifests is used for compiling port and cargo statistics.
11. Description of tables
Tables 1 to 7 present shipping statistics glvlng the number of ships and their capacity analysed by region, by first/last country/port of call, by type of shipping service, by ship type, by flag, by class of deadweight tonnage and by length of time in port.
Tables 8 to 14 present statistics of cargo discharged/loaded in Hong Kong giving the weight (in tonnes) and gross volume (in cubic metres) analysed, respectively, by selected country/port of loading/discharge, by selected country/port of loading/discharge by containerization, by principal commodity, by prinCipal commodity by containerization, by selected country/
port by principal commodity and by principal commodity by selected port. Table 15 further analyses statistics by selected port by selected ship type.
Transhipment cargo statistics analysed by selected country/port are shown in Table 16, by selected country/port by containerization i n Table 17, by principal commodity in Table 18, by principal commodity by containerization in Table 19, and by selected country by principal commodity in Table 20. Table 21 relates the country of loading and country of discharge of cargo transhipped in Hong Kong, based on information reported in the outward cargo manifests.
Ill. Type of shipment
The Hong Kong Shipping Statistics System classifies shipment into four types, namely, imports, exports (comprising exports and re-exports)., inward transhipments and outward transhipments. Goods . importe~ into Hong Kong or exported/re-exported from Hong Kong are classified as direct shipments, whereas goods transhipped in Hong Kong under a through bill of lading (as distinguished from those imported into Hong Kong for subsequent re-exportation) are classified as transhipment cargo. Goods in transit through Hong Kong are not included in the statistics.
IV. Units of measurement
For shipping statistics, the number of ships are counted; ship capacity is expressed in three kinds of measurements, namely, deadweight tonnage, gross registered tonnage and net registered tonnage. Cargo statistics are recorded in gross weight tonnes and in cubic measurement. Definitions are given under Terms and Olassifications on pages 4 - 6.

V. Commodity Classification
Cargo reported in the manifests is classified into 112 shipping commodity groups in the Hong Kong-Shipping Statistics System in 1990. Most of the commodity groupe are closely related to the Standard International Trade Classification (Revision 2) Divisions (i.e. at the 2-digit level). As Hong Kong exports a large volume of manufactured goode, a finer classification vas made for the S.I.T.C. Sections 6 aad 8, namely, Manufactured GoodeClaasified Chiefly by Material, and Miscellaneous Manufactured Articles. The commodity codes and descriptio .. are listed on pages 7 - 8.
VI. Port Classification
In shipping statistics, the first/laet port of call is used to identif) a voyage, but in port and cargo statistics, the actual port of loading or discharge of the cargo is record.d. In the "3rd quarter of 1990, the por~ list comprises 465 ports, of which 323 are separately identified and 142 are smaller ports grouped together. They are listed on pages 9 - 13.
VII. other Classifications
Shipping, port and cargo statistics are also analysed by type of shipping service, ship type, flag, and by deadweight tonnage, etc. Please refer to Terms and ClasSifications for details.
2 -
For the classification of type of shipping aervice, all cargo carried by a ship is claasified under one type of ahipping service, as declared in the general declaration, although in practice cargo can be loade~unloaded in both conference and non-conference shipment areas in the same voyage.
VIII. Sampling Method
The atratified syatematic sampling scheme is used for selecting consignments from ocean cargo manifests. CODaicnments are first classified by type of shipment, and a sample consiating of a tull enumeration of the top 4_ (by gross weight) of consignments and a 3.3-aystematic s.-ple of the remaining o.es ia th •• selected separately for each type of shipment. The over.ll saapltag fraction is therefore about 7.t!i, .
IX. Discrepancies and Sources of Errors
Statisti~ in this report are subject to errers et reporting, processing, and of imputing cubic measurement figures by stowage factors when only gross weights are available.
Figures presented in this report are rounded to the nearest digit of the specified unit or to the nearest percentage point. Hence individual statistics may not add up to the respective totals.

x. Revisions to CumUlative Statistics
P.djustments to previous quarter":I records may at times be necessary. Since these adjustments are incorporated in the cumulative totals only, the sum of the quarterly statistics in previous quarterly reports may differ from the corresponding cumulative total published in this report.
XI. Enquiries on the Shipping Statistics
Enquiries on the statistics contained in this report may be directed to the Trade Surveys and Shipping Statistics Section, Census and Statistics Department, 22hd floor, Wanchai Tower I, 12 Harbour Road, Wanchai, Hong Kong, at telephone number 823 4887.
3

TERMS AND CLASSIFICATIONS
Capacity
This refers to the capacity of a vessel. There are 3 kinda of measurement in this report :
(a) Deadweight tonnage,
(b) Gross registered tonnage,
(c) Net registered tonnage.
Deadweight tonnage (DWT)
This ia the weight in tonnes of cargo, stores, fuel, water, passengers and crew carried by the ship when loaded to her maximum summer loadline.
The following categories are used
(1) Below 2 000
(2) 2 000 to 3 999
(3) 4 000 to 4 999
( 4 ) 5 000 tci 5 999
(5) 6 000 to 6 999
(6) 7 000 to 7 999
(7) 8 000 to 8 999
(8) 9 000 to 9 999
(9) 10 000 to 10 999
(10) 11 000 to 11 999
(11) 12 000 to 12 999
( 12) · 13 000 to 13 999
(13) 14 000 to 14 999
(14) 15 000 to 15 999
(15) 16 000 to 17 999
(16) 18 000 to 19 999
(17) 20 000 to 24 999
(18) 25 000 to 29 999
(19) 30 000 to 39 999
(20) 40 000 and above
- 4 -
Gross registered tonnage (GRT)
This measurement is, broadly, the capacity of a ship in cubic feet of the space within the hull, and of the enclosed apace above the deck avai lable for cargo, stores, fuel, passengers and crew, with certain exceptions, divided by 100. Thus 100 cubic feet .of capacity is equivalent to 1 gross registered ton.
Net registered tonnage (NRT)
This is derived from the gross registered tonnage by deducting space used for the accommodation of the master, officers, crew, fuel, nav,igation and propelling machinery.
Cargo discharged/loaded
This is the measurement of cargo discharged/ loaded in Hong Kong.
There are two types of statistics : gross weight of cargo in tonnes and gross volume of cargo in cubic metres.
Commodity codes
Codes are assigned to commodities according to the Hong Kong shipping commodity classification.
No. of codes at group (3-digit) level = 112
No. of codes at section (1-digit) level = 10
The codes and descriptions are listed on pages 7 - 8.

Gross weight
This refers to the weight of cargo in tonnes inclusive of packing, but exclusive of ISO container or other container for moving the goods.
Gross volume
This refers to the volume of cargo in cubic metres inclusive of packing, but exclusive of ISO container or other container for moving the goods.
First port of call
This refers to the first port of loading of .the ship in her voyage to Hong Kong as declared to the Marine Department by the ship master. It is used to identify a voyage and the cargo discharged in Hong Kong may be loaded at other than the first port of call.
Last port of call
This refers to the last port of discharge of the ship in her voyage from Hong Kong as declared to the Marine Department by the ship master. It is used to identify a voyage and the cargo loaded in Hong Kong may be discharged at other than the last port of call.
Port of loading/discharge
This refers to a foreign port at which cargo was loaded and carried to Hong Kong and in the case of outward cargo, to the foreign port at which cargo carried from Hong Kong is discharged.
- 5 -
This is the nationality of the vessel, indicating where she is officially registered.
Seventeen principal flags are separately classified . . 1. American 10 . Liberian 2. British 11. Norwegian 3. Chinese 12. Panamanian 4. Danish 13. Philippine 5. Dutch 14. Russian 6. German (F.R. of Germany) 15. Singaporean 7. Greek 16. South Korean 8. Indonesian 17. Taiwanese 9. Japanese 18. Others
Ship type
This refers to the known specific function of the ship.
Seventeen types of ship are distinguished
1. Conventional cargo vessel 2. Passenger ship 3. Semi-container vessel 4. Container vessel (fully cellular) 5. Barge carrier (LASH/Seabee) 6. Roll-on/roll-off 7. Oil tanker 8. Gas carrier/tanker 9. Chemical carrier/tanker
10. Other fluid product carrier 11. Dry bulk carrier 12. OBO carrier 13. Log/timber carrier 14. Lighter/barge/junk 15. Fishing (including fish processing vessel) 16. Tug 17. Others

Type of sh ipping service
This refers to the nature of service provided by a ship.
Four types of service are distinguished
1. Conference liner
2 . Non-conference liner
3. Tramp
4. Others
Type of shipment
This indicates the direction and the type of flow of commodities.
The four classifications are as follows
Code
1
2
3 4
'l'ranshipment cargo
Description
Inward direct shipments (imports)
Outward direct shipments (domestic exports and re-exports)
Inward transhipments
Outward transhipments
This refers to cargo tha t is consigned on a t hrough bill of l ading from a place outside Hong Kong to another pla ce outside Hong Kong but is or is to be removed from one vessel (ship, vehicle, train or aircraft) and either returned to the same vessel or transferred to another vessel within Hong Kong waters.
- 6 -

Commodity Classification
Code Description
o Food and live animals chiefly for food 1 Beverages and tobacco 2 Crude materials, inedible, except fuels 3 Mineral fuels, lubricants and related materials 4 Animal and vegetable oils, fats and waxes 5 Chemicals and related products, n.e.B. 6 Manufactured goods classified chiefly by materials 7 Machinery and transport eqUipment 8 Miscellaneous manufactured articles 9 Postal packages; live animals not for food;
ammunition; transactions in coin, not current; and cargo not identifiable
000 Live animals chiefly for food 010 Meat and meat preparations 020 Dairy products and birds' eggs 030 Fish, crustaceans and molluscs, and preparations
thereof 040 Cereals and cereal preparations 050 Vegetables and fruit 060 Coffee, tea, cocoa, sugar preparations, honey,
spices and manufactures thereof 089 Canned food 099 Miscellaneous edible products and preparations 110 Beverages 120 Tobacco and" tobacco manufactures 247 Logs and timber; wood, simply worked 251 Pulp and waste paper 260 Textile fibres 270 Textile , wastes 273 Stone, sand and gravel 280 Metalliferous ores and metal scrap 291 Clay and kaolin 299 Crude animal and vegetable materials, n.e.s. 320 Coal, coke and briquettes 330 Petroleum 9 petroleum products and related materials 340 Gas, natural and manufactured 410 Animal and vegetable oils, fats and waxes
Code Description
510 Organic chemicals 520 Inorganic chemicals 530 Dyeing, tanning and colouring materials 540 Medicinal and pharmaceutical products 550 Essential oils and perfume materials; toilet, polishing
and cleansing preparations 562 Fertilizers, manufactured 570 Explosives and pyrotechnic products 580 Artificial resins and plastic materials, and cellulose
esters and et hers 591 Gum rosin 599 Chemical materials and products, n.e.s. 610 Leather, leather manufactures, n.e.s. and dressed
furskins 620 Rubber manufactures, n.e.so 630 Cork and wood manufactures (excluding furniture) 640 Paper, paperboard and articles of paper pulp, of paper
or of paperboard 650 ,Cotton textiles 651 Linen textiles 652 Silk textiles 653 Woollen textiles 654 Textiles of man-made fibres 656 Textiles of mixed uterials or other materials, n.e.s. 657 Textile yarn and thread, all kinds 659 Other textile products, n.e.s. 661 Cement and cement clinker 665 Glassware 666 Pottery (including chinaware and porcelainware) 670 Iron and steel 679 Iron and steel ware 680 Non-ferrous metals 691 Aluminiumware and brassware 695 Tools, hand and powered 696 Cutlery and kitchenware 697 Plastic manufactures, n.e.s. 699 Miscellaneous manufactures of metal and non-metallic
minerals, n.e.s o
- 7 -

Code Description
751 Electronic calculators 759 Office machines and automatic data processing
equipment, n.e.s. 761 Television receivers 762 Radio-broadcast receivers 769 Other telecommunications and sound recording and
reproducing apparatus and equipment, n.e.s. 771 Electric fans 772 Electric hair dressing apparatus 773 Sewing machines 774 Batteries 775 Household type electrical equipment and their
non-electrical counter-parts, n.e.so 778 Other electrical and electronic appliances and parts 779 Other machinery and equipment and parts, n.e.s. 781 Bicycles and motor cycles, including parts 789 Other road vehicles and accessories 799 other transport equipment 811 Lamps and lanterns 812 Flashlights 819 Sanitary, plumbing, heating and lighting fixtures
and fittings, n.e.s. 820 Furniture and parts thereof 830 Travel goods, handbags and similar containers 840 Cotton garments 841 Linen garments 842 Silk garments 843 Woollen garments 844 Garments of man-made fibres 845 Leather garments 846 Garments of mixed materials or other materials,
n.e.s. 848 Hats, caps and other headgear 849 Articles of apparel and clothing accessories, n.e.s. 850 Footwear
- 8 -
Code Description
861 Artificial flowers, foliage, fruit, plants and parts 862 Bamboo ware, rattan ware, fern, willow and .traw ware
(excluding furniture) 863 Brushes and brushware 864 Candles 865 Gloves (of all materials) 866 Umbrellas/parasols 867 Mats and matting 868 Rugs and carpets 869 Handicrafts 871 Stationery 879 ProfeSSional, scientific and controlling instruments
and apparatus, n.e.s. 881 Cameras 884 Optical goods, n.e.so 885 Watches 886 Clocks 889 Photographic apparatus, equipment and supplies, n.e.s. 891 Electronic games, hand held and TV games 892 Printed matter, pictures and paintings 894 Toys 895 Albums (photograph, stamp. etc.) 896 Sporting goods 897 Jewellery, goldsmiths' and silversmiths' wares, and
other articles of precious and semi-precious materials
898 Musical instruments and parts 899 Miscellaneous manufactured articles, n.e.so
901 Postal paCkages; live animals not for food; ammunition; and transactions in coin, not current
999 Cargo not separately identifiable

PORT LIST
Alhania Durres Othe r, Alhania
Alg eria Algiers Oth er, Alg eri a
Angola Lobito Luanda Other, Angola
Argentina Bu enos Aires Ri o Grande Other, Arg entina
Aruba Oranjestad Other, Aruba
Australia Abbot Point Adelaide Brisbane Burni e Fremantle Gladstone Hobart Melbourne Newc astle Ri sdon Sydn ey Othe r, All s t.ralia
Bahamas Nassau Other, Bah ama s
Bahrain Mina Sulman Othe r , Bahrain
Bangladesh Chi ttagong Other, Bangladesh
Barbados Bridgetown Other, Barbados
Belgium & Luxembourg Antwerp Other, Belgium & Luxembourg
Belize (British Honduras) Beli ze City Other, Belize
(Br itish Honduras)
Benin Cotonou Other, Benin
Brazil Manaus Rio De Janeiro Rio Grande Santos Ot.her, Brazil
Brunei Randar Seri Begawan Other, Brunei
Bulgaria Bourgas Other, Bulga r ia
Camer oon Republi c Du ala Other , Cameroon Republi c
Canada Halifax Mont r eal Qu ebec Roberts Bank st. John Toronto Vancouv er Oth er , Canada
Chile Arica Iquique San Antonio Valparaiso Other, Chile
China Dalian Fuzhou Guangzhou (incl. Huangpu) Haikou Nanjing Qingdao Qinhuangdao Shanghai Shantou Tianjin Xingang Wenzhou Wuhu Xiamen Zhangjiagang Zh anjiang Oth er, China
- 9 -
Col ombi a Barr anqu i lla Buenaventu ra Ot her, Col ombi a
Cook Is lands Rar otonga Is land Ot he r , Cook I s lands
Costa Ri ca Puntarenas Other, Costa Rica
Cuba Manzanillo Other, Cuba
Curacao Willemstad Other, Curacao
Cyprus Famagusta Larnaca Lirnassol Other, Cyprus
Democratic Karnpuchea Phnom-Penh Other, Democratic Karnpu chea
Democratic People's Republic of Korea Narnpo Wonsan Other, Democra t ic Peopl e 's
Republi c of Korea

Denmark & Greenldnd Aarhus Copenhagen Other, Den mark & Greenland
Djibouti Dj ibouti (Port) Other, Djjbouti
Dominican Republic Santo Domingo Oth er, Dominican Republi c
Ecuador Guayaquil Other, Ecuador
fuLyQl Alexandria Port Said Other, Egypt
El Salvador Aca jutla Other , El Salvador
Ethiopia Assab Other, Ethiopia
Federal Republic of Germany Bremen Bremerhaven Hamburg Other, Federal Republic of
Germany
Fi j i Lautoka Suva Other, F'ijj
Finland Helsinki Oth er , Finland
France Bou rdea ux Fos Le Havre Marseilles Other , France
French & Netherlands West Indies Cayenne Other, French & Netherlands
West Indies
Gabon Owendo Other, Gabon
Gambia Banjul (Bathrust) Other, Gambia
German Democratic Republic Rostock Other, German Democratic
Republic
Ghana Tema Other, Ghana
Gibraltar Gibraltar (Port)
Greece Pira eus Other, Greece
Grenada & West Indies As sociated States St. George Other, Grenada & West Ind ies
Associated States
Guat. emala San Jose Other, Guatemala
Guinea Conakry Other, Guinea
Guinea - Bissau Bissau Other, Guinea- Bissau
Guyana (British Guiana) Georgetown (Demerara) Other, Guyana (British
Guiana)
Haiti Port Au- Prince Other, Haiti
Honduras Puerto Cortes San Lorenzo Other, Honduras
Hunga r y Budapest Ot.her, Hungary
Iceland Reykjavik Other, Icel and
- 10 -
India Bombay Calcutta Madras Ot her, India ' (incl. Cochin,
Mangalore, etc. )
Indonesia Belawan Jakarta Panjang Samarinda Semarang Surabaya Tanjung Priok Ujung Pandang Other, Indonesia
Insular Spain & Spanish Ports & Provinces in Afri ca Las Palmas Tenerife Other, Insular Spain &
Spanish Ports & Provinces in Africa
Iran Bandar Abbas Other, Iran
Iraq Basrah Other, Iraq
Irish Republic Dublin Other, Irish Republ ic

Israel Ashdod Eilat Haifa Other, I sra el
Italy Genoa Leghorn (Livorno) Naples Trieste Other, Italy
Ivory Coast Abidjan San Pedro Other, Ivory Coa s t
Jamaica Kingston Other, Jamaica
Japan Himeji Hirohata Hiroshima Kanda Kawasaki Kimitsu Kobe Kushiro Mizushima Moji Nagoya Osaka Sa j kj Shimi zu Susakj Tokyo Tomakoma i Ts ukumi
Ube Yawata Yokohama Other, Japan
Jordan Aqaba Other, Jord an
Kenya Mombasa Other ! Kenya
Kiribati Tarawa Island Other, Kiribati
Kuwait Kuwait (Port) Other, Kuwait
Lebanon Beirut Other, Lebanon
Liberia Monrovia Other, Liberia
Libya Benghazi Tripoli Other, Libya
Macau Macau (Port)
Malagasy Republi c Pointe Des Galets Tamatave Other , Malaga s y Republi c
Malaysia Kota Kinaballl Kuching Labuan Penang Island Port Kelang Sandakan Sibu Tanjong Mani Tawau Other, Malaysia
Maldives Addu Atoll Other, Maldives
Malta Valletta Other, Malta
Mauritania Nouakchott Other, Mauritania
Mauritius Port Louis Other, Mauritius
Mexico Acapulco Manzanillo Other, Mexi co
Morocco Casablanca Other, Morocco
Mozambique Beira Maputo Other, Mo za mbique
- 11 -
Myanmar Rangoon Other, Myanmar
Nauru Nauru Island Other, Nau ru
Nether l ands Amsterdam Rotterdam Other, Nethe rlands
New Zealand Auckland Dunedin Lyttelton Napier Tauranga Wellington Other, New Zealand
Nicaragua Corinto Other, Nicaragua
Nigeria Apapa Lagos Port Harcourt Warri Other, Nigeria
Niue Niue Island
Norway Oslo Other, Norway

Oceania, n .e . s. Noumea Papeet.e Other, Oceania, n .e. s.
Oman (Muscat & Oman) Mina Qaboos Other, Oman (Mus ca t & Oman)
Pakistan Karachi Other, Pakistan
Panama Balboa ,Cristobal Other, Panama
Papua New Guinea Kieta Lae Madang Port Moresby Rabaul Wewak Other, Papua Ne,w Guinea
Paraguay Asuncion Other, Paraguay
Peninsular Spain Barcelona Valencia Other, Penjnsular Spain
People' s Democratic Republic of Yemen (Ad en) Acten Oth er, People's Democra tic
Rp.pllbl i c of Yemen (Acten)
People's Republic of Congo (Brazzaville) Pointe Noire Other, People's Republic of
Congo (Bra zzaville)
Peru Callao Chimbote Other, Peru
Philippines Bugo Cebu Manila Mariveles Other, Philippines
Pitcairn Island Pitcairn Island (Port)
Poland G'(}ynia Other, Poland
Portugal, Azores & Madeira Lisbon Other, Portugal, Azores &
Madeira
Puert.o Rico San Juan Other, Puerto Rico
Qatar Doha Other, Qatar
Republi c of Korea (S outh Korea) Bukpyong Busan Inchon Other, Republic of Korea
Republi c of South Africa Cape Town Durban East London Port Elizabeth Richards Bay Other, Republic of South
Africa
Republic of Zaire (Kimshasa) Matadi Other, Republic of Zaire
(Kimshasa)
Romania Constantza Other, Romania
Samoa (Western Samoa) Apia Other, Samoa (Western Samoa)
Saudi Arabia Damman ,Jeddah Other, Saudi Arabia
Senegal Dakar Other, Senegal
Seychel les Mahe Island Other, Seychelles
- 12 -
Sierra Leone Freetown Other, Sierra Leone
Singapore Singapore (Port) Other, Singapore
Solomon Islands Honiara Other, Solomon Isl ands
Somali Democrat ic Republic Mogadishu Other, Somali Democ ratic
Republic
sd Lanka Colombo Other, Sri Lanka
Sudan Port Sudan Other, Sudan
Surinam Paramaribo Other, Surinam
Sweden -Gothenhurg Other, Sweden
Switzerland & Liechtenstein Basle Other, Switzerland &
Liechtenstein
Syria Lattakia Other, Syria

Tai wan Hllalien Kaohslung Keelung Suao Taichung Other, Taiwan
Tanzan·ia Dar-Es-Salaa.m Zanzibar Is1and Other, Tanzania
Thailand' Bangkok Other, Thailand
Togo ·· Lome Other, ~ogo
Tonga Nutualota Other, Tongs
Trinidad & Tobago Port ot Spain . Other, l'rinidad &~obago
Trust Territory of the Pacific Islands Koror Yap Other, Trust Territory of
the Pacific Islands
Tunisia Sfax Tunis at her, Tu n 1 S i a
Turkey Istanbll] Other, Turkey
Tuvalu ----F'unafuti Other, Tuvaln
United Arab, Emirates Abu Dhabi Dubai Other, United Arab Emirates
United Kingdom Felixstowe Hull London Manchester Portsmouth Southampton Tilbury Other, United Kingdom
Union of Soviet Socialist Republic Ilichevsk Vostochny Other, Urtion of Soviet
Socialist Rep¥blic
United states of America Baltimore Boston Charleston Chicago Galveston Houston Jack~onVl11f' Long Beach L:ongvif'w
Los Angeles Miami New Orl eans New York Newark Norfolk Oakland Philadelphia Portland (Maine) Portland (Oregon) San Diego San Francisco San Pedro Savannah Seattle Stockton Tacoma Tampa Wilmington (Delaw,are) Wilmington (North Carolina) Other, United States of
America
United States ot oceania Guam Pago Pago Other, United States of
Oceania
Uruguay Montevideo Other ,Urugu,ay
Vanuatu Port Vila Other, Vanuatu
- 13 -
Venez uela El Guamach e La Guira Maraca ibo Puerto Cabello Other, Venezuela
Vietnam Da -Nang Haiphong Ho Chi Minh City Vung Tau Other, Vietnam
Yemen Arab Republic Hodeidah Other, Yemen Arab Republi c
Yngoslavia RiJeka (}ther, Yugoslavia

PAR T B
GENERAL REVIEW
I. SHIPPING STATISTICS
In the third quarter of 1990, 4 982 ships with a total capacity of 29.5 million NRT arrived Hong Kong, representing an increase of 377 (or 8%) in number and of 1.1 million NRT (or 4%) in capacity over the third quarter of 1989. During the same period, departing ships numbered 4 947 with a total capacity of 29.1 million NRT, representing an increase of 349 (or 8%) in number and of 1.0 million NRT (or 4%) in capacity over the third quarter of 1989. The above are summarized in Table A below.
Table A: Summary of shipping statistics in the third quarter of 1990
Change % change over over
~ Q3 89 Q3 89
Incoming shi}!s Number 4 982 +377 +8% Total capacity (Mn. NRT) 29.5 +1.1 +4%
Outgoing shi~s Number 4 947 +349 +8% Total capacity (Mn. NRT) 29.1 +1.0 +4%
In the following analyses, comparisons are focused on changes between the third quarter of 1989 and the third quarter of 1990.
- 14 -
1 . By first/last country of call
Major changes in the number of incoming/ outgoing ships analysed by first/last country of call are summarized below. Further details with country and port breakdowns can be found in Table 2.
First country of call China Taiwan Macau Singapore Malaysia Japan U.S.A. South Korea
Incoming shi~s
Number in Q3 90 1 518
970 275 381
84 501 100 175
Change over Q3 89
+96 +80 +58 +47 +32 +23 -19 -24

Last country of call China Japan Macau Singapore Thailand Australia
Outgoing ships
Number in Q3 90 1''' 481
328 270 578 178
78
Change over Q3 89
+70 +58 +54 +49 +38 -11
Chart 1 shows the number and share of ships arrlvlng from/departing for the major countries of call in the third quarter of 1990.
2. By type of shipping service
Of the incoming ships, liners increased by 209 in number and tramps increased by 92. Of the outgoing ships, liners increased by 210 in number and tramps increased by 72. [Table 3]
3. By ship type
Major changes in the number of incoming and outgoing ships anilysed by ship type are summarized below. Further details are given in Table 4.
Ship type Container vessel Conventional cargo vessel Gas carrier/tanker Semi-container vessel Roll -on/roll-off
Changes (Q3 Incoming ships
+213 +116
+36 +21 +12
90 over Q3 89) i'Outgoing
ships +208
+76 +37 +15 +13
- 15 -
CHA RT 1 .'
NU MBER AND SHARE OF SH IPS ,jR RtYING FROM/DEPART I NG FO R THE MA.iOR COU NTRIE S OF CA Ll IN THE 3RD QUARTE R OF 199 0
TAIWAN '9 ,5% 970
JAPAN 10,1% 501
SINGAPORE 7,7% 381
FIRST COUNTRY OF CALL
MACAU 5.5% 275
TAIWAN 20. 7% 1023
'r
SING APORE 117% 578
PHILIPPINES 4.2% 207
LAST COUNTRY Of CALL
CHINA 30,5% 1518
OTH ER COUN TRIES 19,2%
955
CHINA 29.9% 1481
OTHER OOU NTR IE S 18.0 %
890
MACA U 5,5% 186 2 70
PH ILIP PINES 3.9% 1 9 1

4. By Flag
The following shows the major changes in the number of incoming and outgoing ships analysed by flag . Further details can be found in Table 5.
Flag Panamanian Chinese Liberian Norwegian South Korean Taiwanese Japanese Dutch
Changes (Q3 90 Incoming ships
+102 +99 +58 +20 +20 +15 -11 -16
over Q3 89) Outgoing ships
+92 +88 +63 +21 +17 + 9 - 12 -17
5. By ship capacity
6.
The average capacity of all i~coming ships in the third quarter of 1990 was 13 986 DWT. Major changes in the number of incoming and outgoing ships analy'sed by ship capacity are summarized below. Further details are given in Table '6.
Changes {Q3 90 over Q3 89) Incoming Outgoing
Ship capacity (DWT) ships ships
Below 2 000 +120 +121 2 000 - 3 999 +57 +45
12 000 12 999 +42 +41 18 000 - 19 999 +36 +35
5 000 - 5 999 +36 +34 7 000 - 7 999 -17 -23
By length of time in port
About 68% of the departing ships stayed in Hong Kong for less than 2 days. [Table 71
11. PORT AND CARGO STATISTICS
Port and cargo statistics are compiled based on a sample of the consignments listed in ocean cargo manifests. In the third quarter of 1990, the total tonnage of cargo discharged in Hong Kong from incoming ships, including imports and inward transhipment cargo, was estimated to be 12.6 Mn. tonne and represented an increase of 2% over the same quarter in 1989. During the same period, the total tonnage of cargo loaded onto outgoing ships, including domestic exports, re- exports and outward transhipment cargo, was estimated to be 5.3 Mn. tonne and represented an increase of 3%. Of the cargo discharged from incoming ships, 89% in terms of tonnage was imports and 11% was transhipment cargo, and 35% in terms of tonnage
,was containerized cargo. Of those loaded onto outgoing ships, 66% in terms of tonnage was exports (including domestic exports and re-exports) and 34% was transhipment cargo, and 80% in terms of tonnage was containerized cargo.
Table B shows the tonnage of cargo discharged and loaded in the third quarter of 1990 for the four types of shipment, the percentage changes when compared with the third quarter of 1989 and the extent of containerization.
Table B: Summary of port and cargo statistics in the third quarter of 1990
Direct shipment
Tranship-ment
Total
- 16 -
Imports Exports
Inward Outward
Q3 90 (Mn. tonne)
11.2 3.5
1.4 1.8
Discharged from 12.6 incoming ships
Loaded onto 5.3 outgoing ships
% change over Q3 89
+5% +9%
- 16% -7%
Extent of containerization
30% 73%
78% 93%
+2% 35%
+3% 80%

The coefficients of variation (i.e. standard errors of the statistics divided by the statistics) of the port and_cargo statistjcs at the aggregate level published in this report are as follows ;-
Gross weight
Cubic measutement
Direct Shipment Imports Exports
0.3% 0.5%
,0 . 6% 0.8%
Transhipment Inward Outward
1. 3% 1.1%
1.6% 1.4%
This shows that errors due to sampling for such aggregate statistics analysed by type of shipment ranged from about ±0.6% to ±3.1% at the 95% confidence level.
Detailed statistics are subject to larger sampling errors. With a few exceptions, the coefficients of variation of the statistics published in Tables 8-21 are less than 5%.
In the following analyses, comparisons are focused on changes between the third quarter of 1989 and the third quarter of 1990.
1. Direct shipment (or seaborne imports/exports)
1.1 By country of loading/discharge
The major countries of loading for seaborne imports in tonnage terms were Singapore (which accounted for 16%), Japan (13%), China (11%), Australia (11%), South Africa (10%), Taiwan (8%) and the U.S.A. (7%). [Table 8 (AU
- 17 -
The major countries of discharqe for seaborne exports in tonnage terms were the U.S.A . (which accounted for 21%), China (15%), Taiwan (12%), ' Japan (6%) and Singapore (5%). (Table 8(B)]
The major countries of loading/discharge for seaborne imports/exports and their share in tonnage terms in the third quarter of 1990 are illustrated in Chart 2.
Comparing between the third quarter of 1989 and the third quarter of 1990, the total tonnage of seaborne imports rose by 5%, while that of seaborne exports rose by 9%.
Major changes in the tonnage of seaborne imports and exports analysed by country of loading/discharge are summarized below. Further details can be found in Table 8.
Seaborne Seaborne imports by exports by country of % change country of % change loading over Q3 89 discharge over Q3 89 Indonesia +215% West Germany +60% U.S.A. +48% Netherlands +34% Australia +38% United Kingdom +27% Taiwan +16% Japan +25% Thailand +12% Taiwan +20% Japan -15% Singapore +15% South Africa -23% China -16%

CH ART 2
MAJ OR COU NTRIES Of LOADING / DI Sr,HARGE FOR SEABORNE IMPORTS/ E X PORTS AND THEIR SHARE IN TONNAGETERMS IN THE aRD QUARTER OF 1990
SEABOR NE IMPORTS
JAPAN 13.1%
A U S T RA LI A f.:::::::::::::::::::!!! 10.7%
SOUTH AFRICA 10.2%
TAIWAN 7.6%
U.S.A. 6 .5%
SI NGAPORE 15.9%
OTHER COUNTRIES 24.5%
SEABORNE EXPORTS (INCLUPING POMESTIC EXPORTS AND RE-E XPORTS)
JAPAN 5.6%
SINGAPORE 53%
WEST GERMANY 4 .3%
SOUTH f,OREA 34 %
CHINA 15.1%
OTHER COUNTRIES 3:3 1'l
;... 18 -
1.2 By country of loading/discharge by containerization
In terms of tonnage, containerized cargo accounted for 30% of seaborne imports, and 13% of seaborne exports. The total tonnage of containerized seaborne imports in the third quarter of 1990 rose by 23% over the third quarter of 1989. During the same period, the total tonnage of containerized seaborne exports rose by 15%.
The extent of containerization for seaborne imports and exports analysed by country of loading/dischaige is shown below. Further detftils with country and port breakdowns can- be found in Ta'ble 9.
Seaborne im:Qorts Seaborne eX:Qorts Extent of Extent of container- container-
Country of ization Country of ization loading in Q3 90 discharge in Q3 90 West Germany 91% United Kingdom 100% Netherlands 80% U.S.A. 100% Taiwan 80% West Germany 100% U.S.A. 16% Australia 100% South Korea 16% Netherlands 99%
Philippines 98%

1.3 By principal commodity
Table 10 presents the analysis of seaborne imports/exports by principal commodity . In tonnage terms, 58% of the seaborne imports was bulk cargo (i ncluding dry bulk and liquid bulk), whereas bulk cargo accounted for some 24% of seaborne exports.
The principal commodities imported/exported by sea and their share in tonnage terms in the third quarter of 1990 are shown in Chart 3.
Major changes in the tonnage of seaborne imports and exports analysed by principal commodity between the third quarter of 1990 and the third quarter of 1989 are summarized below.
Seaborne imports
Principal commodities Cork and wood manufactures (excluding
furniture) Crude animal & vegetable materials, n.e.s. Organic chemicals Paper, paperboard and articles of paper
pulp, of : paper or of paperboard Art i ficial resins and plastic materials Cement and cement clinker
Seaborne exports
Principal commodities Plastic manufactures, n . e.s. Travel goods, handbags and similar
containers Footwear Toys Garments of mixed materials or other
materials, n.e.s. Pulp and waste paper
% change over Q3 89
+94%
+49% +42% +39%
+33% -26%
% change over Q3 89
+42%
+34% +33% +27% +25%
- 23%
CHART 3 PRI NC IPAL COMMODI TIES IMPORTED/EXP ORTED BY SEA AND
TH E I R S HARE IN T ONNAGE TERMS IN T HE 3RD QUARTER OF 1990
S E ABORNE IMPORTS
COAL. COKE AND
BR IQUET TES
PEH,O LEUM. PETROLEU M PRODUCTS AND RELATED MATERIALS
CE M ENT AN D CE M ENT
CLINKER
I RO N AND STEEL
AR TI F I C I AL RE S I NS
AND PLAS TI C
M ATE RI A LS
28. 2%
o 2 4 6 8 _ 10 12 14 16 18 20- , 22 24 26 28 30
SHARE IN CARGO TONNAGE (%)
SEABORNE EXPORTS (INCLUDING DOMESTIC EXPORTS AND RE-EXPORTS)
PE T RO L E U M. PET ROL E U M \.-y,~~"'--"--'~~~~"'--"--'~"TT""""'"77',...,..-,~-y-,-"'--"--'~"TT""""~~0'77-rrT'>
PR O DU C TS A N D RE LATE D
MATE R IA LS
TOYS
MISC E LLA NEOUS
MAN U FACT URED
A RTI CLES. N .E . S .
C RUD E A NIMAL AND
VEGETABL E M ATE R IALS:
N .E . S .
M E TA L LI FEROUS ORES
AN D M E TA L SCRAP
o 2 4 6 8 10 12
SHARE IN CARGO TONNAGE (%)
14.6~ .
16
- 19 -

1.4 By principal commodity by containerization
The extent of containerization for seaborne imports and exports analysed by principal commodity is shown below. Further details appear in Table 11.
Seaborne imports
Principal commodities Artificial resins and plastic
materials Other electrical and electronic
applicances and parts Paper, paperboard and articles of
paper pulp, of paper or of paperboard
Miscellaneous manufactures of metal and non-metallic minerals, n.e.s.
Seaborne exports
Principal commodities Cotton garments Footwear .. Travel goods, handbags and similar
containers Toys Garments of mixed materials or other
materials, n.e.s. Plastic manufactures, n.e.s. Miscellaneous manufactured articles,
n.e.s.
Extent of containerization
in Q3 90 99%
92%
91%
88%
Extent of containerization
in Q3 90 100% 100% 100%
100% 100%
99% 99%
- 20 -
1.5 By country by principal commodity
Singapore was the largest country of loading for Hong Kong's seaborne imports, and the principal commodities imported were petroleum, petroleum products and related materials. Japan ranked second, from where cement and cement clinker, iron and steel and artificial resins and plastic materials were imported. Other important countries of loading were China (loading coal, coke and briquettes, and petroleum, petroleum products and related materials), Australia (loading coal, coke and briquettes), South Africa (loading coal, coke and briquettes), Taiwan (loading artificial resins and plastic materials, and cement and cement clinker) and the U.S.A. (loading paper, paperboard and articles of paper pulp, of paper or of paperboard, artificial resins and plastic materials and coal, coke and briquettes). [Table 12(A)]
The U.S.A. was the largest country of discharge for Hong Kong's seaborne exports, unloading toys, miscellaneous manufactured articles, n.e.s. and garments of mixed materials or other materials, n.e.s. China ranked second, unloading petroleum, petroleum products and related materials. Other important countries of discharge were Taiwan (unloading clay and kaolin, crude animal and vegetable materials, n.e.s. and metalliferous ores and metal scrap), Japan (unloading petroleum, petroleum products and related materials) and Singapore (unloading vegetables and fruit). [Table 12 (B)]

1.6 By port by principal commodity
Singapore was the largest port of loading for Hong Kong's seaborne imports, and the principal commodities imported were petroleum, petroleum products and related materials. Richards Bay ranked second, from where coal, coke and briquettes were imported to Hong Kong. Other important ports of loading were Qinhuangdao (loading coal, coke and briquettes), Abbot Point (loading coal, coke and briquettes), and Newcastle (loading coal, coke and briquettes). [Table 13(A)]
Keelung was the largest port of discharge for Hong Kong's seaborne exports, unloading clay and kaolin, crude animal and vegetable materials, n.e.s. and stone, sand and gravel. Other important ports of discharge were Long Beach (unloading toys, footwear and miscellaneous manufactured articles, n.e.s.), Los Angeles (unioading toys and garments of mixed materials or other materials, n.e.s.) and Singapore (unloading vegetables and fruit). [Table 13(8)]
1.7 ~ principal commodity by port
The principal commodities of Hong Kong's seaborne imports were coal, coke and briquettes, petroleum, petroleum products and related materials and cement and cement clinker. Coal, coke and briquettes were mainly imported from Richards Bay and Qinhuangdao, petroleum, petroleum products and related materials mainly from Singapore, and cement and cement clinker mainly from Ube, Tsukumi and Saiki. [Table 14(A)]
The principal commodities exported from Hong Kong by sea were petroleum, petroleum products and related materials (mainly to Guangzhou), ' toys (mainly to Long Beach and Los Angeles), miscellaneous manufactured articles n.e.s. (mainly to Los Angeles and Long Beach), and crude animal and vegetable materials, n.e.s . (mainly to Keelung and Kaohsiung). [Table 14(B)]
2. Transhipment cargo
- 21 -
2.1 By country of loading/discharge
The two major countries of loading for inward transhipment cargo were China (40%) and the U.S.A. (14%). [Table 16(A)]
The two major countries of discharge for Hong Kong's outward transhipment cargo were the U. S. A. (15%) and China (12%). [Table 16(B)]
The major countries of loading/discharge for inward/outward transhipment cargo and their share in tonnage terms in the third quarter of 1990 are illustrated in Chart 4.
Comparing between the third quarter of 1989 and the third quarter of 1990, the total tonnage of inward transhipment cargo dropped by 16%, while that of outward transhipment cargo dropped by 7%.
Major changes in the tonnage of inward and outward transhipment cargo analysed by country of loading/ discharge are summarized below. Further details can be found in Table 16.
Inward transhipment cargo by country of loading Singapore Austr.:alia Japan Taiwan Thailand Netherlands U.S.A.
% change over 03 89
+42% +39% +27% +18% -29% -32% -38%
Outward transhipment cargo by country of discharge Malaysia ~ingapore Netherlands Philippines China
% change over 03 89
+46% +18% - 16% -22% - 41%

CHAR T 4 MAJOB COUNTBIES OF LOADING / DIS CHARGE fOB INMBp/ OUTYt\BP TBANSHIPMENT
CABGO AN P T HE I B SH ABE I N TONNAGE TEBMS IN THE 3BP QUABT EB OF , QQD
INWARD TRANSHIPMENT CARG O
U.S.A. 14 .2%
TAIWAN 6 .0%
JAPAN 4.4%
SINGAPORE 4.3%
WEST GERMAN Y 3.5%
NETHER L ANDS 2.4%
CHI NA 39.8%
OTHER COUNTRIES
25 .5%
OUTWARD TRANSHIPMENT CARGO
SINGAPORE 7.4%
TAI WAN 6 .3%
PHI LIPPINES 5.7%
WEST GERM AN Y 5.4%
JAPAN 4 .7%
CHINA 12 .0%
OT HER COU NT RIES 43.7%
- 22 -
2.2 By country of loading/discharge by containerization
In terms of tonnag-e, 78% of inward transhipment cargo was containerized, whereas the extent of containerization for outward transhipment cargo was 93%. The total tonnage of containerized inward transhipment cargo in the third quarter of 1990 decreased by 4% over the third quarter of 1989. During the same period, the total tonnage of containerized outward transhipment cargo ' decreased by 1%.
The extent of containerization for inward and outward seaborne transhipment cargo analysed by country of loading/discharge are shown below. Further details with country and port breakdowns appear in Table 17.
Inward transhi~ment cargo Outward transhi~ment cargo Extent of Extent of container- container-
Country of ization Country of ization lo~ding i.n 23 90 discharge in 23 90 U.S.A. 100% U.S.A. 100% Australia 100% United Kingdom 100% Macau 100% West Germany 100% West Germany 100% Japan 100% Singapore 99% Taiwan 99% Netherlands 99% Netherlands 98% Philippines 98% Philippines 96% Taiwan 95% China 92% Japan 87% Singapore 89%
2.3 By I2rinci~al commodity
Cargo transhipped through Hong Kong was mainly general cargo, accounting for 91% of inward transhipment cargo and 92% of outward transhipment cargo.

Chart 5 shows the principal commodities transhipped through Hong Kong by sea and their relative share in tonnage terms in the third quarter of 1990.
Major changes in the tonnage of inward and outward transhipment cargo analysed by principal commodity in t he third quarter 1990 over the third quarter of 1989 are summarized below. Further details can be found in Table 18.
Inward transhipment cargo
Principal commodities
Cork and wood manufactures (excluding furniture)
Canned food Organic chemicals Textile fibres Crude animal and vegetable materials, n.e.s. Artificial resins and plastic materials
Outward transhipment cargo
Principal commodities
Paper, paperboard and articles of paper pulp, of paper or of paperboard
Garments of mixed materials or other materials, n.e.s.
Crude animal and vegetable materials, n.e.s. Organic chemicals Textile fibres
% change over Q3 89
+175%
+ 9% -21% -27% -32% -34%
% change over Q3 89
+25%
+11%
-25% -26% -38%
C HART 5 PRINCIPAL COMMODITIES TRANSH I PPED THROUGH HONG KONG BY SEA
AND THEIR SHARE IN TONNAGE T E RMS IN THE 3RO QUART ER OF ~990
INWARD TRANSHIPMENT CARGO
ORGAN I C C H E MI CALS
OTHER MACHINERY
A N D EO UI PMENT
A ND PAR TS. N .E S .
M I SC MANUFAGl URES OF
M E TAL & N O N - M E TAL LI C
MIN E RALS. N . E. S .
ART IF I CIA L R ES IN S
AN D P L A S T I C
M ATERIALS
PA PE R . PAPE R BOARD
AN D AR T I C LES
o ~
OUTWARD TRANSHIPMENT CARGO
MI SC MANUFACTURES OF
M ETAL & NON - METALLIC
M I NER AL S. N . E . S .
O THER MACHIN E RY
AND EOUIPMENT
AND PARTS . N. E .S .
O RG ANI C C HEMI C ALS
IN O RG ANI C C HEMI CALS
CRUDE ANIMAL AND
VEGETABLE MATERIALS .
N . E S .
- 23 -
o ~
2 3 4 6 7
SHARE IN CARGO TONNAGE(')
2 3 4 5 6 7
SHARE IN CARGO TONNAGE (') .
8
8.1%
8

2.4 By principal commodity by containerization
The extent of containerization for seaborne inward and outward transhipment cargo analysed by principal commodity are shown below. Further details appear in Table 19 .
Inward transhipment cargo
Principal commodities Artificial resins and plastic
materials Organic chemicals Paper, paperboard and articles of
paper pulp, of paper or of paperboard Inorganic chemicals Canned food
Extent of containerization
in Q3 90 98%
97% 87%
79% 76%
Outward transhipment cargo
Principal commodities Artificial resins and plastic
materials Organic chemicals Canned food Inorganic chemicals Miscellaneous manufactures of metal
and non-metallic minerals, n.e.s. Crude animal and vegetable materials,
n.e.s.
Extent of containerization
in Q3 90 99%
99% 99% 93% 92%
91%
- 24 -
2.5 By c?untry by principal commodity
China and USA were the two major countries of loading/discharge for transhipment cargo. Transhipment cargo from China were mainly miscellaneous manufactures of metal and non-metallic minerals, n.e . s., other machinery and equipment and parts, n.e.s., and canned food, while those to China were mainly organic chemicals, artificial resins and plastic materials, and textile fibres. On the other hand, transhipment cargo from the U. S.A. were mainly organic chemicals, pulp and waste paper, and artificial resins and plastic materials, while those to the U.S.A. were mainly garments of mixed materials or other materials , n.e.s. and toys . [Table 20]
2.6 Outward transhipment statistics by country of . discharge and country of loading
Attempt has been made to analyse the flow of seaborne transhipment cargo by their country of loading and country of discharge, based on the information reported in the outward cargo manifests. The -cove~age is, however, limited to those transhipment cargo which are carried out of Hong Kong by ocean-going vessels, irrespective of the means of transportation by which they are carried into Hong Kong. Statistics so compiled do not include those transhipment cargo which are carried into Hong Kong by ocean-going vessels (and other means of transportation) but are not carried out of Hong Kong by ocean-going vessels.

Based on the information reported in the outward ca rgo manifests, about 37% of the cargo transnipped onto ocean-going vessels to China was loaded in the U.S . A., while 46% of the cargo transhipped to the U.S.A. was loaded in China. Besides providing transhipment services for China and the U.S.A., Hong Kong also transhipped cargo from China to Singapore, the Philippines, West Germany, Japan, the Netherlands and Thailand, and from the U.S.A. to Singapore, Taiwan , the Philippines, Thailand and Malaysia. [Table 21]
Ill . Supplementary Statistics
Table C presents the tonnage and share of cargo discharged/loaded by mode of transport in the third quarter of 1990 .
Table C: Tonnage and share of cargo discharged/loaded by mode of transport in the third quarter of 1990
Mode of Cargo % Cargo % transpor t Discharged share Loaded share
( '000 tonne) ('000 tonne)
Ocean 12 644 78% 5 254 70% River 1 735 11% 750 10% Road 1 255 8% 1 236 17% Rail 487 3% 99 1% Air 85 1% 123 2%
Total 16 206 100% 7 463 100%
Source Ocean - Census & Statistics Dept . River - Marine Dept. Road - Customs & Excise Dept. Rail - Kowloon-Canton Railway Corporation. Air - Civil Aviation Dept.
Table D ranks leading container ports of the world by container throughput in terms of twenty- foot equivalent unit (T.E.U.>.
Table D: Ranking of container ports of the wofld by container throughput in terms of T.E.U.
Por t 1989 Rank 1988 Rank Hong Kong 4 463 709* 1 4 033 427 1 Singapore 4 360 000 2 3 375 000 2 Rotterdam 3 603 161 3 3 288 829 3 Kaohsiung 3 382 512 4 3 082 838 4 Kobe 2 458 964 5 2 263 214 5 Busan 2 313 000 6 2 065 500 7 Los Angeles 2 056 980 7 1 652 070 9 New York 1 988 098 8 2 089 530 6 Keelung 1 771 908 9 1 761 599 8 Hamburg 1 727 609 10 1 621 615 10
* Revised figure. Source Containerization International, Sept. 1990 Ed.
Table E compares the container throughput of Hong Kong, Singapore and Kaohsiung up to the third quarter of 1990.
Table E: Comparison of container throughput (in T.E.U.> for Hong Kong, Singapore and Kaohsiung
Port Hong Kong Singapore Kaohsiung
23 1990 1 414 544 1 342 900
887 270
January - September 1990 3 745 952 3 826 000 2 585917
Source: Individual port authorities.
- 25 -

PAR T C
TAB LE 1 (A) INCOMING SHIPS ~N~LYSED py REGION FOR 3RD QUARTEi< 10 9 C - INWARD
REGION
NORTH AMERICA
WESTERN EUPOPE
SOVIET UNION AND EASTERN EUROPE
CENTRAL AND SOUTH AMERICA
MI DOL E EA S T
AS I A
AFRICA
AUSTRALASIA AND OCEANIA
PORTS NOT IDENTIFIED
TOTAL
3R D OUARTER 199 G JANUARY TO
NUMBER OF
SHIPS
1/)6 125)
69 49)
16 32)
22 34)
32 27)
L 424 4 082 )
7S 86)
82 80)
156 90)
4 982 4 605)
DWT
('DaD)
3 854 4 457>
2 237 1 762)
198 515)
574 1 009)
977 733)
54 888 50 924)
2 704 :5 470)
2 470 1 806)
777 932)
69 679 ( 65 608)
C A P A C I
GRT
( '0(0)
3 435 3 969)
1 979 1 578 )
140 346)
369 616)
774 647>
43 312 40 815)
• 1 843 2 404 )
1 584 1 224)
1 416 858)
54853 ( 52 456)
T Y
NRT
('000)
1 694 1 976 )
026 755)
74 188 )
222 51B)
409 307)
23 317 22 ('125 )
1 027 1 362>
943 722 )
745 481>
29 457 28 319)
NUM8EQ OF
SHIPS
332 391)
19 ('\ 163 )
5fl 81)
57 82>
77 85)
12 617 ( 11 615)
202 241)
225 222)
421 277>
14 177 (13 157>
FIGURES IN BRACKETS ARE STATISTICS FOR CORRESPONDING PERIOD IN 198Q
- 26 -
DWT
( '000)
11 965 13 858)
6 451 5 695)
702 1 215)
1 449 2 553)
2 263 ( 2 414)
154 353 ( 1'1 702)
7 522 9 420)
5 709 5 596)
5 368 3 354)
195 782 (185 808)
SFPTEMBER 1990
CAP A C I T Y
Gm
( • 000)
10 804 12 455)
5 735 5 072)
497 842)
911 527 )
1 740 2 t:l88 )
123 707 ( 113 663)
5 207 7 233)
3 865 3 603 )
4 301 3 059)
156 768 (149 543)
NRT
(' 00 ()
5 338 6 279 )
2 898 2 536 )
255 440)
546 1 066 )
956 1 034 )
66 074 61 128 )
2 911 :5 735)
2 262 2 186 )
2 414 1 565)
83 653 ( 79 969)

T ,.BLE 1
REGION
NORTH AMERICA
WESTERN EUROPE
SOVIET UNION AND EAS TERN EUROP E
CENTR AL AND SOUTH AM ERICA
MIDDLE EAST
AS I A
AFRICA
AUSTRALASIA AND OCEA NIA
PORTS NOT IDENTIFIED
TOTAL
(B) OUTGOING SHIPS ,. NALYSE D BY REGION FOR
3R D QUART ER 199 (}
NUMB ER OF
SHIPS
49 59)
41 44)
6 8 )
10 6)
31 19)
4 546 4 196)
32 53)
94 1 (15)
138 108 )
4 947 4 598)
C A
DW T
('COO)
1 775 2 24 3)
1 440 1 782 )
77 95)
225 124)
726 465)
58 0 82 53 909 )
952 1 977)
3 387 3 170)
2 233 1 441>
68 897 65 206)
P ,. C T Y
GRT
( 'Da D)
1 5r)3 ? 030)
250 573 )
48 78)
142 82)
534 322)
46 52 8 43 371)
715 581>
2 117 2 031)
490 135)
54 327 52 203)
NRT
(' 000)
707 956 )
658 852)
27 32 )
85 46)
294 18(1 )
24 826 23 448 )
383 763 )
278 190 )
892 677)
29 149 28 145)
3RD Q UAR HR 1990 - OUTW"RD
NUMBER OF
SHIPS
153 186)
115 135 )
21 51)
21 21'»
75 56 )
13 0(19 (12 (07)
91 165)
279 287)
4Q2 270)
14 167 (13 177)
JANUARY TO
DWT
( • 000)
5 929 6 700)
4 215 5 122)
262 596)
447 449)
1 724 1 503 )
164 655 (152 664)
2 62!! 5 763)
9 018 9 432)
6 218 3 517>
195 089 ( 1 85 746)
S"PTEMBER 1990
C A P A C I
GRT
( , 000)
5 008 6 (137)
3 742 4 599)
223 466)
296 306 )
300 114 )
133 676 (123 836)
1 873 4 505)
5 700 5 901 )
4 437 2 713)
156 255 (149 477)
T Y
FIGURES IN BRACKF-TS ARE STATISTICS FOR CORRESPONDING PERIOD IN 1989
- 27 -
N RT
(' 00 ()
2 384 2 906 )
1 9 ;17 2 369 )
93 213)
173 183 )
690 579)
70 879 66 211>
1 066 2 294 )
3 538 3 575)
2 630 1 622 )
83 370 79 952)

TABLE 2 (A) INCOMING SHtpS ANALYSED BY SELECTED FIRST COUNTRY AND PORT OF CALL FOR 3RD ~UARTER 1990 - INWARD
3RD QUARTER 1990 JANUARY TO S ~PTEMB ER 199 Cl
NUMBER C A P A C I T Y NUMBER CAP A C I T Y SELECTED FIR S T CO UN TRY OF OF AN D PORT OF CALL SHIPS DWT GRT NRT SHIPS DWT GRT NRT
( 'ODD) ( '(00) C' 000) (' 000) ( • 000) ( • 00 Co)
AU ST R All A S5 2 a34 268 758 148 4 527 2 981 1 747 54) 1 458) 970) 573 ) 154) 4 679) 2 991> 1 826 )
SYDNEY 16 267 199 110 49 747 632 330
CHINA 1 518 10 594 7 309 4 314 4 443 29 975 21 152 12 240 1 422) C 9 816) 6 868) 4 Q~8) 3 963) 28 304) 19 852 ) 11 490) D ALIAN 57 738 434 272 161 1 926 1 242 725 FUZ HOU 39 129 9('1 50 124 459 329 177 GUANGZHOU (INCL. 212 567 001 597 634 4 315 2 802 638 HUANGPU)
ff'AIKOU 61 98 112 57 16 g 317 365 184 NANJING 15 106 59 29 51 422 237 124 QINGDAO 71 683 460 27(1 199 1 996 1 343 786 SHANGHAI 232 2 274 675 985 678 6 986 5 134 3 016 SHANTOU 99 169 360 179 324 595 1 219 614 TIANJIN XINGANG 97 042 718 417 283 3 151 2 248 252 X I A MEN 92 497 336 173 267 1 435 967 503 ZHANGJIAGANG 27 187 138 77 78 578 42(1 245 ZHANJ IANG 86 534 302 210 234 1 19r' 629 425 OTH ER,CH 1 NA 41')0 2 016 297 784 1 155 4 924 3 236 9 (6
INDONESIA 73 974 620 382 208 2 490 1 595 986 54) 690) 463) 283 ) 154) 1 607> 1 054) 637> JAKARTA 16 159 110 66 31) 299 203 123 o T H ER , I N DON E S H 34 367 227 131 108 1 021 633 386
JAPAN 501 9 688 8 123 4 362 1 418 26 681 23 225 12 206 478) C 9 489) 8 111> 4 272 ) 1 428) 25 825) 22 719) 11 727> KOB E 145 3 858 3 354 1 630 436 11 176 9 796 4 796
NAGOY A 26 380 361 178 72 817 777 387 OS A KA 57 246 004 460 140 3 226 2 588 1 245 TOKYO 34 965 882 468 80 2 203 2 320 1 125 YOKOHAJWlA 101 11 386 '1 094 862 278 3 997 3 182 2 551 OTH ER,J APAN 81 961 876 418 236 2 460 2 503 950
MACAU 275 259 186 89 680 666 475 227 217) 207) 158 ) 73 ) 617> ( 592) 434) 204 )
- 28 -

TABLE 2 (A) (CONT' 0)
3RO QUMT ER 1990 JANUARY TO S EPT EMB ER 1990
NUMB ER C A P A C I T Y NUMBER CAP A C I T Y SELECTED FIRST COUNTRY OF OF AND PORT OF CALL SHIPS DWT GRT NRT SHIPS DWT GRT NRT
( ·000) ( '000) (' 000) ( '1)00) ( • 000) ('(lOO
MAC AU 275 259 186 89 68 0 666 475 227
MALAYSIA 84 017 844 430 238 2 631 2 167 127 52) 513) 425 ) 221 ) 165) 1 729) 1 343 ) 685) PORT KELANG 28 597 583 267 65 1 347 1 342 619 OTH ER,MALAYS 1,1. 22 188 122 74 45 374 231 144
PHI LI PP IN E S 207 1 776 1 387 778 546 4 633 3 648 2 026 211 ) 1 804) 1 434) 789) 555) 4 674) 3 661> 2 027) M AN IL A 163 1 520 1 2 !17 683 4QQ 3 977 3 173 1 764 OTHER,PHILIPPINI'OS 34 234 170 90 11 (j 541 411 224
REPUBLIC OF KOREA 175 3 326 2 814 1 495 538 10 138 8 620 4 683 (S OUTH KOR EA) 199) 3 859) 3 385) 1 771 ) 587> ;10 655) 9 023 ) 4 7 Q2) BUS AN 158 3 015 2 610 1 385 474 9 075 7 952 4 286
REPUBLIC OF SCUTH 47 1 855 175 679 134 5 407 3 415 2 C18 AF R I C A 53) 2 432) 465) 895) 137> 6 134) 4 196) 2 281 ) DURBAN 21 483 363 184 62 1 340 i D41 545 RICHARDS BAY 18 239 704 436 56 3 743 2 095 1 327
SIN GA PO R E 381 10 315 8 535 4 388 126 3D 233 25 056 12 916 334) 9 633) 8 "15) 4 306 ) 98D) 26 307) 21 783 ) 11 7 OS) SI N GAPOR E 381 10 315 8 535 4 388 126 30 233 25 056 12 916
SR I LANKA (CEYLON) 15 410 351 164 40 1 055 910 418 18) 444 ) L 06 ) 176 ) ( 48 ) 1 103 ) 1 004 ) 440) COLOMBO 15 410 351 164 4n 1 055 910 418
TAIWAN 970 14 85C 11 995 6 257 ? 708 40 659 33 301 17 1 99 890) 12 8 27) 10 418) 5 479) 2 579) 36 241) 29 613 ) 15 687) KAOHSIUNG 514 7 866 6 489 3 318 1 403 20 714 17 175 8 843 K EELUNG 368 6 129 4 939 2 611 1 084 17 875 14 751 7 542 T AI CHUNG 66 661 433 261 176 1 716 1 142 690
THAILAND 107 1 068 726 427 320 3 267 2 227 1 308 ( 106 ) 1 102) 773 ) 438 ) 277 ) 2 872) 1 983 ) ( 1 128 ) BANGKOK 103 995 680 402 314 3 .. 158 2 158 1 269
- 29 -

HBL E 2 (A) (CONT' D)
3RD QUAPT ER 1990 J ANU ARY TO S EPT EI'IB ER 199 -)
NUMBER C A P A C 1 T Y NUMBER CAP A C I T Y SELECTED FIRST COUNTRY OF OF AND PORT OF CALL SHIPS DWT GRT NRT SHIPS DWT GRT NRT
( '000) ('aDO) (' 000) (t 000) (' 000) (t 00.0
UNITF.D STATES OF 100 3 656 3 317 1 624 315 11 359 1D 447 5 117 AM ER !CA 119) 4 251) 3 845 ) 1 903 ) 376) 13 299) ( 12 132) 6 078)
OAKLAND 35 1 525 1 412 628 124 5 227 4 842 2 186 SEATTLE 32 956 844 477 88 2 582 2 253 1 317
VIETNAM 94 332 244 121 263 898 655 333 82) 3(3) 229 ) 133 ) 194) 796) 566) 3 C3)
HO CHI MINH CITY 53 179 117 63 141 41(1 275 150 OTHER,VIETNA!'1 15 34 25 12 53 131 91 49
OTH ER COUNTRIES 38 0 7 523 5 960 3 188 1 052 21 164 16 894 9 1·01 316) 6 738) 5 492) 2 999) 943) 20 992) 17 190) 9 Olo9)
TOTAL 4 982 69 679 54 853 29 457 14 177 195 782 156 768 83 653 ( 4 605) 65 608 ) 52 456 ) 28 319 ) (13 157) (185 808) (149 5(3) 79 969 )
FIGURES 1N BRACKETS ARE STATISTICS FOR CORRESPONDING PERIOD IN 1989
- 30 -

TAB L E 2 (B) OUTGOING SHIPS ANALYSED BY SELECTED LAST COUNTRY AND PORT OF CALL FOR 3RD QUARTER 1990 - OUTWARD
3R 0 QUARTr::R 1990 Jf\NUARY TO SEPTEMBER 1990
NUMBER C A P A C I T Y NUMBER CAP A C I T Y SELECTED LAST COUNTRY OF OF AND PORT OF CALL SH IPS OWT GRT NRT SHIPS DWT GRT NRT
( '000) (. '.)00) (a 000) ( a 000) (' 000) (. 00 ()
AUSTRALIA 78 3 157 935 1 179 222 8 269 5 109 3 221 89) 3 023) 913) 1 134) 245) 9 024 ) 5 564) 3 411 ) SYDNEY 12 332 290 136 32 879 773 374 OTHER,AUSTRALIA 37 1 814 017 666 113 5 261 2 966 1 933
CHINA 1 481 8 654 6 274 3 603 4 350 24 632 18 060 10 322 1 411) 8 548) 6 176 ) 3 659 ) 3 921) 24 61 Cl) 17 986) 10 350)
D A L IAN 59 722 463 272 151 '1 616 1 047 621 F U Z HO U 45 161 112 64 117 392 269 153 GUANGZHOU (INCL. 202 343 894 517 609 3 355 2 267 1 297 HUANGPU) HAIKOU 67 126 129 66 188 370 399 204 NANJING 28 218 143 75 63 473 304 151 Q IN GD AO 56 404 282 160 172 1 487 1 039 627 SH A NGHA I 201 700 343 745 646 5 530 4 339 2 431 SHANTOU 111 214 403 2 ~5 345 704 1 311 670 TI A NJ I N X I NG A N G 81 794 537 317 253 2 650 1 827 1 063 XIAMEN 86 513 349 184 254 1 416 972 499 Z HANGJ IA6ANG 26 199 145 92 67 523 373 231 ZH A NJ I ANG 113 417 275 183 312 836 574 357 o T H ER , CHI N A 39G 547 r'21 600 106 3 927 2 536 1 479
I N DON ES lA 67 865 578 349 182 2 145 400 837 65) 684) 438) 260) 196) 1 979) 315) 771> JAKARTA 25 230 165 88 68 668 467 259 OTHER,INDONESIA 19 161 124 71 51 624 409 248
JAPAN 328 6 499 5 692 2 905 970 18 124 16 506 8 250 270) 5 149) 4 677) 2 310) 834) 14 695) 13 529 ) 6 663 ) KOB E 91 2 207 1 988 996 208 5 173 4 614 2 340 NAGOYA 33 604 537 269 92 1 378 1 252 629 OSAKA 22 431 360 170 70 1 315 1 105 6 C3 TOK YD 38 857 868 454 104 2 433 2 700 1 354 YOKOHAMA 79 480 116 616 245 4 531 3 422 1 966 DTH ER,J APAN 36 314 340 139 155 1 479 1 913 609
MACAU 270 253 183 87 673 639 456 217 216) 206) 157) 72) 617) 591) ( 434) 204)
- 31 -

TABLE 2 (B) (CONT'O)
3RO IWA~TER 1990 JANUARY TO S EPTEMB ER 1990
NUMBER CAP A C I T Y NUMBER CAP A C 1 T Y SELECTED LAST COUNTRY OF OF _ND PORT OF C~LL SHIPS OWT GRT NRT SHIPS OWT GRT NRT
( '000) ( '000) (' COO> (. 000) (. 000) ( '000)
MA C AU 270 253 183 87 673 639 456 2·17
MALAYSIA 115 189 765 756 34 0 3 644 2 345 2 297 103) 938) 609) 642 ) 345 ) ( 3 069) 1 933) 1 992 )
PORT KEUNG 44 407 273 182 108 985 657 955 OTH ER, MA L AYS lA 38 449 260 179 126 1 688 1 081 723 .'
PHILIPPIN ES 191 1 572 1 181 673 546 4 451 3 356 1 936 196) 1 489) 1 047) 600) 535 ) 4 274) 2 979) 1 7 8 3)
M AN IL A 16 0 1 453 1 077 616 431 3 818 2 878 1 66 0 o T H ER , PHI LI P PIN E S 28 79 69 36 108 544 412 234
REPUBLIC OF KOR EA 186 3 564 2 963 1 461 515 9 199 7 792 3 857 (SOUTH KOR EA) 160> 2 799) 2 484) 1 186 ) 444) 7 557) 6 255 ) 3 033 )
BUS AN 153 3 103 2 663 1 286 413 7 996 6 987 3 395 IN C HO N 2 8 377 253 144 78 876 606 :!50
SINGAPORE 578 14 519 11 , 46 5 935 1 638 41 292 33 144 17 058 529) 13 930) 11 020) 5 898) 1 427> 37 144) 30 214) 15 813)
SINGAPO RE 578 14 519 11 '46 5 935 1 638 41 292 33 144 17 058
SR I LANKA (CEYLON) 19 700 60 C' 322 60 2 207 1 915 0(3 10) 174) 159 ) 75) 29 ) 551) 502) 241)
COLOMBO 19 700 600 322 60 2 207 1 915 OC3
TA 1101 AN 1 023 17 840 15 211 7 765 2 917 51 465 43 935 22 350 1 009) 17 819) ( 15 185) 7 911> 2 967> ( 52 170) 44 636) 23 053)
HUALI EN 19 159 103 57 39 39C 250 142 I( AOHS lUNG 623 12 095 10 468 5 320 1 840 35 572 30 968 15 60 I( EELUNG 309 4 938 4 251 2 139 854 13 893 11 676 5 976 TAl CHUNG 64 563 339 218 159 1 406 913 557
TH AILAND 178 924 1 306 779 481 5 122 3 601 2 086 140) 555 ) 1 023 ) 596) 444 ) ( 4 447) 3 010) 1 709 )
BANGKOK 174 815 1 242 739 474 4 961 3 489 2 '{]21
UNITED STATES OF 43 593 1 379 636 . 127 5 026 4 399 2 020 AMERICA 51> 931> 1 799) 834 ) 174 ) 6 203) 5 697> 2 721)
- 32 -

TABL[; 2 (8) (CONT' D)
3R 0 QUART ER 1990 J ANU ARY TO SEPTEMBER 1990
NUMB ER C A P A C T Y NUMBER CAP A C I T Y SELECTED LA S T C OU NT R Y OF OF AN 0 PORT OF CALL SH IPS OWT GRT NRT SHIPS OWT GRT NRT
( '000) ( 'O!H:1) ('000) ( '000) ( , 000) (' 00 ()
LOS ANGELES 14 581 484 207 37 578 335 562
v I ETN AM 80 173 121 66 247 643 458 247 62) 345 ) 22C> 135 ) 161) 64 0) 415) 244 )
HAIPHONG 15 43 32 19 38 102 68 37 HO CHI MINH CIn 48 107 71 39 157 453 326 176
OTHER COUNTRIES 31 0 6 396 4 692 2 631. 899 18 230 13 779 7 667 287> 6 61 8 ) 5 296 ) 2 833 ) 838 ) 18 791) 15 008 ) 7 965 )
TOT AL 4 947 68 897 54 327 29 149 14 167 195 089 156 255 83 370 4 598) 65 206 ) 52 203 ) 28 145 ) (13 177) (185 746) (149 477) 79 952 )
FIGURES IN BRACKETS ARE STATISTICS FOR CORRESPONDING PERIOD IN 1989
- 33 -

TABLE 3 (A) INCOMING SHIPS ~NALYSED BY TYPE OF SHIPPING SERVICE FOR 3RD QUARTER 1990 - INWARD
3RO QUARTER 1990 J ANU ARY TO S EPTEMB ER 1990
NUMBER CAP A C I T Y NUMBER CAP A C I T Y OF OF
TYPE OF SHIPPING SERVICE SH IPS DWT GRT NRT SHIPS DWT GRT NRT
('QOO) ( '000) (' 000) ('ODD) ('000) (' 000
CONFERENCE LINER 342 24 146 21 319 '0 760 3 770 70 255 62 491 31 366
273) 24 685) 22 153 ) 11 175 ) 3 655) 68 663) 61 705 ) 31 196 )
NON-CONFERENCE LINER 628 24 844 20 225 10 514 4 662 69 619 56 834 29 679
488) 21 970) 17 934) 9 572 ) 4 3U» 62 810) 51 522) 27 244 )
TR AMP 161 15 615 9 890 6 202 3 316 41 675 27 181 16 787
069) 14 926) 9 772 ) 6 037> 3 136 ) 42 986) 28 629) (17 062)
OTHERS 851 5 r)75 3 419 981 2 429 14 233 10 262 5 821
775) " 026) 2 598) 1 535 ) - ( 2 r:l4Q) 11 348) 7 688) 4 467>
TOT AL " 982 69 679 54 853 29 457 14 177 195 782 156 768 83 653
4 605) 65 608) 52 456) 28 319) (13 157> ( 185 808) (149 543 ) 79 969 )
FIGURES IN BRACKETS ARE STATISTICS FOR CORRESPONDING PERIOD IN 1989
- 34 -

TABLE 3
TY PE OF SHIPPING SERVICE
co NF ERENC E LINER
NON-CONFERENCE LINER
TR AMP
OTHERS
TOTAL
(B) OUTGOING SHIPS ANALYSED BY TYPE OF SHIPPING SERVICE FOR 3RD QUARTER 1990 - OUTWARD
NUM B ER OF
SHIPS
337
265)
622
484)
140
068)
848
781)
4 947
4 598)
3RD QUART ER
DWT
( 'aDO)
24 082
24 588)
24 551
21 882)
15 120
14 711>
5 144
4 025)
68 897
65 206)
C A P
199 Cl
A C I
6RT
( '1)00)
21 306
21 985)
20 056
17 910)
9 576
9 725)
3 388
2 583)
54 327
52 203)
T Y
NRT
(' ~O'))
10 727
11 130 )
10 406
9 534)
6 042
5 960)
973
521)
29 149
28 145)
NUM8ER OF
SHIPS
3 761
3 627)
4 637
4 352)
3 295
3 135 )
2 424
2 063 )
14 167
(13 177)
JANUARY TO
DIIT
( '000)
70 224
68 366)
69 550
62 973)
41 351
42 744)
13 961.
11 663)
195 089
(185 746)
FIGURES IN BRACKETS ARE STATISTICS FOR CORRESPONDING PERIOD IN 1989
- 35 -
SEPTEMBER 1990
CAP A C I T Y
GRT
( '000)
62 537
61 393)
56 833
51 755)
26 964
28 5 Q9)
Q 920
7 820)
156 255
(149 477)
N RT
( , 00 C)
31 385
31 061)
29 647
27 I.-GO)
16 650
16 948 )
5 688
4 543 )
83 370
79 952)

TABL E 4 (A) INCO"lING SHIPS ANALYSED BY SHIP TYPE FOR 3RD QUARTER 1990 - INWARD
3RD QUARTER 1990 JANUARY TO SEPTEMB ER 1990
NUMBER CAP A C I T Y NUI'lBER CAP A C I T Y OF OF
SHIP TYPE SHIPS DWT GRT NRT SHIPS DWT GRT NRT
( 'aDo) ('ODD) (' (la~) ( • 000) ('ODD) ( , 000)
CONVENTIONAL CARGO VESSEL ()54 8 270 5 419 3 536 2 956 23 491 15 565 10 079 938) 7 929 ) 5 175 ) 3 372 ) 2 803 ) 23 946) 15 499) 10 133 )
S E ~ I - CO N H I N ER V E S S E L 288 3 860 2 685 597 853 11 383 7 936 4 706 267> 3 731) 2 593) 518 ) 803 ) 10 588) 7 480) 4 385 )
CONTAINER VESSEL 2 126 40 882 35 308 17 720 5 9Q4 115 326 100 178 50 252 1 913) 37 281) 32 766) 16 47Q) 5 442 ) (105 002) ( 92 353) 46 509 )
ROLL-ON/ROLL-OFF 113 1 309 1 423 657 320 3 894 4 252 1 952 101> 1 292) ( 1 354) 6E) 315) 3 846) 4 072) 1 966 )
OIL TANK ER 567 3 241 1 884 156 1 683 9 567 5 650 3 439 592) 3 736) 2 204) 383 ) 1 465) 9 988) 5 841> 3 600)
GAS CARRIER/TANKER 84 698 447 249 229 1 488 1 012 553 48) 163) 120) 66 ) 149) 657) 469) 259 )
CH::MICP.L CARRI::R/HNK::R 51 794 457 278 139 2 330 1 326 832 43) 777) 450) 276) 114) 1 918) 1 110) 677)
DRY BULK CA RRIER 339 7 175 4 476 2 669 939 ;18 809 12 182 7 029 342) 7 525 ) 4 876) 2 959) 9(1) 19 869) 13 180) 7 418 )
LOG/TIMBER CARRIER 61 468 297 231 155 1 200 748 539 51) ( 374) 235) 146) 162) 1 204) 750) 469)
OTHERS 299 2 983 2 457 1 363 999 8 295 7 919 4 272 310) 2 801) 2 683) 1 456 ) 003 ) 8 79C!) 8 788) 4 553 )
TOT AL 4 982 69 679 54 853 29 457 14 177 195 782 156 768 83 653 4 605 ) 65 608) ( 52 456) 28 319) (13 157> (185 808 ) (149 543 ) 79 969 )
FIGURES IN BRACKETS ARE STATISTICS FOR CORRESPONDING PERIOD IN 1989
- 36 -

HBLE 4 (B) OUTGOING SHIPS ANALYSED BY SH IP T YPi= FOR 3 RD QUARTER 1990 - OUTWARD
3~D QUARTER 1990 JANUARY TO SEPTEMBER 1990
NUMB ER CAP A C I T Y NUMBER CAP A C I T Y OF OF
SHIP TYPE SHIPS DWT GRT NRT SHIPS DWT GRT N RT
( 'ODD) ('000) (' 000) ( '000) ('ono) ( • 00 C)
CONVENTIONAL CARGO VESSEL 032 8 16(' 5 339 3 499 2 956 23 605 15 617 10 120 956) 8 131> 5 304 ) 3 452) 2 833) 24 144) 15 628) 10 2-C6 )
SEMI-CONTAINER VESSEL 280 3 755 2 598 554 850 11 320 7 876 4 679 265) ( 3 665) 2 543) 495 ) 806 ) 10 614) 7 489) 4 4 (9)
CONTAINER VESSEL 2 110 40 561 35 027 17 555 5 895 114 920 99 813 50 061 1 902) 37 020) 32 520) 16 344 ) 5 428) ( 1-04 792) 92 151> 46 4CO)
ROLL-ON /ROLL-OF F 114 348 474 676 321 3 93(1 4 287 1 966 101 ) 292) 354) 673 ) 317') 3 868) 4 090) 1 975)
OIL TANK ER 575 3 347 1 946 1 196 1 688 9 602 5 673 3 452 588) 3 652) 2 157) 1 351> 1 457> 9 898) 5 795) 3 567)
GA S CARRIER/TANKER 84 700 448 250 234 1 498 021 557 47) 160) 117> 66 ) 147) 653) 465) 258)
CHE MICAL CARRIERITANKER 52 797 460 28C 142 2 364 345 844 44) 833) 485) 295) 113 ) 1 930) 11 ?) 682)
DRY BULK CARRIER 330 6 961 4 367 2 586 930 18 561 12 054 6 937 324) 7 114) 4 732 ) 2 804 ) 900) 20 082) 13 299) 7 492)
LOG/TIMBER CARRIER 6t.. 488 311 239 156 1 243 771 554 51> 376) 238) 146) 162) 1 208 ) 752 ) 471)
OTHERS 306 2 780 2 357 1 315 995 8 046 7 797 4 199 320) 2 962) 2 753) 1 52(1) " 014) 8 558) 8 690) 4 492 )
TOTAL 4 947 68 897 54 327 29 149 14 167 1 95 089 156 255 83 370 4 598) 65 206) 52 203 ) ( 28 145 ) (13 177 ) (185 746) (149 477) ( 79 952 )
FIGURES IN BRACKETS ARE STATISTICS FOR CORRESPONDI~G PERIOD IN 1989
- 37 -

TABLE 5 (A) INCOMING SHIPS ANALYSED BY FLAG FOR 3RD QUARTER 1990 - INWARD
3RD QUART ER 199 r: JANUARY TO S EPTEMB ER 1990
NUMBER CAP A C I T Y NUMBER CAP A C I T Y OF OF
FLAG SHIPS DWT GRT NRT SHIPS DIIT GRT NRT
('000) ( '000) (' 000) (' 000) ( 'OOC) (. 00 0)
AMERICAN 75 2 429 2 337 1 215 222 7 112 6 818 3 547 83) 2 600) 2 465) 1 335 ) 230) 7 210) 6 865) 3 7G4) .
BRITISH 84 2 690 2 275 1 236 267 7 996 7 186 3 815 89) 2 788) 2 354) ( 1 305 ) .?61 ) 7 639) 6 575) 3 6 2Z>
CHINESE ,1 325 9 490 6 935 3 926 :3 895 27 268 20 101 11 364 1 226) 8 577) 6 263) 3 540) 3 425 ) 24 750) 18 304 ) 10 3 CO)
DANISH 88 3 375 2 799 331 242 9 682 13 254 3 794 74) 3 (l08 ) 2 634 ) 162) 194 ) 8 106) 7 072) 3 151>
DUTCH 40 1 202 046 512 125 3 663 3 232 1 614 56) 1 609 ) 377) 721) 152) 4 665) " J23) 2 055 )
GERMAN (F.R. OF GERM ANY) H13 2 186 1 746 1 049 312 6 295 4 982 2 937 96) 2 151> 1 766) 1 005 ) 254) 5 503 ) 4 496) 2 590)
GR EEK 42 115 728 481 119 3 272 2 108 1 397 34) ( 911> 590) 380) 126) 3 257> 2 308 ) 1 322 )
INDONESIAN 40 487 357 237 97 1 178 868 571 35) 413) 295) 190) 101> 1 121) 799 ) 516 )
J A PA N ES E 1 1)7 2 916 2 a46 1 413 355 8 396 8 257 4 026 118 ) 2 934) 2 845 ) 1 393) 408 ) 8 692) 8 700) 4 227>
LlBER IAN 252 6 299 4 901 2 593 691 17 883 13 903 7 366 194) 4 715) ( 3 450) 1 970) 550) 13 485) 10 242 ) 5 613)
- 38 -

FLAG
NO RW E GI AN
PANAMANIAN
PH III PP IN E
RUSSIAN
SINGAPOREAN
SOUTH KOREAN
TAIWANESE
OTHERS
TOTAL
NUMBER OF
SHIPS
47 27>
1 450 1 348)
48 54)
81 81)
150 148)
122 102 )
334 319)
594 521)
4 982 4 605)
TABLE 5 (A) (CONT' D)
3RD QUARTER
DWT
( '00 C)
175 869)
14 096 ( 13 629 )
1 207 1 655)
1 087 1 144)
3 190 3 483)
1 988 1 656)
5 038 4 853)
9 709 8 613)
69 679 65 608)
C A P
199 n
A C I
GRT
( 'ODD)
887 625 )
10 889 11 508 )
745 (113)
966 0(16)
2 387 2 640 )
667 445)
4 025 3 856 )
7 317 6 317)
54 853 52 456)
T Y
NRT
(' aDO)
465 363 )
5 815 5 935 )
434 605 )
442 564)
32r. 513 )
798 682 )
946 900)
4 243 3 755)
29 457 28 319)
NUMB ER O·
SHIPS
125 76)
3 948 3 846)
125 152)
24 n 25D)
433 408 )
362 309 )
919 912)
700 503 )
14 177 (13 157>
JANUARY TO
DWT
('ODD)
3 453 2 490)
38 506 38 911)
2 652 4 823)
3 336 3 420)
8 654 8 763)
5 696 4 464)
13 987 14 253)
26 753 24 255)
195 782 (185 808)
FIGURES IN BRACKETS ARE STATISTICS FOR CORRESPONDING PERIOD IN 1989
- 39 -
SEPTEMBER 199("·
CAP A C I T Y
GRT
( '000)
2 480 1 812)
30 755 32 544)
1 706 2 772)
2 917 2 99Z)
6 858 6 758)
4 834 3 881>
11 200 11 319)
20 309 18 080)
156 768 (149 543)
NRT
( • 00 ()
1 365 1 o C2)
16 019 16 584)
984 654 )
1 314 1 727)
3 752 3 830)
2 3 CO 1 858 )
5 408 5 562)
12 ()79 10 653 )
83 653 79 969)

TABLE 5 (B) OUTGOING SHIPS ANALYSED BY FLAG FOR 3RD QUARTER 199u - OUTWARD
3llD QU AKT ER 1990 J ANU ARY TO S EPTEMB ER 1990
NUMB ER C A P A C T Y NUMBER CAP A C I T Y OF OF
FL AG SH I PS DWT GRT NRT SHIPS DWT GRT N RT
( '000) ( 'Ort(l) (. 000) ('ODD) ( • 000) ('000
AM ER I CAN 76 2 491 2 413 1 236 221 7 089 6 802 3 537 8n 2 515) 2 373) 1 3G4 ) 2~O) 7 218) 6 862) 3 712)
BRITISH 81 2 528 2 153 161 258 7 717 6 983 3 697 88) 2 607> 2 243) 242 ) 258) 7 552) 6 509 ) 3 588 )
CHINESE 317 9 267 6 826 3 849 3 912 27 474 20 243 11 444 229 ) 8 391> 6 160) 3 481) ( 3 447) ( 24 970) ( 18 446 ) ( 10 398 )
DANISH 88 3 372 2 ~1 8 1 342 24 (\ 9 597 8 180 3 765 74) 3 007) 2 634) 1 162 ) 193) 8 052) 7 029 ) 3 132 )
DUTCH 39 19C 1 038 5 GB 124 3 667 3 242 1 618 56) 586) 1 342 ) 695 ) 152) 4 637) 3 988) 2 026 )
GERMAN (F.R. OF GERMANY) 103 2 168 734 1 n42 311 6 269 4 964 2 926 96) 2 149) 766) 1 003 ) 255) 5 532) 4 516) 2 6 C3)
GR EEK 41 1 091 714 472 12 (I 3 328 2 139 1 420 36) 1 074) 669 ) 442 ) 126 ) 3 237) 2 300) 1 313 )
INDONESIAN 38 474 "349 232 97 1 175 866 570 36 ) 419) 299) 192) 100) 1 115) 796) 514)
JAPANESE 1a7 3 017 2 888 447 355 8 368 8 241 4 017 119) 2 975) 2 887> 408 ) 411> 8 773) 8 782) 4 265)
LIBERIAN 256 6 463 5 CC1 2 657 689 17 852 13 875 7 353 193) 4 641> 3 401) 1 945) 547) 13 278) ( 10 103 ) 5 534 )
- 40 -

FL AG
NO RW EGI AN
PANAM ANI.6.N
PH III PP INE
RUSSIAN
SINGAPORE"N
SOUTH KOREflN
TA I WA NESE
OTHE RS
TOTAL
NUMBER OF
SHIPS
46 25)
441 349)
45 50)
8D 79)
150 146)
118 101>
332 323)
589 517)
4 947 4 598)
TABL E 5 (B) (CONT' D)
3RD QUARTER 1990
DWT
( '000)
167 716)
13 682 13 632)
., 055 1 709 )
059 125)
3 1 68 3 437)
1 946 1 637)
4 931 4 957)
9 828 8 63 [)
68 897 65 206)
c " P A C I
GRT
( 'OD 0)
879 524)
1e 631 ( 11 636)
659 ()41)
942 970)
2 36 (' 2 587)
1 629 1 423)
3 929 3 906 )
7 366 6 342)
54 327 52 203)
T Y
NRT
('ODD)
459 295 )
5 649 5 949)
387 631>
429 545 )
1 31 6 1 488 )
777 67 Q)
1 911 ., 928)
" 275 3 767 )
29 149 28 145)
NUMB Ell OF
SHIPS
125 7f. )
3 94('1 3 848)
125 146 )
23i 25 0 )
43 8 411>
36 C-307>
918 917)
1 695 1 5 05)
,14 167 (13 177>
JANUARY TO
DWT
('ODD)
3 482 2 321)
38 134 39 037)
2 658 4 783)
3 308 3 42 (')
8 71 0 8 787)
5 659 4 432)
·13 876 14 19 Q)
26 726 24 409)
195 089 (185 746)
FIGURES IN BRACKETS ARE STATISTICS FOR CORRESPONDING PERIOD IN 1989
- 41 -
S EPTEI'IB ER 1990
CAP A C I T Y
GRT
( '000)
2 495 1 700)
30 538 32 651)
1 708 2 746 )
2 892 2 971)
6 900 6 742 )
4 800 3 852)
11 102 11 302 )
2 0 284 18 183 )
156 255 (149 477)
HRT
(' 00 ()
371 928 )
15 866 16 642 )
986 1 638 )
1 3 C1 1 715 )
3 782 3 838 )
2 281 1 841)
5 376 5 539)
12 060 10 7 29)
83 370 79 952)

TAB L!: 6 (A) INCOMING SHIPS ANALYSED BY OEAOWEIGHT TONNAGE (OWn FOR 3RO QUARTER 1990 - INWARD
3RD QUART ER 199 (') HNUARY TO S EPTEMB ER 1990
NUM B ER CAP A C I T Y NUMBER CAP A C I T Y OF OF
OWT SHIPS DWT GRT NRT SHIPS OWT GRT NRT
('000) ('000) ('000> (. cno) ( • 000) ( • 00·0)
BELOW 2 000 osn 034 1 092 542 3 DB 2 945 3 582 1 788 930) 942) 1 257> 635 ) 2 508 ) 2 506) ( 3 458) 1 744 )
2 000 TO 3 999 479 426 073 581 321 3 914 2 952 1 587 4~2) 231) 942) 506 ) 241> 3 639) 2 888) 1 525)
4 000 TO 4 999 251 1 114 796 1.44 73'1 3 245 2 436 1 324 245) 1 093) 836) 452) 719) 3 205) 2 5 aS) 1 363 )
5 000 TO 5 999 219 209 878 505 59£. 3 269 2 462 1 403 183) 008) 754) 444 ) 571) 3 149) 2 430) 1 407)
6 (100 TO 6 999 328 2 112 1 440 885 935 6 010 4 132 2 441 317) 2 033) 1 374) 791) 938) 6 019) 4 146) 2 384)
7 000 TO 7 999 208 567 034 601 631 4 747 3 078 1 794 225) 690) 109 ) 633 ) 671) 5 051> 3 323) 1 897>
8 Doe TO 8 999 272 2 290 676 1 184 787 6 637 4 882 3 464 253) 2 129) 544) 1 112) 755 ) 6 351) 4 602 ) 3 324 )
9 000 TO 9 999 101 965 7n8 399 30c) 2 859 2 111 1 383 117) 118) 804 ) 545) 307> 2 928) 2 101) 1 489 )
10 000 TO 10 999 87 913 663 385 251 2 643 1 924 1 107 79) 832) ( 593 ) 338) 241) 2 534) 1 814) 1 040)
11 00OT011999 90 041 742 452 277 3 208 2 291 1 392 72) 832-) 619) ( 370) 210) 2 433) 1 822) 1 089)
- 42 -

DW T
12 000 TO 12 999
13 000 TO 13 999
14000 TO 14 999
15 000 TO 15 999
16 000 TO 17 999
18 000 TO 19 999
20 000 TO 24 999
25 000 TO 29 999
30 000 TO 39 999
40 000 AND ABOVE
TOTAL
T A e L E 6 ( A ) ( C 0 NT • D )
3RD QUART ER 199 (\ JANUARY TO
NUMBER OF
SHIPS
119 77)
86 77)
69 68)
91 97)
140 133)
124 88)
289 258)
212 214)
366 377)
4tH 373)
4 982 4 605)
C A
DWT
( 0000)
503 970)
160 039)
994 981)
397 493)
2 362 2 241)
2 337 1 653 )
6 451 5 797)
5 786 5 862)
12 693 13 082 )
21 326 ( 19 582)
69 679 65 608)
P A C I T Y
GRT
( ·000)
134 774)
955 791>
816 848 )
185 2(7)
1 734 1 633)
794 2 C2 )
5 119 4 926)
4 532 4 557)
1rJ 464 1" 685)
,17 (117 ( 15 909 )
54 853 52 456)
NRT
(0000)
647 435)
546 449 )
452 460)
613 68(1)
951 897)
985 680)
2 758 2 632)
2 455 2 494 )
5 357 5 628)
8 716 8 135)
29 457 28 319)
NUMBER OF
SHIPS
316 ?48 )
251 26 rl)
203 198 )
284 253)
387 379)
332 288)
801 718)
594 572)
1 067 1 032)
103 048)
14 177 (13 157)
FIGURES IN BRACKETS ARE STATISTICS FOR CORRESPONDING PERIOD IN 1989
- 43 -
DWT
( • 000)
3 995 3 122)
3 387 3 517)
2 928 2 855)
4 366 3 882)
6 520 6 385)
6 259 5 418)
17 917 16 172 )
16 219 15 671)
37 003 35 804)
57 712 55 167>
195 782 (185 808)
S EPT F.MB ER 199r
CAP A C I T Y
G RT
( °DOQ)
3 023 2 397)
2 783 2 668)
2 525 2 503 )
4 000 3 284 )
4 881 4 715 )
4 701 3 989)
14 691 13 91.4)
12 762 12 295)
30 549 29 684)
47 005 44 976)
156 768 (149 543)
N RT
(·000
1 733 1 3 83 )
1 560 1 487)
321 344 )
2 1·04 1 76(l)
2 644 2 601 )
2 672 2 245 )
7 798 7 265)
6 886 6 684>
15 592 15 405 )
23 6tO ( 22 531)
83 653 79 969)

TABLE 6 (B) OUTGOING SHIPS ANALYSED BY DEADWEIGHT TONNAGE (DWT) FOR 3RD QUARTER 1990 - OUTWARD
3RD QUARTER 1990 HNU ARY TO S EPT EMB ER 1990
NUMBER CAP A C I T Y NUMBER CAP A C I T Y OF OF
DWT SHIPS DWT GRT NRT SHIPS DWT GRT NRT
( • 000) ('000) (. 000) ( '000) ( • 000> ( , 00 C>
BELOW 2 000 050 036 1 103 545 3 01 (1 2 947 3 584 1 784 929) 943) 1 265) 639 ) 2 506 ) 2 506) 3 468) 1 749 )
2 000 TO 3 999 470 1 398 059 574 1 318 3 902 2 937 1 580 425) 1 240) 950) 509 ) 1 244) 3 648) 2 896) 1 529 )
4 000 TO 4 999 249 105 792 441 733 3 258 2 458 337 243) 084) 837) 451 ) 718> 3 20n 2 511> 365 )
5 000 TO 5 999 216 192 866 498 593 3 26[. 2 463 1 l. '11 182) 003) 731> 431) 568) 3 131> 2 395) 1 391>
6 000 TO 6 999 328 2 110 1 438 882 937 6 022 4 146 2 447 313) 2 006) 1 366) 782 ) 941}) 6 029) 4 160) 2 389 )
7 000 TO 7 999 212 1 598 1 053 612 634 4 76Q 3 097 1 802 235) 1 764) 1 156 ) 66(1) 672) 5 059) 3 334) 1 901)
8 000 TO 8 999 269 2 265 1 653 1 17(\ 789 6 655 4 890 3 468 250) 2 105 ) 1 532 ) 1 1 (l4) 75Q) 6 308) 4 576) 3 310)
9 000 TO 9 999 99 945 692 391 300 2 859 2 108 1 384 117) 119) 80?) 547 ) 31 () 2 957) 2 125) 1 5 CS )
10 000 TO 10 999 87 914 665 385 253 2 664 1 938 1 114 79 ) 832) 593) 338) 241> 2 534) 1 819) 1 041)
l' 000 TO 11 999 93 075 763 463 277 3 207 2 286 1 391 73) 844 ) 628) 375 ) 213) 2 468) 1 834) 1 097 )
- 44 -

DOlT
12 000 TO 12 999
13 000 TO 13 999
14 000 TO 14 999
15 000 TO 15 999
16 000 TO 17 999
11$ 000 TO 19 999
20 000 TO 24 999
25 000 TO 29 999
30 000 TO 39 999
40 000 AND ABOVE
TOTAL
TABLE 6 (B) (CONT'o)
3RD QUARTER 1990 J I,NU ARY TO
NUMBER OF
SHIPS
118 77)
83 77)
68 65)
86 102 )
142 136)
124 89)
285 259)
207 209 )
367 369)
394 369)
4 947 4 591$)
C A
oWT
( 'OGO)
490 969 )
1 120 1 040)
980 936 )
321 569)
2 396 2 290)
2 336 1 673)
6 364 5 828)
5 661 5 728)
12 738 12 SOD)
20 853 19 432)
68 897 65 2(6)
P A C
GRT
( 'ODD)
124 773)
924 790)
80G 820)
1 139 1 345 )
1 752 1 661>
801 223)
5 05 0
5 061)
4 47Q 4 449 )
10 (.82 10 477)
16 692 15 737)
54 327 52 2(3)
T Y
NRT
('ODD)
646 436 )
529 448 )
446 445 )
582 714 )
962 917)
990 688)
2 717 2 646 )
2 405 2 432)
5 368 5 523 )
8 543 8 059 )
29 149 28 145)
NUMBE~ OF
SHIPS
314 247)
"249 262)
2 O~ 199)
285 261)
392 ,91'1)
331 288)
796 719)
592 577)
1 %8 1 034 )
1 093 1 038 )
14 167 (13 177)
FIGURES IN BRACKETS ARE STATISTICS FOR CORRESPONDING PERIOD IN 1989 - 45 -
DOlT
( '000)
3 971 3 10n
3 3M' 3 545)
2 928 2 869)
4 382 4 005)
6 603 6 570)
6 241"1 5 419)
17 805 16 196)
16 17Q 15 809 )
37 058 35 880)
57 021 54 504)
195 089 (185 746)
SEPTEMBER 199 C'
CAP A C I T Y
GRT
('ODD)
3 004 2 393)
2 762 2 688)
2 520 2 516)
(. 015 3 373)
4 931 4 830)
4 696 3 989 )
14 620 13 937) .
12 733 12 367)
30 543 29 757 )
46 523 44 509 )
156 255 (149 477)
NRT
( , 00 C)
726 378 )
1 549 1 498 )
319 354 )
2 110 1 8 OS)
2 673 2 672)
2 665 2 247>
7 7 Sf) 7 275)
6 862 6 732 )
15 604 15 461>
23 (.03 22 251>
83 370 79 952)

LENGTH OF TIME IN PORT (NO. OF DAYS)
BELOW 1/2
1/2 TO LESS THAN
1 TO LESS THAN 1-1/2
1-1/2 TO LESS THAN 2
2 TO LESS THAN 2-1/2
2-1/2 TO L~SS THAN 3
3 TO LESS THAN 3-1/2
3-1/2 TO LESS THAN 4
4 TO LESS THAN 6
6 TO LESS THAN 8
8 TO LESS THAN 11
11 TO LESS THAN 16
16 AND ABOVE
TOTAL
TABLE 7 OUTGOING SHIPS ANALYS~D BY LENGTH OF TIME IN PORT FOR 3RD QUARTER 1990
3RD QUARTER 1990 JANUARY TO S~PTEMBER 1990
NUMB ER OF
SHIPS
849 716)
480 370)
691 701)
363 369)
285 236)
183 156)
158 165)
116 102)
359 296)
161 172 )
114 120)
70 80)
118 115)
4 947 4 598)
DWT
('ODD)
9 388 8 579)
27 667 24 627)
10 232 10 457)
4 146 t. 301.)
2 889 2 464)
2 124 1 600)
375 7 O~)
123 976 )
3 636 3 8(2)
2 371 2 464)
647 462)
917 393)
381 376)
68 897 65 206)
CAPACITY
GRT NRT
( 'on 0)
8 11:11 7 825)
23 563 20 997)
8 068 8 6 (1·6 )
3 101 3 Q83)
1 985 1 711)
1 437 1 102)
919 366)
709 7 ('\4 )
2 477 2 5 E3)
581 628)
006 854)
528 857>
852 886)
54 327 52 203)
('aDO)
4 185 4 067)
11 818 10 651)
4 337 4 495)
1 991 1 733)
1 185 1 306)
835 646 )
539 822 )
426 424 )
1 423 1 441)
887 943 )
634 547>
349 538 )
539 531)
29 149 28 145)
NUMBER OF
S HI PS
2 444 2 049)
4 192 :') 799)
2 04'5 2 01 (1)
017 090)
825 740)
535 443 )
428 469)
316 295)
Q27 87(1)
455 460)
321 353)
216 219)
346 380>
-14 167 (13 177)
FIGURES IN BRACKETS ARF STATISTICS FOR CORRESPONDING PERIOD IN 1989
- 46 -
DWT
( '000)
30 047 25 140)
77 990 70 552)
28 026 27 556)
11 098 12 943)
8 166 7 534)
5 517 4 351)
3 893 4 57(1)
2 915 2 879)
11 05t. ( 1n 36C))
5 747 6 167>
3 619 4 823)
2 876 3 655)
4 139 5 216)
195089 (185 746)
CAP A C I T Y
GRT
('000)
26 617 22 784)
66 408 60 418)
22 536 22 227>
8 352 ' 9 551)
5 487 5 290)
3 903 3 033)
2 641 3 370)
2 224 2 465)
7 689 7 807)
3 86(1 4 066)
2 211 2 908)
1 722 2 234)
2 603 3 325)
156 255 (149 477)
NRT
( '00 ()
13 648 11 790)
33 597 30 772)
11 92Q 12 036)
5 216 5 395)
3 544 3 373)
2 169 1 775)
1 517 1 939)
1 148 1 2 G2)
4 3S~ 4 025)
2 172 2 39C))
372 8 28)
1 1 -01 1 4 20)
1 612 2 0 C8)
83 370 79 952)

PAR T D
TABLE 8 (A) SEABORNE CARGO DISCHARGED ANALYSED BY SELECT~~ COUNTRY AND PORT OF LOADING - INWARD
SELECTED COUNTRY AND PORT OF LOADING
SI NGAP ORE
SINGAPORE
JAPAN
OTH E R,J AF AN YOK 0 HMA KOBE UBE TSUKUMI SUSHI
CHINA
QINHUANGnAO DALI AN SH AN GHAI OTHER,CHINA
AUSTRALIA
ABBOT POINT NEW C ASTL E OTHER,AUSTRALIA
REPUBLIC OF SOUTH AFRICA
RICH ARDS BAY
TAIWAN
KEEL UNG KAO H SIUN C;
UNITED STATES OF AMERICA
LOS ANG ElES LONG BEACH OAK L AHD SEA T TLE
3RD QUARTER
TONNe 1990 1989
1 781 636 1 753 133
1 781 636 1 753 133
1 469 829 1 734 185
233 600 198 035 188 548 162 5CO 13 7 200 130 850
1 287 433
407 813 261 061 152 655 143 655
1 203 925
393 735 377 283 224 837
1 145 030
G94 568
850 30.9
331047 325 097
731 493
150 222 1'18113
82 9 t1 67 745
493 489 215 996 172 635 183 090 202 000
19 500
234 808
544 936 159 108 127 888 106 835
874 450
111 878 337 489 lOB 710
1 494 273
1 420 964
735 985
268 880 327 908
493 322
31 681 90 723 75 284 40 942
CUBIC METRE 1990 1989
2 317 845
2 317 845
2 427 426
233 772 557 338 480 238 190 685 174 256 111 226
1 825 133
483 880 331 523 282 464 202 6::4
1 459 758
460 67Q 441 421' 263 228
339 706
261 558
927 598
91)1 850 634 113
530 816
219 644 267 949 204 971) 171 795
- 47 -
2 240 977
2 240 977
2 459 728
450 644 452 353 418 590 19:3 897 260 580
11 895
796 980
654 979 214 992 271 060 148 1 30
097 233
130 897 394 883 127 719
1 760 22'2
650 625
597 921
744 321 599 695
051963
72 134 197 926 166 919 100 500
JANUARY TO SEPTEMBER
TONNE 1990 1989
5 119 889
5 .119 889
4 ~12. 1 924
752 018 575 618 537 644 430 700 :3 63 813 275 900
3 435 548
., 084 197 639 092 402 100 389 289
2 7'14 614
5,14 459 a 93 471 '594 678
:3 2.19 670
3 085 749
2 247 780
929 881 763 197
1 782 762
263 265 319 882 170 460 :183 225
4 961 173
4 961 173
4 391 442
211756 493 623 490 005 459 230 495 855
32 450
3 129 932
108 665 556 223 316 712 259 262
2 937 025
460 806 885 288 691 444
:3 912 795
3 694 123
2 209 728
8Q7 759 874 249
., 448 691
100 088 304 885 169 841 150 573
CUBIC METRE 1990 1989
6 716 912
6 716 912
6 464 053
651 955 460 863 374 826 536 663 447 275 199 706
4 769 946
286 293 809 538 727 175 469 824
3 317 9(13
601 917 Q45 314 698 635
3 755 1:)5
3 557 789
5 190 775
2 521 615 1 552 636
3 810 001
444 617 734 310 4Q2 040 436 421
6 359 021
6 359 021
6 773 350
1 356 015 1 249 929 1 242 921
5Q4 456 602' 670
25 269
4 628 461
1 324 682 753 084 653 282 383 806
3 585 035
539 ' 143 035 227 816 269
4 554 019
4 285 876
4 566 682
2 174 559 1 602 450
3 044 077
223 712 616570 363 366 365 772

TABLE 8 (A) (CONT"D)
3RD QUARTER JANUARY TO SEPTE"'BER
SELECTED CCUNTRY AND PORT OF LOADING TONNE CUBIC METRE TONNE CUBIC METRE 1990 1989 1990 1989 11990 1989 199·0 1989
UNITED STATES OF AfIIERICA OTHER,USA 53" , 2'cj 25 935 84 937 46 389 1148 702 108 576·. 225 . 711 175 078 NEW YORK 41 133 23 932 87 332 51 494 99 628 87 590 . 214 968 181 595
INDON E SIA 572 469 181 643 787 938 274 244 1 .1,16 751 464 169 1 602 398 721 685
S AliI A RI ND A 256 113 12 368 313 343 18 692 436 634 33 552 545 126 57 111 OTHER,INDONESIA 140 207 40 618 200 774 67 138 323 030 117 752 469 425 189 480 HK A ATA 90 464 21 917 132 456 41 679 157 309 69 816 254 896 134 183
REPUBL IC OF KOREA (SOUTH 357 049 384 457 650 303 708 322 ,1 096 125 1 430 910 1 921 669 2 583 075 KOREA)
BUSAN 258 388 212 924 516 340 457 776 674 422 596 140 354 993 359 710
THAILAND 195 912 174 536 317 528 290 836 567 330 535 698 934 392 889 986
BANGKOK 179 412 153 536 300 038 268 576 502 610 484 907 865 258 835 828
OTHER COUNTRIES 617 921 1 595 001 2 542 942 2 350 025 4 69-0 263 4 683 565 7 158 465 6 961 144
TOTAL 11 213 065 10 655 793 17 126 993 15 628 450 30 ,1-13 155 30' 105 127 45 641 618 44 666 533
- 48 -

TABL E 8 (B) SEABORNE CARGO LOADED ANALYSED BY SELECTED COUNTRY AND PO~T OF DISCHARGE - OUTWARD
3RD QUARTER
SELECTED CCUNTRY ' AND P'ORT OF DISCHARGE TONNE CUBIC METRE 1990 1989 1990 1989
UNITED STATES OF AMERICA
LONG BEACH LO SANG ELES SEATTLE NEW YORK
CH INA
OTHER,CHINA GUANGZHOU <INCL. HUANGPU)
TAIWAN
KEELUNG KAOHSIUNG
JAPAN
KOBE TOK Y 0 YOKOHAMA OTHER,JAPAN
SI NGAP ORE
51 NG APO R E
FEDERAL REFUBLICOF GERMANY
HAMBURG
REPUBL le 0 F' KORE'A (SOUTH KOREA)
BUSAN
UNITED I<I NGDOM
FH I XSTO WE SOUTHAMPTON
IN DON E SIA
JAKARTA
740 36;1
217 938 194 531
74 780 71 907
527 653
278 408 94 564
415 500
225 378 144 415
196 136
SO 994 39 479 33 Q21 26 803
184 073
184 073
150 179
135 293
120 003
92 667
114 920
63 219 44 599
105 727
57 78.{J
683 094
193 098 179 201
62 904 70 904
629 214
268 789 146 263
347 639
208 480 100 OC5
156 420
62 268 24 055 26 711
+ 160 483
160 483
94 084
85 843
115 779
91 591
90 473
52 036 36 423
112 218
48 369
4 458 938
343 889 223 500 455 377 405 766
716 535
338 146 105 867
749 805
376 603 297 942
574 607
193 554 136 415 101 608
33 654
479 486
479 486
838 058
749 897
215 2.45
176 489
629 886
317 409 270 638
207 976
121 848
- 49 -
4 006 813
1 186 825 1 047 020
363. 227 357 432
871 468
340 3 07 168 445
601 983
330 475 198 433.
470 757
212. 016 77 501 82 246
+
418 183
418 183
540 603
489 715
211 379
181 780
483 683
284341 187 793
201 415
97 816
JANUARY TO SEPTEMBER
TONNE C UBI C M ETR E ,1990 1989 1990 1989
1 904 565
575 995 493 702 ,176 395 197 519
470 856
727 343 306 160
1 ,17.1 901
661 429 370 177
HT 109 88 409 91 329 37 970
486 948
486 948
381 851
34U 340·
328 326
259 668
264 005
161 415 89 315
330 100
159 539
1 757 820 10 877 651
478 950 479 428 1 58 916 193 731
3 395 308 2 865153 1 061 942 ., 041 826
432 546 2 002 034
595 601 887 593 309 411 343 988
051 921 2 u53 303
577 491 048 688 346 076 772 856
461 477 1 469 936
1 56 122 68 175 86 435
+
404 389
4G4 389
246 379
225 096
381 597
321 860
233 806
133 382 87 829
314 116
136 144
516 893 307 271 276 770
49 025
305 378
305 378
2 050 716
1 827 768
612 808
517 289
328 885
748 467 496 860
634 194
345 24R
9 719 690
2 701 745 2 692 032
892 136 959 526
2 109 117
758 067 352 802
1 860 383
878 478 727 711
255 389
499 463 207 644 240 401
+ 051 982
051 982
314 182
193 488
701 883
622 775
181 193
675 960 451 024
544 439
259 421

TABLE 8 (B) (CONT'D)
3 RD QUARTER JANUARY TO SEPTEMBER
SELECT EO C CUNTRY AND PORT Of DrSCHARG~ 'TONN E CUBIC METRE TONN E CUB 1 C METRE 1990 1989 199·0 1989 1990 1989 1990 1989
INOON·ESIA SURABAYA 21 12:1' 27 721 38 134 52 158 69 590 73 377 134 998 146 524
NE TH E R LAN D 5 84 306 63 119 441 · 1bC 306 1 Q4 214 317 177 52:1 1 070 015 763 077
ROTT ERO A" 84 306 62 050 441 l6D 302 512 214 252 176 044 1 069 803 758 093
OTHER COUNTRIES 847 276 760 297 2 957 907 2 579 562 2 298 235 2 002 228 7 703 753 6 587 316
TOTAL 3 486 134 3 212 819 12 269 602 10 691 95Q 9 3t.3 348 8 463 799 31 108 673 27 088 652
+ S TAT IS TI CS SUPPRE SSED BECAUSE OF LARGE SAMPLING ERRORS
- 50 -

lASL E 9 (A) SEABORNE CARGO DISCHARGED ANALYseD BY SELECTED COUNTRY AND PORT OF LOADING BY CONTAINERISATION - INWARD
SELECTED COUNTRY AND PORT OF LOADING
TAIWAN CONTAINERISED TOTAL
KEELUNG CONTAINERISED TOTAL
KAOHSIUNG COHAINERISED TOTAL
UNIT E D S T A TE S 0 F - AM ER I C A CO NTA I NER IS ED ToTAL
LONG BEACH CONTAINERISED TO TAL
OAKLAND CO tiTAINE RISED TOTAL
SEATTLE COnAINERISED TO TAL
NEW YORK CONTAINERISED TOTAL
LOS ANG E lES CON T A I Ni: R IS E D TOTAL
CHA R lES T CN CONTAINERISED TO TAL
TAC 0 MA
JAPAN
KOB E
CO NTAINE RISED TOTAL
CONTAINERISED TOTAL
CONTAINERISED TOTAL
YOKOHA"'A CONTAINERISED TOTAL
3RD QUA.RTER JANUARY TO SEPTEJIIIBER
TONNE CUB re "'ETR E TONNE CUBIC METRE 1990 1989 1990: 1989 1990 1989 1990 1989
680 279 850 369
328 723 331 047
237 504 325 097
557 197 731 493
118 113 118 113
82 911 82 911
67 745 67 745
41 133 41 133
40 57Z 150 222
38 4-15 384-15
34 324 34 32'"
532 060 1 469 829
153 918 188 548
152 625 198 035
493 397 1 753 434 1 304 483 , 789 758 1 356 539 4 733 598 3 545' 176 735 985 1 92.7 598 1 597 921 2 247 780 2 209 728 5 190 775 4 566682
259692 8974(}'1 718108 9·03516 752524 2499158 2041581 268 880 901 850 744 321 929 881 807 759 . 2 521 615 2 174 559
171 661 526 715 395 227 559 238 430 081 1 281 180 997 648 327 908 634 113 599 695 763 197 874 249 1 552 636 1 602 450
405 544 1 311 694 942 626 458 167 1 227 029 3 395 066 2 755 483 493 322 1 530 816 051 963 1 78.2 762 1 448 691 3 810 C01 3 Q44 077
90 723 267949 197926 3.19882 269252 734 310 577 Q17 90 723 267 949 197 926 119 882 304 885 734 310 616 STD
75 284 204 970 166 919 170 46u 169 841 402 040 363 366 75 284 204 970 166 919 170 460 169 841 402 040 363 366
40 942 171 795 1CQ 500 183 225 150 161 436 421 364 760 40 942 171 795 100500 183 225 150 573 436 421 365772
23 932 87 332 51 494 99 628 87 474 214 968 181 407 23 932 87 332 51494 99 628 87 590 214 968 181 595
31 681 90 624 72 134124 193 99 568 285 587 223257 31681 219644 72 134 263265 100 088 444 617 223712
25 914 91 205 67 638 8;1 933 72 253 196 604 183 344 25 914 91 205 67 638a:1 933 72 253 196 604 183 344
33 091 78 251 80 8331:13 00' 109 601 260 243 253 976 33 091 78 251 80 833 ,1-13 001 109 601 260 243 253 976
388 684 1 734 185
138 452 172 635
102 222 215 996
283 860 2 427 426
412 913 480 238
397 901 557 338
- 51 -
916 346 2459728
368 072 418 590
237 178 452 353
1 389 583 4 121 924
436 522 537 644
384 702 575 618
1 126 476 4 391 442
385 838 490 a05
305 420 493 623
3 303 634 6 464 Q53
1 219 944 1 374 826
953 879 1 46 Ci 863
2 726 493 6 773 350
1 073 748 1 242 921
735 853 249 929

TABLE 9 (A) (CONT'D)
3RD QUA RTER JANUARY TO SEPTEMBER
SELECT ED CCUNTRY AND TONNE CUBIC PIIETRE TONNE CUBIC METRE PORT OF LOADING 1990 1989 1990 1989 ,1990 1989 1990 1989
JAPAN TOKY 0
CONTAINERISED 68 011 43 655 153 76 '1 110 058 :162 735 141 456 378 113 351 199 TO TAL 73 450 49 595 . 155 331 1115,43 172 625 156 284 381 614 356 296
REPUBL IC OF KOREA (SOUTH KOREA)
CONTAINERISED 271 313 248 B8U 562 707' 547 560 734 078 713' 006 1 520 402 1 701 253 TOlAL 357 049 384 457 65.0 303 7Q8 322 1 ·0.96 125 1 430 910 . 1 921 669 2 583 075
BUS AN CONTAIN.fRISED 219 2'50 193 378 469 972 . 432 887 574613 527 572 1 237 784 1 279 658 TO TAL 258 388 212 924 516 34,(1 457 776 674 422 596 140 1 354 993 1 359 710
SINGAPORE COIiTAINERIS-ED 210 662 214 005 439 67{) 457 410 6i18 188 594 085 1 325 623 1 243 239 T'o TAL 1 781 636 1 753 133 2 317 845 2 240 977 5 119 889 4 961 173 6 716 912 6 359 021
SI~GAPORE
CON TA I "c RI Sf D 210 662 214 005 439 670 457 410 6118 138 594 085 1 325 623 1 243 239 TOTAL 1 781 636 1 753 133 2 317 845 2 240 977 5 1:19 889 4 961 173 6 716 912 6 359 021
CHI NA COfiTAINERISED 129 002 111 4.04 338 299 279 364 325 838 252 029 850 122 622 593 TO TAL 287 433 1 234 808 825 133 796 98 Cl 3 435 548 3 129 932 4 769 946 4 628 461
S HA N GHA I CONTAINERISED 5a 312 39 915 132 693 1 Q.l 991 ,127 186 80 795 315 51Q 202 281 TOTAL 152 655 127 888 282 464 271 06 G 4·{]2 100 316 712 727 175 653 282
TIANJIN XING AN G CO NTAINE RISED 17 345 23 H3 45 666 53 314 56 648 62 783 149 .010 140 13D TOTAL 79 668 76 020 128 497 127 309 26·C 3Q4 246 103 429 870 394 524
F£DERAL REPUBLIC OF GERMANY CO NTAIN£RIS EO 110 251 '101 713 228 545 193 383 299 059 280 001 589 861 543 829 TOTAL 120 607 137 528 246 529 231 Ha 355 363 373 7QO 690 72Q 675 974
HAMBURG CQNTAINEJUSED 89 791 76 964 184 052 144 22 D 234 961 219 623 466 526 425 139 TOTAL 99 329 110 821 195 867 169 357 276 630 305 831 512 801 519 753
t-t£TH ER lANl)S' COri:TAINERISED 104 6·11 80 840 199 207 151 670 250 999 241 312 479 657 429 783
. TO TAl 130 524 98 764 246 432 185 243 35'1 699 302 610 643 524 525 052 ROTT ~RD A'" .
CO NTAlNERIS EO 104 215 80 835 197 904 151 655 250 4Q3 240 749 478 1 Cl, 428 528 TO TAL 130 095 97 165 244 754 176 514 339 416 294 581 621 750 504 606
- 52 -

HBlE 9 (A) (CONT'C)
3RD QUARTER JANUARY TO SEPTEMBER
SELECTED C OUNTI1Y AND TONNE CUBIC M ETR E TONNE CUBIC METR E PORT OF LOADING 1990 1989 1990 1989 1990 1989 1990 1989
AUSTRALIA CONTAINERISED 92 090 89 157 158 159 153 397 242 710 333 962 394 8,10 494 418
~ TO ,TAL '1 203 925 874 450' 459 758 097 233 2 7;14 614 2 937 Q25 3 317 903 3 585 035 SYDN~Y ,
853 CONTAINERISED 36 36 205 65 524 56 103 8:1 702 81 940 128 515 124 471 T-O:TAL 37 44,1. 36 205 65 900 56 103 82 890 81 940 138 522 124 471
JIIELBOURNE CONTAINERISED 27 319 28 794 52 104 49 309 80 672 82 265 151 728 144 071 TOT AL 27 319 28 794 52 104 49 309 8{] 672 82 716 151 728 145 019
BRISBANE CO NTAl NE Rls EO 14 284 + 22 267 + 39 Ca7 + 57 423 + TOTAL 14 284 + 22 267 + 43 887 + 64 647 +
TH AI LAND C ONTAIttE RISED 84 291 65 707 167 128 148 233 234 362 190 994 485 914 428 901 TOTAL 195 9,12 174 536 317 528 290 836 567 830 535 698 934 392 889 986
BANGKOK CONTAINERISED 84 291 65 707 167 12:8 148 233 234 362 19 C 994 485 914 428 901 TO TAL 179 412 153 536 300 038 268 576 502 61 a 484 907 865 258 835 828
OTHER COUNTRIES CONTAINERISED 594 637 536 385 1 223 142 1 106 647 1 7-{18 348 1 650 235 3 556 111 3 367 682 TOlAL 3 084 288 3 034 624 4 177 625 3 967 73 a 8 319 621 8 384 218 11 181 725 11 035 822
ALL COUNTRIES CO NTAINERISEO 3 366 393 2 735 716 7 ' 66 5 845 6 201 119 9 051 09 Q 7 965 668 2Q 634 aN 17 858 851 TOTAL 11 213 065 10 655 793 17 126 993 15 628 45 Q 30 1;13 155 30 105 127 45 641 618 44 666 533
+ STATISTICS SUPPRESSED BECAUSE OF LARGE SAMPLING :RRORS
- 53 -

TAB LE 9 (B) SEABORNE CARGO LOADED ANALYSED BY SELECTED COUNTRY AND PORT OF DISCHARGE BY CONTAINERISATION - OUTWARD
SELECTED CCUNTRY AND PORT OF DISCHARGE
UNITED STATES OF AME~ICA CO NTAI NE RISEO TO TAL
LONG BEACH CONTAINERISED TOTAL
LOS ANGELES C 0 HT AI HER I SED TOTAL
SEA TTt.:E CO NTAINE RISED TOTAL
N cWYtlR K CONT.AItt£RISED TOTAL
TAIWAN CONTAINERISED TO TAL
KEELUNG CONTAINERISED TOlAL
KAOH SIU N G
JAPAN
KOB E
TOKY 0
CONTAINERISED TO TAL
CONTAINERISED TO TAL
CONTAINERISED TOTAL
COHAINERISED TOTAL
YOK 0 HAM" CO NTA I NE RI S ED TOTAL
SI NGAP ORE CO NTAlNER ISED TOTAL
3RD QUA RTER
TONNE CUB le M ETR E 1990 1989 1990 1989
740 208 740 36,1
217 93S 217 938
194 531 194 531
74 78.0 74 780
71 907 71 907
183 514 415 500
99 117 225 378
74 984 144 415
164 561 196 136
50 760 50 994
35 708 39 479
32 994 33 021
160 492 184 073
682 577 4 455 576 3 996 575 683 094 4 458 938 4 006 813
193 098 1 343 8891186 825 193 098 1343 889 1 186 825
179 144 1 223 500 1 046 355 179 201 1 223 50c} 1 041. 02 a
62 904 455 3~7 363 227 62 904 455377 36Y227
70 752 4U5 766 . 353 745 70 904 405 766 357 432
149 166 347 639
83 645 208 480
60 409 1-00 DOS
154 365 156 420
60 238 62 268
24 055 24 055
26 687 26 711
133 926 160 483
458 257 749 805
237 104 376 603
198 257 297 942
538 666 574 607
192 862 193 554
13 2 404 136 415
101 534 101 608
441 679 479 486.
- 54 -
368 168 601 983
201 384 330 475
155 785 198 433
468 624 470 757
209 964 212 016
77 501 77 501
82 165 82 246
378 444 418 183
JANUARY TO SEPTE"BER
TONNE CUBIC METRE .1990 1989 1990 1989
1 9~3 340 1 756 739 10 862 154 9 707 845 1 9a4 565 1 757 820 10 877 651 9 719690
57~ 806 478 950 3 395 038 2 701 745 575 995 478 95-0 · 3 395 308 2 701 745
49-3 369 479 371 2 863 962 2 691.- 367 493 702 479 428 2 865 153 2 692 032
176 395 158 894 1 061 942 891 682 176395 158 916 1061942 892 136
197024- 193 578 1032 389 955838 197 519 193 731 1 041 826 959 526
5i12 131 1 .17;1 901
274 465 661 429
2:13 126 370 177
435 141 49,1 742
136 820 13 7 109
84 484 88 409
90 972 91 329
42-Q 521 486 948
429 488 1 250 870 1 020 052 051 921 2 053 303 1 860 383
236 332 643 671 521 594 577 491 Q48 688 878 478
18 0 08 9 5 52 Q CO 466 9 47 346 076 772 856 727 711
429 175 461 477
153 956 156 122
68 175 68 175
86 408 86 435
335 967 404 389
406 616 469 936
516 060 516 893
302 978 3-07 271
275 263 276 770
1 207 337 1 305 378
1 217 477 1 255 389
496 815 499 463
207 644 207 -644
240 313 240 401
944 550 1 051 982
"

TA8LE 9 (B) <CONT' D)
3RD QUARTER JANUARY TO. SEPTEMB ER
SELECTBD COUNTRY AND TONNE CUB IC METR E TONNE CUBIC ","ETR E . PORT OF DISCHARGE 1990 1989 1990 1989 19 SO 1989 19.90 1989
SINGAPORE S IN&APOR E
CONTAINERISED 16U 492 133 926 441 679 378 444 42'{! 52 .1 335 967 , 207 337 944 550 TO TAL 184 073 160 483 479 486 418 183 48'6- 948 404 389 1 305 378 1 051 982
FEDERAl REPUBLIC OF GERMANY CONTAINERISED 150 (}14 94 068 837 298 540 56 a 38,1 686 246 363 2 049 956 1 314 138 TOnt 150 179 94 084 838 058 540 603 381 851 246 379 2 050 716 1 314 182
HAMBURG CONTAINERISED 135 129 85 827 749 137 489 672 34-0 175 225 080 1 827 0013 1 193 444 TOlAL 135 293 85 843 749 897 489 715 34-C 34Q 225 096 1 827 768 1 193 488
UN IT E D KINGDOM CONTAINERISED 114 920 90 473 629 886 483 683 263 972 233 643 1 328 753 1 180 889
. TO tAL 114 920 90 473 629 886 483 683 264 005 233 806 1 328 885 1 181 193 FEL IXSTOIiE
CO~TAINERISED 63 219 52 036 317 409 284 341 16;1 415 133 382 748 467 675 960 TO TAL 63 219 52 036 317 409 284 341 :16·1 415 133 382 748 467 675 960
SOUTHAMPTON CONTAINERISED 44 599 36 423 271') 638 187 793 89 315 87 829 496 860 451 024 TOlAL 4.4 599 36 423 270 638 187 793 89 315 87 829 496 860 451 C24
REPU8L IC OF KOREA (SOUTH KOREA)
CONTAINERISE-D 1()3 453 95 562 196 071 187 785 28G 800 307 597 558 106 613 392 TOTAL 120 003 115 779 215 245 211 379 328 826 381 597 61 2 808 701 883
BUSAH CON T A I NE RI SED 78 206 74 469 160 282 162 496 213 732 251 455 465 555 539 124 T01AL 92 667 91 591 176 489 18,1 78 Q 259 668 321 860 517 289 622 775
NETHERLANDS CONTAINERISED 83 573 63 119 438 716 306 ·104 2:13 583 177 521 1 067 571 763 077 TOlAl 84 306 63 119 441 160 306 104 2:14 317 177 521 1 070 015 763 077
RO TT ERD AM CONTAINERISED 83 573 62 050 438 716 3.02 512 2i13 518 176 044 1 067 359 758 093 TOl AL 84 306 62 050 441 160 302 512 214 252 176 044 1 069 803 758 093
PHILIPPINES CONTAINERISED 74 600 69 808 186 369 195 416 2i10 655 175 557 554 130 470 674 TOTAL 76 244 81 155 188 976 202 513 2;16 972 203 771 562 686 490 249
MAN ILA CO NTU NERIS ED 72 229 68 621 180 165 192 286 205 683 172 764 538 894 464 253 T OTAL 73 873 79 968 182 772 199 38 3 210 964 197 917 545 940 481 380
- 55 -

TABLE 9 (B) (C ONT'D)
3RD QUARTER JAN UAR Y TO SEPTEI'IBER
SELECTED CCUNTRY AND TONNE CUBIC METRE TONNE CU BIC "'ETR E PORT OF DISCHARGE 1990 , 1989 1990 1989 :199-0 1989 1990 1989
AU S TR ALIA COIiTAINERISED ' 71) 432 86 591 325 258 352 735 ,185 002 209 978 770 931 803 407 TOtAL 70 541 86 591 326 175 352 735 185 767 211 303 772 349 805 025
SY D N EY CONTAINERISED 33 566 39 064 144 794 156 951 89 130 95 005 359 971 364 1 a5 TOTAL 33 610 39 064 145 680 156 951 89 174 95 224 360 858 364 847
IfIELBOURNE CONTAINERISED 27 331 34 718 142 662 148 379 70 984 84 103 318 352 329 935 TOTAL 27 331 34 718 142 662 148 379 70 984 85 001 318 352 330 482
OTHER COUN TR I ES CONTAINERISED 693 350 594 613 2 529 596 2 125 221 . 1 874 147 1 595 774 6 578 364 5 566 724 TOTAL 333 87.1 1 333 982 3 367 266 3 097 197 3 696 453 ,3 333 816 9 004 946 7 945 598
ALL COUNTRIES CONTAINERISED 2 539 116 2 214 269 11 037 373 9 403 31 5 6 68·0 979 5 897 802 27 634 788 23 6Q2 226 TOTAL 3 486 134 3 212 819 12 269 602 10 691 950 9 343 348 8 463 799 31 108 673 27 088 652
- 56 -

TABLE 10
PR IN C I PAL COMMOD ITY
DRY BULK
COAL ~ COKE AND BRIQUETTES I R 0 N AN D S T EEL CER E ALS ~NI> CEREAL
PREPARATIONS LOGS AND TIMBER; WOOD, SIMPLY
11 0 RKED STONE, SAND AND GRAVEL
LIQUI I) BULK
PETROLEUM, PETROLEUM PRODUCTS AND RELATED MATERIALS
GAS, NATURAL AND MANUFACTURED
GENERAL CHGO
CEMENT AND CEMENT CLINKER ARTIFICIJL RESINS ANI) PLASTIC
M ATER I JLS, AND CELLULOS E ESTERS AND ETHERS
PAPER, PAPERBOARD AND ARTICLES OF PAPER PULP, OF PAPER OR OF PAPERBCARD
VEGETABLES AND FRUIT CORK AND WOOD MANUFACTURES
(EXCLUDING FURNITURE) MISCELLANEOUS MANUFACTURES OF
METAL AND NON-METALLIC MINERALS, N.~.~.
ORG ANIC CHEMIC ALS CRUDe ANIMAL AND VEGETABLe
MATERIALS, N-.E.S. TEXT ILE FIBRES OTHER MACHINERY AND EQUIPMENT
AND P A IITS, N·. E.S • TEXTILE YARN AND THREAD, ALL
KINDS OTHER ELECTRICAL AND
ELECTRONIC APPLIANCES AND PARTS
INOR6ANl C CHEMICALS
CA) HABORNE CARGO DISCHARGED ANALYSED BY PRINCIPAL COMMODITY- INWARD
3RD QUARTER
TONNE 1990 1989
4 276 94·Q
3 166 105 626 210 224 414
142 375
77 393
2 202 259
2 142 553
59 706
4 733 866
852 090 575 814
529 046
176 841 169 940
167 308
159 683 152 539
118 117 110. 415
107 802
93 16,1
92 406
3 969 848
2 937 202 650 960 191 497
134 615
30 036
2 277 475
2 230 123
47 353
4 4Q8 470
1156041 433 005
380 556
193 665 87 696
169 330
112 481 102 323
111118 101 567
85 407
74 210
128 139
CUB I C I'tETRE 1990 1989
4 637 450
3 704 50-0 313 524 322 477
169 176
61 889
2 640 504
2 565 687
74 818
9 849 039
826 552 035 908
1 01 Q 575
405 511 289 684
249 723
245 522 264 013
293 663 339 559
330 282
271 707
122 GO 8
- 57 -
4 276 281
3 467 754 304 29 a 279 709
163 556
29 361
2 686 960
2 629 896
57 064
8 665 209
128 444 764 19 a
739 152
414 617 150 974
238 596
172 807 189 455
273 150 346 799
272 562
2 Q9 405
152 634
JANUARY TO SEPTE~BER
1990
10 689 957
7 469 081 1 847 231
619 896
50,1 761
152 615
6 336 520
6 165 698
17( 822
13086678
2 764 084 1 5!17 899
'49.2 952 454 751
TONNE 1989
11180364
7 931 528 1 980 584
649 876
414 094
105 207
6 220 415
6 058 585
161 830
12 704 348
3 305 562 1 248 502
083 246
519 303 298 898
452 570. 462 916
424 661 31,.1 252
3115 284 330 416
300 661
249 249
253 137
320 629 304 443
352 957 342 704
278 218
225 082
321 054
CUBIC 1'1 ETR E 1990 1989
11 434 189
.8 752 252 886 144 917 076
583 417
13 5 868
7 521 280
7 312 655
208 625
26 686 150
2 596 441 2 723 999
2 499 323
120 989 763 294
650 348
653 8{)9 622 036
779 895 062 963
958 422
708 782
322 675
11 982 140
9 328 654 962 160 961 883
495 488
103 733
7 437 274
7 242 644
194 631
25 247 120
3 239 316 2 178 179
2 075 876
107 718 504 168
649 638
496 778 525 929
844 238 1 306 099
879 236
668 531
392 678

TAB.lE .10 (A) (CONT'D)
3RD QUARTER JANUARY TO SEPT EMB ER
PRINCIPAL COI'IMOO ITY TiONNE CUBIC "'ETR E TONN E CUB IC !IIETRE ·1990 1989 1990 1989 1990 1989 1990 1989
GENERAl CA ~60 TEXTILES OF MIXED MATERIALS OR 84 092 83 852 277 622 274 913 242 506 222 843 776 542 713 280
OTHER MATERIALS, N • . E.S. /H S CELL AN'Eou S EDIBl.E PRODUCTS 79 605 81 524 154 750 .143 755 247 872 224 056 495 556 424 487
AN 0 PREPARATIONS COF FEE", . T'EA, COCOA, . SUGAR 67 99.(1 92 025 102 062 157 365 ,168 893 211 671 271 215 374 151
PftepAR·ATlO NS, HONEY, SF' ICES AND II\A'WFAC'TURES THEREOF
MEAT AND MEAT PREPARATIONS 64 910 60 157 130 870 116 237 202 566 179 088 391 315 334 372 NON - FER R C US'" ET AL 5 63 463 66 813 57 870 62 484 .18C 970 205 338 185 721 191 656 TEXT IlES o F MA N:~'" A 0 E FIBRES 61 862 45 540 188 165 137 577 ,17:1 341 129 306 514 064 383 901 BEV ERAG E 5 59 071 50 596 97 709 83 048 ,136 468 137 295 229 429 221 803 FOO TI/EAR 51 413 27 035 226 893 122 662 ,136 974 76 687 592 605 355 732 OTH ER RO _0 V EH ICLES AND 50 117 44 697 370 869 314 822 13:1 344 128 085 990 109 955 144
ACCESSCRIES A NI'" AL A fi D V E 6 ETA B L E OILS, 49 852 50 375 72 361 73 386 145 817 170 581 212 565 244 490
FATS HD WAX ES
TOTAL 11 213 065 1Q 6 SS 793 1 7 126 993 15 628 45': 3 0 113 155 3{l 105 127 45 641 6,18 44 666 533
- 58 -

TABLE 10
PRINCIPAL COMMODITY
DRY BULK
METALLIFeROUS ORES AND METAL SCRAP .
CLAY AN 0 K AOLlN IRON AND STEEL
t.IQUID BULK
PETR~LEUM, PETROLEUM PRODUCTS AND RELATED MATERIALS
G EN ERA L CAR G 0
TOY S MISCELLAKEOUS MANUFACTURED
ARTICLES, N-.E·.S. CR U 0 E AN IMAL A NO VEGE~TAB LE
MATERIALS, N·.E.S". MISCELLANEOUS I'1ANUFACTURES OF
METAL AND NON-METALLIC MINERALS, H.E.S.
GARMENTS OF MIXED MATERIALS OR OTHER MATERIALS, N·.E.S.
VEGETABLES AND FRU"IT PULP AND WASTE PAP~R FOOTWEAR PLASTIC ftANUFACTURES, N·.E.S·. COTTON GARMENTS MISCELLANEOUS EDIBLE PRODUCTS
AND PREPARATIONS TRAVEL GOODS, HANDBAGS AND
SIMILAR CONTAINERS INORGANIC CHEMICALS OTHER MACHINERY AND EQUIPMENT
AND PART S, N". E. S • COTTON TEXTILES TEXTILES OF MIXED MATERIALS OR
OTHER 'ATERIALS, N.E.S. OTHER ELECTRICAL AND
ELECTRONIC APPLIANCES AND PARTS
(B) SEABORNE CARGO LOADED ANALYSED BY PRINCIP~L COMMODITY - OUTWARD
3RD QUARTER
TONNE 1990 1989
311 661
122 844
83 526 59 324
510 913
509 542
2 663 560
298 258 158 053
133 837
115 204
109 118
9.1) 372 79 568 75 965 68 225 67 450 66 733
61 670
56 789 55 931
51 87'1 51 834
50 812
307 31 C
130 615
93 324 51 821
544 490
540 554
2 361 019
235 677 130 105
112 343
100 389
87 227
92 697 102 766
57 324 47 993 73 901 55 435
45 937
79 118 44 393
67 182 48 219
54 919
CUB IC METRE 1990 1989
349 866
141 317
98 599 47 801
573 71 a
571 730
11346 018
2 618 364 748 239
237 447
236 721
693 650
199 350 181 237 498 471 262 314 368 793 126 278
366 312
73 652 160 097
140 104 152 782
205 743
339 653
148 530
100 714 34 173
626 924
621 951
9 725 373
999 809 634 123
21)3 81 2
186 248
558 829
199 237 235 277 344 262 190 862 · 390 42 G 104 262
281 863
104 401 125 587
179 626 136 279
205 305
- 59 -
,1990
917 865
4·(J2 589
248 240 156 376
1 369 456
1 35a. 051
7056 027
602 Q68 396 236
385 352
321 764
247 573
2:12 548 237 669 2·19 864 :17f1 259 1 gd 337 176128
166 66,1
.180 749 16.1 259
,166 723 130 879
143 666
JANUARY TO SEPTEMBER
TONNE 1989
897 618
402 999
255 627 155 558
1 203 97.7
, 196 788
6 362 204
485 875 360 163
349 912
275 378
216 750
220 17 0 302 60.3 162 003 128543 · 187 7~7 ·
154 008
121 767
210 012 122 741
17 8 095 139 745
124 697
CUB re METRE 1990 1989
1 002 240
447 638
275 100 123911
1 549 759
532 833
28 556 673
5 111 654 1 867 620
688 296
617 494
534 079
476 468 543 377
1417 677 671 131
· 007 571 338 853
991 734
231 507 460 036
452 5 Z3 377 299
538 279
967 825
451 141
274 218 115 58.1
378 085
368 595
24 742 741
4 002 474 1 748 553
641 128
480 329
335 927
475 673 697 440 952 4tJ6 501 363 966 841 294 679
724 999
275 583 345 375
470 ' 144 402 718
446 591

TABLE 10 (B) (CONT'D)
3RD QUA RTER JANUARY TO SEPTEMBER
PRINCIPAL COMMOD ITY TO NN e- CUBIC J'IIETR E TONNE CUBI C i'lETR E 1990 1989 1990 1989 1990 1989 1990 1989
G EN ERA l CAR GO OTHER TELECOM"'UNICATIONS AND 46 596 31 819 285 331 184 663 ,11;1 634 77 285 658 529 426 515
SOUND RECORDING , AND R EPRODUCINGAPPARATUS AND
RADIO-BRCADCAST RECEIVERS 44 704 28 385 256 417 160. 777 ,116 932 80 193 661 731 436 675 BEVERAGES 43 236 29 823 69 631 46 746 93 915 82 561 152 099 131 470 ARTIFICUL R£SINS AND PLASTIC 41 445 35 939 68 733 58 579 138 757 111 758 224 623 177 746
MATERIALS, AND CELLULOSE ESTER S AND ETHERS
NON-FERRCUS METALS 39 467 24 905 41 730 27 572 84 017 78 658 86 G45 77 740 POTTERY (INCLUDING CHINAWARE 35 733 30 304 111 545 97 496 96 139 72 866 302 122 226 584
AND PORCELAIN WARE) CANN EO FOOD 34 414 28 356 52 800 41 158 87 868 97 411 132 768 142 049 CHEMICAL MATERIALS AND 29 991 29 584 53 222 52 235 89 335 89 669 158 663 156 691
PRODUCTS, N.E,.S. PRINTED I':ATTER, PICTURES AND 29 958 30 055 57 57Q 53 372 74 468 74 613 138 164 133 370
PAINTHGS
TOTAL 3 486 134 3 212 819 12 269 602 10 691 950 9 343 348 8 463 799 31 108 673 27 088 652
- 60 -

TABLE 11 ( A) SEABORNE CARGO DISCHARGED ANALYSED BY PRINCIPAL COMI1ODITY BY CONTAINERISATION - INWARD
3RD QUARTER JANUARY TO SEPTEfo!S!:R
PRINCIPAL CO"',",OD ITY TONNE C us IC "'ETRE TONN E CUB I C METRE 1990' 1989 1990 1989 199·0 1989 1990 1989
DRY B U.LK CONTAINERISED 211 786 151 205 283 934. 195 579 563 363 603 465 765 211 784 141 T01AL 4 276 940 3 969 848 4 637 450 4 276 281 10 689 957 11 180 364 11 434 189 11 982 14·0
CEREALS AND CE REAL PREPARATIONS
CONTAINERISED · 94 186 76 202 139 482 115 453 240 292 232 059 380. 975 367 472 TOlAL 224 414 191 497 322 477 279 709 6119 896 649 876 917 076 961 883
IRON AND STEEL CONTAINERISED 75 705 45 937 76 114 40 623 194 853 151 467 187 281 136 ' 616 TOTAL 626 210 650 960 313 524 304 290 847 231 980 584 886 144 962 160
LIQUH BULK (' CONTAINERISED 27 64-1 17 793 44 358 26 630 5i1 573 46 212 82 467 67 880
TO TAL 2 202 259 2 277 475 2 640 504 2 686 960 6 336 520 6 220 415 7 521 280. 7 437 274
GENERAL CARGO CONTAINERISED 3 126 966 2 566 718 7 337 553 5 978 910 3 436 154 7 315 991 19 787 126 17 006 831 TOlAt 4 733 866 4 408 470 9 849 039 8 665 209 13 .086 678 12 70'4 348 26 686 150 25 247 120
ARTIFICIAL RESINS AND PLASTIC "ATER I ALS, AND CELLULOSE ESTERS AND ETH ERS
CONTAINERISED 567 990 417 349 1 023 414. 737 160 1 492 517 1 170 821 2 681 814 2 050 166 TOTAL 575 814 433 005 1 035 908 764 19Q '1
PAP E R, P APERBOAR~. AH.o ARTICLES 5.17 899 1 248 502 2 723 999 2 178 179
OF PAPER PULP, OF PAPER OR OF PAPERBCARD
CONTAINERISED 482 886 339 561 927 659 663 897 1 205 364 973 844 2 331 601 1 874 299 TOTAL 529 046 380 556 1 010 575 739 152 1 300 979 083 246 2 499 323 2 075 876
~ISCElLA~EOUS ~ANUFACTURES OF M EIAL AND NON-METALLIC MINERALS, N..E·.S.
CO NTAINERISED 147 5.99 142 032 229 947 210 727 39,1 044 394 731 589 522 581 264 TOTAL 167 308 169 330 249 723 238 596 452 570 462 916 650 348 649 638
VEGETABLES AND FRU'I T CONTAUiERISED 141 325 155 202 331 543 334 476 4>1,t 47,1 384 230. 950 475 830 131 TOTAL 176 841 193 665 405 511 414 617 492 952 519 303 12Q 989 1 107 71&
TEx TILE FIBRES CONTAINERISED 91 984 70 558 228 848 177 979 21$ 231 255 179 692 523 615 528 TOTAL 118 117 111' 118 293 663 213
OTHER ELECTRICAL AND 150 3115 284 352 957 779 895 844 238
ELECTRONIC APPLIANCES AND PA RTS
CONTAINERIS'ED 85 950 67 297 256 369 192 393 230 046 207 426 665 788 623 497 TOTAL 93 161 74 210 271 707 209 405 249 249 225 082 708 782 668 531
- 61 -

TABLE 11 0) (CONT'D)
3RD QUARTER JANUARY TO SEPTEMB ~R
PRINCIPAL COMMOO ITY ' TONNE CUB le METRE TONNE CUBIC METRE 1990 1989 1990 1989 ,199-{] 1989 1990 1989
GENER.A( ' C A RGO , TEXTILE YARN AND THREAD, ALL
KI NOS , CO NTAl NE RlS EO 81 995 63 959 250 066 203 345 239 &39 20'3 942 765 129 641 533 TOTAL 107 802 85 407 330 282 272 562 3,0,0 661 278 218 958 422 879 236
OTHER IH-CHINERY ' AND EQUIPMENT AN D PARTS, N-. E. S •
CO NTA I NE RI SED 74 903 82 625 243 885 256 863 237 165 254 358 732 518 769 876 TOTAL 11 () 415 101 567 339 559 346 799 330 416 342 704 " 062 963 1 306 099
TEXTILES OF~IXED MAtERIALS OR OTHER I(ATERIALS, N.E.S.
CONTAlNERISED 73 828 66 486 250 280 227 964 22-0 493 176 470 716 8u9 587 467 T01AL 84 092 83 852 277 622 274 913 242 506 222 843 776 542 713 280
ORGANIC CHEMICALS CONTAINERISED 70 183 54 134 97 823 77 189 ,19,1 436 137 4B1 270 412 199 097 TO UL 159 683 112 481 245 522 172 807 424 661 320 629 653 8 ,09 496 778
CO F FEE, TEA, COCOA, SUGAR PREPARATIONS, HONEY, SPICES AND MANUFACTURES THEREOF
COHAINERISED 67 218 54 338 100 453 90 515 ,165 102 157 285 262 603 273 214 TO TAL 67 990 92 025 102 062 157 365 ,168 893 211 671 271 215 374 151
I'll S C ELLAliEOUSEDIBLE PRODUCTS AND PREPARAfIONS
CONTAINERISEn 66 671 59 788 131 968 103 744 ,1911 443 160 169 394 611 309 299 TOTAL 79 605 81 524 154 751) 143 755 247 872 224 056 495 556 424 487
INORGAHrc.: CHellCALS co N TA I NE R I SED 60 726 53 392 82 97 a 67 452 166 779 148 332 217 277 191 987 TOTAL 92 406 128 139 122 008 152 634 253 137 321 054 322 675 392 678
TEXTILES OF MA~-MADE FlBRES CONTAINERIS'ED 58 308 41 170 178 301 125 556 16.1 072 113 438, 485 866 340.065 TOTAL 61 862 45 540 188 165 137 577 .17'1 341 129 306 ' 514 064 383 901
CRUDE ANIMAL AND VEGETABLE MATERIALS, N,.E.S.
CONTAINERLSED 52 951 70 432 114 917 142 874 1&5 422 195 70Cl 386 291 377 556 TOTAL 152 539 102 323 264 013 189 455 3411 252 304 44.3 622 036 525 929
BEV E RAGE 5 CONTAINERISED 52 562 45 851 85 624 74 ' 235 ,123 958 128 342 206 491 205 542 TOTAL 59 071 50 596 97 709 83 048 136 468 137 295 229 429 221 803
MEAT AND MEAT PREPARATIONS CONTAINERISED 51 531 41 551 107 523 84 466 151 653 132 926 301 .917 254 5'25 TO TAL 64 910 60 157 130 870 116 237 202 566 179 088 391 315 334 372
NON~FERROUS METALS CONTAINERISCD 50 174 54 707 49 725 54 547 148 309 165 468 164 672 163 472 TOTAL 63 463 66 813 57 870, 62 484 180 970 205 338 185 721 191 656
- 62 -

TABLE 11 ( A) (CONT'C)
3Rt> QUA RTER JANUARY TO SEPTEMB ER
PRI~CIPAL ' CO~"'ODITY TONNE CUB I C METRE TONNE CUB I C METRE 1990 1989 1990 1989 .199·0 1989 1990 1989
GENERAL CAl/GO FOOTWEAR
CORlAINERISED 48 953 24 651 215 530 111 472 133 106 60 750 - 573 772 279 419 TOTAL 51 413 27 035 226 893 122 662 136 974 76 687 592 605 355 732 COR~AND worio MANU~ACTtiRES
(EXCLUDING FURNITURE) CONTAINERISED 45 704 35 654 77 796 59 008 1.28 138 111 063 213 384 184 086 TOTAL 169 940 87 696 289 684 150 974 454 751 298 898 763 294 504 168
LEATHER, LEATHER MANUFACTURES, N-. 6.S ·. 0 FURSKINS
COnAINERISED 43 557 45 166 84 676 80 15-0 !106 167 110 843 206 014 198 772 TOTAL 43 560 46 243 84 681 82 743 107 175 114 161 207 8;14 205 241
DAJR Y PRODUCTS AND BIRD S • E6GS COnAINERISED 42 445 42 479 84 204 71 928 .126 897 111 442 247 329 193 ' 731 T01AL 49 263 46 215 102 273 79 834 .140 303 119 476 281 C38 212 215 CHEMICAL MATERIALS AND
PRODUCTS, N·.E·.S. CONTAINERISED 39 930 37 632 66 587 61 125 120 179 127 514 198 204 203 000 TOlAL 48 422 47 274 79 649 76 575 ·148 130 174 451 240 299 273 934
'HS CELLA HOUS MANUFACTURED ARTICLES, N·.E.S.
CONTAINERISED 38 466 - 33 402 135 C01 131 232 le7 467 108 077 363 584 427 843 T01AL 39 964 34 443 138 882 134 254 11-1 749 115 187 374 899 449 005 E S S E HT I A L 0 I L S AND PERFUME
MATERr~LS; TOILET, POLISH I NG AN D CLEANSING PREPARATIQNS
CONTAINERISED 37 739 21 638 83 715 46 979 86 258 63 093 197 494 138 599 TOTAL 38 192 23 727 84 907 50 93 a 90 31 5 68 496 204 610 149 696
OTHERTELECO~"UNICATIONS AND SOUND RECOADING AND REPR()D'UCING APPARATUS AND
CO NTAlNERIS E-D 28 961 21 241 125 173 91 405 73 90,. 52 506' 337 491 256 401 -;'rOTAL 30 215 21 948 12 a 707 100 210 75 197 56 208 34i 314 271 321 DYEING, :TANNING AND C{}LOURING MATER,lALS
CO NTAINERISED 28 377 23 772 49 601 44 057 75 794 71 205 132 425 128 733 T01AL 3-0 914 25 610 53 591 46 627 IHl 560 76 068 140 377 136 719 PLAS TIC IIIANUFACTURES~ N. ~ •. S-. CONTAINERISED 27 856 23 052 76 782 78 584 8·1 192 69 890 224 223 2H 263 TOTAL 27 921 25 028 77 003 84 975 85 a90 77 377 231 824 238 669
- 63 -
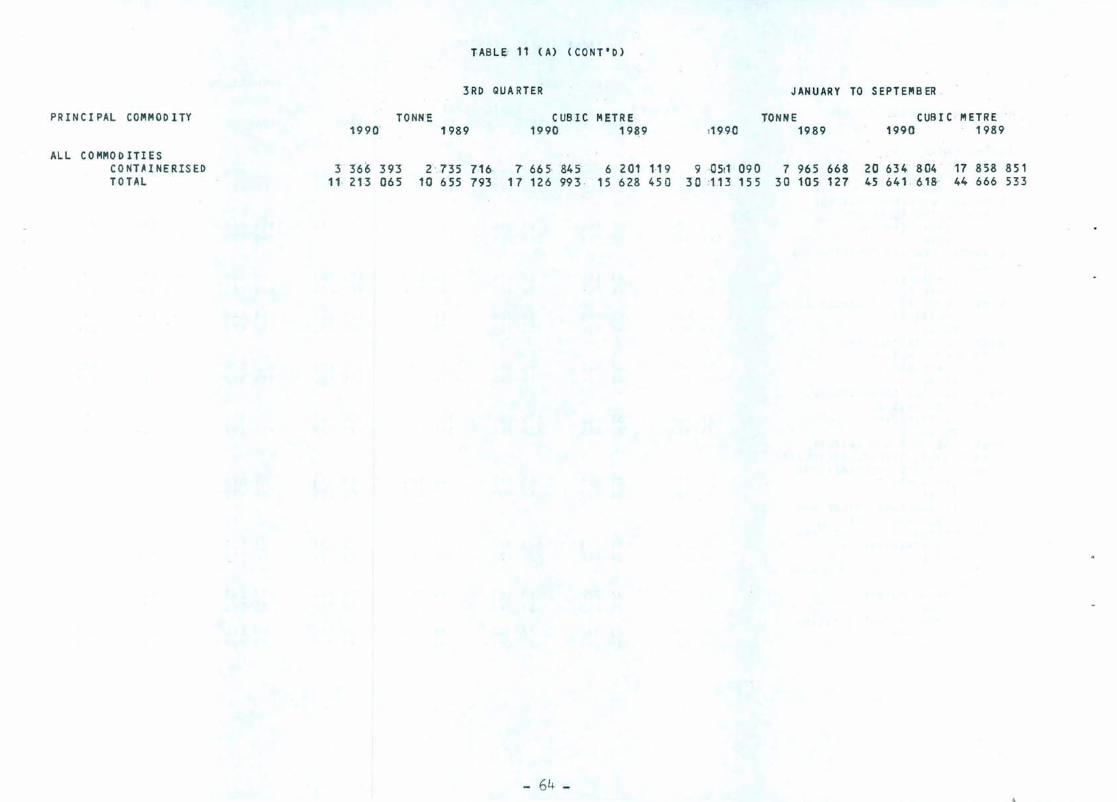
PRINCIPAL COfllMODlTY
AL Leo MI'IO D IT lE S CONTAINERISED TOTAL
TABL~ 11 0) (CONT'O)
3RD QUARTER J ANU AfIY TO SE PTEIIIB ER .
TONN 'E C US IC METRE TONNE CUBI C "'ETRE 1990 1989 1990 19~9 ,199·0 1989 1990 1989
3 366 393 2 ' 735 716 7' 665, 845 6 201 119 90511 090 7 965 668 20 634 804 17 858 851 11 213 065 10 655 793 17 126 993 15 628 450 30113 155 30 105 127 45 64161& 44 666 533
- 64 -

TABLE 11 (e) SEABORNE CARGO LOA~ED ANALYSED BY PRINCIPAL COMOD1 TV BY CONTAINERISATION - OUTWARD
3RD QUARTER JANUARY TO . SEPTEMBER .·
PRINCIPAt COfl!PlOI) ITY TONNE CUB IC METRE TONN E CUBI C METRE 1990 1989 1990 1989 ,1990 1989 1990 1989·
DRY 3 ULK CO NTAINER IS1:D .. 91 065 74 886 125 237 115 936 234 446 217 820 319 261 299 144 TOTAL 311 661 307 310 349 866 339 653 9117 865 897 618 · 1 Q02 240 967 825
METALLIFEROUS · ORES AN& "'ETAL SCRAP
CONTAINERISED 37 030 38 975 48 665 49 905 98 841 110 859 126 438 139 828 TOTAL 122 844 130 615 141 317 148 53 U 402 589 402 999 447 638 451 141
IRON AND STEEL CO "TA I NE RISED 29 79C! 12 870 28 129 12 935 66 535 52 605 64 999 53 657 TOTAL 59 324 51 821 47 801 34 773 156 376 155 558 123 911 115 581
LI QU I D BULK CONTAINERISED 21 986 17 440 30 444 23 319 51 648 44 205 69 994 60 294 TOTAL 510 913 544 490 573 718 626 924 1 369 456 1 203 977 1 549 759 378 085
GENE"RAt:· CARG().. CO NT AINE R IS ED 2 426 066 2 121 943 10 881 691 9 264 059 6 394 886 5 635 777 27 245 532 23 242 788 HllAL 2 663 560 2 361 019 11 346 018 9 725 373 7 056 027 6 362 204 28 556 673 24 742 741
TOY S CO NTAI ~ERISEi> 298 G8G 235 400 2 616 938 1 998 17 IJ 601 582 485 219 5 108 070 3 998 928 TOTAL 298 258 235 677 2 618 364 1 999 809 602 068 485 875 ; 111- 654 4 002 474
~ISCELLA~EOUS MA~UFACTURED ARTICLES, N-.E·.S.
CONTAINERISED 155 846 127 634 740 743 623 303 392 024 352 685 1 849 400 1 712 226 TOTAL 15B 053 130 105 748 239 634 123 396 236 360 163 1 867 620 1 748 553
MISCELLANEOUS MANUFACTURES OF PIE TAL AND NON~ETALLIC ~ I NER A l S, N·. E-.5 •
CONTAINERISED 109 332 92 933 226 215 174 206 304 121 249 576 645 564 442 561 . TOTAL 115 204 100 889 236 721 186 248 321 764 275 378 677 494 480 . 329
GARMENTS OF PlIHD MATERIALS OR OTHER M ATE R I A LS, N • E • S •
CONTAINERISED 108 790 87 114 691 677 558 118 247 154 216 367 1 531 555 1 333 684 TOTAL 109 118 87 227 693 650 558 829 247 573 216 750 1 534 079 1 335 927 VEGETABLES AND FRUIT C.O NU I NE RlS EO 83 668 85 685 185 317 182 534 198 163 204 540 446 830 438 525 TOTAL 90 372 92 697 199 35 (l 199 237 2:12 548 220 170 476 468 475 673
CRUDE ANIMAL AN~ VEGETABLE MATERIALS, N-.f.S.
CONTAINERISED 82 315 67 112 180 802 153 538 24-D 572 209 313 525 003 476 507 TOTAL 133 837 112 843 237 447 203 812 385 352 349 912 688 296 641 128 FOOTWEAR CONTAINERISED . 7'5 938 57 175 498 348 343 742 2'19 231 161 014 1 414 080 946 646 TOTAL 75 965 57 324 498 471 344 262 2:19 864 162 003 1 417 677 952 406
- 65 -

TA BLE ,11 (B) (CONT"D)
3RD QUA RTER J ANUAR Y TO SEPTEMBER
PRHtC I PAL COMMaO ITV TONNE C US IC METRE TONNE CUBI C fIlETRE 1990 1989 1990 1989 .1 CJ90 1989 1990 1989
GENE.RAl CARGO PLASTIC MAh'UH C'TURES, , N-.E-.S-.
CO NTAINE RISED 67 842 47 684 261 336- 189 .666 - 1.6.9 823 1Z7654 . 667 030 497 588 To'tAl 68 225 47 993 262 3-' 4 190: 862 11il 259 128 543 671 131 501 363
COTTON GARMENTS CONTA.INERISED 67 450 73 822 368 79-3 390 117 19-0 . 270 187 373 . 1 006 965 964 753
- lOTAl 67 450 73 901 368 793 390 42 a 19-0 387 187 767 1 007 571 966 841 TRAVEL -GOODS, . HANOBAGS AND
S UllLAR CONTAINERS CONTAINERISED 61 646 45 914 366 192 281 725 166 469 121 631 991 145 724 593 T 01-AL 61 67Q 45 937 366 312 281 863 166 661 121 767 991 734 724 999
MISCELLANEOUS EDIBLE PRODUCTS AN D PR EPARATIONS
CONTAINERISED 55 792 47 566 109 561) 92 284 114.9 610 130 527 299 140 259 039 TOTAL 66 733 55 435 126 278 104 262 176 128 154 008 - 338 853 294 679
COTTON TEXTILES CONTAINERISED - 51 783 66 709 139 635 178 538 166 099 176 508 450 602 466 536 TO TAL 51 871 67 102 140 104 179 626 166 723 178 095 452 523 470 144
INORGANIC CHEMICALS CONTAINERISED 51 298 53 592 65 944 71 498 144 936- 155 099 186 246 205 493 TOTAL 56 789 79 118 73 652 104 401 18:C 749 210 OH 231 507 275 583
TEXTILES OF MIXED MATtRIALS OR OTHER /'IATERI ALS, N.E.S.
CONTAINERISED 50 672 46 54(1 149 486 130 976 128- 241 13S 477 369 541 390 348 TOTAL 51 834 48 219 152 782- 136 279 no 879 139 745 377 299 402 718
OTHER ELECTRICAL AND ELECTRONIC APPLIANCES AND PA RTS
COIiTAINERISED 50 397 54 177 204 784 202 863 142 400 122 836 534 921 441 074 TO TAL 50 812 54 919 2.05 743 205 305 143 666 124 697 538 279 446 591
OTHER TELECOMMUNICAT10NS AND SOUND RECORb ING AND REPRODUCING APPARATUS Ap,(D
"- CONTAINERISED 46 569 31 739 285 226 184 372 _M i1 201 77 098 656 123 425 555 TOTAL 46 596 31 819 285 331 184 663 ",1 634 77 285 658 529 426- 515
RADIO~8ROADCAST RECEIVERS CONTAINERISED 44 697 28 371 256 392 160 691 116 886 80 169 661 552 436 541 TOlAl 44 704 28 385 256 417 160 777 ,1,16 932 80 193 661 731 436 675
OTHER- MACHINERY AN-D EQUIPMENT AND PHTS, N-.E~S.
COHAINERISED 4{) 362 36 063 109 485 103 844 118 268 96 307 332 056 272 515 TOTAL 55 931 44 393 160 097 125 58 ? 161 259 12 Z 741 460 036 34-5 375
- 66 -
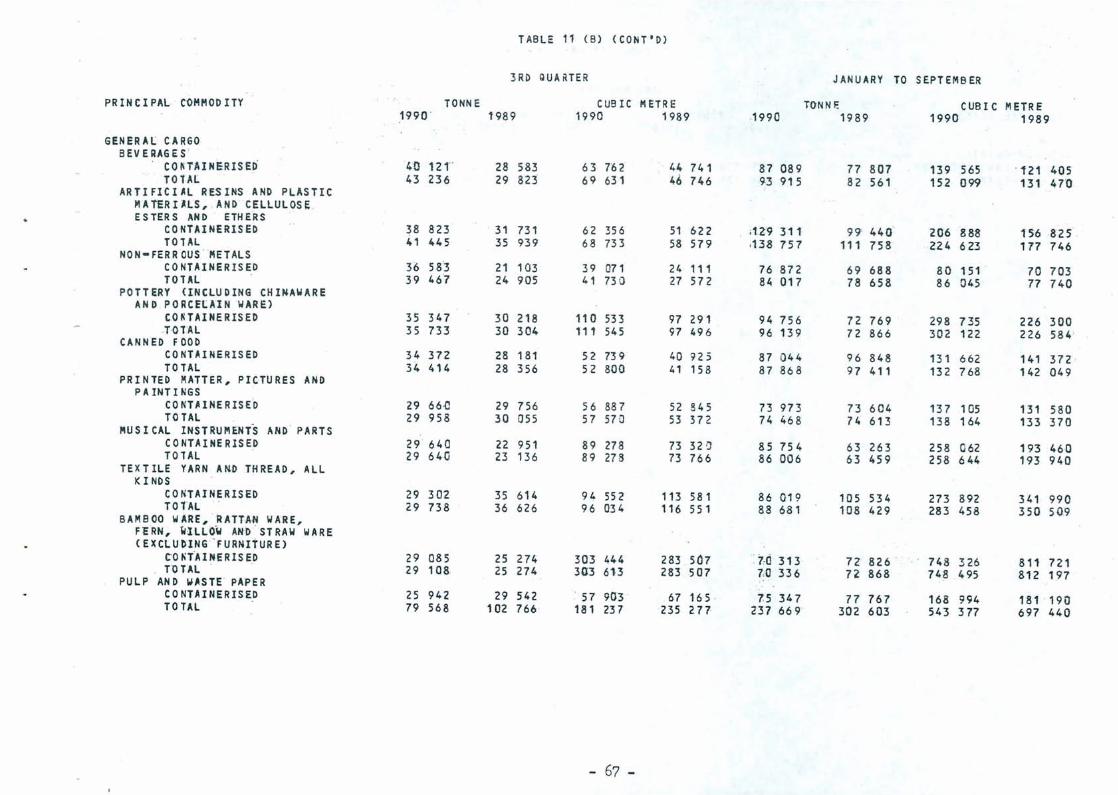
TABLE 1'1 (B) (CONT'D)
3RD QUA RTER JANUARY TO SEPTEMB ER
PRINCIPAL COMMODITY TONNE C US le M ETR E TONN!: CUBI C METRE 1990 1989 1990 1989 1990 1989 1990 1989
GENERAL CARGO BEV E RAG ES
CO~TAINERISED 40 121· 28 583 63 762 44 741 87 089 77 807 139 565 121 405 TOUL 43 236 29 823 69 631 46 746 93 915 82 561 152 099 131 470
ARTIFICIAL RESINS AND PLASTIC II\ATERULS, AND CELLULOSE . ESTER S AND ETHERS .
CONTAINERISED 38 823 31 731 62 356 51 622 ;129 311 99 440 206 888 156 825 TO 'TAL 41 445 35 939 68 733 58 579 .138 757 111 758 224 623 177 746
NO N - FER ROUS · MET ALS CONTAINERISED 36 583 21 103 39 071 24 111 76 872 69 688 80 151 . 70 703 TO 'TAL 39 467 24 905 41 730 27 572 84 017 78 658 86 045 77 740 pon ERY (INCLUDING CHINAWARE
AND . PO RCELAI NWAR E) CO fIT AINE RIS EO 35 347 30 218 110 533 97 291 94 756 72 769 298 735 226 300
-TOTAL 35 733 30 304 111 545 97 496 96 139 72 866 302 122 226 584 CANNED FOOD CONTAINERISED 34 372 28 181 52 739 40 925 87 044 96 848 131 662 141 372 TO TAL 34 414 28 356 52 800 41 158 87 868 97 411 132 768 142 049
PRINTED ~ATTER, PICTURES AND PAINTINGS
CONTAINERISED 29 66-C 29 756 56 887 52 845 73 973 73 604 137 105 131 580 TO TAL 29 958 30 055 57 57 a 53 372 74 468 74 613 138 164 133 370 PlUS I CAL INSTRUMENr"S AND PARTS
CONTAINERISED 29 640 22 951 89 278 73 32 a 85 754 63 263 258 062 193 460 T01AL 29 64{i 23 136 89 278 73 766 86 006 63 459 258 644 193 940 TEX TILE YARN AND THREAD, ALL
KINDS CONTAINERISED 29 302 35 614 94 SS 2 113 581 86 019 105 534 273 892 341 990 TOlAL 29 738 36 626 96 034 116 551 88 681 108 429 283 458 350 509 BAMBOO WARE, lATTA~ WARE,
FERN, wILLOW AND · ST RAW WARE (E X CLUbING -FURNITUR E)
COtiTAlNERISED 29 085 25 274 303 444 283 507 to 313 72 826 748 326 811 721 TU TAL 29 108 25 274 3G3 613 283 507 7,0 336 72 868 748 495 812 1.97 PULP AND "'ASTE PAPER CONTAINERISED 25 942 29 542 57 903 67 165 75 347 77 767 168 994 181 190 TO TAL 79 568 102 766 181 237 235 277 237 669 - 302 603 543 377 697 440
- 67 -

PRINCIPAL COMMODITY
ALL COMMODITIES CO NTUNE RISED TOTAL
TABLE 11 (B) (CONT'D)
3RD QUARTER
TONNE 19901989
CUB le ,.,ETR E 1990 1989
2 539 116 3 486 134
2214269 1,1 037 373 9403315 3 212 819 12 269 602 10 691 950
- 68 -
1990
JANUARY TO SEPTEMB ER
TONNE 1989
CUB I C ME TR E. 1990 1989
6 68C 979 5 897 802 27 634 788 · 23 6Q2226 9 343 348 8 463 799 31 108 673 27 088 652

TABLE 12 (A) SEABORNE CARGO DISCHARGED ANALYSED BY SELECTED COUNTRY OF LOADING BY PRINCIPAL COM~ODITY - INWARn
SELECT COUNTRY OF LOADING AND PRINCIPAL COMMODITY
SI N G AP OR E
PETROLEUI'I, PETROLEUM PRODUCTS AND RELATED MATERIALS
JAPAN
CEMENT AND CEMENT CLINKER I R 0 N AN 0 S T HL ARTIFICIn RESINS AND PLASTIC
MATERIALS, AND CELLULOSE ESTERS AND ETHERS
CH I NA
COAL, COKE AND BRIQUETTES PETROLEUM, PETROLEUM PRODUCTS
AND RELATED MATERIALS I RON AN D STEEL
AUSTRALIA
CO A L, CO K E AND BR IQ U E TT E S
REPUBLIC Of SOUTH AFRICA
COAL, COKE AND BRIQUETTES
TAIWAN
ARTIFICIAL RESINS AND PLASTIC MATERIALS, AND CELLULOSE ESTERS AND ETHERS
CEMENT A~D CEMENT CLINKER PAPER, PAPERBOARD AND ARTICLES
OF PAPER PULP, OF PAPER OR OF PAPERBCARD
3RD QUARTER
TONNE 1990 1989
781 636
552 038
469 829
518 573 151 807 114 951
287 433
399 615 361 803
103 160
203 925
104 362
145 030
068 962
850 369
166 633
83 100 72 769
753 133
518 093
734 185
813 946 159 143
64 257
234 808
528 824 260 205
44 893
874 450
780 341
494 273
401 205
735 985
1 08 101
106 985 48 803
CUBIC METRE 1990 1989
2 317 845
854 645
2 427 426
488 945 75 485
183 382
825 133
467 550 434 746
40 324
459 758
292 104
339 706
25::1 685
927 598
269 679
61 843 159 451
- 69 -
2 240 977
776 784
2 459 728
788 03 1 69 389
103 588
796 98 'J
625 309 309 896
21 308
097 233
937 548
760 222
639 41(1
597 92 1
176 813
89 13 2 112 637
1990
5 ,1,19 889
4465710
772 Q62 417 158 289 676
3 435 548
as 4 937 8ge 590
2 40 383
2714614
2 423 693
3 219 67C
3 006 406
2 247 780
381 426
227 760 189 161
JANUARY TO SEPTEMBER
TONNE 1989
4 961 173
4 224 051
4 391 442
2 000 955 491 325 200 844
3 129 932
073 932 785 261
167 395
2 937 025
2 665 453
3 912 795
3638582
2 209 728
293 132
441 308 132 262
CUBI C METRE 1990 1989
6 716 912
5 343 870
6 464 053
1 635 447 180 379 467 652
4 769 946
1 234 289 1058259
99 268
3 317 983
. 2848959
3 755 105
3 517 494
5190775
627 938
164 462 416 956
6 359 021
4 977 501
6 773 350
891 964 230 969 323 449
4 628 461
263 101 986 686
75 479
3 585 035
3 160 386
4 554 019
4 257 141
4 566 6112
488 379
332 493 297 653
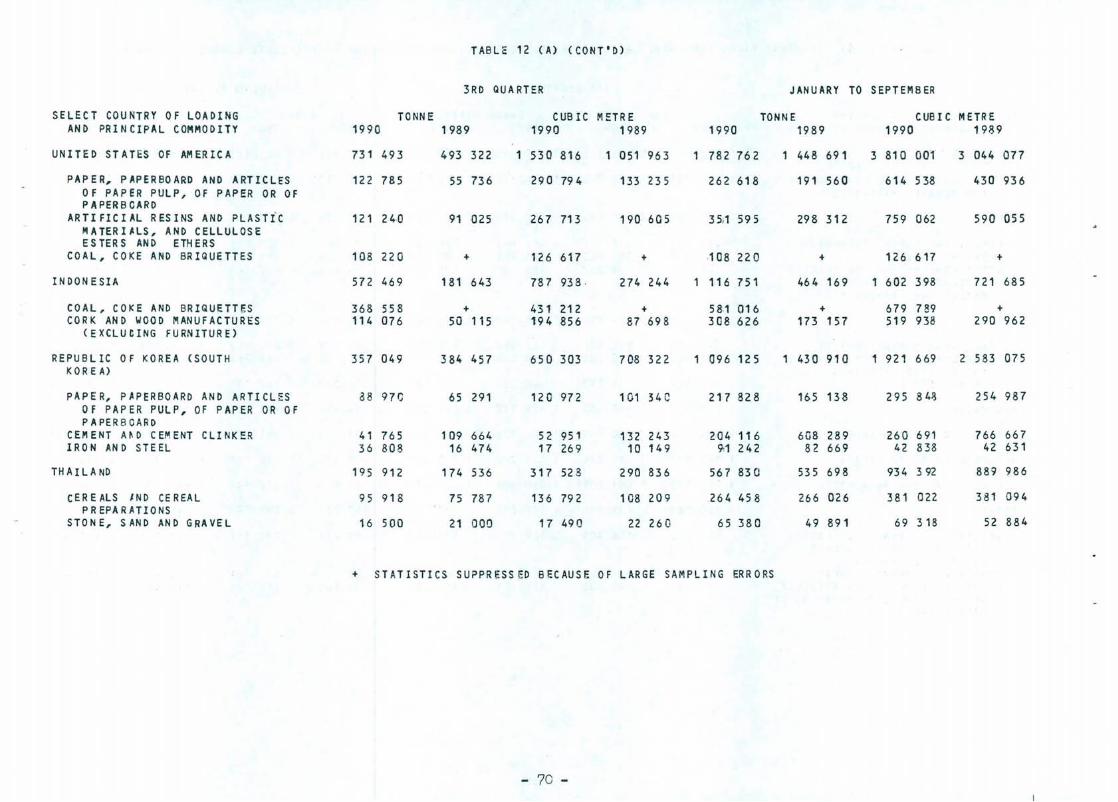
TABLE 12 (A) (CONT'D)
3RD QUARTER JANUARY TO SEPTEMB ER
SELECT COUNTRY OF LOADING TONN E CUB IC METR E TONNE CUB I C METRE AND PRINCIPAL COMMODITY 1990 1989 1990 1989 1990 1989 1990 1989
UNITED STATES OF AMERICA 731 493 493 322 530 816 051 963 1 782 762 1 448 691 3 810 001 3 044 077
PAPER, PAPERBOARD AND ARTICLES 122 785 55 736 290 794 133 235 262 618 191 560 614 538 430 936 OF PAPER PULP, OF PAPER OR OF PAPERBCARD
ARTIFICIAL RESINS AND PLASTic 121 240 91 025 267 713 190 605 35i1 595 298 312 759 062 590 055 MATERI~LS, AND CEllULOSE ESTER S AND ETH ERS
COAL, COKE AND BRIQUETTES 108 220 + 126 617 + 108 220 + 126 617 +
INDONESIA 572 469 t 81 643 787 938 274 244 116 751 464 169 1 602 398 721 685
COAL, COKE AND BRIQUETTES 368 558 + 431 212 + 58;1 016 + 679 789 + CORK AND WOOD MANUFACTURES 114 076 50 115 194 856 87 698 308 626 173 157 519 938 290 962
(EXCLUCING FURNITURE)
REPUBLIC Of KOREA (SOUTH 357 049 384 457 650 303 708 322 096 125 1 430 91Q 1 921 669 2 583 075 KO REA)
PAPER, P~PERBOARD AND ARTICLES 38 970 65 291 120 972 101 He 217 828 165 138 295 84-3 254 987 OF PAPER PULP, Of PAPER OR OF PAPERBOARD
CEM ENT A~ D C EIl!ENT CLINKER 41 765 109 664 52 951 132 243 204 116 6G8 289 260 691 766 667 IRON AND STEEL 36 808 16 474 17 269 10 149 9;1 242 82 669 42 838 42 631
THAILAND 195 912 174 536 317 523 290 836 567 830 535 698 934 392 889 986
CER E AlS tND CE REAL 95 918 75 787 136 792 108 209 .26 " 4S 8 266 026 381 022 381 094 PREPARATIONS
STONE, SAND AND GRAVEL 16 500 21 000 17 490 22 260 65 380 49 891 69 318 52 884
+ STATISTICS SUPPRESSED BECAUSE OF LARGE SAMPLING ERRORS
- 70 -

TABLE 12 (B) SEABORNE CARGO LOADED ANALYSED BY SELECTED COUNTRY OF DISCHARGE ey PRINCIPAL COMMODITY - OUTWARD
SELECT COUNTRY OF DISCHARGE AND PRINCIPAL CO,.,"'ODITY
UNITED STATES OF AMERICA
TOYS "'I S.C ELL A NEOU SI1 ANU F AC TU RED
ARTICLES, N-.E-.S. GARMENTS OF MIXED MATERIALS OR
o THE R M ATE R I A LS, N. E-. S •
CH INA
PETROLEU~, PETROLEUM PRODUCTS AND RelATED MATERIAlS
TAIWAN
CLAY AND KAOLIN CRUDE ANIMAL AND V~GETABLE
,., ATE R I A LS, N-. E • S • METALLIFEROUS OR ES AND METAL
SCRAP
JAPAN
PETROLEUM, PETROLEUM PRODUCTS AND RELATED MATERIALS
METALLIFEROUS ORES AND METAL SCRAP
8EV E RAG ES
SI NGAP ORE
VEGETABLES AND FRUIT MISCELLANEOUS EDIBLE PRODUCTS
AND PREPARATIONS
FEDER AL R EFUBLIC OF GERMANY
TOYS MISCELLA~EOUS MANUFACTURED
ARTICLE-
3RD QUARTER
TONNE · CUBIC METRE 1990 1989 1990 1989
740 36:1
17 4 844 60 974
47 028
527 653
412 000
415 500
70 073 69 119
58 671
196 136
25 001
20 848
15 971
184 073
35 442 12 747
15 U 179
21 701 13 239
683 094 4 458 938 4 006 813
138 155 564 787 210 737 43 967 328 165 238 943
40 580 300 900 259 142
629 214 716 535 871 468
488 758 461 930 . 561 087
347 639 749 805 601 983
77 543 84 323 83 918 52 752 106 307 84 704
55 875 59 202 55 134
156 420 574 6e7 470 757
+ 27 501 +
18 955 29 159 27 273
8 895 2S 295 14 194
160 483 479 486 418 183
36 643 78 421 78 212 9 040 19 950 14 133
94 084 838 058 540 603
13 149 183 189 111 216 10 244 71 425 61 167
- 71 -
1990
JANUARY TO SEPTEMBER
TONN E 1989
CUBIC METRE 1990 1989
1904565 1757 820 10877 651 9 719 69(}
337 000 273 711 2 924 445 2 329 039 146 264 129 708 793 650 701 887
11Q 583 100 738 693 969 618 863
1 470 856 432 546 2 002 034 2 109 117
164 855 028 013 314 187 173 359
117:1 901 051 921 2 053 303 860 383
205 86 0 2Q9 478 23 0 ~ 56 225 857 189 077 152 759 291 340 239 099
193 543 167 382 19 0 926 166 923
491 742 461 477 469 936 1 255 3B9
31 11 5 + 34 288 +
6 0 410 47 871 79 451 66 407
31 22 4 22 83 1 50 348 37 054
486 948 404 389 3D5 378 051 982
75 044 7 0 471 179 530 163 821 29 777 27 036 46 181 42 135
381 851 246 379 2 05 0 716 1 314 182
44 566 26 850 36 0 855 218 673 34 342 33 058 186 867 184 676

TABLE 12 (B) (CONT'D)
3RD QUA RTER JANUARY TO SEPTEMBER
SELECT COUNTRY OF DISCHARGE TONN-E CUB I C METRE TONNE CUBI C . fIIETR::: AND PRINCIPAL COMMODITY 1990 1989 1990 1989 199.0 1989 1990 1989
FEDERAL REPUBLIC OF GERMANY
COTTON GARMENTS 12 707 9 661 74 529 57 318 32 897 23 635 183 789 134 543
REPUBLIC OF KOREA (SOUTH 120 003 115 779 215 245 211 379 328 826 381 597 612 808 701 883 KO REA)
MISCELLANEOUS MANUFACTURES OF 16 828 20 007 18 118 21 989 411 047 62 964 45 822 64 853 I'IE TAL AND /'fON-METALLIC M I NER ALS, N. E·.S.
I R 0 N AN D S TE EL H i 826 3 401 8 01 Q 3 162 18 855 12 213 15 363 11 869
UNITED KI NGDOM 114 920 90 473 629 886 483 683 264 005 233 806 328 885 181 193
TOYS 24 081 18 361 217 258 143 518 46 149 39 207 393 529 314 802 COTTON GARMENTS 7 178 8 078 38 516 40 979 16 047 20 867 82 602 105 392
INDONESIA 1 as 727 112 218 207 976 201 415 330 100 314 116 634 194 544 439
METALLI F EROUS ORES AN D METAL 23 381 23 651 28 319 27 072 79 541 70 063 89 589 74 079 SCRAP
OTHE~ MACHINERY AND EQUIPMENT 12 243 6 095 35 453 14 912 32 821 17 167 87 362 43 336 AND P A H S, N·. E·. S •
INORGANIC CHEMICALS 7 006 8 155 9 396 10 182 29 132 25 464 36 610 34 381
NETHERLANDS 84 3% 63 119 441 160 306 104 214 317 177 521 070 015 763 077
TOYS 11 238 9 161 103 270 78 254 24 129 19 806 218 482 163 491
+ STATISTICS SUPPRESSED BECAUSE OF LARGE SAMPLING ERRORS
- 72 -

TABLE 13 (A) SEABORNE CARGO DISCHARGED ANALYSED BY SELECTED PORT OF LOADING BY PRINCIPAL COMMODITY ~ INWARD
SELECT PORT OF LOADING AND PRINCIPAL COMMODITY
SINGAPORE
PETROLEUM, PETROLeUM PRODUCTS AND RELATED MATERIALS
RICHAR OS BAY
COAL, COKE AND BRIQUETTES
Q I N H U A NG D A 0
COAL, COKE AND BRIQUETTES
ABBOT POI N T
COAL, COKE AND BRIQUETTES
NEWC A S TLE
COAL, COKE AND BRIQUETTES
KEELUNG
ARTIFICIAL RESINS AND PLASTIC "'ATERHLS, AND CELLULOSE ESTER SAND ETHERS
TEXTILES OF ~AN-MADE FIBRES T E X T IL E Y A RNA N D T HR E AD, At L
K I NOS
KAOH SlUNG
ARTIFICI~L RESINS AND PLASTIC M ATER I ALS, AND CELLULOS E ESTERS AND ETHERS
IRON AND STEEL
3RD QUARTER
TONNE CUBIC METRE 1990 1989 1991) 1989 1990
JANUARY TO SEPTEMBeR
TONN E 1989
CUB I C METRE 1990 1989
781 6361 753 133 2 317 845 2 240 977 5 .119 889 4 961 173 6 716 912 6 359 021
552 038 518 093 854 645 776 784 4 465 710 4 224 051 5 343 870 4 977 501
094 568 420 964 261 558 650 625 3 085 749 3 694 123 3 557 7S9 4 285 876
1 068 962 4~1 205 250 685 639 410 3 [06 406 3 638 582 3 517 494 4 257 141
407 813 544 936 483 880 654 979 1 084 197 108 665 286 293 1 324 682
399 615 528 824 467 550 625 309 054 937 1 073 860 234 289 263 001
393 735 111 878 460 670 130 897 514 459 460 806 601 917 539 143
393 735 111 878 460 67 0 130 897 514 459 460 806 601 917 539 143
377 283 337 4 89 441 421 394 883 893 471 885 288 045 314 035 227
377 283 337 229 441 421 394 558 892 972 883 529 044 777 0 33 729
331 047 268 830 901 85 0 744 321 929 881 a07759 2 521 615 2 174 559
44 608 21 660 76 144 39 48 I) 1-04 648 82 977 185 6 15 1 45 2 11
35 194 27 779 110 908 81 542 89 407 71 922 273 643 207 396 30 256 19 585 80 455 55 125 81062 69 377 230 611 195 996
325097 327 9~8 634113 599695 763197 874249 552636 1602450
117 235 83 697 185 556 132 674 262 556 200 294 416 355 322 268
31 955 14 794 14 421 7 603 58 308 67 379 33 831 33 860
- 73 -

TABLE 13 (A) (CONTrD)
3RD QUARTER JANUARY TO S EPTEMB ER
SELECT PORT OF LOADING TONNE CUB IC METRE TONNE CUB I C METRE AND PRI N ClPAL COMODITY 1990 1989 1990 1989 1990 1989 1990 1989
DALIAN 261 061 159 108 331 523 214 992 639 092 556 223 809 538 753 084
PETROLEUM, PETROLEUM PRODUCTS 208 805 106 589 254 058 131 073 47'1 984 385 506 569 558 490 818 AN D RELATED MATERIALS
BUSAN 258 388 212 924 516 340 457 776 674 422 596 140 354 993 1 359 710
PAPER, PAPERBOARO AND ARTICLES 74 464 58 371 102 738 91 499 173 891 132 087 238 883 203 41 1 OF PAPER PULP, OF PAPER OR OF PAPERBCARD
ARTIFICIAL RESINS AND PLASTIC 27 819 40 372 44 914 63 259 83 691 86 485 131 586 137 863 MATERIALS, AND CELLULOSE ESTER S AN D ETH ER S
CEMENT AND CEMENT CLINKER 21 941 + 27 378 + H 211 + 63 444 + SA,..AR I NOA 256 113 12 368 313 343 18 692 436 634 33 552 545 126 57 111
COAL, COKE AND BR IQUE TTES 232 950 + 272 551 + 377 953 + 442 205 +
+ STATISTICS SUPPRESSED BECAUSE OF LARGE SAMPLING ERRORS
- 74 -

TABLE 13 (B) SEABORNE CARGO LOADED ANALYSED BY SEL~CTED PORT OF DISCHARGE BY PRINCIPAL COMMODITY - OUTWARD
SELECT PORT OF DISCHARGE AND PRINCIPAL COMMODITY
OTHER, CHIN ~
PETROLEU~, PETROLEUM PRODUCTS AND RELATED MATERIALS
KEELUNG
CLAY AND KAOLIN CRUDE ANIMAL AND VEGETABLE
1'!ATERIALS, N·.c.S. STONE, SAND AND GRAVEL
LONG BEACH
TOY S FOOTWEAR MISCELLANEOUS MANUFACTURED
ARTICLES, N.E.S.
LOS ANGELES
TOY S GARI'lENTS OF I'lIXED MATERIALS OR
OT~ER ~ATERIALS, N.E.S. MISCELLANEOUS MANU~ACTURED
ARTICLES, N.E.S.
SI NGAP ORE
Vi:GETABLES AND FRUIT MISCELLANEOUS EDIBLE PRODUCTS
AND PR EPARATIONS
K AO H SlUNG
METALLIFEROUS ORES AND METAL SCRAP
CRUDE ANIMAL AND VEGETABLE MATERIALS, N·.E.S.
3 RD QUA RTER
TONNE CUBIC METRE 1990 1989 1990 1989
278 · 408
249 598
225 378
69 422 55 24C
8 871
217 938
52 590 16 840 14 768
194 531
49 266 22 505
15 471
184 073
35 442 12 747
144 415
39 830
12 304
268 789
230 025
208 480
76 349 35 155
7 699
193 098
39 284 13 827 11 623
179 201
39 620 18 614
7 690
160 483
36 643 9 040
100 1J05
26 672
16 373
338 146
279 362
376 603
83 634 75 499
4 258
343 889
493 717 136 056
75 31 0
223 500
452 277 135 745
80 776
479 486
78 421 19 950
297 942
40 614
26 353
- 75 -
340 307
262 520
330 475
82 520 52 563
3 745
186 825
370 61 7 92 495 58 332
047 020
321 396 113 671
41 537
418 183
78 212 14 133
'98 433
25 748
29 789
JANUARY TO SEPTEMBER
1990 TONNE
1989
727 843
650 731
202 B07 145 499
29 765
575 995
109 359 56 713 36 043
493 7 0 2
87 695 49 219
36 001
486 948
75 044 29 777
37·0 177
92 693
38 646
59 S 601
511 603
577 491
205 312 103 913
23 043
478 9S 0
72 216 33 S99 31 S63
479 428
77 445 45 045
32 543
4C4 389
70 471 27 036
346 076
96 942
44 366
CUBIC METRE 1990 1989
887 593
729 895
1 048 688
226 755 201 224
13 202
3 . 395 308
977 840 420 499 190 852
2 B65 153
773 280 295 458
195 813
1 305 378
179 530 46 181
77 2 856
91 277
78 002
758 067
581 932
878 478
221 247 148 975
11 180
2 701 745
660 169 225 564 159 560
2 692 032
630 966 269 308
171 243
051 982
163 821 42 135
727 711
94 597
79 899

TABLE 13 (B) (CONT'D)
3RD QUA RTER JANUARY TO SEPTEMBER
SELECT PORT OF DISCHARGE TONNE CUB IC METRE TONNE CUB I C METRE AND PRINCIPAL COMMODITY 1990 1989 1990 1989 1990 1989 1990 1989
KAOHSIUNG
C EM E NT AND CEMENT CLINKER 11 173 + 12 211 + 22 423 + 23 941 + . HAJIIIBURG 135 293 85 843 749 897 489 715 34-0 34 a 225 096 827 768 1 193 488
TOYS 18 983 11 669 157 910 98 701 39 148 23 915 317 114 194 634 MISCELLANEOUS ' MANUFACTURED 12 193 9 601 65 9B3 58 066 31 551 30 018 171 846 169 630
ARTICLES, N.E.S. COTTON GARMENTS 11 76'1 9 434 69 055 55 890 3·1 376 22 785 174 931 129 401
GUAN6ZHOU (INCL. HUANGPU) 94 564 146 263 105 867 168- 445 306 160 309 411 343 988 352 802
PETROLEU~, PETROLEUM PRODUCTS 94 341 145 568 105 070 167 195 3·C5 435 308 354 342 323 349 949 AND RElATED MATERIALS
BUSAN 92 667 91 591 176 489 181 780 259 668 321 860 517 289 622 775
CLAY AN D KAOLIN 9 295 10 259 Hl 102 11 122 3:1 390 25 464 33 961 27 664 I~ON AN D STEEL 6 942 2 396 4 294 2 273 1.1 336 8 452 7 836 8 342
ROTTE R DAM 84 306 62 050 441 160 302 512 214 252 176 044 069 803 758 093
TOYS 11 238 9 161 103 270 78 254 24 129 19 806 218 482 163 491
+ STATISTIC S SUPPRESSED BECAUSE OF LARGE SAMPLING ERRORS
- 76 -

TABLE 14 (A) SEABORNE CARGO DISCHARGED ANALYSED BY PRINCIPAL COMMODITY BY SELECT~D PORT OF LOADING - INWARD
PRINCIPAL COMMODITY AND SELECTED PORT OF LOADING
COAL, COKE AND BRIQUETTES
RI CHAR 0 S BAY QINHUANGDAO ABBOT POINT NEW CAST LE
PETROLEUM, PETROLEUM PRODUCTS AND RELATED MATERIALS
SINGAPORE
CEMENT AND CEMENT CLINKER
UBE OTHER,JAFAN TSUKUMI SAIKI
IRON AND STEEL
OTHER,JAPAN SHANGHAI OTHER,BRAZIL OSAKA
ARTIFICIAL RESINS AND PLASTIC MATERIALS, AND CELLULOSE eSTERS AIID HHERS
KAOHSIUNG KEEL UNG LONG BEA CH
PAPER, PAPERBOARD AND ARTICLES OF PAPER PULP, OF PAPER OR OF PAPERBOARD
BUSAN
3RD QUA RTER
TONNE 1990 1989
3 166 105
1 068 962 399 615 393 735 377 283
2142553
552 038
852 090
162 500 103 360
94 000 87 500
626 210
45 221 42 159 37 024 32 086
575 814
117 235 44 608 39 111
529 Q46
74 464
2 937 202
1 401 205 528 824 111 878 337 229
2 230 123
518 093
156 041
183 090 191 950 202 000 105 OCO
650 960
58 030 10 909
107 795 25 310
433 005
83 697 21 660 28 218
380 556
58 371
CUB lC M c;r R e 1990 1989
3 704 500
1 25 n 685 467 550 46 Cl 670 441 421
2 565 687
854 645
826 552
190 685 70 155
121 26 1:;
53 375
313 524
31 413 15 787 13 614 11 228
1 035 908
185 556 76 144 83 393
010 575
102 738
3 467 754
1639 410 625 309 130 897 394 558
2 629 896
776 784
128 441.
193 897 117 09 i) 260 580
64 05"
3 04 29 i
24 679 6 14 2
41 14 (] 9 151
764 19 0
132 674 39 48 j 55 396
739 152
91 499
- 77 -
1990
7469081
3 006 406 1 054 937
5·14459 892 972
6 165 698
4 465 710
2 764 084
430 700 426 360 320 613 281 000
847 231
123 389 113 894 15G 840 102 985
517 899
262 556 104 648 107 095
300 979
173 891
JANUARY TO SEPTEMBER
TONN E 1989
7 931 528
3 638 582 1 073 860
460 806 883 529
6 058 585
4 224 051
3 305 562
459 230 503 246 495 855 323 DO 0
980 584
188 693 50 388
232 726 87 399
1 248 502
200 294 82 977 85 819
1 083 246
13 2 087
CUB I C M ETR E 1990 1989
8 752 252
3 517 494 1 234 289
601 917 044 777
7 312 655
5 343 870
2 596 441
536 663 266 880 394 279 171 410
886 144
67 638 44 617 58 018 35 619
2 723 999
416 355 185 615 224 396
2 499 323
238 883
9 328 654
4 257 141 1 263 001
539 143 033 729
7 242 644
4 977 501
3 239 316
504 456 322 620 602 670 202 280
962 160
89 931 25 538 83 241 32 037
2 178 179
322 268 145 211 162 200
2 075 876
203 411

TABLE 14 (A) (CONT'D)
3 RD QUARTER JANUARY TO SEPTEMBER
PRINCIPAL COMMOD ITY AND TONNE CUB I C M ETR E TONN E CUB I C METRE SELECTED PORT OF LOADING 1990 1989 1990 1989 .1990 1989 1990 1989
PAPER, PAPERBOARD AND ARTICLES OF PAPER PULP, OF PAPER OR OF PA PE RBO A RD
HAMBURG 30 755 19 735 48 433 29 315 77 135 63 345 120 974 98 701 TA I C HUN G 30 381 18 354 62 34 t1 36 800 89 123 60 170 181 064 121 581
CEREALS AND CEREAL 224 414 191 497 322 477 279 709 6:19 896 649 876 917 076 961 883 PREPARATIONS
BANGKOK 95 918 75 787 136 792 108 209 264 458 265 126 381 022 379 819 OTHER,USA 27 11 5 7 145 35 521 9 360 82 603 54 795 108 211 73 908 S Y D N EY 13 286 19 804 16 767 25 356 33 887 41 776 43 039 56 697
VEGETABLES AND FRUIT 176 841 193 665 4Q5 511 414 617 492 952 519 303 120 989 107 718
OAKLAND 36 299 37 192 98 635 89 207 52 020 52 717 134 136 128 606
CORK AND WOOD MANUFACTURES 169 940 87 696 289 684 150 974 454 751 298 898 763 294 504 168 (EXCLUDI/iG FURNITURE)
OTHER,INOONESIA 68 263 32 135 116 03 ;) 56 781 ac 61 Q 96 754 301 725 163 565 SAMARIND~ 23 163 5 812 40 792 10 275 58 375 25 735 102 439 46 893
MISCELLANECUS MANUFACTURES OF 167 308 169 330 249 723 238 596 452 570 462 916 650 348 649 638 METAL AND NOK-METALLIC MINERALS, N.E.S·.
- 78 -

lABL E14 (B) SEABORNE CARGO LOAD_~P ANALYSED BY PRINCIPAL C,QMMODITY BY SELECJ.!;j1l PORT o F D IS CH A R G E-" ~, ,.,OU.TW A R D
3RD QUA RTER J ANU ARY TO SEPTEMBER
PRINC IPAL COMMOD ITY AND TONNE CUB I C METRE TONN E CUB I C METRE SELECTED PORT OF DISCHARGE 1990 1989 1990 1989 1990 1989 1990 1989
PETROLEUM, PETROLEUM PRODUCTS 509 542 540 554 571 730 621 951 358 051 1 196 788 532 833 1 368 595 AND RELATED MATERIALS
OTHER,CHINA 249 598 230 025 279 362 262 520 65C 731 511 603 729 895 581 932 GUANGZHOU <INCL·. HUANGPU) 94 341 145 568 105 070 167 195 305 435 308 354 342 323 349 949 MACAU 52 124 29 803 54 616 31 054 111 479 84 757 116 487 88 508
TOYS 298 258 235 677 2 618 364 999 809 602 068 485 875 S 111 654 4 002 474
LONG BEACH 52 590 39 284 493 717 370 617 109 359 72 216 977 840 660 169 LOS ANG a ES 49 266 39 62 0 452 277 321 396 87 695 77 44S 773 280 630 966 SEATTLE 21 698 13 946 186 912 105 422 44 461 31 222 365 729 238 203 HAMBURG 18 983 11 669 1 S 7 910 98 701 39 148 23 915 317 114 194 634
MISCELLANEOUS MANUFACTU RE 0 158 053 130 105 748 239 634 123 396 236 360 163 867 620 748 553 A R TI CL E S, N·. S • S·.
LOS ANGElES 15 471 7 690 80 776 41 537 36 001 32 543 195 813 171 243 LONG BEACH 14 768 11 623 75 31(; 58 332 36 043 31 563 190 852 159 560 HAMBURG 12 193 9 681 65 983 58 066 3,1 551 313 018 171 8 46 169 630
CRUDE AN I MAL AND VEGETABLE 133 23 7 112 843 237 447 203 812 385 352 349 912 688 296 641 128 MATERIALS, N.E,.S.
K EEL UNG 55 240 35 155 75 499 52 563 145 499 103 913 201 224 148 975 KAOH SIU N G 12 304 16 373 26 353 29 789 38 646 44 866 78 CO2 79 899 BAN GKOK 1 C' 469 7 3~6 1 5 766 11 37 () 38 426 26 482 S9 169 42 660 MANILA 9 701 4 103 14 969 6 598 22 812 13 640 37 700 23 258
METALLIFERCUS ORES AND METAL 122 844 130 615 141 317 148 53 0 402 589 402 999 447 638 451 141 SCRAP
KAOHSIUNG 39 83 0 26 672 40 614 25 743 92 693 96 942 91 277 94 597 TAICHUNG 12 363 9 605 12 109 9 965 56 3G5 27 801 55 171 28 005 BcLAWAN 11 186 15 964 15 884 19 718 46 114 31 470 56 574 37 262 K EEL UNG 6 478 19 597 6 478 19 421 44 545 42 639 44 479 44 321
- 79 -

TABLE 14 (8) (CONT'D)
3RD QUA RHR JANUARY TO SEPTEMBER
PRINCIPAL COMMOD ITY AND TONNE C US I C M ETR E TONNE CUB I C METRE SELECTED PORT OF DISCHARGE 1990 1989 1990 1989 ,1990 1989 1990 1989
MISCELLANEOUS MANUFACTURES OF 115 204 100 889 236 721 186 24 8 321 764 275 378 677 494 480 329 METAL A~O NON-METALLIC MINERALS, N·. E. S·.
IN C H ON 10 067 9 654 9 922 8 672 26 OGO 21 035 26 161 19 094 BUSAN 6 761 10 353 8 195 13 317 15 Q47 41 928 19 661 45 759 KEEL UNG 6 260 4 900 9 939 6 46 ,] 16 137 13 668 23 926 20 319
GARMENTS OF MIXED MATERIALS OR 109 118 87 227 693 650 558 829 247 573 216 750 534 079 1 335 927 OTHER MATERIALS, N.E.S.
LOS ANGELES 22 5 a5 18 614 135 745 113 671 49 219 45 045 295 458 269 308 HAMB URG 11 153 8 402 76 050 60 88 " 26 671 21 121 174 288 144 134
VEGETABLES AND F Run 90 372 92 697 199 350 199 237 212 548 220 170 476 468 475 673
SIN G APO RE 35 442 36 643 78 421 78 212 7S 044 70 471 179 530 163 821 KAOHSIUNG 4 943 5 224 1fl 252 9 507 16 880 17 252 32 417 31 328
CLAY AND KAOLIN 83 526 93 324 98 599 100 714 248 240 255 627 275 100 274 218
K"ELUNG 69 422 76 349 83 634 82 52 'J 202 807 205 312 226 755 221 247
PULP AND W JSTE PAPER 79 568 102 766 181 237 235 277 237 669 302 603 543 377 697 440
OTHER,CHINA 20 189 20 239 46 279 46 505 49 203 49 863 112 962 113 444 TAL CHUNG 17 757 23 Q73 40 856 52 923 56 379 85 777 129 583 196 197 BANGKOK 16 981 23 675 38 615 55 577 53 572 68 036 124 991 165 378 MANILA 11 620 11 758 25 238 25 547 32 286 26 156 70 189 56 582
.'
- 80 -

TABLE 15 CA) SEABORNE CARGO DISCHARGED ANALYSED BY SELECTED PORT OF LOADING BY SELECTED SHIP TYPE - INWARD
SELECTED PORT OFLOADI~G AND SELECTED SHIP TYPE
SINGAPORE
OIL TANK ER GAS CARR IER/TANKER
RICHARDS BAY
DRY gULK CARRIER 080 CARRIER
Q 1 N H U A NG D A 0
DRY BULK CARRIER
ABBOT POINT
OBO CARRIER
NEW CAS TLE
OBO CARRIER
KEELU NG
CONTAINER VESSEL
KAOHSIUNG
CONTAINER VESSEL CONVENTIONAL CARGO VESSEL
DALlAN
OIL TANK ER CONTAINER VESSEL
3RD QUARTER JANUARY TO SEPTEMBER
TONNE CUBIC METRE . TONN!; CUB I C ill ETR E 1990 1989 1990 1989 ,1990 1989 1990 1989
1 781 636 753133 2 317 845 2., 240. 977 5 '1119 889 4 961 173 6 716 912 6 359 021
120.7 923417 420: "453836 1 651 683 3 669119 3 964 187 4- 417 116 4- 673 523 284 .241 + 325 161 + 5M 792 + 637 488 +
1 09~ 568 1 420 964 261 558 650 625 3 ~a5 749 3 694 123 3 557 789 4 285 876
550 946 723 209 634 913 842 046 369 663 1 371 149 1 593 618 1 593 014 529 78C 683 983 619 843 800 260 655 157 2 284 640 1 932 426 2 673 029
407 813 544 936 483 880 654 979 084 197 108 665 1 286 293 1 324 682
399 615 528 824 467 550 625 309 -054 841 073 860 234- 164 263 001
393 735 111 878 46067e 130 897 514 459 460 806 601 917 539 143
393 735 111 878 460 670 13C 897 514 459 334 196 601 917 391 009
377 283 337 489 441 421 394 883 893 471 885 288 1 045 314 035 227
305 666 207 814 357 629 243 142 821 355 617 623 960 985 722 619
331047 268880 901850 744321 929881 807759 2521615 2174559
295902 222540 811 0~3 613 031 786029 663474 2175266 796540
325 097 327 908 634 113 599 695 763 197 874 249 552 636 602 450
226 003 174 687 497 977 400 406 538 679 485 925 230 .409 112 912 72904 87366 91619 120706 16,1639 299129 218733 374369
261 061 159 11)8 331 523 214 992 639 092 556 223 809 538 753 084
181 058 101 696 218 800 124 461) 4,16 898 339 250 500 942 431 869 40837 + 64670 + 55498 + 97855 +
- 81 -

TABLe 15 ( A) (CONT'D)
3RD QUA RTER JANUARY TO S EPTEMB ER
SELECTED PORT~F ~ LO~DING . TONNE CUB le METRE TONNE CUBIC METRE · AND SEL E CT E D S H If' JY? E 1990 1989 1990 1989 ;199.0 1989 1990 1989
BUSAN 258 388 212 924 516 340 457 776 674 422 596 140 354 993 359 710
CONTA1NER . VESS El 190 26 Q 151 133 396 113 319 369 450 497 398- 119 929 485 939 753
SAMARINDA 256 113 + 313 343 + 436 634 + 545 126 + DRY BULK CARRIER 232 950 + 272 551 + 304 544 + 357 560 +
+ STATISTICS SUPPRESSCD BECAUSE OF LARGE SAfIIPLlNG ERRORS
- 82 -

.TABLE 15 (B> SEABORN~ CARGO LOADED ANALYSED BY SELECT~D PORT OF DISCHARGE B~ SELECTED SHIP TYPE - OUT~ARD
SELECTED peRT OF DISCHARGE AND SEt-ECTED SHIP TYPE
. 0 THE R , CH I N A
o I I TAN K ER
KEELUN6
CONT AIN ER VESS EL CON YEN T ION A L C A RG 0 ve S S El
LONG BEACH
CONTAINER VESSEL
LOS ANGELES
CONTAINER VESSEL
SI NGAP ORE
CONTAINER VESSEL
KAOHSI UNG
CONVENTIONAL CARGO VESSEL CONTAINER VESSEL
HAMBURG
CONTAINER VESSEL
GUANGZ HOU <INCL. HUANGPU>
OIL TAN K ER
BUSAN
CONTAINER veSSEL S Ef'll-CO N 1 AIN ER VESS EL
3RD QUARTER
TONNE 1990 1989
nz 40S
228 207
225 378
121 107 73 635
217 938
213 656
194 531
17 4 097
184 073
147 471
144 415
72 332 68 465
135 293
130 328
94 564
92 341
92 667
· 58 814 33 417
268 789
227 158
208 480
92 348 83 090
193 098
190 109
179 201
147 361
160 483
124 853
100 :]05
40 680 58 134
85 843
83 825
146 263
145 545
91 591
50 138 39 013
CUB IC METRE 1990 1989
338 146
254 733
376 603
256 308 79 324
343 889
320 859
223 5eo
116 304
479 486
409 368
297 942
106 118 177 331
749 897
732 199
, Q 5 867
102 700
176 489
124 196 51 375
- 83 -
340 307
259 584
330 475
202 697 92 087
186 ~25
166 352
047 02!J
874 789
418 183
355 539
198 433
47 267 147 248
482 760
168 445
167 161
1&1 780
1 C5 )) 9!J 70 885
JANUARY TO. SEPTEMBER ·
. TONNE CUBIC METRE ;1990 1989 1990 1989
727 843
623 732
66;1 429
302 974 267 392
575 995
562 196
493 702
428 078
486 94 S
382 397
370 177
165 902 197 144
340 340
330 888
3{l6 160
298 135
259 668
,1/;,1 992 1-16 530
595 601 887 593
510 047 700 281
577 491 048 688
258 671 663 544 214 593 281 335
478950 3395308
472 800 3 321 177
479 428 2 865 153
402 69~ 2 540 004
404 389 305 378
318 500 107 931
3 46 076 77 2 8 56
167 196 244 478 170 934 503 998
225 096 827 768
221 920 1788 021
309 411 343 988
308 331 334 013
321 860 517 289
173 043 301 531 13 9 833 2 1 2 9 93
758 067
580 686
878 478
520 935 242 512
2 701 745
2 668 620
2 692 032
2287146
1 051 982
902 934
727 711
272 298 436 676
1 193 488
1 180 709
352 802
349 915
622. 775
346 119 261 238

TABLE.·15 (B) (CONT'D) .'
3RD · QUARTER JANUARY TO SEPTEMB ER
:' SELECTED PORT OF DISCHARGE TONNE CUBIC. METRE TONN E CUBI C METRE AND SELECTED SHIP TYPE 1990 1989 1990 1989 1990 1989 1990 1989
ROTTERDAM 84 306 62 050 441 160 302 512 2,14 252 176 044 069 803 758 093
CO NT A.IN E R V ESS EL 80 183 60 797 428 143 296 637 2·04 719 167 091 1 034 033 740 671
- 84 -

TABLE 16 (A) INWARD TRANSHIPMENT CARGO ANALYSED BY SELECTED COUNTRY AND PORT OF LOADING
SELECTED CCUNTRY AND PORT OF LOADING
CHINA
S H A N GHA I TIANJIN XINGANG QINGDAO OTH E R,CH INA D AL I AN
UNITED STATES OF AMERICA
CHARLESTCN OAU AND LONG BEACH NEI/ YORK SE A TTLE
TAIl/AN
KEELUNG KAOHSIUNG
JAPAN
TOI'IAKOMAI
SINGAPORE
SIN G APO RE
FEDERAL REPUBLIC OF GERMANY
HAMBURG
NETHERLANDS
RO TT ERD A i'I
AUSTRALIA
SYDNEY
THAILAND
. BANGKOK
3RD QUARTER
TONNE 1990 1989
568 a88
168 858 95 171 65 514 56 197 37 782
202 453
36 787 31 13 2 28 790 21 967 17 990
85 866
46 113 31 498
63 065
8 797
61 622
61 622
50 212
44 109
33 73.9
33 739
29 436
7 411
28 777
28 777
549 . 522
171 546 96 803 67 043 56 709 43082
328 830
72 050 34 345 33 546 19 596 21 649
72 997
26 639 45 811
49 663
+
43 427
43 427
59 142
52 740
49 842
49 842
21 138
+
40 295
40 295
CUBIC METRE 1990 1989
572 707
550 334 261 802 176 796 144 372
90 984
429 192
56 131 71 471 69 569 46 170 39 912
295 539
167 668 100 560
140 079
15 588
136 170
136 170
99 231
90 223
62 310
62 310
49 345
15 149
80 1']4
80 104
- 85 -
499 751
563 327 270 257 165 620 149 793
96 981
579 247
97 486 76 028 85 193 43 646 44 988
251 345
102 :) 59 145 912
113 715
+
99 434
99 434
113 096
102 905
82 063
82 063
34 661
+
95 799
95 799
JANUARY TO SEPTEMBER
TONN E ,1990 1989
1 &{J9 175
470 600 266 522 2'12 381 162 704 1.10 846
692 233
1 C8 634 1>11 275 1,11 894
60 803 70 872
226 792
123 922 87 378
166 177
15 229
169 393
169 393
158 203
135 321
105 350
105 350
55 893
11 571
92 838
92 838
1 583 328
457 828 309 152 214 447 154 161 116 592
944 464
238 660 109 929
99 508 56 454 77 486
209 15 G
87 324 117 634
165 171
+
134 250
134 25(;
156 378
140 419
132 291
132 291
64 442
+
162 845
153 845
CUB I C METRE 1990 1989
4 291 207
450 102 773 781 514 636 405 637 238 776
464 991
167 697 246 010 259 397 135 191 146 150
771 637
428 402 295 033
369 516
28 926
378 072
378 072
296 507
264 C07
196 111
196 111
88 953
20 394
226 293
226 293
4 093 086
1 412 889 781 991 523 040 411 899 243 545
706 454
345 568 237 547 229 503 121 756 149 634
688 959
319 631 354 592
472 578
+
315 769
315 769
323 222
299 213
229 377
229 377
105 030
+
316 573
307 ,)33
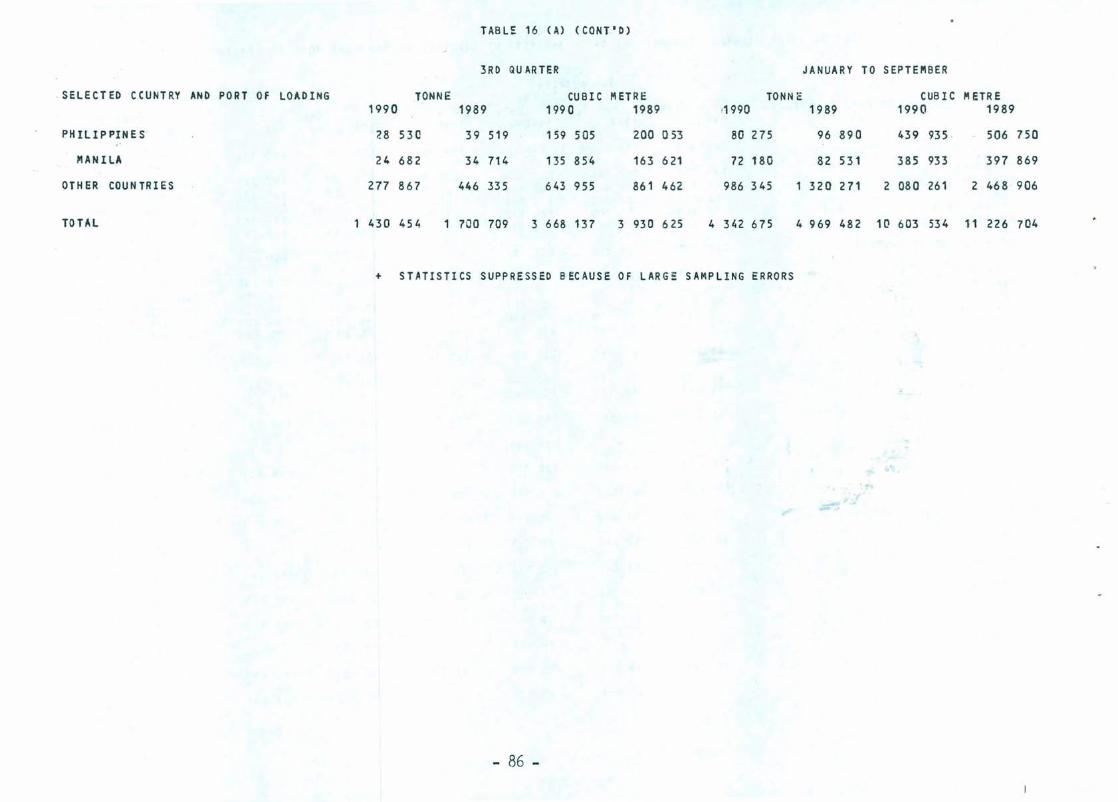
TABU: 16 (A) (CQNT'O)
3RD QUARTER JANUARY TO SEPTEIIIBER
SELECTED CCUNTRY AND PORT OF LOADING TONNE CUBIC METRE TONN c CUB I C METRE 1990 1989 1990 1989 !1990 1989 1990 1989
PHILIPPINES 28 530 39 519 159 505 ZOO 053 80 275 96 890 439 935 506 750
MAN I L~ 24 682 34 714 135 854 163 621 72 180 82 531 385 933 397 869
OTHER COUNTRIES 277 867 446 335 643 955 861 462 986 345 32Q 271 2 080 261 2 468 906
TOTAL 430 454 700 709 3 668 137 3 930 625 4 342 675 4 969 482 1(1 603 534 11 226 704
+ STATISTICS SUPPRESSED B ~CAUSE OF LARG: SAMPLING ERRORS
- 86 -

TABLE 16 (B) OUTWARD TRANSHIPMENT CARGO ANALYSt:D BY SELECTeD COUNTRY AND PORT OF DISCHARG':
3RD QUARTER
SELECTED COUNTRY AND PORT OF DISCHARGE lONNE CUBIC "'ETRE 1990 1989 1990 1989
UNITED STATES OF AMERICA
LONG BEACH LO SANG E LES TA COMA NEW YORK
CH I N A
S H A N GH A I 6UANGZHOU (INCL. HUANGPU) T I AN J I N X IN G AN G ZHANGJIAGANG
SI NG AP ORE
SINGAPORE
TAIl/AN
KEELUNG KAOHSIUNG
PHILIPPINES
'" A N I LA
FEDERAl REPUELIC OF GERMANY
HAMBURG
JAPAN
YOKOHAMA KOB E
NETHERLANDS
ROTTERDAM
THAILAND
BANGKOK
261 774
91 678 39 136 27 998 24 149
212 899
64 687 42 371 21 723 20 95C
130 878
130 878
111 793
62 006 33 469
1;]0 990
95 788
94 7C3
8~ 311
Fl2 237
14 807 14 038
81 110
81 100
78 092
78 092
260 880
73 859 44 843 28 765 32 200
359 838
89 219 22 517 41 2Q3 36 871
110 836
110 836
113 306
80 925 25 858
129 838
124 936
92 748
86 220
85 619
21 968 18 127
95 999
95 934
73 627
73 627
1 033 339
360 064 184 080 125 650
71 869
395 161
124 844 78 831 53 721 21 311
271 501
271 5 [;1
207 562
119 842 56 18 n
188 070
175 B60
335 727
284 130
163 736
30 276 41 492
223 975
223 841
149 891
149 891
- 87 -
909 295
254 622 179 099 125 445
98 284
609 186
197 540 43 722 79 825 38 079
251 571
251 571
208 490
147 629 47 429
240 629
228 751
317 479
290 919
175 286
35 786 52 750
257 631
257 331
140 441
140 441
JANUARY TO SEPTEMBER
TONNE 1990 1989
778 754
262 991 108 492
78 544-91 040
669 679
217 283 102 578
93 004 56 493
359 064
359 1]64
345 643
197 145 11091Q
312 283
296 5S5
3C2 088
274 751
254 755
51 B 67 51 308
270 795
270 481
271 558
271 558
723 198
211 659 118 727
74 219 89 584
002 574
276 778 54 604
153 757 102 002
297 999
297 999
379 59"
257 713 97 736
369 031
359 597
261 734
238 105
240 802
66 811 55 882
262 048
261 906
218 616
218 616
CUBIC "'ETRE 1990 1989
2 783 656
963 8B5 432 127 344 146 245 825
190 786
419 654 184 415 176 336
57 698
777 662
777 662
668 526
392 8.16 199 1.56
590 800
553 955
951 768
349 360
496 765
105 048 122 635
712 447
708 709
503 288
503 288
2 465 572
726 332 497 411 300 391 246 173
747 623
561 181 98 333
315 589 107 351
684 746
684 746
691 349
463 417 179 914
680 913
659 (;91
819 984
742 898
472 37u
112 985 141 246
652 965
651 565
416 496
416 496

TABLE 16 (B) (CONT'O)
3RO . QU ARTER • JANUARY TO SEPTEMBER
SELE CT EO CCUNTRY AND PORT OF OISCHARGE TONNE CUBIC "'ET RE TONN, CUB I C METRE 1990 1989 1990 1989 ·1990 1989 1990 1989
MALAYSIA 48 643 33 351 96 703 67 855 1124 874 95 576 239 389 193 724
PORT KfLANG 21 756 13 050 46 112 27 861 62 45.1 37 318 116 435 76 456
OTHER eau N T RI E S 5.64 675 550 267 1 584 061 489 000 1 696 488 537 144 4 463 240 4 092 975
TOTAL 767 793 1 906 310 4 649 726 4 666 864 5 385 983 5 388 315 13 378 327 12 918 718
- 88 -

··TABLE 17. (A) INWARD TRANSHIPMENT CARGO ANALYSED BY SELECTED COUNlRY AND PORT OF LOADING BY CONTAINERISATION
SELECTED : COUNTRY AND PORT OF LOADING
CH INA CONTAINERISED TOTAL
SH AN GHAI C o NU:! ttE R IS E D
' TOTAL . ClI NG DAO
CONTAINE RIS El> TOTAL
TI ANJlN XINGANG CONTAINERISED TOTAL
GUANGZHOU (INCL. HUANGPU) CO NTAINER ISED TOTAL
X IAMEN COHAINERISEI> TO TAL
OTHER,CHINA CO NTA I NE R 1 SED TOTAL
UNIT E D S T A TE S 0 F AJII ER I C A CONTAINERISED TO tAL
CH A R LfS T ON CON T A I Ni: RI SED TOTAL
OAK LAND CONTAINERISED TOTAL
LONG BEACH COIlTAINERISED TOTAL
NEW YORK CONTAINERISED T01AL
SEATTlE
TAIWAN '
CONTAINERISED TO 'TAL
CONTAINERISED TOlAL
3RD QUA RTER
TONNE 1990 1989
327 056 568 888
82 439 '68 858
41 952 65 514
38 375 95 171
33 185 ' 33 185
32 343 32 382
27 140 56 197
2Q2 453 202 453
36 787 36 787
31 132 31 132
28 790 28 790
21 967 21 967
17 990 17 990
81 747 85 866
271 319 549 522
75 353 171 546
39 024 67 043
51 173 96 803
+
+
26 205 27 568
15 018 56 709
260 274 328 830
72 050 72 050
34 345 34 345
33 546 33 546
19 596 19 596
21 649 21 649
72 199 72 997
CUBIC M.EYRE 1990 19'89
956 16~799658 1 572 707 1 499751
307 412 286 493 550 334 563 327
117 658 1 05 13 2 17 6 796 165 62 a
129 483 154 765 261 802 270 257
56 585 + 56 585 +
88 643 49 093 88 985 51 947
68 685 41 294 144 372 149 793
429 192 508 325 429 192 579 247
56 131 97 486 56 131 97 486
71 471 76 023 71 471 76 028
69' 569 85 1 9 3 69 569 85 193
46 .170 43 646 46 170 43 646
39 912 44 988 39 912 44, 988
287 557 295 539
- 89 -
2 so 124 251 345
JANUARY TO .SEPTEMBER
TONNE CUBIC METRE ,19·<10 1989 1990 1989
9i24 753 1 6·09 17 5
'; .
236-: 820 4:7t 6(}{J
,1.33 194 2,12 381
.123 428 266 522
63 932 63 932
84 245 84 733
74 086 162 704
687 566 692 233
108 634 ,108 634
l1 ' 1~ 27 5 11:1' 275
111 894 11:1 894
~ 803 60 803
70 872 70 872
2~19 31 2 226 792
753 252 '. 2 558 753 2 060 222 1 583 328, 4 291 207 4 093 086
203 618 803 511 689 904 457 828 1 45'0102 412 889
119 352 334 735 320 988 214 44] 514 636 523 040
136 046 410 888 386 826 309 152 773 781 781 991
+ 103 (l35 + + 103 035 +
66 381 207 650 115 409 69 521 209 097 119 143
39 718 181 044 103 945 154 161 405 687 411 899
791 559 1 459 377 1 538 102 944 464 1 464 991 1 706 454
238 660 167 697 345 568 238 660 167 697 345 568
109 929 246 010 237 547 109 929 246 010 237 547
97 231 259 397 228 298 99 508 259 397 229 503
56 454 135 191 121 756 56 454 135 191 121 756
77 486 146 150 149 634 77 486 146 150 149 634
207 338 2Q9 150
76{) 315 771 687
685 157 688 959

TABLE 17 0) (COHT'D)
~
3RD QUARTER JANUARY TO SEPTEJIIB ER
SELECTED CCUNTRY AND . T"ONN E . CUBIC METRE TONNE CUBIC METRE .. .. PORT OF · LOADING 1990 1989 1990 1989 1990 1989 1990 1989
TAIW AN . KEELUNG .
CONTAINERISED ~2 506 26 225 162 034 · 101 559 .1;18 547 86 664 419 8 S6 318 362 TOTAL 46 113 26 639 167 668 102 ,·059 123 922 87 324 428 402 319 631
KAOHSIUN6 CONTAINERISED J"() 985 .' 45 426 ' 9! 21 1' · 145 19.1 85 273 116 892 292 207 352 805 TOTAL 3.:.1 498 45 8'11 100 560 145. 912 87 378 117 634 295 033 354 592
SINGAPORE CONTAINERISED 61 202 41 123 134 964 98 790 :16:1 951 122 770 365 981 301 752 TOTAL 61 622 43 427 136 170 99 434 169 393 134 250 378 072 315 769
SINGAPORE CONTAUERISED 61 202 41 123 134 964 98 79 Q g1 9S1 122 770 365 981 301 . 7.5 2' T01AL 61 622 43 427 136 171) 99 434 :169 393 134 250 378 072 315 769
JAPAN CONTAHlERISED 55 176 37 368 129 782 99 947 148 034 136 726 342 582 424 866 TOTAL 63 065 49 663 140 079 113 71 5 166 177 165 171 369 516 472 Fa
TOMAKO.UI C'O NTAIN£RISEO 8 797 + 15 sas + 15 229 + 28 926 + TOTAL 8 797 + 15 588 + 15 229 + 28 926 +
FE DER At REPUBLIC OF GERMA~Y C1lNTAINERISED 49 975 57 857 98 659 109 543 155 694 147 688 288 774 307 418 TOTAL 50 212 S9 142 99 231 113 096 158 203 156 378 296 507 323 222
HAMBURG CONTAINERISED 43 898 51 537 89 656 99 475 132 837 132 849 256 279 283 662 TOtAL 44 109 52 740 90 223 102 905 135 321 140 419 264 007 299 213
NETHERLANDS CONTAINERISED 33 366 49 220 61 875 80 931 ,Hi4 978 131 669 195' 676 228 245 TO TAL 33 739 49 342 62 3E! 82 063 105 350 132 291 196 111 229 377
ROTTERDAM CONTAINERISED 33 366 49 220 61 875 80 931 104 978 131 669 195 676 228 245 TOlAL 33 739 49 842 62 310 82 063 ·105 350 132 291 196 111 229 377
AUSTRALIA CONTAINERISED 29 436 21 138 49 345 34 661 55 893 64 407 88 953 104 704 TOTAL 29 436 21 138' 49 345 34 661 55 893 64 442 88 953 105 030
SY DN EY CO NTAINERISED 7 411 + 15 149 + .U 571 + 20 394 + TO TAL 7 411 + 15 149 + ,., 571 + 2Q 394 +
- 90 -

TABLE 17 (A) (CONT"O)
3RD QUARTER JANUARY TO S EPTE~B ER
SELECTED COUNTRY AND TONNE CUB IC METRE TONNE CUBIC METRE PORT OF LOADING 1990 1989 1990 1989 ·1990 1989 1990 1989
PHILIPPINES CONTAINERISED 27 855 39 479 158 193 198 973 78 844: 96 850 438 411 50S 670 TOTAL 28 530 39 519 159 505 200 053 8e 275 96 890 439 935 506 750
MANILA CONTAINERISED 24 682 34 714 135 854 163 621 72 180 82 531 385. 933 397 869 TO TAL 24 682 34 714 135 854 163 621 72 180 82 531 385 933 397 869
I1ACAU CONTAINERISED 24 032 18 517 138 903 113 019- 59 621 52 652 330 477 296 9:28 TOT.AL 24 032 18 788 138 903 114 980 59 621 52 938 330 . 477 299 036
MACAU CONTAINERISED 24 032 18 517 138 903 113 019 59 621 52 652 330 477 296 928 TOTAL 24 032 18 788 138 903 114 980 59 621 52 938 330 477 299 036 .
OTHER COUNTRIES CONTAINERISED 219 085 287 590 486 517 613 326 729 637 835 317 1 591 325 1 764 106 TOTAL 282 612 467 842 585 156 842 281 019 562 430 179 1 976 077 2 486 443
ALL COUNTR IES CONTAINERISED 111 382 156 083 2 931 152 2 90.7 297 3 326 283 3 340 229 8 420 625 8 217 168 T01AL 430 454 700 709 3 668 137 3 93Q ~25 4 342 675 4 969 482 10 603 534 11 22.6 704
+ STATISTICS SUPPRESSED BECAUSE OF LARGE SAMPLING ERRORS
- 91 -

TABLE 17 (B) OUTWARD TRANSHIPMENT CARGO ANALYSED BY SELECTED COUNTRY AND PORT OF DISCHARGE BY tONTAINERIS.ATION
3RD QUA RTER JANUARY TO SEPTEI'IB ER
SELECTED COUNTRY AND TONNE CUB IC: METR E TONNE CUBI C METRE · PORT OF DISC~ARGE 1990 1989 1990 1989 199-0. 1989 1990 19S9
UNITE D STATES OF AMERICA . CONTAINERISED 2"61 774 260 880 . 1 ' 033 339: . 909 295 778 754 722 890 2 783 656 2 465 088 TOTAL 261 774 260 880 1 033 339 909 295 7,18 754 723 198 2 783 656 2 465 572
LONG BEA CH CONTAINERISED 91 678 73 859 360 064 254 622 262 991 211 659 963 885 726 332 TOTAL 91 678 73 859 360 064 254 622 262 991 211 659 963 885 726 332
LOS ANGELES CONTAINERISED 39 136 44 843 184 OB{} 179 099 ,H18 492 118 667 432 127 497 314 TO TAL 39 136 44 843 184 080 179 099 108 492 118 727 432 127 . 497 411
TAC 0 MA CONTAINERISED 27 998 28 765 125 650 125 445 7S: 544 74 219 344 146 300 391 TOTAL 27 998 28 765 125 650 125 445 78 544 74 219 344 146 300 391
NEW YORK COHAINERISED H 149 32 200 71 869 98 284 ~1040 89 584 245 825 246 173 TOTAL 24 149 32 200 71 869 98 284 9;1 040 89 584 245 825 246 173
CH INA CONTAINERISED 196 23B . 245' 088 368 099 448 267 546 547 743 000 985 736 1 367 090 TO TAL 212 899 ' 359 838 395 161 609 186 669 679 1 002 574 190 786 1 747 623
SH AN GHA I CONTAINERISED 53 14B 69 793 105 173 144 . 29 a 160 729 219 455 301 151 431 621 TO TAL 64 687 89 219 124 844' 197 540 211'7 283 276 778 419 654 561 H1
GUANGZHOU <INCL. HUANGPU) CONTAINERISED 42 371 21 413 78 831 42. 552 :102' 578 53 206 184. 415 95 " 102
. TOTAL 42 371 22 517 78 831 43 722 tHlt 578 54 604 184 415 98 333 ZHANGJIAGANG
CONTAINERISED 20 9,{1 36 871 21 31 f 38 079 56 493 102 002 57 698 107 351 TOTAL 20 95<' 36 871 21 31 ,' 38 079 56 493 102 002 57 698 107 351
TI ANJlN XINGANG CONTAINERIHD 20 6H 35 64C 52" 192 n 742 75 34-2 130 063 151 947 282 784 TO TAL 21 723 41 203 53 721 .79 825 93 004 153 757 176. 336 315 589
XIAMEN CONTAINERISED 13 256 9 745 26 483 18 324 33 474 36 325 66 455 70 617 TOTAL 13 256 15 710 26 483 24 908 33 474 45 804 66 455 80 925
SI NG AP ORE CONTAINERISED 116 157 98 773 251 651 227 832 325 330 261 054 713 678 620 502 TO TAL 130 878 110 836 271 501 25.1
SINGAPORE 571 359 064 297 999 777 662 684 746
CONTAINERISED J16 157 98 773 251 651 227 832 325 330 261 054 713 678 620 502 TOTAL 130 878 110 836 271 Sal 251 571 359 064 297 999 777 662 684 746
- 92 -

TABLE 17 (B) (CONT'D)
3RD QUARTER JANUARY TO SEPTEMB ER
SELECTED COUNTRY AND TONNE CUB IC METRE TONNE CUEI C METRE PORT OF CISCHARGE 1990 1989 1991) 1989 -19<f.0 1989 1990 1989
TAIW AN CONTAINERISED 110 816 - 113 306 205 79{J 2Q8 490 3402 592 369 471 664 095 680 847 TOTAL 111 793- 113 306 207 5~2 208 49 tJ 345 643 379 594 668 526 691 349 _.
KEELUNG I
CONTAUi.ERISED 61 604 80 925 118 724 147 629 195 076 -- 253 386 389 7C2 459 189 TO'TAL 62 (ro6 80 925 119 842 147_ 629 :197 145 257 713 392 806 463 417
KAOHSIUNG CONTAINERISED 33 H1 25 858 56 016 47 429 HQ 175 94 189 198 619 176 730 TOTAL 33 469 25 858 56 180 47 429 11Q 910 97 736 199 456 179 914
PHILIPPINES CO NTAINE RISED 97 315 125 049 184 540 236 568 303 500 355 961 580 138 668 043 TOTAL 100 990 129 838 188 070 241): 629 3-12 283 369 031 590 8GO 680 913
PIAN ItA CONTAINERISED 92 112 120 147 172 33 Q 224 69 G 287 802 346 527 543 293 646 222 TO"lAL 95 788 124 936 175 860 228 751 29 C 585 359 597 553 955 659 091
FEDERAL REPUBLIC OF GERf'lANY CONTAINERISED 94 643 92 444 335 588 316 631 3C2 028 261 330 951 629 81B 947 TO 'TAL 94 703 92 748 335 727 317 479 302 088 261 734 951 768 8 19 984
HAMBURG CONTAINERISED 83 251 85 916 283 991 290 071 274 691 237 701 849 222 741 862 TO TAL 83 311 86 220 284 130 290 919 274 751 238 105 849 360 742 898
JAPAN CO NTAINE RISED 82 035 85 509 163 355 175 100 254 553 240 692 496 384 472 183 TOTAL 82 237 85 619 163 736 175 286 254 755 240 802 496 765 472 370
YOKOHAMA CONTAINERISED 14 807 21 858 30 276 35 599 51 867 66 701 105 048 112 798 TO TAL 14 8-(17 21 968 30 276 35 786 51 867 66 811 105 048 112 985
KOBE CO ~TAINE RISED 14 038 18 127 41 492 52 750 5,1 308 55 882 122 635 141 246 TOTAL 14 038 18 127 41 492 52 750 5:1 308 55 882 122 635 141 246
NETHERLANflS CONTAINERISED 79 721 95 999 222 643 257 631 268 282 261 485 709 0-04 651 509 TOTAL 81 11Q 95 999 223 975 257 631 270 795 262 048 712 447 652 965
ROTT ERD AM CONTAINERISED 79 711' 95 934 222 509 257 331 268 024 261 342 706 364 650 109 TOTAL 81 100 95 934 223 841 257 331 27e 481 261 906 708 709 651 565
THAILAND CONTAINERISED 64 191 59 801 12 G 904 111 467 228 923 182 597 426 051 350 571 TOTAL 78 092 73 627 149 891 140 441 27;1 558 218 616 503 288 416 496
- 93 -

TABLE 17 (B) (CONT'D)
3RD QUARTER JANUARY 'TO : S EPTEM B ER
SELECTED CaU~TR~AND TONN I: CUB le METRE TONNE CUBIC METRE PORT OF DISCHARGE 1990 1989 1990 1989 11990 1989 1990 1989
THAILAND BAN-6KOK
CO NTAIN£RIS EO 64 191 59 801 120 9Q4 111 467 228 923 182 597' 426 ,051 350 571 TOUL 78 092 73 627 149 891 140 441 27:1 558 218 616- 503 288 416 496
UNITED ,KINGDOM CO NT A I NER IS£D 47 020 50 781 207 793 226 823 .13 9 669 140 904 479 580 530 265 TOTAL 47 020 50 761 207 793 226 823 ,139 669 140 904 479 580 530 265
FELIXSTOWE .' CO tlTAI N'ERISED 25 264 25 886 91 372 121 051 78 786 58 088 239 853 233 873 , "rl)'TAL 25 264 25 886 91 372 121 051 78 786 58 088 239 8. 53 233 873
SOUTHAMP r<lH ' CONoTAINERISED 19 278 20 502 106 880 90 107 53 577 71 795 218 725 262 978 TOTAL 19 278 20 502 1Q6 88 C 90 107 53 577 71 795 218 725 262 978
OTHER COUN TRIES CONTAINERISED 5a2 472 446 096 1 359 783 1 175 021 1 468 037 1 262 842 3 833 871 3 334 297 TOTAL 566 297 532 837 1 472 972 1 330 032 1 68:1 693 1 491 817 4 223 05Ci 3 756 434
ALL CO UNTRIES CONTAINERISED 652 3a2 1 673 727 4 453 486 4 293 127 4 958 216 4 802 227 12 624 621 11 959 342 TOTAL 767 793 1 906 310 4 649 726 4 666 864 5 385 983 5 388 315 13 378 327 12 918 718
- 94 -

TABLE 18
PR I N C I PAL CO"''''OO ITY
ORY BULK
IRON A"NO STEEL
LIQUID BULK
GENERAL CAli60
ORGANIC CHEMICALS OTHER ~ACHINERY AND EQUIPMENT
AND PARTS, N-.E.S. MISCELLANEOUS MANUFACTURES OF
METAL AND NON-I'IETALLlC "'INERALS, N.E.S.
ARTIFICIAL RESINS AND PLASTIC MATERIALS, AND CELLULOSE ESTERS AND ETHERS
PAPER, PAPERBOARD AND ARTICLr-S OF PAPER PULP, OF PAPER OR OF PAPERBOARD
GARMENTS OF ~IXED MATERIALS OR OTHER ~ATERIAlS, N.E.S.
CANNED FeOD INORGANIC CHE"'ICALS TEXTILE FIBRES CRUDE ANIMAL AND VEGETABLE
MATERIALS, N-.E.S. VEGETABLES AND FRUIT CORK AND WOOD MANUFACTURES
(EXCLUDING FURNITURE) PULP AND WASTE PAPER l'IISCELLHEOUS EDIBLE PRODUCTS
AND PREPARATIONS FOOTWEAR CHEMICAL MATERIALS AND
PRODUCTS, N.E.S. TOYS
TOTAL
(A) INWARD TRANSHIPMENT CARGO ANALYSED BY PRINCIPAL CO"''''ODITY
3RD QUARTER
TONN-e 1990 1989
114 062
55 707
8 920
T 307 472
10S 422 95 950
88 DOS
77 014
57 166
53 838
5e 818 50 79C 48 788 42 640
35 405 31 148
30 655 24 044
23 785 21 290
21 003
430 454
301 339
59 419
13 347
1 386 024
133 210 94 587
95 079
116 919
54 317
51 243
46 761 47 672 66 435 62 650
38 132 11 347
36 650 2Q 787
15 288 3C 898
16 290
700 709
- CUB I C- METR E: 1990 1989
126076
44 366
12 452
3 529 609
13 8 094 255 307
14 9 279
141 620
118 814
32{) 782
71 191 62 802
119 388-77 240
62 533 65 853
64 939 48 284
13 6 384 39 030
153 406
3 668 137
- 95 -
322 584
42 235
16 617
3591425
170 504 268 340
155 195
210 360
98 coa
3 CO 044
67 0:98 59 000
156 7!3 5 106 073
74 616 23 210
78 855 37 739
82 259 53 533
128 083
3 930625
JANUARY TO ' SEPTEMBER
TONNE -t990 1989
47ft 342
t50 350
20 624
3 847 7Q9
3-04 865 272 414
25-C 106
268 586
168 899
143 428
15,1 1 Q 5 128 393 169 892 155 591
119 078 70 261
101 .1 531 75 920
65 222 7C 568
43 251
4 342 675
897 809
198 267
25 957
4 045 716
372 183 266 885
283 194
296 343
13 6 042
119 438
149 207 125 277 213 719 215 974
115 537 27 683
122 758 63 220
44 816 99 946
41 852
4 969 482
CUBIC M"ETRE 1990 1989
52.7 654
119 915
32 985
10 042 895
399 997 756 403
419 596
497 001
329 203
855 491
213 3 CO 161 5 S6 419 627 270 692
223 S 26 146 229
237 033 146 344
340 341 119 078
310 388
10 603 534
980 960
151 083
35 562
10 210 181
468 769 751 020
468 648
534 440
265 131
696 181
213 105 152 752 510 590 364 547
217 238 57 945
252 980 114 736
241 529 164 035
310 449
11 226 704
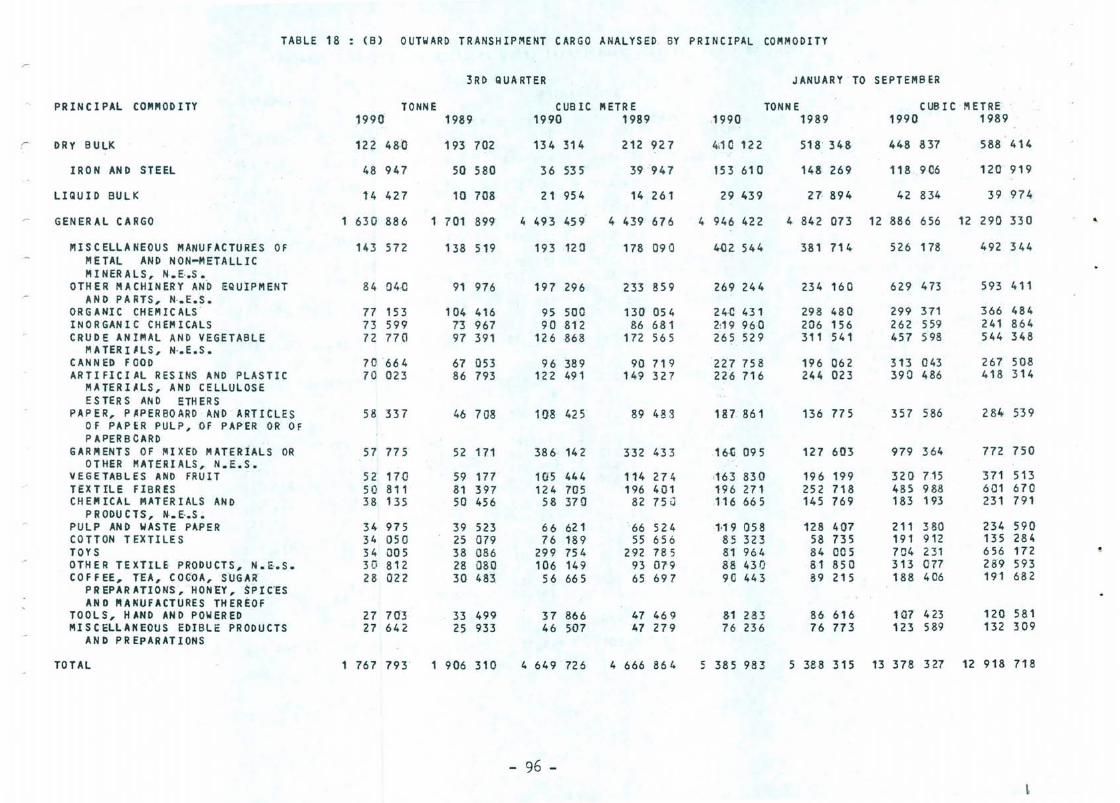
TABLE 18
PRINCIPAL CO,","ODITY
DRY BULK
IRON AND STEEL
LIQUID BULK
GENERAL CARGO
~ISCELLANEOUS MANUFACTURES OF "'ETAL AND NON .. METAlLIC M I NER ALS, N.E-.S.
OTH ER M A CHINERY AND EQUIPMENT AND PAR T S , N-. E • S •
ORGANIC CHEMICALS INORGANIC CHEMICALS CRUDE ANIMAL AND VEGETABLE
"'ATERIILS, N-.E.S. CANNED FOOD ARTIFICIAL RESINS AND PLASTIC
MATERI~LS, AND CELLULOSE ESTERS AND ETHERS
PAPER, PAPERBOARD AND ARTICLES OF PAPER PULP, OF PAPER OR OF PAPERBCARD
GAR"ENTS OF 1011 XED I'lATERIALS OR OTHER MATERIALS, N.E.S.
VEGETABLES AND FRUlT re X T IL EFl 8 RES CHEMICAL MATERIALS AND
PR ODU C T S, N-. E-.S ~ PULP AND WASTE PAPER COTTON TEXTILE S TOYS OTHER TEXTIL& PRODUCTS, N.E.S. COFFEE, TEA, COCOA, SUGAR-
PR EPAR ATIONS,HONEY, Si'I C-ES AND "ANUfACTURES THERtOF
TOOLS, HAND AND POWERED MISCELLANEOUS EDIBLE PRODUCTS
AND PREPARATIONS
TOTAL
(B) OUTWARD TRANSHIPMENT CARGO ANALYSED BY PRINCIPAL COMMODITY
3RD QUARTER
TONNE 1990 1989
122 480
48 947
14 427
1 630 886
143 572
84 04.Q
77 153 73 599 72 770
70.664 70 023
58 337
57 77 5
52 170 50 811 38 135
34 975 34 050 34 005 3D 812 28 022
27 703 27 642
193 702
50 580
10 708
1 701 899
138 519
91 976
104 416 73 967 97 391
67 053 86 793
46 708
52 171
59 177 81 397 50 456
39 523 25 079 38 086 28 080 30 483
33 499 25 933
1 767 793 1 906 310
CUBIC "'ETRE 1990 1989
13 4 314
36 535
21 9S 4
4 493 459-
193 120
197 296
95 soa 90 812
126 868
96 389 122 491
10:8 425
386 142
105 444 124 705
58 370
66 621 76 189
299 754 106 149
56 665
37 866 46 507
4 649 726
.. 96 ..
212 927
39947
14 261
4 439 676
178 090
233 859
130 OS 4 86 681
172 565
90 719 149 327
89 48 3
332 433
114 274 196 401
82 75 iJ
66 524 55 656
292 785 93 079 65 697
47 469 47 279
4 666 864
JANUARY TO SEPTEMBER
,1990 TONNE
1989
4<1-C 122
153 610
29 439
4 946 422
4-02 544
269 244
24-0 431 2:19 960 265 529
227 758 226 716
18.7 861
16-tl 095
,163 830 196 271 116 665
1,19 058 85 323 81 964 88 430 90 443
81 283 76 236
518 348
14S 269
27 894
4 842 073
381 714-
234 160
298 480 206 156 311 541
196 062 244 023
136 775
127 6113
196 199 252 718 145 769
128 407 58 735 84 CO 5 81 850 89 215
86 616 76 773
CUBIC METRE 1990 1989
448 837
118 ge6
42 834
12 886 656
526 178
629 473
299 371 262 559 457 598
313 043 390 486
357 586
979 364
320 715 485 988 183 193
211 380 191 912 704 231 313 077 188 406
1'.17 423 123 589
588 414
120 919
39 974
12 290 330
492 344
593 411
366 484 241 864 544 348
267 508 418 314
284 539
772 750
371 513 601 670 231 791
234 590 135 284 656 172 289 593 191 682
120 581 132 309
5 385 983 5 388 315 13 378 327 12 918 718
'-
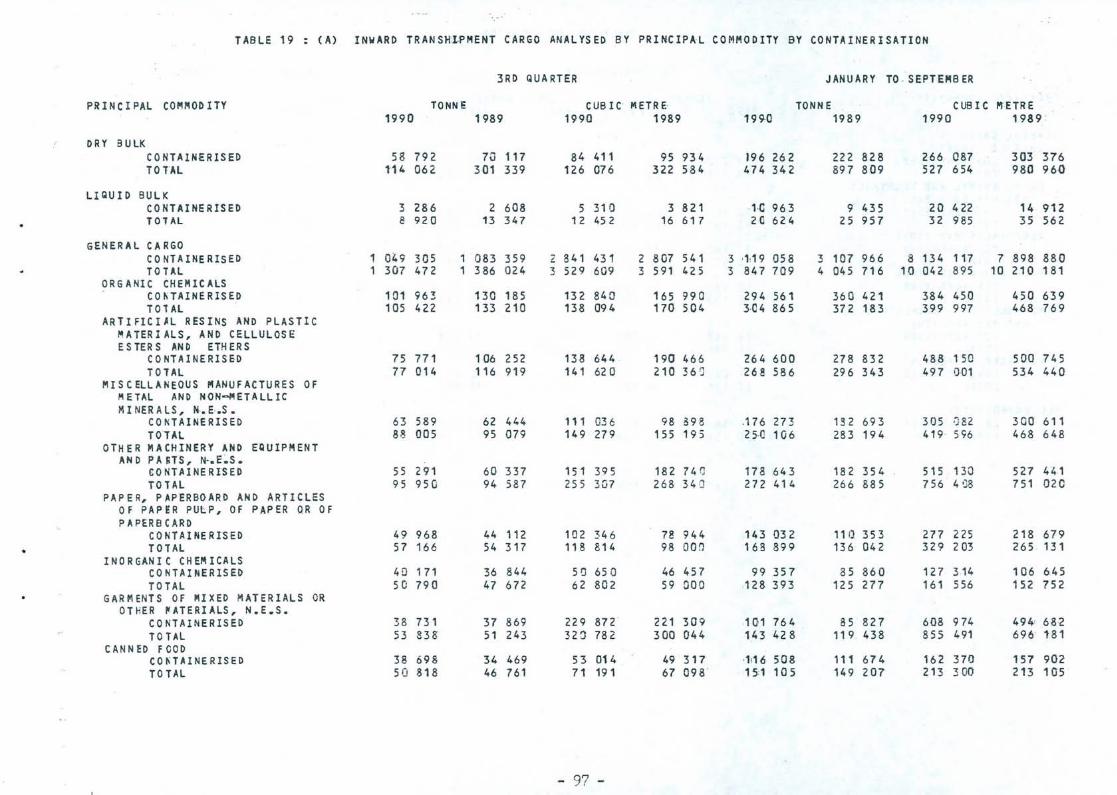
TABLE 19 ( A) INWARD TR AN SHl·PMENT CARGO ANAL YS EO BY PRINCIPAL COMMODITY BY CONTAINERISATION
3RO QUA HER JANUARY TO · SEPTEI'IB ER
PRINC IPAL COl'lf'lOD ITV TONN E CUBIC METRE- TONNE CUBIC ~ETRE 1990 1989 1990 1989 199-0 1989 1990 1989
DRY BULK CONTAINERISED 58 792. 70 117 84 411 95 934 196 262 222 828 266 087 303 376 TO TAL 114 062 3·01 339 126 076 322 584 474 342 897 809 527 654 980 960
Ll QU I D BULK CONTAINERISED 3 286 2 608 5 310 3 821 ' -0 963 9 435 20 422 14 912 TOT Al 8 92 a 13 347 12 452 16 617 2 C 624 25 957 32 985 35 562
GENERAL CARGO CONTAINERISED 1 049 305 1 083 359 2 841 431 2 807 541 3 ,1,19 058 3 107 966 8 134 117 7 898 880 TOTAL 1 307 472 1 386 024 3 529 609 3 591 425 3 847 7Q9 4 045 716 10 042 895 10 210 181
ORG ANIe CHEMIC ALS COIiTAINERISED 101 963 130 185 132 840 165 990 294 561 360 421 384 450 450 639 TOHL 105 422 133 210 138 094 170 504 3·04 865 372 183 399 997 468 769
ARTIFICIAL RESINS AND PLASTIC /IlATERIALS, AND CELLULOSE ESTER S AND ETH ERS
CO NTA I NE RISED 75 771 106 252 138 644 190 466 264 600 278 832 488 150 500 745 TOTAL 77 014 116 919 141 620 210 36 '] 268 586 296 343 497 001 534 440
MISCELLANEOUS MANUFACTURES OF 1'1 ETAL AND NON~ETALLIC MINERAlS, N.E.S.
CONTAINERISED 63 589 62 444 111 036 98 a98 .176 273 132 693 305 082 300 611 TOTAL 8S 005 95 079 149 279 155 195 250 106 283 194 419 596 468 648
o THE R MA CHIN ER Y AND EQUIPMENT AND PAns, N-.E~S.
CO tiT A I NE R IS E D 55 291 60 337 151 395 182 74 rJ 178 643 182 354 515 130 527 441 TOTAL 95 950 94 587 255 307 268 34 0 272 414 266 885 756 'd8 751 020
PAPER, PAPERBOARD AND ARTICLES o F PAP ER PUt P, 0 F PAPER QR OF PAPERBCARo
CONTAINERISED 49 968 44 112 102 346 78 944 143 {)32 11 Q 353 277 225 218 679 TOTAL 57 166 54 317 118 814 98 Don 168 899 136 042 329 203 265 131
INORGANIC CHEI'IICALS CONTAINERISED 40 171 36 844 51J 650 46 457 99 357 85 860 127 314 106 6.45 TO TAL 50 790 47 672 62 802 59 000 ,128 393 125 277 161 556 15.2 752
GARMENTS OF fII!XED MATERIALS OR OT HER ~ATERIALS, N.E.S.
CONTAINERISED 38 731 37 869 229 872 221 309 101 764 85 827 608 974 494' 682 TO TAL 53 838 51 243 323 782 300 044 143 428 119. 438 855 491 696 181
CANNED FOOD COHAINERISED 38 698 34 469 53 Q14 49 317 ,1;16 50& 111 674 162 370 157 902 TO TAL 50 818 46 761 71 191 67 098 151 105 149 207 213 300 213 1 a5
- 97 -

TABLE 19 (A) <CONT'O)
3R~' QUARTER J AHUARY TO SEPTEMBER
PRINtIPAL COMMODITY lONlfE CUB re METRE TONNE CUBI e "'ETRE 1990 1989 1990 1989 1990 1989 1990 1989
GENERAL - CARGO TEXTILE FIBRES
CONTAINERISED 36 727 42 965 87 563 1 04 586 139 406 163 451 347 799 398 021 T01AL 48 788 66 435 119 388 156 785 169 892 213 719 419 627 510 590
CRUDe ANIMAL ANO VEGETABLE MATERIALS, N-.E.S·.
COIITAINERISED 32 889 45 837 60 898 78 486 :1:14 342 152 180 203 1)02 256 784 TOTAL 42 640 62 650 77 240 106 0 73 :155 591 215 974 270 692 364 547 ~
VEGETABLES AND FRUIT eONHINERISED 31 463 33 539 55 357 66 057 105 425 101 283 192 667 189 841 T01Al 35 405 38 132 62 533- 74 616 119 078 115 537 223 526 217 238
PULP AND WASTE PAPER CONTAINERISED 30 155 34 509 64 377 75 130 i "1,1 031 104 440 236 471 222 597 TO TAL 30 655 36 650 64 939 78 855 111 531 122 758 237 033 252 980
IH S CELLA NEOUS EDIBLE PRODUCTS AN~ PRfPARAT!ONS
COflTAINE!USED 22 457 20 095 45 442 36 575 70 265 57 009 136 504 103 531 TOTAL 24 044 20 787 48 284 37 739 75 92 0 63 220 146 344 114 736
NON-FERRCUS ~ETALS CONTAINERISED 17 226 13 473 18 525 12 498 55 264 58 602 61 427 59 271 TOTAL 17 435 16 103 18 653 14 795 57 432 70 140 62 550 68 948
ALL COMMOD ITIES CONTAINERISED 1 111 382 1 156 083 2 931 152 2 907 297 3 326 283 3 340 229 8 420 625 8 217 168 TOTAL 1 430 454 1 700 709 3 668 137 3 930 625 4 342 675 4 969 482 10 603 534 11 226 704
+ STATISTICS SUPPRESSED BECAUSE OF LARGE SAMPLING ERRORS
- 98 -

TABLE 19. (B) OUTWARD TRANSHIPMENT CARGO ANALYSED BY PRINCIPAL COMMODITY BY CONTAINERISATION
3RD QUARTER JANUARY TO SEPTEJIIIBER
PRINCIPAL COMMOD lTY TONNE CUB re JIIIETRE TONNE CUBI C METRE 1990 1989 1990 1989 1990 1989 1990 1989
DRy BULl< CONTAINERISED 98 660 97 264 114 255 115 010 287 48 T 294 159 323 000 355 487 TOTAL 122 480 193 702 134 314 212
IRON AND STEEL 927 410 122 518 348 448 837 588 414
CONTAINERISED 37 980 34 974 31 558 30 504 113 150 99 534 93 596 87 455 TOTAL 48 947 50 580 36 535 39 947 153 610 148 269 118 906 120 919
METALLIFEROUS ORES AND JIIETAL SCRAP
CONTAINERISED 26 6Q7 20 255 33 871 21 049 6<1 300 66 350 75 526 68 724 TOTAL 27 009 21 64Q 34 167 22 284 62 687 7Q 303 76 688 72 337
LIQUI D BULK CONTAINERISED 12 487 7 268 19 259 9 731 23 132 21 626 34 303 31 388 TO TAL 14 427 10 708 21 954 14 261 29 439 27 894 42 834 39 974
GENERAL CA~GO CONTAINERISED 1 541 234' 1 569 195 " 319 971 4 168 386 4 647 597 " 486 441 12 267 318 11 572 467 TOTAL 1 630 886 1 701 899 4 493 459 4 439 676 4 946 422 4 842 073 12 886 656 12 290 330
MISCELLA~EOUS MANUFACTURES OF ~ E TAL AND NON-METALLIC MINERALS, N-.E.S.
CONTAINERISED 132 331 130 519 182 323 170 172 377 366 354 000 497 799 461 972 TO TAL 143 572 138 519 193 120 178 09 :J 4-{l2 544 381 714 526 178 492 344
ORGANIC CHEJIIIIC ALS CO~TAINERlSED 76 391 103 214 94 332 128 23 -'; 238 954 - 294 434 297 382 36() 848 TOlAL 77 153 104 416 95 500 130 054 24-0 431 298 480 299 371 366 484
CANNtD FOOD CONTAINERISED 69 792 66 381 95 211 89 803 22'5 771 193 868 310 389 264 525 TOTAL 70 664 67 053 96 389 90 719 227 758 196 062 3'13 ,043 267 508
ARTI1ICIAL RESINS AND PLASTIC ~ATERIALS, AND CELluLOS~ ESTER S AND ETH ERS
CONTAINERISED 69 378 83 340 121 503 142 83.3 225 290 233 753 388 C43 399 694 TOTAL 70 023 86 793 122 491 149 327 226 716 244 023 390 -486 418 , 314
INORGANIC CHEMICALS CONTAINERISED 68 433 68 193 80 039 79 326 205 169 189 598 240 479 219 059 TOT AL 73 599 73 967 90 812 86 681 2'19 960 206 156 262 559 241 864
OTH ER MACHINERY AND EQUIPMENT AND PARTS, N,.E.S.
CONTAI NE RISED 66 581 76 151 155 043 193 817 2,15 091 193 180 502 740 497 058 TO'TAL 84 040 91 976 197 296 233 859 269 244 234 160 629 473 593 411
- 99 -
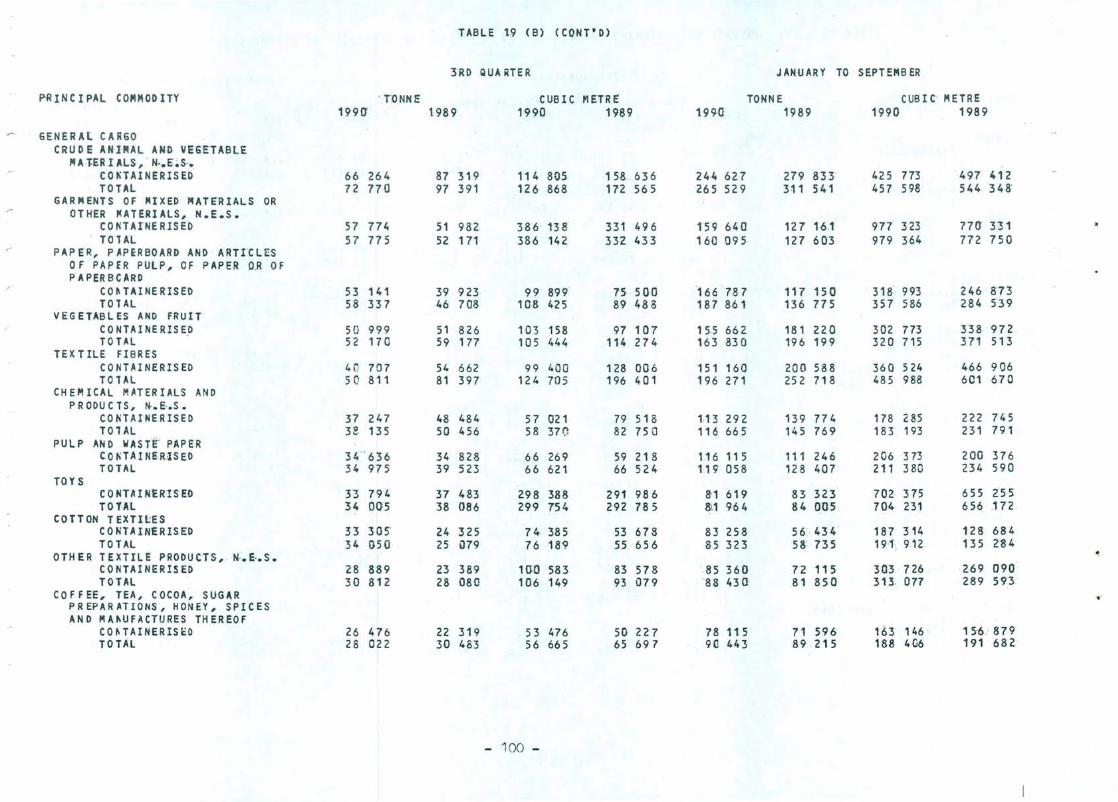
TABLE 19 (B) (CONT'D)
3RD QUARTER JMWARY TO SEPTEI'IB ER
P-RINC I PAL CO"'"OD IlY . T:ONNE CUB I C METRE TONNE CUB I C METRE 199 (J 1989 1990 1989 199·a 1989 1990 1989
GENERAl CARGO CRU D E ANIMAL AND VEG~TABLE
M A·f.ER I ALS, . N·.S ~S· •. COnAINERISED 66 264 87 319 114 805 158 . 636 244 627 279 833 425 773 497 412 TOTAL 72 770 97 391 126 868 172 565 265 529 311 541 457 598 544 348'
GARMENTS OF MIXED ~AT~RIALS OR OT HER MATERIALS, N.E.S.
CO NTAINE RISE-D 57 774 51 982 386 138 331 496 159 640 127 1<>.1 977 323 77(J 331 TO 'TAl 57 775 52 171 386 142 332. 433 160 095 127 603 979 364 772 750
,- PAP ER, P APERBOARD ANt> ARTICLES Of PAPER PULP, OF PAPER OR OF PAPER BCARD
.r COHAINERISED 53 141 39 923 99 899 75 500 166 787 117 150 318 993 246 873 TOTAL 58 337 46 708 108 425 89 488 187 861 136 775 357 586 284 539
V EG ETAB L ES AND FRUIT CONTAINERISED 50 999 51 826 103 158 97 107 155 662 181 220 302 773 338 972 TO TAL 52 170 59 177 105 444 114 274 163 830 196 199 320 715 371 513
TEXTILE FIBRES CONTAINERISED 40 707 54 662 99 400 128 006 151 160 200 588 360 524 466 906 TOTAL 50 811 81 397 124 705 196 401 196 271 252 718 485 98B 601 670
CH EM rCAl MATERIALS AND PRODUCTS, N-.E·.S.
CONTAINERISED 37 247 48 484 57 021 79 518 1.13 292 139 774 178 285 222 745 TOTAL 3'g 135 50 456 58 370 82 750 116 665 145 769 183 193 231 791
PULP AND WASTE' PAPER c.o tiT A I N5RlS ED 34 636 34 828 66 269 59 218 116 115 111 246 2G6 373 20'0 376 TOTAL 34 975 39 523 66 621 66 524 1.19 058 128 407 211 380 234 590'
TOY S CO flTA I NUn ED 33 794 37 483 298 388 291 986 ~1619 83 323 70'2 375 655 255 TOTAL 34 00'5 38 0'86 299 754 292 78 S &.1 964 84 005 704 231 656 172
COTTON TEXTILES CO NlA INER IS ED 33 305 24 325 74 385 53 678 83 258 56 . 434 187 314 128 684 TO TAL 34 050 25 u79 76 189 55 656 85 323 58 735 191 912 135 2:84
OTHER TEXTILE PRODUCTS, N:. E-. S. ~
CONTAINERISED 28 889 23 389 WO 583 83 578 85 360' 72 115 30'3 726 269 090' TOTAL 3D 812 28 080 10'6 149 93 079 88 43 a 81 850 313.. 077 289 593
COFFEE, TEA, COCOA, SUGAR .-PREPARATIONS, HONEY, SPICES AND I'IAIiUFilCTURES THEREOF
COHAINERIScD 26 476 22 319 53 476 50' 227 78 115 71 596 163 146 15'6. 879 TOTAL 28 022 30 483 56 665 65 697 90 443 89 . 215 188 406 191 682
- 100 -

TABLE 19 ( B) (CONT' D)
3RD QUARTER JANUARY TO SEPTEMBER
PRINCIPAL COMMOD IH TONNE C USIC I'tETR E TONNE CUBI C III ETRE 1990 1989 1990 1989 1990 1989 1990 1989
SENERA t CA RGO POTTERY (!NCLUDING CHINAWARE
ANO POIlCELAIN WARE) CONTAINERISE.D 26 280 23 865 75 072 70 185 5e 476 52 613 156 · 590 154 9.77 TOTAL 26 4-00 24 2-14 75 264 70 970 52 835 53. 597 157 676 157 535
ALL COI'IMODITIES CONTAINERISED 1 652 382 1 673 727 4 453 486 4 293 127 4 958 216 - 4 802 227 12· 624 621 11 959 342 TOl AL 1 767 793 1 906 310 4 649 726 4 666 864 5 385 983 5 388 315 13 378 327 12 918 718
- 101 -

TABLE 20 (A> INWARD TRANSHIPMENT CARGO ANALYS~O BY SELECTED COUNTRY Of LO~DING BY PRINCIPAL COMMODITY
SELECTED CCUNTRY ~F LOADING AND PRINCIPAL COMMODITY
CH INA
MISCELLA~EOUS MANUFACTURES OF METAL AND NON-METALLIC 'UNERALS, N·.E.S·.
OTHER MACHINERY AND EQUIPf'fENT AND PARTS, N-.E.S.
CANN EO FOOD
UNITED STATES OF AMERICA
ORGANIC CHEMICALS PULP AND WASTE PAPER ARTIFICIAL RESI~S AND PLASTIC
MATERI~LS, AND CELLULOSE ESTERS AND ETHERS
HIWAN
JAPAN
PAPER, PAPERBOARDAND ARTICLES OF PAPE"R- PULP, OF PAPER OR OF PAPERBCARO
IRON AND STEEL
SI NGAP ORE
ARTIFICI~L RESINS AND · PLASTIC "'ATERI.aLS, AND CELLULOSE E S TE R S AN D E TH ER S '
FEDERAL REPUBLIC OF GERMANY
PAPER, PAPERBOARD AND ARTICLES OF PAPER PULP, OF PAPER OR OF PAPERBOARD I :
3RD QUARTER
.TONNE 1990' 1989
568 888
56 42'9
49 084
43 046
202 453
35 223 24 117 20 23,1
85 866
63 065
6. 593
6 545
61 622
14 081
5 Q 212
6 24-n
549 522
57 821
37 178
39 019
328 830
67 610 28 118 36 282
72 997
49 663
+
9 188
43 427
12 821
59 142
12 941
CUBIC METRE 1990 1989
1 572 707 .. 1 499 751
89 155
111 850
60 901
429 192
40 436 54 855 39 576
295 539
140 079
12 412
2 823
136 170
25 325
99 231
8 966
- 102 - -
92 470
89 676
56 094
579 247
81 626 64 653 70 609
251 345
113 715
+
3 77 r:J
99 434
21 465
113 096
18 038
JANUARY TO SEPTE~BER
1990 TONNE
1989
609 17 5
;156 04-0
116 813
132 275
692 233
1-05 025 79. 928 99 997
226 792
166 177
,13 271
15 338
169 393
33 545
158 203
28 475
1 583 328
173 889
95 130
128 311
944 464
W6 329 80 373 89 542
209 150
165 171
+
20 245
134 250
26 193
156 378
28 410
CUBIC METRE 1990 1989
4 291 207
249 463
270 627
188 017
464 991 .
122 920 189 742 193 067
771 687
369 516
21 141
7 734
378 072
59 5&1
296 507
40 956
4 093 086
278 525
232 370
183 995
706 454
230 562 178 562 176 005
688 959
472 578
+
11 969
315 769
44 965
323 222
43 415

TABLE 20 (A) (CONT'O)
3RD QUA RTER JANUARY TO S EPTEMB ER
SELECTED COUNTRY CF LOADING TONNE CUB le METR E TONNE CUBI C METRE AND PRI N CIpAL COMM_OD lTY 1990 1989 1990 1989 ,1990 1989 1990 1989
NETHERLANDS 33 739 49 842 62 3 1 0 82 063 ,105 350 132 291 196 ",1 229 377
AUSTRALIA 29 436 21 138 49 345 34 66 .1 55 893 64 442 88 953 105 030
NON,..FERRCUS I'\ETALS 4 527 + 4 611 + 8 785 + 8 684 +
TH AIL A ND 28 777 40 295 80 104 95 799 92 838 162 845 226 293 316 573
• CRUDE ANI'MH AND VEGETABLE 3 211 4 537 5 601 7 642 8 722 18 226 15 413 31 873 MATERIALS, N·.E.S.
PHILIPPINES 28 530 39 519 159 505 200 053 8C 275 96 890 439 935 506 750
+ STATISTICS SUPPR ESSED B~CAUSE OF. LARGE SAMPLING ERRORS
•
- 103 -

TABLE 20 . : (B) OUTWA.RD TRANSHIPMENT CARGO ANALYSED BY SELECTED COUNTRY OF DISCHARGE BY PRINCIPAL COMMODITY
SELECTED CCUNTRY OF DISCHARGE AND PUN CIPAt. COMMODlTY
UNITED STATES OF A"E~ICA
GARIIIEN.TS Of' PInED i'IATERIALS OR OTHER ICATERIAlS, N.E.S.
TOYS .
CHINA
ORGANIC CHEMICALS ARTIFICIAL RESINS AND PLASTIC
~ATERIALS, AND CELLULOSE ES TER SAND ETHERS
TEXTILE FIBRES
SI NGAP ORE
TAIWAN
PULP AND wASTE PApER
PHILIPPINES
PAPER, PAPERBOARD AND ARTICLES OF PAPER PULP, OF PAPER OR OF PAPERBCARD .
MISCElLA~EOUS EDIBLE PRODUCTS AND PREPARATIONS
FEDERAL REFUBlIC OF GERMANY
CANNED FOOD GARMENTS OF ~IXED MATERIALS OR
OTHER ICATERIAlS, N.E.S~
JAPAN
3RD QUARTER
TONNE CUBIC METR E 1990 1989 1991) 1989
261" 774
17 115
16 317
212 899
sf 690 35 615
24 982
130 878
111 793
13 229
100 990
11 618
7 598
94 703
20 062 9 286
82 237
260 880 1 033 339
17 589 130 204
15 082 159 820
359 838 395 161
68 497 60 677 48 284 62 754
48 134 61 015
110 836 271 501
113 306 207 562
+ 25 851
1 29 83 8 18 8 07 G
7 362 19 022
+ 13 249
92 748 335 727
15 962 7 619
85 619
28· 346 59 792
163 736
- 104 -
909 295
123 850
121 940
609 186
76 463 81 289
118 005
251 571
208 490
+
240 629
11 425
+
31T 479
21 751 54 672
175 286
JANUARY TO SEPTEMBER
TONNE CUBIC METRE. · 1990 1989 1990 1989
778 754
54 880
39 323
669 679
·142 442 93 028
9-0 881
359 064
345 643
32 911
3.12 283
29 292
16 201
302 088
'79 561 . 20 18"
254 755
723 19' 2 783 656 2 465 572
47 703 375 198 308 786
34 565 368 377 293 566
1 002 574 190 786 ., 747 623
185 184 165 841 211 438 134 882 16u 297 219 232
136 720 220 233 324 745
297 999 777 662 684 746
379 594 668 5 26 691 349
+ 59966 +
369 031 590 800 680 913
21 331 53 662 34 486
+ 27 694 +
261 734 951 768 819 984
50 413 14 900
240 802
1.,., 624 121 139
496 765
68 849 99 239
472 370

TABLE 20 (8) <CONT'D)
3RD QUA RTER JANUARY TO SEPTEMBER
SELECT'ED C'OUtlTRY OFD lStliARGE TONNE · CUB IC METRE TONNE . CUBIC- METRE · AND PRINCIPAL COMMODITY 1990 1989 1990 1989 1990 1989 1990 1989
NfTHER LAND S 81 110 95 999 223 975 257 631 270 795 262 048· .712 447 652 965
GUM ROS IN. 5 951 7 207 7 644 8 855 20 763 14 220 25 799 17 669
THAILAND 78 092 73 627 149 891 140 441 27'1 558 218 616 503 288 416 496
PULP AND WASTE PAPER 5 578 6 997 12 146 12 883 35 084 35 917 58 456 69 674
MALAYSIA 48 643 33 351 96 703 67 855 124 874 95 576 239 389 193 724
•
+ STATISTICS SUPPRESSED BECAUSE OF LARGE SAMPLING ERRORS
- 105 -

TABLE 21 OUTW.ARD TRANSHIPMENT CARGO ANALYSIS BY SELECTED COUNTRY OF DISCHARGE. BY SELECTED COUNTRY OF LOADING
SELECTED COUNTRY OF · DISCHARGE AND SELECTED COUNTRY OF LOADING . .
UNITED STATES OF AMERICA
CHI N A
CHINA
UNITED STATES OF A~£RIcA
SINGAPORE
CHINA UNITED STATES OF AMERICA
TAIWAN
UNITED STATES OF AMERICA FEDERAL REPUBLIC OF GERIIIANY
pHILIPPINES
UNITED STATES OF AMERICA CH IN A
FEDERAL REPUBLIC OF GERMANY
CH I N A
JAPAN
CH I N A
NETHERLANDS
CHINA
THAILAND
UNITED STATES OF AMERICA CH I N A
MALAYSIA
3RD QUARTER
fONNE . CUBIC · M£TRE 199(} 1989 1~O 1989
261 774
121 388
212 899
78 651
130 878
55 710 30 975
111 793
30 485 14 831
100 990
34 353 11 003
94 703
56 004
82 237
32 704
81 110
49 973
78 092
24 076 21 581
48 643
260 8801 033 33~
126 064 390 781
359 838 395 161
147 228 136 808
110 836 271 501
35 039 24 939
113 306
32 788 19 647
129 838
50 219 19 761
92 748
61 143
85 619
28 742
95 999
60 466
73 627
28 696 18 677
33 351
110 633 · 58 275
207 562
67 751 25 290
188 070
72 583 20 885
335 727
185 189
163 736
5 5 ~2 0
223 975
127 372
149 891
45 222 40 620
96 703
- 10 6 -
909 .. 295
3 H .68i1
609 186
222 887
251 571
71 68 a 47 141
. 208 490
70 410 36 949
240"629
100 330 31 064
317 479
203 983
175 286
46 891
257 63 1
149 381
140 441
48 762 38 53 t)
67 855
,1990
JANUARY TO SEPTEMBER
TONN E 1989
CUBIC .METRE 1990' 1989
·778 754 723 198 2 783; 656 2 465 572
389900 3354421136'. 574 8719'13.
669 679 1 002 574 1 190 786 1 747 623
23~ 477 342 642 415 67D 545 557
359 064 297 999 777 662 684 746
,no 534 94 77 5
345 643
86 652 62 699
3:12 283
115 891 3!1 902
302 088
196 178
254 755
86 946
270 795
166 968
27:1 558
1·09 900 64 586
124 874
91 227· 75 789
379 594
136 925 45 844
369 031
136 526 53 641
261 73 4
172 771
240 802
73 169
262 048
159 362
218 616
102 507 43 316
95 576
264 4·14 179 342
668 526.
212 916 112 570 .
590 800
235 219 55 148
951 768
553 861
496 765
135 466
712 447
397 062
503 288
196 024 127 053
239 389
185 392 150 926
691 349
285 947 87 257
680 913
264 967 79 224
819 984
509 393
472 370
126 295
652 965
364 030
416 496
188 830 80 363
193 724
•

TABLE 21 (CONT"D)
3 RD QUA RTER JANUARY TO SEPTEfIIBER
5ELECTEt> CCUNTRY .OF DISCHARGE AND TONNE CUBIC METRE TONNE CUBIC . M.fTRE SELECTED COUNTRY ' OF LOADING 1990 1989 1990 1989 ,19.9.0 1989 1990 1989:
MALAY S lA
UNITED 5.TATE:S: OF AfIIERICA 7 799 + 12 2.0.6 + 22 364- + . 39 299 +
OTHER COUN TRIES' 564 67.? 550 267 1 584 061 .. -1 489 000 :1 6.96 488 1 537 144 4 463 240 4 092 ' 975
ALL COUNTRIES 1 767 793 1 9'()6 310 4649 726 4 666 864 5 385 983 5 388 315 13 · 378 327 12 918718
+ STATISTICS SUPPRESS~D BECAUSE OF LARGE SAMPLING ERRORS
y
- 107 -

'I
1/91 $26.50--J59009003EO