VOL.41, No.3, SUMMER 2010
98
VOL.41, No.3, SUMMER 2010 ISSN 0084-5841
-
Upload
khangminh22 -
Category
Documents
-
view
3 -
download
0
Transcript of VOL.41, No.3, SUMMER 2010

VO
L.41, NO
.3, Sum
mer 2010
VOL.41, No.3, SUMMER 2010
ISSN 0084-5841

Criteria for Article SelectionPriority in the selection of article for publication is given
to those that –a.b.
c.
d.
e.
f.
g.
h.
Rejected/Accepted Articlesa.
b.
c.d.
Procedurea.
b.
c.
INSTRUCTIONS TO AMA CONTRIBUTORSThe Editorial Staff of the AMA requests of articles for publication to observe the following editorial
policy and guidelines in order to improve communication and to facilitate the editorial process:
Article must be sent on CD-R with MS DOS format (e.g. Word Perfect, Word for DOS, Word for Win-dows... Absolutely necessary TEXT FORMAT) along with two printed copy (A4).The data for graphs and photographs must be saved into piecemeal dates and enclosed with the article.Whether the article is a technical or popular contribu-tion, lecture, research result, thesis or special report, the format must contain the following features:(i) brief and appropriate title;(ii) the writer(s) name, designation/title, office/orga-nization; and mailing address;(iii) an abstract following ii) above;(iv) body proper (text/discussion);(v) conclusion/recommendation; and a(vi) bibliographyThe printed copy must be numbered (Arabic nu-meral) successively at the top center whereas the disc copy pages should not be number. Tables, graphs and diagrams must likewise be numbered. Table numbers must precede table titles, e.g., "Table 1. Rate of Seed-ing per Hectare". Such table number and title must be typed at the top center of the table. On the other hand, graphs, diagrams, maps and photographs are considered figures in which case the captions must be indicated below the figure and preceded by num-ber, e.g., "Figure 1. View of the Farm Buildings".The data for the graph must also be included. (e.g. EXCEL for Windows)Tables and figures must be preceded by texts or discussions. Inclusion of such tables and figures not otherwise referred to in the text/discussion must be avoided.Tables must be typed clearly without vertical lines or partitions. Horizontal lines must be drawn only to contain the sub-title heads of columns and at the bot-tom of the table.Express measurements in the metric system and crop yields in metric tons per hectare (t/ha) and smaller units in kilogram or gram (kg/plot or g/row).Indicate by footnotes or legends any abbreviations or symbols used in tables or figures.Convert national currencies in US dollars and use the later consistently.Round off numbers, if possible, to one or two decimal units, e.g., 45.5 kg/ha instead of 45.4762 kg/ha.When numbers must start a sentence, such numbers must be written in words, e.g., Forty-five workers..., or Five tractors..."instead of 45 workers..., or, 5 trac-tors.
Format/Style Guidancea.
b.
c.
d.
e.
f.
g.
h.
i.
j.
k.
l.
are written in the English language;are relevant: to the promotion of agricultural mecha-nization, particularly for the developing countries;have not been previously published elsewhere, or, if previously published are supported by a copyright permission;deal with practical and adoptable innovations by, small farmers with a minimum of complicated for-mulas, theories and schematic diagrams;have a 50 to 100-word abstract, preferably preceding the main body of the article;are printed, double-spaced, under 3,000 words (ap-proximately equivalent to 6 pages of AMA-size pa-per) ; and those thatart: supported by authentic sources, reference or bib-liography.written on CD-R.
As a rule, articles that are not chosen for AMA pub-lication are not returned unless the writer(s) asks for their return and are covered with adequate postage stamps. At the earliest time possible, the writer(s) is advised whether the article is rejected or accepted.When an article is accepted but requires revision/modification, the details will be indicated in the re-turn reply from the AMA Chief Editor in which case such revision/modification must be completed and returned to AMA within three months from the date of receipt from the Editorial Staff."The AMA does not pay for articles published. Complimentary copies: Following the publishing, three successive issue are sent to the author(s).
Articles for publication (original and one-copy) must be sent to AMA through the Co-operating Editor in the country where the article originates. (Please refer to the names and addresses of Co-operating Editors in any issue of the AMA). However, in the absence of any Co-operating Editor, the article may be sent directly to the AMA Chief Editor in Tokyo.Contributors of articles for the AMA for the first time are required to attach a passport size ID photograph (black and white print preferred) to the article. The same applies to those who have contributed articles three years earlier. In either case, ID photographs taken within the last 6 months are preferred.The article must bear the writer(s) name, title/designa-tion, office/organization, nationality and complete mailing address.
VOL.41, No.3, SUMMER 2010
Yoshisuke Kishida, Publisher & Chief EditorContributing Editors and Cooperators
- AFRICA -Kayombo, Benedict (Botswana)Fonteh, Fru Mathias (Cameroon)
El Behery, A.A.K. (Egypt)El Hossary, A.M. (Egypt)
Pathak, B.S. (Ethiopia)Bani, Richard Jinks (Ghana)Djokoto, Israel Kofi (Ghana)
Some, D. Kimutaiarap (Kenya)Houmy, Karim (Morocco)Igbeka, Joseph C. (Nigeria)
Odigboh, E.U. (Nigeria)Oni, Kayode C. (Nigeria)
Kuyembeh, N.G. (Sierra Leone)Abdoun, Abdien Hassan (Sudan)
Saeed, Amir Bakheit (Sudan)Khatibu, Abdisalam I. (Tanzania)Baryeh, Edward A. (Zimbabwe)Tembo, Solomon (Zimbabwe)
- AMERICAS -Cetrangolo, Hugo Alfredo (Argentina)
Naas, Irenilza de Alencar (Brazil)Ghaly, Abdelkader E. (Canada)
Hetz, Edmundo J. (Chile)Valenzuela, A.A. (Chile)
Aguirre, Robert (Colombia)Ulloa-Torres, Omar (Costa Rica)Magana, S.G. Campos (Mexico)
Ortiz-Laurel, H. (Mexico)Chancellor, William J. (U.S.A.)
Goyal, Megh Raj (U.S.A.)Mahapatra, Ajit K. (U.S.A.)
- ASIA and OCEANIA -Quick, G.R. (Australia)
Farouk, Shah M. (Bangladesh)Hussain, Daulat (Bangladesh)
Mazed, M.A. (Bangladesh)Wangchen, Chetem (Bhutan)
Wang, Wanjun (China)Illangantileke, S. (India)
Ilyas, S. M. (India)Michael, A.M. (India)
Ojha, T.P. (India)Verma, S.R. (India)
Soedjatmiko (Indonesia)Behroozi-Lar, Mansoor (Iran)
Minaei, Saeid (Iran)Sakai, Jun (Japan)
Snobar, Bassam A. (Jordan)Chung, Chang Joo (Korea)
Lee, Chul Choo (Korea)Bardaie, Muhamad Zohadie (Malaysia)
Pariyar, Madan (Nepal)Ampratwum, David Boakye (Oman)
Eldin, Eltag Seif (Oman)Chaudhry, Allah Ditta (Pakistan)
Mughal, A.Q. (Pakistan)Rehman, Rafiq ur (Pakistan)
Devrajani, Bherular T. (Pakistan)Abu-Khalaf, Nawaf A. (Palestine)Nath, Surya (Papua New Guinea)Lantin, Reynaldo M. (Philippines)Venturina, Ricardo P. (Philippines)
Al-suhaibani, Saleh Abdulrahman (Saudi Arabia)Al-Amri, Ali Mufarreh Saleh (Saudi Arabia)
Chang, Sen-Fuh (Taiwan)Peng, Tieng-song (Taiwan)
Krishnasreni, Suraweth (Thailand)Phongsupasamit, Surin (Thailand)
Rojanasaroj. C. (Thailand)Salokhe, Vilas M. (Thailand)Singh, Gajendra (Thailand)
Pinar, Yunus (Turkey)Haffar, Imad (United Arab Emirates)
Lang, Pham Van (Viet Nam)Nguyen Hay (Viet Nam)
Hazza’a, Abdulsamad Abdulmalik (Yemen)
- EUROPE -Kaloyanov, Anastas P. (Bulgaria)
Kic, Pavel (Czech)Müller, Joachim (Germany)
Pellizzi, Giuseppe (Italy)Hoogmoed, W.B. (Netherlands)
Pawlak, Jan (Poland)Marchenko, Oleg S. (Russia)
Kilgour, John (U.K.)Martinov, Milan (Yugoslavia)
EDITORIAL STAFF(Tel.+81-(0)3-3291-3674)
Yoshisuke Kishida, Chief EditorMasako Terauchi, Managing Editor
Zachary A. Henry, Editorial Consultant
ADVERTISING(Tel.+81-(0)3-3291-3674)
Yuki Komori, Manager (Head Office)Advertising Rate: 300 thousand yen per page
CIRCULATION(Tel.+81-(0)3-3291-3674)(Fax.+81-(0)3-3291-5717)
Editorial, Advertising and Circulation Headquarters2-7-22, Kanda Nishikicho, Chiyoda-ku, Tokyo 101-0054, Japan
URL: http://www.shin-norin.co.jpE-Mail: [email protected]
Copylight © 2010 byFARM MACHINERY INDUSTRIAL RESEACH CORP.
in SHIN-NORINSHA Co., LtdPrinted in Japan
This is the 144th issue since its maiden isue in the Spring of 1971
EDITORIAL
This September, the joint conference of the Chinese Association of Agricultural Machinery Manufac-turers and Asian Association for Agricultural Engineering was held in Shanghai, China. The new presi-dent of the Asian Association for Agricultural Engineering is Dr. Shujun Li, the chairman of the Chinese Academy of Agricultural Mechanization Sciences and also the vice chairman of the Chinese Association of Agricultural Machinery Manufacturers.
The secretariat of the Asian Association for Agricultural Engineering was formerly based at AIT in Thailand for about 20 years but, from this July with the leadership of new president Li, it has been moved to the Chinese Academy of Agricultural Mechanization Sciences in Beijing. It was the first international conference for him as the president of AAAE but was memorable and, indeed, a powerful conference.
After the conference, I had some time to visit the World Expo. The venue was so huge that I could only see about 20 % of the whole expo. Regardless of the numbers of people visiting, the crowd control was handled promptly. As I was driving through the highway, I saw Shanghai city growing into a large me-tropolis. I saw the great economic growth of China during the stay.
However, this growth has created a new food problem. As income levels rise, food consumption up-grades follow; such as the growth of meat consumption. And now China seems to have become the im-porter of food, instead of exporter. What’s more, the urbanization of the inland area is expected in the near future.
The majority of population growth in the 21st century is that in the developing countries. There are already many problems in the cities of these countries. As the poverty groups grow with the population in the cities, it is a matter of course that the government will get the price of the food down at first as a political move. This is the reason why terms of trade differ so much between food and other products, which make young people move to the cities rather than stay in the country as low-income farmers.
In the 21st century, we need to fulfill the growing food demand with a small group of people. We must push up the agricultural productivity with limited farmland, water, and other resources. This means that a global level of agricultural mechanization is needed to help this situation.
In China, to narrow the income gap between the cities and farmlands, a great amount of political funds were used. For example, a total subsidy 300 billion yen was used for agricultural machinery. I know there are not many countries able to spend so much money, but it is a matter of fact that developing coun-tries need aggressive financial aid from the government. We must make a move before farming becomes impoverished with the lack of labor power. This tendency can already be seen in Japan. Many 65 or older farmers are going to retire in next 10 years.
China, growing so rapidly, has overcome Japan and is becoming the world’s second economic power. If this growth does not slowdown in the next 20 years, the national per capita income of Chinese will be more than that of the American today. The consumption of resources, then, would be beyond all imagi-nation. For example, it is estimated that the consumption of paper of highly developed 1.3 billion Chinese would use up all the trees in the world. To prevent this, we should research and develop the technology to push up the productivity of each resource. Also, discussing this as a worldwide problem, we should cor-rect the terms of trade between primary industry and other industries on a global level. Whatever hap-pens, it is a matter of course that the development of agricultural mechanization is a must-do.
My hope for the readers of AMA is to cooperate with each other to complete this historical mission and develop agricultural machinery in the world.
Yoshisuke KishidaChief Editor
September, 2010
Yoshisuke Kishida
T. S. Moroke, F. Pule-MeulenbergM. Mzuku, C. Patrick, K. Kashe
Ashish K. Shrivastava, C. R. MehtaM. M. Pandey, Atul K. Shrivastava
P. U. Shahare, S. K. ThakreS. M. Mathur, Y. C. Bhatt
K. Kathirvel, B. SuthakarD. Manohar Jesudas
M. BalakrishnanR. Visvanathan, B. Soundararajan
V. V. Sreenarayanan
M. Muthamilselvan, K. RangasamyC. Divaker Durairaj, R. Manian
S. K. Patel, B. P. VarshneyR. R. Singh, P. K. Sundaram
R. Marco Lopez, H. Edmundo Hetz B. Cristian Maturana
Jagvir Dixit, J. N. KhanR. M. Shukla
Murshed Alam, Daulat Hussain
T. Z. Fouda
P. R. Jayan, V. J. F. Kumar
Yang Haiqing, Yang Yan, He Yong
G. S. Manes, A. K. DixitSurendra Singh, A. Sharda
K. Singh
7
9
17
21
30
36
41
46
52
59
64
70
75
83
89
Editorial
Water Harvesting and Conservation Techniques for Dryland Crop Production in Botswana: A Review
Accessibility Index of Indian Tractors- A Case Study
Sleeve Boom Sprayer-II: Performance Evaluation of a Tractor Mounted Sleeve Boom Sprayer for Cotton
Influence of Crop and Machine Parameters on Conveying Effi-ciency and Inclination of Maize Stalks in an Experimental Fodder Harvester
A Hand-Operated Rotary Type Cleaner-Cum-Grader for Black Pep-per and Cardamom
Knapsack Type Pneumatic Cotton Picker: Physiological Cost Anal-ysis with Indian Workers
Field Evaluation of Experimental Plot Drill
Economic Evaluation of Collection, Transport and Utilization of Straw in the Swath of Wheat Stubble
Mechanization Possibilities of Maize Cultivation in Hilly Regions of Jammu and Kashmir State of India
Variability of the Performance of Lever Operated Knapsack Sprayer
Optimizing Kinematic Parameters for Compost Turning Machine for Mininmum Energy Requirememts
A Mechanical Dibber Planter for Selected Seeds
Wireless Sensor Network for Orchard Soil and Climate Monitoring
Development and Evaluation of Tractor Operated Vegetable Trans-planter
CONTENTS
AGRICULTURAL MECHANIZATION IN ASIA, AFRICA AND LATIN AMERICAVol.41, No.3, Summer 2010
Instructions to AMA Contributors .......................4Co-operating Editor ............................................94
Back Issues ..........................................................97★ ★ ★
VOL.41 NO.3 2010 AGRICULTURAL MECHANIZATION IN ASIA, AFRICA, AND LATIN AMERICA 9
by
T. S. MorokePrincipal Agricultural Research OfficerDepartment of Agricultural ResearchP/Bag 0033, Gaborone,BOTSWANA
AbstractWater is the factor most limit-
ing to dryland crop production in Botswana because of low and er-ratic rainfall and high evaporative demands. Much research work has been done on soil and water man-agement techniques that improve and stabilize crop production in Botswana. Tied-ridging, furrow and precision strip tillage systems in-creased soil water storage and crop yields on sandy loam soils but did not appeal to farmers due to differ-ences between conventional meth-ods and additional labour and equip-ment required. Double ploughing, was effective in weed control and improving crop yields. Deep tillage
F. Pule-MeulenbergLecturerDepartment of Crop Science & ProductionBotswana College of AgricultureP/Bag 0027, Gaborone,BOTSWANA
M. MzukuLecturerDepartment of Agricultural Engineering& Land PlanningBotswana College of AgricultureP/Bag 0027, GaboroneBOTSWANA
Water Harvesting and Conservation Techniquesfor Dryland Crop Production in Botswana: A Review
C. PatrickSenior Lecturer & Head Department of Agricultural Engineering& Land PlanningBotswana College of AgricultureP/Bag 0027, Gaborone.BOTSWANA
K. KasheAgric. Research OfficerDepartment of Agricultural ResearchP/Bag 0033, Gaborone.BOTSWANA
and single mouldboard ploughing of loamy and clod-forming soils in-creased water infiltration and crop yields. Surface residue management and minimum tillage such as chisel ploughing are low input farming systems with a potential for the enhancement of soil moisture con-ditions in Botswana. The challenge is to ensure large-scale practical implementation of such technologies with a view to increase and stabilize crop yields.
IntroductionBotswana lies more or less in the
centre of Southern Africa and is divided by the Tropic of Capricorn.
Water is the major factor limiting dryland crop production in Botswa-na (DLFRS, 1980; Breyer, 1986; DAR, 1991, Racliffe et al., 1992). Lack of adequate water supply ema-nates from low average annual rain-fall (200-650 mm) that is highly er-ratic with common dry spells during the cropping season and droughts that occur from year to year (Pike, 1971; Bhalotra, 1987). In the south-western corner, the rainfall is as low as 200 mm per year and it increases as one goes north to about 650 mm in the extreme northern par t of the country. In eastern and north-eastern Botswana, rainfall occurs between October and April, is un-reliable, mono-modal and averages between 450 to 600 mm per annum
AGRICULTURAL MECHANIZATION IN ASIA, AFRICA, AND LATIN AMERICA 2010 VOL.41 NO.310
(Bhalotra, 1987). The rainy season is followed by a five months (May to August), dry winter season. Runoff from high intensity rainstorms can reach 50 to 70 % of rainfall (Gib-bon et al., 1974; DLFRS, 1980; L & WMRP, 1992) and this, combined with high evaporative demands, low infiltration rates and low water holding capacity of the soils reduce effective rainfall and crop produc-tion potential. The nature of rainfall patterns in Botswana makes dryland crop production highly risky and calls for efficient use of available water resources to stabilize the large fluctuations in crop yields.
In order to get the most effective use of variable and limited water supply, various tillage and crop management techniques can be used to modulate this water variability. The main aim of tillage is to retain rainfall where it falls on the field, to improve infiltration potential, and reduce runoff and evaporation losses. Water harvesting and con-servation farming techniques that may be effectively used vary from simple and low-input intervention (double ploughing, plough and cul-tivate, single mouldboard ploughing and reduced tillage using disk and chisel plough instead of mould-board plough) to more radical or complex interventions that use land engineering operations such as tied ridges and furrow, deep ripping and contouring. Once water conserva-tion practices are put in place, crop-ping management techniques such as judicious planting dates, choice of crops with early-maturing, high-yielding, drought resistance or in-creased water use efficient crop va-rieties are planted. Also, agronomic practices that include application of fertilizers based on expected water supply and pest control all play an important role in improving water use efficiency and crop production yields.
The idea of effective agricultural improvement in low-input, small-holder farming is to modify the
traditional production system with-out the need for excessive external input and high-level mechanization. Low-input t illage interventions investigated in Botswana include single ploughing, double ploughing, and plough and cultivate. Ploughing after harvest or early spring on first rains followed by second ploughing after the next appreciable rainfall (at least 15 mm of rain) and planting is referred to as double ploughing (L & WMRP, 1992; Persaud et al., 1992). In this system, ploughing can also be done after harvest or dur-ing winter followed by the second ploughing in spring before planting. Plough and cultivate is similar to double ploughing except that the second ploughing is done using a tined cultivator instead of a mould-board plough. Deep tillage, surface residue management and reduced tillage promote water infiltration where rain falls on the field. Tied-ridges, furrows and strip tillage systems redistribute and concentrate rainwater at certain locations on the field and the water also infiltrates and increases soil water storage. Tied-ridges are a variation of mi-crocatchment approach for trapping water and holding water in small depressions or blocked furrows. The small depressions retard runoff, hold water and allow it to infiltrate into the soil. Tied ridges are suitable for areas not prone to high intensity rainstorms and freely drained soils with gentle slopes.
Despite the amount of work de-voted towards improving crop pro-duction, cereal grain yields under traditional farming average 350 kg ha-1 compared with over 1500 kg ha-1 under research conditions and commercial farming (IFPP, 1977; EFSAIP, 1981, DLFRS, 1985; Persaud et al., 1992). The factors contributing towards low produc-tion under traditional farming vary from limited use of fertilizers, poor crop management and lack of pest control measures. Even though high yielding crop varieties are generally
used in traditional arable areas, the fields are located on areas that lack infrastructural development, and are on fragile soils characterised by poor fertility (Oland et al., 1980 and MOA, 2000).
Although less than 1 % of arable soils were rated as having high po-tential for dryland crop productivity (MOA, 2000), the use of modern farming techniques can raise suit-ability of 20 % of the land to at least moderate productivity (Radcliffe et al., 1992). These soils are located on areas of relatively high rainfall in the north of the country and to a lesser extent in the southeast re-gion. Considering availability of more suitable and improved dryland farming agricultural technologies, there is much scope in improving crop production in Botswana.
A considerable amount of work on water harvesting and conserva-tion research and related studies has been conducted in Botswana during the past 35 years. Literature of crop and soil management technologies is found in various publications and reports. The challenge is to synthe-size research findings and provide farmers and producers with tech-nologies that are likely to provide reasonable yields in worst years and good crop yields in good seasons. The synthesis developed will also strengthen the knowledge base and understanding of available technolo-gies in Botswana.
The aim of this paper is to 1 re-view the effect of water harvesting and conservation techniques on soil properties and crop yield, 2 outline challenges and implications of im-proved technologies for arable farm-ing, and 3 recommend crop manage-ment techniques that improve crop yields and sustainable agricultural development in the semi-arid condi-tions of Botswana.
Influence of Tillage on Water Infil-tration
Ponded steady-state infiltration rates of uncultivated soils in Bo-
VOL.41 NO.3 2010 AGRICULTURAL MECHANIZATION IN ASIA, AFRICA, AND LATIN AMERICA 11
tswana varied between 11 to 330 mm hr-1 (Joshua, 1991). Water in-filtration was lowest (191 mm hr-1) and greatest (353 mm hr-1) under sweep tillage and precision strip till-age (ripping to 30 cm depth in crop rows), respectively (DLFRS, 1980; Moroke et al., 2007). Mouldboard, chisel and disk ploughing resulted in similar infiltration rates of about 245 mm hr-1. Average ponded steady state infiltration rates were 110, 140, 230 and 270 mm hr-1 (after 4 hours) on ferric luvisols, haplic luvisols, chromic cuvisols and cerric creno-sols (Mandiringana et al., 2006; Moroke et al., 2007). Sandy loam ferric frenosols (Kalahari sand) and chromic luvisols had the greatest water infiltration rates. Steady-state infiltration rate was greatest under deep ripping and single mould-board ploughed soils. This could be explained in part by accelerated organic matter decomposition and soil structure deterioration due to repeated tillage under double ploughing that leads to relatively rapid collapse of soil aggregates. Deep ripping and single ploughing have a better potential to relatively increase organic matter content, de-crease runoff and improve soil wa-ter storage through increased water infiltration.
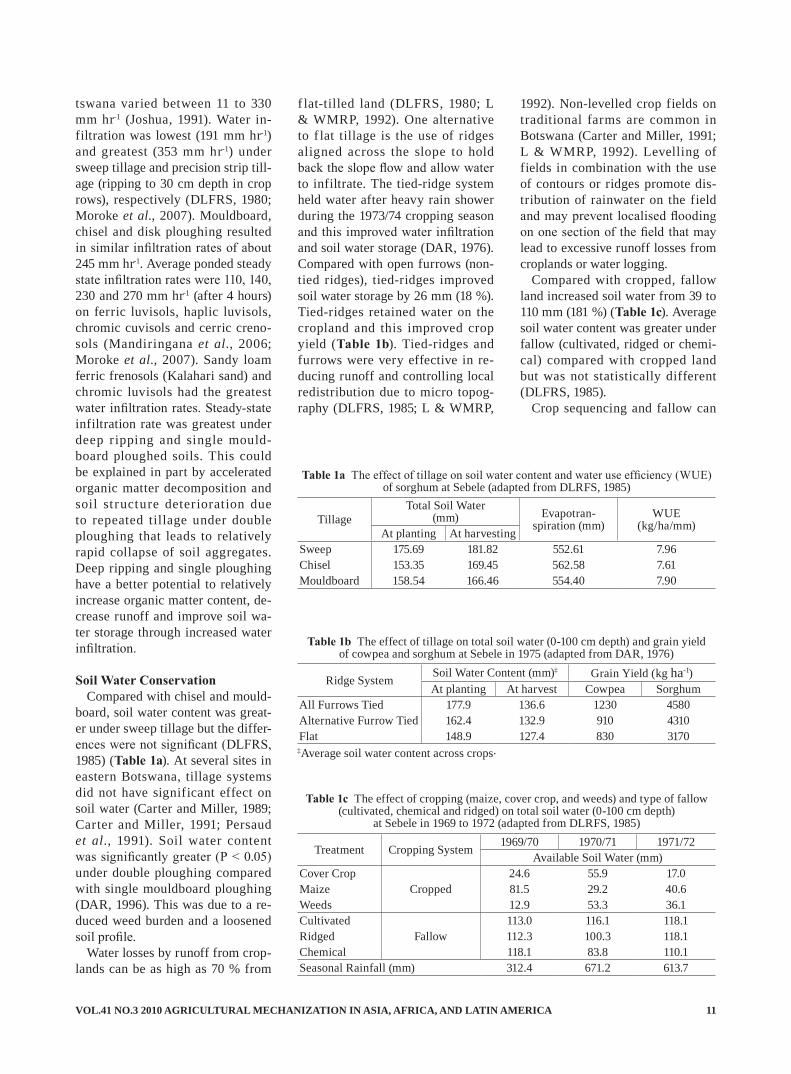
Soil Water ConservationCompared with chisel and mould-
board, soil water content was great-er under sweep tillage but the differ-ences were not significant (DLFRS, 1985) (Table 1a). At several sites in eastern Botswana, tillage systems did not have significant effect on soil water (Carter and Miller, 1989; Carter and Miller, 1991; Persaud et al., 1991). Soil water content was significantly greater (P < 0.05) under double ploughing compared with single mouldboard ploughing (DAR, 1996). This was due to a re-duced weed burden and a loosened soil profile.
Water losses by runoff from crop-lands can be as high as 70 % from
f lat-tilled land (DLFRS, 1980; L & WMRP, 1992). One alternative to f lat tillage is the use of ridges aligned across the slope to hold back the slope flow and allow water to infiltrate. The tied-ridge system held water after heavy rain shower during the 1973/74 cropping season and this improved water infiltration and soil water storage (DAR, 1976). Compared with open furrows (non-tied ridges), tied-ridges improved soil water storage by 26 mm (18 %). Tied-ridges retained water on the cropland and this improved crop yield (Table 1b). Tied-ridges and furrows were very effective in re-ducing runoff and controlling local redistribution due to micro topog-raphy (DLFRS, 1985; L & WMRP,
1992). Non-levelled crop fields on traditional farms are common in Botswana (Carter and Miller, 1991; L & WMRP, 1992). Levelling of fields in combination with the use of contours or ridges promote dis-tribution of rainwater on the field and may prevent localised flooding on one section of the field that may lead to excessive runoff losses from croplands or water logging.
Compared with cropped, fallow land increased soil water from 39 to 110 mm (181 %) (Table 1c). Average soil water content was greater under fallow (cultivated, ridged or chemi-cal) compared with cropped land but was not statistically different (DLFRS, 1985).
Crop sequencing and fallow can
TillageTotal Soil Water
(mm) Evapotran-spiration (mm)
WUE(kg/ha/mm)At planting At harvesting
Sweep 175.69 181.82 552.61 7.96Chisel 153.35 169.45 562.58 7.61Mouldboard 158.54 166.46 554.40 7.90
Table 1a The effect of tillage on soil water content and water use efficiency (WUE) of sorghum at Sebele (adapted from DLRFS, 1985)
Ridge SystemSoil Water Content (mm)‡ Grain Yield (kg ha-1)At planting At harvest Cowpea Sorghum
All Furrows Tied 177.9 136.6 1230 4580Alternative Furrow Tied 162.4 132.9 910 4310Flat 148.9 127.4 830 3170
Table 1b The effect of tillage on total soil water (0-100 cm depth) and grain yield of cowpea and sorghum at Sebele in 1975 (adapted from DAR, 1976)
‡Average soil water content across crops.
Treatment Cropping System 1969/70 1970/71 1971/72Available Soil Water (mm)
Cover CropCropped
24.6 55.9 17.0Maize 81.5 29.2 40.6Weeds 12.9 53.3 36.1Cultivated
Fallow113.0 116.1 118.1
Ridged 112.3 100.3 118.1Chemical 118.1 83.8 110.1Seasonal Rainfall (mm) 312.4 671.2 613.7
Table 1c The effect of cropping (maize, cover crop, and weeds) and type of fallow (cultivated, chemical and ridged) on total soil water (0-100 cm depth)
at Sebele in 1969 to 1972 (adapted from DLRFS, 1985)
AGRICULTURAL MECHANIZATION IN ASIA, AFRICA, AND LATIN AMERICA 2010 VOL.41 NO.312
be managed to increase soil water storage. Rainwater falling on fallow land can be conserved in the soil to supplement the rain that is received in the next season. In Botswana, partial fallows are essentially be-tween post harvest to planting (May/June to November/January or early February in the North, where the growing season is longer). Full fal-low is that part of the land that is not cropped for the rest of season and it could be a fraction or the whole of a farmers’ field.
Weed control under fallow was achieved using herbicides and cul-tivation (Whiteman, 1975; DLFRS, 1980). Average soil water content under fallow was about three times greater as compared with cropped land (Table 1c). Compared with cropped area, the benefit of fallow in improving soil water storage increased with decreasing rainfall. When the previous seasonal rain-fall was high, the effect of fallow was negligible (Table 1c). Besides eliminating weed competition for water and nutrients, this technique also improved infiltration of winter (late season) and early spring rains. Double ploughing, a partial fallow that increased soil water storage and improved crop yields was a recom-mended tillage technique for dry-land farming in Botswana.
The difference between 83 and 30 mm of stored soil water at planting led to a yield difference of 1190 and 70 kg ha-1 of sorghum under only 108 mm of incident rainfall (DL-FRS, 1985). Compared with con-ventional methods, sorghum grain yields were doubled due to fallow in Botswana (Whiteman, 1975). However, weed infestation, lack of labour for weeding and the thought of weeding an uncropped land has made adoption of fallow system dif-ficult in Botswana.
Effect of Tillage on Crop Water Use Efficiency (WUE)
Considering the long-term sea-sonal rainfall average of 525 mm
(Bhalotra, 1987; L & WMRP, 1992), it appears major crops (cowpea, maize, sorghum and millet) in Bo-tswana would be produced quite reliably. However, high runoff and evaporation losses, low available water holding capacity and low input-management farming methods led to low WUE. Compared with traditional farming (e.g., broadcast-ing; low-input and minimal fertiliz-er use) WUE was much greater un-der improved crop production (row planting, fertilizer use, pest control and timely planting) (L & WMRP, 1992). Sub-optimal and harsh crop physical environment under tradi-tional farming severely limit crops to effectively use soil water and led to low WUE (L & WMRP, 1992). Improved WUE caused crop yields in traditional farming systems to be increased.
Sorghum generally has high WUE but crops such as maize, cowpea, groundnut and watermelon may arguably be more marketable than sorghum. For example, groundnut, peanut and maize are commonly used as snacks in Botswana and can afford farmers a reasonable income. In addition, these crops may be harvested as green vegetables and do not have to reach physiological maturity, showing that they could have a very short season depending on the intended use.
Differences of WUE and crop yields between improved (relatively higher inputs) and traditional (low-input) agriculture were dramatic (L & WMRP, 1992). Traditional crop production with low plant popula-tion density had low but stable crop yields, while more intensive and improved crop production, had relatively greater but unstable crop yields. Changing from extensive traditional methods to intensive crop production (hybrids, effective weed control measures, fertilizer application based on soil test) in-creased WUE. Also, combined use of tillage and fertilizer use improved WUE (FAO, 1987; ICRISAT, 1989).
However, there was a need for long-term investigations of how yield and WUE could be increased without sacrificing yield stability.
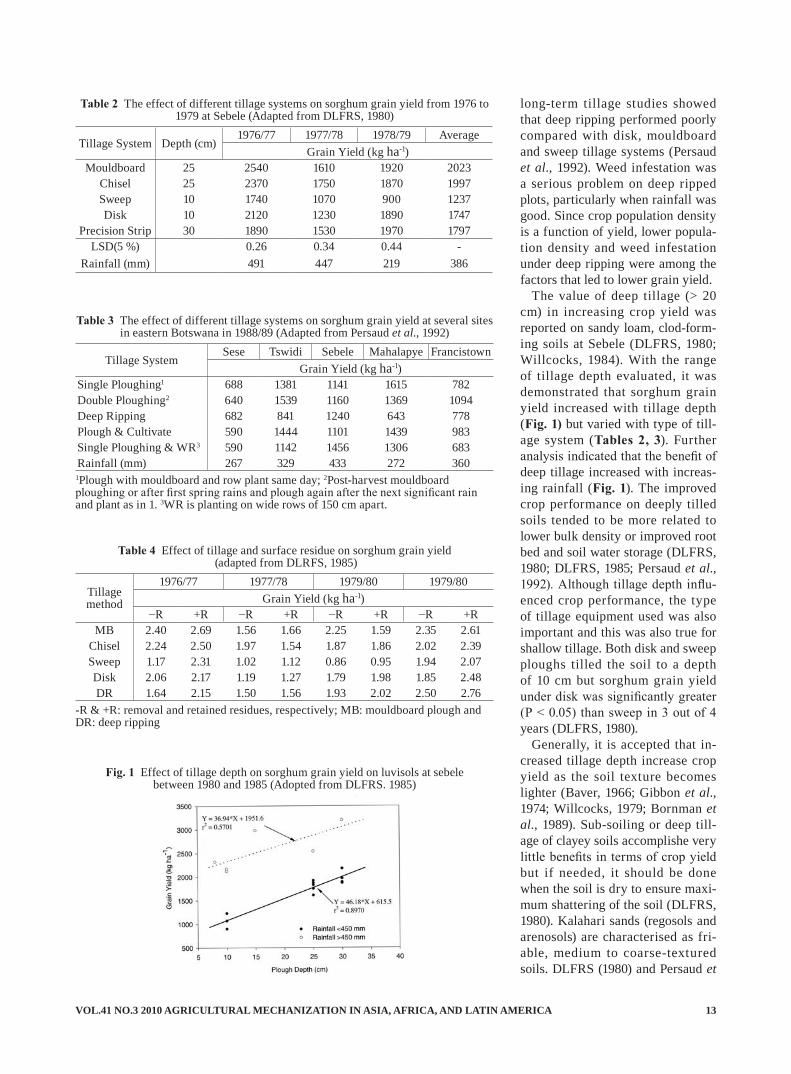
Effect of Tillage on Crop YieldA series of trials comparing dif-
ferent tillage systems on soil prop-erties, water conservation and crop yields were carried out mostly in eastern Botswana (DLFRS, 1980; L & WMRP, 1992, Persaud et al., 1992). Conventional mouldboard ploughing on clod-forming soil (san-dy loam) produced depressions that stored rainwater that acted as micro-catchments. This was so since most of the rainfall occured in few high intensity, short duration showers in-terspersed by periods of high evapo-rative demand, high run-off leading to low effective rainfall. Any form of tillage was therefore beneficial to both run-off reduction and the im-provement of the hydraulic conduc-tivity of the soil. Mouldboard and chisel ploughing consistently out-yielded shallow sweep tillage (DL-FRS, 1985; Willcocks, 1981; Dregne and Willis, 1983; Lal, 1985a). Thus, mouldboard ploughing on sandy loam soils produced sorghum grain yields that were similar to chisel, and disk tillage systems, which are well known water conserving till-age systems. Crop yields under disk plough and precision strip (deep ripping) were generally similar but slightly smaller than mouldboard and chisel plough (Tables 2, 4).
As a follow up to DLFRS till-age research, double mouldboard, and single mouldboard and cul-tivate ploughing (Table 3) were introduced and investigated. Deep ripping (variant of precision strip tillage) with crop row width of 150 cm in contrast to the standard 75 cm was recommended for further investigation (DLFRS, 1980). Com-pared with deep ripping, ploughing using mouldboards and chisels sig-nificantly (P < 0.05) increased grain yield on 2 years out of 4 (Table 3). However, sorghum grain yield from
VOL.41 NO.3 2010 AGRICULTURAL MECHANIZATION IN ASIA, AFRICA, AND LATIN AMERICA 13
long-term tillage studies showed that deep ripping performed poorly compared with disk, mouldboard and sweep tillage systems (Persaud et al., 1992). Weed infestation was a serious problem on deep ripped plots, particularly when rainfall was good. Since crop population density is a function of yield, lower popula-tion density and weed infestation under deep ripping were among the factors that led to lower grain yield.
The value of deep tillage (> 20 cm) in increasing crop yield was reported on sandy loam, clod-form-ing soils at Sebele (DLFRS, 1980; Willcocks, 1984). With the range of tillage depth evaluated, it was demonstrated that sorghum grain yield increased with tillage depth (Fig. 1) but varied with type of till-age system (Tables 2, 3). Further analysis indicated that the benefit of deep tillage increased with increas-ing rainfall (Fig. 1). The improved crop performance on deeply tilled soils tended to be more related to lower bulk density or improved root bed and soil water storage (DLFRS, 1980; DLFRS, 1985; Persaud et al., 1992). Although tillage depth influ-enced crop performance, the type of tillage equipment used was also important and this was also true for shallow tillage. Both disk and sweep ploughs tilled the soil to a depth of 10 cm but sorghum grain yield under disk was significantly greater (P < 0.05) than sweep in 3 out of 4 years (DLFRS, 1980).
Generally, it is accepted that in-creased tillage depth increase crop yield as the soil texture becomes lighter (Baver, 1966; Gibbon et al., 1974; Willcocks, 1979; Bornman et al., 1989). Sub-soiling or deep till-age of clayey soils accomplishe very little benefits in terms of crop yield but if needed, it should be done when the soil is dry to ensure maxi-mum shattering of the soil (DLFRS, 1980). Kalahari sands (regosols and arenosols) are characterised as fri-able, medium to coarse-textured soils. DLFRS (1980) and Persaud et
Tillage method
1976/77 1977/78 1979/80 1979/80Grain Yield (kg ha-1)
−R +R −R +R −R +R −R +RMB 2.40 2.69 1.56 1.66 2.25 1.59 2.35 2.61
Chisel 2.24 2.50 1.97 1.54 1.87 1.86 2.02 2.39Sweep 1.17 2.31 1.02 1.12 0.86 0.95 1.94 2.07Disk 2.06 2.17 1.19 1.27 1.79 1.98 1.85 2.48DR 1.64 2.15 1.50 1.56 1.93 2.02 2.50 2.76
Table 4 Effect of tillage and surface residue on sorghum grain yield (adapted from DLRFS, 1985)
-R & +R: removal and retained residues, respectively; MB: mouldboard plough and DR: deep ripping
Fig. 1 Effect of tillage depth on sorghum grain yield on luvisols at sebele between 1980 and 1985 (Adopted from DLFRS. 1985)
Tillage SystemSese Tswidi Sebele Mahalapye Francistown
Grain Yield (kg ha-1)Single Ploughing1 688 1381 1141 1615 782Double Ploughing2 640 1539 1160 1369 1094Deep Ripping 682 841 1240 643 778Plough & Cultivate 590 1444 1101 1439 983Single Ploughing & WR3 590 1142 1456 1306 683Rainfall (mm) 267 329 433 272 360
Table 3 The effect of different tillage systems on sorghum grain yield at several sites in eastern Botswana in 1988/89 (Adapted from Persaud et al., 1992)
1Plough with mouldboard and row plant same day; 2Post-harvest mouldboard ploughing or after first spring rains and plough again after the next significant rain and plant as in 1. 3WR is planting on wide rows of 150 cm apart.
Tillage System Depth (cm)1976/77 1977/78 1978/79 Average
Grain Yield (kg ha-1)Mouldboard 25 2540 1610 1920 2023
Chisel 25 2370 1750 1870 1997Sweep 10 1740 1070 900 1237Disk 10 2120 1230 1890 1747
Precision Strip 30 1890 1530 1970 1797LSD(5 %) 0.26 0.34 0.44 -
Rainfall (mm) 491 447 219 386
Table 2 The effect of different tillage systems on sorghum grain yield from 1976 to 1979 at Sebele (Adapted from DLFRS, 1980)

AGRICULTURAL MECHANIZATION IN ASIA, AFRICA, AND LATIN AMERICA 2010 VOL.41 NO.314
al. (1992) recommended that only a shallow tillage operation is required to control weeds before planting. However, weed control using herbi-cides are as effective.
Tied ridges concentrate rainwater on cropped land, reduce runoff and can produce yield benefits in dry years (DLFRS, 1985c L & WMRP, 1992). Tied ridging significantly (P < 0.05) increased sorghum grain yield in both wet and dry seasons (Table 1b). Tied ridges and furrows were very effective in reducing runoff and restricting local redis-tribution due to micro topography (DLFRS, 1985; L & WMRP, 1992).
Fallowing allows the soil to ac-cumulate nutrients and water re-serves leading to improved yields of subsequent crops (Rowland, 1993). Whiteman (1975) showed that water conservation by fallowing improved crop yields by more than 100 %. Sorghum grain yield was signifi-cantly greater (P < 0.05) after bare fallow than after crop cover, weed and maize crop (Whiteman, 1975). Chemical weed control during fal-low was more effective in water conservation than mechanical till-age and ridging (Whiteman, 1975).
During the May to August dry winter period, soil commonly dries out to near permanent wilting point unless there are late rains. Under these conditions, partial fallow is suitable for dryland conditions in Botswana where crop performance under double mouldboard plough-ing is good (Persaud et al., 1992; DAR, 1996). In this system, post-harvest or early spring ploughing at first rains is done to control weeds, improves water inf iltration that recharges the soil profile and soil water storage. Second ploughing and planting is conducted at the next sufficient rainfall. Once planted, the crop benefits from weed free seed-bed and sufficient stored soil water often ensure good establishment (Persaud et al., 1992; DAR, 1996). In contrast, post harvest or early spring allowed a flush of nitrogen to
occur at planting and become avail-able to young crops. Grain yield un-der deep ripping and conventional tillage with wide row spacing (150 cm row spacing) were about the same (Persaud et al., 1991), probably because of comparable plant popu-lation density.
Although deep ripping is an ideal water harvesting technique for semi-arid Botswana, this tillage system did not perform better than tillage systems that included conventional, double ploughing, plough and culti-vate, and chiselling. Chisel plough-ing resulted in crop yields that were comparable to double ploughing, a tillage system recommended for crop production in Botswana. Chisel ploughing is a minimum tillage technique that disturbs the soil less and retains more crop residues on the soil surface. Conservation farm-ing using chisel ploughing could reduce tillage costs, facilitate timely completion of tillage operations, and conserve soil and water and bio-diversity under the dryland crop production conditions in Botswana.
Maintenance of crop residues on the soil surface all year round pro-tects the soil against soil erosion, improves water infiltration and re-duces evaporation and runoff losses. Average positive increase in sor-ghum grain due to presence of crop residue was 31, 15, 14, 13 and 10 % for sweep, chisel, disk, deep ripping and mouldboard tillage systems, re-spectively (Table 4). Retaining crop residue on the soil surface signifi-cantly increased mean yields across tillage treatments (DLFRS, 1985). Within individual tillage treatments, grain yield increases were greatest for sweep, deep ripping, and disk tillage. Only mouldboard and chisel ploughing showed inconsistency in increasing sorghum grain yield due to presence of surface residues (Table 4). DLFRS (1985) reported that surface residue cover was not uniform after tillage operations and this probably caused decreased grain yield in some years.
ConclussionsThe lack of good arable land
coupled with low and erratic rainfall limit dryland crop production in Bo-tswana. Research findings show that there is much scope for agricultural development and that Botswana has the capacity to produce surplus grains at economic levels. However, there is a need to use the most pro-ductive land and practise the most water efficient techniques available.
Among improved water use tech-nologies are water harvesting and conservation (e.g., tied-ridges and surface residues), reduced tillage and surface residue management. High management inputs such as fertilization, pest control and till-age are needed to optimise the use of rainwater. Bare fallow as full or partial (double ploughing) system, has some measure of built in yield stability and has shown a great po-tential in Botswana.
On Kalahari sands, weed control before planting using herbicides or shallow cultivation was the only tillage required for crop production. Minimum tillage using chisels or disks improved crop yields that were similar to conventional mouldboard ploughing on sandy loamy or clod-forming soils in eastern Botswana. On these soils, crop yields increased with depth of tillage because of re-duced bulk density. The use of chis-el plough was the most economic because it covered a larger path and the yields were comparable to dou-ble ploughing. Surface residues sup-pressed evaporation and increased water infiltration.
RecommendationsMuch research on promising tied-
ridging and deep ploughing tech-nologies needs to be continued both on-farm and at research stations.
The use of minimum tillage, crop residue and partial fallow combined with short season and appropriate crop management techniques would increase water use efficiency of dry-
VOL.41 NO.3 2010 AGRICULTURAL MECHANIZATION IN ASIA, AFRICA, AND LATIN AMERICA 15
land crops in Botswana.
REFERENCESBaver, L. D. 1966. Soil physics (3rd
Ed). John Wiley & Sons, Inc., New York, NY.
Bhalotra, Y. P. R. 1987. Climate of Botswana, Part II: elements of cli-mate. Department of Meteorologi-cal Services. Govt of Botswana. Gaborone.
Bornman J. J., J. F. Ranwell, G. C. H. Venter, and L. B. Vosloo (eds.). 1989. Fertilizer handbook. Third Edition. The Fertilizer Society of South Africa. Hennopsmeer. South Africa.
Breyer, J. I. 1986. The dryland farm-ing of the lower Boteti region and its suitability for traditional dry-land farming. Ph.D Dissertation. Unversity of Hamburg, Hamburg, Germany.
Carter, D. C. and S. T. Miller. 1991. Three year experience with an on-field macro-catchment water harvesting system in Botswana. Agric. Water Manage. 19: 191-203.
Carter, D. and S. Miller. 1989. Crop production using using water har-vesting techniques, No.7, p. 1-14. The Bulletin of Agricultural Re-search, Gaborone.
DAR. 1996. Annual report for the Division of Crops Research. Department of Agricultural Re-search, Gaborone.
DAR. 1991. Annual report for the Division of Crops Research. Department of Agricultural Re-search, Gaborone.
DAR. 1976. Crop production in Bo-tswana, Biennial Report 1973-75. Department of Agricultural Re-search, Ministry of Agriculture, Gaborone.
DLFRS. 1985. Dryland Farming Research Scheme (DLFRS) Phase III 1985. Final Report Vol. 4. Till-age and water conservation. Div. of Agric. Res., Ministry of Agric. Gaborone.
DLFRS. 1980. Dryland Framing Research Scheme (DLFRS) Bo-tswana, Phase II Vol. 1: scheme summary and semiarid tillage studies. Division of Agricultural Research, Ministry of Agricul-ture/UK-ODA. Gaborone.
Dregne, H. E. and W. O. Willis (eds.). 1983. Dryland agriculture. Agron. Monogr. 23. ASA, CSSA and SSSA. Madison, WI.
EFSAIP. 1981. Evaluation of Farm-ing Systems and Agricultural Implements Project (EFSAIP) Botswana, farming system agron-omy: An evaluation of improved and t radit ional technologies, broadcast planting in perspective. Ministry of Agriculture/Div. of Agric. Res. Gaborone.
FAO. 1987. Soil and water conserva-tion in semi-arid areas. FAO Soils Bulletin No. 57. Rome.
Gibbon, D., J. Harvey, and K. Hab-bard. 1974. A minimum tillage for Botswana. World Crops 26: 229-235.
ICRISAT. 1989. Soil, crop and water management systems for rainfed agriculture in the Sudano-Sahelian Zone. Proceedings of the international work, 11-16 January 1987. ICRISAT ( International Crop Research Institute for Semi-arid Tropics) Sahelian Center, Neamey, Niger. ICRISAT, Pan-tacheru, India.
IFPP. 1977. Integrated Farming Pilot Project (IFPP). First annual report 1977. Agric. Field Services. Min-istry of Agriculture, Lobatse.
Lal, R. 1985a. Mechanized tillage systems effects on proper ties of tropical Alfisol in watershed cropped to maize. Soil and Tillage Res. 6: 149-161.
L & WMPRP. 1992. Crop produc-tion, rainfall, runoff and availabil-ity of soil moisture in semiarid Botswana. SACCAR, SADC. Ga-borone.
Mandiringana, O. T., T. E. Simalen-ga, and M. Mabi. 2006. Evaluation of soil-water Conservation tillage systems for communal farmers in
the Eastern Cape, South Africa. AMA. 37(4): 27-32.
MOA. 2000. National Master Plan for Agricultural Development (NAMPAD) final report, Vol. 1, Main Report. Tahal Agricultural Engineering Consulting Com-pany, Ministry of Agriculture. Gaborone.
Moroke. T. S., O. Dikinya, and C. Patrick. 2007. Comparison of wa-ter infiltration under different till-age systems and soils in eastern Botswana. Proceeding of second Scientif ic Symposium, 20-22 February 2007, The Grand Palm, Gaborone. SADC Land and Water Management Applied Research and Training Programme, Sebele, Botswana.
Oland, K., H. Alverson, and R. W. Cumming Jr. 1980. Targets for agricultural development in Bo-tswana. Depart. of Res., MoA. Sebele.
Persaud, N., A. MacPherson, B. Sebolai, S. Beynon, M. Phillips, and N. Mokete. 1991. Tillage and fertilizer research Programme. Repor t on the 1990/91 tillage and fertilizer trials. Ministry of Agriculture, Dept. of Agric. Res., Gaborone.
Persaud, N., A. MacPherson, B. Sebolai, S. Beynon, M. Phillips, and N. Mokete. 1992. Tillage and fertilizer research Programme. Repor t on the 1990/91 tillage and fertilizer trials. Ministry of Agriculture, Dept. of Agric. Res., Gaborone.
Pike, J. G. 1971. Rainfall and evapo-ration in Botswana. Technical document 1. UNDP, Gaborone.
Radcliffe, D. J., J. L. Tersteeg, and P. V. de Wit. 1992. Map of land suitability for rainfed crop pro-duction, explanatory note and leg-end. Project FAO/TCP/BOT/053. Field Document No. 3. Ministry of Agric. Gaborone.
Twomlow, S. T. and P. M. C. Bru-neau. 2000. The inf luence of tillage on semi-arid soil-water regimes in Zimbabwe. Geoderma
AGRICULTURAL MECHANIZATION IN ASIA, AFRICA, AND LATIN AMERICA 2010 VOL.41 NO.316
95: 33-51.Whiteman, P. T. S. 1975. Moisture
conservation by fallowing in Bo-tswana. Experimental Agriculture 11: 305-314. 1975.
Willcocks, T. J. 1984. Tillage re-quirements in relation to soil type in semi-arid rainfed agriculture. J. Agric. Eng. Res. 30: 327-336. 1984.
Willcocks, T. J. 1981. The tillage of clod-farming sandy loam soils in the semi-arid climate of Botswa-na. Soil Tillage Research 1: 3223-350.
Willcocks, T. J. 1979. Semi-arid till-age research in Botswana. p. 127-146. In Food Production and Rural Development Division. Proceed-ings of appropriate tillage work-
shop held 16-20 January 1979 in Zaria, Nigeria. Food Production and Rural Development Division, Commonwealth Secretariat, Pall Mall, London. UK.
■■
NEWS
Irrigation Show 2010Dec. 5-7, 2010I Phoenix, AZ I www. irrigationshow. org
Grow Your Business:Stay current on irrigation best praciices.Explore the latest innovations.See the winners of the new product contest.Network with customers, business partners and peers.Learn how to improve and promote your business.Find out how IA is advancing the industry.
Inprove Your Knowledge300+ exhibitorsEducation classesIA certification examsASABE technical sessionsWater management best practicesNEW Ag insights track
VOL.41 NO.3 2010 AGRICULTURAL MECHANIZATION IN ASIA, AFRICA, AND LATIN AMERICA 17
by
Ashish K. ShrivastavaJunior Project OfficerAgricultural & Food Engineering Department, Indian Institute of Technology, Kharagpur (WB)INDIA
AbstractTractors that are intended to be
used by Indian farmers must be designed based on anthropometric data of male agricultural workers to enhance efficiency, comfort and safety of the tractor drivers. The arrangement of controls on a trac-tor is the crucial deciding factor for the comfort and efficiency of tractor drivers. The quantitative method of Banks and Boone (1981) to compare the alternate controls arrangement was followed to study the acces-sibility indices of five Indian trac-tors. The location of controls from the seat reference point (SRP) and their ranked frequency of use for the tractors were determined to cal-culate the accessibility index. The accessibility indices for the tractors were negative and ranged −0.350 to −0.025. It was observed that the control arrangements on the trac-tor were not within easy reach of Indian drivers. Therefore, it may be concluded that frequently operated controls on the tractors should be located in or very close to optimum reach area of the operators for better tractor workplace design.
C. R. MehtaPrincipal ScientistAgricultural Energy and Power division Central Institute of Agricultural Engineering, Nabi-bagh, Bhopal-462 038 (MP)INDIA
M. M. PandeyDirectorCentral Institute of Agricultural Engineering, Nabi-bagh, Bhopal-462 038 (MP)INDIA
Accessibility Index of Indian Tractors - A Case Study
Atul K. ShrivastavaAssociate ProfessorCollege of Agricultural Engineering, JNKVV, Jabalpur (MP)INDIA
IntroductionThe basic concept in the applica-
tion of human factors to the system design is the “human machine sys-tem”. It can be defined as the study of human abilities and characteris-tics that affect the design of equip-ment, systems and jobs. It is an interdisciplinary activity based on human engineering, psychology and anatomy of the operator. The main aim is to improve the efficiency, comfort and safety of operators. In our day to day life we find ourselves in contact with physical facilities that have a relationship to our basic physical features and dimensions while working with machines. These facilities might be chairs, desks, work areas, controls for trac-tors or machines, and clothing. We know from general experience that the comfort, safety and performance of people are greatly affected by the extent that the “facilities fit” to the user. Equipment that is intended to be used by people must be designed and/or selected according to anthro-pometric principles if it is to func-tion satisfactorily. Thus, it is crucial that engineers involved in the de-
sign of “people equipment” under-stand the use of anthropometric techniques in their design. The wide range in size and ability of humans make the designer’s task challeng-ing.
The tractor designer must con-sider the great variation of users and attempts should be made to accommodate a large proportion of operators. However, human beings must not only fit spatially in a man-machine-task system but also be able to move and function dynami-cally. It requires additional room for the operator to ingress, egress, move, turn, reach, and operate con-trols. Although static body dimen-sions are helpful for certain design purposes, dynamic and functional dimensions are more useful for most design problems. The dynamic and functional dimensions must consid-er the location and movement of op-erating controls as well as the forces to be exerted and the direction and frequency of the movements.
Anthropometric data are avail-able as a ready reference in western countries for scientific experiments to improve the comfort and safety of the tractor operators. However,
AGRICULTURAL MECHANIZATION IN ASIA, AFRICA, AND LATIN AMERICA 2010 VOL.41 NO.318
available Indian anthropometric data are not sufficient (Patel et al., 2000). Studies from the western countries underline the importance of ergo-nomic consideration for improving the safety and comfort of tractor operator. Lehmann (1958) studied the relative positioning of brake and clutch pedals, foot rest, steering column and steering wheel. Dupuis (1959) investigated the strain on the tractor operators during operation of different controls. He observed that the operator shifted the gear lever and operated the clutch pedal, brake pedals and hydraulic control lever of a front mounted loader 230, 100 and 250 times, respectively during an hour. He concluded that the ef-ficiency and comfort of the operator could be improved with a properly designed tractor workplace. Tiwari (2001) reported that tractor drivers operated the hydraulic control lever 224 times, shifted gears and oper-ated the clutch pedal 210 times and operated brake pedal 100 times in an hour during ploughing opera-tion. Yadav (1995) reported mean frequencies of 72, 148, 230 and 436 for operation of clutch pedal, brake pedals, draft control lever and view-ing backward, respectively, by the tractor drivers over a period of one hour.
Liljedahl et al. (1959) studied the forces required to steer wheel type farm tractors. Matthew and Knight (1971) suggested that the vertical distance of the pedal should vary with the type of task and should not be more than 400 mm. McCormick (1976) recommended the design feature of vehicle cabs. Matthews (1977) suggested that better control design required less physical effort to operate the controls. A survey in Bedfordshire was conducted by Barber (1978) to determine the cor-relation between the characteristics of the tractor seat/workplace and operator subjective opinions. Whyte and Barber (1985) investigated the nature of tractor driving and postur-al changes required for agricultural
operations. Gite and Yadav (1989) collected anthropometric data of ag-ricultural workers from Central In-dia and suggested the use of data for farm machinery design on the basis of 5th, 50th and 95th percentile val-ues of workers. Arude and Tiwari (1999) studied control locations in popular Indian tractor models and tractor operator activities while performing ploughing operations. Mehta et al. (2003) reported that horizontal and vertical leg reach of the operators in a tractor seat are interrelated and specified the limits for location of tractor control ped-als.
In India, about 13 leading tractor manufacturers sell around 260,000 tractors per year. The size, shape and location of controls on these tractors vary based on hp of the tractor and research input of individ-ual tractor manufacturers. However, the tractors are operated by Indian agricultural workers. The scientific information about the accessibil-ity of controls on these tractors by Indian operators based on anthro-pometric consideration is meager. A good tractor design requires that important controls are easily ac-cessible to operators. The designer must consider the great variation in anthropometric parameters of us-ers and their attempt should be such that it can accommodate large pro-portion of operators. Therefore, the quantitative method given by Banks and Boone (1981) to compare the alternate controls arrangement on automobiles was followed to study the accessibility index of some of Indian tractors.
Theoretical ConsiderationsAccessibility index (Banks and
Boone, 1981) is a function of the correlation between distance from operators to controls and ranked frequency of use of controls during operation of the tractor. This index considers three important factors:
The convenience of reaching the control as determined by the reach envelope for a particular size person.
The frequency of use from a sub-jective evaluation on the part of the users.
The relative position to the opera-tor so that controls used most frequently should be closer to the operator.
The Accessibility index can be calculated by the equations given below.
....... (1)
................................ (2)where, I = Accessibility index,r = (Pearson) co-relation between
distance from the operator to control(X) and the ranked fre-quency of use (Y),
n = number of controls outside the reach envelope,
N = total number of controls,f = rank of each control within the
envelope,f^ = rank of each control outside
the envelope, ands = number of operators used to
collect the data.The accessibility index ranges
between −2 and +1. The closer the index approaches +1, the better the control arrangement on the tractor is within the reach of the drivers.
Materials and MethodsThe five most popular Indian trac-
tors of different makes, models and sizes; viz T1 (45 kW), T2 (56 kW), T3 (26 kW), T4 (34 kW) and T5 (26 kW), were randomly selected for determi-nation of accessibility indices. The location of controls on the tractors from the operator was determined with respect to seat reference point (SRP). Seat reference point (SRP) is defined as the point in the central
rN XY X Y
N X 2 X2
N Y 2 Y2
I rf
n
fN
S
S
VOL.41 NO.3 2010 AGRICULTURAL MECHANIZATION IN ASIA, AFRICA, AND LATIN AMERICA 19
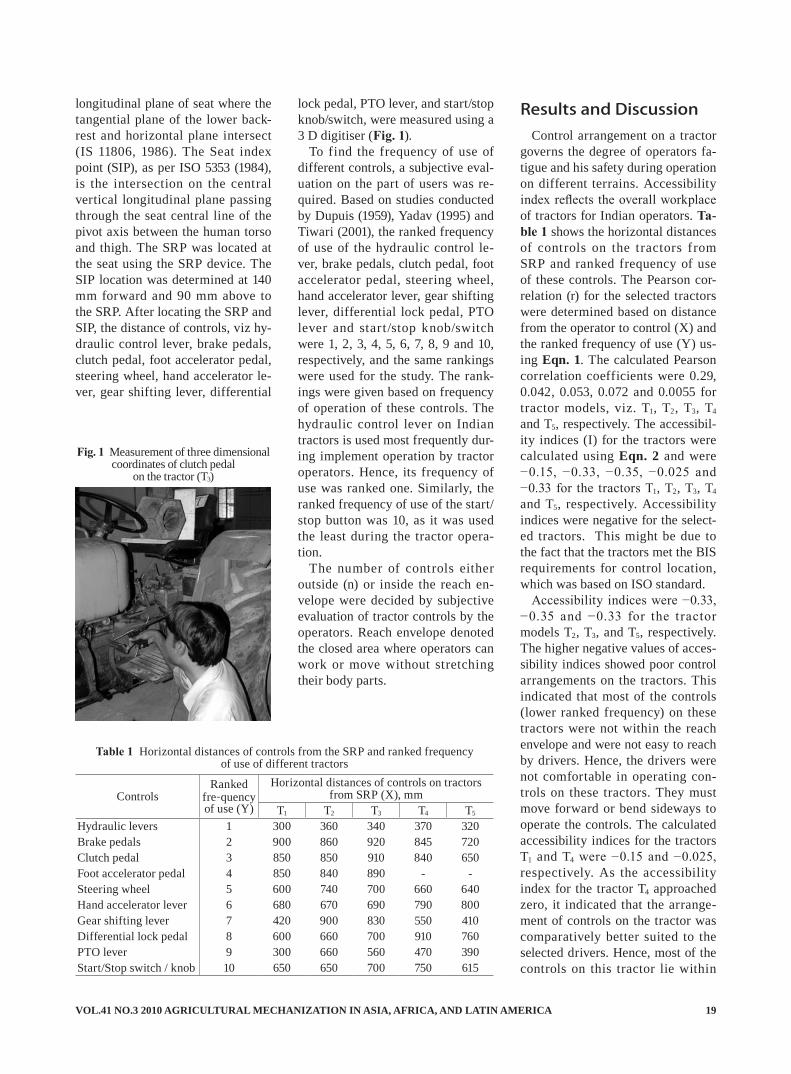
longitudinal plane of seat where the tangential plane of the lower back-rest and horizontal plane intersect (IS 11806, 1986). The Seat index point (SIP), as per ISO 5353 (1984), is the intersection on the central vertical longitudinal plane passing through the seat central line of the pivot axis between the human torso and thigh. The SRP was located at the seat using the SRP device. The SIP location was determined at 140 mm forward and 90 mm above to the SRP. After locating the SRP and SIP, the distance of controls, viz hy-draulic control lever, brake pedals, clutch pedal, foot accelerator pedal, steering wheel, hand accelerator le-ver, gear shifting lever, differential
lock pedal, PTO lever, and start/stop knob/switch, were measured using a 3 D digitiser (Fig. 1).
To find the frequency of use of different controls, a subjective eval-uation on the part of users was re-quired. Based on studies conducted by Dupuis (1959), Yadav (1995) and Tiwari (2001), the ranked frequency of use of the hydraulic control le-ver, brake pedals, clutch pedal, foot accelerator pedal, steering wheel, hand accelerator lever, gear shifting lever, differential lock pedal, PTO lever and start/stop knob/switch were 1, 2, 3, 4, 5, 6, 7, 8, 9 and 10, respectively, and the same rankings were used for the study. The rank-ings were given based on frequency of operation of these controls. The hydraulic control lever on Indian tractors is used most frequently dur-ing implement operation by tractor operators. Hence, its frequency of use was ranked one. Similarly, the ranked frequency of use of the start/stop button was 10, as it was used the least during the tractor opera-tion.
The number of controls either outside (n) or inside the reach en-velope were decided by subjective evaluation of tractor controls by the operators. Reach envelope denoted the closed area where operators can work or move without stretching their body parts.
Results and DiscussionControl arrangement on a tractor
governs the degree of operators fa-tigue and his safety during operation on different terrains. Accessibility index reflects the overall workplace of tractors for Indian operators. Ta-ble 1 shows the horizontal distances of controls on the tractors from SRP and ranked frequency of use of these controls. The Pearson cor-relation (r) for the selected tractors were determined based on distance from the operator to control (X) and the ranked frequency of use (Y) us-ing Eqn. 1. The calculated Pearson correlation coefficients were 0.29, 0.042, 0.053, 0.072 and 0.0055 for tractor models, viz. T1, T2, T3, T4 and T5, respectively. The accessibil-ity indices (I) for the tractors were calculated using Eqn. 2 and were −0.15, −0.33, −0.35, −0.025 and −0.33 for the tractors T1, T2, T3, T4 and T5, respectively. Accessibility indices were negative for the select-ed tractors. This might be due to the fact that the tractors met the BIS requirements for control location, which was based on ISO standard.
Accessibility indices were −0.33, −0.35 and −0.33 for the t ractor models T2, T3, and T5, respectively. The higher negative values of acces-sibility indices showed poor control arrangements on the tractors. This indicated that most of the controls (lower ranked frequency) on these tractors were not within the reach envelope and were not easy to reach by drivers. Hence, the drivers were not comfortable in operating con-trols on these tractors. They must move forward or bend sideways to operate the controls. The calculated accessibility indices for the tractors T1 and T4 were −0.15 and −0.025, respectively. As the accessibility index for the tractor T4 approached zero, it indicated that the arrange-ment of controls on the tractor was comparatively better suited to the selected drivers. Hence, most of the controls on this tractor lie within
ControlsRanked
fre-quency of use (Y)
Horizontal distances of controls on tractors from SRP (X), mm
T1 T2 T3 T4 T5
Hydraulic levers 1 300 360 340 370 320Brake pedals 2 900 860 920 845 720Clutch pedal 3 850 850 910 840 650Foot accelerator pedal 4 850 840 890 - -Steering wheel 5 600 740 700 660 640Hand accelerator lever 6 680 670 690 790 800Gear shifting lever 7 420 900 830 550 410Differential lock pedal 8 600 660 700 910 760PTO lever 9 300 660 560 470 390Start/Stop switch / knob 10 650 650 700 750 615
Table 1 Horizontal distances of controls from the SRP and ranked frequency of use of different tractors
Fig. 1 Measurement of three dimensional coordinates of clutch pedal
on the tractor (T3)
AGRICULTURAL MECHANIZATION IN ASIA, AFRICA, AND LATIN AMERICA 2010 VOL.41 NO.320
the reach of the operators. The cal-culated accessibility index for the tractor T3 was minimum (−0.35), i.e. maximum value towards the nega-tive side of the index. It highlighted that important frequently operated controls on the tractors were not within easy reach of the operators. Although the tractors T2 and T3 had enough space for the movements of the operators, but most of control arrangements were not within the reach envelope. Similar results were obtained for tractor T5.
Accessibility indices of the se-lected tractors ranged from −0.025 to −0.35 and it may be concluded that control arrangement on these tractors were not comfortable for Indian drivers. This may be because most the Indian tractor manufactur-ers opted the design parameter from the guidelines provided by ISO standard, which was adopted by the BIS due to lack of anthropometric data of Indian operators. Therefore, it may be concluded that frequently operated controls on tractors should be located in or very close to opti-mum reach area of the operator for the best design. Controls located outside this area will be more diffi-cult to operate. The controls should not be located outside the maximum reach area unless their frequency of use was very low. It was also ob-served that the range of dimensions presented in the Indian standard was very large. Therefore, it is required to refine the BIS standard based on anthropometric data of Indian agri-cultural workers. It was also felt that tractor manufacturers should also provide adjustment in controls loca-tions.
ConclusionsThe following conclusions may be
drawn from the study.· There was wide variation in
control arrangement on differ-ent makes and models of Indian tractors.
· The accessibility index is an ob-jective method to quantify the control arrangements on a trac-tor with respect to the operator.
· The accessibility indices for the selected Indian tractors were negative and ranged from −0.35 to −0.025. This indicated that control arrangements on the tractor were not within easy reach of Indian operators.
· The frequently operated controls on the tractors should be locat-ed in or very close to optimum reach area of the operator for better tractor workplace design.
REFERENCES
Arude and V. K. Tiwari. 1999. A study on control locations in popular Indian tractor models and tractor operators activities. Ap-plied Ergonomics, 22(5): 317-328.
Banks, W. W. and M. P. Boone. 1981. A method for quantifying control accessibility. Human Fac-tors, 23, 299-303.
Barber, T. S. 1978. A survey of tractor seating and postural re-quirements. Dept. Note No. DN/E/922/02005, NIAE, Silsoe, Eng-land.
BIS. 1986. Method of determination of seat reference point for tractor and machinery for agricultural and forestry, 11806.
Dupuis, H. 1959. Effect of tractor operation on human stress. Agri-cultural Engineering, 40, 510-519, 525.
Gite, L. P. and B. G. Yadav. 1989. Anthropometric survey for agri-cultural machinery design. Ap-plied Ergonomics, 20, 191-196.
International Organization for Stan-dardization (ISO). 1984. Earth moving machinery, and tractors and machinery for agriculture and forestry-Seat index point. Amend-ment 02. ISO 5353-1984.
Lehmann, G. 1958. Physiological basis of tractor design. Ergonom-ics, 1(3): 197-206.
Liljedahl, J. B., R. Gluck, and M. E. Schroeder. 1959. Steering force requirements of wheel tractors. Agricultural Engineering, 40, 522-525.
Matthews, J. 1977. The ergonomics of tractors. ARC Research Re-view, 3(3): 59-65.
Matthews, J. and A. A. Knight. 1971. Ergonomics in agricultural equipment design. National Insti-tute of Agricultural Engineering, Wrest Park, Silsoe, Bedford.
McCormick, E. J. 1976. Human Fac-tors in Engineering and Design. 4th edition, McGraw Hill Book Co., New York, 487p.
Mehta , C. R., P. S. Tiwar i , S. Rokade, M. M. Pandey, L. P. Gite, S. B. Yadav, and S. Pharade. 2004. Ergonomical considerations in op-timum locations of tractor control pedals for Indian operators. FMP-2004-HE-17. Proc. of XXXVIII Annual Convention of Indian Society of Agricultural, Dr. B. S. Sawant Konkan Krishi Vidyap-eeth, Dapoli (Jan. 16-18,2004), pp 564-572.
Patel, R., K. Adarsh, and D. Mohan. 2000. Development of an ergo-nomical facility for Indian trac-tors. Applied Ergonomics, 31, 311-316.
Tiwari, K. 2001. Ergonomical evalu-ation of tractor operator’s work-place and activity. Unpublished M. Tech thesis. J. N. K. V. V. Ja-balpur.
Whyte, E. L. and F. W. Barber. 1985. A method for relating seat-ing to control location. J. Agril. Engg., 24, 176-180.
Yadav, R. 1995. Some ergonomical investigation on tractor operator workplace design. Unpublished Ph. D. Thesis, Indian Institute of Technology, Kharagpur.
■■
VOL.41 NO.3 2010 AGRICULTURAL MECHANIZATION IN ASIA, AFRICA, AND LATIN AMERICA 21
by
P. U. ShahareAssociate professor (FMP),College of Agricultural Engineering,Mahatma Phule Krishi Vidyapeeth,Rahuri, M.S. 413 722INDIA
AbstractEfforts have been made to design
and develop a sleeve boom sprayer for cotton which could be operated with a 30-35 hp tractor. The blower performance of the sleeve boom sprayer was evaluated for different blower speeds, viz. 1,841 rpm, 2,035 rpm, 2,133 rpm and 2,362 rpm, for five stagger angles, viz. 8º, 16º, 24º, 32º, and 36º with an impeller of cambered, tapered and f lat under-surface made from two different materials, FRP and aluminium. The sleeve performance was evaluated for different sleeve angles, viz. −15º, 0º, 15º and 30º and for nozzle angles of 25º, 35º and 45º.
Air velocity and power consump-tion of the developed blower had a linear and quadratic relationship, respectively, with the blower speed. The droplet density increased with increase in air sleeve angle, either in the positive or negative direction to zero degrees air sleeve angle. Bet-ter values of VMD were obtained
S. K. ThakreAssistant Professor (FMP), College of Agricultural Engineering and Technology, Dr. PDKV, Akola, M.S. 444 104INDIA
Sleeve Boom Sprayer - Ⅱ: Performance Evaluation of a Tractor Mounted Sleeve Boom Sprayer for Cotton
S. M. MathurAssociate professor (FMP), College of Technology and Engineering, Maharana Pratap University of Agriculture and Technology, Udaipur (Rajsthan) 313 001 INDIA
Y. C. BhattAssociate professor (FMP), College of Technology and Engineering, Maharana Pratap University of Agriculture and Technology, Udaipur (Rajsthan) 313 001 INDIA
with 30º sleeve angle and 35º nozzle angle. The maximum mean drop-let densities at almost all positions within the plants were with a nozzle angle 35º.
These performance parameters fulfilled the requirements for spray-ing of cotton. The sleeve boom sprayer performed satisfactorily at a blower speed of 2,133 rpm with cambered type blades set at 36º when the sleeve was set at an angle of 30º and the nozzle at an angle of 35º.
IntroductionA signif icant factor, with in-
creased use of pesticides, is that high efficiency must be maintained during application in order to use only the minimum amount of pes-ticide for adequate control and minimum contamination to the environment. Many types of ap-plication equipment are available that have the ability to store, meter,
atomize and distribute pesticides with more accurate deposition for the control of targeted pests. Con-siderable effort has been made in recent years to develop a spraying system, mainly through modifica-tions of air stream configuration, to reduce the loss (Pergher et al., 1977). Air assisted spraying has received a lot of attention due to the claim of high drift reduction, improved canopy penetration to the lower side of the leaves, faster ap-plication rate and quick, easy pest
AckowledgementsThe authors sincerely thank to Mr.
Sharad Patel, the Managing Direc-tor, ASPEE Research and Develop-ment Foundation , Mumbai for pro-viding facility and necessary funds for this research work. Valuable guidance and help provided by Prof. A. C. Pandya, Chairman, Advisory Committee, ASPEE Research and Development Foundation, Mumbai is also sincerely acknowledged.
AGRICULTURAL MECHANIZATION IN ASIA, AFRICA, AND LATIN AMERICA 2010 VOL.41 NO.322
control (Anonymous, 1997). The sprayers were also modif ied by providing an adjustable air outlet to direct the spray to converge onto the canopy. Such configuration reduced the drift loss from 15 to 50 percent and improved deposition efficiency (Furness and Pinczewski, 1985). In India, very few research studies have been made on air sleeve boom spraying system on orchards. In field crops like cotton, due to veg-etative growth, the adjacent plants get intermingled with each other, which resist the penetration of spray deep into canopy and, on the lower side of the leaves, when sprayed with a conventional boom sprayer. Thus, the total pest on plants can not be controlled, resulting in poor productivity. Hence, a sleeve boom spraying system was developed and evaluated.
Materials and MethodsTest Set-up for Laboratory Tests
A wind tunnel was designed and fabricated following AMCA (1987) standards for testing the blower. The blower was run at four speeds; 1,841 rpm, 2,035 rpm, 2,133 rpm and 2,362 rpm. In the test set-up, speed of the blower was dependent upon gear ratio. Hence a uniform speed interval could not be ob-tained. In order to get different air velocities, the blade stagger angles were varied. To decide these levels, an initial test was conducted with a
impeller. The stagger angle was in-creased from 0º to 40º at 10º inter-vals and air velocity and discharge were measured. These values were increased up to 30º and decreased afterwards. Hence, stagger angles of 8º, 16º, 24º, 32º, and 36º were selected. Initially blades were fixed to the impeller at 8º. Similar pro-cedures were adopted for the tests with the remaining blades, speeds and stagger angles. The laboratory experiments were conducted to study sleeve performance with dif-ferent air sleeve angles and nozzle angles for droplet density and drop-let size on different plant positions. Sleeve angles of −15º, 0º, 15º and 30º; and nozzle angles of 25º, 35º and 45º were used. A false f loor arrangement was fabricated from 2 mm thick M.S. sheet with an ar-rangement to place the cotton plants at a recommended spacing of 900 mm in a single line. The spraying height was 80 cm. To facilitate the evaluation of spray penetration into the canopy of cotton plants, glossy papers were stapled onto the leaf in different plant locations, i.e. top po-sition, upper leaf surface (TU); top position, lower leaf surface (TL); middle position, upper leaf surface (MU); middle position, lower sur-face (ML); bottom position, upper leaf surface (BU) and bottom posi-tion, lower leaf surface (BL). Royal blue indigo dye was mixed with water to prepare coloured spray so-lution. The tractor was operated at 1.5 km/h for spraying in the labora-
tory. The glossy papers were taken for further analysis using a droplet image analyzer.
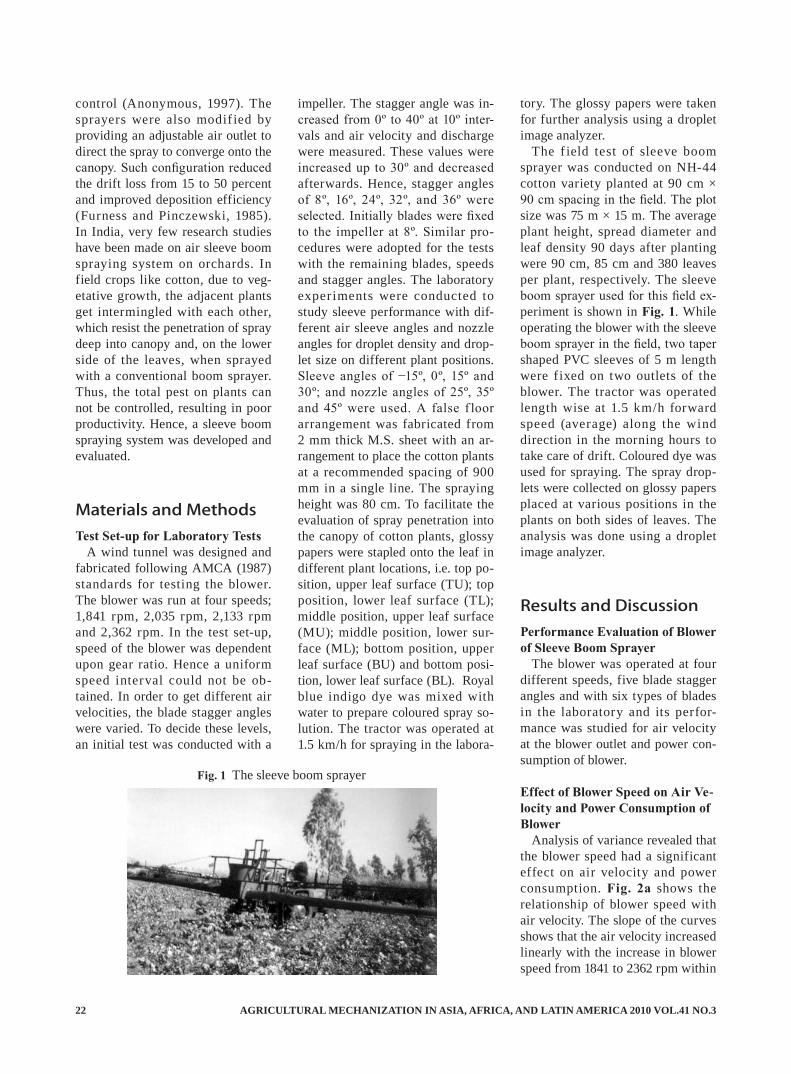
The f ield test of sleeve boom sprayer was conducted on NH-44 cotton variety planted at 90 cm × 90 cm spacing in the field. The plot size was 75 m × 15 m. The average plant height, spread diameter and leaf density 90 days after planting were 90 cm, 85 cm and 380 leaves per plant, respectively. The sleeve boom sprayer used for this field ex-periment is shown in Fig. 1. While operating the blower with the sleeve boom sprayer in the field, two taper shaped PVC sleeves of 5 m length were fixed on two outlets of the blower. The tractor was operated length wise at 1.5 km/h forward speed (average) along the wind direction in the morning hours to take care of drift. Coloured dye was used for spraying. The spray drop-lets were collected on glossy papers placed at various positions in the plants on both sides of leaves. The analysis was done using a droplet image analyzer.
Results and DiscussionPerformance Evaluation of Blower of Sleeve Boom Sprayer
The blower was operated at four different speeds, five blade stagger angles and with six types of blades in the laboratory and its perfor-mance was studied for air velocity at the blower outlet and power con-sumption of blower.
Effect of Blower Speed on Air Ve-locity and Power Consumption of Blower
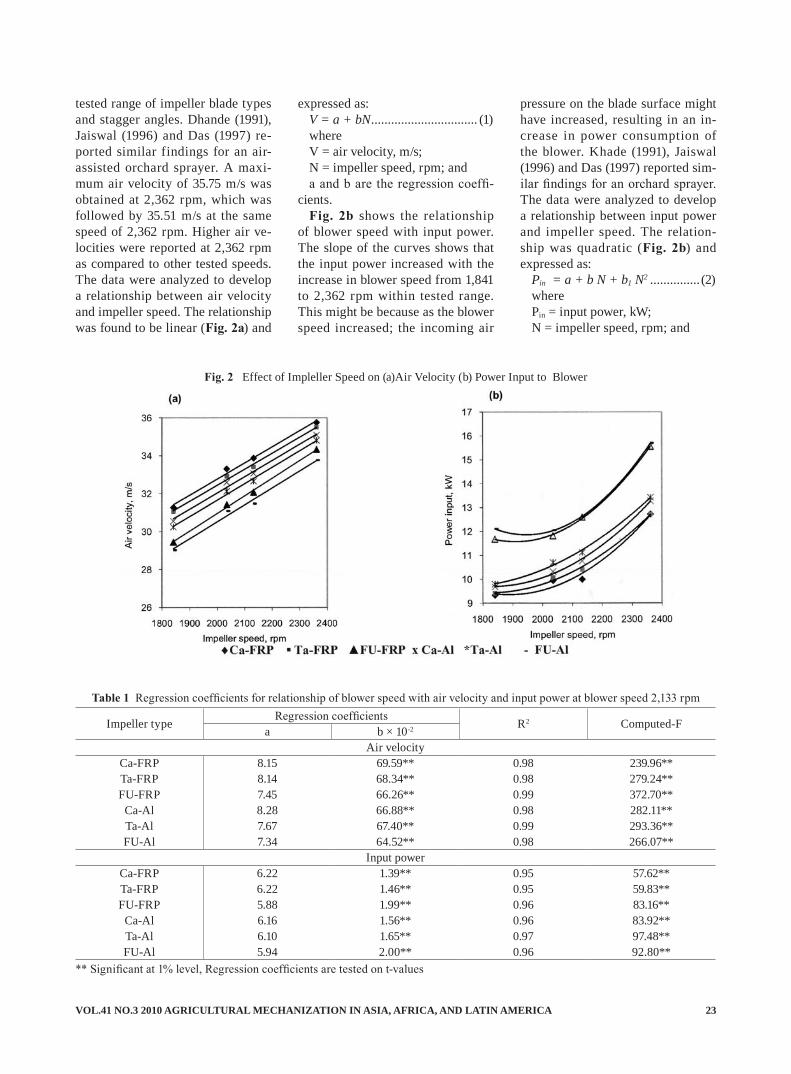
Analysis of variance revealed that the blower speed had a significant effect on air velocity and power consumption. Fig. 2a shows the relationship of blower speed with air velocity. The slope of the curves shows that the air velocity increased linearly with the increase in blower speed from 1841 to 2362 rpm within
Fig. 1 The sleeve boom sprayer
VOL.41 NO.3 2010 AGRICULTURAL MECHANIZATION IN ASIA, AFRICA, AND LATIN AMERICA 23
Impeller type Regression coefficients R2 Computed-Fa b × 10-2
Air velocityCa-FRP 8.15 69.59** 0.98 239.96**Ta-FRP 8.14 68.34** 0.98 279.24**FU-FRP 7.45 66.26** 0.99 372.70**
Ca-Al 8.28 66.88** 0.98 282.11**Ta-Al 7.67 67.40** 0.99 293.36**FU-Al 7.34 64.52** 0.98 266.07**
Input powerCa-FRP 6.22 1.39** 0.95 57.62**Ta-FRP 6.22 1.46** 0.95 59.83**FU-FRP 5.88 1.99** 0.96 83.16**
Ca-Al 6.16 1.56** 0.96 83.92**Ta-Al 6.10 1.65** 0.97 97.48**FU-Al 5.94 2.00** 0.96 92.80**
tested range of impeller blade types and stagger angles. Dhande (1991), Jaiswal (1996) and Das (1997) re-ported similar findings for an air-assisted orchard sprayer. A maxi-mum air velocity of 35.75 m/s was obtained at 2,362 rpm, which was followed by 35.51 m/s at the same speed of 2,362 rpm. Higher air ve-locities were reported at 2,362 rpm as compared to other tested speeds. The data were analyzed to develop a relationship between air velocity and impeller speed. The relationship was found to be linear (Fig. 2a) and
expressed as:V = a + bN ................................ (1)whereV = air velocity, m/s;N = impeller speed, rpm; anda and b are the regression coeffi-
cients.Fig. 2b shows the relationship
of blower speed with input power. The slope of the curves shows that the input power increased with the increase in blower speed from 1,841 to 2,362 rpm within tested range. This might be because as the blower speed increased; the incoming air
pressure on the blade surface might have increased, resulting in an in-crease in power consumption of the blower. Khade (1991), Jaiswal (1996) and Das (1997) reported sim-ilar findings for an orchard sprayer. The data were analyzed to develop a relationship between input power and impeller speed. The relation-ship was quadratic (Fig. 2b) and expressed as:
Pin = a + b N + b1 N2 ............... (2)wherePin = input power, kW;N = impeller speed, rpm; and
Fig. 2 Effect of Impleller Speed on (a)Air Velocity (b) Power Input to Blower
Table 1 Regression coefficients for relationship of blower speed with air velocity and input power at blower speed 2,133 rpm
** Significant at 1% level, Regression coefficients are tested on t-values
AGRICULTURAL MECHANIZATION IN ASIA, AFRICA, AND LATIN AMERICA 2010 VOL.41 NO.324
a, b and b1 are the regression co-efficients.
The power consumption for the required air velocity and air dis-charge generating impeller (Ca-FRP) was 10.00 kW at a blower speed of 2,133 rpm and at 36º blade stager angle, which was within the limit of available power for operat-ing the sleeve boom sprayer (11 kW). A regression coefficient for air velocity and power consumption is given in Table 1.
Effect of Impeller Blade Type on Air Velocity and Power Consump-tion of Blower
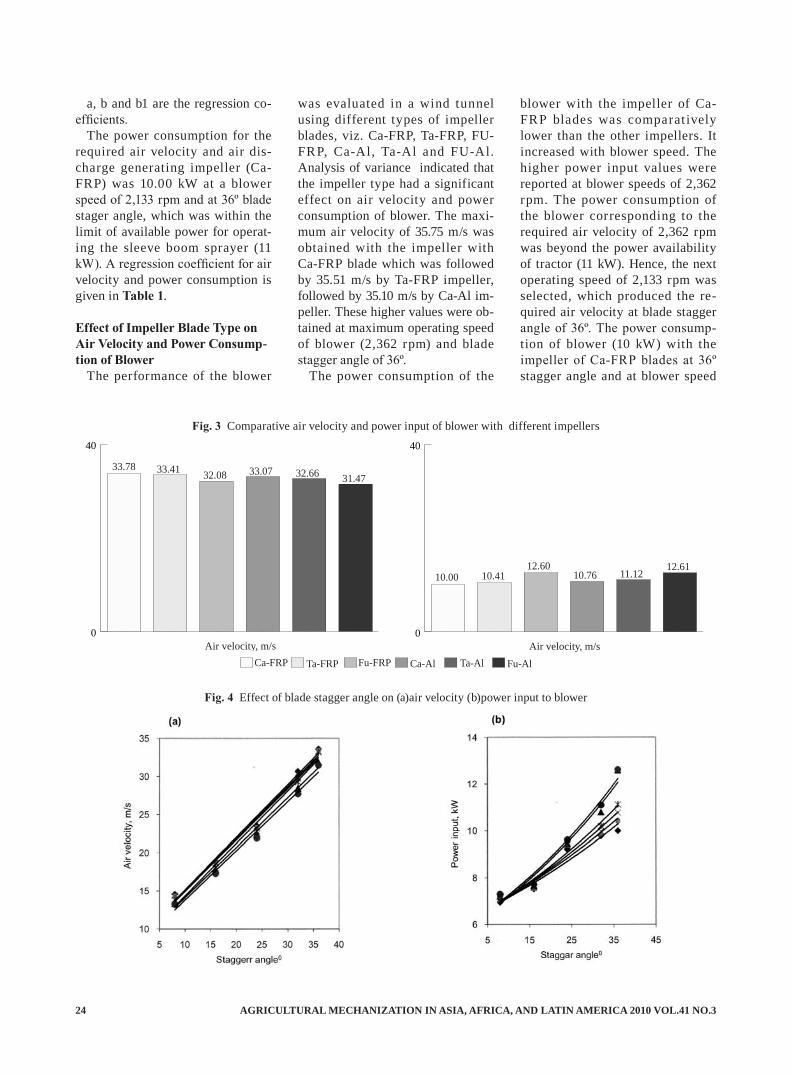
The performance of the blower
was evaluated in a wind tunnel using different types of impeller blades, viz. Ca-FRP, Ta-FRP, FU-FRP, Ca-Al, Ta-Al and FU-Al. Analysis of variance indicated that the impeller type had a significant effect on air velocity and power consumption of blower. The maxi-mum air velocity of 35.75 m/s was obtained with the impeller with Ca-FRP blade which was followed by 35.51 m/s by Ta-FRP impeller, followed by 35.10 m/s by Ca-Al im-peller. These higher values were ob-tained at maximum operating speed of blower (2,362 rpm) and blade stagger angle of 36º.
The power consumption of the
blower with the impeller of Ca-FRP blades was comparat ively lower than the other impellers. It increased with blower speed. The higher power input values were reported at blower speeds of 2,362 rpm. The power consumption of the blower corresponding to the required air velocity of 2,362 rpm was beyond the power availability of tractor (11 kW). Hence, the next operating speed of 2,133 rpm was selected, which produced the re-quired air velocity at blade stagger angle of 36º. The power consump-tion of blower (10 kW) with the impeller of Ca-FRP blades at 36º stagger angle and at blower speed
Air velocity, m/s0
40
Ca-FRP Ta-FRP Fu-FRP Ca-Al Ta-Al Fu-Al
33.78 33.41 32.08 33.07 32.66 31.47
Air velocity, m/s0
40
Ca-FRP Ta-FRP Fu-FRP Ca-Al Ta-Al Fu-Al
10.00 10.4112.60
10.76 11.1212.61
Fig. 3 Comparative air velocity and power input of blower with different impellers
Fig. 4 Effect of blade stagger angle on (a)air velocity (b)power input to blower
Ca-FRP Ta-FRP Fu-FRP Ca-Al Ta-Al Fu-Al
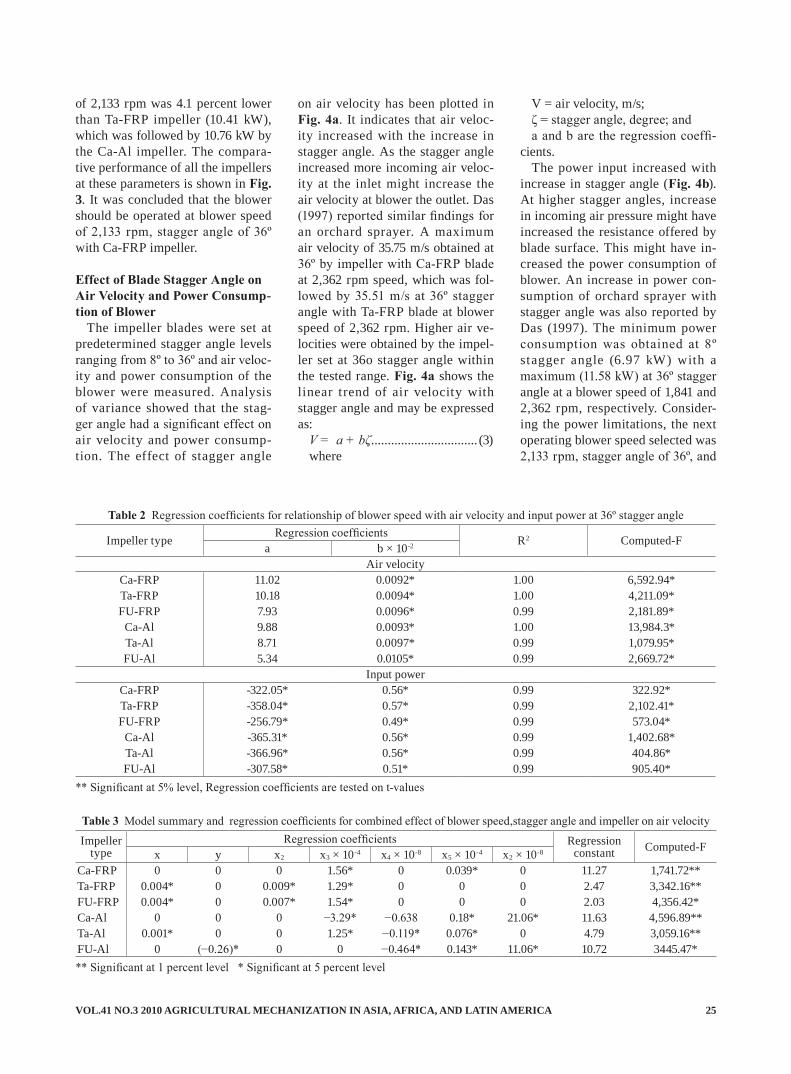
VOL.41 NO.3 2010 AGRICULTURAL MECHANIZATION IN ASIA, AFRICA, AND LATIN AMERICA 25
of 2,133 rpm was 4.1 percent lower than Ta-FRP impeller (10.41 kW), which was followed by 10.76 kW by the Ca-Al impeller. The compara-tive performance of all the impellers at these parameters is shown in Fig. 3. It was concluded that the blower should be operated at blower speed of 2,133 rpm, stagger angle of 36º with Ca-FRP impeller.
Effect of Blade Stagger Angle on Air Velocity and Power Consump-tion of Blower
The impeller blades were set at predetermined stagger angle levels ranging from 8º to 36º and air veloc-ity and power consumption of the blower were measured. Analysis of variance showed that the stag-ger angle had a significant effect on air velocity and power consump-tion. The effect of stagger angle
on air velocity has been plotted in Fig. 4a. It indicates that air veloc-ity increased with the increase in stagger angle. As the stagger angle increased more incoming air veloc-ity at the inlet might increase the air velocity at blower the outlet. Das (1997) reported similar findings for an orchard sprayer. A maximum air velocity of 35.75 m/s obtained at 36º by impeller with Ca-FRP blade at 2,362 rpm speed, which was fol-lowed by 35.51 m/s at 36º stagger angle with Ta-FRP blade at blower speed of 2,362 rpm. Higher air ve-locities were obtained by the impel-ler set at 36o stagger angle within the tested range. Fig. 4a shows the linear trend of air velocity with stagger angle and may be expressed as:
V = a + bζ ................................ (3)where
V = air velocity, m/s;ζ = stagger angle, degree; anda and b are the regression coeffi-
cients.The power input increased with
increase in stagger angle (Fig. 4b). At higher stagger angles, increase in incoming air pressure might have increased the resistance offered by blade surface. This might have in-creased the power consumption of blower. An increase in power con-sumption of orchard sprayer with stagger angle was also reported by Das (1997). The minimum power consumption was obtained at 8º stagger angle (6.97 kW) with a maximum (11.58 kW) at 36º stagger angle at a blower speed of 1,841 and 2,362 rpm, respectively. Consider-ing the power limitations, the next operating blower speed selected was 2,133 rpm, stagger angle of 36º, and
Impeller type Regression coefficients R2 Computed-Fa b × 10-2
Air velocityCa-FRP 11.02 0.0092* 1.00 6,592.94*Ta-FRP 10.18 0.0094* 1.00 4,211.09*FU-FRP 7.93 0.0096* 0.99 2,181.89*
Ca-Al 9.88 0.0093* 1.00 13,984.3*Ta-Al 8.71 0.0097* 0.99 1,079.95*FU-Al 5.34 0.0105* 0.99 2,669.72*
Input powerCa-FRP -322.05* 0.56* 0.99 322.92*Ta-FRP -358.04* 0.57* 0.99 2,102.41*FU-FRP -256.79* 0.49* 0.99 573.04*
Ca-Al -365.31* 0.56* 0.99 1,402.68*Ta-Al -366.96* 0.56* 0.99 404.86*FU-Al -307.58* 0.51* 0.99 905.40*
Table 2 Regression coefficients for relationship of blower speed with air velocity and input power at 36º stagger angle
** Significant at 5% level, Regression coefficients are tested on t-values
Impeller type
Regression coefficients Regression constant Computed-Fx y x2 x3 × 10-4 x4 × 10-8 x5 × 10-4 x2 × 10-8
Ca-FRP 0 0 0 1.56* 0 0.039* 0 11.27 1,741.72**Ta-FRP 0.004* 0 0.009* 1.29* 0 0 0 2.47 3,342.16**FU-FRP 0.004* 0 0.007* 1.54* 0 0 0 2.03 4,356.42*Ca-Al 0 0 0 −3.29* −0.638 0.18* 21.06* 11.63 4,596.89**Ta-Al 0.001* 0 0 1.25* −0.119* 0.076* 0 4.79 3,059.16**FU-Al 0 (−0.26)* 0 0 −0.464* 0.143* 11.06* 10.72 3445.47*
Table 3 Model summary and regression coefficients for combined effect of blower speed,stagger angle and impeller on air velocity
** Significant at 1 percent level * Significant at 5 percent level
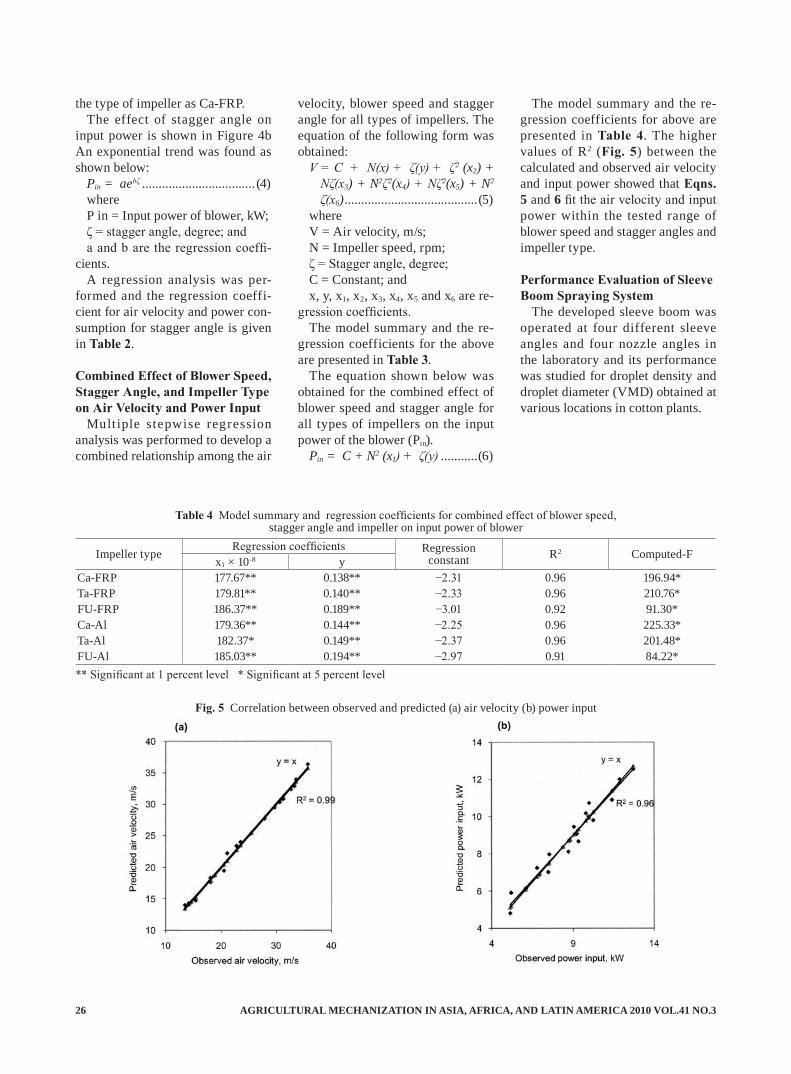
AGRICULTURAL MECHANIZATION IN ASIA, AFRICA, AND LATIN AMERICA 2010 VOL.41 NO.326
the type of impeller as Ca-FRP.The effect of stagger angle on
input power is shown in Figure 4b An exponential trend was found as shown below:
Pin = aebζ .................................. (4)whereP in = Input power of blower, kW;ζ = stagger angle, degree; and a and b are the regression coeffi-
cients.A regression analysis was per-
formed and the regression coeffi-cient for air velocity and power con-sumption for stagger angle is given in Table 2.
Combined Effect of Blower Speed, Stagger Angle, and Impeller Type on Air Velocity and Power Input
Mult iple stepwise regression analysis was performed to develop a combined relationship among the air
velocity, blower speed and stagger angle for all types of impellers. The equation of the following form was obtained:
V = C + N(x) + ζ(y) + ζ2 (x2) + Nζ(x3) + N2ζ2(x4) + Nζ2(x5) + N2
ζ(x6) ........................................(5)whereV = Air velocity, m/s;N = Impeller speed, rpm;ζ = Stagger angle, degree;C = Constant; andx, y, x1, x2, x3, x4, x5 and x6 are re-
gression coefficients.The model summary and the re-
gression coefficients for the above are presented in Table 3.
The equation shown below was obtained for the combined effect of blower speed and stagger angle for all types of impellers on the input power of the blower (Pin).
Pin = C + N2 (x1) + ζ(y) ...........(6)
The model summary and the re-gression coefficients for above are presented in Table 4. The higher values of R2 (Fig. 5) between the calculated and observed air velocity and input power showed that Eqns. 5 and 6 fit the air velocity and input power within the tested range of blower speed and stagger angles and impeller type.
Performance Evaluation of Sleeve Boom Spraying System
The developed sleeve boom was operated at four different sleeve angles and four nozzle angles in the laboratory and its performance was studied for droplet density and droplet diameter (VMD) obtained at various locations in cotton plants.
Fig. 5 Correlation between observed and predicted (a) air velocity (b) power input
Impeller type Regression coefficients Regressionconstant R2 Computed-Fx1 × 10-8 y
Ca-FRP 177.67** 0.138** −2.31 0.96 196.94*Ta-FRP 179.81** 0.140** −2.33 0.96 210.76*FU-FRP 186.37** 0.189** −3.01 0.92 91.30*Ca-Al 179.36** 0.144** −2.25 0.96 225.33*Ta-Al 182.37* 0.149** −2.37 0.96 201.48*FU-Al 185.03** 0.194** −2.97 0.91 84.22*
Table 4 Model summary and regression coefficients for combined effect of blower speed, stagger angle and impeller on input power of blower
** Significant at 1 percent level * Significant at 5 percent level

VOL.41 NO.3 2010 AGRICULTURAL MECHANIZATION IN ASIA, AFRICA, AND LATIN AMERICA 27
Effect of Sleeve Angle on Droplet Density and Droplet Diameter (VMD)
The sleeve was set at different angles (−15º, 0º 15º and 30º). Its ef-fect on droplet density and droplet diameter was studied. The droplet density and droplet diameter at dif-ferent sleeve angles are plotted in Fig. 6. The trend of the curve (Fig. 6a) showed that the droplet density increased with increase in air sleeve angle either in the positive or nega-tive direction to zero degrees air sleeve angle. This trend was found similar in almost all positions of the plant. The maximum droplet density obtained through the plant canopy on the upper leaf surface on the tar-get plant was at 30º air sleeve angle and minimum mean droplet density was observed with an air sleeve angle of 0º. Air velocity acting ver-tically downward (0º) showed lower
deposition as compared to other sleeve angles. The reason behind this phenomenon was that plant leaves offered more resistance to spray laden air to penetrate deep into canopy when air was entering vertically downward. The results showed that, due to an air sleeve angle of 30º, the number of droplets deposited at the top position upper and lower surface, middle upper (MU) and bottom position upper leaf surface was within the range of droplets recommended for effective control of pests.
The trend in Fig. 6b shows that the droplet diameter (VMD) in-creased with increase in sleeve angle from 30º to −15º for upper leaf surface for top, middle and bottom position of plant. It increased with increase in air sleeve angle either in positive or negative direction to
0º air sleeve angle for lower leaf surface for different plant positions. The maximum VMD was observed due to the position of air sleeve set at −15º angle at top leaf surfaces and minimum VMD was observed at 0º sleeve angle at lower leaf surface. The values of VMD were observed as an effect of air sleeve angle of 30º at top position at upper and lower leaf surfaces, middle upper surface of plant and bottom position at up-per and lower leaf surface were very close to opening size of stomata on leaf (100 micron). The lower leaf surfaces at middle position had at-tained the lowest deposition. This might be due to vigorous entrain-ment of air with spray thoroughly resulting in disintegration of the droplets. The higher impact of at-tacking air in the inclined direction and reflected air from ground sur-
Plantposition
Leafsurface
Droplet density,No./cm2
Droplet size,µm VMD
Volumeml/cm2
Depositionindex
Top Upper 26.52 120.1 2.30 × 10⁻⁵ 1.81Top Lower 22.88 123.0 2.22 ×10⁻⁵ 1.67
Middle Upper 21.10 107.4 1.30 × 10⁻⁵ 1.05Middle Lower 12.4 75.8 2.60 × 10⁻⁵ 0.2Bottom Upper 21.2 114.2 1.44 × 10⁻⁵ 1.22Bottom Lower 14.2 88.8 5.55 × 10⁻⁵ 1.43
Table 5 Data on field evaluation of tractor mounted sleeve boom sprayer
Fig. 6 Effect of air sleeve angle on (a)droplet density (b) droplet diameter
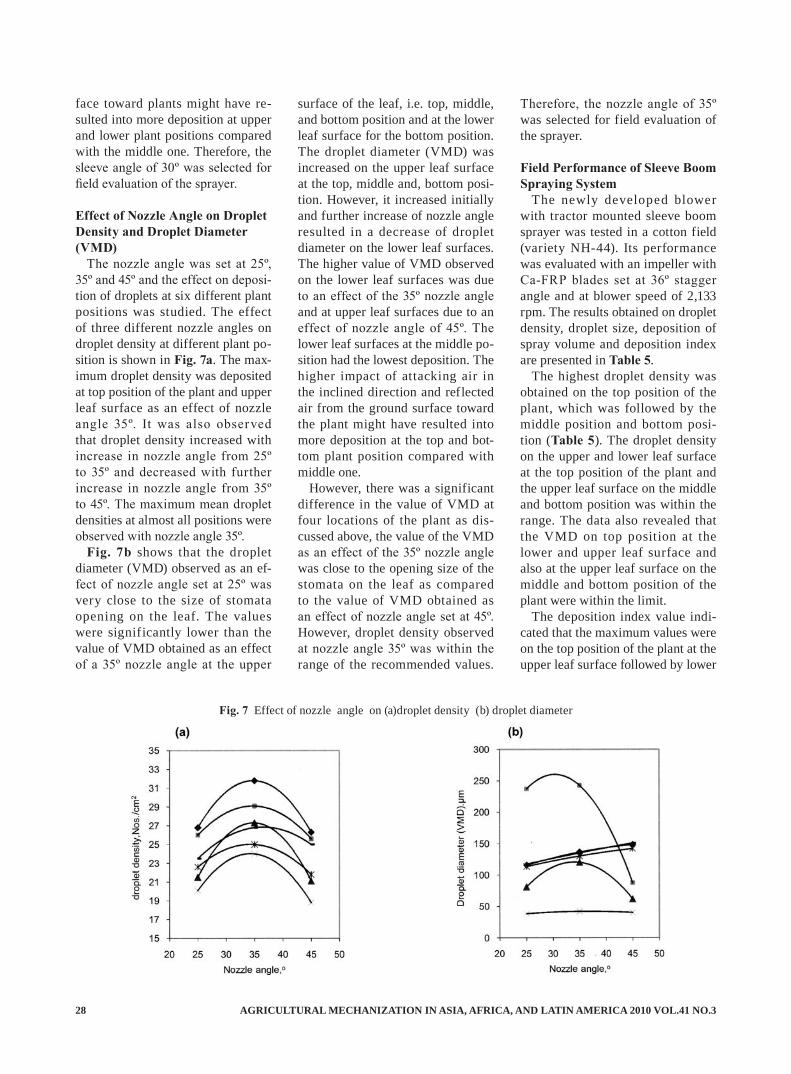
AGRICULTURAL MECHANIZATION IN ASIA, AFRICA, AND LATIN AMERICA 2010 VOL.41 NO.328
face toward plants might have re-sulted into more deposition at upper and lower plant positions compared with the middle one. Therefore, the sleeve angle of 30º was selected for field evaluation of the sprayer.
Effect of Nozzle Angle on Droplet Density and Droplet Diameter (VMD)
The nozzle angle was set at 25º, 35º and 45º and the effect on deposi-tion of droplets at six different plant positions was studied. The effect of three different nozzle angles on droplet density at different plant po-sition is shown in Fig. 7a. The max-imum droplet density was deposited at top position of the plant and upper leaf surface as an effect of nozzle angle 35º. It was also observed that droplet density increased with increase in nozzle angle from 25º to 35º and decreased with further increase in nozzle angle from 35º to 45º. The maximum mean droplet densities at almost all positions were observed with nozzle angle 35º.
Fig. 7b shows that the droplet diameter (VMD) observed as an ef-fect of nozzle angle set at 25º was very close to the size of stomata opening on the leaf. The values were significantly lower than the value of VMD obtained as an effect of a 35º nozzle angle at the upper
surface of the leaf, i.e. top, middle, and bottom position and at the lower leaf surface for the bottom position. The droplet diameter (VMD) was increased on the upper leaf surface at the top, middle and, bottom posi-tion. However, it increased initially and further increase of nozzle angle resulted in a decrease of droplet diameter on the lower leaf surfaces. The higher value of VMD observed on the lower leaf surfaces was due to an effect of the 35º nozzle angle and at upper leaf surfaces due to an effect of nozzle angle of 45º. The lower leaf surfaces at the middle po-sition had the lowest deposition. The higher impact of attacking air in the inclined direction and reflected air from the ground surface toward the plant might have resulted into more deposition at the top and bot-tom plant position compared with middle one.
However, there was a significant difference in the value of VMD at four locations of the plant as dis-cussed above, the value of the VMD as an effect of the 35º nozzle angle was close to the opening size of the stomata on the leaf as compared to the value of VMD obtained as an effect of nozzle angle set at 45º. However, droplet density observed at nozzle angle 35º was within the range of the recommended values.
Therefore, the nozzle angle of 35º was selected for field evaluation of the sprayer.
Field Performance of Sleeve Boom Spraying System
The newly developed blower with tractor mounted sleeve boom sprayer was tested in a cotton field (variety NH-44). Its performance was evaluated with an impeller with Ca-FRP blades set at 36º stagger angle and at blower speed of 2,133 rpm. The results obtained on droplet density, droplet size, deposition of spray volume and deposition index are presented in Table 5.
The highest droplet density was obtained on the top position of the plant, which was followed by the middle position and bottom posi-tion (Table 5). The droplet density on the upper and lower leaf surface at the top position of the plant and the upper leaf surface on the middle and bottom position was within the range. The data also revealed that the VMD on top position at the lower and upper leaf surface and also at the upper leaf surface on the middle and bottom position of the plant were within the limit.
The deposition index value indi-cated that the maximum values were on the top position of the plant at the upper leaf surface followed by lower
Fig. 7 Effect of nozzle angle on (a)droplet density (b) droplet diameter
VOL.41 NO.3 2010 AGRICULTURAL MECHANIZATION IN ASIA, AFRICA, AND LATIN AMERICA 29
leaf surface and lower leaf surface at the bottom position. However, these were slightly higher except at the upper leaf surface on the middle and bottom positions of plants.
ConclusionsIt can be concluded that the air ve-
locity of the developed sleeve boom sprayer increased with increase in blower speed linearly. A quadratic relationship was observed between input power and blower speed. The blower with impeller of Ca-FRP type consumed relatively less power (10 kW) at 2,133 rpm. The devel-oped sleeve boom sprayer exhibited better deposition efficiency with the impeller of Ca-FRP blades set at 36º stagger angle, operated at 2,133 rpm blower speed by setting the sleeve at an angle of 30º and nozzle angle of 35º. During the field trial, the droplet density and volume mean diameter indicated that the newly developed sprayer performed satis-factorily in the field when operated with a medium sized tractor.
REFERENCES
AMCA. 1987. Test Codes for Air Moving Devices. AMCA Stan-dard 210(67), AMCA, Inc., Illi-nois. pp. 1-55.
Anonymous. 1997. Degania Spray-ers Brochure-Air Sleeve Boom Sprayer. Degania Bet, 15230, Is-rael.
Das, S. K. 1997. Performance evalu-ation and optimization of parame-ters of axial flow blower. M Tech. Thesis, IIT, Kharagpur (India).
Dhande, K. G. 1992. Design and performance evaluation of air car-rier sprayer for mango orchard. M Tech. Thesis, IIT, Kharagpur (India).
Fuurness, G. D. and W. Pinczewski. 1985. A comparison of the spray distribution obtained from the sprayers with conversing and di-verging air jets with low volume air assisted spraying on citrus and grapevines. J. Agric. Engg. Res. 32: 291-301.
Jaiswal, A. P. 1996. Design devel-opment and performance evalu-ation of axial f low blower using
air-assisted spraying system for orange orchard. Unpublished M Tech. Thesis, MPUA&T, Udaipur , Rajsthan (India).
Khade, S. S. 1991. Design develop-ment and performance evaluation of axial flow mist blower. M Tech. Thesis, Dr. PDKV, Akola M. S. (India).
Pergher, G., R. Gubiani, and Ton-netto. 1977. Foliar deposition and pesticide losses from the air as-sisted sprayers in hedgerows vine-yard. Crop Protection. 19 (1): 25-33.
Shahare, P. U. 2005. Design, de-velopment and per for mance evaluation of axial f low blower for tractor mounted sleeve boom sprayer. Unpublished Ph. D. The-sis, MPUA&T, Udaipur, Rajsthan (India).
Thakare, S. K. 2004. Design, development and performance evaluation of air-assisted boom for tractor mounted sleeve boom sprayer. Unpublished Ph. D. The-sis, MPUA & T, Udaipur, Rajst-han (India).
■■
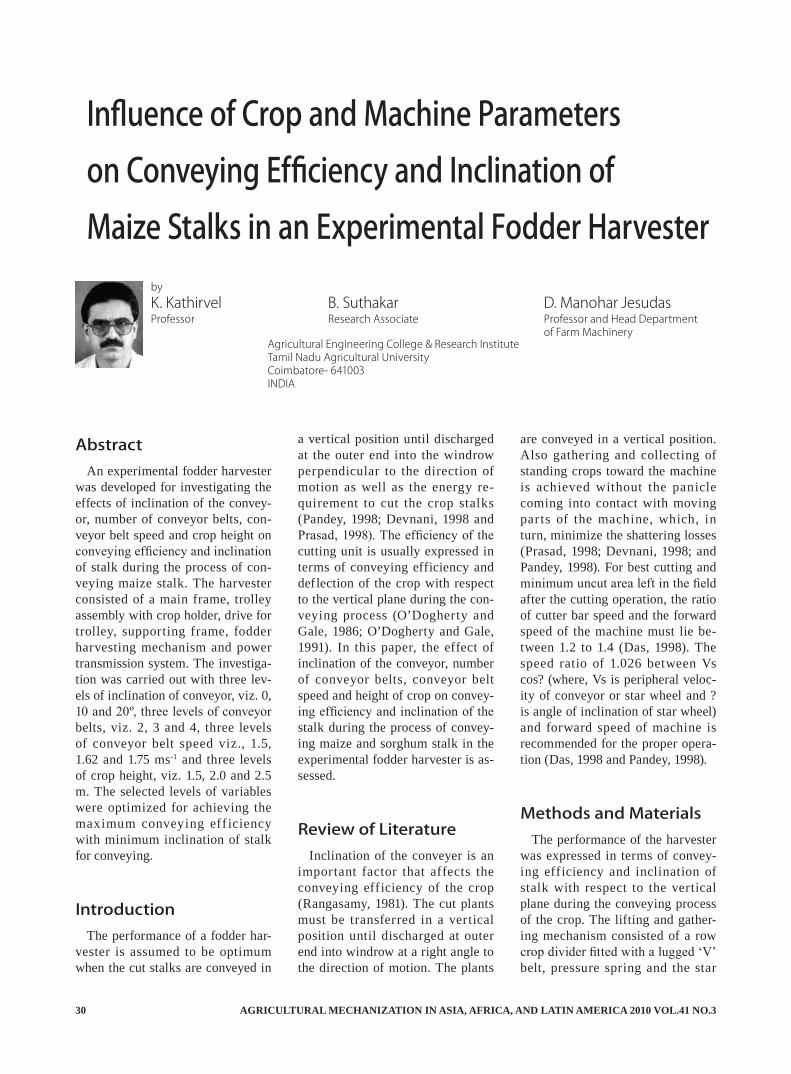
AGRICULTURAL MECHANIZATION IN ASIA, AFRICA, AND LATIN AMERICA 2010 VOL.41 NO.330
by
K. KathirvelProfessor
AbstractAn experimental fodder harvester
was developed for investigating the effects of inclination of the convey-or, number of conveyor belts, con-veyor belt speed and crop height on conveying efficiency and inclination of stalk during the process of con-veying maize stalk. The harvester consisted of a main frame, trolley assembly with crop holder, drive for trolley, supporting frame, fodder harvesting mechanism and power transmission system. The investiga-tion was carried out with three lev-els of inclination of conveyor, viz. 0, 10 and 20º, three levels of conveyor belts, viz. 2, 3 and 4, three levels of conveyor belt speed viz., 1.5, 1.62 and 1.75 ms-1 and three levels of crop height, viz. 1.5, 2.0 and 2.5 m. The selected levels of variables were optimized for achieving the maximum conveying eff iciency with minimum inclination of stalk for conveying.
IntroductionThe performance of a fodder har-
vester is assumed to be optimum when the cut stalks are conveyed in
B. SuthakarResearch Associate
Influence of Crop and Machine Parameterson Conveying Efficiency and Inclination ofMaize Stalks in an Experimental Fodder Harvester
D. Manohar JesudasProfessor and Head Department of Farm Machinery
a vertical position until discharged at the outer end into the windrow perpendicular to the direction of motion as well as the energy re-quirement to cut the crop stalks (Pandey, 1998; Devnani, 1998 and Prasad, 1998). The efficiency of the cutting unit is usually expressed in terms of conveying efficiency and deflection of the crop with respect to the vertical plane during the con-veying process (O’Dogherty and Gale, 1986; O’Dogherty and Gale, 1991). In this paper, the effect of inclination of the conveyor, number of conveyor belts, conveyor belt speed and height of crop on convey-ing efficiency and inclination of the stalk during the process of convey-ing maize and sorghum stalk in the experimental fodder harvester is as-sessed.
Review of LiteratureInclination of the conveyer is an
important factor that affects the conveying efficiency of the crop (Rangasamy, 1981). The cut plants must be transferred in a vertical position until discharged at outer end into windrow at a right angle to the direction of motion. The plants
are conveyed in a vertical position. Also gathering and collecting of standing crops toward the machine is achieved without the panicle coming into contact with moving parts of the machine, which, in turn, minimize the shattering losses (Prasad, 1998; Devnani, 1998; and Pandey, 1998). For best cutting and minimum uncut area left in the field after the cutting operation, the ratio of cutter bar speed and the forward speed of the machine must lie be-tween 1.2 to 1.4 (Das, 1998). The speed ratio of 1.026 between Vs cos? (where, Vs is peripheral veloc-ity of conveyor or star wheel and ? is angle of inclination of star wheel) and forward speed of machine is recommended for the proper opera-tion (Das, 1998 and Pandey, 1998).
Methods and MaterialsThe performance of the harvester
was expressed in terms of convey-ing efficiency and inclination of stalk with respect to the vertical plane during the conveying process of the crop. The lifting and gather-ing mechanism consisted of a row crop divider fitted with a lugged ‘V’ belt, pressure spring and the star
Agricultural Engineering College & Research InstituteTamil Nadu Agricultural UniversityCoimbatore- 641003INDIA

VOL.41 NO.3 2010 AGRICULTURAL MECHANIZATION IN ASIA, AFRICA, AND LATIN AMERICA 31
wheel. The star wheels for each row were driven by the lugs attached to the conveyor belt, thus, guiding the crop to the cutter bar. The quality of conveying and windrowing of cut stalk was highly influenced by the speed of the conveyor belt, number of conveyor belts and height of the crop. Also, higher velocity of con-veyor belts resulted in higher shat-tering losses. Hence, the inclination of conveyor, number of conveyor belts, conveyor belt speed and height of crop were identified as pertinent machine, crop and operational vari-ables for investigation with symbols as indicated below.
1 Inclination of conveyor (θ)2 Number of conveyor belts (N)3 Conveyor belt speed (V)4 Height of crop (H)The levels of variables selected
for conveying sorghum using the experimental fodder harvester are furnished below.
An experimental fodder harvester was developed for investigating the influence of crop and machine parameters on conveying efficiency and deflection of the crop (Fig. 1).
The experimental setup consisted of a main frame, trolley assembly with crop holder, drive for trolley, supporting frame, fodder harvesting mechanism and power transmission system.
Evaluational ParametersThe efficiency of a fodder har-
vester is usually expressed in terms of the force and energy required for cutting, efficiency of the conveyor and orientation of the stem. The performance of the fodder harvester is assumed to be optimum for the combination of selected variables, which results in minimum cutting force, minimum cutting energy and the maximum conveying efficiency.
The conveying efficiency of the experimental fodder harvester was computed based on the following expression.
Ec = No × 100 ........................... (1) Ni
whereEc = Conveying efficiency, per-
centNi = Number of stalks fed to ex-
perimental fodder harvester
No = Number of stalks conveyed and windrowed
The inclination of the stalk was the angle between the stalk and the imaginary vertical line during the process of conveying along the conveyor board. To measure the inclination of the stalk for investiga-tion of the orientation of the stalk to the conveyor board during the process of conveying, vertical lines were marked on the conveyor board at intervals of 200 mm from the one end of the cutter bar. The inclination of stalks was recorded using a digi-tal video camera. From the video clip, the frame was captured when the stem crossed each vertical line marked over the conveyor board with help of POWER DVD soft-ware. The captured picture was ex-ported to AUTOCAD 2002 software for measuring the angle between the stalk and each line marked over the conveyor board as shown in Fig. 2. From the measured inclination of the stalk, the orientation of the stem during the process of conveying was represented with a schematic diagram as shown in Fig. 3.
Results and DiscussionA total of 243 randomly replicated
experiments were conducted using the experimental fodder harvester with selected levels of variables. The conveying efficiency and the inclination of the stalk were re-corded for all treatments. The effect of selected levels of variables on the evaluation parameters were ana-lyzed and presented below.
Effect of Inclination of the Conve-yor on Conveying Efficiency for a Maize Stalk 1.5 m High (H1)
The effect of inclination of the conveyor on conveying efficiency of the experimental fodder harvester is shown in Fig. 4. The increase in inclination of the conveyor from 0º (θ1) to 10º (θ2) had negligible effect on conveying efficiency at all se-
A. Machine ParametersI. Inclination of Conveyor 3 levels
1. Inclination angle (0º) (θ1)2. Inclination angle (10º) (θ2)3. Inclination angle (20º) (θ3)
II. Number of Conveyer belts 3 levels1. Two (N1)2. Three (N2)3. Four (N3)
B. Operational ParametersI. Conveyor belt speed 3 levelsThe following three levels of conveyor belt speed were calculated from the optimized cutter bar speed of 2.0 ms-1
1. 1.50 ms-1 (V1)2. 1.62 ms-1 (V2)3. 1.75 ms-1 (V3)
II. Height of the Crop 3 levels1. 1.5m (H1)2. 2.0 m (H2)3. 2.5 m (H3)
Replications 3Total number of treatments = θ × N × V × H × R
= 3 × 3 × 3 × 3 × 3 = 243
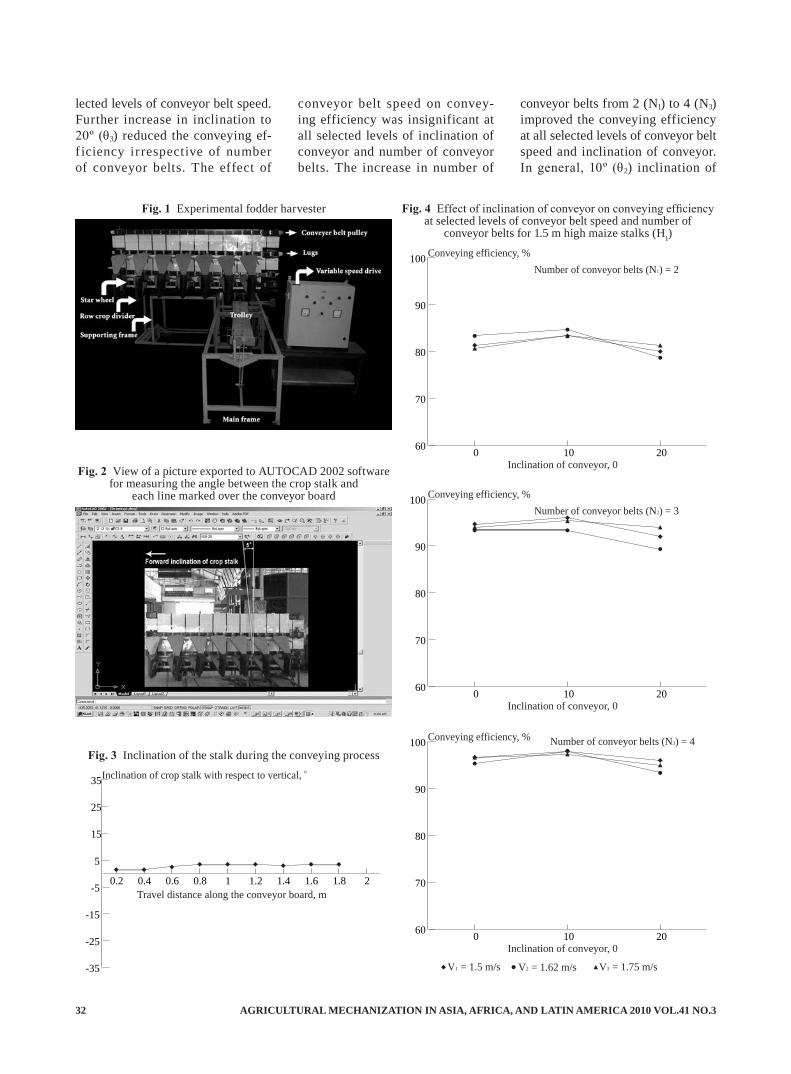
AGRICULTURAL MECHANIZATION IN ASIA, AFRICA, AND LATIN AMERICA 2010 VOL.41 NO.332
lected levels of conveyor belt speed. Further increase in inclination to 20º (θ3) reduced the conveying ef-f iciency ir respective of number of conveyor belts. The effect of
conveyor belt speed on convey-ing efficiency was insignificant at all selected levels of inclination of conveyor and number of conveyor belts. The increase in number of
conveyor belts from 2 (N1) to 4 (N3) improved the conveying efficiency at all selected levels of conveyor belt speed and inclination of conveyor. In general, 10º (θ2) inclination of
Fig. 1 Experimental fodder harvester
Fig. 2 View of a picture exported to AUTOCAD 2002 software for measuring the angle between the crop stalk and
each line marked over the conveyor board
Travel distance along the conveyor board, m
Inclination of crop stalk with respect to vertical, o
-35
-25
-15
-5
5
15
25
35
21.81.61.41.210.80.60.40.2
Fig. 3 Inclination of the stalk during the conveying process
Inclination of conveyor, 0
Conveying efficiency, %
60
70
80
90
100
20100
Number of conveyor belts (N1) = 2
V1 = 1.5 m/s V2 = 1.62 m/s V3 = 1.75 m/s
Inclination of conveyor, 0
Conveying efficiency, %
60
70
80
90
100
20100
Number of conveyor belts (N2) = 3
Inclination of conveyor, 0
Conveying efficiency, %
60
70
80
90
100
20100
Number of conveyor belts (N3) = 4
V1 = 1.5 m/s V2 = 1.62 m/s V3 = 1.75 m/s
Fig. 4 Effect of inclination of conveyor on conveying efficiency at selected levels of conveyor belt speed and number of
conveyor belts for 1.5 m high maize stalks (H1)
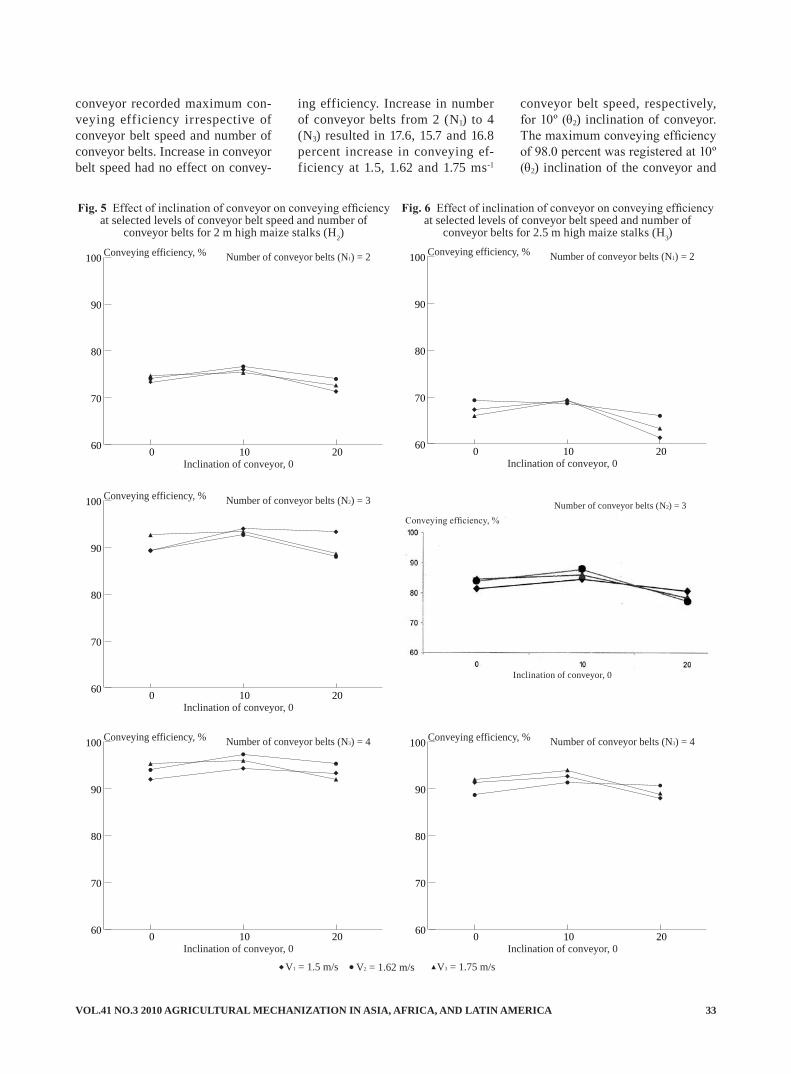
VOL.41 NO.3 2010 AGRICULTURAL MECHANIZATION IN ASIA, AFRICA, AND LATIN AMERICA 33
conveyor recorded maximum con-veying efficiency irrespective of conveyor belt speed and number of conveyor belts. Increase in conveyor belt speed had no effect on convey-
ing efficiency. Increase in number of conveyor belts from 2 (N1) to 4 (N3) resulted in 17.6, 15.7 and 16.8 percent increase in conveying ef-ficiency at 1.5, 1.62 and 1.75 ms-1
conveyor belt speed, respectively, for 10º (θ2) inclination of conveyor. The maximum conveying efficiency of 98.0 percent was registered at 10º (θ2) inclination of the conveyor and
Inclination of conveyor, 0
Conveying efficiency, %
60
70
80
90
100
20100
Number of conveyor belts (N1) = 2
Inclination of conveyor, 0
Conveying efficiency, %
60
70
80
90
100
20100
Number of conveyor belts (N2) = 3
Inclination of conveyor, 0
Conveying efficiency, %
60
70
80
90
100
20100
Number of conveyor belts (N3) = 4
Fig. 5 Effect of inclination of conveyor on conveying efficiency at selected levels of conveyor belt speed and number of
conveyor belts for 2 m high maize stalks (H2)
Inclination of conveyor, 0
Conveying efficiency, %
60
70
80
90
100
20100
Number of conveyor belts (N1) = 2
Inclination of conveyor, 0
Conveying efficiency, %
60
70
80
90
100
20100
Number of conveyor belts (N3) = 4
Fig. 6 Effect of inclination of conveyor on conveying efficiency at selected levels of conveyor belt speed and number of
conveyor belts for 2.5 m high maize stalks (H3)
V1 = 1.5 m/s V2 = 1.62 m/s V3 = 1.75 m/s
Number of conveyor belts (N2) = 3Conveying efficiency, %
Inclination of conveyor, 0
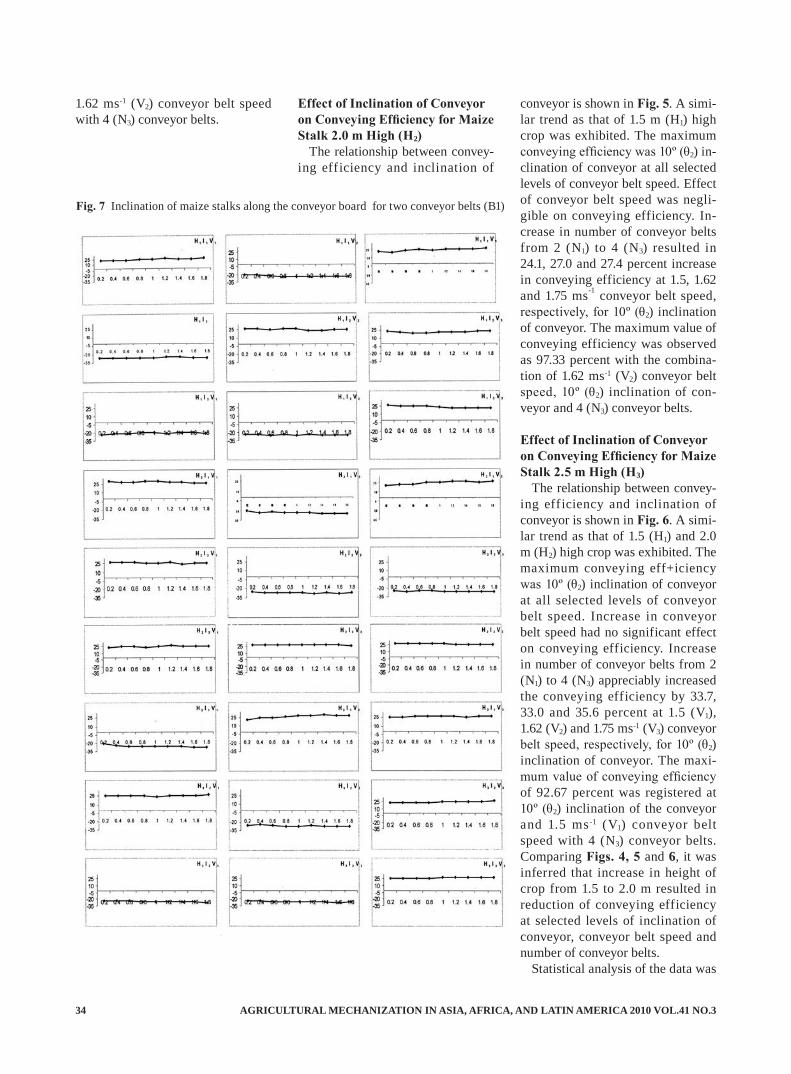
AGRICULTURAL MECHANIZATION IN ASIA, AFRICA, AND LATIN AMERICA 2010 VOL.41 NO.334
Fig. 7 Inclination of maize stalks along the conveyor board for two conveyor belts (B1)
1.62 ms-1 (V2) conveyor belt speed with 4 (N3) conveyor belts.
Effect of Inclination of Conveyor on Conveying Efficiency for Maize Stalk 2.0 m High (H2)
The relationship between convey-ing efficiency and inclination of
conveyor is shown in Fig. 5. A simi-lar trend as that of 1.5 m (H1) high crop was exhibited. The maximum conveying efficiency was 10º (θ2) in-clination of conveyor at all selected levels of conveyor belt speed. Effect of conveyor belt speed was negli-gible on conveying efficiency. In-crease in number of conveyor belts from 2 (N1) to 4 (N3) resulted in 24.1, 27.0 and 27.4 percent increase in conveying efficiency at 1.5, 1.62 and 1.75 ms-1 conveyor belt speed, respectively, for 10º (θ2) inclination of conveyor. The maximum value of conveying efficiency was observed as 97.33 percent with the combina-tion of 1.62 ms-1 (V2) conveyor belt speed, 10º (θ2) inclination of con-veyor and 4 (N3) conveyor belts.
Effect of Inclination of Conveyor on Conveying Efficiency for Maize Stalk 2.5 m High (H3)
The relationship between convey-ing efficiency and inclination of conveyor is shown in Fig. 6. A simi-lar trend as that of 1.5 (H1) and 2.0 m (H2) high crop was exhibited. The maximum conveying eff+iciency was 10º (θ2) inclination of conveyor at all selected levels of conveyor belt speed. Increase in conveyor belt speed had no significant effect on conveying efficiency. Increase in number of conveyor belts from 2 (N1) to 4 (N3) appreciably increased the conveying efficiency by 33.7, 33.0 and 35.6 percent at 1.5 (V1), 1.62 (V2) and 1.75 ms-1 (V3) conveyor belt speed, respectively, for 10º (θ2) inclination of conveyor. The maxi-mum value of conveying efficiency of 92.67 percent was registered at 10º (θ2) inclination of the conveyor and 1.5 ms-1 (V1) conveyor belt speed with 4 (N3) conveyor belts. Comparing Figs. 4, 5 and 6, it was inferred that increase in height of crop from 1.5 to 2.0 m resulted in reduction of conveying efficiency at selected levels of inclination of conveyor, conveyor belt speed and number of conveyor belts.
Statistical analysis of the data was
VOL.41 NO.3 2010 AGRICULTURAL MECHANIZATION IN ASIA, AFRICA, AND LATIN AMERICA 35
performed to assess the significance of the variables viz., number of con-veyor belts (N), inclination of con-veyor (θ), conveyor belt speed (V) and height of crop (H) on conveying efficiency for maize stalk. There was a significant difference among the treatments. The individual ef-fect of the variables viz., number of conveyor belts (N), inclination of conveyor (θ) and height of crop (H) were significant at the 1 percent level of probability. Individual ef-fect of conveyor belt speed (V) was not significant. The order of signifi-cance for the treatment effect was highest for number of conveyor belts and height of crop (H) on conveying efficiency for maize crop.
Inclination of StalkThe influence of the selected vari-
ables on inclination of stalk during the conveying process along the conveyor board was analyzed and presented below. The inclination of stalk, as it traveled across the con-veyor board, did not systematically change with respect to the distance of travel.
The initial orientation at the start-ing point was almost maintained through out the travel. This might have been because there was no change in the relative position of the f light of lugs that held the cut stalks during conveying. Also, there was no jumping of stalks once they were held in a particular set of lugs. However, the average inclination of stalks changed with selected levels of variables examined under this investigation. A sample graph showing variation in inclination of maize stalks 1.5 (H1), 2.0 (H2) and 2.5 m (H3) high at selected levels of conveyor belt speed and inclination
of conveyor with two conveyor belts (N1) is shown in Fig. 7. The inclina-tion was either in a positive (for-ward) or negative (backward) direc-tion with respect to the direction of conveying. The point of interest was to investigate the average inclination irrespective of direction and hence the data on inclination of maize and sorghum stalks were normalized by taking the root of squared values and these values were used for ana-lyzing the influence of all selected variables on inclination of stalk dur-ing the conveying process.
ConclusionThe maximum conveying effi-
ciency was registered for 10º incli-nation of conveyor for the selected levels of conveyor belt speed. In-crease in conveyor belt speed from 1.5 to 1.75 ms1 had no significant ef-fect on conveying efficiency. For 10º inclination of conveyor, increase in number of conveyor belts from 2 to 4 increased the conveying efficiency by 33.0 to 35.6 percent for the se-lected levels of conveyor belt speed. Increase in height of crop from 1.5 to 2.0 m resulted in reduction of conveying efficiency for the selected levels of inclination of conveyor, conveyor belt speed and number of conveyor belts. The statistical analy-sis revealed that the order of signifi-cance was the highest for number of conveyor belts followed by height of crop, inclination of conveyor and conveyor belt speed on inclination of maize and sorghum stalk. The maximum conveying efficiency of 94.0 percent and minimum inclina-tion of 2.44º for combination levels of 10º inclination of the conveyor,
2.5 m height of crop, 1.5 ms-1 con-veyor belt speed and four conveyor belts was optimized.
REFERENCES
Das, P. K. 1998. Design of cutter bar. Design, testing and produc-tion technology of harvesting and threshing equipment. L7: 1-20.
Devnani, R. S. 1998. Design of ver-tical conveyor raper. Design, test-ing and production technology of harvesting and threshing equip-ment. 76-104.
O’Dogherty, M. J. and G. E. Gale. 1986. Laboratory studies of the cutting grass stems. Journal of Agricultural Engineering Re-search, 35: 115-129.
O’Dogherty, M. J., and G. E. Gale. 1991. Laboratory studies of the ef-fect of blade parameters and stem configuration on the dynamics of cutting grass. Journal of Agricul-tural Engineering Research, 49: 99-111.
Pandey, M. M. 1998. Design of trac-tor front vertical conveyor reaper. Design, testing and production technology of harvesting and threshing equipment, T1: 1-16.
Prasad, J. 1998. Design of self-pro-pelled reaper. Design, testing and production technology of harvest-ing and threshing equipment. T4: 1-15.
Rangasamy, K. 1981. Design and development of a windrow type paddy harvester as an attachments to low cost wheel tractor. Unpub-lished M. E. thesis, Tamil Nadu Agricultural University, Coim-batore, Tamil Nadu.
■■
AGRICULTURAL MECHANIZATION IN ASIA, AFRICA, AND LATIN AMERICA 2010 VOL.41 NO.336
by
M. BalakrishnanAssistant ProfessorDepartment of Food & Agricultural Process Engineering,Tamil Nadu Agricultural University,Coimbatore-641 003,INDIA
AbstractA rotary sieve type cleaner-cum-
grader was developed and evaluated for black pepper and cardamom. This unit is suitable for removing impurities from the dried black pepper and cardamom and grading them into three grades. The grader was evaluated with black pepper and cardamom at different speeds, viz., 15, 25 and 35 rpm at 12-14 % (w.b.) moisture content. The samples from feed and various outlets were manually analyzed and the effec-tiveness of the grader unit was esti-mated. The capacity of the unit was 200 and 150 kg/h of black pepper and cardamom, respectively with grading effectiveness of 0.88 and 0.89. The sieves on the rotor of the unit could be changed according to the variety and grade specifications, and could also be made suitable for other crops by changing the sieves. The cost of the unit is approximately Rs.10,000/- and the cost of operation per quintal is Rs.40 and 30, for pep-
R. VisvanathanProfessor & HeadDepartment of Food & Agricultural Process Engineering, Tamil Nadu Agricultural University,Coimbatore-641 003, INDIA
A Hand-Operated Rotary Type Cleaner-Cum-Grader for Black Pepper and Cardamom
B. SoundararajanResearch Scholar,Indian Institute of Technology,Chennai, INDIA
V. V. SreenarayananDean (Mechanical Sciences)Dr. Mahalingam College of Engineering & Technolgy,Pollachi,INDIA
per and cardamom, respectively.
IntroductionBlack pepper (Piper nigrum) and
cardamom (Elettaria cardamom), popularly known as king and queen of spices, are native to evergreen rainforests of Western Ghat forests regions in India. India is the largest producer, consumer and exporter of both black pepper and cardamom. Besides India, pepper is produced in Vietnam, Indonesia, Brazil, Ma-laysia and Sri Lanka. Kerala alone contributes about 90 and 60 % of the country’s production of pepper and cardamom, respectively. Apart from Kerala, pepper and cardamom are also cultivated in the beautiful hill districts of Karnataka and Tamil Nadu. In Kerala, pepper is mostly grown as one of the component crops under high-density multispe-cies cropping systems in the home-steads. Both these important spices, essentially crops of humid tropics,
require heavy and well-distributed rainfall and high temperature for good growth.
Pepper becomes ready to harvest in about 6-8 months after flowering. Well matured but unripe berries are harvested by climbing on the Erythrina and silver oak trees to the height of 9-11 m, on which the pepper vines are trained. The green pepper berries after threshing are dried, mostly by sun drying in the plantation on cement floors. It takes about four days to dry the green pepper to a final moisture content of 8-10 % from the initial moisture content of about 70 % (w.b.). Car-
AcknowledgementThe authors acknowledge the
financial support received for this study under the National Agricul-tural Technology Project (NATP) and the facilities extended by M/s. Hemaland Estate, Yercaud, Tamil Nadu and Kerala Agricultural Uni-versity, Thrissur, India for conduct-ing evaluation studies.
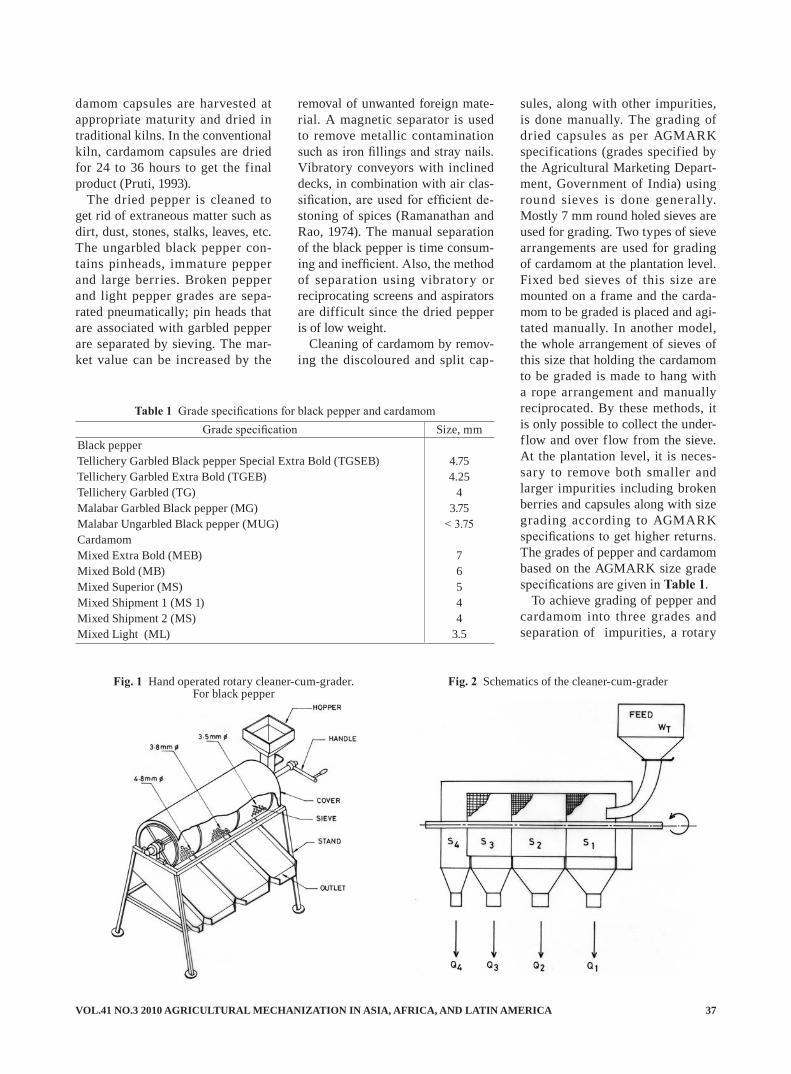
VOL.41 NO.3 2010 AGRICULTURAL MECHANIZATION IN ASIA, AFRICA, AND LATIN AMERICA 37
damom capsules are harvested at appropriate maturity and dried in traditional kilns. In the conventional kiln, cardamom capsules are dried for 24 to 36 hours to get the final product (Pruti, 1993).
The dried pepper is cleaned to get rid of extraneous matter such as dirt, dust, stones, stalks, leaves, etc. The ungarbled black pepper con-tains pinheads, immature pepper and large berries. Broken pepper and light pepper grades are sepa-rated pneumatically; pin heads that are associated with garbled pepper are separated by sieving. The mar-ket value can be increased by the
removal of unwanted foreign mate-rial. A magnetic separator is used to remove metallic contamination such as iron fillings and stray nails. Vibratory conveyors with inclined decks, in combination with air clas-sification, are used for efficient de-stoning of spices (Ramanathan and Rao, 1974). The manual separation of the black pepper is time consum-ing and inefficient. Also, the method of separation using vibratory or reciprocating screens and aspirators are difficult since the dried pepper is of low weight.
Cleaning of cardamom by remov-ing the discoloured and split cap-
sules, along with other impurities, is done manually. The grading of dried capsules as per AGMARK specifications (grades specified by the Agricultural Marketing Depart-ment, Government of India) using round sieves is done generally. Mostly 7 mm round holed sieves are used for grading. Two types of sieve arrangements are used for grading of cardamom at the plantation level. Fixed bed sieves of this size are mounted on a frame and the carda-mom to be graded is placed and agi-tated manually. In another model, the whole arrangement of sieves of this size that holding the cardamom to be graded is made to hang with a rope arrangement and manually reciprocated. By these methods, it is only possible to collect the under-flow and over flow from the sieve. At the plantation level, it is neces-sary to remove both smaller and larger impurities including broken berries and capsules along with size grading according to AGMARK specifications to get higher returns. The grades of pepper and cardamom based on the AGMARK size grade specifications are given in Table 1.
To achieve grading of pepper and cardamom into three grades and separation of impurities, a rotary
Grade specification Size, mmBlack pepperTellichery Garbled Black pepper Special Extra Bold (TGSEB) 4.75Tellichery Garbled Extra Bold (TGEB) 4.25Tellichery Garbled (TG) 4Malabar Garbled Black pepper (MG) 3.75Malabar Ungarbled Black pepper (MUG) < 3.75CardamomMixed Extra Bold (MEB) 7Mixed Bold (MB) 6Mixed Superior (MS) 5Mixed Shipment 1 (MS 1) 4Mixed Shipment 2 (MS) 4Mixed Light (ML) 3.5
Table 1 Grade specifications for black pepper and cardamom
Fig. 1 Hand operated rotary cleaner-cum-grader. For black pepper
Fig. 2 Schematics of the cleaner-cum-grader
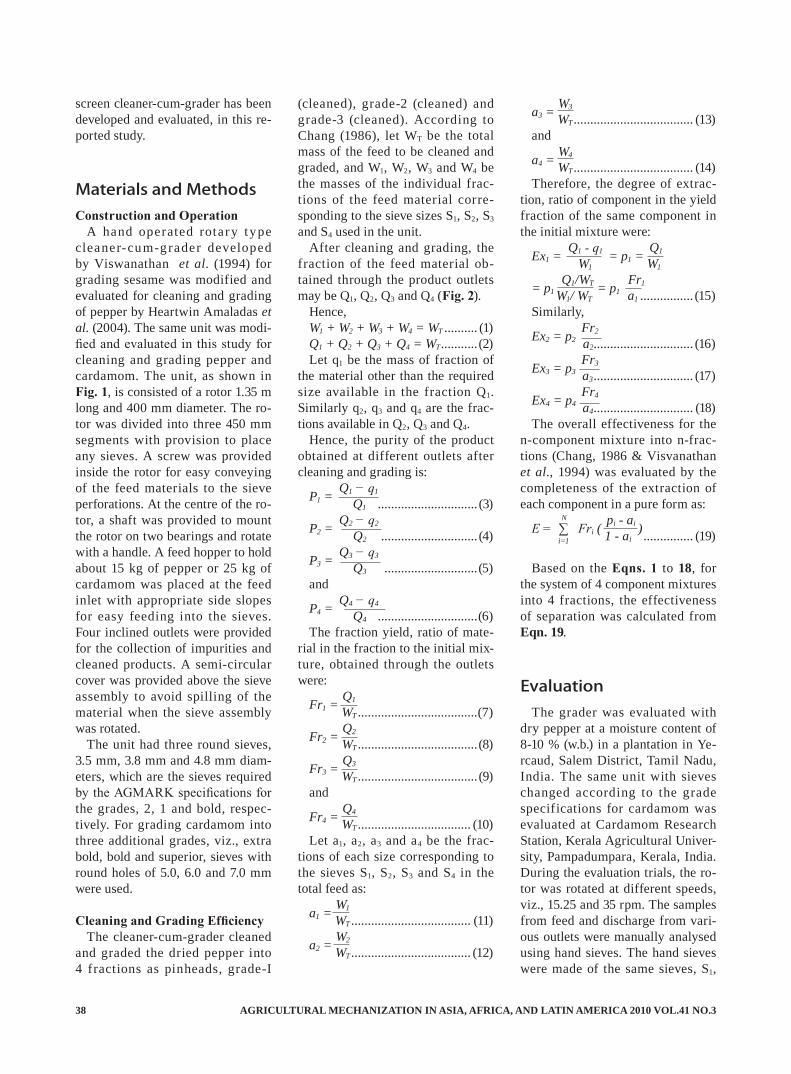
AGRICULTURAL MECHANIZATION IN ASIA, AFRICA, AND LATIN AMERICA 2010 VOL.41 NO.338
screen cleaner-cum-grader has been developed and evaluated, in this re-ported study.
Materials and MethodsConstruction and Operation
A hand operated rotary type cleaner-cum-grader developed by Viswanathan et al. (1994) for grading sesame was modified and evaluated for cleaning and grading of pepper by Heartwin Amaladas et al. (2004). The same unit was modi-fied and evaluated in this study for cleaning and grading pepper and cardamom. The unit, as shown in Fig. 1, is consisted of a rotor 1.35 m long and 400 mm diameter. The ro-tor was divided into three 450 mm segments with provision to place any sieves. A screw was provided inside the rotor for easy conveying of the feed materials to the sieve perforations. At the centre of the ro-tor, a shaft was provided to mount the rotor on two bearings and rotate with a handle. A feed hopper to hold about 15 kg of pepper or 25 kg of cardamom was placed at the feed inlet with appropriate side slopes for easy feeding into the sieves. Four inclined outlets were provided for the collection of impurities and cleaned products. A semi-circular cover was provided above the sieve assembly to avoid spilling of the material when the sieve assembly was rotated.
The unit had three round sieves, 3.5 mm, 3.8 mm and 4.8 mm diam-eters, which are the sieves required by the AGMARK specifications for the grades, 2, 1 and bold, respec-tively. For grading cardamom into three additional grades, viz., extra bold, bold and superior, sieves with round holes of 5.0, 6.0 and 7.0 mm were used.
Cleaning and Grading EfficiencyThe cleaner-cum-grader cleaned
and graded the dried pepper into 4 fractions as pinheads, grade-I
(cleaned), grade-2 (cleaned) and grade-3 (cleaned). According to Chang (1986), let WT be the total mass of the feed to be cleaned and graded, and W1, W2, W3 and W4 be the masses of the individual frac-tions of the feed material corre-sponding to the sieve sizes S1, S2, S3 and S4 used in the unit.
After cleaning and grading, the fraction of the feed material ob-tained through the product outlets may be Q1, Q2, Q3 and Q4 (Fig. 2).
Hence,W1 + W2 + W3 + W4 = WT .......... (1)Q1 + Q2 + Q3 + Q4 = WT ........... (2)Let q1 be the mass of fraction of
the material other than the required size available in the fraction Q1. Similarly q2, q3 and q4 are the frac-tions available in Q2, Q3 and Q4.
Hence, the purity of the product obtained at different outlets after cleaning and grading is:
Q1 − q1P1 = Q1 .............................. (3) Q2 − q2P2 = Q2 ............................. (4) Q3 − q3P3 = Q3 ............................(5)and Q4 − q4P4 = Q4 ..............................(6)The fraction yield, ratio of mate-
rial in the fraction to the initial mix-ture, obtained through the outlets were:
Q1Fr1 = WT ....................................(7) Q2Fr2 = WT .................................... (8) Q3Fr3 = WT .................................... (9)and Q4Fr4 = WT .................................. (10)Let a1, a2, a3 and a4 be the frac-
tions of each size corresponding to the sieves S1, S2, S3 and S4 in the total feed as:
W1a1 = WT .................................... (11) W2a2 = WT .................................... (12)
W3a3 = WT .................................... (13)and W4a4 = WT .................................... (14)Therefore, the degree of extrac-
tion, ratio of component in the yield fraction of the same component in the initial mixture were:
Q1 - q1 Q1Ex1 = W1 = p1 = W1
Q1/WT Fr1= p1 W1/ WT = p1 a1 ................ (15)
Similarly, Fr2Ex2 = p2 a2 .............................. (16) Fr3Ex3 = p3 a3 .............................. (17) Fr4Ex4 = p4 a4 .............................. (18)The overall effectiveness for the
n-component mixture into n-frac-tions (Chang, 1986 & Visvanathan et al., 1994) was evaluated by the completeness of the extraction of each component in a pure form as:
N pi - aiE = ∑ Fri ( 1 - ai ) ............... (19)
i=1
Based on the Eqns. 1 to 18, for the system of 4 component mixtures into 4 fractions, the effectiveness of separation was calculated from Eqn. 19.
EvaluationThe grader was evaluated with
dry pepper at a moisture content of 8-10 % (w.b.) in a plantation in Ye-rcaud, Salem District, Tamil Nadu, India. The same unit with sieves changed according to the grade specifications for cardamom was evaluated at Cardamom Research Station, Kerala Agricultural Univer-sity, Pampadumpara, Kerala, India. During the evaluation trials, the ro-tor was rotated at different speeds, viz., 15.25 and 35 rpm. The samples from feed and discharge from vari-ous outlets were manually analysed using hand sieves. The hand sieves were made of the same sieves, S1,
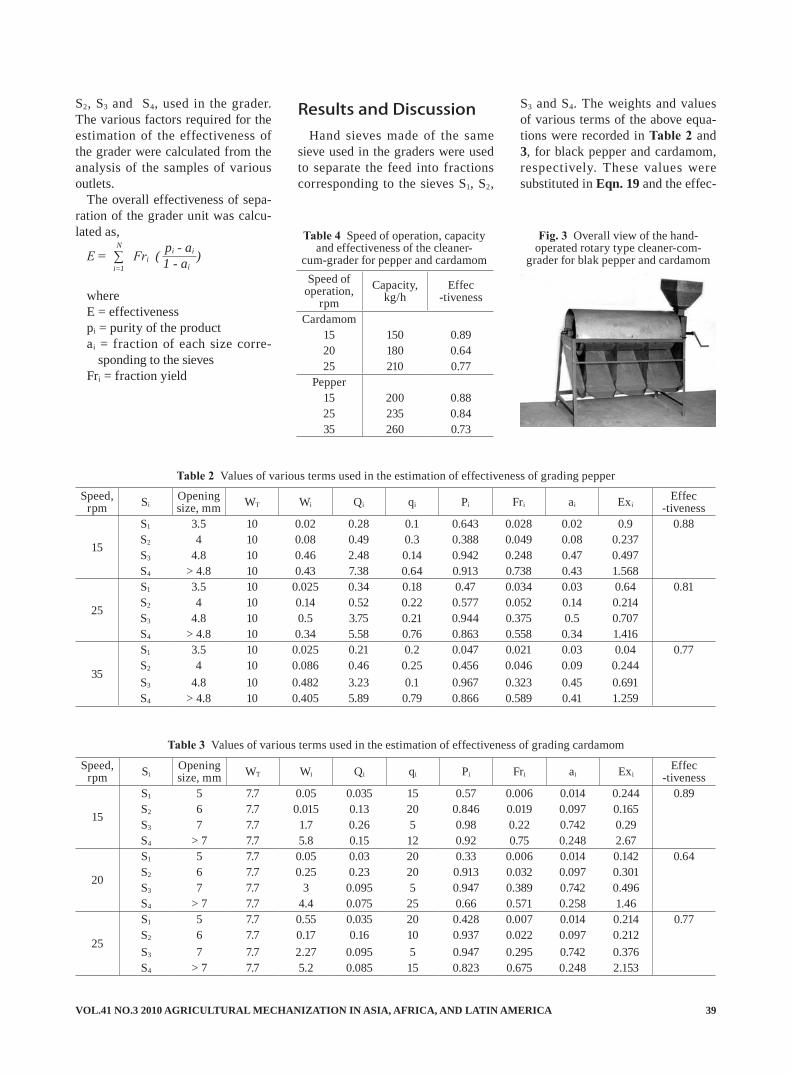
VOL.41 NO.3 2010 AGRICULTURAL MECHANIZATION IN ASIA, AFRICA, AND LATIN AMERICA 39
S2, S3 and S4, used in the grader. The various factors required for the estimation of the effectiveness of the grader were calculated from the analysis of the samples of various outlets.
The overall effectiveness of sepa-ration of the grader unit was calcu-lated as,
N pi - aiE = ∑ Fri ( 1 - ai )
i=1
where E = effectivenesspi = purity of the productai = fraction of each size corre-
sponding to the sievesFri = fraction yield
Results and DiscussionHand sieves made of the same
sieve used in the graders were used to separate the feed into fractions corresponding to the sieves S1, S2,
Speed, rpm Si
Opening size, mm WT Wi Qi qi Pi Fri ai Exi
Effec-tiveness
15
S1 3.5 10 0.02 0.28 0.1 0.643 0.028 0.02 0.9 0.88S2 4 10 0.08 0.49 0.3 0.388 0.049 0.08 0.237S3 4.8 10 0.46 2.48 0.14 0.942 0.248 0.47 0.497S4 > 4.8 10 0.43 7.38 0.64 0.913 0.738 0.43 1.568
25
S1 3.5 10 0.025 0.34 0.18 0.47 0.034 0.03 0.64 0.81S2 4 10 0.14 0.52 0.22 0.577 0.052 0.14 0.214S3 4.8 10 0.5 3.75 0.21 0.944 0.375 0.5 0.707S4 > 4.8 10 0.34 5.58 0.76 0.863 0.558 0.34 1.416
35
S1 3.5 10 0.025 0.21 0.2 0.047 0.021 0.03 0.04 0.77S2 4 10 0.086 0.46 0.25 0.456 0.046 0.09 0.244S3 4.8 10 0.482 3.23 0.1 0.967 0.323 0.45 0.691S4 > 4.8 10 0.405 5.89 0.79 0.866 0.589 0.41 1.259
Table 2 Values of various terms used in the estimation of effectiveness of grading pepper
Speed, rpm Si
Opening size, mm WT Wi Qi qi Pi Fri ai Exi
Effec-tiveness
15
S1 5 7.7 0.05 0.035 15 0.57 0.006 0.014 0.244 0.89S2 6 7.7 0.015 0.13 20 0.846 0.019 0.097 0.165S3 7 7.7 1.7 0.26 5 0.98 0.22 0.742 0.29S4 > 7 7.7 5.8 0.15 12 0.92 0.75 0.248 2.67
20
S1 5 7.7 0.05 0.03 20 0.33 0.006 0.014 0.142 0.64S2 6 7.7 0.25 0.23 20 0.913 0.032 0.097 0.301S3 7 7.7 3 0.095 5 0.947 0.389 0.742 0.496S4 > 7 7.7 4.4 0.075 25 0.66 0.571 0.258 1.46
25
S1 5 7.7 0.55 0.035 20 0.428 0.007 0.014 0.214 0.77S2 6 7.7 0.17 0.16 10 0.937 0.022 0.097 0.212S3 7 7.7 2.27 0.095 5 0.947 0.295 0.742 0.376S4 > 7 7.7 5.2 0.085 15 0.823 0.675 0.248 2.153
Table 3 Values of various terms used in the estimation of effectiveness of grading cardamom
S3 and S4. The weights and values of various terms of the above equa-tions were recorded in Table 2 and 3, for black pepper and cardamom, respectively. These values were substituted in Eqn. 19 and the effec-
Speed of operation,
rpmCapacity,
kg/hEffec
-tiveness
Cardamom15 150 0.8920 180 0.6425 210 0.77
Pepper15 200 0.8825 235 0.8435 260 0.73
Table 4 Speed of operation, capacity and effectiveness of the cleaner-
cum-grader for pepper and cardamom
Fig. 3 Overall view of the hand-operated rotary type cleaner-com-
grader for blak pepper and cardamom
AGRICULTURAL MECHANIZATION IN ASIA, AFRICA, AND LATIN AMERICA 2010 VOL.41 NO.340
tiveness was calculated for different rotor speeds viz. 15, 25 and 35 rpm. The capacity and effectiveness of the grader evaluated with pepper and cardamom are given in Table 4.
The overall effectiveness of the manually operated cleaner-cum-grader was in the range of 0.89 to 0.64 and 0.88 to 0.73 in the speed range of 15 to 25 rpm, for the carda-mom and pepper, respectively. The capacity increased from 150 to 210 and 200 to 260 kg/hour in the same speed range for cardamom and pep-per, respectively. The effectiveness decreased with increase in speed of operation. However, the effective-ness of separation is important for value addition and to obtain a higher value for the produce.
Thus, the higher effectiveness of 0.89 and 0.88 with grading capac-ity of 150 and 200 kg/hour is pos-sible for cardamom and pepper,
respectively. The cost of the unit is Rs.10,000/- and the cost of opera-tion per quintal is Rs.40 and Rs.30, respectively for pepper and carda-mom.
The overall view of the equipment is shown in Fig. 3.
The advantages of this type of cleaner-cum-grader are:
· Can be made to suit any crop by changing the sieves.
· This unit can be operated with out dependency on electricity.
REFERENCES
Chang, Joo Chung. 1986. Rice Mill-ing Technology. In: Post-harvest prevention of Paddy/rice loss. Council of Agriculture, Republic of China. pp. 236-239.
Pruthi, J. S. 1993. Crop Manage-ment and Post Harvest Technol-
ogy. In: Major Spices of India. Published by Publication and In-formation Division, ICAR, Krishi Anusandhan Bhavan, PUSA, New Delhi-11012.
Ramanathan, P. K. and P. N. S. Rao. 1974. Equipment needs of spice industry. In: Proceedings of sym-posium on Spice Industries Devel-opment Prospects. pp.82.
Viswanathan, R. V. V. Sreenarayan-an and K. R. Swaminathan. 1994. Development of a hand operated rotary sieve cleaner-cum-grader for sesame seed. Agricultural Mechanisation in Asia, Africa & Latin America. 25(2): 35-36.
Hear twin Amaldas, P., S. Sub-ramanina , M. Balak r ishnan, R . Vi swa n a t h a n , a nd V. V. Sreenarayanan. 2004. Perfor-mance evaluation of cleaner-cum-grader for black pepper. Journal of Plantation Crops. 32(1): 32-36.
■■
BOOKS
Annual Report 2007
ContentsForeword / Contents / Introduction / Organization & Human ResourcesResearch Division
Plant BreedingPlant BiotechnologyPlant ProtectionEngineering & EnvironmentPalm Oil Based Product Process & QualitySocial, Technology, & EconomyCollaboration & Support Services For Research
Business DivisionMarihat Business UnitMedan Business UnitDivision Of Services & ConsultationTrainingLaboratoriesExhibition, Promotion, & Products Other Than Planting MaterialsStrategic Business Of Planting Materials
Indonesian Oil Palm Research Institutehttp://www.rspo.org/?q=am/394
Now Available
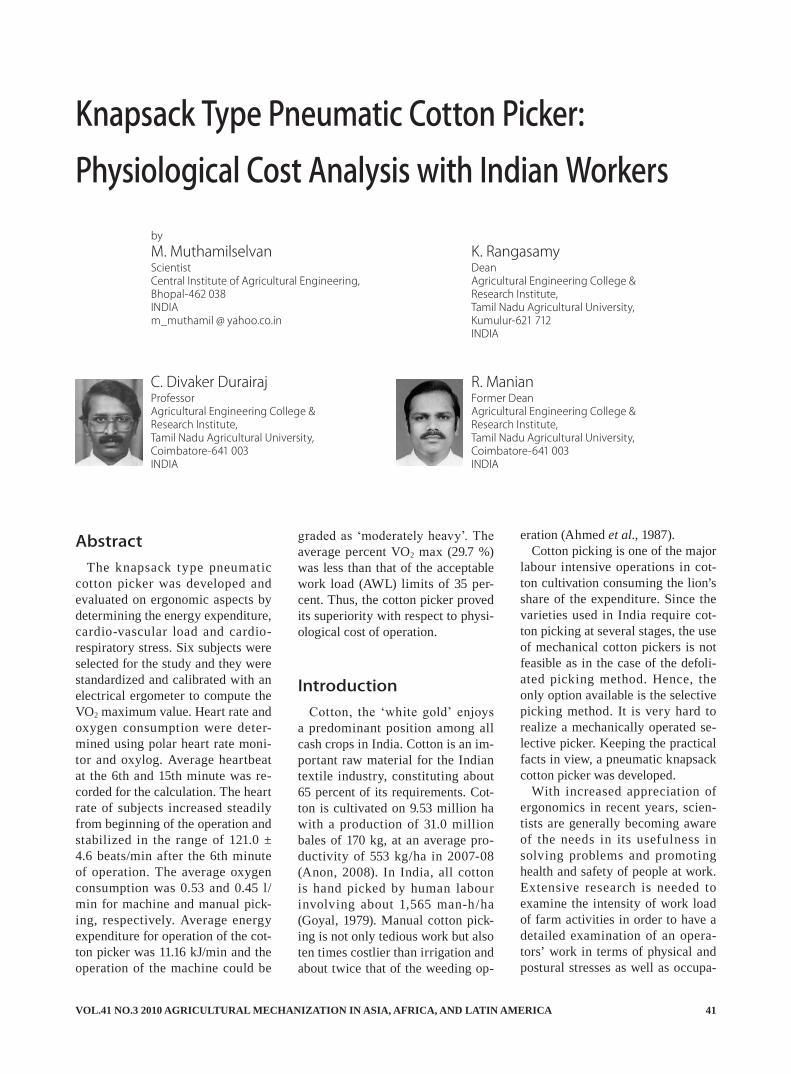
VOL.41 NO.3 2010 AGRICULTURAL MECHANIZATION IN ASIA, AFRICA, AND LATIN AMERICA 41
by
M. MuthamilselvanScientistCentral Institute of Agricultural Engineering, Bhopal-462 038INDIAm_muthamil @ yahoo.co.in
AbstractThe knapsack type pneumatic
cotton picker was developed and evaluated on ergonomic aspects by determining the energy expenditure, cardio-vascular load and cardio-respiratory stress. Six subjects were selected for the study and they were standardized and calibrated with an electrical ergometer to compute the VO2 maximum value. Heart rate and oxygen consumption were deter-mined using polar heart rate moni-tor and oxylog. Average heartbeat at the 6th and 15th minute was re-corded for the calculation. The heart rate of subjects increased steadily from beginning of the operation and stabilized in the range of 121.0 ± 4.6 beats/min after the 6th minute of operation. The average oxygen consumption was 0.53 and 0.45 l/min for machine and manual pick-ing, respectively. Average energy expenditure for operation of the cot-ton picker was 11.16 kJ/min and the operation of the machine could be
K. RangasamyDeanAgricultural Engineering College & Research Institute, Tamil Nadu Agricultural University,Kumulur-621 712INDIA
Knapsack Type Pneumatic Cotton Picker: Physiological Cost Analysis with Indian Workers
C. Divaker DurairajProfessorAgricultural Engineering College & Research Institute, Tamil Nadu Agricultural University, Coimbatore-641 003INDIA
R. ManianFormer DeanAgricultural Engineering College & Research Institute,Tamil Nadu Agricultural University, Coimbatore-641 003INDIA
graded as ‘moderately heavy’. The average percent VO2 max (29.7 %) was less than that of the acceptable work load (AWL) limits of 35 per-cent. Thus, the cotton picker proved its superiority with respect to physi-ological cost of operation.
IntroductionCotton, the ‘white gold’ enjoys
a predominant position among all cash crops in India. Cotton is an im-portant raw material for the Indian textile industry, constituting about 65 percent of its requirements. Cot-ton is cultivated on 9.53 million ha with a production of 31.0 million bales of 170 kg, at an average pro-ductivity of 553 kg/ha in 2007-08 (Anon, 2008). In India, all cotton is hand picked by human labour involving about 1,565 man-h/ha (Goyal, 1979). Manual cotton pick-ing is not only tedious work but also ten times costlier than irrigation and about twice that of the weeding op-
eration (Ahmed et al., 1987).Cotton picking is one of the major
labour intensive operations in cot-ton cultivation consuming the lion’s share of the expenditure. Since the varieties used in India require cot-ton picking at several stages, the use of mechanical cotton pickers is not feasible as in the case of the defoli-ated picking method. Hence, the only option available is the selective picking method. It is very hard to realize a mechanically operated se-lective picker. Keeping the practical facts in view, a pneumatic knapsack cotton picker was developed.
With increased appreciation of ergonomics in recent years, scien-tists are generally becoming aware of the needs in its usefulness in solving problems and promoting health and safety of people at work. Extensive research is needed to examine the intensity of work load of farm activities in order to have a detailed examination of an opera-tors’ work in terms of physical and postural stresses as well as occupa-
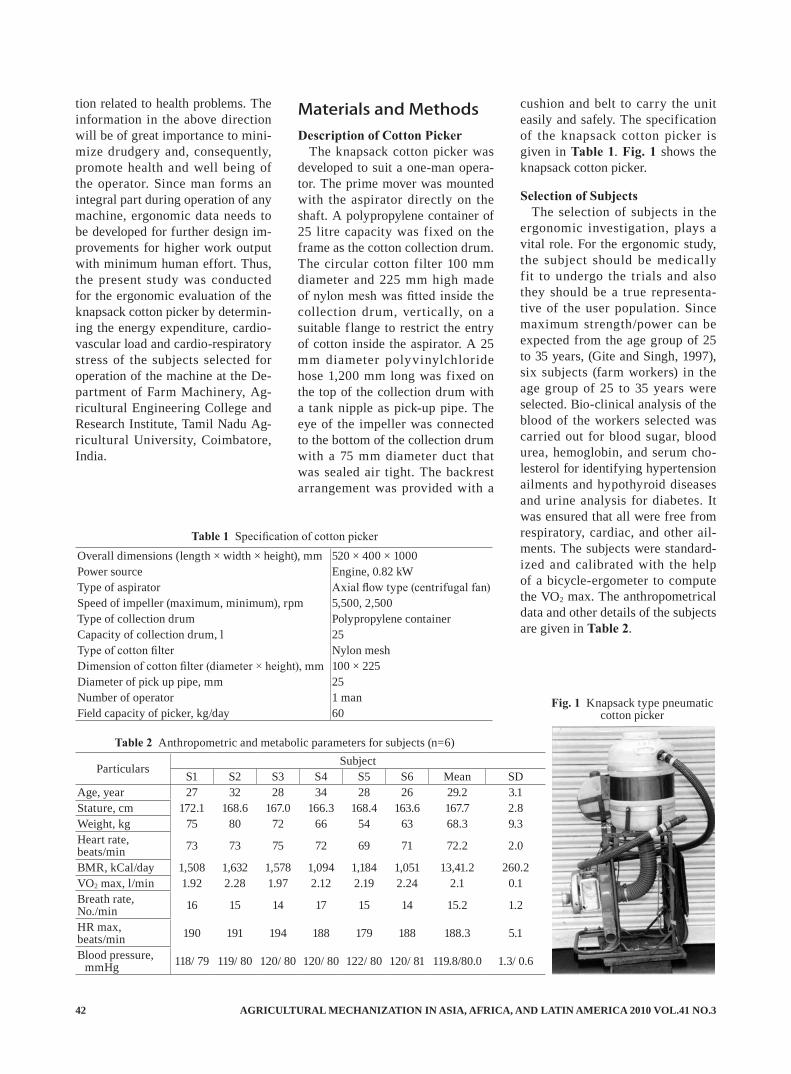
AGRICULTURAL MECHANIZATION IN ASIA, AFRICA, AND LATIN AMERICA 2010 VOL.41 NO.342
tion related to health problems. The information in the above direction will be of great importance to mini-mize drudgery and, consequently, promote health and well being of the operator. Since man forms an integral part during operation of any machine, ergonomic data needs to be developed for further design im-provements for higher work output with minimum human effort. Thus, the present study was conducted for the ergonomic evaluation of the knapsack cotton picker by determin-ing the energy expenditure, cardio-vascular load and cardio-respiratory stress of the subjects selected for operation of the machine at the De-partment of Farm Machinery, Ag-ricultural Engineering College and Research Institute, Tamil Nadu Ag-ricultural University, Coimbatore, India.
Materials and MethodsDescription of Cotton Picker
The knapsack cotton picker was developed to suit a one-man opera-tor. The prime mover was mounted with the aspirator directly on the shaft. A polypropylene container of 25 litre capacity was fixed on the frame as the cotton collection drum. The circular cotton filter 100 mm diameter and 225 mm high made of nylon mesh was fitted inside the collection drum, vertically, on a suitable flange to restrict the entry of cotton inside the aspirator. A 25 mm diameter polyvinylchloride hose 1,200 mm long was fixed on the top of the collection drum with a tank nipple as pick-up pipe. The eye of the impeller was connected to the bottom of the collection drum with a 75 mm diameter duct that was sealed air tight. The backrest arrangement was provided with a
cushion and belt to carry the unit easily and safely. The specification of the knapsack cotton picker is given in Table 1. Fig. 1 shows the knapsack cotton picker.
Selection of SubjectsThe selection of subjects in the
ergonomic investigation, plays a vital role. For the ergonomic study, the subject should be medically fit to undergo the trials and also they should be a true representa-tive of the user population. Since maximum strength/power can be expected from the age group of 25 to 35 years, (Gite and Singh, 1997), six subjects (farm workers) in the age group of 25 to 35 years were selected. Bio-clinical analysis of the blood of the workers selected was carried out for blood sugar, blood urea, hemoglobin, and serum cho-lesterol for identifying hypertension ailments and hypothyroid diseases and urine analysis for diabetes. It was ensured that all were free from respiratory, cardiac, and other ail-ments. The subjects were standard-ized and calibrated with the help of a bicycle-ergometer to compute the VO2 max. The anthropometrical data and other details of the subjects are given in Table 2.
Overall dimensions (length × width × height), mm 520 × 400 × 1000Power source Engine, 0.82 kWType of aspirator Axial flow type (centrifugal fan)Speed of impeller (maximum, minimum), rpm 5,500, 2,500Type of collection drum Polypropylene containerCapacity of collection drum, l 25Type of cotton filter Nylon meshDimension of cotton filter (diameter × height), mm 100 × 225Diameter of pick up pipe, mm 25Number of operator 1 manField capacity of picker, kg/day 60
Table 1 Specification of cotton picker
Fig. 1 Knapsack type pneumatic cotton picker
Particulars SubjectS1 S2 S3 S4 S5 S6 Mean SD
Age, year 27 32 28 34 28 26 29.2 3.1Stature, cm 172.1 168.6 167.0 166.3 168.4 163.6 167.7 2.8Weight, kg 75 80 72 66 54 63 68.3 9.3Heart rate, beats/min 73 73 75 72 69 71 72.2 2.0
BMR, kCal/day 1,508 1,632 1,578 1,094 1,184 1,051 13,41.2 260.2VO2 max, l/min 1.92 2.28 1.97 2.12 2.19 2.24 2.1 0.1Breath rate, No./min 16 15 14 17 15 14 15.2 1.2
HR max, beats/min 190 191 194 188 179 188 188.3 5.1
Blood pressure, mmHg 118/ 79 119/ 80 120/ 80 120/ 80 122/ 80 120/ 81 119.8/80.0 1.3/ 0.6
Table 2 Anthropometric and metabolic parameters for subjects (n=6)
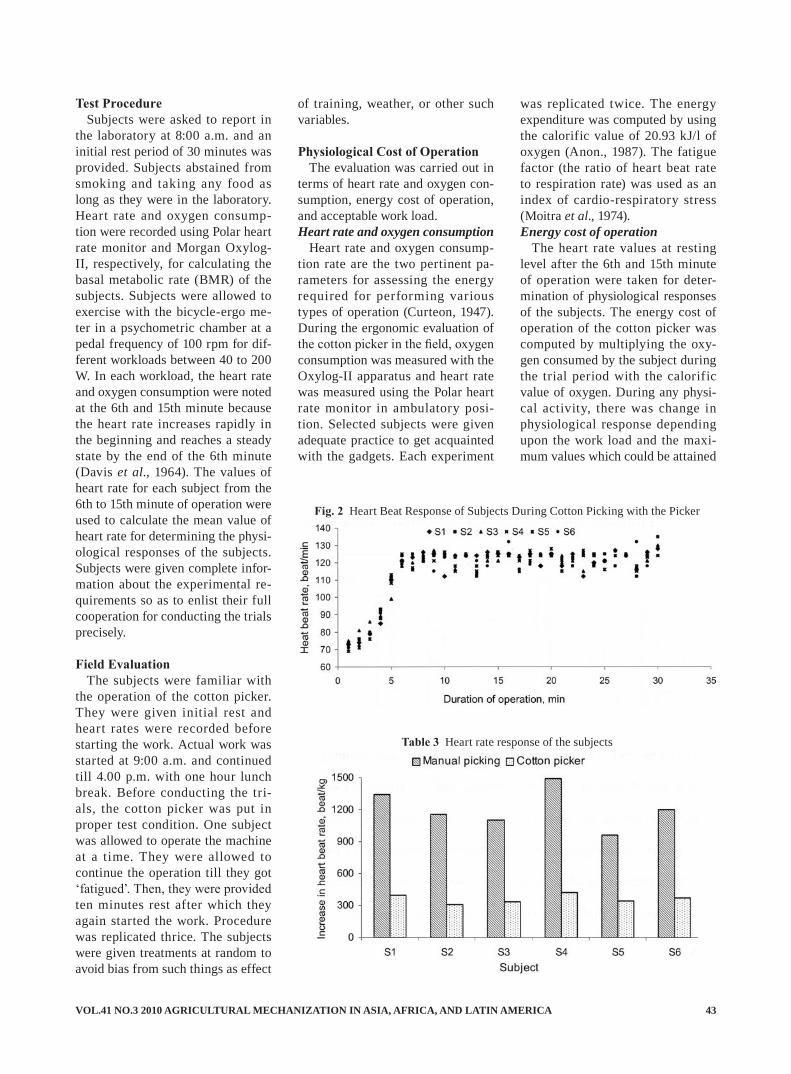
VOL.41 NO.3 2010 AGRICULTURAL MECHANIZATION IN ASIA, AFRICA, AND LATIN AMERICA 43
Test ProcedureSubjects were asked to report in
the laboratory at 8:00 a.m. and an initial rest period of 30 minutes was provided. Subjects abstained from smoking and taking any food as long as they were in the laboratory. Heart rate and oxygen consump-tion were recorded using Polar heart rate monitor and Morgan Oxylog-II, respectively, for calculating the basal metabolic rate (BMR) of the subjects. Subjects were allowed to exercise with the bicycle-ergo me-ter in a psychometric chamber at a pedal frequency of 100 rpm for dif-ferent workloads between 40 to 200 W. In each workload, the heart rate and oxygen consumption were noted at the 6th and 15th minute because the heart rate increases rapidly in the beginning and reaches a steady state by the end of the 6th minute (Davis et al., 1964). The values of heart rate for each subject from the 6th to 15th minute of operation were used to calculate the mean value of heart rate for determining the physi-ological responses of the subjects. Subjects were given complete infor-mation about the experimental re-quirements so as to enlist their full cooperation for conducting the trials precisely.
Field EvaluationThe subjects were familiar with
the operation of the cotton picker. They were given initial rest and heart rates were recorded before starting the work. Actual work was started at 9:00 a.m. and continued till 4.00 p.m. with one hour lunch break. Before conducting the tri-als, the cotton picker was put in proper test condition. One subject was allowed to operate the machine at a time. They were allowed to continue the operation till they got ‘fatigued’. Then, they were provided ten minutes rest after which they again started the work. Procedure was replicated thrice. The subjects were given treatments at random to avoid bias from such things as effect
of training, weather, or other such variables.
Physiological Cost of OperationThe evaluation was carried out in
terms of heart rate and oxygen con-sumption, energy cost of operation, and acceptable work load.Heart rate and oxygen consumption
Heart rate and oxygen consump-tion rate are the two pertinent pa-rameters for assessing the energy required for performing various types of operation (Curteon, 1947). During the ergonomic evaluation of the cotton picker in the field, oxygen consumption was measured with the Oxylog-II apparatus and heart rate was measured using the Polar heart rate monitor in ambulatory posi-tion. Selected subjects were given adequate practice to get acquainted with the gadgets. Each experiment
was replicated twice. The energy expenditure was computed by using the calorific value of 20.93 kJ/l of oxygen (Anon., 1987). The fatigue factor (the ratio of heart beat rate to respiration rate) was used as an index of cardio-respiratory stress (Moitra et al., 1974). Energy cost of operation
The heart rate values at resting level after the 6th and 15th minute of operation were taken for deter-mination of physiological responses of the subjects. The energy cost of operation of the cotton picker was computed by multiplying the oxy-gen consumed by the subject during the trial period with the calorific value of oxygen. During any physi-cal activity, there was change in physiological response depending upon the work load and the maxi-mum values which could be attained
Fig. 2 Heart Beat Response of Subjects During Cotton Picking with the Picker
Table 3 Heart rate response of the subjects
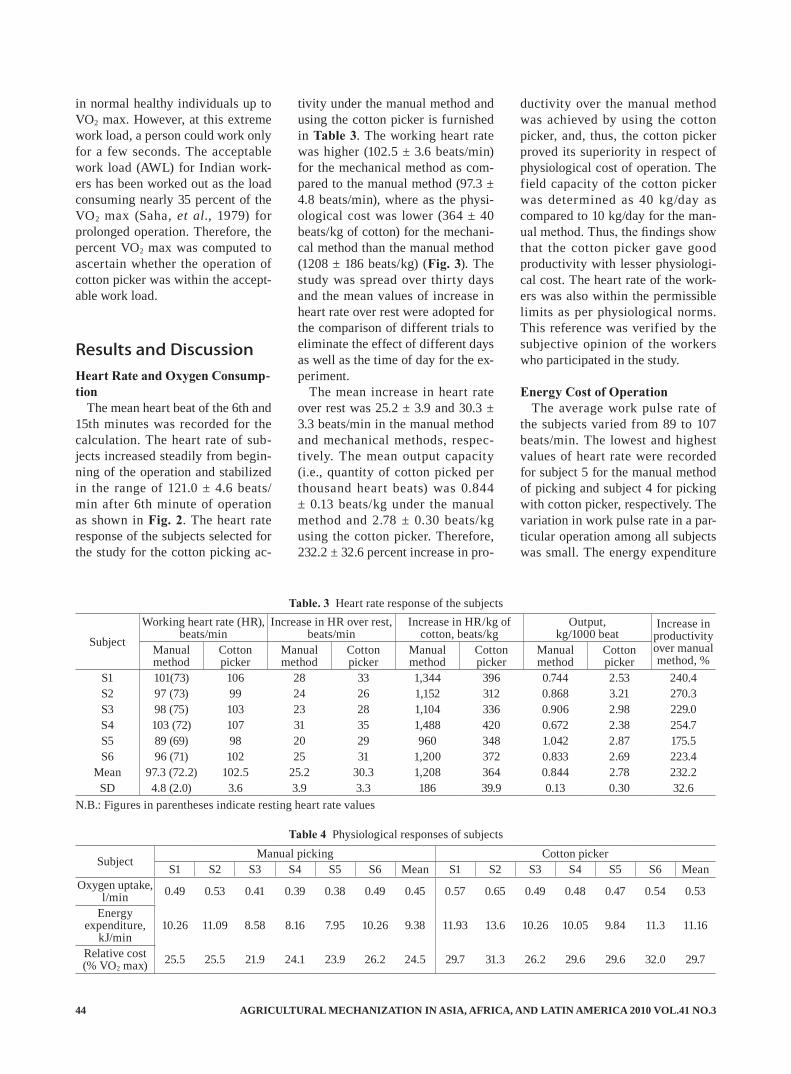
AGRICULTURAL MECHANIZATION IN ASIA, AFRICA, AND LATIN AMERICA 2010 VOL.41 NO.344
in normal healthy individuals up to VO2 max. However, at this extreme work load, a person could work only for a few seconds. The acceptable work load (AWL) for Indian work-ers has been worked out as the load consuming nearly 35 percent of the VO2 max (Saha, et al., 1979) for prolonged operation. Therefore, the percent VO2 max was computed to ascertain whether the operation of cotton picker was within the accept-able work load.
Results and DiscussionHeart Rate and Oxygen Consump-tion
The mean heart beat of the 6th and 15th minutes was recorded for the calculation. The heart rate of sub-jects increased steadily from begin-ning of the operation and stabilized in the range of 121.0 ± 4.6 beats/min after 6th minute of operation as shown in Fig. 2. The heart rate response of the subjects selected for the study for the cotton picking ac-
tivity under the manual method and using the cotton picker is furnished in Table 3. The working heart rate was higher (102.5 ± 3.6 beats/min) for the mechanical method as com-pared to the manual method (97.3 ± 4.8 beats/min), where as the physi-ological cost was lower (364 ± 40 beats/kg of cotton) for the mechani-cal method than the manual method (1208 ± 186 beats/kg) (Fig. 3). The study was spread over thirty days and the mean values of increase in heart rate over rest were adopted for the comparison of different trials to eliminate the effect of different days as well as the time of day for the ex-periment.
The mean increase in heart rate over rest was 25.2 ± 3.9 and 30.3 ± 3.3 beats/min in the manual method and mechanical methods, respec-tively. The mean output capacity (i.e., quantity of cotton picked per thousand heart beats) was 0.844 ± 0.13 beats/kg under the manual method and 2.78 ± 0.30 beats/kg using the cotton picker. Therefore, 232.2 ± 32.6 percent increase in pro-
ductivity over the manual method was achieved by using the cotton picker, and, thus, the cotton picker proved its superiority in respect of physiological cost of operation. The field capacity of the cotton picker was determined as 40 kg/day as compared to 10 kg/day for the man-ual method. Thus, the findings show that the cotton picker gave good productivity with lesser physiologi-cal cost. The heart rate of the work-ers was also within the permissible limits as per physiological norms. This reference was verified by the subjective opinion of the workers who participated in the study.
Energy Cost of OperationThe average work pulse rate of
the subjects varied from 89 to 107 beats/min. The lowest and highest values of heart rate were recorded for subject 5 for the manual method of picking and subject 4 for picking with cotton picker, respectively. The variation in work pulse rate in a par-ticular operation among all subjects was small. The energy expenditure
Subject
Working heart rate (HR), beats/min
Increase in HR over rest, beats/min
Increase in HR/kg of cotton, beats/kg
Output, kg/1000 beat
Increase in productivity over manual method, %
Manual method
Cotton picker
Manual method
Cotton picker
Manual method
Cotton picker
Manual method
Cotton picker
S1 101(73) 106 28 33 1,344 396 0.744 2.53 240.4S2 97 (73) 99 24 26 1,152 312 0.868 3.21 270.3S3 98 (75) 103 23 28 1,104 336 0.906 2.98 229.0S4 103 (72) 107 31 35 1,488 420 0.672 2.38 254.7S5 89 (69) 98 20 29 960 348 1.042 2.87 175.5S6 96 (71) 102 25 31 1,200 372 0.833 2.69 223.4
Mean 97.3 (72.2) 102.5 25.2 30.3 1,208 364 0.844 2.78 232.2SD 4.8 (2.0) 3.6 3.9 3.3 186 39.9 0.13 0.30 32.6
Table. 3 Heart rate response of the subjects
N.B.: Figures in parentheses indicate resting heart rate values
Subject Manual picking Cotton pickerS1 S2 S3 S4 S5 S6 Mean S1 S2 S3 S4 S5 S6 Mean
Oxygen uptake, l/min 0.49 0.53 0.41 0.39 0.38 0.49 0.45 0.57 0.65 0.49 0.48 0.47 0.54 0.53
Energy expenditure,
kJ/min10.26 11.09 8.58 8.16 7.95 10.26 9.38 11.93 13.6 10.26 10.05 9.84 11.3 11.16
Relative cost (% VO2 max) 25.5 25.5 21.9 24.1 23.9 26.2 24.5 29.7 31.3 26.2 29.6 29.6 32.0 29.7
Table 4 Physiological responses of subjects
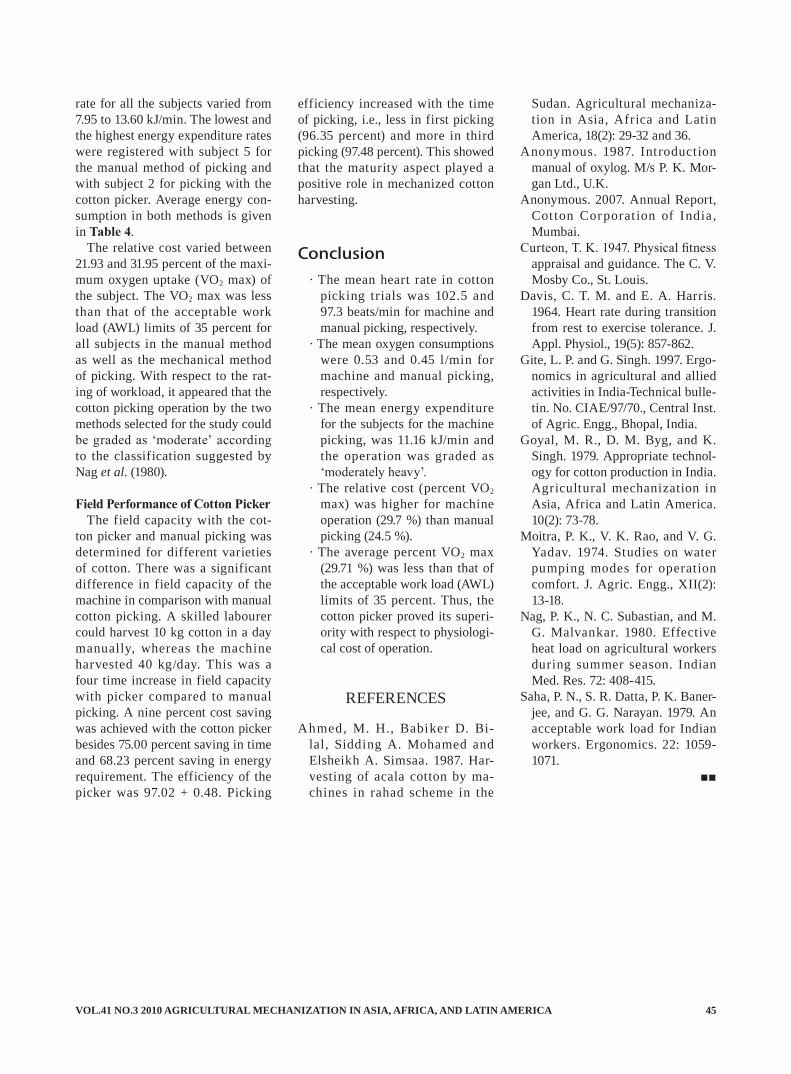
VOL.41 NO.3 2010 AGRICULTURAL MECHANIZATION IN ASIA, AFRICA, AND LATIN AMERICA 45
rate for all the subjects varied from 7.95 to 13.60 kJ/min. The lowest and the highest energy expenditure rates were registered with subject 5 for the manual method of picking and with subject 2 for picking with the cotton picker. Average energy con-sumption in both methods is given in Table 4.
The relative cost varied between 21.93 and 31.95 percent of the maxi-mum oxygen uptake (VO2 max) of the subject. The VO2 max was less than that of the acceptable work load (AWL) limits of 35 percent for all subjects in the manual method as well as the mechanical method of picking. With respect to the rat-ing of workload, it appeared that the cotton picking operation by the two methods selected for the study could be graded as ‘moderate’ according to the classification suggested by Nag et al. (1980).
Field Performance of Cotton PickerThe field capacity with the cot-
ton picker and manual picking was determined for different varieties of cotton. There was a significant difference in field capacity of the machine in comparison with manual cotton picking. A skilled labourer could harvest 10 kg cotton in a day manually, whereas the machine harvested 40 kg/day. This was a four time increase in field capacity with picker compared to manual picking. A nine percent cost saving was achieved with the cotton picker besides 75.00 percent saving in time and 68.23 percent saving in energy requirement. The efficiency of the picker was 97.02 + 0.48. Picking
efficiency increased with the time of picking, i.e., less in first picking (96.35 percent) and more in third picking (97.48 percent). This showed that the maturity aspect played a positive role in mechanized cotton harvesting.
Conclusion· The mean heart rate in cotton
picking trials was 102.5 and 97.3 beats/min for machine and manual picking, respectively.
· The mean oxygen consumptions were 0.53 and 0.45 l/min for machine and manual picking, respectively.
· The mean energy expenditure for the subjects for the machine picking, was 11.16 kJ/min and the operation was graded as ‘moderately heavy’.
· The relative cost (percent VO2 max) was higher for machine operation (29.7 %) than manual picking (24.5 %).
· The average percent VO2 max (29.71 %) was less than that of the acceptable work load (AWL) limits of 35 percent. Thus, the cotton picker proved its superi-ority with respect to physiologi-cal cost of operation.
REFERENCES
Ahmed, M. H., Babiker D. Bi-lal, Sidding A. Mohamed and Elsheikh A. Simsaa. 1987. Har-vesting of acala cotton by ma-chines in rahad scheme in the
Sudan. Agricultural mechaniza-tion in Asia, Africa and Latin America, 18(2): 29-32 and 36.
Anonymous. 1987. Introduction manual of oxylog. M/s P. K. Mor-gan Ltd., U.K.
Anonymous. 2007. Annual Report, Cot ton Corporat ion of India, Mumbai.
Curteon, T. K. 1947. Physical fitness appraisal and guidance. The C. V. Mosby Co., St. Louis.
Davis, C. T. M. and E. A. Harris. 1964. Heart rate during transition from rest to exercise tolerance. J. Appl. Physiol., 19(5): 857-862.
Gite, L. P. and G. Singh. 1997. Ergo-nomics in agricultural and allied activities in India-Technical bulle-tin. No. CIAE/97/70., Central Inst. of Agric. Engg., Bhopal, India.
Goyal, M. R., D. M. Byg, and K. Singh. 1979. Appropriate technol-ogy for cotton production in India. Agricultural mechanization in Asia, Africa and Latin America. 10(2): 73-78.
Moitra, P. K., V. K. Rao, and V. G. Yadav. 1974. Studies on water pumping modes for operation comfort. J. Agric. Engg., XII(2): 13-18.
Nag, P. K., N. C. Subastian, and M. G. Malvankar. 1980. Effective heat load on agricultural workers during summer season. Indian Med. Res. 72: 408-415.
Saha, P. N., S. R. Datta, P. K. Baner-jee, and G. G. Narayan. 1979. An acceptable work load for Indian workers. Ergonomics. 22: 1059-1071.
■■
AGRICULTURAL MECHANIZATION IN ASIA, AFRICA, AND LATIN AMERICA 2010 VOL.41 NO.346
by
S. K. PatelPh. D. ScholarIndian Agricultural Research Institute, New Delhi-12, [email protected]
AbstractMechanization of field operations
on experimental plots is considered a key input to agricultural research. However, with the introduction of mechanized, accurate and reliable planting systems, even small yield gains made in varietal improve-ment may easily be noticed. The use of machines facilitates preci-sion and timeliness in operation and reduces drudgery, which are all critical to the productivity of crops. The tractor drawn Oyjord plot drill (Wintersteiger) was evalu-ated for seed placement uniformity at four operational speeds (4, 5, 6 and 7 km/h) and two types of seeds [Rapeseed (Brassica juncea L.) and Pea (Pisum sativum L.)] with three levels of seed rate in each case. The experimental work was carried out at the Crop Research Centre of GBPUA&T, Pantanagar. The plot drill seed uniformity was described with respect to coefficient of unifor-mity and standard deviation. Results showed that an average seed drop could not be achieved in to ground wheel skid. Seed rate and speed of
B. P. VarshneyRt. ProfessorGBPUAT, Pantnagar-263 145U. S. Nagar (Uttaranchal),INDIA
Field Evaluation of Experimental Plot Drill
R. R. SinghPh. D. ScholarIndian Agricultural Research Institute, New Delhi-12, INDIA
P. K. SundaramPh. D. ScholarIndian Agricultural Research Institute, New Delhi-12, INDIA
operation did not have significant effect on coefficient of uniformity between rows for rapeseed (Brassica juncea L.), while speed of opera-tion had a highly significant (1 %) effect for peas (Pisum sativum L.). At 4 km/h, standard deviation was minimum (0.10, 0.14 and 0.19 at 2.5, 3.0 and 3.5 kg/ha seed rate for rape-seed (Brassica juncea L.) and 0.09, 0.10 and 0.17 at 80, 85 and 90 kg/ha seed rate for pea, respectively). The plot seed drill covered more distance than the selected test run, as per manufacturer’s calibration table, where the percent variation in distance coverage was almost equal to the ground wheel skid. Therefore, in order to obtain correct seed rate, the quantity of seed for a particular distance had to be increased or dis-tance shown in the calibration table had to be decreased in accordance with the ground wheel skid.
IntroductionUniformity in seed spacing has
been demonstrated to be a signifi-cant factor in quality and yield for
crops. With uniform spacing, the roots can grow to an optimum size and fill the row space without being pushed out of the row by a neigh-boring root. This ensures that all of each root can be gathered from the row by the harvester. With un-even plant spacing, some roots may be too small to be gathered by the harvester, or some roots may be too large, and may be damaged by the topping implements, or the lifting wheels of the harvester (Jaggard, 1990). Traditional methods of crop planting have involved planting of excess seed and later on thinning of the resulting plants to obtain the desired plant population at uniform plant spacing. Advancements in plant establishment practices such as seed bed preparation, high qual-ity seed, and precision planters, have provided higher and more consistent seedling emergence. As a result, crops are planted at the desired population, in contrast with planting excess seed and thinning to a desired stand population. The precision seeding offers numer-ous advantages to the researchers, which include lower thinning costs,
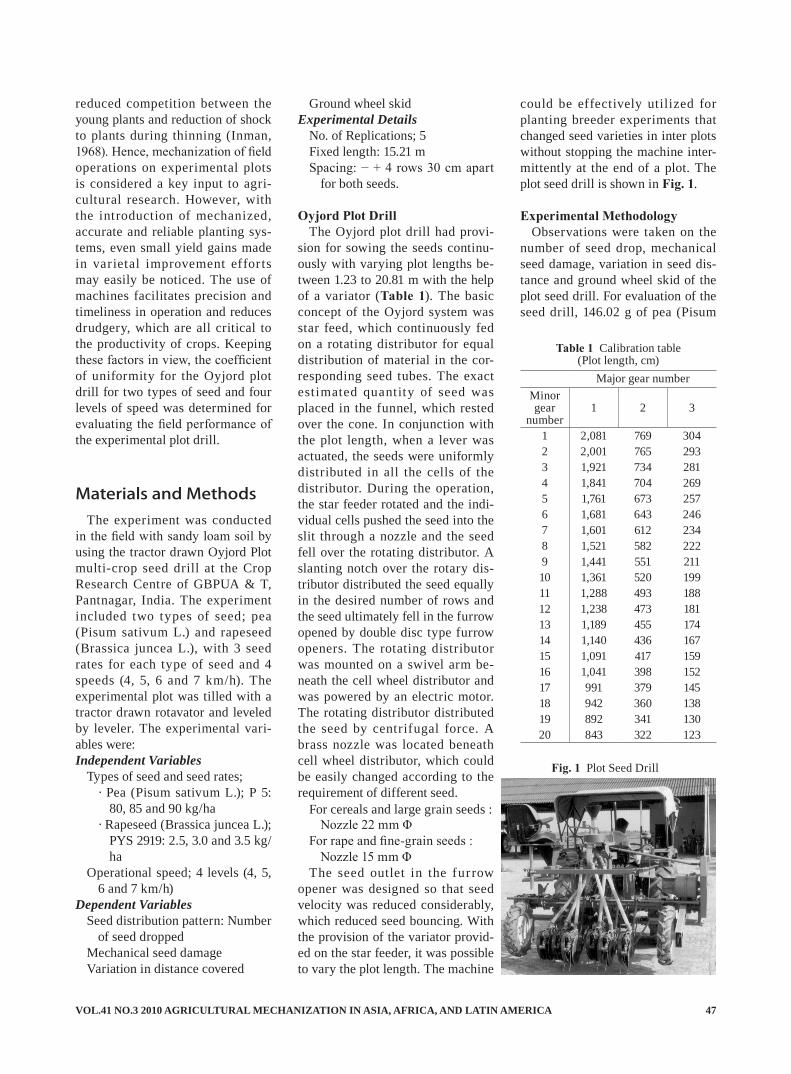
VOL.41 NO.3 2010 AGRICULTURAL MECHANIZATION IN ASIA, AFRICA, AND LATIN AMERICA 47
reduced competition between the young plants and reduction of shock to plants during thinning (Inman, 1968). Hence, mechanization of field operations on experimental plots is considered a key input to agri-cultural research. However, with the introduction of mechanized, accurate and reliable planting sys-tems, even small yield gains made in varietal improvement effor ts may easily be noticed. The use of machines facilitates precision and timeliness in operation and reduces drudgery, which are all critical to the productivity of crops. Keeping these factors in view, the coefficient of uniformity for the Oyjord plot drill for two types of seed and four levels of speed was determined for evaluating the field performance of the experimental plot drill.
Materials and MethodsThe experiment was conducted
in the field with sandy loam soil by using the tractor drawn Oyjord Plot multi-crop seed drill at the Crop Research Centre of GBPUA & T, Pantnagar, India. The experiment included two types of seed; pea (Pisum sativum L.) and rapeseed (Brassica juncea L.), with 3 seed rates for each type of seed and 4 speeds (4, 5, 6 and 7 km/h). The experimental plot was tilled with a tractor drawn rotavator and leveled by leveler. The experimental vari-ables were: Independent Variables
Types of seed and seed rates;· Pea (Pisum sativum L.); P 5:
80, 85 and 90 kg/ha· Rapeseed (Brassica juncea L.);
PYS 2919: 2.5, 3.0 and 3.5 kg/ha
Operational speed; 4 levels (4, 5, 6 and 7 km/h)
Dependent VariablesSeed distribution pattern: Number
of seed droppedMechanical seed damageVariation in distance covered
Ground wheel skidExperimental Details
No. of Replications; 5Fixed length: 15.21 mSpacing: − + 4 rows 30 cm apart
for both seeds.
Oyjord Plot DrillThe Oyjord plot drill had provi-
sion for sowing the seeds continu-ously with varying plot lengths be-tween 1.23 to 20.81 m with the help of a variator (Table 1). The basic concept of the Oyjord system was star feed, which continuously fed on a rotating distributor for equal distribution of material in the cor-responding seed tubes. The exact estimated quantity of seed was placed in the funnel, which rested over the cone. In conjunction with the plot length, when a lever was actuated, the seeds were uniformly distributed in all the cells of the distributor. During the operation, the star feeder rotated and the indi-vidual cells pushed the seed into the slit through a nozzle and the seed fell over the rotating distributor. A slanting notch over the rotary dis-tributor distributed the seed equally in the desired number of rows and the seed ultimately fell in the furrow opened by double disc type furrow openers. The rotating distributor was mounted on a swivel arm be-neath the cell wheel distributor and was powered by an electric motor. The rotating distributor distributed the seed by centrifugal force. A brass nozzle was located beneath cell wheel distributor, which could be easily changed according to the requirement of different seed.
For cereals and large grain seeds :Nozzle 22 mm Φ
For rape and fine-grain seeds : Nozzle 15 mm Φ
The seed outlet in the furrow opener was designed so that seed velocity was reduced considerably, which reduced seed bouncing. With the provision of the variator provid-ed on the star feeder, it was possible to vary the plot length. The machine
could be effectively utilized for planting breeder experiments that changed seed varieties in inter plots without stopping the machine inter-mittently at the end of a plot. The plot seed drill is shown in Fig. 1.
Experimental MethodologyObservations were taken on the
number of seed drop, mechanical seed damage, variation in seed dis-tance and ground wheel skid of the plot seed drill. For evaluation of the seed drill, 146.02 g of pea (Pisum
Major gear numberMinor gear
number1 2 3
1 2,081 769 3042 2,001 765 2933 1,921 734 2814 1,841 704 2695 1,761 673 2576 1,681 643 2467 1,601 612 2348 1,521 582 2229 1,441 551 21110 1,361 520 19911 1,288 493 18812 1,238 473 18113 1,189 455 17414 1,140 436 16715 1,091 417 15916 1,041 398 15217 991 379 14518 942 360 13819 892 341 13020 843 322 123
Table 1 Calibration table(Plot length, cm)
Fig. 1 Plot Seed Drill
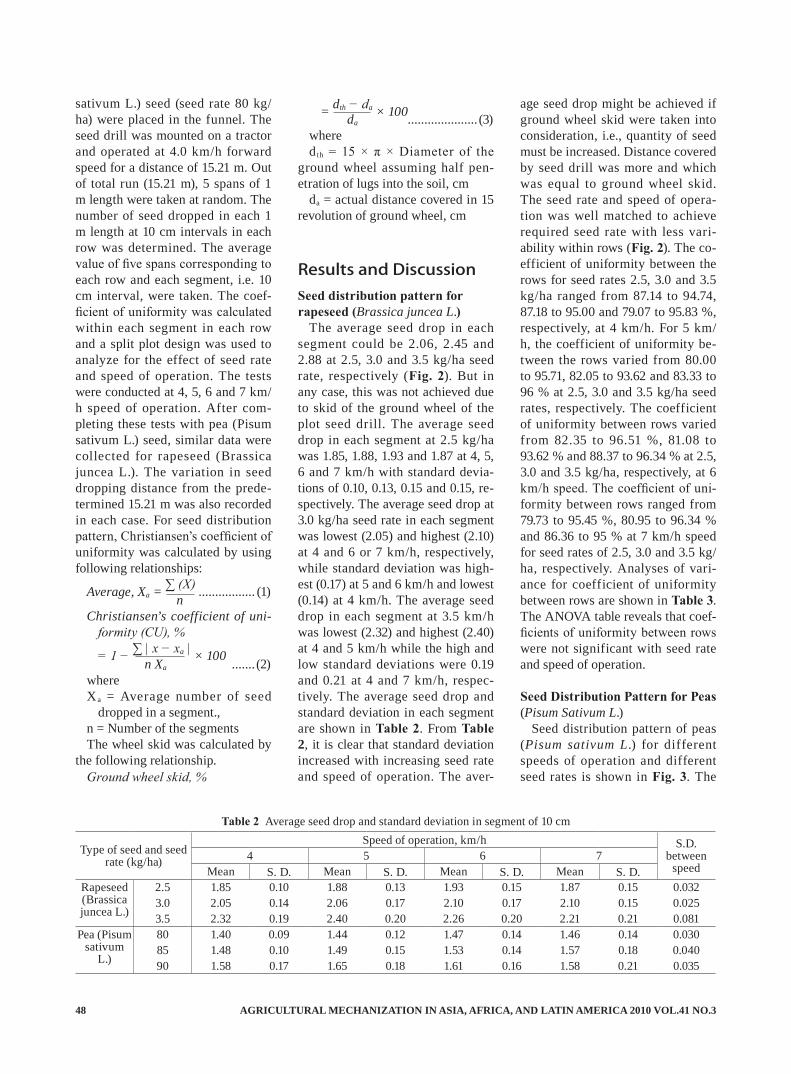
AGRICULTURAL MECHANIZATION IN ASIA, AFRICA, AND LATIN AMERICA 2010 VOL.41 NO.348
sativum L.) seed (seed rate 80 kg/ha) were placed in the funnel. The seed drill was mounted on a tractor and operated at 4.0 km/h forward speed for a distance of 15.21 m. Out of total run (15.21 m), 5 spans of 1 m length were taken at random. The number of seed dropped in each 1 m length at 10 cm intervals in each row was determined. The average value of five spans corresponding to each row and each segment, i.e. 10 cm interval, were taken. The coef-ficient of uniformity was calculated within each segment in each row and a split plot design was used to analyze for the effect of seed rate and speed of operation. The tests were conducted at 4, 5, 6 and 7 km/h speed of operation. After com-pleting these tests with pea (Pisum sativum L.) seed, similar data were collected for rapeseed (Brassica juncea L.). The variation in seed dropping distance from the prede-termined 15.21 m was also recorded in each case. For seed distribution pattern, Christiansen’s coefficient of uniformity was calculated by using following relationships:
Average, Xa = ∑ (X) ................. (1) nChristiansen’s coefficient of uni-
formity (CU), %
= 1 − ∑ | x − xa | × 100 n Xa ....... (2)whereXa = Average number of seed
dropped in a segment.,n = Number of the segmentsThe wheel skid was calculated by
the following relationship.Ground wheel skid, %
= dth − da × 100 da ..................... (3)wheredth = 15 × π × Diameter of the
ground wheel assuming half pen-etration of lugs into the soil, cm
da = actual distance covered in 15 revolution of ground wheel, cm
Results and DiscussionSeed distribution pattern for rapeseed (Brassica juncea L.)
The average seed drop in each segment could be 2.06, 2.45 and 2.88 at 2.5, 3.0 and 3.5 kg/ha seed rate, respectively (Fig. 2). But in any case, this was not achieved due to skid of the ground wheel of the plot seed drill. The average seed drop in each segment at 2.5 kg/ha was 1.85, 1.88, 1.93 and 1.87 at 4, 5, 6 and 7 km/h with standard devia-tions of 0.10, 0.13, 0.15 and 0.15, re-spectively. The average seed drop at 3.0 kg/ha seed rate in each segment was lowest (2.05) and highest (2.10) at 4 and 6 or 7 km/h, respectively, while standard deviation was high-est (0.17) at 5 and 6 km/h and lowest (0.14) at 4 km/h. The average seed drop in each segment at 3.5 km/h was lowest (2.32) and highest (2.40) at 4 and 5 km/h while the high and low standard deviations were 0.19 and 0.21 at 4 and 7 km/h, respec-tively. The average seed drop and standard deviation in each segment are shown in Table 2. From Table 2, it is clear that standard deviation increased with increasing seed rate and speed of operation. The aver-
age seed drop might be achieved if ground wheel skid were taken into consideration, i.e., quantity of seed must be increased. Distance covered by seed drill was more and which was equal to ground wheel skid. The seed rate and speed of opera-tion was well matched to achieve required seed rate with less vari-ability within rows (Fig. 2). The co-efficient of uniformity between the rows for seed rates 2.5, 3.0 and 3.5 kg/ha ranged from 87.14 to 94.74, 87.18 to 95.00 and 79.07 to 95.83 %, respectively, at 4 km/h. For 5 km/h, the coefficient of uniformity be-tween the rows varied from 80.00 to 95.71, 82.05 to 93.62 and 83.33 to 96 % at 2.5, 3.0 and 3.5 kg/ha seed rates, respectively. The coefficient of uniformity between rows varied from 82.35 to 96.51 %, 81.08 to 93.62 % and 88.37 to 96.34 % at 2.5, 3.0 and 3.5 kg/ha, respectively, at 6 km/h speed. The coefficient of uni-formity between rows ranged from 79.73 to 95.45 %, 80.95 to 96.34 % and 86.36 to 95 % at 7 km/h speed for seed rates of 2.5, 3.0 and 3.5 kg/ha, respectively. Analyses of vari-ance for coefficient of uniformity between rows are shown in Table 3. The ANOVA table reveals that coef-ficients of uniformity between rows were not significant with seed rate and speed of operation.
Seed Distribution Pattern for Peas(Pisum Sativum L.)
Seed distribution pattern of peas (Pisum sativum L.) for different speeds of operation and different seed rates is shown in Fig. 3. The
Type of seed and seed rate (kg/ha)
Speed of operation, km/h S.D. between
speed4 5 6 7
Mean S. D. Mean S. D. Mean S. D. Mean S. D.Rapeseed (Brassica juncea L.)
2.5 1.85 0.10 1.88 0.13 1.93 0.15 1.87 0.15 0.0323.0 2.05 0.14 2.06 0.17 2.10 0.17 2.10 0.15 0.0253.5 2.32 0.19 2.40 0.20 2.26 0.20 2.21 0.21 0.081
Pea (Pisum sativum
L.)
80 1.40 0.09 1.44 0.12 1.47 0.14 1.46 0.14 0.03085 1.48 0.10 1.49 0.15 1.53 0.14 1.57 0.18 0.04090 1.58 0.17 1.65 0.18 1.61 0.16 1.58 0.21 0.035
Table 2 Average seed drop and standard deviation in segment of 10 cm
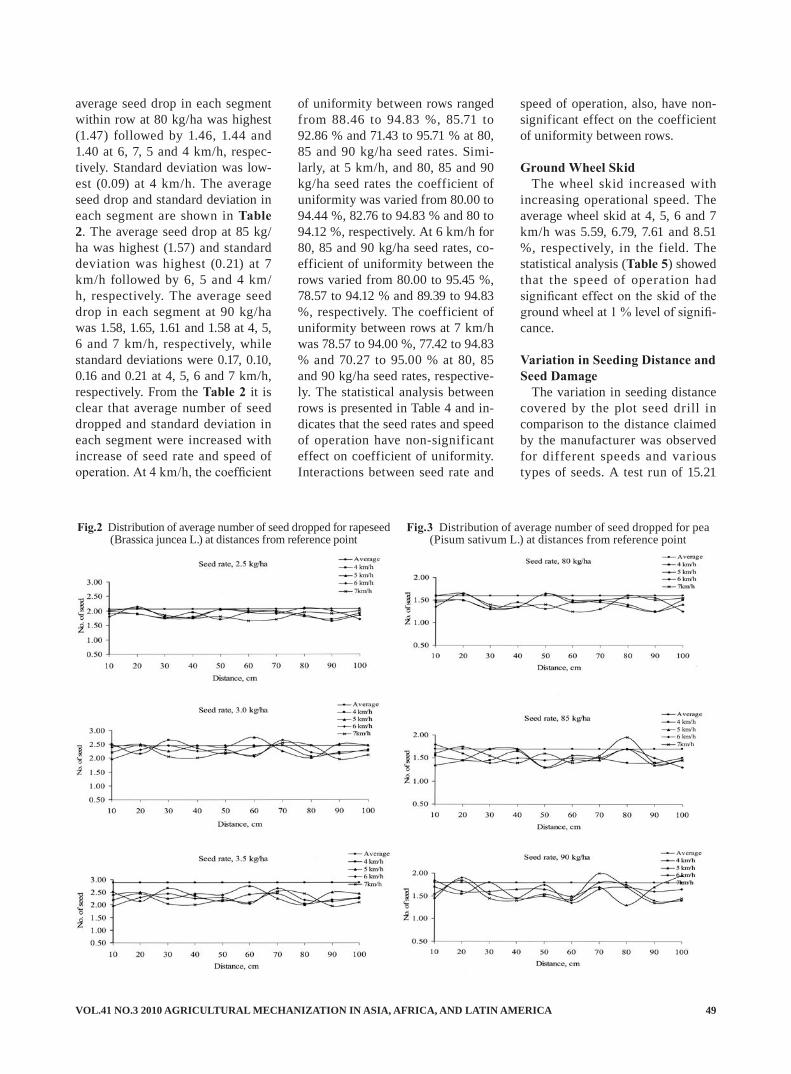
VOL.41 NO.3 2010 AGRICULTURAL MECHANIZATION IN ASIA, AFRICA, AND LATIN AMERICA 49
average seed drop in each segment within row at 80 kg/ha was highest (1.47) followed by 1.46, 1.44 and 1.40 at 6, 7, 5 and 4 km/h, respec-tively. Standard deviation was low-est (0.09) at 4 km/h. The average seed drop and standard deviation in each segment are shown in Table 2. The average seed drop at 85 kg/ha was highest (1.57) and standard deviation was highest (0.21) at 7 km/h followed by 6, 5 and 4 km/h, respectively. The average seed drop in each segment at 90 kg/ha was 1.58, 1.65, 1.61 and 1.58 at 4, 5, 6 and 7 km/h, respectively, while standard deviations were 0.17, 0.10, 0.16 and 0.21 at 4, 5, 6 and 7 km/h, respectively. From the Table 2 it is clear that average number of seed dropped and standard deviation in each segment were increased with increase of seed rate and speed of operation. At 4 km/h, the coefficient
of uniformity between rows ranged from 88.46 to 94.83 %, 85.71 to 92.86 % and 71.43 to 95.71 % at 80, 85 and 90 kg/ha seed rates. Simi-larly, at 5 km/h, and 80, 85 and 90 kg/ha seed rates the coefficient of uniformity was varied from 80.00 to 94.44 %, 82.76 to 94.83 % and 80 to 94.12 %, respectively. At 6 km/h for 80, 85 and 90 kg/ha seed rates, co-efficient of uniformity between the rows varied from 80.00 to 95.45 %, 78.57 to 94.12 % and 89.39 to 94.83 %, respectively. The coefficient of uniformity between rows at 7 km/h was 78.57 to 94.00 %, 77.42 to 94.83 % and 70.27 to 95.00 % at 80, 85 and 90 kg/ha seed rates, respective-ly. The statistical analysis between rows is presented in Table 4 and in-dicates that the seed rates and speed of operation have non-significant effect on coefficient of uniformity. Interactions between seed rate and
speed of operation, also, have non-significant effect on the coefficient of uniformity between rows.
Ground Wheel SkidThe wheel skid increased with
increasing operational speed. The average wheel skid at 4, 5, 6 and 7 km/h was 5.59, 6.79, 7.61 and 8.51 %, respectively, in the field. The statistical analysis (Table 5) showed that the speed of operation had significant effect on the skid of the ground wheel at 1 % level of signifi-cance.
Variation in Seeding Distance and Seed Damage
The variation in seeding distance covered by the plot seed drill in comparison to the distance claimed by the manufacturer was observed for different speeds and various types of seeds. A test run of 15.21
Fig.2 Distribution of average number of seed dropped for rapeseed (Brassica juncea L.) at distances from reference point
Fig.3 Distribution of average number of seed dropped for pea (Pisum sativum L.) at distances from reference point
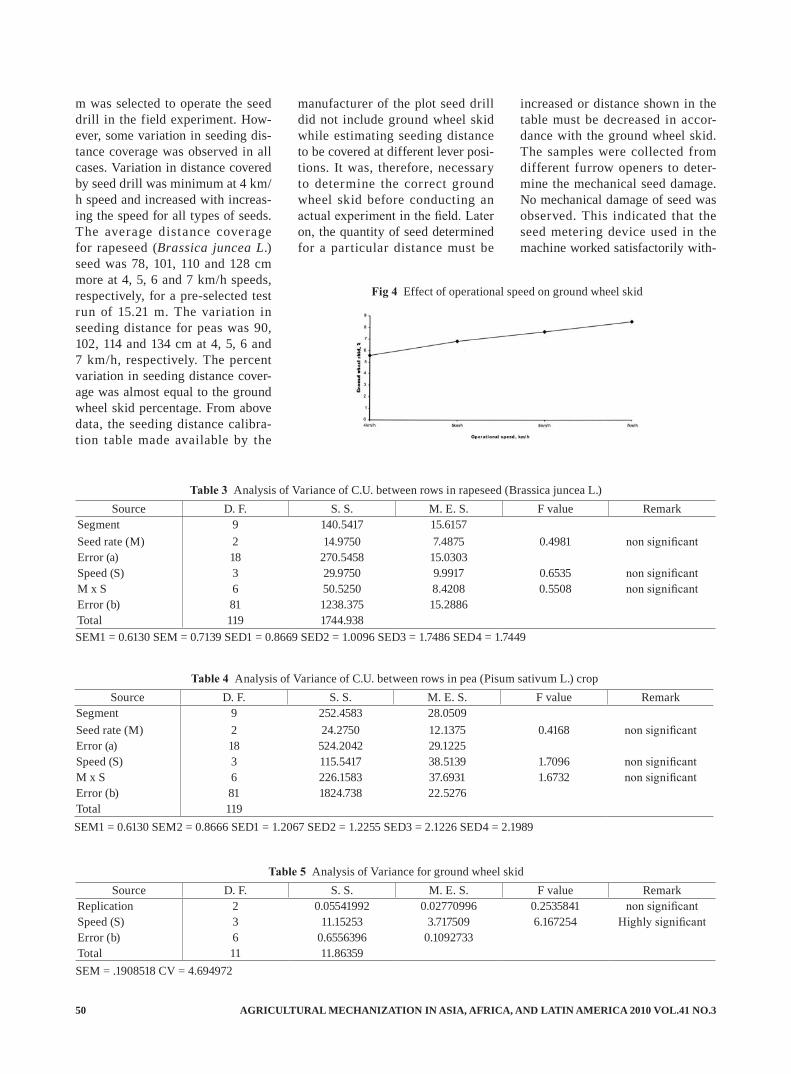
AGRICULTURAL MECHANIZATION IN ASIA, AFRICA, AND LATIN AMERICA 2010 VOL.41 NO.350
Source D. F. S. S. M. E. S. F value RemarkSegment 9 140.5417 15.6157Seed rate (M) 2 14.9750 7.4875 0.4981 non significantError (a) 18 270.5458 15.0303Speed (S) 3 29.9750 9.9917 0.6535 non significantM x S 6 50.5250 8.4208 0.5508 non significantError (b) 81 1238.375 15.2886Total 119 1744.938
Table 3 Analysis of Variance of C.U. between rows in rapeseed (Brassica juncea L.)
SEM1 = 0.6130 SEM = 0.7139 SED1 = 0.8669 SED2 = 1.0096 SED3 = 1.7486 SED4 = 1.7449
Source D. F. S. S. M. E. S. F value RemarkSegment 9 252.4583 28.0509Seed rate (M) 2 24.2750 12.1375 0.4168 non significantError (a) 18 524.2042 29.1225Speed (S) 3 115.5417 38.5139 1.7096 non significantM x S 6 226.1583 37.6931 1.6732 non significantError (b) 81 1824.738 22.5276Total 119
Table 4 Analysis of Variance of C.U. between rows in pea (Pisum sativum L.) crop
SEM1 = 0.6130 SEM2 = 0.8666 SED1 = 1.2067 SED2 = 1.2255 SED3 = 2.1226 SED4 = 2.1989
Source D. F. S. S. M. E. S. F value RemarkReplication 2 0.05541992 0.02770996 0.2535841 non significantSpeed (S) 3 11.15253 3.717509 6.167254 Highly significantError (b) 6 0.6556396 0.1092733Total 11 11.86359
Table 5 Analysis of Variance for ground wheel skid
SEM = .1908518 CV = 4.694972
Fig 4 Effect of operational speed on ground wheel skid
m was selected to operate the seed drill in the field experiment. How-ever, some variation in seeding dis-tance coverage was observed in all cases. Variation in distance covered by seed drill was minimum at 4 km/h speed and increased with increas-ing the speed for all types of seeds. The average distance coverage for rapeseed (Brassica juncea L.) seed was 78, 101, 110 and 128 cm more at 4, 5, 6 and 7 km/h speeds, respectively, for a pre-selected test run of 15.21 m. The variation in seeding distance for peas was 90, 102, 114 and 134 cm at 4, 5, 6 and 7 km/h, respectively. The percent variation in seeding distance cover-age was almost equal to the ground wheel skid percentage. From above data, the seeding distance calibra-tion table made available by the
manufacturer of the plot seed drill did not include ground wheel skid while estimating seeding distance to be covered at different lever posi-tions. It was, therefore, necessary to determine the correct ground wheel skid before conducting an actual experiment in the field. Later on, the quantity of seed determined for a particular distance must be
increased or distance shown in the table must be decreased in accor-dance with the ground wheel skid. The samples were collected from different furrow openers to deter-mine the mechanical seed damage. No mechanical damage of seed was observed. This indicated that the seed metering device used in the machine worked satisfactorily with-
VOL.41 NO.3 2010 AGRICULTURAL MECHANIZATION IN ASIA, AFRICA, AND LATIN AMERICA 51
out mechanical damage of seeds.
ConclusionsThe coefficient of uniformity be-
tween rows and number of seed drop were decrease with increase in seed rates as well as operational speeds. The average ground wheel skid was 5.59, 6.79, 7.61 and 8.51 % at 4, 5, 6 and 7 km/h speeds of operation of the plot seed drill, respectively. The plot seed drill covered more distance than the selected test run as per manufacturer’s calibration
table where the percent variation in distance coverage was almost equal to the ground wheel skid. Therefore, in order to obtain correct seed rate, the quantity of seed determined for a particular distance had to be increased or distance shown in the table had to be decreased in accor-dance with the ground wheel skid.
REFERENCES
Chandel, S. R. S. 2004. A Hand Book of Agricultural Statistics. Achal Prakashan Mandir, Kanpur.
Inman, J. W. 1968. Precision plant-ing-a reality for vegetables. Agri-cultural Engineering. 49(6): 344-45.
Jaggrd, K. 1990. Are there too may beets in our fields- British Sugar Beet Re. 58(1): 6-9.
Patel, S. K. 2003. Performance eval-uation of imported experimental multi-crop seed drill and plot combine harvester. Unpublished M. Tech.Thesis, GBPUA&T, Pant-nagar.
■■
NEWSCIGR International Symposium
7th International Symposium on Cement Based Materials for a Sustainable Agriculture (CSAS)September 18-21st Qiébec City, Canada
The organizing committee is delighted to invite you to the 7th International Symposium on Cement Based Materials for a Sustainable Agriculture of the International Commission of Ag-ricultural Engineering (CIGR). This Symposium will take place at the Château Bonne- Entente, located in Québec City.
Dates and DeadlinesAbstract submission deadline November 12th 2010Notification of acceptance January 2011Paper submission deadline May 30th 2011Early bird registration Up to June 1st 2011Symposium date 18 – 21st September 2011
https://www.bioeng.ca/csas2011
CIGR-AgEng2012International Conference of Agricultural Engineering
Agriculture $ Engineering for a Healthier LifeJuly 8-12, 2012, Valencia (Spain)
http://cigr.ageng2012.org
AGRICULTURAL MECHANIZATION IN ASIA, AFRICA, AND LATIN AMERICA 2010 VOL.41 NO.352
byR. Marco LopezUniversity of Concepción, Faculty of Agricultural Engineering, PO Box 537, Chillan, [email protected]
AbstractThe objectives of this work were
to economically evaluate the collec-tion, transport and utilization of the straw available in the swath left by the combine harvester in the wheat stubbles and to estimate the possible benefits for the farmers. In order to achieve these objectives, data about straw availability from 15 farms in three Chilean provinces generated in a recent research work were used. For the baling, collection and trans-port, three models of rotobalers and three of rectangular balers, a front loader mounted on a tractor, a wag-on and workers were considered; for the off?the?farm transport the local tariff of 2.2 US$ km-1 was used. The Annual Equivalent Cost and the Net Present Value, at a 10 % real an-nual interest, indicators were used to obtain the operating costs of the tractors and machines and to evalu-ate the different alternatives. The results showed that the baling, col-lection and transport costs reached
H. Edmundo HetzUniversity of Concepción, Faculty of Agricultural Engineering, PO Box 537, Chillan, CHILE
Economic Evaluation of Collection, Transport and Utilization of Straw in the Swath of Wheat Stubble
B. Cristian MaturanaUniversity of Concepción, Faculty of Agricultural Engineering, PO Box 537, Chillan, CHILE
values from 17.2 to 26.1 US$ ha-1, the possible benefits for the farm-ers could reach values between 42.6 and 48.9 US$ ha-1, the Net Present Value could go from US$ 18,300 to 40,500 for farms from 10 to 100 wheat hectares and the farmers could benefit from the sale of their straw including transportation up to 50 to 80 km.
IntroductionWheat (Triticum aestivum L.) is
the most important crop in Chile, considering that the annually seeded area is approximately 285,000 hect-ares (INE, 2007). The straw left in the stubble presents great difficul-ties for any tillage activity or direct seeding. This problem is greater in Chile than the other countries because the quantities of straw in the stubbles are larger, reaching often up to 8 and 9 t ha-1. Moreover, the months after harvest have low temperatures that causes very slow
decomposition (Mellado, 2007).The use of fire to eliminate straw
is still a very common practice, mainly because of its low cost and its phytosanitary positive effects. However, is not sustainable and the pressure to eliminate it will be unsustainable in the coming years, as it has already happened in the de-veloped countries (Mellado, 2007). The alternatives to burn the straw have different cost/benefit relation-ships, and it is important and urgent to evaluate possible solutions for wheat producers.
On the other hand, previous research has shown that to leave about 3 t ha-1 of straw in the field is enough to protect the soil from ero-sion, maintain a good level of organ-
AcknowledgementsThe authors are indebted with
the Research Division of the Uni-versity of Concepción, which fi-nanced this work through Project Nº 204.131.006-1.0

VOL.41 NO.3 2010 AGRICULTURAL MECHANIZATION IN ASIA, AFRICA, AND LATIN AMERICA 53
ic matter, enhance high productivity and allow an adequate performance of the tillage implements and/or the zero tillage seeder (Mellado, 2007; Crovetto, 2002).
The biggest problem is caused by the swath of long straw, of approxi-mately 1 m wide, left behind the combine harvester, which joins all the material cut and collected by the header. In Chile, this can vary from 3 to 6 m wide. Hetz et al. (2006) established that the linear density in this swath depends, mainly, on the width and height of the combine harvester cutting header, with val-ues ranging from 0.552 to 2.686 kg m-1 and with an average of 1.037 kg m-1. Then the amount of straw pos-sible to collect from the swath with a baler can range from 1.5 to 4.5 t ha-1, averaging close to 2.5 t ha-1 that are values similar to those found by Bamaga et al. (2003) and Neale et al. (1993).
The straw collected from this swath can be used for livestock, ag-ricultural or industrial purposes. In the first uses are the winter bed and animal feed. Agricultural uses in-clude the production of saprophytes fungi, composting and organic soil, eroded land cover and an addition to ensilage with excess of water (Crovetto, 2002). The industrial uti-lization includes use as solid fuel, with a contribution of approximate-ly 14 to 15 MJ kg-1. A recovery of 3 t ha-1 is equivalent to about 1,125 L ha-1 of diesel fuel (38.66 MJ L-1). This use is widespread in northern Europe for heating buildings for collective use and could become a cheap fuel for drying agricultural products in Chile. Other uses in-clude the manufacture of plastics, furfural, bioethanol, paper, insula-tion panels and filling in packages (Butterworth, 1985).
Several authors (López and Hetz, 1998; Ibáñez et al, 1994) indicate that it is essential to analyze the operating costs of agricultural ma-chinery to establish its economic minimum intensity of use (EMIU),
for making an informed judgment to decide whether the farmer should possess his own machines or should hire the mechanized services need-ed.
The objectives of this research were to economically evaluate the collection, transport and utilization of straw available in the swath left by the combine harvester in wheat stubble, to establish the costs of collecting and transporting to the places where it could be used and to estimate the possible benefits for the farmers.
MethodologyGeneral Background
The research was carried out at the Mechanization and Energy De-partment of the Agricultural Engi-neering Faculty at the University of Concepción, Chillán, during 2006. The results of measurements made by Hetz et al. (2006) in 15 locations in the provinces of Linares, Ñuble and Malleco, south-central zone of Chile, were used. The area is located between 35º 37' Lat. South, 71º 34' Long. West and 37-59' Lat. South, 72º 49' Long. West. From these results the average value of straw available in the swath equiva-lent to 2.5 t ha-1, dry matter basis, was used.
Collection and Possible Utilization of Straw Availablein the Swath
The specifications, price and tech-nical characteristics of cylindrical and rectangular balers used in Chile were obtained. With these data, the effective work capacity (EWC) in ha h-1 of each model was established according to reasonable working speeds permitted by the density of the straw in the swath and depend-ing on the width and cut height of the combine harvester. A tractor of 63.4 kW (85 HP) was also consid-ered, with an operational cost of 14.94 US$ h-1 (Hetz and Weinlaub, 2001; Hetz et al., 1998).
The use considered for the straw collected include its utilization for animal feed with a consumption of 3.5 kg per day-1, bed for stabled cattle with a consumption of 67.5 kg month-1 per animal, solid fuel with a contribution of 14 MJ kg-1 and gen-eration of liquid fuel as bioethanol requiring 6 kg of straw to produce 1 L of bioethanol (Butterworth., 1985).
Bale Transportation on and off the Farm
Within the property, the rectangu-lar bales are loaded and transported in a wagon and then transferred to the gathering place where they are loaded on a truck to be carried to the place of final use. It was established that two workers needed 15 minutes to load 100 bales of 25 kg each, gen-erated in one hectare of wheat, at a cost of US$ 0.88 for labor. For the cylindrical bales of 600 kg, a tractor equipped with a front loader and a wagon with a 8 bales capacity for transportation to the place of collec-tion were considered; for this activ-ity a time of 15 minutes per hectare, for loading and transporting was established. For transportation off the farm, the local rate of 2.19 US$ km-1 was used, considering 30 ton trucks with an estimated capacity of 450 rectangular bales or 24 cylindri-cal bales.
Economic EvaluationThe economic calculations were
carried out considering the effec-tive prices of the machines, inputs and workers in July 2006, the prices were surveyed in Chilean pesos and expressed in US dollars without the Value Added Tax (VAT) (US$ 1 = Ch$ 547, July of 2006).
The economic evaluation of each one of the alternatives was carried out with the following assumptions:
· The evaluation span used was 10 year.
· The prices considered for the
AGRICULTURAL MECHANIZATION IN ASIA, AFRICA, AND LATIN AMERICA 2010 VOL.41 NO.354
machinery correspond to values of new machines.
· The interest rate for capital in-vestment considered was 10% annual, real.
· This evaluation included the bal-ing costs, on and off the farm transportation.
· The price of 0.03 US$ kg-1 was obtained by selling the straw as the benefit to the farmer.
· The project was financed with the farmer’s own money.
· The alternatives were indepen-dent of each other.
· The calculation of the economic indicators Annual Equivalent Cost (AEC) and Net Present Value (NPV) were carried out under the same conditions for each alternative, because all of them provide the same service (Blank and Tarquin, 1992).
The f ixed costs considered an
insurance equivalent to 2% of the average between the initial cost and the recovery of the capital asset (Fundación Chile, 2003). The vari-able costs included the repair and maintenance calculated using the Morris (1988) equation, which esti-mated these costs as a percentage of purchase prices over the cumulative hours of use. The labor cost was es-timated at 1.75 US$ h-1. A 5 % of the total variable costs as unforeseen cost was applied (Fundacion Chile, 2003).
The AEC was calculated as pro-posed by Blank and Tarquin (1992). In that methodology, each cash flow in the future is calculated and then all of them are transferred to the present time (year zero) as a single actual amount. Then the AEC is calculated as the annual equivalent amount of the actual present using a capital recovery factor for the 10
years considered in this study. To obtain the operational costs,
per hour and per hectare, the hours of use per year and the EWC of each machine were used. Moreover, the price to perform agricultural mech-anized services was calculated as Ibañez and Villar (1994) proposed, which considered fixed and vari-able costs, administration cost (10 %) and 20 % of the costs estimated above as profit.
T he N PV, a s t he d i f fe rence bet ween income and outcome expressed in actual money, as pro-posed by Sapag and Sapag (2007), was calculated. The scenarios were analyzed according to the economic profitability of machinery’s invest-ment and included all costs of the process or hiring the service ac-cording to a tariff. The most likely scenario considered the more prob-able working conditions for collect-
Trademark and baler model Work speed(km h-1)
Bale weight(kg)
Acquisition Price(VAT included)
(US$)*
Rotobaler Mascar Rotop-2120 5.5-8.5 300 21,500John Deere 467 5.5-8.5 600 27,000Claas 250 R 5.5-8.5 600 33,000
Average 27,167Rectangular baler Hesston 4570 3.5-6.0 25 18,088
New Holland 570 W 3.5-6.0 25 17,850Case SBX-540 3.5-6.0 25 19,500
Average 18,479
Table 1 Characteristics of the roto and rectangular balers considered in this research work
Source: Claas, 2006; Dercomaq, 2006; Deere & Co, 2006; Kutz, 2006; Mascar, 2006; Sigdotek, 2006; Tattersall, 2006. * US$ 1 = Ch$ 547 (July, 2006)
Baler model Working width(m)
Work speed(km h-1)
EWC(ha h-1)
EWC(h ha-1)
Rotobaler 3.2 8.5 2.041 0.4904.0 7.0 2.101 0.4766.0 5.5 2.475 0.404
Average 2.205 0.457Rectangular baler 3.2 6.0 1.441 0.694
4.0 5.0 1.499 0.6676.0 3.5 1.575 0.635
Average 1.505 0.665
Table 2 Width, speed and effective work capacity (EWC) of the balers
Source: Made using data from Ibáñez and Villar (1994), and enterprises Claas, John Deere, Mascar, Agrícola Gildemeister, Dercomaq, Sigdotek y Tattersall Consulted 2006.
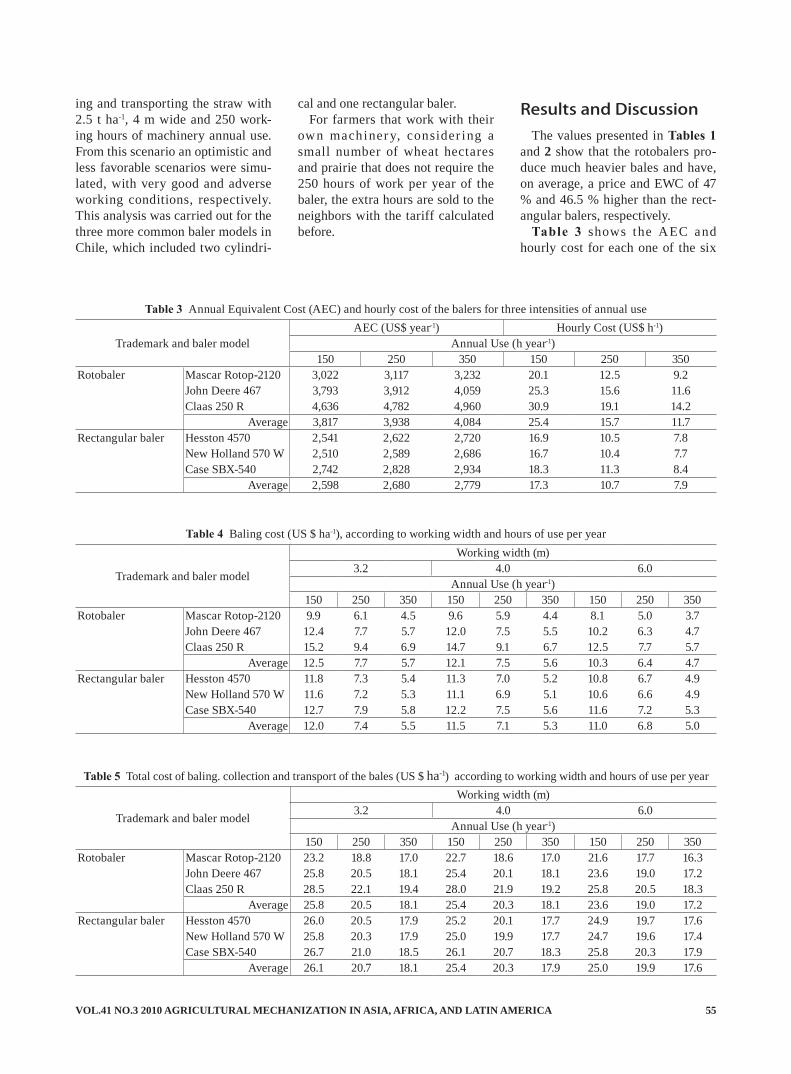
VOL.41 NO.3 2010 AGRICULTURAL MECHANIZATION IN ASIA, AFRICA, AND LATIN AMERICA 55
ing and transporting the straw with 2.5 t ha-1, 4 m wide and 250 work-ing hours of machinery annual use. From this scenario an optimistic and less favorable scenarios were simu-lated, with very good and adverse working conditions, respectively. This analysis was carried out for the three more common baler models in Chile, which included two cylindri-
cal and one rectangular baler. For farmers that work with their
own machiner y, consider ing a small number of wheat hectares and prairie that does not require the 250 hours of work per year of the baler, the extra hours are sold to the neighbors with the tariff calculated before.
Results and DiscussionThe values presented in Tables 1
and 2 show that the rotobalers pro-duce much heavier bales and have, on average, a price and EWC of 47 % and 46.5 % higher than the rect-angular balers, respectively.
Table 3 shows the AEC and hourly cost for each one of the six
Trademark and baler modelAEC (US$ year-1) Hourly Cost (US$ h-1)
Annual Use (h year-1)150 250 350 150 250 350
Rotobaler Mascar Rotop-2120 3,022 3,117 3,232 20.1 12.5 9.2John Deere 467 3,793 3,912 4,059 25.3 15.6 11.6Claas 250 R 4,636 4,782 4,960 30.9 19.1 14.2
Average 3,817 3,938 4,084 25.4 15.7 11.7Rectangular baler Hesston 4570 2,541 2,622 2,720 16.9 10.5 7.8
New Holland 570 W 2,510 2,589 2,686 16.7 10.4 7.7Case SBX-540 2,742 2,828 2,934 18.3 11.3 8.4
Average 2,598 2,680 2,779 17.3 10.7 7.9
Table 3 Annual Equivalent Cost (AEC) and hourly cost of the balers for three intensities of annual use
Trademark and baler model
Working width (m)3.2 4.0 6.0
Annual Use (h year-1)150 250 350 150 250 350 150 250 350
Rotobaler Mascar Rotop-2120 9.9 6.1 4.5 9.6 5.9 4.4 8.1 5.0 3.7John Deere 467 12.4 7.7 5.7 12.0 7.5 5.5 10.2 6.3 4.7Claas 250 R 15.2 9.4 6.9 14.7 9.1 6.7 12.5 7.7 5.7
Average 12.5 7.7 5.7 12.1 7.5 5.6 10.3 6.4 4.7Rectangular baler Hesston 4570 11.8 7.3 5.4 11.3 7.0 5.2 10.8 6.7 4.9
New Holland 570 W 11.6 7.2 5.3 11.1 6.9 5.1 10.6 6.6 4.9Case SBX-540 12.7 7.9 5.8 12.2 7.5 5.6 11.6 7.2 5.3
Average 12.0 7.4 5.5 11.5 7.1 5.3 11.0 6.8 5.0
Table 4 Baling cost (US $ ha-1), according to working width and hours of use per year
Trademark and baler model
Working width (m)3.2 4.0 6.0
Annual Use (h year-1)150 250 350 150 250 350 150 250 350
Rotobaler Mascar Rotop-2120 23.2 18.8 17.0 22.7 18.6 17.0 21.6 17.7 16.3John Deere 467 25.8 20.5 18.1 25.4 20.1 18.1 23.6 19.0 17.2Claas 250 R 28.5 22.1 19.4 28.0 21.9 19.2 25.8 20.5 18.3
Average 25.8 20.5 18.1 25.4 20.3 18.1 23.6 19.0 17.2Rectangular baler Hesston 4570 26.0 20.5 17.9 25.2 20.1 17.7 24.9 19.7 17.6
New Holland 570 W 25.8 20.3 17.9 25.0 19.9 17.7 24.7 19.6 17.4Case SBX-540 26.7 21.0 18.5 26.1 20.7 18.3 25.8 20.3 17.9
Average 26.1 20.7 18.1 25.4 20.3 17.9 25.0 19.9 17.6
Table 5 Total cost of baling. collection and transport of the bales (US $ ha-1) according to working width and hours of use per year

AGRICULTURAL MECHANIZATION IN ASIA, AFRICA, AND LATIN AMERICA 2010 VOL.41 NO.356
baler models considered in this study, with three intensities of an-nual use. It can be appreciated that the rotobaler models have an AEC and hourly costs of 47 %, on aver-age, higher than the rectangular balers. It can also be seen that the AEC increases slightly with annual hours of use, but that the hourly cost decreases significantly, less than half, as it increases from 150 to 350 hours annual use, highlighting the importance of increased annual hours of use for decreasing hourly costs (López and Hetz, 1998).
Table 4 presents the baling costs in US$ ha-1 for different baler mod-els, working width and annual hours of use. These values show that the rotobaler costs are similar, on the average, to rectangular balers with the same working width and annual hours of use. It can also be seen that these costs decrease slightly as the working width increases and fall with increased annual hours of use.
Table 5 shows the total costs of baling, collection and transport for three working widths and three levels of annual hours of use. These costs do not show significant dif-ferences between the cylindrical and rectangular balers for differ-ent working widths, but there is a notable decrease by increasing
the annual hours of use. However, these costs, that include the collec-tion and transport of the bales, are considerably greater than the baling cost shown in Table 4. For the most common situation found in the field (4 m wide and 250 working annual hours) the cost increased 171 % for the rotobalers and 186 % for the rectangular balers.
Table 6 shows that the potential revenues are, on average, 42.6 US$ ha-1 for the hired service and 48.9 US$ha-1 for farmer own machinery service in relation to the potential benefits arising from the sale of the straw collected with the farmer’s own machinery for the three com-mon baler models in the field and the tariff of the hired machinery service,. These values were esti-mated with 2.5 t ha-1 of straw in the swath and it should be remembered that this value could climb up to 4.5 t ha-1, as shown by Hetz et al. (2006) Then, the revenues and benefits of the straw sold would increase sig-nificantly, especially for farmers who use high-tech machinery with appropriate levels of inputs timely applied to increase grain and straw production.
As for the NPV, Table 7 shows average values for two rotobalers of 26.9 to 47.4 thousand dollars as the
area increases from 5 to 100 hect-ares of wheat and 18.3 to 40.5 thou-sand dollars for a rectangular baler.
Finally, the profits or costs for baling in different field sizes, from 10 to 100 hectares, and their trans-portation to distances between 10 and 100 km, are shown in Table 8 for a rotobaler and Table 9 for a rectangular baler. It can be seen that there are benefits generated for transportation distances, up to 70 and 80 km with a rotobaler and only up to 60 and 70 km for a rectangular baler. This reduction in the distance for rectangular baler arises from the higher cost of collecting and trans-porting the larger number of small bales. It also can be seen that the distance that provides profit increas-es with incrementing field sizes because of a larger economic justi-fication of machinery ownership by the larger number of annual hours of use (López and Hetz, 1998).
ConclusionsThe baling, collection and trans-
port on-farm costs ranged, on aver-age, between 17.2 and 25.8 US$ ha-1 for rotobalers and between 17.6 and 26.1 US$ ha-1 for the rectangular baler.
Trademark and baler model Sales(US $ ha-1)
Tariff(US $ ha-1)
Profit by origin of service (US$ ha-1)Hired Owner
Rotobaler Mascar Rotop-2120 68.6 24.7 45.7 49.8John Deere 467 68.6 26.7 41.9 48.3
Rectangular baler New Holland 570 W 68.6 26.4 42.1 48.5Average 68.6 25.9 42.6 48.9
Table 6 Sales, tariff, profit and difference between owned and hired machines (US$ ha-1) in the most likely scenario with 2.5 t ha-1 of straw in the swath
Trademark and baler model Weathfield size (ha)10 40 70 100
Rotobaler Mascar Rotop-2120 26,097 33,139 39,856 47,221John Deere 467 27,675 34,313 40,951 47,589
Average 26,887 33,726 40,402 47,404Rectangular baler New Holland 570 W 18,322 25,726 33,128 40,530
Table 7 Net Present Value (US$) for 10 years with 10% real annual interest, in the most likely scenario with 2.5 t ha-1 of straw in the swath and four wheatfield sizes
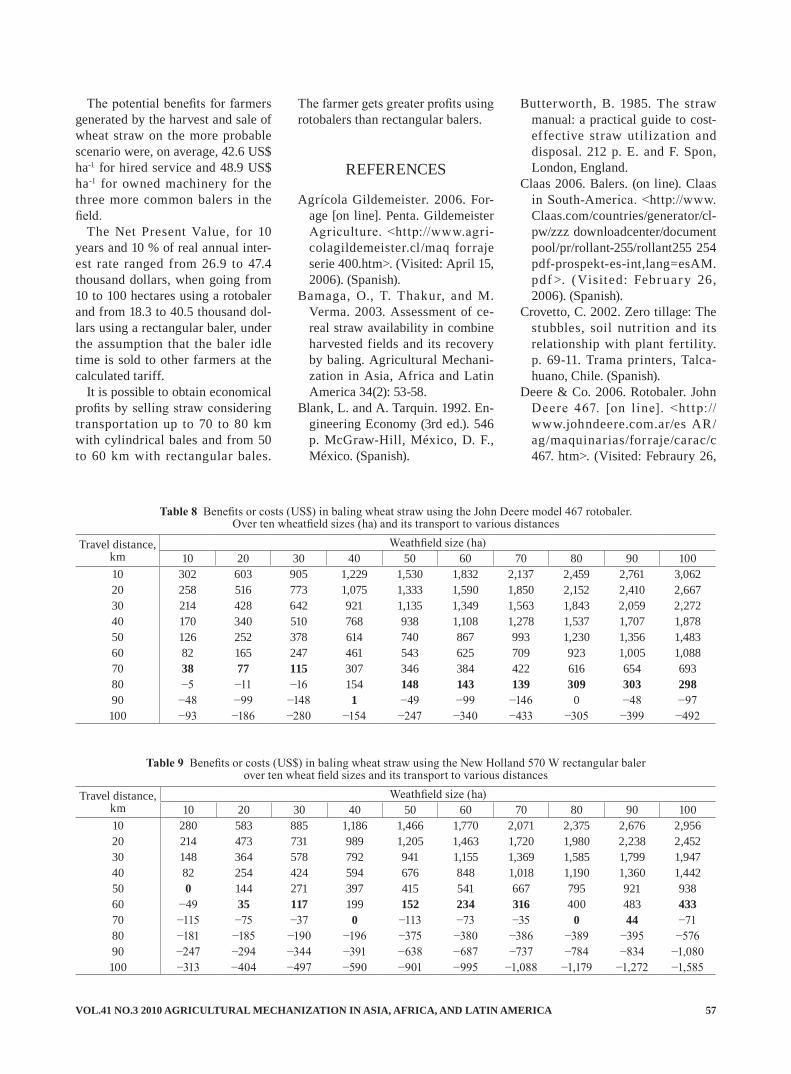
VOL.41 NO.3 2010 AGRICULTURAL MECHANIZATION IN ASIA, AFRICA, AND LATIN AMERICA 57
The potential benefits for farmers generated by the harvest and sale of wheat straw on the more probable scenario were, on average, 42.6 US$ ha-1 for hired service and 48.9 US$ ha-1 for owned machinery for the three more common balers in the field.
The Net Present Value, for 10 years and 10 % of real annual inter-est rate ranged from 26.9 to 47.4 thousand dollars, when going from 10 to 100 hectares using a rotobaler and from 18.3 to 40.5 thousand dol-lars using a rectangular baler, under the assumption that the baler idle time is sold to other farmers at the calculated tariff.
It is possible to obtain economical profits by selling straw considering transportation up to 70 to 80 km with cylindrical bales and from 50 to 60 km with rectangular bales.
The farmer gets greater profits using rotobalers than rectangular balers.
REFERENCES
Agrícola Gildemeister. 2006. For-age [on line]. Penta. Gildemeister Agriculture. <http://www.agri-colagildemeister.cl/maq forraje serie 400.htm>. (Visited: April 15, 2006). (Spanish).
Bamaga, O., T. Thakur, and M. Verma. 2003. Assessment of ce-real straw availability in combine harvested fields and its recovery by baling. Agricultural Mechani-zation in Asia, Africa and Latin America 34(2): 53-58.
Blank, L. and A. Tarquin. 1992. En-gineering Economy (3rd ed.). 546 p. McGraw-Hill, México, D. F., México. (Spanish).
Butterworth, B. 1985. The straw manual: a practical guide to cost-effective straw utilization and disposal. 212 p. E. and F. Spon, London, England.
Claas 2006. Balers. (on line). Claas in South-America. <http://www. Claas.com/countries/generator/cl-pw/zzz downloadcenter/document pool/pr/rollant-255/rollant255 254 pdf-prospekt-es-int,lang=esAM.pdf >. (Visited: Febr uary 26, 2006). (Spanish).
Crovetto, C. 2002. Zero tillage: The stubbles, soil nutrition and its relationship with plant fertility. p. 69-11. Trama printers, Talca-huano, Chile. (Spanish).
Deere & Co. 2006. Rotobaler. John Deere 467. [on l ine]. <ht tp://www.johndeere.com.ar/es AR/ag/maquinarias/forraje/carac/c 467. htm>. (Visited: Febraury 26,
Travel distance, km
Weathfield size (ha)10 20 30 40 50 60 70 80 90 100
10 302 603 905 1,229 1,530 1,832 2,137 2,459 2,761 3,06220 258 516 773 1,075 1,333 1,590 1,850 2,152 2,410 2,66730 214 428 642 921 1,135 1,349 1,563 1,843 2,059 2,27240 170 340 510 768 938 1,108 1,278 1,537 1,707 1,87850 126 252 378 614 740 867 993 1,230 1,356 1,48360 82 165 247 461 543 625 709 923 1,005 1,08870 38 77 115 307 346 384 422 616 654 69380 −5 −11 −16 154 148 143 139 309 303 29890 −48 −99 −148 1 −49 −99 −146 0 −48 −97100 −93 −186 −280 −154 −247 −340 −433 −305 −399 −492
Table 8 Benefits or costs (US$) in baling wheat straw using the John Deere model 467 rotobaler.Over ten wheatfield sizes (ha) and its transport to various distances
Travel distance,km
Weathfield size (ha)10 20 30 40 50 60 70 80 90 100
10 280 583 885 1,186 1,466 1,770 2,071 2,375 2,676 2,95620 214 473 731 989 1,205 1,463 1,720 1,980 2,238 2,45230 148 364 578 792 941 1,155 1,369 1,585 1,799 1,94740 82 254 424 594 676 848 1,018 1,190 1,360 1,44250 0 144 271 397 415 541 667 795 921 93860 −49 35 117 199 152 234 316 400 483 43370 −115 −75 −37 0 −113 −73 −35 0 44 −7180 −181 −185 −190 −196 −375 −380 −386 −389 −395 −57690 −247 −294 −344 −391 −638 −687 −737 −784 −834 −1,080100 −313 −404 −497 −590 −901 −995 −1,088 −1,179 −1,272 −1,585
Table 9 Benefits or costs (US$) in baling wheat straw using the New Holland 570 W rectangular baler over ten wheat field sizes and its transport to various distances
AGRICULTURAL MECHANIZATION IN ASIA, AFRICA, AND LATIN AMERICA 2010 VOL.41 NO.358
2006). (Spanish).Dercomaq. 2006. Pasturage [on
line]. Massey Ferguson, Lan-dini and Farmtrac. <http://www.dercomaq.cl/contenido/agricola/implementos/implementos_paste.htm>. (Visited: March 2, 2006). (Spanish).
Fundación Chile. 2003. Cost and uses of agricultural machinery. Agroecon?mico 76: 17-25. (Span-ish).
Hetz, E., A. Huerta, S. Villar, and M. López. 1998. Economic evalu-ation of the agricultural tractors commercialized in Chile. Agro Sur 26(2): 33-43. (Spanish).
Hetz, E. and M. Weinlaub. 2001. Technical evaluation of the agri-cultural tractors commercialized in Chile. Agro Ciencia 17(2): 187-192. (Spanish).
Hetz, E., J. de la Cerda y M. López. 2006. Straw availability in the swath of wheat stubbles in three Chilean provinces. Agric. Téc. (Chile) 66(4): 393-401. (Spanish).
Ibáñez, M. and S. Villar. 1994. Eco-nomic justification of agricultural machinery ownership. 43 p. Ex-
tension Bulletin Nº 27. University of Concepcion, Agricultural En-gineering Faculty, Chillán, Chile. (Spanish).
Instituto Nacional de Estadísti-cas (INE). 2007. Essential an-nual crops. Seed intentions at national level for agricultural year 2006/2007. [on line]. http://www.ine.cl/canales/chile_estadistico/ estadisticas_agropecuarias/inten-ciones_siembra/archivos/inten-cion_sep_naciona_2006-2007.xls. Visited: June 25, 2008. (Spanish).
Kutz. 2006. Agricultural Machin-ery. [on line]. Hugo Kutz Agricul-tural Machinery. <http://www.kutzmaquinarias.cl/maquinas/c2f4.php> (Visited: March 8, 2006). (Spanish).
López, M. and E. Hetz. 1998. An-nual use that economically justi-fies the ownership of some high price agricultural machines. Agro Sur 26(2): 44-52. (Spanish).
Mascar. 2006. The quality you are looking for. [on line]. AGROM Agricultural Machinery. http://www.mascar.it/english/rot 2120.htm (Visited: March 2, 2006).
Mellado, M. 2007. Wheat in Chile. 684 p. INIA Nº 21 Collection books. Agricultural Research Institute, Quilamapu Regional Research Centre, Chillán, Chile. (Spanish).
Morris, J. 1988. Estimation of trac-tor repair and maintenance costs. J. Agric. Eng. Res. 41(3): 191-200.
Neale, M. and P. Williams. 1993. A survey of straw swaths and the implications for in- field straw processing equipment. The Agri-cultural Engineer 48: 72-74.
Sapag, N. and R. Sapag. 2007. Project Formulation and Evalu-ation (5th ed.). 445 p. Mc Graw-Hill Interamericana. México D. F. México. (Spanish).
Sigdotek. 2006. Agricultural Ma-chinery. [on line]. Sigdo Koppers S. A. ht tp://www.sigdotek.cl /maquinariapasteria.asp (Visited: February 26, 2006).
Tattersall. 2006. Agro Agricultural Machinery. [on line]. http://www.comercial.cl/catalogo02 (Visited: March 8, 2006).
■■
VOL.41 NO.3 2010 AGRICULTURAL MECHANIZATION IN ASIA, AFRICA, AND LATIN AMERICA 59
by
Jagvir DixitAssociate ProfessorDiv. of Agril. Engineering,SKUAST-K, Shalimar, [email protected]
AbstractThis paper describes the prospec-
tus in amenability to maize cultiva-tion mechanization in hilly regions of Jammu and Kashmir State based on the field experiments conducted. Based on the comparative perfor-mance of improved implements with convent ional methods of maize cultivation, mechanization prospectus of different farm op-erations of maize cultivation have been explored and presented in this paper. Seed bed preparation with a power tiller rotary has enhanced the crop yields by 17.6 percent, in comparison to bullock ploughing due to a fine and well pulverized seed bed. Maize sowing by a rotary dibbler raised bed planter ensured a proper plant stand and produced 20-25 percent increased yield over the conventional method of sowing (broadcasting). Weeding, with the help of a wheel hand hoe and power weeder, gave a cost saving of about Rs. 1,400-1,700 per hectare over
J. N. KhanAssociate ProfessorDiv. of Agril. Engineering,SKUAST-K, Shalimar, Srinagar-191121INDIA
Mechanization Possibilities of Maize Cultivation in Hilly Regions of Jammu and Kashmir State of India
R. M. ShuklaAssistant ProfessorDiv. of Agril. Engineering,SKUAST-K, Shalimar, Srinagar-191121INDIA
manual weeding. Similarly, har-vesting and shelling by mechanical methods produced better results in terms of labour saving, cost saving and drudgery reduction. This meant that the various operations of maize cultivation need to be mechanized with suitable improved implements suitable to local conditions.
IntroductionMaize (zea mays L.) is the largest
cereal crop of Jammu and Kashmir, which is grown in the high rainfall area with good drainage. Maize is being cultivated in about 3.3x 10⁵ ha area annually. The total produc-tion of maize in the state for the year 2000-01 was 5.38 x 10⁵ M.T. in 0.33 M ha area with an giving the average yields of 16.48 q/ha (Anonymous, 2001). To increase food production, the productivity of land and labour need to be increased substantially, which will require both higher energy inputs and bet-
ter management of food production systems. Conventional practices are followed for most of the farm opera-tions in maize, which consume max-imum time, energy and cost as well as increase drudgery to the growers. High labour demands in each opera-tion adversely affects the timeliness of operations, thereby, reducing the crop yield. Better cultivation prac-tices, plant protection measurers and balanced fertilizer application play a significant role in augmenting the yields. Nevertheless, the adoption of improved processes and modified implements is equally important for better germination, proper plant stand and inter-culturing, which are prerequisites for good crop yields. It is the need of the hour and a chal-lenge to change the agricultural strategy for increasing crop yields through appropriate mechanization to meet the food grain requirement of increasing population.
Research conducted by the sci-entists on different aspects reveals that decisively higher yield can be
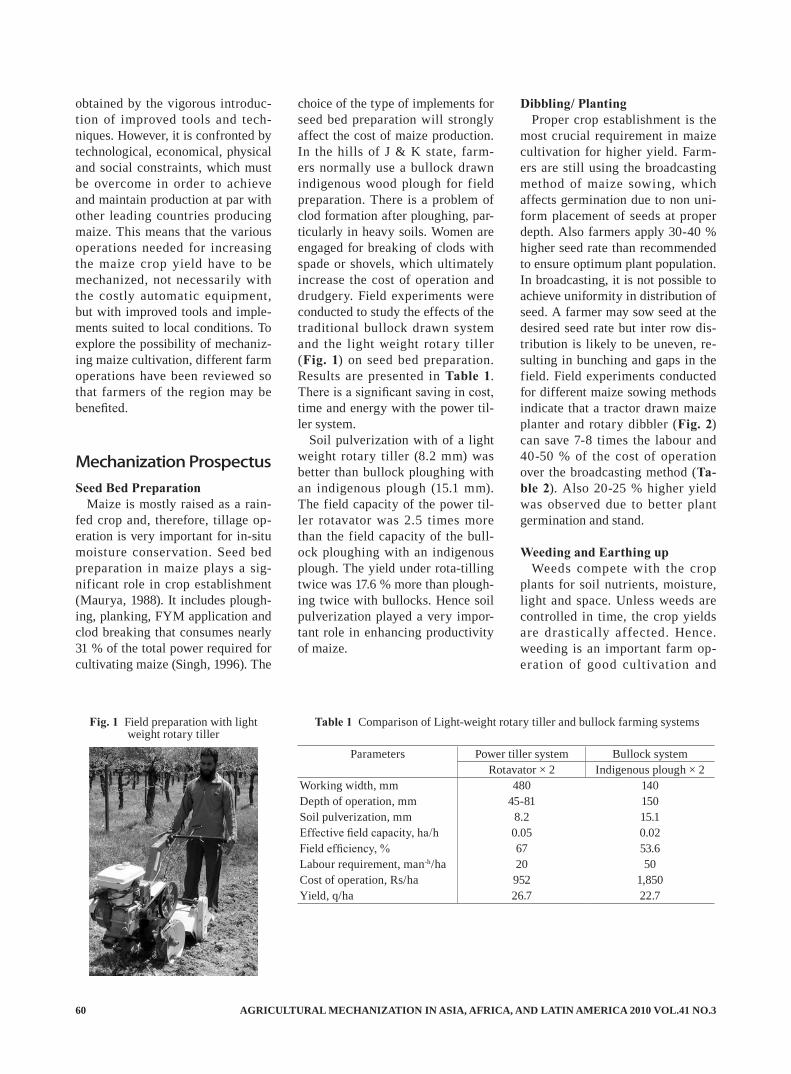
AGRICULTURAL MECHANIZATION IN ASIA, AFRICA, AND LATIN AMERICA 2010 VOL.41 NO.360
obtained by the vigorous introduc-tion of improved tools and tech-niques. However, it is confronted by technological, economical, physical and social constraints, which must be overcome in order to achieve and maintain production at par with other leading countries producing maize. This means that the various operations needed for increasing the maize crop yield have to be mechanized, not necessarily with the costly automatic equipment, but with improved tools and imple-ments suited to local conditions. To explore the possibility of mechaniz-ing maize cultivation, different farm operations have been reviewed so that farmers of the region may be benefited.
Mechanization ProspectusSeed Bed Preparation
Maize is mostly raised as a rain-fed crop and, therefore, tillage op-eration is very important for in-situ moisture conservation. Seed bed preparation in maize plays a sig-nificant role in crop establishment (Maurya, 1988). It includes plough-ing, planking, FYM application and clod breaking that consumes nearly 31 % of the total power required for cultivating maize (Singh, 1996). The
choice of the type of implements for seed bed preparation will strongly affect the cost of maize production. In the hills of J & K state, farm-ers normally use a bullock drawn indigenous wood plough for field preparation. There is a problem of clod formation after ploughing, par-ticularly in heavy soils. Women are engaged for breaking of clods with spade or shovels, which ultimately increase the cost of operation and drudgery. Field experiments were conducted to study the effects of the traditional bullock drawn system and the light weight rotary tiller (Fig. 1) on seed bed preparation. Results are presented in Table 1. There is a significant saving in cost, time and energy with the power til-ler system.
Soil pulverization with of a light weight rotary tiller (8.2 mm) was better than bullock ploughing with an indigenous plough (15.1 mm). The field capacity of the power til-ler rotavator was 2.5 times more than the field capacity of the bull-ock ploughing with an indigenous plough. The yield under rota-tilling twice was 17.6 % more than plough-ing twice with bullocks. Hence soil pulverization played a very impor-tant role in enhancing productivity of maize.
Dibbling/ PlantingProper crop establishment is the
most crucial requirement in maize cultivation for higher yield. Farm-ers are still using the broadcasting method of maize sowing, which affects germination due to non uni-form placement of seeds at proper depth. Also farmers apply 30-40 % higher seed rate than recommended to ensure optimum plant population. In broadcasting, it is not possible to achieve uniformity in distribution of seed. A farmer may sow seed at the desired seed rate but inter row dis-tribution is likely to be uneven, re-sulting in bunching and gaps in the field. Field experiments conducted for different maize sowing methods indicate that a tractor drawn maize planter and rotary dibbler (Fig. 2) can save 7-8 times the labour and 40-50 % of the cost of operation over the broadcasting method (Ta-ble 2). Also 20-25 % higher yield was observed due to better plant germination and stand.
Weeding and Earthing upWeeds compete with the crop
plants for soil nutrients, moisture, light and space. Unless weeds are controlled in time, the crop yields are drastically affected. Hence. weeding is an important farm op-eration of good cultivation and
Fig. 1 Field preparation with light weight rotary tiller
Parameters Power tiller system Bullock systemRotavator × 2 Indigenous plough × 2
Working width, mm 480 140Depth of operation, mm 45-81 150Soil pulverization, mm 8.2 15.1Effective field capacity, ha/h 0.05 0.02Field efficiency, % 67 53.6Labour requirement, man-h/ha 20 50Cost of operation, Rs/ha 952 1,850Yield, q/ha 26.7 22.7
Table 1 Comparison of Light-weight rotary tiller and bullock farming systems
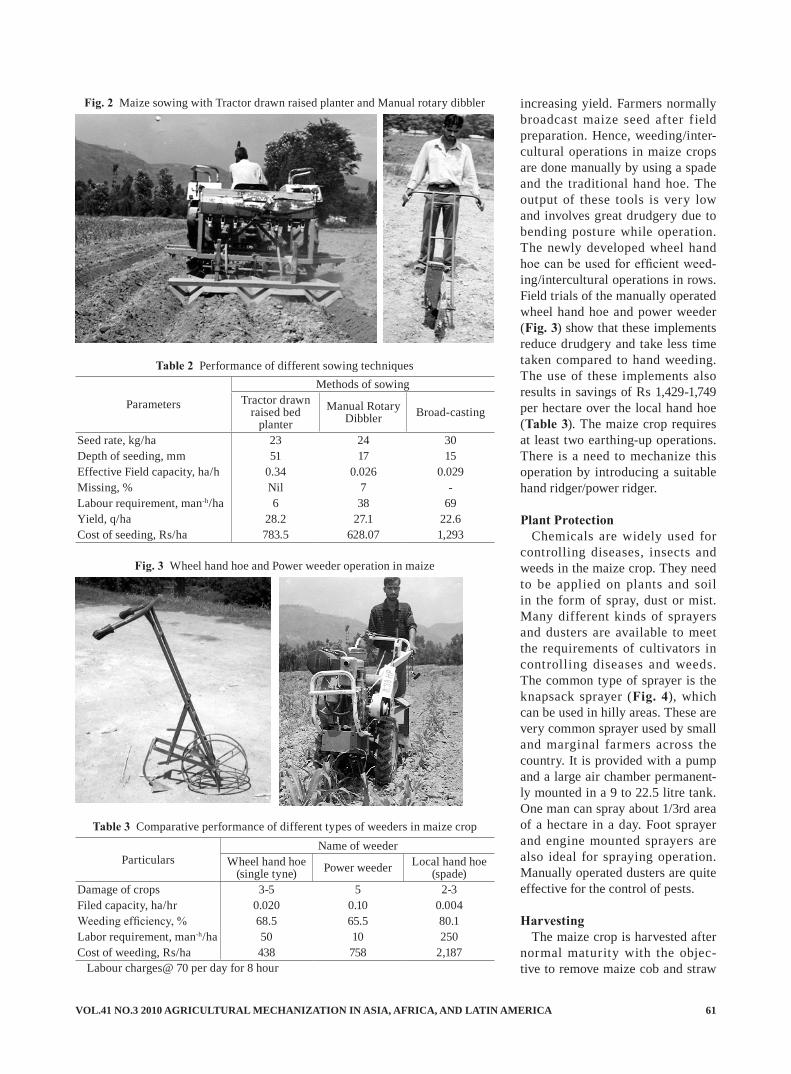
VOL.41 NO.3 2010 AGRICULTURAL MECHANIZATION IN ASIA, AFRICA, AND LATIN AMERICA 61
increasing yield. Farmers normally broadcast maize seed after f ield preparation. Hence, weeding/inter-cultural operations in maize crops are done manually by using a spade and the traditional hand hoe. The output of these tools is very low and involves great drudgery due to bending posture while operation. The newly developed wheel hand hoe can be used for efficient weed-ing/intercultural operations in rows. Field trials of the manually operated wheel hand hoe and power weeder (Fig. 3) show that these implements reduce drudgery and take less time taken compared to hand weeding. The use of these implements also results in savings of Rs 1,429-1,749 per hectare over the local hand hoe (Table 3). The maize crop requires at least two earthing-up operations. There is a need to mechanize this operation by introducing a suitable hand ridger/power ridger.
Plant ProtectionChemicals are widely used for
controlling diseases, insects and weeds in the maize crop. They need to be applied on plants and soil in the form of spray, dust or mist. Many different kinds of sprayers and dusters are available to meet the requirements of cultivators in controlling diseases and weeds. The common type of sprayer is the knapsack sprayer (Fig. 4), which can be used in hilly areas. These are very common sprayer used by small and marginal farmers across the country. It is provided with a pump and a large air chamber permanent-ly mounted in a 9 to 22.5 litre tank. One man can spray about 1/3rd area of a hectare in a day. Foot sprayer and engine mounted sprayers are also ideal for spraying operation. Manually operated dusters are quite effective for the control of pests.
HarvestingThe maize crop is harvested after
normal maturity with the objec-tive to remove maize cob and straw
Fig. 2 Maize sowing with Tractor drawn raised planter and Manual rotary dibbler
Parameters
Methods of sowingTractor drawn
raised bed planter
Manual Rotary Dibbler Broad-casting
Seed rate, kg/ha 23 24 30Depth of seeding, mm 51 17 15Effective Field capacity, ha/h 0.34 0.026 0.029Missing, % Nil 7 -Labour requirement, man-h/ha 6 38 69Yield, q/ha 28.2 27.1 22.6Cost of seeding, Rs/ha 783.5 628.07 1,293
Table 2 Performance of different sowing techniques
ParticularsName of weeder
Wheel hand hoe (single tyne) Power weeder Local hand hoe
(spade)Damage of crops 3-5 5 2-3Filed capacity, ha/hr 0.020 0.10 0.004Weeding efficiency, % 68.5 65.5 80.1Labor requirement, man-h/ha 50 10 250Cost of weeding, Rs/ha 438 758 2,187
Table 3 Comparative performance of different types of weeders in maize crop
Labour charges@ 70 per day for 8 hour
Fig. 3 Wheel hand hoe and Power weeder operation in maize
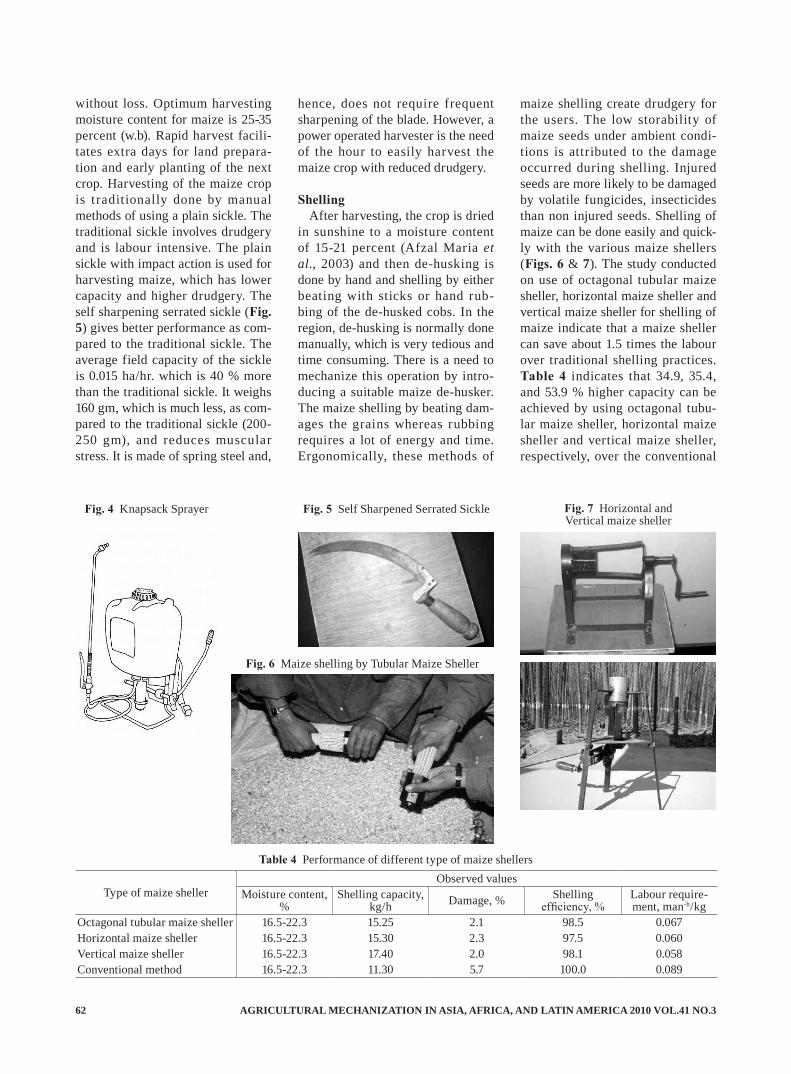
AGRICULTURAL MECHANIZATION IN ASIA, AFRICA, AND LATIN AMERICA 2010 VOL.41 NO.362
without loss. Optimum harvesting moisture content for maize is 25-35 percent (w.b). Rapid harvest facili-tates extra days for land prepara-tion and early planting of the next crop. Harvesting of the maize crop is traditionally done by manual methods of using a plain sickle. The traditional sickle involves drudgery and is labour intensive. The plain sickle with impact action is used for harvesting maize, which has lower capacity and higher drudgery. The self sharpening serrated sickle (Fig. 5) gives better performance as com-pared to the traditional sickle. The average field capacity of the sickle is 0.015 ha/hr. which is 40 % more than the traditional sickle. It weighs 160 gm, which is much less, as com-pared to the traditional sickle (200- 250 gm), and reduces muscular stress. It is made of spring steel and,
hence, does not require frequent sharpening of the blade. However, a power operated harvester is the need of the hour to easily harvest the maize crop with reduced drudgery.
ShellingAfter harvesting, the crop is dried
in sunshine to a moisture content of 15-21 percent (Afzal Maria et al., 2003) and then de-husking is done by hand and shelling by either beating with sticks or hand rub-bing of the de-husked cobs. In the region, de-husking is normally done manually, which is very tedious and time consuming. There is a need to mechanize this operation by intro-ducing a suitable maize de-husker. The maize shelling by beating dam-ages the grains whereas rubbing requires a lot of energy and time. Ergonomically, these methods of
maize shelling create drudgery for the users. The low storability of maize seeds under ambient condi-tions is attributed to the damage occurred during shelling. Injured seeds are more likely to be damaged by volatile fungicides, insecticides than non injured seeds. Shelling of maize can be done easily and quick-ly with the various maize shellers (Figs. 6 & 7). The study conducted on use of octagonal tubular maize sheller, horizontal maize sheller and vertical maize sheller for shelling of maize indicate that a maize sheller can save about 1.5 times the labour over traditional shelling practices. Table 4 indicates that 34.9, 35.4, and 53.9 % higher capacity can be achieved by using octagonal tubu-lar maize sheller, horizontal maize sheller and vertical maize sheller, respectively, over the conventional
Fig. 4 Knapsack Sprayer Fig. 5 Self Sharpened Serrated Sickle
Fig. 6 Maize shelling by Tubular Maize Sheller
Fig. 7 Horizontal and Vertical maize sheller
Type of maize shellerObserved values
Moisture content, %
Shelling capacity, kg/h Damage, % Shelling
efficiency, %Labour require-ment, man-h/kg
Octagonal tubular maize sheller 16.5-22.3 15.25 2.1 98.5 0.067Horizontal maize sheller 16.5-22.3 15.30 2.3 97.5 0.060Vertical maize sheller 16.5-22.3 17.40 2.0 98.1 0.058Conventional method 16.5-22.3 11.30 5.7 100.0 0.089
Table 4 Performance of different type of maize shellers

VOL.41 NO.3 2010 AGRICULTURAL MECHANIZATION IN ASIA, AFRICA, AND LATIN AMERICA 63
method. Also, grain damage is low-er in maize shelling by mechanical methods (2.1-2.3 %) in comparison to conventional method of shelling (5.7 %).
ConclusionThe mechanization of maize cul-
tivation in the region is still in its infancy, has tremendous potential and merits immediate attention. The opportunities are excellent for mechanizing the maize crop in the hills of Jammu and Kashmir state by adopting the improved tools and implements for different opera-tions suitable for the region, which can reduce the time, cost of opera-tion and drudgery over traditional methods. Research work in the development and dissemination of
engineering technologies for mecha-nization of the maize cultivation for the state can play a dominant role in augmenting and sustaining the maize production. Also, application of socioeconomic and human con-siderations in agricultural tools and machines play a very vital role and should be given due consideration in introduction of technology in order to achieve the development of hill agriculture.
REFERENCES
Anonymous. 2001. Digest of Stat-ics. Directorate of Economics and Statics Planning and Development Deptt. J & K Government.
Dixit , Jagvi r. 2005. Prototype feasibility testing of farm imple-ments and machinery in selected
regions of Jammu and Kashmir. ICAR adhoc project report. Divi-sion of Agricultural Engineering, SKUAST-K, Wadura (Kashmir), India. November, 2001 to July, 2005.
Afzal, Maria et al. 2003. Design, fabr ication and evaluation of maize cob shellers for hilly re-gions of J & K. Unpublished project report KITE polytechnic, Rangreth, Budgam (J & K).
Maurya, P. R. 1988. Comparison of tillage and conventional tillage under different soils and climatic condit ions in Niger ia. AMA. 19(2): 30-32.
Vatsa, D. K. and S. P. Singh. 1996. Effect of various sowing tech-niques under hilly conditions. Journal of Hill Research. 9(2): 2 55-261.
■■
NEWSCIGR International Symposium
"Sustainable Bioproduction - Water, Energy, and Food"19-23 September, 2011
Tokyo, JAPAN http://www.cigr2011.org/
Sponsored by SCJ, JAICABE & CIGR
About The SymposiumThe 2011 CIGR International Symposium on "Sustainable Bioproduction - Water, Energy,
and Food", September 19-23, 2011 Tower Hall Funabori, Tokyo, JAPAN will bring together researchers and professionals interested in new ideas, engineering, and technologies used in sustainable bioproduction systems. Attendees will be able to share ideas, theories, techniques, challenges, and concerns with peers and expand their professional networks worldwide. They will also have the opportunity to attend many joint activities. The symposium is opened to researchers and engineers from all over the world as well as general publics those who are in-terested in the global issues with water, energy, and food.
AGRICULTURAL MECHANIZATION IN ASIA, AFRICA, AND LATIN AMERICA 2010 VOL.41 NO.364
by
Murshed AlamProfessor Department of farm Power &Machinery Bangladesh Agricultural [email protected]
AbstractMore than 5 million Lever Op-
erated Knapsack (LOK) Sprayers are sold annually in the world and most of them are sold in Southeast Asia. A research was conducted to find the variability of performance of LOK sprayer. Different sources contributing to variability in spray-ing from a LOK sprayer were in-vestigated in the laboratory and in field conditions. The pressure and discharge was recorded by a digital pressure gauge and a flow meter, re-spectively, and varied in every sec-ond. An experiment was conducted in the field using three video cam-eras, which were placed in the front, top and side of the sprayers during operation for finding the variation in spray swaths, nozzle heights, and movement of grip, lance and nozzle, and the potential consequences. The performance of LOK sprayers were poor due to variation of parameters such as spraying pressure (CV = 20 %), f low rate (CV = 11 %), nozzle heights (CV = 60 %), forward speed of the operators (CV = 28 %), and application rate of active ingredi-ent. Thus, the spraying pressure, discharge, swath, spray angle and spray coverage of LOK sprayer var-ied significantly and all of the above factors influenced an uneven spray
Daulat HussainProfessorDepartment of farm Power &Machinery Bangladesh Agricultural [email protected]
Variability of the Performance ofLever Operated Knapsack Sprayer
distribution, off-target deposition, and drift.
IntroductionPesticides are being used for
protecting crops in most develop-ing countries due to continuous in-creasing demands for quantity and quality of rice. These pesticides are mostly being applied using Lever Operated Knapsack (LOK) sprayers (FAO, 1994; Thornhill, 1992; Gite, 1992; Litsinger et al., 1980; Prasadja and Ruhendi, 1980; Ooi et al., 1983). More than 5 million hand operated sprayers are sold annually in the world and most of them are sold in Southeast Asia, (Matthews, 1992). The quality of a number of these sprayers, and their ability to be used to apply pesticides accurately and efficiently is of great concern due to their design and operation. The majority of the sprayers performed poorly, indicating that they are poor-ly designed with poor materials and mishandled by the farmers, (Mamat and Omar, 1992). It was estimated that about 50-80 % of applied pes-ticides wasted due to poor spray machinery and inappropriate appli-cation methods (Khan et al., 1997; and Heong et al., 1997). The vari-ability in pumping causes a variable
amount of spraying and droplet size. The stroke length can vary from time to time and from operator to operator. The forced applied on the lever can also vary, which influenc-es spray output, swath and droplet size. Pressures can reach as much as 3 to 5 bar (McAuliffe, 1999) during lever operation and this can result in a high percentage of fine droplets. These fine droplets are less likely to penetrate the crop canopy and increase exposure to the worker. The lever strokes per minute have a great influence on spraying quality, coverage and can vary from time to time. A constant f low rate is con-sidered as ±1.5 % of the actual flow rate (McAuliffe, 1999) and ensures accurate application of chemicals, uniform dosages and coverage, and the best biological performance of the applied chemicals. Optimum and constant pressure provides bet-ter spray droplet spectrums and less drift and non-target deposition. According to Matthews (1992) and IRRI (1992), the suggested required spraying pressure for insecticides and herbicide is 3 bars and 1 bar, respectively. To achieve the maxi-mum recommended flow rates and operating pressure, the pump should be operated within the suggested ranges. The recommended lever strokes per minute for most LOKs
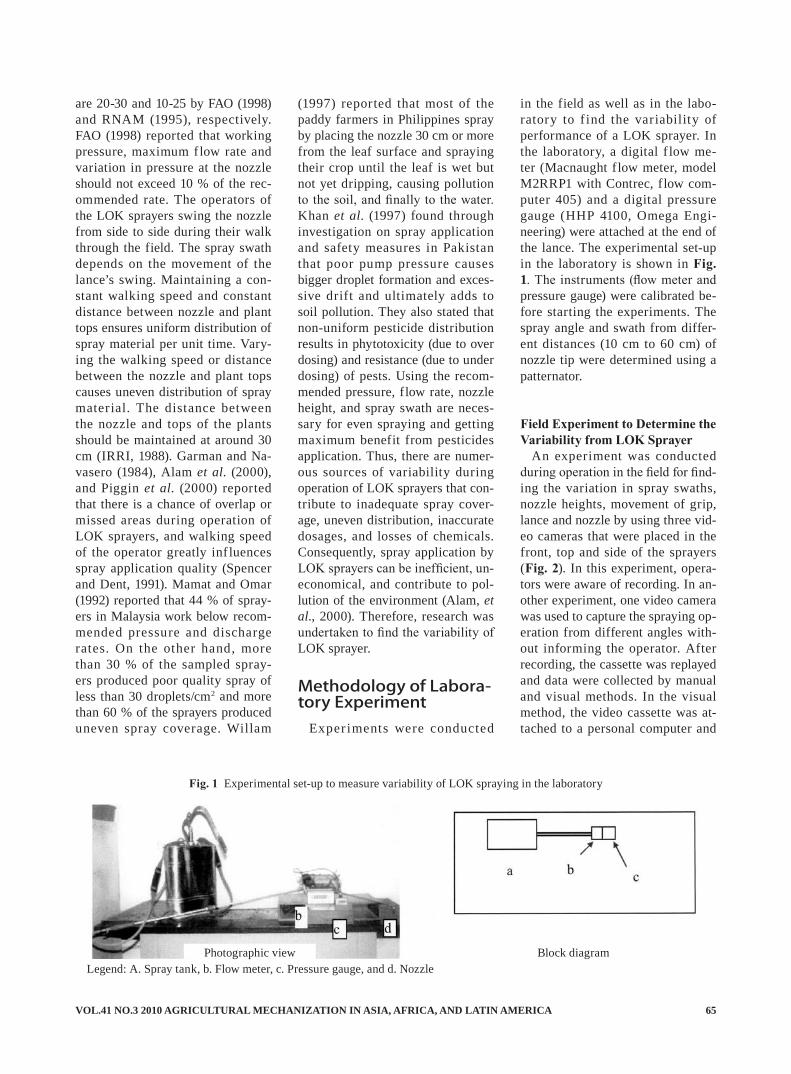
VOL.41 NO.3 2010 AGRICULTURAL MECHANIZATION IN ASIA, AFRICA, AND LATIN AMERICA 65
are 20-30 and 10-25 by FAO (1998) and RNAM (1995), respectively. FAO (1998) reported that working pressure, maximum flow rate and variation in pressure at the nozzle should not exceed 10 % of the rec-ommended rate. The operators of the LOK sprayers swing the nozzle from side to side during their walk through the field. The spray swath depends on the movement of the lance’s swing. Maintaining a con-stant walking speed and constant distance between nozzle and plant tops ensures uniform distribution of spray material per unit time. Vary-ing the walking speed or distance between the nozzle and plant tops causes uneven distribution of spray material. The distance between the nozzle and tops of the plants should be maintained at around 30 cm (IRRI, 1988). Garman and Na-vasero (1984), Alam et al. (2000), and Piggin et al. (2000) reported that there is a chance of overlap or missed areas during operation of LOK sprayers, and walking speed of the operator greatly inf luences spray application quality (Spencer and Dent, 1991). Mamat and Omar (1992) reported that 44 % of spray-ers in Malaysia work below recom-mended pressure and discharge rates. On the other hand, more than 30 % of the sampled spray-ers produced poor quality spray of less than 30 droplets/cm2 and more than 60 % of the sprayers produced uneven spray coverage. Willam
(1997) reported that most of the paddy farmers in Philippines spray by placing the nozzle 30 cm or more from the leaf surface and spraying their crop until the leaf is wet but not yet dripping, causing pollution to the soil, and finally to the water. Khan et al. (1997) found through investigation on spray application and safety measures in Pakistan that poor pump pressure causes bigger droplet formation and exces-sive drift and ultimately adds to soil pollution. They also stated that non-uniform pesticide distribution results in phytotoxicity (due to over dosing) and resistance (due to under dosing) of pests. Using the recom-mended pressure, flow rate, nozzle height, and spray swath are neces-sary for even spraying and getting maximum benefit from pesticides application. Thus, there are numer-ous sources of variability during operation of LOK sprayers that con-tribute to inadequate spray cover-age, uneven distribution, inaccurate dosages, and losses of chemicals. Consequently, spray application by LOK sprayers can be inefficient, un-economical, and contribute to pol-lution of the environment (Alam, et al., 2000). Therefore, research was undertaken to find the variability of LOK sprayer.
Methodology of Labora-tory Experiment
Exper iments were conducted
in the field as well as in the labo-ratory to f ind the variability of performance of a LOK sprayer. In the laboratory, a digital f low me-ter (Macnaught f low meter, model M2RRP1 with Contrec, flow com-puter 405) and a digital pressure gauge (HHP 4100, Omega Engi-neering) were attached at the end of the lance. The experimental set-up in the laboratory is shown in Fig. 1. The instruments (flow meter and pressure gauge) were calibrated be-fore starting the experiments. The spray angle and swath from differ-ent distances (10 cm to 60 cm) of nozzle tip were determined using a patternator.
Field Experiment to Determine the Variability from LOK Sprayer
An experiment was conducted during operation in the field for find-ing the variation in spray swaths, nozzle heights, movement of grip, lance and nozzle by using three vid-eo cameras that were placed in the front, top and side of the sprayers (Fig. 2). In this experiment, opera-tors were aware of recording. In an-other experiment, one video camera was used to capture the spraying op-eration from different angles with-out informing the operator. After recording, the cassette was replayed and data were collected by manual and visual methods. In the visual method, the video cassette was at-tached to a personal computer and
Fig. 1 Experimental set-up to measure variability of LOK spraying in the laboratory
Legend: A. Spray tank, b. Flow meter, c. Pressure gauge, and d. NozzlePhotographic view Block diagram
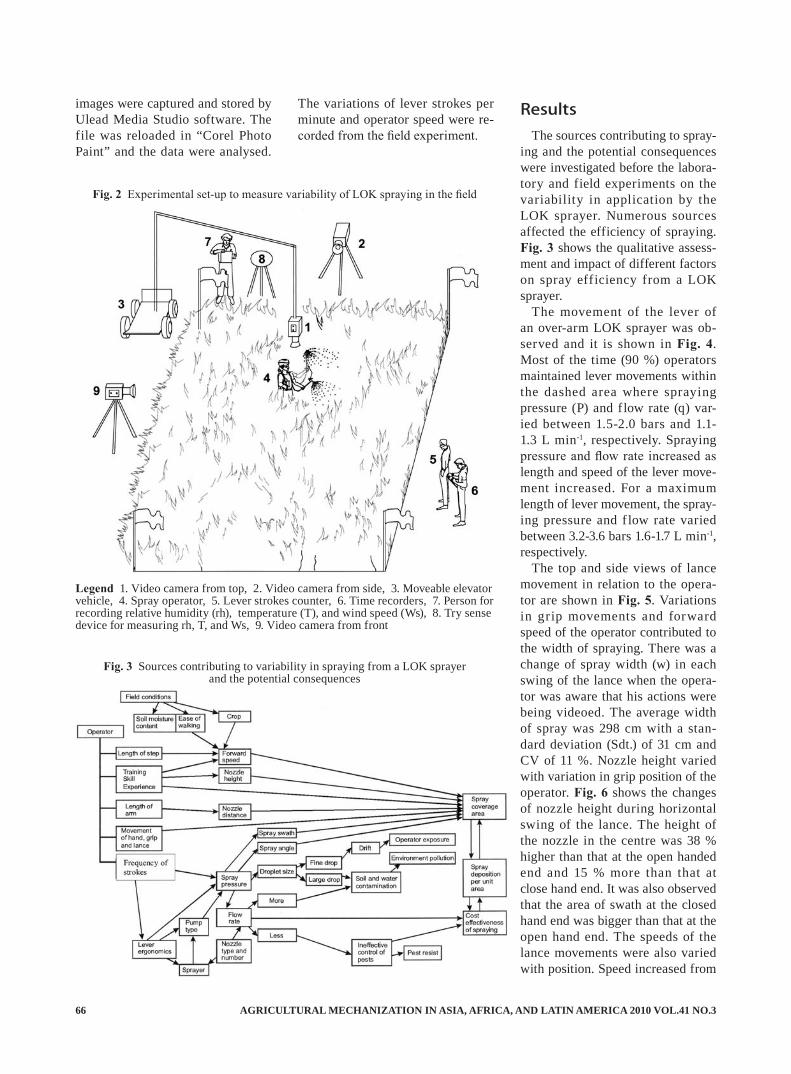
AGRICULTURAL MECHANIZATION IN ASIA, AFRICA, AND LATIN AMERICA 2010 VOL.41 NO.366
images were captured and stored by Ulead Media Studio software. The file was reloaded in “Corel Photo Paint” and the data were analysed.
The variations of lever strokes per minute and operator speed were re-corded from the field experiment.
ResultsThe sources contributing to spray-
ing and the potential consequences were investigated before the labora-tory and field experiments on the variability in application by the LOK sprayer. Numerous sources affected the efficiency of spraying. Fig. 3 shows the qualitative assess-ment and impact of different factors on spray efficiency from a LOK sprayer.
The movement of the lever of an over-arm LOK sprayer was ob-served and it is shown in Fig. 4. Most of the time (90 %) operators maintained lever movements within the dashed area where spraying pressure (P) and flow rate (q) var-ied between 1.5-2.0 bars and 1.1-1.3 L min-1, respectively. Spraying pressure and flow rate increased as length and speed of the lever move-ment increased. For a maximum length of lever movement, the spray-ing pressure and f low rate varied between 3.2-3.6 bars 1.6-1.7 L min-1, respectively.
The top and side views of lance movement in relation to the opera-tor are shown in Fig. 5. Variations in grip movements and forward speed of the operator contributed to the width of spraying. There was a change of spray width (w) in each swing of the lance when the opera-tor was aware that his actions were being videoed. The average width of spray was 298 cm with a stan-dard deviation (Sdt.) of 31 cm and CV of 11 %. Nozzle height varied with variation in grip position of the operator. Fig. 6 shows the changes of nozzle height during horizontal swing of the lance. The height of the nozzle in the centre was 38 % higher than that at the open handed end and 15 % more than that at close hand end. It was also observed that the area of swath at the closed hand end was bigger than that at the open hand end. The speeds of the lance movements were also varied with position. Speed increased from
Legend 1. Video camera from top, 2. Video camera from side, 3. Moveable elevator vehicle, 4. Spray operator, 5. Lever strokes counter, 6. Time recorders, 7. Person for recording relative humidity (rh), temperature (T), and wind speed (Ws), 8. Try sense device for measuring rh, T, and Ws, 9. Video camera from front
Fig. 2 Experimental set-up to measure variability of LOK spraying in the field
Fig. 3 Sources contributing to variability in spraying from a LOK sprayer and the potential consequences
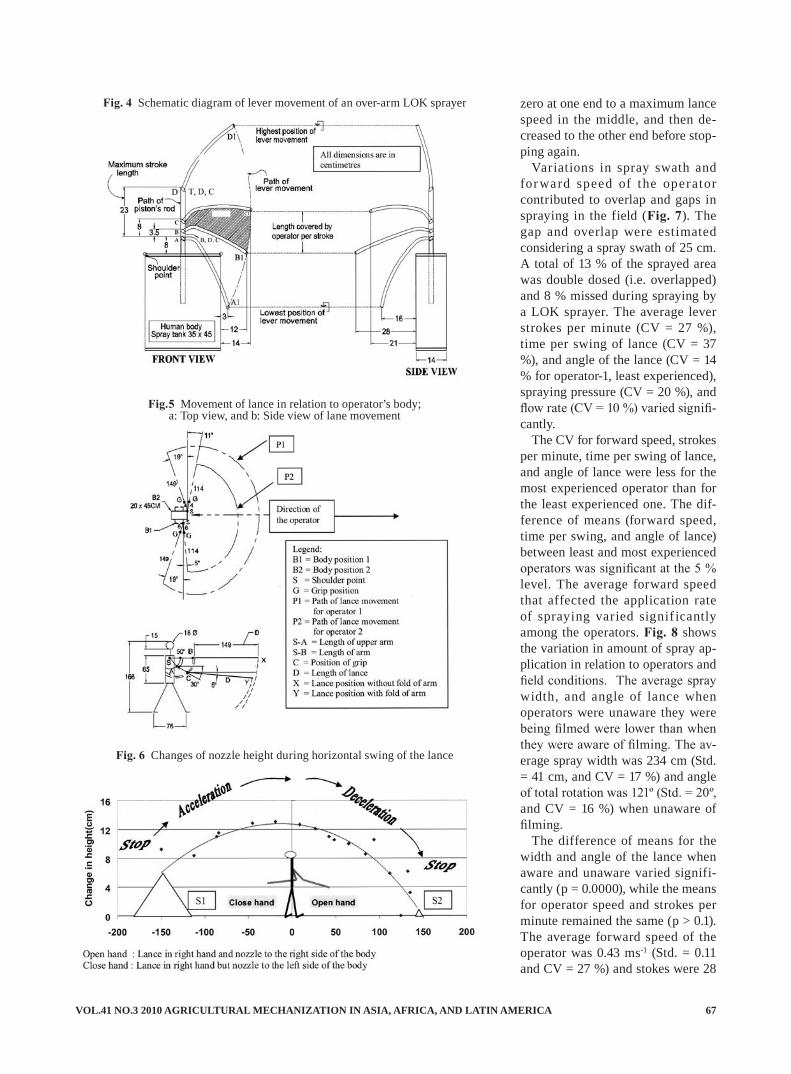
VOL.41 NO.3 2010 AGRICULTURAL MECHANIZATION IN ASIA, AFRICA, AND LATIN AMERICA 67
zero at one end to a maximum lance speed in the middle, and then de-creased to the other end before stop-ping again.
Variations in spray swath and for ward speed of the operator contributed to overlap and gaps in spraying in the field (Fig. 7). The gap and overlap were estimated considering a spray swath of 25 cm. A total of 13 % of the sprayed area was double dosed (i.e. overlapped) and 8 % missed during spraying by a LOK sprayer. The average lever strokes per minute (CV = 27 %), time per swing of lance (CV = 37 %), and angle of the lance (CV = 14 % for operator-1, least experienced), spraying pressure (CV = 20 %), and flow rate (CV = 10 %) varied signifi-cantly.
The CV for forward speed, strokes per minute, time per swing of lance, and angle of lance were less for the most experienced operator than for the least experienced one. The dif-ference of means (forward speed, time per swing, and angle of lance) between least and most experienced operators was significant at the 5 % level. The average forward speed that affected the application rate of spraying varied signif icantly among the operators. Fig. 8 shows the variation in amount of spray ap-plication in relation to operators and field conditions. The average spray width, and angle of lance when operators were unaware they were being filmed were lower than when they were aware of filming. The av-erage spray width was 234 cm (Std. = 41 cm, and CV = 17 %) and angle of total rotation was 121º (Std. = 20º, and CV = 16 %) when unaware of filming.
The difference of means for the width and angle of the lance when aware and unaware varied signifi-cantly (p = 0.0000), while the means for operator speed and strokes per minute remained the same (p > 0.1). The average forward speed of the operator was 0.43 ms-1 (Std. = 0.11 and CV = 27 %) and stokes were 28
Fig. 4 Schematic diagram of lever movement of an over-arm LOK sprayer
Fig.5 Movement of lance in relation to operator’s body; a: Top view, and b: Side view of lane movement
Fig. 6 Changes of nozzle height during horizontal swing of the lance
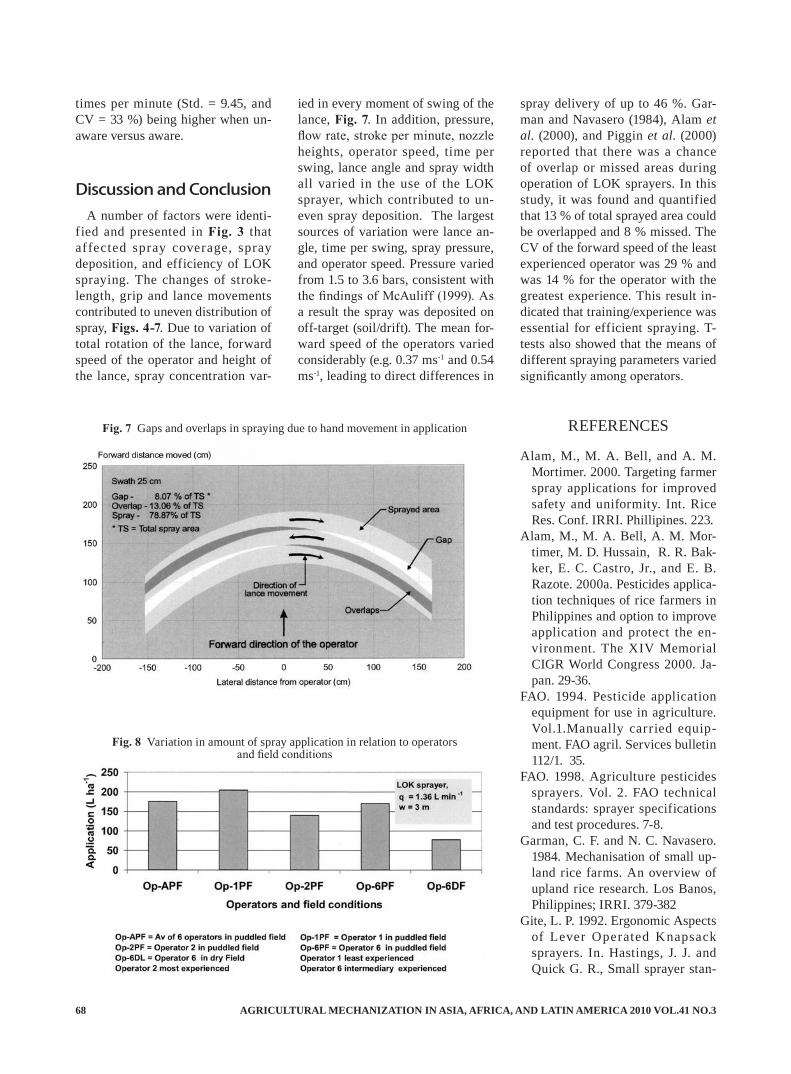
AGRICULTURAL MECHANIZATION IN ASIA, AFRICA, AND LATIN AMERICA 2010 VOL.41 NO.368
times per minute (Std. = 9.45, and CV = 33 %) being higher when un-aware versus aware.
Discussion and ConclusionA number of factors were identi-
fied and presented in Fig. 3 that affected spray coverage, spray deposition, and efficiency of LOK spraying. The changes of stroke-length, grip and lance movements contributed to uneven distribution of spray, Figs. 4-7. Due to variation of total rotation of the lance, forward speed of the operator and height of the lance, spray concentration var-
ied in every moment of swing of the lance, Fig. 7. In addition, pressure, flow rate, stroke per minute, nozzle heights, operator speed, time per swing, lance angle and spray width all varied in the use of the LOK sprayer, which contributed to un-even spray deposition. The largest sources of variation were lance an-gle, time per swing, spray pressure, and operator speed. Pressure varied from 1.5 to 3.6 bars, consistent with the findings of McAuliff (1999). As a result the spray was deposited on off-target (soil/drift). The mean for-ward speed of the operators varied considerably (e.g. 0.37 ms-1 and 0.54 ms-1, leading to direct differences in
spray delivery of up to 46 %. Gar-man and Navasero (1984), Alam et al. (2000), and Piggin et al. (2000) reported that there was a chance of overlap or missed areas during operation of LOK sprayers. In this study, it was found and quantified that 13 % of total sprayed area could be overlapped and 8 % missed. The CV of the forward speed of the least experienced operator was 29 % and was 14 % for the operator with the greatest experience. This result in-dicated that training/experience was essential for efficient spraying. T-tests also showed that the means of different spraying parameters varied significantly among operators.
REFERENCES
Alam, M., M. A. Bell, and A. M. Mortimer. 2000. Targeting farmer spray applications for improved safety and uniformity. Int. Rice Res. Conf. IRRI. Phillipines. 223.
Alam, M., M. A. Bell, A. M. Mor-timer, M. D. Hussain, R. R. Bak-ker, E. C. Castro, Jr., and E. B. Razote. 2000a. Pesticides applica-tion techniques of rice farmers in Philippines and option to improve application and protect the en-vironment. The XIV Memorial CIGR World Congress 2000. Ja-pan. 29-36.
FAO. 1994. Pesticide application equipment for use in agriculture. Vol.1.Manually carried equip-ment. FAO agril. Services bulletin 112/1. 35.
FAO. 1998. Agriculture pesticides sprayers. Vol. 2. FAO technical standards: sprayer specifications and test procedures. 7-8.
Garman, C. F. and N. C. Navasero. 1984. Mechanisation of small up-land rice farms. An overview of upland rice research. Los Banos, Philippines; IRRI. 379-382
Gite, L. P. 1992. Ergonomic Aspects of Lever Operated Knapsack sprayers. In. Hastings, J. J. and Quick G. R., Small sprayer stan-
Fig. 7 Gaps and overlaps in spraying due to hand movement in application
Fig. 8 Variation in amount of spray application in relation to operators and field conditions
VOL.41 NO.3 2010 AGRICULTURAL MECHANIZATION IN ASIA, AFRICA, AND LATIN AMERICA 69
dards, safety and future direction for Asia, IRRI. 25.
Heong, K. L. and M. M. Escalada. 1997. A comparative analysis of Pest management practices of rice farmers in Asia. In: Heong, K. L. and M.M. Escalada, editors. Pest management of rice farmers in Asia. IRRI, Los Banos. 227.
IRRI. 1992. Development of a set of minimum standard specifications for Lever Operated Knapsack sprayers. In. Hastings, J. J and Quick G. R, editors. Small sprayer standards, safety and future direc-tion for Asia, IRRI. 98.
IRRI. 1988. Operating a Knapsak sprayer, RP3-18. Rice production Skills Development series. 9
Khan, A. S., R. Rafiq, A. Nadeem, and A. Hameed. 1997. Application technology for agro-chemicals in Pakistan. In. Salokhe, V. M., editor. Proceedings of the inter-national workshop on safe and eff icient application of agro-chemicals and bio-products in south and Southeast Asia, Bang-kok, Thailand. 79-101.
Litsinger, J. A, E. C. Price, and R. T. Herrera. 1980. Small farmer pest control practises for rainfed rice, corn, and grain legumes in three Philippines provinces. Philippine Entomologist, 4: 65-86.
Mamat, J. M. and D. Omar. 1992. Country report: Malaysia. Status of small sprayers usage’s, Features and standard in Malaysia. In. Hastings, JJ and Quick GR, Small sprayer standards, safety and fu-ture direction for Asia, IRRI. 146.
Matthews, G. A. 1992. Small spray-ers development, standards and safety. In Hastings, J. J. and Quick G. R. Editor. Small sprayer stan-dards, safety and future direction for Asia, IRRI. Los Banos (Phil-ippines), IRRI. 3
McAuliffe, D. 1999. Flow control of lever operated knapsack sprayers with Cfvalve. International pest control 4(1): 21-23.
Meek, C. 2000. Constant flow pres-sure regulator test. Personal con-tact.
Ooi, A. C. P., K. L. Heong, B. K. Lim, and S. Mazlan. 1983. Adop-tion of pesticide application tech-nology by small-scale farmers in Peninsular Malaysia. Pesticide application technology. Proceed-ings of the Seminar, 16 November 1982, Serdang, Malaysia. 148-158.
Piggin, C. M., C. O. Garcia, J. D. Janiya, M. A. Bell, C. E. Rizote, and J. Hill. 2000. Establishment of irrigated rice under zero and conventional tillage systems in the Philippines. Int. Rice Res. Conf.
93.Prasadja, I. and Ruhendi. 1980.
Farmers’ existing technology and pest control practices for food crops at three locations in Jogja-karta Province. (Bogor, Indone-sia : Agency for Agric. Res. and development, centre res. Inst. for Agric.). 59.
RNAM. 1995. Regional network for Agricultural Machinery. RNAM test codes and procedures for Farm Machinery. 171.
Spencer, J. and D. R. Dent. 1991. Walking speed as a variable in knapsack sprayer operation: per-ception of speed and the effect of training. Trop-Pest-Manage 37(4): 321-323.
Thornhill, E. W. 1992. Some views on side lever Knapsack sprayers. In. Hastings, J. J and G. R. Quick, editors. Small sprayer standards, safety and future direction for Asia, IRRI. 65.
Willam, R. 1997. Application tech-nology for agro-chemicals in Ma-laysia. In. V. M. Salokhe, editor. Proceedings of the Int. Workshop. Safe and efficient application of agro chemicals and bio-products in South and Southeast Asia. AIT, Bangkok. 65-72.
■■
AGRICULTURAL MECHANIZATION IN ASIA, AFRICA, AND LATIN AMERICA 2010 VOL.41 NO.370
byT. Z. FoudaAssociate ProfessorAgricultural Engineering,Factory of AgriculturalTanta UniversityEGYPT
AbstractA compost t u r n ing machine
performance in terms of machine capacity, compost density, fuel con-sumption, energy requirements and turning cost was investigated as a function of change in the kinematic parameter (ratio of drum peripheral velocity to machine forward speed) during the compost turning opera-tion.
From the obtained data it was concluded that:· Machine capacity increased by de-
creasing the kinematic parameter.· Compost density decreased by in-
creasing the kinematic parameter.· Energy requirements, as well as
turning cost, were minimum at a kinematic parameter of 35.
IntroductionMechanization of compost turn-
ing operation is considered of great importance to reduce time period to maturity, labor and cost. Different types of turning machines are avail-able in compost fields nowadays. Among these is the self-propelled compost turning machine.
The major concerns with the compost turning operation is to mix compost materials, rebuild the
Optimizing Kinematic Parameters for CompostTurning Machine for Mininmum Energy Requirememts
porosity of the compost and release trapped heat, water vapor and gas-ses. This exposes all mater ials equally to the air at the outer sur-face. The compost turning machine performs complex motions. For example, a translatory motion with the machine and relative motion due to the positive drive of the turning drum. El shal and Morad (1991) stated that the combine header per-formance during the harvesting of standing and lodging rice have a reel kinematic parameter of 1.2 and 1.5 for standing and lodging rice, re-spectively, which are considered the optimum values for minimizing the header losses. Morad and El Shazly (1994) stated that the adjustment of a rotary plow kinematic parameter improved tillage performance. They also showed that a rotary plow kine-matic parameter of 2-2 minimized energy requirements and improved tillage efficiency.
Morad (1995) stated that the proper adjustment of the kinematic parameter for a rotary mower dur-ing the mowing operation is of great importance to increase crop yield and decrease cost requirements. Decreasing the rotary mower ki-nematic parameter increased field capacity and cutting height, while field efficiency, cutting efficiency, fuel consumption and energy re-
quirements decreased. A rotary mower kinematic parameter of 25 minimized the mowing cost.
Mohamed, et al. (1999) showed that, the higher values of a harvest-ing machine kinematic parameter are more effective in lifting lentil plants and laying them back on to the cutter bar. To avoid the shack-ing action of the mower cutter bar, increasing kinematic parameter values from 1.33 to 2 increased grain losses from 5.9 to 8 %. It was recommended that the lentil crop be harvested using the self-propelled harvesting machine at a reel kine-matic parameter of 1.33.
Abd El-Mottaleb (2006) showed that, increasing machine forward speed from 200 to 600 m/h, mea-sured at rotor speeds of 80, 160 and 240 rpm, increased fuel consump-tion from 14.9 to 19.1 (26 %), the power from 14.9 to 23.2 (26.9 %) and the energy requirements from 12.40 to 21.50 and (28.10 %) when the self propelled turning machine was used.
Fouda et al. (2008) showed that increasing the compost turning ma-chine forward speed from 1,200 to 1,500 m/h increased fuel consump-tion from 7.5 to 10.0 lit/h. Data have shown that increasing machine for-ward speed from 1,500 to 2,000 m/h increased the required power from
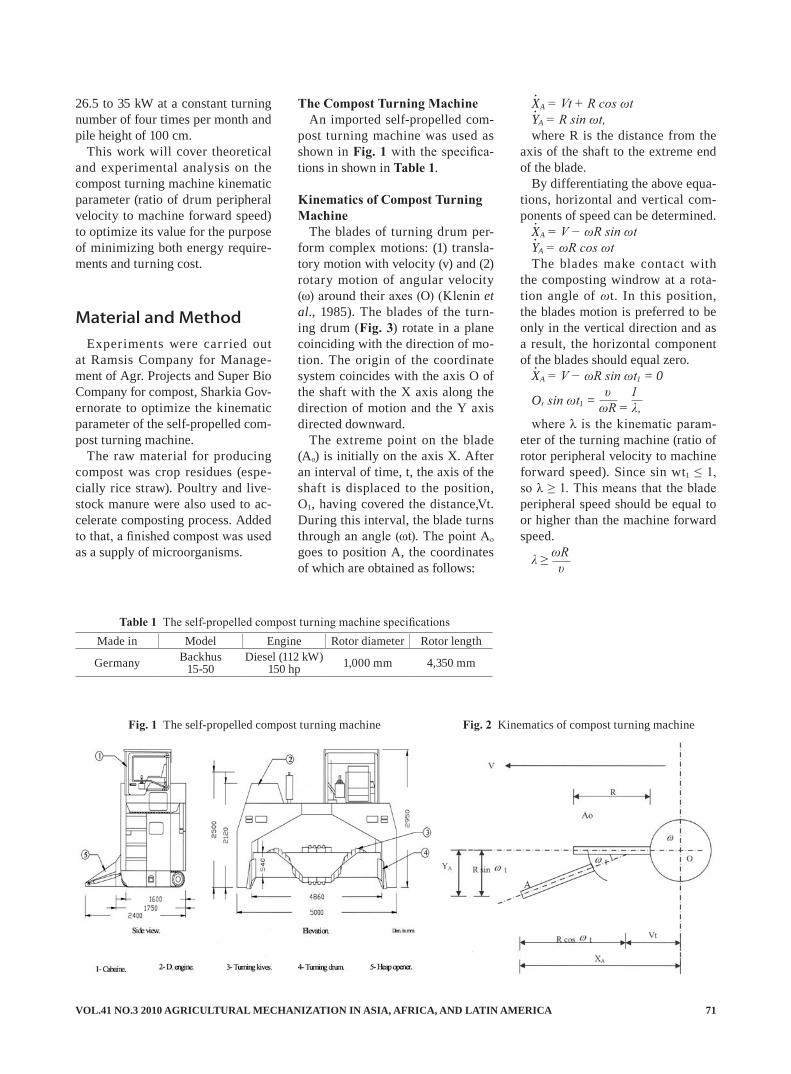
VOL.41 NO.3 2010 AGRICULTURAL MECHANIZATION IN ASIA, AFRICA, AND LATIN AMERICA 71
26.5 to 35 kW at a constant turning number of four times per month and pile height of 100 cm.
This work will cover theoretical and experimental analysis on the compost turning machine kinematic parameter (ratio of drum peripheral velocity to machine forward speed) to optimize its value for the purpose of minimizing both energy require-ments and turning cost.
Material and MethodExperiments were carried out
at Ramsis Company for Manage-ment of Agr. Projects and Super Bio Company for compost, Sharkia Gov-ernorate to optimize the kinematic parameter of the self-propelled com-post turning machine.
The raw material for producing compost was crop residues (espe-cially rice straw). Poultry and live-stock manure were also used to ac-celerate composting process. Added to that, a finished compost was used as a supply of microorganisms.
The Compost Turning Machine An imported self-propelled com-
post turning machine was used as shown in Fig. 1 with the specifica-tions in shown in Table 1.
Kinematics of Compost Turning Machine
The blades of turning drum per-form complex motions: (1) transla-tory motion with velocity (v) and (2) rotary motion of angular velocity (ω) around their axes (O) (Klenin et al., 1985). The blades of the turn-ing drum (Fig. 3) rotate in a plane coinciding with the direction of mo-tion. The origin of the coordinate system coincides with the axis O of the shaft with the X axis along the direction of motion and the Y axis directed downward.
The extreme point on the blade (Ao) is initially on the axis X. After an interval of time, t, the axis of the shaft is displaced to the position, O1, having covered the distance,Vt. During this interval, the blade turns through an angle (ωt). The point Ao goes to position A, the coordinates of which are obtained as follows:
X4
A = Vt + R cos ωtY4
A = R sin ωt,where R is the distance from the
axis of the shaft to the extreme end of the blade.
By differentiating the above equa-tions, horizontal and vertical com-ponents of speed can be determined.
X4
A = V − ωR sin ωtY4
A = ωR cos ωtThe blades make contact with
the composting windrow at a rota-tion angle of ωt. In this position, the blades motion is preferred to be only in the vertical direction and as a result, the horizontal component of the blades should equal zero.
X4
A = V − ωR sin ωt1 = 0 υ 1Or sin ωt1 = ωR = λ,where λ is the kinematic param-
eter of the turning machine (ratio of rotor peripheral velocity to machine forward speed). Since sin wt1 ≤ 1, so λ ≥ 1. This means that the blade peripheral speed should be equal to or higher than the machine forward speed.
λ ≥ ωR υ
Made in Model Engine Rotor diameter Rotor length
Germany Backhus15-50
Diesel (112 kW) 150 hp 1,000 mm 4,350 mm
Table 1 The self-propelled compost turning machine specifications
Fig. 1 The self-propelled compost turning machine Fig. 2 Kinematics of compost turning machine
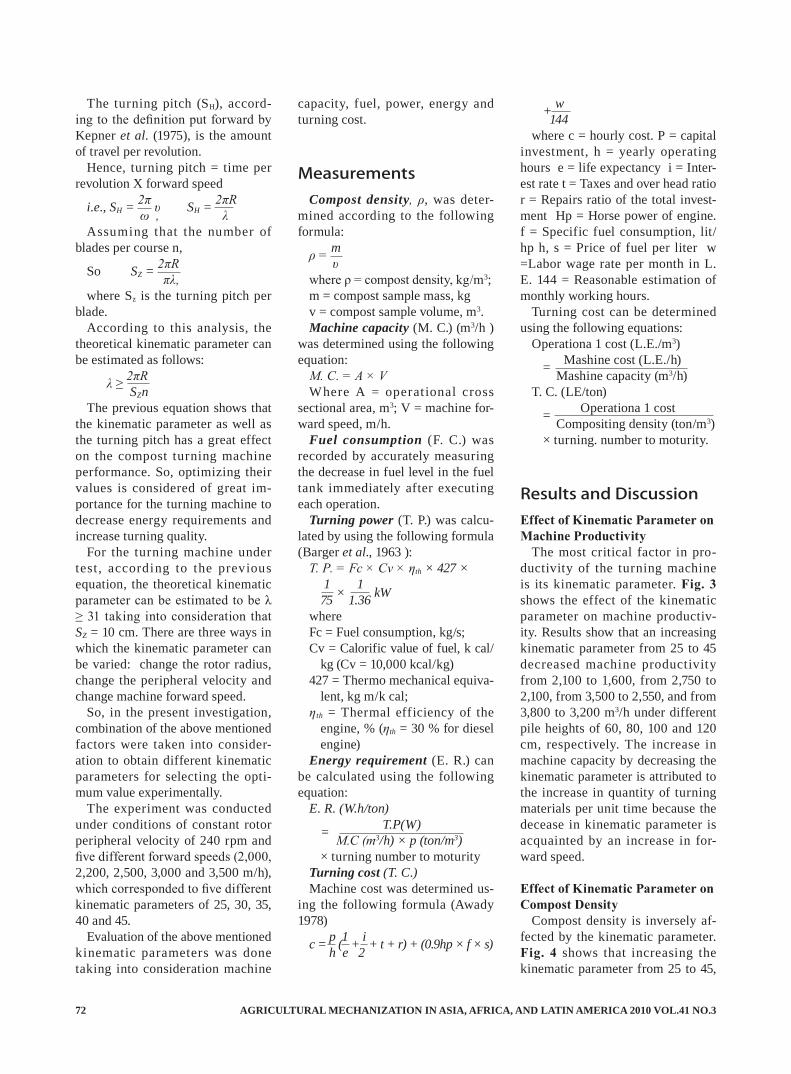
AGRICULTURAL MECHANIZATION IN ASIA, AFRICA, AND LATIN AMERICA 2010 VOL.41 NO.372
The turning pitch (SH), accord-ing to the definition put forward by Kepner et al. (1975), is the amount of travel per revolution.
Hence, turning pitch = time per revolution X forward speed
i.e., SH = 2π υ SH = 2πR ω , λAssuming that the number of
blades per course n,
So SZ = 2πR
πλ,where Sz is the turning pitch per
blade.According to this analysis, the
theoretical kinematic parameter can be estimated as follows:
λ ≥ 2πR SZnThe previous equation shows that
the kinematic parameter as well as the turning pitch has a great effect on the compost turning machine performance. So, optimizing their values is considered of great im-portance for the turning machine to decrease energy requirements and increase turning quality.
For the turning machine under test , according to the previous equation, the theoretical kinematic parameter can be estimated to be λ ≥ 31 taking into consideration that SZ = 10 cm. There are three ways in which the kinematic parameter can be varied: change the rotor radius, change the peripheral velocity and change machine forward speed.
So, in the present investigation, combination of the above mentioned factors were taken into consider-ation to obtain different kinematic parameters for selecting the opti-mum value experimentally.
The experiment was conducted under conditions of constant rotor peripheral velocity of 240 rpm and five different forward speeds (2,000, 2,200, 2,500, 3,000 and 3,500 m/h), which corresponded to five different kinematic parameters of 25, 30, 35, 40 and 45.
Evaluation of the above mentioned kinematic parameters was done taking into consideration machine
capacity, fuel, power, energy and turning cost.
MeasurementsCompost density, ρ, was deter-
mined according to the following formula:
ρ = m υwhere ρ = compost density, kg/m3;m = compost sample mass, kgv = compost sample volume, m3.Machine capacity (M. C.) (m3/h )
was determined using the following equation:
M. C. = A × VWhere A = operational cross
sectional area, m3; V = machine for-ward speed, m/h.
Fuel consumption (F. C.) was recorded by accurately measuring the decrease in fuel level in the fuel tank immediately after executing each operation.
Turning power (T. P.) was calcu-lated by using the following formula (Barger et al., 1963 ):
T. P. = Fc × Cv × ηth × 427 × 1 175 × 1.36 kW
whereFc = Fuel consumption, kg/s;Cv = Calorific value of fuel, k cal/
kg (Cv = 10,000 kcal/kg)427 = Thermo mechanical equiva-
lent, kg m/k cal;ηth = Thermal efficiency of the
engine, % (ηth = 30 % for diesel engine)
Energy requirement (E. R.) can be calculated using the following equation:
E. R. (W.h/ton)
= T.P(W) M.C (m3/h) × p (ton/m3)
× turning number to moturityTurning cost (T. C.)Machine cost was determined us-
ing the following formula (Awady 1978)
c = p (1 + i + t + r) + (0.9hp × f × s) h e 2
+ w 144
where c = hourly cost. P = capital investment, h = yearly operating hours e = life expectancy i = Inter-est rate t = Taxes and over head ratio r = Repairs ratio of the total invest-ment Hp = Horse power of engine. f = Specific fuel consumption, lit/hp h, s = Price of fuel per liter w =Labor wage rate per month in L. E. 144 = Reasonable estimation of monthly working hours.
Turning cost can be determined using the following equations:
Operationa 1 cost (L.E./m3)
= Mashine cost (L.E./h) Mashine capacity (m3/h)
T. C. (LE/ton)
= Operationa 1 cost Compositing density (ton/m3)× turning. number to moturity.
Results and DiscussionEffect of Kinematic Parameter on Machine Productivity
The most critical factor in pro-ductivity of the turning machine is its kinematic parameter. Fig. 3 shows the effect of the kinematic parameter on machine productiv-ity. Results show that an increasing kinematic parameter from 25 to 45 decreased machine productivity from 2,100 to 1,600, from 2,750 to 2,100, from 3,500 to 2,550, and from 3,800 to 3,200 m3/h under different pile heights of 60, 80, 100 and 120 cm, respectively. The increase in machine capacity by decreasing the kinematic parameter is attributed to the increase in quantity of turning materials per unit time because the decease in kinematic parameter is acquainted by an increase in for-ward speed.
Effect of Kinematic Parameter on Compost Density
Compost density is inversely af-fected by the kinematic parameter. Fig. 4 shows that increasing the kinematic parameter from 25 to 45,
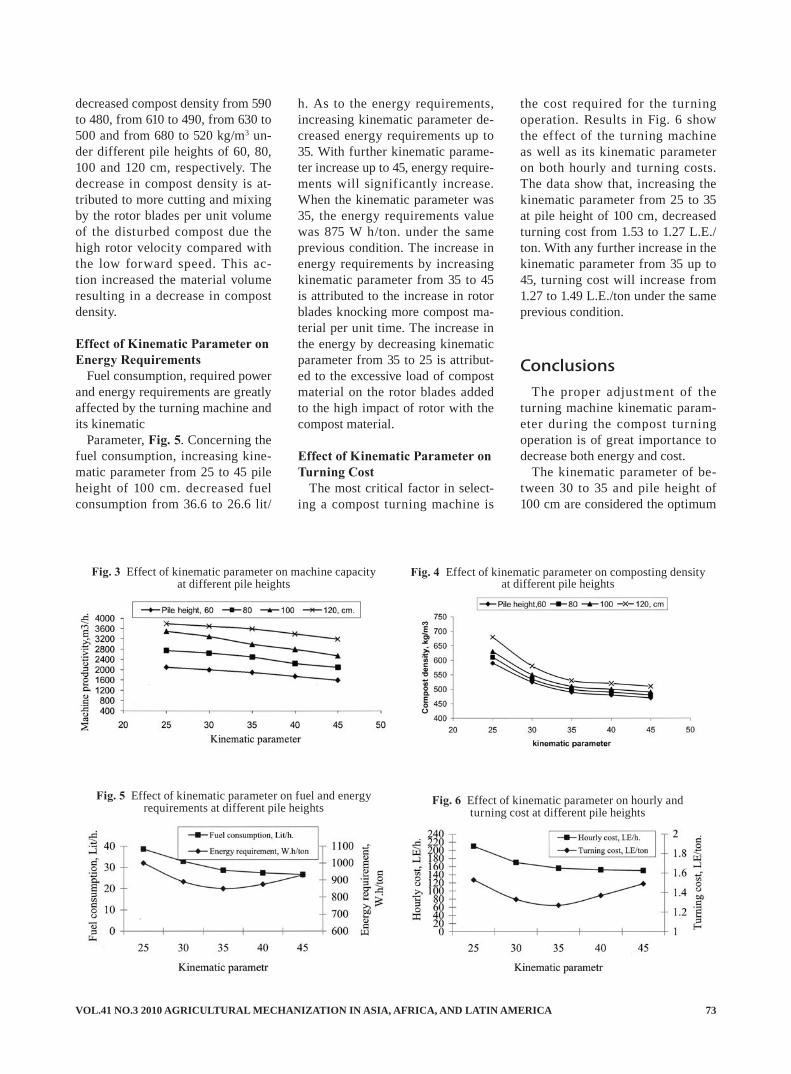
VOL.41 NO.3 2010 AGRICULTURAL MECHANIZATION IN ASIA, AFRICA, AND LATIN AMERICA 73
decreased compost density from 590 to 480, from 610 to 490, from 630 to 500 and from 680 to 520 kg/m3 un-der different pile heights of 60, 80, 100 and 120 cm, respectively. The decrease in compost density is at-tributed to more cutting and mixing by the rotor blades per unit volume of the disturbed compost due the high rotor velocity compared with the low forward speed. This ac-tion increased the material volume resulting in a decrease in compost density.
Effect of Kinematic Parameter on Energy Requirements
Fuel consumption, required power and energy requirements are greatly affected by the turning machine and its kinematic
Parameter, Fig. 5. Concerning the fuel consumption, increasing kine-matic parameter from 25 to 45 pile height of 100 cm. decreased fuel consumption from 36.6 to 26.6 lit/
h. As to the energy requirements, increasing kinematic parameter de-creased energy requirements up to 35. With further kinematic parame-ter increase up to 45, energy require-ments will significantly increase. When the kinematic parameter was 35, the energy requirements value was 875 W h/ton. under the same previous condition. The increase in energy requirements by increasing kinematic parameter from 35 to 45 is attributed to the increase in rotor blades knocking more compost ma-terial per unit time. The increase in the energy by decreasing kinematic parameter from 35 to 25 is attribut-ed to the excessive load of compost material on the rotor blades added to the high impact of rotor with the compost material.
Effect of Kinematic Parameter on Turning Cost
The most critical factor in select-ing a compost turning machine is
the cost required for the turning operation. Results in Fig. 6 show the effect of the turning machine as well as its kinematic parameter on both hourly and turning costs. The data show that, increasing the kinematic parameter from 25 to 35 at pile height of 100 cm, decreased turning cost from 1.53 to 1.27 L.E./ton. With any further increase in the kinematic parameter from 35 up to 45, turning cost will increase from 1.27 to 1.49 L.E./ton under the same previous condition.
ConclusionsThe proper adjustment of the
turning machine kinematic param-eter during the compost turning operation is of great importance to decrease both energy and cost.
The kinematic parameter of be-tween 30 to 35 and pile height of 100 cm are considered the optimum
Fig. 3 Effect of kinematic parameter on machine capacity at different pile heights
Fig. 4 Effect of kinematic parameter on composting density at different pile heights
Fig. 5 Effect of kinematic parameter on fuel and energy requirements at different pile heights Fig. 6 Effect of kinematic parameter on hourly and
turning cost at different pile heights
AGRICULTURAL MECHANIZATION IN ASIA, AFRICA, AND LATIN AMERICA 2010 VOL.41 NO.374
conditions for the compost turning operation.
REFERENCES
Abd El-Mottaleb A. F. 2006. Effect of some operating parameters on the performance of compost turn-ing machines. Misr J. Ag. Eng., 23(1): 40-54.
Awady, M. N. 1978. Tractor and Farm Machinery. Txt bk., Col.
Ag., Ain Shams U. 146-167.Barger E. L., J. B. L. Edohl, W. M.
Carletor, and E. G. Mchibben 1963. Tractor and their Power Units. 2nd Ed. Wiley and Sons, Inc., New York, U.S.A.
Klenin, N. E., E. F. Popov, and V. A. Sakun. 1985. Agricultural Ma-chines. America Publishing Co. Prt. Lid., New Delhi. 633pp.
Morad, M. M. and M. A. El-Shazly. 1994. Effect of some operating parameters on rotary-plow per-
formance. Misr, J. Ag. Eng., 11(4): 1009-1020.
El shal M.s. and M. M. Morad. 1991. Improving the combine header performance in respect to rice grain losses Misr. J. Ag. Eng., 8(1): 1-10.
Mohamed, A., M. M. Morad, and M. A. Arnaout. Development of the reciprocating mower for har-vesting lentil crop Misr. J. Ag. Eng., 17(1): 1-16.
■■
NEWS
CIOSTA Conference 2011Efficient and Safe Production Processes in Sustainable
Agriculture and Forestry29 June - 1 July 2011, Vienna, Austria
CIOSTA, CIGR, EurAgEng, VDI, ÖKL, FJ BLT Wieselbug and the University of Natural Resources and Applied Life Sciences would like to invite you to the XXXVI CIOSTA & CIGR Section V Conference in Vienna, Austria.
The conference provides a forum to present and exchange ideas and to promote research, development and application of efficient and safe technology and management in production processes of agriculture and forestry.
CIOSTA emphasises a holistic and sustainable approach to designing and improving sys-tems and fosters cooperation among scientists, technicians, advisers and producers through-out the world.
TopicsLabour, ergonomics, safety and healthSystem engineering, management, traceabilityField operationsLivestock managementProcessing, post-harvest technology, logisticsRenewable energy and efficiencyInformation systems and precision farmingOpen Topics
http://www.nas.boku.ac.at/ciosta2011.html
VOL.41 NO.3 2010 AGRICULTURAL MECHANIZATION IN ASIA, AFRICA, AND LATIN AMERICA 75
byP. R. JayanAssociate Professor (FPM) & Head, Division of Agricultural Engineering, Regional Agricultural Research Station (Kerala Agricultural University), Mele Pattambi-679 306, [email protected]
AbstractA mechanical dibber planter was
developed for planting selected seed namely maize, redgram, and cotton. The unit consisted of six dibbers ar-ranged radially on a dibber wheel, which actuates the seed metering mechanism and allows the seed to fall on the seed transfer cup and travel to the tip of the dibber. The dynamic performance of the dibber wheel was evaluated in a test track in terms of depth of placement of seed, pattern of seed placement, and hill spacing at forward speeds of 1.0, 1.25, 1.5, 1.75, and 2.0 km h-1, dibber depth settings of 20, 35, and 50 mm, and soil moisture levels of 8, 10, 12, 14, and 16 percent (d.b.). Tests were conducted using vertisol. The dibber depth setting and for-ward speed influenced the pattern of seed placement. The soil moisture did not affect the number of seeds placed inside the dibbed hole. The hill spacing was strongly influenced by all the selected soil and machine parameters. A dibber depth set-ting of 50 mm resulted in the best performance at the forward speed of 1.0-1:25 km h-1 and soil moisture content of 10 percent (d.b.). From the field experiments, the frequency distribution of number of plants per hill indicated that two seedlings were germinated for maize in 75 ± 2 percent of the hills. But, three seedlings were germinated in 68.5 ± 1.5 and 62 percent of the hills for
V. J. F. Kumar Professor, Dept. of Farm Machinery & Power, AEC&RI, Tamil Nadu Agricultural University, Coimbatore 641 003. Tamil [email protected]
A Mechanical Dibber Planter for Selected Seeds
redgram and cotton, respectively. The frequency distribution of hill spacing for the three crops indicated that about 32 percent of the hills were spaced at 300 mm. About 82 ± 2 percent of the hills were spaced at a distance of 285-300 mm. The missing hills were 3-5 percent. The field capacity of the dibber planter was 0.27, 0.20 and 0.34 ha h-1, re-spectively for maize, redgram and cotton.
IntroductionThe steady increase in India’s
population necessitates an increase in crop production every year to meet the food demand of the coun-try. Because of the steep increase in cost of seed, fer tilizers, and migration of agricultural labour-ers to urban areas, the cost of food production is going up at an alarm-ing rate. Although introduction of high yielding varieties and adoption of more stringent resource man-agement practices has increased crop production to a certain extent, technological advancement in ag-riculture is a must to cope with the productivity of the land (Swami-nathan, 2001). The most important agronomic practice that enhances the productivity in cultivable land is maintaining required plant popula-tion. Low seed germination percent-age, seed damage, inadequate soil moisture, and improper depth of
seed placement are the major fac-tors that affect the plant population in the field. At present, the desired plant population is achieved by sow-ing excess seeds per unit area and thinning the crop after germination. This process is labour intensive and costly seeds are wasted, thereby, the total cost of production is increased many fold. Introduction of preci-sion planting machinery can solve these problems apart from enhanc-ing plant yield through better plant spacing management. At present precision planting is not popular in the country since 100 percent vi-able seeds are not commercially available. If precision planting is adopted at this juncture, the plant population must to be maintained through gap filling (Anon., 1999). But the gap filled seeds require 7- 10 days to catch up with the earlier seedlings in the field. The life cycle is hence affected and ultimately the crop yield is reduced. Hill dropping is therefore an ultimate solution, as it takes into account the viable part of the seed, since two to three seeds are placed in a single hole. If such a hill dropping system is fitted with a dibber, it will ensure a more desirable environment by provid-ing correct depth of seed placement and spacing. Earlier researchers investigated the dibber planting technique and its capacity to im-prove overall emergence of seeds in comparison with conventional planters (Heineman et al., 1973;
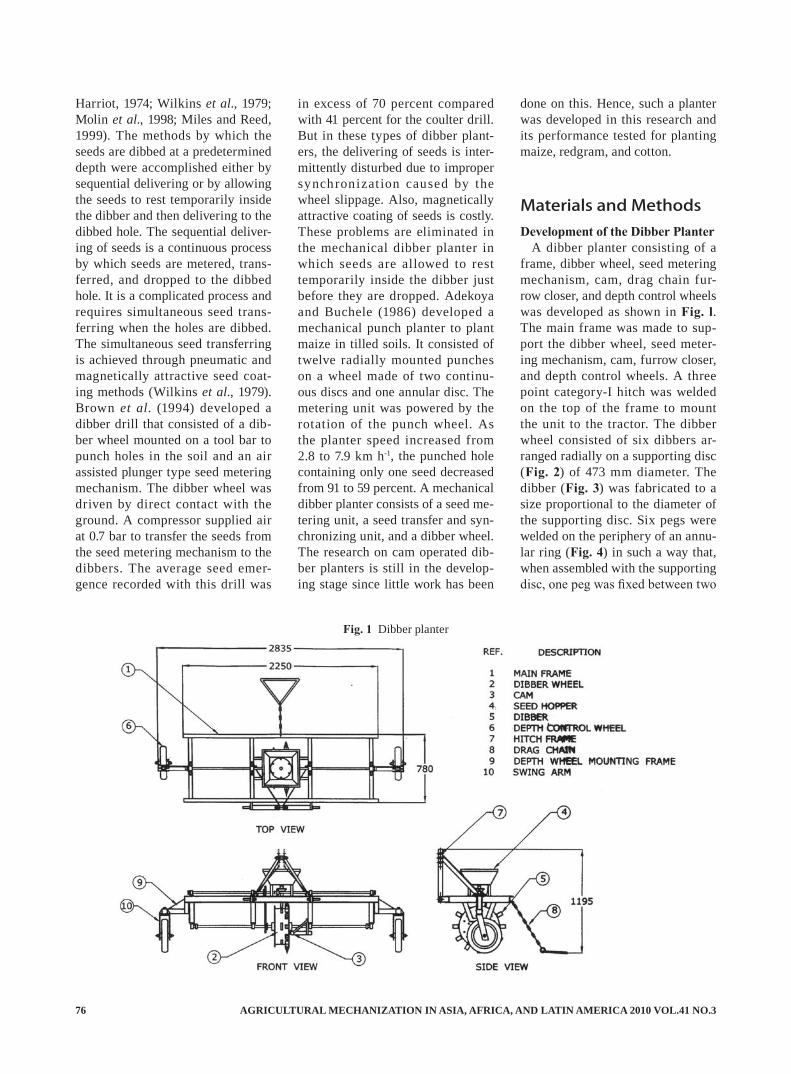
AGRICULTURAL MECHANIZATION IN ASIA, AFRICA, AND LATIN AMERICA 2010 VOL.41 NO.376
Harriot, 1974; Wilkins et al., 1979; Molin et al., 1998; Miles and Reed, 1999). The methods by which the seeds are dibbed at a predetermined depth were accomplished either by sequential delivering or by allowing the seeds to rest temporarily inside the dibber and then delivering to the dibbed hole. The sequential deliver-ing of seeds is a continuous process by which seeds are metered, trans-ferred, and dropped to the dibbed hole. It is a complicated process and requires simultaneous seed trans-ferring when the holes are dibbed. The simultaneous seed transferring is achieved through pneumatic and magnetically attractive seed coat-ing methods (Wilkins et al., 1979). Brown et al. (1994) developed a dibber drill that consisted of a dib-ber wheel mounted on a tool bar to punch holes in the soil and an air assisted plunger type seed metering mechanism. The dibber wheel was driven by direct contact with the ground. A compressor supplied air at 0.7 bar to transfer the seeds from the seed metering mechanism to the dibbers. The average seed emer-gence recorded with this drill was
in excess of 70 percent compared with 41 percent for the coulter drill. But in these types of dibber plant-ers, the delivering of seeds is inter-mittently disturbed due to improper synchronizat ion caused by the wheel slippage. Also, magnetically attractive coating of seeds is costly. These problems are eliminated in the mechanical dibber planter in which seeds are allowed to rest temporarily inside the dibber just before they are dropped. Adekoya and Buchele (1986) developed a mechanical punch planter to plant maize in tilled soils. It consisted of twelve radially mounted punches on a wheel made of two continu-ous discs and one annular disc. The metering unit was powered by the rotation of the punch wheel. As the planter speed increased from 2.8 to 7.9 km h-1, the punched hole containing only one seed decreased from 91 to 59 percent. A mechanical dibber planter consists of a seed me-tering unit, a seed transfer and syn-chronizing unit, and a dibber wheel. The research on cam operated dib-ber planters is still in the develop-ing stage since little work has been
done on this. Hence, such a planter was developed in this research and its performance tested for planting maize, redgram, and cotton.
Materials and MethodsDevelopment of the Dibber Planter
A dibber planter consisting of a frame, dibber wheel, seed metering mechanism, cam, drag chain fur-row closer, and depth control wheels was developed as shown in Fig. l. The main frame was made to sup-port the dibber wheel, seed meter-ing mechanism, cam, furrow closer, and depth control wheels. A three point category-I hitch was welded on the top of the frame to mount the unit to the tractor. The dibber wheel consisted of six dibbers ar-ranged radially on a supporting disc (Fig. 2) of 473 mm diameter. The dibber (Fig. 3) was fabricated to a size proportional to the diameter of the supporting disc. Six pegs were welded on the periphery of an annu-lar ring (Fig. 4) in such a way that, when assembled with the supporting disc, one peg was fixed between two
Fig. 1 Dibber planter
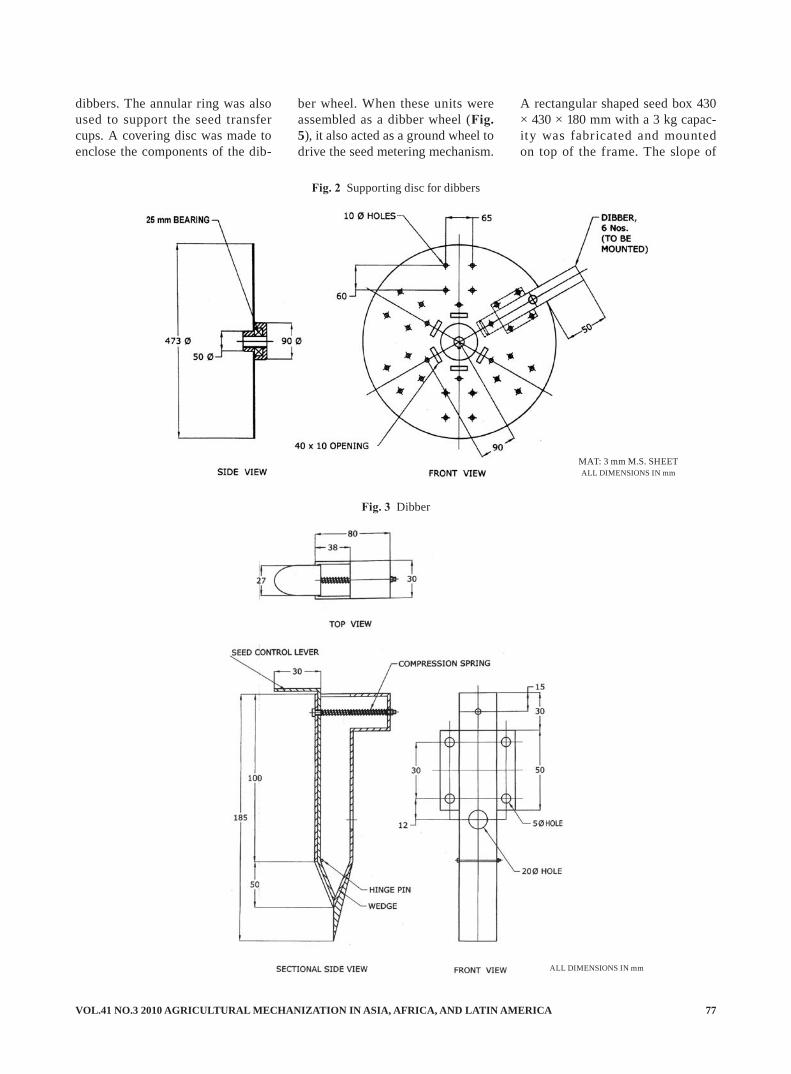
VOL.41 NO.3 2010 AGRICULTURAL MECHANIZATION IN ASIA, AFRICA, AND LATIN AMERICA 77
dibbers. The annular ring was also used to support the seed transfer cups. A covering disc was made to enclose the components of the dib-
ber wheel. When these units were assembled as a dibber wheel (Fig. 5), it also acted as a ground wheel to drive the seed metering mechanism.
A rectangular shaped seed box 430 × 430 × 180 mm with a 3 kg capac-ity was fabricated and mounted on top of the frame. The slope of
Fig. 2 Supporting disc for dibbers
MAT: 3 mm M.S. SHEETALL DIMENSIONS IN mm
Fig. 3 Dibber
ALL DIMENSIONS IN mm
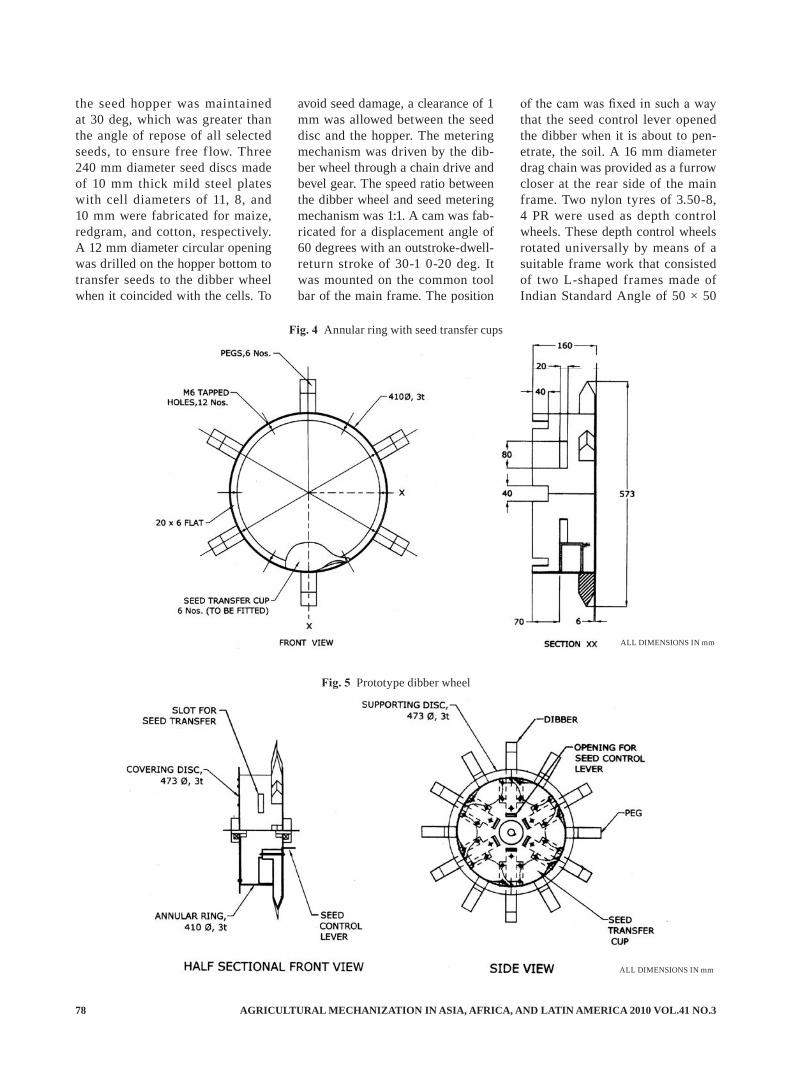
AGRICULTURAL MECHANIZATION IN ASIA, AFRICA, AND LATIN AMERICA 2010 VOL.41 NO.378
the seed hopper was maintained at 30 deg, which was greater than the angle of repose of all selected seeds, to ensure free f low. Three 240 mm diameter seed discs made of 10 mm thick mild steel plates with cell diameters of 11, 8, and 10 mm were fabricated for maize, redgram, and cotton, respectively. A 12 mm diameter circular opening was drilled on the hopper bottom to transfer seeds to the dibber wheel when it coincided with the cells. To
avoid seed damage, a clearance of 1 mm was allowed between the seed disc and the hopper. The metering mechanism was driven by the dib-ber wheel through a chain drive and bevel gear. The speed ratio between the dibber wheel and seed metering mechanism was 1:1. A cam was fab-ricated for a displacement angle of 60 degrees with an outstroke-dwell-return stroke of 30-1 0-20 deg. It was mounted on the common tool bar of the main frame. The position
of the cam was fixed in such a way that the seed control lever opened the dibber when it is about to pen-etrate, the soil. A 16 mm diameter drag chain was provided as a furrow closer at the rear side of the main frame. Two nylon tyres of 3.50-8, 4 PR were used as depth control wheels. These depth control wheels rotated universally by means of a suitable frame work that consisted of two L-shaped frames made of Indian Standard Angle of 50 × 50
Fig. 4 Annular ring with seed transfer cups
ALL DIMENSIONS IN mm
Fig. 5 Prototype dibber wheel
ALL DIMENSIONS IN mm
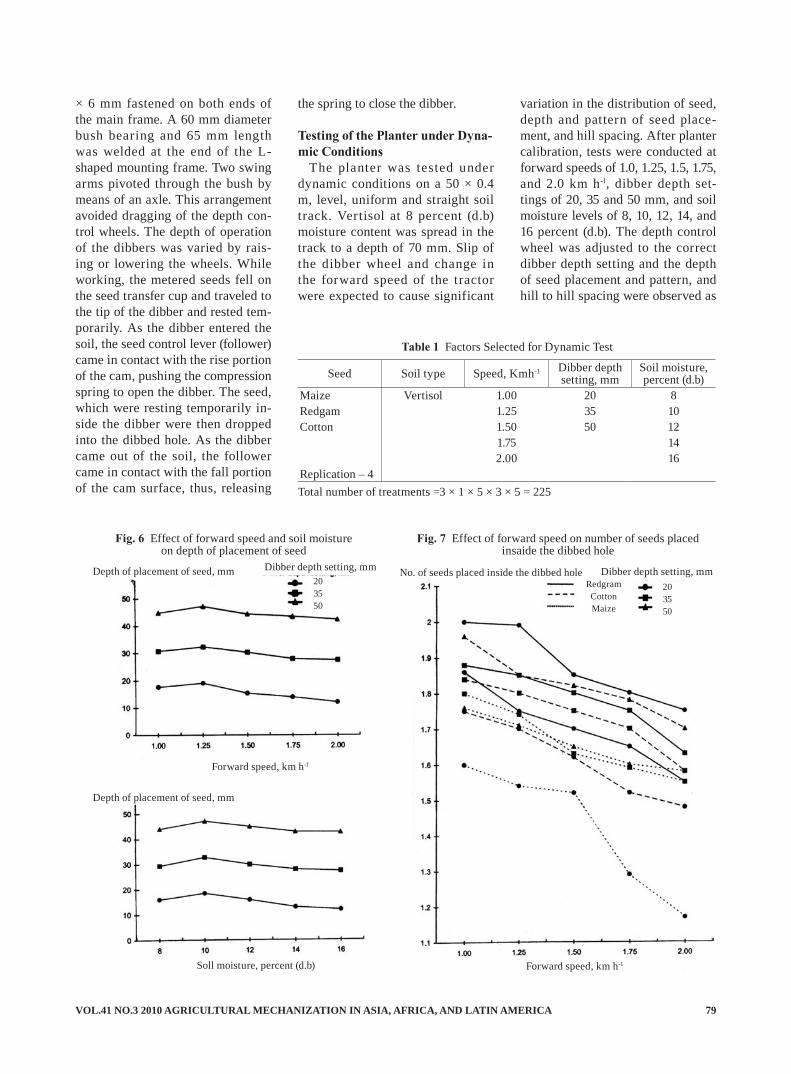
VOL.41 NO.3 2010 AGRICULTURAL MECHANIZATION IN ASIA, AFRICA, AND LATIN AMERICA 79
Total number of treatments =3 × 1 × 5 × 3 × 5 = 225
× 6 mm fastened on both ends of the main frame. A 60 mm diameter bush bearing and 65 mm length was welded at the end of the L-shaped mounting frame. Two swing arms pivoted through the bush by means of an axle. This arrangement avoided dragging of the depth con-trol wheels. The depth of operation of the dibbers was varied by rais-ing or lowering the wheels. While working, the metered seeds fell on the seed transfer cup and traveled to the tip of the dibber and rested tem-porarily. As the dibber entered the soil, the seed control lever (follower) came in contact with the rise portion of the cam, pushing the compression spring to open the dibber. The seed, which were resting temporarily in-side the dibber were then dropped into the dibbed hole. As the dibber came out of the soil, the follower came in contact with the fall portion of the cam surface, thus, releasing
the spring to close the dibber.
Testing of the Planter under Dyna-mic Conditions
The planter was tested under dynamic conditions on a 50 × 0.4 m, level, uniform and straight soil track. Vertisol at 8 percent (d.b) moisture content was spread in the track to a depth of 70 mm. Slip of the dibber wheel and change in the forward speed of the tractor were expected to cause significant
variation in the distribution of seed, depth and pattern of seed place-ment, and hill spacing. After planter calibration, tests were conducted at forward speeds of 1.0, 1.25, 1.5, 1.75, and 2.0 km h-l, dibber depth set-tings of 20, 35 and 50 mm, and soil moisture levels of 8, 10, 12, 14, and 16 percent (d.b). The depth control wheel was adjusted to the correct dibber depth setting and the depth of seed placement and pattern, and hill to hill spacing were observed as
Seed Soil type Speed, Kmh-1 Dibber depth setting, mm
Soil moisture, percent (d.b)
Maize Vertisol 1.00 20 8Redgam 1.25 35 10Cotton 1.50 50 12
1.75 142.00 16
Replication – 4
Table 1 Factors Selected for Dynamic Test
Forward speed, km h-1
203550
203550
Dibber depth setting, mm Dibber depth setting, mmRedgramCottonMaize
Soll moisture, percent (d.b)
Depth of placement of seed, mm
Depth of placement of seed, mm
No. of seeds placed inside the dibbed hole
Forward speed, km h-1
Fig. 6 Effect of forward speed and soil moisture on depth of placement of seed
Fig. 7 Effect of forward speed on number of seeds placed insaide the dibbed hole
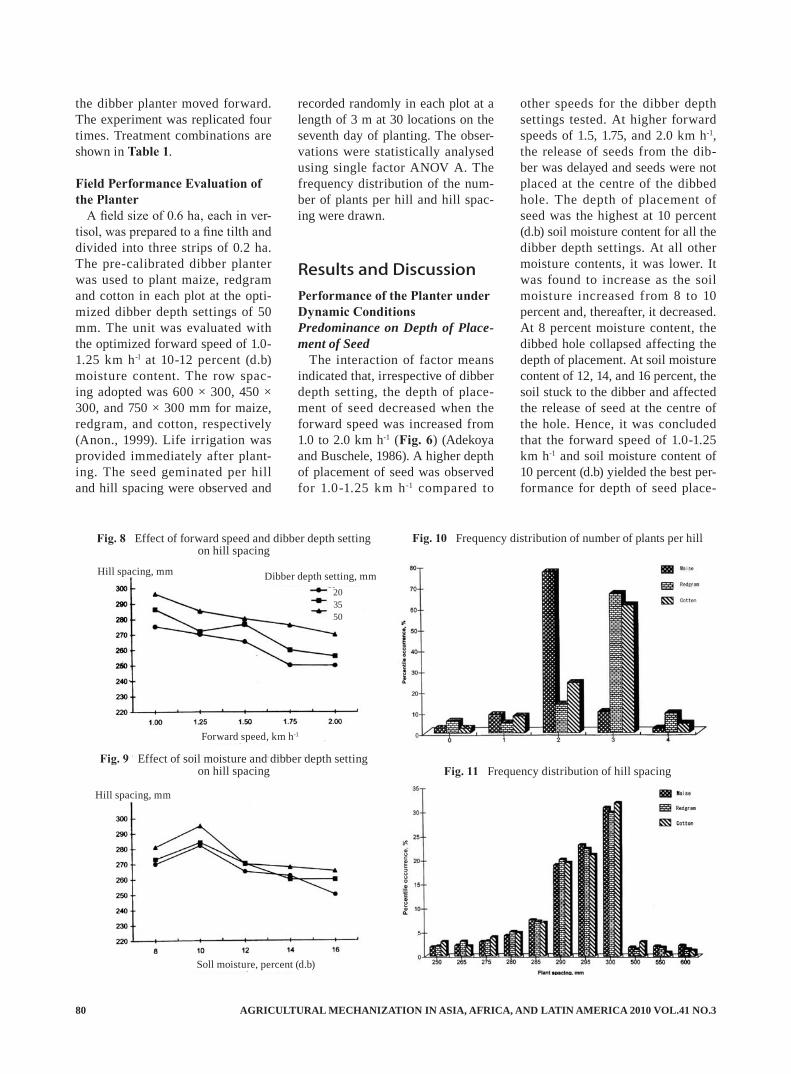
AGRICULTURAL MECHANIZATION IN ASIA, AFRICA, AND LATIN AMERICA 2010 VOL.41 NO.380
the dibber planter moved forward. The experiment was replicated four times. Treatment combinations are shown in Table 1.
Field Performance Evaluation of the Planter
A field size of 0.6 ha, each in ver-tisol, was prepared to a fine tilth and divided into three strips of 0.2 ha. The pre-calibrated dibber planter was used to plant maize, redgram and cotton in each plot at the opti-mized dibber depth settings of 50 mm. The unit was evaluated with the optimized forward speed of 1.0-1.25 km h-l at 10-12 percent (d.b) moisture content. The row spac-ing adopted was 600 × 300, 450 × 300, and 750 × 300 mm for maize, redgram, and cotton, respectively (Anon., 1999). Life irrigation was provided immediately after plant-ing. The seed geminated per hill and hill spacing were observed and
recorded randomly in each plot at a length of 3 m at 30 locations on the seventh day of planting. The obser-vations were statistically analysed using single factor ANOV A. The frequency distribution of the num-ber of plants per hill and hill spac-ing were drawn.
Results and DiscussionPerformance of the Planter under Dynamic ConditionsPredominance on Depth of Place-ment of Seed
The interaction of factor means indicated that, irrespective of dibber depth setting, the depth of place-ment of seed decreased when the forward speed was increased from 1.0 to 2.0 km h-1 (Fig. 6) (Adekoya and Buschele, 1986). A higher depth of placement of seed was observed for 1.0-1.25 km h-1 compared to
other speeds for the dibber depth settings tested. At higher forward speeds of 1.5, 1.75, and 2.0 km h-1, the release of seeds from the dib-ber was delayed and seeds were not placed at the centre of the dibbed hole. The depth of placement of seed was the highest at 10 percent (d.b) soil moisture content for all the dibber depth settings. At all other moisture contents, it was lower. It was found to increase as the soil moisture increased from 8 to 10 percent and, thereafter, it decreased. At 8 percent moisture content, the dibbed hole collapsed affecting the depth of placement. At soil moisture content of 12, 14, and 16 percent, the soil stuck to the dibber and affected the release of seed at the centre of the hole. Hence, it was concluded that the forward speed of 1.0-1.25 km h-1 and soil moisture content of 10 percent (d.b) yielded the best per-formance for depth of seed place-
Forward speed, km h-1
203550
Dibber depth setting, mm
Soll moisture, percent (d.b)
Hill spacing, mm
Fig. 8 Effect of forward speed and dibber depth setting on hill spacing
Hill spacing, mm
Fig. 9 Effect of soil moisture and dibber depth setting on hill spacing
Fig. 10 Frequency distribution of number of plants per hill
Fig. 11 Frequency distribution of hill spacing
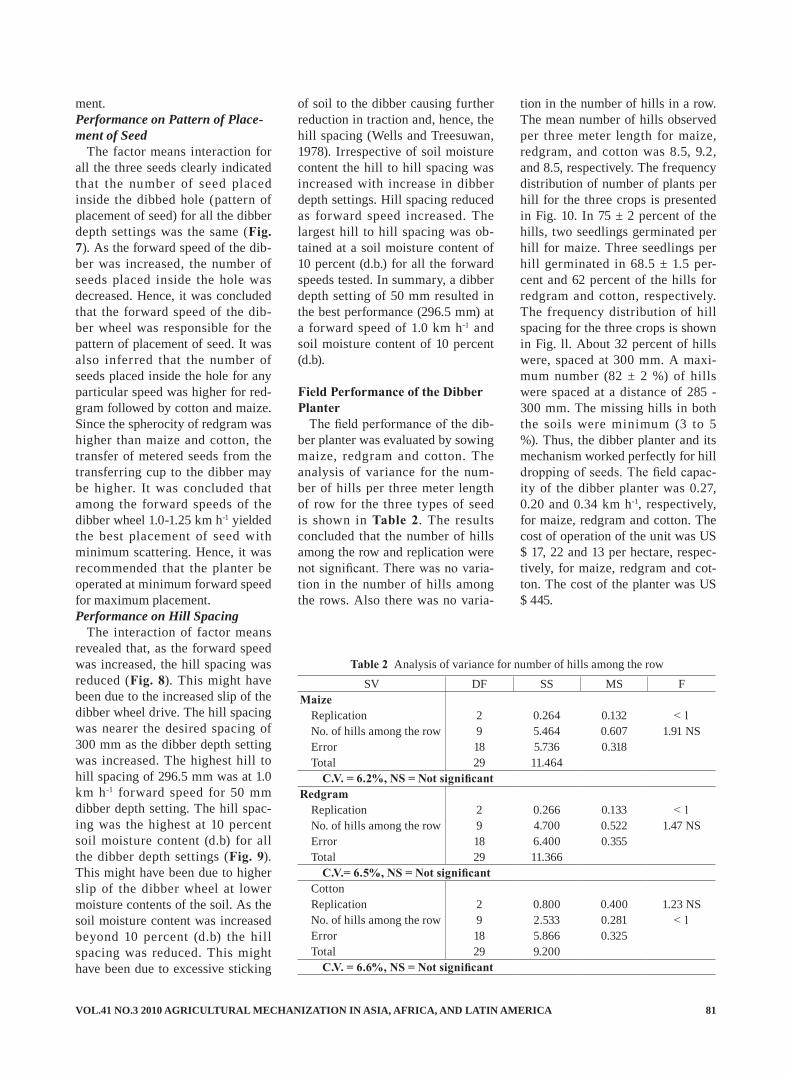
VOL.41 NO.3 2010 AGRICULTURAL MECHANIZATION IN ASIA, AFRICA, AND LATIN AMERICA 81
ment.Performance on Pattern of Place-ment of Seed
The factor means interaction for all the three seeds clearly indicated that the number of seed placed inside the dibbed hole (pattern of placement of seed) for all the dibber depth settings was the same (Fig. 7). As the forward speed of the dib-ber was increased, the number of seeds placed inside the hole was decreased. Hence, it was concluded that the forward speed of the dib-ber wheel was responsible for the pattern of placement of seed. It was also inferred that the number of seeds placed inside the hole for any particular speed was higher for red-gram followed by cotton and maize. Since the spherocity of redgram was higher than maize and cotton, the transfer of metered seeds from the transferring cup to the dibber may be higher. It was concluded that among the forward speeds of the dibber wheel 1.0-1.25 km h-1 yielded the best placement of seed with minimum scattering. Hence, it was recommended that the planter be operated at minimum forward speed for maximum placement.Performance on Hill Spacing
The interaction of factor means revealed that, as the forward speed was increased, the hill spacing was reduced (Fig. 8). This might have been due to the increased slip of the dibber wheel drive. The hill spacing was nearer the desired spacing of 300 mm as the dibber depth setting was increased. The highest hill to hill spacing of 296.5 mm was at 1.0 km h-1 forward speed for 50 mm dibber depth setting. The hill spac-ing was the highest at 10 percent soil moisture content (d.b) for all the dibber depth settings (Fig. 9). This might have been due to higher slip of the dibber wheel at lower moisture contents of the soil. As the soil moisture content was increased beyond 10 percent (d.b) the hill spacing was reduced. This might have been due to excessive sticking
of soil to the dibber causing further reduction in traction and, hence, the hill spacing (Wells and Treesuwan, 1978). Irrespective of soil moisture content the hill to hill spacing was increased with increase in dibber depth settings. Hill spacing reduced as forward speed increased. The largest hill to hill spacing was ob-tained at a soil moisture content of 10 percent (d.b.) for all the forward speeds tested. In summary, a dibber depth setting of 50 mm resulted in the best performance (296.5 mm) at a forward speed of 1.0 km h-1 and soil moisture content of 10 percent (d.b).
Field Performance of the Dibber Planter
The field performance of the dib-ber planter was evaluated by sowing maize, redgram and cotton. The analysis of variance for the num-ber of hills per three meter length of row for the three types of seed is shown in Table 2. The results concluded that the number of hills among the row and replication were not significant. There was no varia-tion in the number of hills among the rows. Also there was no varia-
tion in the number of hills in a row. The mean number of hills observed per three meter length for maize, redgram, and cotton was 8.5, 9.2, and 8.5, respectively. The frequency distribution of number of plants per hill for the three crops is presented in Fig. 10. In 75 ± 2 percent of the hills, two seedlings germinated per hill for maize. Three seedlings per hill germinated in 68.5 ± 1.5 per-cent and 62 percent of the hills for redgram and cotton, respectively. The frequency distribution of hill spacing for the three crops is shown in Fig. ll. About 32 percent of hills were, spaced at 300 mm. A maxi-mum number (82 ± 2 %) of hills were spaced at a distance of 285 - 300 mm. The missing hills in both the soils were minimum (3 to 5 %). Thus, the dibber planter and its mechanism worked perfectly for hill dropping of seeds. The field capac-ity of the dibber planter was 0.27, 0.20 and 0.34 km h-1, respectively, for maize, redgram and cotton. The cost of operation of the unit was US $ 17, 22 and 13 per hectare, respec-tively, for maize, redgram and cot-ton. The cost of the planter was US $ 445.
SV DF SS MS FMaize
Replication 2 0.264 0.132 < 1No. of hills among the row 9 5.464 0.607 1.91 NSError 18 5.736 0.318Total 29 11.464
C.V. = 6.2%, NS = Not significantRedgram
Replication 2 0.266 0.133 < 1No. of hills among the row 9 4.700 0.522 1.47 NSError 18 6.400 0.355Total 29 11.366
C.V.= 6.5%, NS = Not significantCottonReplication 2 0.800 0.400 1.23 NSNo. of hills among the row 9 2.533 0.281 < 1Error 18 5.866 0.325Total 29 9.200
C.V. = 6.6%, NS = Not significant
Table 2 Analysis of variance for number of hills among the row
AGRICULTURAL MECHANIZATION IN ASIA, AFRICA, AND LATIN AMERICA 2010 VOL.41 NO.382
ConclusionsThe developed mechanical dibber
planter distributed seeds uniformly to all the dibbers. It was concluded that it would be very effective at minimum forward speeds for dib-bing of seeds. Attachment of an electronic seed metering mechanism would result in better performance of seed transfer. Fixing of pointed edges at the dibber tips would help restrict the entry of soil boulders and other materials into the dibbers. Further work should be directed along these lines.
REFERENCES
Anonymous. 1999. Crop Production Guide. Tamil Nadu Agricultural
University, Coimbatore and Com-missioner of Agriculture, Chen-nai. India
Adekoya, L. O. and W. F. Buchele. 1986. A precision punch planter for use in tilled and untilled soils. J. Agric. Engng. Res., 37: 171-178.
Brown, F. R., S. L. Miles, and L. Butler. 1994. Design and develop-ment of a high speed dibber drill for improved crop establishment. J. Agric. Engng. Res., 58: 261-270.
Harriott, B. L. 1974. Planting mech-anism for seed tablets. Trasns. ASAE, 17(3): 447-448 and 451.
Heinemann, W. H. Jr., J. W. Cary, and A. E. Dilworth. 1973. Experi-mental machines for auto dibble planting. Trans. ASAE, 16(4): 656-659.
Miles, S. J. and J. N. Reed. 1999. Dibber drill for precise placement
of seed and granular pesticide. J. Agric. Engng. Res., 74(2): 127-133.
Molin, J. P., L. L. Bashford, K. V. Bargen, and L. I. Leviticus. 1998. Design and evaluation of a punch planter for no-till systems. Trans. ASAE., 41(2): 307-314.
Swaminathan, M. S. 2001. Food security and sustainable develop-ment. Current Science, 81(8): 948-954.
Well, L. G. and O. Treesuwan. 1978. The response of various soil strength indices to changing water content and bulk density. Trans. ASAE, 21(5): 854-860.
Wilkins, D. E., P. A. Adrian, and W. J. Conley. 1979. Punch planting of vegetable seeds -a progress report. Trans. ASAE., 22(1): 746-749.
■■
NEWSYou can downlord free PDF format files of AMA back issues dating back to 2-7 years.
Access our website.
http://www.shin-norin.co.jp/ama/ama.html
VOL.41 NO.3 2010 AGRICULTURAL MECHANIZATION IN ASIA, AFRICA, AND LATIN AMERICA 83
by
Yang HaiqingPh.D StudentAssociate ProfessorCollege of Information Engineering,Zhejiang University of TechnologyHangzhou 310032, Zhejiang Province,P. R. [email protected]
AbstractSoil and cl imate monitor ing
plays an important role in orchard management. A wireless sensor network is an efficient approach for monitoring a large-scale orchard with densely distr ibuted nodes. Combined with a project of facility cultivation of a local pear variety in Zhejiang province, China, a wire-less sensor network combining net-work clustering and route enhancing is proposed with an aim to facilitate node distribution in orchard and regular network maintenance. The topology of a wireless sensing clus-ter, hardware and software design of wireless node and routing enhance-ment are elaborated. The test results show that the proposed scheme has the capability of robust data trans-mission, high sensing accuracy of soil and climate parameters and ex-cellent data consistency. The design method proposed in the paper is also suitable for other farmland monitor-ing systems.
Yang YanPh. D StudentLecturerDepartment of Mathematics & computer science,Guangxi Teachers Education UniversityNanning 530001, Guangxi Autonomous Region,P. R. [email protected]
Wireless Sensor Network for Orchard Soiland Climate Monitoring
He YongProfessor and DeanSchool of Biosystems Engineering & Food Science,Zhejiang University,Hangzhou 310029, Zhejiang Province,P. R. [email protected]
IntroductionThe growth of fruit trees has a
close a relationship with orchard soil conditions and climate change. During its growth, a fruit tree not only needs abundant sunlight and a certain level of air temperature and humidity, but also appropriate soil temperature, moisture and manure. The all-day monitoring of orchard soil and cl imate helps orchard management. At the present time, orchard monitoring in China is just beginning and most monitoring techniques are still in the stage of testing. As the traditional methods, including underground cabling and trolley wiring, disturb orchard culti-vation, wireless techniques are gain-ing farmer’s great interest. Although some wireless monitoring systems based on GSM or GPRS have been put into operation, it is still hard to obtain region-wide farmland infor-mation with certain density due to sparse sensing points. In the area of large scale farmland monitoring,
emerging wireless sensor network (Sausen et al., 2008; Pappas et al., 2008; Chang et al, 2008; and Qiao et al., 2005) has its unique capabili-ties, like random deployment, flex-ible extension, and cost-effective field-map building. The multi-hop communication between sensing nodes not only helps form directive data transmission, but also provides feedback signal pathways to actua-tors in precision control (Morais et al., 2005).
The wireless sensor network has found its way into various fields
AcknowledgementThis research was funded by Na-
tional Science and Technology Sup-port Program (Project No. 2006BA-D10A0403), National High-tech Research and Development Program (863) (Project No. 2007AA10Z210), National Science Foundation of China (Project No. 30671213), and Key Project of Science and Tech-nology of Ningbo City (Project No.2007C10034).

AGRICULTURAL MECHANIZATION IN ASIA, AFRICA, AND LATIN AMERICA 2010 VOL.41 NO.384
such as frost prevention (Jaradat et al., 2008), flood monitoring (Kuang et al., 2008), soil detection (Liu et al., 2008), and farmland informa-tion collection (Li et al., 2008 and Zhang, 2008). When a large num-ber of sensing nodes is distributed, the life of a network with various energy-consumption nodes will terminate ahead of schedule as some individual node exhausts its energy. Lu and Liu (2007) proposed a regional distribution density for-mula of sensing nodes, theoretically indicating that energy consump-tion rate of each node could keep balance. According to the scheme, however, it would become hard to deploy network nodes in a real field. Up to now, there is no information about how to design an application-specific convenient way to build a wireless sensor network. In this pa-per, combined with a project on fa-cility cultivation of Huanghua Pear, a local variety in Zhejiang province, China, a kind of wireless sensor net-work integrating network clustering and route enhancing is proposed. The system has been implemented and tested for orchard soil and cli-mate monitoring.
System DesignA wireless sensor network for
orchard soil and climate monitor-ing (or orchard monitoring system thereaf ter) consists of wireless sensing nodes, sink nodes, routing nodes, base station, network server and remote clients (Fig. 1).
To facilitate network management and maintenance, the orchard moni-toring system is divided into several wireless sensing clusters and one routing cluster. Functionally, each sensing cluster is a wireless sensor sub-network, which is made up of sensing nodes and one sink node . A sensing node is responsible for the collection and storage of site-specific soil and climate param-eters such as air temperature and humidity, sunlight intensity, soil temperature, moisture and electric
conductivity (He et al., 2008). A sensing node transfers these data to sink nodes via multi-hop com-munication protocol. A sink node has the duties of receiving, filtering and storing the data and forwarding them to wireless routing node. The main difference between a routing cluster and a sensing cluster is that there is no sensing capability of soil and climate parameters. Routing nodes can transfer data in a bidirec-tional way, while a sensing node, in general, delivers data in a fixed direction. Although sensing nodes can form an ad hoc network, such a system needs extra energy support. When sensing nodes are statically deployed, it is unnecessary to adopt an ad hoc network (Dressler, 2008). Also, it is harder to test node com-munication in an ad hoc network. In ISM radio bands, the weak emit-ting power of wireless nodes leads to narrow signal coverage, which is usually less than 100 m radially. When a sink node is far away from the base station, there is no guaran-tee of reliable data communication between them. In this case, more routing nodes are needed to extend the network coverage. To ease regu-
lar maintenance of the network, routing nodes could be deployed along two sides of paths in the or-chard. Thanks to bidirectional data transmission of a wireless routing cluster, base station(s) can statically access to the network via a nearby routing node, while mobile devices, like PDA, can dynamically apply for network access. Base station(s) and mobile devices should follow the procedure of node identification. Only those passing the identification have the right of data browsing and network supervision. Base stations with an access to the internet can upload data to network server and carry out a series of data operations. When permitted by network manag-er, a remote client can retrieve data from the network server.
Wireless Sensing ClusterA wireless sensing cluster is
one of basic units of an orchard monitoring system management and maintenance. The more the sensing nodes in a sensing cluster, the faster the energy consumption of sensing nodes closer to the sink node (Lu and Liu, 2007). In our design, each node uses a 4-bit encoding scheme
Fig. 1 Wireless sensor network for orchard soil and climate monitoring
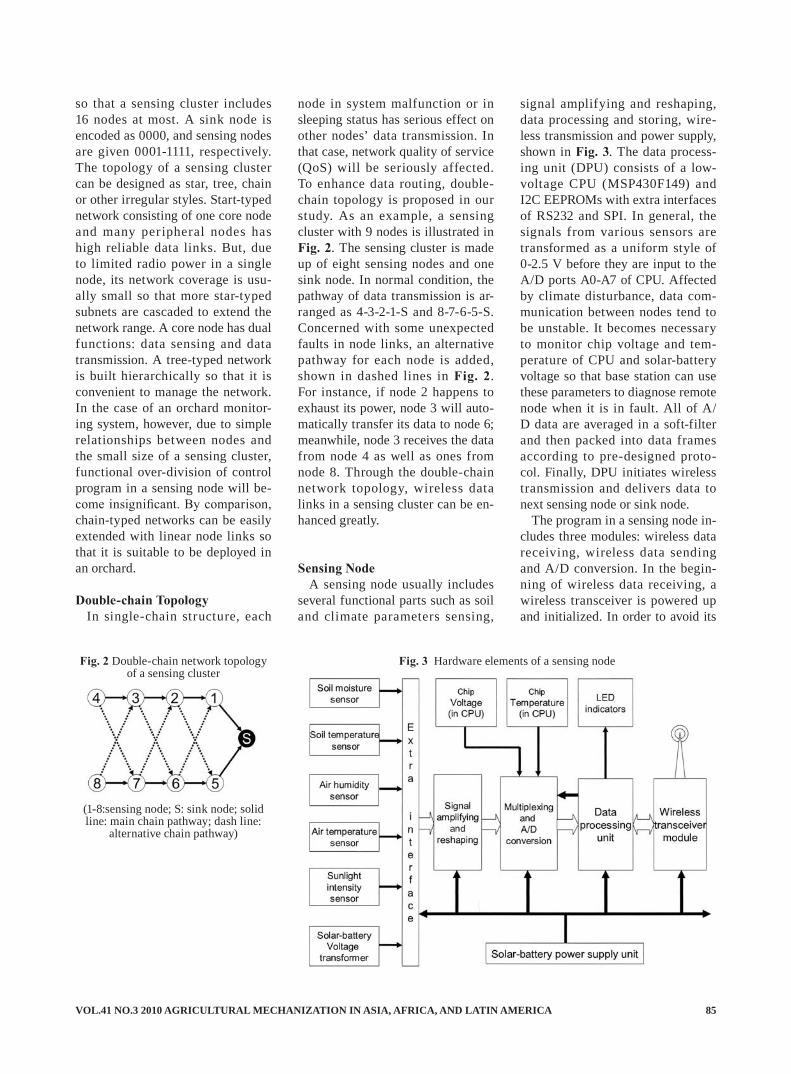
VOL.41 NO.3 2010 AGRICULTURAL MECHANIZATION IN ASIA, AFRICA, AND LATIN AMERICA 85
so that a sensing cluster includes 16 nodes at most. A sink node is encoded as 0000, and sensing nodes are given 0001-1111, respectively. The topology of a sensing cluster can be designed as star, tree, chain or other irregular styles. Start-typed network consisting of one core node and many peripheral nodes has high reliable data links. But, due to limited radio power in a single node, its network coverage is usu-ally small so that more star-typed subnets are cascaded to extend the network range. A core node has dual functions: data sensing and data transmission. A tree-typed network is built hierarchically so that it is convenient to manage the network. In the case of an orchard monitor-ing system, however, due to simple relationships between nodes and the small size of a sensing cluster, functional over-division of control program in a sensing node will be-come insignificant. By comparison, chain-typed networks can be easily extended with linear node links so that it is suitable to be deployed in an orchard.
Double-chain TopologyIn single-chain structure, each
node in system malfunction or in sleeping status has serious effect on other nodes’ data transmission. In that case, network quality of service (QoS) will be seriously affected. To enhance data routing, double-chain topology is proposed in our study. As an example, a sensing cluster with 9 nodes is illustrated in Fig. 2. The sensing cluster is made up of eight sensing nodes and one sink node. In normal condition, the pathway of data transmission is ar-ranged as 4-3-2-1-S and 8-7-6-5-S. Concerned with some unexpected faults in node links, an alternative pathway for each node is added, shown in dashed lines in Fig. 2. For instance, if node 2 happens to exhaust its power, node 3 will auto-matically transfer its data to node 6; meanwhile, node 3 receives the data from node 4 as well as ones from node 8. Through the double-chain network topology, wireless data links in a sensing cluster can be en-hanced greatly.
Sensing NodeA sensing node usually includes
several functional parts such as soil and climate parameters sensing,
signal amplifying and reshaping, data processing and storing, wire-less transmission and power supply, shown in Fig. 3. The data process-ing unit (DPU) consists of a low-voltage CPU (MSP430F149) and I2C EEPROMs with extra interfaces of RS232 and SPI. In general, the signals from various sensors are transformed as a uniform style of 0-2.5 V before they are input to the A/D ports A0-A7 of CPU. Affected by climate disturbance, data com-munication between nodes tend to be unstable. It becomes necessary to monitor chip voltage and tem-perature of CPU and solar-battery voltage so that base station can use these parameters to diagnose remote node when it is in fault. All of A/D data are averaged in a soft-filter and then packed into data frames according to pre-designed proto-col. Finally, DPU initiates wireless transmission and delivers data to next sensing node or sink node.
The program in a sensing node in-cludes three modules: wireless data receiving, wireless data sending and A/D conversion. In the begin-ning of wireless data receiving, a wireless transceiver is powered up and initialized. In order to avoid its
Fig. 2 Double-chain network topology of a sensing cluster
Fig. 3 Hardware elements of a sensing node
(1-8:sensing node; S: sink node; solid line: main chain pathway; dash line:
alternative chain pathway)
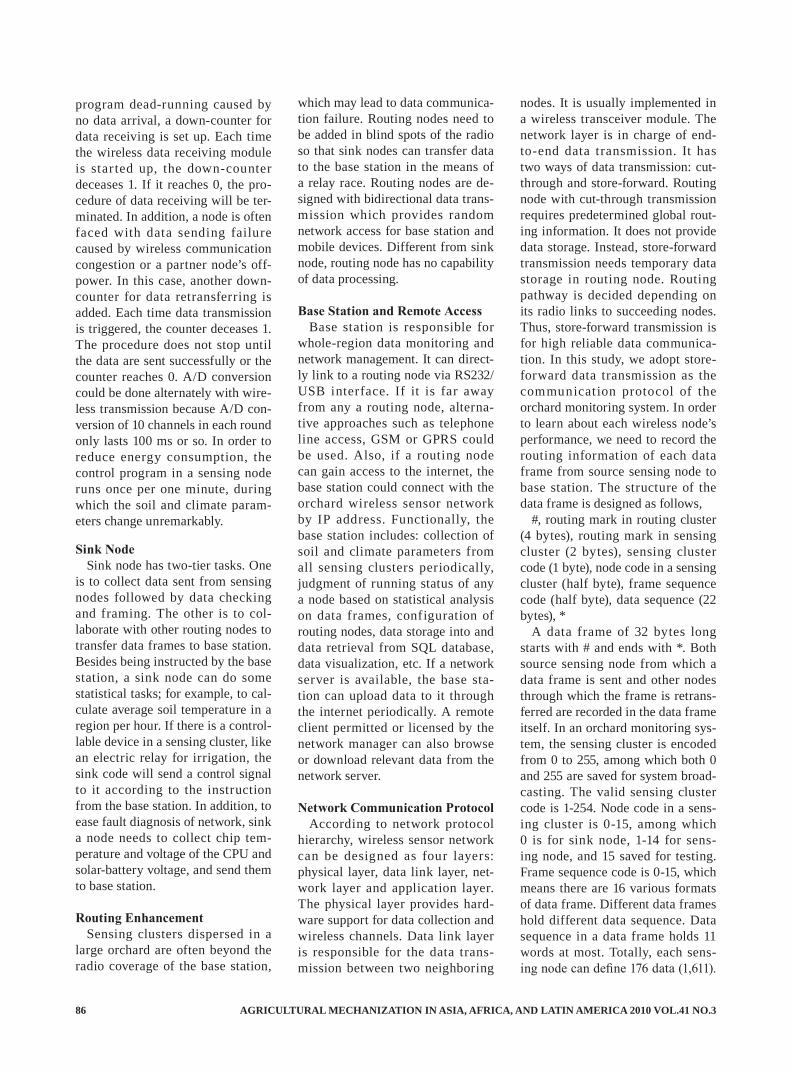
AGRICULTURAL MECHANIZATION IN ASIA, AFRICA, AND LATIN AMERICA 2010 VOL.41 NO.386
program dead-running caused by no data arrival, a down-counter for data receiving is set up. Each time the wireless data receiving module is star ted up, the down-counter deceases 1. If it reaches 0, the pro-cedure of data receiving will be ter-minated. In addition, a node is often faced with data sending failure caused by wireless communication congestion or a partner node’s off-power. In this case, another down-counter for data retransferring is added. Each time data transmission is triggered, the counter deceases 1. The procedure does not stop until the data are sent successfully or the counter reaches 0. A/D conversion could be done alternately with wire-less transmission because A/D con-version of 10 channels in each round only lasts 100 ms or so. In order to reduce energy consumption, the control program in a sensing node runs once per one minute, during which the soil and climate param-eters change unremarkably.
Sink NodeSink node has two-tier tasks. One
is to collect data sent from sensing nodes followed by data checking and framing. The other is to col-laborate with other routing nodes to transfer data frames to base station. Besides being instructed by the base station, a sink node can do some statistical tasks; for example, to cal-culate average soil temperature in a region per hour. If there is a control-lable device in a sensing cluster, like an electric relay for irrigation, the sink code will send a control signal to it according to the instruction from the base station. In addition, to ease fault diagnosis of network, sink a node needs to collect chip tem-perature and voltage of the CPU and solar-battery voltage, and send them to base station.
Routing EnhancementSensing clusters dispersed in a
large orchard are often beyond the radio coverage of the base station,
which may lead to data communica-tion failure. Routing nodes need to be added in blind spots of the radio so that sink nodes can transfer data to the base station in the means of a relay race. Routing nodes are de-signed with bidirectional data trans-mission which provides random network access for base station and mobile devices. Different from sink node, routing node has no capability of data processing.
Base Station and Remote AccessBase station is responsible for
whole-region data monitoring and network management. It can direct-ly link to a routing node via RS232/USB interface. If it is far away from any a routing node, alterna-tive approaches such as telephone line access, GSM or GPRS could be used. Also, if a routing node can gain access to the internet, the base station could connect with the orchard wireless sensor network by IP address. Functionally, the base station includes: collection of soil and climate parameters from all sensing clusters periodically, judgment of running status of any a node based on statistical analysis on data frames, configuration of routing nodes, data storage into and data retrieval from SQL database, data visualization, etc. If a network server is available, the base sta-tion can upload data to it through the internet periodically. A remote client permitted or licensed by the network manager can also browse or download relevant data from the network server.
Network Communication ProtocolAccording to network protocol
hierarchy, wireless sensor network can be designed as four layers: physical layer, data link layer, net-work layer and application layer. The physical layer provides hard-ware support for data collection and wireless channels. Data link layer is responsible for the data trans-mission between two neighboring
nodes. It is usually implemented in a wireless transceiver module. The network layer is in charge of end-to-end data transmission. It has two ways of data transmission: cut-through and store-forward. Routing node with cut-through transmission requires predetermined global rout-ing information. It does not provide data storage. Instead, store-forward transmission needs temporary data storage in routing node. Routing pathway is decided depending on its radio links to succeeding nodes. Thus, store-forward transmission is for high reliable data communica-tion. In this study, we adopt store-forward data transmission as the communication protocol of the orchard monitoring system. In order to learn about each wireless node’s performance, we need to record the routing information of each data frame from source sensing node to base station. The structure of the data frame is designed as follows,
#, routing mark in routing cluster (4 bytes), routing mark in sensing cluster (2 bytes), sensing cluster code (1 byte), node code in a sensing cluster (half byte), frame sequence code (half byte), data sequence (22 bytes), *
A data frame of 32 bytes long starts with # and ends with *. Both source sensing node from which a data frame is sent and other nodes through which the frame is retrans-ferred are recorded in the data frame itself. In an orchard monitoring sys-tem, the sensing cluster is encoded from 0 to 255, among which both 0 and 255 are saved for system broad-casting. The valid sensing cluster code is 1-254. Node code in a sens-ing cluster is 0-15, among which 0 is for sink node, 1-14 for sens-ing node, and 15 saved for testing. Frame sequence code is 0-15, which means there are 16 various formats of data frame. Different data frames hold different data sequence. Data sequence in a data frame holds 11 words at most. Totally, each sens-ing node can define 176 data (1,611).
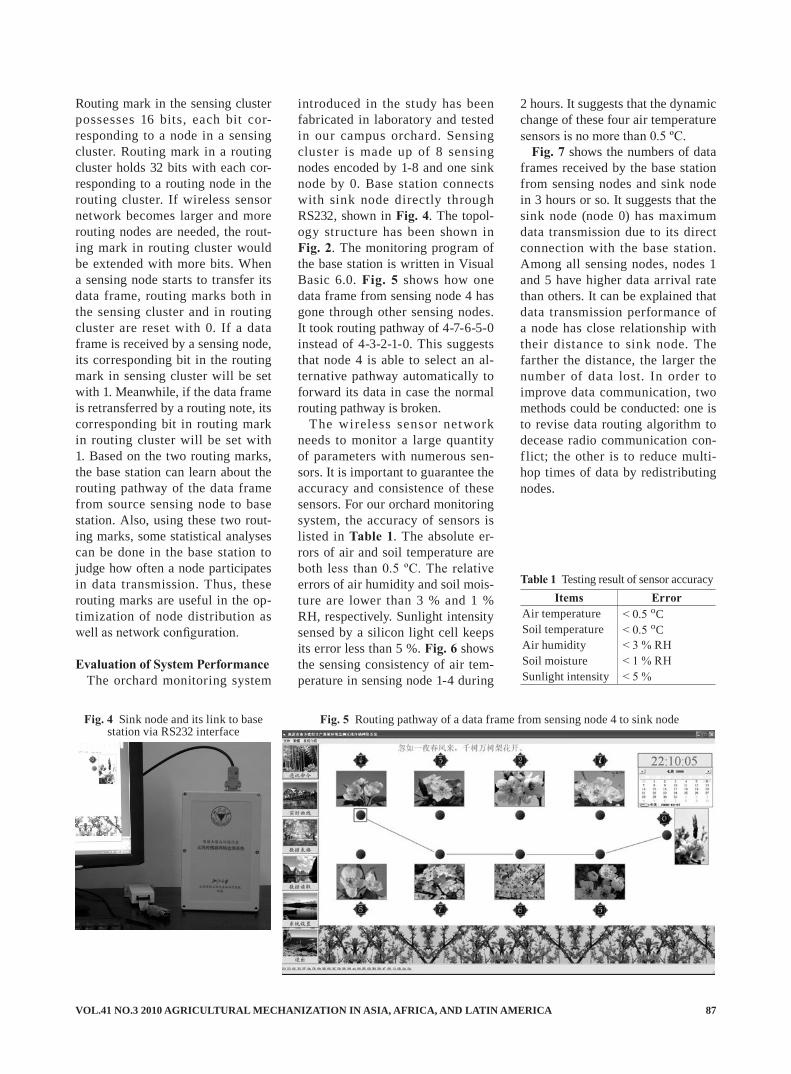
VOL.41 NO.3 2010 AGRICULTURAL MECHANIZATION IN ASIA, AFRICA, AND LATIN AMERICA 87
Routing mark in the sensing cluster possesses 16 bits, each bit cor-responding to a node in a sensing cluster. Routing mark in a routing cluster holds 32 bits with each cor-responding to a routing node in the routing cluster. If wireless sensor network becomes larger and more routing nodes are needed, the rout-ing mark in routing cluster would be extended with more bits. When a sensing node starts to transfer its data frame, routing marks both in the sensing cluster and in routing cluster are reset with 0. If a data frame is received by a sensing node, its corresponding bit in the routing mark in sensing cluster will be set with 1. Meanwhile, if the data frame is retransferred by a routing note, its corresponding bit in routing mark in routing cluster will be set with 1. Based on the two routing marks, the base station can learn about the routing pathway of the data frame from source sensing node to base station. Also, using these two rout-ing marks, some statistical analyses can be done in the base station to judge how often a node participates in data transmission. Thus, these routing marks are useful in the op-timization of node distribution as well as network configuration.
Evaluation of System PerformanceThe orchard monitoring system
introduced in the study has been fabricated in laboratory and tested in our campus orchard. Sensing cluster is made up of 8 sensing nodes encoded by 1-8 and one sink node by 0. Base station connects with sink node directly through RS232, shown in Fig. 4. The topol-ogy structure has been shown in Fig. 2. The monitoring program of the base station is written in Visual Basic 6.0. Fig. 5 shows how one data frame from sensing node 4 has gone through other sensing nodes. It took routing pathway of 4-7-6-5-0 instead of 4-3-2-1-0. This suggests that node 4 is able to select an al-ternative pathway automatically to forward its data in case the normal routing pathway is broken.
The wireless sensor network needs to monitor a large quantity of parameters with numerous sen-sors. It is important to guarantee the accuracy and consistence of these sensors. For our orchard monitoring system, the accuracy of sensors is listed in Table 1. The absolute er-rors of air and soil temperature are both less than 0.5 ºC. The relative errors of air humidity and soil mois-ture are lower than 3 % and 1 % RH, respectively. Sunlight intensity sensed by a silicon light cell keeps its error less than 5 %. Fig. 6 shows the sensing consistency of air tem-perature in sensing node 1-4 during
2 hours. It suggests that the dynamic change of these four air temperature sensors is no more than 0.5 ºC.
Fig. 7 shows the numbers of data frames received by the base station from sensing nodes and sink node in 3 hours or so. It suggests that the sink node (node 0) has maximum data transmission due to its direct connection with the base station. Among all sensing nodes, nodes 1 and 5 have higher data arrival rate than others. It can be explained that data transmission performance of a node has close relationship with their distance to sink node. The farther the distance, the larger the number of data lost. In order to improve data communication, two methods could be conducted: one is to revise data routing algorithm to decease radio communication con-f lict; the other is to reduce multi-hop times of data by redistributing nodes.
Fig. 4 Sink node and its link to base station via RS232 interface
Fig. 5 Routing pathway of a data frame from sensing node 4 to sink node
Items ErrorAir temperature < 0.5 ºCSoil temperature < 0.5 ºCAir humidity < 3 % RHSoil moisture < 1 % RHSunlight intensity < 5 %
Table 1 Testing result of sensor accuracy
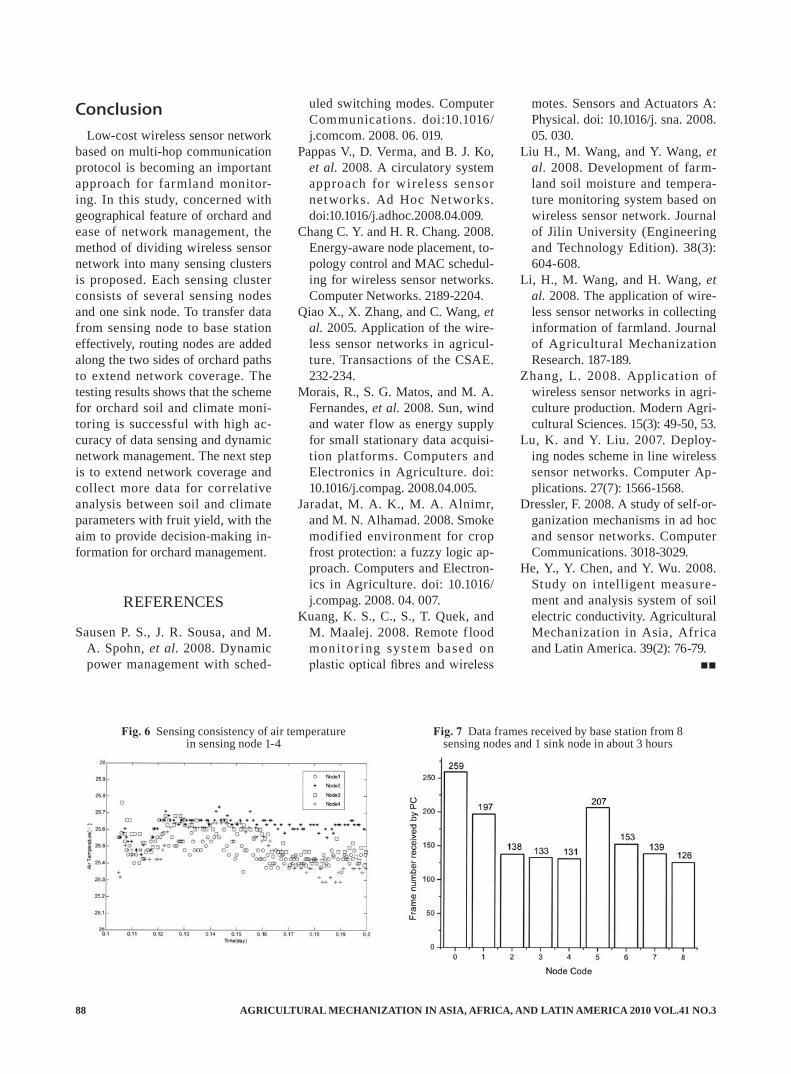
AGRICULTURAL MECHANIZATION IN ASIA, AFRICA, AND LATIN AMERICA 2010 VOL.41 NO.388
ConclusionLow-cost wireless sensor network
based on multi-hop communication protocol is becoming an important approach for farmland monitor-ing. In this study, concerned with geographical feature of orchard and ease of network management, the method of dividing wireless sensor network into many sensing clusters is proposed. Each sensing cluster consists of several sensing nodes and one sink node. To transfer data from sensing node to base station effectively, routing nodes are added along the two sides of orchard paths to extend network coverage. The testing results shows that the scheme for orchard soil and climate moni-toring is successful with high ac-curacy of data sensing and dynamic network management. The next step is to extend network coverage and collect more data for correlative analysis between soil and climate parameters with fruit yield, with the aim to provide decision-making in-formation for orchard management.
REFERENCES
Sausen P. S., J. R. Sousa, and M. A. Spohn, et al. 2008. Dynamic power management with sched-
uled switching modes. Computer Communications. doi:10.1016/j.comcom. 2008. 06. 019.
Pappas V., D. Verma, and B. J. Ko, et al. 2008. A circulatory system approach for wireless sensor networks. Ad Hoc Networks. doi:10.1016/j.adhoc.2008.04.009.
Chang C. Y. and H. R. Chang. 2008. Energy-aware node placement, to-pology control and MAC schedul-ing for wireless sensor networks. Computer Networks. 2189-2204.
Qiao X., X. Zhang, and C. Wang, et al. 2005. Application of the wire-less sensor networks in agricul-ture. Transactions of the CSAE. 232-234.
Morais, R., S. G. Matos, and M. A. Fernandes, et al. 2008. Sun, wind and water flow as energy supply for small stationary data acquisi-tion platforms. Computers and Electronics in Agriculture. doi: 10.1016/j.compag. 2008.04.005.
Jaradat, M. A. K., M. A. Alnimr, and M. N. Alhamad. 2008. Smoke modified environment for crop frost protection: a fuzzy logic ap-proach. Computers and Electron-ics in Agriculture. doi: 10.1016/j.compag. 2008. 04. 007.
Kuang, K. S., C., S., T. Quek, and M. Maalej. 2008. Remote f lood monitor ing system based on plastic optical fibres and wireless
Fig. 6 Sensing consistency of air temperature in sensing node 1-4
Fig. 7 Data frames received by base station from 8 sensing nodes and 1 sink node in about 3 hours
motes. Sensors and Actuators A: Physical. doi: 10.1016/j. sna. 2008. 05. 030.
Liu H., M. Wang, and Y. Wang, et al. 2008. Development of farm-land soil moisture and tempera-ture monitoring system based on wireless sensor network. Journal of Jilin University (Engineering and Technology Edition). 38(3): 604-608.
Li, H., M. Wang, and H. Wang, et al. 2008. The application of wire-less sensor networks in collecting information of farmland. Journal of Agricultural Mechanization Research. 187-189.
Zhang, L. 2008. Application of wireless sensor networks in agri-culture production. Modern Agri-cultural Sciences. 15(3): 49-50, 53.
Lu, K. and Y. Liu. 2007. Deploy-ing nodes scheme in line wireless sensor networks. Computer Ap-plications. 27(7): 1566-1568.
Dressler, F. 2008. A study of self-or-ganization mechanisms in ad hoc and sensor networks. Computer Communications. 3018-3029.
He, Y., Y. Chen, and Y. Wu. 2008. Study on intelligent measure-ment and analysis system of soil electric conductivity. Agricultural Mechanization in Asia, Africa and Latin America. 39(2): 76-79.
■■
VOL.41 NO.3 2010 AGRICULTURAL MECHANIZATION IN ASIA, AFRICA, AND LATIN AMERICA 89
K. SinghOlericulturistDepartment of vegetables, Punjab Agricultural University,Ludhiana-141004INDIA
by
G. S. Manes
AbstractVegetables are a major source of
protective foods in human nutrition. Also the cultivation of vegetables is one of the options to shifting from a rice-wheat rotation. One of the major hindrances in vegetable culti-vation is transplanting of seedlings which requires lot of labour (244-310 man-h/ha). Vegetables crops are sensitive and require a very timely operation. The imported machines are quite sophisticated and costly. So a two row semi-automatic trans-planter having a picker wheel type metering mechanism has been de-veloped and evaluated. It can trans-plant wash-root type seedlings of vegetables like cauliflower, tomato and chillies on the beds as well as flat fields. The plants missing were about 2 to 3 percent at a speed of about 0.8-1.0 km/h depending upon the plant to plant spacing and skill of operator. Plant mortality and yield was comparable with the man-ual transplanting. There is a savings
A. K. Dixit
Development and Evaluation of Tractor Operated Vegetable Transplanter
A. ShardaAssistant Research EngineerDepartment of Farm Power & Machinery, Punjab Agricultural University, Ludhiana-141004INDIA
of about 70-80 percent in labour re-quirement in comparison to manual transplanting, depending upon crop spacing.
IntroductionIndia is next only to China in
area and production of vegetables and occupies prime position in the production of caulif lower, second in onion and third in cabbage in the world. The area under vegetable crops was about 7.05 million ha and production was about 110.27 million tones during 2005-06 (Anon, 2008). Vegetables are a major source of protective foods in human nutrition. In Punjab, total area under vegeta-bles during 2005-06 was approxi-mately 163 thousand hectares with a production of 2.47 million tones with an average productivity of 15.1 ton per hectare (Anon, 2007). Due to increased rate of ground water depletion, emphasis is now being laid on shifting area from rice to
some other crops. Cultivation of vegetables is one of the options. One of the major problems in vegetable cultivation is transplanting of seed-lings. This requires a lot of labour, which is very costly. The depen-dence on labour is major constraint in enhancing area under these crops. The labour requirement in manual transplanting is as high as 244 -310 man-h/ha (Chaudhuri et al., 2001). Vegetable crops are sensitive and require very timely transplanting operation. Labour shortage in peak season causes delay, which leads to reduced yield. (Chaudhuri et al., 2003). One percent missing plants in the field results in reduction in yield up to 0.6 % (Saimbhi et al., 1992). The transplanting in bending posture requires an extra energy ex-penditure of 8 kJ/min and increases the heart rate by 51 percent (Nag et al., 1980). The imported machines are quite sophisticated and the semi-automatic vegetable transplanter developed earlier was found to have poor performance on traditional
Surendra SinghProject Coordinator (FIM),Central Institute of Agricultural Engineering,Nabi Bagh, Berasia Road, Bhopal-462 038INDIA
Research EngineerDepartment of Farm Power & Machinery, Punjab Agricultural University, Ludhiana-141004INDIA

AGRICULTURAL MECHANIZATION IN ASIA, AFRICA, AND LATIN AMERICA 2010 VOL.41 NO.390
seedlings because it had a gravity type metering mechanism (Anony-mous, 2002). A two row semi-automatic planter having a picker wheel type metering mechanism was developed and evaluated. It can transplant wash-root type seedlings on the beds as well as on the f lat fields.
Materials and MethodBrief Description of the Machine
The machine consisted of a frame, two lugged ground wheels, seedling tray, seat for the operator, furrow openers, compaction wheels, finger guide tunnel, picker wheel type metering mechanism and a water tank. The picking fork had a spring mounted rubber f lapper, which closes while passing through the tunnel. Again these f lappers open at the bottom end of the tunnel to release the seedlings in a furrow. The inclined wheel compact the soil around the seedlings. Power from the wheel is supplied to the plant-ing mechanism through shaft, chain and sprockets. The plant spacing in the machine can be adjusted as per the requirement of agronomic practice of a particular vegetable by changing sprockets. A stationary view of machine is shown in Fig. 1.
Isometric view of machine with de-tailed components is shown in Fig. 2. Two persons, one for each row is required to place the seedlings in the flappers when these open at the top position. The root side of the seedlings is kept towards the opera-tor. Water is sprayed on each row by the shower provided behind the picker wheel for temporary relief to the plant. Brief specifications of the machine are given in Table 1.Evaluation Procedure:
The machine was first evaluated in the laboratory to find the forward speed of the machine based on miss-ing and optimal ergonomical param-eters based on light workload (75 < HR < 100). It was observed that a person could put 30 seedlings/min-ute in the picking fingers (Table 2). Based upon this, the planter could be operated at a speed of about 1.0 km/h.
The machine was used for trans-planting vegetable seedlings of chilli, brinjal, cabbage and cauli-flower (Fig. 3). Comparative trials of each crop (three replications) were transplanted using the trans-planter and using traditional manual labour. Manual transplanting was done as per university recommenda-tions. The crop parameters of these vegetables are given in Table 3. Besides this, sarson (mustard) seed-
lings were also transplanted with transplanter on flat (45 × 26 cm) us-ing the three-row machine and by the manual method on a flat field as per recommendation of the univer-sity (45 × 15 cm). All the vegetable seedlings were transplanted using the machine at row-to-row spacing of 67 cm instead of 60 cm since it is not possible in this mechani-cal transplanting due to high tread width of available tractors. A view of the crop stand of different veg-etables is shown in Fig. 4.
Parameters SpecificationType of the machine Semi-automaticNursery type for which
machine is developedBare root type
Type of metering mechanism
Picker wheel type
No of picking fingers 10Type of pickers Rubber flappersRow spacing, cm 45-60
(Adjustable)Method of changing
plant spacingBy changing sprocket
Type of furrow openers Shoe typeWatering arrangement Two nozzlesWater tank capacity, lit 120
Table 1 Brief Specifications of vegetable transplanter
Fig. 2 An isometric view of tractor operated two-row vegetable transplanter
Fig. 1 Stationery view of tractor operated two-row vegetable transplanter
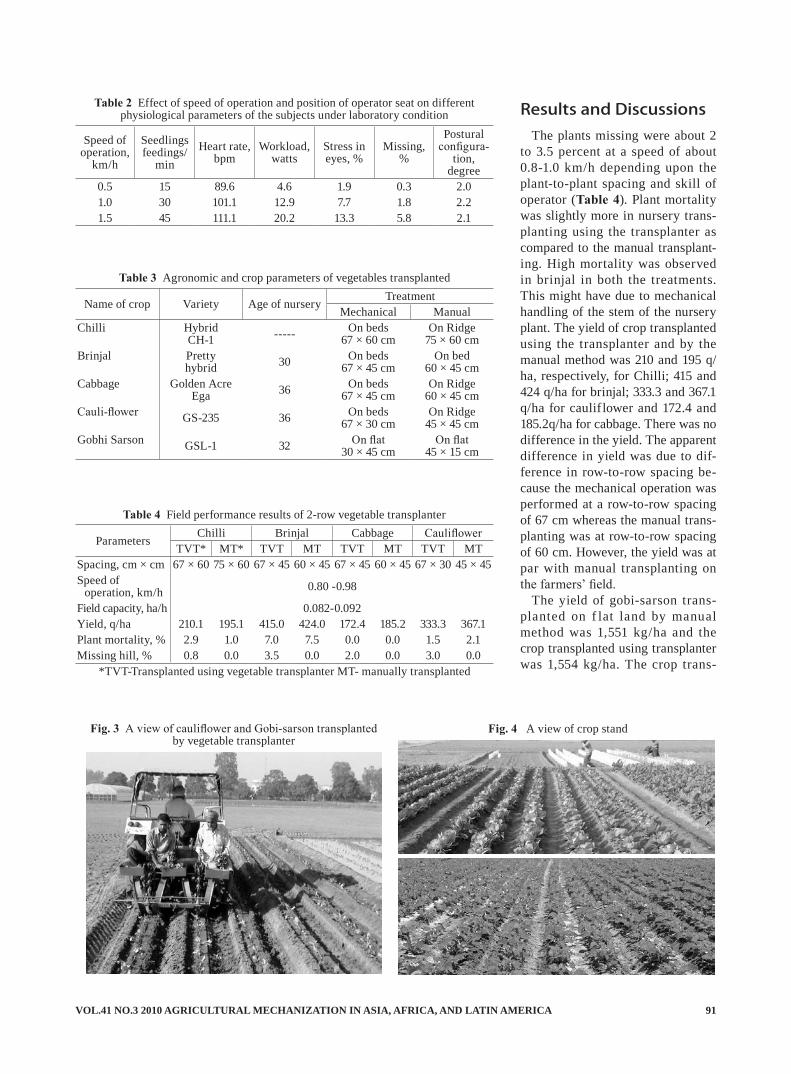
VOL.41 NO.3 2010 AGRICULTURAL MECHANIZATION IN ASIA, AFRICA, AND LATIN AMERICA 91
Speed of operation,
km/h
Seedlings feedings/
minHeart rate,
bpmWorkload,
wattsStress in eyes, %
Missing,%
Postural configura-
tion,degree
0.5 15 89.6 4.6 1.9 0.3 2.01.0 30 101.1 12.9 7.7 1.8 2.21.5 45 111.1 20.2 13.3 5.8 2.1
Table 2 Effect of speed of operation and position of operator seat on different physiological parameters of the subjects under laboratory condition
Fig. 3 A view of cauliflower and Gobi-sarson transplanted by vegetable transplanter
Results and DiscussionsThe plants missing were about 2
to 3.5 percent at a speed of about 0.8-1.0 km/h depending upon the plant-to-plant spacing and skill of operator (Table 4). Plant mortality was slightly more in nursery trans-planting using the transplanter as compared to the manual transplant-ing. High mortality was observed in brinjal in both the treatments. This might have due to mechanical handling of the stem of the nursery plant. The yield of crop transplanted using the transplanter and by the manual method was 210 and 195 q/ha, respectively, for Chilli; 415 and 424 q/ha for brinjal; 333.3 and 367.1 q/ha for cauliflower and 172.4 and 185.2q/ha for cabbage. There was no difference in the yield. The apparent difference in yield was due to dif-ference in row-to-row spacing be-cause the mechanical operation was performed at a row-to-row spacing of 67 cm whereas the manual trans-planting was at row-to-row spacing of 60 cm. However, the yield was at par with manual transplanting on the farmers’ field.
The yield of gobi-sarson trans-planted on f lat land by manual method was 1,551 kg/ha and the crop transplanted using transplanter was 1,554 kg/ha. The crop trans-
Name of crop Variety Age of nurseryTreatment
Mechanical ManualChilli Hybrid
CH-1 ----- On beds67 × 60 cm
On Ridge75 × 60 cm
Brinjal Pretty hybrid 30 On beds
67 × 45 cmOn bed
60 × 45 cmCabbage Golden Acre
Ega 36 On beds67 × 45 cm
On Ridge60 × 45 cm
Cauli-flower GS-235 36 On beds67 × 30 cm
On Ridge45 × 45 cm
Gobhi Sarson GSL-1 32 On flat30 × 45 cm
On flat45 × 15 cm
Table 3 Agronomic and crop parameters of vegetables transplanted
Parameters Chilli Brinjal Cabbage CauliflowerTVT* MT* TVT MT TVT MT TVT MT
Spacing, cm × cm 67 × 60 75 × 60 67 × 45 60 × 45 67 × 45 60 × 45 67 × 30 45 × 45Speed of
operation, km/h 0.80 -0.98
Field capacity, ha/h 0.082-0.092Yield, q/ha 210.1 195.1 415.0 424.0 172.4 185.2 333.3 367.1Plant mortality, % 2.9 1.0 7.0 7.5 0.0 0.0 1.5 2.1Missing hill, % 0.8 0.0 3.5 0.0 2.0 0.0 3.0 0.0
Table 4 Field performance results of 2-row vegetable transplanter
*TVT-Transplanted using vegetable transplanter MT- manually transplanted
Fig. 4 A view of crop stand
AGRICULTURAL MECHANIZATION IN ASIA, AFRICA, AND LATIN AMERICA 2010 VOL.41 NO.392
planted using the machine on flats had fewer plants per square meter as compared to that transplanted man-ually and gave the same yield due to more space availability to facilitate its growth in terms of more shoots per plant. The machine saved about 70-80 percent labour in comparison to manual sowing depending upon crop spacing. Due to low capacity of the machine the saving in cost was up to 10 percent.
Conclusions· The machine can transplant differ-
ent types of seedlings precisely and without any problem at a speed of about 1.0 km/h.
· The machine saves about 70-80 percent labour in comparison to manual transplanting depending upon crop spacing.
· The yield was at par with manual transplanting.
· The machine will act as a boom at the time of scarcity of labour.
REFERENCES
Anonymous. 2002. Design develop-ment and evaluation of vegetable t ransplanter. Biannual repor t (2000-01). AICRP on FIM (Lu-dhiana Centre). Presented during XXIV workshop held at TNAU Coimbatore (India) during April 18-21, 2002.
Anonymous. 2007. Area under vegetable crops during 2005-06. Package of Practices for Cultiva-tion of Vegetables. Punjab Ag-ricultural University, Ludhiana (India).
Anonymous. 2008. http:/www.In-diasat.com
Chaudhuri, D, V. V. Singh, and A. K. Dubey. 2001. Refinement and adoption of mechanical vegetable transplanters for Indian condi-tions. Paper presented in 35th an-nual convention of ISAE held at OUAT Bhuvaneshwar (India).
Chaudhuri, D,. V. Singh, and A. K. Dubey. 2003. Design and devel-opment of tractor operated two row vegetable transplanter. Paper preseted in 37th annual conven-t ion of ISAE held at CTAE, MPUAT, Udaipur (India).
Nag, P. K., N. C. Sebastian, and M. G. Mavlankar. 1980. Occupational workload of Indian agricultural workers. Ergonomics 23: 91-102.
Saimbhi, M. S., D. Singh, K. S. Sandhar, and N. P. S. Dhillon. 1992. Effect of planting space on yield of caulif lower. Journal of Research PAU 29(4): 488-92.
■■
ABSTRACTS
858Optimum Tilt Angle and Orientation for a Flat Plate
Solar Water Heater under Egyptian Conditions: Salah, M. Abdellatif, Prof. and Head of Agric. Enging Dept. Man-soura University, Egypt; Nasser, M. Elashmay, Researcher in Agric. Enging Res. Inst., Agric. Res Center, Giza, Egypt.; Ahmed, M. Kassem, Senior Researcher in Agric. Same.
Solar water heater (SWH) is a most widely used for different Agricultural and Industrial applications in Egypt. But, there are many parameters that affect solar water heater thermal performance. Tilt angle and orien-tation are considered as an important factors influenc-ing, not only the thermal performance but also the heat energy acquired by the solar system. Four identical solar water heaters were situated on the roof of Agricultural Engineering Department to investigate under clear sky conditions the effect of tilt angle and orientation on solar water heater thermal performance. They were mounted
individual on a movable frames which could be adjusted so that at any time the angle of incidence of the surface of the solar heater and the sun’s rays could be set at zero. Water could be continually cycled through the SWH. After passing through the SWH, the heater water was stored in an insulated storage tank. The obtained result clarified that the solar heater which tracked the sun’s rays once each half an hour from sunrise to sunset was more efficient than the other solar heaters. Overall thermal ef-ficiencies for SWH1, SWH2, SWH3, and SWH4 were on average 72.83%, 65.85%, 61.60%, and 55.98%, respec-tively.
904Supercritical Carbon Dioxide Extraction of Fungi-
Converted Lipids: Meishuang Dong, City College of Zhejiang University, 50 Huzhou Street, Hangzhou 310015, P. R. China; Mike Dong, Department of Animal and Food
The ABSTRACTS pages is to introduce the abstracts of the article which cannot be published in whole contents owing to the limited publication space and so many contributions to AMA. The readers who wish to know the contents of the article more in detail are kindly requested to contact the authors.
VOL.41 NO.3 2010 AGRICULTURAL MECHANIZATION IN ASIA, AFRICA, AND LATIN AMERICA 93
Science, Delaware University, 531 S College Ave., Newark, DE 19711, USA, Changqing Wu, Same.
Supercritical CO2 extraction was investigated for the lipid recovery from canola flake, in which polyunsatu-rated fatty acids (PUFAs) was added by fungi conver-sion, including arachidonic acid (ARA, C20:4n6) and eicosapentaenoic acid (EPA, C20:5n3). Up to 92% lipids were recovered during 10 hours extraction at 5,000 psi, 50°C and 2.31×10⁻⁵ kg/s CO2 flow rate. The fatty acid composition of extracted oil for the percentages of the main components, C16:0, C18:0, C18:1, C18:2, C18:3, C20:4 (ARA) and C20:5 (EPA) had no significant change during extraction. The extraction kinetics was modeled with high R2 of 0.99 and small sum of square deviations (SSD) using Goto et al. (1993) model. The feasibility was demonstrated and for lipid extraction using supercritical CO2 from fungi-converted canola flake.
911Development and Testing of an Improved Turmeric
Boiler: V.Thirupathi, Associate Professor; Department of Food & Agricultural Process Engineering, Agricultural Engineering College and Research Institute, Tamil Nadu Agricultural University, Coimbatore-03 641003, India, R. Viswanathan, Professor and Head, same.
In turmeric processing boiling is the first post harvest operation to be performed in the farm level. In the tra-ditional method of turmeric boiling, cow dung slurry was used in open vessels, which leads to lower price of the produce, loss of energy, loss of time and higher labor requirement. To overcome this problem, a steam boiling type improved turmeric boiler, has been developed and the performance of the unit was tested. Capacity of the unit was 240 kg per batch and time taken for boiling is 20 minutes. Saving of time and fuel in the improved boiler were 50 and 38 percent respectively. Time taken for dry-ing turmeric rhizomes is less when boiled in improved boiler. Curcumin, oleoresin and essential oil content were high for samples boiled in improved method.
912Vibration Charac terist ic s of Power Wee der s:
K.Kathirvel, Professor, Department of Farm Machinery, Agricultural Engineering College & Research Institute, Tamil Nadu Agricultural University, Coimbatore- 641003, INDIA, S.Thambidurai, Ph.D scholar, same, D.Ramesh, Asst. Professor, same, D.Manohar Jesudas, Professor and Head, same.
Power weeders have been developed for the mechani-cal control of weeds to alleviate the acute labour scarcity in modern agriculture. The operator of a power weeder has to endure various environments and stresses. The environment includes all the factors in the surroundings which have an effect on man-machine system. Among these factors, mechanical vibration is more important
because it significantly accelerates fatigue and affects the sensitivity and reaction rates of the operator. The machine vibration of three commercially available power weeders popular among the farmers viz., power weeder operated by 7.5 kW diesel engine (PW1), power weeder operated by 4 k W petrol engine (PW2) and power weed-er operated by 4 kW petrol start kerosene run engine (PW3) was measured at different locations viz., engine, chassis, gear box, root of handle bar and handle using the portable PULSE multi-analyzer system (Brüel & Kjaer Type 3560 C) in stationary mode at different levels of en-gine speed. The machine vibration at handle for the three power weeders was measured at 1.5, 1.8 and 2.1 km h-1 forward speed during first and second weeding in cotton crop. The vibration mapping indicated that increase in engine speed from 1,600 to 3,200 rpm resulted in three fold increase in peak acceleration at handle of PW1 and two fold increase for PW2 and PW3 power weeders in sta-tionary mode. Vibration at the top of the engine was the highest followed by handle, gear box, chassis and root of handle bar in all the three selected power weeders. Ac-celeration levels varied widely and were greatly depen-dent on variables such as forward speed, terrain, type of power weeder and mode of operation. Acceleration levels increased with forward speed of travel under all operat-ing conditions. In weeding mode, with increase in for-ward speed from 1.5 to 2.1 km h-1 the percentage increase in peak acceleration during first weeding was 98.8, 31.5 and 78.3 percent at the handle of three power weeders PW1, PW2 and PW3 respectively. Peak acceleration on the handle is lower in second weeding than the first weeding due to damping effect of soil. Among the three power weeders, the vibration induced at selected locations was maximum for power weeder PW3 followed by PW2 and PW1.
915Performance Evaluation of Reciprocating Type Grad-
er for Black Pepper: V. Thirupathi, Associate Professor, Department of Food and Agricultural Process Engineer-ing, Tamil Nadu Agricultural University, Coimbatore-641 003 INDIA, R. Visvanathan, Professor and Head, same.
Grading is done to standardize a product, to facilitate marketing, for sales appeal, for ease in quantifying, for ease in price fixing of uniform sized lot and for compli-ance of international or national grading standards. Black pepper is graded for commercial value and for export purpose. Grading was done based on size of the black pepper. Grading was done in a reciprocating type grader at different slope (10, 11.8 and 13.5º), stroke length (1:1, 1:2 and 1:3) and peripheral speed (113,138, 163 and 188 m/min). Maximum grading efficiency of 87.12 percent was obtained for black pepper at 163 m/min peripheral speed, 1:2 stroke length and 11.8º slope.
■■

AGRICULTURAL MECHANIZATION IN ASIA, AFRICA, AND LATIN AMERICA 2010 VOL.41 NO.394
-AFRICA-Benedict KayomboAssociate Professor of Soil and Water Engineering, Dept. of Agric. Engineering and Land Planning, Botswana College of Agriculture, University of Bo-tswana, Private Bag 0027, Gaborone, BOTSWANA.TEL(+267)-3650125, FAX(+267)-328753E-mail: [email protected]
Mathias Fru FontehAsst. Professor and Head, Dept. of Agric. Engineer-ing, Faculty of Agriculture, University of Dschang, P.O. Box 447, Dschang, West Province, CAMEROONTEL+237-45-1701/1994, FAX+237-45-2173/1932E-mail: [email protected]
Ahmed Abdel Khalek El BeheryAgric Engineering Research Institute, Agricultural Reserch Center, Nadi El-Said St. P.O. Box 256, Dokki 12311, Giza, EGYPT
Ali Mahmoud El HossarySenior Advisor to the Ministry of Agriculture and Chairman of (AGES)-Agengineering Consulting Group, Ministry of Agriculture - P.O.Box 195 Zama-lek 11211 Cairo, EGYPTTEL00-202-335-9304, FAX00-202-3494-132
B. S. PathakProject Manager, Agric. Implements Research and Improvement Centre, Melkassa, ETHIOPIA
Richard Jinks BaniLecturer & Co-ordinator, Agric. Engineering Div., Faculty of Agriculture, University of Ghana, Legon, GHANA
Israel Kofi DjokotoSenior Lecturer, University of Science and Technol-ogy, Kumasi, GHANA
David Kimutaiarap SomeProfessor, Deputy Vice-chancellor. Moi University, P.O. Box: 2405, Eldoret, KENYA
Karim HoumyProfessor and head of the Farm Mechanization Dept., Institute of Agronomy and Velerinary Medi-cine II, Secteur 13 Immeuble 2 Hay Riad, Rabat, MOROCCO, Tel+212-7-68-05-12, Fax+212-7-775801E-mail: [email protected]
Joseph Chukwugotium IgbekaProfessor, Dept. of Agricultural Engineering, Univ. of Ibadan,, Ibadan, NIGERIATEL+234-2-8101100-4, FAX+234-281030118E-mail: [email protected]
E. U. OdigbohProfessor, Agricultural Engg Dept., Faculty of En-gineering, University of Nigeria, Nsukka, Enugu state, NIGERIA, TEL+234-042-771676, FAX042- 770644/771550, E-mail: [email protected]
Kayode C. OniDirector/Chief Executive, National Centre for Agric. Mechanization (NCAM), P.M.B.1525, Ilorin, Kwara State, NIGERIATEL+234-031-224831, FAX+234-031-226257E-mail: [email protected]
Linus U. OparaResearch Professor, S. Africa Chair in Postharvest Technology, Faculty of AgriSciences, Stellenbo-sch University, Private Bag X1, Stellenbosch 7602, SOUTH AFRICATEL+27-21-808-4604, FAX+27-21-808-2121, E-mail: [email protected]
N. G. KuyembehAssociate Professor, Njala University Colle, Univer-sity of Sierra Leone, Private Mail Bag, Free Town, SIERRA LEONETEL+249-778620-780045, FAX+249-11-771779
Abdien Hassan AbdounMember of Board, Amin Enterprises Ltd., P.O. Box 1333, Khartoum, SUDAN
Amir Bakheit SaeedAssoc. Professor, Dept. of Agric. Engineering, Fac-ulty of Agriculture, University of Khartoum, 310131 Shambat, SUDAN, TEL+249-11-310131
Abdisalam I. KhatibuNational Prolect Coordinafor and Direcror, FAO Ir-rigated Rice Production, Zanzibar, TANZANIA
Edward A. BaryehProfessor, Africa University, P.O.Box 1320, Mutare, ZIMBABWE
Solomon Tembo52 Goodrington Drive, PO Mabelreign,Sunridge, Harare, ZIMBABWE
-AMERICAS-Hugo Alfredo CetrangoloFull Professor and Director of Food and Agribusi-ness Program Agronomy College Buenos Aires University, Av. San Martin4453, (1417) Capital Fed-eral, ARGENTINATEL+54-11-4524-8041/93, FAX+54-11-4514-8737/39E-mail: [email protected]
Irenilza de Alencar NääsProfessor, Agricultural Engineering College, UNI-CAMP, Agricultural Construction Dept.,P.O. Box 6011, 13081 -Campinas- S.P.,BRAZILTEL+55-19-7881039, FAX+55-19-7881010E-mail: [email protected]
A. E. GhalyProfessor, Biological Engineering Deparment Dalhousie University, P.O. Box 1000, Halifax, Nova Scotia, B3J2X4, CANADATEL+1-902-494-6014, FAX+1-902-423-2423E-mail: [email protected]
Edmundo J. HetzProfessor, Dept. of Agric. Eng. Univ. of Concepcion, Av. V.Mendez 595, P.O. Box 537, Chillan, CHILETEL+56-42-216333, FAX+56-42-275303E-mail: [email protected]
A. A. ValenzuelaEmeritus Professor, Ag. Eng. Fac., University of Concepcion,Casilla537Chillan, CHILETEL+56-42-223613, FAX+56-42-221167
Roberto AguirreAssociate Professor, National University of Colom-bia, A.A. 237, Palmira, COLOMBIATEL+57-572-2717000, FAX+57-572-2714235E-mail: [email protected]
Omar Ulloa-TorresProfessor, Escuela de Agricultura de la Region, Tropical Humeda(EARTH), Apdo. 4442- 1000, San Jose, COSTA RICA, TEL+506-255-2000, FAX +506-255-2726, E-mail: [email protected]
S. G. Campos MaganaLeader of Agric. Engineering Dept. of the Gulf of Mexico Region of the National Institute of Forestry and Agricultural Research, Apdo. Postal 429. Vera-cruz, Ver. MEXICO
B Kayombo M F Fonteh A A KEl Behery
A MEl Hossary
B S Pathak R J Bani I K Djokoto D K Some K Houmy J C Igbeka
E U-Odigboh K C Oni N GKuyembeh
A HAbdoun
A B Saeed A I Khatibu E A Baryeh S Tembo H ACetrangolo
I de A Nääs A E Ghaly E J Hetz A AValenzuela
R Aguirre O Ulloa-Torres S G CMagana
H Ortiz-Laurel W JChancellor
M R Goyal
Co-operating Editors
L U Opara
VOL.41 NO.3 2010 AGRICULTURAL MECHANIZATION IN ASIA, AFRICA, AND LATIN AMERICA 95
A KMahapatra
Hipolito Ortiz-LaurelHead of Agric. Engineering and Mechanization Dept./ Postgraduate College, Iturbide 73, Salinas de Hgo, S.L.P., C.P. 78600, MEXICOTEL+52-496-30448, FAX+52-496-30240
William J. ChancellorProfessor Emeritus, Bio. and Agr. Eng. Dept., Univ. of California, Davis, CA, 95616, U.S.A.TEL+1-530-753-4292, FAX+1-530-752-2640E-mail: [email protected]
Megh R. GoyalProf./Agric & Biomedical Engineering, University of Puerto Rico, P.O.Box 0086, RINCON, Puerto Rico, 00677-0086, U.S.A., TEL+1-939-697-8039
Ajit K. MahapatraPresent add: Agric. & Biosystems Eng. Dept., South Dakota State Univ., P.O. Box2120 Brook-ings, SD 57007-1496, U.S.A., TEL605-6885291, FAX 605-6886764, E-mail: [email protected]
-ASIA and OCEANIA-Graeme R. QuickConsulting Enginner, 83 Morrisons Road, Peaches-ter, Queensland, 4519, AUSTRALIA
Shah M. FaroukProfessor (Retd.),Farm Power & Machinery Dept., Bangladesh Agricultural University, Mymensingh 2200, BANGLADESH, TEL+880-91-5695ext.2596, FAX91-55810, E-mail: [email protected]
Daulat HussainDean, Faculty of Agric. Engineering and Tech-nology, Bangladesh Agricultural University, My-mensingh-2202, BANGLADESH, TEL+880-91-52245, FAX91-55810, E-mail: [email protected]
Mohammed A. MazedMember-Director, Bangladesh Agri. Res. Council, Farmgate, Dhaka, BANGLADESHE-mail: [email protected]
Chetem WangchenProgramme Director Agricultural Machinery Centre Ministry of Agriculture Royal Government of Bhutan, Bondey Paro Bhutan 1228, BHUTAN, E-mail: [email protected]
Wang WanjunPast Vice Director and Chief Engineer/Chinese Academy of Agricultural Mechanization Sciences, 1 Beishatan, Beijing, 100083, CHINA
TEL+86-(0)83-001-6488-2710, FAX001-6488-2710E-mail: [email protected]
Sarath IllangantilekeRegional Representative for South and West Asia, International Potato Center (CIP), Regional Office for CIP-South & West Asia, IARI (Indian Ag-ric. Res. Institute) Campus, Pusa, New Delhe-12, 110002, INDIA, TEL+91-11-5719601/5731481, FAX./5731481, E-mail: [email protected]
S. M. IlyasDirector, National Academy of Agricultural Re-search Management (NAARM), Rajendranagar, Hyderabad-500030, INDIA, Tel+91-40-24015070, Fax:+91-41-24015912, E-mail: [email protected]
A. M. Michael1/64, Vattekunnam, Methanam Road, Edappally North P.O., Cochin, 682024, Kerala State, S. INDIA
Gajendra SinghProfessor, Gajendra Singh, Former Vice Chancellor, Doon University 260, SFS Flats, Ashok Vihar Phase IV, Delhi-110052 INDIA, TEL+91-11-2730 7664, Email: [email protected]
T. P. OjhaDirector General(Engg.) Retd., ICAR, 110, Vineet Kung Akbarpur, Kolar Road, Bhopal, 462 023, INDIATEL+91-755-290045
S. R. VermaEx-Dean & Professor of Agr. Engg., H. No. 14, Good Friends Colony, Barewal Road, Ludhiana 141012. Punjab, INDIA, TEL+91-161-2551096E-mail: [email protected]
SoedjatmikoPresident, MMAI(Indonesian Soc. of Agric. Eng. & Agroindustry), Menara Kadin Indonesia Lt.29 Jl. HR. Rasuna Said X-5/2-3 Jakarta, 12940, INDONESIATEL+62-(0)21-9168137/7560544, FAX(0)21-5274485/5274486/7561109
Mansoor Behroozi-LarProfessor, Agr. Machinery, Ph.D, Tehran University Faculty of Agriculture, Karaj, IRANTEL+98-21-8259240, E-mail: [email protected]
Saeid MinaeiAssistant Professor, Dept. of Agr. Machinery Eng., Tarbiat Modarres Univ., P.O.Box 14115-111, Tehran, IRANTEL+9821-6026522-3(office ext.2060, lab ext.2168)FAX+9821-6026524, E-mail: [email protected]
Jun SakaiProfessor Emeritus, Kyushu University, 2-31-1 Chi-haya, Higashi-ku, Fukuoka city, 813, JAPANTEL+81-92-672-2929, FAX+81-92-672-2929E-mail: [email protected]
Bassam A. SnobarProfessor and Vice President, Jordan University of Science and Technology, P.O.Box 3030 Irbid, 22110, JORDAN, TEL+962-2-295111, FAX+962-2-295123E-mail: [email protected]
Chang Joo ChungEmeritus Professor, Seoul National University, Ag-ricutural Engineering Department, College of Agri-culture and Life Sciences, Suwon, 441-744, KOREATEL+82-(0)331-291-8131, FAX+82-(0)331-297-7478E-mail: [email protected]
Chul Choo LeeMailing Address: Rm. 514 Hyundate Goldentel Bld. 76-3 Kwang Jin Ku,Seoul, KOREATEL+82-(0)2-446-3473, FAX+82-(0)2-446-3473E-mail: [email protected]
Muhamad Zohadie BardaieProfessor, Department of Agricultural and Biosys-tems Engineering, University Putra Malaysia, 43400 upm, Serdang, Serdangor, MALAYSIATEL+60-3-89466410Email: [email protected]
Madan P. PariyarConsultant, Rural Development through Selfhelp Promotion Lamjung Project, German Technical Cooperation. P.O. Box 1457, Kathmandu, NEPAL
David Boakye AmpratwumAssociate Professor, Dept.of Bioresource and Agri-cultural Engineering, College of Agriculture, Sultan Qaboos University, P.O. Box 34, Post Code 123, Muscat, Sultanate of Oman, OMANTEL+968-513866, FAX513866E-mail: [email protected]
EITag Seif Eldin Mailling Address: Dept. of Agric. Mechanization, College of Agriculture, P.O. Box 32484, Al-Khod, Sultan Qaboos University, Muscat, Sultanate of Oman, OMAN
Allah Ditta ChaudhryProfessor and Dean Faculty of Agric. Engineering and Technology, University of Agriculture, Faisala-bad, PAKISTAN
G R Quick S M Farouk DaoulatHussain
M A Mazed Chetem Wangchen
Wang Wanjun
S Illangantileke S M Ilyas A M Michael
T P Ojha S R Verma Soedjatmiko M Behroozi-Lar
Saeid Mi-naei
J Sakai B A Snorbar C J Chung C C Lee
M ZBardaie
M P Pariyar D BAmpratwum
E S Eldin A DChaudhry
A Q Mughal R ur Rehmen B TDevrajani
N AAbu-Khalaf
Surya Nath
G Singh

AGRICULTURAL MECHANIZATION IN ASIA, AFRICA, AND LATIN AMERICA 2010 VOL.41 NO.396
R PVenturina
A. Q. A. MughalVice Chancellor, Sindh Agriculture University, Tan-dojam, PAKISTAN
Rafiq ur RehmanDirector, Agricultural Mechanization Reserch Insti-tute, P.O. Box No. 416 Multan, PAKISTAN
Bherulal T. DevrajaniProfessor and Chairman, Faculty of Agricultural En-gineering, Sindh Agriculture University, Tandojam, Sindh, PAKISTANTEL+92-2233-5594
Nawaf A. Abu-KhalafEngineer, the Project Directorate in Palestinian Ag-ricultural Ministry, P.O.Box 405, Hebron, PALESTINETelfax: 972-2-2227846/7E-mail: [email protected]
Surya NathAssoci. Prof., Dept. of Agriculture, Papua New Guinea University of Technology, Private Mail Basg, Lae, PAPUA NEW GUINEA, TEL+675-475-5162, FAX473-4477, E-mail: [email protected]
Reynaldo M. LantinProfessor, College of Engineering and Agro-Indus-trial Technology University of the Philippines Los Banos, Laguna 4031, PHILIPPINESTEL+63-(0)49-536-2792, FAX+63-(0)49-536-2873E-mail: [email protected]
Ricardo P. VenturinaPresident & General Manager, Rivelisa publishing House, 215 F, Angeles St. cor Taft Ave. Ext., 1300 Pasay City, Metro Manila,PHILIPPINES
Saleh Abdulrahman Al-suhaibaniProfessor, Agricultural Engineering Dept.,College of Agriculture, King Saud University,P.O. Box 2460 Riyadh 11451, SAUDI ARABIA
Ali Mufarreh Saleh Al-AmriProfessor, Dept. of Agric. Engineering, Colleg of Agricultural and Food Sciences, King Faisal Univer-sity, Al-Ahsa,SAUDI ARABIAE-Mail: [email protected],[email protected]
Sen-Fuh ChangProfessor, Agric.-Machinery Dept. National Taiwan University, Taipei, TAIWAN
Tieng-song PengDeputy Director, Taiwan Agricultural Mechaniza-tion Research and Development Center. FL. 9-6, No. 391 Sinyi Road, Sec. 4, TAIWAN
Suraweth KrishnasreniSenior Expert in Agricultural En-gineering, Depart-ment of Agricul-ture, Chatuchak, Bangkok 10900, THAILANDTel5792153,5794497,5798520,Ext.124, Fax9405791, E-mail: [email protected]
Surin PhongsupasamitPresident, Institute for Promotion of Teaching Sci-ence and Technology, 924 Sukumit Rd. Klong Toey Bangkok, THAILAND
Chanchai RojanasarojResearch and Development Engineer, Dept. of Ag-riculture, Ministry of Agriculture and Cooperatives, Gang-Khen, Bangkok 10900, THAILAND
Vilas M. SalokheProfessor, AFE Program, Asian Institute of Technol-ogy, P.O. Box 4, Klang Luang. Pathumthani 12120, THAILAND, TEL+66-2-5245479, FAX+66-2-5246200E-mail: [email protected]
Yunus PinarProfessor, and Head, Agric. Machinery Dept, Fac-ulty of Agriculture, University of Ondokuz Mayis, Kurupelit, Samsun, TURKEY
Imad HaffarManaging Director, Palm Water Jumeirah Village (SIte Office Gate #10) Al Khail Road, P.O. Box 215122, Dubai, UAE, Tel+971-4-375-1196, FAX+971-4-429-0574 E-mail: [email protected]
Nguyen HayAssociate Professor, Dean of Faculty of Engineering, Nonglam University, Linh Trung Ward, Thu Duc Dis-trict, Ho Chi Minh City, VIET NAME-mail: [email protected]
Pham Van LangDirector, Vietnam Institute of Agricultural Engineer-ing, A2-Phuong Mai, Dong Da Hanoi, VIET NAM
Abdulsamad Abdulmalik Hazza,aProfessor and Head of Agricultural Engineering De-partment, Faculty of Agriculture, Sana,a University, P.O.Box 12355, Sana,a YEMEN, Tel+9671-407300, Fax:9671-217711, E-mail: [email protected]
-EUROPE-Anastas Petrov KaloyanovProfessor & Head, Research Laboratory of Farm Mechanization, Higher Institute of Economics, So-fia, BULGARIA
Pavel KicVice-Dean/Technical Faculty, Czech University of Agriculture Prague, 16521 Prague 6-Suchdol, CZECH, Tel+420-2-24383141, Email: [email protected]
Joachim MüllerFull Professor at the University Hohenheim, Insti-tute of Agricultural Engineering, Head of Agricul-tural Engineering in the Tropics and Subtropics, University of Hohenheim, 70593 Stuttgart, GERMA-NY, Tel+0711-459-22490, E-mail: joachim.muller@ uni-hohenheim.de
Giuseppe PellizziDirector of the Institute of Agric. Engineering of the University of Milano and Professor of Agric. Machinery and Mechanization, Via G. Celoria, 2-20133 Milano, ITALY, Tel+39-02-503-16871, E-mail: [email protected]
W. B. HoogmoedUniversity Lecturer, Faculty of Lsg Agrarische Bedrii-jfstechnologie, Wangeningen University, Agrotech-nologie en Voedingswetenshappen, Bornsesteeg 59, 6700 AA, Wageningen, P.O.Box 17, NETHERLAND, E-mail: [email protected]
Jan PawlakProfessor, head of the Dept. of Economics and Utilization of Farm Machines at IBMER, Professor at the Univ. of Warmia and Mazury in Olsztyn, Fac. of Tech. Sci., POLAND
Oleg S. MarchenkoProfessor and agricultural engineer, Department Head in All-Russia Research Institute for Mechani-zation in Agriculture (VIM), 1st Institutsky proezd, 5, Moscow 109428, RUSSIA, Tel+7(095)174-8700, Fax+7(095)171-4349, E-mail: [email protected]
John KilgourSenior Lecturer in Farm Machinery Design at Silsoe College, Silsoe Campus, Silsoe, Bedford, MK45 4DT, UK
Milan MartinovProfessor, Faculty of Engineering, Chair for Biosys-tems Engineering, Novi Sad, SERBIA, TEL+ 381-21-485-2369, Fax++381-21-635-0592 E-mail: [email protected]
O SMarchenko
J Kilgour M Martinov
S AAl-Suhaibani
A M SAl-Amri
S F Chang T S Peng S Krishnasreni S Phong-supasamit
C Rojanasaroj V M Salokhe
Y Pinar I Haffar P V Lang A A Hazza,a A P
KaloyanovP Kic J Müller G Pellizzi
Jan Pawlak
N Hay
R M Lantin
W BHoogmoed
VOL.41 NO.3 2010 AGRICULTURAL MECHANIZATION IN ASIA, AFRICA, AND LATIN AMERICA 97
Back Issues
Vol.39, No.4, Autumn, 2008Biomass Heat-Emission Characteristics of
Energy Plants (Jan Malaťák, A. K. Gürdil, Petr Jevic, K. Çagatay Selvi) .......................
Comparative Grain Supply Chain in Canada and China (L. Fan, D. S. Jayas) ...................
Investigation into Farm Mechanization Prac-tices for Cassava and Yam in Rivers State, Nigeria (S. O. Nkakini, O. Ceder) ...............
Domestic Solar Geyser Cum Distiller (S. H. Sengar, A. K. Kurchania) .............................
Laser Guided Land Leveler: Precession Leveler With Laser Technology for Land Preparation (B. Suthakar, K. Kathirvel, R. Manian, D. Manohar Jesudas) .....................
Development and Testing of Engine Operated Pneumatic Cotton Picker (A. Yajuddin) ......
The Effect of Two Type of Plows With Four Speeds on the Field Capacity and Bulk Density (Ali Mazin Abdul-Munaim, Maysm Thamer Al-Hadidy) ........................
Development and Evaluation of Direct Paddy Seeder for Assessing the Suitability to Rural Woman (D. Sirisha, K. Kathirvel, R. Manian) .........................................................
Development and Evaluation of Farm Level Turmeric Processing Equipment (U. S. Pal, K. Khan, N. R. Sahoo, G. Sahoo) ................
Effect of Threshing Cylinders on Seed Dam-age and Viability of Moongbean (Virna radiate. (L.) Wilezee) (Shiv Kumar Lohan)
Engineering the Application of Grain Pro-tectants on F1 Hybrid Rice Seed: The Philippine-HRCP Experience (Ricardo F. Orge, John Eric O. Abon) .............................
Development and Performance of a Solar-Cum-Gas Fired Dates Dryer (Munir Ah-mad, Asif A. Mirani) ....................................
Formation of Generalized Experimental Models for Double Roller Gin (P. G. Patil, P. M. Padole, J. F. Agrawal, A. B. Dahake) .
Preservation and Storage of Perishable Fresh Fruits and Vegetables in the Lowlands of Papua New Guinea (Surya Nath, Simon Sil) .................................................................
Annual Costs of Mechanizing With Tractors in Tanzania (Sylvester Mpanduji, Baanda Salim) ............................................................
◇ ◇ ◇
Vol.40, No.1, Winter, 2009Comparative Evaluation of Different Ground-
nut Digging Blades (S. H. Suryawanshi, B. Shridar, K. Kathirvel) ..................................
Designing and Testing an Improved Maize Sheller (I. K. Tastra) .....................................
Development of a Chopping Machine for Ag-ricultural Residue (a Case Study on Grape Trashes) ( Ismail Fouad Sayed-Ahmad, N. El-Desoukey, M. A. Metwally, A. B. El-Nagar) ............................................................
Establishment and Performance of Indege-neous Small Scale Rice Processing Plant in Nigeria (Gbabo Agidi)..................................
Development and Performance Evaluation of
a Garlic Bulb Breaker (V. D. Mudgal, S. B. Sahay) ............................................................
Mechanized Rice Cultivation in Bangladesh: Past Experiences and Future Potentials (Syedul Islam, S. M. M. Rahman, M. A. Rahman, M. A. Quasem, M. D. Huda, AKM S. Islam, M. Ahiduzzaman, M. G. K. Bhui-yan, M. A. Hossen, M. A. Baqui) ..................
Status of Farm Power Availability in the Se-lected Villages of Jammu District (J & K States) (Sushil Sharma) ................................
Indoor Storage of Paddy-Rice in the Low-lands of Papua New Guinea (Surya Nath) ..
Threshing Unit Losses Prediction for Thai Axial Flow Rice Combine Harvester (Som-chai Chuan-Udom, Winit Chinsuwan) .......
Development and Performance Evaluation of Prototype Double Roller Gin (P. G. Patil, P. M. Padole, J. F. Agrawal, A. B. Dahake) ...
Impact of Tillage and Nutrient Management in Maize-Wheat Crop Rotation Under Dry-land Cultivation (J. P. Singh, Vikas Abrol, Syed Zameer Hussain).................................
Status of Post Harvest Technology of Guar (Cyamopsis Tetragonoloba) in India (R. K. Vishwakarma, S. K. Nanda, U. S. Shivhare, R. T. Patil) ......................................................
Constraction and Performance Evaluation of a Local Device for Separating Sunflower Seeds and Environment Preservation (A. Lofty).............................................................
Design of a Pollination Device for Palm Tree (I. Yehia)........................................................
Small Scale on Farm Mechanization in Wal-nut Cultivation (Junaid N. Kahn, Jagvir Dixit, Navin C. Shahi) .................................
◇ ◇ ◇
Vol.40, No.2, Spring, 2009Design and Performance Evaluation of a
Small Tractor-Simulator (Indra Mani, J. S. Panwar) .........................................................
Farm Power Status and Its Utilization Pat-tern in Nalanda District of Bihar - A Case Study (V. B. Shambhu, J. P. Gupta, S. K. Jha, Sanjay Kumar) .....................................
Evaluation of a Nylon Towrope for Buffering Pulling Forces of Animal-drawn Utility Wagons (Timothy M. Harrigan, Richard J. Roosenberg) .................................................
The Influence of Some Parameters to Quality of Brown Rice After Husking on Small Productivity Rice Husker in the Rural Areas of Lamdong Province (Nguyen Hay, Pham Can) .....................................................
Improved Cost Effective Implements for Small Rice Farmers (Jagvir Dixit, J. N. Khan) .............................................................
Development and Modeling of Mobile Disin-tegrator (S. M. Bhende, N. P. Awate, D. S. Karale, S. P. Trikal, V. P. Khambalkar) .....
Development and Performance Evaluation of Tractor Operated Plant Uprooter for Castor Crop (H. B. Solanki, Rajvir Yadav) ...........
Design, Development and Evaluation of a
Peanut Sheller (M. A. Rostami, F. Azad-shahraki, H. Najafinezhad)..........................
Factors Affecting Breaking Force Distribu-tion of Wheat Kernel Before Milling (I. E. A. Elbatawi) ..................................................
Development of Tillage Machinery for Con-servation Agriculture in Bangladesh (K. C. Roy, M. E. Haque, Scott Justice, Israil Hossain, C. A. Meisner) ..............................
Development and Performance Evaluation of a Tractor Operated Cotton Stalk Shredder Cum Insitu Applicator (T. Senthilkumar, R. Manian, K. Kathirvel) ............................
Design Development and Performance Evalu-ation of Cotton Loading and Unloading Machine for Heaping (S. K. Shukla, V. G. Arude, P. G. Patil) ........................................
Ergonomically Designed Thresher (S. V. Gole, Rashmi Shahu) ...................................
Study of Kharang Grader in Bhutan (Ugyen Drukpa, Chetem Wangchen, Karma Thin-ley, Hai Sakurai) .......................................... Biomass Utilization for Thermal Energy (Gürkan A. K. Gürdİl, Jan Malaťák, K. Çağatay Selvİ, Yunus Pinar) .......................
◇ ◇ ◇
Vol.40, No.3, Summer, 2009Parasol Sprayer for Efficient Chemical Ap-
plication in Dwarf and Semi Dwarf Mango Orchards (C. Ramana, D. Manohar Jesu-das) ................................................................
Development of Rice Cleaner for Reduced Impurities and Losses (M. N. El-Awady, I. Yehia, M. T. Ebaid, E. M. Arif) ...................
Evaluation of a Handy Tool for Sugacane De-Trashing (G. Kathiresan) .............................
Performance of a Mixed-Mode Type Solar Crop Dryer in Drying Rough Rice Under Natural Convection (M. A. Basunia, T. Abe) ...............................................................
Research on Shear Characteristics of Chinese Cabbage Rootstalk (Xu Liming, Yao Huil-ing) ................................................................
Design, Development and Performance Eval-uation of Rota Drill (Muhammad Yasin, Muhammad Anjum Ali) ..............................
Effect of Seedlings Age on Performance of Rice Transplanter (Aswini K. Goel, S. Swain, Debaraj Behera) ...............................
Development of a Motorized Stationary Sor-ghum Thresher (K. J. Simonyan) ................
Performance Enhancement of Traditional Un-peeled Longan Dryers with Design Modifi-cation (Nakorn Tippayawong, Chutchawan Tantakitti, Satis Thavornun) ........................
Conversion of Large Diesel Engine to Run on Biogas for High Efficiency Electrical Power Generation (S. Siripornakarachai, T. Sucharitakul) ................................................
Empirical Equations to Predict the Tractor Center of Gravity (S. M. Abd El Aal) .........
The Utilization of a Drilling Planter for Rice Band Sowing (Ismail, Z. E) .........................
Optimum Tilt Angle and Orientation for a
(Vol.39, No.4, Autumn, 2008-)
9
14
22
28
30
37
39
41
46
51
55
63
69
75
81
9
12
18
25
32
36
41
46
50
55
60
65
73
78
81
9
13
22
27
30
36
41
47
50
58
65
68
73
76
80
9
15
21
23
30
35
41
47
56
59
64
69
AGRICULTURAL MECHANIZATION IN ASIA, AFRICA AND LATIN AMERICA
AGRICULTURAL MECHANIZATION IN ASIA, AFRICA, AND LATIN AMERICA 2010 VOL.41 NO.398
Flat Plate Solar Water Heater under Egyp-tian Conditions (Salah, M. Abdellatif, Nasser, M. Elashmay, Ahmed, M. Kassem)
Performance Evaluation of Locally Fabricated Electric Dryer (Pema Dakpa, Hai Sakurai, Ugyen Penjore) .............................................
Liquid Wastes from Methyl Ester Oil Produc-tion and Thermal-Emission Properties (Gürkan A. K. Gürdil, Jan Malaták K. Ça-gatay Selvi, Yunus Pinar) .............................
◇ ◇ ◇
Vol.40, No.4, Autumn, 2009Soil Response to Tillage Treatments (Ismail,
Zakarya Ebrahen) .........................................Status of Biogas Technology in Akola District
of Maharashtra State (V. P. Khambalkar, S. R. Gadge, Shilpa B. Dahatonde, D. S. Karale) ...........................................................
Prediction of Surface Area of Garden Egg (Solanum Aethiopicum L) from Weight Measurements (R. J. Bani, E. Y. Kra, J. Amoah, M. Aggey) .......................................
Farm Mechanization Status and Future Strat-egies for Major Cereal and Horticultural Crops in Kashmir (Jagvir Dixit, J. N. Khan, R. M. Shukla) ....................................
Ergonomics of Self Propelled Power Weeders as Influenced by Forward Speed and Ter-rain Condition (K. Kathirvel, S. Thambi-durai, D. Ramesh, D. Manohar Jesudas) .....
A Simple Milk Churner for Ghee-Making (Abduh Muyanja, John B. Kawongolo, William S. Kisaalita) ....................................
Detection of Stress Cracks in Rice Kernels Based on Machine Vision (Xu Lizhang, Li Yaoming) .......................................................
Economical Evaluation of Mechanization Alternatives for Small Horticulturist in Chillán-Chile (Marco López, Edmundo Hetz, Claudio Villagra) ................................
Mechanical Harvesting of Fodder Maize as Influenced by Crop, Machine and Opera-tional Parameters (K. Kathirvel, B. Sutha-kar, D. Manohar Jesudas) .............................
A Hand Operated White Pepper Peeling Ma-chine (V. Thirupathi, R. Viswanathan) .......
Performance Evaluation of a Divergent Roller Grader for Selected Vegetables (S. Shahir, V. Thirupathi) ...............................................
Development of Low Cost, Bullock Drawn, Multi-Purpose Implement for Sandy Loam Soil (V. K. Chandegara) ...............................
Development and Evaluation of a Tractor-Operated Sugarcane Cleaner (Sanjay Khar, L. N. Shukla) .................................................
Design and Development of Compact Desic-cant Seed Dryer (S.S. Dhaliwal, Sukhmeet Sing, Parm Pal Singh) ..................................
Test Results of “Aquasearch Pm-600” Mois-ture Meter of “Kett Electric Laboratory” (Japan) (Pugachyov P. M., Levina N. S., Shalayeva L. A., Kotov M. G.) .....................
◇ ◇ ◇
Vol.41, No.1, Winter, 2010Field Performance and Evaluation of Manual
Paddy Transplanter in Kashmir Valley (Jagvir Dixit) .................................................
Development and Evaluation of a Mobile
73
78
83
9
15
20
23
28
34
38
42
52
57
60
63
70
75
81
9
Sprinkler System for Orchards (Alamgir Akhtar Khan, Muhammad Arshad, Mu-hammad Yasin, Muhammad Rafiq-ur-Rehman) ........................................................
Modeling for Mechanization Strategies of Rice Cultivation in Chhattisgarh, India (Ajay Kumar Verma) ....................................
Argan Nut Cracker for Southwestern Moroc-can Women (William S. Kisaalita, Meghan Shealy, Max J. Neu, Philip Jones, Jonathan Dunn) ............................................................
Vibrat ion Character ist ics of Self Pro -pelled Power Weeders (K.Kathirvel, S.Thambidurai, D.Ramesh, D.Manohar Jesudas) .........................................................
Study of the Mechanics of a 5 Hp Power Til-ler Attached to a 10-Row Garlic Planter (Jiraporn Benjaphragairat, Hai Sakurai, Nobutaka Ito) ................................................
Air-jet Seed Knockout Device for Pneumatic Precision Planters (Hassan Zaki Dizaji, Saeid Minaei, Mohammad Reza, Y. Taheri)
Sowing Methods with Different Seed Drills for Mechanizing Mountain Farming (D. K. Vatsa, Sukhbir Singh) ..................................
Performance of Sweet Potato Transplanting Machine on Mineral and Bris Soils (Akhir Hamid, Desa Ahmad, Ibni Hajar Rukunud-din) ................................................................
Optimization of Machine Parameters of Fin-ger Millet Thresher-Cum-Pearler (K. P. Singh, Supradip Saha, H. N. Mishra) ..........
Evolving Quality Rice for Temperate High-lands (Asif B. Shikari, Er. Syed Zameer, G. A. Parray, Gul Zafar) ....................................
Estimating Reliability for Redundant Agri-cultural Machinery Systems (Kunihiro Tokida) ..........................................................
Optimization of Size of Gasholder for Storage of Biogas in Unheated Biogas Plant (Sand-hya, Parm Pal Singh) ....................................
Effect of Seed Bed Preparation and Fertil-ization on Soil Water Storge and Barley Production Yield (A. Derbala, N. Abd El-Kader, T. Fouda) ...........................................
◇ ◇ ◇
Vol.41, No.2, Spring, 2010Ergonomic Intervention in Sugarcane De-
trashing (K. Kathirvel, R. Thiyagarajan, D. Ramesh, D. Manohar Jesudas).....................
Optimization of Barnyard Millet Dehulling Process Using RSM (K. P. Singh, Supradip Saha, H. N. Mishra) ......................................
Minimum Tractor Power Requirement for Ar-able Crop Production Using The Simplex Method: A Case of Barolong Agricultural District of Botswana (Ezekiel M. Chim-bombi) ...........................................................
Ergonomic Evaluation of Male and Female Operators during Weeding Operation (R. Yadav, S. Pund, L.P. Gite) ............................
Development of Automatic Chemical Sprayer (Wan Ishak Wan Ismail, Khairuddin Abdul Rahman) ........................................................
Tractor Front-Mounted Cross-Conveyor Paddy Straw Thrower (C. J. S. Pannu, L. N. Shukla) ..........................................................
Modernization of Indian Roller Gins and the Effect on Cotton Fibre Quality (V. G. Arude, S. K. Shukla, D. N. Makawan, T. S.
14
20
27
34
40
45
51
55
60
68
72
77
83
9
15
21
26
30
35
Manojkumar, J. M. Nath) .............................Sleeve Boom Sprayer- I: Design and Devel-
opment of Tractor Mounted Sleeve Boom Sprayer for Cotton (P. U. Shahare, S. K. Thakre, S. M. Mathur, Y. C. Bhatt) .............
Development and Evaluation of a Prospective Grader for Spherical Fruits (S. Mangaraj, A. C. Varshney, K. K. Singh, B. S. Reddy) .
Technological Impact on Energy Require-ments for Wheat Cultivation in North India (Radhey Shyam Singh) ................................
Grinding Characteristics of Dried Water Chestnut Kernel in Batch Processing (S. K. Garg, U. C. Lohani, P. Pandey) ....................
Man-Power Utilization in Some Unit Opera-tions of Dairy Farm (Ravi Kant Gupta, Hem Chandra Joshi) .....................................
Design and Testing of an Avian Hatchery So-lar Energy Incubator for Smallholder Poul-try Farmers from the Sudano-Sahelian Belt (William S. Kisaalita, Brian Bibens, Ed Lane, Patrick Young, Vans Randell Kinsey, Salibo Some) .................................................
■■
43
48
55
63
72
77
84

SUBSCRIPTION/ORDER FORMAGRICULTURAL MECHANIZATION IN ASIA, AFRICA AND LATIN AMERICA ( AMA )
Issued Quarterly
Subscription Rate (includes surface mail postage)
Annual (4 issues)...........................¥6,000 Single copy .......................................¥1,700
(Check one)□ Please send me/us an invoice□ I/We enclose remittance for ¥ □ Please charge my/our credit card □ VISA □ MASTER Card. No.
Exp. date
Signature
We deeply appreciate your payment by credit card. We will ask for an extra bank charge of 3.000 JPY when paid by bank transfer or a check.
******************************Name:
Firm:
Position:
Address: (block letters)
FARM MACHINERY INDUSTRIAL RESEARCH CORP.2-7-22 Kanda-Nishikicho, Chiyoda-ku, Tokyo 101-0054, Japan
Tel. (03)-3291-3674URL: http://www.shin-norin.co.jp
E-Mail: [email protected]

STAMP
FARMMACHINERYINDUSTRIALRESEARCHCORP. 2-7-22KandaNishikicho,Chiyoda-ku, Tokyo101-0054,Japan
1st FOLD HERE
2nd FOLD HERE