Vol. 60 @BULLET July 2008 @BULLET No. 4 CONTENTS The Impact of International Trade on Democracy: A...
24
Vol. 60 • July 2008 • No. 4 CONTENTS The Impact of International Trade on Democracy: A J. Ernesto López-Córdova and Long-Run Perspective Christopher M. Meissner 539 The Political Economy of Women’s Lisa Blaydes and Support for Fundamentalist Islam Drew A. Linzer 576 Does Landholding Inequality Block Democratization? A Test of the “Bread and Democracy” Thesis and the Case of Prussia Daniel Ziblatt 610 RESEARCH NOTE Social Stratification and Welfare Regimes for the Twenty-first Century: Revisiting Lyle A. Scruggs and The Three Worlds of Welfare Capitalism James P. Allan 642 REVIEW ARTICLE Federalism in Europe and Latin America: Conceptualization, Causes, and Consequences Kent Eaton 665 Index to Volume 60 699 The Contributors ii Abstracts iii Referees 2007 v WP60.4-00.fm-LM.indd 1 10/9/08 1:42:42 PM
-
Upload
independent -
Category
Documents
-
view
2 -
download
0
Transcript of Vol. 60 @BULLET July 2008 @BULLET No. 4 CONTENTS The Impact of International Trade on Democracy: A...
Vol. 60 • July 2008 • No. 4
CONTENTS
The Impact of International Trade on Democracy: A J. Ernesto López-Córdova and Long-Run Perspective Christopher M. Meissner 539
The Political Economy of Women’s Lisa Blaydes and Support for Fundamentalist Islam Drew A. Linzer 576
Does Landholding Inequality Block Democratization? A Test of the “Bread and Democracy” Thesis and the Case of Prussia Daniel Ziblatt 610
ReseaRch Note
Social Stratification and Welfare Regimes for the Twenty-first Century: Revisiting Lyle A. Scruggs and The Three Worlds of Welfare Capitalism James P. Allan 642
Review aRticle
Federalism in Europe and Latin America: Conceptualization, Causes, and Consequences Kent Eaton 665
Index to Volume 60 699
The Contributors ii
Abstracts iii
Referees 2007 v
WP60.4-00.fm-LM.indd 1 10/9/08 1:42:42 PM
Research NoteSocial Stratification
and Welfare regimeS for the tWenty-firSt century
revisiting The Three Worlds of Welfare Capitalism
By lyle a. ScruggS and JameS P. allan*
IntroductIon
in the decade and a half since its publication, gøsta esping-ander-sen’s Three Worlds of Welfare Capitalism has loomed large over the
comparative analysis of the welfare states of Western europe and other advanced capitalist economies.1 its seminal status is evidenced by the extent to which it continues to be cited in articles on comparative welfare states, and it remains required reading for most students of comparative political economy and social policy. a major reason for its enduring popularity is the strong empirical support offered for its three-regime clustering of welfare states in the Western democracies. this typology, like all effective typologies, has three advantages: it is parsimonious; countries cluster in a manner that allows researchers to examine the underlying logic of the categories; and it facilitates the development and testing of new hypotheses about causes and consequences of social policy. What made the methodology of Three Worlds truly innovative, however, was that—in contrast to many other studies—it employed a systematic empirical comparison of the programmatic aspects of numerous
* Some of the original data used in this paper were collected with support from the national Science foundation. We would like to thank lane Kenworthy, the editors of World Politics, and the anonymous reviewers for their comments on an earlier draft of this article.
1 gøsta esping-andersen, The Three Worlds of Welfare Capitalism (Princeton: Princeton university Press, 1990).
World Politics 60 ( July 2008), 642–64
WP60.4-04.scruggs.642-664-LM.indd 642 10/9/08 1:46:47 PM
socIal stratIfIcatIon and welfare regImes 643
2 there are several useful reviews of the “worlds of welfare” literature, including Wil arts and John gelissen, “three Worlds of Welfare or more? a State of the art report,” Journal of European Social Policy 12, no. 2 (2002); and esping-andersen, Social Foundations of Post-Industrial Economies (new york: oxford university Press, 1999), especially chap. 5. the number of “worlds” has been expanded to include other areas. for the antipodes, see, for example, frank castles and deborah mitchell, “iden-tifying Welfare State regimes: the links between Politics, instruments and outcomes,” Governance 5, no. 1(1992). for Southern europe, see, for example, maurizio ferrara, “the ‘Southern model’ of Welfare in Social europe,” Journal of European Social Policy 7, no. 1 (1996); and guiliano Bonoli, “clas-sifying Welfare States: a two dimension approach,” Journal of Social Policy 26, no. 3 (1997). other lines of criticism suggesting different regime arrangements concern the limited aspects of welfare state protection addressed in Three Worlds. the almost exclusive focus on a male breadwinner household model is criticized in, for example, ann orloff, “gender and the Social rights of citizenship,” Ameri-can Sociological Review 58, no. 3 (1993); diane Sainsbury, ed., Gendering Welfare States (london: Sage, 1996); and alan Siaroff, “Work Welfare and gender equality: a new typology,” also in Sainsbury. other authors argue that the focus on major social insurance/assistance programs (health care, unem-ployment, sick pay, and public pensions) is too narrow for other reasons. See, for example, graham room, “commodification and decommodification: a developmental critique,” Policy and Politics 28, no. 3 (2000); J. gal, “decommodification and Beyond: a comparative analysis of Work-injury Programmes,” Journal of European Social Policy 14, no. 1 (2004); and martin Powell and armando Barrientos, “Welfare regimes and the Welfare mix,” European Journal of Political Research 43, no. 1 (2004). finally, several have criticized the technical approach to uncovering the three regime types. See michael Shalev, “limits and alternatives to multiple regression in comparative research,” Compara-tive Social Research (greenwich, conn.: jaI Press, 2007); and alexander hicks and lane Kenworthy, “Varieties of Welfare capitalism,” Socio-economic Review 1, no. 1 (2003).
3 for a small selection of research that takes the Three Worlds typology as its starting point, see f. John mehrtens iii, “three Worlds of Public opinion? Values, Variation, and the effect on Social Policy,” International Journal of Public Opinion Research 16, no. 2 (2004); cathie Jo martin, “reinvent-ing Welfare regimes: employers and the implementation of active Social Policy,” World Politics 57 (october 2004); Stefan Svallfors, “Worlds of Welfare and attitudes to redistribution: a comparison of eight Western nations,” European Sociological Review 13, no. 3 (1997); Paul Pierson, “the new Politics of the Welfare State,” World Politics 48 ( January 1996); evelyne huber and John d. Stephens, Development and Crisis of the Welfare State: Parties and Policies in Global Markets (chicago: university of chicago Press, 2001); duane Swank, Global Capital, Political Institutions, and Policy Change in Developed Welfare States (cambridge: cambridge university Press, 2002); robert e. goodin, Bruce headey, ruud muffels, and henk-Jan dirven, The Real Worlds of Welfare Capitalism (cambridge: cambridge university Press, 1999); and emily Beller and michael hout, “Welfare States and Social mobility: how educa-tional and Social Policy may affect cross-national differences in the association between occupational origins and destinations,” Research in Social Stratification and Mobility 24, no. 4 (2006).
4 in addition to regarding welfare states as systems of social stratification, esping-andersen (in fn. 1 and in fn. 2, 74) and others such as arts and gelissen (fn. 2) have also emphasized how the degree to which national welfare regimes decommodify labor is essential to the characterization of welfare states.
national welfare regimes. in other words, evidence of regimes was (ap-parently) confirmed with social data.
While the threefold classification of welfare regimes has been called into question for a variety of reasons, it has nevertheless been embraced by literally hundreds of studies in comparative social policy and com-parative political economy.2 Because research designs have often selected cases on the basis of this typology, where a country belongs has impor-tant implications for the inferences we should draw from that research.3
in this article we reevaluate esping-andersen’s indices of social stratification from the bottom up, going back to the original sources and using better, publicly available data.4 We also provide stratification indices at two different time points, around 1980 and around 2000,
WP60.4-04.scruggs.642-664-LM.indd 643 10/9/08 1:46:47 PM
644 world polItIcs
allowing us to evaluate change in welfare stratification over time. We find only limited support for distinctive regimes of welfare stratification. these findings, combined with other recent results replicating indices of welfare state decommodification, call into question the historic and continued utility of the Three Worlds typology.5
the article proceeds as follows. We begin with a discussion of social stratification as a defining concept in the welfare regimes literature. We then examine the social data on each dimension of welfare stratifica-tion, sticking as close as possible to the original presentation. We follow with a discussion of differences over time and compare our results with those presented in Three Worlds. finally, we discuss some implications of our results for the comparative analysis of social policy in advanced industrial democracies.
the meanIng of socIal stratIfIcatIon
much scholarship on the welfare state has focused on its expansion and later retrenchment in advanced capitalist democracies, measured largely in terms of social expenditures. this focus underemphasizes how welfare state policy structures social relations. Political economists and state theorists have, of course, long recognized the propensity of social policy to order social relations, but it was in his 1990 book that esping-andersen brought this insight to the forefront of comparative welfare state research: “[Welfare] states may be equally large or comprehensive, but with entirely different effects on social structure. one may cultivate hierarchy and status, another dualisms, and a third universalism. each case will produce its own unique fabric of social solidarity.”6
identifying distinct welfare state logics, then, based on distinctive imperatives relating to social stratification exposes an additional di-mension with which one can classify welfare states beyond “effort” or “generosity.” it is worth briefly recalling the central underlying prin-ciples associated with each of esping-andersen’s “worlds of welfare.”
Social policy in conservative welfare regimes has as a primary goal the preservation of traditional status differences in society. faced with the potential for instability introduced by the emergence of modern capitalism, social policy could reinforce a “natural” social order. thus,
5 See lyle Scruggs and James P. allan, “Welfare State decommodification in eighteen oecd countries: a replication and revision,” Journal of European Social Policy 16, no. 1 (2006); and clare Bambra, “decommodification and the Worlds of Welfare revisited,” Journal of European Social Policy 16, no. 1 (2006).
6 esping-andersen (fn. 1), 58.
WP60.4-04.scruggs.642-664-LM.indd 644 10/9/08 1:46:47 PM
socIal stratIfIcatIon and welfare regImes 645
while conservative welfare regimes have historically been associated with significant levels of social expenditure, they have also been associ-ated with a paternalistic state, an old-style corporatist economic order, and a significant role for religion in society. it is not coincidental that early welfare state developers—in Bismarck’s germany, for example—reinforced the central role of the state or that christian democratic welfare policies emphasized traditional social and family roles.
Liberal welfare regimes seek the opposite. classical liberals reasoned that traditional social patterns constrained individual freedoms and that a free market afforded individuals the ability to realize their po-tential unfettered by preexisting social hierarchies of both church and state. in its efforts, classical liberalism required, in Polanyi’s terms, that economic welfare be liberated from social institutions and become de-pendent wholly on the market.7 as Polanyi pointed out, however, the liberal state was far from passive when it came to creating a “market society.” in social policy, this approach tended to manifest itself in pro-grams that encouraged more extensive interaction with the market for the purposes of income maintenance and insurance against risks posed by illness and especially old age. liberal welfare regimes have a marked tendency to favor private remedies for social risks, even where that en-tails considerable “fate-based” inequalities in life chances.
the third welfare regime is social democracy. like its conservative and liberal counterparts, “socialist reformism was always pursued with dis-tinct stratification outcomes in mind. for labor movements, it was the construction of solidarity that mattered.”8 the desire for social solidar-ity coupled with the need to attract sufficient electoral support led social democrats to pursue policies that emphasized universalism in a broad sense—across class lines—linking state policies to social citizenship. Perhaps the principles of socialist stratification were most apparent in the concept of the Swedish “people’s home” first invoked by sap leader Per albin hansson in the late 1920s: “in a good home there prevails equality, thoughtfulness, cooperation, helpfulness. . . . [the] citizens’ home . . . implies a breaking down of all social and economic barriers which now divide citizens between the privileged and the forgotten, the rulers and the dependent, the rich and poor.”9 thus, social democratic welfare policy sought broader equality through nonmarket mechanisms within the confines of a capitalist economy.
7 Karl Polanyi, The Great Transformation (1944; Boston: Beacon Press, 2001).8 esping-andersen (fn. 1), 65.9 Quoted in hugh heclo and henrik madsen, Policy and Politics in Sweden: Principled Pragmatism
(Philadelphia: temple university Press 1987), 157.
WP60.4-04.scruggs.642-664-LM.indd 645 10/9/08 1:46:47 PM
646 world polItIcs
reassessIng welfare stratIfIcatIon
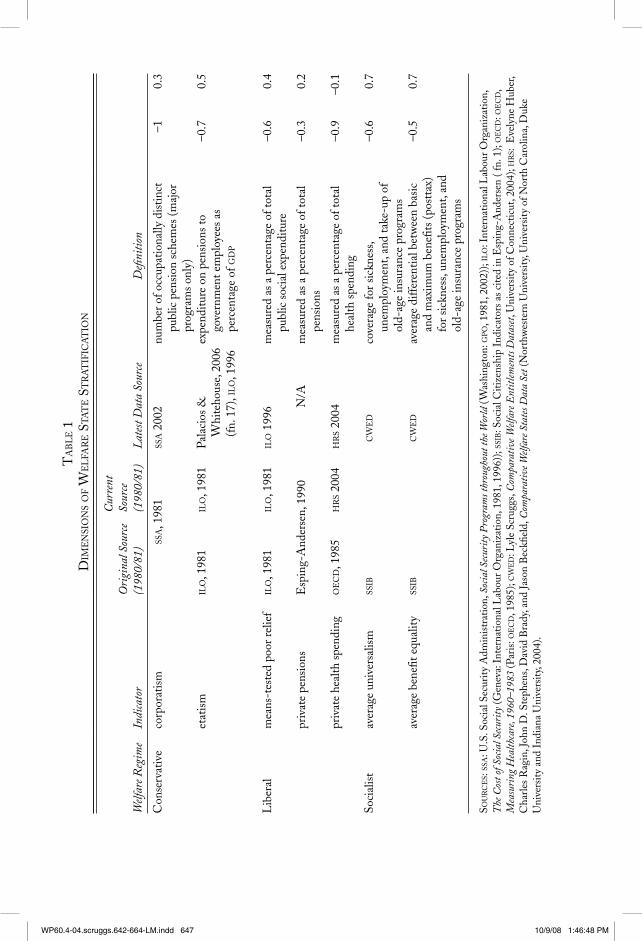
reflecting the different foundational goals of the three world of wel-fare, Three Worlds presents three empirical indices of welfare program stratification and several variables, representing macrofeatures of wel-fare programs expected to capture these differences.10 two of these re-flect the conservative stratification goals of preserving existing status differences and the privileged position of the state in conservative wel-fare regimes: the segmentation of public pension programs based upon major occupational categories (corporatism) and the extent of pension expenditure on government employees as a percentage of gross do-mestic product (etatism). three factors capture the liberal emphasis on market solutions in social provision. the first highlights the importance of means-tested benefits (poor relief ); the second emphasizes the im-portance of private pensions for securing individual income security in old age (private pension share); and the third captures the importance private health spending in total health expenditure. finally, two factors are employed to capture the stratification goals of social democratic wel-fare regimes. first is program universalism, which is measured as the portion of the workforce eligible for benefits in three social insurance programs: unemployment, sickness, and old-age pensions. the sec-ond is the equality of benefits, measured as the ratio of basic benefit to maximum allowable benefit averaged over the three above-mentioned programs.
the underlying measures and data used to construct the stratification index were originally presented together in the book’s tables. table 1 of this article contains a description of the indicators, as well as the sources of the original and our replication data. the ssIb data, used for the two social democratic stratification measures, are not publicly available, but the comparative Welfare entitlements data (cwed) employed here are based on concepts that are identical to them.11 though the sources are slightly different in some cases, we checked to ensure that there is comparability with the information for the early 1980s.
scorIng procedure
the appendix to chapter 3 of Three Worlds employs the following scor-ing method to construct the stratification indices. countries with a score more than a standard deviation above the mean for an index variable
10 the original variables and discussion of the index are in esping-andersen (fn. 1), 69–78.11 cwed data are available from the authors and at http://sp.uconn.edu/~scruggs/wp.htm.
WP60.4-04.scruggs.642-664-LM.indd 646 10/9/08 1:46:47 PM
ta
bl
e 1
dIm
en
sIo
ns
of
we
lfa
re s
tat
e s
tr
at
IfIc
at
Ion
Wel
fare
Reg
ime
Indi
cato
rO
rigi
nal S
ourc
e (1
980/
81)
Cur
rent
So
urce
(1
980/
81)
Lat
est D
ata
Sour
ceD
efini
tion
con
serv
ativ
eco
rpor
atis
mss
a, 1
981
ssa
200
2nu
mbe
r of o
ccup
atio
nally
dis
tinct
pu
blic
pen
sion
sch
emes
(maj
or
prog
ram
s on
ly)
–10.
3
etat
ism
Ilo
, 198
1Il
o, 1
981
Pala
cios
&
Whi
teho
use,
200
6 (f
n. 1
7), I
lo
, 199
6
expe
nditu
re o
n pe
nsio
ns to
go
vern
men
t em
ploy
ees
as
perc
enta
ge o
f gd
p
–0.7
0.5
lib
eral
mea
ns-t
este
d po
or re
lief
Ilo
, 198
1Il
o, 1
981
Ilo
199
6 m
easu
red
as a
per
cent
age
of to
tal
publ
ic s
ocia
l exp
endi
ture
–0.6
0.4
priv
ate
pens
ions
esp
ing-
and
erse
n, 1
990
n/a
mea
sure
d as
a p
erce
ntag
e of
tota
l pe
nsio
ns–0
.30.
2
priv
ate
heal
th s
pend
ing
oe
cd
, 198
5h
rs
2004
hr
s 20
04m
easu
red
as a
per
cent
age
of to
tal
heal
th s
pend
ing
–0.9
–0.1
Soci
alis
tav
erag
e un
iver
salis
mss
Ibc
we
dco
vera
ge fo
r sic
knes
s, un
empl
oym
ent,
and
take
-up
of
old-
age
insu
ranc
e pr
ogra
ms
–0.6
0.7
aver
age
bene
fit e
qual
ity
ssIb
cw
ed
aver
age
diff
eren
tial b
etw
een
basi
c an
d m
axim
um b
enefi
ts (p
ostt
ax)
for s
ickn
ess,
unem
ploy
men
t, an
d ol
d-ag
e in
sura
nce
prog
ram
s
–0.5
0.7
Sou
rc
es:
ssa
: u.S
. Soc
ial S
ecur
ity
adm
inis
trat
ion,
Soc
ial S
ecur
ity
Pro
gram
s thr
ough
out t
he W
orld
(W
ashi
ngto
n: g
po
, 198
1, 2
002)
); Il
o: i
nter
natio
nal l
abou
r org
aniz
atio
n,
The
Cos
t of S
ocia
l Sec
urit
y (g
enev
a: i
nter
natio
nal l
abou
r org
aniz
atio
n, 1
981,
199
6));
ssIb
: Soc
ial c
itize
nshi
p in
dica
tors
as
cite
d in
esp
ing-
and
erse
n ( f
n. 1
); o
ec
d: o
ec
d,
Mea
suri
ng H
ealth
care
, 196
0–19
83 (P
aris
: oe
cd
, 198
5); c
we
d: l
yle
Scru
ggs,
Com
para
tive
Wel
fare
Ent
itle
men
ts D
atas
et, u
nive
rsit
y of
con
nect
icut
, 200
4); h
rs:
eve
lyne
hub
er,
cha
rles
rag
in, J
ohn
d. S
teph
ens,
dav
id B
rady
, and
Jaso
n B
eckfi
eld,
Com
para
tive
Wel
fare
Sta
tes D
ata
Set (
nor
thw
este
rn u
nive
rsit
y, u
nive
rsit
y of
nor
th c
arol
ina,
duk
e u
nive
rsit
y an
d in
dian
a u
nive
rsit
y, 20
04).
WP60.4-04.scruggs.642-664-LM.indd 647 10/9/08 1:46:48 PM
648 world polItIcs
are given maximum points (4), scores within a standard deviation of the mean values receive the middle score (2), and scores more than a standard deviation below the mean are given minimum scores (0). the scoring is considered rough, in that there is room for marginal cases to be scored higher or lower than their strict deviation from the mean might imply.
Based on our replication, the scoring methodology in Three Worlds appears to deviate considerably from the procedure outlined. the last two columns of our table 1 show, in standardized values, the cut points actu-ally used in the book: they deviate far from what is described. (Perfect correspondence would have cut points at +1 and –1 standard deviation.) in order to facilitate the comparison with esping-andersen’s empirical re-sults, we tend to use the de facto cut points, but it is worth noting that the original procedure for constructing the index leaves a lot to be desired.
conservatIve stratIfIcatIon
corporatIsm
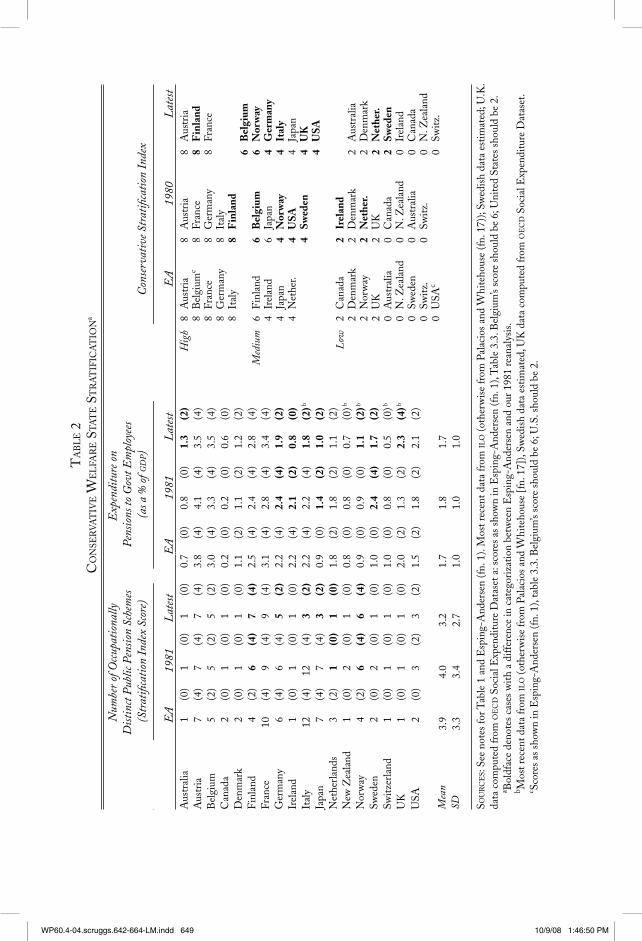
Welfare state corporatism is intended to capture the degree to which the welfare state reinforces segmentation by providing for different lev-els of welfare for the different occupational groups, with different plans providing for more generous (or at least separate) conditions for higher-status positions. this is measured by the number of significant occu-pational public pension funds. the precise criteria are never explicitly stated but appear to be based on funds mentioned in Social Security Pro-grams throughout the World.12 the leftmost section of table 2 provides the data. the first column includes the number of significant funds as coded in Three Worlds circa 1980; the second column is our replicated score for 1980; the third column presented our replicated raw and index score for 2004.
the rank ordering of countries is generally consistent with the con-ventional impression that continental european countries, such as france, italy, and austria, had and still have very segmented public pension schemes. only two countries—italy and Japan—change very much between the two periods. it is worth noting that the change in the reported number of schemes in italy corresponds to substantive reforms: legal reforms in the 1990s consolidated the pension system’s administration and conditions. on the whole, our results suggest some rather limited moves away from occupational segmentation.
12 Social Security administration, Social Security Programs throughout the World (Washington, d.c.: government Printing office, 1981, 2004).
WP60.4-04.scruggs.642-664-LM.indd 648 10/9/08 1:46:48 PM
ta
bl
e 2
co
nse
rva
tIv
e w
el
far
e s
tat
e s
tr
at
IfIc
at
Ion
a
Num
ber o
f Occ
upat
iona
llyD
istin
ct P
ublic
Pen
sion
Sche
mes
(Str
atifi
cati
on In
dex
Scor
e)
Exp
endi
ture
on
Pen
sions
to G
ovt E
mpl
oyee
s (a
s a %
of g
dp)
Con
serv
ativ
e Str
atifi
cati
on In
dex
EA
1981
Lat
est
EA
1981
Lat
est
EA
1980
Lat
est
aus
tral
ia1
(0)
1(0
)1
(0)
0.7
(0)
0.8
(0)
1.3
(2) b
Hig
h8
can
ada
12a
ustr
alia
12a
ustr
alia
aus
tria
7(4
)7
(4)
7(4
)3.
8(4
)4.
1(4
)3.
5(4
) b8
Switz
.12
can
ada
12c
anad
aB
elgi
um5
(2)
5(2
)5
(2)
3.0
(4)
3.3
(4)
3.5
(4) b
8u
sa12
uSa
12u
Sac
anad
a2
(0)
1(0
)1
(0)
0.2
(0)
0.2
(0)
0.6
(0) b
8a
ustr
alia
10D
enm
ark
10D
enm
ark
den
mar
k2
(0)
1(0
)1
(0)
1.1
(2)
1.1
(2)
1.2
(2) b
8
Japa
n10
Japa
n10
Japa
nf
inla
nd4
(2)
6(4
)7
(4)
2.5
(4)
2.4
(4)
2.8
(4) b
10Sw
itz.
10Sw
itz.
fran
ce10
(4)
9(4
)9
(4)
3.1
(4)
2.8
(4)
3.4
(4) b
ger
man
y6
(4)
6(4
)5
(2)
2.2
(4)
2.4
(4)
1.9
(2) b
Med
ium
6fr
ance
8F
inla
nd 8
Fin
land
irel
and
1(0
)1
(0)
1(0
)2.
2(4
)2.
1(2
)0.
8(0
) b 4
net
her.
8fr
ance
8N
. Zea
land
ital
y12
(4)
12(4
)3
(2)
2.2
(4)
2.2
(4)
1.8
(2) b
4 d
enm
ark
8u
K 8
uK
Japa
n7
(4)
7(4
)3
(2)
0.9
(0)
1.4
(2)
1.0
(2) b
4g
erm
any
6g
erm
any
6fr
ance
net
herl
ands
3(2
)1
(0)
1(0
)1.
8(2
)1.
8(2
)1.
1(2
) b 6
net
her.
6g
erm
any
new
Zea
land
1(0
)2
(0)
1(0
)0.
8(0
)0.
8(0
)0.
7(0
) b 6
N. Z
eala
nd 6
Irel
and
nor
way
4(2
)6
(4)
6(4
)0.
9(0
)0.
9(0
)1.
1(2
) b 6
net
her.
Swed
en2
(0)
2(0
)1
(0)
1.0
(0)
2.4
(4)
1.7
(2) b
6N
orw
aySw
itzer
land
1(0
)1
(0)
1(0
)1.
0(0
)0.
8(0
)0.
5(0
) b
uK
1(0
)1
(0)
1(0
)2.
0(2
)1.
3(2
)2.
3(4
) bL
ow 2
aus
tria
4a
ustr
ia 4
aus
tria
uSa
2(0
)3
(2)
3(2
)1.
5(2
)1.
8(2
)2.
1(2
) b 2
Bel
gium
4n
orw
ay 4
Bel
gium
2f
inla
nd 2
Bel
gium
4It
aly
Mea
n3.
94.
03.
21.
71.
81.
7 2
n. Z
eala
nd 2
irel
and
4Sw
eden
Sd3.
33.
42.
71.
01.
01.
0 0
irel
and
2It
aly
s ou
rc
es:
See
not
es fo
r tab
le 1
and
esp
ing-
and
erse
n (f
n. 1
). m
ost r
ecen
t dat
a fr
om Il
o (o
ther
wis
e fr
om P
alac
ios
and
Whi
teho
use
(fn.
17)
); Sw
edis
h da
ta e
stim
ated
; u.K
. da
ta c
ompu
ted
from
oe
cd
Soc
ial e
xpen
ditu
re d
atas
et a
: sco
res
as s
how
n in
esp
ing-
and
erse
n (f
n. 1
), t
able
3.3
. Bel
gium
’s sc
ore
shou
ld b
e 6;
uni
ted
Stat
es s
houl
d be
2.
a Bol
dfac
e de
note
s ca
ses
with
a d
iffer
ence
in c
ateg
oriz
atio
n be
twee
n e
spin
g-a
nder
sen
and
our 1
981
rean
alys
is.
b mos
t rec
ent d
ata
from
Ilo
(oth
erw
ise
from
Pal
acio
s an
d W
hite
hous
e [f
n. 1
7]),
Swed
ish
data
est
imat
ed, u
K d
ata
com
pute
d fr
om o
ec
d S
ocia
l exp
endi
ture
dat
aset
.c Sc
ores
as
show
n in
esp
ing-
and
erse
n (f
n. 1
), ta
ble
3.3.
Bel
gium
’s sc
ore
shou
ld b
e 6;
u.S
. sho
uld
be 2
.
b
H
igh
8 a
ustr
ia
8 a
ustr
ia
8 a
ustr
ia
8
Bel
gium
c 8
fran
ce
8 F
inla
nd
8
fran
ce
8 g
erm
any
8 fr
ance
8 g
erm
any
8 it
aly
8 it
aly
8 F
inla
nd
6
Bel
gium
Med
ium
6
fin
land
6
Bel
gium
6
Nor
way
4 ir
elan
d 6
Japa
n 4
Ger
man
y
4
Japa
n 4
Nor
way
4
Ital
y
4
net
her.
4 U
SA
4 J
apan
4 Sw
eden
4
UK
4 U
SA
L
ow
2 c
anad
a 2
Irel
and
2 d
enm
ark
2 d
enm
ark
2 a
ustr
alia
2 n
orw
ay
2 N
ethe
r. 2
den
mar
k
2
uK
2
uK
2
Net
her.
0 a
ustr
alia
0
can
ada
2 Sw
eden
0 n
. Zea
land
0
n. Z
eala
nd
0 ir
elan
d
0
Swed
en
0 a
ustr
alia
0
can
ada
0 Sw
itz.
0 Sw
itz.
0 n
. Zea
land
0 u
Sac
0 Sw
itz.
WP60.4-04.scruggs.642-664-LM.indd 649 10/9/08 1:46:50 PM
650 world polItIcs
in assigning stratification index scores to each country, we followed esping-andersen’s method.13 the scores are shown in parentheses be-side the raw score. according to our analysis, only three countries have different index scores in 2004 than they did in 1980. all three are typi-cally considered to have corporatist pension systems. not surprisingly, the dramatic changes in italy and Japan reduce their scores from 4 to 2. germany’s index score should be treated with caution, because it results from a small absolute change in reported pension funds.
etatIsm
the middle section of table 2 presents the original data showing the share of public pension payments (as a percentage of gdp) devoted to public sector workers.14 using replication data for 1980, we constructed estimates for all countries that match esping-andersen’s estimates rel-atively closely.15
in compiling the conservative stratification index, we employed the metric outlined in Three Worlds.16 these scores are again shown in paren-theses beside the raw values in table 2. for the 1980s, austria, france, Belgium, and germany devoted comparatively large amounts of gdp to public sector pensions. Several other countries—canada, australia, and new Zealand—devoted small amounts. overall, our scoring is close to the original scores. the main exceptions are Sweden and Japan, which devote more to public pensions in our scoring than is suggested in Three Worlds. comparing the 2000 data with the 1980 data, though average spending stays about the same, scores change in seven countries.17 Scores increased in australia, norway, and the united Kingdom, while they decreased in germany, ireland, italy, and Sweden.
13 a score of 0 is given if there are two or fewer distinct schemes; a score of 2 is given if the number of schemes is greater than two and less than or equal to five; and finally, a score of 4 is given to countries with more than five distinctive pension schemes.
14 for the early 1980s, we used the country series in oecd, Social Expenditure Database (SOCX 2004) (Paris: oecd, 2004) and the original source, international labour organization; for data we used Cost of Social Security (geneva: Ilo, 1983). Values for most countries are very similar across the two sources. We chose the oecd source for the united States in 1980 because the Ilo series appears to underesti-mate state and local government employee pension spending. We used the Ilo’s estimate for italy in 1980, because the oecd figure excluded public sector pensions managed by the treasury. We used the oecd’s estimate for the netherlands, because it excluded disability pensions, and these do not appear to be treated as retirement pensions elsewhere.
15 the largest difference occurs for Sweden. the Ilo data show a large, sustained jump in the public service pension expenditures between the late 1970s and the early 1980s in Sweden, from about 1.2 percent to 2.4 perent of gdp. We were inclined to believe the higher figure, because, among other reasons, Sweden has a relatively large public sector workforce.
16 Where share of expenditures is 1 percent or less of gdp, the score is zero. Between 1 and 2.1 percent (inclusive), the score is 2, and the maximum score of 4 is assigned to expenditures greater than 2.1 percent.
17 the Ilo survey changed in the early 1990s and no longer collected separate data for public employee pensions. for comparable recent information for circa 2000, we rely primarily on data in
WP60.4-04.scruggs.642-664-LM.indd 650 10/9/08 1:46:50 PM
socIal stratIfIcatIon and welfare regImes 651
conservatIve stratIfIcatIon Index
for 1980 the data in the table indicate several important discrepan-cies between our results and those presented in Three Worlds. finland and Belgium trade places between the “strong” and “medium” groups, while the netherlands and the united States switch places between the “medium” and “low” groups. the Belgian placement discrepancy can be attributed in part to a scoring error in the original study: Belgium should have scored 2 on corporatism and 4 on etatism, for a total of 6 (not 8). Similarly, the different placement of the united States results from the combination of a scoring error in the book and a difference in our classification of distinct programs.18 finland moves from the “medium” to the “strong” group, due to the higher score it is assigned on the corporatism measure: we found evidence of more occupationally distinct pension programs than reported in Three Worlds. the shift for the netherlands is due to the fact that we did not identify distinctive public occupational funds, though, as in the nordic countries, there are collectively bargained funds.
Our results for the late 1990s suggest a decline in conservative stratifica-tion among the key conservative welfare states. two strongly conservative regimes in the 1980s, italy and germany, became less so over time. in-creased public sector pension spending also explains why several coun-tries appeared more “conservative” since the early 1980s.19 While there are drawbacks to overall validity of civil servant spending, we suspect that if we used an alternative indicator of status (for example, retire-ment age for public/private sector workers or accrual rates for public pensions), we would also see a similar pattern of the declining “privi-leged status” of state workers over time.
lIberal stratIfIcatIon
prIvate health spendIng
data on private health spending shares in 1980, reported in table 3, are closely correlated with the data originally reported in Three Worlds (for robert Palacios and edward Whitehouse, “civil Service Pension Schemes around the World,” World Bank Social Protection discussion Paper no. 602 (2006). We used the most recent Ilo data (generally for 1989) for the countries not covered in their paper.
18 We count three programs based on the Social Security administration’s distinction between special programs for railroad and federal employees and the many separate schemes for individual state and local government employees. (this situation creates considerable fragmentation by subnational units if not distinct occupations, since most states have at least one public pension fund for their em-ployees, with its own set of rules.)
19 an important general limitation of using public sector spending to gauge civil servants’ privileged status is that the shares increase via a larger public sector workforce.
WP60.4-04.scruggs.642-664-LM.indd 651 10/9/08 1:46:50 PM
ta
bl
e 3
lIb
er
al w
el
far
e s
tat
e s
tr
at
IfIc
at
Ion
Pri
vate
Hea
lth S
pend
ing
(%
of H
ealth
Spe
ndin
g)M
eans
-Tes
ted
Poor
Rel
ief
a (%
of T
otal
Soc
ial S
pend
ing)
Lib
eral
Str
atifi
cati
on In
dexb
EA
1980
Lat
est
EA
1980
Lat
est
EA
19
80L
ates
ta
ustr
alia
36(4
)37
(4)
31(4
)3.
3(2
)43
.0(4
)49
.0(4
)H
igh
12c
anad
a12
aus
tral
ia12
aus
tral
iaa
ustr
ia36
(4)
31(4
)31
(4)
2.8
(0)
3.1
(0)
3.4
(0)
12Sw
itz.
12c
anad
a12
can
ada
Bel
gium
13(2
)17
(2)
28(4
)4.
5(2
)2.
9(0
)5.
3(0
)12
uSa
12u
Sa12
uSa
can
ada
26(4
)24
(4)
29(4
)15
.6(4
)20
.2(4
)16
.5(4
)10
aus
tral
ia10
Den
mar
k10
Den
mar
kd
enm
ark
15(2
)12
(2)
17(2
)1.
0(0
)12
.7(4
)13
.6(4
)10
Japa
n10
Japa
n10
Japa
nf
inla
nd21
(4)
21(4
)25
(4)
1.9
(0)
13.0
(4)
12.7
(4)
10Sw
itz.
10Sw
itz.
fran
ce28
(4)
21(4
)24
(4)
11.2
(4)
15.8
(4)
10.5
(2)
ger
man
y20
(2)
21(4
)25
(4)
4.9
(2)
4.1
(0)
6.2
(0)
Med
ium
8fr
ance
8F
inla
nd 8
Fin
land
irel
and
6(0
)19
(2)
27(4
)5.
9(2
)2.
5(0
)3.
3(0
) 8
net
her.
8fr
ance
8N
. Zea
land
ital
y12
(2)
20(2
)27
(4)
9.3
(4)
3.4
(0)
6.2
(0)
6
den
mar
k 8
uK
8u
KJa
pan
28(4
)29
(4)
22(4
)7.
0(2
)11
.9(2
)7.
2(2
) 6
ger
man
y 6
ger
man
y 6
fran
cen
ethe
rlan
ds22
(4)
31(4
)37
(4)
6.9
(2)
6.2
(0)
2.8
(0)
6it
aly
6n
ethe
r. 6
ger
man
yn
ew Z
eala
nd18
(2)
12(2
)22
(4)
2.3
(0)
33.0
(4)
27.9
(4)
6u
K 6
N. Z
eala
nd 6
Irel
and
nor
way
1(0
)15
(2)
15(2
)2.
1(0
)8.
8(2
)18
.1(4
) 6
net
her.
Swed
en7
(0)
7(0
)15
(2)
1.1
(0)
11.2
(2)
12.0
(2)
6N
orw
aySw
itzer
land
35(4
)39
(4)
44(4
)8.
8(4
)8.
4(2
)9.
5(2
)u
K10
(2)
11(2
)19
(2)
1.0
(0)
15.7
(4)
15.9
(4)
Low
4a
ustr
ia 4
aus
tria
4a
ustr
iau
Sa(4
)54
(4)
56(4
)18
.2(4
)20
.2(4
)19
.7(4
) 4
Bel
gium
4n
orw
ay 4
Bel
gium
4f
inla
nd 2
Bel
gium
4It
aly
Mea
n19
.623
.327
.46.
013
.113
.3 2
n. Z
eala
nd 2
irel
and
4Sw
eden
Stan
dard
D
evia
tion
10.8
11.7
10.2
5.0
10.8
11.1
2ir
elan
d 2
Ital
y
0n
orw
ay 2
Swed
en 0
Swed
en
s ou
rc
es:
See
not
es fo
r tab
le 1
and
esp
ing-
and
erse
n (f
n. 1
).a t
able
mea
ns a
nd s
tand
ard
devi
atio
ns re
port
ed w
ith a
ll ca
ses;
deta
ils o
n in
dex
scor
ing
see
fn. 2
0 an
d 21
. b
the
re a
re n
o av
aila
ble
data
on
priv
ate
pens
ion
spen
ding
as
a sh
are
of to
tal p
ensi
on s
pend
ing;
we
use
esp
ing-
and
erse
n’s
scor
es in
bot
h pe
riod
s. c
ount
ries
in b
old
deno
te a
diff
eren
ce in
cat
egor
izat
ion
betw
een
esp
ing-
and
erse
n an
d ou
r ana
lysi
s.
WP60.4-04.scruggs.642-664-LM.indd 652 10/9/08 1:46:51 PM
socIal stratIfIcatIon and welfare regImes 653
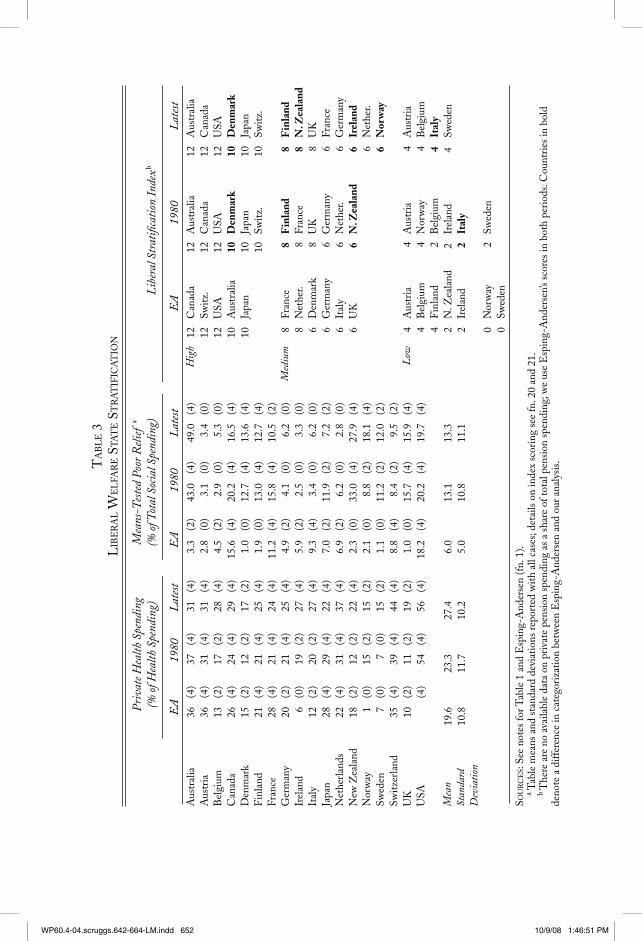
example, r=0.91 for the eighteen countries). however, in five cases—france, ireland, italy, the netherlands, and norway—our results are considerably higher than reported. the most extreme discrepancies are for norway and ireland, where we found a 14 and 13 percentage point difference, respectively. in the three other cases, we find lower levels of private spending, by a margin of 5–7 percentage points. thus, despite the overall correlation, the ranking of countries on this measure is not very consistent with “liberal” stratification. countries such as canada and new Zealand—often considered part of the liberal welfare state tradition—have lower private shares of health spending than countries that have become widely classified as nonliberal welfare states. this is, of course, because these countries, in particular, have nationalized the health care sector.
comparing the data for 1980 and 2000 suggests considerable “liberal-ization” in developed country health care systems over that twenty-year period. the average private-to-total spending ratio rose from around 23.3 percent to 27.4 percent. ten countries experienced increases of more than 5 points between 1980 and 2000, and two, Belgium and new Zealand, reported double-digit increases. only australia and Ja-pan, both comparatively more “mixed public-private” systems in 1980, reported a decline of more than 5 percentage points in 2000. in this regard, health care is clearly a sector with convergence around a still mostly public, but increasingly private, spending trajectory. finally, there is also no evidence here that erstwhile liberal welfare states show a greater propensity to rely more on private health care over time than do their social democratic or conservative counterparts.20 What we cannot tell from these changes, of course, is whether and where health outcomes have also become more dependent on individual market performance.
means-tested poor relIef
the central columns of table 3 report the means-tested relief shares of social spending from Three Worlds and our replication. the data source, Ilo’s Cost of Social Security, stopped publishing the details tables in the early 1990s, so we were unable to extend that series beyond 1989. the correlation between our results and esping-andersen’s is very low. Some of the nordic countries, the antipodes, and the united Kingdom have considerably more means testing of benefits than has traditionally
20 in assigning stratification index scores, we used the original scoring metric in Three Worlds. Pri-vate spending shares up to 10 percent are scored 0; shares between 10 and 20 percent are scored 2; and private spending shares greater than 20 percent are scored 4. (nb: the cut point for obtaining a high score in Three Worlds is actually below the mean, with or without the united States included!)
WP60.4-04.scruggs.642-664-LM.indd 653 10/9/08 1:46:52 PM
654 world polItIcs
been recognized. for the nordic countries, our results probably under-estimate means-tested spending because we counted all “basic pension” spending as non–means tested even though considerable amounts are spent on income-tested supplements above the universal pension in those countries.21
one source of difference in our results may derive from the distinc-tion between “means-tested” and “regular” income-tested programs. tables in Three Worlds suggest that regular income-tested benefits like housing (and presumably supplemental pensions for retirees) were ex-cluded from the means-tested category. however, the distinction be-tween means testing and income testing is not made conceptually clear in the original study, and any distinction seems to be inconsistently ap-plied.22 in the broader literature means-testing and income testing are generally used interchangeably, with means testing occasionally distin-guished by the use of both income and asset tests. one also sometimes encounters a conceptual distinction between the degree to which in-come tests target the upper class for exclusion (that is, generous income limits) and the degree to which they target the needy for relief (that is, low income limits).23
our data on means testing suggest that the rank order of countries differs considerably from what was reported in Three Worlds. new Zea-land, denmark, finland, and the united Kingdom are among the most liberal welfare states. With the exception of france (and perhaps Ja-pan), countries that are conventionally considered conservative welfare state regimes spent comparatively little on means-tested programs.
prIvate pensIons
determining the share of private pensions in total pension income is very difficult.24 due to a lack of comparable data for most countries, we simply take the values provided in Three Worlds as correct for 1980 and
21 index values for means-tested programs are calculated following the general procedure adopted in Three Worlds. first, we dropped the extremely high values for new Zealand and australia before computing the mean and standard deviation. next, we used the standardized value cut points used in Three Worlds, –.6 and +.4, to create lower and upper bounds of 6.7 and 15.6, respectively.
22 the original results in Three Worlds strongly imply that non-earnings-related public pension supplements were not counted as means-tested spending in the nordic countries and the united King-dom but were so counted in the united States and canada. it also appears that certain other near-cash benefits (for example, housing assistance and food programs) were excluded from the calculation in the former and included in the latter.
23 See, for example, castles and mitchell (fn. 2).24 esping-andersen provides an extensive list of sources used in computing private pension pay-
ments in each country, but these are not easily available; esping-andersen “the comparison of Policy regimes: an introduction,” in martin rein, gøsta esping-andersen, and lee rainwater, eds., Stag-nation and Renewal in Social Policy (armonk, n.y.: m. e. Sharpe, 1987)). Pension income categories
WP60.4-04.scruggs.642-664-LM.indd 654 10/9/08 1:46:52 PM
socIal stratIfIcatIon and welfare regImes 655
recent years. We have no reason to think that relative rankings have changed substantially, and we suspect that private sector shares have, if anything, increased in most countries during that period.
lIberal stratIfIcatIon Index
the right-hand section of table 3 presents a liberal stratification in-dex for 1980 and the most recent data available. Scores theoretically range between 0 and 12. (By contrast, the conservative and socialist stratification indices range between 0 and 8.) comparing our reanalysis with results in Three Worlds for 1980 suggests several things. first, most countries tend to have higher scores than suggested in Three Worlds. Sec-ond, there is much less variation along this dimension than previously assumed. third, three countries emerge as much more liberal than previ-ously reported. denmark has a surprisingly high degree of market-based stratification tendencies. indeed, it has a more liberal welfare state pro-file than france and the netherlands. While it does not fall into the cat-egory of the united States or canada, it is very close. meanwhile, several other countries—in particular, new Zealand and finland—emerge as much more liberal in 1980 than had previously been suggested.
Perhaps more striking is the degree and pattern of change over time. the change between the two periods suggests that welfare states in the early twenty-first century are more liberal than they had been just two de-cades earlier. of the countries with the nine lowest scores in 1980, six have higher scores in the second period. (only one country, france, shows a decline in liberal stratification over the period.) these changes, of course, are consistent with the idea that welfare states have become much more “market compatible” overall in recent decades. if our asser-tion that the share of private pensions in total pension spending has also increased in recent years, increased reliance on the market over time in all countries would be all the more dramatic. overall, this result contra-dicts claims, often relying on variations in spending patterns, that oecd welfare states have not liberalized significantly in recent decades.25
in the luxembourg income Study, in theory, allow us to compute the private sector share. however, our analysis of the lIs data reveal that income sources are not reliably divided among these categories, producing scores that are not credible in a number of cases.
25 See, for example, Paul Pierson, Dismantling the Welfare State? Reagan, Thatcher, and the Politics of Retrenchment (new york: cambridge university Press, 1994); geoffrey garrett, Partisan Politics in the Global Economy (cambridge: cambridge university Press, 1998); duane Swank, Global Capital, Political Institutions, and Policy Change in Developed Welfare States (cambridge: cambridge university Press, 2002); francis castles, The Future of the Welfare State: Crisis Myths and Crisis Realities (new york: oxford university Press, 2004); and Peter lindert, Growing Public: Social Spending and Economic Growth since the Eighteenth Century (new york: cambridge university Press, 2004).
WP60.4-04.scruggs.642-664-LM.indd 655 10/9/08 1:46:52 PM

656 world polItIcs
socIalIsm
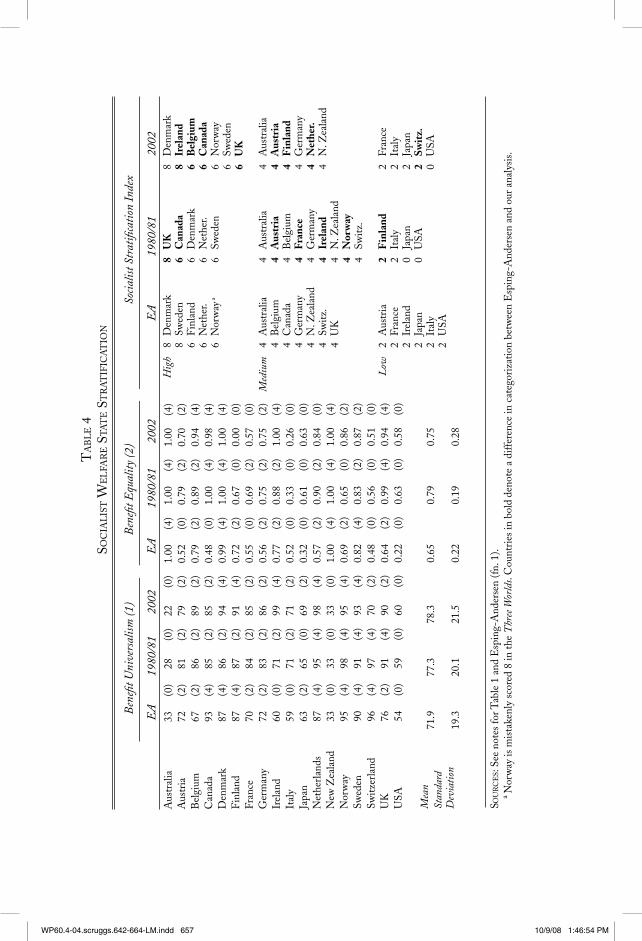
the socialist stratification index in Three Worlds consisted of two mea-sures. the first, “universalism,” is computed as the average portion of the labor force covered by unemployment insurance, sickness insur-ance, and public pensions. the second, “benefit equality,” is the (aver-age) ratio of standard to maximum income replacement rate in national unemployment, sickness, and public pension programs. the underly-ing data for both of these indicators were from the Social citizenship indicators Project.26 the comparative Welfare entitlements dataset (cwed) contains the relevant information for replication of the social-ist stratification index. table 4 provides the data; the latest cwed data are for 2002. As was the case with welfare state liberalism, our results differ considerably from conventional wisdom regarding which countries score high for their “socialist” welfare program principles.
unIversalIsm
cwed data suggest that most social insurance programs in 1980 were more universal than suggested in Three Worlds. in eight cases the coun-try’s average coverage is not even within 10 percent of what was re-ported. coverage is generally higher among conservative welfare states (specifically austria, Belgium, france, germany, ireland, italy, and the netherlands) and the u.K. differences in coverage in conservative versus social democratic states appear lower than has been previously reported. coverage is much higher (more than 20 percent higher) in four countries: the u.K., italy, france, and Belgium.27 our analysis also indicates that universalism is appreciably lower than reported in Three Worlds only for australia and canada.28
if we compare welfare state universalism in 2002 with that in 1980, coverage has tended to increase slightly, and the cross-national varia-tion remains pretty similar in the two periods. universalism declines
26 this data set is not publicly available.27 it appears that estimates for these categories in Three Worlds are from Peter flora, State, Economy,
and Society in Western Europe, 1815–1975: A Data Handbook (frankfurt/chicago: campus Verlag/St. James Press, 1983). results for the united Kingdom in Three Worlds do not match coverage based on national insurance contributions, our main source for coverage. coverage figures for italy, france, and Belgium are prone to some error, as they are not always directly reported. cwed uses national sources for Belgium. for france, cwed uses national sources for unemployment and the number of salarie and non-salarie covered by assurance maladie in official social security statistics. this also produces coverage estimates that are higher than those found in flora’s study. cwed estimates may also be higher due to attempts to include those receiving pensions in another’s name, such as survivors and those in receipt of couples supplements.
28 in the former case the difference arises because we used the portion of those above retirement age (sixty-five) actually in receipt of a pension. in canada cwed estimates for unemployment insurance are based on statistics from canadian sources on employment insurance coverage.
WP60.4-04.scruggs.642-664-LM.indd 656 10/9/08 1:46:52 PM
ta
bl
e 4
soc
Ial
Ist w
el
far
e s
tat
e s
tr
at
IfIc
at
Ion
Ben
efit U
nive
rsal
ism (1
)B
enefi
t Equ
alit
y (2
)So
cialis
t Str
atifi
cati
on In
dex
EA
1980
/81
2002
EA
1980
/81
2002
EA
198
0/81
200
2a
ustr
alia
33(0
)28
(0)
22(0
)1.
00(4
)1.
00(4
)1.
00(4
)H
igh
12c
anad
a12
aus
tral
ia12
aus
tral
iaa
ustr
ia72
(2)
81(2
)79
(2)
0.52
(0)
0.79
(2)
0.70
(2)
12Sw
itz.
12c
anad
a12
can
ada
Bel
gium
67(2
)86
(2)
89(2
)0.
79(2
)0.
89(2
)0.
94(4
)12
uSa
12u
Sa12
uSa
can
ada
93(4
)85
(2)
85(2
)0.
48(0
)1.
00(4
)0.
98(4
)10
aus
atra
lia10
Den
mar
k10
Den
mar
kd
enm
ark
87(4
)86
(2)
94(4
)0.
99(4
)1.
00(4
)1.
00(4
)10
Japa
n10
Japa
n10
Japa
nf
inla
nd87
(4)
87(2
)91
(4)
0.72
(2)
0.67
(0)
0.00
(0)
10Sw
itz.
10Sw
itz.
fran
ce70
(2)
84(2
)85
(2)
0.55
(0)
0.69
(2)
0.57
(0)
ger
man
y72
(2)
83(2
)86
(2)
0.56
(2)
0.75
(2)
0.75
(2)
Med
ium
8fr
ance
8F
inla
nd 8
Fin
land
irel
and
60(0
)71
(2)
99(4
)0.
77(2
)0.
88(2
)1.
00(4
) 8
net
her.
8fr
ance
8N
. Zea
land
ital
y59
(0)
71(2
)71
(2)
0.52
(0)
0.33
(0)
0.26
(0)
6 d
enm
ark
8u
K 8
uK
Japa
n63
(2)
65(0
)69
(2)
0.32
(0)
0.61
(0)
0.63
(0)
6g
erm
any
6g
erm
any
6fr
ance
net
herl
ands
87(4
)95
(4)
98(4
)0.
57(2
)0.
90(2
)0.
84(0
) 6
ital
y 6
net
her.
6g
erm
any
new
Zea
land
33(0
)33
(0)
33(0
)1.
00(4
)1.
00(4
)1.
00(4
) 6
uK
6N
. Zea
land
6Ir
elan
dn
orw
ay95
(4)
98(4
)95
(4)
0.69
(2)
0.65
(0)
0.86
(2)
6n
ethe
r.Sw
eden
90(4
)91
(4)
93(4
)0.
82(4
)0.
83(2
)0.
87(2
) 6
Nor
way
Switz
erla
nd96
(4)
97(4
)70
(2)
0.48
(0)
0.56
(0)
0.51
(0)
uK
76(2
)91
(4)
90(2
)0.
64(2
)0.
99(4
)0.
94(4
)L
ow 4
aus
tria
4a
ustr
ia 4
aus
tria
uSa
54(0
)59
(0)
60(0
)0.
22(0
)0.
63(0
)0.
58(0
) 4
Bel
gium
4n
orw
ay 4
Bel
gium
4f
inla
nd 2
Bel
gium
4It
aly
Mea
n71
.977
.378
.30.
650.
790.
75 2
n. Z
eala
nd 2
irel
and
4Sw
eden
Stan
dard
D
evia
tion
19.3
20.1
21.5
0.22
0.19
0.28
2ir
elan
d 2
Ital
y
0n
orw
ay 2
Swed
en 0
Swed
en
sou
rc
es:
See
not
es fo
r tab
le 1
and
esp
ing-
and
erse
n (f
n. 1
).a n
orw
ay is
mis
take
nly
scor
ed 8
in th
e T
hree
Wor
lds.
cou
ntri
es in
bol
d de
note
a d
iffer
ence
in c
ateg
oriz
atio
n be
twee
n e
spin
g-a
nder
sen
and
our a
naly
sis.
H
igh
8 d
enm
ark
8 U
K
8 d
enm
ark
8 Sw
eden
6
Can
ada
8 Ir
elan
d
6
fin
land
6
den
mar
k 6
Bel
gium
6 n
ethe
r. 6
net
her.
6 C
anad
a
6
nor
way
a 6
Sw
eden
6
nor
way
6 Sw
eden
6 U
K
Med
ium
4
aus
tral
ia
4 a
ustr
alia
4
aus
tral
ia
4
Bel
gium
4
Aus
tria
4
Aus
tria
4 c
anad
a 4
Bel
gium
4
Fin
land
4 g
erm
any
4 Fr
ance
4
ger
man
y
4
n. Z
eala
nd
4 g
erm
any
4 N
ethe
r.
4
Switz
. 4
Irel
and
4 n
. Zea
land
4 u
K
4 n
. Zea
land
4 N
orw
ay
4
Switz
.
L
ow
2 a
ustr
ia
2 F
inla
nd
2 fr
ance
2 fr
ance
2
ital
y 2
ital
y
2
irel
and
0 Ja
pan
2 Ja
pan
2 Ja
pan
0 u
Sa
2 Sw
itz.
2 it
aly
0 u
Sa
2
uSa
WP60.4-04.scruggs.642-664-LM.indd 657 10/9/08 1:46:54 PM
658 world polItIcs
noticeably in only two countries, australia and Switzerland, and in-creases considerably in one, ireland. australia’s decline is due to the fact that fewer retirees rely on its means-tested pension. in Switzerland the decline is a result of a liberalization of the sickness insurance system and a consequent drop in the number of people enrolling in health plans that provide sickness cash benefits. in ireland the sharp increase in economic prosperity has been associated with a much more universal welfare state.29
benefIt equalIty
Benefit equality, following Three Worlds, is computed as the average of the ratio of standard to maximum (posttax) benefits for unemploy-ment, sickness, and pension insurance. our analysis suggests consider-ably more equality in many countries and less variability among them than popularly thought. our results were within 10 percent of those reported in Three Worlds in only five cases.
notably, the largest discrepancies are among countries conventionally classified as liberal welfare regimes, in particular, canada, the united Kingdom, and the united States. the discrepancy for the united States (63 percent versus 22 percent) is the most dramatic. the united States has no sickness program, so we assign it the minimum score of 0.30 however, standard and maximum benefits in its two other programs are much closer to unity. our ratio for social security benefits is based on a benefit calculator developed by the Social Security administration that calculates the precise benefit amount for a precise earnings history. for unemployment insurance, individual state programs, as a rule, cap benefits at about 50 percent of the average wage, making the standard unemployment benefit and maximum unemployment benefit basically identical. even an ungenerous accounting of the u.S. unemployment system would make the maximum benefit about two times the standard benefit and would make its equality score lower (.54), but still far more than .22.
the equality score for canada in Three Worlds is also inexplicably low. canada’s sickness program is integrated into the unemployment insur-ance system, so the equality ratios for the two programs are identical.
29 We constructed the stratification index scores for universalism using the standardized cut points, as we did earlier for the means-tested benefits (fn. 19). the cut point for a low universalism score in the original is z=–.6, while the cut point for the high score is z=.7.
30 a few states do, in fact, have sickness programs. these programs have a structure very similar to unemployment insurance, but since the total workforce in these states is a fraction of the national total, we treat the country as having no program.
WP60.4-04.scruggs.642-664-LM.indd 658 10/9/08 1:46:54 PM
socIal stratIfIcatIon and welfare regImes 659
the standard to maximum pension ratios are also basically identical, because the pension contribution ceiling was below the apw wage for most of the program’s history to 1980 (and only just above that for years from 1980 to 2002).
finally, our equality score for the united Kingdom is also higher than the score provided in Three Worlds. earnings-related benefits for both sickness and unemployment insurance had contribution/benefit ceilings that were below the average production worker’s (apw) wage. thus, the standard to maximum benefit ratio is unity for both pro-grams. the earnings-related pension system instituted in the late 1970s did have a benefit ceiling above the standard wage, but the program was still new in 1980. a person with maximum contributions through 1979 would have little more public pension income than an apw worker would be entitled to.
comparing changes in the equality ratio between 1980 and 2002 provides considerable evidence that national welfare states have become less egalitarian since the 1980s. half of the eighteen countries experi-enced a decline in the benefit ratio.31 Benefit equality declined notice-ably in austria, france, italy, and the netherlands and also in Switzer-land, the u.K., and the u.S. oil-rich norway is the only country to have increased equality significantly.32
socIalIst stratIfIcatIon Index
the right-hand section of table 4 presents both our index for 1980 and 2002 and the index provided in Three Worlds. Our results challenge the conventional views that countries conventionally described as socialist score high on the socialist stratification index while other countries score low. first, only two of the five conventional social democratic countries, Sweden and denmark, score in the top category in our reanalysis for 1980. fin-land’s score is at the bottom of this category; and norway moves from the top category to the middle. meanwhile, canada, a “quintessentially liberal” welfare state in the conventional view, scores high on the social-ist dimension in our reanalysis. the united Kingdom, where the idea of the flat-rate citizenship benefit originated, is the only country to receive the maximum socialist stratification index score in 1980.
31 the most dramatic changes between 1980 and 2002 are in finland, where all three programs eliminated a maximum benefit ceiling, though its inegalitarian impact should not be overstated. the marginal replacement rate for higher earnings is small compared to the one for average earnings.
32 index scores for equality were based on z-values used in Three Worlds. Scores below z=–.5 were scored 0, while those above 0.7 were scored 4.
WP60.4-04.scruggs.642-664-LM.indd 659 10/9/08 1:46:54 PM

660 world polItIcs
looking at the results for 2002, we find substantial evidence that chal-lenges conventional assumptions about consistent patterns of national welfare stratification. first, more countries move into the high-equality group. two of them, ireland and Belgium, are not conventionally re-ferred to as egalitarian-universal systems. Second, the netherlands falls out of the high group.
dIscussIon
the preceding results provide scores for eighteen postindustrial coun-tries on three indices comprising a total of seven different measures. in numerous cases, our results are at odds with what was reported in Three Worlds for 1980. But we have also found considerable change over time in the patterns of stratification as measured by these welfare state indicators.
it is important to bear in mind that, unlike much of the literature that begins with a philosophical or other ontological critique of Three Worlds, our results should have deviated minimally from those results; we have largely limited our effort to replicating the measures and scor-ing methodology used in the original study. the fact that we find such discordant results should raise doubts about the empirical basis for the Three Worlds typology and its variants, especially insofar as those are derived from the original results.
it is also important to recall that the results presented in Three Worlds were, in fact, striking in their crystallization of distinct regime types. in the original presentation, fifteen of the eighteen countries scored high on one, and only one, of the three dimensions: conservative, liberal, socialist. moreover, two of three anomalies, ireland and new Zealand, still indicated a dominant type, since they scored moderate on one di-mension and low on the other two. only one country, the united King-dom, appeared completely enigmatic. its scores were in the middle on two dimensions (liberal and socialist) and low on the third. this kind of tight clustering certainly contributed greatly to the influence of the Three Worlds schema on the subsequent development of welfare state research.33
33 a factor analysis (nonrotated) with the published regime scores as variables suggests that of the two factors extracted, the liberal, socialist, and conservative indices load (respectively), +.55, –.62, .07 and –.34, –.23, +.60. that result is, in fact, consistent with Three Worlds, because the data cannot be reliably reduced to one or two dimensions, and the two extracted dimensions suggest a liberal-socialist distinction independent of conservatism and a conservative dimension that is (vaguely) negatively cor-related with liberalism and socialism.
WP60.4-04.scruggs.642-664-LM.indd 660 10/9/08 1:46:54 PM
socIal stratIfIcatIon and welfare regImes 661
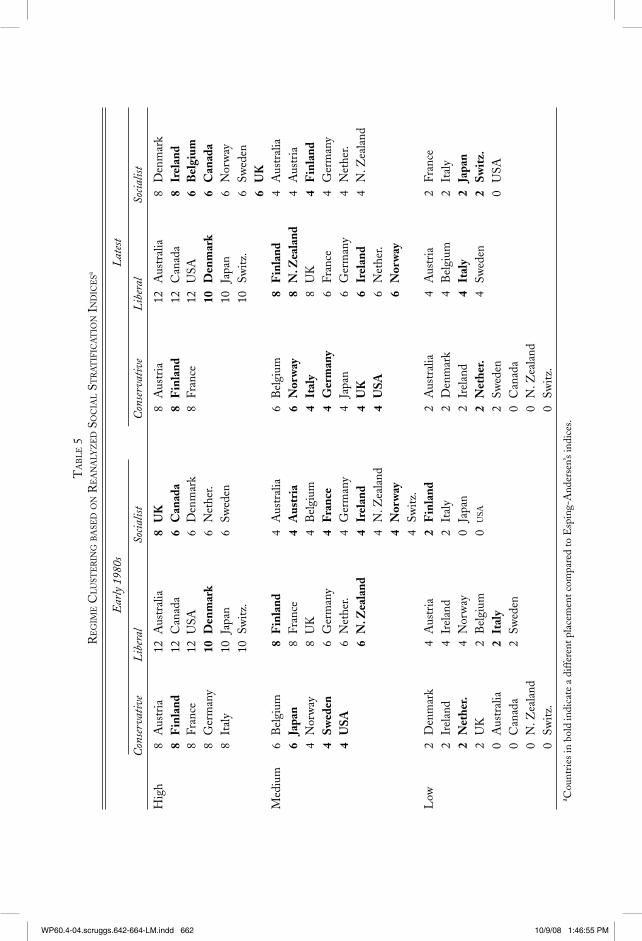
our reassessment suggests that these original results were, in fact, too good to be true, as seen in table 5. first, our results show that two countries—canada and denmark—score high on two dimensions, while four—Belgium, ireland, new Zealand, and norway—score high on zero dimensions. moreover, all of the latter four cases score medium on two dimensions and low on one.34 thus, reanalysis of welfare state stratification patterns in the early 1980s suggests that fully one-third of these countries do not have a clear stratification profile. a factor analysis of country scores on all three stratification dimensions indicates that all the three indices collapse onto a single dimension.35
another general concern raised by our results is whether country classifications correspond to certain “priors” about national welfare state types.36 Some of our results suggest clear divergence from much conventional thinking. they suggest that, in 1980, both canada and denmark scored high on both the liberal and the socialist indices, even though both countries have typically been thought of as unambiguous cases of the respective types. Second, far from being an ambiguous case, the u.K. obtains the highest score on the socialist index in 1980. third, finland scores high only on the conservative dimension. fourth, nor-way is an ambiguous case in 1980, not a clear social democratic welfare state. yet another anomalous case is the netherlands. While it is widely considered a conservative and socialist hybrid today, our results suggest that, in fact, it scores very low on the conservative regime indicators.
Several accounts of welfare state change rely on the unexamined as-sumption that the regime that a country belongs to can be treated as ef-fectively constant. it is thus instructive not only to compare our results with previous work but also to look at change over time. our results in table 5 suggest a considerable amount of flux. in 2002, for example, we again find that only about two-thirds of the countries are classified
34 We would go further to suggest that the high conservatism category include countries scoring a 6. this would be consistent with the treatment of scores on the socialist stratification index. doing so would make Belgium a clear conservative welfare state in our replication. Japan would then score high on two dimensions: conservatism and liberalism. Such a change would make esping-andersen’s original results appear slightly less clear, as finland would then be high in conservatism and socialism. (the remarkable factor analysis scores are not affected by this decision.)
35 the eigenvalue for factor 1 is .96; for factor 2, it is .44. eigenvalues for the original scores were .69 and .49, respectively. the nonrotated factor loadings for two dimensions are .36, .51, –.75 and .51, –.43, and .04, for socialism, liberalism, and conservatism, respectively.
36 While not the expressed point of our analysis, there do appear to be some cases where the inter-pretation of measures was ill considered, for example, the possible inconsistent treatment of means-tested benefits in nordic countries compared with the treatment in north america or the antipodes. the implication is that the development of the indicators was biased toward finding (1) larger dif-ferences than otherwise existed and (2) bias that exaggerated the distinctiveness policies in the three regime types. in our earlier work on decommodification (Scruggs and allan [fn. 5]), we also found evidence to indicate that some of the original coding decisions consistently favored certain countries.
WP60.4-04.scruggs.642-664-LM.indd 661 10/9/08 1:46:55 PM
ta
bl
e 5
re
gIm
e c
lu
ste
rIn
g b
ase
d o
n r
ea
na
lyz
ed
so
cIa
l s
tr
at
IfIc
at
Ion
In
dIc
esa
Ear
ly 1
980s
Lat
est
Con
serv
ativ
eL
iber
alSo
cialis
tC
onse
rvat
ive
Lib
eral
Socia
list
hig
h8
aus
tria
12a
ustr
alia
8U
K8
aus
tria
12a
ustr
alia
8d
enm
ark
8F
inla
nd12
can
ada
6C
anad
a8
Fin
land
12c
anad
a8
Irel
and
8fr
ance
12u
Sa6
den
mar
k8
fran
ce12
uSa
6B
elgi
um8
ger
man
y10
Den
mar
k6
net
her.
10D
enm
ark
6C
anad
a8
ital
y10
Japa
n6
Swed
en10
Japa
n6
nor
way
10Sw
itz.
10Sw
itz.
6Sw
eden
6U
Km
ediu
m6
Bel
gium
8F
inla
nd4
aus
tral
ia6
Bel
gium
8F
inla
nd4
aus
tral
ia6
Japa
n8
fran
ce4
Aus
tria
6N
orw
ay8
N. Z
eala
nd4
aus
tria
4n
orw
ay8
uK
4B
elgi
um4
Ital
y8
uK
4F
inla
nd4
Swed
en6
ger
man
y4
Fran
ce4
Ger
man
y6
fran
ce4
ger
man
y4
USA
6n
ethe
r.4
ger
man
y4
Japa
n6
ger
man
y4
net
her.
6N
. Zea
land
4Ir
elan
d4
UK
6Ir
elan
d4
n. Z
eala
nd4
n. Z
eala
nd4
USA
6n
ethe
r.4
Nor
way
6N
orw
ay4
Switz
.l
ow2
den
mar
k4
aus
tria
2F
inla
nd2
aus
tral
ia4
aus
tria
2fr
ance
2ir
elan
d4
irel
and
2it
aly
2d
enm
ark
4B
elgi
um2
ital
y2
Net
her.
4n
orw
ay0
Japa
n2
irel
and
4It
aly
2Ja
pan
2u
K2
Bel
gium
0u
sa2
Net
her.
4Sw
eden
2Sw
itz.
0a
ustr
alia
2It
aly
2Sw
eden
0u
Sa0
can
ada
2Sw
eden
0c
anad
a0
n. Z
eala
nd0
n. Z
eala
nd0
Switz
.0
Switz
.
a cou
ntri
es in
bol
d in
dica
te a
diff
eren
t pla
cem
ent c
ompa
red
to e
spin
g-a
nder
sen’
s in
dice
s.
WP60.4-04.scruggs.642-664-LM.indd 662 10/9/08 1:46:55 PM
socIal stratIfIcatIon and welfare regImes 663
strong on only one stratification dimension. But the countries doing so differ over time.
norway moves from not being high on any index to being high on the socialist index. meanwhile, the other two nonclassified cases from the early 1980s—ireland and Belgium—score high on the socialist stratification index in 2002. thus, in 2002 most countries scoring high on the socialist dimension are not countries identified as socialist in Three Worlds (or elsewhere). finally, circa 2002 finland looks much more like a conservative/liberal hybrid than a socialist welfare state.
conclusIon
in this article we have sought to reassess some long-standing empiri-cal results for a key aspect of the welfare state, one upon which much subsequent research and commentary has been based. as with earlier reexaminations of the index of decommodification, we find that this research design produces considerably less empirical support for coher-ent welfare regime types. first, many countries are miscategorized. Per-haps more fundamentally, there is little evidence that countries score strongly on only one dimension.
What are we to make of these findings, which appear to undermine the idea of distinctive “worlds of welfare”? our results have several important implications for earlier work. first, our reanalysis calls into question previous empirical results that imply effects of welfare strati-fication.37 Second, conceptually, our results raise questions about the degree of empirical support for “welfare regimes,” as opposed to “wel-fare programs.” the operating assumption since (at least) Three Worlds is that welfare state programs are not independent within countries but rather are systematically interrelated. our results imply that welfare states may not be so interrelated and may, in fact, be subject to reform at different speeds.
third, our results suggest that there has been some movement in two seemingly contradictory directions since the 1980s. on the one hand, the individualization of risk and the targeted portion of social budgets have increased somewhat. on the other hand, most social insurance programs (unemployment benefits, pensions, sick pay) tend to be more universal and pay benefit amounts that more closely approximate flat-rate benefits as far as most people are concerned. on reflection, these
37 the impact on large-n cases may be obvious—for example, miscoding an explanatory variable biases regression results. But the same problem applies to small-n comparisons, at least insofar as their inferences about stratification effects are based on the misclassified cases.
WP60.4-04.scruggs.642-664-LM.indd 663 10/9/08 1:46:55 PM
664 world polItIcs
two trends are not at all inconsistent programmatically; a policy of freezing maximum nominal benefits alongside increased real spending on targeted programs is sufficient to gradually “residualize” the welfare state.
We certainly invite others to scrutinize our findings. We have few il-lusions that our efforts are not without mistakes or that they too might hinge on some choices that we have not recognized. But our being wrong does not necessarily make the conventional wisdom right. if the conventional wisdom is right, we welcome an analysis that will dem-onstrate that.38
38 one alternative view of our results is that they are flawed and that the original results support the conventional categories. however, we follow procedures outlined in the creation of the original index. We also documented a number of errors that have exaggerated variation across conventional regimes and to minimize it within them. our results may be an object lesson for the importance of independent replication.
WP60.4-04.scruggs.642-664-LM.indd 664 10/9/08 1:46:55 PM