Vol. 6 Special Issue 1 February, 2018 Impact Factor: 3.017 ISSN
114
INTERNATIONAL JOURNAL OF COMMERCE (A Peer-Reviewed-Refereed/Scholarly Quarterly Journal Globally Indexed with Impact Factor) Vol. 6 Special Issue 1 February, 2018 Impact Factor: 3.017 ISSN: 2320-4168 UGC Approval No: 44120 National Conference on RECENT ADVANCEMENTS IN BUSINESS PRACTICES 1 st February 2018 Organised by NEHRU INSTITUTE OF MANAGEMENT STUDIES A Standalone Business School Approved by AICTE & Affiliated to Anna University, Chennai, An ISO 14001: 2004 Certified Institution “Nehru Gardens” Thirumalayampalayam (Post), Coimbatore - 641 105 Department of Commerce NIRMALA COLLEGE FOR WOMEN An Autonomous College Affiliated to Bharathiyar University (Re-Accredited with “A” Grade by NAAC), Coimbatore
-
Upload
khangminh22 -
Category
Documents
-
view
1 -
download
0
Transcript of Vol. 6 Special Issue 1 February, 2018 Impact Factor: 3.017 ISSN
INTERNATIONAL JOURNAL OF COMMERCE
(A Peer-Reviewed-Refereed/Scholarly Quarterly Journal Globally Indexed with Impact Factor)
Vol. 6 Special Issue 1 February, 2018 Impact Factor: 3.017
ISSN: 2320-4168 UGC Approval No: 44120
National Conference on
RECENT ADVANCEMENTS IN BUSINESS PRACTICES
1st February 2018
Organised by
NEHRU INSTITUTE OF MANAGEMENT STUDIES
A Standalone Business School
Approved by AICTE & Affiliated to Anna University, Chennai, An ISO 14001: 2004
Certified Institution
“Nehru Gardens” Thirumalayampalayam (Post), Coimbatore - 641 105
Department of Commerce
NIRMALA COLLEGE FOR WOMEN
An Autonomous College Affiliated to Bharathiyar University
(Re-Accredited with “A” Grade by NAAC), Coimbatore

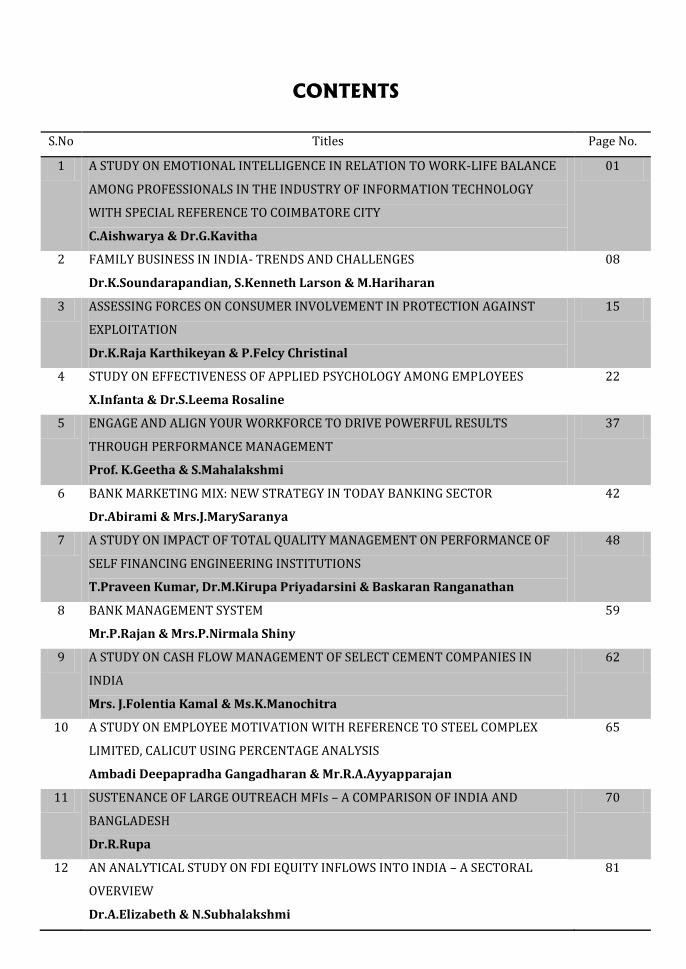
CONTENTS
S.No Titles Page No.
1 A STUDY ON EMOTIONAL INTELLIGENCE IN RELATION TO WORK-LIFE BALANCE
AMONG PROFESSIONALS IN THE INDUSTRY OF INFORMATION TECHNOLOGY
WITH SPECIAL REFERENCE TO COIMBATORE CITY
C.Aishwarya & Dr.G.Kavitha
01
2 FAMILY BUSINESS IN INDIA- TRENDS AND CHALLENGES
Dr.K.Soundarapandian, S.Kenneth Larson & M.Hariharan
08
3 ASSESSING FORCES ON CONSUMER INVOLVEMENT IN PROTECTION AGAINST
EXPLOITATION
Dr.K.Raja Karthikeyan & P.Felcy Christinal
15
4 STUDY ON EFFECTIVENESS OF APPLIED PSYCHOLOGY AMONG EMPLOYEES
X.Infanta & Dr.S.Leema Rosaline
22
5 ENGAGE AND ALIGN YOUR WORKFORCE TO DRIVE POWERFUL RESULTS
THROUGH PERFORMANCE MANAGEMENT
Prof. K.Geetha & S.Mahalakshmi
37
6 BANK MARKETING MIX: NEW STRATEGY IN TODAY BANKING SECTOR
Dr.Abirami & Mrs.J.MarySaranya
42
7 A STUDY ON IMPACT OF TOTAL QUALITY MANAGEMENT ON PERFORMANCE OF
SELF FINANCING ENGINEERING INSTITUTIONS
T.Praveen Kumar, Dr.M.Kirupa Priyadarsini & Baskaran Ranganathan
48
8 BANK MANAGEMENT SYSTEM
Mr.P.Rajan & Mrs.P.Nirmala Shiny
59
9 A STUDY ON CASH FLOW MANAGEMENT OF SELECT CEMENT COMPANIES IN
INDIA
Mrs. J.Folentia Kamal & Ms.K.Manochitra
62
10 A STUDY ON EMPLOYEE MOTIVATION WITH REFERENCE TO STEEL COMPLEX
LIMITED, CALICUT USING PERCENTAGE ANALYSIS
Ambadi Deepapradha Gangadharan & Mr.R.A.Ayyapparajan
65
11 SUSTENANCE OF LARGE OUTREACH MFIs – A COMPARISON OF INDIA AND
BANGLADESH
Dr.R.Rupa
70
12 AN ANALYTICAL STUDY ON FDI EQUITY INFLOWS INTO INDIA – A SECTORAL
OVERVIEW
Dr.A.Elizabeth & N.Subhalakshmi
81

13 PERFORMANCE EVALUATION OF SELECT KOTAK EQUITY FUNDS
Dr.A.Elizabeth & J.Mary Immaculet Anjalin
85
14 MARKET POTENTIAL ANALYSIS ON MILKY MIST PRODUCT
N.Bharath Yugander, R.Chandana & Dr.R.Kanthiah Alias Deepak
88
15 E- MARKETING IN THE CURRENT SCENARIO
Dr.B.Saranya & R.Akash
94
16 GREEN MARKETING
K.Sathiya Priya
101
17 ADMINISTRATION BRAND FAIRNESS: CAPITALIZING ON
THE SIGNFINANACE TRADE NAME
S.R.Kritikaa
106
Vol. 6 Special Issue 1 February 2018 ISSN: 2320-4168
Shanlax International Journal of Commerce Page 1
A STUDY ON EMOTIONAL INTELLIGENCE IN RELATION TO WORK-LIFE BALANCE
AMONG PROFESSIONALS IN THE INDUSTRY OF INFORMATION TECHNOLOGY WITH
SPECIAL REFERENCE TO COIMBATORE CITY
Abstract
Emotional intelligence is a psychological character that describes how effectively an individual identifies, understands, regulates the emotions and then uses it in problem solving thereby making decisions. A joy or sorrow in a human life is like the sides of the coin. The degree of intelligence of the people differ from person to person. Some of them are masters in managing their their emotions, some may not be able to manage their emotions. usually, mastery doesn’t get angry even in stressful situations, instead they have the ability to look at a problem and calmly find a solution. The present paper aims to investigate the level of emotional intelligence, stress and work performance of faculty members. Performance is defined as the outcomes and accomplishment valued by the organization or system that one works in each individual is exposed to a level of emotional intelligence and a range of stressors both at work and in their personal lives which ultimately affect his or her performance in their work place. Pressure at work can be positive leading to increase performance. However when the pressure becomes excessive it may negatively affect work attitude and behaviour of the employees in the workplaces. It is conclude that the possession of high emotional intelligence is more important when managing stress and emotions at workplace. Introduction
Human beings are social beings and hardly ever live and work in isolation. We always plan,
develop and manage our relations both consciously and unconsciously. The relations are the
outcome of our actions and depend to a great extent upon our ability to manage our actions. The
whole context of Human Resource Management revolves around this core matter of managing
relations at work place. Emotional Intelligence is a set of qualities and competencies that captures a
broad collection of individual skills and dispositions, usually referred to as soft skills or inter and
intra-personal skills, that are outside the traditional areas of specific knowledge, general
intelligence, and technical or professional skills. Emotions are an intrinsic part of our biological
makeup, and every morning they march into the office with us and influence our behavior. They
consist of five factors: Knowing one's emotions, managing emotions, motivating oneself,
recognizing emotions in others, and handling relationships Goleman (1995). A form of intelligence
that involves the ability to monitor one's own and others' feelings and emotions, to discriminate
among them and to use this information to guide one's thinking and actions. Emotional intelligence
improves individual and organizational performance. It plays a significant role in the kind of work
an employee produces, and the relationship he or she enjoys in the organization.
Work – Life Balance is a challenging issue for IT leaders, managers and has also attracted the
attention of researchers. Work/life balance, in its broadest sense, is defined as a satisfactory level of
involvement or „fit‟ between the multiple roles in a person‟s life. There is very little research
C.Aishwarya
Professor, PSG College of Arts and Science, Coimbatore
Dr.G.Kavitha
Assistant Professor
PSGR Krishnammal College for Women, Coimbatore
National Conference on RECENT ADVANCEMENTS IN BUSINESS PRACTICES
Page 2 Nehru Institute of Management Studies, Coimbatore
Nirmala College For Women, Coimbatore
conducted on Emotional Intelligence in relation to Work – Life Balance and it is very important to
explore and intensify research in this area. Various research studies have unraveled that the leaders
with higher emotional intelligence see changes as opportunities for something better, and they do
not cherish stability but ongoing development of individual workers and of the organization itself
become their prime agenda. This phenomenon of paradigm shift has led many researches in the area
and the present one is also an attempt in the line.
Objectives
To identify what aspects of work interferes with personal life, also the factors that which has
impact on the work-life balance.
To find out the emotions of the employees if there is no proper balance of work life with family
life.
To find out the relationship and influence between emotional intelligence and work life balance.
Research Methodology
The process of systematically solving a research problem is set to be research methodology. It is
a science of studying how research is done scientifically and the various steps that are generally
adopted by the researchers in studying the research problem.
Source of Data
1. Primary data
Primary data has been collected through survey method using questionnaire as the tool.
2. Secondary data
Secondary data has been collected from journals and research articles.
3. Sample size
A sample of 150 IT employees were surveyed in random from various levels of management.
4. Area of study
The study has been confined to Coimbatore city.
5. Statistical analysis
Percentage analysis, chi square and ANOVA test have been applied to analyse the data
collected.
6. Sampling method
Simple random sampling technique
Literature Review
Studies on Work – Life Balance
Lewis & Humbert (2010)1 The most important form of flexible work arrangement used in the
organization, four days a week, is double edged and complex in its effects. It supports mothers,
but at a cost because of gendered assumptions. Despite a commitment to flexibility and “work
life balance”, the gendered construction of the ideal worker and ideas of competence conflated
with hegemonic masculinity, remain powerful. This, together with a prevalent “good mother”
ideology, undermines both gender equity and workplace effectiveness.
Vol. 6 Special Issue 1 February 2018 ISSN: 2320-4168
Shanlax International Journal of Commerce Page 3
Baral (2009)2 studied the scope and coverage of work-life balance practices in some of the
leading organizations in India. Based on review of literature, empirical study and analyses of
reports of news paper articles, research suggests the Indian organizations have to do a lot to
treat work-life balance practices as strategic aspect of organizational performance.
Organizations offer a lot of benefits in the name of work – life balance. However they do not
form an integral part of the companies polices. In knowledge centric organizations like IT and
ITES industries where women workforce participation is relatively higher, statutory policies
such as maternity leave and benefits are common, while practices such as flexi-time, work from
home and part-time work are still yet to pick up pace. Stress management workshops and
training programs on work life balance are being conducted by organizations as part of the
welfare provisions, but companies do not follow them as regular practices in most of the
organizations. Research shows considerable difference between the responses of HR managers
and employees. It was found that even though organizations had quite a few work-life balance
programs their employees did not recognize so. This finding shows that HR managers have to
put more efforts to properly and effectively communicate about the availability of different
work-life balance practices in their respective organizations to their employees.
In a study of 730 managerial employees from various organizations in India, it was found that
family contributes extensively to work in terms of enhancing performance and positive
emotions at workplace. One of the key findings was availability of work-life balance practices.
When an organization offers its employees policies, practices, benefits and services to help them
integrate their work and family responsibilities, employees feel committed to the organization
and indulge themselves in organizational citizenship behaviors.
Golden, Veiga and Simsek (2006)3, around one-third of American employees had entered into
telework and telecommunicating work arrangements in the year 2005. Though this arrangement
can improve work-life balance, it could have a different impact that reduces Work Family
Conflict but increases Family work Conflict, such advancement in the technological
environment can have an impact on Work Family Conflict which can be moderated by family
size, job autonomy and flexibility.
Ferrer and Gagne (2006)4 examined in the study that in larger companies and those like
information technology and information technology enabled services industries, when
compared with the older industries like mining and construction, they implement more family
friendly policies that can ease the level of tension between work and life/family.
Pyman, Cooper, Teicher & Holland, (2006)5 an employee who is engaged and encouraged to
participate it leads to better organizational commitment and job satisfaction. When employees
are given an opportunity to speak they feel more satisfied, hoping their work-life balance
concerns can be expressed and hopefully addressed.
Spector, Cooper, Poelmans (2004)6 explored that, urban Asians on an average worked for 2,149
hours per annum as compared to 2,068 hour for South Americans, 1,898 hours for North
Americans and 1,773 hours in Europe. The lowest work hours per annum were reported by
Berlin and Germany at 1,667, with the average worker getting 30 days off every year. Research
National Conference on RECENT ADVANCEMENTS IN BUSINESS PRACTICES
Page 4 Nehru Institute of Management Studies, Coimbatore
Nirmala College For Women, Coimbatore
has also found a stronger positive relationship between the number of work hours and work
family stressors in Anglo countries.
Studies on Emotional Intelligence
Sánchez-Ruiz, Jose, Carlos, Prez-Gonzlez and Petride (2010)1 Investigated the trait emotional
intelligence (trait EI or trait emotional self-efficacy) profiles of 512 students from five university
faculties: technical studies, natural sciences, social sciences, arts, and humanities. Using the Trait
Emotional Intelligence Questionnaire, it was hypothesized that (a) social sciences would score
higher than technical studies in Emotionality, (b) arts would score higher than technical studies
in Emotionality, (c) arts would score lower than technical studies in Self-control, and (d) there
would be an interaction between gender and faculty, whereby female students would score
higher than male students within the social sciences only. Several other exploratory
comparisons were also performed. Results supported hypotheses (a), (b), and (d), but not
hypothesis (c), although the differences were in the predicted direction.
Nelis, Quoidbach, Mikolajczak and Hansenne (2009)2 the construct of emotional intelligence
(EI) refers to the individual differences in the perception, processing, regulation, and utilization
of emotional information. As these differences have been shown to have a significant impact on
important life outcomes (e.g., mental and physical health, work performance and social
relationships), this study investigated, using a controlled experimental design, whether it is
possible to increase EI. Participants of the experimental group received a brief empirically
derived EI training (four group training sessions of two hours and a half) while control
participants continued to live normally. Results showed a significant increase in emotion
identification and emotion management abilities in the training group. Follow-up measures
after 6 months revealed that these changes were persistent. No significant change was observed
in the control group. These findings suggest that EI can be improved and open new treatment
avenues. Hopkins & Bilimoria (2008)3 Explored the relation between emotional and social
intelligence competencies and organizational success. The study showed not much of
differences between male and female leaders in their demonstration of emotional and social
intelligence competencies. It was also found that when it comes to competency demonstration
most successful men and women were more the same than different. However gender did play
a reasonable role in the relationship between the demonstration of these competencies and
success. Further male leaders were considered to be more successful, even though male and
female leaders demonstrated the same level of competencies. The four competencies that
divided the most successful male and female leaders from their typical counterparts were Self
Confidence, Achievement Orientation, Inspirational Leadership and Change Catalyst.
Romanelli, Cain, and Smith (2006)4 examined a study conducted by Pau et al. in which the EI
of dental students and the effect of stress were evaluated. It was found that students with high
EI scores were found to have more adaptive coping strategies and better time management
skills as compared to who had low EI scores, students with low EI scores were found to have
engaged themselves in unhealthy behaviors such as smoking, procrastinating, and withdrawing
socially. Brown, Bryant, and Reilly (2005)5 in their study predicted a connection between
transformational leadership (TL) and desirable outcomes. They also went on to say that they
Vol. 6 Special Issue 1 February 2018 ISSN: 2320-4168
Shanlax International Journal of Commerce Page 5
would find transformational leadership predicts desirable outcomes. Further they predicted that
there would be a positive relation between EI and desirable outcomes, but were not sure if this
relation would be a simple relationship or would only emerge after factoring out the effects of
transformational leadership. The same authors also predicted that there would be a positive
relation with transformational leadership and EQ and a negative relation with contingent
reward and with laissez-faire leadership styles. Further they went on to propose by adding EI as
well as transformational leadership to a predictive model of desirable outcomes and predicted
an interaction effect between EI and TL.
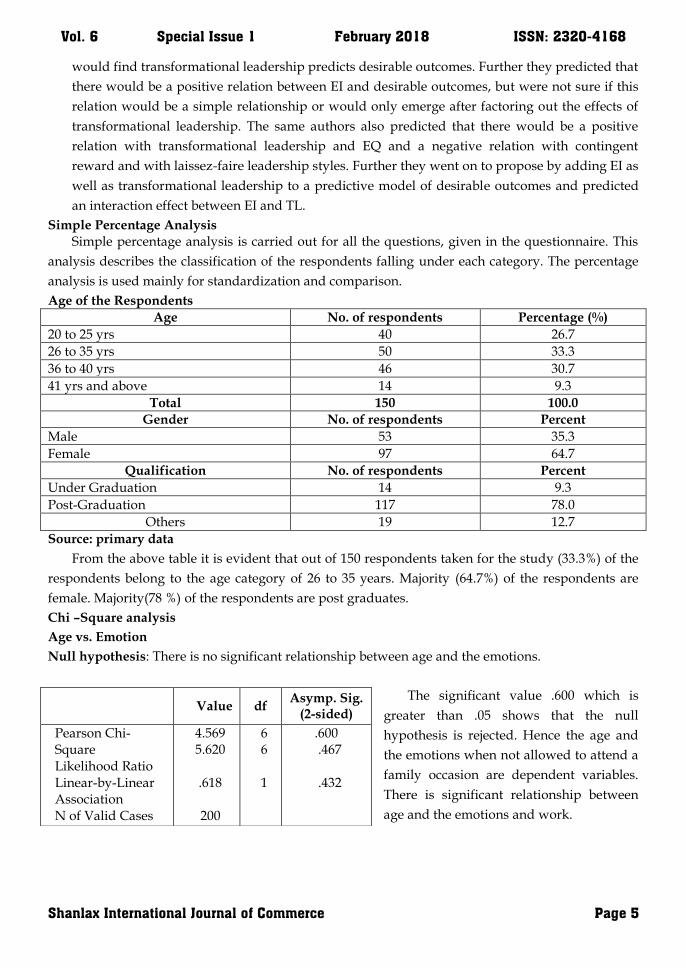
Simple Percentage Analysis Simple percentage analysis is carried out for all the questions, given in the questionnaire. This
analysis describes the classification of the respondents falling under each category. The percentage
analysis is used mainly for standardization and comparison.
Age of the Respondents
Age No. of respondents Percentage (%)
20 to 25 yrs 40 26.7
26 to 35 yrs 50 33.3
36 to 40 yrs 46 30.7
41 yrs and above 14 9.3
Total 150 100.0
Gender No. of respondents Percent
Male 53 35.3
Female 97 64.7
Qualification No. of respondents Percent
Under Graduation 14 9.3
Post-Graduation 117 78.0
Others 19 12.7
Source: primary data
From the above table it is evident that out of 150 respondents taken for the study (33.3%) of the
respondents belong to the age category of 26 to 35 years. Majority (64.7%) of the respondents are
female. Majority(78 %) of the respondents are post graduates.
Chi –Square analysis
Age vs. Emotion
Null hypothesis: There is no significant relationship between age and the emotions.
The significant value .600 which is
greater than .05 shows that the null
hypothesis is rejected. Hence the age and
the emotions when not allowed to attend a
family occasion are dependent variables.
There is significant relationship between
age and the emotions and work.
Value df
Asymp. Sig. (2-sided)
Pearson Chi-Square Likelihood Ratio Linear-by-Linear Association N of Valid Cases
4.569 5.620
.618
200
6 6 1
.600 .467
.432
National Conference on RECENT ADVANCEMENTS IN BUSINESS PRACTICES
Page 6 Nehru Institute of Management Studies, Coimbatore
Nirmala College For Women, Coimbatore
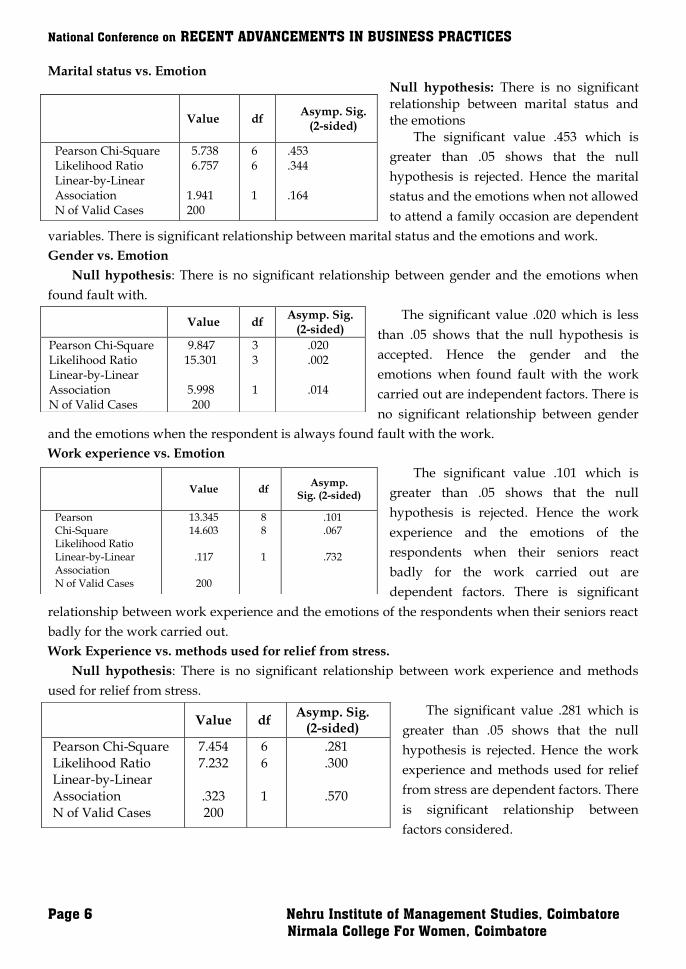
Marital status vs. Emotion Null hypothesis: There is no significant relationship between marital status and the emotions
The significant value .453 which is
greater than .05 shows that the null
hypothesis is rejected. Hence the marital
status and the emotions when not allowed
to attend a family occasion are dependent
variables. There is significant relationship between marital status and the emotions and work.
Gender vs. Emotion
Null hypothesis: There is no significant relationship between gender and the emotions when
found fault with.
The significant value .020 which is less
than .05 shows that the null hypothesis is
accepted. Hence the gender and the
emotions when found fault with the work
carried out are independent factors. There is
no significant relationship between gender
and the emotions when the respondent is always found fault with the work.
Work experience vs. Emotion
The significant value .101 which is
greater than .05 shows that the null
hypothesis is rejected. Hence the work
experience and the emotions of the
respondents when their seniors react
badly for the work carried out are
dependent factors. There is significant
relationship between work experience and the emotions of the respondents when their seniors react
badly for the work carried out.
Work Experience vs. methods used for relief from stress.
Null hypothesis: There is no significant relationship between work experience and methods
used for relief from stress.
The significant value .281 which is
greater than .05 shows that the null
hypothesis is rejected. Hence the work
experience and methods used for relief
from stress are dependent factors. There
is significant relationship between
factors considered.
Value df Asymp. Sig.
(2-sided)
Pearson Chi-Square Likelihood Ratio Linear-by-Linear Association N of Valid Cases
5.738 6.757
1.941 200
6 6 1
.453
.344 .164
Value df Asymp. Sig.
(2-sided)
Pearson Chi-Square Likelihood Ratio Linear-by-Linear Association N of Valid Cases
9.847 15.301
5.998 200
3 3
1
.020
.002
.014
Value df Asymp.
Sig. (2-sided)
Pearson Chi-Square Likelihood Ratio Linear-by-Linear Association N of Valid Cases
13.345 14.603
.117
200
8 8
1
.101
.067
.732
Value df Asymp. Sig.
(2-sided)
Pearson Chi-Square Likelihood Ratio Linear-by-Linear Association N of Valid Cases
7.454 7.232
.323 200
6 6
1
.281
.300
.570
Vol. 6 Special Issue 1 February 2018 ISSN: 2320-4168
Shanlax International Journal of Commerce Page 7
Conclusion
The world today is undergoing a change in a profound way since the dawn of the modern age.
For one, the global job market is demanding more of prospective employees. And the world‟s best
employers are not just pickier – they are seeking top graduates who also have emotional intelligence
strengths. Employers require emotional intelligence from their workers, especially as these skills
become more critical in a global, diverse workplace. Employees will have to participate in team
building and use collaborative, emotional intelligence skills that enhance working on shared goals.
"People who have successfully changed their eating habits or career paths often relied on these
methods," states Dr. Robert Epstein, United States International University at San Diego Professor.
Epstein calls them the "Three M's. Briefly, they are: Modify your environment, Monitor your
behavior, and Make commitments. People, who change their self, change their world, or "stimulus
environment." If you become more aware of what you are doing wrong -let's say an annoying bad
habit - and start self-monitoring yourself, you can start to perform positively. Just writing down on
a piece of paper each time you misbehave or mis-speak can make you focus on changing behavior.
Another powerful aid to developing those EI skill areas that you may want to reinforce is to make a
commitment to another person, who in turn, will put pressure on you when you don't comply with
the area in need of improvement. The really happy news with emotional intelligence maturity
building is that we can meet and master improvements in EI with skill techniques not just will
power. For workplace success, IQ matters, too – just not in the same way that EI does. IQ remains
the best predictor of which level of job someone can hold. For the professions (medicine, teaching,
accounting and the like) you need an IQ roughly a standard deviation among the norm – that is,
around 115 or higher. But once you are in that position, IQ does not guarantee that you will be
outstanding in your performance, nor that you will emerge as a leader. A main reason IQ no longer
predicts success once you are on the job is that everyone you are competing with is about as smart
as you. That‟s when emotional intelligence adds great value. The workplace competencies that
independent studies have identified as distinguishing outstanding performers and leaders from the
average are largely based on emotional intelligence – and as you go higher up the organizational
ladder, they have greater and greater value.
References
Further readings: Journals/Articles
1. Cavallo, K. and Brienza, D. (n.d.), “Emotional competence and leadership excellence at Johnson
and Johnson: the emotional intelligence and leadership study”, unpublished manuscript,
Michigan State University, East Lansing, MI.
2. O‟Reilly, C.A. and Chatman, J. (1986), “Organizational commitment and psychological
attachment: the effects of compliance, identification, and internalization on prosocial behavior”,
Journal of Applied Psychology, Vol. 71, pp. 492-9.
3. Scholl, R.W. (1981), “Differentiating organizational commitment from expectancy as a
motivating force”, Academy of Management Review, Vol. 6, pp. 589-99.
National Conference on RECENT ADVANCEMENTS IN BUSINESS PRACTICES
Page 8 Nehru Institute of Management Studies, Coimbatore
Nirmala College For Women, Coimbatore
FAMILY BUSINESS IN INDIA- TRENDS AND CHALLENGES
Abstract Family owned business is any business in which a majority of the ownership or control lies within a family. Family is one of the oldest surviving social system (Goode1982) and family business is the oldest surviving economic system. Family businesses exist all over the world for centuries. Families like Tata, Birla, Goenka, Murugappa, Bajaj, Modis, Bangurs, Mafattals, Godrej, Wipro, Ambani are surviving since more than 3 generations successfully. Long term commitment, family bonding, loyalty towards customers and employees, social identity, hands on training experience, risk taking capacity, fast decision making, respect for generations and family culture are some peculiar features of family businesses in India. With 75% of the Indian workforce employed by a family-owned business, how they are run and what are the trends and challenges they face is discussed in this paper. The outcome of the research will throw some lights for the long-term success of the family owned business. Keywords: Family business, succession planning, entrepreneurship, generation business, trends, challenges, JEL Classification N8, Introduction
By definition, a family business is one in which the majority of the stake is held by the person
who has established or acquired the company (or by his or her parents, spouse, child or child's
direct heir) and at least one representative of the family is involved in the management or
administration of the business. Around 80% of the world business is controlled by families. Family
businesses constitute the largest size in terms of ownership contribute significant to the gross
national product (GNP), total industrial employment and total exports of the country. The world‟s
oldest family business is a construction company named „KongoGumini‟ of Japan founded in 578
AD and is currently managed by the 40thgeneration. Some of largest family business firms
worldwide are: WAL – Mart (USA) – Sam Walt man Family, Samsung Group (South Korea),
Foxconn (Taiwan) and Tata Group (India) India enjoys a rich and glorious history of family
business. Many of India‟s largest and most celebrated companies were nurtured by a small group of
promoters and family members. The contribution that such family businesses have made towards
the growth of the Indian economy is highly commendable. Indian economy has gone through a
roller-coaster ride since the country‟s Independence. In 1947, India was an open economy but by the
mid-1950s, big business was a bad word and soon the government placed regulatory limits on
growth of big firms. Public sector firms were at the centre of the economy. Economic policy came a
full circle in 1991, as P V Narasimha Rao government unleashed reforms and liberalised the
economy. Big businesses and foreign capital were now objects of desire, rather than derision. All
through this change, one feature of Indian economy, has remained unchanged - the dominance of
family-owned enterprises. Fifteen of the top 20 business groups in 2016 are family-owned. Together,
they controlled nearly Rs 26 lakh crore ($390 billion) of assets at the end of FY16, accounting for 84
Dr.K.Soundarapandian
Professor, Department of Management Studies
Sri Sairam Engineering College, Chennai
S.Kenneth Larson & M.Hariharan
Full-Time Student, Management Program
Sri Sairam Engineering College, Chennai
Vol. 6 Special Issue 1 February 2018 ISSN: 2320-4168
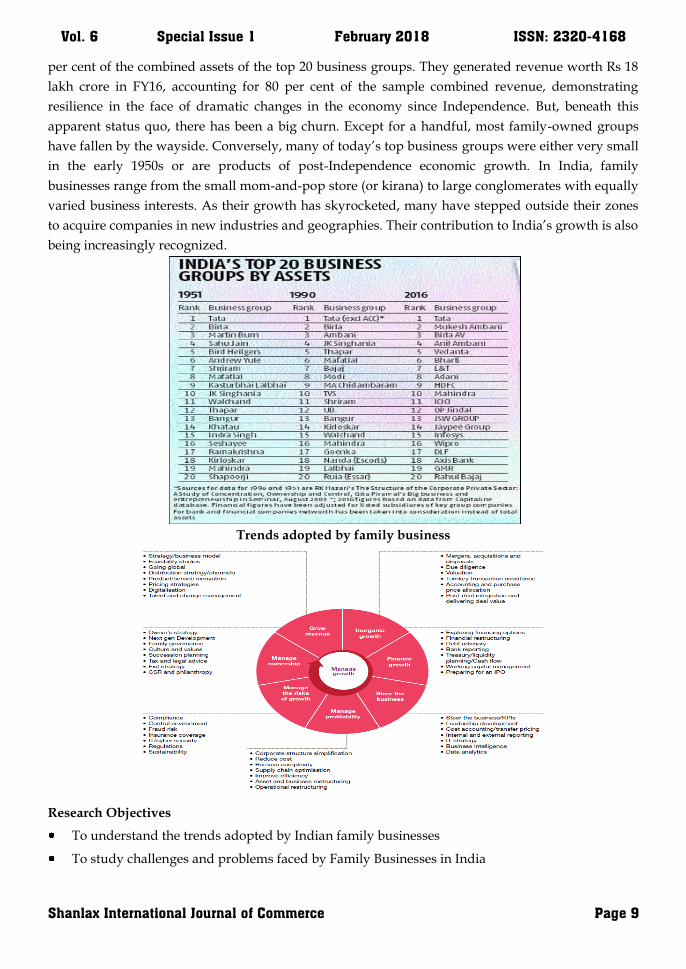
Shanlax International Journal of Commerce Page 9
per cent of the combined assets of the top 20 business groups. They generated revenue worth Rs 18
lakh crore in FY16, accounting for 80 per cent of the sample combined revenue, demonstrating
resilience in the face of dramatic changes in the economy since Independence. But, beneath this
apparent status quo, there has been a big churn. Except for a handful, most family-owned groups
have fallen by the wayside. Conversely, many of today‟s top business groups were either very small
in the early 1950s or are products of post-Independence economic growth. In India, family
businesses range from the small mom-and-pop store (or kirana) to large conglomerates with equally
varied business interests. As their growth has skyrocketed, many have stepped outside their zones
to acquire companies in new industries and geographies. Their contribution to India‟s growth is also
being increasingly recognized.
Trends adopted by family business
Research Objectives
To understand the trends adopted by Indian family businesses
To study challenges and problems faced by Family Businesses in India

National Conference on RECENT ADVANCEMENTS IN BUSINESS PRACTICES
Page 10 Nehru Institute of Management Studies, Coimbatore
Nirmala College For Women, Coimbatore
To Suggest measures to overcome problems and challenges of Family businesses in India
Certain Challenges Remain
In today‟s competitive environment, innovation is an essential requirement to survive and
thrive. Family businesses in India view continuous innovation as the most challenging aspect over
the next five years. Talent issues, technology needs and complying with the regulations are
additional challenges that family businesses will have to face over the next five years.
Innovation for a Competitive Advantage
Our survey reveals that 56% of the family businesses in India view the need to continually
innovate as a key challenge over the next five years. Innovation is critical maintain their relevance in
the changing business environments. In order to innovate successfully, they need to combine their
new strategies to broader business goals. In addition to this, these companies need to invest in
innovation, promote a culture where mistakes are permitted and also instill in the ranks that
innovation is crucial to survival.
Retaining Talent
This is important for any organization. Family businesses believe that attracting the right talent
(40%) and then retaining it (36%) is a challenge that will have to be faced in the medium term.
Efficient Succession Planning
Mentoring and developing the next generation of successors and leaders is crucial to the success
of family businesses. 22% of our respondents felt that training and preparing the high-potential
members of the staff to take up high-level decision-making positions and the ability to survive
succession is one of the major challenges awaiting them in the near future.
Need for New Technology
Technological advancements are redefining business models, strategies and the changing
industry dynamics. Family businesses are acutely aware of the risks their businesses face if they are
unable to either adapt to the new technological advancements or bring in new technologies to
enhance the quality of products and services. One-third of the companies interviewed feel the need
to constantly keep up with the fast-paced strides technology is taking in turning the older business
models obsolete and therefore, the need to invest time and resources in research and development
(R&D).
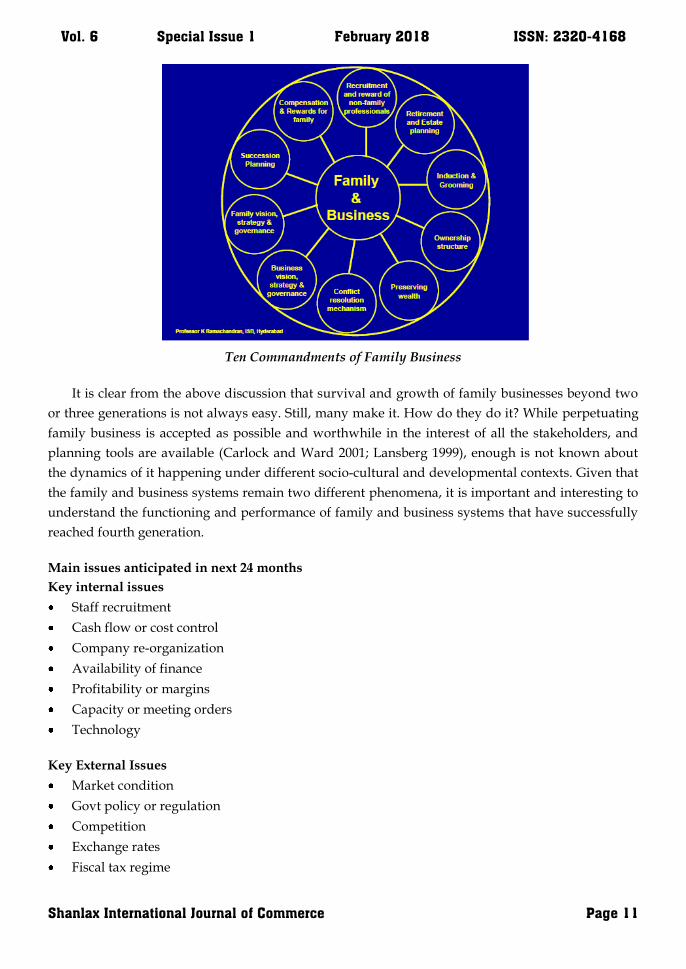
In essence, the most important areas of concern for the success of family businesses appear to be
the ten dimensions as listed in Figure 2. These are all interrelated, such as between succession
planning and conflict resolution and ownership structure. It is the synergy created by the
interactions and reinforcements of these dimensions that help family businesses to perpetuate.
While this needs empirical validation as the most important of many dimensions there does not
seem to be any dispute on their relevance. We could call them the Ten Commandments of Family
Business.
Vol. 6 Special Issue 1 February 2018 ISSN: 2320-4168
Shanlax International Journal of Commerce Page 11
Ten Commandments of Family Business
It is clear from the above discussion that survival and growth of family businesses beyond two
or three generations is not always easy. Still, many make it. How do they do it? While perpetuating
family business is accepted as possible and worthwhile in the interest of all the stakeholders, and
planning tools are available (Carlock and Ward 2001; Lansberg 1999), enough is not known about
the dynamics of it happening under different socio-cultural and developmental contexts. Given that
the family and business systems remain two different phenomena, it is important and interesting to
understand the functioning and performance of family and business systems that have successfully
reached fourth generation.
Main issues anticipated in next 24 months
Key internal issues
Staff recruitment
Cash flow or cost control
Company re-organization
Availability of finance
Profitability or margins
Capacity or meeting orders
Technology
Key External Issues
Market condition
Govt policy or regulation
Competition
Exchange rates
Fiscal tax regime
National Conference on RECENT ADVANCEMENTS IN BUSINESS PRACTICES
Page 12 Nehru Institute of Management Studies, Coimbatore
Nirmala College For Women, Coimbatore
Price of raw materials
Interest rates
Challenges for the Family Business
Emotions. Family problems will affect the business. Divorce, separations, health or financial
problems also create difficult political situations for the family members.
Informality. Absence of clear policies and business norms for family members
Tunnel vision. Lack of outside opinions and diversity on how to operate the business.
Lack of written strategy. No documented plan or long term planning.
Compensation problems for family members. Dividends, salaries, benefits and compensation
for non-participating family members are not clearly defined and justified.
Role confusion. Roles and responsibilities must be clearly defined.
Lack of talent. Hiring family members who are not qualified or lack the skills and abilities for
the organization. Inability to fire them when it is clear they are not working out.
High turnover of non-family members. When employees feel that the family “mafia” will
always advance over outsiders and when employees realize that management is incompetent.
Succession Planning. Most family organizations do not have a plan for handing the power to the
next generation, leading to great political conflicts and divisions.
Retirement and estate planning. Long term planning to cover the necessities and realities of
older members when they leave the company.
Training. There should be a specific training program when you integrate family members into
the company. This should provide specific information that related to the goals, expectations
and obligations of the position.
Paternalistic. Control is centralized and influenced by tradition instead of good management
practices.
Overly Conservative. Older family members try to preserve the status quo and resist
change. Especially resistance to ideas and change proposed by the younger generation.
Communication problems. Provoked by role confusion, emotions (envy, fear, anger), political
divisions or other relationship problems.
Systematic thinking. Decisions are made day-to-day in response to problems. No long-term
planning or strategic planning.
Exit strategy. No clear plan on how to sell, close or walk away from the business.
Business valuation. No knowledge of the worth of the business, and the factors that make it
valuable or decrease its value.
Growth. Problems due to lack of capital and new investment or resistance to re-investment in
the business.
Vision. Each family member has a different vision of the business and different goals.
Control of operations. Difficult to control other members of the family. Lack of participation in
the day-to-day work and supervision required.

Vol. 6 Special Issue 1 February 2018 ISSN: 2320-4168
Shanlax International Journal of Commerce Page 13
Discussion & Suggestions
75% of Indian family businesses have grown in the last 12 months; 84% expect to grow
either steadily or quickly and aggressively over the next 5 years. 56% of Indian family businesses
feel the need to innovate will be a key challenge in the next 5 years. Only 15% of family businesses
have a robust, documented and communicated succession plan. 35% plan to pass on management to
the next gen; 48% plan to pass on ownership but bring in professional management.
To make the most of new opportunities, we suggest that leaders of family businesses must be
prepared to do the following:
Acquire the right mix of talent, technology, and innovation to stay ahead of their competitors
Need to devote more time and resources on entrepreneurship and innovations in existing
operations
Redefine their strategies and goals from time to time, considering whether the strategies they
are pursuing will be relevant five years from now
Cross-verify and check whether they are competent enough to grow their market share, by
penetrating into the new markets, and even creating new markets
Examine their domestic performance thoroughly along with benchmarking with a peer group
before taking steps to go global so that when it happens, they are fully prepared to have
successful forays in international markets
Catalyse conversations with mentors, mentees, peers and colleagues.
Keep program participants engaged with leadership thinking when they return to their
workplace.
Create a common language amongst your colleagues on leadership and management practice
Keep up-to-date with the latest thought-leadership from the world‟s leading business schools.
Drill-down on the original research or even contact the researchers directly
Measuring and appraising performance
Shareholders‟ agreement
Family council
Third party mediator
National Conference on RECENT ADVANCEMENTS IN BUSINESS PRACTICES
Page 14 Nehru Institute of Management Studies, Coimbatore
Nirmala College For Women, Coimbatore
Conclusion
Family businesses in India will continue to play an integral part in the nation‟s growth story.
However, with more and more family businesses looking to run their organisations professionally
and with the corporates imbibing some of the ingredients which have helped family businesses
succeed, the lines between the two categories are getting blurred. Family enterprises are now much
more aware of their standing in the larger scheme of things. It is only a matter of time before family
businesses start to collaborate rather than compete, and in the process positively influence
government policies and actions in their favour. The government also has a crucial role to play in
ensuring that fiscal policies as well as domestic systems support family firms. This includes
providing a level playing field especially in terms of access to finance. Family-run businesses can
continue to be important drivers of India‟s overall growth if they are given the right support at the
right time.
References
1. Carlock, R.S. and Ward, J.L. (2001). Strategic Planning for the Family Business: parallel planning
to unify the family and business, New York. Palgrave.
2. Lansberg, 1. (1999) Succeeding Generations: realizing the dream of families in business, Boston,
MA. Harvard Business School Press.
3. Ramachandran, K. 2005. Indian family businesses: Their survival beyond three generations.
Working paper, Indian School of Business, Hyderabad, India.
4. http://www.pwc.in/assets/pdfs/services/private-and-entrepreneurial-services/family-
businesses-the-evolving-bharat-story.pdf.
5. https://www.pwc.in/assets/pdfs/publications/family-business-survey-2016/pwc-india-
family-business-survey-2016-aligning-with-indias-growth-story.pdf.
6. https://www.pwc.in/ghost-templates/india-family-business-survey-2012-13.html.
Vol. 6 Special Issue 1 February 2018 ISSN: 2320-4168
Shanlax International Journal of Commerce Page 15
ASSESSING FORCES ON CONSUMER INVOLVEMENT IN
PROTECTION AGAINST EXPLOITATION
Abstract
Consumer protection is safeguarding the interest and rights of consumers. The need for empowerment of consumers as a class cannot be exaggerated and is already well recognized all over the earth. The level of awareness of the consumer can be taken as a needle of the progress of a country. The present study aimed to know the assessing forces on consumer involvement in protection in Coimbatore District of Tamilnadu. The necessity of adopting measures to protect the interest of consumers arises mainly due to the helpless position of the consumers. There is no denying fact that the consumers have the basic right to be protected from the loss or injury caused on account of defective goods and deficiency of services. The respondents were selected on the basis of simple random sampling technique. The study concluded that special attention is needed for counseling and guidance mechanisms, training and research in consumer education, complaint handling, product testing labs, and so on. Keywords: Consumer, protection, Empowerment, Defective, Rights. Introduction
The consumers are becoming more mature and conscious of their rights against the malpractices
by the business. There are many consumer organisations and associations who are making efforts to
build consumer awareness, taking up their cases at various levels and helping them to enforce their
rights. The business has to serve consumer interests for their own survival and growth. On account
of globalisation and increased competition, any business organisation which indulges in
malpractices or fails to provide improved services to their ultimate consumer shall find it difficult to
continue. Hence, they must in their own long run interest, become consumer oriented. With the
growth in rural markets and due to poor knowledge about their rights and also to lack of skills to
take a rational decision based on information about the product or services, the rural consumer in
India is exploited in many ways. The rural consumer has been made to endure sub standard
products and services, adulterated foods, short weights and measures, spurious and hazardous
drugs, exorbitant process, endemic shortages leading to black marketing and profiteering,
unfulfilled manufacturing guarantees and host of other ills. The rural consumers who generally
depend on weekly markets to purchase essential things are often cheated due to lack of choice.
Consumer organisations have been active all over the world to promote and protect consumer
interests. A number of such organisations have also been set up in recent years in different parts of
India. It is felt that neither it is possible to discipline all members of the business community
through moral sanctions and a code of fair business practices nor can administrate orders and
legislative provisions to ensure consumer protection without the active involvement of consumer
associations. Now with an increasing number of consumer organisations involved in consumer
Dr.K.Raja Karthikeyan
Head and Research Supervisor, Department of Corporate
Secretaryship, Erode Arts and Science College, Erode
P.Felcy Christinal
Research Scholar, Department of Corporate Secretaryship
Erode Arts and Science College, Erode
National Conference on RECENT ADVANCEMENTS IN BUSINESS PRACTICES
Page 16 Nehru Institute of Management Studies, Coimbatore
Nirmala College For Women, Coimbatore
protection, the consumer movement is getting a foothold in India and helping individuals to seek
quick and adequate redressal of their grievances.
Need for the Study
Consumer protection is needed to provide better and all-round protection to consumers and
effective safeguards against different types of exploitation such as defective goods, deficient services
and unfair trade practices. The necessity of adopting measures to protect the interest of consumers
arises mainly due to the helpless position of the consumers. There is no denying fact that the
consumers have the basic right to be protected from the loss or injury caused on account of defective
goods and deficiency of services. But they hardly use their rights due to lack of awareness,
ignorance or lethargic attitude. However in view of the prevailing malpractices and their
vulnerability there to, it is necessary to provide them physical safety, protection of economic
interests, access to information, satisfactory product standard, and statutory measures for redressal
of their grievances.
Statement of the Problem
Generally, Indian consumer is poor, ignorant, reflexive, illiterate, unaware, and helpless. Due to
illiteracy, unawareness, traditional or reflexive outlook consumer is being exploited in unusual
ways. Especially, the rural consumers in India are usually ignorant and they are also unorganized.
Thus, they are exploited by the manufacturers, sellers and the service providers in dissimilar ways.
The rural consumers are not only scattered but also diverse and heterogeneous. As a result of
globalization and liberalization the rural market in India is the largest potential market in the world.
The manifestation of consumer desert are evident in the adulterated food the people eat, the
spurious, unsafe and substandard product the people buy, the repeated shortage of essential
commodities accompanied by black marketing and profiteering, the hazardous drugs banned in
some of the countries that are pushed through the counter, the glossy, unethical and manipulative
advertisements.
Objectives of the Study
1. To know the assessing forces on consumer involvement in protection in Coimbatore District of
Tamilnadu.
2. To give suitable suggestions for better ways and means for consumer protection.
Materials and Methods
Wahidul Habid and Gazi Salah Uddin (2008) provided an insight into the awareness and
perception towards consumer rights in Dhaka City, Bangladesh. The study revealed that 84% of the
respondents had never heard about consumer rights and only 16% of them found aware about the
consumers‟ rights. A large of number of respondents i.e. 84.7% had never heard about CAB,
however, most of the respondents (86%) were aware about the role of BSTI. The television and news
paper were good source of information. Partap Singh and Joginder Grewal (2013) concluded that
even than several laws meant to protect consumers against such unfair trade practices, false and
misleading advertisements continue exploit the consumers. If the hour is improved laws in keeping
Vol. 6 Special Issue 1 February 2018 ISSN: 2320-4168
Shanlax International Journal of Commerce Page 17
with the times, better enforcement, curative advertisements better self- regulations by industry
independent regulator to regulate health and children - related advertisements. Outdated laws,
deprived enforcement of them are some of the lacunas in order to control advertising. Nature,
women, the youth and the rural populations, all need to be accommodated in any planning ahead
for a sustainable, healthy and meaningful life for India‟s „tomorrow‟ consumers. Procedural
simplicity and speedy and inexpensive redressal of consumer grievances as contained in the
Consumer Protection Act are really unique and have few parallels in the world. Execution of the Act
reveals that interests of consumers are better protected than ever before. However, consumer
awareness through consumer education and actions by the government, consumer activists, and
associations are needed the most to make consumer protection movement a success in the country.
Positively, telivision programmes have begun to discuss the problems of consumer protection and
consumer‟s movement and a separate cell for consumer protection has been formed in the Ministry
of Food and Supplies. Therefore, the domestic products should be of high quality to attract the
interest and build the trust of consumers, and the government should enact certain standards for the
quality assurance of not only the domestic but also the imported products.
Methodology is a form to systematically resolve the research problems. It explains the different
steps that are normally adopted by the researcher in studying the research problems along with the
logic behind it. This study used both primary data and secondary data. For collecting primary data
field survey technique was undertaken in the study. The researcher has collected five hundred and
thirty samples in Coimbatore district by means of using questionnaires from the different
consumers. The respondents were selected on the basis of simple random sampling technique.
Factor analysis was used for further analysis.
Results and Discussions
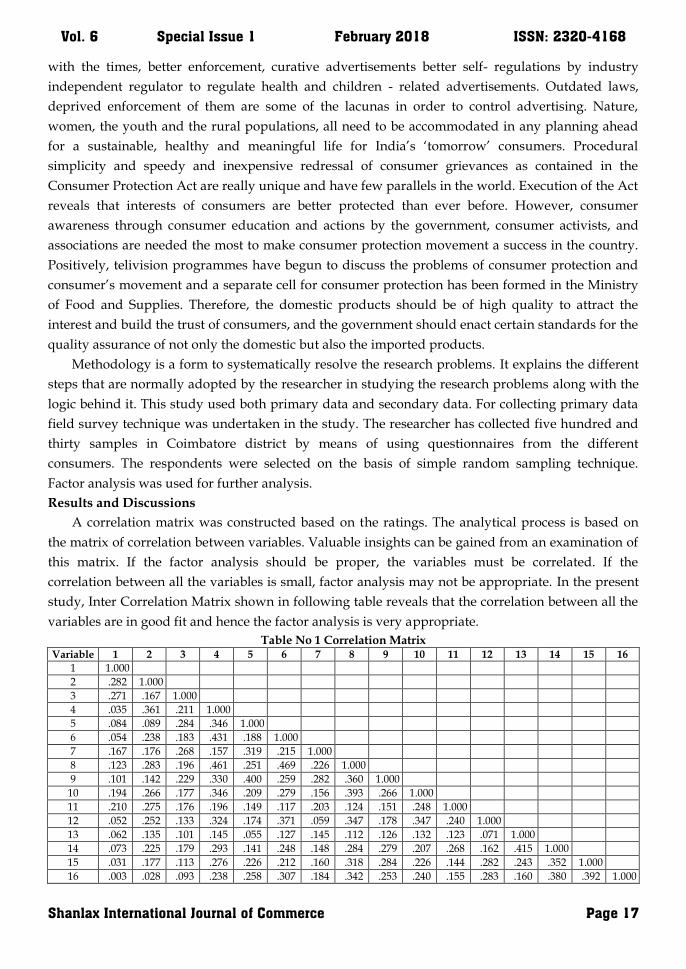
A correlation matrix was constructed based on the ratings. The analytical process is based on
the matrix of correlation between variables. Valuable insights can be gained from an examination of
this matrix. If the factor analysis should be proper, the variables must be correlated. If the
correlation between all the variables is small, factor analysis may not be appropriate. In the present
study, Inter Correlation Matrix shown in following table reveals that the correlation between all the
variables are in good fit and hence the factor analysis is very appropriate.
Table No 1 Correlation Matrix Variable 1 2 3 4 5 6 7 8 9 10 11 12 13 14 15 16
1 1.000
2 .282 1.000
3 .271 .167 1.000
4 .035 .361 .211 1.000
5 .084 .089 .284 .346 1.000
6 .054 .238 .183 .431 .188 1.000
7 .167 .176 .268 .157 .319 .215 1.000
8 .123 .283 .196 .461 .251 .469 .226 1.000
9 .101 .142 .229 .330 .400 .259 .282 .360 1.000
10 .194 .266 .177 .346 .209 .279 .156 .393 .266 1.000
11 .210 .275 .176 .196 .149 .117 .203 .124 .151 .248 1.000
12 .052 .252 .133 .324 .174 .371 .059 .347 .178 .347 .240 1.000
13 .062 .135 .101 .145 .055 .127 .145 .112 .126 .132 .123 .071 1.000
14 .073 .225 .179 .293 .141 .248 .148 .284 .279 .207 .268 .162 .415 1.000
15 .031 .177 .113 .276 .226 .212 .160 .318 .284 .226 .144 .282 .243 .352 1.000
16 .003 .028 .093 .238 .258 .307 .184 .342 .253 .240 .155 .283 .160 .380 .392 1.000
National Conference on RECENT ADVANCEMENTS IN BUSINESS PRACTICES
Page 18 Nehru Institute of Management Studies, Coimbatore
Nirmala College For Women, Coimbatore
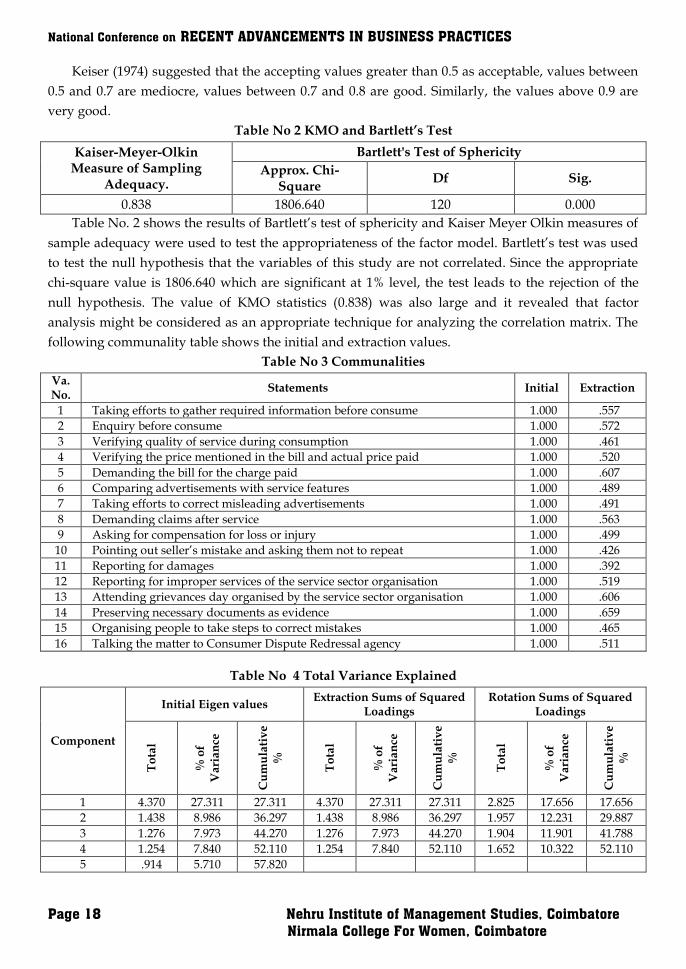
Keiser (1974) suggested that the accepting values greater than 0.5 as acceptable, values between
0.5 and 0.7 are mediocre, values between 0.7 and 0.8 are good. Similarly, the values above 0.9 are
very good.
Table No 2 KMO and Bartlett’s Test
Kaiser-Meyer-Olkin Measure of Sampling
Adequacy.
Bartlett's Test of Sphericity
Approx. Chi-Square
Df Sig.
0.838 1806.640 120 0.000
Table No. 2 shows the results of Bartlett‟s test of sphericity and Kaiser Meyer Olkin measures of
sample adequacy were used to test the appropriateness of the factor model. Bartlett‟s test was used
to test the null hypothesis that the variables of this study are not correlated. Since the appropriate
chi-square value is 1806.640 which are significant at 1% level, the test leads to the rejection of the
null hypothesis. The value of KMO statistics (0.838) was also large and it revealed that factor
analysis might be considered as an appropriate technique for analyzing the correlation matrix. The
following communality table shows the initial and extraction values.
Table No 3 Communalities
Va. No.
Statements Initial Extraction
1 Taking efforts to gather required information before consume 1.000 .557
2 Enquiry before consume 1.000 .572
3 Verifying quality of service during consumption 1.000 .461
4 Verifying the price mentioned in the bill and actual price paid 1.000 .520
5 Demanding the bill for the charge paid 1.000 .607
6 Comparing advertisements with service features 1.000 .489
7 Taking efforts to correct misleading advertisements 1.000 .491
8 Demanding claims after service 1.000 .563
9 Asking for compensation for loss or injury 1.000 .499
10 Pointing out seller‟s mistake and asking them not to repeat 1.000 .426
11 Reporting for damages 1.000 .392
12 Reporting for improper services of the service sector organisation 1.000 .519
13 Attending grievances day organised by the service sector organisation 1.000 .606
14 Preserving necessary documents as evidence 1.000 .659
15 Organising people to take steps to correct mistakes 1.000 .465
16 Talking the matter to Consumer Dispute Redressal agency 1.000 .511
Table No 4 Total Variance Explained
Component
Initial Eigen values Extraction Sums of Squared
Loadings Rotation Sums of Squared
Loadings
To
tal
% o
f
Va
ria
nce
Cu
mu
lati
ve
%
To
tal
% o
f
Va
ria
nce
Cu
mu
lati
ve
%
To
tal
% o
f
Va
ria
nce
Cu
mu
lati
ve
%
1 4.370 27.311 27.311 4.370 27.311 27.311 2.825 17.656 17.656
2 1.438 8.986 36.297 1.438 8.986 36.297 1.957 12.231 29.887
3 1.276 7.973 44.270 1.276 7.973 44.270 1.904 11.901 41.788
4 1.254 7.840 52.110 1.254 7.840 52.110 1.652 10.322 52.110
5 .914 5.710 57.820

Vol. 6 Special Issue 1 February 2018 ISSN: 2320-4168
Shanlax International Journal of Commerce Page 19
6 .820 5.124 62.944
7 .781 4.880 67.824
8 .758 4.735 72.559
9 .710 4.438 76.997
10 .680 4.251 81.248
11 .601 3.755 85.003
12 .588 3.673 88.675
13 .505 3.158 91.834
14 .468 2.926 94.760
15 .424 2.653 97.413
16 .414 2.587 100.000
From Table No. 4, it was observed that the labeled “Initial Eigen values” gives the Eigen values.
The Eigen value for a factor indicates the “Total Variance” attributed to the factor. From the
extraction sum of squared loadings, it was learnt that the first factor accounted for a variance 4.370
which was 27.311%, the second factor accounted for the variance 1.438 which was 8.986%, the third
factor accounted for the variance 1.276 which was 7.973%, and the fourth factor accounted for the
variance 1.254 which was 7.840%. All these four factors put together showed the total percentage of
the variance with 52.110.
Chart 1
Determination of Factors
Based on Eigen values
In this approach only
factors with Eigen values
greater than 1.00 are
retained and the other
factors are not included in
this model. The five
components possessing
the Eigen values which
were greater than 1.00
were taken as the
components extracted.
Table No 5 Rotated Component Matrix
Variables Component
1 2 3 4
Reporting for improper services of the service sector organisation .705
Demanding claims after service .691
Comparing advertisements with service features .672
Verifying the price mentioned in the bill and actual price paid .663
Pointing out seller‟s mistake and asking them not to repeat .563
Demanding the bill for the charge paid
.741
Taking efforts to correct misleading advertisements
.651
Asking for compensation for loss or injury
.609
Verifying quality of service during consumption
.551
Preserving necessary documents as evidence
.767
National Conference on RECENT ADVANCEMENTS IN BUSINESS PRACTICES
Page 20 Nehru Institute of Management Studies, Coimbatore
Nirmala College For Women, Coimbatore
Attending grievances day organised by the service sector organisation
.752
Organising people to take steps to correct mistakes
.555
Talking the matter to Consumer Dispute Redressal agency
.500
Taking efforts to gather required information before consume
.718
Enquiry before consume .402 .633
Reporting for damages
.545
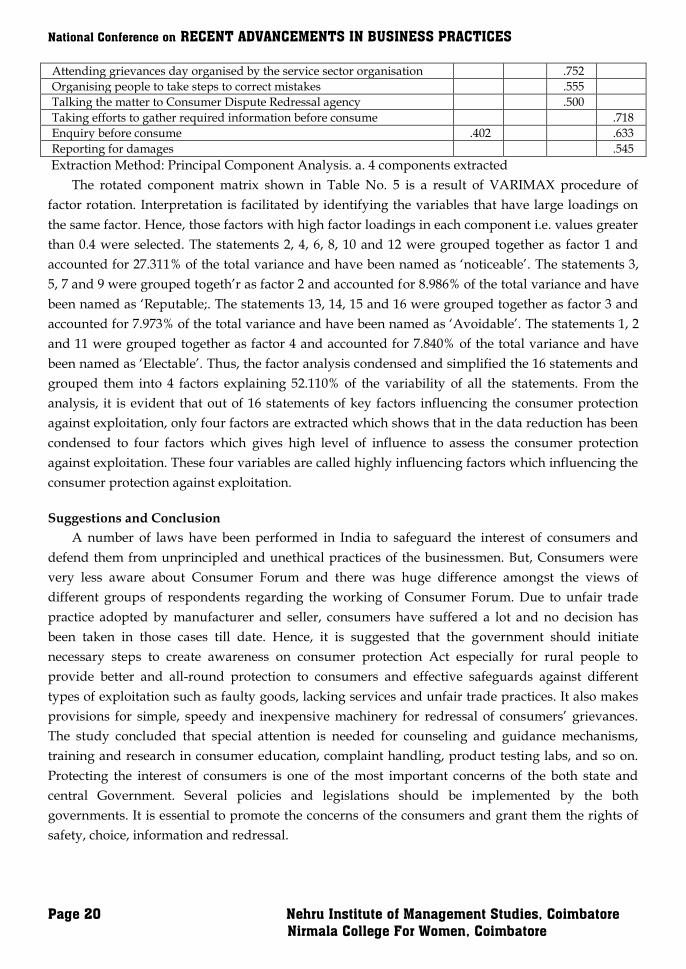
Extraction Method: Principal Component Analysis. a. 4 components extracted
The rotated component matrix shown in Table No. 5 is a result of VARIMAX procedure of
factor rotation. Interpretation is facilitated by identifying the variables that have large loadings on
the same factor. Hence, those factors with high factor loadings in each component i.e. values greater
than 0.4 were selected. The statements 2, 4, 6, 8, 10 and 12 were grouped together as factor 1 and
accounted for 27.311% of the total variance and have been named as „noticeable‟. The statements 3,
5, 7 and 9 were grouped togeth‟r as factor 2 and accounted for 8.986% of the total variance and have
been named as „Reputable;. The statements 13, 14, 15 and 16 were grouped together as factor 3 and
accounted for 7.973% of the total variance and have been named as „Avoidable‟. The statements 1, 2
and 11 were grouped together as factor 4 and accounted for 7.840% of the total variance and have
been named as „Electable‟. Thus, the factor analysis condensed and simplified the 16 statements and
grouped them into 4 factors explaining 52.110% of the variability of all the statements. From the
analysis, it is evident that out of 16 statements of key factors influencing the consumer protection
against exploitation, only four factors are extracted which shows that in the data reduction has been
condensed to four factors which gives high level of influence to assess the consumer protection
against exploitation. These four variables are called highly influencing factors which influencing the
consumer protection against exploitation.
Suggestions and Conclusion
A number of laws have been performed in India to safeguard the interest of consumers and
defend them from unprincipled and unethical practices of the businessmen. But, Consumers were
very less aware about Consumer Forum and there was huge difference amongst the views of
different groups of respondents regarding the working of Consumer Forum. Due to unfair trade
practice adopted by manufacturer and seller, consumers have suffered a lot and no decision has
been taken in those cases till date. Hence, it is suggested that the government should initiate
necessary steps to create awareness on consumer protection Act especially for rural people to
provide better and all-round protection to consumers and effective safeguards against different
types of exploitation such as faulty goods, lacking services and unfair trade practices. It also makes
provisions for simple, speedy and inexpensive machinery for redressal of consumers‟ grievances.
The study concluded that special attention is needed for counseling and guidance mechanisms,
training and research in consumer education, complaint handling, product testing labs, and so on.
Protecting the interest of consumers is one of the most important concerns of the both state and
central Government. Several policies and legislations should be implemented by the both
governments. It is essential to promote the concerns of the consumers and grant them the rights of
safety, choice, information and redressal.

Vol. 6 Special Issue 1 February 2018 ISSN: 2320-4168
Shanlax International Journal of Commerce Page 21
References
1. Arora Renu, “Consumer Grievance Redressed “Manak Publication Pvt. Ltd., New Delhi.
Consumer Protection Issue and Acts (2000) “Art of Science and Adverting” Jaipur, RBSA
Publication, 2005.
2. Giram, S.J and Sawarkar, J.G, “Consumer Awareness: A Survey Analysis”, Indian Journal of
Marketing, Vol. 25, 1996, pp. 13-21.
3. Kumar, N. and Batra, N., “Consumer Rights-Awareness and Action”, Indian Journal of
Marketing, 21 (4), 1990, pp. 21-23.
4. Md. Wahidul Habid and Md. Gazi Salah Uddin, “Consumers‟ Perception and Awareness of
Consumers Rights: A Study on Dhaka City”, Consumer Protection and Welfare, Krishnankoil
Snams Book House Pvt. Ltd, Kalasalingam University, Chennai, 2008.
5. Partap Singh and Joginder Grewal, “Consumer Protection in India: Some Issues and Trends”,
International Journal of Latest Trends in Engineering and Technology, Vol. 2, Issue 1, January
2013, pp.272-276.
6. Roopa vajpeyi, “The Future Consumer Dilemmas” Yojana, Vol. 53, Feb 2009, pp. 49-52.
7. Singh. K and Shetty.S, “Awareness of Consumer Protection Act among Doctors in Udaipur City,
India”, Journal of Dentistry, Tehran University of Medical Sciences, Vol. 7, No. 1. 2010.
National Conference on RECENT ADVANCEMENTS IN BUSINESS PRACTICES
Page 22 Nehru Institute of Management Studies, Coimbatore
Nirmala College For Women, Coimbatore
STUDY ON EFFECTIVENESS OF APPLIED PSYCHOLOGY AMONG EMPLOYEES
Abstract
Psychology has been extraordinarily successful at attracting the next generation of social scientists into the discipline. The growth of interest in psychology during the past three decades is most striking when compare psychology to social science disciplines of sociology, political science, and economics. The project was carried in order to analyse and interpret the psychological status of the employees of Rentokil India Pvt. Ltd., Coimbatore. For the purpose of analysis the statistical tool - Percentage Analysis was used. Keywords: Applied psychology, Growth of interest, Sociology, Political science, economics, Percentage Analysis. Introduction
Psychology has been extraordinarily successful at attracting the next generation of social
scientists into the discipline. The growth of interest in psychology during the past three decades is
most striking when compare psychology to social science disciplines of sociology, political science,
and economics.
It is clear that the field of psychology has grown and changed markedly over the past
generation. The field is now in the position of enjoying a powerful flow of undergraduates who are
eager to develop careers where they can use their training and follow their interests in psychology.
The extraordinary growth of applied psychology, especially in applied areas of business,
government, law, health, prevention, social change, and education, signals a momentous change in
the role of psychology in society. The most prominent professional associations of psychologists
have taken note of this change, and now commit significant time and resources to further the
development of applied psychology.
Behavioral and social scientists are encouraged to bring their research results forward to help
inform the public and the public policy process about the Decade‟s four major themes.
Increasing safety
Increasing prosperity
Promoting democracy
Improving health and education
The goals of this initiative are to educate the public about the importance and relevance of
behavioral and social science research, to translate research findings into public policy, to generate
new knowledge relevant to current problems, and to recruit the next generation of scholars into the
behavioral and social sciences.
X.Infanta
Department of Corporate Secretaryship
Bishop Ambrose College, Coimbatore, Tamil Nadu, India
Dr.S.Leema Rosaline
Department of Commerce, Nirmala College for Women
Coimbatore, Tamil Nadu, India

Vol. 6 Special Issue 1 February 2018 ISSN: 2320-4168
Shanlax International Journal of Commerce Page 23
Literature Review
John E. Mathieu [2007]1examined in their study that the effects of organizational district and
team contexts on team processes and performance in a longitudinal cross-level design. As
hypothesized, at the team-level of analysis, interdependence related positively to team performance
as partially mediated by processes. Moreover, a cross-level meditational relationship was evident
between the organizational district-level openness climate and team performance as fully mediated
by team processes. In contrast, organizational district-level multi-team coordination unexpectedly
exhibited a direct cross-level relationship with team performance. Multi-team coordination also
negatively interacted with team processes as related to team performance, in an exploratory
analysis. Resultswere discussed in terms of the importance of considering both organizational-
district and team contexts as embedding conditions that influenced team effectiveness.
James A. Breaugh and Jessalyn Arnold (2007)2 obtained in their study that the introduction to
the use of a matched-groups design as a strategy for controlling nuisance variables. Building on the
insightful comments of Campbell and Kenny and of Meehl, the authors utilized Monte Carlo
simulations to highlight three major limitations of this control strategy (i.e., regression toward
different means, systematic unmatching and the generalizability of results) that they believe had
received insufficient attention by researchers. Particular attention was given to how the effect of
regression toward different means can result in researchers' drawing erroneous conclusions from
their data. Recommendations for researchers considering the use of a matched-groups design were
provided.
Morgeson, et al., (2005)3 found in their research that there was considerable variation in how
broadly individuals defined their jobs. They investigated the theoretically meaningful yet
infrequently studied relationships between incumbent job autonomy, cognitive ability, job-related
skill, role breadth and job performance. Using multiple data sources and multiple measurement
occasions in a field setting, they found that job autonomy, cognitive ability and job-related skill were
positively related to role breadth, accounting for 23% of the variance in role breadth. In addition,
role breadth was positively related to job performance and was found to mediate the relationship
between job autonomy, cognitive ability, job-related skill and job performance. These results added
to our understanding of the factors that predicted role breadth, as well as having implications for
how job aspects and individual characteristics were translated into performance outcomes and the
treatment of variability in incumbent reports of job tasks.
Campion, et al., (2005)4 evaluated in their study that successful work-design initiatives must
overcome many obstacles in order to have their intended impact. This research outlined eight
obstacles to work redesign: (1) influences on multiple outcomes, (2) trade-offs between different
approaches, (3) difficulty in choosing appropriate units of analysis, (4) difficulty in predicting the
nature of the job, (5) complications from individual differences, (6) job enlargement occurring
without job enrichment, (7) creating new jobs as part of growth or downsizing and (8) differences
between long-term and short-term effects. This study examined the nature of these eight obstacles,
reviews prior research on this topic and outlined suggestions for managing these obstacles in
practice.
National Conference on RECENT ADVANCEMENTS IN BUSINESS PRACTICES
Page 24 Nehru Institute of Management Studies, Coimbatore
Nirmala College For Women, Coimbatore
Hossam M. Abu (2002)5 obtained in the study that the relationship between job characteristics
and work attitudes and behaviors in a non-Western context. Job characteristics (i.e., task variety,
task identity, task significance, autonomy and feedback) were tested as predictors of three key work
outcomes (i.e., job satisfaction, organizational commitment and turnover intentions) after
controlling the impact of some demographic variables and organizational justice. Data were
collected from 350 employees working in five different services and manufacturing organizations in
Dubai. Consistent with studies conducted in a Western context, a series of hierarchical regression
analyses showed that high skill variety and increased feedback led to increased job satisfaction,
organizational commitment and decreased turnover intentions. Contrary to Western studies, the
study revealed that task identity was positively related to job satisfaction and task significance had
functional effects on work attitudes and behaviours.
Parker, et al., (2001)6 reported that the developments in work design theory had not kept pace
with the changes occurring in the organizational landscape. They proposed a theoretical framework
that specified five categories of work design variables that span individual, group and
organizational levels of analysis. Specifically, they proposed an elaborated model of work design
that included: systematic consideration of antecedents of work characteristics; expansion of the
traditional range of work characteristics to include aspects salient to the modern context; extension of
the range of outcome variables beyond the existing narrow focus on affective reactions; analysis of
the mechanisms or processes, that explained why work characteristics led to particular outcomes and
consideration of contingencies that moderated the effects of work characteristics. They argued that
the particular choice of work design variables should be guided by theory and an analysis of the
organizational context.
Shalley, et al., (2000)7 reported that survey of 2,200 individuals, the authors examined the
degree to which work environments were structured to complement the creative requirements of
jobs. Regression analyses indicated that proximal job characteristics were more strongly associated
with a combined objective and perceptual measure of job-required creativity than were distal
organizational characteristics.
Edwards, et al., (1999)8 evaluated in their study that development of the Job Satisfaction Survey
(JSS), a nine-subscale measure of employee job satisfaction applicable specifically to human service,
public and non-profit sector organizations, was described. The item selection, item analysis and
determination of the final 36-item scale were also described and data on reliability and validity and
the instrument's norms were summarized. Included were a multi trait-multi method analysis of the
JSS and the Job Descriptive Index (JDI), factor analysis of the JSS and scale inter correlations.
Correlation of JSS scores with criteria of employee perceptions and behaviors for multiple samples
were consistent with findings involving other satisfaction scales and with findings from the private
sector. The strongest correlations were with perceptions of the job and supervisor, intention of
quitting and organizational commitment. More modest correlations were found with salary, age,
level, absenteeism and turnover.
Raymark, et al., (1997)9 determined in their research one factor that can influence the
magnitude of predictive validity of personality tests for selection was the bandwidth of the
constructs measured (Ashton, Jackson, Paunonen, Helmes, & Rothstein, Journal of Research in
Vol. 6 Special Issue 1 February 2018 ISSN: 2320-4168
Shanlax International Journal of Commerce Page 25
Personality, 29, 432–442 (1995)). In addition, certain personality characteristics had been shown to
be more prevalent in an occupational category (Barrick & Mount, Personnel Psychology, 44, 1 –26
(1991)). The results of this study suggested the necessity to perform personality based job analysis
within a specific occupational category to properly select a personality measure. Criterion validity
coefficients of broad constructs were non significant. However, specific facets identified in a
personality based job analysis demonstrated moderate significant correlations. In addition,
applicants preferred a more narrowly defined selection test.
Michael A. Campion (1993)10stated in the study that five common themes were derived from
the literature on effective work groups and then characteristics representing the themes were related
to effectiveness criteria. Themes included job design, interdependence, composition, context and
process. They contained 19 group characteristics which were assessed by employees and managers.
Effectiveness criteria included productivity, employee satisfaction and manager judgments. Results
showed that all three effectiveness criteria were predicted by the characteristics and nearly all
characteristics predicted some of the effectiveness criteria. The job design and process themes were
slightly more predictive than the interdependence, composition and context themes. Implications
for designing effective work groups were discussed and a 54-item measure of the 19 characteristics
was presented for future research.
An Overview of Applied Psycology
Understanding of Applied Psychology
The trends and developments described earlier set the context for the main event. Directly from
some of the individuals responsible for advancing scientific psychology and promoting its growth,
to learn their views about the progress and promise of using scientific psychology to promote
human welfare and social betterment throughout the 21st century.
Definition of Applied Psychology
According to John W.Santrock (2010), applied psychology is the use of psychological methods
and findings of scientific psychology to solve practical problems of human and animal behavior and
experience.
Like all psychologists, applied psychologists are trained in the basic science of psychology.
Their unique contributions result from their application of psychological concepts to problems of
human behavior (Aamodt, 1999).
Statement of the problem
Psychological research is often conceptualized as being either basic research or applied research.
Basic psychological research, usually laboratory based, is conducted to gain a scientific
understanding of human behavior, often primarily for the purpose of advancing relevant theories.
Applied psychological research is conducted for some additional reasons : to gain a scientific
understanding of human behaviors that occur in work and everyday life, or to solve practical
problems encountered in daily pursuits. In this research, historical and current trends in cognitive
psychology research are presented to demonstrate the rich tradition of applied research among the
employees working in Rentokil Pvt Ltd, Coimbatore.
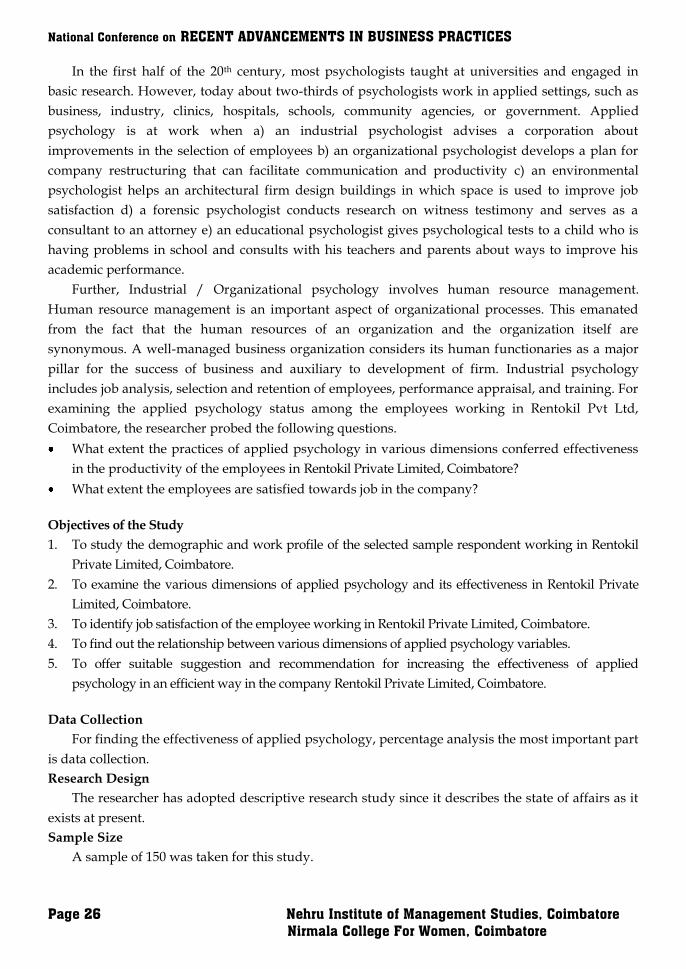
National Conference on RECENT ADVANCEMENTS IN BUSINESS PRACTICES
Page 26 Nehru Institute of Management Studies, Coimbatore
Nirmala College For Women, Coimbatore
In the first half of the 20th century, most psychologists taught at universities and engaged in
basic research. However, today about two-thirds of psychologists work in applied settings, such as
business, industry, clinics, hospitals, schools, community agencies, or government. Applied
psychology is at work when a) an industrial psychologist advises a corporation about
improvements in the selection of employees b) an organizational psychologist develops a plan for
company restructuring that can facilitate communication and productivity c) an environmental
psychologist helps an architectural firm design buildings in which space is used to improve job
satisfaction d) a forensic psychologist conducts research on witness testimony and serves as a
consultant to an attorney e) an educational psychologist gives psychological tests to a child who is
having problems in school and consults with his teachers and parents about ways to improve his
academic performance.
Further, Industrial / Organizational psychology involves human resource management.
Human resource management is an important aspect of organizational processes. This emanated
from the fact that the human resources of an organization and the organization itself are
synonymous. A well-managed business organization considers its human functionaries as a major
pillar for the success of business and auxiliary to development of firm. Industrial psychology
includes job analysis, selection and retention of employees, performance appraisal, and training. For
examining the applied psychology status among the employees working in Rentokil Pvt Ltd,
Coimbatore, the researcher probed the following questions.
What extent the practices of applied psychology in various dimensions conferred effectiveness
in the productivity of the employees in Rentokil Private Limited, Coimbatore?
What extent the employees are satisfied towards job in the company?
Objectives of the Study
1. To study the demographic and work profile of the selected sample respondent working in Rentokil
Private Limited, Coimbatore.
2. To examine the various dimensions of applied psychology and its effectiveness in Rentokil Private
Limited, Coimbatore.
3. To identify job satisfaction of the employee working in Rentokil Private Limited, Coimbatore.
4. To find out the relationship between various dimensions of applied psychology variables.
5. To offer suitable suggestion and recommendation for increasing the effectiveness of applied
psychology in an efficient way in the company Rentokil Private Limited, Coimbatore.
Data Collection
For finding the effectiveness of applied psychology, percentage analysis the most important part
is data collection.
Research Design
The researcher has adopted descriptive research study since it describes the state of affairs as it
exists at present.
Sample Size
A sample of 150 was taken for this study.
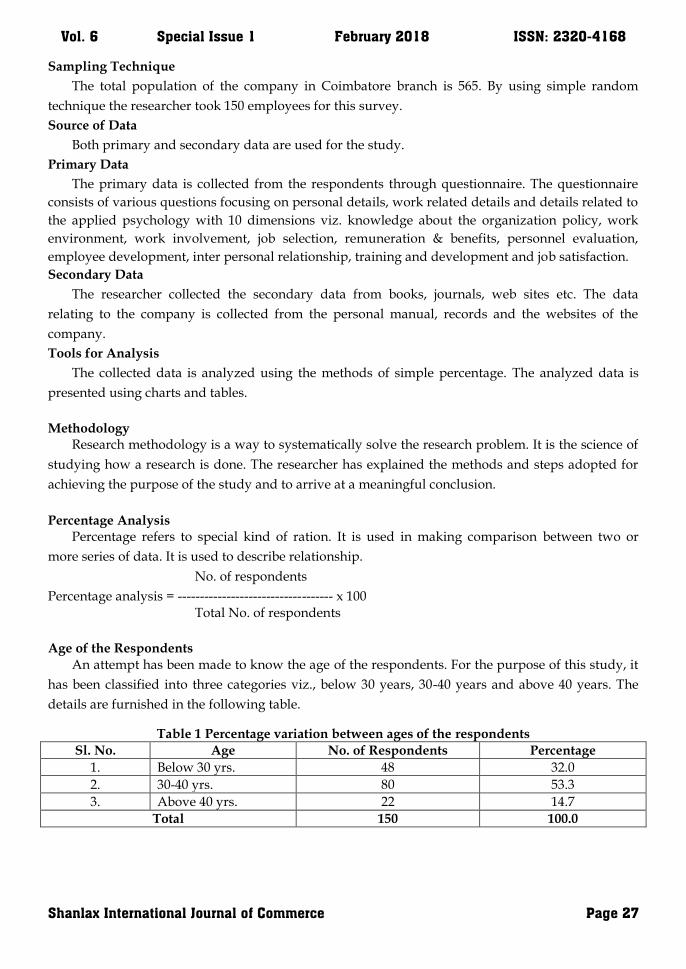
Vol. 6 Special Issue 1 February 2018 ISSN: 2320-4168
Shanlax International Journal of Commerce Page 27
Sampling Technique
The total population of the company in Coimbatore branch is 565. By using simple random
technique the researcher took 150 employees for this survey.
Source of Data
Both primary and secondary data are used for the study.
Primary Data
The primary data is collected from the respondents through questionnaire. The questionnaire
consists of various questions focusing on personal details, work related details and details related to
the applied psychology with 10 dimensions viz. knowledge about the organization policy, work
environment, work involvement, job selection, remuneration & benefits, personnel evaluation,
employee development, inter personal relationship, training and development and job satisfaction.
Secondary Data
The researcher collected the secondary data from books, journals, web sites etc. The data
relating to the company is collected from the personal manual, records and the websites of the
company.
Tools for Analysis
The collected data is analyzed using the methods of simple percentage. The analyzed data is
presented using charts and tables.
Methodology Research methodology is a way to systematically solve the research problem. It is the science of
studying how a research is done. The researcher has explained the methods and steps adopted for
achieving the purpose of the study and to arrive at a meaningful conclusion.
Percentage Analysis Percentage refers to special kind of ration. It is used in making comparison between two or
more series of data. It is used to describe relationship.
No. of respondents
Percentage analysis = ----------------------------------- x 100 Total No. of respondents
Age of the Respondents
An attempt has been made to know the age of the respondents. For the purpose of this study, it
has been classified into three categories viz., below 30 years, 30-40 years and above 40 years. The
details are furnished in the following table.
Table 1 Percentage variation between ages of the respondents
Sl. No. Age No. of Respondents Percentage
1. Below 30 yrs. 48 32.0
2. 30-40 yrs. 80 53.3
3. Above 40 yrs. 22 14.7
Total 150 100.0
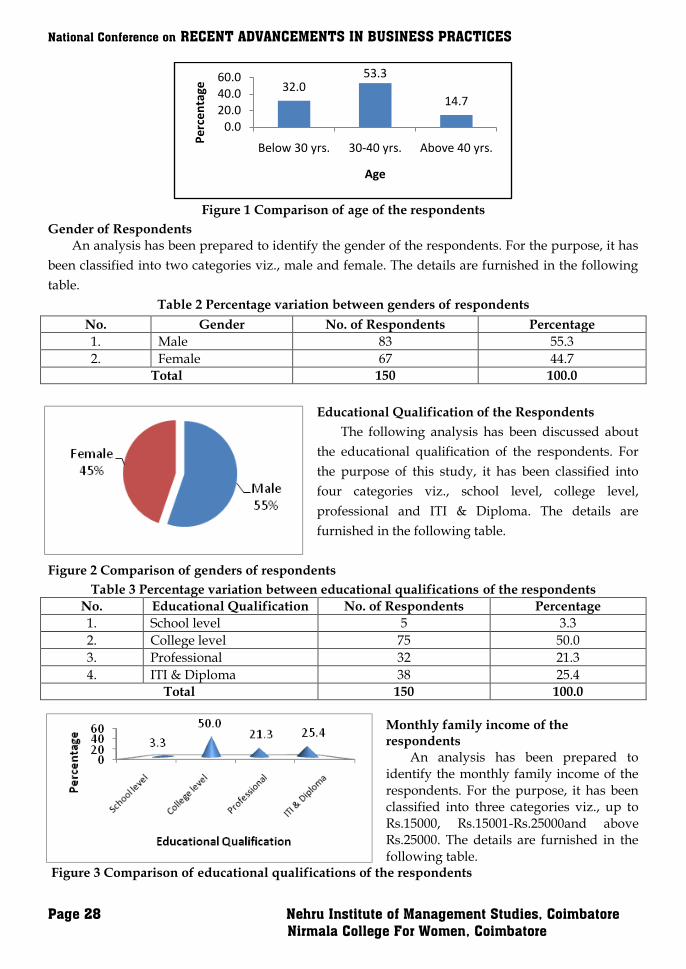
National Conference on RECENT ADVANCEMENTS IN BUSINESS PRACTICES
Page 28 Nehru Institute of Management Studies, Coimbatore
Nirmala College For Women, Coimbatore
Figure 1 Comparison of age of the respondents
Gender of Respondents
An analysis has been prepared to identify the gender of the respondents. For the purpose, it has
been classified into two categories viz., male and female. The details are furnished in the following
table.
Table 2 Percentage variation between genders of respondents
No. Gender No. of Respondents Percentage
1. Male 83 55.3
2. Female 67 44.7
Total 150 100.0
Educational Qualification of the Respondents
The following analysis has been discussed about
the educational qualification of the respondents. For
the purpose of this study, it has been classified into
four categories viz., school level, college level,
professional and ITI & Diploma. The details are
furnished in the following table.
Figure 2 Comparison of genders of respondents
Table 3 Percentage variation between educational qualifications of the respondents
No. Educational Qualification No. of Respondents Percentage
1. School level 5 3.3
2. College level 75 50.0
3. Professional 32 21.3
4. ITI & Diploma 38 25.4
Total 150 100.0
Monthly family income of the respondents An analysis has been prepared to identify the monthly family income of the respondents. For the purpose, it has been classified into three categories viz., up to Rs.15000, Rs.15001-Rs.25000and above Rs.25000. The details are furnished in the following table.
Figure 3 Comparison of educational qualifications of the respondents
32.053.3
14.7
0.020.040.060.0
Below 30 yrs. 30-40 yrs. Above 40 yrs.
Percentage
Age
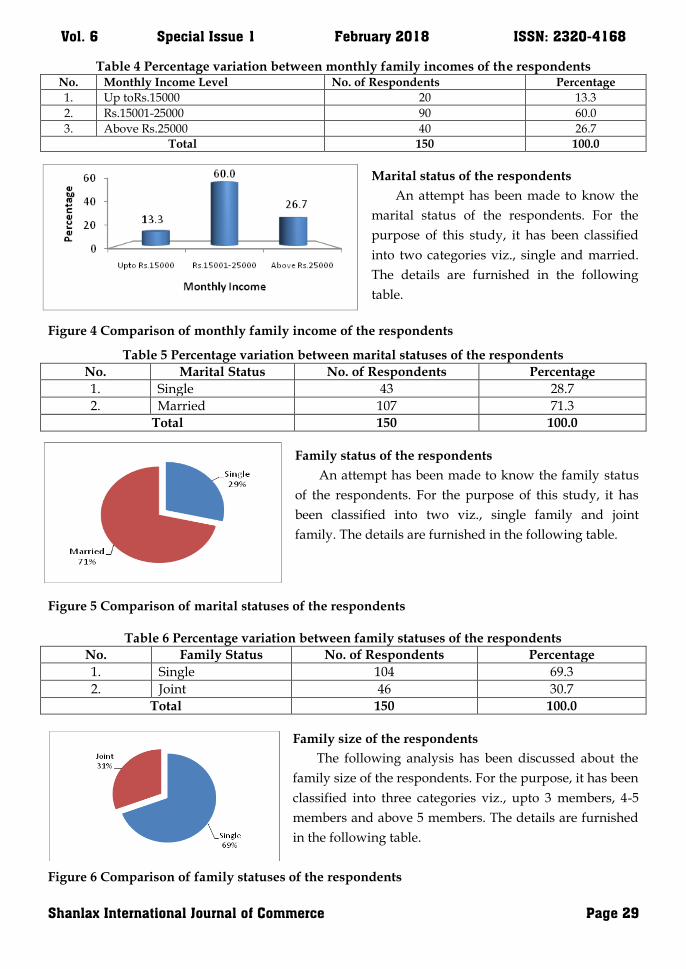
Vol. 6 Special Issue 1 February 2018 ISSN: 2320-4168
Shanlax International Journal of Commerce Page 29
Table 4 Percentage variation between monthly family incomes of the respondents No. Monthly Income Level No. of Respondents Percentage
1. Up toRs.15000 20 13.3
2. Rs.15001-25000 90 60.0
3. Above Rs.25000 40 26.7
Total 150 100.0
Marital status of the respondents
An attempt has been made to know the
marital status of the respondents. For the
purpose of this study, it has been classified
into two categories viz., single and married.
The details are furnished in the following
table.
Figure 4 Comparison of monthly family income of the respondents
Table 5 Percentage variation between marital statuses of the respondents
No. Marital Status No. of Respondents Percentage
1. Single 43 28.7
2. Married 107 71.3
Total 150 100.0
Family status of the respondents
An attempt has been made to know the family status
of the respondents. For the purpose of this study, it has
been classified into two viz., single family and joint
family. The details are furnished in the following table.
Figure 5 Comparison of marital statuses of the respondents
Table 6 Percentage variation between family statuses of the respondents
No. Family Status No. of Respondents Percentage
1. Single 104 69.3
2. Joint 46 30.7
Total 150 100.0
Family size of the respondents
The following analysis has been discussed about the
family size of the respondents. For the purpose, it has been
classified into three categories viz., upto 3 members, 4-5
members and above 5 members. The details are furnished
in the following table.
Figure 6 Comparison of family statuses of the respondents
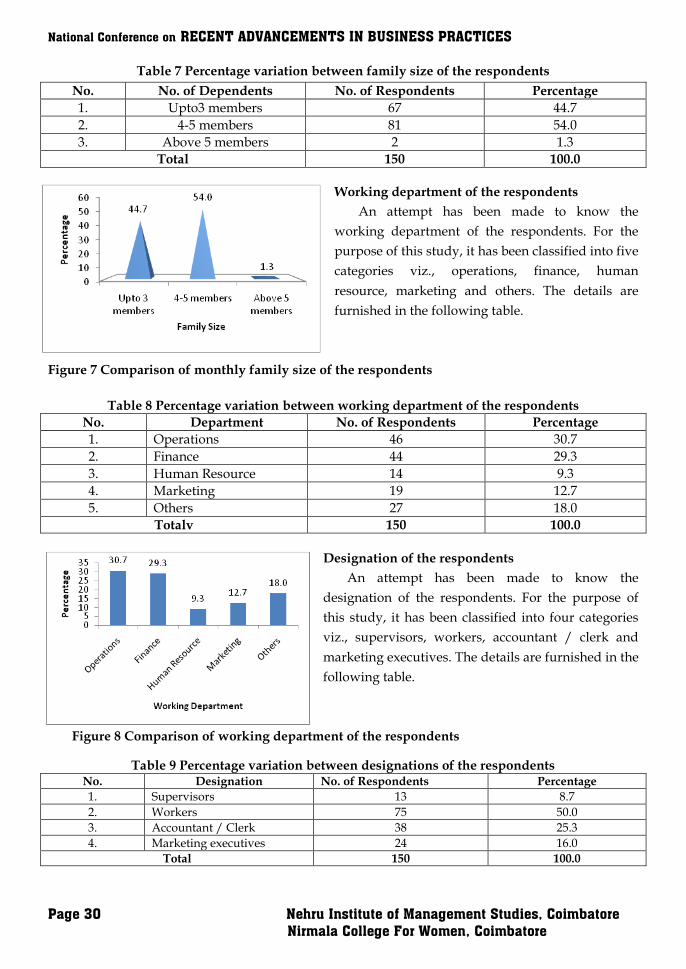
National Conference on RECENT ADVANCEMENTS IN BUSINESS PRACTICES
Page 30 Nehru Institute of Management Studies, Coimbatore
Nirmala College For Women, Coimbatore
Table 7 Percentage variation between family size of the respondents
No. No. of Dependents No. of Respondents Percentage
1. Upto3 members 67 44.7
2. 4-5 members 81 54.0
3. Above 5 members 2 1.3
Total 150 100.0
Working department of the respondents
An attempt has been made to know the
working department of the respondents. For the
purpose of this study, it has been classified into five
categories viz., operations, finance, human
resource, marketing and others. The details are
furnished in the following table.
Figure 7 Comparison of monthly family size of the respondents
Table 8 Percentage variation between working department of the respondents
No. Department No. of Respondents Percentage
1. Operations 46 30.7
2. Finance 44 29.3
3. Human Resource 14 9.3
4. Marketing 19 12.7
5. Others 27 18.0
Totalv 150 100.0
Designation of the respondents
An attempt has been made to know the
designation of the respondents. For the purpose of
this study, it has been classified into four categories
viz., supervisors, workers, accountant / clerk and
marketing executives. The details are furnished in the
following table.
Figure 8 Comparison of working department of the respondents
Table 9 Percentage variation between designations of the respondents No. Designation No. of Respondents Percentage
1. Supervisors 13 8.7
2. Workers 75 50.0
3. Accountant / Clerk 38 25.3
4. Marketing executives 24 16.0
Total 150 100.0

Vol. 6 Special Issue 1 February 2018 ISSN: 2320-4168
Shanlax International Journal of Commerce Page 31
Experience of the respondents
An attempt has been made to know the
experience of the respondents. For the purpose of
this study, it has been classified into three categories
viz., 0-2 years, 3-5 years and above 5 years. The
details are furnished in the following table.
Figure 9 Comparison of designation of the respondents
Table 10 Percentage variation between experiences of the respondents
No. Experience No. of Respondents Percentage
1. 0-2 years 25 16.7
2. 3-5 years 96 64.0
3. Above 5 years 29 19.3
Total 150 100.0
Nature of job of the respondents
An attempt has been made to know the nature of
job of the respondents. For the purpose of this study,
it has been classified into two categories viz.,
permanent and temporary. The details are furnished
in the following table.
Figure 10 Comparison of experience of the respondents
Table 11 Percentage variation between natures of job of the respondents
No. Nature of job No. of Respondents Percentage
1. Permanent 142 94.7
2. Temporary 8 5.3
Total 150 100.0
Mode of transport of the respondents
An attempt has been made to know the mode of
transport of the respondents. For the purpose of this
study, it has been classified into four categories viz.,
private bus, two / four wheeler, company bus and by
walk. The details are furnished in the following table.
Figure 11 Comparison of natures of job of the respondents
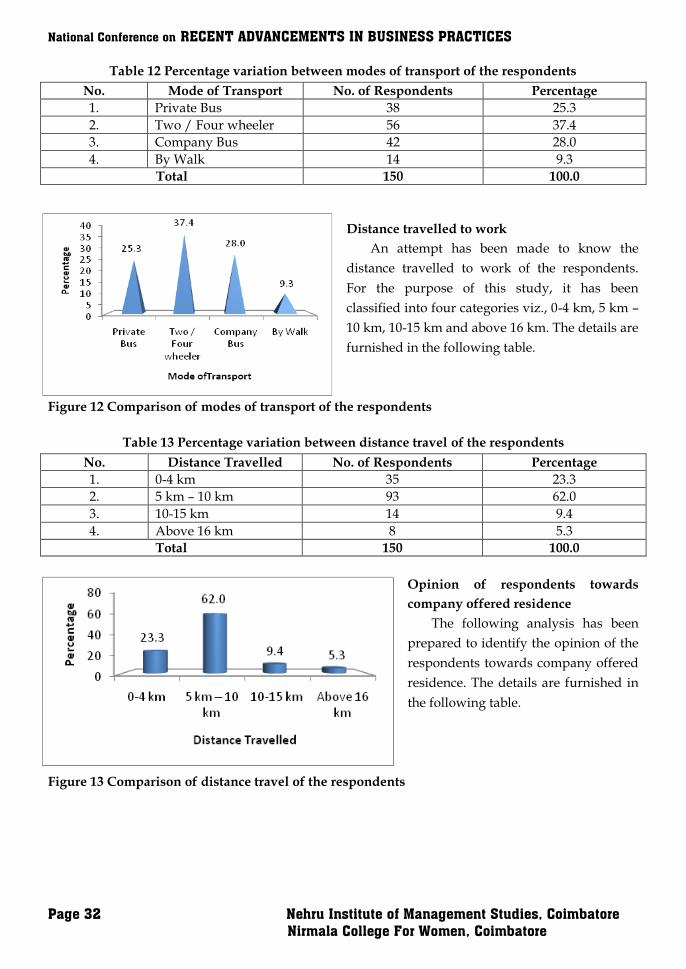
National Conference on RECENT ADVANCEMENTS IN BUSINESS PRACTICES
Page 32 Nehru Institute of Management Studies, Coimbatore
Nirmala College For Women, Coimbatore
Table 12 Percentage variation between modes of transport of the respondents
No. Mode of Transport No. of Respondents Percentage
1. Private Bus 38 25.3
2. Two / Four wheeler 56 37.4
3. Company Bus 42 28.0
4. By Walk 14 9.3
Total 150 100.0
Distance travelled to work
An attempt has been made to know the
distance travelled to work of the respondents.
For the purpose of this study, it has been
classified into four categories viz., 0-4 km, 5 km –
10 km, 10-15 km and above 16 km. The details are
furnished in the following table.
Figure 12 Comparison of modes of transport of the respondents
Table 13 Percentage variation between distance travel of the respondents
No. Distance Travelled No. of Respondents Percentage
1. 0-4 km 35 23.3
2. 5 km – 10 km 93 62.0
3. 10-15 km 14 9.4
4. Above 16 km 8 5.3
Total 150 100.0
Opinion of respondents towards
company offered residence
The following analysis has been
prepared to identify the opinion of the
respondents towards company offered
residence. The details are furnished in
the following table.
Figure 13 Comparison of distance travel of the respondents
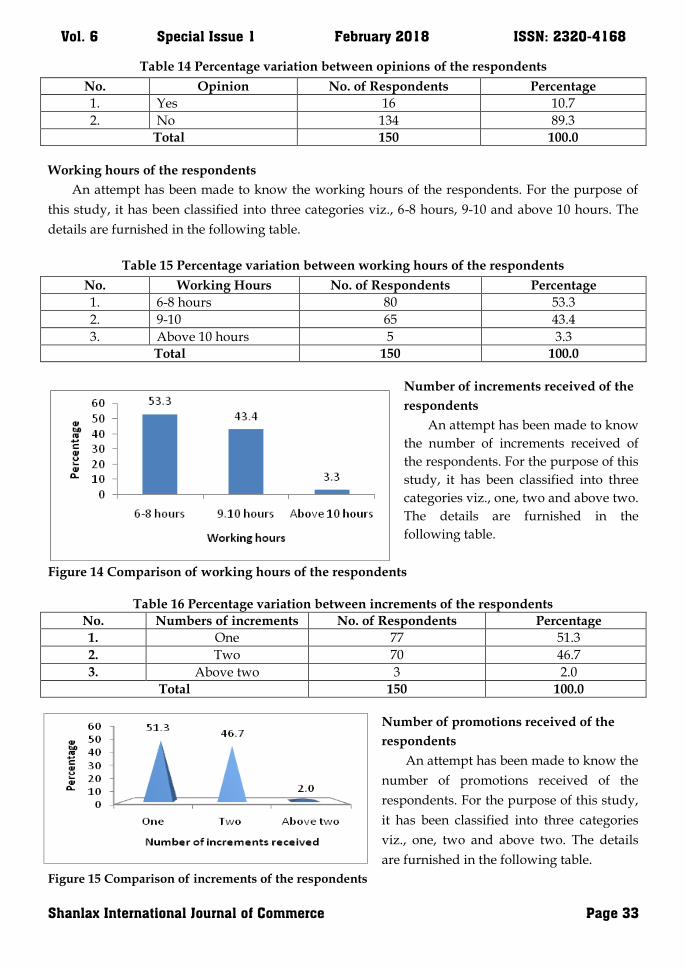
Vol. 6 Special Issue 1 February 2018 ISSN: 2320-4168
Shanlax International Journal of Commerce Page 33
Table 14 Percentage variation between opinions of the respondents
No. Opinion No. of Respondents Percentage
1. Yes 16 10.7
2. No 134 89.3
Total 150 100.0
Working hours of the respondents
An attempt has been made to know the working hours of the respondents. For the purpose of
this study, it has been classified into three categories viz., 6-8 hours, 9-10 and above 10 hours. The
details are furnished in the following table.
Table 15 Percentage variation between working hours of the respondents
No. Working Hours No. of Respondents Percentage
1. 6-8 hours 80 53.3
2. 9-10 65 43.4
3. Above 10 hours 5 3.3
Total 150 100.0
Number of increments received of the
respondents
An attempt has been made to know
the number of increments received of
the respondents. For the purpose of this
study, it has been classified into three
categories viz., one, two and above two.
The details are furnished in the
following table.
Figure 14 Comparison of working hours of the respondents
Table 16 Percentage variation between increments of the respondents
No. Numbers of increments No. of Respondents Percentage
1. One 77 51.3
2. Two 70 46.7
3. Above two 3 2.0
Total 150 100.0
Number of promotions received of the
respondents
An attempt has been made to know the
number of promotions received of the
respondents. For the purpose of this study,
it has been classified into three categories
viz., one, two and above two. The details
are furnished in the following table.
Figure 15 Comparison of increments of the respondents
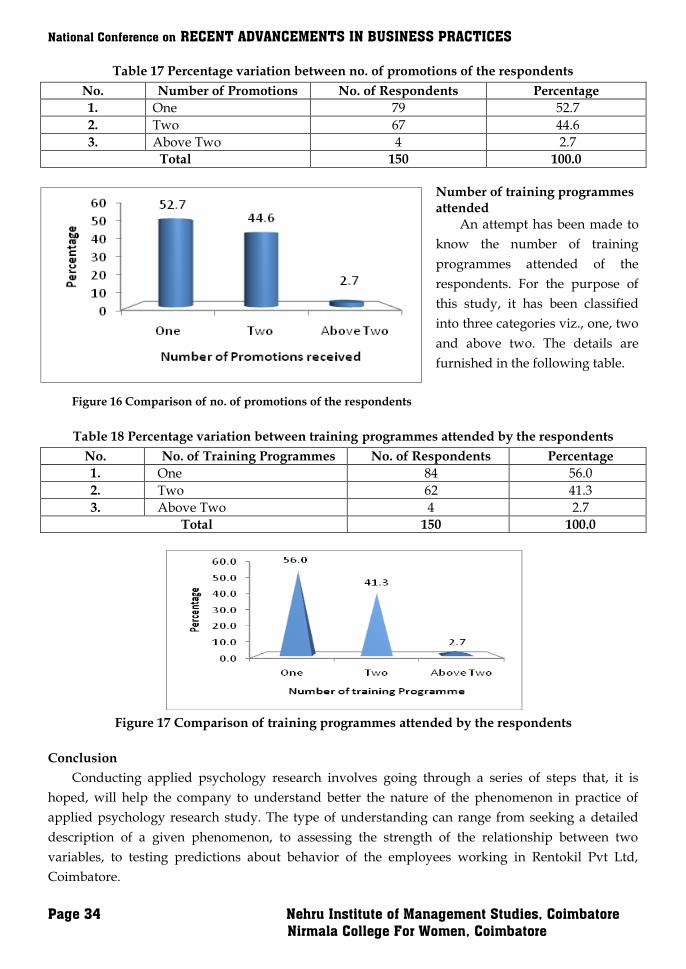
National Conference on RECENT ADVANCEMENTS IN BUSINESS PRACTICES
Page 34 Nehru Institute of Management Studies, Coimbatore
Nirmala College For Women, Coimbatore
Table 17 Percentage variation between no. of promotions of the respondents
No. Number of Promotions No. of Respondents Percentage
1. One 79 52.7
2. Two 67 44.6
3. Above Two 4 2.7
Total 150 100.0
Number of training programmes attended An attempt has been made to
know the number of training
programmes attended of the
respondents. For the purpose of
this study, it has been classified
into three categories viz., one, two
and above two. The details are
furnished in the following table.
Figure 16 Comparison of no. of promotions of the respondents
Table 18 Percentage variation between training programmes attended by the respondents
No. No. of Training Programmes No. of Respondents Percentage
1. One 84 56.0
2. Two 62 41.3
3. Above Two 4 2.7
Total 150 100.0
Figure 17 Comparison of training programmes attended by the respondents
Conclusion
Conducting applied psychology research involves going through a series of steps that, it is
hoped, will help the company to understand better the nature of the phenomenon in practice of
applied psychology research study. The type of understanding can range from seeking a detailed
description of a given phenomenon, to assessing the strength of the relationship between two
variables, to testing predictions about behavior of the employees working in Rentokil Pvt Ltd,
Coimbatore.
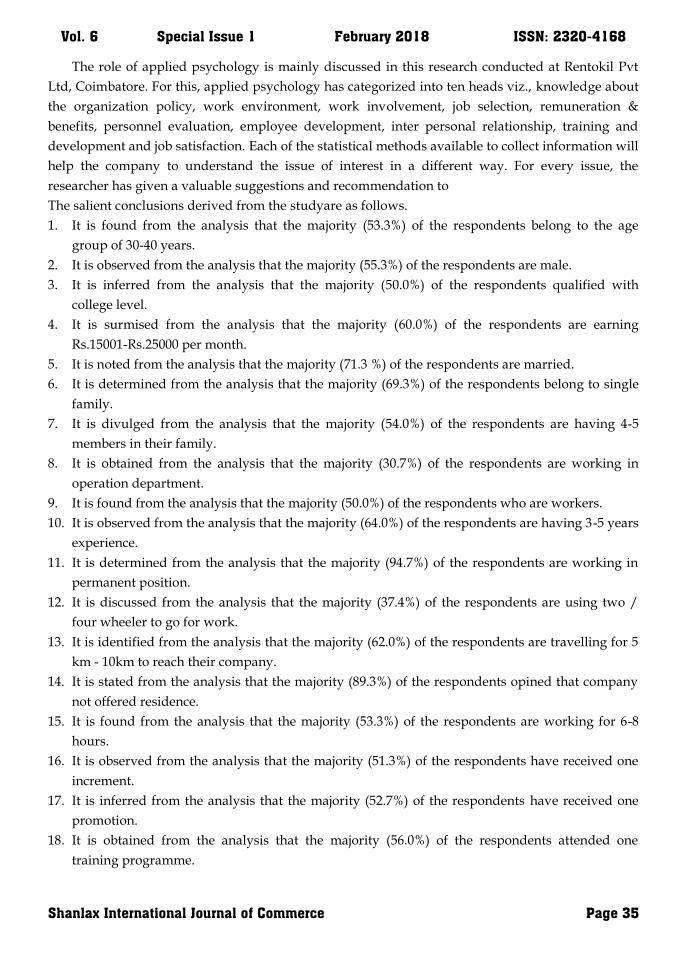
Vol. 6 Special Issue 1 February 2018 ISSN: 2320-4168
Shanlax International Journal of Commerce Page 35
The role of applied psychology is mainly discussed in this research conducted at Rentokil Pvt
Ltd, Coimbatore. For this, applied psychology has categorized into ten heads viz., knowledge about
the organization policy, work environment, work involvement, job selection, remuneration &
benefits, personnel evaluation, employee development, inter personal relationship, training and
development and job satisfaction. Each of the statistical methods available to collect information will
help the company to understand the issue of interest in a different way. For every issue, the
researcher has given a valuable suggestions and recommendation to
The salient conclusions derived from the studyare as follows.
1. It is found from the analysis that the majority (53.3%) of the respondents belong to the age
group of 30-40 years.
2. It is observed from the analysis that the majority (55.3%) of the respondents are male.
3. It is inferred from the analysis that the majority (50.0%) of the respondents qualified with
college level.
4. It is surmised from the analysis that the majority (60.0%) of the respondents are earning
Rs.15001-Rs.25000 per month.
5. It is noted from the analysis that the majority (71.3 %) of the respondents are married.
6. It is determined from the analysis that the majority (69.3%) of the respondents belong to single
family.
7. It is divulged from the analysis that the majority (54.0%) of the respondents are having 4-5
members in their family.
8. It is obtained from the analysis that the majority (30.7%) of the respondents are working in
operation department.
9. It is found from the analysis that the majority (50.0%) of the respondents who are workers.
10. It is observed from the analysis that the majority (64.0%) of the respondents are having 3-5 years
experience.
11. It is determined from the analysis that the majority (94.7%) of the respondents are working in
permanent position.
12. It is discussed from the analysis that the majority (37.4%) of the respondents are using two /
four wheeler to go for work.
13. It is identified from the analysis that the majority (62.0%) of the respondents are travelling for 5
km - 10km to reach their company.
14. It is stated from the analysis that the majority (89.3%) of the respondents opined that company
not offered residence.
15. It is found from the analysis that the majority (53.3%) of the respondents are working for 6-8
hours.
16. It is observed from the analysis that the majority (51.3%) of the respondents have received one
increment.
17. It is inferred from the analysis that the majority (52.7%) of the respondents have received one
promotion.
18. It is obtained from the analysis that the majority (56.0%) of the respondents attended one
training programme.
National Conference on RECENT ADVANCEMENTS IN BUSINESS PRACTICES
Page 36 Nehru Institute of Management Studies, Coimbatore
Nirmala College For Women, Coimbatore
References
1. John E. Mathieu 23 September 2007, DOI: 10.1002/job.480
2. James A. Breaugh&Jessalyn Arnold, (2007). Original Research Method, 10 (3), 523 – 541.
3. Morgeson, F. P., Delaney – Klinger, K. A., & Hemingway, M. A. (2005). The importance of job
autonomy, cognitive ability and job – related skill for predicting role breadth and job
performance. Journal of applied psychology, 90, 399 – 406.
4. Campion, M. A., Mumford, T. V., Morgeon, F. P., &Nahrgang, J. D. (2005). Work redesign:
Obstacles and opportunities. Human Resource management, 44, 367 – 390.
5. Hossam M. Abu, (2002). Employees perception of job characteristics in a Non- Western Context:
An examination of the relationship between job characteristics and work attitudes and
behaviours in the UAE refereed paper.
6. Parker, S. K., Wall, T. D &Cordery, J. L. (2001). Future work design research and practice:
Towards an elaborated model of work design. Journal of Occupational and Organizational
Psycology, 74, 413 -440.
7. Shalley, C. E., Gilson, L. L., & Blum, T. C. (2002). Matching creativity requirements and the work
environment.
8. Edwards, J. R., Scully, J. A., &Brtek, M. D. (1999). The measurement of work: Hierarchical
representation of the multy method job design questionnaire. Personnel psychology, 52,
305 – 334.
Vol. 6 Special Issue 1 February 2018 ISSN: 2320-4168
Shanlax International Journal of Commerce Page 37
ENGAGE AND ALIGN YOUR WORKFORCE TO DRIVE POWERFUL RESULTS
THROUGH PERFORMANCE MANAGEMENT
Abstract
Performance management is essential to build a productive and engaged workforce. Performance management solutions enable you to automate appraisals, close skill gaps, and manage career and succession plans. With these critical capabilities in play, you can quickly align your talent pool with your overall business goals. Performance management solutions offer full-featured functionality and deployment options to cover your specific business requirements
This enables to integrate development goals with the performance appraisal process.
The solutions automate the performance review process that link to your compensation programs for a more practical and efficient approach to engaging and rewarding employees.
Performance management solutions also give you cascading goal functionality that transforms each employee’s goals into an individual scorecard, along with dashboards that provide administrators with greater insight into talent gaps.
We even tackle the mobility challenges, so your on-the-go workforce always maximizes productivity.
It offer the flexibility for today’s businesses demand. Introduction
Feedback from focus groups, survey and the EAC and design teams indicates:
Employees want to know what‟s expected of them, employees want Managers to be trained
The resolutions resulted in the following:
4 vs. 3 Performance Ratings
Model, Strong, Developing & Unacceptable
Simpler performance management tool
Link between salary and Performance Rating
These Initiatives required that we revisit our approach to Performance Management
The tool we use for Performance planning and performance evaluation has changed
Today is all about Performance Planning
Who Does Performance Planning?
Reviewer and Supervisor take the lead in creating the Performance Plan and both should agree
on the final plan before it is shared with the employee. Employee who has been in the job any length
of time should be consulted and have input into the planning.
Position Description First!
The first step in completing the Performance Plan is to review the Position Description to ensure
it is up to date and accurate.
Prof.K.Geetha
Assistant Professor, Department of Management
Sri Krishna Arts and Science College, Coimbatore
S.Mahalakshmi, M.Phil.,
Assistant Professor Department of Management
Sri Krishna Arts and Science College, Coimbatore
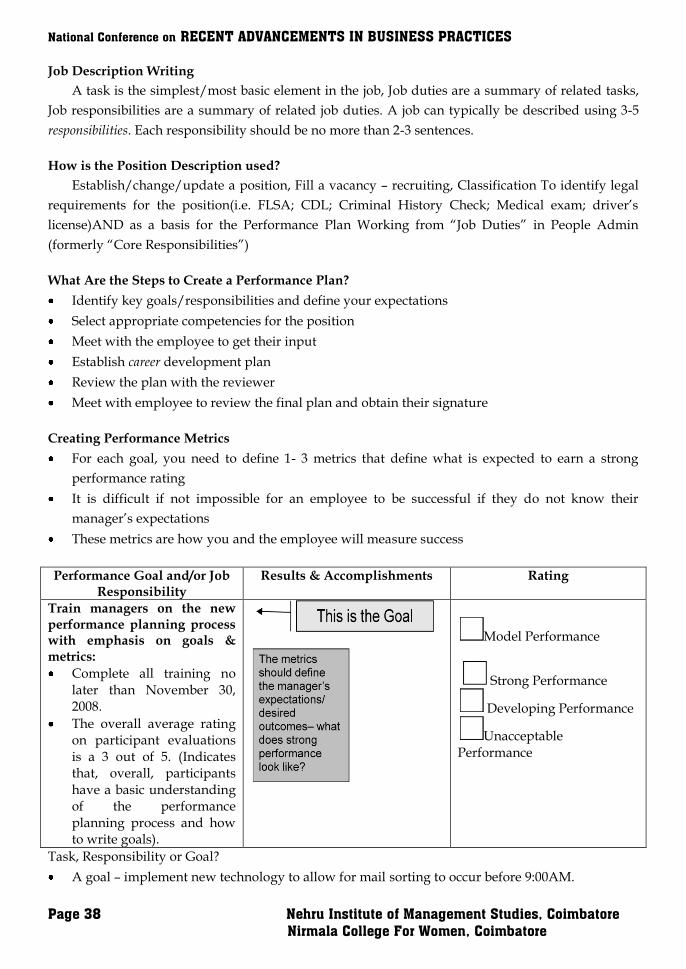
National Conference on RECENT ADVANCEMENTS IN BUSINESS PRACTICES
Page 38 Nehru Institute of Management Studies, Coimbatore
Nirmala College For Women, Coimbatore
Job Description Writing
A task is the simplest/most basic element in the job, Job duties are a summary of related tasks,
Job responsibilities are a summary of related job duties. A job can typically be described using 3-5
responsibilities. Each responsibility should be no more than 2-3 sentences.
How is the Position Description used?
Establish/change/update a position, Fill a vacancy – recruiting, Classification To identify legal
requirements for the position(i.e. FLSA; CDL; Criminal History Check; Medical exam; driver‟s
license)AND as a basis for the Performance Plan Working from “Job Duties” in People Admin
(formerly “Core Responsibilities”)
What Are the Steps to Create a Performance Plan?
Identify key goals/responsibilities and define your expectations
Select appropriate competencies for the position
Meet with the employee to get their input
Establish career development plan
Review the plan with the reviewer
Meet with employee to review the final plan and obtain their signature
Creating Performance Metrics
For each goal, you need to define 1- 3 metrics that define what is expected to earn a strong
performance rating
It is difficult if not impossible for an employee to be successful if they do not know their
manager‟s expectations
These metrics are how you and the employee will measure success
Performance Goal and/or Job Responsibility
Results & Accomplishments Rating
Train managers on the new performance planning process with emphasis on goals & metrics:
Complete all training no later than November 30, 2008.
The overall average rating on participant evaluations is a 3 out of 5. (Indicates that, overall, participants have a basic understanding of the performance planning process and how to write goals).
Model Performance
Strong Performance
Developing Performance
Unacceptable Performance
Task, Responsibility or Goal?
A goal – implement new technology to allow for mail sorting to occur before 9:00AM.
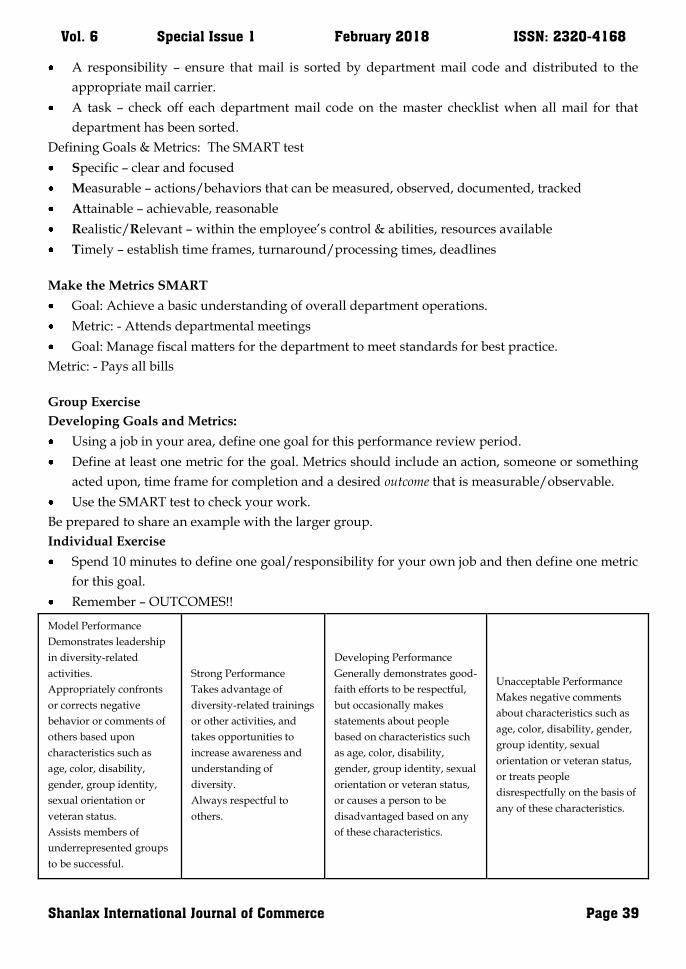
Vol. 6 Special Issue 1 February 2018 ISSN: 2320-4168
Shanlax International Journal of Commerce Page 39
A responsibility – ensure that mail is sorted by department mail code and distributed to the
appropriate mail carrier.
A task – check off each department mail code on the master checklist when all mail for that
department has been sorted.
Defining Goals & Metrics: The SMART test
Specific – clear and focused
Measurable – actions/behaviors that can be measured, observed, documented, tracked
Attainable – achievable, reasonable
Realistic/Relevant – within the employee‟s control & abilities, resources available
Timely – establish time frames, turnaround/processing times, deadlines
Make the Metrics SMART
Goal: Achieve a basic understanding of overall department operations.
Metric: - Attends departmental meetings
Goal: Manage fiscal matters for the department to meet standards for best practice.
Metric: - Pays all bills
Group Exercise
Developing Goals and Metrics:
Using a job in your area, define one goal for this performance review period.
Define at least one metric for the goal. Metrics should include an action, someone or something
acted upon, time frame for completion and a desired outcome that is measurable/observable.
Use the SMART test to check your work.
Be prepared to share an example with the larger group.
Individual Exercise
Spend 10 minutes to define one goal/responsibility for your own job and then define one metric
for this goal.
Remember – OUTCOMES!!
Model Performance
Demonstrates leadership
in diversity-related
activities.
Appropriately confronts
or corrects negative
behavior or comments of
others based upon
characteristics such as
age, color, disability,
gender, group identity,
sexual orientation or
veteran status.
Assists members of
underrepresented groups
to be successful.
Strong Performance
Takes advantage of
diversity-related trainings
or other activities, and
takes opportunities to
increase awareness and
understanding of
diversity.
Always respectful to
others.
Developing Performance
Generally demonstrates good-
faith efforts to be respectful,
but occasionally makes
statements about people
based on characteristics such
as age, color, disability,
gender, group identity, sexual
orientation or veteran status,
or causes a person to be
disadvantaged based on any
of these characteristics.
Unacceptable Performance
Makes negative comments
about characteristics such as
age, color, disability, gender,
group identity, sexual
orientation or veteran status,
or treats people
disrespectfully on the basis of
any of these characteristics.
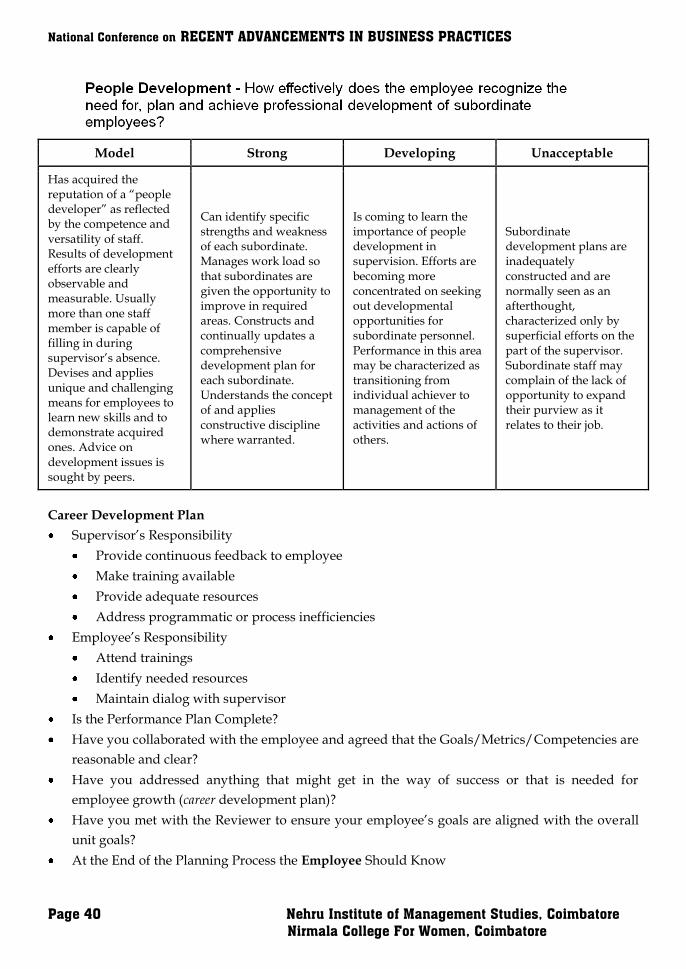
National Conference on RECENT ADVANCEMENTS IN BUSINESS PRACTICES
Page 40 Nehru Institute of Management Studies, Coimbatore
Nirmala College For Women, Coimbatore
Model Strong Developing Unacceptable
Has acquired the reputation of a “people developer” as reflected by the competence and versatility of staff. Results of development efforts are clearly observable and measurable. Usually more than one staff member is capable of filling in during supervisor‟s absence. Devises and applies unique and challenging means for employees to learn new skills and to demonstrate acquired ones. Advice on development issues is sought by peers.
Can identify specific strengths and weakness of each subordinate. Manages work load so that subordinates are given the opportunity to improve in required areas. Constructs and continually updates a comprehensive development plan for each subordinate. Understands the concept of and applies constructive discipline where warranted.
Is coming to learn the importance of people development in supervision. Efforts are becoming more concentrated on seeking out developmental opportunities for subordinate personnel. Performance in this area may be characterized as transitioning from individual achiever to management of the activities and actions of others.
Subordinate development plans are inadequately constructed and are normally seen as an afterthought, characterized only by superficial efforts on the part of the supervisor. Subordinate staff may complain of the lack of opportunity to expand their purview as it relates to their job.
Career Development Plan
Supervisor‟s Responsibility
Provide continuous feedback to employee
Make training available
Provide adequate resources
Address programmatic or process inefficiencies
Employee‟s Responsibility
Attend trainings
Identify needed resources
Maintain dialog with supervisor
Is the Performance Plan Complete?
Have you collaborated with the employee and agreed that the Goals/Metrics/Competencies are
reasonable and clear?
Have you addressed anything that might get in the way of success or that is needed for
employee growth (career development plan)?
Have you met with the Reviewer to ensure your employee‟s goals are aligned with the overall
unit goals?
At the End of the Planning Process the Employee Should Know
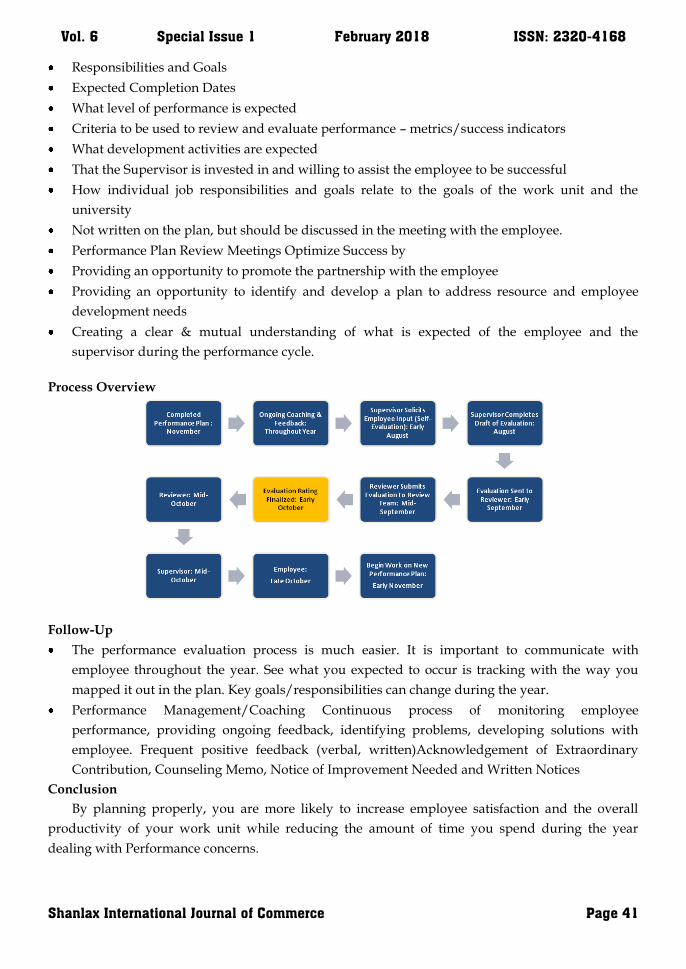
Vol. 6 Special Issue 1 February 2018 ISSN: 2320-4168
Shanlax International Journal of Commerce Page 41
Responsibilities and Goals
Expected Completion Dates
What level of performance is expected
Criteria to be used to review and evaluate performance – metrics/success indicators
What development activities are expected
That the Supervisor is invested in and willing to assist the employee to be successful
How individual job responsibilities and goals relate to the goals of the work unit and the
university
Not written on the plan, but should be discussed in the meeting with the employee.
Performance Plan Review Meetings Optimize Success by
Providing an opportunity to promote the partnership with the employee
Providing an opportunity to identify and develop a plan to address resource and employee
development needs
Creating a clear & mutual understanding of what is expected of the employee and the
supervisor during the performance cycle.
Process Overview
Follow-Up
The performance evaluation process is much easier. It is important to communicate with
employee throughout the year. See what you expected to occur is tracking with the way you
mapped it out in the plan. Key goals/responsibilities can change during the year.
Performance Management/Coaching Continuous process of monitoring employee
performance, providing ongoing feedback, identifying problems, developing solutions with
employee. Frequent positive feedback (verbal, written)Acknowledgement of Extraordinary
Contribution, Counseling Memo, Notice of Improvement Needed and Written Notices
Conclusion
By planning properly, you are more likely to increase employee satisfaction and the overall
productivity of your work unit while reducing the amount of time you spend during the year
dealing with Performance concerns.
National Conference on RECENT ADVANCEMENTS IN BUSINESS PRACTICES
Page 42 Nehru Institute of Management Studies, Coimbatore
Nirmala College For Women, Coimbatore
BANK MARKETING MIX: NEW STRATEGY IN TODAY BANKING SECTOR
Abstract
Bank marketing in general and Customer Relationship Management (CRM) in particular are of vital importance for Indian banks, particularly in the current context when banks are facing tough competition from other agencies, both local and foreign, that offer value-added services. The Role of marketing in the banking industry continues to change. For many years the primary focus of bank marketing was public relations. Then the focus shifted to advertising and sales promotion. That was followed by focus on the development of a sales culture. Today banking sector all elements of the marketing concept – customer satisfaction, profit integrated framework and social responsibility are all equally important. Main principal aspects of Bank Marketing are- Customer Oriented Services, Design & Delivery of Such Services Corporate Objectives of the Bank, Environmental & Other Constraints. The second element in formulation of marketing strategy in banking sector is development of proper marketing mix (product, place, price, promotion, people, process, physical evidence) so as to satisfy the needs of the target group of customers. With the help of 4‘Cs (customer solution, customer cost, communication, convenience) use of marketing mix in banking sector is increasing day by day. The bank marketing mix concept is very important for every bank in tough competition. Use of 7‘p and 4‘c for bank and implementation of these concepts in banking sector shows the Role of marketing in bank in present Era. In bank marketing, marketer uses both “Collective" and “Selective" approach to attract and convince the target customer .It is the aggregate of functions, directed at providing services to satisfy customers‘ financial (and other related) needs and wants, more effectively and efficiently . Keywords: Bank Marketing Mix, Social Responsibility, Collective & Selective approaches, Customer Relationship Management. Introduction
In India, the banking sector is a central component of services sector. Banks are the most
common institutions for transfer of funds and investments. Prior to economic liberalisation, public
sector banks enjoyed a monopoly over market due to protectionist policies of the government. The
liberalization policy of the Government of India in 1991 permitted entry to foreign and private
banks in the banking industry, leading to increased competition. Because of increased competition,
banks are exploring marketing strategies to differentiate their services from their competitors. For
designing effective marketing strategies, knowledge of service marketing mix is essential. This
paper examines the role of service marketing mix (product, price, place, promotion, people, process
and physical evidence) in Indian banking sector.
Marketing Concepts
Its application to Banking, when we apply marketing to the banking industry, the bank
marketing strategy can be said to include the following –
i) A very clear definition of target customers.
ii) The development of a marketing mix to satisfy customers at a profit for the bank. iii) Planning
for each of the source „markets & each of the use‟ markets (A Bank needs to be doubly market –
Dr.Abirami
Associate Professor
Dr.NGP Arts and Science College, Coimbatore
Mrs.J.MarySaranya
Research Scholar, Bharathiar University, Coimbatore
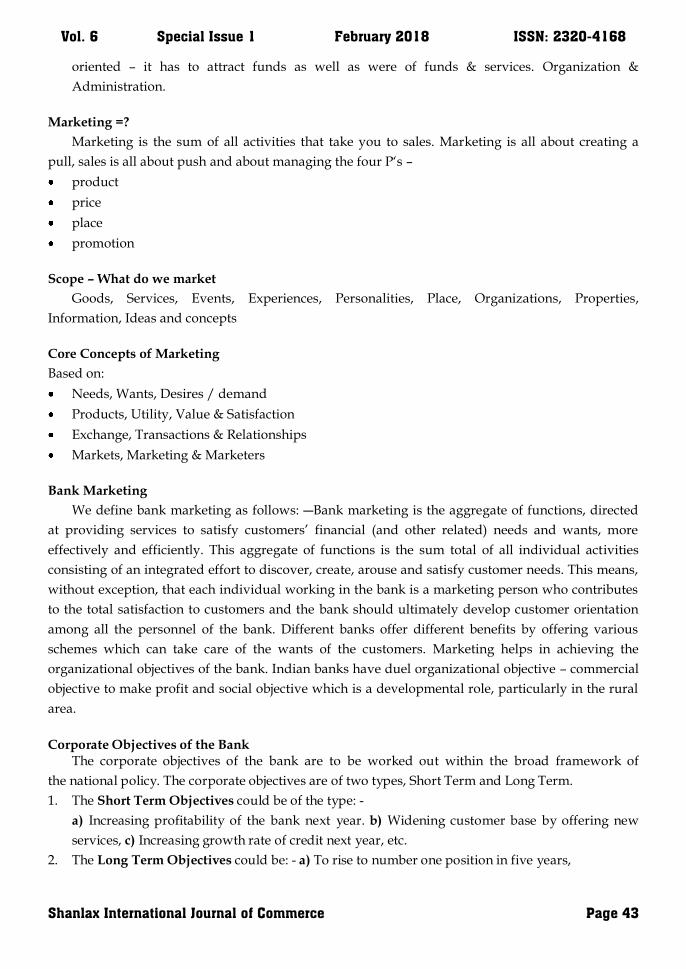
Vol. 6 Special Issue 1 February 2018 ISSN: 2320-4168
Shanlax International Journal of Commerce Page 43
oriented – it has to attract funds as well as were of funds & services. Organization &
Administration.
Marketing =?
Marketing is the sum of all activities that take you to sales. Marketing is all about creating a
pull, sales is all about push and about managing the four P„s –
product
price
place
promotion
Scope – What do we market
Goods, Services, Events, Experiences, Personalities, Place, Organizations, Properties,
Information, Ideas and concepts
Core Concepts of Marketing
Based on:
Needs, Wants, Desires / demand
Products, Utility, Value & Satisfaction
Exchange, Transactions & Relationships
Markets, Marketing & Marketers
Bank Marketing
We define bank marketing as follows: ―Bank marketing is the aggregate of functions, directed
at providing services to satisfy customers‟ financial (and other related) needs and wants, more
effectively and efficiently. This aggregate of functions is the sum total of all individual activities
consisting of an integrated effort to discover, create, arouse and satisfy customer needs. This means,
without exception, that each individual working in the bank is a marketing person who contributes
to the total satisfaction to customers and the bank should ultimately develop customer orientation
among all the personnel of the bank. Different banks offer different benefits by offering various
schemes which can take care of the wants of the customers. Marketing helps in achieving the
organizational objectives of the bank. Indian banks have duel organizational objective – commercial
objective to make profit and social objective which is a developmental role, particularly in the rural
area.
Corporate Objectives of the Bank The corporate objectives of the bank are to be worked out within the broad framework of
the national policy. The corporate objectives are of two types, Short Term and Long Term.
1. The Short Term Objectives could be of the type: -
a) Increasing profitability of the bank next year. b) Widening customer base by offering new
services, c) Increasing growth rate of credit next year, etc.
2. The Long Term Objectives could be: - a) To rise to number one position in five years,
National Conference on RECENT ADVANCEMENTS IN BUSINESS PRACTICES
Page 44 Nehru Institute of Management Studies, Coimbatore
Nirmala College For Women, Coimbatore
b) To become the universal bank over the period of next 3 years, etc.
Once the corporate objectives are clearly spelt out, various schemes can be designed to fulfill the
needs of the customers within the framework of the chosen corporate objectives. Further, the
resources made available for systematic marketing efforts are also constrained by policies, vision
and attitudes of the management.
Marketing Strategy in Banking Sector
Consumer Behavior and Segmentation
Banks deal with individuals, group of persons and corporate, all of whom have their likes and
dislikes. No bank can afford to assess the needs of each and every individual buyer (actual or
potential). Segmentation of the market into more or less homogenous groups, in terms of their
needs and expectations from the banking industry, provides a solution to this problem.
Customer Relationship Management
The marketing strategy consists of a very clear definition of prospective customers and
their needs and the creation of marketing mix to satisfy them. A recent development in this regard
is Customer Relationship Management (CRM). It is a business strategy to learn more and more
about customer behavior in order to create long term and sustainable relationship with them. It is a

Vol. 6 Special Issue 1 February 2018 ISSN: 2320-4168
Shanlax International Journal of Commerce Page 45
comprehensive process of acquiring and retaining selective customers to generate value for the
bank and its customers.
Identification of Target Customers & their Needs
This is an important area in formulation of a marketing strategy. Unless the bank has clear
idea about the customers it wants to serve, it is not possible to work out products to satisfy their
needs.
Marketing Mix in Bank
The second element in formulation of marketing strategy is development of proper
marketing mix, so as to satisfy the needs of the target group of customers. This would involve
decisions regarding product, place, price, promotion, process, physical evidence, and people.
Bank marketing deals with providing services to satisfy customers' financial needs and wants.
To satisfy these financial needs, customers want specific services. All the techniques and strategies
of marketing are used so that ultimately they induce the people to do business with a particular
bank. This requires satisfaction of customers. Traditional marketing mix cannot be responsible for
the total marketing function of a service organization like banks. It requires all elements of service
marketing mix. Service marketing mix plays an important role in bank marketing. It consists of the
various elements of a marketing programme which need to be considered in order to successfully
implement the marketing strategy and positioning in the markets. It helps in differentiating services
of a particular bank from its competitors.
Product
In the banking sector, the core products are 'deposits' and 'advances'. All the banks have these
two main products and differentiation of banking services with reference to core product is difficult
to achieve. Banks differentiate their services on the basis of value added services which mainly
cover information technology based services. And, customer has to be tech-savvy for availing these
value added services. Some example of value added services are: mobile banking, mobile and DTH
(Direct to Home) recharge through internet banking, electronic fund transfer, etc.

National Conference on RECENT ADVANCEMENTS IN BUSINESS PRACTICES
Page 46 Nehru Institute of Management Studies, Coimbatore
Nirmala College For Women, Coimbatore
Price
Chang and Wildt (1994) defined perceived price as the consumers' perceptual representation or
subjective perception of the objective price of the product / service. Price perceptions are formed in
relation to internal reference prices; Price in banking sector means interest rate and service charges.
Prices are being controlled by RBI in banking sector but limited deregulation has allowed banks to
differentiate their services on the basis of differential interest rates.
Place
Place in banking services means providing banking services at right time in convenient way.
Inseparability of production and consumption is the most intriguing characteristic of services.
Service provider's physical connection to the service, the customer's involvement in the service
production process and involvement of other customers in the service production process create
challenges for service provider. As income of people is rising, there is inclination towards
convenience related services. Growing demand of laundry services, housekeeping, home delivery
grocery outlets are some example of services that reflect convenience orientation of people.
Promotion
Due to complexity of prices involved, customers are left with little choice but to interact with
employees to get more clarity. Choosing the right advertising medium by banks for communicating
its services helps to satisfy its customers. In Indian banking sector, aggressive and attractive
promotional strategies are not visualized. Most often, important schemes are verbally
communicated to customers by employees. Decision to buy particular banking services largely
depends on decision convenience provided by employees. Notice boards at branches also play
significant role in providing information to customers.
People (Customers and Employees) Customers and employees both participate in service delivery. Their participation is
unavoidable in service delivery. So, both are responsible for effective service delivery. Customers
can't be separated from the production process of service firms and can contribute to their own
satisfaction. In India people rely more on social bonding than individualistic approach. Business
transactions in a collectivistic culture like India emphasizing social bonding are different from those
of individualistic cultures emphasizing structural bonding (Dash et al., 2007). Therefore, employees'
behavior plays a dominant role in differentiating banking services.
Physical Evidence (Tangibility)
Physical evidence is important for banks as this is the environment in which the service is
delivered and where the bank employees and customers interact. Furniture, equipments, staff
members, pass book, cheque book, information boards, etc. provide tangibility to banks.
Process Customers are present during service delivery, 'process' is important for customer satisfaction.
Process explains how services are being delivered by service organization. If customer does not
have sufficient time, he seeks bank that provides effort and time saving banking services.
Vol. 6 Special Issue 1 February 2018 ISSN: 2320-4168
Shanlax International Journal of Commerce Page 47
Conclusion All the above service marketing mix elements revolve around customers. Differentiating the
services from competitors is the principal requirement of every service organization. Knowing
customers' perceptions regarding services offered to them will help to know their feeling about
service marketing mix and relationship of these factors with satisfaction will help marketers to
decide marketing strategies for their customers. In banking services price fairness and transparency,
distributing banking services in convenient way, behavior of employees, customers' education,
tangibility and process through technology play important role in differentiating services from
competitors.
National Conference on RECENT ADVANCEMENTS IN BUSINESS PRACTICES
Page 48 Nehru Institute of Management Studies, Coimbatore
Nirmala College For Women, Coimbatore
A STUDY ON IMPACT OF TOTAL QUALITY MANAGEMENT ON PERFORMANCE
OF SELF FINANCING ENGINEERING INSTITUTIONS
Abstract
At present, in Tamilnadu a wide range of self financing engineering institute is involved in implementing a Total Quality Management (TQM) practices. But still their performance in the competitive engineering education market is very low when comparing to the other premier engineering institutions in India. So the purpose of this study is to explore the TQM practices of the self financing engineering institute in Tamilnadu and its impact on their performance. The conceptual model is developed and the dimension and items are determined based on the study from Begum Sayeda, Chandrasekharan Rajendran and Prakash Sai Lokachari (2010) TQM Model for achieving institutional excellence. This study is descriptive research design type and is based on the primary data; the primary data is collected from the faculty of the self finance engineering institute in Tamilnadu through the structured questionnaire. The sampling technique used in this study is simple random sampling technique and by using the Gpower analysis the sample size is determined as 256. The reliability test for the questionnaire is carried out and reliability value (cronbach alpha) is found more than 0.7 for all the dimension of the study. The statistical tools descriptive statistics,Path analysis was applied to measure the hypothesis and objectives. The findings of the study show that Performance of the self financing engineering institution is majorly influenced by the quality management system of the institution and minor influenced by the stakeholders of the institution. Key words: TQM, Engineering institute performance, Path analysis JEL : 123 Introduction
Total quality management (TQM) is a way of managing to improve the effectiveness, efficiency,
cohesiveness, flexibility and competitiveness of a business as a whole. As defined by British
Standard Institution, TQM consists of a “management philosophy and company practices which
aim to harness the human and material resources of an organization in the most effective way to
achieve the objectives of the organization”. Some researchers are skeptical of the idea of applying
TQM to higher education institutions (HEI). For instance, Chaston (1994) has identified obstacles,
which include insufficient trust between departments and low confidence levels of ability to manage
the process: “Under these circumstances, it does not appear that, for the foreseeable future, British
universities are in a position to adopt TQM philosophy.” Paradoxically, however, HEIs, which
research and teach TQM lack credibility if they decline to embrace the TQM philosophy and
practices themselves. Because TQM is universal and proven by many successful firms, it should
been used to formulate the mission statement for the services provided by HEI; a generic mission
statement could be “To provide quality education, training, research and related services to
consistently satisfy stakeholders‟ needs and achieve excellence through TQM”. The competitiveness
T.Praveen Kumar
Assistant Professor, Department of Management Studies
Sri Sai Ram Engineering College, Chennai, India
Dr.M.Kirupa Priyadarsini
Associate Professor, KCT Business School, Coimbatore, India
Baskaran Ranganathan
Associate Professor, Department of Industrial Engineering
Anna University (CEG), Chennai, India
Vol. 6 Special Issue 1 February 2018 ISSN: 2320-4168
Shanlax International Journal of Commerce Page 49
of a country and skill level of its students is determined by its quality of higher education provide to
its students. Indian educational institutions especially engineering institution adapting to this new
reality, they are gearing up to cater to the needs of their domestic educational market and as well as
to the international educational markets Kelley and Sharif (2005).India is growing in the information
technology (IT), IT ez and various outsourcing (BPO , KPO etc), its due to the cost advantage as well
as the availability of the skilled workforce. This paves the way for growth of the higher educational
institution especially the engineering institution. Theengineers play a pivotal role in the generation
of employment opportunities and consequently in the aggrandizement of a nation‟s wealth. In
Tamil Nadu, the number of engineering educational institutions is rapidly increasing because of its
demand and government policies. But the quality standard in this institution especially
infrastructure, Faculty, Leadership is major concern for their stakeholders. Total quality
management has generally been recognized as a major innovation and system development in
management thought and has gained widespread acceptance in business and industry. The
principles of TQM have been successfully adopted in the field of higher education by developed
countries such as Japan, USA and UK. At present, a wide range of self financing engineering
institute in Tamilnadu is involved in implementing a Total Quality Management (TQM) practices.
But still their performance in the competitive higher education market is very low when comparing
to the other premier institutions in India. So the purpose of this study is to explore the TQM
practices and its impact on the performance of self financing engineering Institute.
Review of Literature
TQM has been used successfully and effectively implemented in variety of organizations,
including manufacturing and service organizations. TQM was first applied in industries. Later the
educational institution like Colleges and universities has gradually started applying TQM principles
to improve their system performance. The following review of literature gives the researcher
contribution in framing TQM model for the higher educational Institution.
Gregory (1996) suggest four dimensions of institutional leaderships symbolic, political,
managerial and academic in his model of distributed leadership for managing change in higher
education institutions.
Kanji (1998) suggested a business excellence model for higher education institution, which
having four factors: delight the customer, management by fact, people-based management and
continuous improvement.
S.G.Deshmukh (2006) in his study brief the importance and usefulness of TQM concept for
technical education and also how the six-sigma concept and approach (DMAIC methodology) in
eliminating the error in the processes of various activities of technical institutes.
G.S Sureshchandar et al (2001) discussed 12 dimensions in his study related to the quality
management and its critical for the utilization of a TQM environment in service organizations like
financial institutions, health care system and education.
Mergen et al. (2000) developed a model of quality management which had three components:
quality of design (QD), quality of conformance (QC) and quality of performance (QP). It provided a
framework to identify opportunities for improvement in research, teaching and operations.
National Conference on RECENT ADVANCEMENTS IN BUSINESS PRACTICES
Page 50 Nehru Institute of Management Studies, Coimbatore
Nirmala College For Women, Coimbatore
Longbottom (2002) propose enabler criteria, which affects performance and help organizations
to achieve organizational excellence. These “enabler” criteria are leadership, policy and strategy,
people management, resources and partnerships and processes. They also suggest “result” criteria
including customer satisfaction, people satisfaction and impact on society and key performance
results for measuring the effectiveness of TQM implementation. Non-implementation of TQM was
due to institutions pre-occupation with funding agencies and non-embracement of continuous
improvement culture. Proper education and training of those involved in the implementation
process will help to mitigate this problem.
Viswanadhan and Rao (2005) in his study the researcher measure the impact of privatization of
engineering education through the performance of undergraduate engineering programmes in
India. The factors taken in the study were commitment of top management and leadership,
customer focus, course delivery, communication, campus facilities, congenial learning environment
and continuous assessment and improvement.
Sakthivel et al.(2005) conceptualized five TQM variables and developed a 5-C TQM model of
academic excellence in technical institutions of India: commitment of top management, course
delivery, campus facilities, courtesy and customer feedback and improvement.
U. Surya Rao and A. Pal Pandi (2006) study given the concept of using all the existing quality
management techniques like ISO 9001:2000, Six-Sigma (DMAIC), TQM, Knowledge Management
and Lean Thinking in the name of Integrated Total Quality Management (ITQM) in technical
institutions
Begum Sayeda, ChandrasekharanRajendran and Prakash Sai Lokachari (2014) This study
proposes a model for achieving institutional excellence from the macro perspective of the
management. Two critical factors, i.e. healthy innovative practices and feeder institution partnership
have been identified as key enablers in this study. Institutional performance (effectiveness), as a
holistic construct, has been measured by five measures of performance, institution reputation and
image, infrastructure quality, faculty excellence, research and industry exposure and stakeholders‟
satisfaction.
Problem Statement
To improve the technical and skilled manpower in the country the Engineering education is
essential. Graduate courses in engineering appear to have lost their charm and value. This academic
year (2016-17), there have been no takers for more than one lakh seats for various courses offered by
the 539 self-financing/private engineering colleges in the State. In other words, one lakh seats in
Bachelor of Engineering (B.E.) or Bachelor of Technology (B.Tech.) courses in Information
Technology, Electronics and Electrical Engineering, Computer Science and Engineering, Mechanical,
Civil or Electrical Engineering, Biotechnology, Metallurgy, Rubber Technology, and so on, have not
been filled. The trend was noticed in 2011-12 when 45,062 seats in different engineering disciplines
remained unfilled. It became glaring in subsequent years. In 2012-13, 50,000 seats remained unfilled;
in 2013-14, it was 80,700; and in 2014-15, the figure rose to 1, 00,819. The situation forced several self-
financing engineering colleges to close down last year. This academic year, 20 engineering colleges
have not admitted fresh students and 15 colleges could fillonly 10 per cent of the seats. These are all
Vol. 6 Special Issue 1 February 2018 ISSN: 2320-4168
Shanlax International Journal of Commerce Page 51
due to the poor performance of the self financing engineering colleges. In Tamilnadu many
engineering institutions especially self financing engineering institution have ISO9001: 2000 and
NBA certificates but it seems the education quality in those institutions is not satisfactory. Some of
the problems like lack of infrastructure, shortage of qualified faculty, students‟ attitude towards
learning, poor students‟ results and placement inadequacy in the engineering institutions result in
the institutions‟ and stakeholders‟ dissatisfaction. The implementation of TQM practices in self
engineering institutions may certainly help the students to get quality education and also TQM
build the system in order to improve the performance of the self financing engineering colleges. The
objectives of this study are to identify the TQM dimensions and its impact on the self financing
engineering institution.
Objectives of the Study
To study the perception the engineering institution staffs with respect to the TQM practices
dimension of the self financing engineering institution
To measure the impact of TQM Practices on performance of the self financing engineering
institution
Research Methodology
The research design used in this study is descriptive research design. Descriptive research
design is a scientific method which involves observing and describing the behavior of a subject
without influencing it in any way. The population of the study is faculty of the self financing
engineering colleges. The criteria for respondent (faculty) they should have experience more than 3
years. The sampling design used in this study is simple random sampling for collecting the data
from faculty. The simple random sampling means is in which every item of the population equal
probability of being chosen. The sample size of this study is determined by the G Power analysis
GPower 3. The sample size is determined based on the specified power, alpha level and effect size
(medium =0.5) in the GPower analysis. The sample size is determined as 256. The structured
questionnaire is used to collect the primary data from the respective self finance engineering
Institute faculty members. Responses were recorded along a five-point Likert scale ranging from 1
(strongly disagree) to 5 (strongly agree) for all the items in the questionnaire. The measurement
scale used in this study is TQM in EEIs from the management‟s (service provider) perspective/TQM
Model for achieving institutional excellence developed by Begum Sayeda,
ChandrasekharanRajendran, Prakash Sai Lokachari (2014) the measurement scale consist of TQM
dimension and Institutional performance dimension, the factors in the TQM dimension are Top
management, Infrastructure, QMS, Stakeholders and process and the factors in the Institutional
performance dimensions are Reputation, quality, faculty excellence, Industry exposure and
stakeholders satisfaction. The reliability of the 32 variables used in the study was carried out using
VPLS 2.1 software. The alpha scores which greater than 0.7 is generally acceptable as sufficient
accuracy for a construct (Nunnally, 1978). The composite reliability for internal consistency of the
constructs was tested and was above 0.7.
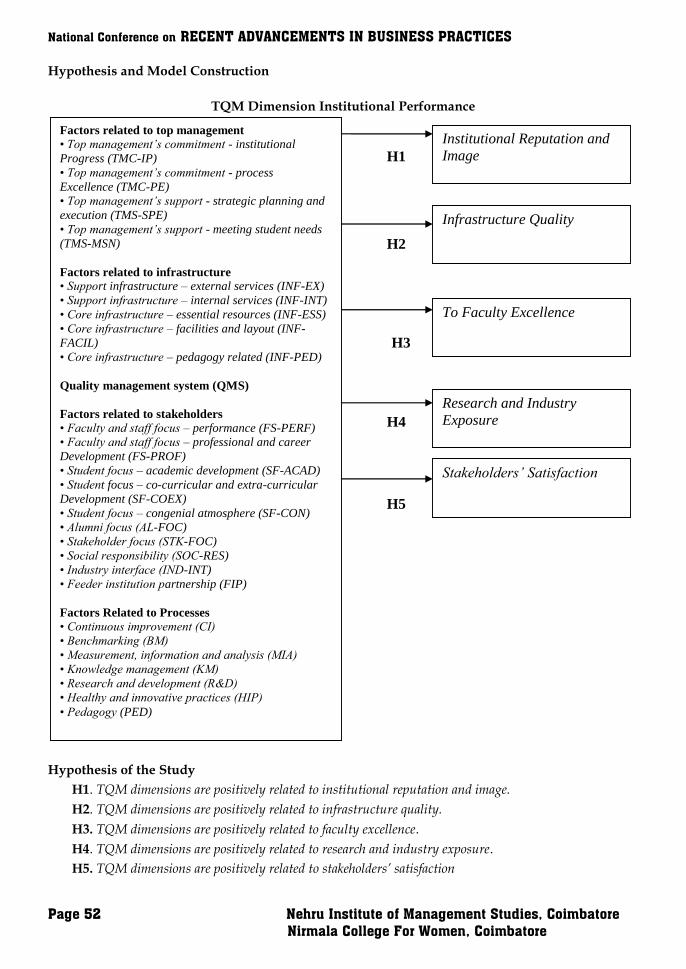
National Conference on RECENT ADVANCEMENTS IN BUSINESS PRACTICES
Page 52 Nehru Institute of Management Studies, Coimbatore
Nirmala College For Women, Coimbatore
Hypothesis and Model Construction
TQM Dimension Institutional Performance
Hypothesis of the Study
H1. TQM dimensions are positively related to institutional reputation and image.
H2. TQM dimensions are positively related to infrastructure quality.
H3. TQM dimensions are positively related to faculty excellence.
H4. TQM dimensions are positively related to research and industry exposure.
H5. TQM dimensions are positively related to stakeholders’ satisfaction
Factors related to top management
• Top management’s commitment - institutional
Progress (TMC-IP)
• Top management’s commitment - process
Excellence (TMC-PE)
• Top management’s support - strategic planning and
execution (TMS-SPE)
• Top management’s support - meeting student needs
(TMS-MSN)
Factors related to infrastructure
• Support infrastructure – external services (INF-EX)
• Support infrastructure – internal services (INF-INT)
• Core infrastructure – essential resources (INF-ESS)
• Core infrastructure – facilities and layout (INF-
FACIL)
• Core infrastructure – pedagogy related (INF-PED)
Quality management system (QMS)
Factors related to stakeholders
• Faculty and staff focus – performance (FS-PERF)
• Faculty and staff focus – professional and career
Development (FS-PROF)
• Student focus – academic development (SF-ACAD)
• Student focus – co-curricular and extra-curricular
Development (SF-COEX)
• Student focus – congenial atmosphere (SF-CON)
• Alumni focus (AL-FOC)
• Stakeholder focus (STK-FOC)
• Social responsibility (SOC-RES)
• Industry interface (IND-INT)
• Feeder institution partnership (FIP)
Factors Related to Processes
• Continuous improvement (CI)
• Benchmarking (BM)
• Measurement, information and analysis (MIA)
• Knowledge management (KM)
• Research and development (R&D)
• Healthy and innovative practices (HIP)
• Pedagogy (PED)
Institutional Reputation and
Image
Infrastructure Quality
To Faculty Excellence
Research and Industry
Exposure
Stakeholders’ Satisfaction
H1
H1
H2
H1
H3
H1
H4
H1
H5
H1
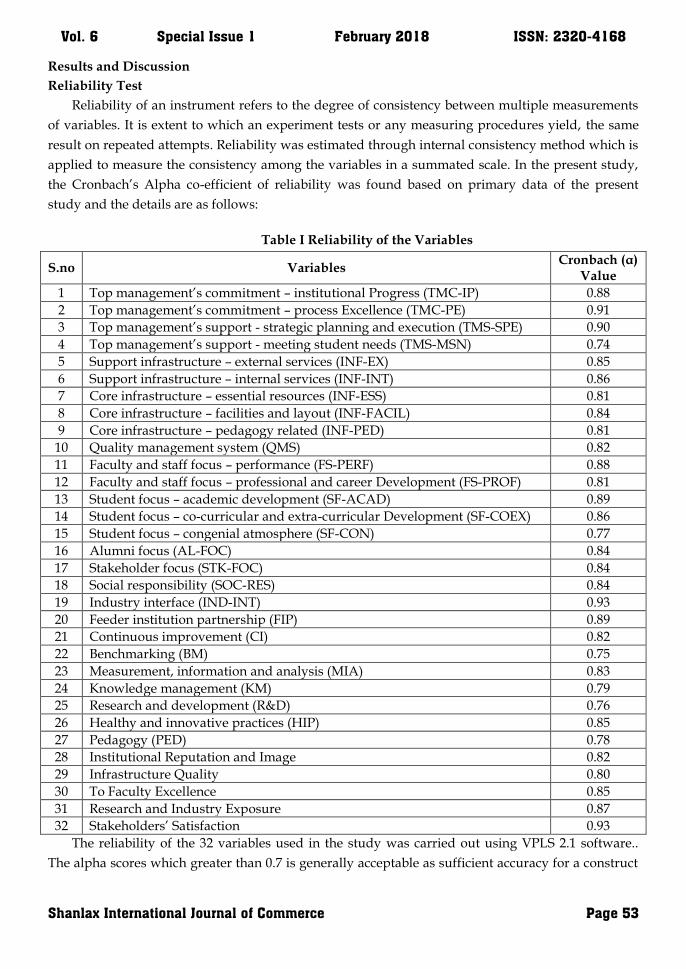
Vol. 6 Special Issue 1 February 2018 ISSN: 2320-4168
Shanlax International Journal of Commerce Page 53
Results and Discussion
Reliability Test
Reliability of an instrument refers to the degree of consistency between multiple measurements
of variables. It is extent to which an experiment tests or any measuring procedures yield, the same
result on repeated attempts. Reliability was estimated through internal consistency method which is
applied to measure the consistency among the variables in a summated scale. In the present study,
the Cronbach‟s Alpha co-efficient of reliability was found based on primary data of the present
study and the details are as follows:
Table I Reliability of the Variables
S.no Variables Cronbach (α)
Value
1 Top management‟s commitment – institutional Progress (TMC-IP) 0.88
2 Top management‟s commitment – process Excellence (TMC-PE) 0.91
3 Top management‟s support - strategic planning and execution (TMS-SPE) 0.90
4 Top management‟s support - meeting student needs (TMS-MSN) 0.74
5 Support infrastructure – external services (INF-EX) 0.85
6 Support infrastructure – internal services (INF-INT) 0.86
7 Core infrastructure – essential resources (INF-ESS) 0.81
8 Core infrastructure – facilities and layout (INF-FACIL) 0.84
9 Core infrastructure – pedagogy related (INF-PED) 0.81
10 Quality management system (QMS) 0.82
11 Faculty and staff focus – performance (FS-PERF) 0.88
12 Faculty and staff focus – professional and career Development (FS-PROF) 0.81
13 Student focus – academic development (SF-ACAD) 0.89
14 Student focus – co-curricular and extra-curricular Development (SF-COEX) 0.86
15 Student focus – congenial atmosphere (SF-CON) 0.77
16 Alumni focus (AL-FOC) 0.84
17 Stakeholder focus (STK-FOC) 0.84
18 Social responsibility (SOC-RES) 0.84
19 Industry interface (IND-INT) 0.93
20 Feeder institution partnership (FIP) 0.89
21 Continuous improvement (CI) 0.82
22 Benchmarking (BM) 0.75
23 Measurement, information and analysis (MIA) 0.83
24 Knowledge management (KM) 0.79
25 Research and development (R&D) 0.76
26 Healthy and innovative practices (HIP) 0.85
27 Pedagogy (PED) 0.78
28 Institutional Reputation and Image 0.82
29 Infrastructure Quality 0.80
30 To Faculty Excellence 0.85
31 Research and Industry Exposure 0.87
32 Stakeholders‟ Satisfaction 0.93
The reliability of the 32 variables used in the study was carried out using VPLS 2.1 software..
The alpha scores which greater than 0.7 is generally acceptable as sufficient accuracy for a construct
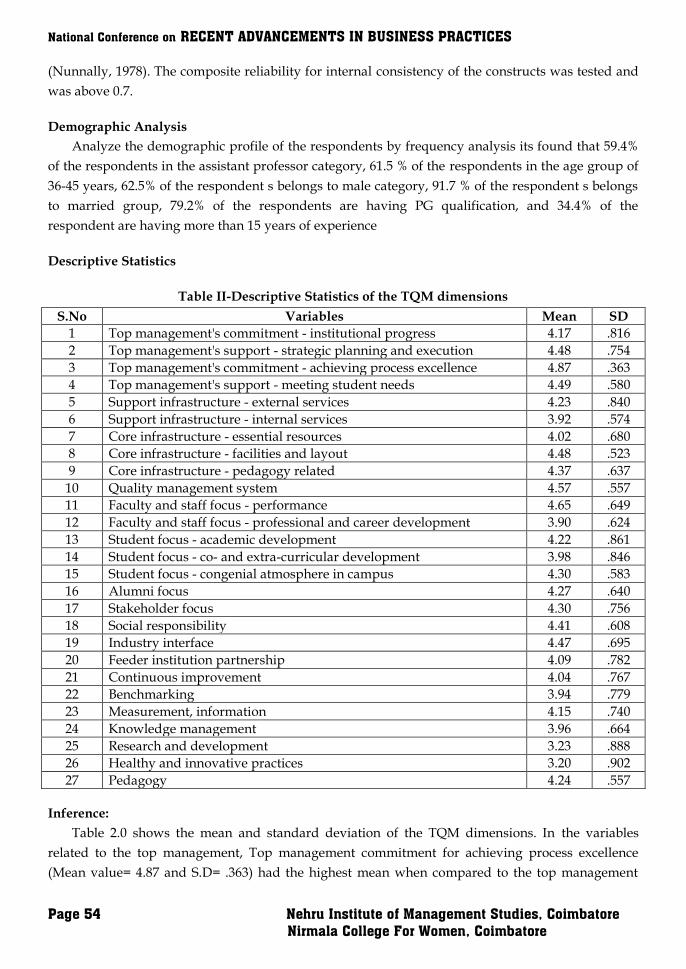
National Conference on RECENT ADVANCEMENTS IN BUSINESS PRACTICES
Page 54 Nehru Institute of Management Studies, Coimbatore
Nirmala College For Women, Coimbatore
(Nunnally, 1978). The composite reliability for internal consistency of the constructs was tested and
was above 0.7.
Demographic Analysis
Analyze the demographic profile of the respondents by frequency analysis its found that 59.4%
of the respondents in the assistant professor category, 61.5 % of the respondents in the age group of
36-45 years, 62.5% of the respondent s belongs to male category, 91.7 % of the respondent s belongs
to married group, 79.2% of the respondents are having PG qualification, and 34.4% of the
respondent are having more than 15 years of experience
Descriptive Statistics
Table II-Descriptive Statistics of the TQM dimensions
S.No Variables Mean SD
1 Top management's commitment - institutional progress 4.17 .816
2 Top management's support - strategic planning and execution 4.48 .754
3 Top management's commitment - achieving process excellence 4.87 .363
4 Top management's support - meeting student needs 4.49 .580
5 Support infrastructure - external services 4.23 .840
6 Support infrastructure - internal services 3.92 .574
7 Core infrastructure - essential resources 4.02 .680
8 Core infrastructure - facilities and layout 4.48 .523
9 Core infrastructure - pedagogy related 4.37 .637
10 Quality management system 4.57 .557
11 Faculty and staff focus - performance 4.65 .649
12 Faculty and staff focus - professional and career development 3.90 .624
13 Student focus - academic development 4.22 .861
14 Student focus - co- and extra-curricular development 3.98 .846
15 Student focus - congenial atmosphere in campus 4.30 .583
16 Alumni focus 4.27 .640
17 Stakeholder focus 4.30 .756
18 Social responsibility 4.41 .608
19 Industry interface 4.47 .695
20 Feeder institution partnership 4.09 .782
21 Continuous improvement 4.04 .767
22 Benchmarking 3.94 .779
23 Measurement, information 4.15 .740
24 Knowledge management 3.96 .664
25 Research and development 3.23 .888
26 Healthy and innovative practices 3.20 .902
27 Pedagogy 4.24 .557
Inference:
Table 2.0 shows the mean and standard deviation of the TQM dimensions. In the variables
related to the top management, Top management commitment for achieving process excellence
(Mean value= 4.87 and S.D= .363) had the highest mean when compared to the top management
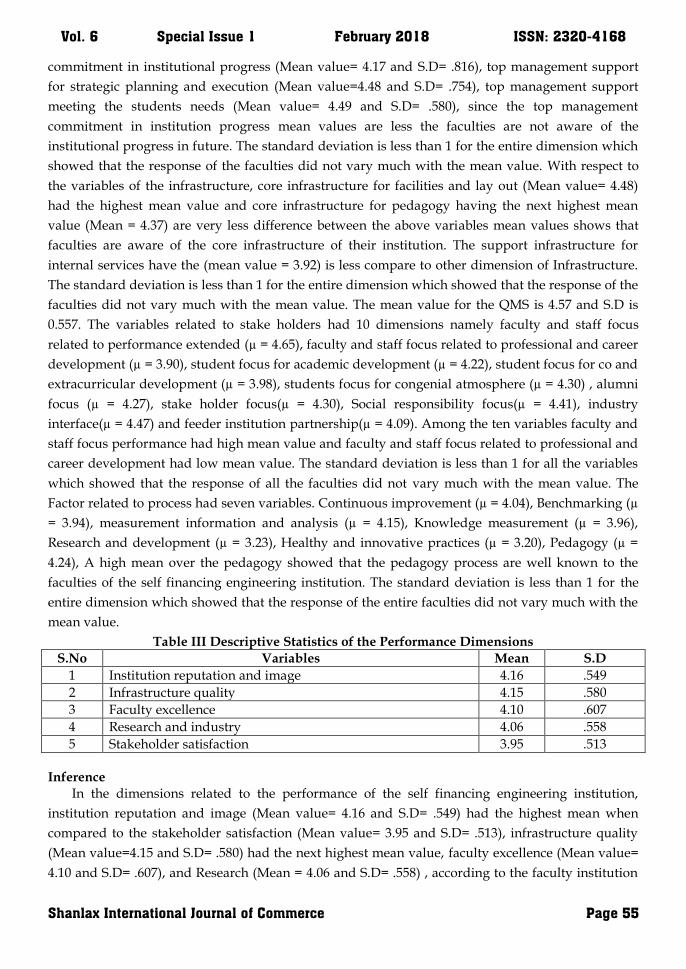
Vol. 6 Special Issue 1 February 2018 ISSN: 2320-4168
Shanlax International Journal of Commerce Page 55
commitment in institutional progress (Mean value= 4.17 and S.D= .816), top management support
for strategic planning and execution (Mean value=4.48 and S.D= .754), top management support
meeting the students needs (Mean value= 4.49 and S.D= .580), since the top management
commitment in institution progress mean values are less the faculties are not aware of the
institutional progress in future. The standard deviation is less than 1 for the entire dimension which
showed that the response of the faculties did not vary much with the mean value. With respect to
the variables of the infrastructure, core infrastructure for facilities and lay out (Mean value= 4.48)
had the highest mean value and core infrastructure for pedagogy having the next highest mean
value (Mean = 4.37) are very less difference between the above variables mean values shows that
faculties are aware of the core infrastructure of their institution. The support infrastructure for
internal services have the (mean value = 3.92) is less compare to other dimension of Infrastructure.
The standard deviation is less than 1 for the entire dimension which showed that the response of the
faculties did not vary much with the mean value. The mean value for the QMS is 4.57 and S.D is
0.557. The variables related to stake holders had 10 dimensions namely faculty and staff focus
related to performance extended (µ = 4.65), faculty and staff focus related to professional and career
development (µ = 3.90), student focus for academic development (µ = 4.22), student focus for co and
extracurricular development (µ = 3.98), students focus for congenial atmosphere (µ = 4.30) , alumni
focus (µ = 4.27), stake holder focus(µ = 4.30), Social responsibility focus(µ = 4.41), industry
interface(µ = 4.47) and feeder institution partnership(µ = 4.09). Among the ten variables faculty and
staff focus performance had high mean value and faculty and staff focus related to professional and
career development had low mean value. The standard deviation is less than 1 for all the variables
which showed that the response of all the faculties did not vary much with the mean value. The
Factor related to process had seven variables. Continuous improvement (µ = 4.04), Benchmarking (µ
= 3.94), measurement information and analysis (µ = 4.15), Knowledge measurement (µ = 3.96),
Research and development (µ = 3.23), Healthy and innovative practices (µ = 3.20), Pedagogy (µ =
4.24), A high mean over the pedagogy showed that the pedagogy process are well known to the
faculties of the self financing engineering institution. The standard deviation is less than 1 for the
entire dimension which showed that the response of the entire faculties did not vary much with the
mean value.
Table III Descriptive Statistics of the Performance Dimensions
S.No Variables Mean S.D
1 Institution reputation and image 4.16 .549
2 Infrastructure quality 4.15 .580
3 Faculty excellence 4.10 .607
4 Research and industry 4.06 .558
5 Stakeholder satisfaction 3.95 .513
Inference
In the dimensions related to the performance of the self financing engineering institution,
institution reputation and image (Mean value= 4.16 and S.D= .549) had the highest mean when
compared to the stakeholder satisfaction (Mean value= 3.95 and S.D= .513), infrastructure quality
(Mean value=4.15 and S.D= .580) had the next highest mean value, faculty excellence (Mean value=
4.10 and S.D= .607), and Research (Mean = 4.06 and S.D= .558) , according to the faculty institution
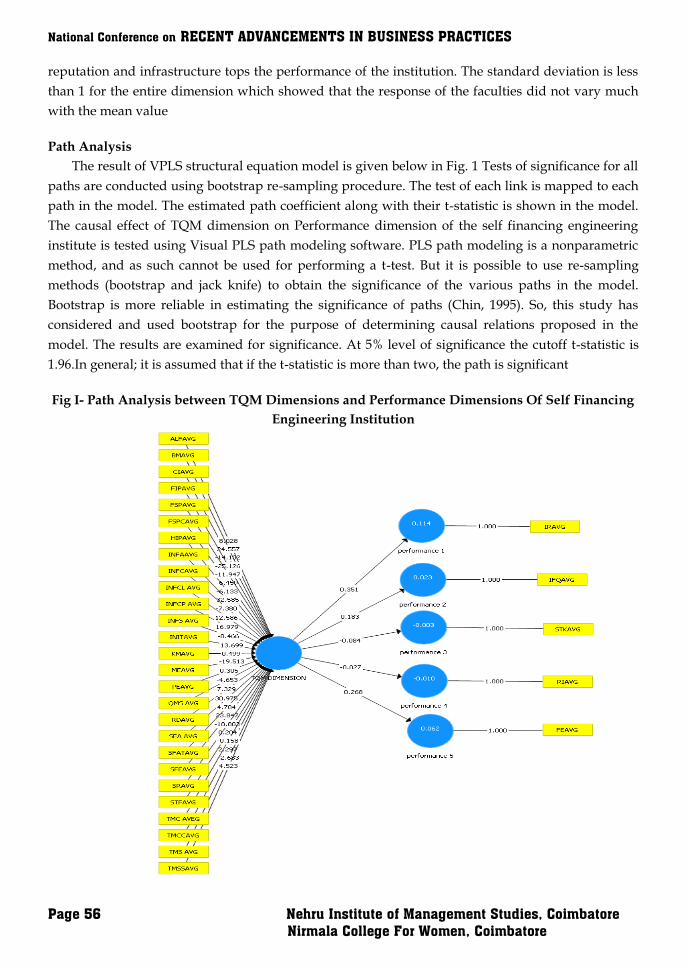
National Conference on RECENT ADVANCEMENTS IN BUSINESS PRACTICES
Page 56 Nehru Institute of Management Studies, Coimbatore
Nirmala College For Women, Coimbatore
reputation and infrastructure tops the performance of the institution. The standard deviation is less
than 1 for the entire dimension which showed that the response of the faculties did not vary much
with the mean value
Path Analysis
The result of VPLS structural equation model is given below in Fig. 1 Tests of significance for all
paths are conducted using bootstrap re-sampling procedure. The test of each link is mapped to each
path in the model. The estimated path coefficient along with their t-statistic is shown in the model.
The causal effect of TQM dimension on Performance dimension of the self financing engineering
institute is tested using Visual PLS path modeling software. PLS path modeling is a nonparametric
method, and as such cannot be used for performing a t-test. But it is possible to use re-sampling
methods (bootstrap and jack knife) to obtain the significance of the various paths in the model.
Bootstrap is more reliable in estimating the significance of paths (Chin, 1995). So, this study has
considered and used bootstrap for the purpose of determining causal relations proposed in the
model. The results are examined for significance. At 5% level of significance the cutoff t-statistic is
1.96.In general; it is assumed that if the t-statistic is more than two, the path is significant
Fig I- Path Analysis between TQM Dimensions and Performance Dimensions Of Self Financing
Engineering Institution
Vol. 6 Special Issue 1 February 2018 ISSN: 2320-4168
Shanlax International Journal of Commerce Page 57
Inference
The performance1 (Institutional reputation and image) is influenced positively by TQM with a
path coefficient of 0.351. The R- square value of performance1 (Institutional reputation and image) is
0.114 it can be concluded that 11% of variation in performance1 (Institutional reputation and image)
is of the sample as explained by the TQM. This empirical investigation supports the TQM and its
dimension and also supports the fact that performance1 (Institutional reputation and image) is
influenced by TQM.
H1. TQM dimensions are positively related to institutional reputation and image.
The above H1is accepted so the TQM dimensions are positively related to institutional
reputation and image.
The performance 2 (Infrastructure Quality) is influenced positively by TQM with a path
coefficient of 0.183. The R- square value of performance 2 (Infrastructure Quality) is 0.023 it can be
concluded that 2% of variation in performance 2 (Infrastructure Quality) is of the sample as
explained by the TQM. This empirical investigation supports the TQM and its dimension and also
supports the fact that performance 2 (Infrastructure Quality) is influenced by TQM.
H2. TQM dimensions are positively related to infrastructure quality.
The above H2 is accepted so the TQM dimensions are positively related to infrastructure quality
The performance 3 (Faculty excellence) is influenced negatively by TQM with a path coefficient
of -0.084. The R- square value of performance 3 (Faculty excellence) is -0.003 it can be concluded that
0% of variation in performance 3 (Faculty excellence) is of the sample as explained by the TQM. This
empirical investigation supports the TQM and its dimension and not supports the fact that
performance 3 (Faculty excellence) is influenced by TQM.
H3.TQM dimensions are positively related to faculty excellence.
The above H3 is rejected so the TQM dimensions are negatively related to faculty excellence
The performance 4 (Research and industry exposure) is influenced negatively by TQM with a
path coefficient of -0.027. The R- square value of performance 4 (Research and industry exposure) is
-0.010 it can be concluded that -1% of variation in performance 4 (Research and industry exposure)
is of the sample as explained by the TQM. This empirical investigation supports the TQM and its
dimension and not supports the fact that performance 4(Research and industry exposure) is
influenced by TQM.
H4. TQM dimensions are positively related to research and industry exposure.
The above H4 is rejected so the TQM dimensions are negatively related to research and industry
exposure
The performance 5 (stakeholders satisfaction) is influenced positively by TQM with a path
coefficient of 0.268. The R- square value of performance 5 (stakeholders satisfaction) is 0.062 it can be
concluded that 6% of variation performance 5 (stakeholders satisfaction) is of the sample as
explained by the TQM. This empirical investigation supports the TQM and its dimension and also
supports the fact that performance 5 (stakeholders satisfaction is influenced by TQM.
H5.TQM dimensions are positively related to stakeholders’ satisfaction
The above H5 is accepted so the TQM dimensions are positively related to stakeholder‟s
satisfaction.
National Conference on RECENT ADVANCEMENTS IN BUSINESS PRACTICES
Page 58 Nehru Institute of Management Studies, Coimbatore
Nirmala College For Women, Coimbatore
Conclusion
The present study made an attempt to measure the impact of TQM dimension on performance
of the self financing engineering institution in Tamilnadu. The constructs are validated by a series of
statistical tests and analysis. The relationship between the constructs of TQM and the measures of
self financing engineering institutional performance has been assessed. It is seen that the TQM
dimensions significantly influence all the measures of performance of the institution, which have a
significant bearing on institutional effectiveness. The individual dimensions which result in each of
the particular measure of institutional performance is highlighted for the purpose of reflection for
the service provider to concentrate more on each of the performance areas for improvement. Some
important observations and concerns from the management‟s perspective are also highlighted and
they pertain to developing vision, commitment of resources for launching quality management
initiatives and process lacunae experienced by key stakeholders.
References
1. Chaston, I. (1994). Are British universities in a position to consider implementing Total Quality
management?. Higher Education Quarterly, 48(2), 118-134.
2. Deshmukh, SG., (2006), “Some Perspective on Total Quality Management in Technical
Institutes”, Journal of Engineering Education, Vol.XIX (3&4), 44- 59.
3. Ernest Osseo-Asare, A., &Longbottom, D. (2002). The need for education and training in the use
of the EFQM model for quality management in UK higher education institutions. Quality
Assurance in Education, 10(1), 26-36.
4. Gregory, M. (1996). Developing effective college leadership for the management of educational
change. Leadership & Organization Development Journal, 17(4), 46-51.
5. Harris, R. W. (1994). Alien or ally? TQM, academic quality and the new public
management. Quality assurance in Education, 2(3), 33-39.
6. Kanji, G.K. (1998), “Measurement of business excellence”, Total Quality Management, Vol. 9,pp.
633-43.
7. Kelley, T. D., & Sharif, N. M. (2005). Understanding the mindset of higher education
CIOs. Educause Quarterly, 28(4), 33.
8. Kumar, M. S., &Sasikala, M. S. (2016). Factors Influencing Quality Management Practices in
Perception of Engineering Students. Global Journal For Research Analysis, 5(6).
9. Mergen, E., Grant, D. and Widrick, S. (2000), “Quality management applied to higher
education”,Total Quality Management, Vol. 11, pp. 345-52.
10. Nunnally, J. C., & Durham, R. L. (1975). Validity, reliability, and special problems of
measurement in evaluation research. Handbook of evaluation research, 1, 289-352.
Vol. 6 Special Issue 1 February 2018 ISSN: 2320-4168
Shanlax International Journal of Commerce Page 59
BANK MANAGEMENT SYSTEM
Abstract The Plan and process of this Bank Management system supply a more guaranteed motion in managing bank customer’s info which increase the relation between banks and their customers by rendering the right answer that uses a structure safety to improve customer damages.To keep the trust of customers, there is the optimistic need for management of the bank, which can hold all this with pleasant and simplicity. Effective and efficient management leads to the satisfaction of the customers and staff members, indirectly. And also, it encourages management administrative body in taking some required choice for approaching improvement of the bank. Now a days, managing a bank is boring job up to certain level. So computer code that reduces the work is important. Also today’s world is a good computer world and is getting quicker and quicker day-by-day. In this paper we will have a look at how a bank manages its possession in order to earn the high possible income. Keywords: Bank management, Customers relationship, Safety required and Satisfaction
Introduction
A bank is a financial institution which take deposits, pays power on per-defined revenue
enhancement, distinct checks, form loans, and frequently acts as an mediator in financial
proceedings. It also supply other financial work to its customers. Bank management regulate several
concerns related with bank in order to increase net income. The concerns generally consider
liquidity management, asset management, liability management and capital management. We will
discuss these areas in this paper.Today, banks are sensing beyond the transactions to the full
possibility on how to manage their customers. Consequently, they are going beyond managing
customer as plain interaction to a entire new plane of consumer relationship management, creating
a super technical client experience that gives the bank a competitive plus and a more loyal, gainful
and bound up customers. There are many definitions of bank management. In general, bank
management relate to the activity of managing the Bank‟s act . Bank management is defined by the
particular object of management - financial dealings attached with banking action and other
dealings, also connected with execution of management purpose in banking.
Evolution of Banks
Barter system replaced by cash which made transaction uniform
Uniform laws were made up to develop public trust
Centralized banks were made up to manage other banks
Book keeping was changed from papers to digital format with the introduction of computers
ATM's were made up for easier withdrawal of money
Net banking came into existence with development of web
Mr. P. Rajan
Professor - Cum- Head, Department of Management
Sri Krishna Arts and Science College, Coimbatore
Mrs. P. Nirmala Shiny
Assistant Professor, Department of Management
Sri Krishna Arts and Science College, Coimbatore
National Conference on RECENT ADVANCEMENTS IN BUSINESS PRACTICES
Page 60 Nehru Institute of Management Studies, Coimbatore
Nirmala College For Women, Coimbatore
General Principles of Bank Management
Liquidity Management
Asset Management
Liability Management
Liquidity Management
In finance, liquidity management takes one of two forms based on the account of liquidity. One
type of liquidity relate to the quality to trade an asset, such as a stock or bond, at its actual price.
The other account of liquidity applies to sizable organizations, such as commercial enterprise. Banks
are often evaluated on their liquidity, or their quality to encounter cash and related obligations
without acquisition significant losses. In either case, liquidity management explains the activity of
investors or managers to reduce liquidity risk aspect.
Asset Management
Asset management is the path of a customer cash and safety by a financial services organization,
usually an finance bank. The organization offers finance services along with a broad scope of
traditional and secondary outcome offerings that might not be accessible to the normal capitalist.
The account is held by a bank institution and includes checking writing privileges, credit cards,
debit cards, margin loans, the automatic sweep of cash balances into a money market fund and
brokerage services.
Liability Management
Liability management is the use and management of liabilities, such as client deposits, by a bank
in order to serve loaning and let for balanced maturation. Management of money recognized from
depositors as well as finances barred from other organization constitute liability management.
It also involves security against alteration in interest rates and dominant the gap between the
maturities of assets and liabilities.
3 Reasons why Bank Management is Important
1. Changing Regulation of Banks
2. Increasing Competition due to Changing Technological Development
3. Changing International Relationship
Changing Regulation of Banks
Changing rules of bank can affect the customers, so they follow some methods to manage the
banks.Some of the techniques followed by the bank regulatory authorities to control over the
activities of commercial banks are;
1. Direction for the right price of bank services.
2. Introduction of deposit insurance.
3. Direction for adequate liquidity.
4. Direction for capital adequacy.
5. Direction for approval and non-approval of bank loan operation.
6. Recruitment of directors and direction regarding recruitment and directing their duties and
Vol. 6 Special Issue 1 February 2018 ISSN: 2320-4168
Shanlax International Journal of Commerce Page 61
responsibilities.
7. Loan supervision,, review and examination.
8. Direction for adequacy reserve etc.
Increasing Competition due to Changing Technological Development
Why the new welfare or service that the bank content is unique and various from that of the
other organization definite quantity the commercial banks to take part in the multidimensional
competitive surroundings. The bank, which can attract more clients, can create client repeatedly.
This technological environment absorbed more investment and new training. So, the management
of bank creates new strategy of banking services adjusted in competitive banking business.
Changing International Relationship
In global banking business, the bank faces broad sum of civil law in the event of a new problem.
Worldwide relations, global or bilateral, create more rival in banking business. Other cause, such as
changes in world trade and commerce, laws of found transfer, alteration in society and cultural
factors launch new operational management system which demand the banking business. In this era
of modern-day s, solution of competitive situation and development of world relationship among
banks, the management of bank follows scheme to unite banks in multinational banking business.
Conclusion
Now a days banking has become a necessary need for many people all around the world.
At present many banks are adopting the new methods of management system. So that they can
easily serve the customers and give their best in the competitive environment. This paper includes
the important main scheme needed for banking management and adoption of banking management
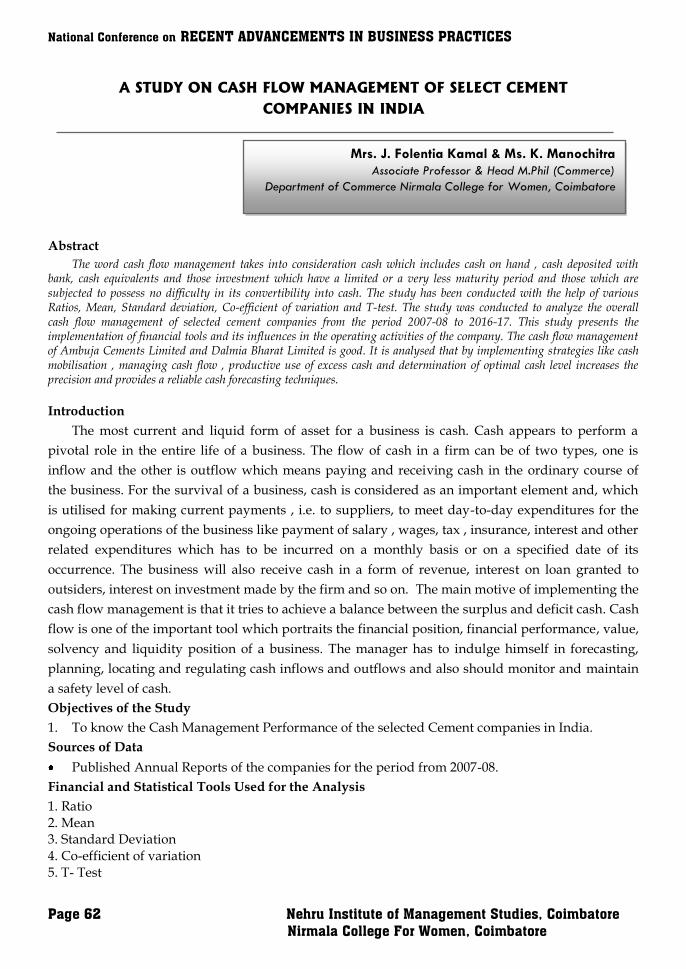
National Conference on RECENT ADVANCEMENTS IN BUSINESS PRACTICES
Page 62 Nehru Institute of Management Studies, Coimbatore
Nirmala College For Women, Coimbatore
A STUDY ON CASH FLOW MANAGEMENT OF SELECT CEMENT
COMPANIES IN INDIA
Abstract
The word cash flow management takes into consideration cash which includes cash on hand , cash deposited with bank, cash equivalents and those investment which have a limited or a very less maturity period and those which are subjected to possess no difficulty in its convertibility into cash. The study has been conducted with the help of various Ratios, Mean, Standard deviation, Co-efficient of variation and T-test. The study was conducted to analyze the overall cash flow management of selected cement companies from the period 2007-08 to 2016-17. This study presents the implementation of financial tools and its influences in the operating activities of the company. The cash flow management of Ambuja Cements Limited and Dalmia Bharat Limited is good. It is analysed that by implementing strategies like cash mobilisation , managing cash flow , productive use of excess cash and determination of optimal cash level increases the precision and provides a reliable cash forecasting techniques. Introduction
The most current and liquid form of asset for a business is cash. Cash appears to perform a
pivotal role in the entire life of a business. The flow of cash in a firm can be of two types, one is
inflow and the other is outflow which means paying and receiving cash in the ordinary course of
the business. For the survival of a business, cash is considered as an important element and, which
is utilised for making current payments , i.e. to suppliers, to meet day-to-day expenditures for the
ongoing operations of the business like payment of salary , wages, tax , insurance, interest and other
related expenditures which has to be incurred on a monthly basis or on a specified date of its
occurrence. The business will also receive cash in a form of revenue, interest on loan granted to
outsiders, interest on investment made by the firm and so on. The main motive of implementing the
cash flow management is that it tries to achieve a balance between the surplus and deficit cash. Cash
flow is one of the important tool which portraits the financial position, financial performance, value,
solvency and liquidity position of a business. The manager has to indulge himself in forecasting,
planning, locating and regulating cash inflows and outflows and also should monitor and maintain
a safety level of cash.
Objectives of the Study
1. To know the Cash Management Performance of the selected Cement companies in India.
Sources of Data
Published Annual Reports of the companies for the period from 2007-08.
Financial and Statistical Tools Used for the Analysis
1. Ratio 2. Mean 3. Standard Deviation 4. Co-efficient of variation 5. T- Test
Mrs. J. Folentia Kamal & Ms. K. Manochitra
Associate Professor & Head M.Phil (Commerce)
Department of Commerce Nirmala College for Women, Coimbatore
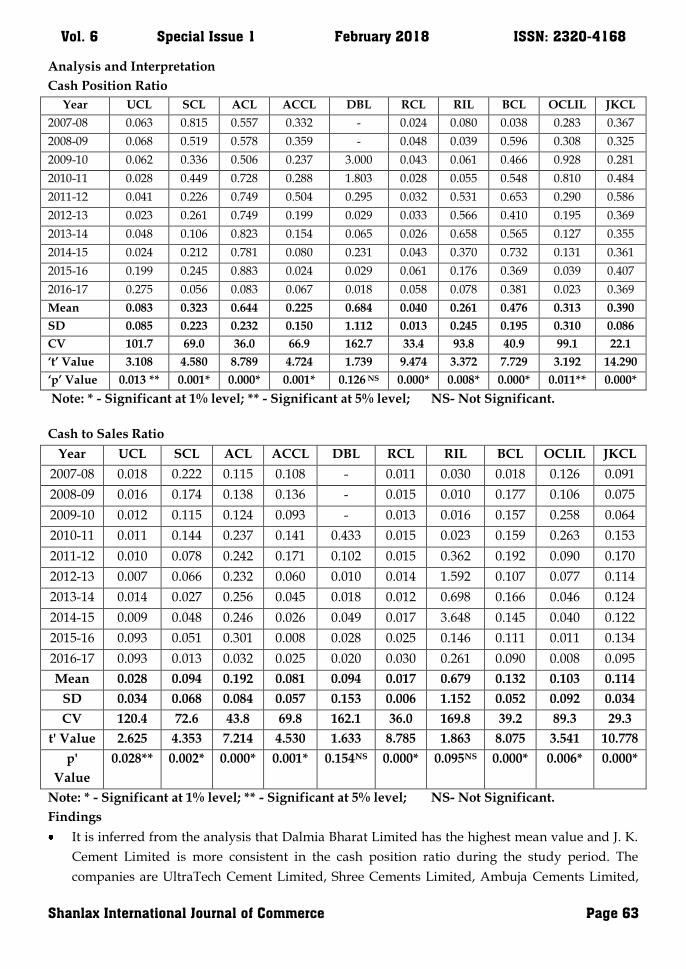
Vol. 6 Special Issue 1 February 2018 ISSN: 2320-4168
Shanlax International Journal of Commerce Page 63
Analysis and Interpretation
Cash Position Ratio
Year UCL SCL ACL ACCL DBL RCL RIL BCL OCLIL JKCL
2007-08 0.063 0.815 0.557 0.332 - 0.024 0.080 0.038 0.283 0.367
2008-09 0.068 0.519 0.578 0.359 - 0.048 0.039 0.596 0.308 0.325
2009-10 0.062 0.336 0.506 0.237 3.000 0.043 0.061 0.466 0.928 0.281
2010-11 0.028 0.449 0.728 0.288 1.803 0.028 0.055 0.548 0.810 0.484
2011-12 0.041 0.226 0.749 0.504 0.295 0.032 0.531 0.653 0.290 0.586
2012-13 0.023 0.261 0.749 0.199 0.029 0.033 0.566 0.410 0.195 0.369
2013-14 0.048 0.106 0.823 0.154 0.065 0.026 0.658 0.565 0.127 0.355
2014-15 0.024 0.212 0.781 0.080 0.231 0.043 0.370 0.732 0.131 0.361
2015-16 0.199 0.245 0.883 0.024 0.029 0.061 0.176 0.369 0.039 0.407
2016-17 0.275 0.056 0.083 0.067 0.018 0.058 0.078 0.381 0.023 0.369
Mean 0.083 0.323 0.644 0.225 0.684 0.040 0.261 0.476 0.313 0.390
SD 0.085 0.223 0.232 0.150 1.112 0.013 0.245 0.195 0.310 0.086
CV 101.7 69.0 36.0 66.9 162.7 33.4 93.8 40.9 99.1 22.1
‘t’ Value 3.108 4.580 8.789 4.724 1.739 9.474 3.372 7.729 3.192 14.290
‘p’ Value 0.013 ** 0.001* 0.000* 0.001* 0.126 NS 0.000* 0.008* 0.000* 0.011** 0.000*
Note: * - Significant at 1% level; ** - Significant at 5% level; NS- Not Significant.
Cash to Sales Ratio
Year UCL SCL ACL ACCL DBL RCL RIL BCL OCLIL JKCL
2007-08 0.018 0.222 0.115 0.108 - 0.011 0.030 0.018 0.126 0.091
2008-09 0.016 0.174 0.138 0.136 - 0.015 0.010 0.177 0.106 0.075
2009-10 0.012 0.115 0.124 0.093 - 0.013 0.016 0.157 0.258 0.064
2010-11 0.011 0.144 0.237 0.141 0.433 0.015 0.023 0.159 0.263 0.153
2011-12 0.010 0.078 0.242 0.171 0.102 0.015 0.362 0.192 0.090 0.170
2012-13 0.007 0.066 0.232 0.060 0.010 0.014 1.592 0.107 0.077 0.114
2013-14 0.014 0.027 0.256 0.045 0.018 0.012 0.698 0.166 0.046 0.124
2014-15 0.009 0.048 0.246 0.026 0.049 0.017 3.648 0.145 0.040 0.122
2015-16 0.093 0.051 0.301 0.008 0.028 0.025 0.146 0.111 0.011 0.134
2016-17 0.093 0.013 0.032 0.025 0.020 0.030 0.261 0.090 0.008 0.095
Mean 0.028 0.094 0.192 0.081 0.094 0.017 0.679 0.132 0.103 0.114
SD 0.034 0.068 0.084 0.057 0.153 0.006 1.152 0.052 0.092 0.034
CV 120.4 72.6 43.8 69.8 162.1 36.0 169.8 39.2 89.3 29.3
t' Value 2.625 4.353 7.214 4.530 1.633 8.785 1.863 8.075 3.541 10.778
p'
Value
0.028** 0.002* 0.000* 0.001* 0.154NS 0.000* 0.095NS 0.000* 0.006* 0.000*
Note: * - Significant at 1% level; ** - Significant at 5% level; NS- Not Significant.
Findings
It is inferred from the analysis that Dalmia Bharat Limited has the highest mean value and J. K.
Cement Limited is more consistent in the cash position ratio during the study period. The
companies are UltraTech Cement Limited, Shree Cements Limited, Ambuja Cements Limited,
National Conference on RECENT ADVANCEMENTS IN BUSINESS PRACTICES
Page 64 Nehru Institute of Management Studies, Coimbatore
Nirmala College For Women, Coimbatore
Associated Cement Companies Limited, Ramco Cements Limited, Rain Industries Limited, Birla
Corporation Limited, OCL India Limited and J. K. Cement Limited are having significant
difference in the study period.
It is stated from the analysis that Rain Industries Limited has the highest mean value and J. K.
Cement Limited is more consistent in the cash to sales ratio during the study period. The
companies are UltraTech Cement Limited, Shree Cements Limited, Ambuja Cements Limited,
Associated Cement Companies Limited, Ramco Cements Limited, Birla corporation Limited,
OCL India Limited and J. K. Cement Limited are having significant difference in the study
period.
Conclusion
The study was conducted to analyze the overall cash flow management of selected cement
companies from the period 2007-08 to 2016-17. This study presents the implementation of financial
tools and its influences in the operating activities of the company. The cash flow management of
Ambuja Cements Limited and Dalmia Bharat Limited is good. Discovering the cash position of the
firm becomes easy if the information relating to cash is been referred from the past historical records
by the financial manager for viewing the cash flow statement. It is analysed that by implementing
strategies like cash mobilisation , managing cash flow , productive use of excess cash and
determination of optimal cash level increases the precision and provides a reliable cash forecasting
techniques.
Books for Reference
1. M.Y. Khan & P.K. Jain , Financial Management, Tata Mc Graw Hill Publishing House, New
Delhi.
2. Dr. S. Gurusamy and A Murthy (2006) , Management Accounting , Windom Publication ,
Chennai.
Journals Reference
1. Rohit Kumar (2015). Impact of cash flow on the Individual Shareholders Investment Decision
Making. 11, 68-79.
2. Navon R. (1996). Company-Level Cash-Flow Management. Journal of Construction Engineering
and Management, 22 - 29.

Vol. 6 Special Issue 1 February 2018 ISSN: 2320-4168
Shanlax International Journal of Commerce Page 65
A STUDY ON EMPLOYEE MOTIVATION WITH REFERENCE TO STEEL COMPLEX
LIMITED, CALICUT USING PERCENTAGE ANALYSIS
Abstract
Motivation is a major factor in the growth of an organization. Organizations need highly motivated employees to take their success mission forward. The rewards and recognition programmes play a vital role in boosting employee morale and motivation. The research was carried out to study the motivational factors of employees and its effectiveness in Steel Complex Ltd., Calicut and to study about the welfare measures provided to employees by Steel Complex Ltd. In today's time the study of what are the factors that motivates employees and in turn improves productivity and profitability has a wide scope. The study analyses various related factors that affect employee motivation and the needs and wants of the employees in an organization. Various measures that inspire and motivate employees are very important to achieve the organizations desired objectives Keywords Employee, Motivation, Organizations, performance, recognition, Steel Industry Introduction
Motivation is a major factor in the growth of an organization. Organizations need highly
motivated employees to take their success mission forward. The rewards and recognition
programmes play a vital role in boosting employee morale and motivation. Performance recognition
is a must have for any organization, it is an important factor but mere introduction of a reward and
recognition programme does not guarantee encouraging results. The rewards and recognition
programme to yield good results must meet the following two factors a) Expectations of employees
b) The implementation process of the performance recognition system should be fair to inspire
employees, In spite of having well intended performance recognition in place, organization far too
often fail to motivate their employees.
Motivation has to be drawn from within, it is not a force that can be applied from outside,
A manager who can inspire his employees to overcome all obstacles and hurdles and grow on the
personal front as well as professionally is a true leader, A leaders charisma and actions bring in a
transformation in his employees to improve their performance. A manger should be a role model
for their employees, in today‟s times respecting the interest of employees assumes much
importance. A good manager should look into the development of each employee and
understanding their interests and strength. This in turn is essential to establish a relationship of trust
between an employee and employer and motivate the employees to align his goal in lieu with the
goals of the company.
Steel Complex Limited (SCL) is the only mini steel plant in Kerala. It is managed and run by the
Government of Kerala. It started off as a joint venture co run by KSIDC (Kerala State Industrial
Development Corporation) and some private entrepreneurs namely Mr. S.A. Jifri, Mr. A.K. Kader
Kutty, Mr. K.P. Abdul Kareem, Mr. R.N. Menon, Mr.K.T. Joseph etc. Later the 50% of the shares
were taken over by KSIDC and it became a subsidiary of KSIDC. SCL was making considerable
Ambadi Deepapradha Gangadharan & Mr.R.A.Ayyapparajan
Assistant Professor, Department of International Business
Nehru Arts and Science College
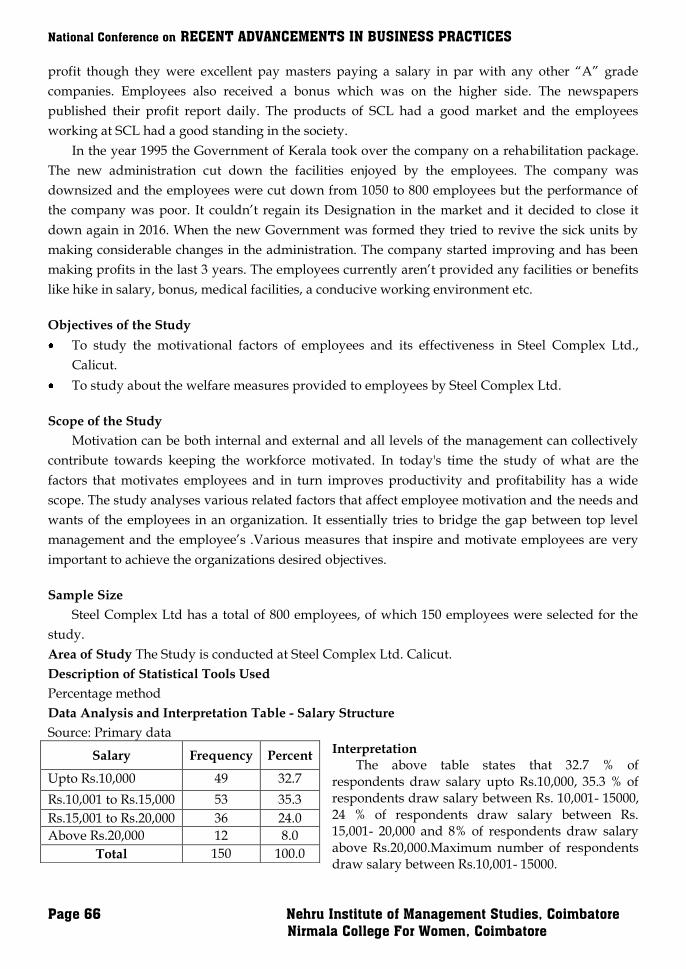
National Conference on RECENT ADVANCEMENTS IN BUSINESS PRACTICES
Page 66 Nehru Institute of Management Studies, Coimbatore
Nirmala College For Women, Coimbatore
profit though they were excellent pay masters paying a salary in par with any other “A” grade
companies. Employees also received a bonus which was on the higher side. The newspapers
published their profit report daily. The products of SCL had a good market and the employees
working at SCL had a good standing in the society.
In the year 1995 the Government of Kerala took over the company on a rehabilitation package.
The new administration cut down the facilities enjoyed by the employees. The company was
downsized and the employees were cut down from 1050 to 800 employees but the performance of
the company was poor. It couldn‟t regain its Designation in the market and it decided to close it
down again in 2016. When the new Government was formed they tried to revive the sick units by
making considerable changes in the administration. The company started improving and has been
making profits in the last 3 years. The employees currently aren‟t provided any facilities or benefits
like hike in salary, bonus, medical facilities, a conducive working environment etc.
Objectives of the Study
To study the motivational factors of employees and its effectiveness in Steel Complex Ltd.,
Calicut.
To study about the welfare measures provided to employees by Steel Complex Ltd.
Scope of the Study
Motivation can be both internal and external and all levels of the management can collectively
contribute towards keeping the workforce motivated. In today's time the study of what are the
factors that motivates employees and in turn improves productivity and profitability has a wide
scope. The study analyses various related factors that affect employee motivation and the needs and
wants of the employees in an organization. It essentially tries to bridge the gap between top level
management and the employee‟s .Various measures that inspire and motivate employees are very
important to achieve the organizations desired objectives.
Sample Size
Steel Complex Ltd has a total of 800 employees, of which 150 employees were selected for the
study.
Area of Study The Study is conducted at Steel Complex Ltd. Calicut.
Description of Statistical Tools Used
Percentage method
Data Analysis and Interpretation Table - Salary Structure
Source: Primary data Interpretation The above table states that 32.7 % of respondents draw salary upto Rs.10,000, 35.3 % of respondents draw salary between Rs. 10,001- 15000, 24 % of respondents draw salary between Rs. 15,001- 20,000 and 8% of respondents draw salary above Rs.20,000.Maximum number of respondents draw salary between Rs.10,001- 15000.
Salary Frequency Percent
Upto Rs.10,000 49 32.7
Rs.10,001 to Rs.15,000 53 35.3
Rs.15,001 to Rs.20,000 36 24.0
Above Rs.20,000 12 8.0
Total 150 100.0
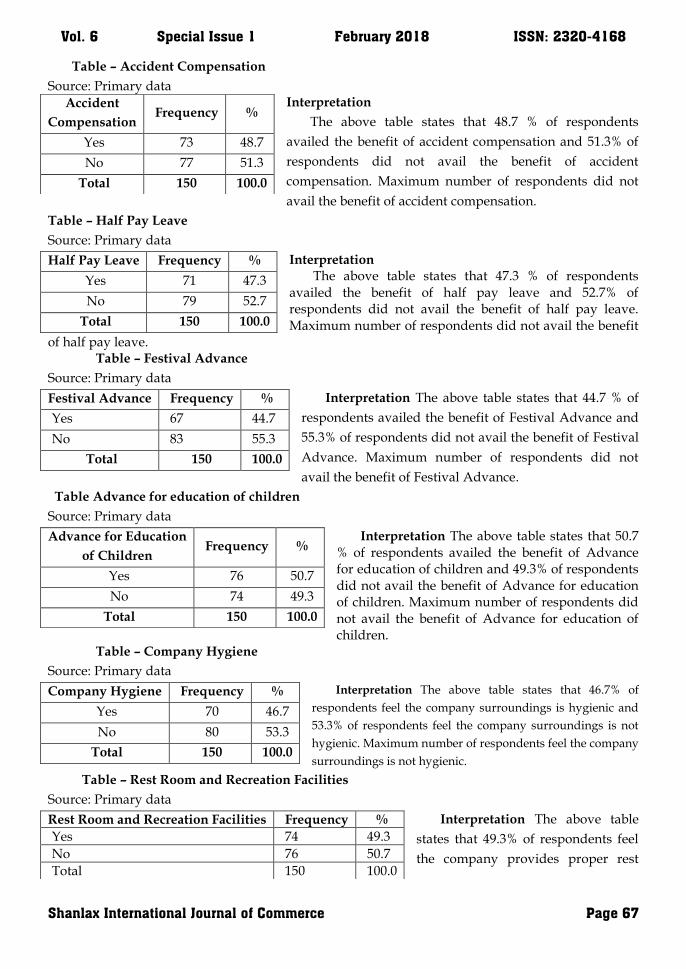
Vol. 6 Special Issue 1 February 2018 ISSN: 2320-4168
Shanlax International Journal of Commerce Page 67
Table – Accident Compensation
Source: Primary data Interpretation
The above table states that 48.7 % of respondents
availed the benefit of accident compensation and 51.3% of
respondents did not avail the benefit of accident
compensation. Maximum number of respondents did not
avail the benefit of accident compensation.
Table – Half Pay Leave
Source: Primary data
Interpretation The above table states that 47.3 % of respondents availed the benefit of half pay leave and 52.7% of respondents did not avail the benefit of half pay leave. Maximum number of respondents did not avail the benefit
of half pay leave. Table – Festival Advance
Source: Primary data
Interpretation The above table states that 44.7 % of
respondents availed the benefit of Festival Advance and
55.3% of respondents did not avail the benefit of Festival
Advance. Maximum number of respondents did not
avail the benefit of Festival Advance.
Table Advance for education of children
Source: Primary data
Interpretation The above table states that 50.7 % of respondents availed the benefit of Advance for education of children and 49.3% of respondents did not avail the benefit of Advance for education of children. Maximum number of respondents did not avail the benefit of Advance for education of children.
Table – Company Hygiene
Source: Primary data
Interpretation The above table states that 46.7% of
respondents feel the company surroundings is hygienic and
53.3% of respondents feel the company surroundings is not
hygienic. Maximum number of respondents feel the company
surroundings is not hygienic.
Table – Rest Room and Recreation Facilities
Source: Primary data
Interpretation The above table
states that 49.3% of respondents feel
the company provides proper rest
Accident
Compensation Frequency %
Yes 73 48.7
No 77 51.3
Total 150 100.0
Half Pay Leave Frequency %
Yes 71 47.3
No 79 52.7
Total 150 100.0
Festival Advance Frequency %
Yes 67 44.7
No 83 55.3
Total 150 100.0
Advance for Education
of Children Frequency %
Yes 76 50.7
No 74 49.3
Total 150 100.0
Company Hygiene Frequency %
Yes 70 46.7
No 80 53.3
Total 150 100.0
Rest Room and Recreation Facilities Frequency %
Yes 74 49.3
No 76 50.7
Total 150 100.0
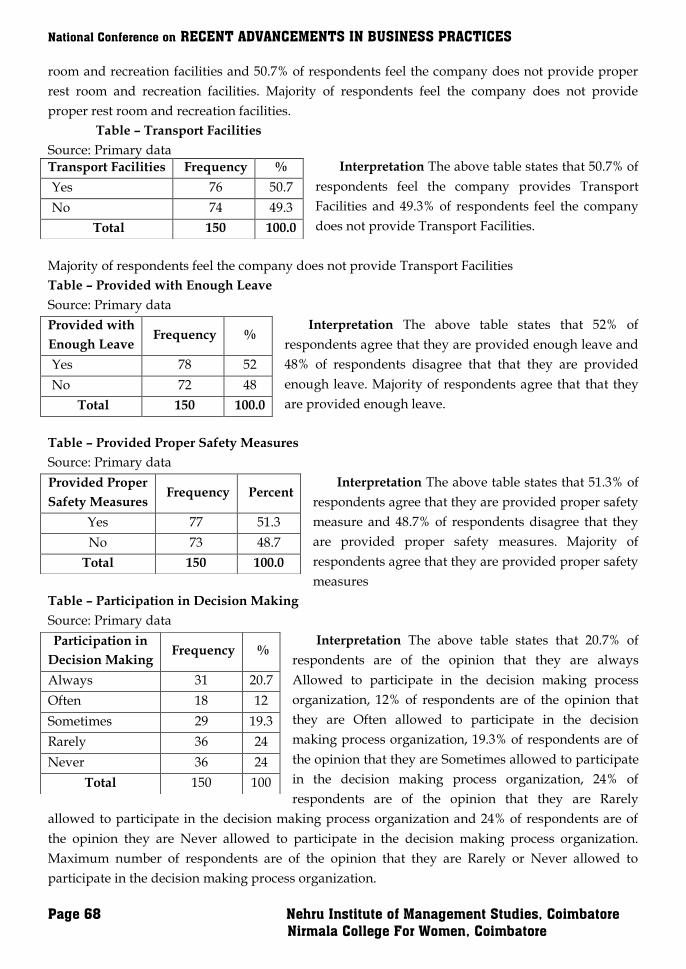
National Conference on RECENT ADVANCEMENTS IN BUSINESS PRACTICES
Page 68 Nehru Institute of Management Studies, Coimbatore
Nirmala College For Women, Coimbatore
room and recreation facilities and 50.7% of respondents feel the company does not provide proper
rest room and recreation facilities. Majority of respondents feel the company does not provide
proper rest room and recreation facilities.
Table – Transport Facilities
Source: Primary data Interpretation The above table states that 50.7% of
respondents feel the company provides Transport
Facilities and 49.3% of respondents feel the company
does not provide Transport Facilities.
Majority of respondents feel the company does not provide Transport Facilities
Table – Provided with Enough Leave
Source: Primary data
Interpretation The above table states that 52% of
respondents agree that they are provided enough leave and
48% of respondents disagree that that they are provided
enough leave. Majority of respondents agree that that they
are provided enough leave.
Table – Provided Proper Safety Measures
Source: Primary data
Interpretation The above table states that 51.3% of
respondents agree that they are provided proper safety
measure and 48.7% of respondents disagree that they
are provided proper safety measures. Majority of
respondents agree that they are provided proper safety
measures
Table – Participation in Decision Making
Source: Primary data
Interpretation The above table states that 20.7% of
respondents are of the opinion that they are always
Allowed to participate in the decision making process
organization, 12% of respondents are of the opinion that
they are Often allowed to participate in the decision
making process organization, 19.3% of respondents are of
the opinion that they are Sometimes allowed to participate
in the decision making process organization, 24% of
respondents are of the opinion that they are Rarely
allowed to participate in the decision making process organization and 24% of respondents are of
the opinion they are Never allowed to participate in the decision making process organization.
Maximum number of respondents are of the opinion that they are Rarely or Never allowed to
participate in the decision making process organization.
Transport Facilities Frequency %
Yes 76 50.7
No 74 49.3
Total 150 100.0
Provided with
Enough Leave Frequency %
Yes 78 52
No 72 48
Total 150 100.0
Provided Proper
Safety Measures Frequency Percent
Yes 77 51.3
No 73 48.7
Total 150 100.0
Participation in
Decision Making Frequency %
Always 31 20.7
Often 18 12
Sometimes 29 19.3
Rarely 36 24
Never 36 24
Total 150 100
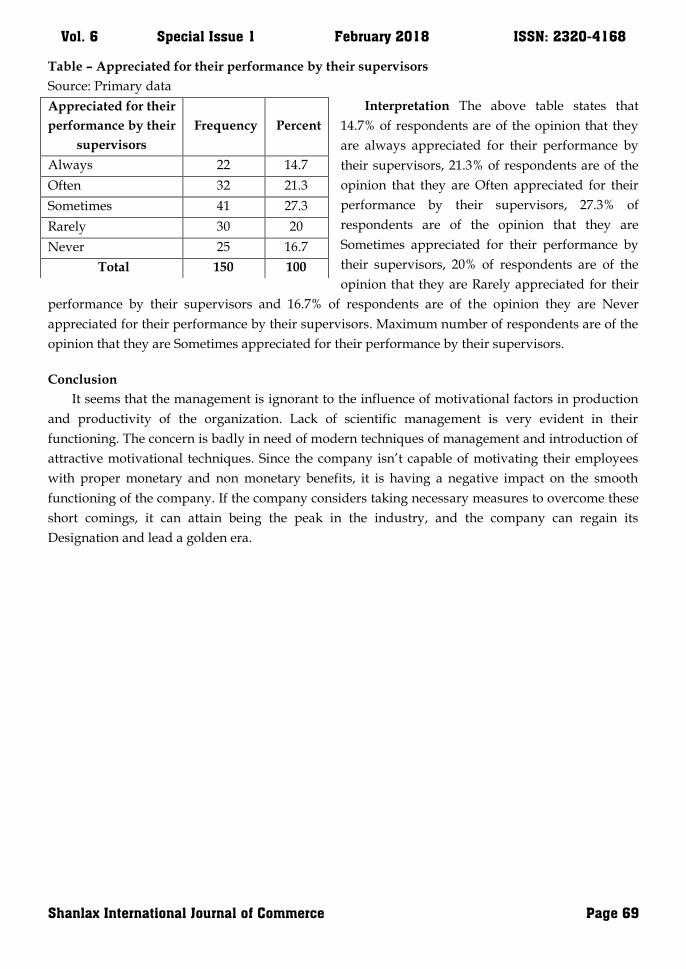
Vol. 6 Special Issue 1 February 2018 ISSN: 2320-4168
Shanlax International Journal of Commerce Page 69
Table – Appreciated for their performance by their supervisors
Source: Primary data
Interpretation The above table states that
14.7% of respondents are of the opinion that they
are always appreciated for their performance by
their supervisors, 21.3% of respondents are of the
opinion that they are Often appreciated for their
performance by their supervisors, 27.3% of
respondents are of the opinion that they are
Sometimes appreciated for their performance by
their supervisors, 20% of respondents are of the
opinion that they are Rarely appreciated for their
performance by their supervisors and 16.7% of respondents are of the opinion they are Never
appreciated for their performance by their supervisors. Maximum number of respondents are of the
opinion that they are Sometimes appreciated for their performance by their supervisors.
Conclusion
It seems that the management is ignorant to the influence of motivational factors in production
and productivity of the organization. Lack of scientific management is very evident in their
functioning. The concern is badly in need of modern techniques of management and introduction of
attractive motivational techniques. Since the company isn‟t capable of motivating their employees
with proper monetary and non monetary benefits, it is having a negative impact on the smooth
functioning of the company. If the company considers taking necessary measures to overcome these
short comings, it can attain being the peak in the industry, and the company can regain its
Designation and lead a golden era.
Appreciated for their
performance by their
supervisors
Frequency Percent
Always 22 14.7
Often 32 21.3
Sometimes 41 27.3
Rarely 30 20
Never 25 16.7
Total 150 100
National Conference on RECENT ADVANCEMENTS IN BUSINESS PRACTICES
Page 70 Nehru Institute of Management Studies, Coimbatore
Nirmala College For Women, Coimbatore
SUSTENANCE OF LARGE OUTREACH MFIs – A COMPARISON OF INDIA
AND BANGLADESH
Abstract Microfinance Institutions (MFIs) are those offering the financial services and banking opportunities to unbankable. The study aims at analyzing and comparing the large outreach MFIs in India and Bangladesh by applying mannwhitney u test. The data have been collected from Microfinance Information Exchange (MIX). The large outreach MFIs of India and Bangladesh have the ability to sustain for long period but comparatively Indian MFIs have better performance in terms of debt to equity ratio, gross loan portfolio to total assets, average loan balance per borrower, average loan balance per borrower/GNI per capita, return on equity, financial revenue to assets, profit margin, yield on gross portfolio (nominal), provision for loan impairment to assets, operating expense by assets, operating expense by loan portfolio, average salary by GNI per capita, loan per staff member, personnel allocation ratio and risk coverage. Key words: Microfinance, Microfinance Institutions, Financial Performance, Large outreach MFIs, Mann withney u test
Introduction and problem statement:
Microfinance has emerged as a viable alternative to reach the hitherto unreached for their social
and economic empowerment through social and financial intermediation. The institutions that are
providing microfinance services such as savings, credit, insurance and remittance services to poor
are called Microfinance Institutions (MFIs). MFIs have come up as a bridge between banks and
poor, whose only source of credit has so far been the money lender. MFIs are commonly known as
“Bank for the poor”. In some countries, MFIs are already numerous and in aggregate serve a large
number of clients, manage a significant loan portfolio, and hold an important share of financial
assets of poor people. MFIs play a significant role in financial sector development, and thereby,
overall development.
India and Bangladesh are two developing economies in the world and poverty is a common
problem in these two countries. It becomes imperative to formulate specific situational poverty
alleviation policies and programmes for generation of minimum level of income for rural poor
which forms substantial percentage of national population in developing societies. Microfinance is
an option to resolve this problem of poor people. Bangladesh has been the birth place of
microfinance and also pioneer in the world for applying microfinance. The microfinance industry in
India started with informal Self Help Group (SHG) to access the much – needed savings and credit
services in the early 1980‟s and today it has evolved into a vibrant industry exhibiting variety of
business model. Going forward, MFIs are likely to expand their client base and reach out to more
underserved areas of the country. To provide microfinance and other support services MFIs should
be able to sustain for long period. In order to sustain operations, MFIs must generate enough
revenues from financial services to cover their financial and operating cost and in many cases, build
institutional capital through profit. Financial performance becomes a watchword in the governance
Dr.R.Rupa, M.Com., M.Phil., MBA., PGDCA., Ph.D
Associate Professor, SCMS School of Technology and Management
SCMS Campus, Prathapnagar, Muttom
Aluva, Cochin
Vol. 6 Special Issue 1 February 2018 ISSN: 2320-4168
Shanlax International Journal of Commerce Page 71
of MFIs. The present study is an attempt to assess the financial performance of Large Outreach
Microfinance Institutions operating in India and Bangladesh and to make a comparison thereof.
Review of Literature
Befekadu B. Kereta (2007)1, in his study has attempted to investigate MFIs performance in
Ethiopia from outreach and financial sustainability angles and has aimed to identify challenges
faced by MFIs.The secondary data of 27 MFIs has been collected from Association of Microfinance
Institutions and National bank of Ethiopia for the period 2003-07. The primary data has been
collected through representative sample of MFIs i.e., one fourth of MFI operating in country based
on the criterions like convenience to reach, outreach deviation and diversion in major objective.
Simple correlation, econometric analysis technique and descriptive analysis technique has been
employed to analyse the data. The study has found that industry outreach has increased during the
study period on average by 22.9 per cent. The study has concluded that MFIs finds no evidence of
trade-off between outreach and financial sustainability.
K.Awuasabo – Asare, S.K.Annim, A.M.Abane and D.Asare – Minta (2009)2 in their article has
aimed to assess the socio economic status of household clients and non-clients of rural MFIs and
government oriented credit programmes; to assess the level of poverty of household involved in
rural MFIs in relation to national sample of non-clients; and to assess depth of outreach of selected
MFIs. They have used microfinance poverty assessment tool to compute the house hold level
relative poverty the scores based on data of 2704 households comprising of 1104 and 1600 non
clients and clients respectively. The computed scores have unraveled the depth of outreach of each
MFI. The results of study have shown that rural and community banks and the financial NGOs
reached out to all categories of clients ranging from extremely poor in the lowest wealth quintile to
the poor in highest quintile.
Niels Hermes, Robert Lensink and AljarMeesters (2009)3in their study examines whether there has been a
trade-off between outreach to the poor and efficiency of MFIs. They have used stochastic frontier analysis to
examine whether there has been trade-off between outreach poor and efficiency of MFI. The study has been
conducted with sample of 435 MFIs from Africa, East Africa and Pacific, Eastern Europe and Central Asia,
Latin America and Caribbean and South Asia. The data have been collected for the period 1997-2007. Using
the sample of more than 1300 observations, they have found that outreach has negatively related to efficiency
of MFIs that have lower average loan balances, which are a measure of depth of outreach, are also less efficient.
They found evidences showing that MFIs have more women borrower as clients, measure of depth of outreach
has shown less efficient.
BereketZerai and Lalitha Rani (2011)5 in their article titled “Is there a trade-off between outreach
and sustainability of MFIs? Evidence from Indian MFIs” has tried to examine a trade-off between
outreach to the poor and financial sustainability based on the data on 85 Indian MFIs by using
correlation matrix. The study has been based on data reported to mix market during the year 2009.
The indicators, namely, outreach and financial sustainability has been taken for analysis. These have
found that study does not support a tradeoff between outreach and financial sustainability more
specifically the simple correlation between average loan size and operational sustainability has been
found to be weak. The study has revealed that there is a strong positive correlation between the
number of outreach and operational sustainability.
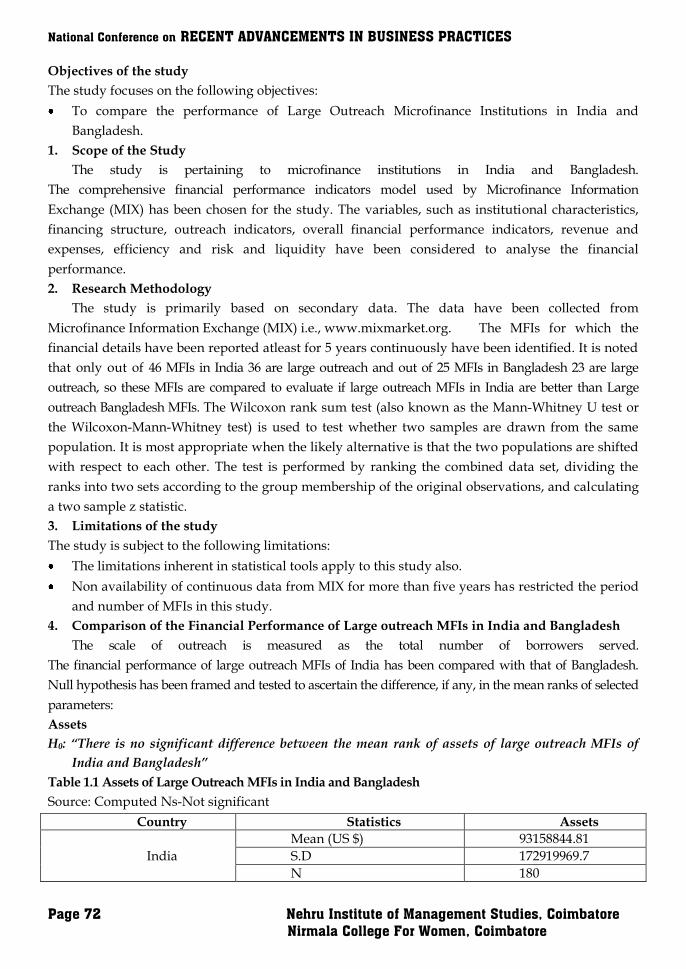
National Conference on RECENT ADVANCEMENTS IN BUSINESS PRACTICES
Page 72 Nehru Institute of Management Studies, Coimbatore
Nirmala College For Women, Coimbatore
Objectives of the study
The study focuses on the following objectives:
To compare the performance of Large Outreach Microfinance Institutions in India and
Bangladesh.
1. Scope of the Study
The study is pertaining to microfinance institutions in India and Bangladesh.
The comprehensive financial performance indicators model used by Microfinance Information
Exchange (MIX) has been chosen for the study. The variables, such as institutional characteristics,
financing structure, outreach indicators, overall financial performance indicators, revenue and
expenses, efficiency and risk and liquidity have been considered to analyse the financial
performance.
2. Research Methodology
The study is primarily based on secondary data. The data have been collected from
Microfinance Information Exchange (MIX) i.e., www.mixmarket.org. The MFIs for which the
financial details have been reported atleast for 5 years continuously have been identified. It is noted
that only out of 46 MFIs in India 36 are large outreach and out of 25 MFIs in Bangladesh 23 are large
outreach, so these MFIs are compared to evaluate if large outreach MFIs in India are better than Large
outreach Bangladesh MFIs. The Wilcoxon rank sum test (also known as the Mann-Whitney U test or
the Wilcoxon-Mann-Whitney test) is used to test whether two samples are drawn from the same
population. It is most appropriate when the likely alternative is that the two populations are shifted
with respect to each other. The test is performed by ranking the combined data set, dividing the
ranks into two sets according to the group membership of the original observations, and calculating
a two sample z statistic.
3. Limitations of the study
The study is subject to the following limitations:
The limitations inherent in statistical tools apply to this study also.
Non availability of continuous data from MIX for more than five years has restricted the period
and number of MFIs in this study.
4. Comparison of the Financial Performance of Large outreach MFIs in India and Bangladesh
The scale of outreach is measured as the total number of borrowers served.
The financial performance of large outreach MFIs of India has been compared with that of Bangladesh.
Null hypothesis has been framed and tested to ascertain the difference, if any, in the mean ranks of selected
parameters:
Assets
H0: “There is no significant difference between the mean rank of assets of large outreach MFIs of
India and Bangladesh”
Table 1.1 Assets of Large Outreach MFIs in India and Bangladesh
Source: Computed Ns-Not significant
Country Statistics Assets
India
Mean (US $) 93158844.81
S.D 172919969.7
N 180
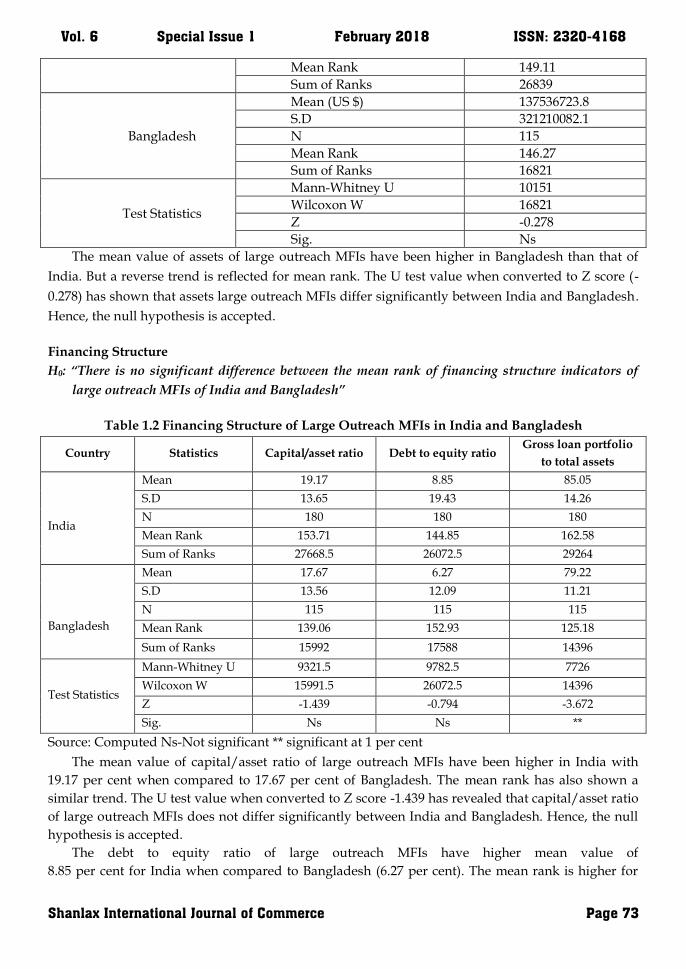
Vol. 6 Special Issue 1 February 2018 ISSN: 2320-4168
Shanlax International Journal of Commerce Page 73
Mean Rank 149.11
Sum of Ranks 26839
Bangladesh
Mean (US $) 137536723.8
S.D 321210082.1
N 115
Mean Rank 146.27
Sum of Ranks 16821
Test Statistics
Mann-Whitney U 10151
Wilcoxon W 16821
Z -0.278
Sig. Ns
The mean value of assets of large outreach MFIs have been higher in Bangladesh than that of
India. But a reverse trend is reflected for mean rank. The U test value when converted to Z score (-
0.278) has shown that assets large outreach MFIs differ significantly between India and Bangladesh.
Hence, the null hypothesis is accepted.
Financing Structure
H0: “There is no significant difference between the mean rank of financing structure indicators of
large outreach MFIs of India and Bangladesh”
Table 1.2 Financing Structure of Large Outreach MFIs in India and Bangladesh
Country Statistics Capital/asset ratio Debt to equity ratio Gross loan portfolio
to total assets
India
Mean 19.17 8.85 85.05
S.D 13.65 19.43 14.26
N 180 180 180
Mean Rank 153.71 144.85 162.58
Sum of Ranks 27668.5 26072.5 29264
Bangladesh
Mean 17.67 6.27 79.22
S.D 13.56 12.09 11.21
N 115 115 115
Mean Rank 139.06 152.93 125.18
Sum of Ranks 15992 17588 14396
Test Statistics
Mann-Whitney U 9321.5 9782.5 7726
Wilcoxon W 15991.5 26072.5 14396
Z -1.439 -0.794 -3.672
Sig. Ns Ns **
Source: Computed Ns-Not significant ** significant at 1 per cent
The mean value of capital/asset ratio of large outreach MFIs have been higher in India with
19.17 per cent when compared to 17.67 per cent of Bangladesh. The mean rank has also shown a
similar trend. The U test value when converted to Z score -1.439 has revealed that capital/asset ratio
of large outreach MFIs does not differ significantly between India and Bangladesh. Hence, the null
hypothesis is accepted.
The debt to equity ratio of large outreach MFIs have higher mean value of
8.85 per cent for India when compared to Bangladesh (6.27 per cent). The mean rank is higher for
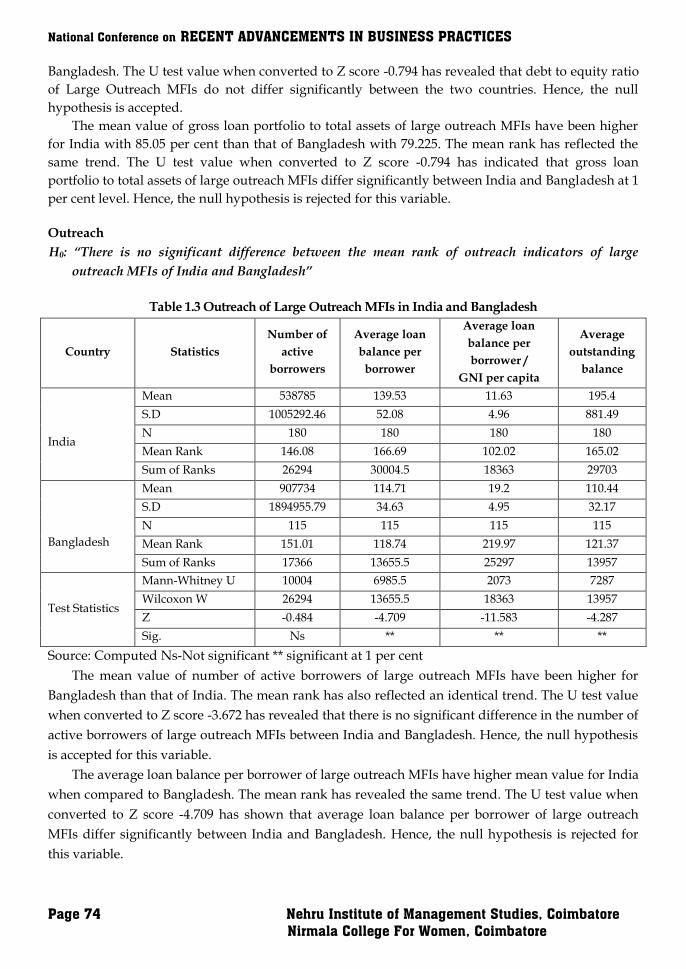
National Conference on RECENT ADVANCEMENTS IN BUSINESS PRACTICES
Page 74 Nehru Institute of Management Studies, Coimbatore
Nirmala College For Women, Coimbatore
Bangladesh. The U test value when converted to Z score -0.794 has revealed that debt to equity ratio
of Large Outreach MFIs do not differ significantly between the two countries. Hence, the null
hypothesis is accepted.
The mean value of gross loan portfolio to total assets of large outreach MFIs have been higher
for India with 85.05 per cent than that of Bangladesh with 79.225. The mean rank has reflected the
same trend. The U test value when converted to Z score -0.794 has indicated that gross loan
portfolio to total assets of large outreach MFIs differ significantly between India and Bangladesh at 1
per cent level. Hence, the null hypothesis is rejected for this variable.
Outreach
H0: “There is no significant difference between the mean rank of outreach indicators of large
outreach MFIs of India and Bangladesh”
Table 1.3 Outreach of Large Outreach MFIs in India and Bangladesh
Country Statistics
Number of
active
borrowers
Average loan
balance per
borrower
Average loan
balance per
borrower /
GNI per capita
Average
outstanding
balance
India
Mean 538785 139.53 11.63 195.4
S.D 1005292.46 52.08 4.96 881.49
N 180 180 180 180
Mean Rank 146.08 166.69 102.02 165.02
Sum of Ranks 26294 30004.5 18363 29703
Bangladesh
Mean 907734 114.71 19.2 110.44
S.D 1894955.79 34.63 4.95 32.17
N 115 115 115 115
Mean Rank 151.01 118.74 219.97 121.37
Sum of Ranks 17366 13655.5 25297 13957
Test Statistics
Mann-Whitney U 10004 6985.5 2073 7287
Wilcoxon W 26294 13655.5 18363 13957
Z -0.484 -4.709 -11.583 -4.287
Sig. Ns ** ** **
Source: Computed Ns-Not significant ** significant at 1 per cent
The mean value of number of active borrowers of large outreach MFIs have been higher for
Bangladesh than that of India. The mean rank has also reflected an identical trend. The U test value
when converted to Z score -3.672 has revealed that there is no significant difference in the number of
active borrowers of large outreach MFIs between India and Bangladesh. Hence, the null hypothesis
is accepted for this variable.
The average loan balance per borrower of large outreach MFIs have higher mean value for India
when compared to Bangladesh. The mean rank has revealed the same trend. The U test value when
converted to Z score -4.709 has shown that average loan balance per borrower of large outreach
MFIs differ significantly between India and Bangladesh. Hence, the null hypothesis is rejected for
this variable.
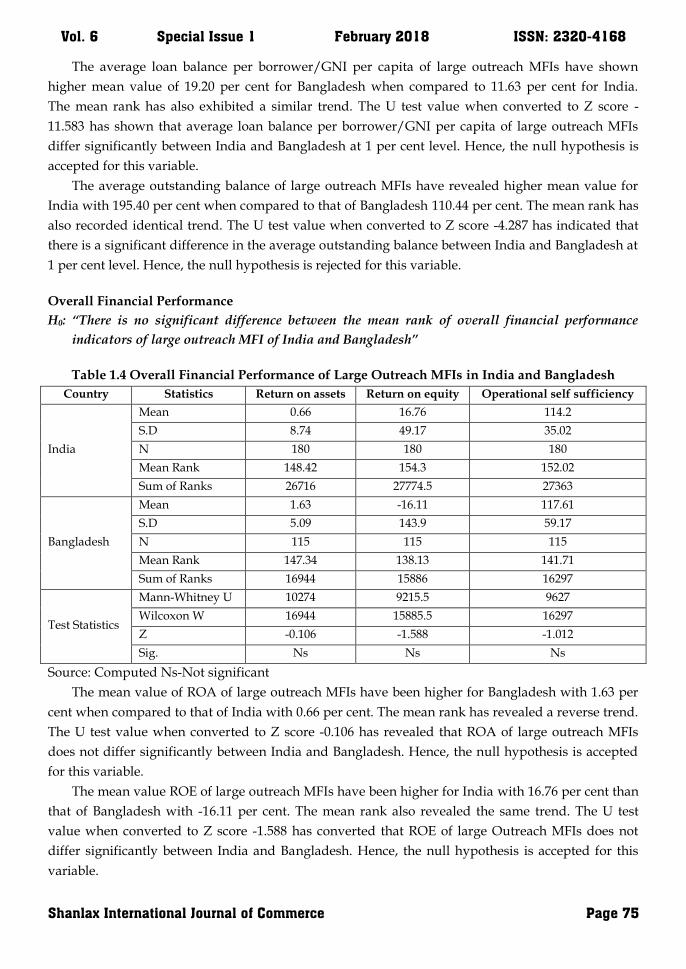
Vol. 6 Special Issue 1 February 2018 ISSN: 2320-4168
Shanlax International Journal of Commerce Page 75
The average loan balance per borrower/GNI per capita of large outreach MFIs have shown
higher mean value of 19.20 per cent for Bangladesh when compared to 11.63 per cent for India.
The mean rank has also exhibited a similar trend. The U test value when converted to Z score -
11.583 has shown that average loan balance per borrower/GNI per capita of large outreach MFIs
differ significantly between India and Bangladesh at 1 per cent level. Hence, the null hypothesis is
accepted for this variable.
The average outstanding balance of large outreach MFIs have revealed higher mean value for
India with 195.40 per cent when compared to that of Bangladesh 110.44 per cent. The mean rank has
also recorded identical trend. The U test value when converted to Z score -4.287 has indicated that
there is a significant difference in the average outstanding balance between India and Bangladesh at
1 per cent level. Hence, the null hypothesis is rejected for this variable.
Overall Financial Performance
H0: “There is no significant difference between the mean rank of overall financial performance
indicators of large outreach MFI of India and Bangladesh”
Table 1.4 Overall Financial Performance of Large Outreach MFIs in India and Bangladesh
Country Statistics Return on assets Return on equity Operational self sufficiency
India
Mean 0.66 16.76 114.2
S.D 8.74 49.17 35.02
N 180 180 180
Mean Rank 148.42 154.3 152.02
Sum of Ranks 26716 27774.5 27363
Bangladesh
Mean 1.63 -16.11 117.61
S.D 5.09 143.9 59.17
N 115 115 115
Mean Rank 147.34 138.13 141.71
Sum of Ranks 16944 15886 16297
Test Statistics
Mann-Whitney U 10274 9215.5 9627
Wilcoxon W 16944 15885.5 16297
Z -0.106 -1.588 -1.012
Sig. Ns Ns Ns
Source: Computed Ns-Not significant
The mean value of ROA of large outreach MFIs have been higher for Bangladesh with 1.63 per
cent when compared to that of India with 0.66 per cent. The mean rank has revealed a reverse trend.
The U test value when converted to Z score -0.106 has revealed that ROA of large outreach MFIs
does not differ significantly between India and Bangladesh. Hence, the null hypothesis is accepted
for this variable.
The mean value ROE of large outreach MFIs have been higher for India with 16.76 per cent than
that of Bangladesh with -16.11 per cent. The mean rank also revealed the same trend. The U test
value when converted to Z score -1.588 has converted that ROE of large Outreach MFIs does not
differ significantly between India and Bangladesh. Hence, the null hypothesis is accepted for this
variable.
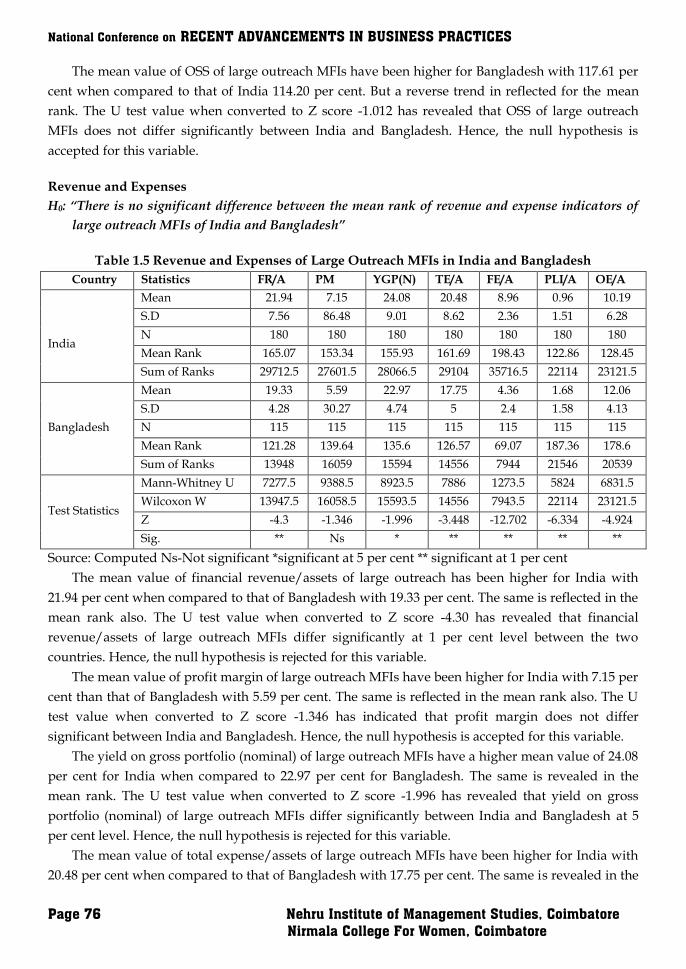
National Conference on RECENT ADVANCEMENTS IN BUSINESS PRACTICES
Page 76 Nehru Institute of Management Studies, Coimbatore
Nirmala College For Women, Coimbatore
The mean value of OSS of large outreach MFIs have been higher for Bangladesh with 117.61 per
cent when compared to that of India 114.20 per cent. But a reverse trend in reflected for the mean
rank. The U test value when converted to Z score -1.012 has revealed that OSS of large outreach
MFIs does not differ significantly between India and Bangladesh. Hence, the null hypothesis is
accepted for this variable.
Revenue and Expenses
H0: “There is no significant difference between the mean rank of revenue and expense indicators of
large outreach MFIs of India and Bangladesh”
Table 1.5 Revenue and Expenses of Large Outreach MFIs in India and Bangladesh
Country Statistics FR/A PM YGP(N) TE/A FE/A PLI/A OE/A
India
Mean 21.94 7.15 24.08 20.48 8.96 0.96 10.19
S.D 7.56 86.48 9.01 8.62 2.36 1.51 6.28
N 180 180 180 180 180 180 180
Mean Rank 165.07 153.34 155.93 161.69 198.43 122.86 128.45
Sum of Ranks 29712.5 27601.5 28066.5 29104 35716.5 22114 23121.5
Bangladesh
Mean 19.33 5.59 22.97 17.75 4.36 1.68 12.06
S.D 4.28 30.27 4.74 5 2.4 1.58 4.13
N 115 115 115 115 115 115 115
Mean Rank 121.28 139.64 135.6 126.57 69.07 187.36 178.6
Sum of Ranks 13948 16059 15594 14556 7944 21546 20539
Test Statistics
Mann-Whitney U 7277.5 9388.5 8923.5 7886 1273.5 5824 6831.5
Wilcoxon W 13947.5 16058.5 15593.5 14556 7943.5 22114 23121.5
Z -4.3 -1.346 -1.996 -3.448 -12.702 -6.334 -4.924
Sig. ** Ns * ** ** ** **
Source: Computed Ns-Not significant *significant at 5 per cent ** significant at 1 per cent
The mean value of financial revenue/assets of large outreach has been higher for India with
21.94 per cent when compared to that of Bangladesh with 19.33 per cent. The same is reflected in the
mean rank also. The U test value when converted to Z score -4.30 has revealed that financial
revenue/assets of large outreach MFIs differ significantly at 1 per cent level between the two
countries. Hence, the null hypothesis is rejected for this variable.
The mean value of profit margin of large outreach MFIs have been higher for India with 7.15 per
cent than that of Bangladesh with 5.59 per cent. The same is reflected in the mean rank also. The U
test value when converted to Z score -1.346 has indicated that profit margin does not differ
significant between India and Bangladesh. Hence, the null hypothesis is accepted for this variable.
The yield on gross portfolio (nominal) of large outreach MFIs have a higher mean value of 24.08
per cent for India when compared to 22.97 per cent for Bangladesh. The same is revealed in the
mean rank. The U test value when converted to Z score -1.996 has revealed that yield on gross
portfolio (nominal) of large outreach MFIs differ significantly between India and Bangladesh at 5
per cent level. Hence, the null hypothesis is rejected for this variable.
The mean value of total expense/assets of large outreach MFIs have been higher for India with
20.48 per cent when compared to that of Bangladesh with 17.75 per cent. The same is revealed in the
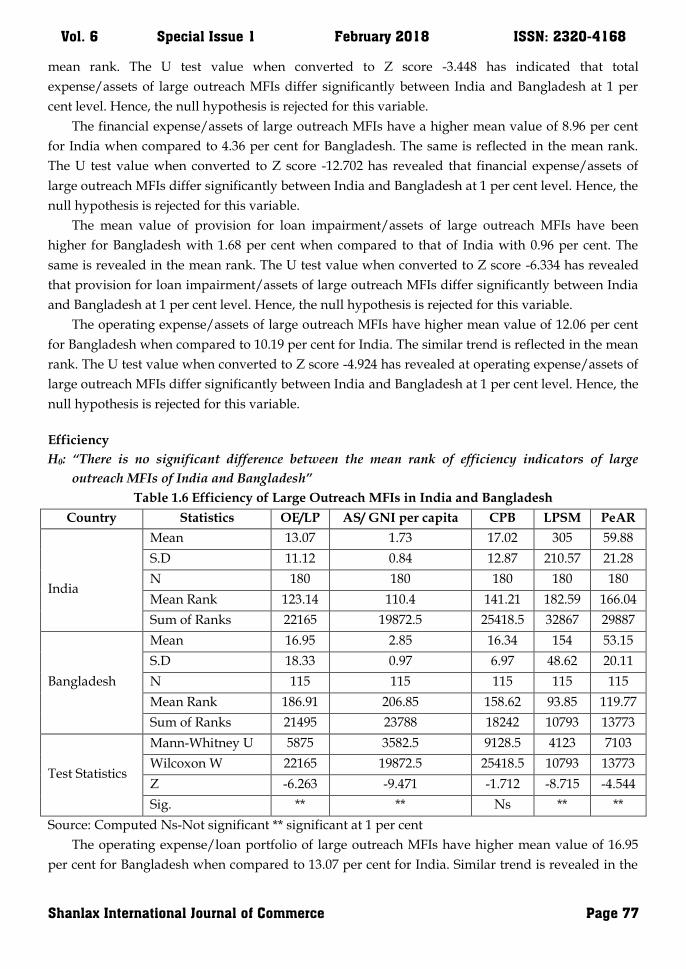
Vol. 6 Special Issue 1 February 2018 ISSN: 2320-4168
Shanlax International Journal of Commerce Page 77
mean rank. The U test value when converted to Z score -3.448 has indicated that total
expense/assets of large outreach MFIs differ significantly between India and Bangladesh at 1 per
cent level. Hence, the null hypothesis is rejected for this variable.
The financial expense/assets of large outreach MFIs have a higher mean value of 8.96 per cent
for India when compared to 4.36 per cent for Bangladesh. The same is reflected in the mean rank.
The U test value when converted to Z score -12.702 has revealed that financial expense/assets of
large outreach MFIs differ significantly between India and Bangladesh at 1 per cent level. Hence, the
null hypothesis is rejected for this variable.
The mean value of provision for loan impairment/assets of large outreach MFIs have been
higher for Bangladesh with 1.68 per cent when compared to that of India with 0.96 per cent. The
same is revealed in the mean rank. The U test value when converted to Z score -6.334 has revealed
that provision for loan impairment/assets of large outreach MFIs differ significantly between India
and Bangladesh at 1 per cent level. Hence, the null hypothesis is rejected for this variable.
The operating expense/assets of large outreach MFIs have higher mean value of 12.06 per cent
for Bangladesh when compared to 10.19 per cent for India. The similar trend is reflected in the mean
rank. The U test value when converted to Z score -4.924 has revealed at operating expense/assets of
large outreach MFIs differ significantly between India and Bangladesh at 1 per cent level. Hence, the
null hypothesis is rejected for this variable.
Efficiency
H0: “There is no significant difference between the mean rank of efficiency indicators of large
outreach MFIs of India and Bangladesh”
Table 1.6 Efficiency of Large Outreach MFIs in India and Bangladesh
Country Statistics OE/LP AS/ GNI per capita CPB LPSM PeAR
India
Mean 13.07 1.73 17.02 305 59.88
S.D 11.12 0.84 12.87 210.57 21.28
N 180 180 180 180 180
Mean Rank 123.14 110.4 141.21 182.59 166.04
Sum of Ranks 22165 19872.5 25418.5 32867 29887
Bangladesh
Mean 16.95 2.85 16.34 154 53.15
S.D 18.33 0.97 6.97 48.62 20.11
N 115 115 115 115 115
Mean Rank 186.91 206.85 158.62 93.85 119.77
Sum of Ranks 21495 23788 18242 10793 13773
Test Statistics
Mann-Whitney U 5875 3582.5 9128.5 4123 7103
Wilcoxon W 22165 19872.5 25418.5 10793 13773
Z -6.263 -9.471 -1.712 -8.715 -4.544
Sig. ** ** Ns ** **
Source: Computed Ns-Not significant ** significant at 1 per cent
The operating expense/loan portfolio of large outreach MFIs have higher mean value of 16.95
per cent for Bangladesh when compared to 13.07 per cent for India. Similar trend is revealed in the
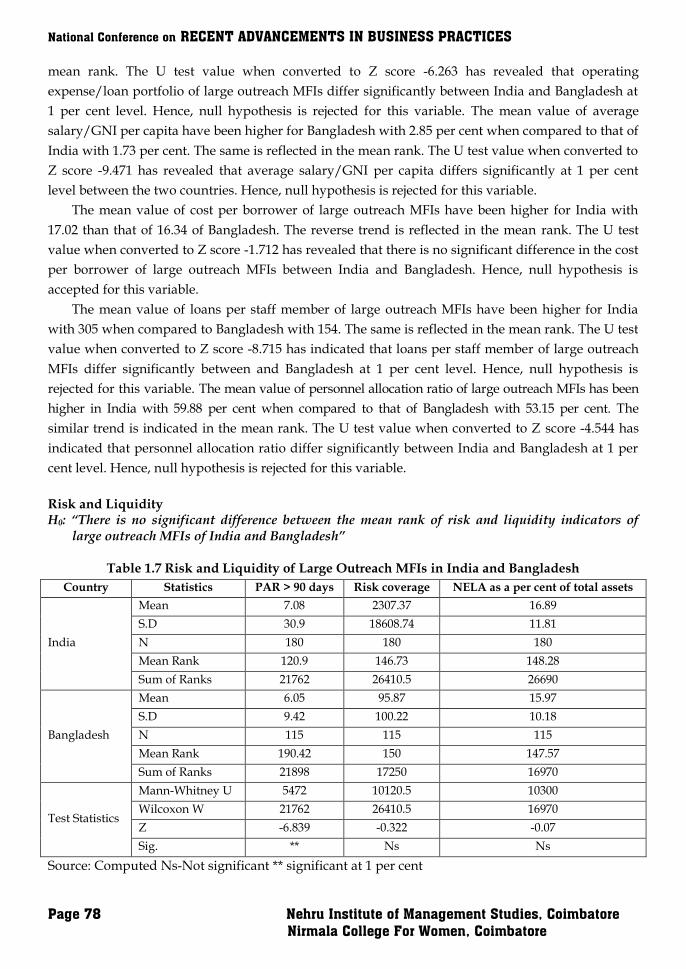
National Conference on RECENT ADVANCEMENTS IN BUSINESS PRACTICES
Page 78 Nehru Institute of Management Studies, Coimbatore
Nirmala College For Women, Coimbatore
mean rank. The U test value when converted to Z score -6.263 has revealed that operating
expense/loan portfolio of large outreach MFIs differ significantly between India and Bangladesh at
1 per cent level. Hence, null hypothesis is rejected for this variable. The mean value of average
salary/GNI per capita have been higher for Bangladesh with 2.85 per cent when compared to that of
India with 1.73 per cent. The same is reflected in the mean rank. The U test value when converted to
Z score -9.471 has revealed that average salary/GNI per capita differs significantly at 1 per cent
level between the two countries. Hence, null hypothesis is rejected for this variable.
The mean value of cost per borrower of large outreach MFIs have been higher for India with
17.02 than that of 16.34 of Bangladesh. The reverse trend is reflected in the mean rank. The U test
value when converted to Z score -1.712 has revealed that there is no significant difference in the cost
per borrower of large outreach MFIs between India and Bangladesh. Hence, null hypothesis is
accepted for this variable.
The mean value of loans per staff member of large outreach MFIs have been higher for India
with 305 when compared to Bangladesh with 154. The same is reflected in the mean rank. The U test
value when converted to Z score -8.715 has indicated that loans per staff member of large outreach
MFIs differ significantly between and Bangladesh at 1 per cent level. Hence, null hypothesis is
rejected for this variable. The mean value of personnel allocation ratio of large outreach MFIs has been
higher in India with 59.88 per cent when compared to that of Bangladesh with 53.15 per cent. The
similar trend is indicated in the mean rank. The U test value when converted to Z score -4.544 has
indicated that personnel allocation ratio differ significantly between India and Bangladesh at 1 per
cent level. Hence, null hypothesis is rejected for this variable.
Risk and Liquidity H0: “There is no significant difference between the mean rank of risk and liquidity indicators of
large outreach MFIs of India and Bangladesh”
Table 1.7 Risk and Liquidity of Large Outreach MFIs in India and Bangladesh
Country Statistics PAR > 90 days Risk coverage NELA as a per cent of total assets
India
Mean 7.08 2307.37 16.89
S.D 30.9 18608.74 11.81
N 180 180 180
Mean Rank 120.9 146.73 148.28
Sum of Ranks 21762 26410.5 26690
Bangladesh
Mean 6.05 95.87 15.97
S.D 9.42 100.22 10.18
N 115 115 115
Mean Rank 190.42 150 147.57
Sum of Ranks 21898 17250 16970
Test Statistics
Mann-Whitney U 5472 10120.5 10300
Wilcoxon W 21762 26410.5 16970
Z -6.839 -0.322 -0.07
Sig. ** Ns Ns
Source: Computed Ns-Not significant ** significant at 1 per cent

Vol. 6 Special Issue 1 February 2018 ISSN: 2320-4168
Shanlax International Journal of Commerce Page 79
The mean value of PAR > 90 days of large outreach MFIs have been higher for India with 7.08
per cent when compared to that of Bangladesh with 6.05 per cent. The reverse trend is reflected in
mean rank. The U test value when converted to Z score-6.839 has revealed that PAR > 90 days of
large outreach MFIs differ significantly between the two countries at 1 per cent level. Hence, null
hypothesis is rejected for this variable.
The risk coverage of large outreach MFIs have higher mean value for India with 2307.37 per cent
when compared to that of Bangladesh with 95.87 per cent. The reverse trend is reflected in the mean
rank. The U test value when converted to Z score -0.322 has revealed that the risk coverage of large
outreach MFIs do not differ significantly between India and Bangladesh. Hence, null hypothesis is
accepted for this variable.
The NELA as a per cent of total assets have higher mean value for India with 16.89 per cent than
that of Bangladesh with 15.97 per cent. The same is reflected in the mean rank. The U test value
when converted to Z score -0.070 has indicated that NELA as a per cent of total assets of large
outreach MFIs does not differ significantly between India and Bangladesh. Hence, null hypothesis is
accepted for this variable.
Findings and Conclusion
A significant difference is observed between the MFIs of both the countries having large
outreach in the mean ranks of the variables, namely, gross loan portfolio to total assets, average loan
balance per borrower, average loan balance per borrower/GNI per capita, average outstanding
balance, financial revenue to assets, yield on gross portfolio (nominal), total expense/assets,
financial expense to assets, provision for loan impairment to assets, operating expense by assets,
operating expense by loan portfolio, average salary by GNI per capita, loan per staff member,
personnel allocation ratio and portfolio at risk greater than 90 days. But the mean ranks of these
MFIs do not significantly differ for assets, capital asset ratio, debt to equity ratio, number of active
borrower, return on assets, return on equity, operational self-sufficiency, profit margin, cost per
borrower, risk coverage and non-earning liquid assets as a per cent of total assets.
The large outreach MFIs of India have revealed a better performance in variables, namely, debt
to equity ratio, gross loan portfolio to total assets, average loan balance per borrower, average loan
balance per borrower/GNI per capita, return on equity, financial revenue to assets, profit margin,
yield on gross portfolio (nominal), provision for loan impairment to assets, operating expense by
assets, operating expense by loan portfolio, average salary by GNI per capita, loan per staff member,
personnel allocation ratio and risk coverage.
The large outreach MFIs of Bangladesh have performed better in variables, namely, assets,
capital assets ratio, number of active borrowers, average outstanding balance, return on assets,
operational self-sufficiency, total expense to assets, financial expense to assets, cost per borrower,
portfolio at risk greater than 90 days and non-earning liquid assets as a per cent of total assets.
References
1. Befekadu.B.Kereta, “Outreach and financial performance analysis of microfinance institutions in
Ethiopia”, African Economic Conference, United Nations Conference Center (UNCC), Ethiopia,
15th – 17th November 2007.

National Conference on RECENT ADVANCEMENTS IN BUSINESS PRACTICES
Page 80 Nehru Institute of Management Studies, Coimbatore
Nirmala College For Women, Coimbatore
2. K.Awusabo – Asare, S.K.Annim, A.M.Abane and D.Asare – Minta, “Who is reaching whom?
Depth of outreach of rural microfinance institutions in Ghana”, International NGO journal, Vol.
4(4), April 2009, pp. 132-141.
3. BereketZerai and Lalitha Rani, “Is there a trade-off between outreach and sustainability of
MFIs? Evidence from Indian MFIs”, Research Journal of Finance and Accounting, Vol. 2, No. 11,
2011.
4. “India Microfinance review 2007”, M-Cril, Mix 2007.
5. “Tracking Financial Performance standards of Microfinance Institutions – An operational
manual”, Technical Tool series 1, published by Sa-Dhan – The Association of Community
Development finance Institutions, August 2003.
6. ADB, “Finance for the poor: Microfinance Development Strategy”, Manila: ADB, 2000.
7. Anand Kumar Rai, “A comparative analysis of the financial performance of microfinance
institutions of India and Bangladesh”, Thesis, Jaypee Business School, July 2012.
8. Frances Sinha, “State of microfinance in India 2009”, Prepared for Institute of Microfinance, as a
part of project on state of microfinance in SAARC countries, 2009.
9. India Top 50 MFIs: A financial awareness initiative of CRISIL, CRISIL Ratings, October 2009.
10. Jivan Kumar Chowdhury, “Microfinance revolution and microfinance services in Indian
perspective”, Banking Finance, Vol. XXI, No.6, June 2008, pp. 5-8.
11. K. SrinivasaRao, “What‟s gone wrong with microfinance?”, Kurushetra - A Journal on Rural
Development, Vol. 59, No.3, Jan 2011, pp. 30 – 32.
12. LetenahEjigu, “Performance analysis of sample microfinance Institutions of Ethiopia”,
International NGO Journal, Vol.4 (5), May 2009, pp. 287 – 298.
13. Microfinance barometer 2013, Convergences, 2013, pg.2.
14. Microfinance in India: A crisis at the bottom of pyramid, Legatum Ventures, May 2011.
15. Microfinance industry in India, Lok Capital, March 2010.
16. MPRA Munich Personal RePEc Archive, “Micro-finance in the India: the changing face of micro-
credit Schemes”, Wanchoo, Rajat, 10th June 2007,
17. N.Tejmani Singh, “Microfinance practices in India: An Overview”, International Review of
Business Research papers, Vol.5, No.5, September 2009, pp.131 -146.
18. Prakash Singh, “Performance analysis of microfinance institutions in India: what drives their
valuation”, Prajnan, Vol.XL, No.1, 2011-12.
19. Sa-Dhan, “Quick report: A snapshot of MFIs in India”, www. Sa-dhan.org, 2007.
20. Zohra Bi and ShyamLalDevPandey, “Comparison of performance of microfinance institutions
with commercial banks in India”, Australian Journal of Business and Management Research,
Vol.1, No.6, September 2011, pp.110-120.
Vol. 6 Special Issue 1 February 2018 ISSN: 2320-4168
Shanlax International Journal of Commerce Page 81
AN ANALYTICAL STUDY ON FDI EQUITY INFLOWS INTO INDIA –
A SECTORAL OVERVIEW
Abstract Foreign Direct Investment is a key element in international economic integration. FDI creates direct, stable and long lasting links between economies. It encourages the transfer of technology and know-how between countries, and allows the host economy to promote its products more widely in international market. FDI is also an additional source of funding for investment and, under the right policy environment; it can be an important vehicle for development. The recent trends in FDI and policy liberalization in China, Eastern Europe, India and in a number of other developing countries is a clear indication of the wide acceptance of the positive role of foreign technology and FDI in the economic development of the developing countries. Keywords: Foreign Direct Investment, technology transfer, Gross domestic Product.
Introduction
The world is a global village and we are in the globalized era. No country is an exception to be
isolated from this system. It is inevitable that the emerging nations will decide the overall economic
growth of the world. The average world Gross Domestic Product (GDP) is 3.1 per cent, at the same
time the Gross Domestic Product of emerging countries are China 11 per cent, Brazil 5.4 per cent,
Russia 8.1 per cent and India 9 per cent. The aggregate of theses countries population is more than
one third of the world population. Any adverse impact on these economies will affect the world
economy also. The emerging countries like Brazil, Russia, India, China, South Africa (BRICs)
Nations are having their own strength exclusively. India is the biggest consumer market and the
more educated younger population is the added advantage. Likewise each and every developing
nation has its own advantage. But to utilize all these available resources, almost all these nations
require more Capital. It is needless to emphasis that the capital formation will always be low in the
emerging nations. The pave way for economic development is looking for Foreign Direct
Investment. India is no exception for this.
India has been a major recipient of FDI Inflows in the majority of sectors. In the post
liberalization era, India is known to have attracted a large amount of Foreign Direct Investment.
Foreign direct investment in India is allowed freely in most of the sectors, except a few, where
specific guidelines are given for foreign direct investment beyond a limit. After liberalization its role
has changed significantly. Progressive liberalization of FDI policy has strengthened investors‟
confidence with opening up of new sectors like integrated township, tea plantation etc. India‟s
capacity as a host nation in attracting FDI has been enhanced during the post reforms period. Earlier
the amount of FDI was low covering some selected sectors, but now the inflow of FDI has grown
Dr.A.Elizabeth
Assistant Professor, Department of Commerce
Nirmala College for Women, Coimbatore
N.Subhalakshmi
Assistant Professor, Department of Commerce (CA) &
PG Department of Commerce
Nirmala College for Women, Coimbatore
National Conference on RECENT ADVANCEMENTS IN BUSINESS PRACTICES
Page 82 Nehru Institute of Management Studies, Coimbatore
Nirmala College For Women, Coimbatore
tremendously and almost in all the sectors of the economy. Revision of FDI policy during 2005
opened the few sectors for the foreign investors to start their business.
Review of Literature
Shalini Aggarwal, Ankush Singla, Ritu Aggarwal (2012), „Foreign Direct Investment in India‟
through this paper the researchers tried to study the need of FDI in India, to exhibit the sector-wise
and year-wise analysis of FDI‟s in India, to rank the sectors based upon highest FDI inflows.
The results show that Mauritius is the country that has invested highly in India followed by
Singapore, Japan, and USA and so on. It can be observed from the analysis of this paper that at the
sectoral level of the Indian economy, FDI has helped to raise the output, productivity and
employment in some sectors especially in service sector. Indian service sector is generating the
proper employment options for skilled workers with high perks. On the other side banking and
insurance sectors help in providing the strength to the economic condition and develop the foreign
exchange system in the country.
S.Harish Babu (2012), „Foreign Direct Investment in India and Its Economic Significance in
Relation to Development of Various Sectors‟ concludes that the most liberal polices for foreign
investment and technology transfer is followed in India. Foreign investment gives the Indian
industry a chance for technological up gradation, access to global managerial skills and practices,
optimum utilization of human capital and natural resources, and to compete efficiently in the
international market.
Amit Saini , Pankaj Madan and S. K. Batra (2014) “Role of FDI Inflow in Indian growth
perspective” in this paper, the researcher examined the sectoral trend of FDI inflows and the major
sources in terms of investing countries of FDI inflows in India during twelve years from 2000 to
2012. In India some of the sectors such as service sector, telecommunication sectors are most
preferred in terms of foreign investment and Mauritius and Singapore are such countries which
revealed full confidence in India concerning to FDI inflow. However, India receives comparatively
much lesser FDI than china and other smaller economies in Asia. To achieve the highest foreign
investment, India needs to develop such an attractive investment avenues and need to frame liberal
economic policies and required to develop the level of infrastructure in India.
Objective of the Study
To study the trend of sector wise analysis of FDI equity inflows into India.
Methodology
Source of data: The study is based on secondary data. The required data have been collected
from the Bulletin of RBI.
Period of the study: The study covers a period of 5 years from 2012 to 2017. The accounting
year starts from 1st April and ends with 31st March.
Tools for Analysis
Percentage Analysis
Trend Analysis
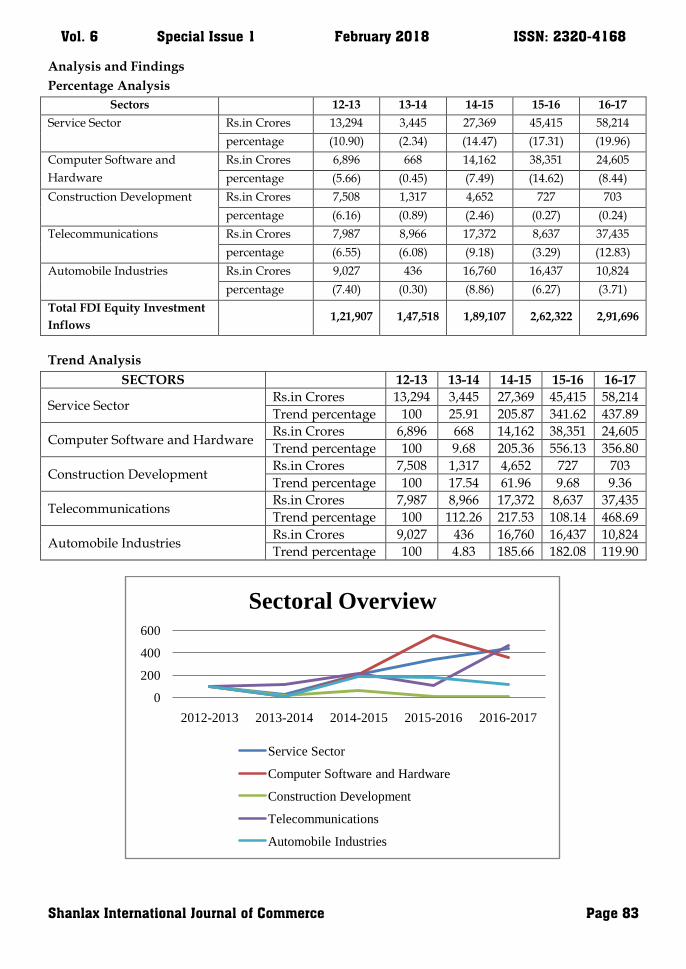
Vol. 6 Special Issue 1 February 2018 ISSN: 2320-4168
Shanlax International Journal of Commerce Page 83
Analysis and Findings
Percentage Analysis
Sectors 12-13 13-14 14-15 15-16 16-17
Service Sector Rs.in Crores 13,294 3,445 27,369 45,415 58,214
percentage (10.90) (2.34) (14.47) (17.31) (19.96)
Computer Software and
Hardware
Rs.in Crores 6,896 668 14,162 38,351 24,605
percentage (5.66) (0.45) (7.49) (14.62) (8.44)
Construction Development Rs.in Crores 7,508 1,317 4,652 727 703
percentage (6.16) (0.89) (2.46) (0.27) (0.24)
Telecommunications Rs.in Crores 7,987 8,966 17,372 8,637 37,435
percentage (6.55) (6.08) (9.18) (3.29) (12.83)
Automobile Industries
Rs.in Crores 9,027 436 16,760 16,437 10,824
percentage (7.40) (0.30) (8.86) (6.27) (3.71)
Total FDI Equity Investment
Inflows 1,21,907 1,47,518 1,89,107 2,62,322 2,91,696
Trend Analysis
SECTORS 12-13 13-14 14-15 15-16 16-17
Service Sector Rs.in Crores 13,294 3,445 27,369 45,415 58,214
Trend percentage 100 25.91 205.87 341.62 437.89
Computer Software and Hardware Rs.in Crores 6,896 668 14,162 38,351 24,605
Trend percentage 100 9.68 205.36 556.13 356.80
Construction Development Rs.in Crores 7,508 1,317 4,652 727 703
Trend percentage 100 17.54 61.96 9.68 9.36
Telecommunications Rs.in Crores 7,987 8,966 17,372 8,637 37,435
Trend percentage 100 112.26 217.53 108.14 468.69
Automobile Industries Rs.in Crores 9,027 436 16,760 16,437 10,824
Trend percentage 100 4.83 185.66 182.08 119.90
0
200
400
600
2012-2013 2013-2014 2014-2015 2015-2016 2016-2017
Sectoral Overview
Service Sector
Computer Software and Hardware
Construction Development
Telecommunications
Automobile Industries
National Conference on RECENT ADVANCEMENTS IN BUSINESS PRACTICES
Page 84 Nehru Institute of Management Studies, Coimbatore
Nirmala College For Women, Coimbatore
In India about 58% of cumulative FDI inflows have been attracted in four sectors; Computer
software and Hardware, Services sector, Telecommunications sector, Automobile industries, and the
remaining FDI inflows were received by rest of economy during 2012 to 2017. Among all, Service
sector remained on top priority for investment in India on account of low cost of labour force and
wide gap between demand and supply of financial services.
Conclusion
There is a global race for attracting FDI in all developed and developing countries of the world.
Although, the developing countries need to modify the level of educational, technological and
infrastructure background to promote the FDI, India has observed a remarkable growth in the flow
of FDI in the last one decade. One of the significant reasons to invest in India is the youth of this
country who are brand loyal and more conscious about taste and preference. In India some of the
sectors such as Service sector, Telecommunication sectors are most preferred in terms of foreign
investment. To achieve the highest foreign investment India need to develop such an attractive
investment avenues and need to frame liberal economic policies and required to develop the level of
Infrastructure in India.
References
1. Aggrawal, S., Singla, A., Aggrawal, R. (2012). Foreign direct investment in India. International
Journal of Computational Engineering & Management, 15 (5), Pg. 93-105.
2. S.Harish Babu (2012), Foreign Direct Investment in India and Its Economic Significance in
Relation to Development of Various Sectors. European Journal of Business and Management,
Vol 3, Pg.1-10 ISSN 2222 -2839 (Online).
3. Amit Saini, Pankaj Madan and S. K. Batra (2014), Role of FDI Inflow in Indian growth
perspective. Golden Research Thoughts, Volume -4, Issue – 1, July – 2014, Pg. 1-7,
ISSN 2231-5063.
4. www.dipp.nic.in
5. www.fdi.gov.in
6. www.rbi.org
Vol. 6 Special Issue 1 February 2018 ISSN: 2320-4168
Shanlax International Journal of Commerce Page 85
PERFORMANCE EVALUATION OF SELECT KOTAK EQUITY FUNDS
Abstract Mutual fund is one of the most preferred investment alternatives for the risk avert investors as it offers chance to invest in a diversified, professionally handled portfolio at low cost. With emphasis on increase in domestic savings and increase in investment through capital markets, the need of mutual fund operation has increased tremendously. Mutual fund performs different roles for different constituencies and their primary role is to assist investors in earning an income or building their wealth, by participating in the opportunities available in various securities and markets. Key words: Mutual fund, investment, sharpe, beta, standard deviation, portfolio turnover
Introduction
Mutual fund is the most suitable investment vehicle for the common man as it offers an
opportunity to invest in a diversified portfolio. The most common features of the mutual fund unit
are small amount of investments, possibility of higher return per se, low administrative cost and
informed management taking decisions. Mutual fund industry is part of a well regulated
investment environment where the interests of the investors are protected by the regulator. All
funds are registered with SEBI and complete transparency is enforced. Mutual funds can also act as
a market stabilizer, in countering large inflows or outflows from foreign investors. Mutual funds are
therefore viewed as a key participant in the capital market
Review of Literature
Jensen (2011) developed a composite portfolio evaluation technique concerning risk-adjusted
returns. He evaluated the ability of 115 fund managers in selecting securities during the period
1945-1966. Analysis of net returns indicated that 39 funds had above average returns, while 76
funds yielded abnormally poor returns. Using gross returns, 48 funds showed above average
results and 67 funds below average returns. Jensen concluded that, there was very little
evidence that funds were able to perform significantly better than expected as fund managers
were not able to forecast securities price movements.
Garg (2011) examined the performance of top ten mutual funds that was selected on the basis of
previous years return. The study analyzed the performance on the basis of return, standard
deviation, beta as well as Treynor, Jensen and Sharpe indexes. The study also used Carhart‟s
four-factor model for analyzing the performance of funds. The results revealed that Reliance
Regular Saving Scheme Fund had achieved the highest final score and Canara Robeco Infra had
achieved the lowest final score in the one year category
Dr.A.Elizabeth
Assistant Professor, Department of Commerce
Nirmala College for Women, Coimbatore
J.Mary Immaculet Anjalin
Assistant Professor, Department of Commerce (CA) &
PG Department of Commerce
Nirmala College for Women, Coimbatore
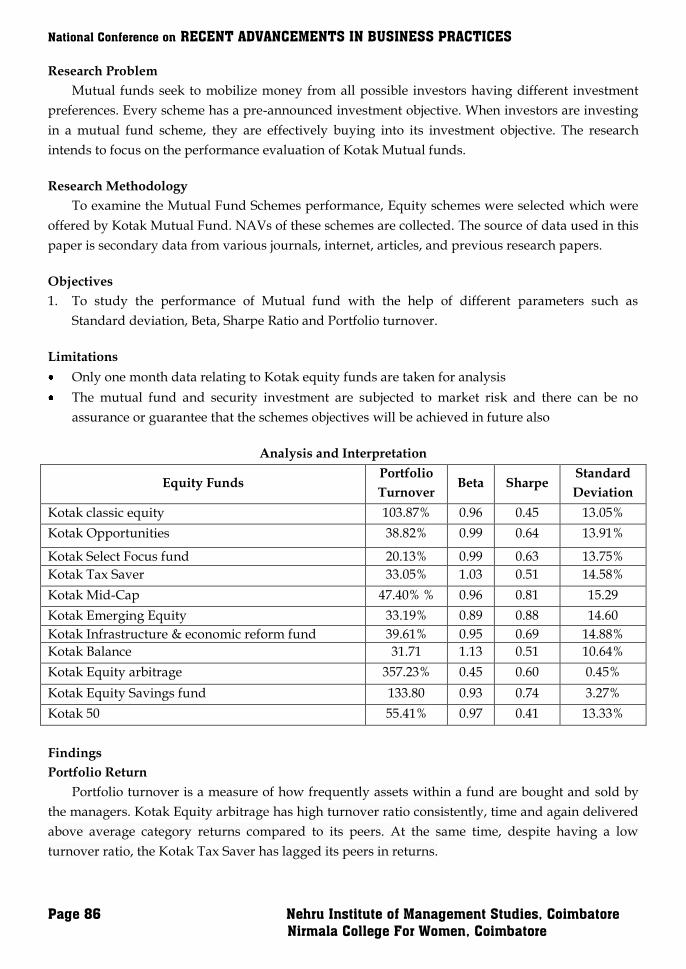
National Conference on RECENT ADVANCEMENTS IN BUSINESS PRACTICES
Page 86 Nehru Institute of Management Studies, Coimbatore
Nirmala College For Women, Coimbatore
Research Problem
Mutual funds seek to mobilize money from all possible investors having different investment
preferences. Every scheme has a pre-announced investment objective. When investors are investing
in a mutual fund scheme, they are effectively buying into its investment objective. The research
intends to focus on the performance evaluation of Kotak Mutual funds.
Research Methodology
To examine the Mutual Fund Schemes performance, Equity schemes were selected which were
offered by Kotak Mutual Fund. NAVs of these schemes are collected. The source of data used in this
paper is secondary data from various journals, internet, articles, and previous research papers.
Objectives
1. To study the performance of Mutual fund with the help of different parameters such as
Standard deviation, Beta, Sharpe Ratio and Portfolio turnover.
Limitations
Only one month data relating to Kotak equity funds are taken for analysis
The mutual fund and security investment are subjected to market risk and there can be no
assurance or guarantee that the schemes objectives will be achieved in future also
Analysis and Interpretation
Equity Funds Portfolio
Turnover Beta Sharpe
Standard
Deviation
Kotak classic equity 103.87% 0.96 0.45 13.05%
Kotak Opportunities
38.82%
0.99
0.64
13.91%
Kotak Select Focus fund 20.13% 0.99 0.63 13.75%
Kotak Tax Saver 33.05% 1.03 0.51 14.58%
Kotak Mid-Cap 47.40% % 0.96 0.81 15.29
Kotak Emerging Equity 33.19% 0.89 0.88 14.60
Kotak Infrastructure & economic reform fund 39.61% 0.95 0.69 14.88%
Kotak Balance 31.71 1.13 0.51 10.64%
Kotak Equity arbitrage 357.23% 0.45 0.60 0.45%
Kotak Equity Savings fund 133.80 0.93 0.74 3.27%
Kotak 50 55.41% 0.97 0.41 13.33%
Findings
Portfolio Return
Portfolio turnover is a measure of how frequently assets within a fund are bought and sold by
the managers. Kotak Equity arbitrage has high turnover ratio consistently, time and again delivered
above average category returns compared to its peers. At the same time, despite having a low
turnover ratio, the Kotak Tax Saver has lagged its peers in returns.

Vol. 6 Special Issue 1 February 2018 ISSN: 2320-4168
Shanlax International Journal of Commerce Page 87
Beta
A beta determines the risk of a fund in comparison to that of its index or bench mark. From the
above calculations Kotak classic equity, Kotak Opportunities, Kotak Select Focus fund, Kotak Tax
Saver, Kotak Mid-Cap, Kotak Infrastructure& economic reform fund, Kotak Balance, Kotak Equity
Savings fund and Kotak 50 are very close to 1 and this means the fund performance is similar to its
benchmark indices. Kotak Equity arbitrage is less than 1 and this means less volatile than its bench
mark.
Sharpe
Sharpe measures excess returns earned over risk free return per unit of risk, higher positive
values of sharpe found in Kotak Opportunities, Kotak Select Focus fund, Kotak Mid-Cap, Kotak
Emerging Equity, Kotak Infrastructure & economic reform fund, Kotak Equity arbitrage, Kotak
Equity Savings fund, Kotak Balance and Kotak Tax Saver among all funds least performer is Kotak
50 and Kotak classic equity.
Standard deviation
Standard deviation of a fund measures the risk by measuring the degree to which the fund
fluctuates in relation to its average return of a fund over a period. From the above table Kotak
Equity arbitrage and Kotak Equity Savings fund are less risk than other funds. Kotak Mid-Cap is of
more risk than others.
Conclusion
In this highly volatile market, small investors should take a mutual fund route to investment in
risky funds to maximize the returns and avail professional help coming with low costs. They
should be dynamic in regrouping the portfolio periodically to invest in the growing segments of
business.
References
Books
1. ”Financial Management” Pearson Publishing company Ltd, Sheeba A kapil
Journals
1. Jensen Michael C., "The Performance of Mutual Funds In the Period 1945-
2. 1964", Journal of Finance, 23, 2011, pp. 389-416.
3. Garg, Sanjay (2011). A Study on Performance Evaluation of Selected Indian Mutual Funds,
International Journal of Innovation Creativity and Management (IJICM), 1(1), 1-10
Website
1. www.moneycontrol.com
2. www.kotakmutualfunds.com
3. www.valueresearch.com
National Conference on RECENT ADVANCEMENTS IN BUSINESS PRACTICES
Page 88 Nehru Institute of Management Studies, Coimbatore
Nirmala College For Women, Coimbatore
MARKET POTENTIAL ANALYSIS ON MILKY MIST PRODUCT
Abstract This article is a part of a specific research output called Quality Influence on the Performance and Competitiveness of the Company. One of the research phases is elaborated in this article; its subject is measuring customer satisfaction with the quality of food products companies. This article aim is to determine the level of customer satisfaction with the quality of food production enterprises. The partial aim of the article is to identify factors that have the greatest influence on the customer satisfaction. The research confirms close relations between customers, quality perception, their satisfaction and the level of fulfilment of their demands. Keywords: Customer satisfaction, quality, food industry, quality management, company performance, competition, repurchase, customer expectation. Introduction
The importance dairying in the country like India hardly needs emphasizing. India has vast
resource of livestock which play an important role in national economy. And also in socioeconomic
developments of millions of rural households. During 1950‟s to 1960‟s India was one of the largest
importers of dairy products. Traditionally milk production in India has been closely integrated with
crop production. India is currently the largest producer of milk in the world. The population
growth, urbanization growth, income growth, high income elasticity demand and changes in food
habits that fueled the increase in milk consumption are expected to continue well into the new
millennium creating the livestock revolution. This chapter focuses on descriptive analysis of the
personal data of 120 sample respondents. It also aims at presenting the profile of the respondents,
problems faced by them in purchasing dairy products and consumer‟s satisfaction towards dairy
products. In this chapter the attitude of the respondents towards various attributes of dairy
products has also been analyzed. Problems of consumers have been analyzed on the basis of five
levels like strongly agree (SA), agree (A), no opinion (NO), disagree (DA) and strongly disagree
(SDA).Consumers‟ satisfaction have been analyzed based on a five point scaling method like highly
satisfied (HS), satisfied (S), neither satisfied nor dissatisfied (NSND),dissatisfied(DS) and highly
dissatisfied (HDS).The study has been entitled as “Consumers” Perception towards milky
mistproducts in Coimbatore district”. In this study the growth of dairy sector and the various
schemes implemented by the Government of India to improve the milk production are discussed.
Also the role of private players in the Indian dairy industry is also analyzed. The name of the
N.Bharath Yugander
PG Scholar, School of Management
Sri Krishna College of Technology, Kovaipudur, Coimbatore
R.Chandana
PG Scholar, School of Management
Sri Krishna College of Technology, Kovaipudur, Coimbatore
Dr.R.Kanthiah Alias Deepak
Assistant Professor, School of Management
Sri Krishna College of Technology, Kovaipudur, Coimbatore
Vol. 6 Special Issue 1 February 2018 ISSN: 2320-4168
Shanlax International Journal of Commerce Page 89
Company is Milky Mist Dairy Food Pvt.Ltd. It belongs to the Consumer staples Sector. It comes
under the Consumer products Industry. It comes under the Packaged food Industry Sub-Industry.
It is established during the year 1990‟s.The corporate address of milky mist is104/9 Erode
Road, Chittode Erode, 638102, INDIA. Their Business Operation is to Offers Premium Quality dairy
products in INDIA. Their Financial (ending year 2013-14) turnover is aroundRs.121 crore.
Their Clients are Reliance Fresh, Metro cash &carry Big Bazaar, MTR, ITC group of hotels, Walmart
,Easy day, Star bazaar, Max, Hyper city, Taj group of Hotels, LeMeridien, Residency, Kannan
departmental stores, Jai surya etc.
Objectives
The objectives of the study are to study the profile of milky mist at Global level. To examine the
profile of milky mist at National level. And to analyze the profile of milky mist at District
(Coimbatore) level. Also to observe the socio-economic profile of the respondents. Then to discuss
the consumption pattern of the respondents towards milk and dairy products of milky mist. Next is
to study the brand preferences and influencing factors of the respondents towards milky mist
products. Also to find out the satisfaction level of the respondents. And also to analyze the problems
faced by the respondents in milky mist products. Finally to offer findings and suggestions for the
development of the milky mist product.
Review of literature
As the largest single dairy producing country, India's output continues to grow strongly in the
3-4 percent range, largely in response to internal demand growth and sustained by increasing
productivity (Gupta, 2007).India accounts for over half the total milk output of Asia. India is
considered as a major milk deficit countries in Asia and Africa. Major importers of milk and dairy
products are Bangladesh, China, Hong Kong, Singapore, Thailand, Malaysia, the Philippines, Japan,
UAE, Oman, and other gulf countries, all located close to India. There is vast potential for the export
of dairy products, the cost of milk production in India being the lowest. Given recent high
international prices, India has started to enter certain export markets; particularly for skimmed milk
powder. Indian companies like Nestle, Amul, Varshney Bhandu Pvt. Ltd., Harbansh Lal Foods,
Shree Vinayak Ingredients, Milky mist etc. Manufacturing and exporting skimmed milk powder.
The major factor influencing production and export of milk products would be the newer uses that
may be developed through R&D support. Milk proteins are being utilized increasingly replacing
animal and vegetable proteins in special bakery products and instant foods. Through the
application of membrane process, milk proteins isolates are being produced. There is scope for
introducing newer plants adopting newer processes by the dairy industry in the country.
Dhanabalan.M.(2009) opined that dairy has an important role in improving the overall
economic conditions of rural India. To maintain the ecological balance, there is need for sustainable
and balanced development of agriculture and allied sectors. From our first plan onwards, planners
have given priority to allied sector for the economic development of the rural sector. Dairy farming
is described as a small industry which provides gainful employment opportunities. It comprises of
about six per cent of the national income. Mandeep Singh and Joshi.A.S.(2008)reported the
economic analysis of dairy farming has been reported for marginal and small farmers in Punjab for
National Conference on RECENT ADVANCEMENTS IN BUSINESS PRACTICES
Page 90 Nehru Institute of Management Studies, Coimbatore
Nirmala College For Women, Coimbatore
the year 2003-04. It has been found that a majority of the farm households are not able to meet their
requirements from their income from crops. The study has suggested to further exploit the potential
of off-farm sources towards meeting the domestic expenditure. Also, the technical efficiency of
crops and dairy farming should be improved to provide more income to farmers. Islam.
S.,Goswami.A. and Mazumdar. D. (2008) have analysed Tehatta-II block of Nadia district in West
Bengal. There were 17 blocks in the Nadia district of which Tehatta-II block was selected purposely.
The block consisted of 7 gram panchayats and 2 gram panchayats namely Palsunda-I and Barnia
were selected randomly. The study revealed that crossbreed cows were more economical and gave
higher yield than the indigenous cows and inclusion of a few crossbreed cows can increase the
income of a dairy entrepreneur and provide gainful and round the year employment.
SintayehuYigrem, et al.(2008)studied about two hundred forty dairy producers. Both rural and
urban producers in the four major towns representing the area in southern Ethiopia, were selected
using a multi-stage sampling techniques, with the objective of characterizing dairy production,
processing/handling, marketing systems as well as to prioritize constraints and opportunities for
dairy development in the area. Dairy marketing systems were studied with the help of topical
guidelines. Dairy producers were interviewed using a pre-tested and structured formal
questionnaire. RadhaKrishnan, Nigam.S, and Shantanu Kumar (2008) in their opinion growing
human population, rising per capita income and increasing urbanization are fuelling rapid growth
in the demand for food and animal origin in developing countries. India possesses the largest
livestock population in the world. The large population of livestock in India productivity of Indian
livestock is low compared to many developing countries. Waghmare P.R. and Hedgire D.N.
(2007)opined that Milk productions in India during 1950-51 was 17 million tones which has reached
78 million tones in 1997-98. Presently India ranks first in the world in milk production. The
Operation Flood Programme was instrumental in dairy development activities. These programmes
are useful in upgrading the standard of living of farmers. Ramakrishnappa.V. and Jagannatha
Rao.R.(2006)opined that the dairy enterprise is an established sector in rural India and is playing a
vital role in generating additional income and employment. In Karnataka, dairy development is a
positive and significant as state contributes towards milk production, marketing, and processing of
various dairy products in India. The microfinance programmes extended in dairy sector are helpful
to take up dairy as main occupation among economically backward communities in the state. In this
paper, an attempt was made to analyze the different aspects of microfinance scheme implemented
by KBCDC.
Rawal and Vikas (2001) analysed that the comparison of caste, education and land holding of
MS farmers with NMS farmers points to a larger proportion of households belonging to the
backward caste, being less educated and holding lower size of land are not able to participate in
dairying. A recent study of two dairy co-operatives in Gujarat argued that inequality in land
ownership, caste, illiteracy and undemocratic functioning of co-operatives are the barriers to entry.
Illiteracy might not be a factor in Kerala but land ownership could be one, as among the lower size
class of land owners smaller proportion seem to be keeping cattle. Gautam Kakaty and
MoromiGogoi (2001) animal husbandry plays a pivotal role in the agrarian economy of India. It is
closely interlinked with the socioeconomic matrix of rural society. The development of livestock

Vol. 6 Special Issue 1 February 2018 ISSN: 2320-4168
Shanlax International Journal of Commerce Page 91
sector has been receiving significant priority in India in the last two to three decades. Dairy sector
contributes significantly in generating employment opportunities and supplementing the income of
small and marginal farmers providing by them food security. Narayana (2001) opined that the work
status of the adult population has no significant difference between MS farmers and NMS farmers
could be observed. Women, however, devoted considerable amount of time for dairying,
irrespective of whether they reported as working or not working and giving the reason as
housewife. Obviously, the categories of work status and employment often used are not very useful
in capturing the work input of women in dairying. Time disposal studies do help to bring this
aspect of work and show that women‟s role in cattle keeping is great. The initiatives undertaken
such as Malabar Rural Development Foundation for improving the quality of dairy farmers are
welcome as they go beyond the landless as their participation in dairying is low. This needs to be
kept in mind while planning welfare interventions.
Research Methodology
Research methodology is a way to study a problem systematically and scientifically. In this we
study the various factors causing the problem along with the logic behind them. It is necessary for
the researcher to know not only the research method or technique but also the methodology.
A questionnaire was prepared for the research into customer satisfaction with the products of milky
mist. The respondents filled out the questionnaire themselves. Its introduction included
identification of the product and product range, while the conclusion included the identification of
the respondent. The main part of the questionnaire, focussed on customer satisfaction, contained 20
questions, 16 of which were close-ended questions (5-point scale), four were semi-open questions
and two were open ended questions. One of the latter was divided into semi-open sub-questions.
The primary data were collected through a questionnaire to analyse the customer satisfaction
towards milky mist. And the Secondary data were collected from books, websites, reports and
pamphlets. The Research design adopted for this study is one of the “descriptive” in the nature.
To measure the customer satisfaction towards milky mist sample “120 customers” were selected for
this study. The data collected from respondents were analyzed using the percentage analysis.
Results and Discussions
From the above table, it is clear that 64.2% of the respondents belong to male category and
35.8% belong to female category.11.8% of the respondents belong to below 20 age group, 31.9%
belong to 20-30 age group, 37.8% of the respondents belong to 30-40 age group and remaining of the
respondents belong to above 40 age group, it is clear that the marital status of the customers is
found that 120 of the respondents 40% belong to unmarried and 60% belong to married. Nearly
9.2%always change their product and 38.3% often change their product, the people who sometimes
change their product are37.5% and the persons who use rarely change their products are 11.7%.,
from the survey it is clear that how much does the customers rate milky mist out of 2.7% of the
respondents give 1 rating to milky mist , 4% of the respondents give 2 rating to milky mist , 20.8% of
the respondents give 3 rating to milky mist, 50.8% of the respondents give 4 rating to milky mist,
21.7% of the respondents give 5 rating to milky mist.34.2% where buy their product in departmental
stores, 37.5% where buy their product in retail shop and 10.8% buy their product in sales persons,
National Conference on RECENT ADVANCEMENTS IN BUSINESS PRACTICES
Page 92 Nehru Institute of Management Studies, Coimbatore
Nirmala College For Women, Coimbatore
9.2% where buy their product from Agencies, 8.3% where buy their product in wholesale store.
12.6% where buy their product in source of family members, 11.8% where buy their product in
neighbours and 12.6% where buy their product from newspaper and 43.7% buy their product in
source of television, 6.7% where buy their product with reference from friends. Nearly 12.5% where
used cheese and butter 22.5%,35.8% are used curd and 15.8% are used pannier and remaining are
used by other products.27.5%always change their product and 20.8% often change their product, the
people who sometimes change their product are 29.2% and the persons who use rarely change their
products are 18.3%. 25% strongly agree there product and 51.7% agree there product, the people
who disagree there product are 12.5% and the persons who use never use their products are
10.8%.Nearly 19.2% strongly agree there product and 53.3% agree there product, the people who
disagree there product are 19.2% and the persons who use never use their products are 8.3%. 16%
strongly agree there product and 25.2% agree their product, the people who disagree there product
are 43.7% and the persons who use never use their products are 15.1%.From the table it is clear that
20.8% very good experience in their product and 51.7% good experience in their product, the people
who have average experience in their product are 15% and the persons who have bad experience
about their products are 10.8%.
From the above table it is clear that 19.2% highly satisfied in their product pricing and 23.3% are
satisfied in their product pricing, the people who are neutral with their product are 29.2% and the
persons who have low satisfaction about their products are 10.8%.And the people who have highly
dissatisfaction are 10.8%. the app usage survey are as follows 14.2%always use the app and 29.2%
often use the app,the people who sometimes use the app are 25.8% and the persons who use rarely
use the app 18.3%. It is observed that 38.3% rated very good and 35.8% rated good satisfaction, the
people rated average are 19.2% and 6.7% of people rated bad satisfaction about the survey. Nearly
20.8%always use the product and 29.2% often use the product, the people who sometimes use the
product are 30.8% and the persons who use rarely use the product 15 %and the persons who use
never use the product4.2 %.
Conclusion
Our nation‟s milk producers have transformed Indian dairying from stagnation to world
leadership. The dairy cooperative movement has been central to the development of dairying in
India. The Indian dairy sector is the largest contributor to the agriculture Gross Domestic Product
(GDP). In terms of output, milk is now the single largest agricultural commodity in India. White
revolution was very well witnessed in India due to the Operation Flood programme which was
initiated in 1970 and the Cooperative Movement also helped us to reach this stage. It provides
employment to millions of rural farmers. Nowadays the rural farmers in India are involved in
dairying as they find it as an alternative source of livelihood. Government of India sponsored a
scheme called 'Strengthening Infrastructure for quality and clean milk production' to strengthen
infrastructure facilities and to ensure clean milk production at village level. Government of India so
far has sanctioned Rs.1224.21 lakhs to Vellore, Villupuram, Trichy, Dharmapuri, Salem,
Kancheepuram- Thiruvallur, Erode, Nilgris and Coimbatore milk Unions for the implementation of
the scheme. “In order to meet the growing demand for milk and to increase the milk production,
Vol. 6 Special Issue 1 February 2018 ISSN: 2320-4168
Shanlax International Journal of Commerce Page 93
Union Government has started a scheme called National Dairy Plan-Phase I for the period of 2011-
12 to 2016-17 with an investment of Rs. 2,242 crores focusing on areas like Production of high
Genetic Merit Bulls, Pilot Model for viable Doorstep A1 Delivery service, Fodder development,
Information and Communication Technology (ICT) for MIS, Semen Production, Ration Balancing
Programme, Village Based Milk Procurement system and Learning and evaluation. National Dairy
Plan(NDP) a six year plan was drafted by the National Dairy Plan for 14 major dairying states viz.
Andhra Pradesh, Bihar, Gujarat, Haryana, Karnataka, Kerala, Madhya Pradesh, Maharashtra,
Odisha, Punjab, Rajasthan, Tamil Nadu, Uttar Pradesh and West Bengal. So, the Government takes
almost all the measures and implements various policies and regulatory laws for the development
of the dairy sector in our country. The private sector plays a pivotal role in the development of
Indian dairy industry as well as produces various value added products to meet the growing
demands of the consumers.
References
1. Dhanabalan.M.(2009),“Productive Efficiency of Milk Production In Tamil Nadu”, Indian Journal
of Marketing, Volume XXXIX, Number 12, P-21.
2. Gautam Kakaty and Moromi Gogoi (2001), “Employment and income opportunity in Dairy
enterprises of Assam-A Case Study”, Agricultural situation in India, Vol.66, No.2, May,P.69.
3. Islam.S. Goswami.A. and Mazumdar.D. (2008) “Comparative Profitability of Cross Breed and
Indigenous Cattle in West Bengal” Indian Res. J.Ext. Edu, Vol. 8(1), Pp- 28-30.
4. Mandeep Singh and Joshi. A.S.(2008),“Economic Analysis of Crop Production and Dairy
Farming on Marginal and Small Farms in Punjab” Agricultural Economics Research Review,
Vol. 21, Issue: 2, P-30.
5. Narayana (2001), “Dairying in Malabar: A Venture of the Landowning based on Women‟s
work?”, Indian journal of Agricultural Economics,Vol.57,No.4,October - December, P.712.
6. Radha Krishnan, Nigam.S. and Shantanu Kumar (2008), “Contribution of livestock in Indian
Scenario”, Agricultural Situation inIndia, Vol. 66, Issue 1, April, Pp. 25-28.
7. Ramakrishnappa.V. and Jagannatha Rao. R.(2006),“Emerging microfinance issuesnin dairy
development: a case study from Karnataka, India”, International Journal of Agricultural
Resources, Governance and Ecology, Vol. 5, Issue 4, Pp. 399-412.
8. Rawal and Vikas (2001),“Participation of the Rural Poor in Dairy Co-operatives: A Case Study
from Gujarat”, Indian Journal of Agricultural Economics, Vol.57, No.4, October December, P.712
9. SintayehuYigrem, et al. (2008), “Dairy production, processing and marketing systems of
Shashemene -Dilla area, South Ethiopia” – abstract of the project on Improving Productivity and
Market Success (IPMS) of Ethiopian farmers project, International Livestock Research Institute
(ILRI), Addis Ababa, Ethiopia.
10. Waghmare.P.R.andHedgire.D.N.(2007),“Econometric analysis of integrated dairy development
Programme in Parbhani District”, Agricultural Situation in India, Vol. 64, Issue 3, Pp. 97-101.
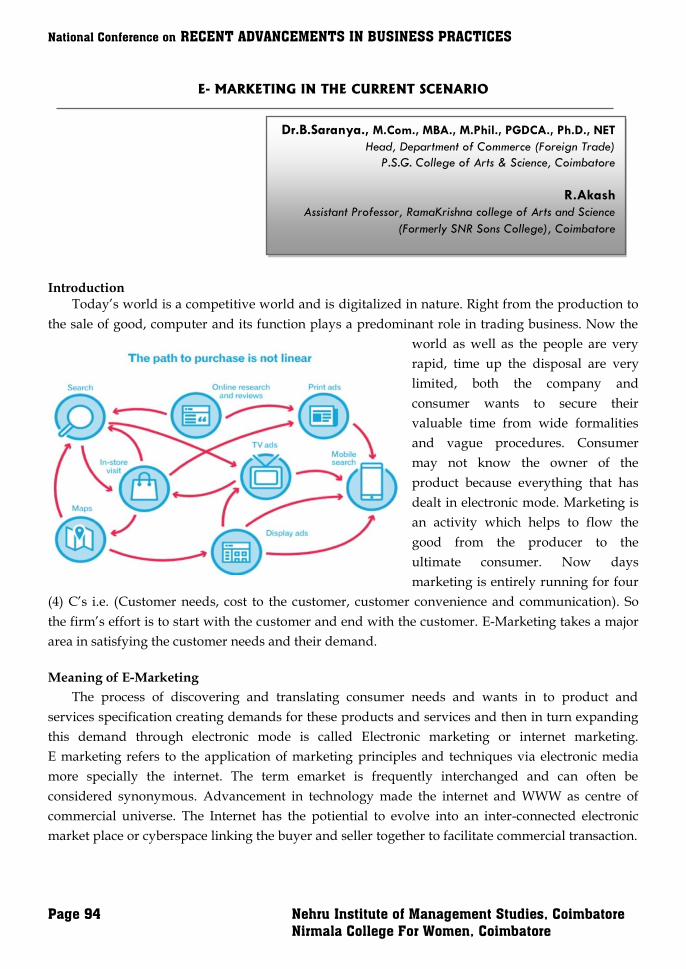
National Conference on RECENT ADVANCEMENTS IN BUSINESS PRACTICES
Page 94 Nehru Institute of Management Studies, Coimbatore
Nirmala College For Women, Coimbatore
E- MARKETING IN THE CURRENT SCENARIO
Introduction Today‘s world is a competitive world and is digitalized in nature. Right from the production to
the sale of good, computer and its function plays a predominant role in trading business. Now the
world as well as the people are very
rapid, time up the disposal are very
limited, both the company and
consumer wants to secure their
valuable time from wide formalities
and vague procedures. Consumer
may not know the owner of the
product because everything that has
dealt in electronic mode. Marketing is
an activity which helps to flow the
good from the producer to the
ultimate consumer. Now days
marketing is entirely running for four
(4) C‘s i.e. (Customer needs, cost to the customer, customer convenience and communication). So
the firm‘s effort is to start with the customer and end with the customer. E-Marketing takes a major
area in satisfying the customer needs and their demand.
Meaning of E-Marketing
The process of discovering and translating consumer needs and wants in to product and
services specification creating demands for these products and services and then in turn expanding
this demand through electronic mode is called Electronic marketing or internet marketing.
E marketing refers to the application of marketing principles and techniques via electronic media
more specially the internet. The term emarket is frequently interchanged and can often be
considered synonymous. Advancement in technology made the internet and WWW as centre of
commercial universe. The Internet has the potiential to evolve into an inter-connected electronic
market place or cyberspace linking the buyer and seller together to facilitate commercial transaction.
Dr.B.Saranya., M.Com., MBA., M.Phil., PGDCA., Ph.D., NET
Head, Department of Commerce (Foreign Trade)
P.S.G. College of Arts & Science, Coimbatore
R.Akash
Assistant Professor, RamaKrishna college of Arts and Science
(Formerly SNR Sons College), Coimbatore

Vol. 6 Special Issue 1 February 2018 ISSN: 2320-4168
Shanlax International Journal of Commerce Page 95
Definition of E Marketing
―E-Marketing is known as internet marketing, web marketing, or online marketing, E-marketing
is the process of marketing a product or a services using the internet‖
Objectives of E-Marketing
It is known from the words of barker and ans hen that ―the end of all the marketing activities is
the satisfaction of human wants‖. The object of marketing is to make the transaction simple and
deliver the product and service to customer as fast as possible .the following are the aims of E-
Marketing.
Quick Delivery of Product and Services
Marketing aim is to satisfy the needs of the customer there by increasing the sales volume and
profit margin of the firm. E-marketing made that very simple by fast and quick delivery of goods .it
lead to increase in image of the firm in the market. Now days three days is the maximum days for
the delivery of the goods even the company is beyond the country.
Reduce Transaction cost and Intermediaries
Marketing has large number of intermediaries involved in the trading transaction. Right from
the producer door to consumer door there involve innumerous number of intermediates and the
product is handled by many hands. Everyone wants to make profit out of service apart from their
commission. That is why there is a change in price of manufacturing place to the market place.
E- Marketing reduce such constrain by having direct contact with the customer.
Advantages of E Marketing
E-Marketing is much better return on investment when compare to that of traditional
marketing.
As the marketing is done through the internet it eventually reduce the marketing campaign
cost.
Fast result of the campaign
Employer can easily monitor through web tracking capabilities which makes the E-marketing
an efficient one.
Using e marketing viral content can be made by using viral marketing(use of internet to spread
the message.
Types of E Marketing
Article Marketing
Article marketing is a form marketing / advertisement in which company/business writes
articles about their product, services, their company and their core competencies .the basic purpose
of article marketing is to promote their business, increase awareness and to give user some
knowledge based contents. There are two types of article marketing. They are traditional article
marketing and online article marketing. Online article marketing is form of article marketing in
which the content is strategically placed on the internet. Traditional article marketing is a form of
marketing in which newspaper and magazines are used as a medium of marketing.
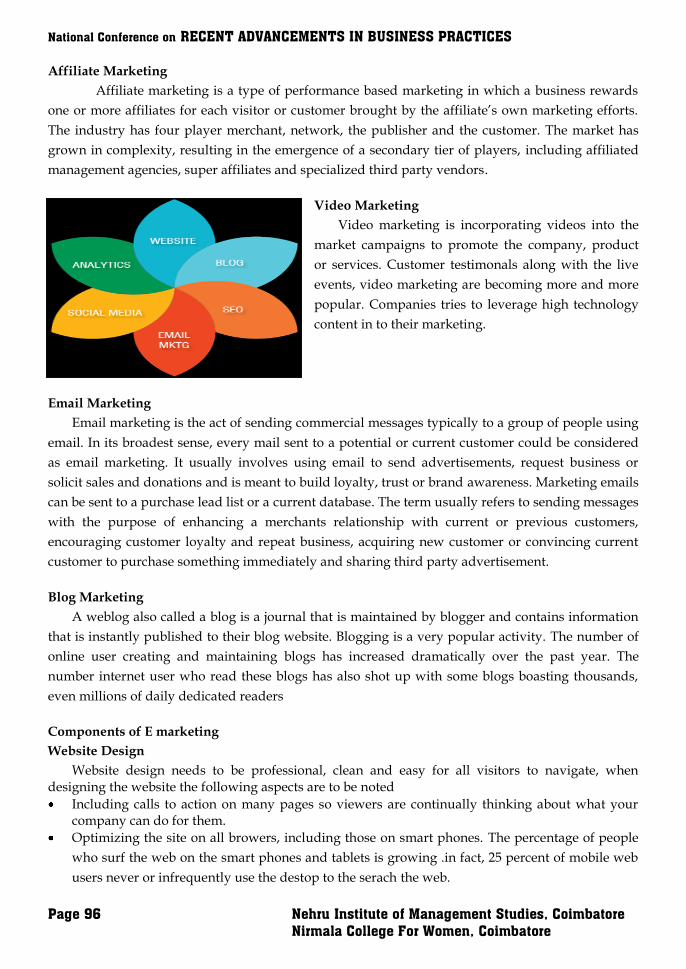
National Conference on RECENT ADVANCEMENTS IN BUSINESS PRACTICES
Page 96 Nehru Institute of Management Studies, Coimbatore
Nirmala College For Women, Coimbatore
Affiliate Marketing
Affiliate marketing is a type of performance based marketing in which a business rewards
one or more affiliates for each visitor or customer brought by the affiliate‘s own marketing efforts.
The industry has four player merchant, network, the publisher and the customer. The market has
grown in complexity, resulting in the emergence of a secondary tier of players, including affiliated
management agencies, super affiliates and specialized third party vendors.
Video Marketing
Video marketing is incorporating videos into the
market campaigns to promote the company, product
or services. Customer testimonals along with the live
events, video marketing are becoming more and more
popular. Companies tries to leverage high technology
content in to their marketing.
Email Marketing
Email marketing is the act of sending commercial messages typically to a group of people using
email. In its broadest sense, every mail sent to a potential or current customer could be considered
as email marketing. It usually involves using email to send advertisements, request business or
solicit sales and donations and is meant to build loyalty, trust or brand awareness. Marketing emails
can be sent to a purchase lead list or a current database. The term usually refers to sending messages
with the purpose of enhancing a merchants relationship with current or previous customers,
encouraging customer loyalty and repeat business, acquiring new customer or convincing current
customer to purchase something immediately and sharing third party advertisement.
Blog Marketing
A weblog also called a blog is a journal that is maintained by blogger and contains information
that is instantly published to their blog website. Blogging is a very popular activity. The number of
online user creating and maintaining blogs has increased dramatically over the past year. The
number internet user who read these blogs has also shot up with some blogs boasting thousands,
even millions of daily dedicated readers
Components of E marketing
Website Design
Website design needs to be professional, clean and easy for all visitors to navigate, when designing the website the following aspects are to be noted
Including calls to action on many pages so viewers are continually thinking about what your company can do for them.
Optimizing the site on all browers, including those on smart phones. The percentage of people
who surf the web on the smart phones and tablets is growing .in fact, 25 percent of mobile web
users never or infrequently use the destop to the serach the web.

Vol. 6 Special Issue 1 February 2018 ISSN: 2320-4168
Shanlax International Journal of Commerce Page 97
Incorporating the relevant keywords naturally to help your search ranking.
Blog
It is known from the statistically, campanies that blog get 55% more visitors than the companies
that don‘t blog. Therefore, your websites should include an integrated blog, which helps you
provide customers with useful, relevant information. When creating a blog, ensure that it is:
Easy reader to subscribe through RSS and email
Easy to share through social media.
Easy to interact with you by commenting on posts.
Search Engine Optimization
Many potential customers starts at the serachengines when they need what you sell. To be
found, you must use search engine optimization techniques to help your website, blog and social
media accounts rank high in the search enginees. Follows these steps in your marketing strategy:
Email Marketing
Email marketing is a great way to stay in front of your customers. We must Pay attention to:
Creating a quality design for your email template so it ties in with the look and feel of your
website, completing a comprehensive marketing strategy.
Providing useful, relevant information through email on a regular basis to help you convert
potentials into customers.
Social Media Presence
Facebook, Twitter, Linkedin, YouTube, and Google+ are not just for individuals. They have
several major advantages for businesses:
Provide an opportunity to create a community around your company through interaction with
the people who are interested in you.
Help you remain on people’s radars by posting status updates, media, blog posts, and
information about your company regularly.
Allow you to reach exponential numbers of people at a very minimal cost because of the viral
nature of these networks.
Analytics
Measuring the results and trends of your website, blog, email campaigns, search engine
ranking, and social media reach plays a crucial role in any online marketing strategy. The most
important metrics to measure include:
Website: Site visitors, page views, pages per visit, average time on the site, bounce rate, top
landing and exit pages, top content, leads & conversions.
Blog: Subscribers, views / visitors, conversions, comments, clicks, rank, inbound links, social
media shares.
SEO: Page rank, # of indexed pages, # of inbound links, # of keywords sending traffic to your
site, long-tail keyword rank & opportunities.
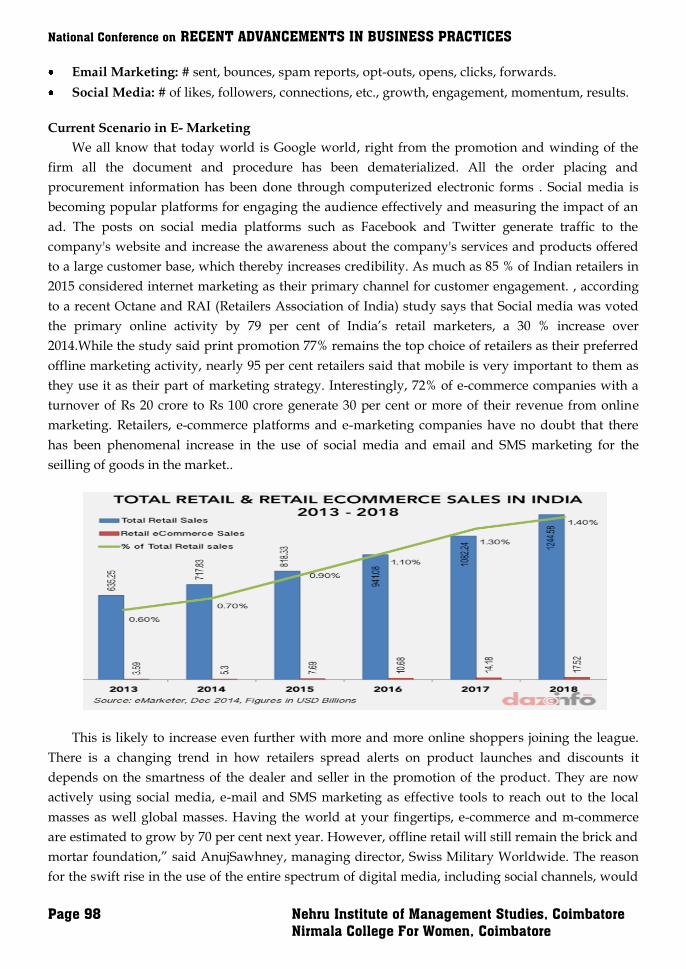
National Conference on RECENT ADVANCEMENTS IN BUSINESS PRACTICES
Page 98 Nehru Institute of Management Studies, Coimbatore
Nirmala College For Women, Coimbatore
Email Marketing: # sent, bounces, spam reports, opt-outs, opens, clicks, forwards.
Social Media: # of likes, followers, connections, etc., growth, engagement, momentum, results.
Current Scenario in E- Marketing
We all know that today world is Google world, right from the promotion and winding of the
firm all the document and procedure has been dematerialized. All the order placing and
procurement information has been done through computerized electronic forms . Social media is
becoming popular platforms for engaging the audience effectively and measuring the impact of an
ad. The posts on social media platforms such as Facebook and Twitter generate traffic to the
company's website and increase the awareness about the company's services and products offered
to a large customer base, which thereby increases credibility. As much as 85 % of Indian retailers in
2015 considered internet marketing as their primary channel for customer engagement. , according
to a recent Octane and RAI (Retailers Association of India) study says that Social media was voted
the primary online activity by 79 per cent of India‘s retail marketers, a 30 % increase over
2014.While the study said print promotion 77% remains the top choice of retailers as their preferred
offline marketing activity, nearly 95 per cent retailers said that mobile is very important to them as
they use it as their part of marketing strategy. Interestingly, 72% of e-commerce companies with a
turnover of Rs 20 crore to Rs 100 crore generate 30 per cent or more of their revenue from online
marketing. Retailers, e-commerce platforms and e-marketing companies have no doubt that there
has been phenomenal increase in the use of social media and email and SMS marketing for the
seilling of goods in the market..
This is likely to increase even further with more and more online shoppers joining the league.
There is a changing trend in how retailers spread alerts on product launches and discounts it
depends on the smartness of the dealer and seller in the promotion of the product. They are now
actively using social media, e-mail and SMS marketing as effective tools to reach out to the local
masses as well global masses. Having the world at your fingertips, e-commerce and m-commerce
are estimated to grow by 70 per cent next year. However, offline retail will still remain the brick and
mortar foundation,‖ said AnujSawhney, managing director, Swiss Military Worldwide. The reason
for the swift rise in the use of the entire spectrum of digital media, including social channels, would
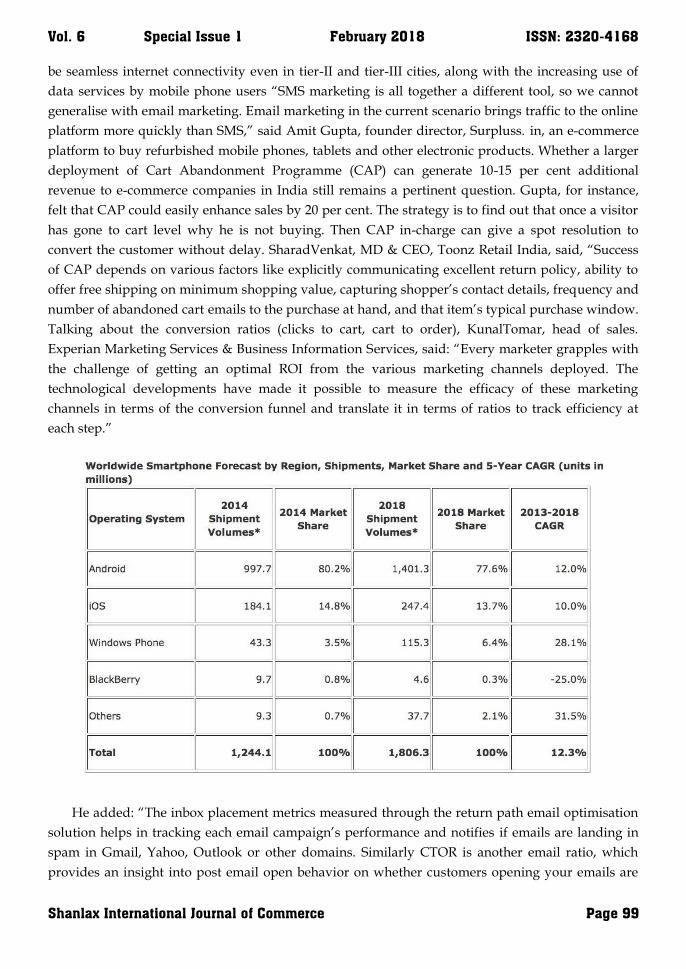
Vol. 6 Special Issue 1 February 2018 ISSN: 2320-4168
Shanlax International Journal of Commerce Page 99
be seamless internet connectivity even in tier-II and tier-III cities, along with the increasing use of
data services by mobile phone users ―SMS marketing is all together a different tool, so we cannot
generalise with email marketing. Email marketing in the current scenario brings traffic to the online
platform more quickly than SMS,‖ said Amit Gupta, founder director, Surpluss. in, an e-commerce
platform to buy refurbished mobile phones, tablets and other electronic products. Whether a larger
deployment of Cart Abandonment Programme (CAP) can generate 10-15 per cent additional
revenue to e-commerce companies in India still remains a pertinent question. Gupta, for instance,
felt that CAP could easily enhance sales by 20 per cent. The strategy is to find out that once a visitor
has gone to cart level why he is not buying. Then CAP in-charge can give a spot resolution to
convert the customer without delay. SharadVenkat, MD & CEO, Toonz Retail India, said, ―Success
of CAP depends on various factors like explicitly communicating excellent return policy, ability to
offer free shipping on minimum shopping value, capturing shopper‘s contact details, frequency and
number of abandoned cart emails to the purchase at hand, and that item‘s typical purchase window.
Talking about the conversion ratios (clicks to cart, cart to order), KunalTomar, head of sales.
Experian Marketing Services & Business Information Services, said: ―Every marketer grapples with
the challenge of getting an optimal ROI from the various marketing channels deployed. The
technological developments have made it possible to measure the efficacy of these marketing
channels in terms of the conversion funnel and translate it in terms of ratios to track efficiency at
each step.‖
He added: ―The inbox placement metrics measured through the return path email optimisation
solution helps in tracking each email campaign‘s performance and notifies if emails are landing in
spam in Gmail, Yahoo, Outlook or other domains. Similarly CTOR is another email ratio, which
provides an insight into post email open behavior on whether customers opening your emails are
National Conference on RECENT ADVANCEMENTS IN BUSINESS PRACTICES
Page 100 Nehru Institute of Management Studies, Coimbatore
Nirmala College For Women, Coimbatore
clicking on links or not. Metrics like ‗Clicks to Cart‘ and ‗Cart to Order‘ will definitely get more
focus with an ever increasing marketing clutter in the e-commerce space.‖ ―With the ongoing
concern on the conversion ratios and the shifting focus to e-marketing and mobile marketing, we
strongly feel that conversion ratios will see sharp focus from e-tailers. While abandoned
merchandise is increasing, various surveys also indicate that a majority of that is going to be
recoverable by savvy online retailers,‖ said PankajAcharya, founder & MD, Mad(e) In India, a
lifestyle brand.
However, Palrecha added there was a need to choose and use social media platforms and email
and SMS marketing tools with the right balance and in the right way to reach the target group
―Email and SMS marketing help business houses to directly reach their target group as a large
number of heads as well as access to email addresses are available on the mobile. Thus the former
two are gaining importance in the digital world. But on the other hand, it has also been noticed that
people tend to ignore such activities as too much mailing and SMS distract the users sometimes,‖
explained K Supriya Nair, CEO, foreseegame.com. She added: ―When a mail is sent to a particular
email address and ignored a number of times, the sender of the mail is automatically marked as
spam and the subsequent mails, therefore, fail to hit the inbox and are diverted to the junk/spam
box. Even in the case of SMS marketing, if a mobile user has opted for DND (do not distrub) service
via his or her service provider, it is not possible for the promotional text messages to hit the inbox.
Again, this leads to failure of such marketing activities.
Conclusion
The present study investigates the various issues and challenges marketing in the scenario.
The customer satisfaction is one of the most important elements of this E marketing and also
providing various online services. Speed, accuracy, efficiency and updating are the element for the
business. All the elements can be done throughinternet marketing. Alerting the date of competition,
now days customer are busy they want everything to be digitalize to simply their commitment.
References
1. PillaiBhavathi,‖ Marketing Management‖, Sultan and company, Newdelhi.
2. www.smartinsights.com
3. www.mbaskool.com
Vol. 6 Special Issue 1 February 2018 ISSN: 2320-4168
Shanlax International Journal of Commerce Page 101
GREEN MARKETING
Abstract We know that environmental issues influence all human activities, few academic disciplines have integrated green issues into their literature. This is especially true of marketing. As society becomes more concerned with the natural environment, businesses have begun to modify their behavior in an attempt to address society's "new" concerns. Some businesses quickly accept the concepts of environmental protection and waste minimization, and have integrated environmental issues into all organizational activities. One business area where environmental issues have received a great deal of discussion in the popular and professional press is marketing. Terms like "Green Marketing" and "Environmental Marketing" appear frequently in the popular press. Many governments are started concentrating towards green marketing activities also that they have attempted to regulate them. One of the biggest problems with the green marketing area is that there has been little attempt to academically examine environmental or green marketing. This paper will attempt about the importance, marketing techniques as well as the advertising methodologies of green marketing. Keywords: green marketing, advertising and environmental benefits Introduction
Green marketing affects all areas of our economy, it does not just lead to environmental
protection but it also create new market and job opportunities. There have been little analysis of the
impact of this new market on the consumers and the environment so far. Majority of people believe
that eco marketing refers to the promotion or advertising of products related to environmental
characteristics. Terms like Phosphate Free, Recyclable, Refillable, Ozone Friendly, and
Environmentally Friendly are some of the things consumers most often associate with green
marketing. Hence green marketing is one of the broader concept that can be applied to for
consumer, industrial and services goods.
Thus green marketing incorporates involved in changes in product modification, production
process, packaging and advertising. Hence defining the green marketing is not an easiest task.
Indeed the terminology used in this area has varied, it includes: Green Marketing, Environmental
Marketing and Ecological Marketing. The American Marketing Association (AMA) held the first
workshop on "Ecological Marketing" in 1975. The proceedings of this workshop resulted in one of
the first books on green marketing entitled "Ecological Marketing" [Henion and Kinnear 1976a].
Importance of Green Marketing
Human has limited resources on the earth, with that they are in need to satisfy the worlds'
unlimited wants. (There is extensive debate as to whether the earth is a resource at man's disposal,
for example, see Gore 1993.) While the question of whether these wants are reasonable or achievable
is important, this issue will not be addressed in this paper. In market societies where there is
"freedom of choice", it has generally been accepted that individuals and organizations have the right
to attempt to have their wants satisfied. As industries also have limited natural resources with that
K.Sathiya Priya
Assistant Professor Department of Business Administration (IB&RM)
PSGR Krishnammal College for Women, Peelamedu Coimbatore
National Conference on RECENT ADVANCEMENTS IN BUSINESS PRACTICES
Page 102 Nehru Institute of Management Studies, Coimbatore
Nirmala College For Women, Coimbatore
they must satisfying these unlimited wants of consumer. Ultimately green marketing looks at how
marketing activities utilize these limited resources, while satisfying consumers wants, both of
individuals and industry, as well as achieving the selling organization's objectives.
Why are Firms using Green Marketing? When looking through the literature there are several suggested reasons for firms increased use
of Green Marketing. Five possible reasons cited are:
Opportunities As we know that all types of consumers, both individual and industrial are becoming more
concerned and aware about the natural environment. In a 1992 study of 16 countries, more than 50%
of consumers in each country, other than Singapore, indicated they were concerned about the
environment [Ottman 1993]. A 1997 study in Australia found that 84.6% of the sample believed all
are responsible to care for the environment. A further 80% of this sample indicated that they had
modified their behavior, including their purchasing behavior, due to environmental reasons [EPA-
NSW 1994].
Social Responsibility Many organizations are beginning to realize that they are the members of the wider community
and therefore must behave in an environmentally responsible. The firms believe that they must
achieve environmental objectives along profit objectives. This results in environmental issues being
integrated into the firm's corporate culture. Firms can follow two methods; 1) using the fact they are
environmentally responsible as a marketing tool; or 2) they can become responsible without
promoting this fact. There are some examples of firms which adopt both the strategies.
Organizations like the Body Shop heavily promote the fact that they are environmentally
responsible. When the behavior is a competitive advantage, the firm was established specifically to
offer consumers environmentally responsible alternatives to conventional cosmetic products. This
philosophy is directly tied to the overall corporate culture than simply being a competitive tool.
Governmental Pressure As with all marketing related activities, government is responsible to "protect" consumers and
society; this protection has significant green marketing implications. Governmental regulations
relating to environmental marketing are designed to protect consumers in several ways, 1) reduce
production of harmful goods or by-products; 2) modify consumer and industry's use and
consumption of goods are not good for consumers; or 3) ensure that all types of consumers have the
ability to evaluate the environmental composition of goods. Governments establish regulations
designed to control the amount of hazardous wastes produced by firms. Many by-products of
production are controlled through the issuing of various environmental licenses, thus modifying
organizational behavior.
Competitive Pressure
In the green marketing area, firms maintain their competitive position to observe competitors
promoting their environmental behaviours and attempt to emulate this behaviour. In some
Vol. 6 Special Issue 1 February 2018 ISSN: 2320-4168
Shanlax International Journal of Commerce Page 103
instances this competitive pressure has caused the whole industry to modify and thus decrease its
detrimental environmental behaviour.
Cost or Profit Issues
Firms are using green marketing in an attempt to address cost or profit related issues. Disposing
of environmentally harmful by-products, such as polychlorinated biphenyl (PCB) contaminated oil
is also becoming increasingly costly and difficult. Therefore the industries that can decrease the
harmful wastes may incur substantial cost savings. When trying to minimize waste, firms are forced
to re-examine their production processes. In these cases they often develop more effective
production processes that not only reduce waste, but also reduce the need for some raw materials.
How to Advertise Green Marketing?
Integrating green initiatives into every aspect of the organization: Companies are trying to
link the corporate brand to efforts in social responsibility, Edwards says—and environmental
stewardship can affect the bottom line as it improves customer relationships. At United Parcel
Service (UPS), for example, new mapping systems enabled a ―No Left Turn‖ rule to eliminate costly
left turns from drivers‘ routes. According to The New York Times, UPS spokeswoman Heather
Robinson reported that the company shortened delivery routes by 28.5 million miles, saving 3
million gallons of gas and reducing carbon emissions by 31,000 metric tons. ―They‘re tying their
brand image to efficiency and environmental savings,‖ Edwards says.
Using ecolabels and ecologos on products or marketing materials: Perhaps the most well-
known ecolabel is the recycling symbol composed of chasing arrows, created in 1970 by Gary
Anderson, who won a graphics and design competition hosted by the Container Corporation of
America. Since then, a significant number of labels have popped up, some of which have
contributed to an industry malfeasance known as ―greenwashing.‖ (See the sidebar, ―The 7 Sins of
Greenwashing.‖) Other widely recognized symbols include the USDA Organic, which signifies the
use of organic ingredients in food; Forest Stewardship Council (FSC) indicates wood and paper
products produced in methods that advocate responsible forestry; and Energy Star identifies home,
building and construction, and electronics that are energy efficient.
Engaging customers in green marketing: Companies are looking to motivate consumers by
encouraging them to participate and engage in the campaign or directly with the product. Marketers
that send out direct mail pieces can put links directing marketers to participate in green programs
online, or do something as simple as ask customers to recycle the mail after reading. Edwards has
seen largely positive feedback from marketers who‘ve attempted to bring customers into the mix;
the number of those doing so is growing but still pretty small, Edwards admits.
Asking and respecting customer choices and preferences: Segmentation is a practice that goes
back to Marketing 101. Companies that are leveraging customer data and respecting their
preferences will inevitably have fewer unnecessary mailings. (For more on this, see this month‘s
Real ROI case study about U.S. Bank.) In October 2007, the DMA launched its Commitment to
Consumer Choice policy, which among other stipulations, requires all DMA members to provide
existing and prospective customers and donors with notice of an opportunity to modify or opt out
National Conference on RECENT ADVANCEMENTS IN BUSINESS PRACTICES
Page 104 Nehru Institute of Management Studies, Coimbatore
Nirmala College For Women, Coimbatore
of commercial communications. By giving consumers this choice, companies are not only acting
environmentally responsible, but also reinforcing their corporate responsibilities.
Adopting a lifecycle approach: Companies are choosing the green materials and products for
their marketing materials and adopting a lifecycle approach that looks at the whole of the campaign,
thereby foreseeing areas of potential waste. Edwards sees more marketers adopting recycled and
FSC-approved papers and printing, vegetable and soy-based inks, smaller formats and trim sizes,
and a reduction in paper use overall. Aromatherapy and skincare treatment provider Decleor now
only uses Programme for the Endorsement of Forest Certification and FSC-certified paper, despite
the fact that it‘s 3 percent to 7 percent more costly.
Shifting to the online space: Digital marketing was projected to reach $25.6 billion in 2009, and
reach $55 billion, 21 percent of all marketing spend, by 2014, according to Forrester Research‘s
United States Interactive Marketing Spend report. Mobile marketing, social media, email marketing,
display advertising, and search marketing the are some of the important channel to be used in green
marketing. More and more companies are requiring that employees remind email recipients to think
about the environment before printing.
Some Problems with Going Green
The industries are facing various challenges while adopting the green marketing. One of the
main problems is that firms using green marketing must ensure that their activities are not
misleading to consumers or industry, and do not breach any of the regulations or laws dealing with
environmental marketing. For example the marketers should ensure that their green marketing
claims.
Clearly state environmental benefits;
Explain environmental characteristics;
Explain how benefits are achieved;
Ensure comparative differences are justified;
Ensure negative factors are taken into consideration; and
Only use meaningful terms and pictures.
Another problem firm face is that the firms are going with consumer concern those are
sometimes not correct. When firms are going socially responsible, they may face some risk that
environmental friendly may found to be harmful in future. Given the limited scientific knowledge at
any point in time, it may be impossible for a firm to be certain they have made the correct
environmental decision.
Conclusion
Green marketing is not only an important tool but also the future is depends upon environment.
It has a positive impact on environmental safety. Because of the growing concern of environmental
protection, there is an emergence of a new market which is the green market. For companies to
survive in this market, they need to go green in all aspect of their business. Consumers want to
identify themselves with companies that are green compliant and are willing to pay a premium for a
Vol. 6 Special Issue 1 February 2018 ISSN: 2320-4168
Shanlax International Journal of Commerce Page 105
greener life style. Green marketing is not only a tool but also a marketing strategy to be followed by
every industry.
References
1. Advertising Age. 1991. "Spurts and Starts: Corporate Role in '90s Environmentalism Hardly
Consistent." Advertising Age 62 (46): GR14-GR16.
2. Azzone, Giovanni and Raffaella Manzini. 1994. "Measuring Strategic Environmental
Performance." Business Strategy and the Environment 3 (1): 1-14.
3. Carlson, Les, Stephen Grove, and Norman Kangun. 1993. "A Content Analysis of Environmental
Advertising." Journal of Advertising 22 (3): 27-38.
4. Charter, Martin (ed). 1992. Greener Marketing. Sheffield, England: Greenleaf Publishing.
5. Coddington, Walter. 1993. Environmental Marketing: Positive Strategies for Reaching the Green
Consumer. New York: McGraw-Hill Inc.
6. Davis, Joel J. 1992. "Ethics and Green Marketing." Journal of Business Ethics 11 (2): 81-87.
7. Davis, Joel J. 1993. "Strategies for Environmental Advertising." Journal of Consumer Marketing
10 (2): 19-36.
8. Debets, Felix M. H. 1989. "Health and Environmental Safety Aspects of DME as an Aerosol
Propellant." Aerosol Age 34 (12): 39-42.
National Conference on RECENT ADVANCEMENTS IN BUSINESS PRACTICES
Page 106 Nehru Institute of Management Studies, Coimbatore
Nirmala College For Women, Coimbatore
ADMINISTRATION BRAND FAIRNESS: CAPITALIZING ON
THE SIGNFINANACE TRADE NAME
Abstract Brand devotion is likewise characterized as the degree of the dedication of shoppers to a specific brand, communicated through their rehash buys, independent of the promoting weight produced by the contending brands. Where customers end up steadfast to mark they influence regular to obtain at some point or item reliability is a consequence of shopper conduct and is influenced by a man's inclinations. Faithful clients will reliably buy items from their favoured brands, paying little heed to comfort or cost. Organizations resolve over and again utilize disparate publicizing procedure to advance faithful buyers, be available close by through devotion program (i.e. rewards projects) or trials and motivating forces (illustration tests and unconditional presents). Keywords: mark unwaveringness, faithful to client Introduction
Brand purchases a similar maker started item or administration more than once after some time
as opposed to purchasing from numerous providers inside the classification" or "how much a
shopper reliably buys a similar brand inside an item class". Attempting to characterize the term,
David A. Aaker considers that brand dedication reflect how likely a purchaser resolve be to change
to another brand, particularly when that brand makes an adjust in value, item includes, its
correspondence or appropriation programs" (Aaker, 1991) 98. Brand steadfastness is additionally
characterized as the degree of the unwaveringness of shoppers to a specific brand, communicated
through their rehash buys, independent of the showcasing weight created by the contending
brands. At the point when buyers wind up devoted to mark name they make constant buy more
than period. Brand steadfastness is an after-effect of customer conduct and is influenced by a man's
inclinations. Steadfast clients will reliably buy items from their favoured brands, paying little mind
to accommodation or cost. Organizations choose routinely utilize disparate showcasing technique to
advance dependable clients, be it is through reliability programs (i.e. rewards projects) or trials and
motivating forces (case tests and unconditional presents). Organizations that effectively develop
faithful clients likewise create mark diplomats – shoppers that will showcase a specific brand and
speak decidedly about it among their companions. This is complimentary expression of-oral hole
advertising for the organization and Brand dependability is a urgent objective and after-effect of
fruitful advertising programs, deals activities and item improvement endeavours. At the centre of
each effective brand is a core of steadfast clients. These "genuine adherents" comprehend the brand
better, buy all the more regularly and prescribe the brand to others. 98. Aaker, D. A., (1991),
"Overseeing Brand Equity: Capitalizing on the Value of a Brand Name", the Free Press, New York,
1991, p. 12. Faithful clients can be and ought to be the establishment for advertising procedure. Past
the benefit they create, faithful clients give the premise to mark advancement and change. The
S.R.Kritikaa, M.Com (CA), M.Phil Research Scholar
Sri Ramakrishna College of arts and Science (Formerly SNRSONS)
Vol. 6 Special Issue 1 February 2018 ISSN: 2320-4168
Shanlax International Journal of Commerce Page 107
brand that dismisses its devoted clients has lost its course, and is defenceless against losing piece of
the overall industry (Assael, 1994)99. As a brand's level of faithful clients goes up, piece of the
overall industry increments and the brand turns out to be more gainful. Offer ascents on the
grounds that those clients who move toward becoming rehash buyers are never again lost to the
opposition. Furthermore, rehash clients are more productive than new clients - pulling in new
clients includes contributing much all the more advertising and limited time reserves. To some
degree, mark dependability is being created and overseen by every single effective brand. In any
case, much of the time unwaveringness itself is considered essentially the consequence of first rate
advertising programs.
The most ideal approach to accomplish more prominent brand reliability is by dealing with the
brand steadfastness process. This includes estimating the drivers of brand dependability, choosing
high effect faithfulness change ventures, and rapidly completing them. is frequently exceptionally
viable. Brand steadfastness is a critical objective and consequence of fruitful showcasing programs,
bargain.
Importance of Brand Loyalty
Brand dependability is a urgent objective and after-effect of fruitful advertising programs, deals
activities and item improvement endeavours. At the centre of each effective brand is a core of
steadfast clients. These "genuine adherents" comprehend the brand better, buy all the more
regularly and prescribe the brand to others. 98. Aaker, D. A., (1991), "Overseeing Brand Equity:
Capitalizing on the Value of a Brand Name", the Free Press, New York, 1991, p. 12. Faithful clients
can be and ought to be the establishment for advertising procedure. Past the benefit they create,
faithful clients give the premise to mark advancement and change. The brand that dismisses its
devoted clients has lost its course, and is defenceless against losing piece of the overall industry
(Assael, 1994)99. As a brand's level of faithful clients goes up, piece of the overall industry
increments and the brand turns out to be more gainful. Offer ascents on the grounds that those
clients who move toward becoming rehash buyers are never again lost to the opposition.
Furthermore, rehash clients are more productive than new clients - pulling in new clients includes
contributing much all the more advertising and limited time reserves. To some degree, mark
dependability is being created and overseen by every single effective brand. In any case, much of
the time unwaveringness itself is considered essentially the consequence of first rate advertising
programs. The most ideal approach to accomplish more prominent brand reliability is by dealing
with the brand steadfastness process. This includes estimating the drivers of brand dependability,
choosing high effect faithfulness change ventures, and rapidly completing them.
Measures of Brand Loyalty There are three center measurements of unwaveringness:
1. Disposition – buyer's states of mind toward the brand all in all or mentalities towards the
proposal of exchanging brands.
2. Conduct – shopper's inclination to purchase the brand over others.
3. Value Sensitivity – purchaser's inclination to be set up to pay more for the brand they are
faithful to. In the beginning times of a market, brands will promote to make separation and
National Conference on RECENT ADVANCEMENTS IN BUSINESS PRACTICES
Page 108 Nehru Institute of Management Studies, Coimbatore
Nirmala College For Women, Coimbatore
move faithfulness and in this manner have the capacity to charge a value premium. Here,
behavioural measures will demonstrate to us how much devotion is really present in the market
at our image and cost affectability measures can enable us to discover how far costs can be
extended. When brands are separated in a more develop showcase, attitudinal measures turn
out to be more essential – as need an early cautioning framework for shoppers who might
consider exchanging – to have the capacity to ensure gained offer of the market. Value
affectability measures are additionally imperative in 99. Assaults. H., "Item Classification and
the Theory of Consumer Behavior", Journal of the Academy of Marketing Science, 1994,
Vol. 2 (4).
4. The more develop commercial centre as brands have built up their situating and are presently
beginning value rivalry all together prevail upon the less brand-disapproved of shoppers.
Building Brand Loyalty Building attitudinal devotion primarily infers mark picture working through broad
communications interchanges, yet additionally here and now advertising exercises, for example,
limited time apparatuses fit as a fiddle a brand's picture. In any case, the transient instruments must
be joined by long haul exercises, (for example, item advancement). Brand trust assumes a critical
part in building and keeping up both attitudinal and behavioural brand faithfulness, its part having
been explored broadly in both B2C and B2B segments (Doney and Cannon, 1997)111. It is shown
that brand trust increase mark unwaveringness and impacts piece of the overall industry and cost
versatility. Building and keeping up mark dedication additionally infers recurrence programs with a
specific end goal to hold clients. Generally, dependability cards can be utilized on request to avoid
mark exchanging, however the procedure is effortlessly replicated and it is difficult to infer a
maintainable upper hand from it, being fundamentally a cautious strategy to avert mark
exchanging. Consumer loyalty is basic keeping in mind the end goal to manufacture mark
reliability, despite the fact that fulfilment does not really create or increment unwaveringness. A few
creators accentuate an awry. Schultz (2000)112 frameworks the significance of fulfilling a client with
a specific end goal to make behavioural steadfastness. Consequently, a fulfilled client has a
tendency to be more faithful to a brand after some time than a client whose buy is caused by
different reasons, for example, time limitations and data shortfalls. Davis (2002)113 declares that
brand faithfulness must be accomplished through a solid brand situating which implies making and
dealing with a one of a kind, dependable, supportable, and esteemed place in the client's brains,
rotating around an advantage that enables the brand to stand separated from its opposition. He
expresses that clients must be approached with deference as in the communication between the
organization and its staff, on one hand, and between the organization and its clients, then again,
ought to be sure, while any discourteous, heartless, or inert conduct ought to be stayed away from.
Approaches to Create Brand Loyalty
Dedication is fabricated in view of connections and a feeling of having a place. Connections are
worked from trust which is originated from discussion, remarkable client benefit, a site or store that
has the item/benefit wanted effortlessly available with a reliable.

Vol. 6 Special Issue 1 February 2018 ISSN: 2320-4168
Shanlax International Journal of Commerce Page 109
1. Be Better Than Anyone: This isn't to state to just have one item yet more to centre around what
you truly improve the situation than any other individual. Being superior to any other
individual does not take into account shoppers to consider choices as they realize that they can't
get what they get with you somewhere else.
2. Having a place: Create a feeling of having a place whether it be through a whether it be by
means of a "group" that is select to your image to give individuals motivation to need to wear
that identification.
3. Belivability: This is more than doing what you say you will or an item that does what you say it
will. Keep in mind that we are discussing how to manufacture devotion with the apparatuses
accessible. It might have an awesome item, message however the advertising materials are
photograph duplicated or a profile that is a layout and not intelligent of brand character.
4. Avaibility: These ties into having a place as though the "right" individual is open, individuals
need to be a piece of that to state that they "know" this individual or the CEO of the
organization contacted clients. This is the place the refinement of the brand comes in as clients
can associate and truly let individuals realize that behind the brand is a client, family man/lady,
and so forth who has lunch, drinks espresso and so forth.
5. Association Ability: This is broadly utilized with slogans and the brand message however there
are times that a brand goes up against another "dialect" that is driven by the gathering of
people. Know this and embrace it (insofar as it is the thing that your image speaks to).
6. Rekashan: Stay over what purchasers are stating and abstain from being stale or changing too
quick. Brands have a long timeframe of realistic usability and those that are over where change
or the move in the mentality of shoppers can adjust and keep up steadfast clients. Be proactive
and not receptive to attempt and force individuals back as once they are gone, they are no more.
Brand devotion is more than the item itself. It needs to perform well, in reality superior to any
elective so there is no option in the brain of the purchaser however put this more in the part of
conduct.
Conclusion
The definition and significance of
brand unwaveringness, measurements
and voting demographics of brand
dedication, methodologies and
reliability writes, mark steadfastness
period, building brand devotion, mark
faithfulness based market division,
overseeing and surveying brand
dependability. These days numerous
individuals purchase items just
purchase utilizing brand name. So mark is getting imperative shape in youthful age. The brand
should influence the clients to purchase over and over.
National Conference on RECENT ADVANCEMENTS IN BUSINESS PRACTICES
Page 110 Nehru Institute of Management Studies, Coimbatore
Nirmala College For Women, Coimbatore
References
1. RSN Pillai Bagavathy, Sanjay Nair Rajiv Nair
2. ―An Examination of the Nature of Trust in Buyer - Seller Relationships‖, Journal of Marketing,
1997, Vol. 61 (2), pp. 17 –the Free Press, New York, 1991
3. www.brand
4. Brand loyalty useful measures
5. Aaker, D. A., (1991), ―Managing Brand Equity: Capitalizing on the Value of a Brand Name‖, the
Free Press, New York, 1991, p. 12