Vol. 40, 2020 - Smart Cities
228
Special Issue SMART, SUSTAINABLE AND FAIR CITIES Vol. 40, 2020
-
Upload
khangminh22 -
Category
Documents
-
view
1 -
download
0
Transcript of Vol. 40, 2020 - Smart Cities
Special IssueSMART, SUSTAINABLE AND FAIR CITIES
Vol. 40, 2020

Geography Research Forum
Geography Research Forum (GRF) is a non-profit open-access, international refereed journal published since 1979 by the Department of Geography and Environmental Development at Ben Gurion University of the Negev in Beer Sheva, Israel. GRF specializes in guest-edited international topic issues dealing with all fields of human geography and multi-disciplinary topics of close relevance. All editorial, production and management staff (including guest editors) serve on a voluntary basis towards a joint contribution to the benefit of the international scientific community. We welcome submissions of original, innovative and theoretically informed proposals for future special issue themes. See inside back cover for manuscript submission guidelines. http://www.geog.bgu.ac.il/grf
Chief Editor: Avinoam MeirBook Review Editor: Yuval Karplus
Associate Editor: Yuval KarplusCartographic Editor: Roni Bluestein-LivnonProduction Manager: Roni Bluestein-Livnon
Editorial BoardJames Anderson The Queen’s University of Belfast, IrelandKay Anderson University of Western Sydeny, AustraliaSergio Conti University of Turin, ItalyDavid J. Eaton The University of Texas at Austin, USANicholas J. Entrikin University of California, USA Jean Hillier Royal Melbourne Institute of Technology, AustraliaFranklin Obeng-Odoom, University of Helsinki, FinlandJonathan D. Mayer University of Washington, USADennis Pringle National University of Ireland, IrelandJames C. Saku Frostburg State University, USAIzhak Schnell Tel Aviv University, IsraelRoger M. Selya University of Cincinnati, USAJohn Sheehan University of Technology Sydney, AustraliaEliahu Stern Ben-Gurion University of the Negev, IsraelErez Tzfadia, Sapir College, IsraelOren Yiftachel Ben-Gurion University of the Negev, IsraelMurray D. Rice University of North Texas, USADavid Varady University of Cincinnati, USA Mark Yaolin Wang University of Melbourne, Australia
Published in cooperation with The Negev Center for Sustainability
Copyright © 2020 Department of Geography and Library of Congress: 88-20161
Environmental DevelopmentBen-Gurion University of the Negev ISSN: 0333-5275Beer-Sheva 84105, Israel ISBN: 0-88738-732-2
The editor and editorial board of Geography Research Forum assume no responsibility for statements and opinions expressed by the contributors.
Geography Research ForumVol. 40, 2020
SPECIAL ISSUESMART, SUSTAINABLE AND FAIR CITIES
Edited by Orli Ronen and Ronit Purian
Contents
Between Means and Ends – Sustainable and Smart Cities in FluxAn Editorial Introduction 1Orli Ronen and Ronit Purian
Planning, Responsive and Adaptive Systems – to What?Smart Urban Futures: Outlining the Smart City Planning Project 19Jenni Partanen
Urban Growth Analyses of Rajkot City Applying Remote-Sensing and Demographic Data 35Shaily Raju Gandhi
A Smart City Anomaly: The Near Becomes Far, The Far Becomes NearRonit Purian 57
Smart Drivers to Urban Sustainability and ResilienceBarriers to Empowering and Engaging Youth in Sustainable Urban Development Endeavours – Experience Gained from Korydallos Municipality, Greece 89Nektaria Marava, Andreas Alexopoulos and Anastasia Stratigea
Urban Heat, Vulnerability, and the Public Realm: Lessons from Tel Aviv-Yafo and Implications for COVID-19 Recovery 108Johanna Lovecchio, Grga Basic and Thaddeus Pawlowski
Smart Tourism Cities and Sustainability 137 Alon Gelbman
Municipal Innovation and Sustainability Readiness—Results from a Study of Mediterranean Cities 149Avigdor Sharon and Orli Ronen
The Good and the BadKeystone Practices to Enable Smart Cities to Flourish 171 Theresa Dirndorfer Anderson
Big, Thick, Small and Short - The Flaws of Current Urban Big Data Trends: A Viewpoint 193Rafi Rich
Book Reviews
Tim Schwanen and the late Ronald van Kempen (eds.), Handbook of Urban Geographyrev. Meirav Aharon-Gutman 207
Hans Skifter Andersen, Ethnic Spatial Segregation in European Countriesrev. David Varady 209
Nicos Komninos and Cristina Kakderi, Smart Cities in the Post-Algorithmic Era: Integrating Technologies, Platforms and GovernanceRev. Aharon Kellerman 213
Ross Dowling and Davis Newsome (eds.) Handbook of Geotourismrev. Alon Gelbman 215
Tamara Neuman, Settling Hebron. Jewish Fundamentalism in a Palestinian Cityrev. Batya Roded 217
Shelley Egoz, Karsten JØrgensen and Deni Ruggeri (eds.) Defining Landscape Democracy: A Path to Spatial Justicerev. Eran Tzin 220
Aharon Kellerman, Automated and Autonomous Spatial Mobilitiesrev. Mark Wilson 223
* Environmental Studies Department, Urban Innovation and Sustainability Lab, Porter School of the Environment and Earth Sciences, Tel Aviv University, Israel. [email protected]; [email protected]
Between Means and Ends – Sustainable and Smart Cities in Flux
Geography Research Forum • Vol. 40 • 2020: 1-17.
Editorial
Ronit Purian* and Orli Ronen*Tel Aviv University
CITIES IN FLUX
The discourse on cities is in essence multidisciplinary and diverse; accordingly, the collection of articles in this special issue on Smart Cities presents an array of domains and methods, including critical perspectives on the tech industry, a the-oretical-pragmatic essay and discussion, along with empirical research, case studies and reviews. Nevertheless, a solid body of knowledge is emerging, based on a shared perspective on the smartness of smart cities, i.e., how technology should be utilized in cities and for what purposes. Much has been said and analysed regarding the no-tion of “smartening up a city” as the new urban frontier. We believe that the dust is settling over strategic deliberations on technology per se, recognizing them as means to addressing critical urban issues. The design of information systems (IS) from multiple viewpoints and the integration of urban data is, therefore, a useful goal to pursue when trying to innovate in attempting to address urban problems. Smart Cities are – or at the very least should be – also sustainable cities and fair cities, and urban planning must account for the costs and benefits to society and the environ-ment in a way that cares for the explicit as well as the implicit knowledge (as defined in Information Systems research), for the unobserved in addition to the observable and measurable (as constructed in psychological studies), and to the undocumented presence of people and entities that lack tags and data specifications (work immi-grance, for example, as described in World Bank, 2020a; 2021).
In this special issue we invited urbanists and researchers to study these interfaces between smart, fair, sustainable and urban; in particular concerning climate change, sustainable development and urban inequality. The International Geosphere-Biosphere Programme (IGBP) analysis of development trends depicts a world in

O. Ronen & R. Purian4
flux. The transitioning to the Anthropocene, a new geological epoch dominated by humans – coined the Great Acceleration – is demonstrated through four macro pro-cesses: technological development, environmental degradation, growing inequality, and population and urban growth. The city has become main stage for all four pro-cesses, which are constantly becoming more intense and incompatible.
With the advent of the 21st century, the Smart City model is gaining recognition as a preferred development framework (Matsumoto et al., 2019). Despite numer-ous broader definitions, the prevalent model is primarily technological, positioning city smartness as a goal instead of a vehicle for urban development. This approach is shared by governments and subsequently translated into budget allocation and policy guidelines. While technological innovation may be a leading driver for eco-nomic growth on the national level, it has not succeeded in overcoming social and environmental challenges on the local levels. On the contrary, economic disparity is growing, housing is less affordable, bio-capacity is deteriorating, and air pollution is increasing.
As the world’s urban population multiplied, environmental resiliency decreased exponentially, CO2 in the atmosphere has surpassed several red lines, and key eco-logical systems are on the brink of collapse and extinction (United Nations, 2018; Ros et al., 2019). The new global development goals, adopted in 2015 (United Nations, 2017), reflect the emerging realization of the situation. Through the new development agenda, nations and global institutions are purporting sustainability as a comprehensive development framework, translated into 17 development goals for 2030.
The 2030 Agenda for Sustainable Development is a plan of action for people, planet and prosperity. All countries and stakeholders, acting in collaborative part-nership, are starting to implement this plan. The 17 Sustainable Development Goals and 169 targets, which are integrated and indivisible, demonstrate the scale and ambition of this new universal agenda, which balances the three dimensions of sus-tainable development: economic, social and environmental.
Underneath the comprehensive framework of sustainable development, goal 11 specifically addresses the urban aspects, advocating for a new urban approach:
…to forge a new model of urban development that integrates all facets of sustainable development, to promote equity, welfare and shared prosperity in an urbanizing world.
The new urban development agenda distinctly specifies the Smart Cities frame-work as a key mean to achieving the SDG goal for cities (United Nations, 2014, 4):
We commit ourselves to adopting a smart-city approach that makes use of opportunities from digitalization, clean energy and technologies, as well as innovative transport technologies, thus providing options for inhabitants to make more environmentally friendly choices and boost sustainable economic growth and enabling cities to improve their service delivery. (United Nations, 2017, 19)
Editorial Introduction 5
These broad commitments adopt a system-thinking, recognizing the complexity of the urban environment and aiming for systemic tools to organize it. Granted that today technology can be a key driver for urban development, the articles in this is-sue of GRF present a variety of perspectives and deliberations on the road to attain Smart City frameworks.
The dilemma of means and end resonated strongly as we, as guest editors, formed the organizing concept for the issue. We strongly believe that the interdisciplinary discussion of urban development and technology is highly relevant to 21st century realities, and to the immediate and critical challenges cities face today.
Our interests as scholars and practitioners of urban sustainability, climate change and technology come together through [on] the discourse of means and ends – be-tween Smart Cities and Sustainable Cities, socially and environmentally. Three themes are explored in this context, across different scales and geographies, creating a wide perspective. The first theme relates to planning, responsive and adaptive sys-tems; the second theme is about the interactions between sustainable development and smart development; and the third data-oriented theme revolves on questions of the value of information, data manipulation, rights and privacy in cities:
Planning, Responsive and Adaptive Systems – Adaptive to What?
1. Smart Urban Futures: Outlining the Smart City Planning Project: Jenni Partanen
2. Urban Growth Analyses of Rajkot City Applying Remote-Sensing and Demographic Data: Shaily Raju Gandhi
3. A Smart City Anomaly: The Near Becomes Far, The Far Becomes Near: Ronit Purian
Smart Drivers to Urban Sustainability and Resilience
4. Urban Heat, Vulnerability, and the Public Realm: Lessons from Tel Aviv-Yafo and Implications for COVID-19 Recovery: Johanna Lovecchio, Grga Basic and Thaddeus Pawlowski
5. Barriers to Empowering and Engaging Youth in Sustainable Urban Development Endeavours – Experience Gained from Korydallos Municipality, Greece: Nektaria Marava, Andreas Alexopoulos and Anastasia Stratigea
6. Smart Tourism Cities and Sustainability: Alon Gelbman 7. Municipal Innovation and Sustainability Readiness—Results from a Study
of Mediterranean Cities: Avigdor Sharon and Orli Ronen
O. Ronen & R. Purian6
The Good and the Bad
8. Keystone Practices to Enable Smart Cities to Flourish: Theresa Dirndorfer Anderson
9. Big, Thick, Small and Short – The Flaws of Current Urban Big Data Trends: A Viewpoint: Rafi Rich
PLANNING, RESPONSIVE AND ADAPTIVE AYSTEMS – TO WHAT?
The notion of a holistic planning system has a long history. Suffice it to note the attempt to grasp various aspects of complexity and cognition in a self-regulated “general purpose support system” (GPSS), applying simulation in virtual reality techniques (Portugali, 2006), and more recently a search for sustainability and qual-ity of life indicators in a decision support system (Grifoni et al., 2018). Yet they do not provide design principles for current urban landscapes.
In addition to a dynamic perspective that “explains how different agents change that physical form over time and how diverse processes are involved in this trans-formation”, a perspective on city structure suggests “insights on prescription for the design of cities” (Oliveira, 2019, 529).
Alfasi and Portugali (2007) identified the weaknesses in current planning and building procedures, and proposed an “Urban Code” to create planning rules out of spatial relations, as well as a planning system that takes into account additional urban elements and the qualitative relationships between them. But what is a proper configuration of land and resources? How should the rules be responsive and adap-tive, and to what? To make a clear statement, the aspiration for a city that is ‘smart’, sustainable and compassionate needs to be grounded in methodologies and tools. The three articles in this section connect the vision with pragmatic means.
Jenni Partanen outlines the Smart City Planning Project, and by that she provides a framework that usefully consolidates the deep theoretical knowledge-base of ur-ban complexity with data sources and tools. As she proclaims, cities are constantly evolving complex systems, and the ongoing digitalization is making them even more complex.
Developing a toolkit for urban scientists is, therefore, an ambitious endeavour, especially as Partanen is determined to innovate on a multi-disciplinary scope, and to be pragmatic, at the same time. By actualizing dynamic urban theories and core urban domains, and coupling them with advanced computational methods, the paper builds modules to ultimately connect complexity and the observable and measurable realization of urban dynamics. Three domains – urban space, mobil-ity, and urban economics – capture most actions and reactions in cities. The Smart City Planning Project is therefore organized around the three domains, coupling theoretical approaches to adaptive systems, urban morphology, urban economy and mobility systems – with the methodological foundations to spatial analyses and
Editorial Introduction 7
functional patterns comprehension in the city. Data mining, and other methods and advanced tools are secondary to the solid rationale of intertwined built structure and urban activities. Mobility depends on cognitive and behavioural processes, human activities design the metabolic city, and self-organizing structures often enslave the agents. Urban activity (process, function) and urban form (pattern, structure) shape each other.
This is not just a general discussion about smart city projects, and yet, by bridging the many perspectives – big data and urban planning, cognition and metabolism – the paper can be meaningful for pedagogy, building interdisciplinary education programs; and insightful for urban research and data science, extending urban ana-lytics to grasp urban theories.
By organizing socio-economic aspects as well as topological analyses, urban mor-phology etc., Partanen opens boundaries to a larger context of inquiry. She is not altering existing contexts but prevents silos in closely related domains and tech-niques. The following paper demonstrates such an integrative approach towards urban research, based on data from multiple sources. Together, the two papers illus-trate how to assemble data from printed documents in municipal archives, satellite photos, cellular phones and travel cards in public transportation, questionnaires and knowledge of lifestyles in different parts of the city.
Shaily Raju Gandhi integrates remote-sensing and demographic data to analyse urban sprawl, a major issue in big cities worldwide. Urban growth analyses of Rajkot City, India, along the history provides a broad view on the socio-economic dynam-ics, geopolitical changes and the impact of technology on the urban area and its rural surroundings.
The conflict between urban progress and urban sustainability can be further in-vestigated based on the methodologies provided in this study, from data provision (combining satellite photos data, collecting printed documents in municipal ar-chives) to comprehensive indicators to monitor urban density.
Each city develops its own unique configuration, and so is the City of Rajkot. Interrelationships between structure and function can be tracked, e.g., whether the spatial configuration of growth is outwarded or into the inner-city. This study de-scribes the related processes that may have shaped urban patterns.
Attempts to better understand the spatial configuration of growth, and the mor-phology that determines function (and vice versa, activities that change structure), refer to underlying processes, to relationships between the economy and social di-versity, etc. Urban planning means shaping environments for human wellbeing and health, and this study presents an approach to scrutinize regional transformations.
The physical structure of cities and regions makes it possible to redefine the di-chotomy between the so-called pragmatic perspective – the economic view that is too often narrowed to financial profit, and is long controlled by self-interests – and the ethical perspective that accounts for environment and society. The tension along this dichotomy is rising in recent years. The role and the responsibility of planning –

O. Ronen & R. Purian8
either urban planning or digital product design and development – is to understand the “physical structures within which people conduct their activities” (Farrell & McNamara, 2018), and by that to address their unspoken wishes.
While the discussion on inequality is complex, incomplete, and unresolved, the discussion can be better regarded in spatial terms, as proposed in the next paper. Ronit Purian shows how segregation and information flow affect each other to pro-vide a theory of smart city form. City structure is changing in certain ways that invite us to explain urban dynamics today. To do that, Purian examines urban morphology through the technological progress and the economic and social influences over the years.
The first part of the paper: “The structure of cities: Increasing irregularity”, re-views what led to the structure of the separated patches, as evident in big cities. Developing from homogeneous city quarters in the first urban models, a gradual de-cline in homogeneity appears in the radial pattern of concentric zones; the sectorial pattern of neighbourhoods alongside employment zone; and the pattern of multiple nuclei for different functions. The evolution of urban morphology since the days of concentric zones is presented to emphasize the continuous increase in heterogene-ity. The transition outward to the suburbs and the decay of city core, and then the transition inward, back to inner city centres – constructs the Patchwork Metropolis (Florida & Adler, 2018) that suggests an order of separation – in economy, in soci-ety, and in urban morphology. Rather than relating, near things were separating and the resulting structure of the metropolis is not the ideal unifying bricolage of diverse communities, inclusive neighbourhoods, and buildings that manifest pluralistic val-ues. On the contrary, while the global cities create a global network of “mega nodes” (Castells, 2010, 2743), the central core and the suburbs become farther apart. The patchwork city structure conveys the “homogeneous initial conditions” (Prigogine & Stengers, 1984, 183) as presented in the third part. The second part of the paper continues the morphological review to show how spatially distinctive are the dif-ferentiated spaces in cities, and to distinguish the spatial separation as opposed to integration measures. While network theories and urban morphology “usually focus solely on spatial integration patterns” (Omer & Goldblatt, 2012, 177), the spatial configuration of wealth and poverty in cities is better captured in levels of spatial separation or segmentation between areas. The spatial partitions, either open spaces (discontinuity in street network) or irregularity in street network (discordance), pertain to socio-economic differentiation, and Omer & Goldblatt (2012) innovated when they proposed to characterize spatial configuration in terms of spatial partitions between adjacent neighborhoods. Since 2012 the paper’s assumption is that, in big cities, moderate variations between areas turn into sharp divide in closer proxim-ity. Features of separation and segregation are assumed to imprint “uncoordinated” city spaces, diverse patterns of discontinuity and discordance in street networks and urban areas. However, spatial integration could bring people closer and increase resi-dential integration. Why does socio-economic differentiation exceed the potential
Editorial Introduction 9
for spatial integration? The spatial structure of the city is the local result of the same sociotechnical dynamics that connect the far globally.
The second part of the paper, “Gentrification patterns vs. displacement disorder”, confronts displacement that transformed urban growth and urban renewal into sharp divide in close proximity. Financialization is at stake, in this case real estate investments that radicalize the nature and scale of spatial polarization and dissimi-larity. High disparities in richer cities are expected, instead of organic growth and renewal by individuals who choose to live in affordable neighbourhoods. Qualities of emergence and rejuvenation characterize old communities. Pleasant urban envi-ronments are those least ordered.
The third part, “Elevations all the way up: Vertices isolated with technology and information”, provides theoretical reasoning to address the transitions towards sepa-ration, and how inevitable is the form of segregation when using the technological aids that change behaviours and fragmentize groups in the society. Three views are presented: Hillier’s ideas on innovation vs. stability – to explain global flows of people and money; Lynch on the time and distance for pedestrians and from differ-ent user perspectives – to clarify the dividing flows of technology; and Prigogine’s analyses on scaling, speed and fluctuations – to specify the effects of local flows. Here Deneubourg’s description anticipates how, in dense environments, clusters of condensed wealth rise in inflexible spaces and tighten up their boundaries to include a homogeneous population.
When each community and social group captures local-routines and worldwide-ties in its own separate condense information flow, the groups – that are intercon-nected within – become disconnected and isolated from each other. The impact of technology on the spatial behaviours is separation both physically (e.g., in naviga-tion, to focus on estimated arrival time to destination, to neglect places we pass by) and digitally (e.g., collaborative filtering in recommender systems, much as eco-chamber in social networks, creates social narratives to different groups). The sepa-rating elements are informational. Urbanism, in this sense, is an expression of the economic forces that dictate the direction, whether dividing or integrating. Spatial behaviour is the symptom and the antidote.
To grasp the isolating nature of the smart city, and the grand view on city struc-ture, the urban processes can be envisioned as the effect of physical forces on bond-ing atoms, where populations experience attraction and repulsion, depending on their size and distance. The digital transmission of information has physical mani-festations. The first is in smart city structure: The spatial structure of the smart city is fragmented in city centres, where extreme wealth and poverty levels appear in close proximity, and towards the periphery the gaps are moderated in lower socioeco-nomic levels and lower entropy. The second is in smart city function: Global con-nectivity is outward-interconnecting but inward-excluding. Recent reports identify wider income inequalities in dense urban areas, and lower social mobility in the longer term (World Bank, 2020a; 2020b; 2021). Current findings on the economic

O. Ronen & R. Purian10
implications of Covid-19 reveal the urban vulnerability in different countries and cities. In addition to the chronic rural poverty, the crisis confirmed that the “emerg-ing global profile of the new poor” is urban.
SMART DRIVERS TO URBAN SUSTAINABILITY AND RESILIENCE
During the last two decades, major cities are indeed more vulnerable, they are exposed to recurring catastrophic disruptions; the attack on the Twin Towers in New York, impacts of Hurricane Katrina and Superstorm Sandy, floods in Bangkok, fires in Melbourne, heatwaves in Paris, and the onslaught of COVID-19 in heavily populated areas, to name just a few. The concentration of people and capital in cit-ies renders them vulnerable (Mpanje, et. al., 2018). According to the UN World’s Cities reports (2016, 2018), 59% of cities with at least 500,000 inhabitants were at risk of exposure to at least one of six types of natural disasters, (cyclones, floods, droughts, earthquakes, landslides and volcanic eruptions); 15% were vulnerable to two or more types of disasters. Floods were the most common potential natural disaster, followed by droughts and cyclones, all anticipated to increase in frequency and intensity due to climate change.
It is therefore not surprising that resilience has become prerequisite for a success-ful city; urban wellbeing as defined by the SDG framework is Resilient, Sustainable and Equitable (SDG11). The concept of resilience evolved from the ecological and environmental sciences. Walker defines it as “the capacity of a system to absorb dis-turbance and reorganize while undergoing change” (Walker et al. 2004, 2). In the context of sustainable development, emphasis is given to the ability of a system to reorganize to an improved, more sustainable state.
The idea has been copiously adopted to the urban sphere. ICLEI – Local Governments for Sustainability, one of the leading urban sustainability networks, and one of the first to make this linkage, put forward the following definition for urban resilience:
A resilient city is prepared to absorb and recover from any shock or stress while maintaining its essential functions, structures, and identity as well as adapting and thriving in the face of continual change. Building resilience requires identifying and assessing hazard risks, reducing vulnerability and exposure, and lastly, increasing resistance, adaptive capacity, and emergency preparedness. (ICLEI, 2019, 5).
The New Urban Agenda (United Nations, 2016), a derivative of the SDG frame-work, transposes these objectives into comprehensive policy guidelines:
City systems must be transformed to encourage healthy, sustainable life and enable the development of communities that can adapt to and prepare for existing/ potential shocks and stresses. [...] Effective management for urban environmental sustainability and resilience potentially provides multiple ben-efits including economic development, more attractive and liveable urban

Editorial Introduction 11
landscapes, and increased human well-being. These are elements to a thriving urban subsystem” (United Nations, 2016, 11-12).
Urban challenges and urban opportunities intertwine to produce sustainability for the community and its individuals. The strong emphasis on resilience, together with urban vulnerability, convey a new sense of urgency in urban policy, especially concerning the expected impacts of climate change.
The Second Assessment Report of the Urban Climate Change Research Network (Rosenzweig et al., 2018) explores the implications of changing climatic conditions on critical urban physical and social infrastructure sectors and inter-sectional con-cerns. The report assesses the main concerns and impacts of climate change, point-ing to a number of climatic phenomena that will directly affect cities:
• Temperatures are rising in cities due to both climate change and the urban heat island effect.
• Mean annual precipitation is projected to change by -7 to +10% by the 2020s.• Sea level is projected to rise by 4 to 19 cm by the 2020s.
These findings clearly demonstrate the pressing need for cities to adopt strategic measures to address climate challenges meaningfully. However, while the need is evident, actions are still mostly incremental, fragmented and siloed. The New Urban Agenda (NUA) identifies technology and Smart City models as potential drivers for improving city resilience and sustainability:
…[A]dopting a Smart-City approach that makes use of opportunities from digitalization, clean energy and technologies, as well as innovative transport technologies, thus providing options for inhabitants to make more environ-mentally friendly choices and boost sustainable economic growth and ena-bling cities to improve their service delivery (United Nations, 2017, 19). […] We underscore the need for enhanced cooperation and knowledge exchange on science, technology and innovation to benefit sustainable urban develop-ment… (United Nations, 2017, 37)
The smart city model is clearly identified here as means to an end, utilized to strengthen local efforts aimed at producing strategic climate responses. It remains to be seen whether it can supply the necessary impetus to produce the more trans-formative strategies required to trigger a fundamental change towards sustainable and climate-resilient urban development pathways (Rosenzweig, et. al., 2019).
Strategic urban planning for resilience is not the widespread choice of local gov-ernment, as Jabareen (2013) indicates in proposing the Resilient City Planning Framework, a 4-tiered comprehensive model: vulnerability analysis, planning in uncertainty, urban governance and prevention. The four concepts frame key ques-tions on measures to attain resiliency, which in turn, can define tools and pathways, including spatial planning, technological systems and community engagement and support.
The question of sustainability, resiliency and the Smart City model is addressed in this issue by four contributions from different – yet congruent – perspectives, simi-
O. Ronen & R. Purian12
lar to Jabareen’s delineation: spatial planning and the urban heat island, communi-ty-technology sustainability and tourism, and finally, governance and sustainability.
All articles in this section are concerned with the Mediterranean region, identi-fied, as one of the world’s hotspots for climate change (Kim, et. al., 2019). The region frequently experiences extreme climate and weather events, especially heat waves and droughts. Despite these trends, Mediterranean cities are lagging behind North European cities in addressing climate change challenges and mainstreaming sustainability. Sharon and Ronen (in this special issue) maintain that the emerg-ing convergence of sustainability with innovation may offer a stronger incentive for Mediterranean cities to promote expansive environmental actions and policies. Findings from a study of 34 Mediterranean cities indicate that there was much inter-est in adopting innovative solutions, but less experience of actually doing so. Only one fifth of the participating authorities were already working to develop innovative and large-scale environmental initiatives, predominantly the larger municipalities.
Readiness to adopt sustainable development is also the main theme of the article by Marava, Alexopoulos & Stratigea: “Barriers to Empowering and Engaging Youth in Sustainable Urban Development Endeavours”. The problem of mainstreaming sustainability, especially in including youth in decision and policy making, has be-come more challenging with the advent of the digital generation. Bridging inter-generational gaps, as the article elucidates, needs to overcome barriers in commu-nication, digital gaps, and building trust, skills and avenues for non-trivial input and involvement in solutions for a sustainable and just future. The study deliberates the adoption of ICT-enabled interaction patterns for the establishment of steady communication bridges and information channels with youth, taking advantage of prevailing youth interaction patterns to introduce them into the socio-political discourse. Alternative options are available nowadays, such as online campaigns, clicktivism and slacktivism, hacking and Distributed Denial of Service (DDoS) at-tacks, crowdsourcing and liquid democracy (EC-CE, 2015).
The issue of barriers to innovation and sustainability is augmented by deepening the understanding of practices of the digital generation, the lack of attractive com-munication bridges between youth and local administration and the deficient strate-gic use of available digital means (e.g., Facebook, Twitter) for establishing linkages, spreading information and engaging youth in local affairs. The researchers introduce new insights regarding face-to-face participatory tools used in the DemoCU and Gr-RAC initiatives, and the focus on youth’s creativity as powerful tools for unfold-ing their thoughts, skills and perceptions.
In the context of sustainability, the deliberation on the benefits of technology, mostly centered on the transition from the “Petropolis” to the “Ecopolis”, two op-posing urban models coined by Girardet (Girardet, 2017), exemplifies the current controversy. The contribution of Lovecchio, Basic and Pawlowski on “Urban Heat, Vulnerability, and the Public Realm”, presents a tangible case study of working with aspects of the two models in addressing climate change in a Mediterranean city. The
Editorial Introduction 13
article explores how innovative thermal spatial analysis exposes interconnected risks, to inform new paradigms of planning and design that seek not only climate adapta-tion but also social equity at the community level, integrating social sensitivity in-dicators compound with heat exposure. In this case, socio-political, economic, and environmental stresses converge: from displacement caused by rising unaffordability of housing and disproportionate exposure to heat.
Cascading consequences of heat suggest the interconnected nature of risk: Small businesses with months of lost foot traffic reduce revenue and jeopardize business sustainability, livelihoods, and important community resources for residents. This analysis assumes that vulnerability is defined by the combination of exposure and sensitivity indicators, derived through data analysis and data-based extrapolations, reverberating the discussion of means and end. This process, also known as the “multi-criteria decision analysis,” intended to help prioritize where planning efforts may be directed. This innovative tool introduced through the case study exempli-fied as a Climate Smart framework, demonstrating the use of data in determining climate action.
The implications of both sustainability and smartness on the region’s leading industry – tourism, are brought in by Alon Gelbman in a review article that ex-amines the characteristics of smart tourism cities as a tool for the effective manage-ment of environmental systems and urban society. The major tourism cities of the Mediterranean, such as Barcelona, Venice and Athens, are suffering dramatically from the impact of over-tourism on residential life and local infrastructures.
Technology, ICT applications and better monitoring can help to meet these chal-lenges and possibly create new frontiers even in COVID19 times. Maximizing the use of smart technologies such as robots at airports and other public places will provide better management of visitor movement, reduce crowding and enhance medical and security control. Gelbman also notes the need to address the unique characteristics of the younger generations in this context, born into a digital envi-ronment and for whom this is a part of their life style. They expect smartness, they prefer travel tech and are more aware of the environment. Sustainable management of services and experience are becoming accepted standards.
One can argue that smart urban tourism is transforming from a futuristic vi-sion to a real and abiding need. This includes sustainable tourism management, which creates a balance between the use of environmental and social resources, and the movement of tourist visitors in a city. In this way, online digital experiences in contemporary urban tourism can provide responses to the problems of tourism overcrowding in the 21st century. Gelbman contends that the smart city concept incorporates improved sustainability through the greater efficiency provided by the use of new technologies and higher volumes of information for management, ulti-mately within new governance.
In congruence, Sharon and Ronen, conclude the section and present the policy aspect of integrating innovation and sustainability on the local level, in “Municipal
O. Ronen & R. Purian14
Innovation and sustainability Readiness”. They argue that urban climate resilience depends largely on the municipality’s’ readiness to embrace innovation and main-stream climate and sustainability comprehensively within municipalities; this is the second wave of municipal innovation adoption. The pioneers have already shown the value of transitioning to a climate ready reality, now the more peripheral cities can reap the benefits through collaboration with the first cohort of cities. Most cities do not have integrated institutionalized mechanisms for innovation, and even when they do, these are not associated with sustainability or climate issues. Apparently, innovation is not perceived, nor implemented, as a catalyst for climate action. In view of the growing impact of climate change, this state is concerning in relation to municipal policies, in general and in the Mediterranean region in particular.
Mediterranean cities are contending with the rising environmental and climate challenges. The contributions in this special issue delineate an emerging reality where innovation and technology are becoming advantages and means to pursuing climate and environmental resilience.
THE GOOD AND THE BAD
Smart cities are cities of data science, encompassing the urban data life cycle. Urban decision making, in a smart city model, is a product of business intelligence (BI), technology and information systems (IS) management, and scientific research, based on data that creates one of the most basic pillars of the smart city. In the first days of Obama’s administration, dashboards and mashups were the state of the art. Since then, smart cities replaced the concepts of e-government, e-democracy and e-participation, and the web-based dashboard applications are deeply assimilated in the new giant platforms termed ‘digital twin’. At the recent Smart Cities Conference in Barcelona, technology vendors presented what may be called super-platforms and cities presented use cases. Among the companies presented were Huawei, ESRI, Deloitte, Bentley, Siemens, and more. What are the possible appropriations of digi-tal tools and technologies?
The two closing papers frame the purpose of data, datafication and the operation of smart cities. Theresa Dirndorfer Anderson’s essay presents keystone practices to enable smart cities to flourish, spanning the theoretical and the pragmatic perspec-tives, and Rafi Rich follows with a critical viewpoint on the tech industry. Anderson encourages to see the good and Rich concludes – beware of the bad. The promise of the smart city is also its worst enemy, as municipalities are more likely to adopt bandwagon behaviours. Rich describes the flaws of current urban big data trends, how industry leaders set the rules, and why the big fails to observe the smart conclu-sions gained in thick and small data studies.
Anderson shares her thoughts on lessons learnt as a consequence of the massive bushfires of the summer. She builds on the notion of creative urban ecologies as

Editorial Introduction 15
a way to characterize a thriving ‘smart’ city, both in terms of technology, data in use, and of the city’s capacity to learn and adapt. Anderson introduces four claims underpinning her approach: Data is never complete, information is never certain, but action is still required; indecision in light of the indeterminacy of information is a threat to the resilience of an urban ecology; building trust and mitigating risk is critical to resilience; and emphasizing the context of design with the city rather than for the city. Then, using the concept of “urban ecology”, the paper develops keystone practices of community, mutual respect, consistent communication and connection to place, nurturing intuitive understanding; and appreciating leadership and profes-sionalism as listening and commitment.
To initiate inclusive social and climate actions, data provision and integration is necessary, consolidating the many systems and service providers into a principal-agent problem of collective action (Purian et al., 2019). However, the overall aim of a profit-driven industry is not necessarily to further develop the systems and the societal practices that encourage healthier and more sustainable behaviours.
In this respect, the critical commentary by Rafi Rich clearly states: beware of the flaws, avoid bandwagon behaviours, nurture your own thick and small data and insights. More than industry standards, the smart city is about intimate connections to the people and to the places. Efficiency is necessary, but not sufficient. To break down – and resolve – urban problems we must connect the institutional perspective of organizations in different sectors and the individual perspective in communities and social groups.
The design of data and services, specifying what information to collect, store or deliver forward, is therefore an ethical design of social relationships, actualiz-ing rules of conduct and shaping norms and responsibilities. The smart reality that spans multi-stakeholder initiatives, through services and platforms that facilitate processes, must be effective from a business perspective as well. While doing that, the envisioned mechanisms will produce and absorb streams of collective vast big data, anonymised and privacy-protecting. This big data pillar must be specific and selective, and challenged constantly by gatekeepers to address a simple question: do we collect data not for surveillance but for providence, not to police but to protect, not anonymously monitoring but attentively listening and taking care?
To conclude: perhaps, the good and the bad Smart delineate the axis of the Smart and Sustainable cities discourse, and conversely, the questions presented in this spe-cial are fused, outlining the complexity of cities today. Today, in the age of techno-logical acceleration and global cities, there is a need for a new perspective that inte-grates the emerging ecosystems of systems and agents – both socially and environ-mentally. The following articles explore these assumptions, delving into the intricate fabric of city building, managing and developing at the opening of a new century.
O. Ronen & R. Purian16
REFERENCES
Alfasi, N. and Portugali, J. (2007) Planning rules for a self-planned city. Planning Theory, 6(2), 164-182.
Castells, M. (2010) Globalisation, networking, urbanisation: Reflections on the spatial dynamics of the information age. Urban Studies, 47(13), 2737-2745. https://doi.org/10.1177/0042098010377365
EC & CE (2015) European Commission & Council of Europe. Analytical paper on youth participation. Available at: https://pjp-eu.coe.int/documents /42128013/47261980/What+is+youth+participation.pdf/223f7d06-c766-41ea-b03c-38565efa971a.
Farrell, Y. & McNamara, S. (2018) Freespace Manifesto, La Biennale di Venezia. Florida, R., & Adler, P. (2018) The patchwork metropolis: The morphology of the
divided postindustrial city. Journal of Urban Affairs, 40(5), 609-624.ICLEI (2019) Resilient cities, thriving cities: The evolution of urban resilience.
Bonn, Germany.Girardet, H. (2017) Regenerative cities. In: Shmelev S. (ed.) Green Economy Reader.
Studies in Ecological Economics, vol 6. Springer, Cham, 183-204. http://doi.org/10.1007/978-3-319-38919-6_9
Grifoni, R. C., D’Onofrio, R., & Sargolini, M. (2018) Quality of Life in Urban Landscapes. Springer.
Loring, P. (2021) Why Resilience Matters. http://www.conservationofchange.org/resilience [accessed 11 March 2021]
Mpanje, D., Gibbons, P., and McDermott, R. (2018) Social capital in vulnerable urban settings: An analytical framework. Journal of International Humanitarian Action, 3.1, 1-14.
Oliveira V. (2019) Urban Forms, Agents, and Processes of Change. In: D’Acci L. (ed.) The Mathematics of Urban Morphology. Modeling and Simulation in Science, Engineering and Technology. Birkhäuser, Cham, 529-535.
Omer, I., & Goldblatt, R. (2012) Urban spatial configuration and socio-economic residential differentiation: The case of Tel Aviv. Computers, Environment and Urban Systems, 36(2), 177-185.
Portugali, J. (Ed.) (2006) Complex Artificial Environments: Simulation, Cognition and VR in the Study and Planning of Cities. Springer Science & Business Media.
Prigogine, I., Stengers, I., & Prigogine, I. (1984) Order Out of Chaos: Man’s New Dialogue with Nature. Boulder, CO: New Science Library.
Purian, R., van Hillegersberg, J. & Catlett, C. (2019) Life as a service in the smart
Editorial Introduction 17
city: Fair play in information systems design, data integration and planning. International Conference on Information Systems, ICIS, Munich.
Ros, F. V., Magro, S., and Forés, I. M. (2019) Anthropocene, the challenge for Homo sapiens to set its own limits. Geographical Research Letters, 45, 33-59.
Rosenzweig, C., Solecki, W. D., Romero-Lankao, P., Mehrotra, S., Dhakal, S., & Ibrahim, S. A. (Eds.) (2018) Climate Change and Cities: Second Assessment Report of the Urban Climate Change Research Network. Cambridge University Press.
United Nations General Assembly (2015) Transforming our world: The 2030 Agenda for Sustainable Development. A/RES/70/1,
https://www.refworld.org/docid/57b6e3e44.html [accessed 11 March 2021]United Nations (2018) The World’s Cities in 2018-Data Booklet. Book
Series: Statistical Papers - United Nations (Ser. A), Population and Vital Statistics Report, 1-33.
Walker, B., Holling, C. S., Carpenter, S. R., & Kinzig, A. (2004) Resilience, adaptability and transformability in social–ecological systems. Ecology and Society, 9(2). https://doi.org/10.5751/ES-00650-090205
World Bank (2020a) Global Economic Prospects. Washington, DC. http://hdl.handle.net/10986/33748
World Bank (2020b) Poverty and Shared Prosperity: Reversals of Fortune. Washington, DC. http://hdl.handle.net/10986/34496
World Bank (2021) Global Economic Prospects, January 2021. Washington, DC. http://hdl.handle.net/10986/34710

Planning, Responsive and Adaptive Systems – to What?
Smart Urban Futures: Outlining the Smart City Planning Project
Geography Research Forum • Vol. 40 • 2020: 19-34.
Jenni Partanen*TalTech, Estonia
* Academy of Architecture and Urban Studies, Tõnismägi 14, Tallinn, Estonia, 10119. [email protected]
Cities are constantly evolving complex systems, and ongoing digitalization is mak-ing them even more complex. The toolkit for urban scientists is expanding with computational methods from AI to machine learning, data mining and advanced spatial analyses. Together with vast amount of data of urban phenomena and new lifestyles emerging from virtuality and cybernetic systems, this ‘smartification’ makes the planning and analyses more challenging while providing new tools to respond to them. In this article I propose a project for better understanding and guiding the future smart city based on dynamic urban theories such as those study-ing complex adaptive systems, urban morphology, urban economy and mobility systems. I argue that we need to carry out empirical research on ongoing change to learn about novel, becoming spatial and functional patterns in the city, and apply both theories and imaginary visions to be able to grasp the likely qualitative transition in humans’ life following the ubiquitous use of technology. The project is built around three coupled modules, urban space, mobility and urban econom-ics, and it will be carried out in the city of Tallinn, Estonia. The expected results would help planners, decision makers, urban scientists and developers to better understand the transition we are facing, to be able to support the change and steer it towards better social and economic outcomes.Keywords: Smart city, Models, Spatial Analytics, Urban Planning, Complexity, Uncertainty
INTRODUCTION
Currently ongoing global extensive urbanization makes cities more important than ever economically, culturally and socially. Simultaneously, cities are facing a revolu-tionary transition to become technology mediated environments where digital sys-tems and algorithms increasingly guide our lives in an unforeseen manner (Brenner & Schmid, 2012; Townsend, 2013; Batty, 2018).
This transition, not unlike the industrial revolution, is by default unpredictable. Cities are complex systems in a sense that from time to time they evolve through
J. Partanen20
sudden ruptures emerging from small interdependent, dissipative events, resulting in a qualitatively new dynamic state (Castells, 1996; Portugali 1999). Such intrinsic features embrace uncertainty that makes them difficult to control (Batty, 2007) and to predict (Batty 2018). However, urban planning and management is necessary to guide urban systems for sustainability, economic viability and quality of everyday life. Relevant “complexity planning” approaches have been suggested (e.g., Portugali et al., 2012; de Roo & Hillier, 2016). Consequently, we need to see cities in a sys-temic manner. This article builds on these, extending the technological aspects of fu-ture city both in regard to technologically mediated urban realities, and the digital, algorithmic and other tools applicable to embrace these intrinsic systemic features.
From a systemic perspective, like ecosystems in the nature, cities cannot be pro-duced or controlled, but just guided (Partanen, 2018; Walker & Salt, 2012), as will be explained later. This would mean, first, hindering of the nonpreferable phenomena and let the rest operate. Second, urban management needs to take place in an itera-tive procedure of small initiatives, carefully monitoring and correcting maneuvers (Walker & Salt, 2012; Allen, 1998). Furthermore, since future is by default uncer-tain and urban theories probably apply only to an extent (Batty, 2018), a plausible approach could be to apply credible visions of urban life, for example, mobility or the future of work. These may imply embryonic innovations, such as autonomous vehicles, energy production from renewable sources, virtual presence and beyond. Hence, in this article a methodological approach to the character of complex urban systems, and the necessity to guide it towards preferable goals, is framed and for-mulated.
The ambitious enterprise of creating an intrinsically trans-disciplinary research project agenda has a long history. However, this paper considers complexity theories as well as the (eco)system view of smart urban technologies. Complexity can be considered by embracing particle interaction and its emergent, sometimes surpris-ing impact of systems’ dynamics, and other related dynamic theories with credible future scenarios, to explore possible (or probable) futures and their implications in urban environment. Applicable technologies and related analytical methods that would emerge from urban theories may be emphasizing dynamic change, including computer models and simulations, spatial data analytics, machine learning or other tools considering urban non-linear dynamics hence being capable of embracing multi-agent dynamics in trans-scalar manner – considering the impact of distrib-uted individual actions on a higher (neighborhood, urban, or regional) scale. The research question is hence:
What kind of systemic structure for a research project would embrace the multifaceted and uncertain nature of urbanity for more adaptive planning? What type of general results could be expected from such an approach?
By outlining guidelines and principles for such a model this paper may demon-strate current understanding of possible future development paths and their man-agement options, e.g. trends in mobility, work and lifestyle, to enhance the eco-
Smart Urban Futures: Outlining the Smart City Planning Project 21
nomic viability and the quality of life. Furthermore, novel tools and methods for data integration and analysis are expected to support the viable, constantly renewing urban planning. In this becoming smart urbanity, ubiquitous digital technology is often implicit, perhaps imperceptible. New understanding and methods are expect-ed to explicitly promote urban qualities, business and urban life, setting examples locally and globally.
General aims for a model for smart urbanism would be as follows:To enhance understanding of urban dynamics and the impact of technology in Smart
City avails; suggesting (1) new methods and tools for urban planning and management regarding new ways of life, new work and new mobility; which would (2) support constantly renewing urbanity for viable business and high-quality urbanism.
BACKGROUND AND THEORY
Increasingly Complex Cities
In recent decades, theories of complex adaptive systems (CAS) have enhanced our understanding of the surprising and unpredictable nature of a wide variety of systems in the world (Kauffman, 1993; Batty, 2009; Mitchell, 2009; Bettencourt & West, 2010). Complexity thinking has been applied in a variety of fields, from study of natural ecosystems to economic and social systems, including cities (Mitchell, 2009). Characteristic of complex systems, cities are dynamic networked systems that change constantly from actors’ interaction within the frame of plans, laws, and other regulation. Interactions between myriad actors – firms, institutions, organiza-tions, individuals – result in self-organizing emergent patterns, networks and regular dynamics that feed back to operation of the system. Such patterns may appear as clusters of firms, services or retail nodes, cooperation networks or mobility patterns. They emerge from dissipative decision making from bottom up, forming often sur-prisingly resilient configuration. Consequently, the urban systems appear dynami-cally stable for long periods of time (Portugali, 1999; Holland, 2000). However, such complex systems typically evolve via ruptures initiated from external forces (e.g. natural disasters, pandemics, shifts in global economy) or from internal prem-ises such as (sometimes small) changes in systems’ configuration. Major innovations can also be considered as forces launching eventually a transition (Capra, 1996). Industrial revolution or emergence of knowledge-based society provide examples of such a change: innovations in communication and transportation technology pushed the system to a novel trajectory, changing society and urban life drastically (Harvey, 1999). New technologies and innovations in ICT and transport, along with rising standards of living, enable longer trips and more efficient commuting and communication within shorter time span. An urban region can even be consid-ered to shrink regarding time-space.
J. Partanen22
Urban Metabolism and Morphological View
In complex cities, flows of goods, information and people play an essential role in urban spatial configuration (Ascher, 2004). Flows follow the accessibility landscape of the urban region, where highly accessible locations create potentially attractive places for urban activities and services (Oswald et.al., 2003; Hillier, 2007). Activity nodes and clusters attract more flows – customers, employers, freight traffic – feed-ing back to the spatial configuration in a circular manner (Ascher, 2004; Oswald & Baccini, 2003). Such dynamics can be considered to resemble metabolism in nat-ural organisms, providing an applicable metaphor for the urban system (Ascher, 2004). Furthermore, as the urban morphological perspective highlights the primary role of routes, the interaction between road networks and the urban tissue they nour-ish enables a circular relationship between processes and patterns: formation of ur-ban spaces and steered by the myriads human activities – economic, cultural, social (Caniggia & Maffei, 2001; Batty & Marshall, 2009). Such dynamics is naturally promoted and affected by individuals’ decision making and planning, while the most crucial emergent results appear on the higher scale.
Urbanity on the Threshold of a Transition
Cities seem to be facing yet another major transition: emergence of ”smart” urbanity embedded with ubiquitous, immersive technology founded on almost in-finite sea of datum (Hayles, 2004; Gabrys, 2014; Engin et. al., 2020). Digitally enabled novel features, such as virtual presence, autonomous transportation, aug-mented realities, 3d-printing and robotics guided by algorithms and artificial in-telligence might be able to condense the city again, diminishing the time-space related distances as transportation and many other (remote) activities are obviat-ing the material presence of humans, or liberating them for other tasks while, e.g., travelling. Changes enabled by innovations in communication and transportation technologies, and consequently social welfare and many other aspect of urban life, are forcefully joint with industrial revolutions. Accordingly, this will be reasonable to assume that human life and its choreographies would change as well. Moreover, applying complexity concepts, it is fair to estimate a phase transition through the smartification of cities; a certain qualitative impact of the digital revolution. From myriads of today’s competing embryonic digital, algorithmic, data driven solutions, it is impossible to know which one(s) will enslave the others, defining the global scale characteristics of future cities’ steady state.
Urban theories against which empirics can be reflected would herein establish urban phenomena. However, at the time of transition, should theories be revised or firmly apply to changing regularities (Batty, 2018)? For example, the significance of geographic proximity as a prime promoter of urban dynamics, particularly for economic actors, is unravelling to an extent, while the role of face-to-face contact will probably endure (Batty, 2018; Ascher, 2004). In such complex ecosystems, the
Smart Urban Futures: Outlining the Smart City Planning Project 23
long-term future is intrinsically unpredictable, setting challenges to the planning of urbanity in a constant flux.
Planning Encounters ComplexityA useful option to plan the future is to consider urban, complex ecosystem to an
extent similar to its counterparts in nature, consisting of a vast number of self-or-ganizing agents on nested levels of subsystems and networks, interacting with their environment. Such systems cannot be built from the start, controlled nor optimized without hindering their capacity to self-organize, i.e., renew and survive. The best option for such systems would be to recognize preferable self-organizing systems – in cities, cooperative actor networks, dynamic clusters or other resilient patterns – and restrain non-preferable phenomena, for example, progress apparently leading to segregation, monofunctional or dangerous urban environment.
Hence plausible possibilities for urban planning would be, first, to learn from the system(s) (novel) features and dynamics, through scientific research, the urban self-organizing, interdependent, and dynamic phenomena. Second, as a methodological frame, planning should focus on allowing or supporting preferable dynamics while hindering harmful ones, revising city operation. Such endeavor requires utilizing and developing new tools and approaches ranging from simulations to spatial analy-ses applying geographical information system (GIS), mathematical and statistical models, data mining and AI. Third, planning could promote qualitative research, design research, and experiments, for example, those resembling ‘urban acupunc-ture´, by trial and error, adopting procedures of constant evaluation and swift cor-rection maneuvers, for experimental qualification of urban space.
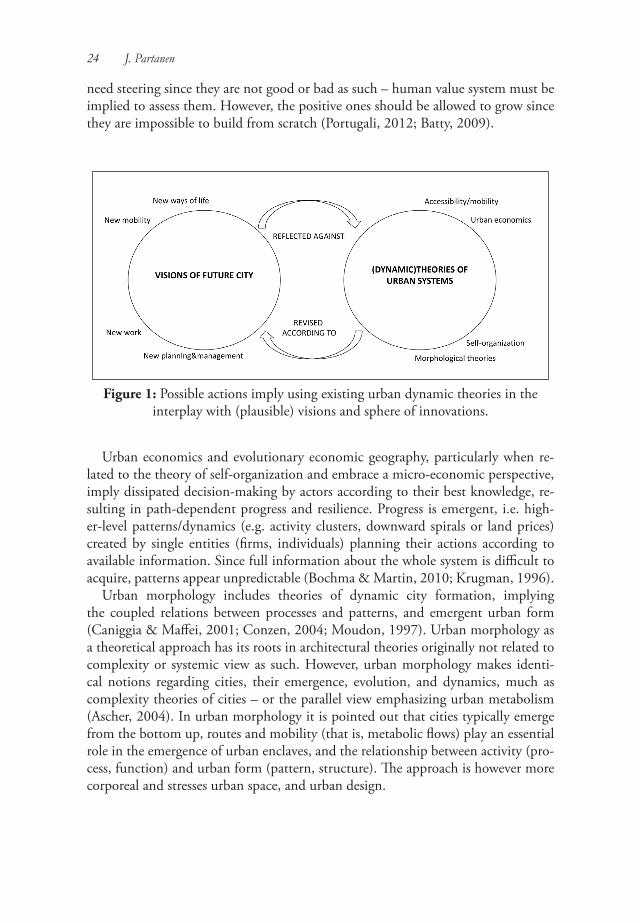
Consequently, a complementary approach could be to envision and imagine the city: while we cannot predict, we can forecast the potential directions to an extent; we can explore cities via imagination and even with visions from art, literature and cinema. By adopting and revising well-grounded visions together with (revised) ur-ban theories, we can estimate their consequences and preferability to possible urban future(s) (Figure 1).
Potential theoretical approaches implying complex behaviors as presented in Figure 1 may include the followings:
Urban self-organization is one of the theories under complexity sciences; self-or-ganization is related to measurements reflecting scaling, fractality or entropy in the system. In the framework of complexity theories originating from natural scienc-es, self-organization refers to a capability of non-living and non-conscious entities (cells, particles, biological systems, but also urban systems) to form organized pat-terns and structures without guidance from outside the system. The self-organizing patterns often enslave the agents as is also the case in the metabolic city: human pro-cesses produce road networks and activity clusters, which start to guide how people move, behave and invest, accelerating the dynamics. Although individual actions are planned, no one has a complete knowledge of the whole, and the system behavior appears to resemble similar behaviors of natural systems. Self-organizing structures
J. Partanen24
need steering since they are not good or bad as such – human value system must be implied to assess them. However, the positive ones should be allowed to grow since they are impossible to build from scratch (Portugali, 2012; Batty, 2009).
Figure 1: Possible actions imply using existing urban dynamic theories in the interplay with (plausible) visions and sphere of innovations.
Urban economics and evolutionary economic geography, particularly when re-lated to the theory of self-organization and embrace a micro-economic perspective, imply dissipated decision-making by actors according to their best knowledge, re-sulting in path-dependent progress and resilience. Progress is emergent, i.e. high-er-level patterns/dynamics (e.g. activity clusters, downward spirals or land prices) created by single entities (firms, individuals) planning their actions according to available information. Since full information about the whole system is difficult to acquire, patterns appear unpredictable (Bochma & Martin, 2010; Krugman, 1996).
Urban morphology includes theories of dynamic city formation, implying the coupled relations between processes and patterns, and emergent urban form (Caniggia & Maffei, 2001; Conzen, 2004; Moudon, 1997). Urban morphology as a theoretical approach has its roots in architectural theories originally not related to complexity or systemic view as such. However, urban morphology makes identi-cal notions regarding cities, their emergence, evolution, and dynamics, much as complexity theories of cities – or the parallel view emphasizing urban metabolism (Ascher, 2004). In urban morphology it is pointed out that cities typically emerge from the bottom up, routes and mobility (that is, metabolic flows) play an essential role in the emergence of urban enclaves, and the relationship between activity (pro-cess, function) and urban form (pattern, structure). The approach is however more corporeal and stresses urban space, and urban design.
Smart Urban Futures: Outlining the Smart City Planning Project 25
Mobility research is, according to current understanding, based on multi-agent dynamics and implies that the traffic system is a complex adaptive system per se. Hence the research often concentrates on emergent, non-linear phenomena taking place in transport networks, such as formation of transportation jams, stop-and-go waves, hysteresis, and phase transitions (Wang et. al., 2012). The emergence in mo-bility system occurs typically through self-organization, and is heavily depending on network topology, along with individual agents’ decision making. Mobility theories range from approaches implying complexity and self-organization to network theo-ries and space syntax, often applying models and simulation (Hillier, 2007; Albert & Barabasi, 2002; Watts & Strogatz, 1998; Li et al., 2007).
Cities today face new challenges. Complexity and the dynamics of urban systems are the foundations on which to study the impact of smartification and datafication on behaviors – and on urban forms.
SUGGESTED STRUCTURE OF THE RESEARCH
Systemic view emphasizes the interaction between the system’s parts, and the in-teraction between the system and its environment, along with feedback from the patterns to the agents that produce them. A system is always depended on strategic interpretation of the world (Cillier, 2005). Hence it is necessary to delineate which variables, subsystems or processes are crucial in embracing the essential characteris-tic and behavior of the system at issue; an analysis based on key principles in com-plexity thinking, urban metabolism and urban morphology.
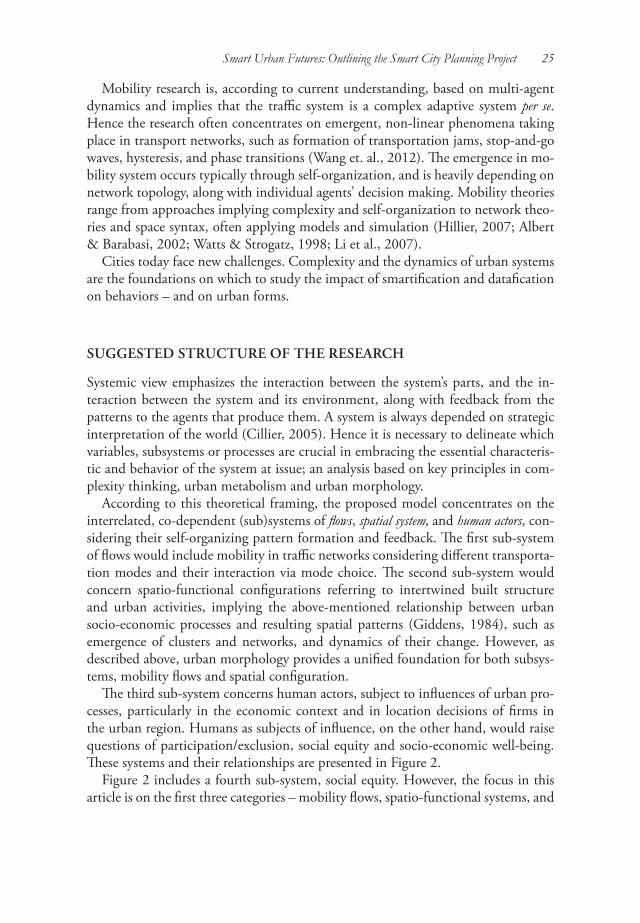
According to this theoretical framing, the proposed model concentrates on the interrelated, co-dependent (sub)systems of flows, spatial system, and human actors, con-sidering their self-organizing pattern formation and feedback. The first sub-system of flows would include mobility in traffic networks considering different transporta-tion modes and their interaction via mode choice. The second sub-system would concern spatio-functional configurations referring to intertwined built structure and urban activities, implying the above-mentioned relationship between urban socio-economic processes and resulting spatial patterns (Giddens, 1984), such as emergence of clusters and networks, and dynamics of their change. However, as described above, urban morphology provides a unified foundation for both subsys-tems, mobility flows and spatial configuration.
The third sub-system concerns human actors, subject to influences of urban pro-cesses, particularly in the economic context and in location decisions of firms in the urban region. Humans as subjects of influence, on the other hand, would raise questions of participation/exclusion, social equity and socio-economic well-being. These systems and their relationships are presented in Figure 2.
Figure 2 includes a fourth sub-system, social equity. However, the focus in this article is on the first three categories – mobility flows, spatio-functional systems, and

J. Partanen26
urban economics – thus leaving the fourth for future research for its pervasive and extensive scope.
Figure 2: The delineation of the sub-systems: Mobility, spatio-functional city, and human action. The systems are partly overlapping, nested and highly interconnected (the fourth sub-system, social equity, is indicated in the figure due to its breadth and crucial importance but, for these very same reasons, extends the scope of this paper).
The Case of Tallinn, EstoniaThe city of Tallinn, Estonia, is a suitable “living laboratory” for this study due
to its flexible, progressive adoption of smart systems and extensive data collection. After investing remarkably on smart systems, Tallinn is today among the leading cit-ies in the provision of online e-services, e-voting and e-residency (see, e.g., E-Estonia https://e-estonia.com/tallinn-smart-capital-digital-nation).
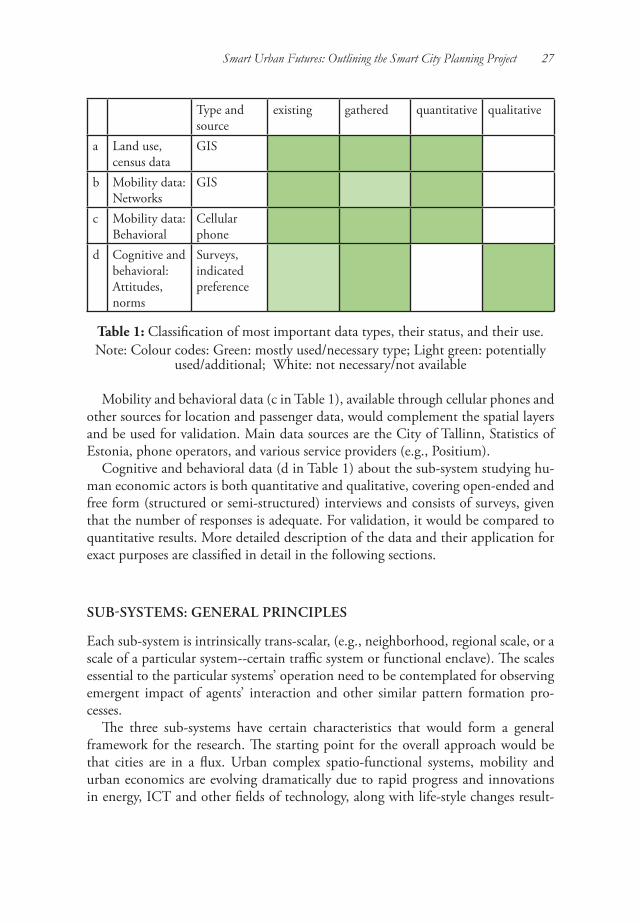
The data variables presented in Table 1 are classified into types and methods (quantitative and qualitative), processing levels (e.g., available and modified data), and sources.
Geographic Information Systems (GIS) and census data (a in Table 1) would form a basic data set. Data may be fully available, processed, or computed and com-plemented with additional geocoded materials such as addresses in socio-economic data, data from multiple external data sources (e.g. travel card systems, credit cards).
The spatial data layer includes street networks (b in Table 1) with information about modes of transportation, cycling networks and public transport. Additional data layers include information about households, employment, services, firms, industries; energy use (from buildings to urban scale); potential tourisms (hotels, Airbnb); or general nationwide trends.
Smart Urban Futures: Outlining the Smart City Planning Project 27
Type and source
existing gathered quantitative qualitative
a Land use, census data
GIS
b Mobility data: Networks
GIS
c Mobility data: Behavioral
Cellular phone
d Cognitive and behavioral: Attitudes, norms
Surveys, indicated preference
Table 1: Classification of most important data types, their status, and their use.Note: Colour codes: Green: mostly used/necessary type; Light green: potentially
used/additional; White: not necessary/not available
Mobility and behavioral data (c in Table 1), available through cellular phones and other sources for location and passenger data, would complement the spatial layers and be used for validation. Main data sources are the City of Tallinn, Statistics of Estonia, phone operators, and various service providers (e.g., Positium).
Cognitive and behavioral data (d in Table 1) about the sub-system studying hu-man economic actors is both quantitative and qualitative, covering open-ended and free form (structured or semi-structured) interviews and consists of surveys, given that the number of responses is adequate. For validation, it would be compared to quantitative results. More detailed description of the data and their application for exact purposes are classified in detail in the following sections.
SUB-SYSTEMS: GENERAL PRINCIPLES
Each sub-system is intrinsically trans-scalar, (e.g., neighborhood, regional scale, or a scale of a particular system--certain traffic system or functional enclave). The scales essential to the particular systems’ operation need to be contemplated for observing emergent impact of agents’ interaction and other similar pattern formation pro-cesses.
The three sub-systems have certain characteristics that would form a general framework for the research. The starting point for the overall approach would be that cities are in a flux. Urban complex spatio-functional systems, mobility and urban economics are evolving dramatically due to rapid progress and innovations in energy, ICT and other fields of technology, along with life-style changes result-

J. Partanen28
ing from these. While the role of corporeal urban environment will retain, it will transform. Urban transformation is intertwined with emerging phenomena such as virtuality and autonomous transport guided by AI and enabled by extremely fast telecommunication (5G) connections.
Hence, in all three sub-systems discussed here, technology is considered not only as a driver of change, but also as a provider of tools and methods for better under-standing and guiding the transformation. Overall, approaches from data analytics to simulation and machine learning are required to respond to emerging challenges in urbanity. Furthermore, it is necessary to stress that for uncertainty of the future, making the city becomes crucial, along with new tools and methods in urban plan-ning and design.
General aims for the research project presented in this article – i.e., understanding the city, developing planning methods and tools, and enhancing urban quality – apply to all sub-systems. Although the sub-systems are presented as separate entities, their scope would be overlapping and complementary, implying remarkable amount of collaborative work in research operation (e.g., sharing data, results, joined research operations, and feedback).
Urban Mobility Sub-system
This sub-system aims at knowledge of systemic features and dynamics within traffic systems, computational tools to evaluate the impact of decisions regarding transport modes and changes in activity nodes to the overall behavior of the flows in the network. Following the metabolic ideas of the city’s operation, the approach focusing on flows is reflecting spatial behavior and spatial configurations, and hence very much is intertwined with other sub-systems of urban space and human actors. Consequently, the scope of the research is the analysis and design methods for trans-forming mobility and urban morphology.
DescriptionThe research would focus on the topology and (anticipated) use of transporta-
tion networks considering novel, emerging modes of transportation in an innovative manner. Furthermore, the resulting changes in mobility, traffic flows and “urban metabolism” in the corporeal city in general are studied with appropriate meth-ods, for example using dynamic, distributed models and simulations or network theoretical methods. The research problems may concern characteristics of future mobile, multi-location and virtual work, individual decisions regarding transporta-tion mode (public, private, current, future modes, and potential threshold values; or relations between the network topology and its actual use, e.g. the emergent, cu-mulative role of individual drivers in congestion; and the role of new network hubs. Due to the intrinsically high level of complexity of the mobility system, computa-tional tools are necessary, and it is suggested to apply a micro-simulation modelling
Smart Urban Futures: Outlining the Smart City Planning Project 29
approach capable of embracing emergent impact of myriad individual dissipated decisions of drivers.
Due to ongoing urban transition and digitalization, changes are expected in the number of daily trips, making them more unpredictable or multimodal. Network characteristics and emergent transportation modes will play a role in congestion and load management.
Potential dataIn addition to the data presented in Table 1, information about commuting
and work place will be collected through interviews, surveys and sources such as Tallinn Smart Card data; land use and parking data in the area of Ülemiste, Tallinn; and previous questionnaires about mobility preferences, mobility questionnaires for Ülemiste area workers, tram passengers data, and public transport accessibility analysis.
Expected resultsA computational tool (simulation model) is introduced to estimate the emergent
impact of individual mobility decisions on a higher (neighborhood, city and/or re-gional) scale, and the role of the network structure in that. The results are reflected to relevant theories of urban systems and urban management to propose guidelines for planning and application of the built tools.
Spatio-functional Sub-system
The aim of the research contemplating this subsystem would be to gain new knowledge and understanding particularly of urban spatio-functional configura-tions, emerging patterns and their changes over time, and other self-organizing reg-ularities (e.g. rhythms of how people use the city currently, or in future). The term spatio-functional refers here to the dynamic relationship between emerging order manifested in space, and the activities (public and private services, residential and other use) generating the spatial patterns.
DescriptionThe research would focus on dynamic morphological and spatio-functional as-
pects of cities, hypothesizing that while our ways to use the city will evolve along immersive technology, urban activity landscape and morphology inevitably respond to this change. The research problems would circle around both making and reading the city: the relationship between the urban morphology (density, form) to energy consumption and distributed production in different urban scales (from building to city level); the impact of new lifestyles to the metabolism and spatio-functional configurations of the city, and more.
J. Partanen30
Potential dataIn addition to the data presented in Table 1, data of energy use in buildings/
neighborhoods/larger units and 3D data of buildings (morphology) and CAD-building data will be collected.
Urban Actors’ Sub-systemThe studies exploring this sub-system delve into the so-called future of work,
implying to novel industries, emerging ways to work remote or multiple places, apply virtual and/or mobile work environment, including changing attitude and understanding of “work”. The ongoing transition of urban systems towards “smart” urbanity could consider, for example, the future key industries and actors in the emerging techno-urbanity; their preferences regarding location decisions in urban regions; the impact of these choices to future urban economic geography; or the role of geographic and other types of proximities in the era of virtual, multi-location work. How to attract firms or creative individuals, how are the preferences of the future ’smart city’ talents regarding their environment differ, and what is their un-derstanding of the concept of work. These revised motivators and attractions would affect the dispersion of activities in urban area.
Expected resultsThis research scheme is expected to result in building plausible scenarios concern-
ing new understanding of work, along with its implications to overall mobility, ur-ban spatial configurations and the way of life particularly in the case city of Tallinn, applying statistical and spatial analyses methods.
DISCUSSION
The practical research schema based on the conceptual model presented here would provide multifaceted understanding of plausible urban dynamics in the near fu-ture. Implementation of the research operations could take place in phases, building incremental knowledge emerging also from the experimental research operations. The phases and their tentative results along the sphere of influence are presented in Figure 3.
The results from the research project presented in this article would benefit urban planners, urban management and developers by producing applicable knowledge and visions of smart city dynamics in complex environment, regarding mobility, built environment and urban economics. This knowledge could take place in the form of new guidelines, proposals or policies for urban development such as more adaptive planning methods, models, simulations or beyond. The next steps for the research would be to build more detailed research plan for implementation of the project in the case city of Tallinn. Furthermore, it would be necessary to build a sys-
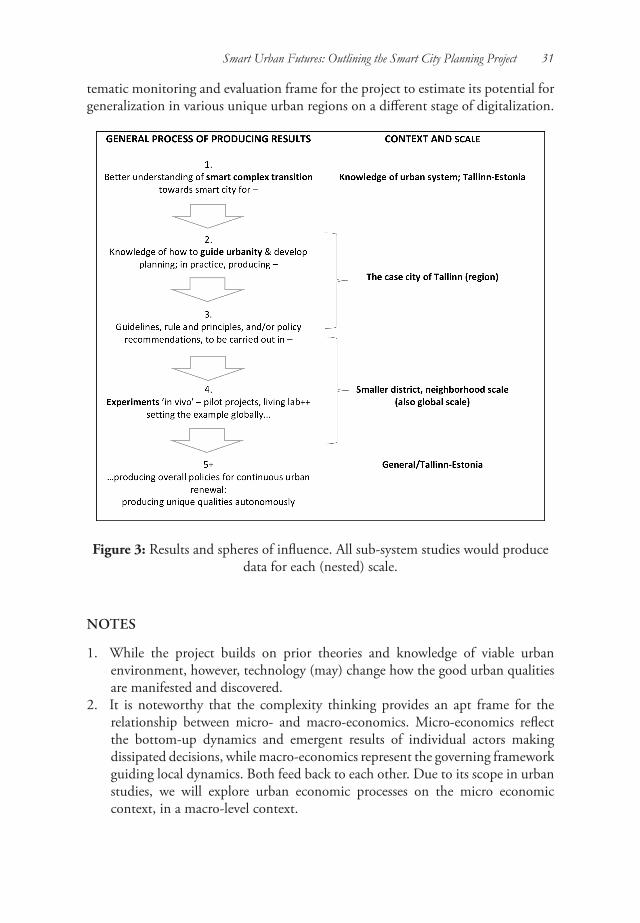
Smart Urban Futures: Outlining the Smart City Planning Project 31
tematic monitoring and evaluation frame for the project to estimate its potential for generalization in various unique urban regions on a different stage of digitalization.
Figure 3: Results and spheres of influence. All sub-system studies would produce data for each (nested) scale.
NOTES
1. While the project builds on prior theories and knowledge of viable urban environment, however, technology (may) change how the good urban qualities are manifested and discovered.
2. It is noteworthy that the complexity thinking provides an apt frame for the relationship between micro- and macro-economics. Micro-economics reflect the bottom-up dynamics and emergent results of individual actors making dissipated decisions, while macro-economics represent the governing framework guiding local dynamics. Both feed back to each other. Due to its scope in urban studies, we will explore urban economic processes on the micro economic context, in a macro-level context.
J. Partanen32
3. For example, echoing theories of self-organization and principles in (evolutionary) economic geography (along with urban metabolism), space syntax is a theory that explores the overall structure of the traffic network as a general accessibility surface, in which certain (groups of ) segments in the network have better overall accessibility (from every other segment) than others. Depending on the scale (i.e., how many segments away we are looking), different accessibility hot spots emerge. Potential for positive, self-organization generating urban activity is related to high accessibility on many scales (reflecting various modes of transport – walk, bike, car etc.). Changes in the network, such as highways, may be modeled and their impact evaluated. Regarding network theories, network topology has a great impact in flows in the network (e.g., few cars in a certain part of the network may cause congestion). Topological structure can reflect the different dynamics in traffic flow. In many systems complex networks (connected clusters, weak ties between the clusters) are associated with higher resilience of the system; the level of complexity may impact the behavior of the traffic flows in the overall system. Different types of networks – regular, random, small-world or scale-free networks – may reflect differing dynamics, e.g., sequenced jams (Li et al., 2007).
REFERENCES
Albert, R., & Barabási, A. L. (2002) Statistical mechanics of complex networks. Reviews of modern physics, 74(1), 47-97.
Allen, P. M. (1998) Cities as Self-Organising Complex Systems. In: Bertuglia, C.S., Bianchi, G. and Mela. A. (eds.) The City and Its Sciences. Physica-Verlag HD. Physica-Verlag, Heidelberg, 95-144.
Ascher, F. 2004. Metapolis. A Third Modern Urban Revolution. Change in Urban Scale and Shape in France. In: Bölling, T. L. &.Sieverts, T. (eds.) Mitten am Rand. Auf dem Weg von der Vorstadt über die Zwischenstadt zur Regionalen Stadtlandschaft. (Zwischenstadt Band 1). Wuppertal: Verlag Müller + Busmann KG.
Batty, M. (2009) Cities as Complex Systems: Scaling, Interaction, Networks, Dynamics and Urban Morphologies. In Encyclopedia of Complexity and Systems Science. Springer. 1-62
-----. (2018) Inventing Future Cities. Boston: MIT press.Batty, M., & Marshall, S. (2009) Centenary paper: The evolution of cities: Geddes,
Abercrombie and the new physicalism. The Town Planning Review, 80(6): 551-574.
Smart Urban Futures: Outlining the Smart City Planning Project 33
Bettencourt, L., & West, G. (2010) A unified theory of urban living. Nature, 467(7318): 912-913.
Boschma, R. & Martin, R. (2010) The aims and scope of evolutionary economic geography (No. 1001). Utrecht University, Department of Human Geography and Spatial Planning, Economic Geography Group.
Brenner, N. & Schmid, C. (2012) Planetary urbanization. In Gandy, M. (ed.), Urban Constellations. Berlin: Jovis, 10-13.
Caniggia, G., & Maffei, G. L. (2001) Interpreting Basic Building: Architectural Composition and Building Typology. Florence: Altralinea Edizioni.
Capra, F. (1996) The Web of Life: A New Scientific Understanding of Living Systems. Anchor: New York
Castells M. (1996) The Rise of the Network Society. Blackwell, Oxford. Conzen, M. R. (2004) Thinking About Urban Form: Papers on Urban Morphology, 1932-
1998. Bern: Peter Lang.De Roo, G., & Hillier, J. (2016) Complexity and Planning: Systems, Assemblages and
Simulations. Oxon: Routledge.Engin, Z., van Dijk, J., Lan, T., Longley, P. A., Treleaven, P., Batty, M., & Penn, A.
(2020) Data-driven urban management: Mapping the landscape. Journal of Urban Management, 9(2): 140-150.
Gabrys, J. (2014) Programming environments: Environmentality and citizen sensing in the smart city. Environment and Planning D: Society and Space, 32(1): 30-48.
Giddens A. (1984) The Constitution of Society: Outline of The Theory of Structuration. Berkeley and Los Angeles: University of California Press.
Harvey, D. (1999) Time—space compression and the postmodern. Modernity: After Modernity, 4: 98-118.
Hayles, N. K. (2006) Unfinished work: From cyborg to cognisphere. Theory, Culture & Society, 23(7-8): 159-166.
Hillier, B. (2007) Space is the Machine: A Configurational Theory of Architecture. London: Space Syntax.
Holland, J. H. (2000) Emergence: From Chaos to Order. Oxford: OUP.Kauffman, S. A. (1993) The origins of order: Self-organization and selection in evolution.
Oxford: Oxford University Press, USA.Krugman, P. (1996) The Self-organizing Economy. Cambridge, Massachusetts:
Blackwell.Li, X. G., Gao, Z. Y., Li, K. P., & Zhao, X. M. (2007) Relationship between
microscopic dynamics in traffic flow and complexity in networks. Physical
J. Partanen34
Review E, 76(1). 1-7.Mitchell, M. (2009) Complexity: A guided tour. Oxford: Oxford University Press. Moudon, A. V. (1997) Urban morphology as an emerging interdisciplinary field.
Urban Morphology, 1(1): 3-10.Oswald, F., Baccini, P., & Michaeli, M. (2003) Netzstadt. Springer Science &
Business Media. Basel Boston Berlin: Birkhäuser.Partanen, J. (2018). ‘Don’t Fix It if It Ain’t Broke’: Encounters with Planning for Complex
Self-Organizing Cities. (Tampere University of Technology. Publication; Vol. 1514). Tampere University of Technology.
Portugali, J. (1999) Self-organization and the City. Springer Science & Business Media. place of publication Berlin and Heidelberg: Springer-Verlag.
Portugali, J., Meyer, H., Stolk, E., & Tan, E. (Eds.). (2012) Complexity Theories of Cities Have Come of Age: An Overview with Implications to Urban Planning and Design. Springer Science & Business Media. Berlin Heidelberg: Springer-Verlag.
Townsend, A. M. (2013) Smart cities: Big data, civic hackers, and the quest for a new utopia. New York/London: WW Norton & Company.
Walker, B., & Salt, D. (2012) Resilience Thinking: Sustaining Ecosystems and People in a Changing World. Washington: Island press.
Wang, P., Hunter, T., Bayen, A. M., Schechtner, K., & González, M. C. (2012 Understanding road usage patterns in urban areas. Scientific Reports, 2, 1001 1-6. [accessed online 15.12.2020 https://www.nature.com/articles/srep01001]
Wang, W., Bubb, H., Wets, G., & Wang, F. (2014) Advances in Mobility Theories, Methodologies, and Applications. (Editorial). Advances in Mechanical Engineering. 1-2 DOI:
10.1155/2014/831689Watts D. J. and Strogatz S. H. (1998) Collective dynamics of ‘small-world’ networks,
Nature, 393: 440-442.
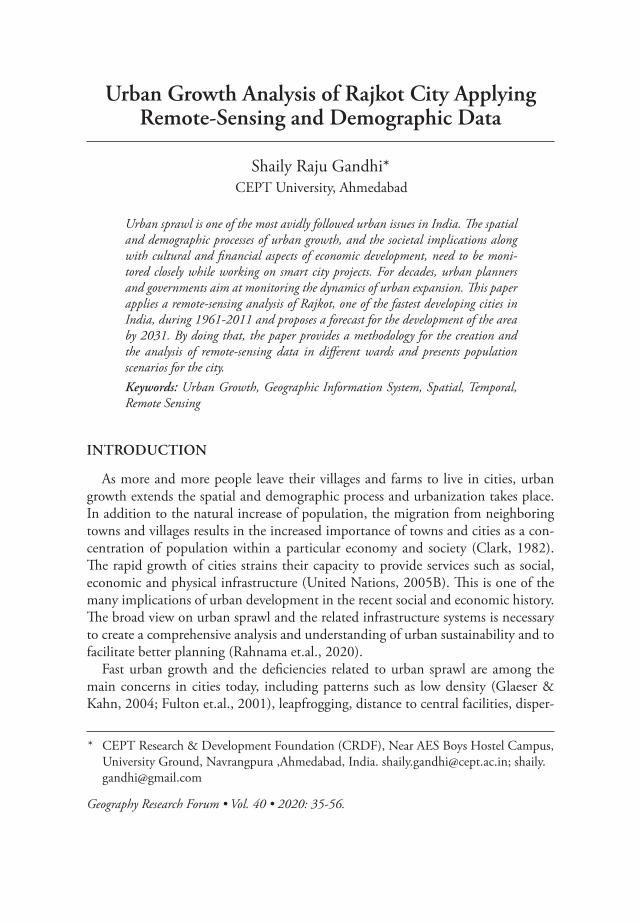
Urban Growth Analysis of Rajkot City Applying Remote-Sensing and Demographic Data
Urban sprawl is one of the most avidly followed urban issues in India. The spatial and demographic processes of urban growth, and the societal implications along with cultural and financial aspects of economic development, need to be moni-tored closely while working on smart city projects. For decades, urban planners and governments aim at monitoring the dynamics of urban expansion. This paper applies a remote-sensing analysis of Rajkot, one of the fastest developing cities in India, during 1961-2011 and proposes a forecast for the development of the area by 2031. By doing that, the paper provides a methodology for the creation and the analysis of remote-sensing data in different wards and presents population scenarios for the city.Keywords: Urban Growth, Geographic Information System, Spatial, Temporal, Remote Sensing
Shaily Raju Gandhi*
Geography Research Forum • Vol. 40 • 2020: 35-56.
* CEPT Research & Development Foundation (CRDF), Near AES Boys Hostel Campus, University Ground, Navrangpura ,Ahmedabad, India. [email protected]; shaily. [email protected]
CEPT University, Ahmedabad
INTRODUCTION
As more and more people leave their villages and farms to live in cities, urban growth extends the spatial and demographic process and urbanization takes place. In addition to the natural increase of population, the migration from neighboring towns and villages results in the increased importance of towns and cities as a con-centration of population within a particular economy and society (Clark, 1982).The rapid growth of cities strains their capacity to provide services such as social, economic and physical infrastructure (United Nations, 2005B). This is one of the many implications of urban development in the recent social and economic history. The broad view on urban sprawl and the related infrastructure systems is necessary to create a comprehensive analysis and understanding of urban sustainability and to facilitate better planning (Rahnama et.al., 2020).
Fast urban growth and the deficiencies related to urban sprawl are among the main concerns in cities today, including patterns such as low density (Glaeser & Kahn, 2004; Fulton et.al., 2001), leapfrogging, distance to central facilities, disper-
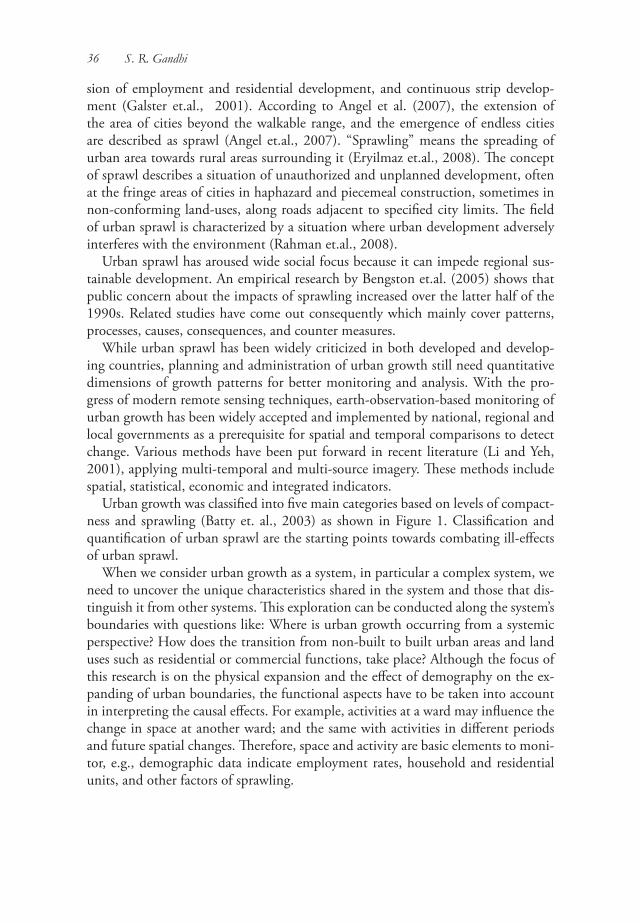
36 S. R. Gandhi
sion of employment and residential development, and continuous strip develop-ment (Galster et.al., 2001). According to Angel et al. (2007), the extension of the area of cities beyond the walkable range, and the emergence of endless cities are described as sprawl (Angel et.al., 2007). “Sprawling” means the spreading of urban area towards rural areas surrounding it (Eryilmaz et.al., 2008). The concept of sprawl describes a situation of unauthorized and unplanned development, often at the fringe areas of cities in haphazard and piecemeal construction, sometimes in non-conforming land-uses, along roads adjacent to specified city limits. The field of urban sprawl is characterized by a situation where urban development adversely interferes with the environment (Rahman et.al., 2008).
Urban sprawl has aroused wide social focus because it can impede regional sus-tainable development. An empirical research by Bengston et.al. (2005) shows that public concern about the impacts of sprawling increased over the latter half of the 1990s. Related studies have come out consequently which mainly cover patterns, processes, causes, consequences, and counter measures.
While urban sprawl has been widely criticized in both developed and develop-ing countries, planning and administration of urban growth still need quantitative dimensions of growth patterns for better monitoring and analysis. With the pro-gress of modern remote sensing techniques, earth-observation-based monitoring of urban growth has been widely accepted and implemented by national, regional and local governments as a prerequisite for spatial and temporal comparisons to detect change. Various methods have been put forward in recent literature (Li and Yeh, 2001), applying multi-temporal and multi-source imagery. These methods include spatial, statistical, economic and integrated indicators.
Urban growth was classified into five main categories based on levels of compact-ness and sprawling (Batty et. al., 2003) as shown in Figure 1. Classification and quantification of urban sprawl are the starting points towards combating ill-effects of urban sprawl.
When we consider urban growth as a system, in particular a complex system, we need to uncover the unique characteristics shared in the system and those that dis-tinguish it from other systems. This exploration can be conducted along the system’s boundaries with questions like: Where is urban growth occurring from a systemic perspective? How does the transition from non-built to built urban areas and land uses such as residential or commercial functions, take place? Although the focus of this research is on the physical expansion and the effect of demography on the ex-panding of urban boundaries, the functional aspects have to be taken into account in interpreting the causal effects. For example, activities at a ward may influence the change in space at another ward; and the same with activities in different periods and future spatial changes. Therefore, space and activity are basic elements to moni-tor, e.g., demographic data indicate employment rates, household and residential units, and other factors of sprawling.
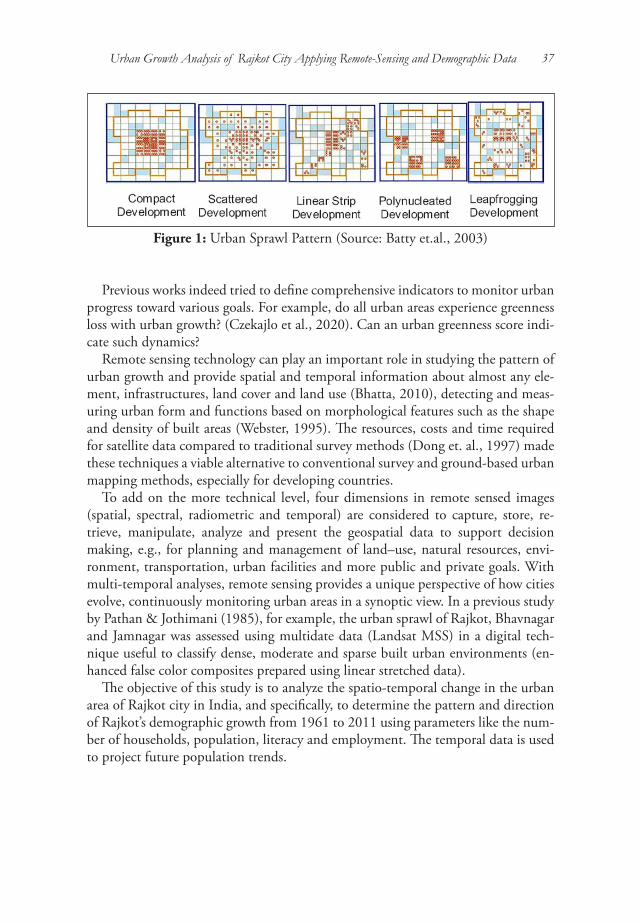
Urban Growth Analysis of Rajkot City Applying Remote-Sensing and Demographic Data 37
Figure 1: Urban Sprawl Pattern (Source: Batty et.al., 2003)
Previous works indeed tried to define comprehensive indicators to monitor urban progress toward various goals. For example, do all urban areas experience greenness loss with urban growth? (Czekajlo et al., 2020). Can an urban greenness score indi-cate such dynamics?
Remote sensing technology can play an important role in studying the pattern of urban growth and provide spatial and temporal information about almost any ele-ment, infrastructures, land cover and land use (Bhatta, 2010), detecting and meas-uring urban form and functions based on morphological features such as the shape and density of built areas (Webster, 1995). The resources, costs and time required for satellite data compared to traditional survey methods (Dong et. al., 1997) made these techniques a viable alternative to conventional survey and ground-based urban mapping methods, especially for developing countries.
To add on the more technical level, four dimensions in remote sensed images (spatial, spectral, radiometric and temporal) are considered to capture, store, re-trieve, manipulate, analyze and present the geospatial data to support decision making, e.g., for planning and management of land–use, natural resources, envi-ronment, transportation, urban facilities and more public and private goals. With multi-temporal analyses, remote sensing provides a unique perspective of how cities evolve, continuously monitoring urban areas in a synoptic view. In a previous study by Pathan & Jothimani (1985), for example, the urban sprawl of Rajkot, Bhavnagar and Jamnagar was assessed using multidate data (Landsat MSS) in a digital tech-nique useful to classify dense, moderate and sparse built urban environments (en-hanced false color composites prepared using linear stretched data).
The objective of this study is to analyze the spatio-temporal change in the urban area of Rajkot city in India, and specifically, to determine the pattern and direction of Rajkot’s demographic growth from 1961 to 2011 using parameters like the num-ber of households, population, literacy and employment. The temporal data is used to project future population trends.
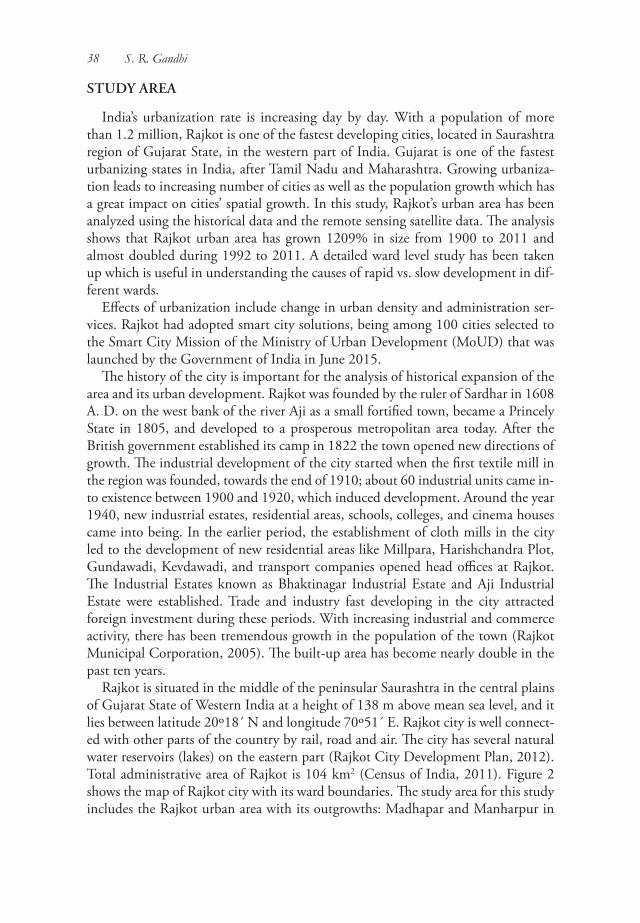
38 S. R. Gandhi
STUDY AREA
India’s urbanization rate is increasing day by day. With a population of more than 1.2 million, Rajkot is one of the fastest developing cities, located in Saurashtra region of Gujarat State, in the western part of India. Gujarat is one of the fastest urbanizing states in India, after Tamil Nadu and Maharashtra. Growing urbaniza-tion leads to increasing number of cities as well as the population growth which has a great impact on cities’ spatial growth. In this study, Rajkot’s urban area has been analyzed using the historical data and the remote sensing satellite data. The analysis shows that Rajkot urban area has grown 1209% in size from 1900 to 2011 and almost doubled during 1992 to 2011. A detailed ward level study has been taken up which is useful in understanding the causes of rapid vs. slow development in dif-ferent wards.
Effects of urbanization include change in urban density and administration ser-vices. Rajkot had adopted smart city solutions, being among 100 cities selected to the Smart City Mission of the Ministry of Urban Development (MoUD) that was launched by the Government of India in June 2015.
The history of the city is important for the analysis of historical expansion of the area and its urban development. Rajkot was founded by the ruler of Sardhar in 1608 A. D. on the west bank of the river Aji as a small fortified town, became a Princely State in 1805, and developed to a prosperous metropolitan area today. After the British government established its camp in 1822 the town opened new directions of growth. The industrial development of the city started when the first textile mill in the region was founded, towards the end of 1910; about 60 industrial units came in-to existence between 1900 and 1920, which induced development. Around the year 1940, new industrial estates, residential areas, schools, colleges, and cinema houses came into being. In the earlier period, the establishment of cloth mills in the city led to the development of new residential areas like Millpara, Harishchandra Plot, Gundawadi, Kevdawadi, and transport companies opened head offices at Rajkot. The Industrial Estates known as Bhaktinagar Industrial Estate and Aji Industrial Estate were established. Trade and industry fast developing in the city attracted foreign investment during these periods. With increasing industrial and commerce activity, there has been tremendous growth in the population of the town (Rajkot Municipal Corporation, 2005). The built-up area has become nearly double in the past ten years.
Rajkot is situated in the middle of the peninsular Saurashtra in the central plains of Gujarat State of Western India at a height of 138 m above mean sea level, and it lies between latitude 20º18´ N and longitude 70º51´ E. Rajkot city is well connect-ed with other parts of the country by rail, road and air. The city has several natural water reservoirs (lakes) on the eastern part (Rajkot City Development Plan, 2012). Total administrative area of Rajkot is 104 km2 (Census of India, 2011). Figure 2 shows the map of Rajkot city with its ward boundaries. The study area for this study includes the Rajkot urban area with its outgrowths: Madhapar and Manharpur in
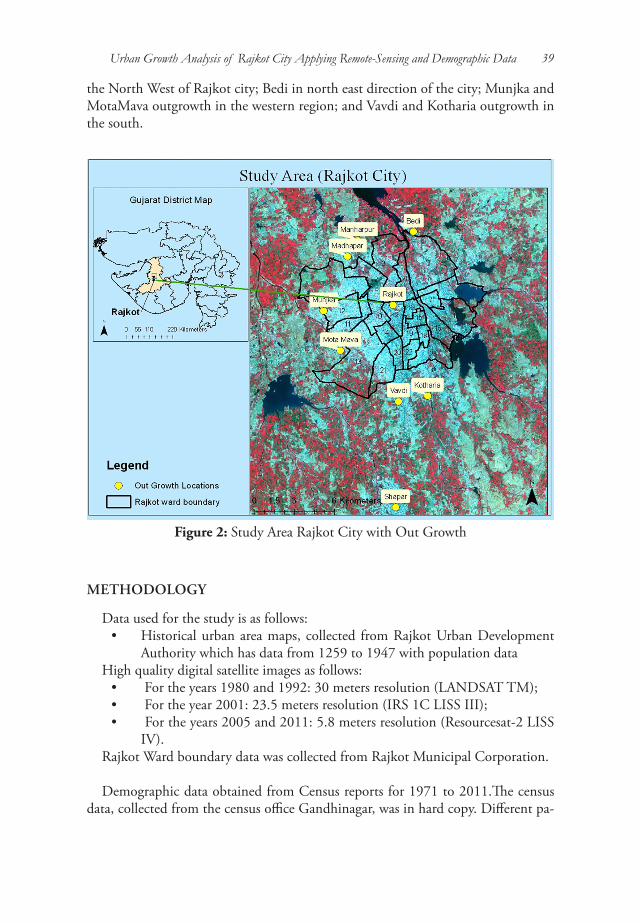
Urban Growth Analysis of Rajkot City Applying Remote-Sensing and Demographic Data 39
the North West of Rajkot city; Bedi in north east direction of the city; Munjka and MotaMava outgrowth in the western region; and Vavdi and Kotharia outgrowth in the south.
Figure 2: Study Area Rajkot City with Out Growth
METHODOLOGY
Data used for the study is as follows:• Historical urban area maps, collected from Rajkot Urban Development
Authority which has data from 1259 to 1947 with population dataHigh quality digital satellite images as follows:
• For the years 1980 and 1992: 30 meters resolution (LANDSAT TM);• For the year 2001: 23.5 meters resolution (IRS 1C LISS III);• For the years 2005 and 2011: 5.8 meters resolution (Resourcesat-2 LISS
IV).Rajkot Ward boundary data was collected from Rajkot Municipal Corporation.
Demographic data obtained from Census reports for 1971 to 2011.The census data, collected from the census office Gandhinagar, was in hard copy. Different pa-
40 S. R. Gandhi
rameters like the number of households, population, literacy, numbers of workers and non-workers were studied from 1961 to 2011. Ward level study was carried out for the growth rate from 2001 to 2011 for the above parameters. Gross density and net density were calculated to identify the maximum developing ward. A composite growth index is derived to show the growth rate at ward level.
Remote sensing data and historical maps, obtained from Rajkot Urban Development Authority, were spatially adjusted with the existing data. Maps for the years 1980, 1992, 2001, 2005 and 2011 were digitized and georectified (UTM WGS 84 projection system, and using visual interpretation). Microsoft Excel 2011 was used for processing census data and ArcGIS 10.2 was used for spatial analysis.
The urban maps extracted from all the 12 time period data have been resampled to 25m pixel size to bring uniformity in all the urban maps. Overlaying of urban built up on each other in Geographical Information System (GIS) environment provided the urban growth pattern map of the study area i.e., Rajkot from year 1259 to 2011. This map has been analyzed to understand the urban sprawl pattern and direction.
Buffer rings at intervals of 1 km incremental buffer has been created from core city center of Rajkot and overlaid on the urban growth pattern map. Urban growth in various directions such as north, north-east, east, south-east, south, south-west, west and north-west was analyzed.
The structural features, as captured in this study, are related to functional features, among them human wellbeing and other SDGs (Giles-Corti, Lowe & Arundel, 2020). Planning urban environments means also shaping cities for health (e.g., Glouberman et al., 2006; Angel et al., 2011).
FINDINGS
Figure 3 presents the growth of Rajkot city from 1259 A.D. to 2011. The growth pattern observed is compact development around the CBD. After 2000, develop-ment has been noticed all along the fringe and more along the transport corridor.
In 1259 A.D., when Rajkot city was established on the east bank of river Aji, it had an area of 0.0078 sq. km. Land utilization had just begun in that time. A small black dot in the center of the map in Figure 3 shows the area of Rajkot city in 1259 AD. Light pink color in the map shows the area of Rajkot city from 1550 to 1646 AD. During that period land utilization for residential and agrarian purpose had started. It was a hamlet stage and the area had increased to 0.0184 sq. km. The Green color shows the boundary of Rajkot urban area for 1646-1744 when perma-nent establishment of the village took place. Area had increased to 0.0595 sq. km. Development was observed in linear pattern in both North and South directions. By 1813 town fortification had taken place and administrative headquarters were established. Orange boundary shows extent of urban area which is 0.3039 sq. km.
Urban Growth Analysis of Rajkot City Applying Remote-Sensing and Demographic Data 41
Development was seen in a western direction of Aji River. Until 1813 development was within half kilometer from the core city center. Light blue boundary shows extent of urban area from 1882 to 1990. After British government established its camp in 1822 the town opened new directions of growth. The western side of river Aji was expanding and the urban area increased to 2.6 sq. km.
More development was observed in a North West direction during this period and the development in this direction had gone up to 2 km from the core city center. Red color shows the urban development on both the sides of the river from 1990 to 1947 in north, south, south west directions at a distance of 2km from the core city center and the area has increased to 5.16 sq. km. The development had taken place around the exiting urban area.
Purple color in the map shows the urban area of Rajkot from 1947 to 1961, dur-ing this time development had occurred on both the sides of the river. In this period development was observed in east and south west direction due to establishment of the Industrial Estates known as Bhaktinagar Industrial Estate and Aji Industrial Estate. The urban area increased to 6.93 sq km. Cream color shows the urban area extracted from satellite image. During 1980 the area had become double that of 1961. More urban growth was observed in the east and south directions compared to the west side of Aji river. Development has been expanded to 3 kms from city center in west and south west directions.
Pink color shows the urban area for the year 1992 after the tremendous growth in all directions from 1980 to 1992. In 1992 the urban area increased to 30 sq. km. Lesser development has been seen in the northern direction but maximum develop-ment is seen in the other three directions. The development in various directions such as north, west and east has been expanded up to 3 kms from city center, in south and south east directions. Urban development has expanded to 4 kms, and in south-west and west directions urban development has expanded to 5 kms.
Purple color shows the urban area in 2001 where only 7 sq. km of urban growth is seen. From 1992 to 2001 a new area has developed in the south. Growth is ob-served up to 4 km in a north-west direction and urban development is seen up to 7 km from the city center in south, south-west and western direction.
Magenta color shows the urban area in 2005. Lots of small villages and urban growth are seen in from 2001 to 2005. Liner growth is observed in various direc-tions such as north development 2kms from city center; south-west, north-east and south-east urban development 6 kms from the city center in a linear strip; south urban development is seen beyond 10kms from the city center in a linear strip; west and north west urban development is seen beyond 10 kms from the city center in a leapfrog pattern.
Dark green color in the map shows the urban area for 2011, observed as 67.55 sq. km. Most of the urban growth is seen on the fringes of the urban area in 2005. There is a scattered development pattern as well as leapfrog urban sprawl pattern during 2001 to 2011 as development is in an uncontinuous manner. Liner growth
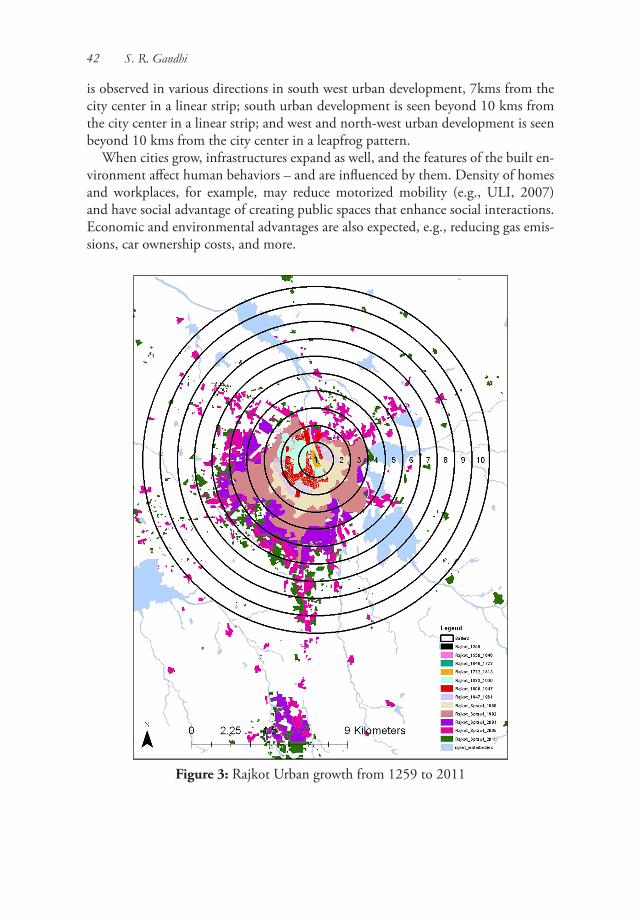
42 S. R. Gandhi
is observed in various directions in south west urban development, 7kms from the city center in a linear strip; south urban development is seen beyond 10 kms from the city center in a linear strip; and west and north-west urban development is seen beyond 10 kms from the city center in a leapfrog pattern.
When cities grow, infrastructures expand as well, and the features of the built en-vironment affect human behaviors – and are influenced by them. Density of homes and workplaces, for example, may reduce motorized mobility (e.g., ULI, 2007) and have social advantage of creating public spaces that enhance social interactions. Economic and environmental advantages are also expected, e.g., reducing gas emis-sions, car ownership costs, and more.
Figure 3: Rajkot Urban growth from 1259 to 2011
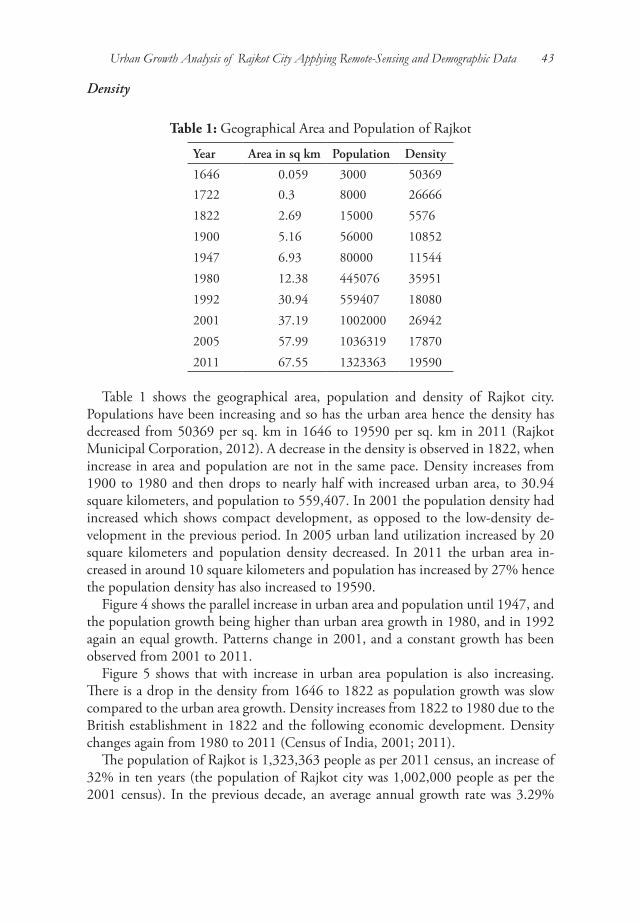
Urban Growth Analysis of Rajkot City Applying Remote-Sensing and Demographic Data 43
Density
Table 1: Geographical Area and Population of Rajkot
Year Area in sq km Population Density
1646 0.059 3000 503691722 0.3 8000 266661822 2.69 15000 55761900 5.16 56000 108521947 6.93 80000 115441980 12.38 445076 359511992 30.94 559407 180802001 37.19 1002000 269422005 57.99 1036319 178702011 67.55 1323363 19590
Table 1 shows the geographical area, population and density of Rajkot city. Populations have been increasing and so has the urban area hence the density has decreased from 50369 per sq. km in 1646 to 19590 per sq. km in 2011 (Rajkot Municipal Corporation, 2012). A decrease in the density is observed in 1822, when increase in area and population are not in the same pace. Density increases from 1900 to 1980 and then drops to nearly half with increased urban area, to 30.94 square kilometers, and population to 559,407. In 2001 the population density had increased which shows compact development, as opposed to the low-density de-velopment in the previous period. In 2005 urban land utilization increased by 20 square kilometers and population density decreased. In 2011 the urban area in-creased in around 10 square kilometers and population has increased by 27% hence the population density has also increased to 19590.
Figure 4 shows the parallel increase in urban area and population until 1947, and the population growth being higher than urban area growth in 1980, and in 1992 again an equal growth. Patterns change in 2001, and a constant growth has been observed from 2001 to 2011.
Figure 5 shows that with increase in urban area population is also increasing. There is a drop in the density from 1646 to 1822 as population growth was slow compared to the urban area growth. Density increases from 1822 to 1980 due to the British establishment in 1822 and the following economic development. Density changes again from 1980 to 2011 (Census of India, 2001; 2011).
The population of Rajkot is 1,323,363 people as per 2011 census, an increase of 32% in ten years (the population of Rajkot city was 1,002,000 people as per the 2001 census). In the previous decade, an average annual growth rate was 3.29%
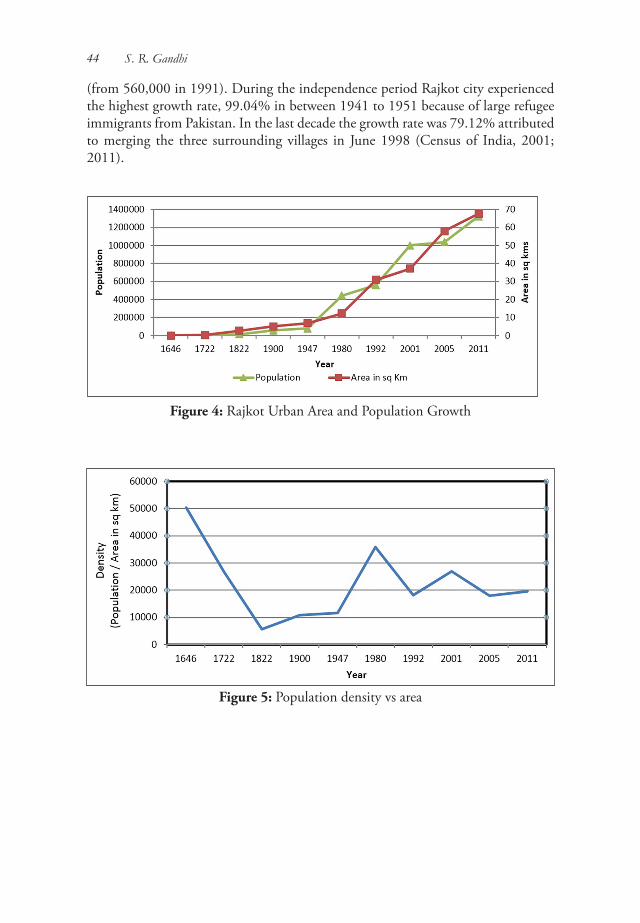
44 S. R. Gandhi
(from 560,000 in 1991). During the independence period Rajkot city experienced the highest growth rate, 99.04% in between 1941 to 1951 because of large refugee immigrants from Pakistan. In the last decade the growth rate was 79.12% attributed to merging the three surrounding villages in June 1998 (Census of India, 2001; 2011).
Figure 4: Rajkot Urban Area and Population Growth
Figure 5: Population density vs area
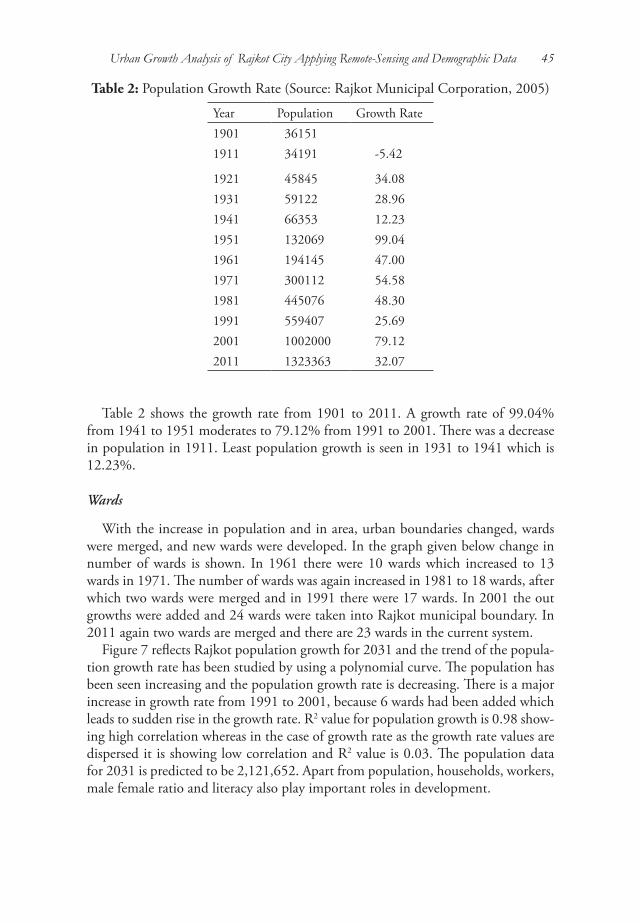
Urban Growth Analysis of Rajkot City Applying Remote-Sensing and Demographic Data 45
Table 2: Population Growth Rate (Source: Rajkot Municipal Corporation, 2005)
Year Population Growth Rate1901 361511911 34191 -5.42
1921 45845 34.081931 59122 28.961941 66353 12.231951 132069 99.041961 194145 47.001971 300112 54.581981 445076 48.301991 559407 25.692001 1002000 79.122011 1323363 32.07
Table 2 shows the growth rate from 1901 to 2011. A growth rate of 99.04% from 1941 to 1951 moderates to 79.12% from 1991 to 2001. There was a decrease in population in 1911. Least population growth is seen in 1931 to 1941 which is 12.23%.
Wards
With the increase in population and in area, urban boundaries changed, wards were merged, and new wards were developed. In the graph given below change in number of wards is shown. In 1961 there were 10 wards which increased to 13 wards in 1971. The number of wards was again increased in 1981 to 18 wards, after which two wards were merged and in 1991 there were 17 wards. In 2001 the out growths were added and 24 wards were taken into Rajkot municipal boundary. In 2011 again two wards are merged and there are 23 wards in the current system.
Figure 7 reflects Rajkot population growth for 2031 and the trend of the popula-tion growth rate has been studied by using a polynomial curve. The population has been seen increasing and the population growth rate is decreasing. There is a major increase in growth rate from 1991 to 2001, because 6 wards had been added which leads to sudden rise in the growth rate. R2 value for population growth is 0.98 show-ing high correlation whereas in the case of growth rate as the growth rate values are dispersed it is showing low correlation and R2 value is 0.03. The population data for 2031 is predicted to be 2,121,652. Apart from population, households, workers, male female ratio and literacy also play important roles in development.
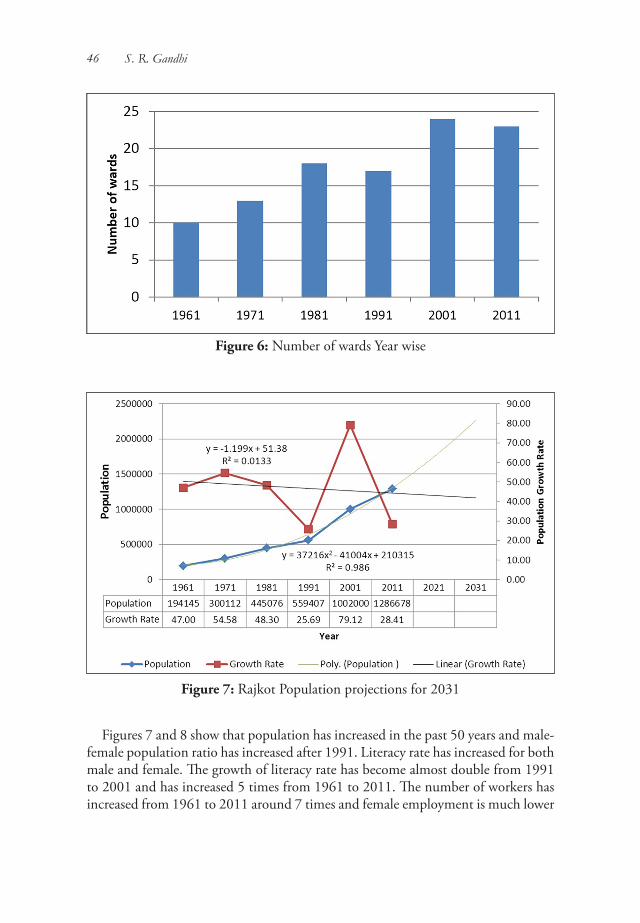
46 S. R. Gandhi
Figure 6: Number of wards Year wise
Figure 7: Rajkot Population projections for 2031
Figures 7 and 8 show that population has increased in the past 50 years and male-female population ratio has increased after 1991. Literacy rate has increased for both male and female. The growth of literacy rate has become almost double from 1991 to 2001 and has increased 5 times from 1961 to 2011. The number of workers has increased from 1961 to 2011 around 7 times and female employment is much lower
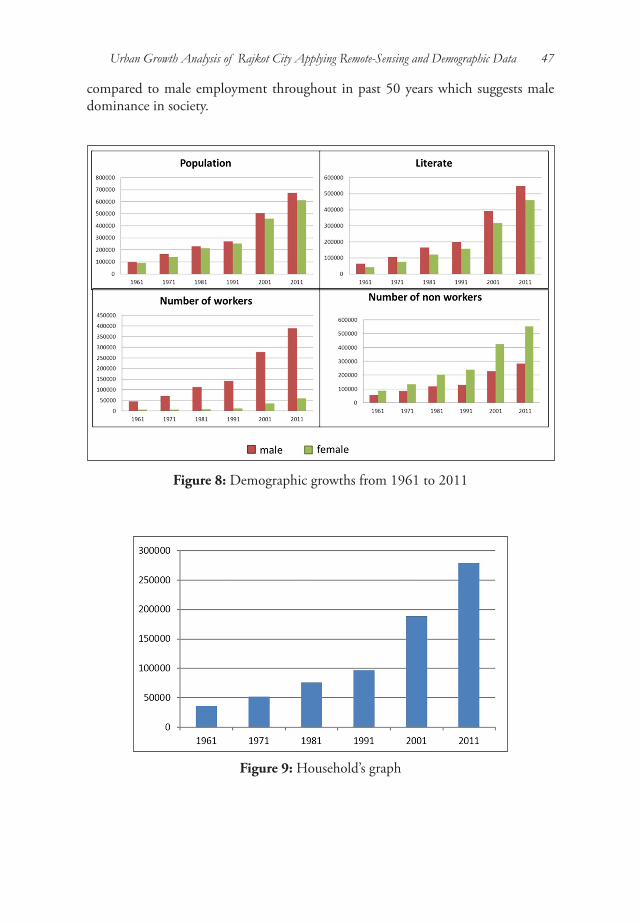
Urban Growth Analysis of Rajkot City Applying Remote-Sensing and Demographic Data 47
compared to male employment throughout in past 50 years which suggests male dominance in society.
Figure 8: Demographic growths from 1961 to 2011
Figure 9: Household’s graph
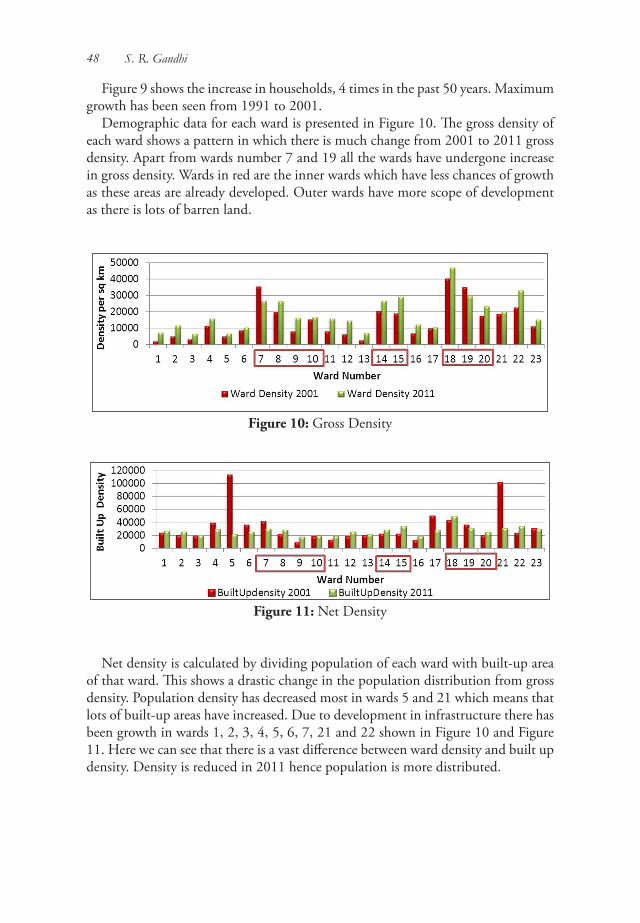
48 S. R. Gandhi
Figure 9 shows the increase in households, 4 times in the past 50 years. Maximum growth has been seen from 1991 to 2001.
Demographic data for each ward is presented in Figure 10. The gross density of each ward shows a pattern in which there is much change from 2001 to 2011 gross density. Apart from wards number 7 and 19 all the wards have undergone increase in gross density. Wards in red are the inner wards which have less chances of growth as these areas are already developed. Outer wards have more scope of development as there is lots of barren land.
Figure 10: Gross Density
Figure 11: Net Density
Net density is calculated by dividing population of each ward with built-up area of that ward. This shows a drastic change in the population distribution from gross density. Population density has decreased most in wards 5 and 21 which means that lots of built-up areas have increased. Due to development in infrastructure there has been growth in wards 1, 2, 3, 4, 5, 6, 7, 21 and 22 shown in Figure 10 and Figure 11. Here we can see that there is a vast difference between ward density and built up density. Density is reduced in 2011 hence population is more distributed.

Urban Growth Analysis of Rajkot City Applying Remote-Sensing and Demographic Data 49
Formula for gross density and net density are as follows:Ward Density = Ward Population / Ward AreaBuilt Up Density = Ward Population / Built Up Area in a Ward
Lesser change between ward density and built up density is observed in inner wards compared to outer wards, as new built up areas can develop in the outer wards. This can be clearly observed in Figure 12 and Figure 13. The combined growth rate is calculated on the basis of growth rate of the built-up area, population, households, workers, and non-workers. Using these five parameters, a combined growth rate for all wards is calculated and the highest growth ward is identified. Figures 14-17 show the growth rate of population, households, workers and non-workers, and Figure 18 shows the combined growth rate. The growth rate has been calculated from 2001 to 2011 using the following formula:
Growth Rate = (End Value / Start Value) (1 / Periods - 1) -1
Figure 14: Population growth rate 2001 to 2011Population growth rate is seen more in the western side of the river. Wards 1, 2,
3, 9, 11, 12, 13 and 16 have high population growth rate. Whereas in wards 4, 5, 8, 14, 15, 18, 22 and 23 there is medium growth rate and ward number 6, 7, 10,
17, 19, 20 and 21 have very low growth
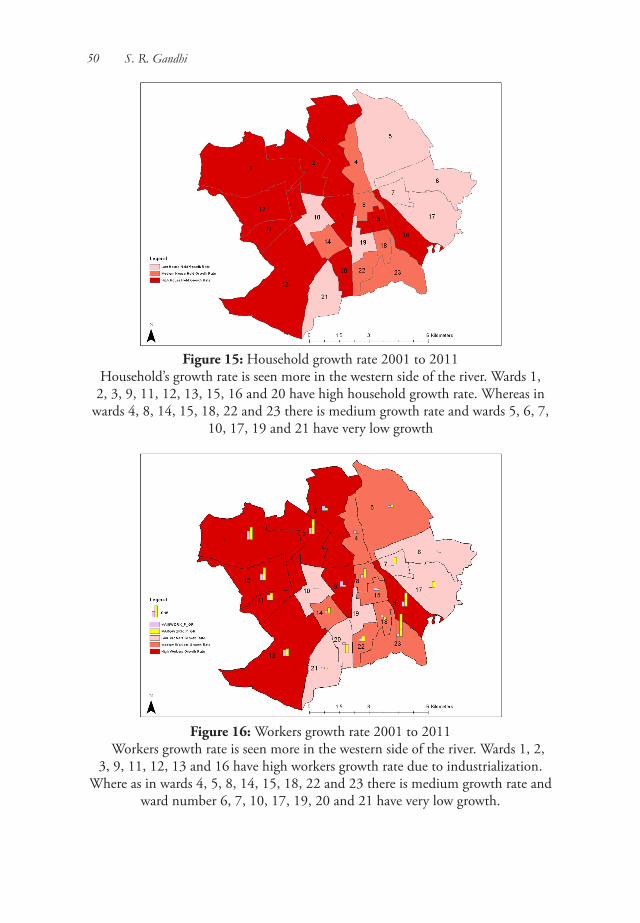
50 S. R. Gandhi
Figure 15: Household growth rate 2001 to 2011Household’s growth rate is seen more in the western side of the river. Wards 1,
2, 3, 9, 11, 12, 13, 15, 16 and 20 have high household growth rate. Whereas in wards 4, 8, 14, 15, 18, 22 and 23 there is medium growth rate and wards 5, 6, 7,
10, 17, 19 and 21 have very low growth
Figure 16: Workers growth rate 2001 to 2011Workers growth rate is seen more in the western side of the river. Wards 1, 2,
3, 9, 11, 12, 13 and 16 have high workers growth rate due to industrialization. Where as in wards 4, 5, 8, 14, 15, 18, 22 and 23 there is medium growth rate and
ward number 6, 7, 10, 17, 19, 20 and 21 have very low growth.
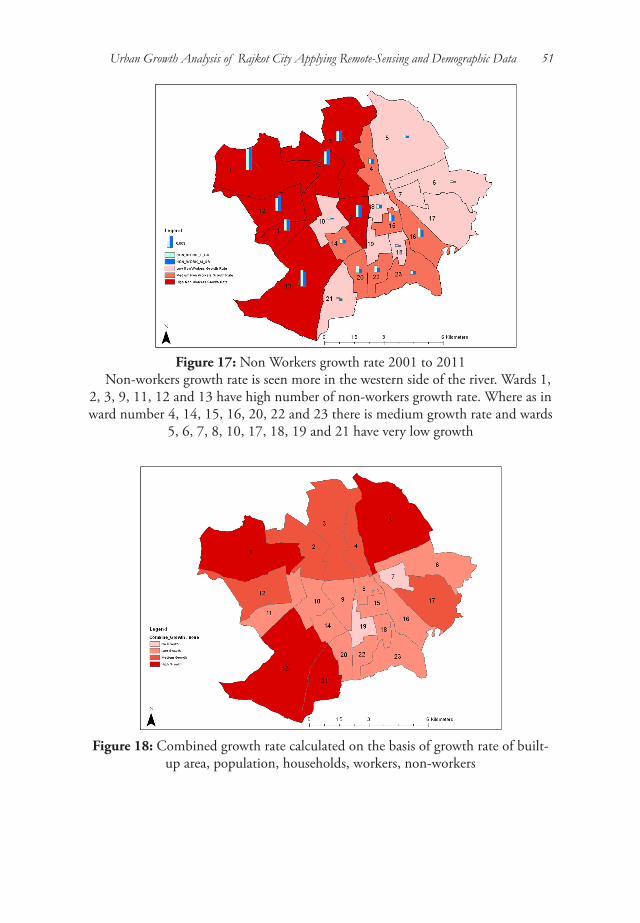
Urban Growth Analysis of Rajkot City Applying Remote-Sensing and Demographic Data 51
Figure 17: Non Workers growth rate 2001 to 2011Non-workers growth rate is seen more in the western side of the river. Wards 1,
2, 3, 9, 11, 12 and 13 have high number of non-workers growth rate. Where as in ward number 4, 14, 15, 16, 20, 22 and 23 there is medium growth rate and wards
5, 6, 7, 8, 10, 17, 18, 19 and 21 have very low growth
Figure 18: Combined growth rate calculated on the basis of growth rate of built-up area, population, households, workers, non-workers
52 S. R. Gandhi
Figure 18 shows the composite growth rate, with maximum growth in wards 1, 5, 13 and 21. Ward 1 is located on the West Zone of RMC, which had the highest infrastructure development throughout this period of time. The increased growth is the result of infrastructure development in the last 5 years. Maximum number of housing projects was carried out in West Zone of Rajkot Municipal Corporation. West zone is also having population of Middle-Class and Upper Middle Class cat-egories, thus more investment is seen on the western part of the city. Institutional fa-cilities & recreational facilities like schools, colleges, university, hospitals, shopping malls, and gardens are in higher number in the western part of the city. Bus rapid transit (BRT) lines with multiple routes create a corridor for public transportation in the western part of the city and improves the attraction of the western zone. Fast implementation of town planning schemes also plays a significant role in the devel-opment of ward number 1. Apart from the observed changes in the infrastructure and institutional development in the western part of the city, influence of political leaders also affects the growth of the western part of the city. At the eastern part of the city, being on the banks of Aji River, industrial growth is higher than residential development. No growth is shown in wards 7 and 19 because of lower residential preference in the industrial and commercial areas that occupy theses wards.
SUMMARY
The analysis clearly shows that Rajkot urban area has increased 1209% in size from 1900 to 2011 and almost doubled in two decades during 1992-2011, after becoming metro city. More thrust on growth was seen in South, South West, North and North West directions. Lower growth is seen in the eastern direction as land area is almost saturated in eastern and south-eastern directions due to several natural water reservoirs. A trend of growth in all directions is visible till 1992 after which the development is seen more on the fringes and along the highways connecting two cities. Leap frog development is visible from 2005 to 2011, and a trend of linear growth towards the south is visible during 2001 to 2011.
In the southern direction urban development has reached 10 kilometers from the city center till 2011. In the western direction the urban development is observed up to 7 kilometers and in north-west direction the urban development is visible up to 8 kilometers and in north east direction liner growth is observed 6 kilometers from the city center. There is urban development up to 5 kilometers from city center in south-east direction. There is around 3 kilometers growth in the eastern direction from city center and around 2 kilometers urban development in northern direction.
Urban Growth Analysis of Rajkot City Applying Remote-Sensing and Demographic Data 53
CONCLUSIONS
This study focuses on the gross and net density of the wards showing actual urban area population scenarios. The analysis of this study can be used by urban planners to envision the growth of the city. The analysis of remote sensing data enables in-depth monitoring of urban growth pattern. The monitoring of urban growth using GIS is easy to understand and provides a clear view of how urban growth has taken place over a period of time in different directions. Rajkot area has grown at a very high rate. The pressure on infrastructure and surrounding land has also increased manifold. This is required for properly manage and proactively plan the growing urban area and infrastructure for sustainable development. Attempts were made to model the relationship between social diversity and the spatial configuration of growth, whether to other regions or into the inner-city. As stated by Taubenböck et al. (2020; 2), “Modeling approaches tried to better understand the complex under-lying processes shaping urban patterns. The complexity is also reflected in the fact that, like DNA, each city developed its own unique configuration. The most obvi-ous configuration is the morphologic-spatial structure”. The differences between cities across the globe, in their spatial firm, depend on geographical and cultural aspects.
The analysis of urban growth patterns with respect to direction and distance from city center provides significant inputs for understanding the causes and consequenc-es of growth in particular directions. The analysis can be further used to under-stand the urban sprawl dynamics in the area, further modeling the growth scenarios. Future growth patterns can be assumed, to preplan the necessary infrastructure for the growing direction of the sprawl for sustainable development. Major challenges come in when sprawling takes place and the roads, drainage, water supply lines and many more basic facilities are developed to connect the sprawl location. This study provides a foundation to plan the direction of expanding the infrastructure to cater the requirement of the new growing areas.
Gross density and net density of the wards show the real scenario of the popu-lation of the urban area. There is a saturation of the population density in inner wards whereas the outer wards sprawl but their density is also changing. Density, destination and distance are among the features of the built environment that play a key role for walkability, according to the Draw-Down project that evaluated the environmental impact of having more walkable cities, together with demand, design and diversity.
Growth rate is calculated for sprawling, population, households, workers and non-workers for each ward and a composite growth is calculated which shows that highest growth has took place in wards 1, 5, 13, and 21. No growth has been seen in wards 7 and 9 as they are inner wards of industrial and commercial areas. While compact development belongs mainly to the planning domain, the related envi-ronmental features (Drawdown) are a matter of technological infrastructures, such
54 S. R. Gandhi
as streetlights, perceived public safety, and the coordination between the different means for mass transportation and last mile accessibility.
To conclude it can be observed that use of technology can make the planners better prepared for taking measures to make sure that all facilities are available in the direction of growth. It is also observed that rapid growth is majorly impacted by the industrialization which proves to be a major pull factor. Urbanization is a pro-cess which can be studied by understanding the temporal growth of the city along with the upcoming industrialization and investments. It is highly recommended to use remote sensing data to study the past growth of the city and its direction before planning the future expansion of the city. Therefore, providing a framework to arrange and analyze the differences in urban sprawl and density is important for understanding the dynamics of the spatial aspects of urban growth.
ACKNOWLEDGEMENT
The author is thankful to ISRO for providing the satellite data used in this study. The author is also thankful to Rajkot Municipal Corporation and Rajkot Urban Development Authority for their cooperation and support for this study. The author is highly thankful to CEPT University for providing the computing facilities. This paper is a part of Minor study for PhD degree carried out by Shaily Gandhi, CEPT University.
REFERENCES
Angel, S., Parent, J., and Civco, D. (2007) Urban Sprawl metrics: An analysis of global urban expansion using GIS. Proceedings of ASPRS 2007 Annual Conference (pp. 1-12). Tampa, Florida May 7-11.
Batty, M., Desyllas, J., & Duxbury, E. (2003) Safety in numbers? Modeling crowds and designing control for the Notting Hill Carnival. Urban Studies, 40( 8): 1573–1590.
Bengston, D. N., Potts, R. S., Fan, D. P., & Goetz, E. G. (2005) An analysis of the public discourse about urban sprawl in the United States: Monitoring concern about a major threat to forests. Forest Policy and Economics,7: 745–756.
Bhatta, B. (2010) Analysis of Urban Growth and Sprawl from Remote Sensing Data. Kolkata: Springer.Census of India (1971) New Delhi: Government of India.
Census of India (1981) New Delhi: Government of India.Census of India (1991) New Delhi: Government of India.Census of india (2001) New Delhi: Government of India.
Urban Growth Analysis of Rajkot City Applying Remote-Sensing and Demographic Data 55
Census of india (2011) New Delhi: Government of India.Clark, D. (1982) Urban Geography: An Introductory Guide. London: Taylor & Francis.Czekajlo, A., Coops, N. C., Wulder, M. A., Hermosilla, T., Lu, Y., White, J. C., &
van den Bosch, M. (2020) The urban greenness score: A satellite-based metric for multi-decadal characterization of urban land dynamics. International Journal of Applied Earth Observation and Geoinformation, 93. 102210. https://doi.org/10.1016/j.jag.2020.102210
Dong, Y., Forster, B., & Ticehurst, C. (1997) Radar backscatter analysis for urban environments. International Journal of Remote Sensing, 18(6): 1351–1364.
Drawdown project: https://drawdown.org/solutions/walkable-citiesEryilmaz, S. S., Cengiz, H., & Eryilmaz, Y. (2008) The urban sprawl model for an
affected metropolis. 44th ISoCaRP Congress 2008, (p. 12). China.Fulton, W., Pendall, R., Nguyen, M., & Harrison, A. (2001) Who Sprawls the
Most? How Growth Patterns Differ Across the US. Washington, DC: The Brookings Institution center on Urban and Metropolitan Policy.
Galster, G., Hanson, R., Wolman, H., Coleman, S., & Freihage, J. (2001) Wrestling sprawl to the ground: Defining and measuring an elusive concept. Housing Policy Debate ,12(4): 681–717.
Giles-Corti, B., Lowe, M., & Arundel, J. (2020) Achieving the SDGs: Evaluating indicators to be used to benchmark and monitor progress towards creating healthy and sustainable cities. Health Policy, 124(6): 581-590. https://doi.org/10.1016/j.healthpol.2019.03.001
Glaeser, E. L., & Kahn, M. E. (2004) The Handbook of Urban and Regional Economics. Oxford: Oxford University Press.
Glouberman, S., Gemar, M., Campsie, P., Miller, G., Armstrong, J., Newman, C. & Groff, P. (2006) A framework for improving health in cities: A discussion paper. Journal of Urban Health, 83(2): 325-338. https://www.ncbi.nlm.nih.gov/pmc/articles/PMC2527162 and https://dx.doi.org/10.1007/s11524-006-9034-9
Li, X., & Yeh, A. (2001b) Zoning land foragricultural protection by the integration of remote sensing, GIS, and cellular automata. Photogrammetric Engineering and Remote Sensing ,67( 4), 471-477.
Pathan, S.K. and Jothimani.P. (1985) Mapping and monitoring of urban sprawl using Landsat MSS data: Case studies of three major cities (Rajkot, Bhavangar, and Jamnagar) of saurashtra region, Gujarat. ISRS symposium on Remote Sensing for Planning and Environmental aspects of Urban and Rural settlements , December 27-28, 1985, Visakhapatnam, India, 45-52.

56 S. R. Gandhi
Rahman, G., Alam, D., & Islam, S. (2008) City growth with urban sprawl and problems of management. Proceedings of 44th ISOCARP Congress Dalian (pp. 19-23). China, September 19–23: International Society of City and Regional Planners and Urban Planning Society of China.
Rahnama, M. R., Wyatt, R., & Shaddel, L. (2020) A spatial-temporal analysis of urban growth in Melbourne; Were local government areas moving toward compact or sprawl from 2001–2016?. Applied Geography, 124, 102318. https://doi.org/10.1016/j.apgeog.2020.102318
Rajkot Municipal Corporation (2005) Rajkot City Development Plan. Rajkot: Rajkot Urban Development Authority
Rajkot Municipal Corporation (2012) Preparation of Second Generation City Development Plan for RMC as well as RUDA. Rajkot: CRISIL Risk and Infrastructure Solutions Limited.
Taubenböck, H., Debray, H., Qiu, C., Schmitt, M., Wang, Y., & Zhu, X. X. (2020) Seven city types representing morphologic configurations of cities across the globe. Cities, 105, 102814. https://doi.org/10.1016/j.cities.2020.102814
ULI (2007) Compact Development: Changing the Rules to Make It Happen. Urban Land Institute (ULI) Community Catalyst Report Number 6: Washington, D.C. http://uli.org/wp-content/uploads/ULI-Documents/Report-6-Compact-Development.ashx_.pdf
United Nations (2005b) World Urbanization Prospects: The 2005 Revision Population Division Department of Economics and Social Affairs. UN.
Webster, C. J. (1995) Urban morphological fingerprints. Environment and Planning B, 22: 279–297.
A Smart City Anomaly: The Near Becomes Far, The Far Becomes Near
Social change that results from new information and communication technologies is manifesting in the form of cities. A major body of literature has been dedicated to characterizing the structure of the networks formed by roads, buildings, land-marks, and other elements in urban environments. While most research in the field is dedicated to centrality, connectivity and integration, previous studies were focused on physical separation as the feature that best expresses socioeconomic seg-regation. This study adds a global layer to the local barriers, developing a ‘theory of smart city form’: urban networks that connect the far and separate the near, eliminate physical distance yet leave physical traces. Significant shifts are occurring in both global and the local processes associated with morphological separation within cities and information flow between cities. Smart cities, global citizens, and urban networks materialize a global regime of competition and innovation that tends to overwhelm local processes of socioeconomic integration and social mobility. Beyond the digital divide and digital literacy, new ecosystems of software development lead innovation in ways that connect the similar while neglecting distance and excluding closer but dissimilar social groups. The establishment of two layers of reference, the local and the global, aligns with the impact of tech-nological progress on the generic city and helps to specify the origins of separabil-ity, and the persistence of segregation and displacement. Global connectivity is outward-interconnected but inward-disconnecting. This paper reviews findings to identify this anomaly in global cities and concludes with a theoretical review to frame the proposed explanation for sharp divides in closer proximity. The myth of move fast and break things is not over yet in the accelerating globalization era where cities are connected and forced to move fast.Keywords: Complex systems, displacement, gentrification, global cities, globaliza-tion, integration, segregation, spatial cognition, spatial behavior, urban morphol-ogy, urban planning
Ronit Purian*Tel Aviv University
Geography Research Forum • Vol. 40 • 2020: 57-87.
* Environmental Studies Department, Urban Innovation and Sustainability Lab, Porter School of the Environment and Earth Sciences, Tel Aviv University, Israel. [email protected]
A Smart City Anomaly: The Near Becomes Far, The Far Becomes Near58 R. Purian
INTRODUCTION
Urban form is recognized as a main organizing force in city life. As cities grow, the nature of urban form is constantly transpiring, shaping societal conditions, and being shaped by them. What are the global and local processes that precede mor-phological separation in cities? What is the impact of the accelerated pace of infor-mation technologies (IT) implementation in various layers of city life? This paper proposes a perspective to describe and interpret changes in the spatial configuration of cities, viewing cities as part of the IT artifact.
The way we organize the form and the elements of our urban life depends on technological changes. The new ecosystem of applications is interlinked with eco-nomic processes, globalization and digitization, and the influences of global cities on local problems that citizens face today (e.g., Hopkin, 2020; Kostakis & Bauwens, 2014; Zuboff, 2015).
The technological revolution of personalized services affected the behaviors of in-dividuals in different socioeconomic groups and communities. Urban behaviors and personal applications will be presented herein to actualize the axis of urban tech-nologies. For about a dozen years technological innovations are increasingly acceler-ating and establishing unprecedented power, continuously evolving through signifi-cant leaps forward such as virtualization, stabilizing communication networks, code sharing, and other innovative infrastructures that alter phases of product develop-ment and programming. The technological progress goes beyond the diffusion of new digital products. A new ecosystem of software development drives the local and the global changes for more than a decade, and further accelerating in recent years.
Similarly, the global networks that constitute the industries and the sectors of software development advance the flows of people and money across cities and na-tions. Local citizens and local economy now compete with global corporations that lay networks of headquarters and interconnected institutions and affiliates, and gain an unbalanced advantage over the nation state. In view of urban networks through-out history, globalization today increases the divide between centers of world-cities and a periphery of urban and rural areas. A worldwide hub of hubs sets the digital divide of technology utilization and appropriation (Al-Natour & Benbasat, 2009), beyond the adoption and the acceptance and use of new technologies, and effectu-ates a transfer of power from countries to global cities and global citizens.
Technology intensifies inequality and – rather than connecting – a network econ-omy of personalized on-demand services, based on mobile applications, may un-chain individuals and communities. Increasing gaps in education, digital skills and earning capacity transform the landscape of economic competition. The promise of the sharing economy, originally aimed at mutual provision of services, is current-ly misutilized in a platform economy where the winner-takes-all as of insufficient policies and regulations (Acquier et al., 2017). New arrangements of public-private partnerships (PPP) are therefore required to prevent biased and unfair competition (regulation often arrives after the market had been exploited by the most aggressive
A Smart City Anomaly: The Near Becomes Far, The Far Becomes Near 59
player, as has been the case in different cities and service sectors). Research on priva-cy and surveillance can scrutinize part of the process as done, for example, by Elkin-Koren & Gal (2019). The additional layer is the physical realm, the place-related consequences, such as patterns of mobility in urban spaces and the actual structure of streets and buildings. When urban players differ in their relative acceleration, and violate principles of proportional control, segregation and displacement become an immense threat. The principles of fair play are needed to maintain a near-constant speed range, regulating the flow in an era of scaling cities and platforms.
In addition to the axis of urban technologies and the related actions and behav-ioral patterns, global networks of cities and citizens play a role in the axis of urban planning. While globalization is not a single factor to polarize society, the global edge – the advantages of being globally appropriate –extends the divide and may be the hidden force underneath gentrification and displacement (Fiske & Haslam, 2005; Psyllidis, 2016). This paper has three main parts: (1) the extent and scale of spatial separation in cities along the century, up to the smart and global cities, will be described – this would be the local level of domestic proximities within the city; (2) this is followed by the state of global cities and the case of Tel Aviv; and thereaf-ter (3) providing possible explanations to pinpoint principles in the creation of the system that eliminates distances between global cities, while excluding closer but dissimilar social groups in the city.
This is not to say that the global network of urban hubs discriminates against local communities intentionally but to describe a continuous transition from a homog-enous city through the post WW2 multiplicity, as determined by rent gradients, and the increasing heterogeneity, as the course of transition outward to the suburbs was inversed inward to the post-industrial fragmented city, and then again from gen-trification that rejuvenated neighborhoods to displacement that further introduces irregularity in a patchwork metropolis, a heterogenous city where information flows ignore near companions while connecting the far in no time. The mechanisms of information flows that originated in a market economy reflect a rather simplistic system of strong and weak groups, in a financialized world (Castells, 2010; Hacking & Hacking, 1999; Hopkin, 2020; Kostakis & Bauwens, 2014; Piketty, 2014; 2015; Polanyi, 1944). However, the paper is focused on the impact of technology on the spatial behaviors and the spatial structure of the city, stating that separating ele-ments are the local result of the same sociotechnical dynamics that connect the far globally. Thus, the purpose is to illuminate:
• How spatially distinctive are the differentiated spaces in cities, whether moderate variations between adjacent neighborhoods turn into sharp divide in closer proximity.
• Why global connectivity is outward-interconnected but inward-excluding, and how connected and confined cities are.
In the absence of a pro-social regime, information and communication tech-nologies (ICT) abolish the Euclidean distance between spaces while enhancing so-

A Smart City Anomaly: The Near Becomes Far, The Far Becomes Near60 R. Purian
cial discrimination against near places; neglecting social implications or choosing to exploit stakeholders (e.g., Geissinger et al., 2020). Real public engagement and reciprocity, the discourse ethics of a communicative action (Habermas, 1990; 1998; Mingers & Walsham, 2010), which are crucial constructs for trust building (Purian, 2012), miss in the relatively new ecosystems that cultivate unstoppable on-demand for-profit applications that fail to recognize mutuality and benevolence. Competent agents are expected to apply ICT for better information and communication processing, as the name ICT suggests; to store, inform and connect, not to confuse and discon-nect.
First the morphological evolution of cities since the days of concentric zones is presented, followed by a review of methods and tools to define and measure urban morphology, and distinguish the feature of physical separation and segregation.
SEPARATION IN FOCUS
The spatial fragmentation of cities has been described qualitatively and quantita-tively, in relation to physical and to socio-economic characteristics. The combina-tion of both layers is established in studies that measured the spatial manifestation of socioeconomic differences. To a lesser extent have the spatial determinants of socio-economic differences been studied. The importance of separating spatial features on social integration will be emphasized as opposed to, e.g., connectivity or centrality.
The order of separation – in the built environment and in daily activities – is a basic layer within which to understand and resolve the dichotomy of values ver-sus opportunities. The outward shift of wealth to the suburbs has been inversed (Ehrenhalt, 2012), but the resulting structure of the metropolis is not necessarily a unifying bricolage of diverse neighborhoods. On the contrary; while the global cities create a global network of “mega nodes” (Castells, 2010, 2743), the central core and the suburbs become farther apart; rather than relating, near things were separating.
What are the components and factors that shape social relationships in neighbor-hoods, cities and regions today? Urban planning involves many preferences and alternatives. A major challenge is to transform the “tension or equilibrium between the two forces” (Arrow, 1974, 17) into design with the benefit of society in mind.
The structure of the separated patches, as evident in big cities, is presented first. After the morphological description in section 1 (“The structure of cities: Increasing irregularity”), the current state of global cities and urban areas is presented in section 2 (“Gentrification patterns vs. displacement disorder”), and next is the theoretical reasoning in section 3 (“Elevations all the way up: Vertices isolated with technology and information”), to address the bifurcating course of transitions. Why has resi-dential differentiation exceeded the potential for spatial integration? A new form of segregation invites us to apprehend urban dynamics.
A Smart City Anomaly: The Near Becomes Far, The Far Becomes Near 61
The Structure of Cities: Increasing Irregularity
The morphological aspects of urban life receive much attention in recent years. The spatial structure of US cities was studied along the years. Hackworth (2005) showed how the distance from the city centers, in the ten largest US metro ar-eas, changed the distribution of population density, rent, average home value, and per-capita income, from 1970-2000. Metropolitan polycentricity was intensified, compared to outer areas (Hackworth, 2005). In other words, urban growth and the resulting “megapolitan region” (Lang & Knox, 2009) do not imply spatial connec-tivity and urban integration.
Homogeneity and MultiplicityThe urban prototype of an inner district that expands and creates peripheral
rings has evolved since Burgess (1925) who described a series of concentric zones in Chicago, unfolding from a core business district to residential, working-class, middle-class, and the suburban commuters. The radial structure was replaced by a sectorial pattern of residential and non-residential areas along transportation routes. The sections, however, still originate in city centers, according to Hoyt (1939) who proposed the morphology based on rent gradients in US cities. The multiple nuclei of growth are revealed in the integrating model presented by Harris & Ullman (1945), with different business, manufacturing and residential districts that have no specified beginning.
Unlike the concentric zone and the sectoral model of residential patterns, Harris & Ullman (1945) do not assume that there is “a single urban core, around which land use is arranged symmetrically in either concentric or radial patterns” but sug-gest that because of actual physical constraints and the existence of separating fac-tors, “separate nuclei” arise. The specific separating factors are not only high rent in the core, which can be afforded by few activities, but also the natural attach-ment of certain activities to extra-urban transport, space, or other facilities, and the advantages of the separation of unlike activities and the concentration of like functions” (Harris & Ullman, 1945, 17). Thus, they emphasize the impact of “sepa-rating factors”. However, not much research has been carried out on the separating factors, physically driving the growth of discrete nuclei and originating new pockets of wealth and poverty.
Heterogeneity and the Transition Outward: SuburbanizationThe concentric zone (Burgess, 1925), the structure of sectors produced along
transportation routes (Hoyt, 1939), and the integrating model of multiple nu-clei (Harris & Ullman, 1945) are urban models of relatively homogeneous areas. However, the outward course of transition to the suburbs delineated the economic mobility and heterogeneity. The dynamics of heterogeneity is deeply rooted in the Schelling model (Schelling, 1969; 1971) and the vast research area that developed since. An extensive body of literature had investigated aggregation and segregation processes, from bottom-up and top-town viewpoints.
A Smart City Anomaly: The Near Becomes Far, The Far Becomes Near62 R. Purian
The many variations of the Schelling model provide a useful knowledge-base that demonstrates the strength of individuals’ preferences, e.g., the level of satisfaction in non-optimal states; and of constrains such as the size and proportion of populations and neighbourhoods; as well as the complex relations between micropreferences of individuals and the macrobehavior of the whole area (Benenson & Torrens, 2004). The thresholds in each choice model, the greediness in the pursuit for “happiness” (NetLogo’s term for satisfaction, to be achieved in a homogenous “like me” neigh-bourhood), and other options (e.g., lock in) determine the course of the transitions’ outbreak and its decrease and termination.
The rapid suburbanization since the 1950s generated low-density neighborhoods that perfectly matched Schelling models. As Batty (2018) states, suburban devel-opment was inevitable, as growth was “faster than any possible increase in density within the existing city” (Batty, 2018, 137). Growing outward was one aspect of urban sprawl. In addition, the spread of city functions had consequently engendered the decline of existing city centers (Batty, 2018; Whyte, 1993). And so, the attack on urban sprawl was not only about the low densities of remote suburbs, but also about the decay of city core. The downtown lost functions and changed structure. Moreover, as claimed by Jane Jacobs, one of the most prominent voices against suburbanization, a new regime of high-rise buildings along freeways was replacing high-density low-rise buildings that integrated neighbourhoods. Thus, the criticism had emphasized the isolating nature of the new city structure.
Heterogeneity and the Transition Inward: The Patchwork MetropolisThe structure of cities, megacities and superstar cities (Gyourko et al., 2013) is
changing from a construct composed of central quarters and the suburbs – into the contemporary construct of separated patches, dividing the postindustrial city (Florida & Adler, 2018). The structure of the separated patches yields a construct that makes it necessary to examine the morphology of separation.
The spatial polarization of wealth and poverty in big cities is evident along the years. A neighborhood typology that showed neighborhood transitions and restruc-turing across three decades, 1980-2000, was explained by the socioeconomic con-dition. The five neighborhood types were clustered to describe the “shifting soci-odemographic geographies of rapidly growing American metropolitan areas emerg-ing as nodes in large-scale New Metropolises and megapolitan regions” (Foote & Walter, 2017, 1225). However, the spatial structure that explains such trajectories of mobility and stability is yet to be revealed.
Spatial clustering of neighborhoods in the 50 largest Metropolitan Statistical Areas (MSAs) in the United States, from 1990–2010, revealed the “increasingly fragmented sociospatial landscape” in urban America (Delmelle, 2019, 12). Los Angeles was the most fragmented of all 50 cities. The neighborhoods were classified into nine types according to their socioeconomic, racial and housing characteristics, and these types were the explanation for the spatial structure; comparing spatial clusters of wealth and poverty in the largest cities (e.g., Chicago, Los Angeles, New
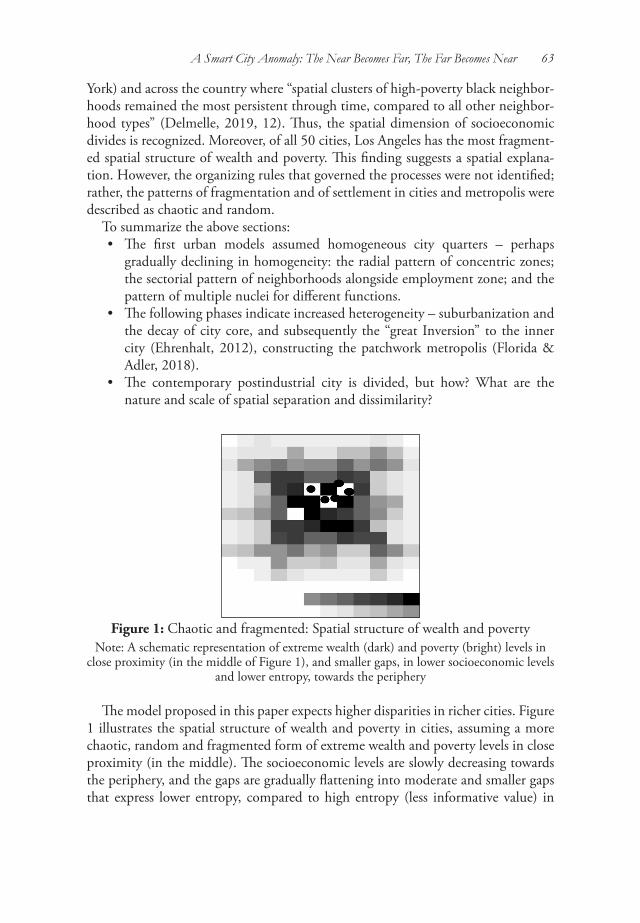
A Smart City Anomaly: The Near Becomes Far, The Far Becomes Near 63
York) and across the country where “spatial clusters of high-poverty black neighbor-hoods remained the most persistent through time, compared to all other neighbor-hood types” (Delmelle, 2019, 12). Thus, the spatial dimension of socioeconomic divides is recognized. Moreover, of all 50 cities, Los Angeles has the most fragment-ed spatial structure of wealth and poverty. This finding suggests a spatial explana-tion. However, the organizing rules that governed the processes were not identified; rather, the patterns of fragmentation and of settlement in cities and metropolis were described as chaotic and random.
To summarize the above sections:• The first urban models assumed homogeneous city quarters – perhaps
gradually declining in homogeneity: the radial pattern of concentric zones; the sectorial pattern of neighborhoods alongside employment zone; and the pattern of multiple nuclei for different functions.
• The following phases indicate increased heterogeneity – suburbanization and the decay of city core, and subsequently the “great Inversion” to the inner city (Ehrenhalt, 2012), constructing the patchwork metropolis (Florida & Adler, 2018).
• The contemporary postindustrial city is divided, but how? What are the nature and scale of spatial separation and dissimilarity?
Figure 1: Chaotic and fragmented: Spatial structure of wealth and povertyNote: A schematic representation of extreme wealth (dark) and poverty (bright) levels in
close proximity (in the middle of Figure 1), and smaller gaps, in lower socioeconomic levels and lower entropy, towards the periphery
The model proposed in this paper expects higher disparities in richer cities. Figure 1 illustrates the spatial structure of wealth and poverty in cities, assuming a more chaotic, random and fragmented form of extreme wealth and poverty levels in close proximity (in the middle). The socioeconomic levels are slowly decreasing towards the periphery, and the gaps are gradually flattening into moderate and smaller gaps that express lower entropy, compared to high entropy (less informative value) in
A Smart City Anomaly: The Near Becomes Far, The Far Becomes Near64 R. Purian
the most fragmented spatial structure in the middle. Before theoretically explaining this spatial organization, and proposing possible conceptualization and measures for displacement as evident in big cities, it should be supported empirically.
As expected, wider income inequalities in dense urban areas, and lower social mo-bility in the longer term, are reported in recent studies (World Bank, 2020a; 2020b; 2021). Simulations developed for the “emerging global profile of the new poor” in various countries confirm that a “large share of the new poor will be urban” (World Bank, 2021, 33), and that the “new poor tend to be more urban than the chronically poor” (p. 37). Compared to chronic rural poverty, the Covid-19 crisis revealed the distinctive urban vulnerability.
Phone surveys and rapid monitoring on the impact of Covid-19 on households show the sharp decline in welfare, income and employment, among “people who were already poor” while impoverishing those who work in construction, manu-facturing, wholesale and retail trade, and informal services. Higher rates of urban respondents reported they have lost employment, compared to rural respondents. Vulnerability increases with lower education levels, e.g., those who work in industry and the services sector, and most vulnerable are informal workers, migrants and refugees who often live in congested informal settlements with inadequate access to health care (World Bank, 2021).
In addition, disparity differs across high- and low-income economies, as expect-ed. According to the World Bank, in high-income economies live 37 percent of ur-ban residents that belong to the bottom 40, a larger share compared to 18 percent of urban residents in low-income economies. Moreover, “all regions share these char-acteristics. From Sub-Saharan Africa to Europe and Central Asia, children, adults with less schooling, and the rural population are more likely to be in the bottom 40, indicating that these patterns are robust relative to geographic conditions and economy-specific income levels” (World Bank, 2021, 123).
Previous OECD studies have also found urbanization to drive spatial inequality, with the world’s largest cities as the most unequal (OECD, 2016; 2018). The cumu-lative findings depict cities as “inequality traps” and the richer cities as more spatially segregated compared to inequality at country level.
Figure 2 summarisiez recent data in reports and databases to present the strength-ened connection between city size and higher economic growth and income level, and at the same time, also higher inequality, segregation – that represent income disparity and social polarization – and the probability to become poor. “Urban ar-eas” tend to extremes (e.g., the Covid-19 new poor; the concentration of wealth in households in apartment buildings), compared to the chronic poverty in “Rural areas”, and as opposed to a relatively moderate inequality in “Small towns”. Larger cities tend to exceed national levels of growth and of average income and inequality – while smaller cities are more likely to shrink – and competitive economies differ from social-democratic economies that restrain disparities.

A Smart City Anomaly: The Near Becomes Far, The Far Becomes Near 65
While redefining functional urban areas (FUA) and metropolitan areas, and wit-nessing the sharp segregation in city centers, residential choices of immigrants ac-count for an additional set of bounding patterns. Immigrants from distant countries are more segregated than immigrants from neighboring countries, and more likely to be segregated in larger immigrant enclaves. Social disparities are revealed also through slower recovery from crises, e.g., after the economic crisis of 2008 and today after almost a year of Covid-19 slowdown. The economic growth of strong groups is detached from the decline of the rest (OECD, 2021a; 2021b).
The schematic representation in Figure 2 depicts some of the main findings re-garding higher inequality, income and segregation in larger cities.
Figure 2. Economic growth, income level, inequality, segregation and poverty risk increase with city size: larger cities tend to exceed national average levels; while
smaller cities are more likely to shrink.
The spatial concentration of innovative activity has long been studied in the con-text of agglomeration, economic performance and growth. Economists have estab-lished the connections between population and economic activity that is spatially concentrated, and innovation. They show that innovation is more spatially concen-trated than manufacturing (Carlino & Kerr, 2015; Glaeser et al., 2015). Size and industrial diversity are among the factors that link agglomeration and innovation (e.g., Bettencourt et al., 2007; Bettencourt, 2013).
What explains the importance of location to clustering innovative activity? While industrial activity depends on externalities in the production of goods and servic-es, innovative activity is clustered through mechanisms of sharing and matching. Knowledge spillovers play key role of in local areas. Carlino & Kerr (2015) review models developed in endogenous growth theory and theoretical literature on urban agglomeration economies, to explain the impact of location on innovative activity, and describe global factors that link innovation clusters together as well as the local advantage of “unique culture and intuitions” of an area (Carlino & Kerr, 2015, 2).
A Smart City Anomaly: The Near Becomes Far, The Far Becomes Near66 R. Purian
A morphological analysis is needed to methodologically assess the processes we see in the rich centers and the weak peripheries of global cities.
Gentrification Patterns vs. Displacement Disorder
Recent decades made gentrification apparent across cities (Omer & Benenson, 2002). The 80’s gave rise to the accommodation of the creative class in old commu-nities (Florida, 2003). The internal migration, increasingly prevalent in large cities where housing costs are high, was criticized for the violation of the social fabric by newcomers, and the breach of higher cost of living in low-income neighbor-hoods. However, gentrification is changing its face (Venerandi et al., 2017; Zuk et al., 2015).
In recent years gentrification is gradually turning into displacement, a new form of spatial polarization. The rather organic process of urban renewal, initiated by individuals who choose to live in affordable neighborhoods, is transformed into displacement and residential segregation by real estate investors that initiate and organize financial projects for new housing but do not necessarily intend to make a home. The literature on gentrification – and later, urban displacement – tracks the changing inflows and outflows between neighborhoods, and the trajectories of social and residential mobility.
A morphological analysis made by Venerandi et al. (2017) in five neighborhoods in London had established the validity of urban morphology, termed morphometric, in relation to gentrification in the studied neighborhoods. In addition to morpho-logical analysis, Venerandi et al. (2017) recognize the motives of collective action that drive gentrification. The effects of social and cultural changes are essential in the analysis of a typical urban form. Venerandi et al. (2017) identify the role of the physical fabric with eight measures that create an index for urban fabric. Linear re-gression analysis is applied on measures from all five neighborhoods to conclude that gentrified areas are “found to sit between urban main streets, which constitute their boundaries” and that “local businesses (cafes, newsagents, groceries), which tend to be present at the intersections with the highly central streets […] serve the inner residential clusters with local services and accessible routes positioned frequently (200–250 m). The prevailing urban type in all five cases is consistently characterized by low/medium rise, traditional perimeter blocks” (pp. 1070-1071). Streets width and building density are main features that portray the neighborhoods and the main streets form the edge of the urban areas that are defined as the gentrified neighbor-hoods. The analysis explains both the separating role of the wider streets that form urban edges (Venerandi et al., 2014) as well as the liveability (Venerandi, 2017) of the inner gentrified area. In other words, the form of gentrification is a form of homogenous areas, of social clusters that are interconnected within, and surrounded by main streets that “provide links to public transport, retail and other important nonresidential uses at the urban scale which are at walking distance” (p. 1070), thus, integrating rather than differentiating edges.
A Smart City Anomaly: The Near Becomes Far, The Far Becomes Near 67
Residential polarization vs. integration is not only an economic question but also a matter of place making and the livability of public spaces, of possible routes in the city and navigation to points of interest, speed of motorized and unmotorized vehi-cles, and walkability. But beyond general and sometimes a rather nostalgic descrip-tion, as Batty (2018) asserts, what is a proper configuration of land and resources?
If structure affects function, how should planning promote social welfare and economic development? Although inequalities exist “within the spatial structure of cities”, claims Batty (2018, 216), “it is hard to unravel the processes that lead to such differences simply from patterns – forms and functions – that we have focused upon in this book. In short, we must admit that there is little we have said here that dwells on how such income and other inequalities emerge“. Studies that do incorporate spatial methods may elaborate on the physical measures and structure (e.g., dissimilarity index, connectivity, etc.) but often neglect the landscape, street patterns, building facades and heights, and vice versa. The spatial structure of the city has an actual effect in several ways. Studies that focus on socioeconomic effects may describe the physical structure of the studied areas but are less likely to apply measurements of the physical structure.
As mentioned before, a growing body of literature describes the spatial structure of poverty and race in socioeconomic terms. What are the spatial measures that would identify them? Reis et al. (2016) reviewed the wide variety of metrics for urban growth and shrinkage, and emphasized the need to create a multidimensional indicator for the physical dimension of urban areas, “perhaps with the inclusion of socioeconomic and demographic variables as well” (p. 265). Residential segregation is often described in terms of geographic areas, locations, size, arrangement and other characteristics of the built environment.
Morphology of SeparationTo understand the spatial dimension of socioeconomic divides, longitudinal anal-
yses could identify structures that encourage integration and generation of the so-cial fabric; structures that attenuate segregation between neighborhoods and streets under excessive development; and structures that force separation in a harmful way, mainly between displaced areas. Complementary to socioeconomic measures, spa-tial measures stipulate the mobility of human agents; whether the structures in con-cern limit function, liberate, determine, regulate, etc.
Oliveira (2016; 2019) addresses the contributions of urban morphology to cit-ies in history and reviews the different approaches and dimensions in the study of urban form, a research area that emerged in the turning to the twentieth century (Oliveira & Pinho, 2010; Oliveira, 2016). The economic, environmental, and social impact created by the physical elements of urban form is presented. The influence on the social dimension of our life in cities, and especially on social justice and social deprivation, is shown by Laura Vaughan who studied urban segregation in differ-ent cities, applying the tools and paradigm of space syntax (Vaughan et al., 2005; Vaughan, 2007; Vaughan & Arbaci, 2011). Omer & Goldblatt (2012) presented
A Smart City Anomaly: The Near Becomes Far, The Far Becomes Near68 R. Purian
similar results in Tel Aviv and Roberto & Hwang (2017) further emphasized the segregating impact of physical boundaries. The role played by the spatial structure as a barrier to residential integration is significant compared to the influences of spatial proximity and connectivity (Roberto, 2018).
Physical barriers, more than distance or connectivity (distance and connectivity can be referred to as perceived usefulness and perceived ease of mobility, respec-tively), are therefore socioeconomic forces. To further emphasize the strength of spatial barriers, Omer & Goldblatt (2012) show that separation measures, rather than the vastly conventional measures of centrality, are highly explanatory with regard to socioeconomic differentiation.
As opposed to networks research, and especially space syntax that since its incep-tion has emphasized measures of centrality, Omer & Goldblatt‘s (2012) findings draw attention to the potency of separability. The impact of roads that split up urban regions and neighborhoods exceeds the incorporating contribution of pave-ments and paths for pedestrians. In addition to the practical contribution of Omer & Goldblatt‘s (2012) findings to urban planning, with regard to streets width and other components of separability, they propose a theoretical contribution that sheds new light on centrality and underline a new interpretation for (dis)connectivity.
How do spatial separation and dissimilarity affect the extent of socioeconomic differentiation?
Spatial CognitionThe dominance of visual perception, and the role of a broad field of view, are
central to the interpretation of topological information. The visual elements identi-fied are dissimilarity of spatial integration, in addition to spatial separation between areas. Omer & Goldblatt (2012) evaluated the effects of spatial relations on resi-dential differentiation between adjacent neighborhoods, i.e., the scale is of walking distance.
The pedestrian viewpoint is formalized in theories and paradigms such as em-bodied cognition, space syntax, affordance, and more. The spatial configuration of urban environments is immanently related to sensation and perception, cognitive representations, and embodied behaviors. Therefore, the assumption is that spatial separation is a factor that shapes socioeconomic patterns in the course of time. Not only connectivity and centrality of road network – but physical barriers such as wide roads or topological elevations that block the field of view. The physical creation of vision and walkability, and the adaptation to living and behaving in an urban habitat, is a context that suits the analysis of topological distance and other dimensions for proximity and sight – a consequence of adjusting to earth and in nature. However, when the home, a place of living, is the artifact in question, the accelerated evolution of real estate investments and financialization further distort a rather physically-based process of decision makers that evaluate and decide where to walk, navigate, reside and live. This process is detached from a closer circle of entrepreneurs and residents to a wider circle. While scaling, in order to keep the
A Smart City Anomaly: The Near Becomes Far, The Far Becomes Near 69
local view, the pedestrian view, a measure that must be planned with cautious is the width of the road; the longer the road, the more dividing is the width. The price (or punishment) for faster connections with far places is the distance from near places (Purian et al., 2019).
To summarize the spatial constellation of social segregation (the local factors; physical structure):
Connectivity by walkability: Main roads separating regions and neighbour-hoods vs. the incorporating contribution of pavements and paths for pedestrians. Preliminary results affirm the persistency of spatial segregation and displacement in Tel Aviv over the last decades.
Connectivity by topology: Movement models can expand to several different types of stimuli and perceptual modalities.
Considering the dominance of visual perception, what is the role of the field of view in the interpretation of topological information? How does vision, being recep-tive to topology, affect the perception of places and spaces? While the social impact of the pedestrian paths network is relatively acknowledged, the role of topology and embodiment in this context is yet to be reasoned and validated.
Urban morphology that frames the visible landscape to passersby holds a social impact, as it affects their perception of places and spaces. In the same respect, what are the influences of technology on behaviors?
Global Cities: Habitat and ArtifactThe morphology of street networks affects the functioning of agents and is shaped
by them. Highways and building facades deploy isolation and separation. So is tech-nology in the rapidly growing vibrant cities that are hubs for national economies. Global cities (Deruytter & Derudder, 2019; GaWC, 2010; Kipnis, 2012) attract global investments and technological innovation (Arribas-Bel et al., 2013; GFCI, 2018; Sassen, 2009). The many characteristics of global cities, however, also in-clude the negative effect of socioeconomic partitioning (Duranton & Puga, 2020; OECD, 2016; 2018), shaping a spatial constellation that further increases the per-sistency of separability, segregation and displacement. In Tel Aviv, for example, since its establishment and throughout most of its history, the southern and the northern parts were characterized as economic and cultural opposites (Aleksandrowicz et al., 2017; Omer, 2018). However, although the sociospatial axis between north and south is prevalent in research (Cohen & Margalit, 2015; Modai-Snir & van Ham, 2017; 2018), it seems that the conventional perception of two vertical halves – rich north and poor south – is being rearranging into horizontally condensed loci of wealth and poverty.
Horizontal axes emerge and divide urban areas: from new and renewed neigh-borhoods along the seashore on the west; to commercial areas that displaced older neighborhoods adjacent to the Ayalon highway on the farther east. As happens in other world capitals, a new form of gentrification spreads disparities in the city (OECD, 2016; 2018). Intrusive planning and building projects displaced older or
A Smart City Anomaly: The Near Becomes Far, The Far Becomes Near70 R. Purian
less-developed places in the city, and a building boom of luxury towers explicitly changed the urban landscape, polarizing vicinities.
A preliminary analysis of changes in socioeconomic areas showed mixed results, applying “space syntax methodology using axial lines” (Omer & Goldblatt, 2012, 179), to ensure consistency and replicability with the same morphological methods. A possible conclusion is that more dedicated and fine measures should adapt to the resolution of distinct spaces and focus on single buildings and isolated high-rise urban habitats.
While previous periods had witnessed the diffusion of wealth and economic mobility between adjacent neighborhoods and in the suburbs (patterns of socio-economic integration), urban scaling in size and in speed, and the increased coor-dination between urban hubs worldwide, created a sequence of global identified vertices. Such hypothesis is consistent with the conception of the rural-urban gaps, the inner-city and suburbs, the trajectories of economic mobility between neigh-borhoods, but then, under the pressure of globalization and accelerating economic forces, fueled by digital platforms, a pattern of irregular and unanticipated polariza-tion appears in the city.
While gentrification had often followed urban grid conditions (Howsley, 2003) in a process that now can be considered natural with city growth, the new pat-tern of differentiating by displacement raises a threat of unanticipated polarization within the streets, and between buildings and amenities. The morphological shift is accompanied by a socio-technical shift. As opposed to the gradual rejuvenation in old communities that host newcomers, real estate investments are orchestrating displacement in coordination with the local and the central government, with sup-pliers and contractors, in fast and efficient actions towards high-scale profit-driven construction projects. In the context of Venerandi et al. (2017), personal housing decisions made by families and individuals did institute gentrification, however, individual choice and degrees of freedom are reduced when facing a multi-layered system of urban planning and building.
Residential differentiation has long been recognized between adjacent neighbor-hoods. If residential differentiation depends on the spatial structure of the physical city, what are the spatial measures that identify and reveal the extent of socioeco-nomic polarization? Figure 4 demonstrates the need in fine measures to capture the scatter geography of structure and function (centrality and connectedness vs. traffic load in Tel Aviv). Although this paper does not aim at proposing such measures, both street networks and the spatial complexity are operationalized for that pur-pose, as suggested by Boeing (2017; 2018; 2019) that addresses the need to analyze complex street networks, including spatial information and legibility of urban form and design.
To summarize the morphological part (Benenson & Torrens, 2004; Omer, 2018), streets and their morphological patterns have a crucial role in the complex societal and economic change of neighborhoods (Omer & Goldblatt, 2012; Roberto &
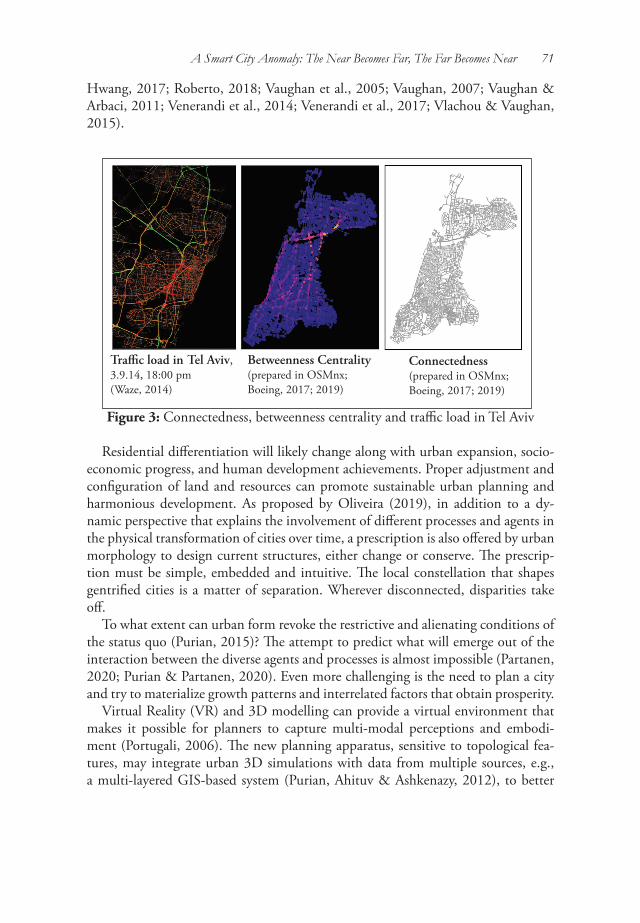
A Smart City Anomaly: The Near Becomes Far, The Far Becomes Near 71
Hwang, 2017; Roberto, 2018; Vaughan et al., 2005; Vaughan, 2007; Vaughan & Arbaci, 2011; Venerandi et al., 2014; Venerandi et al., 2017; Vlachou & Vaughan, 2015).
Traffic load in Tel Aviv, 3.9.14, 18:00 pm (Waze, 2014)
Betweenness Centrality (prepared in OSMnx; Boeing, 2017; 2019)
Connectedness (prepared in OSMnx; Boeing, 2017; 2019)
Figure 3: Connectedness, betweenness centrality and traffic load in Tel Aviv
Residential differentiation will likely change along with urban expansion, socio-economic progress, and human development achievements. Proper adjustment and configuration of land and resources can promote sustainable urban planning and harmonious development. As proposed by Oliveira (2019), in addition to a dy-namic perspective that explains the involvement of different processes and agents in the physical transformation of cities over time, a prescription is also offered by urban morphology to design current structures, either change or conserve. The prescrip-tion must be simple, embedded and intuitive. The local constellation that shapes gentrified cities is a matter of separation. Wherever disconnected, disparities take off.
To what extent can urban form revoke the restrictive and alienating conditions of the status quo (Purian, 2015)? The attempt to predict what will emerge out of the interaction between the diverse agents and processes is almost impossible (Partanen, 2020; Purian & Partanen, 2020). Even more challenging is the need to plan a city and try to materialize growth patterns and interrelated factors that obtain prosperity.
Virtual Reality (VR) and 3D modelling can provide a virtual environment that makes it possible for planners to capture multi-modal perceptions and embodi-ment (Portugali, 2006). The new planning apparatus, sensitive to topological fea-tures, may integrate urban 3D simulations with data from multiple sources, e.g., a multi-layered GIS-based system (Purian, Ahituv & Ashkenazy, 2012), to better
A Smart City Anomaly: The Near Becomes Far, The Far Becomes Near72 R. Purian
construct the various planning aspects (spatial perception, transportation, land use, and more).
Yet, the theoretical prescriptions and the sophisticated tools apparently fail to change the course of transition we face (Purian et al., 2019; Rauwset al., 2020). What makes a historical continuum of separation, from gentrification to displace-ment, rather than a succeeding phase of socioeconomic integration and homogene-ity?
The next assumption would be that the evolution from homogeneous zones to gentrification and displacement indicates the influence of hidden factors that drive the growth of discrete nuclei in the city: originating new pockets of wealth – perhaps even faster than the inertial speed of the city (Bettencourt, 2013), while physical constraints delimit intrinsic consistencies of poverty.
Elevations all the Way Up: Vertices Isolated with Technology and Information
The extreme segregation that exceeds socioeconomic integration over time leads to the establishment of two layers of reference, the local and the global. Tel Aviv illustrates the explanatory power of separation measures compared to centrality (Omer & Goldblatt, 2012), one of the most acknowledged factors in urban studies and networks theories. This is the local description that captures the spatial configu-ration of social segregation. In addition, global forces are assumed to induce displace-ment in cities. Tel Aviv provides a description on that perspective as well (Purian et al., 2019).
What is the spatial manifestation of the propensity to move fast in the global cit-ies? Assuming there are fast lanes that not only deepen urban inequality but create intangible barriers between those who have and those who do not have – how do such invisible routes imprint physical barriers in the city? Beyond the well-estab-lished study of social integration between socio-economic areas in the city, should we expect a new expression of disparities in the city as the speed affects the separa-tion much as liquid particles.
Hillier: Innovation vs. Stability (global flows of people and money)Laying on Hillier & Netto (2002), new technologies do “change the spatial basis
of society”, and “have an impact on society itself ”. The challenging questions are how and why? Hillier (2016) pointed at the dual form of the generic city that creates and reflects two urban grids. The sociocultural stability in the background grid and the morphogenesis of social and spatial networks in the foreground grid are structured by the city and should serve the city. However, in this paper the claim is that the coexistence of the interlocking grids is disrupted: sociocultural factors in the back-ground and microeconomics in the foreground create and reflect the transformation in communication – and communication is the raison d’être (Mingers & Walsham, 2010), the constituent of urban form and function. As emphasized also by Hillier
A Smart City Anomaly: The Near Becomes Far, The Far Becomes Near 73
(2016, 199), “cities exist to create contact”, and his intention is to define “two very specific kinds of contact”.
The most basic terms in which he describes and explains the behavior of the system – the speed, density, redundancy, integration, distance, movement types and coefficients – are changing in the new ecosystem of applications. Urban spaces cannot be considered the same way when residence and social networks, local and global spatial connections, are generated, maintained and behave according to new information and communication technologies. Hillier’s (2016) social and spatial networks model, therefore, can be expanded to a new model where the smart city delineates new contact channels, speed and locations.
If the coexistence of “microeconomic morphogenesis and sociocultural stability is what the city is for”, then a new account of morphogenesis, sociocultural factors and (in)stability currently structures and serves urban digital life. And while Hillier concludes that “Taken as a whole, the spatial nature of the city supports the devel-opment of both social stability and morphogenesis through social networks” (2016, 211), this paper argues that “one of the fundamental effects of the city”, again in Hillier words, “to create non-local connections, and so to overcome distance”, is the current transformative effect that connects the far in dense groups through local to global spatial connections that now emerge, but socially excludes the dissimilar close ones.
New technologies that set certain rules of moving in space are shaping not only spatial behaviors (e.g., navigation or shared mobility) but may also affect social in-tegration and social cohesion – much as accessible roads enhance social integration. The claim is that personalized services divide passengers rather than connect in col-lective services – much as, e.g., public transportation or community applications that care for collaboration. Highways that connect between more distant locations may undermine the social fabric in near places; and so are frequent flights, strongly coupling technological and economic forces to instigate a dividing flow, underneath the physical observable layers.
In other words, Hillier’s assumptions are relevant for a Gentrification scenario, but should adapt to the Displacement scenario, “where the form and nature of society is given by the devices through which society overcomes space to inter-relate a region of separate spatial groups”, as Hillier well describes (2016, 211). The same rules that apply to pre-urban societies apply also today. While economic success is indeed as-sociated with “non-local rather than local measures”, and indeed reflects “how cities work economically to develop and innovate, rather than how they work to create social stability”, I will argue that today, in addition to innovation and economic suc-cess, cities are affected financially and the extreme gap in profit from work and from investments and properties resonate and outline the conceptualization and measures for displacement.
Urban networks have been active since the birth of cities and evolved with trade. Today movements of capital and people are happening in unprecedented pace.

A Smart City Anomaly: The Near Becomes Far, The Far Becomes Near74 R. Purian
Global citizens, on the high end of the socio-economic urban ladder, are the cos-mopolitan habitants of global cities. Even when adapting to local cultures they are consolidating leveraged routes by affiliations to global companies and flows, and by properties that characterize the lifestyle of the relocating families, e.g., their chil-dren’s participation in international education systems. On the low end of the ladder are migrant workers, affected by economic distress, wars, global warming and grow-ing shortage in food and resources in their countries of origin (Vlachou & Vaughan, 2015). Global citizens and work immigrants embody two extremes – of wealth and of insufficiency.
The world’s major urban hubs create the spinal cord of the global network of global cities. The ”spatialization of the a-spatial and non-local knowledge group-ings” (Hillier, 2016, 210) is a tangle of corporates’ HQs, originated in similar competitive business environments, and globally distributed. The global network is therefore dense, fast, determined, forced to grow, enabling routing on fast-pace tracks, and is likely to generate unexpected fluctuations, both in terms of financial volatility (e.g., major crises in a more globalized economy, and weaknesses in bank-ing regulation and supervision) and in physical terms of morphological irregularity (e.g., random forms of separation in the streets). Metaphorically, the topological elevations of high-rises reflect the high yields and financial volumes generated by those portrayed as global citizens, that keep close contact in fast lanes but class dis-tance in close proximity.
Lynch: Pedestrian’s Time and Distance (dividing flows of technology)When Kevin Lynch wrote about time (“What time is this place?” Lynch, 1972)
he identified the rhythms of places. The patterns of movement can be perceived as the polyphony of vehicles and other mobility measures and spatial behaviors (such patterns are identified in music in the general sense of tempo, tension or dynamics when playing a piano). Lynch compares between similar areas in the city: “A city district in its simplest sense is an area of homogeneous character, recognized by dues which are continuous throughout the district and discontinuous elsewhere” (Lynch, 1960,). The “homogeneous character” of city districts is recognized by continuous spatial characteristics, building type, style or topography. As proposed by Lynch: “It may be a typical building feature, like the white stoops of Baltimore. It may be a continuity of color, texture, or material, of floor surface” (Lynch, 1972, 103). Lynch’s sense of time is an intimate rhythm, not subordinated to the external regime of objectivity. His embodiment obeys to inner subjectivity in a continuum of the mind, the body, and the physical environment in our material world. The innate in-tent affects our experience in cities, both the effect and affect, actions and reactions, impression and expression.
When talking about complexity and smart cities, a dual perspective should be considered, the physical and the digital, taking into account the fast growth of ur-ban information networks, and combining the informational framework for navi-gation and way finding in all levels, locally and globally. The desire to organize the

A Smart City Anomaly: The Near Becomes Far, The Far Becomes Near 75
city by separating urban functions – avoiding mixed land use of residential and commercial areas and planning straight streets – characterized a period of more than half a century. Time spent on roads rather than in places on the way is time alienat-ing places, distancing the near and favors the fast. Moreover, being fast and efficient depends on routines that decrease flexibility and ability to make different choices. The smarter the city – in terms of increased dependency on automated processes and service providers – the greater is the need in regulation and policy making to control the accelerating forces and to empower the citizens; at least to increase their sense of control. Based on Lynch’s observations, how would irregular street patterns affect the pace in such streets, compared to a pattern of urban grid that injects order into suburbs, or to the earlier pattern of organic sprawl? While pleasant urban environ-ments are those least ordered, displacement is a polarizing patchwork, deficient in the organic qualities of emergence and rejuvenation, such as that gentrification may display in old communities.
Rephrasing Lynch’s (1981) “A theory of good city form” – a theory of smart city form – should emphasize the order of separation, and how inevitable is the form of segregation when using the technological aids that change behaviors and frag-mentize groups in the society. Attitudes and social norms are changing, and so are the perception of time and place, of contact with others, and of our own identities. Subjectivity faces a realm of quantified selves, optimized personalized services, and collaborative filtering in recommender systems that further improves useful recom-mendations in our daily life, but at the same time embraces us with those who are like us and keep away the dissimilar. Alienating processes are autonomously repro-duced in the routine cycle of weights calculations. The physical impact can be seen in our spatial behavior, consumption, leisure and recreation, and then in the social capital and our relationships and networks. The systems that allow super-users to exploit and appropriate hyper-functionality are accessible to all users. Bifurcation, however, is unavoidable. Users from less advantaged environments may not have the qualifications and the acquaintance with the systems; usage patterns may be less selective by less sophisticated users, and the acceptance of specific systemic advan-tages may also discriminate those anxious users who avoid innovation compared to the digitally literate who would utilize place-based on-demand services, from navigation, car sharing and ride sharing to shared workspaces and co-living. Not only career paths, personal and professional development can be affected by the decisions that recommender systems are paving; the economic activity is affected by the arrival or disappearance of consumers, with recommender systems capable at altering their preferences, tracking them into routes and city zones. With dozens recommender systems that are embedded in our apps and devices, time is accelerat-ing, and places are at distance. The form of roads and buildings is therefore a basic layer on which the city changes in structure and in function.
Figures in Lynch (1960; 1981) tell much about city form and its elements. Considering an updated version for the concept of Time-Space, elevations in the
A Smart City Anomaly: The Near Becomes Far, The Far Becomes Near76 R. Purian
topological map should be transformed into representations of faster financial growth and consolidation of leveraged routes, i.e., height differences that express not only higher income but qualitatively different capacity to path through vertices in the network of global cities. The accelerating pace of digitally literate citizens in global cities is a feature of social divide, materialized in the physical structure of the city through luxury residential complexes, distinct and leveraged. This perspective makes the digital artifact an integral part of the city. Another dimension of the so-ciotechnical dynamics is rooted in the pedestrian perspective – the individual level of wayfinding, commuting, navigating. Increased awareness to the time difference from the starting point to the destination, when using navigation applications and shared mobility services, eliminates the focus on the places in between, and reframes spatial and temporal perceptions. The way is just a space to cross, placeless and meaningless, except for its meaning in time. Endless construction projects in city centers worldwide are therefore need of the hour.
Lynch (1981) distinguished between the physical and the digital in his own way, describing the presence of “persons acting and the physical facilities that support that action” (p. 351), subdividing and elaborating on the various activities possible. The many actions and things in the city consume and produce energy, and materi-alize information, either transmitting data via ICT or storing and communicating via books, speech, and credit accounts (Lynch, 1981, 353). New web architectures, virtualization, and the ability to read and write instantaneously from distributed databases made it possible to further brand and tag objects and places, deliver pho-tos and videos worldwide and increase online actions and interactions. “Individual entities are used as disposable instantiations of universals”, claims Floridi (2002, 131), “and thus can swiftly weave different lives, which do not necessarily merge”. Members of online communities and social networks play the role of data subjects that refine purchase and re-purchase choices, or radicalize the public discourse be-tween polarized communities and social groups (Purian et al., 2020). The purpose of this section is not (only) to criticize consumerism, but to emphasize the incoher-ence of presence in different locations. If there is no time, there is no place.
Communities today produce and consume narratives online. As has been done throughout the ages, people create narratives – concepts that culture and language afford to recognize and share – to give meaning to reality. Technology makes the process and the “precious semantic resources needed to making sense of the world” (Floridi, 2002, 130) increasingly easy. Moreover, narratives created in the virtual space through recommender systems are shared by communities of users that pro-duce and consume data for further improved collaborative filtering algorithms. The participation of others is enhanced with ICT that enable further “de-limitation of culture”, as put by Floridi (2002, 130). However, new limits bound the participa-tion in processes that construct, refine and transmit our private reflections into be-liefs, identities, values and shared ethos. This leads to the rather tangible, biological analogy of urban dynamics.

A Smart City Anomaly: The Near Becomes Far, The Far Becomes Near 77
Prigogine: Scaling Speed and Fluctuations (local flows)Time gains tangible presence through the description of places. Prigogine &
Stengers (1984, 17) illustrated, in one sentence, how space acquires a temporal di-mension: “Consider a landscape and its evolution: villages grow, bridges and roads connect different regions and transform them”. They emphasize that, while the “lo-cal time associated with each observer” depends, on the local level, on “the ‘com-munication’ between observers”, there is also a global level, e.g., age is not located in a specific body part.
The temporal dimension is significant in the fast-paced urban environment. Prigogine & Stengers (1984) compared self-aggregation at high and low densities of insect population. The experiments they cite show not only the speed of aggregation processes, but also the effectiveness of the cluster, how tight and confined it is. The experiments illustrate the role of fluctuations in insect populations, slime molds and the construction of a termite’s nest. The principles and patterns recognized biologically provide a reasonable analogy for the fluctuation of agents in a city and for the identification of spatial evolution. The rapid growth of the cluster precedes the “formation of a new structure”, claim Prigogine & Stengers (1984, 181). They connected fluctuations with structural stability and emphasized the amplification of fluc-tuations.
In the crowded environment, the fast-paced cluster gains central location, much as the fluctuation shown in the patchwork metropolis (Florida & Adler, 2018), cre-ated by an inward shift of wealth from the suburbs (Ehrenhalt, 2012) into clusters in the high-density center. Similar aggregation behaviors were observed in the experi-ments described by Deneubourg: “as they gather in a cluster, the larvae contribute to enhance the attractiveness of the corresponding region. The higher the local density of larvae in the region, the stronger the gradient and the more intense the tendency to move toward the crowded point” (Prigogine & Stengers, 1984, 181).
Effectiveness means larger cluster size; does it specify who can join? Population density determines the number of participants that join and that will “finally be part of the cluster” (p. 181). Large number does not necessarily imply inclusiveness. Effectiveness can be analogues to the building boom of luxury towers (mentioned above, in Tel Aviv) as well as to affordable housing, both achieving high numbers of residents, but aim at different populations; distinctive luxury buildings that count their “similar” vs. inclusive community buildings that manifest pluralistic values (the idealized unifying bricolage of diverse neighborhoods, i.e., multi-cluster solu-tion).Table 1 summarizes the findings.
In dense environments, as we see in our cities in recent years, clusters of con-densed wealth rise in inflexible spaces and tighten up their boundaries to include a homogeneous population. Deneubourg’s description anticipates the structure of separated patches, as emerged in cities (Florida & Adler, 2018) and identifies this construct of separation in terms of “homogeneous initial conditions” (Prigogine & Stengers, 1984, 183). Indeed, new clusters may appear and develop “new types of
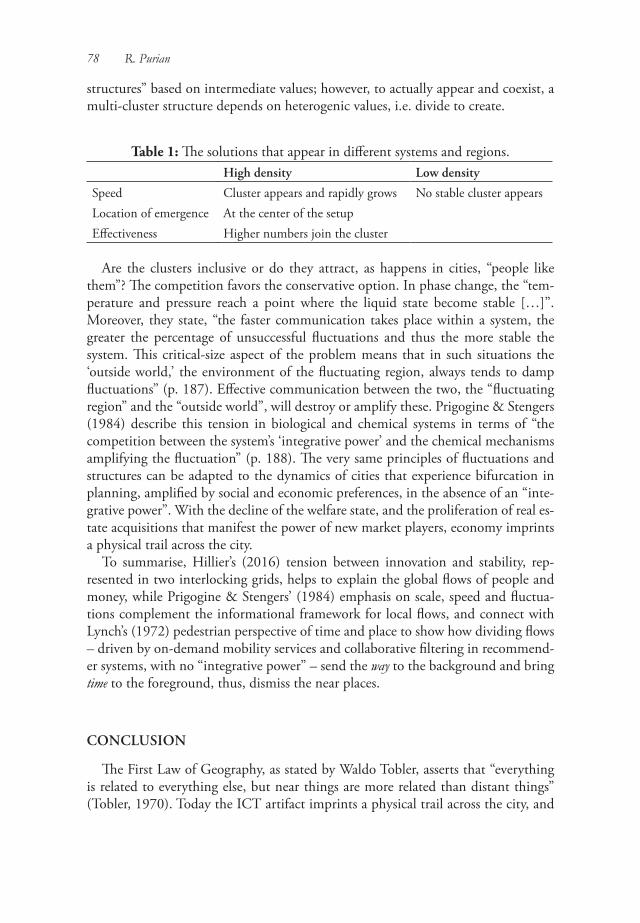
A Smart City Anomaly: The Near Becomes Far, The Far Becomes Near78 R. Purian
structures” based on intermediate values; however, to actually appear and coexist, a multi-cluster structure depends on heterogenic values, i.e. divide to create.
Table 1: The solutions that appear in different systems and regions.High density Low density
Speed Cluster appears and rapidly grows No stable cluster appearsLocation of emergence At the center of the setupEffectiveness Higher numbers join the cluster
Are the clusters inclusive or do they attract, as happens in cities, “people like them”? The competition favors the conservative option. In phase change, the “tem-perature and pressure reach a point where the liquid state become stable […]”. Moreover, they state, “the faster communication takes place within a system, the greater the percentage of unsuccessful fluctuations and thus the more stable the system. This critical-size aspect of the problem means that in such situations the ‘outside world,’ the environment of the fluctuating region, always tends to damp fluctuations” (p. 187). Effective communication between the two, the “fluctuating region” and the “outside world”, will destroy or amplify these. Prigogine & Stengers (1984) describe this tension in biological and chemical systems in terms of “the competition between the system’s ‘integrative power’ and the chemical mechanisms amplifying the fluctuation” (p. 188). The very same principles of fluctuations and structures can be adapted to the dynamics of cities that experience bifurcation in planning, amplified by social and economic preferences, in the absence of an “inte-grative power”. With the decline of the welfare state, and the proliferation of real es-tate acquisitions that manifest the power of new market players, economy imprints a physical trail across the city.
To summarise, Hillier’s (2016) tension between innovation and stability, rep-resented in two interlocking grids, helps to explain the global flows of people and money, while Prigogine & Stengers’ (1984) emphasis on scale, speed and fluctua-tions complement the informational framework for local flows, and connect with Lynch’s (1972) pedestrian perspective of time and place to show how dividing flows – driven by on-demand mobility services and collaborative filtering in recommend-er systems, with no “integrative power” – send the way to the background and bring time to the foreground, thus, dismiss the near places.
CONCLUSION
The First Law of Geography, as stated by Waldo Tobler, asserts that “everything is related to everything else, but near things are more related than distant things” (Tobler, 1970). Today the ICT artifact imprints a physical trail across the city, and
A Smart City Anomaly: The Near Becomes Far, The Far Becomes Near 79
favours a new version for Tobler’s law. According to this version near things are more separated than distant things. Physical barriers that divide groups are not that illusive. The first parts of the paper emphasize the importance of separation measurements in urban morphology. Next, a rather high-level interpretation of the current state of affairs in cities – regulation regime, scaling and routines – is connected with the very tangible features of the built environment: spatial integration and social mobility on the one hand, and the efficiency, separation, high walls and segregations between socioeconomic clusters, on the other hand.
A new perspective on urban morphology, in the age of information acceleration, is presented in this study. The establishment of two layers of reference, the local and the global, provides a new perspective on the societal as well as the spatiotemporal dynamics in the city. In short, the global connectivity that globalization allows is outward-interconnecting but inward-disconnect.
REFERENCES
Acquier, A., Daudigeos, T., & Pinkse, J. (2017) Promises and paradoxes of the sharing economy: An organizing framework. Technological Forecasting and Social Change, 125, 1-10. https://doi.org/10.1016/j.techfore.2017.07.006
Al-Natour, S., & Benbasat, I. (2009) The adoption and use of IT artifacts: A new interaction-centric model for the study of user-artifact relationships. Journal of the Association for Information Systems, 10(9), 2.
Aleksandrowicz, O., Yamu, C., & van Nes, A. (2017) The socio-spatial development of Jaffa-Tel-Aviv: The emergence and fade-away of ethnic divisions and distinctions. In T. Heitor, M. Serra, J. P. Silva, M. Bacharel, & L. Cannas da Silva (Eds.), Proceedings of the 11th International Space Syntax Symposium Lisbon (pp. 1-20). [140] Instituto Superior Técnico, Departamento de Engenharia Civil, Arquitetura e Georrecursos, Portugal. https://core.ac.uk/download/pdf/148332633.pdf
Arribas-Bel, D., Kourtit, K., & Nijkamp, P. (2013) Benchmarking of world cities through self-organizing maps. Cities, 31, 248-257. https://doi.org/10.1016/j.cities.2012.06.019
Arrow, K.J. (1974) The limits of Organization. New York: W.W. Norton & Company.Batty, M. (2018) Inventing Future Cities: How We Can Invent—But Not Predict—The
Future of Cities. MIT Press https://mitpress.mit.edu/books/inventing-future-cities
Benenson, I. & Torrens, P. (2004) Geosimulation: Automata based Modeling of Urban Phenomena. John Wiley & Sons. ISBN:9780470843499 https://onlinelibrary.
A Smart City Anomaly: The Near Becomes Far, The Far Becomes Near80 R. Purian
wiley.com/doi/book/10.1002/0470020997Bettencourt, L. M. (2013) The origins of scaling in cities. Science, 340(6139), 1438-
1441. https://doi.org/10.1126/science.1235823Bettencourt, L. M., Lobo, J., Helbing, D., Kühnert, C., & West, G. B. (2007)
Growth, innovation, scaling, and the pace of life in cities. Proceedings of the National Academy of Sciences, 104(17), 7301-7306. https://doi.org/10.1073/pnas.0610172104
Boeing, G. (2017) OSMnx: New methods for acquiring, constructing, analyzing, and visualizing complex street networks. Computers, Environment and Urban Systems, 65, 126-139. https://www.sciencedirect.com/science/article/pii/S0198971516303970
-----. Measuring the complexity of urban form and design. Urban Design International, 23(4), 281-292. https://doi.org/10.1057/s41289-018-0072-1
-----. (2019) Spatial Information and the Legibility of Urban Form: Big Data in Urban Morphology. https://doi.org/10.1016/j.ijinfomgt.2019.09.009
Burgess, E.W. (1925) The Growth of the city: An introduction to a research project. In: Park, R., Burgess, E.W. & McKenzie R.D. (eds) The City, University of Chicago Press, pp. 47-62. https://doi.org/10.1007/978-0-387-73412-5_5; http://www.esperdy.net/wp-content/uploads/2009/09/Park-The-City.pdf
Carlino, G., & Kerr, W. (2015) Agglomeration and innovation. In Gilles Duranton, J. Vernon Henderson & William C. Strange (eds.) Handbook of Regional and Urban Economics Vol. 5, Elsevier, pp. 349-404). Elsevier. https://doi.org/10.1016/B978-0-444-59517-1.00006-4
Castells, M. (2010) Globalisation, networking, urbanisation: Reflections on the spatial dynamics of the information age. Urban Studies, 47(13), 2737-2745. https://doi.org/10.1177/0042098010377365
CBS (2014) Society in Israel Report (No. 7) The Large Cities at a Glance: Compendium of Maps (Tel Aviv-Yafo: Statistical zones, p. 126), https://old.cbs.gov.il/publications14/rep_07/pdf/maps_h.pdf
Cohen, N., & Margalit, T. (2015) ‘There are really two cities here’: Fragmented urban citizenship in Tel Aviv. International Journal of Urban and Regional Research, 39(4), 666-686. 10.1111/1468-2427.12260
Delmelle, E. C. (2019) The increasing sociospatial fragmentation of urban America. Urban Science, 3(1), 9. https://www.mdpi.com/2413-8851/3/1/9
Deruytter, L., & Derudder, B. (2019) Keeping financialisation under the radar: Brussels Airport, Macquarie Bank and the Belgian politics of privatised infrastructure. Urban Studies. https://doi.org/10.1177/0042098018809912
A Smart City Anomaly: The Near Becomes Far, The Far Becomes Near 81
Duranton, G. & Puga, D. (2020) The economics of urban density. NBER Working Paper 27215, National Bureau of Economic Research, Cambridge, MA. https://diegopuga.org/papers/Duranton_Puga_JEP_2020.pdf
Ehrenhalt, A. (2012) The Great Inversion and the Future of the American City. New York, NY: Knopf.
Elkin-Koren, N., & Gal, M. S. (2019) The chilling effect of governance-by-data on data markets. The University of Chicago Law Review, 86(2), 403-431.
Fiske, A. P., & Haslam, N. (2005). The four basic social bonds: Structures for coordinating interaction. In Mark Baldwin, Ed., Interpersonal Cognition, New York: Guilford, 267–298. www.sscnet.ucla.edu/anthro/faculty/fiske/RM_PDFs/Fiske_Haslam_Four_Basic_Bonds_2005.pdf
Florida, R. (2003) Cities and the creative class. City & Community, 2(1), 3-19. https://doi.org/10.1111/1540-6040.00034
Florida, R., & Adler, P. (2018) The patchwork metropolis: The morphology of the divided postindustrial city. Journal of Urban Affairs, 40(5), 609-624. https://doi.org/10.1080/07352166.2017.1360743
Floridi, L. (2002) What is the philosophy of information? Metaphilosophy, 33(1‐2), 123-145. https://doi.org/10.1111/1467-9973.00221
Foote, N., & Walter, R. (2017) Neighborhood and socioeconomic change in emerging megapolitan nodes: Tracking shifting social geographies in three rapidly growing United States metropolitan areas, 1980–2010. Urban Geography, 38(8), 1203-1230. https://doi.org/10.1080/02723638.2016.1217637
GaWC (2010) The World According to GaWC 2010. Globalization and World Cities (GaWC) Research Network. https://www.lboro.ac.uk/gawc/world2010t.html
Geissinger, A., Laurell, C., & Sandström, C. (2020) Digital disruption beyond Uber and Airbnb—Tracking the long tail of the sharing economy. Technological Forecasting and Social Change, 155, 119323. https://doi.org/10.1016/j.techfore.2018.06.012
GFCI (2018) The Global Financial Centres Index 24 Long Finance. September. https://www.zyen.com/media/documents/GFCI_24_final_Report_7kGxEKS.pdf
Glaeser, E., Kerr, S. & Kerr, W. (2015) Entrepreneurship and urban growth: An empirical assessment with historical mines. Review of Economics and Statistics, 97(2), 498-520. https://doi.org/10.1162/REST_a_00456
Gyourko, J., Mayer, C., & Sinai, T. (2013) Superstar cities. American Economic Journal: Economic Policy, 5(4), 167-99. https://www.aeaweb.org/articles?id=10.1257/

A Smart City Anomaly: The Near Becomes Far, The Far Becomes Near82 R. Purian
pol.5.4.167Habermas, J. (1990) Moral Consciousness and Communicative Action. Boston: MIT press.-----. (1998). On the Pragmatics of Communication. Boston: MIT Press.Hacking, I., & Hacking, J. (1999) The Social Construction of What? Harvard University
Press. http://www.hup.harvard.edu/catalog.php?isbn=9780674004122Hackworth, J. (2005) Emergent urban forms, or emergent post-modernisms? A
comparison of large US metropolitan areas. Urban Geography, 26(6), 484-519. https://doi.org/10.2747/0272-3638.26.6.484
Harris, C. D., & Ullman, E. L. (1945) The nature of cities. The Annals of the American Academy of Political and Social Science, 242(1), 7-17. https://journals.sagepub.com/doi/pdf/10.1177/000271624524200103
Hillier, B. (2016) What are cities for? And how does it relate to their spatial form? The Journal of Space Syntax, 6(2), 199-212. http://128.40.150.106/joss/index.php/joss/article/view/282
Hillier, B., & Netto, V. (2002) Society seen through the prism of space: Outline of a theory of society and space. Urban Design International, 7(3-4), 181-203. https://link.springer.com/article/10.1057/palgrave.udi.9000077
Hopkin, J. (2020) Anti-System Politics: The Crisis of Market Liberalism in Rich Democracies. Oxford University Press. http://doi.org/10.1093/oso/9780190699765.001.0001
Howsley, K. (2003) Uncovering the spatial patterns of Portland’s gentrification. In Proceedings of the Fourth International Space Syntax Symposium. http://www.spacesyntax.net/symposia-archive/SSS4/fullpapers/76Howsleypaper.pdf
Hoyt, H. (1939) The Structure and Growth of Residential Neighborhoods in American Cities. Washington D.C.: Government Printing Office. Federal Housing Administration. https://archive.org/details/structuregrowtho00unitrich
Kipnis, B. A. (2012) The impact of Israel’s wealthy on Tel Aviv’s World-City status and on the dwindling national space. Horizons in Geography. No. 79/80, Themes in Israeli Geography 118-135. www.jstor.org/stable/23718585
Kostakis, V., & Bauwens, M. (2014) Network Society and Future Scenarios for a Collaborative Economy. Springer. https://doi.org/10.1057/9781137406897
Lang, R., & Knox, P. K. (2009) The new metropolis: Rethinking megalopolis. Regional Studies, 43(6), 789-802. https://doi.org/10.1080/00343400701654251
Lynch, K. (1960) The Image of the City. Boston: MIT Press.-----. (1972). What Time Is This Place? Boston: MIT Press.-----. (1981). A theory of good city form. Boston: MIT Press.
A Smart City Anomaly: The Near Becomes Far, The Far Becomes Near 83
Mingers, J., & Walsham, G. (2010) Toward ethical information systems: The contribution of discourse ethics. Mis Quarterly, 34(4), 833-854. https://dl.acm.org/doi/10.5555/2017496.2017505
Modai-Snir, T., & van Ham, M. (2017) The Roles of Increasing Inequality and Divergent Urban Development in Understanding Spatial Polarization in Tel-Aviv. Institute for the Study of Labor (IZA) Discussion Paper No. 11219. https://ssrn.com/abstract=3092563
-----. (2018) Neighbourhood change and spatial polarization: The roles of increasing inequality and divergent urban development. Cities, 82, 108-118. https://doi.org/10.1016/j.cities.2018.05.009
OECD (2016) Making Cities Work for All: Data and Actions for Inclusive Growth. OECD Publishing, Paris https://doi.org/10.1787/9789264263260-en
-----. (2018) Divided Cities: Understanding Intra-urban Inequalities. OECD Publishing, Paris https://doi.org/10.1787/9789264300385-en
-----. (2021 a) Metropolitan areas (database). https://doi.org/10.1787/data-00531-en
-----. (2021 b) Regional Statistics (web) https://doi.org/10.1787/region-data-enOmer, I. (2018) Effect of city form and sociospatial divisions on cognitive
representation of an urban environment. Journal of Urban Affairs, 40(4), 560-575. https://doi.org/10.1080/07352166.2017.1360738
Omer, I., & Benenson, I. (2002) Investigating fine-scale residential segregation by means of local spatial statistics. Geography Research Forum, 22, 41-60. http://raphael.geography.ad.bgu.ac.il/ojs/index.php/GRF/article/view/243
Omer, I., & Goldblatt, R. (2012) Urban spatial configuration and socio-economic residential differentiation: The case of Tel Aviv. Computers, Environment and Urban Systems, 36(2), 177-185. https://doi.org/10.1016/j.compenvurbsys.2011.09.003
Oliveira, V. (2016) Urban Morphology: An Introduction to the Study of the Physical Form of Cities. Springer. Urban Book Series (UBS). https://doi.org/10.1007/978-3-319-32083-0
-----. (2019). Urban forms, agents, and processes of change. In D’Acci, L. (ed) (The Mathematics of Urban Morphology. Modeling and Simulation in Science, Engineering and Technology. Birkhäuser, Cham,529-535. https://doi.org/10.1007/978-3-030-12381-9_28
Oliveira, V., & Pinho, P. (2010) Evaluation in urban planning: Advances and prospects. Journal of Planning Literature, 24(4), 343-361. https://doi.org/10.1177%2F0885412210364589
A Smart City Anomaly: The Near Becomes Far, The Far Becomes Near84 R. Purian
Partanen, J. (2020) Guiding urban self-organization: Combining rule-based and case-based planning. Environment and Planning B: Urban Analytics and City Science, 47(2), 304-320. https://doi.org/10.1177%2F2399808319893687
Piketty, T. (2014) Capital in the Twenty-First Century: A multidimensional approach to the history of capital and social classes. The British journal of Sociology, 65(4), 736-747. http://piketty.pse.ens.fr/files/Piketty2014BJS.pdf
-----. (2015) About capital in the Twenty-First Century. American Economic Review, 105(5), 48-53. http://doi.org/10.1257/aer.p20151060
Polanyi, K. (1944) The Great Transformation: The Political and Economic Origins of our Time. Boston: Beacon. https://archive.org/details/greattransformat00pola; https://archive.org/details/greattransformat00karl
Portugali, J. (2006) Complex Artificial Environments – Simulation, Cognition and VR in the Study and Planning of Cities. Springer. http://www.springer.com/la/book/9783540259176
Prigogine, I., & Stengers, I. (1984) Order Out of Chaos: Man’s New Dialogue With Nature. William Heinemann, UK; Collins Publishing Group, Fontana-Flamingo edition.
Psyllidis, A. (2016) Revisiting urban dynamics through social urban data: Methods and tools for data integration, visualization, and exploratory analysis to understand the spatiotemporal dynamics of human activity in cities. Architecture and the Built Environment, (18), 1-334. https://doi.org/10.7480/abe.2016.18
Purian, R. (2012) Service Quality and Trust in E-Government: Utilizing the Rich Measures of System Usage to Predict Trustworthiness. UKAIS 2012 Proceedings, UK Academy for Information Systems, Oxford University, March 27-28. paper 37, http://aisel.aisnet.org/ukais2012/37
-----. (2015) Size Tackles Quality: Insights from a Simple E-Government Evaluation Index. AIS SIG-PRAG Proceedings, Pre-ICIS Workshop on ”Practice-based Design and Innovation of Digital Artifacts”, Editors: Brian Donnellan, Göran Goldkuhl, Jonas Sjöström, Mark Aakhus, Markus Helfert. Fort Worth, Texas, December 12. http://media.sigprag.net/2015/12/Purian-E-government-evaluation-index.pdf
Purian, R., Ahituv, N. & Ashkenazy, A. (2012). The Richness of Barriers to Public Participation: Multi-Layered System of Real Estate Data from Multiple Sources. MCIS 2012 Proceedings, Mediterranean Conference on Information Systems, Guimarães Portugal, September 8-10. paper 17, http://aisel.aisnet.org/mcis2012/17

A Smart City Anomaly: The Near Becomes Far, The Far Becomes Near 85
Purian, R., Ho, S. M., & Te’Eni, D. (2020) Resilience of Society to Recognize Disinformation: Human and/or Machine Intelligence. Proceedings of the UKAIS https://aisel.aisnet.org/ukais2020/11 The 25th UK Academy for Information Systems International Conference, Oxford, UK.
Purian, R., Kaplan, N. & Omer, I. (2019) The Spatial Shape of Social Segregation – Everything is Related but Near Things are More Separated. Chicago-TAU Workshop on Cities and Urbanism, TAU’s City Center, April 7-8. https://en-urban.tau.ac.il/events/Chicago2019; https://en-urban.tau.ac.il/sites/urban_en.tau.ac.il/files/2019-04-07-ChicagoTAUCityCenter.pdf
Purian, R. & Partanen, J. (2020). Unified Planning: As the City Becomes Part of the Digital Artifact. The 13th International Urban Planning and Environment (IUPE13) Congress, Tallinn University of Technology, Tartu, Estonia (postponed to 2021, 28 June–1 July); IUPE conference and the World Planning Congress (2021 July 5-9), Lisbon. https://www.iupe13.ee
Purian, R., van Hillegersberg, J. & Catlett, C. (2019) Life as a Service in the smart city: Fair play in information systems design, data integration and planning. The 14th International Conference on Information Systems, ICIS, Munich. https://github.com/mschermann/treoaticis2019
Rauws, W., Cozzolino, S., & Moroni, S. (2020) Framework rules for self-organizing cities: Introduction, Environment and Planning B: Urban Analytics and City Science. https://doi.org/10.1177/2399808320905377
Reis, J. P., Silva, E. A., & Pinho, P. (2016) Spatial metrics to study urban patterns in growing and shrinking cities. Urban Geography, 37(2), 246-271. https://doi.org/10.1080/02723638.2015.1096118
Roberto, E. (2018) The spatial proximity and connectivity method for measuring and analyzing residential segregation. Sociological Methodology, 48(1), 182-224. https://journals.sagepub.com/doi/pdf/10.1177/0081175018796871
Roberto, E., & Hwang, J. (2017) Barriers to integration: Physical boundaries and the spatial structure of residential segregation. arXiv preprint arXiv:1509.02574. https://arxiv.org/ftp/arxiv/papers/1509/1509.02574.pdf
Sassen, S. (2009) Cities in today’s global age. SAIS Review of International Affairs, 29(1), 3-34. https://doi.org/10.1353/sais.0.0034
Schelling, T. C. (1969) Models of segregation. The American Economic Review, 59(2), 488-493. https://www.jstor.org/stable/1823701
-----. (1971) Dynamic models of segregation. Journal of Mathematical Sociology, 1(2), 143-186. https://doi.org/10.1080/0022250X.1971.9989794
Tel Aviv-Yafo Municipality (2014) Map based on CBS data 2008 https://www.tel-

A Smart City Anomaly: The Near Becomes Far, The Far Becomes Near86 R. Purian
aviv.gov.il/Transparency/DocLib4/םייטסיטטס םירוזא תפמ.pdf Full report: https://www.tel-aviv.gov.il/Transparency/DocLib4/המלשה תרבוחה.pdf retrieved https://www.tel-aviv.gov.il/Transparency/Pages/Quarter.aspx
-----. (2019) Map based on CBS data 2008 https://www.tel-aviv.gov.il/Transparency/DocLib13/%E2%80%8F%E2%80%8F%202019םייטסיטטס םירוזא.pdf Full statistical yearbook https://www.tel-aviv.gov.il/Transparency/Pages/Year.aspx
------. (2013). Socio-economic clustering based on 2008 CBS data (maps p. 14, 28, 33).
Tobler, W. R. (1970) A computer movie simulating urban growth in the Detroit region. Economic Geography, 46(sup1), 234-240. https://www.tandfonline.com/doi/abs/10.2307/143141
Vaughan, L. (2007) The spatial syntax of urban segregation. Progress in Planning, 67(3), 199-294. http://discovery.ucl.ac.uk/3445/1/3445.pdf
Vaughan, L., & Arbaci, S. (2011) The challenges of understanding urban segregation. Built Environment, 37(2), 128-138.
Vaughan, L., Clark, D. L. C., Sahbaz, O., & Haklay, M. (2005) Space and exclusion: Does urban morphology play a part in social deprivation?. Area, 37(4), 402-412. https://doi.org/10.1111/j.1475-4762.2005.00651.x
Venerandi, A. (2017) A Quantitative Method to Study the Relationship between Urban Form and City Liveability Indexes. Doctoral dissertation, University College London (UCL). http://discovery.ucl.ac.uk/1569319/1/Venerandi_EngDthesis.pdf
Venerandi, A., Zanella, M., Romice, O., Dibble, J., & Porta, S. (2017) Form and urban change – An urban morphometric study of five gentrified neighbourhoods in London. Environment and Planning B: Urban Analytics and City Science, 44(6), 1056-1076. https://doi.org/10.1177/0265813516658031
Venerandi, A., Zanella, M., Romice, O., & Porta, S. (2014) The Form of Gentrification. arXiv preprint arXiv:1411.2984. https://arxiv.org/abs/1411.2984; https://arxiv.org/ftp/arxiv/papers/1411/1411.2984.pdf
Vlachou, A., & Vaughan, L. S. (2015) Successional segregation in Gerani, Athens. Unpacking the spatial structure of an immigrant quarter. In: (Proceedings) 10th International Space Syntax Symposium, 13-17 July 2015, UCL London, UK. The Bartlett Space Syntax Laboratory, UCL: London, UK. http://discovery.ucl.ac.uk/1470205
Waze. (2014, October 2) Data Visualization – Tel Aviv: One Day on Waze [Video: September 3, 2014, 18:00 pm] YouTube https://youtu.be/k70qP6PTHCo?li
A Smart City Anomaly: The Near Becomes Far, The Far Becomes Near 87
st=PLVngCos5VorLK4Im5yQT-Wvq99_JozbHF&t=177Whyte, W. (1993) The exploding metropolis (Volume 1 of Classics in Urban
History). Foreword: Warner, S.B). University of California Press. https://www.ucpress.edu/book/9780520080904/the-exploding-metropolis
World Bank (2020 a) Poverty and Shared Prosperity 2020: Reversals of Fortune. Washington, DC. http://hdl.handle.net/10986/34496
-----. (2020 b) Poverty and Distributional Impacts of COVID-19: Potential Channels of Impact and Mitigating Policies. Unpublished report, April 16, Poverty and Equity Global Practice. Washington, DC.
-----. (2021) Global Economic Prospects. Washington, DC. http://hdl.handle.net/10986/34710
Zuboff, S. (2015) Big Other: Surveillance Capitalism and the Prospects of an Information Civilization. Journal of Information Technology, 30(1), 75-89. https://doi.org/10.1057/jit.2015.5
Zuk, M., Bierbaum, A. H., Chapple, K., Gorska, K., Loukaitou-Sideris, A., Ong, P., & Thomas, T. (2015) Gentrification, displacement and the role of public investment: a literature review. In Federal Reserve Bank of San Francisco. https://www.frbsf.org/community-development/publications/working-papers/2015/august/gentrification-displacement-role-of-public-investment pdf: https://www.frbsf.org/community-development/files/wp2015-05.pdf
Smart Drivers to Urban Sustainability and Resilience
Barriers to Empowering and Engaging Youth in Sustainable Urban Development Endeavour:
Experience Gained from Korydallos Municipality – Greece
Geography Research Forum • Vol. 40 • 2020: 89-107.
Nektaria Marava* Andreas Alexopoulos** Anastasia Stratigea***
Among the key constituents in the contemporary smart city paradigm lie ‘smart people’ and ‘smart governance’, placing at the forefront community engagement and awareness raising with regards to current and emerging cities’ challenges; and the necessity for a steady interaction/cooperation between decision-making bodies and societal groups. Within such a context, youngsters, as a specific age group and the ‘citizens of tomorrow’, seem to be largely overlooked in the prevailing ‘for all’ urban policy stream. Taking this deficit into account and the need to embrace the young generation in the effort of designing a ‘smart and sustainable city strategy for all’, the focus of this work is on the identification of barriers to youth participa-tion in local sustainable urban development processes. In fulfilling this goal, global and European evidence on this topic is explored, coupled with experiences gained by an urban environment in a less privileged urban area of Greece, Korydallos Municipality. Barriers to youth engagement identified at the global scene seem to apply to this specific urban environment too, while they are further enriched by city-specific peculiarities, emerging from the elaboration of two distinct participa-tory exercises and the use of the self-diagnosis CLEAR model.Keywords: Smart city; Smart people and governance; Sustainable urban develop-ment; bottom-up initiatives; youth participation; barriers to youth participation; CLEAR model
* Department of Economic & Regional Development, Panteion University, Greece; [email protected]; **School of Business and Economics, University of West Attica, Greece. [email protected]; ***Corresponding author, Department of Geography & Regional Planning, School of Rural and Surveying Engineering, National Technical University of Athens, Greece. [email protected]
Panteion University University of West Attica
National Technical University of Athens
INTRODUCTION
The concept of participation has vigorously entered the body of urban and regional planning theory during the 1960s (Friedmann, 1987; Garau, 2012), and is further emphasized during the nineties, as a result of a gradually changing planning para-
90 N. Marava, A. Alexopoulos & A. Stratigea
digm, introducing a transition from a top-down to a bottom-up approach (Fishkin, 1995; Rhodes, 1997; Bishop, 1998; Norris, 1999; Stratigea, 2009; Ozcevik et al., 2010; Stratigea et al., 2017; 2018; Chaskin et al., 2018). Such a transition has marked the shift from a regulatory governmental approach to a more democratic and inclusive governance model, while going hand in hand with technological evo-lutions and the emerging smart city paradigm, having as key constituents, among others, the ‘smart people’ and ‘smart governance’ dimensions (Stratigea et al., 2015; Berntzen and Johannessen, 2016; Spil et al., 2017; Chaskin et al., 2018; Simonofski et al., 2019; Marava et al., 2019). These two streams, i.e. human resources and gov-ernance, are perceived as main ingredients of a smart city, leveraged by a third one, i.e. technology (Lombardi et al. 2012; Zait 2016; Marava et al., 2019), illuminating the value of community empowerment as well as evolving multi-actor and multi-level policy making schemes in streamlining more knowledgeable, ICT-enabled policy decisions in a smart city context.
Speaking of the planning discipline, the increasing importance of participa-tion has been stressed by many researchers (Baycan-Levent and Nijkamp, 2009; Stratigea, 2015), as a means towards more knowledgeable planning outcomes at the urban/regional level, consistent with communities’ expectations. The boost of participatory approaches in various planning problems has broadened the scope of participation, demarcating a shift from pure participation to participatory de-mocracy (Allegretti, 2006), which goes beyond the formal representative model (Gangemi, 2009; Stratigea, 2015) and gains ground in the new smart city para-digm. Participation, in this respect, is realized as both an opportunity for consulta-tion and accountability of the various urban actors, and a chance for involvement in more democratic activities (Murgante and Borruso, 2015; Zait, 2016; Marava et al., 2019). Furthermore, it is perceived as the means for awareness raising and motivation of responsible behaviour for reaching glocal (global-local) sustainable development (SD) goals (Parnell, 2016).
The necessity to advance democratic decision-making processes and governance models for dealing with contemporary SD challenges has been largely recognized at a global level (Kiilakoski and Gretschel, 2014). The value of public participa-tion and the local level has also been unveiled in this discourse (Rio Declaration, 1992), with local actions and sustainable behavioural patterns being perceived as key drivers for reaching global SD goals (‘think global act local’ principle) (UN-Habitat, 2012; Parnell, 2016). This has pushed forward participatory urban plan-ning exercises (Baycan-Levent and Nijkamp, 2009) that are grounded on citizens’ empowerment and community development (Kasmell and Andersen, 2011; Garau, 2012; Stratigea, 2012; Chaskin et al., 2018), while establishing new principles and a variety of participatory tools facilitating democratic dialogue, sharing and respon-sibility, commitment and awareness-raising in societies.
Bottom-up urban planning practices and citizens’ participation are nowadays largely supported by smart developments and technology-enabled applications, in-
Barriers to Empowering and Engaging Youth in Sustainable Urban Development Endeavours 91
stitutionalization of participation in various policy making fields, grassroots’ activ-ism, and the gradual maturing of both decision-making bodies and community in dealing with the current, of global extent, SD challenges. In such a context however, a certain deficit is noticed as far as youth participation is concerned, with needs and peculiarities of this specific target group being largely overlooked in participatory planning endeavours.
Having noticed this shortage, the goal of this paper is to explore the barriers and obstacles that confine youth participation in relevant processes at the urban level. This was accomplished by an attempt to outline barriers to youth engagement at the global/European scenery. This picture is complemented with experience gained from a less privileged urban area, namely Korydallos Municipality in Attica Region-Greece through the outcomes of two bottom-up participatory planning exercises. Part of the scope of these two exercises at the local level was to strengthen youth’s sense of belonging and raise awareness on glocal SD challenges, and explore barriers to youth participation in a structured way, following the CLEAR model guidelines (Lowndes et al., 2006a).
The structure of the paper is as follows: first youth participation and its role in pursuing sustainable SD objectives is discussed, sketching also key barriers identi-fied in the European and global scenery; then experience-based results as to barriers to youth engagement at the Korydallos urban locality are illuminated through two participatory case studies; finally, some conclusions are drawn.
ENGAGING YOUTH FOR SERVING SUSTAINABLE URBAN DEVELOPMENT OBJECTIVES
Why youth? The great value of youth participation in decision-making processes is, among others, associated with the population share falling into this age group, and the ambiguous position this group has so far occupied in social science research (UN-Habitat, 2013). Indeed, youngsters (12-14 years old) are currently reaching almost a quarter of world’s population (23%). Furthermore, they share certain at-tributes such as dynamism and doubt, flexibility and adjustability, and willingness to change, rendering youth problem solvers, who can bring on board fresh and in-novative ideas as to current societal concerns (Merkle, 2003).
Youth is also perceived a main pillar for fulfilling SD objectives at a glocal lev-el. Indeed, this has been early enough grasped and articulated in the Brundtland Report (1987), recognized by the United Nations declarations (UN-Habitat, 2013), setting youth high in the policy agenda, acknowledged by international organiza-tions and scientific communities, and appreciated at the local/regional level as well.
However, respective youth engagement efforts have not always been proven suc-cessful, bringing to the forefront the question: do youth really grasp the importance and care about SD issues? The answer to this question comes from evidence-based

92 N. Marava, A. Alexopoulos & A. Stratigea
results produced by various studies (see European Commission [EC], 2013), reveal-ing that SD issues gain youth’s interest for a number of reasons. Among them lie youth’s realization of being the main victims of inherited environmental and socio-economic challenges, and having the greater stake for reversing undesired trends in a longer run. Studies in the European Union demonstrate a growing interest of youth in SD goals (EC, 2013) and their willingness to contribute through engaging in unconventional participation schemes (e.g. environmental organizations, NGOs), lying at a distance from formal political processes.
Taking into consideration the current policy initiatives for youth engagement on the one hand and the youth’s interest for SD on the other, the reverse question is raised, namely ‘how successful these initiatives are in meeting youth’s interests’? Are there efficient communication bridges, established between policy makers and youth that enable effective and substantial interaction? Response to these questions unveils a certain gap in communication and youth’s engagement in articulating SD policy decisions, largely reflecting the domination of old interaction patterns and the lack of attractive/creative youth engagement approaches. This is more evident in the context of Climate Change (CC) policies, where despite the value attached to youth in responding to CC challenges, relative policies are planned ‘for’ and not ‘with’ youth (Narksompong and Limjirakan, 2015).
In an effort to fill the aforementioned gap, policy making bodies adopt nowa-days a variety of practises, targeting youth engagement in SD endeavours. These, as stated by Gretschel et al. (2014), fall into both conventional, e.g. youth councils at the local level as applied in Finland, Spain, Cyprus, Estonia etc., and innovative, such as the young mayor example, applied in Lewisham, UK. Gretschel et al. (2014) provide some interesting examples of relevant good practices for youth engagement in the EU, falling into these two categories.
Despite some promising results though, youth participation in decision-making for SD seems to be fraught with difficulties, associated with the lack of information and training of youth in respect of the very essence of the SD concept. The vague nature of SD and the feeling that potential interventions at the personal/collective level are rather limited, since important decisions are made at a global scene, dis-courage youth from engaging and undertaking relevant action.
Furthermore, a recent study of European Commission (EC) and the Council of Europe (CE) on youth participation (EC-CE, 2015) identifies a certain ‘paradox’ as to the gap of youth engagement. Indeed, while youth engagement is largely rec-ognized and constitutes a challenge for policy makers at the global scenery (UN-Habitat, 2013; EC-CE, 2015), at the same time youth are to a great extent perceived as a ‘problematic’, a ‘trouble’ and/or ‘troubling’ social group (UN-Habitat, 2012 and 2013) in terms of engaging them in decision-making processes. A remarkable aspect of this paradox relates to the ICT communication gap between youth and policy makers, where institutions or organizations are less familiar with ICT-enabled participation forms put first by youth, a deficit that entails communication barriers
Barriers to Empowering and Engaging Youth in Sustainable Urban Development Endeavours 93
and often results in misunderstandings between active young citizens and institu-tions (EC-CE, 2015).
Another quite relevant aspect of the above paradox relates to the lack of legislative framework but also social understanding, presuming youth as equal partners (UN-Habitat, 2013; Gretschel et al., 2014). These weaknesses, coupled with opposing behaviour from older age groups, discourage youth from participating in common affairs. Considering, however, that young people are critical stakeholders but also ‘citizens of the future’ who need to be trained and brought together into SD efforts by adopting problems’ solving behavioural patterns, such barriers constitute a de-mocracy deficit that needs to be dealt with.
The aforementioned paradox seems to be a common ground in various places around the globe (UN-Habitat, 2013). In the EU, as shown by the Euro-barometer study, dealing with youth participation in democratic processes (EC, 2013), there is a noticeable decrease of youth participation in formal political processes (election processes at all three levels); while at the same time a certain increase in youth par-ticipation is noticed in informal processes, e.g. local associations, NGOs, informal initiatives or movements. Various studies on the topic (Kiilakoski and Gretschel, 2014) reveal that youth’s limited interest to participate is also, to a large extent, the outcome of the trivial context of participatory actions, embedded in the majority of formal political processes. In fact, poor participation of youth is often the product of an overly formalistic definition of political participation, marked by trivial engage-ment forms, exclusively addressing issues of formal politics. To overcome this, the dialogue on youth participation in planning needs to step forward from the youth’s psychological and other capabilities to engage to the creation of an enabling govern-ance environment, promoting youth engagement and empowerment (Frank, 2006).
Interpreting youth’s unwillingness to participate as ‘apathy’ or ‘apolitical stand’ is a rather superficial reading. This deficit needs to be more deeply explored and the reasons behind it to be further investigated. Smart city developments and the new ICT-enabled interaction forms these introduce, coupled with the interest in promoting cooperative decision-making models at the local level, seems to create a fertile ground for filling the gap and motivating youth to become an essential part of decision-making processes for reaching urban SD objectives.
YOUTH ENGAGEMENT FOR URBAN SUSTAINABILITY – THE KORYDALLOS MUNICIPALITY EXPERIENCE
In this section, barriers applying to youth engagement in a less privileged urban locality are explored by use of two exercises that fall into the SD realm and address different youth engagement goals. The first exercise is aimed at actively engaging youth in a participatory cultural planning exercise, while the second one at raising youth awareness with respect to SD challenges. Both were carried out in 2016 in
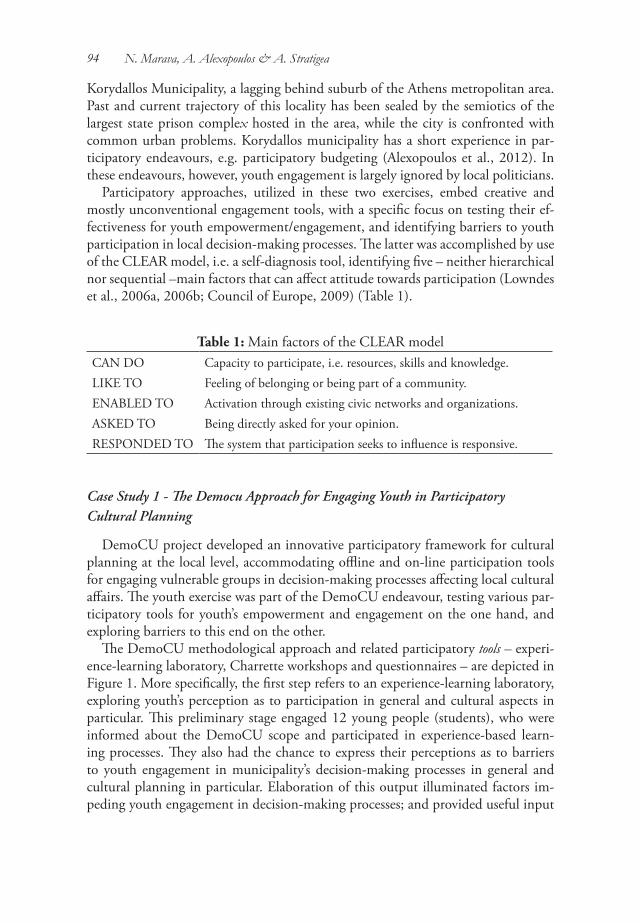
94 N. Marava, A. Alexopoulos & A. Stratigea
Korydallos Municipality, a lagging behind suburb of the Athens metropolitan area. Past and current trajectory of this locality has been sealed by the semiotics of the largest state prison complex hosted in the area, while the city is confronted with common urban problems. Korydallos municipality has a short experience in par-ticipatory endeavours, e.g. participatory budgeting (Alexopoulos et al., 2012). In these endeavours, however, youth engagement is largely ignored by local politicians.
Participatory approaches, utilized in these two exercises, embed creative and mostly unconventional engagement tools, with a specific focus on testing their ef-fectiveness for youth empowerment/engagement, and identifying barriers to youth participation in local decision-making processes. The latter was accomplished by use of the CLEAR model, i.e. a self-diagnosis tool, identifying five – neither hierarchical nor sequential –main factors that can affect attitude towards participation (Lowndes et al., 2006a, 2006b; Council of Europe, 2009) (Table 1).
Table 1: Main factors of the CLEAR modelCAN DO Capacity to participate, i.e. resources, skills and knowledge.LIKE TO Feeling of belonging or being part of a community.ENABLED TO Activation through existing civic networks and organizations.ASKED TO Being directly asked for your opinion.RESPONDED TO The system that participation seeks to influence is responsive.
Case Study 1 - The Democu Approach for Engaging Youth in Participatory Cultural Planning
DemoCU project developed an innovative participatory framework for cultural planning at the local level, accommodating offline and on-line participation tools for engaging vulnerable groups in decision-making processes affecting local cultural affairs. The youth exercise was part of the DemoCU endeavour, testing various par-ticipatory tools for youth’s empowerment and engagement on the one hand, and exploring barriers to this end on the other.
The DemoCU methodological approach and related participatory tools – experi-ence-learning laboratory, Charrette workshops and questionnaires – are depicted in Figure 1. More specifically, the first step refers to an experience-learning laboratory, exploring youth’s perception as to participation in general and cultural aspects in particular. This preliminary stage engaged 12 young people (students), who were informed about the DemoCU scope and participated in experience-based learn-ing processes. They also had the chance to express their perceptions as to barriers to youth engagement in municipality’s decision-making processes in general and cultural planning in particular. Elaboration of this output illuminated factors im-peding youth engagement in decision-making processes; and provided useful input
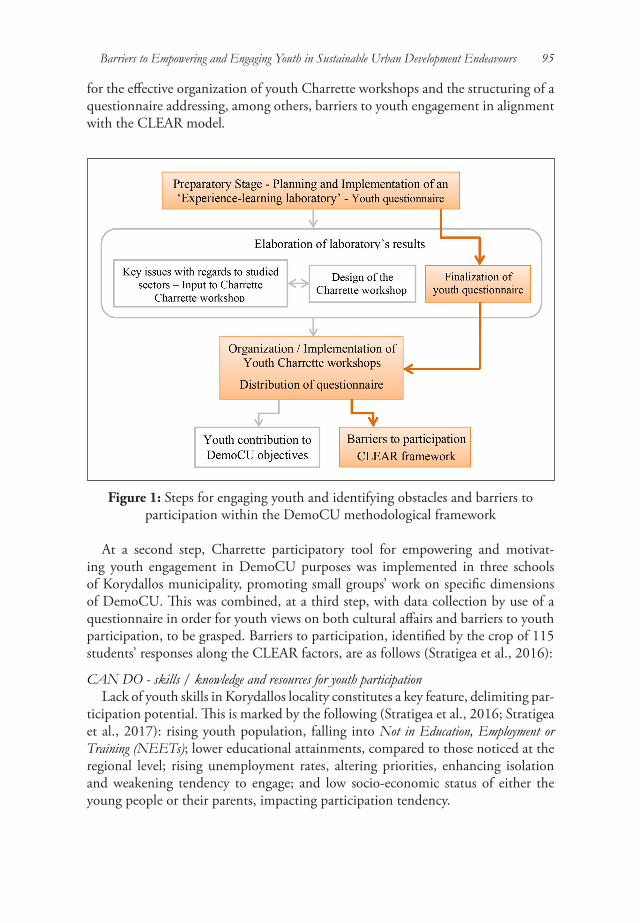
Barriers to Empowering and Engaging Youth in Sustainable Urban Development Endeavours 95
for the effective organization of youth Charrette workshops and the structuring of a questionnaire addressing, among others, barriers to youth engagement in alignment with the CLEAR model.
Figure 1: Steps for engaging youth and identifying obstacles and barriers to participation within the DemoCU methodological framework
At a second step, Charrette participatory tool for empowering and motivat-ing youth engagement in DemoCU purposes was implemented in three schools of Korydallos municipality, promoting small groups’ work on specific dimensions of DemoCU. This was combined, at a third step, with data collection by use of a questionnaire in order for youth views on both cultural affairs and barriers to youth participation, to be grasped. Barriers to participation, identified by the crop of 115 students’ responses along the CLEAR factors, are as follows (Stratigea et al., 2016):
CAN DO - skills / knowledge and resources for youth participation Lack of youth skills in Korydallos locality constitutes a key feature, delimiting par-
ticipation potential. This is marked by the following (Stratigea et al., 2016; Stratigea et al., 2017): rising youth population, falling into Not in Education, Employment or Training (NEETs); lower educational attainments, compared to those noticed at the regional level; rising unemployment rates, altering priorities, enhancing isolation and weakening tendency to engage; and low socio-economic status of either the young people or their parents, impacting participation tendency.
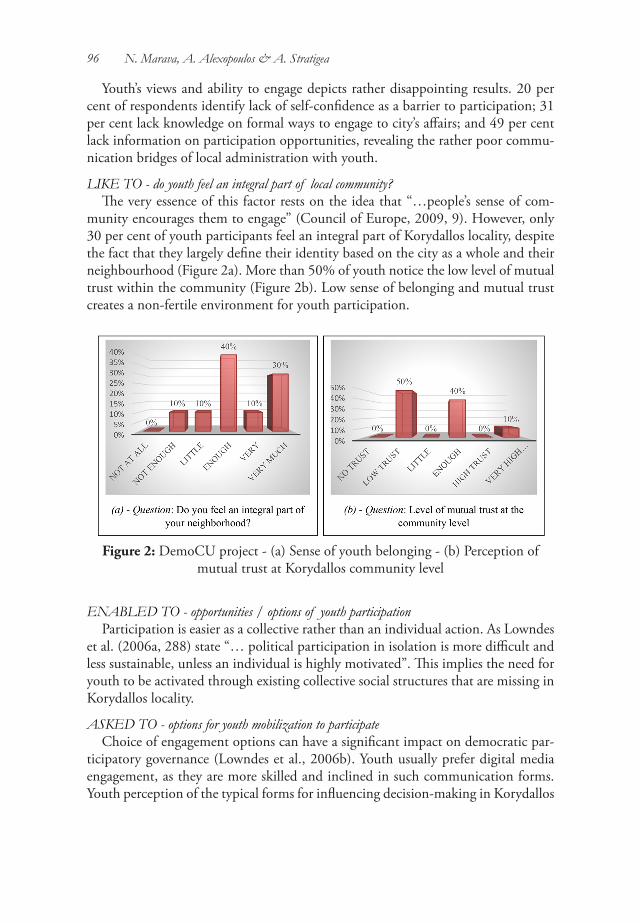
96 N. Marava, A. Alexopoulos & A. Stratigea
Youth’s views and ability to engage depicts rather disappointing results. 20 per cent of respondents identify lack of self-confidence as a barrier to participation; 31 per cent lack knowledge on formal ways to engage to city’s affairs; and 49 per cent lack information on participation opportunities, revealing the rather poor commu-nication bridges of local administration with youth.
LIKE TO - do youth feel an integral part of local community?The very essence of this factor rests on the idea that “…people’s sense of com-
munity encourages them to engage” (Council of Europe, 2009, 9). However, only 30 per cent of youth participants feel an integral part of Korydallos locality, despite the fact that they largely define their identity based on the city as a whole and their neighbourhood (Figure 2a). More than 50% of youth notice the low level of mutual trust within the community (Figure 2b). Low sense of belonging and mutual trust creates a non-fertile environment for youth participation.
Figure 2: DemoCU project - (a) Sense of youth belonging - (b) Perception of mutual trust at Korydallos community level
ENABLED TO - opportunities / options of youth participationParticipation is easier as a collective rather than an individual action. As Lowndes
et al. (2006a, 288) state “… political participation in isolation is more difficult and less sustainable, unless an individual is highly motivated”. This implies the need for youth to be activated through existing collective social structures that are missing in Korydallos locality.
ASKED TO - options for youth mobilization to participateChoice of engagement options can have a significant impact on democratic par-
ticipatory governance (Lowndes et al., 2006b). Youth usually prefer digital media engagement, as they are more skilled and inclined in such communication forms. Youth perception of the typical forms for influencing decision-making in Korydallos
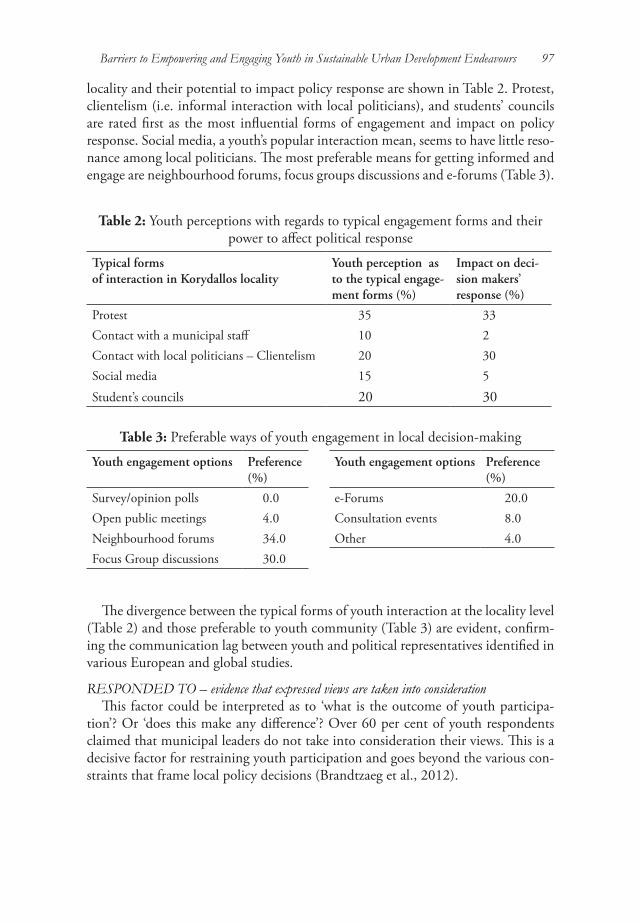
Barriers to Empowering and Engaging Youth in Sustainable Urban Development Endeavours 97
locality and their potential to impact policy response are shown in Table 2. Protest, clientelism (i.e. informal interaction with local politicians), and students’ councils are rated first as the most influential forms of engagement and impact on policy response. Social media, a youth’s popular interaction mean, seems to have little reso-nance among local politicians. The most preferable means for getting informed and engage are neighbourhood forums, focus groups discussions and e-forums (Table 3).
Table 2: Youth perceptions with regards to typical engagement forms and their power to affect political response
Typical forms of interaction in Korydallos locality
Youth perception as to the typical engage-ment forms (%)
Impact on deci-sion makers’ response (%)
Protest 35 33Contact with a municipal staff 10 2Contact with local politicians – Clientelism 20 30Social media 15 5
Student’s councils 20 30
Table 3: Preferable ways of youth engagement in local decision-making
Youth engagement options Preference (%)
Youth engagement options Preference (%)
Survey/opinion polls 0.0 e-Forums 20.0Open public meetings 4.0 Consultation events 8.0Neighbourhood forums 34.0 Other 4.0Focus Group discussions 30.0
The divergence between the typical forms of youth interaction at the locality level (Table 2) and those preferable to youth community (Table 3) are evident, confirm-ing the communication lag between youth and political representatives identified in various European and global studies.
RESPONDED TO – evidence that expressed views are taken into considerationThis factor could be interpreted as to ‘what is the outcome of youth participa-
tion’? Or ‘does this make any difference’? Over 60 per cent of youth respondents claimed that municipal leaders do not take into consideration their views. This is a decisive factor for restraining youth participation and goes beyond the various con-straints that frame local policy decisions (Brandtzaeg et al., 2012).
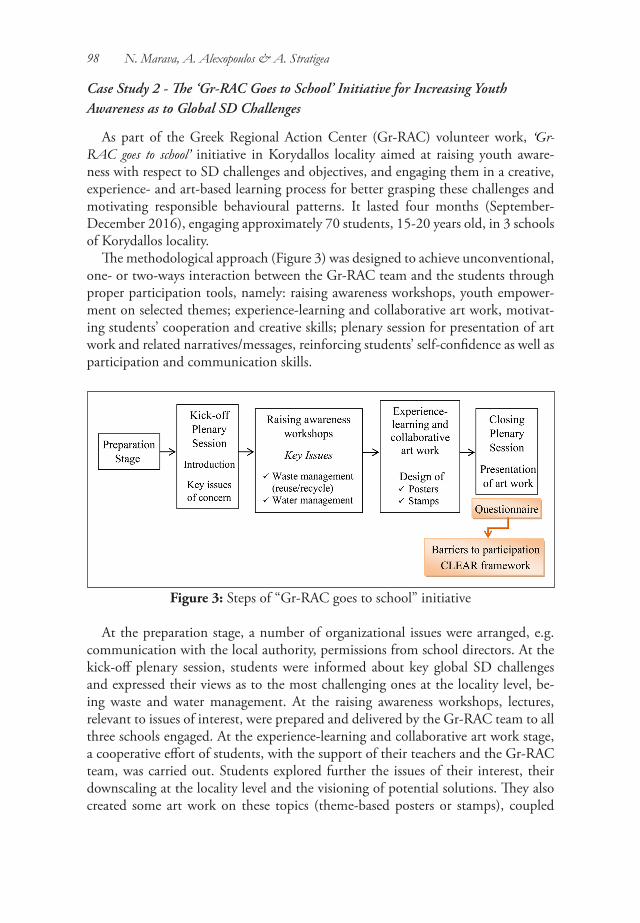
98 N. Marava, A. Alexopoulos & A. Stratigea
Case Study 2 - The ‘Gr-RAC Goes to School’ Initiative for Increasing Youth Awareness as to Global SD Challenges
As part of the Greek Regional Action Center (Gr-RAC) volunteer work, ‘Gr-RAC goes to school’ initiative in Korydallos locality aimed at raising youth aware-ness with respect to SD challenges and objectives, and engaging them in a creative, experience- and art-based learning process for better grasping these challenges and motivating responsible behavioural patterns. It lasted four months (September-December 2016), engaging approximately 70 students, 15-20 years old, in 3 schools of Korydallos locality.
The methodological approach (Figure 3) was designed to achieve unconventional, one- or two-ways interaction between the Gr-RAC team and the students through proper participation tools, namely: raising awareness workshops, youth empower-ment on selected themes; experience-learning and collaborative art work, motivat-ing students’ cooperation and creative skills; plenary session for presentation of art work and related narratives/messages, reinforcing students’ self-confidence as well as participation and communication skills.
Figure 3: Steps of “Gr-RAC goes to school” initiative
At the preparation stage, a number of organizational issues were arranged, e.g. communication with the local authority, permissions from school directors. At the kick-off plenary session, students were informed about key global SD challenges and expressed their views as to the most challenging ones at the locality level, be-ing waste and water management. At the raising awareness workshops, lectures, relevant to issues of interest, were prepared and delivered by the Gr-RAC team to all three schools engaged. At the experience-learning and collaborative art work stage, a cooperative effort of students, with the support of their teachers and the Gr-RAC team, was carried out. Students explored further the issues of their interest, their downscaling at the locality level and the visioning of potential solutions. They also created some art work on these topics (theme-based posters or stamps), coupled
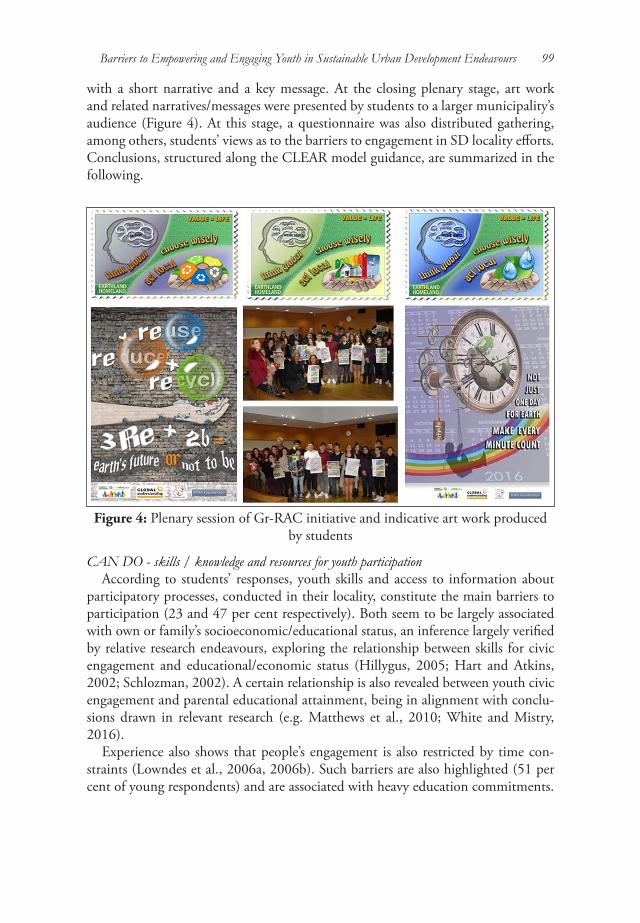
Barriers to Empowering and Engaging Youth in Sustainable Urban Development Endeavours 99
with a short narrative and a key message. At the closing plenary stage, art work and related narratives/messages were presented by students to a larger municipality’s audience (Figure 4). At this stage, a questionnaire was also distributed gathering, among others, students’ views as to the barriers to engagement in SD locality efforts. Conclusions, structured along the CLEAR model guidance, are summarized in the following.
Figure 4: Plenary session of Gr-RAC initiative and indicative art work produced by students
CAN DO - skills / knowledge and resources for youth participation According to students’ responses, youth skills and access to information about
participatory processes, conducted in their locality, constitute the main barriers to participation (23 and 47 per cent respectively). Both seem to be largely associated with own or family’s socioeconomic/educational status, an inference largely verified by relative research endeavours, exploring the relationship between skills for civic engagement and educational/economic status (Hillygus, 2005; Hart and Atkins, 2002; Schlozman, 2002). A certain relationship is also revealed between youth civic engagement and parental educational attainment, being in alignment with conclu-sions drawn in relevant research (e.g. Matthews et al., 2010; White and Mistry, 2016).
Experience also shows that people’s engagement is also restricted by time con-straints (Lowndes et al., 2006a, 2006b). Such barriers are also highlighted (51 per cent of young respondents) and are associated with heavy education commitments.
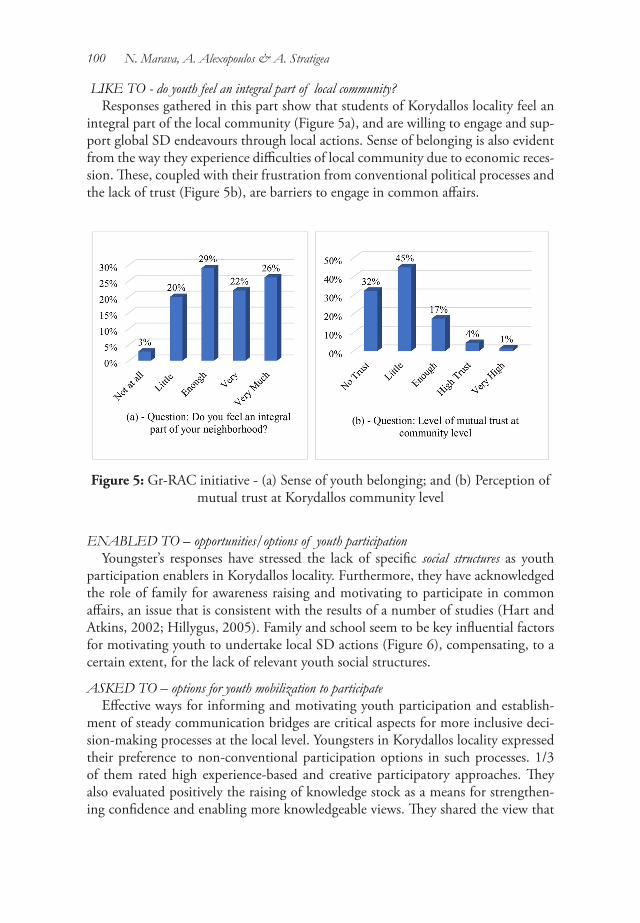
100 N. Marava, A. Alexopoulos & A. Stratigea
LIKE TO - do youth feel an integral part of local community?Responses gathered in this part show that students of Korydallos locality feel an
integral part of the local community (Figure 5a), and are willing to engage and sup-port global SD endeavours through local actions. Sense of belonging is also evident from the way they experience difficulties of local community due to economic reces-sion. These, coupled with their frustration from conventional political processes and the lack of trust (Figure 5b), are barriers to engage in common affairs.
Figure 5: Gr-RAC initiative - (a) Sense of youth belonging; and (b) Perception of mutual trust at Korydallos community level
ENABLED TO – opportunities/options of youth participation Youngster’s responses have stressed the lack of specific social structures as youth
participation enablers in Korydallos locality. Furthermore, they have acknowledged the role of family for awareness raising and motivating to participate in common affairs, an issue that is consistent with the results of a number of studies (Hart and Atkins, 2002; Hillygus, 2005). Family and school seem to be key influential factors for motivating youth to undertake local SD actions (Figure 6), compensating, to a certain extent, for the lack of relevant youth social structures.
ASKED TO – options for youth mobilization to participateEffective ways for informing and motivating youth participation and establish-
ment of steady communication bridges are critical aspects for more inclusive deci-sion-making processes at the local level. Youngsters in Korydallos locality expressed their preference to non-conventional participation options in such processes. 1/3 of them rated high experience-based and creative participatory approaches. They also evaluated positively the raising of knowledge stock as a means for strengthen-ing confidence and enabling more knowledgeable views. They shared the view that
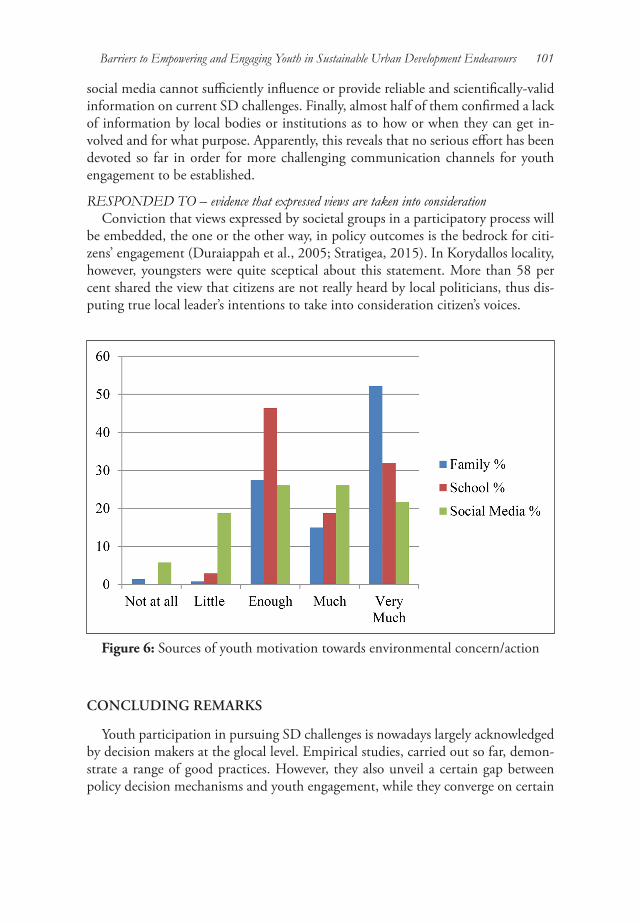
Barriers to Empowering and Engaging Youth in Sustainable Urban Development Endeavours 101
social media cannot sufficiently influence or provide reliable and scientifically-valid information on current SD challenges. Finally, almost half of them confirmed a lack of information by local bodies or institutions as to how or when they can get in-volved and for what purpose. Apparently, this reveals that no serious effort has been devoted so far in order for more challenging communication channels for youth engagement to be established.
RESPONDED TO – evidence that expressed views are taken into considerationConviction that views expressed by societal groups in a participatory process will
be embedded, the one or the other way, in policy outcomes is the bedrock for citi-zens’ engagement (Duraiappah et al., 2005; Stratigea, 2015). In Korydallos locality, however, youngsters were quite sceptical about this statement. More than 58 per cent shared the view that citizens are not really heard by local politicians, thus dis-puting true local leader’s intentions to take into consideration citizen’s voices.
Figure 6: Sources of youth motivation towards environmental concern/action
CONCLUDING REMARKS
Youth participation in pursuing SD challenges is nowadays largely acknowledged by decision makers at the glocal level. Empirical studies, carried out so far, demon-strate a range of good practices. However, they also unveil a certain gap between policy decision mechanisms and youth engagement, while they converge on certain
102 N. Marava, A. Alexopoulos & A. Stratigea
key issues or preconditions in order for effective youth participation to be reached. As the most important ones currently missing, are inferred the following:
Adoption of ICT-enabled interaction patterns for establishing steady communication bridges with youth and information channels, taking advantage of prevailing youth interaction patterns for bringing them in the socio-political discourse.
Education and training which, coupled with the unimpeded access to environmen-tal and other types of information, can increase youth’s knowledge stock and aware-ness towards SD challenges and motivate action.
Political willingness and openness, going hand in hand with trust established between youth and political leaders; and implying the transition from traditional opaque de-cision-making procedures to new, transparent and inclusive governance structures.
Use of non-conventional, experience-based and creative participatory procedures that mo-tivate and keep vivid youth’s interest. Alternative options are nowadays available, such as online campaigns, clicktivism and slacktivism, hacking and dodos attacks, crowdsourcing, liquid democracy (EC-CE, 2015).
Exploration of the international and EU context on the topic reveals certain bar-riers that are predominantly due to inadequately meeting the above requirements. These barriers were also verified by the two case studies, conducted in Korydallos locality. Additional barriers, however, can be identified, emanating from the specifi-cities of each single urban context. In the case of Korydallos locality, youth partici-pation seems to be further restricted by:
The current adverse socio-economic conditions and austerity stress, further wors-ening conditions in this underprivileged neighbourhood of the Athens metropolitan area, and strongly affecting interest to engage and youth priorities’ setting.
The lack of attractive communication bridges between youth and local adminis-tration. The latter does not take leadership neither makes strategic use of available digital means (e.g. Facebook, Twitter) for establishing linkages, spreading informa-tion and engaging youth in local affairs. Youth peculiarities are generally not yet firmly addressed in the political agenda.
The absence of youth structures for youngsters’ empowerment and motivation to engage, an issue partly compensated for by the family and school environment.
Face-to-face participatory tools used in DemoCU and Gr-RAC initiatives and the focus on youth’s creativity and experience-learning have proved powerful tools for unfolding their thoughts, skills and perceptions. Moreover, knowledge stock upgrading and awareness raising as well as creative work on SD issues were ac-knowledged by students as skills- and confidence-building mechanisms. Highly ap-preciated was also the stepwise building of trust and collaborative work, resulting in willingness to engage, cooperate, unfold creative skills and publicly defend out-comes produced. An important result of the two exercises was also youth commit-ment to join efforts and undertake a leading role to local SD activities, while acting as ambassadors of SD messages in the family, the school and the local community environment. The value of CLEAR model should also be noticed, being a useful
Barriers to Empowering and Engaging Youth in Sustainable Urban Development Endeavours 103
tool for structuring and systematically interpreting barriers to youth participation in the two case studies. Finally, it should be mentioned that barriers identified in the specific locality largely reflect general inadequacies with regards to smart gov-ernance constituents of this specific area – i.e. governance, assets and management as decisive layers; and the interplay among technology, people and governance, as shown in a previous work of the authors (Marava et al., 2019). In fact, Korydallos administration, i.e. a typical medium-scale city in Greece, although having already undertaken certain steps towards the smart city in general and smart governance directions in particular, it bears the deficit noticed in the global/EU environment with regards to youth engagement. Participatory efforts, already carried out at the local level, face local community as a whole, overlooking specificities and potential role of youth community. Insight gained in the two case studies, presented in this work, has provided well-documented results on barriers to youth participation that can guide local administration towards more targeted youth engagement initiatives.
ACKNOWLEDGEMENTS
We would like to acknowledge EEA Grants, Program “We are all Citizens”, for funding the DemoCU Project: “Development of a Participatory Methodological Approach and an e-Platform for Planning the Integrated Cultural Policy at the Local Level: Α Pilot Application at the Municipality of Korydallos / DemoCU - Democratic Platform of Culture”, carried out at the Municipality of Korydallos, Greece, in the time span 2015-16.Also our sincere thanks are given to Prof. Benno Werlen, Head of the ‘2016 International Year of Global Understanding – IYGU’ global initiative, for his steady dedication in supporting the Greek Regional Action Center - Gr-RAC. This was established at the National Technical University of Athens, as part of the IYGU initiative, and carried out volunteer actions for the promotion of IYGU objectives in the Greek territory.
REFERENCES
Alexopoulos, A., Papaelias, Th., & Gasparinatos, K. (2012) The concept of participatory budgeting in local administration and its perspectives: The case of Korydallos municipality. In A. Makrydimitris, M. Stamatas, L. Maroudas, & H. Paravita (Eds.), Administration and Democracy: quality, effectiveness, legitimization. Athens: Sakkoula Publishing Company, 721-742. (in Greek)
Allegretti, U. (2006) Verso una nuova forma di democrazia: la democrazia partecipativa. democrazia e diritto, 3, 7-13.
Baycan-Levent, T., & Nijkamp, P. (2009) Planning and management of urban
104 N. Marava, A. Alexopoulos & A. Stratigea
green spaces in Europe: Comparative analysis. Journal of Urban Planning and Development, 135(1), 1-12. DOI: 10.1061/(ASCE)0733-9488(2009)135:1(1).
Berntzen L., & Johannessen, M. (2016) The role of citizen participation in municipal smart city projects: Lessons learned from Norway. In J. Gil-Garcia, T. Pardo, & T. Nam (Eds.) Smarter as the New Urban Agenda - A Comprehensive View of the 21st Century City. Hiedelberg: Springer, 299-314.
Bishop, J. (1998) Collaboration and consensus. Town and Country Planning, 67(3), 111-114.
Brandtzaeg, P. B., Følstad, A., & Mainsah, H. N. (2012) Designing for youth civic engagement in social media. IADIS Press, Proceedings of the IADIS International Conference of Web-Based Communities and Social Media, Lisbon, Portugal, 19 - 21 July, 65-73.
Brundtland Report (1987) Our Common Future. Report of the World Commission on Environment and Development. United Nations.
Chaskin, R.J., McGregor, C., & Brady, B. (2018) Engaging urban youth: Community, citizenship, and democracy. Galway: UNESCO Child and Family Research Centre, National University of Ireland Galway.
Council of Europe (2009) CLEAR tool. European Committee on Local and Regional Democracy (CDLR), Committee of Experts on Democratic Participation and Public Ethics as Local and Regional Level (LR-DP), LR-DP(2008)9, Strasbourg, 15 February 2008.
Duraiappah, A. K., Roddy, P., & Parry, J. E. (2005) Have participatory approaches increased capabilities? Retrieved from the Website of the International Institute for Sustainable Development (IISD):
https://www.iisd.org/system/files/publications/economics_participatory_approaches.pdf.
European Commission – EC (2013) European youth: Participation in democratic life. Final Report, EACEA 2010/03.
European Commission & the Council of Europe – EC-CE (2015) Analytical paper on youth participation. Available at: https://pjpeu.coe.int/documents/42128013/47261980/What+is+youth+participation.pdf/223f7d06-c766-41ea-b03c-38565efa971a.
Fishkin, S. J. (1995) The Voice of the People, Public Opinion and Democracy. New Heaven: Yale University Press.
Frank, K. I. (2006) The potential of youth participation in planning, Journal of Planning Literature, 20, 351-370.
Friedmann, J. (1987) Planning in the Public Domain: From Knowledge to Action.
Barriers to Empowering and Engaging Youth in Sustainable Urban Development Endeavours 105
Princeton, New Jersey: Princeton University Press. https://doi.org/10.1515/9780691214009.
Gangemi, G. (2009) Le varie forme della partecipazione. Foedus, 25, 102-126.Garau, C. (2012) Citizen participation in public planning: A literature review.
International Journal of Sciences, 1, 21-44.Gretschel, A., Levamo, T.M., Kiilakoski T., Laine, S., Mäntylä, N., Pleyers, G., &
Raisio, H. (2014) Youth participation good practices in different forms of regional and local democracy. Helsinki: Finnish Youth Research Network. DOI:10.13140/RG.2.1.4315.0806.
Hart, D., & Atkins, R. (2002) Civic competence in urban youth. Applied Developmental Science, 6(4), 227-236. DOI: 10.1207/S1532480XADS0604_10.
Hillygus, D. S. (2005) The missing link: Exploring the relationship between higher education and political behavior. Political Behavior, 27(1), 25-47.
Lowndes, V., Pratchett, L., & Stoker, G. (2006a) Diagnosing and remedying the failings of official participation schemes: The CLEAR framework. Social Policy and Society 5(2), 281-291. DOI: 10.1017/S1474746405002988.
-----. (2006b) Locality matters: Making participation count in local politics, Institute of Public Policy Research (IPPR).
Kasmell, A., & Andersen, P.T. (2011) Measurement of community empowerment in three community programs in Rapla-Estonia. International Journal of Environmental Research and Public Health, 8, 799-817. DOI: 10.3390/ijerph8030799.
Kiilakoski, T., & Gretschel, A. (2014) Challenging structured participation opportunities.
https://www.researchgate.net/publication/335320501_Challenging_structured_participation_opportunities.
Lombardi, P. L., Giordano, S., Farouh, H. & Yousef, W. (2012) Modelling the smart city performance. Innovation - The European Journal of Social Science Research, 25(2), 137-149. DOI: 10.1080/13511610.2012.660325.
Marava, N., Alexopoulos, A. & Stratigea, A. (2019) Tracking paths to smart governance: The case of Korydallos municipality, Greece. In A. Stratigea & D. Kavroudakis (Eds.), Mediterranean cities and island communities: Smart, sustainable, inclusive and resilient, Switzerland: Springer Nature, pp. 81-112. DOI: 10.1007/978-3-319-99444-4_4.
Matthews, T. L., Hempel, L. M., & Howell, F. M. (2010) Gender and the transmission of civic engagement: Assessing the influences on youth civic activity. Sociological Inquiry, 80(3), 448-474. DOI: 10.1111/j.1475-682X.2010.00342.x.
106 N. Marava, A. Alexopoulos & A. Stratigea
Merkle, C. (2003) Youth participation in El Alto – Bolivia. Environment and Urbanization, 15(1), 205-214. DOI: 10.1177/095624780301500117.
Murgante, B., & Borruso, G. (2015) Smart cities in a smart world. In S. T. Rassia & P. Pardalos (Eds.), Future city architecture for optimal living, Switzerland: Springer International Publishing, 13-35.
Narksompong, J., and Limjirakan, S. (2015) Youth participation in climate change for sustainable engagement. Review of European, Comparative and International Environmental Law (RECIEL), 24(2), 171-181. DOI: 10.1111/reel.12121.
Norris, P. (1999) Critical citizens – Global support for democratic governance. Oxford University Press.
Ozcevik, O., Beygo, C., & Akcakaya, I. (2010) Building capacity through collaborative local action: Case of Matra REGIMA within Zeytinburnu Regeneration Scheme. Journal of Urban Planning and Development, 136(2), 169-175. DOI 10.1061/(ASCE)0733-9488(2010)136:2(169).
Parnell, S. (2016) Defining a global urban development agenda. World Dev. 78, 529–540. DOI: 10.1016/j.worlddev.2015.10.028.
Rhodes, R.A.W. (1997) Understanding governance - Policy networks, governance, reflexivity and accountability. Philadelphia, PA: Open University Press.
Rio Declaration (1992) Rio Declaration on environment and development, Report of the United Nations Conference on Environment and Development, United Nations, A/CONF.151/26 (Vol. I).
Schlozman, K. L. (2002) Citizen participation in America: What do we know? Why do we care? In I. Katznelson, & H. V. Milner (Eds.), Political science: State of the Discipline New York: W.W. Norton and Co., 433–461.
Simonofski, A., Serral Asensio, E. & Wautelet, Y. (2019) Citizen participation in the design of smart cities: Methods and management framework. In A. Visvizi & M. D. Lytras (Eds.), Smart cities: Issues and challenges – Mapping Political, Social and Economic Risks and Threats, Amsterdam: Elsevier, 47-62. DOI: 10.1016/B978-0-12-816639-0.00004-1.
Spil, T.A.M., Effing, R., & Kwast J. (2017) Smart city participation: Dream or reality? A comparison of participatory strategies from Hamburg, Berlin & Enschede. In A. Kar et al. (Eds.), Digital nations – Smart cities, innovation, and sustainability. I3E 2017. Lecture Notes in Computer Science, Vol. 10595. Springer, Cham, Print DOI: 10.1007/978-3-319-68557-1_12.
Stratigea, A. (2009) Participatory planning and sustainable local development – A methodological approach, Proceedings of the 2nd National Conference of Urban and Regional Planning and Regional Development. 24-27 September
Barriers to Empowering and Engaging Youth in Sustainable Urban Development Endeavours 107
(pp. 43-51) Volos, Greece (in Greek).-----. (2012). The concept of smart cities – Towards community development?
NETCOM, 26(3-4), 375-388.-----. (2015) Theory and methods of participatory planning, Athens: Greek Academic
Electronic Books. (in Greek)Stratigea, A., Kikidou, M., Patelida, M., & Somarakis, G. (2018) Engaging citizens
in planning open public space regeneration: Pedio Agora framework. Journal of Urban Planning and Development, 144(1), 1-10. DOI: 10.1061/(ASCE)UP.1943-5444.0000418.
Stratigea, A., Papadopoulou, Ch.-A. & Panagiotopoulou, M. (2015) Tools and technologies for planning the development of smart cities: A participatory methodological framework. Journal of Urban Technology, 22(2), 43-62. DOI: 10.1080/10630732. 2015.1018725.
Stratigea, A., Somarakis, G., Panagiotopoulou, M., Katsoni, V., Marava, N., & Alexopoulos, A. (2016) Analysis of the current situation - Recording and visualisation of cultural structures and infrastructures of the Korydallos Municipality. Project DemoCU, Report I. (in Greek)
Stratigea, A., Somarakis, G., & Panagiotopoulou, M. (2017) Smartening-up communities in less-privileged urban areas – The ‘DemoCU’ participatory cultural planning experience in Korydallos – Greece municipality. In A. Stratigea, E. Kyriakides, & Ch. Nicolaides (Eds.), Smart cities in the Mediterranean - Coping with Sustainability Objectives in Small and Medium-Sized Cities and Island Communities. Switzerland: Springer Nature, 85-111.
UN-Habitat (2012) Young people, participation and sustainable development in an urbanizing world. Retrieved from: https://unhabitat.org/sites/default/files/download-manager-files/Young%20People.pdf,
-----. (2013) Advancing youth civic engagement and human rights with young women and young men. Retrieved from: https://www.youthpolicy.org/library/wp-content/uploads/library/2013_Advancing_Youth_Civic_Engagement_Human_Rights_Eng.pdf.
White, El. S., & Mistry, R. (2016) Parent civic beliefs, civic participation, socialization practices, and child civic engagement. Applied Developmental Science, 20(1), 44-60. DOI: 10.1080/10888691.2015.1049346.
Zait, A. (2016) Exploring the role of civilizational competences for smart cities development. Transforming Government: People, Process and Policy, 11(3), 377-392. DOI: 10.1108/TG-07-2016-0044.
Urban Heat, Vulnerability, and the Public Realm: Lessons from Tel Aviv-Yafo and Implications for
COVID-19 Recovery
Geography Research Forum • Vol. 40 • 2020: 108-136.
* Center for Resilient Cities and Landscapes, Columbia University, New York, NY, USA. [email protected]; [email protected]; [email protected]
Johanna Lovecchio*, Grga Basic*, and Thaddeus Pawlowski* Columbia University
Climate change is leaving Tel Aviv-Yafo hotter and drier. A hotter climate means more energy to cool buildings, more people staying indoors or in cars, and vulner-able people becoming sick from heat exposure. In some neighborhoods, streets were designed to channel sea air through open boulevards, while green spaces provide needed shade. But in other neighborhoods, the streets are dense, narrow, with lim-ited vegetation or green spaces, and communities on the social margins typically have fewer resources to adapt. In the first part of this paper, we discuss the case of The Resilience Accelerator in Tel Aviv-Yafo, a program of the Center for Resilient Cities and Landscapes which supports community-based and local government actions towards climate resilience project implementation with multi-disciplinary and sectoral engagements. This process engaged a spatial heat vulnerability analy-sis to prioritize areas of the city most physically exposed and socially sensitive to heat impacts. Then, it brought together stakeholders from across disciplines, sec-tors, and scales to design projects that mitigate heat impacts and also create a vibrant and accessible public realm in the Shapira neighborhood. Soon after the conclusion of the Accelerator, COVID-19 was declared a pandemic by the World Health Organization, and decision-makers at all levels of government worldwide have faced unprecedented challenges in not only responding to the imminent pub-lic health crises, but also the compounding vulnerabilities and hazards related to climate risk in the most vulnerable communities. So, in the second part of this paper, we reflect on how the pandemic has shed new light on the intersections of risk and areas of future investigation to further unpack the role of the urban plan-ner and designer in constructing and deconstructing oppression and vulnerability. Keywords: Urban Planning and Design, Climate Adaptation, Community En-gaged Design, Vulnerability Analysis
Urban Heat, Vulnerability, and the Public Realm: Tel Aviv-Yafo and COVID-19 Recovery 109
INTRODUCTION
In this paper, we explore insights around how spatial analysis can expose inter-connected risks to inform new paradigms of planning and design that seek not only climate adaptation, but also social equity at the community level. We look first to the Resilience Accelerator Tel Aviv-Yafo (referred to in this paper as the Accelerator, 2018-2019), as a case study in engaging local neighborhood stakeholders to lever-age heat vulnerability analysis to guide adaptation and resilience project design in Shapira, Tel Aviv, where social sensitivity indicators compound with heat exposure. In this neighborhood, socio-political, economic, and environmental stresses meet: From displacement caused by rising housing unaffordability to disproportionate exposure to heat. These vulnerabilities are further compounded by the increasing presence of asylum seekers and migrants largely from east Africa who, in and of themselves, lie at the margins of society and the intersection of climate risk, legacies of colonization, pressures of globalization, and the disruption of social networks caused by all three (Vinyeta, et al., 2015).
After the conclusion of the Accelerator, COVID-19 was declared a pandemic by the World Health Organization (2020), and decision-makers at all levels of govern-ment worldwide have faced unprecedented challenges in not only responding to the imminent public health crises, but also the compounding vulnerabilities and hazards related to climate risk in the most vulnerable communities. So, in the sec-ond part of this paper, we reflect on how the pandemic has shed new light on the intersections of risk and the role of the urban planner and designer in constructing and deconstructing oppression and vulnerability manifest in the built environment and the social conditions inhabited within it and constructed by it.
In this frame, it is worthwhile to reflect on the initial question underpinning the mission of the Accelerator to support project-based resilience building: How can we better bridge the gaps between urban planning and design, scientific and academic research, the work of NGOs and community-based organizations, and the resources that can be leveraged in the philanthropic and private sectors towards climate adap-tation in communities most at-risk to increasing urban heat?
But that question must be taken in the context of a global pandemic and ignited social movement around the world and a global dialogue around the intersectional-ity of social and economic justice, climate change and adaptation, and public health. So, reflection of the lessons learned through the Resilience Accelerator in Tel Aviv-Yafo and similar programs, might necessarily evolve towards greater inclusion and reckoning of the current power structures that have constructed and maintained climate change and social injustice. Until now, the global urban resilience network gained facility bridging ideas and practices between philanthropy, government, aca-demia, and business and sought to identify and scale transformative urban projects. But can this constellation of influence still operate when it is centered on grass-roots community empowerment?

110 J. Lovecchio, G. Basic & T. Pawlowski
RESILIENCE ACCELERATOR: A CASE STUDY IN HEAT VULNERABILITY ANALYSIS AS A TOOL FOR NEIGHBORHOOD-BASED ACTION
Tel Aviv-Yafo is reconciling how the built environment can both support eco-nomic and population expansion, while not contributing to or exacerbating climate change and its impacts on vulnerable communities, neighborhood fabric and char-acter, and surrounding ecosystems. For these reasons, and in pursuit of the imple-mentation of the Tel Aviv-Yafo Resilience Strategy, which aims to build resilience in light of these dynamics, the Accelerator program advanced research and design in response to increasing risk from urban heat.
Given Tel Aviv’s ongoing work on implementation of the Tel Aviv-Yafo Resilience Strategy and development of a City-wide Climate Action Plan, the Municipality ap-plied to the Resilience Accelerator program in April 2018. Together, the Accelerator engaged an interdisciplinary and inter-sectoral partnership between the Center for Resilient Cities and Landscapes at Columbia University (CRCL), the for-mer 100 Resilient Cities Network--Pioneered by the Rockefeller Foundation, the Municipality of Tel Aviv-Yafo, Tel Aviv University, the NASA Goddard Institute of Space Studies, and the Center for Climate Systems Research at Columbia University’s Earth Institute to identify vulnerability to increasing urban heat and define action that supports the most vulnerable in the city.
Between 2018 and 2019, the Accelerator convened municipal leaders and stake-holders, designers, academic and scientific experts, and community leadership, for an intensive research program and facilitated a design session to design pilot project concepts in Shapira neighborhood in November, 2019. The process included place-based design research, city-wide heat vulnerability analysis and site selection process, climate and microclimate modeling, case studies, and workshop findings. Finally, it culminated with a set of actionable pilot project design concepts and actionable next steps that can achieve impact at scale. Recognizing the connections between com-munity vulnerability, heat, and sustainability, three core research questions emerged: What design interventions can help Tel Aviv-Yafo to address urban heat in the most vulnerable communities? What if the public realm could be reimagined with the changing climate? What if the design could cultivate a rich fabric of communities, ecologies, and economies?
July 2019 was the hottest month ever measured on Earth (National Oceanic and Atmospheric Administration. 2019). Where the desert meets the Mediterranean Sea, climate change is leaving Tel Aviv-Yafo hotter and drier. Since the 1980s, Tel Aviv-Yafo warmed nearly 2°C (Yosef et al., 2019). In the last decade, warming in the Tel Aviv-Yafo and the Middle East region has outpaced almost every other region on Earth. This trend is expected to accelerate over the next century if global emissions remain on the same trajectory. Assuming emissions remain in the business as usual scenario (RCP 8.5), average annual temperatures are expected to increase by up to
Urban Heat, Vulnerability, and the Public Realm: Tel Aviv-Yafo and COVID-19 Recovery 111
4.5°C by the 2080s and annual precipitation may decrease by up to 10 percent in the 2020s and up to 38 percent by the 2080s. There could be up to 53 more days over 33°C as soon as this decade, and the average heat wave is expected to last one week longer by the 2050s (NASA, 2015).
Today, Tel Aviv-Yafo’s subtropical Mediterranean climate and urban microcli-matic conditions are influenced by two dynamic factors: The Mediterranean Sea and urbanization. Meanwhile, the city is growing and expects a 37 percent increase in population by 2035, intensifying patterns of urbanization and the urban heat island effect, which represents the totality of microclimatic changes brought about by man-made alterations to the urban surface (Landsberg, 1981). Tel Aviv-Yafo is hotter than surrounding areas because of four related factors: Heat sources and par-ticulate pollution from infrastructure, cars, buildings; materials and surfaces that absorb and radiate heat; the loss of vegetation that evaporates water and provides shade; and, the spatial relationships and geometries of streets, roads, buildings, and open spaces. None of these factors can be considered in isolation: Tall buildings may create shade, but they also trap heat and obstruct the flow of cooling breezes, even in a coastal city.
The dimensions of these impacts transcend the health and vitality of people, eco-systems, and economy; the viability of critical infrastructure and energy resources; and the vibrancy and safety of public spaces. Rapid growth is complicating decisions and affecting resources around energy, housing, infrastructure, community and cul-tural services, and water systems. The vulnerabilities, inefficiencies, and inequities in the built, institutional, and social systems that shape our everyday are revealed through them. At stake are the lives and livelihoods of vulnerable communities and the ecological systems on which all life depends.
Vulnerable neighborhoods are consistently those on the social margins and physi-cal conditions interlock in a feedback loop that maintains exposure and sensitivity and disproportionate burden of risk. Those who are most physically exposed to heat due to decisions made in the built environment that favor hard and energy intensive infrastructure and housing are also often least resourced socially and financially to adapt: Small businesses with lost foot traffic, kids unable to play outside, isolated seniors, and families unable to keep up with increased energy costs for air condi-tioning. Cascading consequences of heat suggest the interconnected nature of risk: Small businesses, for example, with months of lost foot traffic reduce revenue and jeopardize business sustainability, livelihoods, and important community resources for residents.
Health and People
Heat isn’t just about comfort. In Israel, premature deaths and mortality from heat are especially acute among the very young, very old, minorities, and those with chronic and mental illness; and, overall, hospital admissions increase during heat waves (Green et al. 2013). One study found that visits to the emergency room in
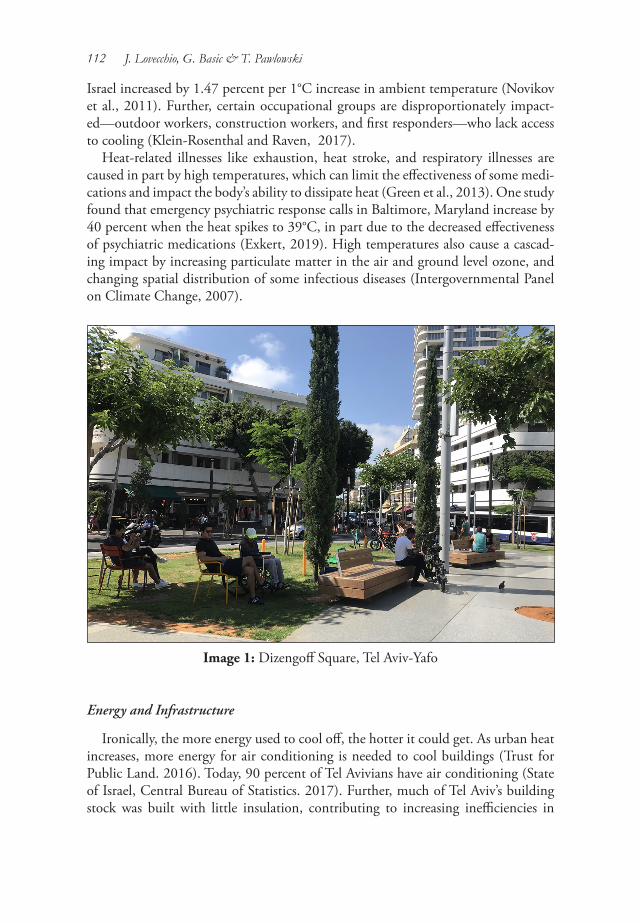
112 J. Lovecchio, G. Basic & T. Pawlowski
Israel increased by 1.47 percent per 1°C increase in ambient temperature (Novikov et al., 2011). Further, certain occupational groups are disproportionately impact-ed—outdoor workers, construction workers, and first responders—who lack access to cooling (Klein-Rosenthal and Raven, 2017).
Heat-related illnesses like exhaustion, heat stroke, and respiratory illnesses are caused in part by high temperatures, which can limit the effectiveness of some medi-cations and impact the body’s ability to dissipate heat (Green et al., 2013). One study found that emergency psychiatric response calls in Baltimore, Maryland increase by 40 percent when the heat spikes to 39°C, in part due to the decreased effectiveness of psychiatric medications (Exkert, 2019). High temperatures also cause a cascad-ing impact by increasing particulate matter in the air and ground level ozone, and changing spatial distribution of some infectious diseases (Intergovernmental Panel on Climate Change, 2007).
Image 1: Dizengoff Square, Tel Aviv-Yafo
Energy and Infrastructure
Ironically, the more energy used to cool off, the hotter it could get. As urban heat increases, more energy for air conditioning is needed to cool buildings (Trust for Public Land. 2016). Today, 90 percent of Tel Avivians have air conditioning (State of Israel, Central Bureau of Statistics. 2017). Further, much of Tel Aviv’s building stock was built with little insulation, contributing to increasing inefficiencies in

Urban Heat, Vulnerability, and the Public Realm: Tel Aviv-Yafo and COVID-19 Recovery 113
energy consumption as AC use increases. The more it is used, the greater the risk of power surges, black and brown outs, and increasing peak energy loads, not only in-creasing emissions, but also putting critical energy infrastructure at risk of systemic disruption (Trilnick, 2012). This energy ensures that businesses can run, data can be stored, and health and transit services can be delivered (Chapman et al. 2013). As air conditioning use intensifies, so too does the amount of waste heat distributed into communities, creating a feedback loop that exacerbates urban heat island: The more you use, the more you need to use. Meanwhile, today’s infrastructure may not be built to withstand the temperature of the coming decades For example, extreme heat influences the material durability of infrastructure, like roadways, railways, and even airline runways that can buckle or warp (Wichter, 2017) . Hotter air is less dense and impacts airplane engines and necessitates longer runways for takeoff (Shepherd, 2017). Extreme heat is not only a safety hazard, it also poses risks for major transportation service disruption that echoes across the social and economic life of Tel Aviv.
Image 2: Mesilat Yesharim Bike Lane, Tel Aviv-Yafo
Heat influences the social life of the city and capacity of neighbors to build com-munity and engage in democratic and civic processes in the public realm (see Image 1 and Image 2). Heat influences the choices made about where we can and want to spend our time, and even changes our mood. When it’s too hot, the basic building blocks of urban life are compromised: Kids can’t play outside and neighbors are less likely to gather. For some, when the choice is going outside or staying indoors, it can
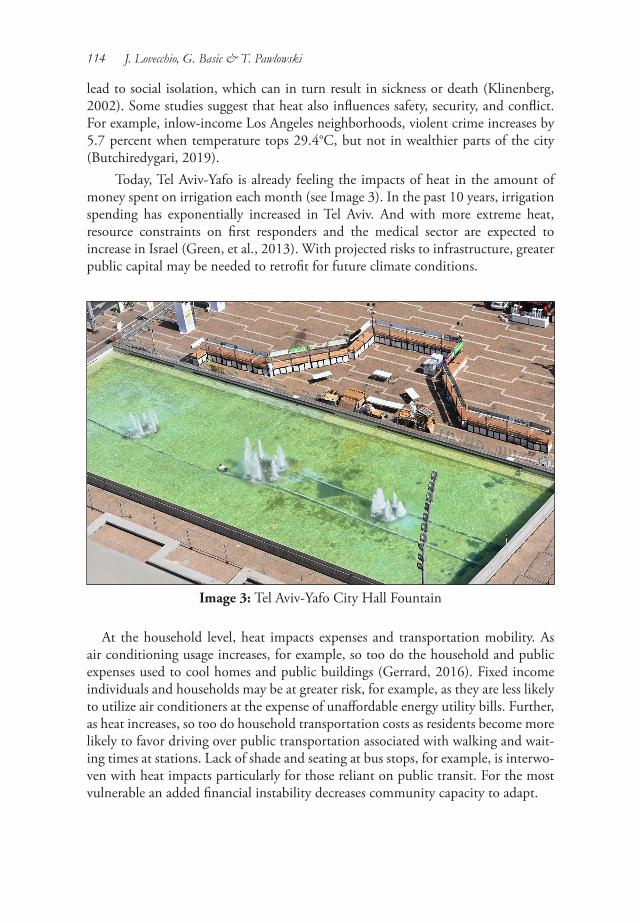
114 J. Lovecchio, G. Basic & T. Pawlowski
lead to social isolation, which can in turn result in sickness or death (Klinenberg, 2002). Some studies suggest that heat also influences safety, security, and conflict. For example, inlow-income Los Angeles neighborhoods, violent crime increases by 5.7 percent when temperature tops 29.4°C, but not in wealthier parts of the city (Butchiredygari, 2019).
Today, Tel Aviv-Yafo is already feeling the impacts of heat in the amount of money spent on irrigation each month (see Image 3). In the past 10 years, irrigation spending has exponentially increased in Tel Aviv. And with more extreme heat, resource constraints on first responders and the medical sector are expected to increase in Israel (Green, et al., 2013). With projected risks to infrastructure, greater public capital may be needed to retrofit for future climate conditions.
Image 3: Tel Aviv-Yafo City Hall Fountain
At the household level, heat impacts expenses and transportation mobility. As air conditioning usage increases, for example, so too do the household and public expenses used to cool homes and public buildings (Gerrard, 2016). Fixed income individuals and households may be at greater risk, for example, as they are less likely to utilize air conditioners at the expense of unaffordable energy utility bills. Further, as heat increases, so too do household transportation costs as residents become more likely to favor driving over public transportation associated with walking and wait-ing times at stations. Lack of shade and seating at bus stops, for example, is interwo-ven with heat impacts particularly for those reliant on public transit. For the most vulnerable an added financial instability decreases community capacity to adapt.

Urban Heat, Vulnerability, and the Public Realm: Tel Aviv-Yafo and COVID-19 Recovery 115
At the macro scale, heat constrains the operations of private firms and the attrac-tiveness of Tel Aviv-Yafo to new workers. Extreme heat causes disruption to busi-ness operations and lost days at school and work. These effects are felt most acutely in people with underlying illnesses and by those in the construction and logistics industries, where delays and disruptions can raise costs, delay development, and decrease worker productivity, safety, and cognitive function (Urban Land Institute, 2019; Gerrard, 2016). In Israel, where tourism is a key factor in future economic growth planning, heat could change consumer habits and tourist activities (Israel Ministry of Foreign Affairs2019).
Ecosystems and Environment
Image 4: Typical Tree Pit, Mesilat Yesharim Street, Tel Aviv-Yafo
Urban heat island effect is driven, in part, by the loss of soil health and vegetation which is especially apparent in more socially marginalized neighborhoods. The loss of vegetation from urban development in turn can further compound risk of

116 J. Lovecchio, G. Basic & T. Pawlowski
increasing heat and decreased precipitation. Certain species of flora, for example, may not be drought resistant, and vegetation hardiness zones may ultimately migrate northward as the climate changes (Trust for Public Land. 2016). Therefore, a warming climate may then change the geographic range of habitats and create uncertainty for city planners and landscape architects charged with decision-making around “green infrastructure” investments. The migration of species may outpace the standards and practices of landscape designers and planners pursuing green infrastructure investments (Cho et al., 2017).
Further, heat, air quality, and water are wholly interdependent as capacities to conserve water become constrained as heat increases. While rainfall is expected to decrease in Tel Aviv-Yafo overall in the coming decades, extreme precipitation events are becoming more frequent and damaging because of inadequate drainage and flood management (Peleg, Shpigel, 2020). These impacts are disproportionately acute in southern neighborhoods. Further, surface temperatures, in turn, impact the temperature of storm-water run-off that drains into local waterways. For example, pavements that are 37.7°C or higher can elevate rainwater temperature from 21°C to 35°C, complicating landscape management and impacting local aquatic life (Low Carbon Living, CRC. 2017). Intact and connected soil systems are critical to the health of trees and vegetation (see Image 4).
HEAT VULNERABILITY METHODOLOGY ASSESSMENT
The urban form of Tel Aviv-Yafo may—out of necessity—change with the cli-mate. People and buildings may turn inward away from the public realm, perhaps with a proliferation of air-conditioned towers, or pockets of cool oases and private gardens reserved for the most privileged. As people turn inward, staying in their cars and apartments, the public realm is at risk of erosion and of enforcing isolation and even conflict between individuals and communities.
Defining Heat Vulnerability
To better understand these relationships we, at the CRCL, began with a city-wide mapping study that spatialized heat vulnerability. This analysis assumes that vulner-ability is defined by the combination of exposure and sensitivity indicators. The Accelerator looked across similar indices developed for other cities, and synthesized some of the key factors associated with heat vulnerability in Tel Aviv. By deriving Land Surface Temperature (LST) and the Normalized Difference Built-Up Index (NDBI) from the Landsat 8 imagery, and using the Tel Aviv-Yafo census data to measure social sensitivity, we identified the most vulnerable neighborhoods. This process, also known as the “multi-criteria decision analysis”, is intended to help prioritize where planning efforts might be directed.
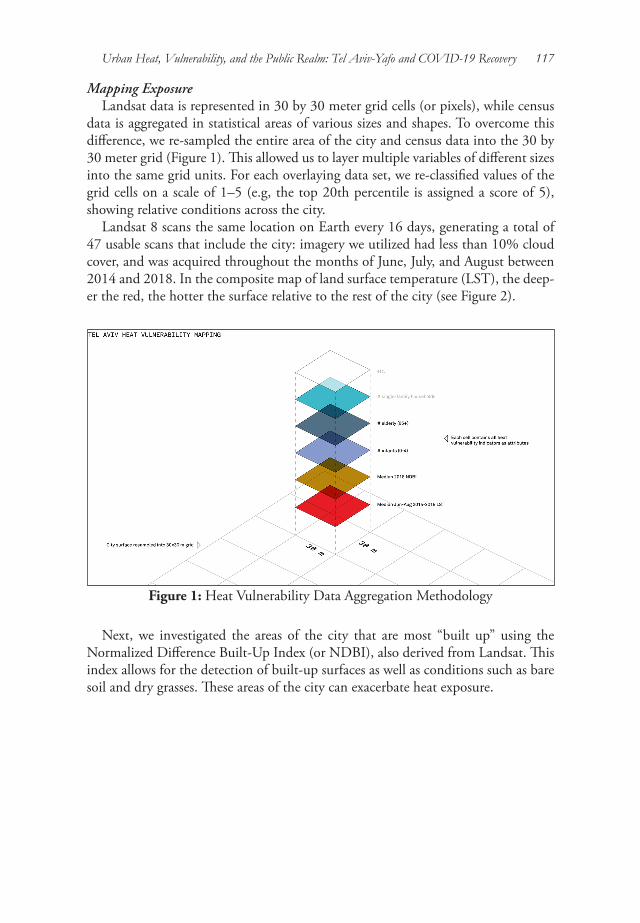
Urban Heat, Vulnerability, and the Public Realm: Tel Aviv-Yafo and COVID-19 Recovery 117
Mapping Exposure Landsat data is represented in 30 by 30 meter grid cells (or pixels), while census
data is aggregated in statistical areas of various sizes and shapes. To overcome this difference, we re-sampled the entire area of the city and census data into the 30 by 30 meter grid (Figure 1). This allowed us to layer multiple variables of different sizes into the same grid units. For each overlaying data set, we re-classified values of the grid cells on a scale of 1–5 (e.g, the top 20th percentile is assigned a score of 5), showing relative conditions across the city.
Landsat 8 scans the same location on Earth every 16 days, generating a total of 47 usable scans that include the city: imagery we utilized had less than 10% cloud cover, and was acquired throughout the months of June, July, and August between 2014 and 2018. In the composite map of land surface temperature (LST), the deep-er the red, the hotter the surface relative to the rest of the city (see Figure 2).
Figure 1: Heat Vulnerability Data Aggregation Methodology
Next, we investigated the areas of the city that are most “built up” using the Normalized Difference Built-Up Index (or NDBI), also derived from Landsat. This index allows for the detection of built-up surfaces as well as conditions such as bare soil and dry grasses. These areas of the city can exacerbate heat exposure.

118 J. Lovecchio, G. Basic & T. Pawlowski
Figure 2: Heat Vulnerability Assessment Outputs
Mapping Sensitivity
With the goal of prioritizing vulnerable neighborhoods, we studied demographic indicators that suggest sensitivity to heat. These factors indicate communities and populations less able to adapt or more vulnerable to the acute impacts of any type of stress or hazard, such as poor health or financial outcomes (Figure 2).
While there are many factors that contribute to sensitivity, this composite map shows where the elderly living alone, very young, low income, single-parent house-holds, unemployed, large households of seven or more, and low education overlap. The deeper the pink, the greater is the assumed sensitivity.
As a last step, we compiled all of the exposure and sensitivity maps. By stacking them, areas of the city facing the most acute impacts from heat stress become visu-ally apparent. Together, these maps suggest that areas in the south of Tel Aviv-Yafo are where exposure to heat disproportionately impacts certain communities.
Today, as we learn more about COVID-19 impacts, it is important to note that some of these factors intersect with those that contribute to COVID-19 mortality such as, the elderly, lower income, and large households (Figure 2) (Mayo Clinic, 2020). Taken together, they suggest a relative difference between the north and south of Tel Aviv: The deeper the pink, the greater the relative vulnerability.
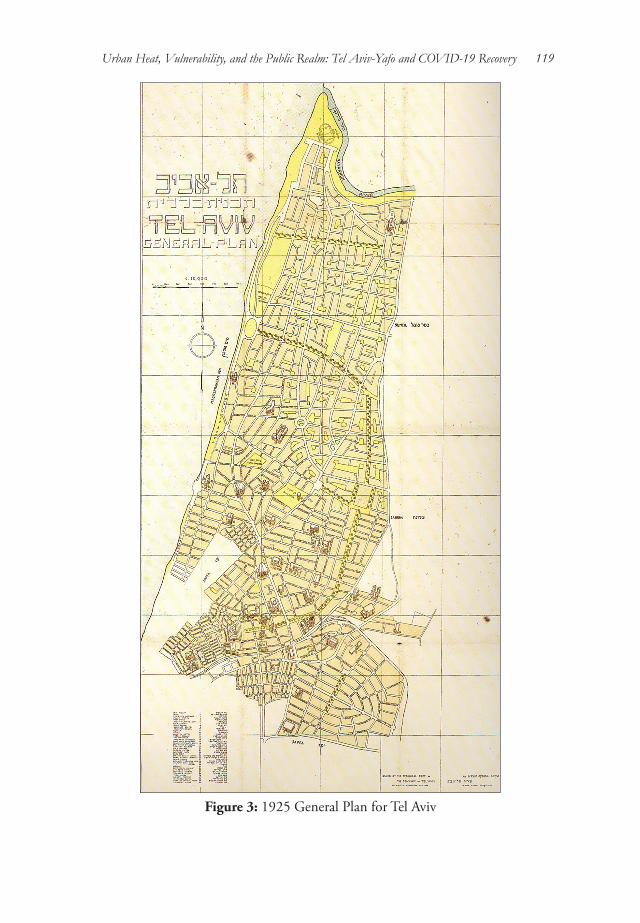
Urban Heat, Vulnerability, and the Public Realm: Tel Aviv-Yafo and COVID-19 Recovery 119
Figure 3: 1925 General Plan for Tel Aviv
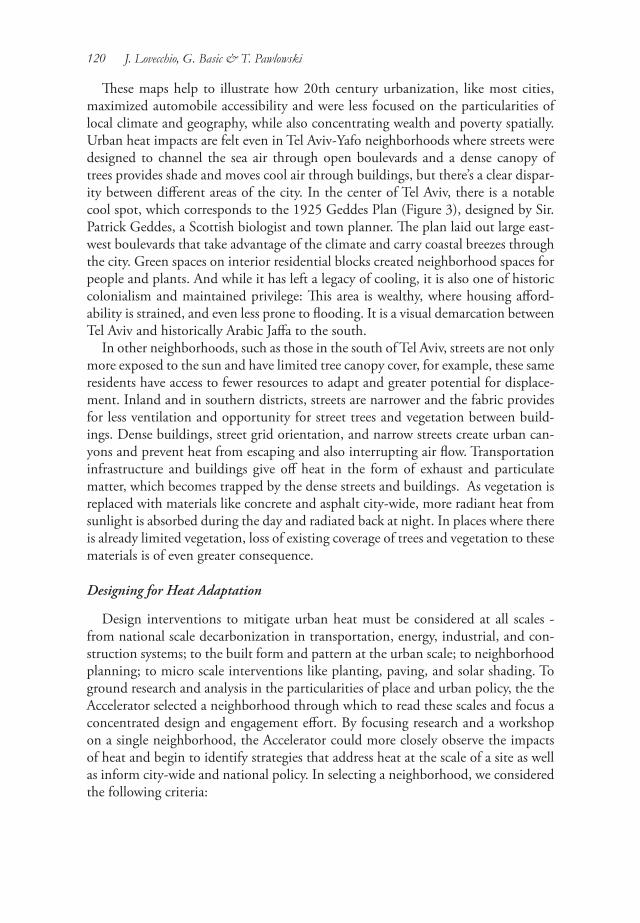
120 J. Lovecchio, G. Basic & T. Pawlowski
These maps help to illustrate how 20th century urbanization, like most cities, maximized automobile accessibility and were less focused on the particularities of local climate and geography, while also concentrating wealth and poverty spatially. Urban heat impacts are felt even in Tel Aviv-Yafo neighborhoods where streets were designed to channel the sea air through open boulevards and a dense canopy of trees provides shade and moves cool air through buildings, but there’s a clear dispar-ity between different areas of the city. In the center of Tel Aviv, there is a notable cool spot, which corresponds to the 1925 Geddes Plan (Figure 3), designed by Sir. Patrick Geddes, a Scottish biologist and town planner. The plan laid out large east-west boulevards that take advantage of the climate and carry coastal breezes through the city. Green spaces on interior residential blocks created neighborhood spaces for people and plants. And while it has left a legacy of cooling, it is also one of historic colonialism and maintained privilege: This area is wealthy, where housing afford-ability is strained, and even less prone to flooding. It is a visual demarcation between Tel Aviv and historically Arabic Jaffa to the south.
In other neighborhoods, such as those in the south of Tel Aviv, streets are not only more exposed to the sun and have limited tree canopy cover, for example, these same residents have access to fewer resources to adapt and greater potential for displace-ment. Inland and in southern districts, streets are narrower and the fabric provides for less ventilation and opportunity for street trees and vegetation between build-ings. Dense buildings, street grid orientation, and narrow streets create urban can-yons and prevent heat from escaping and also interrupting air flow. Transportation infrastructure and buildings give off heat in the form of exhaust and particulate matter, which becomes trapped by the dense streets and buildings. As vegetation is replaced with materials like concrete and asphalt city-wide, more radiant heat from sunlight is absorbed during the day and radiated back at night. In places where there is already limited vegetation, loss of existing coverage of trees and vegetation to these materials is of even greater consequence.
Designing for Heat Adaptation
Design interventions to mitigate urban heat must be considered at all scales - from national scale decarbonization in transportation, energy, industrial, and con-struction systems; to the built form and pattern at the urban scale; to neighborhood planning; to micro scale interventions like planting, paving, and solar shading. To ground research and analysis in the particularities of place and urban policy, the the Accelerator selected a neighborhood through which to read these scales and focus a concentrated design and engagement effort. By focusing research and a workshop on a single neighborhood, the Accelerator could more closely observe the impacts of heat and begin to identify strategies that address heat at the scale of a site as well as inform city-wide and national policy. In selecting a neighborhood, we considered the following criteria:

Urban Heat, Vulnerability, and the Public Realm: Tel Aviv-Yafo and COVID-19 Recovery 121
• Relatively high heat vulnerability geographically • Priority neighborhood and community as defined by the Resilient Tel
Aviv-Yafo Strategy process • Overlaps with other planning efforts, projects, and programs such as the
Sustainable Neighborhoods Program• Presence of a range of public space typologies • Presence of other chronic stresses not illustrated in sensitivity mapping
(e.g., mobility, gentrification)• Proximity to future investment and development areas
For these reasons, we selected Shapira neighborhood, located in southern Tel Aviv-Yafo. Originally an orange grove in former Palestine, the neighborhood is dot-ted with abandoned well houses that were once central to the social, political, and economic life of Arab communities. Dense sabres plants denote a historic legacy of intra-neighborhood boundaries embedded in the landscape. Then, in the 1920’s, the area was developed by America contractor Meir Getzle Shapira, erasing this preexistent community fabric. And because the neighborhood was neither legally a part of Jaffa nor Tel Aviv-Yafo at the time, Getzle Shapira took advantage of free-dom from taxes and the lax construction standards to build factories and homes, the legacy of which remains the defining feature of the built fabric today (Sela, 2009).
Geographically defined by Kibbutz Galuyot Road to the south, Salame Road to the north, the Ayalon Highway to the east, and Sderot Har Tsiyon to the west, the neighborhood is largely residential with low- to mid-rise buildings, a mix of community facilities, and a north-south commercial corridor on Mesilat Yesharim, which is considered a gateway to Shapira. To the north-east, the Tel Aviv Central Bus Station, which in 1967 destroyed the menorah-shaped street grid of bordering Neve Sha’anan, is a gateway for migrant workers, refugees, and asylum seekers ar-riving in Tel Aviv. Many settle in Shapira and neighbouring areas, often with many people to a single apartment and marginalized from the formal economy and politi-cal processes. In many ways, Shapira registers the consequences of global displace-ment due to conflict, economic and political oppression, and climate change, as well as local patterns of urbanization that enforce marginalization based on class and race. It registers how local urban context facilitates the visibility of the privileged and the invisibility of the marginalized. Those already most at risk continue to carry disproportionate burden and risk not only of climate change impacts, but also the consequences of localized displacements driven by housing policy and gentrifica-tion.
Over the last decade, Shapira has battled a perception of blight and disinvest-ment all while housing costs increase driven by population expansion. Efforts to invest in services, housing, and community assets have begun to accelerate both by the City and by private interests. Further, plans to implement a light rail line at the northern edge of the neighborhood could dramatically change the area. With those investments though, come risks to the built and social fabric of the existing
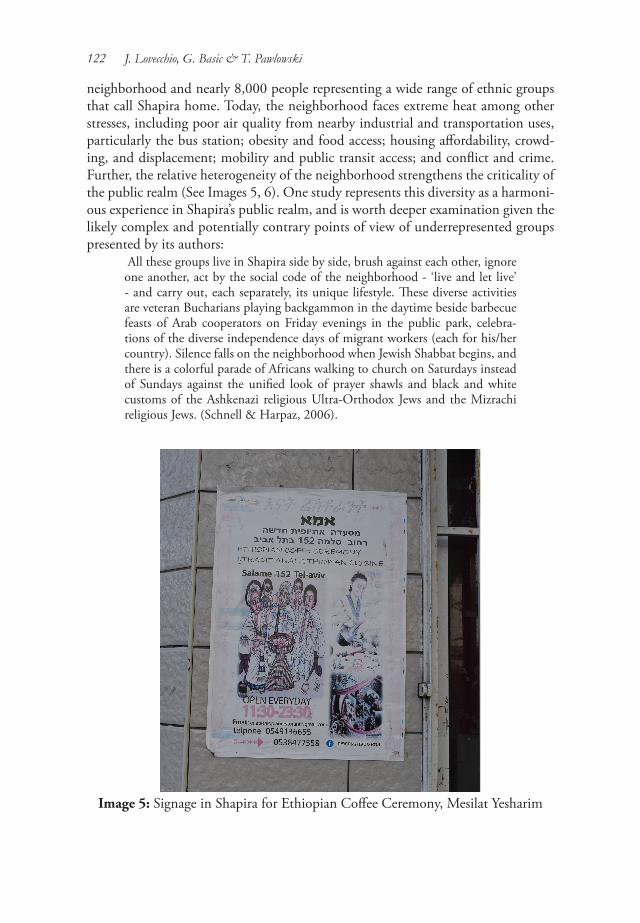
122 J. Lovecchio, G. Basic & T. Pawlowski
neighborhood and nearly 8,000 people representing a wide range of ethnic groups that call Shapira home. Today, the neighborhood faces extreme heat among other stresses, including poor air quality from nearby industrial and transportation uses, particularly the bus station; obesity and food access; housing affordability, crowd-ing, and displacement; mobility and public transit access; and conflict and crime. Further, the relative heterogeneity of the neighborhood strengthens the criticality of the public realm (See Images 5, 6). One study represents this diversity as a harmoni-ous experience in Shapira’s public realm, and is worth deeper examination given the likely complex and potentially contrary points of view of underrepresented groups presented by its authors:
All these groups live in Shapira side by side, brush against each other, ignore one another, act by the social code of the neighborhood - ‘live and let live’ - and carry out, each separately, its unique lifestyle. These diverse activities are veteran Bucharians playing backgammon in the daytime beside barbecue feasts of Arab cooperators on Friday evenings in the public park, celebra-tions of the diverse independence days of migrant workers (each for his/her country). Silence falls on the neighborhood when Jewish Shabbat begins, and there is a colorful parade of Africans walking to church on Saturdays instead of Sundays against the unified look of prayer shawls and black and white customs of the Ashkenazi religious Ultra-Orthodox Jews and the Mizrachi religious Jews. (Schnell & Harpaz, 2006).
Image 5: Signage in Shapira for Ethiopian Coffee Ceremony, Mesilat Yesharim
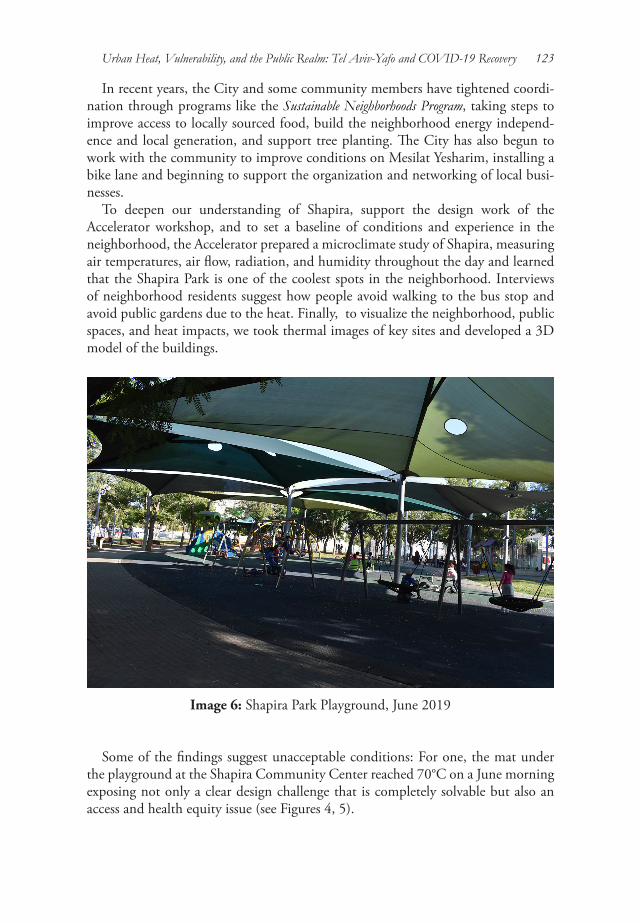
Urban Heat, Vulnerability, and the Public Realm: Tel Aviv-Yafo and COVID-19 Recovery 123
In recent years, the City and some community members have tightened coordi-nation through programs like the Sustainable Neighborhoods Program, taking steps to improve access to locally sourced food, build the neighborhood energy independ-ence and local generation, and support tree planting. The City has also begun to work with the community to improve conditions on Mesilat Yesharim, installing a bike lane and beginning to support the organization and networking of local busi-nesses.
To deepen our understanding of Shapira, support the design work of the Accelerator workshop, and to set a baseline of conditions and experience in the neighborhood, the Accelerator prepared a microclimate study of Shapira, measuring air temperatures, air flow, radiation, and humidity throughout the day and learned that the Shapira Park is one of the coolest spots in the neighborhood. Interviews of neighborhood residents suggest how people avoid walking to the bus stop and avoid public gardens due to the heat. Finally, to visualize the neighborhood, public spaces, and heat impacts, we took thermal images of key sites and developed a 3D model of the buildings.
Image 6: Shapira Park Playground, June 2019
Some of the findings suggest unacceptable conditions: For one, the mat under the playground at the Shapira Community Center reached 70°C on a June morning exposing not only a clear design challenge that is completely solvable but also an access and health equity issue (see Figures 4, 5).

124 J. Lovecchio, G. Basic & T. Pawlowski
Supported by vulnerability and microclimate and urban design research, the Resilience Accelerator convened community leaders, designers, academics, facilita-tors, NGO’s, over a 2.5 day intensive workshop at the Shapira Community Center (see Images 7, 8). Participants designed pilot project concepts and considered their implications for city-wide policy. Residents participated in feedback sessions and mapping exercises that served as a starting place for community-based co-creation of design (see Images 9, 10). Project teams were asked to design with criteria in mind that built off of research and the needs of the City and community communicated by the Municipality and neighborhood partners. The principles aimed to ensure that quality of life is improved for the diverse communities that live and work in Shapira, that the neighborhood serves as a focal point for climate adaptation and mitigation, and that the fabric of the built and social environment maintains integ-rity in light of new infrastructure and housing development plans:
Figure 4: Shapira Neighborhood Insights Visualization

Urban Heat, Vulnerability, and the Public Realm: Tel Aviv-Yafo and COVID-19 Recovery 125
Design Criteria and Considerations
• Microclimate dynamics and influencers, such as: Natural ventilation, air flow; urban geometry and built form; sources and sinks of waste heat; Materials and their albedo and emissivity; sources of shade; vegetative cover and transpiration; and, time of day and seasonality
• The future of Tel Aviv-Yafo as more populous, warmer, and drier • Animation of critical social infrastructure in the public realm, and
encourages intergenerational and cross community gathering and conflict resolution (such as through opportunities for play, art, business operations, mobility)
• Prioritization of the most vulnerable to heat impacts at the forefront, such as seniors most at risk from isolation and health impacts
• Opportunity for partnerships across sectors, agencies and organizations through programming, operations, and maintenance
• Scaling potential across built or social systems city-wide• Culturally specific to the diverse character of Shapira and integrated
within the neighborhood-built fabric and current municipal planning and project implementation efforts
Figure 5: Shapira Community Center Playground, June 2019
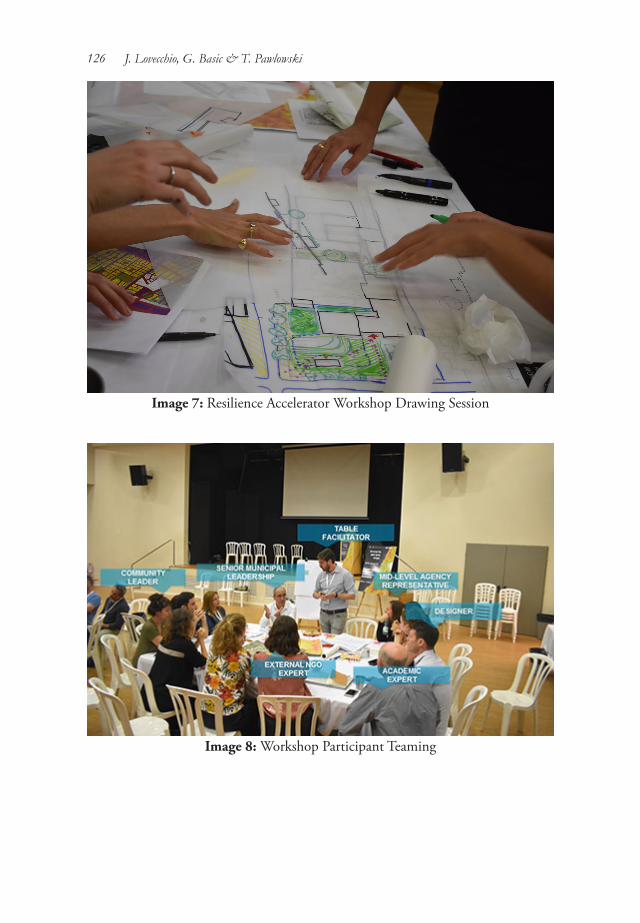
126 J. Lovecchio, G. Basic & T. Pawlowski
Image 7: Resilience Accelerator Workshop Drawing Session
Image 8: Workshop Participant Teaming
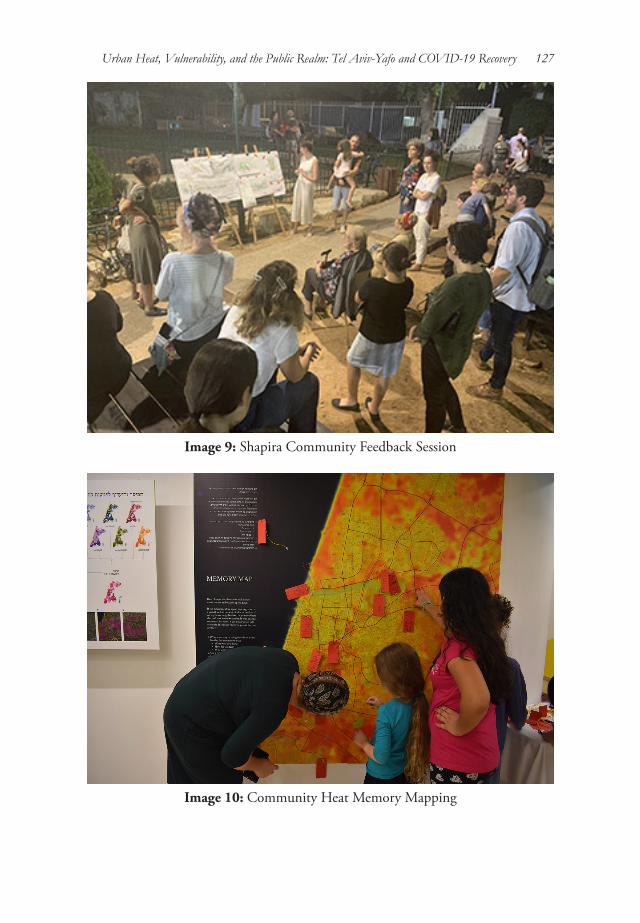
Urban Heat, Vulnerability, and the Public Realm: Tel Aviv-Yafo and COVID-19 Recovery 127
Image 9: Shapira Community Feedback Session
Image 10: Community Heat Memory Mapping

128 J. Lovecchio, G. Basic & T. Pawlowski
Pilot project concepts were developed for three sites:One at the Community Center and two on Mesilat Yesharim, the neighborhood’s commercial corridor.
Image 11: Community Center Concept Plan
Mesilat Yesharim Street: The north-south commercial corridor of Shapira is char-acterized by limited storefront activity, a bike lane that inhibits pedestrian access, highly exposed to heat and solar radiation, unused street furniture, and walled off community assets and public spaces (e.g., synagogue). Recently, the City has in-vested in a placemaking effort for the street to improve conditions, such as through lighting and public art as well as remove the bike lane. Another team looked at a section of Mesilat Yesharim, using the east-west breezes and continuous tree plant-ings to create moments for rest. The concept seeks to engage local artists and the community to design the programming (see Image 11). Another group looked at pedestrianization of another section of Mesilat Yesharim, creating a cooling entrance to the neighborhood. The concept also activates the backyard spaces behind build-ings to create multiple layers of cooling and connectivity (see Images 12, 13).
Shapira Community Center: This is a vital heart of the neighborhood, and actively programmed and used by families. The community center is adjacent to planned renewal and redevelopment sites on Yisra’el mi-Salant Street. The site can become dangerously hot: At 10:00 a.m. on a June morning, the rubber mat of the play-ground registered 70°C when gauged with a radiometer, hot enough to inflict burns on a child’s bare feet. At the Community Center, project teams explored cooling
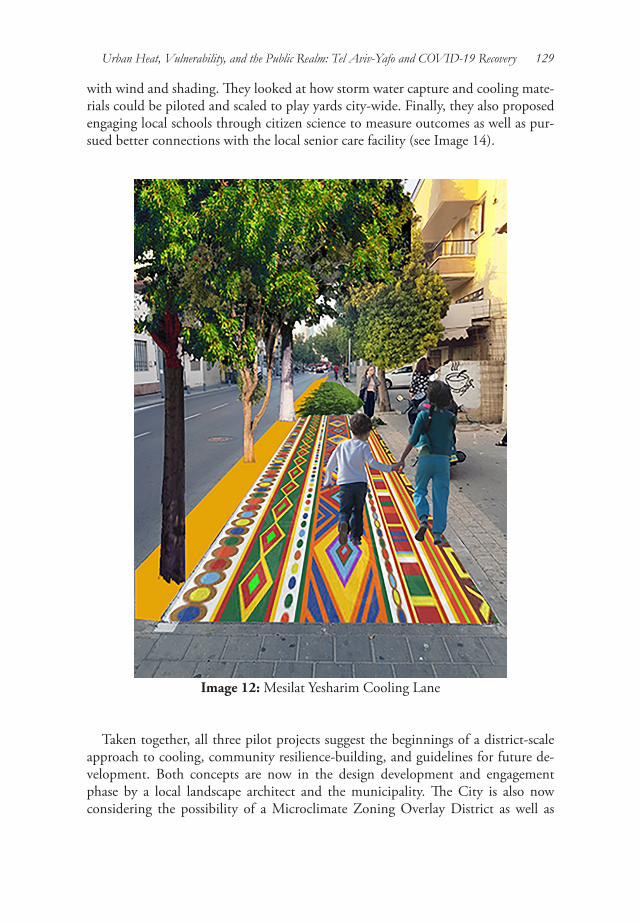
Urban Heat, Vulnerability, and the Public Realm: Tel Aviv-Yafo and COVID-19 Recovery 129
with wind and shading. They looked at how storm water capture and cooling mate-rials could be piloted and scaled to play yards city-wide. Finally, they also proposed engaging local schools through citizen science to measure outcomes as well as pur-sued better connections with the local senior care facility (see Image 14).
Image 12: Mesilat Yesharim Cooling Lane
Taken together, all three pilot projects suggest the beginnings of a district-scale approach to cooling, community resilience-building, and guidelines for future de-velopment. Both concepts are now in the design development and engagement phase by a local landscape architect and the municipality. The City is also now considering the possibility of a Microclimate Zoning Overlay District as well as
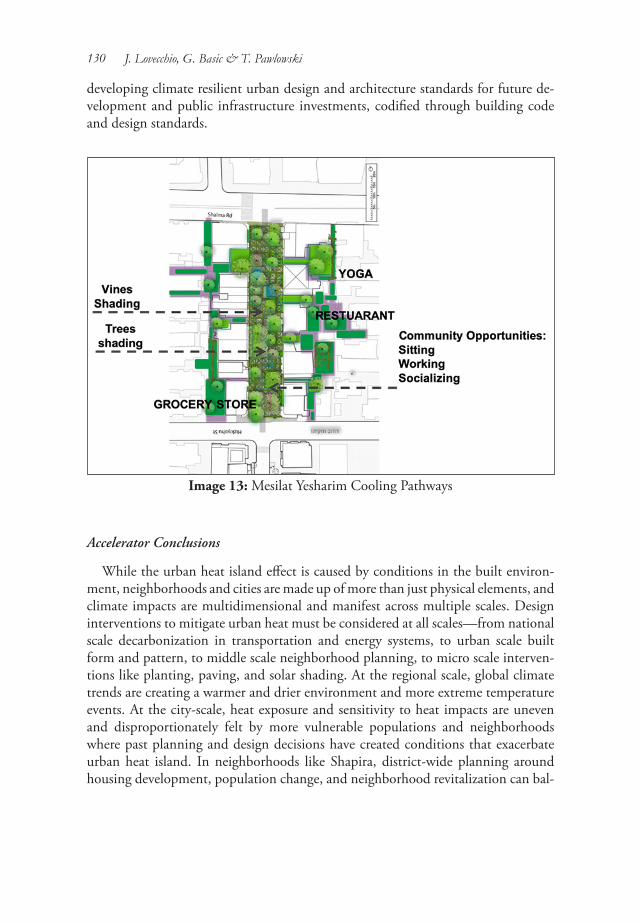
130 J. Lovecchio, G. Basic & T. Pawlowski
developing climate resilient urban design and architecture standards for future de-velopment and public infrastructure investments, codified through building code and design standards.
Image 13: Mesilat Yesharim Cooling Pathways
Accelerator Conclusions
While the urban heat island effect is caused by conditions in the built environ-ment, neighborhoods and cities are made up of more than just physical elements, and climate impacts are multidimensional and manifest across multiple scales. Design interventions to mitigate urban heat must be considered at all scales—from national scale decarbonization in transportation and energy systems, to urban scale built form and pattern, to middle scale neighborhood planning, to micro scale interven-tions like planting, paving, and solar shading. At the regional scale, global climate trends are creating a warmer and drier environment and more extreme temperature events. At the city-scale, heat exposure and sensitivity to heat impacts are uneven and disproportionately felt by more vulnerable populations and neighborhoods where past planning and design decisions have created conditions that exacerbate urban heat island. In neighborhoods like Shapira, district-wide planning around housing development, population change, and neighborhood revitalization can bal-
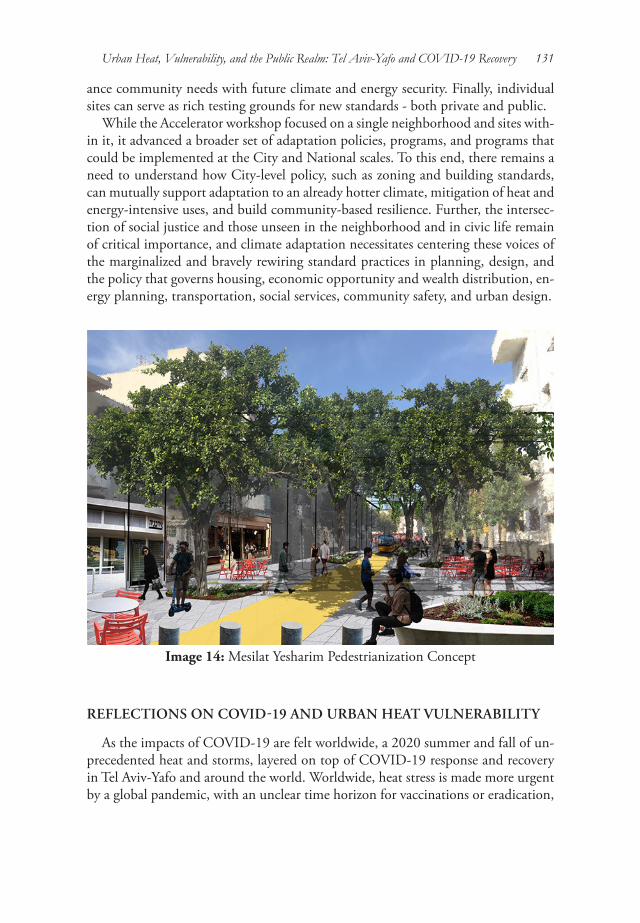
Urban Heat, Vulnerability, and the Public Realm: Tel Aviv-Yafo and COVID-19 Recovery 131
ance community needs with future climate and energy security. Finally, individual sites can serve as rich testing grounds for new standards - both private and public.
While the Accelerator workshop focused on a single neighborhood and sites with-in it, it advanced a broader set of adaptation policies, programs, and programs that could be implemented at the City and National scales. To this end, there remains a need to understand how City-level policy, such as zoning and building standards, can mutually support adaptation to an already hotter climate, mitigation of heat and energy-intensive uses, and build community-based resilience. Further, the intersec-tion of social justice and those unseen in the neighborhood and in civic life remain of critical importance, and climate adaptation necessitates centering these voices of the marginalized and bravely rewiring standard practices in planning, design, and the policy that governs housing, economic opportunity and wealth distribution, en-ergy planning, transportation, social services, community safety, and urban design.
Image 14: Mesilat Yesharim Pedestrianization Concept
REFLECTIONS ON COVID-19 AND URBAN HEAT VULNERABILITY
As the impacts of COVID-19 are felt worldwide, a 2020 summer and fall of un-precedented heat and storms, layered on top of COVID-19 response and recovery in Tel Aviv-Yafo and around the world. Worldwide, heat stress is made more urgent by a global pandemic, with an unclear time horizon for vaccinations or eradication,
132 J. Lovecchio, G. Basic & T. Pawlowski
unstable healthcare systems, and worsening economic crises disproportionately af-fecting the poor and marginalized. The underlying conditions such as diabetes, asthma, and heart disease that make morbidity and mortality from COVID-19 are also those that predispose communities to heat health events. Like Shapira, these communities are consistently those that have historically been exposed to environ-mental conditions that underlie these health outcomes, such as proximity to indus-trial and noxious uses, presence of environmental contamination, lack of access to food, lack of access to public transit, and economic marginalization. These risks are all inextricably linked and are manifest in cities and communities worldwide and at all scales of decision-making.
In the backdrop, researchers and practitioners of urban planning are reckoning with how urbanization has systematically constructed oppression and disenfran-chised, and is further exacerbating social vulnerability and exposure to environmen-tal hazards. We see how these risks combine when we consider how the tools for managing heat stress are inadequate to the current COVID-19 crisis. For example, the moment demands rethinking of traditional methods of cooling centers as a pri-mary tool given social distancing measures, management and design of public open spaces, small business losses in summer tourism, and further reductions in factors that contribute to underlying respiratory stress and health conditions in vulnerable groups. Further, while air conditioning is essential but it may not be available to all and as Eric Klinenberg discusses in Heat Wave: A Social Autopsy of Disaster in Chicago (2002), many older people, often also people of color, may perilously choose to suffer personal discomfort rather than unpayable utility bills. On top of that, air conditioning is a source of waste heat, ultimately accelerating the urban heat island effect.
For many cities, reclaiming streets as cool public spaces has become a focal point for policymakers. But this rethinking of public space has occurred in conjunction with a global movement around social, racial, and economic justice as well as ex-posure of how the prioritization frameworks used to implement street closures, for example, disproportionately benefits white and upper-class neighborhoods (Laris, 2020).
Already, examples of progress around the world are clear from Tel Aviv-Yafo where the Municipality is closing major roadways for pedestrianization to Milan, Washington D.C., and Montreal, where the shut-down and dramatic reduction in vehicular traffic driven by COVID-19 accelerated once-delayed investments in bike lane infrastructure (Kloosterman, 2020; Cobbs, 2020). These, and efforts like them that introduce cooling strategies through street lightening, shade, water that can also reduce car dependency and create socially-distant space for businesses, play, and art in the public realm are critical not only for the response to the pandemic in the sum-mer months, but also are setting important precedent for longer-term and strategic remaking of the public realm in cities.

Urban Heat, Vulnerability, and the Public Realm: Tel Aviv-Yafo and COVID-19 Recovery 133
As we reflect on the Accelerator and Shapira, we offer that planners are at risk of reinforcing the same systemic conditions and power structures that have historically driven vulnerability by repeating top-down processes despite intentions to serve those at risk. So, as the intersections of vulnerability and the assumptions now rea-sonably made around their consistent spatial distribution are increasingly obvious and overlapping, we offer that the placement of these investments and centering of activists in design decisions become nearly as, if not more, important than the actual intervention regardless of the hazard.
ACKNOWLEDGEMENTS
The Resilience Accelerator drew on deep collaboration with the Municipality of Tel Aviv-Yafo, as well as climate researchers at Tel Aviv University’s Porter School of the Environment and Earth Sciences, Tel Aviv University’s Laboratory for Urban Climatology and Bio-Climatology, Columbia University’s Center for Climate Systems Research, and the NASA Goddard Institute for Space Studies who sup-port the downscaled climate projections cited in this paper as well as micro-climate analysis and thermal imagery. The opinions and questions expressed in this paper may not be representative of all of those listed in these acknowledgements. We are also especially grateful to Orli Ronen, Omri Carmon, Oded Potchter, Moshe Mandelmilch, Meridel Phillips, and Christian Braneon for their helpful suggestions.
REFERENCES
Butchiredygari, L. (June 24, 2019) Heat waves precipitate more crime in poor areas, study in L.A. finds. Wall Street Journal. https://www.reddit.com/r/collapse/comments/c4u4am/heat_waves_precipitate_more_crime_in_poor_areas/
Chapman, L., Azevedo, J., Prieto-Lopez, T. (2013) Urban heat and critical infrastructure networks: A viewpoint. Urban Climate, 3: 7–12. https://doi.org/10.1016/j.uclim.2013.04.001
Cobbs, C. (May 15, 2020) How Montreal, Milan, and D.C. have made more space for walk/bike/transit during COVID-19. https://chi.streetsblog.org/2020/05/15/how-montreal-milan-and-d-c-have-made-more-space-for-walk-bike-transit-during-covid/
Cho, R,Morse C., Mitchel, S. Cho, S-R., Baier, G. Ashkin, M. (2017) How Climate Change Affects New York’s Plants and Animals. https://blogs.ei.columbia.edu/2017/01/06/how-climate-change-is-affecting-new-yorks-plants-and-animals/
134 J. Lovecchio, G. Basic & T. Pawlowski
Exkert, N. (September 4, 2019) How high heat can impact mental health. National Public Radio, Morning Edition. https://www.npr.org/2019/09/04/757034136/how-high-heat-can-impact-mental-health
Gerrard, M. (2016) Heat Waves: Legal Adaptation to the Most Lethal Climate Disaster. Columbia University Climate Law. UA Little Rock Law Review, Volume 40:15-544. http://columbiaclimatelaw.com/files/2016/09/6-Gerrard-formatted-embedded.pdf
Green, MS., Groag-Pri Or, N., Capuleto, G., Epstein, Y. and Paz, S. (2013) Climate change and health in Israel: Adaptation policies for extreme weather events. Isr J. Health Policy Res., Jun 27;2(1):23. doi: 10.1186/2045-4015-2-23. https://www.ncbi.nlm.nih.gov/pubmed/23805950#
Intergovernmental Panel on Climate Change (2007) Climate Change 2007 - Impacts, Adaptation and Vulnerability. Working Group 2, Intergovernmental Panel on Climate Change Staff.
Israel Ministry of Foreign Affairs (2019) Economy: Sectors of Israeli Economy. https://mfa.gov.il/mfa/aboutisrael/economy/pages/economy-%20sectors%20of%20the%20economy.aspx
Klein-Rosenthal, J. and Raven, J. ( 2017) Urban Heat and Urban Design – An Opportunity to Transform in NYC. The Sallan Foundation, Snapshot. https://www.sallan.org/Snapshot/2017/07/ urban_heat_and_urban_design_an_opportunity_to_transform_in_nyc.php#.XeVbKEZKiUm
Klinenberg, E. (2002) Heat Wave: A Social Autopsy of Disaster in Chicago. Chicago: University of Chicago Press
Kloosterman, K. (July 17, 2020). Tel Aviv Makes COVID-Friendly Breathing Sidewalks. Green Prophet. https://www.greenprophet.com/2020/07/tel-aviv-makes-covid-friendly-breathing-sidewalks/
Landsberg, H. (1981) The Urban Climate, Volume 28, 1st Edition. Elsevier Academic Press.
Laris, M. (2020) Cities, including D.C, are closing streets to make way for restaurants and pedestrians. https://www.washingtonpost.com/local/trafficandcommuting/cities-are-closing-streets-to-make-way-for-restaurants-and-pedestrians/2020/05/25/1f1af634-9b73-11ea-ad09-8da7ec214672_story.html
Low Carbon Living, CRC (2017) Guide to Urban Cooling Strategies. http://www.lowcarbonlivingcrc.com.au/sites/all/files/publications_file_attachments/rp2024_guide_to_urban_cooling_strategies_2017_web.pdf
Mayo Clinic (2020.) COVID-19: Who’s at higher risk of serious symptoms? https://
Urban Heat, Vulnerability, and the Public Realm: Tel Aviv-Yafo and COVID-19 Recovery 135
www.mayoclinic.org/coronavirus-who-is-at-risk/art-20483301NASA (2015) NEX Global Daily Downscaled Climate Projections 2015. Available
from: https://nex.nasa.gov/nex/projects/1356/.National Oceanic and Atmospheric Administration (2019) July 2019 was the
hottest month on record for the planet. M https://www.noaa.gov/news/july-2019-was-hottest-month-on-record-for-planet
Novikov, I., Kalter-Leibovici, O., Chetrit, A., Stav, N. & Epstein, Y. (2011) Weather conditions and visits to the medical wing of emergency rooms in a metropolitan area during the warm season in Israel: A predictive model. International Journal of Biometeorology 56:121-7. 10.1007/s00484-011-0403-z.
Peleg, B. and Shpigel, N. (April, 2020). Two Die in Flooded Elevator in Tel Aviv as Heavy Storms Hit Israel. Haaretz. https://www.haaretz.com/israel-news/.premium-two-die-in-flooded-elevator-in-tel-aviv-as-heavy-storms-hit-israel-1.8352992
Schnell, I. and Harpaz, M. (2005) A model of a heterogeneous neighborhood. GeoJournal, 64:105-115. DOI: 10.1007/s10708-005-4093-0
Sela, M. (2009) Tel Avi’vs Forgotten Neighborhood. Haaretz. https://www.haaretz.com/1.5055167
Shepherd, M. (June 20, 2017) The science of why it’s too hot for some planes to fly in the southwest US. Forbes. https://www.forbes.com/sites/marshallshepherd/2017/06/20/the-science-of-why-its-too-hot-for-some-planes-to-fly-in-the-southwest-u-s/#2827b12f54ce
State of Israel, Central Bureau of Statistics (2017) Household income and expenditure data from the Household Expenditure Survey, 2017 General Summaries.https://www.cbs.gov.il/he/publications/DocLib/2019/househo lds17_1755/h_print.pdf
Trilnick, I.(July 10, 2012) Israel electric will send brownout alerts by sms, online. Haaretz. https://www.haaretz.com/israel-news/business/cutting-remarks-israel-electric-will-send-brownout-alerts-by-sms-online-1.5265428
Trust for Public Land (2016) The benefits of green infrastructure for heat mitigation and emissions reductions in cities. Climate-Smart Cities ™. https://www.tpl.org/sites/default/files/Benefits%20of%20GI%20for%20heat%20mitigation%20and%20emissions%20reductions%20in%20cities.pdf
Urban Land Institute (2019) Scorched: Extreme Heat and Real Estate. https://americas.uli.org/wp-content/uploads/sites/2/ULI-Documents/Scorched_Final-PDF.pdf
Vinyeta, K., Powys Whyte, K. and Lynn, K. (2015) Climate Change Through an

136 J. Lovecchio, G. Basic & T. Pawlowski
Intersectional Lens: Gendered Vulnerability and Resilience in Indigenous Communities in the United States.” United States Department of Agriculture. https://www.fs.fed.us/pnw/pubs/pnw_gtr923.pdf
Wichter, Z. (June 20, 2017) Too hot to fly? Climate change may take a toll on air travel. NewYork Times. https://www.nytimes.com/2017/06/20/business/flying-climate-change.html
Yosef, Y., Aguilar, E. and Alpert, P. (2019) Changes in extreme temperature and precipitation indices: Using an innovative daily homogenized database in Israel. Int J Climatol., 39:5022–5045. https://doi.org/10.1002/joc.6125

Smart Tourism Cities and Sustainability
Alon Gelbman*
Geography Research Forum • Vol. 40 • 2020: 137-148.
* Department of Tourism and Hotel Management, Kinneret Academic College, Israel. [email protected];[email protected]
Kinneret Academic College
As the tourism sector is suffering the disastrous impact of COVID19, new pros-pects will naturally emerge; this paper explores the potential of technology and IT platforms for the industry, specifically focus is on smart technologies that are changing consumer experiences and generating creative tourism business models. Smart tourism facilitates new ways of managing tourist flows, offering better tour-ist services, new advertising models and new collaborative ventures that build on cloud services and open data to innovate beyond the boundaries of traditional industry. The main aim of this review article is to examine and analyze the char-acteristics of smart tourism cities and the potential place of sustainability as a tool for the effective management of environmental systems and urban society. The subordinate questions are: What mutual ties may exist between the characteristics of smart cities and smart tourism? In addition, what is the place of sustainability in smart tourism cities and how can smart tourism cities use “smartness” technolo-gies for better environmental and social management of tourism in the city? The article makes use of secondary research methodology and is based on an analysis of diverse studies on issues of smart cities, smart tourism, and sustainability in smart tourism cities. What emerges is that the concept and models of smart cities fits well with the idea and framework of smart tourism. They overlap and comple-ment each other. The sustainability factor constitutes a central element in the essence of smart city tourism. Several important challenges can apparently be met through the use of smart technologies and applications for both better management of tourism space through smart city tourism and for monitoring and managing environmental elements. Keywords: urban tourism; innovation; smart cities; smart tourism; sustainable tourism; Covid 19.
INTRODUCTION
Information and communication technologies (ICTs) are important and signifi-cant elements for the changing society of today. The smart tourism agenda is devel-oping in parallel with smart cities. In both cases, emphasis is on smart technologies that change consumer experiences and generate creative business models. Cloud
138 A. Gelbman
computing, big data, mobile apps, location-based services, geo-tag services, bea-con technology, virtual reality, augmented reality, and SNSs (Social Networking Services) are all cutting-edge examples of smart technologies for enhancing tourism experiences and services (Wang et al., 2012). Expanding tourism demand, which might reach 1.8 billion international tourist trips in 2030, in addition to 10 to 12 billion trips in domestic movement (UNWTO, 2017), is generating a considerable ecological impact. There are distinct similarities between tourism trends and the growth of the world’s population with its increasing concentration in urban envi-ronments: by 2050, 66% of the planet’s inhabitants are expected to live in urban areas. Approaches to this urban management challenge emerge largely through the smart city perspective, which sets a clear precedent for smart tourism destinations (STDs) (Perles and Ivars, 2018).
The main objective of the article is to examine and analyze the characteristics of smart tourism cities and the potential place of sustainability in city tourism as a tool for the effective management of environmental and social systems in the city. The subordinate questions are: What mutual ties exist between smart cities and smart tourism? What is the place of sustainability in smart tourism cities and how can smart tourism cities use “smart” technologies for better environmental and social management of tourism in the city? Secondary research methodology is employed and is based on the analysis of existing studies on smart cities, smart tourism and sustainability in smart tourism cities.
The first part of the article relates to the connection between the development of urban tourism with its varied complex challenges, and integration of the idea of smart cities. The article then defines and analyzes issues connected to smart tourism and smart cities, as well as elements connected to sustainability and its potential for ensuring balanced management of tourism activity in the city. The conclusion dis-cusses the ramifications of the findings for planning and developing smart tourism in smart cities. They also address new challenges facing contemporary tourism, such as those caused of late by the COVID 19 pandemic. This research is of significant importance, in light of the many challenges facing tourism cities worldwide. These cities have to cope with major problems resulting from the intensive growth of tourism movement with its potential to disrupt the fine balance between tourism, society and environment in urban areas.
URBAN TOURISM AND SMART CITIES
Urban tourism is distinguishable from other forms of tourism by the many dif-ferent purposes tourists have for visiting the cities other than leisure. These include business, conferences, shopping, and visiting friends and relatives (Edwards et al., 2008). The nature of urban tourism is determined not only by the characteristics of the tourism product, but also by the city’s economy and population size (Shoval,
Smart Tourism Cities and Sustainability 139
2006). The phenomenon of urban tourism has grown in importance since the 1980s. Increase in disposable income, non-work time and consumption preferences have created a demand for new forms of holidays (Hall & Williams, 2008), such as visiting prominent city destinations. City tourists seek distraction from their daily routine in the form of attractions that can offer them entertainment, special experi-ences of local history and culture (Fainstein & Judd, 1999). In a globalizing world, destinations can no longer bank on their traditional visitors or ignore growing com-petitive pressures. As a result, both well-established and emerging tourist destina-tions must manifest innovation in order to increase their attractiveness (Halkier et al., 2014). The competitive tourism market is characterized by high turbulence and rapid changes. To compete effectively, tourism firms must be highly innovative in offering new high-quality products that meet customer demand (Alsos et al., 2014). As a result, tourism policy increasingly focuses on the promotion of innovation (OECD, 2006) and it is within this process that the agenda of smart cities holds a significant place.
The term ‘smart’ today generally denotes technologically-embedded services and products. In many cases, ICTs (Information Communication Technologies) lie at the actual core of the smart city concept (Nam and Pardo, 2011; Su et al., 2011; Boes, et al., 2015). Smart cities are described as urban areas in which a wide range of electronic and digital applications operate in the communities; information technology helps to transform life and work within a region; and ICTs and people work together to enhance innovation, learning, and the production of knowledge (often with university involvement) (Komninos, 2002). Cities can be defined as smart “when investments in human and social capital and traditional (transport) and modern (ICT) communication infrastructure fuel sustainable economic growth and a high quality of life, with a wise management of natural resources, through participatory governance” (Caragliu et al., 2011, 70).
ICTs alone do not determine the success of smart cities. Equally important are innovation, creativity, human capital, and the ability to accentuate the attractive-ness of products and services. Nam and Pardo (2011) emphasize the importance of a knowledgeable workforce, collaborative spaces, innovation, and social capital. A smart city can be perceived as a holistic linked system where people, both visitors and citizens, constitute the most important aspect (Kanter and Litow, 2009). The smart city concept does not stand on its own, and encompasses a variety of indus-tries, including the tourism industry (Guo et al., 2014). Over the two last decades the term ‘smart cities’ has been discussed largely as a potential way to improve the lives of urban inhabitants (Albino et al., 2015). Art and media have been identified as elements of smart regeneration in many cities (Florida, 2005); cities like New York, London, Paris, Amsterdam and Tokyo rank high in smart cities indices (IESE, 2019). The city of Reykjavik (Iceland), which ranked fifth in the IESE index, as highly attractive to IT (information technology) companies, is also emerging as an urban tourism phenomenon.
140 A. Gelbman
SMART TOURISM CITIES
Smart tourism facilitates new ways to manage tourist flows, improves tourist ser-vices, creates new advertising models and new collaborative ventures that build on cloud services and opens data to innovate beyond traditional industry boundaries (Gretzel et al., 2016). Smart tourism also refers to smart destinations (Buhalis and Amaranggana, 2014), which are special variants on smart cities. They are urban or rural areas that apply smart city principles and infrastructure, and harness big data not only from residents but also from tourists in their efforts to support mobility (Hannam, 2019), resource availability and allocation, sustainability, and quality of life/visits. In addition, smart tourism involves smart tourism experiences, which provide tourists with better communication and interactions in cities, allowing them to establish closer relationships not only with residents but also with local businesses, local government, and city attractions. In addition, smart tourism refers to a new smart tourism economy with new resources, players and exchange models and it might support city development and services.
The synthesis between smart cities and smart tourism makes sense given the shared high needs for infrastructure and the high concentration of other resources and users (Gretzel et al., 2016). Many tourism cities offer free Wi-Fi and easily identifiable tourism precincts. The variety of tourism experiences available within relatively small areas further contributes to the viability of smart tourism initiatives in cities. Cities can serve as testbeds for smart tourism efforts before rolling them out on a larger scale. City tourism itself is experiencing unprecedented highs and growth potential (UNWTO, 2012). With shorter and more frequent trips becoming more popular, cities emerge as optimal destinations offering compelling experiences to increasingly sophisticated and demanding travelers seeking to satisfy a wide variety of needs. Support for smart tourism comes from travelers and from the industry, as well as from destination marketing organizations (DMOs) that seek to fulfill important roles of coordination, facilitation and governance within smart tourism ecosystems (Oates, 2016). Actually, it is not farfetched to postulate that smart tour-ism re-empowers the DMOs in terms of structuring and marketing/branding the smart city tourism experience (Gretzel et al., 2016).
Cacho et al.’s (2016) analysis of a unique case study of a mobile tourist guide supporting a smart city initiative in Brazil adds a Latin American perspective and explores the design of a specific mobile app within a larger smart city initiative. It illustrates the business intelligence infrastructure and tourism information system needed not only to provide such a tool but also to take advantage of it in terms of eliciting market intelligence and managing city resources effectively. It also illustrates the interdisciplinary nature of smart city tourism development and research, as it integrates computer science, social sciences, engineering and the planning needed to drive smart city tourism projects forward.
Gretzel et al. (2015) describe three components of smart tourism: smart desti-nation, smart experience and smart business. Smart cities (the smart destination)
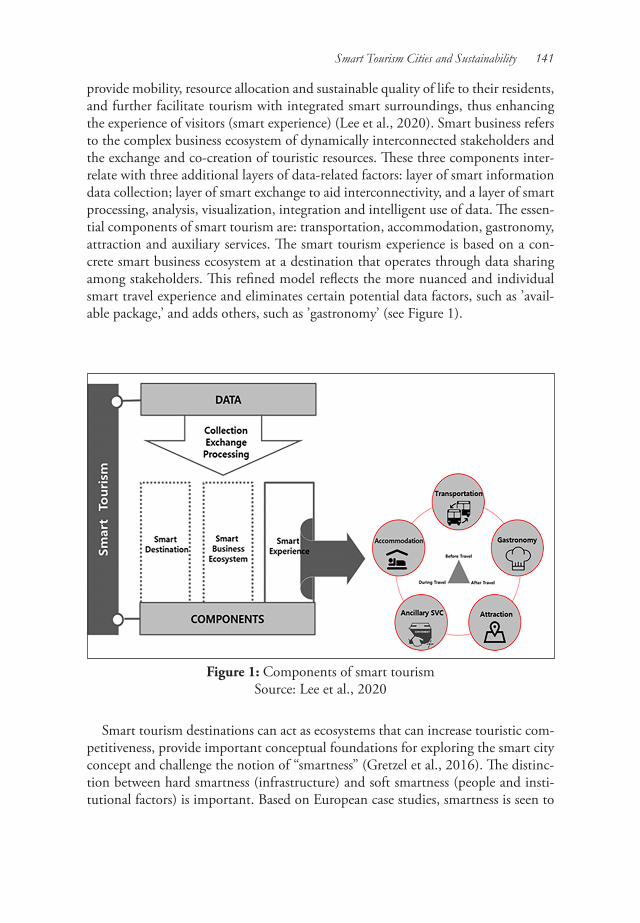
Smart Tourism Cities and Sustainability 141
provide mobility, resource allocation and sustainable quality of life to their residents, and further facilitate tourism with integrated smart surroundings, thus enhancing the experience of visitors (smart experience) (Lee et al., 2020). Smart business refers to the complex business ecosystem of dynamically interconnected stakeholders and the exchange and co-creation of touristic resources. These three components inter-relate with three additional layers of data-related factors: layer of smart information data collection; layer of smart exchange to aid interconnectivity, and a layer of smart processing, analysis, visualization, integration and intelligent use of data. The essen-tial components of smart tourism are: transportation, accommodation, gastronomy, attraction and auxiliary services. The smart tourism experience is based on a con-crete smart business ecosystem at a destination that operates through data sharing among stakeholders. This refined model reflects the more nuanced and individual smart travel experience and eliminates certain potential data factors, such as ’avail-able package,’ and adds others, such as ’gastronomy’ (see Figure 1).
Figure 1: Components of smart tourism Source: Lee et al., 2020
Smart tourism destinations can act as ecosystems that can increase touristic com-petitiveness, provide important conceptual foundations for exploring the smart city concept and challenge the notion of “smartness” (Gretzel et al., 2016). The distinc-tion between hard smartness (infrastructure) and soft smartness (people and insti-tutional factors) is important. Based on European case studies, smartness is seen to
142 A. Gelbman
emerge from innovation that relies on the interplay of people, ICTs and city leader-ship and translates into the delivery of smart services. Smart tourism destinations build on these smart services in order to provide attractions, accessibility, amenities, packages, activities and auxiliary tourism services, paying significant attention to sustainable tourism development.
THE PLACE OF SUSTAINABILITY IN SMART TOURISM CITIES
The idea of smart urban tourism is expressed through information management infrastructure and smart technologies. These assist by providing more effective man-agement of tourism activity in the urban space, optimizing resource utilization. The result can include savings in economic and environmental costs (e.g., lower expenses for energy, transportation and storage and reduced environmental pollution) and reducing the problems of overcrowding in the city (by both locals and tourists).
The sustainability paradigm (Edwards, 2005) has become prevalent since its appearance in the 1980s report of the World Commission on Environment and Development. The report promoted a concept of development designed to meet current social, environmental, and economic needs without compromising the abil-ity of future generations to meet those same needs (Goodland, 1995). The notion of sustainable tourism stems directly from this conceptual framework, delineating four dimensions: environmental, social, cultural and economic. Similarly, tourism can generate benefits for the community, the destinations and the visitors; the in-terdependencies between tourism and the environment should be managed, so the former does not harm the latter, impair future availability or generate unacceptable impacts. Tourism development should respect the size, nature and characteristics of the destination; it should establish a harmonious balance between the needs of the visitor, the place and the resident community; all of the agents involved should respect these principles – the tourism industry, governments and the environmental agencies (Wight, 2002).
While sustainable tourism has been described as tourism that is managed accord-ing to the principles of sustainable development (Butler, 1999), studies mention the concept as an important tool for keeping the balance between tourism development (as an economic sector), society and environment (Liu, 2003).
Tourism growth constitutes a potential cause of environmental damage and socio-cultural problems (Goffi et al., 2019). These are attributable to too many tourists, disturbance of residents’ routine life, and ultimately the desire to exclude tourists (Lee et al., 2020). The combination of budget flights and home-sharing sites has contributed significantly to over-tourism. Budget airlines enable more people to reach tourism destinations and home-sharing sites like Airbnb, provide accom-modations in the midst of local communities so that tourists can experience local life in communities, sometimes at the cost of disrupting that life. Over-tourism may
Smart Tourism Cities and Sustainability 143
have different forms in different cities, but ultimately, the same challenges emerge: alienated local residents, degraded tourist experience, overloaded infrastructure, and damaged nature sites (McKinsey and Company, 2017).
Major tourism cities like Barcelona and Venice are suffering dramatically from the impact of over-tourism on residential life and local infrastructures. The commer-cialization of Airbnb is directly affecting the local real-estate market, raising house prices and consequently increasing cost of living for local residents. The demand for apartments from visitors means local people are pushed out. The Barcelona mu-nicipality, recognizing that the city was facing a severe over-tourism problem, used data aggregates based on cutting-edge technology to develop an apartment rental-detection program, a novel solution designed to fight illegal tourist apartment rent-als. This user-friendly platform provides information to residents and visitors and increases the quality of life for both parties. Lee et al. note that smart tourism cities need to develop inclusive sustainable tourism through accessibility. ICT solutions, such as beacons, which add intelligence to the identification and location of nearby objects, could be developed into inclusive devices in this regard (Lee et al., 2020). Off peak tourism is an additional strategy to disperse tourism loads, utilizing ICT and “smart” technology to expand the tourism year (Ivars-Baidal et al., 2019). The smart city concept incorporates improved sustainability through the greater effi-ciency provided by the use of new technologies and higher volumes of information for management (Giffinger et al., 2007; Komninos, 2015), generally within new governance processes (Caragliu et al., 2011).
The connection between smartness and sustainability are expressed on two com-plementary levels: the destination strategy and the application of technologies for more efficient environmental management. These two levels combine with a new governance framework, create a new approach for managing STD- Smart Tourism Destinations. This is a systemic three-tier approach (see Figure 2): strategic-relation-al, instrumental and applied (Ivars-Baidel et al., 2019). The strategic-relational level depends on robust governance establishing a sustainable territorial-tourism model shared by the local community. This model provides the basis for developing smart solutions adapted to the needs of the destination. These, in turn, are supported by technology and information systems. The STD must adopt sustainable tourism growth or even more radical alternatives, such as evolving towards steady state or de-growth situations.
Several elements of smartness and sustainability benefit from the synergetic ap-proach where, monitoring systems, real-time management, public-private coopera-tion, and open innovation are fused together (Perles-Ribes and Ivars-Baidel, 2018). STD’s are based on innovative technological infrastructure enabling tourists to com-municate and interact with their environment, with diverse stakeholders, through user-friendly platforms in a connected city. A smart tourism city would not only solve urban problems and provide citizens with a better living environment (Wang et al., 2012), but would also enable visitors to explore new destinations and indulge
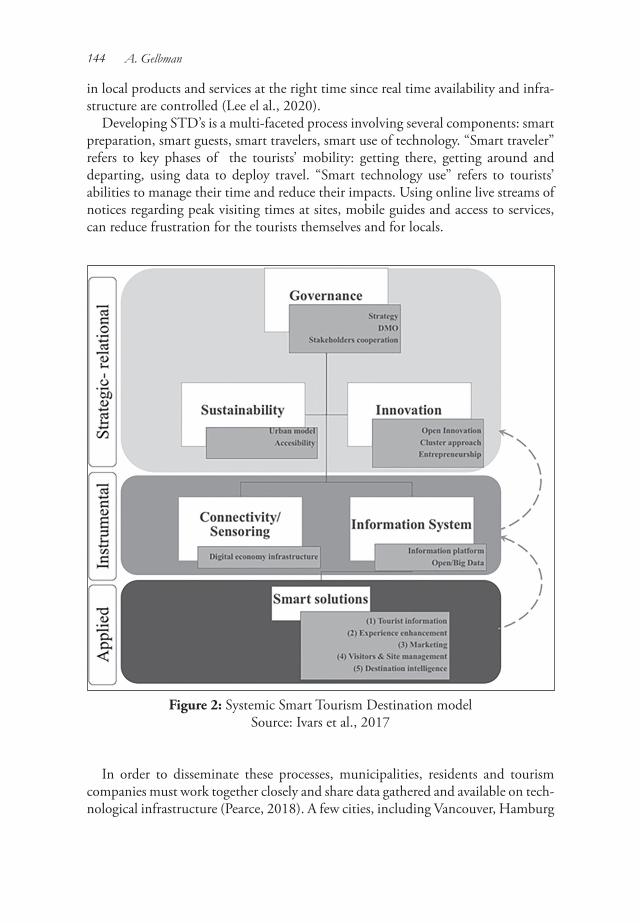
144 A. Gelbman
in local products and services at the right time since real time availability and infra-structure are controlled (Lee el al., 2020).
Developing STD’s is a multi-faceted process involving several components: smart preparation, smart guests, smart travelers, smart use of technology. “Smart traveler” refers to key phases of the tourists’ mobility: getting there, getting around and departing, using data to deploy travel. “Smart technology use” refers to tourists’ abilities to manage their time and reduce their impacts. Using online live streams of notices regarding peak visiting times at sites, mobile guides and access to services, can reduce frustration for the tourists themselves and for locals.
Figure 2: Systemic Smart Tourism Destination model Source: Ivars et al., 2017
In order to disseminate these processes, municipalities, residents and tourism companies must work together closely and share data gathered and available on tech-nological infrastructure (Pearce, 2018). A few cities, including Vancouver, Hamburg
Smart Tourism Cities and Sustainability 145
and Copenhagen, have transformed themselves into STD’s where inclusivity is part of sustainable development. These initiatives have made the cities more accessible to visitors, enhance their inhabitants’ quality of life and are attracting more varied tourists (Lee el al., 2020).
CONCLUSIONS
The concepts and models of smart cities overlap and are mutually complementary with the idea and framework of smart tourism. The sustainability factor constitutes an important element of smart urban tourism. Technology, ICT applications and better monitoring can help to meet a number of important challenges. These in-clude optimal management of the tourism space through smart tourism in order to help prevent over-tourism, and to monitor environmental parameters such as air and water pollution. During the Covid 19 period of 2020, the use of smart urban tourism applications can also serve as an effective tool for managing crowds (as well as maintaining physical social distancing to prevent infection). Sensors can be used to measure body temperature at the entrance to tourism sites. Maximizing the use of smart technologies such as robots at airports and other public places will provide more effective management of visitor movement, reduce crowding and enhance medical and security control.
It is important to note that smart urban tourism is a central component of the tourism experience at these destinations and contributes greatly to the quality of service and the experience. Smart urban tourism, can also control overcrowding and urban stress. These are of special significance for the younger Y and Z generations, born into a digital environment and for whom this is a part of their life style. They expect smartness, they prefer travel tech and are more aware of the environment. Sustainable management of services and experience are becoming accepted stand-ards.
One can argue that smart urban tourism is transforming from a futuristic vision to a real and abiding need. This includes sustainable tourism management, which encourages a balance between the use of environmental and social resources, and the movement of tourist visitors in a city. In this way, online digital experiences in contemporary urban tourism can provide responses to the problems of tourism overcrowding in the 21st century.
REFERENCES
Albino, V., Berardi, U., & Dangelico, R. M. (2015) Smart cities: Definitions, dimensions, performance, and initiatives. Journal of urban technology, 22(1), 3-21.
146 A. Gelbman
Alsos, G. A., Eide, D., & Madsen, E. L. (Eds.) (2014) Handbook of Research on Innovation in Tourism Industries. Cheltenham & Northampton: Edward Elgar Publishing.
Boes, K., Buhalis, D., & Inversini, A. (2015) Conceptualising smart tourism destination dimensions. In: Information and Communication Technologies in Tourism, Proceedings of the International Conference in Lugano, Switzerland, February 3 - 6, 2015, Heidelberg: Springer, 391-403.
Buhalis, D., & Amaranggana, A. (2014) Smart tourism destinations. In: Xiang, Z. & Tussyadiah, I. (Eds.) Information and Communication Technologies in Tourism,. Heidelberg: Springer, 553-564.
Cacho, A., Mendes-Filho, L., Estaregue, D., Moura, B., Cacho, N., Lopes, F., & Alves, C. (2016). Mobile tourist guide supporting a smart city initiative: a Brazilian case study. International Journal of Tourism Cities, 2(2), 164-183.
Caragliu, A., Del Bo, C., & Nijkamp, P. (2011) Smart cities in Europe. Journal of Urban
Technology, 18(2), 65–82.Edwards, A. R. (2005) The Sustainability Revolution: Portrait of a Paradigm Shift. Gabriola
Island: New Society Publishers.Edwards, D., Griffin, T., & Hayllar, B. (2008) Urban tourism research: Developing
an agenda. Annals of Tourism Research, 35(4), 1032-1052. Fainstein, S. S., & Judd, D. R. (1999) Global Forces, Local Strategies, and Urban Tourism:
The Tourist City. New Haven: Yale University Press. Florida, R. (2005) Cities and the Creative Class. London: Routledge. Giffinger, R., Fertner, C., Kramar, H., Kalasek, R., Pichler-Milanovic, N., and
Meijers, E.(2007) Smart cities: Ranking of European medium-sized cities, Centre of Regional Science
(SRF)Vienna University of Technology https://doi.org/10.1016/ S0264-2751(98)00050-X.
Goffi, G., Cucculelli, M., & Masiero, L. (2019) Fostering tourism destination competitiveness in developing countries: The role of sustainability. Journal of cleaner production, 209, 101-115.
Goodland, R. (1995). The concept of environmental sustainability. Annual Review of Ecology and Systematics, 26, 1-24.
Gretzel, U., Sigala, M., Xiang, Z., & Koo, C. (2015) Smart tourism: Foundations and developments. Electronic Markets, 25(3), 179-188.
Gretzel, U., Zhong, L., & Koo, C. (2016) Application of smart tourism to cities. International Journal of Tourism Cities Vol. 2 No. 2.
Smart Tourism Cities and Sustainability 147
Guo, Y., Liu, H., & Chai, Y. (2014) The embedding convergence of smart cities and tourism
internet of things in China: An advance perspective. Advances in Hospitality and Tourism Research, 2(1), 54–69.
Halkier, H., Kozak, M., & Svensson, B. (2014) Innovation and tourism destination development. European Planning Studies, 22(8), 1547-1550,
doi:10.1080/09654313.2013.784571Hall, M. C., & Williams, A. M. (2008) Tourism and Innovation. London: Routledge.Hannam, K. (2019) Smart cities, smart tourism, and smart mobilities. In: Timothy,
D.J. (Ed.), Handbook of Globalisation and Tourism. Edward Elgar Publishing. IESE (2019) The top 50 smart cities in the world 2019 https://citi.io/2019/06/27/the-top-50-smart-cities-in-the-world-2019/.Ivars-Baidal, J. A., Hernández, M. G., & de Miguel, S. M. (2019) Integrating
overtourism in the smart tourism cities agenda. E-review of Tourism Research, 17(2).
Kanter, R. M., & Litow, S. S. (2009) Informed and interconnected: A manifesto for smarter cities (No. 09-141). Retrieved from http://www.hbs.edu/faculty/PublicationFiles/09-141.pdf
Komninos, N. (2008) Intelligent cities. In Electronic Government: Concepts, Methodologies, Tools, and Applications (pp. 4205-4212). IGI Global.
Komninos, N. (2015): The Age of Intelligent Cities: Smart Environments and Innovation-For-All Strategies, 1.ª ed., New York: Routledge, Taylor & Francis Group.
Lee, P., Hunter, W. C., & Chung, N. (2020) Smart tourism city: Developments and transformations. Sustainability, 12(10), 39-58.
Liu, Z. (2003) Sustainable tourism development: A critique. Journal of Sustainable Tourism, 11(6), 459-475. doi: 10.1080/09669580308667216
McKinsey & Company (2017) Report of Coping with Success: Managing Overcrowding in Tourism Destinations. McKinsey & Company: New York.
Nam, T., & Pardo, T. A. (2011) Conceptualizing smart city with dimensions of technology,
people, and institutions. In: Proceedings of the 12th Annual International Digital Government Research Conference on Digital Government Innovation in Challenging Times. New York, NY: ACM, 282–291..
Oates, G. (2016) How the Rise of Smart Cities is Impacting Travel and Tourism. New York: Skift. Accessed online (March 25, 2016) at https://skift.com/2016/02/01/how-the-rise-of-smart-cities-is-impacting-travel-and-tourism/.
148 A. Gelbman
OECD (2006) Innovation and Growth in Tourism. Paris: OECD Publishing.Pearce, P. L. (2018) Limiting overtourism; The desirable new behaviours of the
smart tourist. In: Proceedings of the Tourism Intelligence Forum (t-Forum) Global Exchange Conference, 11-13.
Perles-Ribes, J. F. & Ivars-Baidal, J. (2018) Smart sustainability: A new perspective in the sustainable tourism debate. Journal of Regional Research, (42), 151-170.
Shoval, N. (2006) The geography of hotels in cities: An empirical validation of a forgotten model. Tourism Geographies, 8(1), 56-75. doi: 10.1080/14616680500392499
Su, K., Li, J., & Fu, H. (2011) Smart city and the applications. In international Conference On Electronics, Communications and Control (ICECC), 1028–1031.
UNWTO (2012) Global Report on City Tourism. Madrid: UNWTO. Accessed online (March 25, 2016) at: http://affiliatemembers.unwto.org/publication/global-report-city-tourism.
UNWTO (2017) Tourism Highlights, 2017 Edition, Madrid.Wang, Y., Wong, K. K., & Wang, T. (2012) How do hotels choose their
location? Evidence from hotels in Beijing. International Journal of Hospitality Management, 31, 675-685.
Wight, P. A. (2002) Supporting the principles of sustainable development in tourism and ecotourism: Government’s potential role. Current Issues in Tourism, 5(3-4), 222-244.
Municipal Innovation and Sustainability Readiness: Results from a Study of Mediterranean Cities
Climate change and urbanization will shape the Mediterranean region in the 21st century. It is becoming critical for regional cities to mainstream climate and sustainability goals into their strategies, to ensure sustainable urban development and climate readiness. The Smart City model is often suggested as a pathway to integrating sustainability and innovation within municipal systems to achieve sustainable development goals. This article presents insights from a survey of 34 Mediterranean cities, on the potential for mainstreaming sustainability in cities, mainly through smart sustainability and collaborations with innovation partners such as local SMEs and startups. The study presents the aptitude and readiness of the cities for sustainability and innovation and notes key barriers such as financial constraints and lack of innovative culture within the local government. The study also reveals differences in aptitude between large and small regional cities. Keywords: Mediterranean, Mainstreaming, Sustainability, Climate Change, Smart Cities, Innovation, SMEs
Avigdor Sharon and Orli Ronen*Tel Aviv University
Geography Research Forum • Vol. 40 • 2020: 149-169.
* Urban Innovation & Sustainability Lab, Department of Environmental Studies, Porter School of the Environment and Earth Sciences, Tel Aviv University, Tel Aviv, Israel. [email protected]; [email protected]
INTRODUCTION
Climate change and urbanization are shaping the Mediterranean region in the 21st century. According to the 2015 IPCC report, (IPCC, 2015), the Mediterranean region is one of the world’s hotspots for climate change. Between 1970 and 2010 Fabres, et al., 2012), urbanization around the Mediterranean increased from 54% to 66%. The south and east Mediterranean is actually urbanizing more rapidly than the rest of the world. It is becoming critical for regional cities to mainstream climate and sustainability goals into their strategies, to ensure sustainable urban development and climate readiness. This article presents insights from a survey of 34 Mediterranean cities, on the potential for mainstreaming sustainability in cities, mainly through innovative sustainability and climate initiatives. In the context of
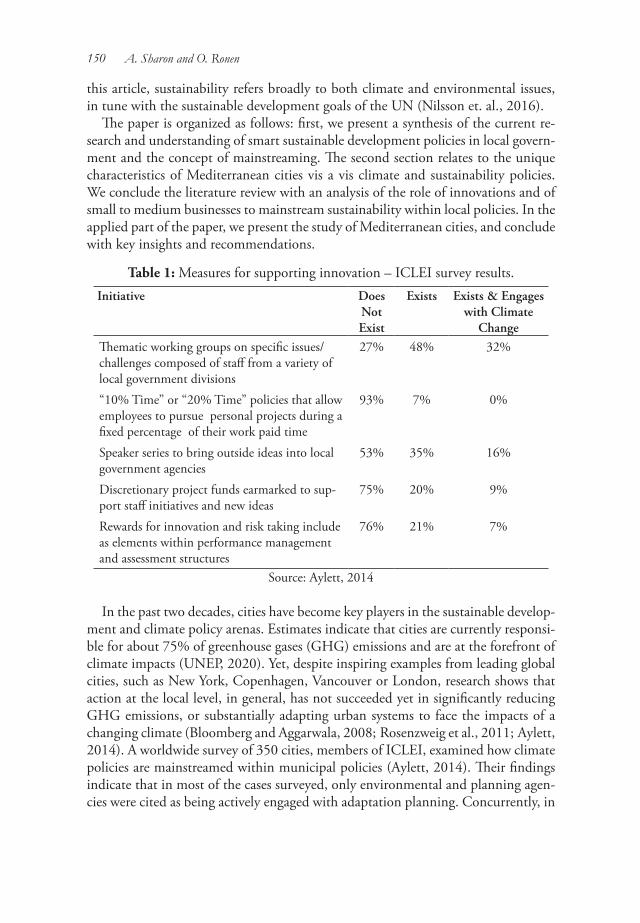
150 A. Sharon and O. Ronen
this article, sustainability refers broadly to both climate and environmental issues, in tune with the sustainable development goals of the UN (Nilsson et. al., 2016).
The paper is organized as follows: first, we present a synthesis of the current re-search and understanding of smart sustainable development policies in local govern-ment and the concept of mainstreaming. The second section relates to the unique characteristics of Mediterranean cities vis a vis climate and sustainability policies. We conclude the literature review with an analysis of the role of innovations and of small to medium businesses to mainstream sustainability within local policies. In the applied part of the paper, we present the study of Mediterranean cities, and conclude with key insights and recommendations.
Table 1: Measures for supporting innovation – ICLEI survey results. Initiative Does
Not Exist
Exists Exists & Engages with Climate
ChangeThematic working groups on specific issues/challenges composed of staff from a variety of local government divisions
27% 48% 32%
“10% Time” or “20% Time” policies that allow employees to pursue personal projects during a fixed percentage of their work paid time
93% 7% 0%
Speaker series to bring outside ideas into local government agencies
53% 35% 16%
Discretionary project funds earmarked to sup-port staff initiatives and new ideas
75% 20% 9%
Rewards for innovation and risk taking include as elements within performance management and assessment structures
76% 21% 7%
Source: Aylett, 2014
In the past two decades, cities have become key players in the sustainable develop-ment and climate policy arenas. Estimates indicate that cities are currently responsi-ble for about 75% of greenhouse gases (GHG) emissions and are at the forefront of climate impacts (UNEP, 2020). Yet, despite inspiring examples from leading global cities, such as New York, Copenhagen, Vancouver or London, research shows that action at the local level, in general, has not succeeded yet in significantly reducing GHG emissions, or substantially adapting urban systems to face the impacts of a changing climate (Bloomberg and Aggarwala, 2008; Rosenzweig et al., 2011; Aylett, 2014). A worldwide survey of 350 cities, members of ICLEI, examined how climate policies are mainstreamed within municipal policies (Aylett, 2014). Their findings indicate that in most of the cases surveyed, only environmental and planning agen-cies were cited as being actively engaged with adaptation planning. Concurrently, in
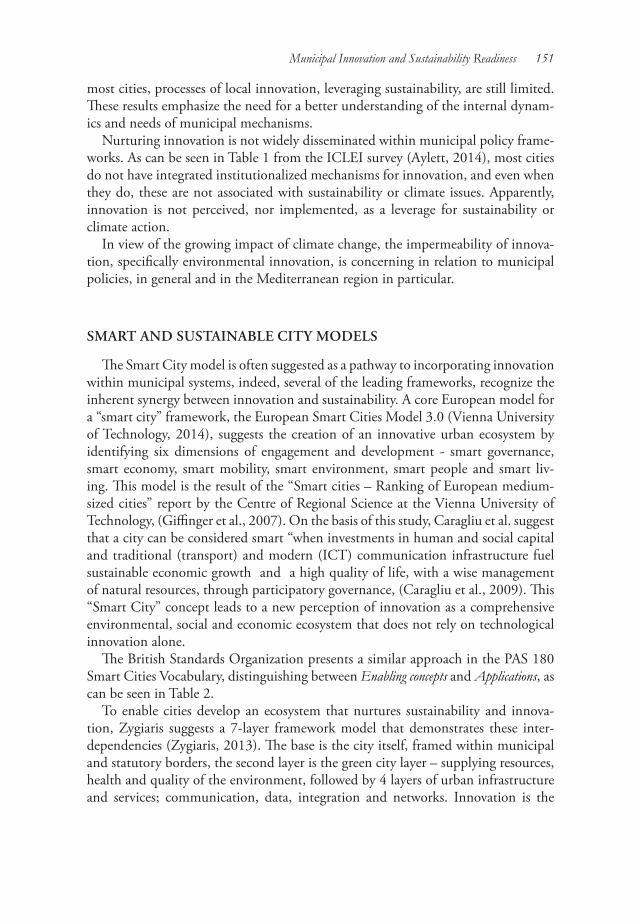
Municipal Innovation and Sustainability Readiness 151
most cities, processes of local innovation, leveraging sustainability, are still limited. These results emphasize the need for a better understanding of the internal dynam-ics and needs of municipal mechanisms.
Nurturing innovation is not widely disseminated within municipal policy frame-works. As can be seen in Table 1 from the ICLEI survey (Aylett, 2014), most cities do not have integrated institutionalized mechanisms for innovation, and even when they do, these are not associated with sustainability or climate issues. Apparently, innovation is not perceived, nor implemented, as a leverage for sustainability or climate action.
In view of the growing impact of climate change, the impermeability of innova-tion, specifically environmental innovation, is concerning in relation to municipal policies, in general and in the Mediterranean region in particular.
SMART AND SUSTAINABLE CITY MODELS
The Smart City model is often suggested as a pathway to incorporating innovation within municipal systems, indeed, several of the leading frameworks, recognize the inherent synergy between innovation and sustainability. A core European model for a “smart city” framework, the European Smart Cities Model 3.0 (Vienna University of Technology, 2014), suggests the creation of an innovative urban ecosystem by identifying six dimensions of engagement and development - smart governance, smart economy, smart mobility, smart environment, smart people and smart liv-ing. This model is the result of the “Smart cities – Ranking of European medium-sized cities” report by the Centre of Regional Science at the Vienna University of Technology, (Giffinger et al., 2007). On the basis of this study, Caragliu et al. suggest that a city can be considered smart “when investments in human and social capital and traditional (transport) and modern (ICT) communication infrastructure fuel sustainable economic growth and a high quality of life, with a wise management of natural resources, through participatory governance, (Caragliu et al., 2009). This “Smart City” concept leads to a new perception of innovation as a comprehensive environmental, social and economic ecosystem that does not rely on technological innovation alone.
The British Standards Organization presents a similar approach in the PAS 180 Smart Cities Vocabulary, distinguishing between Enabling concepts and Applications, as can be seen in Table 2.
To enable cities develop an ecosystem that nurtures sustainability and innova-tion, Zygiaris suggests a 7-layer framework model that demonstrates these inter-dependencies (Zygiaris, 2013). The base is the city itself, framed within municipal and statutory borders, the second layer is the green city layer – supplying resources, health and quality of the environment, followed by 4 layers of urban infrastructure and services; communication, data, integration and networks. Innovation is the
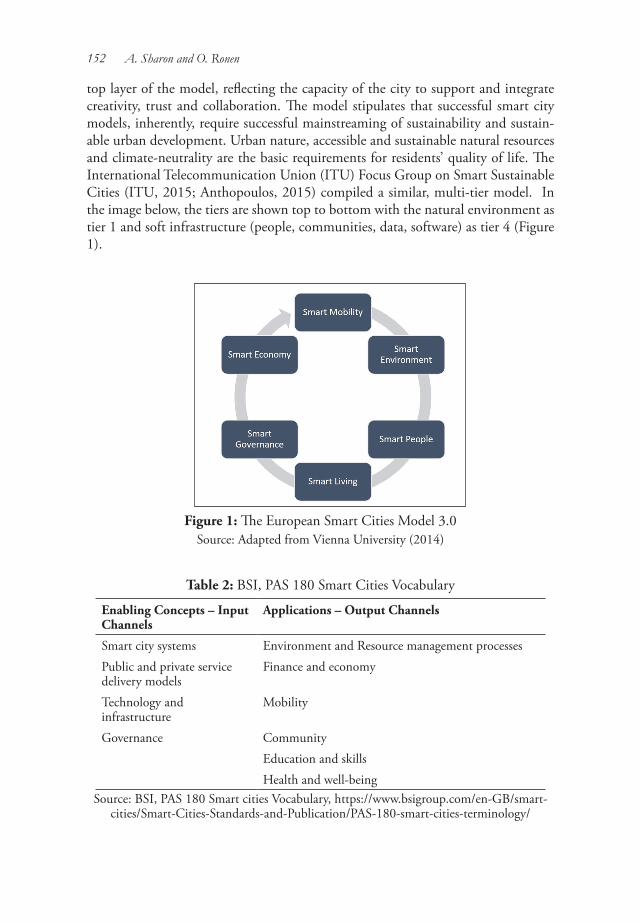
152 A. Sharon and O. Ronen
top layer of the model, reflecting the capacity of the city to support and integrate creativity, trust and collaboration. The model stipulates that successful smart city models, inherently, require successful mainstreaming of sustainability and sustain-able urban development. Urban nature, accessible and sustainable natural resources and climate-neutrality are the basic requirements for residents’ quality of life. The International Telecommunication Union (ITU) Focus Group on Smart Sustainable Cities (ITU, 2015; Anthopoulos, 2015) compiled a similar, multi-tier model. In the image below, the tiers are shown top to bottom with the natural environment as tier 1 and soft infrastructure (people, communities, data, software) as tier 4 (Figure 1).
Figure 1: The European Smart Cities Model 3.0 Source: Adapted from Vienna University (2014)
Table 2: BSI, PAS 180 Smart Cities Vocabulary
Enabling Concepts – Input Channels
Applications – Output Channels
Smart city systems Environment and Resource management processesPublic and private service delivery models
Finance and economy
Technology and infrastructure
Mobility
Governance CommunityEducation and skillsHealth and well-being
Source: BSI, PAS 180 Smart cities Vocabulary, https://www.bsigroup.com/en-GB/smart-cities/Smart-Cities-Standards-and-Publication/PAS-180-smart-cities-terminology/
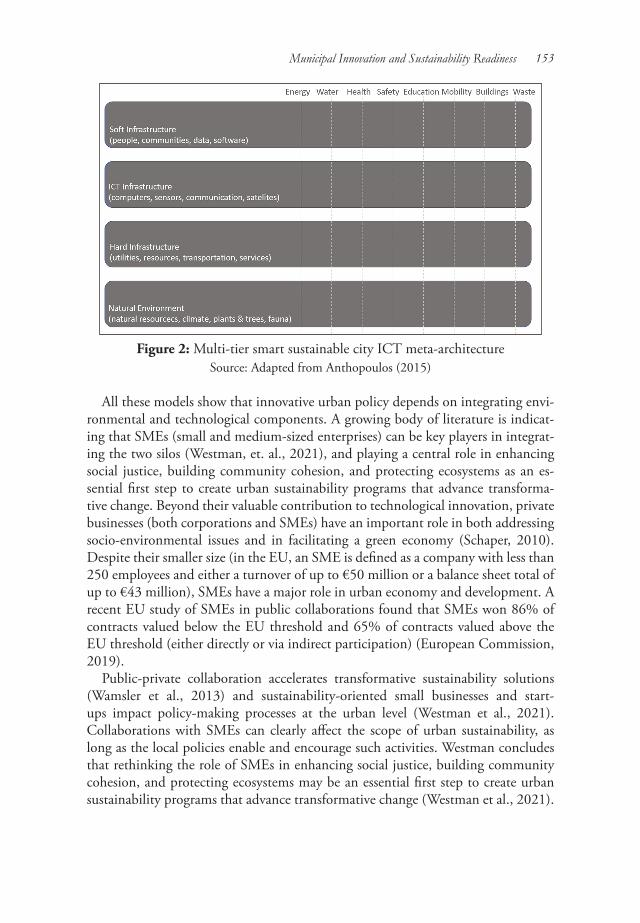
Municipal Innovation and Sustainability Readiness 153
Figure 2: Multi-tier smart sustainable city ICT meta-architectureSource: Adapted from Anthopoulos (2015)
All these models show that innovative urban policy depends on integrating envi-ronmental and technological components. A growing body of literature is indicat-ing that SMEs (small and medium-sized enterprises) can be key players in integrat-ing the two silos (Westman, et. al., 2021), and playing a central role in enhancing social justice, building community cohesion, and protecting ecosystems as an es-sential first step to create urban sustainability programs that advance transforma-tive change. Beyond their valuable contribution to technological innovation, private businesses (both corporations and SMEs) have an important role in both addressing socio-environmental issues and in facilitating a green economy (Schaper, 2010). Despite their smaller size (in the EU, an SME is defined as a company with less than 250 employees and either a turnover of up to €50 million or a balance sheet total of up to €43 million), SMEs have a major role in urban economy and development. A recent EU study of SMEs in public collaborations found that SMEs won 86% of contracts valued below the EU threshold and 65% of contracts valued above the EU threshold (either directly or via indirect participation) (European Commission, 2019).
Public-private collaboration accelerates transformative sustainability solutions (Wamsler et al., 2013) and sustainability-oriented small businesses and start-ups impact policy-making processes at the urban level (Westman et al., 2021). Collaborations with SMEs can clearly affect the scope of urban sustainability, as long as the local policies enable and encourage such activities. Westman concludes that rethinking the role of SMEs in enhancing social justice, building community cohesion, and protecting ecosystems may be an essential first step to create urban sustainability programs that advance transformative change (Westman et al., 2021).
154 A. Sharon and O. Ronen
The current study adds important insights on the barriers and opportunities to ex-pand local policies so they are able to deliver sustainability and climate objectives and support cross sector collaboration.
MAINSTREAMING SUSTAINABILITY THROUGH INNOVATION
The ability to realize climate and sustainability objectives depends on whether sustainability is mainstreamed as a primary policy driver (Martin, et al., 2018). Within climate and sustainable development policies, mainstreaming has been widely acknowledged as a key element for success. According to Oxford Dictionary, mainstream is “the ideas, attitudes, or activities that are shared by most people and regarded as normal or conventional”. Mainstreaming sustainable development in businesses, national or local government, can be understood as having sustainability fully embedded in urban culture, processes and activities (Bucero, 2020).
Mainstreaming environmental principles is the basis on which technological and economic development can prosper. Cities seeking smart and innovative strategic frameworks need to have a sound, sustainable environmental foundation that will support both the technological layers and the health and well-being of residents and incorporate technology as a catalyst for change (Ahvenniemi, et al., 2017).
One barrier to mainstreaming sustainability is the need to introduce new ide-as and technologies into established decision-making systems, dependent on lo-cal characteristics, culture and politics. Desdemoustier and his colleagues, studied adoption of Smart City applications to advance sustainable development, among 115 Belgian municipalities (Desdemoustier, et. al., 2019). The Belgian typology comprises four understandings:
Non-existent – municipalities which have not developed a clear understanding of the Smart City Model.
Technological – municipalities with a strong technological approach. A smart city is a way to implement new technologies, especially using ICT solutions.
Societal – municipalities who already transcend the technological character of the smart city phenomenon to emphasize human-centricity, sustainability and/or on governance.
Comprehensive – for municipalities developing this understanding, smart cities are a combination of concepts related to the use of technology, sustainable develop-ment, governance, creativity, and human and social capital.
The studied sample represent Belgian municipalities, in term of size (small, me-dium, large), and degree of urbanization (urban, rural). Results indicate that mu-nicipalities without any understanding of the smart city model or with a limited technical understanding are mostly located in small and rural municipalities. These municipalities largely reject the concept of the smart city for all purposes. On the other hand, medium and large sized municipalities mostly develop a comprehensive
Municipal Innovation and Sustainability Readiness 155
understanding of the concept, including aspects of sustainability and governance. The results of this study show a dichotomy of understanding and acceptance of the smart city model between rural and urban municipalities, central and peripheral. These findings are further collaborated by Leka and Nicolaides’ (2017) study of small and medium size Mediterranean cities. The study reveals that these cities are somehow marginalized during their “going smart” journey and their developmental momentum remains, largely, unexploited. Further, when analyzing smart city adop-tion in the Mediterranean region, it is essential to note that cities in central and northern Europe and cities in the south and east-Mediterranean regions face differ-ent needs and challenges. Consequently, it is clearly valuable to identify the unique aspects of the Mediterranean region (Monzon, 2015).
SMART AND SUSTAINABLE CITY FRAMEWORKS IN THE MEDITERRANEAN
In 2018, Reckien (Reckien et al., 2018) surveyed 885 cities across Europe. Their analysis shows that most cities have some sort of climate plan. It is interesting to note that cities which have climate targets instated in their policies usually have combined strategic climate plans. However, out of the 885 cities, only 88 are Mediterranean cities, and most of their plans are predominantly in the mitigation category, focused mostly on energy planning. The relatively limited mainstreaming in Mediterranean cities is also apparent in the Sustainable Cities Index of Arcadis (Arcadis Sustainable Cities Mobility Index , 2017), where only six Mediterranean cities are listed out of 32 European and 100 global cities, none in the first two deciles and only two in the third decile. Other rankings, both for smart cities and sustainable cities (IMD, 2020), also reveal sparse placement of Mediterranean cities.
On the one hand, leading cities in the region are incorporating smart city frame-works as central development drivers. Barcelona is undoubtedly the epitome smart city, home of the Smart Cities Expo World Congress, followed by cities such as Tel Aviv Yafo, Turin, Marseilles and Santander, cities that are in effect upgrading and improving their management tools, infrastructure and services. The ‘smart city’ concept is an appealing call for action – replacing established structures and tech-nologies that are no longer sufficient, with new ones, cutting costs using new tools and initiating sustainability-oriented projects. This call for action and innovation is reflected in persuasive case studies, success stories and awards to leading cities, but is this call spreading across all cities?
Indeed, while some municipalities are highly proactive in pursuing “smart cities” practices, others are still watching. A comparison of several Mediterranean cities’ smart city efforts reveals significant variance of needs between cities (Stratigea and Panagiotopoulou, 2015). Smaller, less global cities in the region, exhibit categori-cally different aptitudes and readiness for ‘smart’ efforts affected by unfavorable eco-

156 A. Sharon and O. Ronen
nomic circumstances, lack of knowledge and skills in ICTs and their applications, lack of technical expertise etc. Apparently, the Smart City model, as a driver for innovation, fits the needs of the ‘smart’ ecosystem better than the needs of the mu-nicipal ecosystem.
Apparently, there is substantial disparity in the dissemination and adoption of smart city strategies to attain sustainable development goals. Several studies of European and Mediterranean cities, including the current study, demonstrate these phenomena, exhibiting significant variations in terms of municipal maturity, resil-ience, technological maturity and infrastructures, size and geographic and demo-graphic contexts (Butler, & Hackney, 2015, Stratigea et al., 2017).
THE STUDY
The study of sustainability mainstreaming and innovation readiness in 34 Mediterranean cities is part of the SME4SMARTCITIES research project, an ini-tiative of ENI CBC MED, led by a consortium of six organizations from across the Mediterranean. As presented above, the aptitude and readiness of policy makers is a key determinant to mainstreaming policy. The current study explores the perceived readiness and aptitude of Mediterranean cities, in terms of barriers and practices, to embracing innovation as means of mainstreaming sustainability.
Two key axes delineate the study: • Readiness - The extent cities feel ready for urban and environmental innovation. • Barriers - The challenges encountered in applying urban and environmental
innovation.The main research questions investigated were what are the barriers and oppor-
tunities perceived by city officials for adopting sustainable and smart city solutions, and how do these understandings influence collaborations with local and regional SMEs.
Study Methods and Data Collection
The survey used a mixture of open-ended and closed questions to explore the aptitude and readiness of policy makers of Mediterranean cities, to embracing inno-vation as means of mainstreaming sustainability. Interviews were conducted, mostly online, during 2020, using mixed-mode questionnaire with both Likert-type ques-tions and open text questions. The participants were municipal managers responsi-ble for innovation integration or environmental and climate issues, from 34 cities in the Mediterranean region, from El Puerto de Santa Maria in southern Spain to Eilat in southern Israel. The cities were recruited through a convenience sample, comprising of the project partners and their associate cities: Spain, Italy, Israel and the Palestinian Authority. The participating cities were grouped in two categories; large cities with over 100,000 inhabitants and small to medium sized cities with less
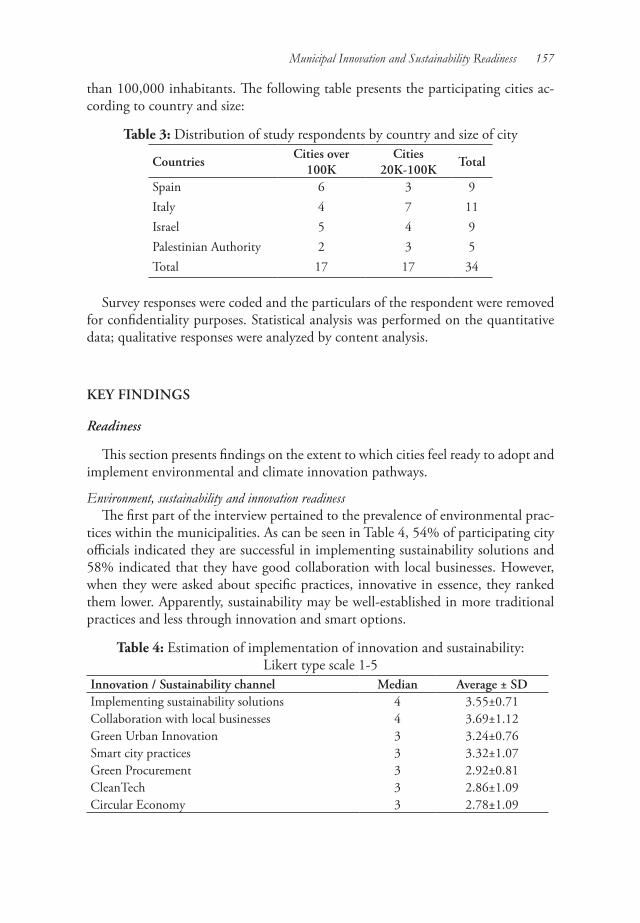
Municipal Innovation and Sustainability Readiness 157
than 100,000 inhabitants. The following table presents the participating cities ac-cording to country and size:
Table 3: Distribution of study respondents by country and size of city
CountriesCities over
100KCities
20K-100KTotal
Spain 6 3 9Italy 4 7 11Israel 5 4 9Palestinian Authority 2 3 5Total 17 17 34
Survey responses were coded and the particulars of the respondent were removed for confidentiality purposes. Statistical analysis was performed on the quantitative data; qualitative responses were analyzed by content analysis.
KEY FINDINGS
Readiness
This section presents findings on the extent to which cities feel ready to adopt and implement environmental and climate innovation pathways.
Environment, sustainability and innovation readinessThe first part of the interview pertained to the prevalence of environmental prac-
tices within the municipalities. As can be seen in Table 4, 54% of participating city officials indicated they are successful in implementing sustainability solutions and 58% indicated that they have good collaboration with local businesses. However, when they were asked about specific practices, innovative in essence, they ranked them lower. Apparently, sustainability may be well-established in more traditional practices and less through innovation and smart options.
Table 4: Estimation of implementation of innovation and sustainability: Likert type scale 1-5
Innovation / Sustainability channel Median Average ± SDImplementing sustainability solutions 4 3.55±0.71Collaboration with local businesses 4 3.69±1.12Green Urban Innovation 3 3.24±0.76Smart city practices 3 3.32±1.07Green Procurement 3 2.92±0.81CleanTech 3 2.86±1.09Circular Economy 3 2.78±1.09

158 A. Sharon and O. Ronen
Environmental issues and applied solutions
Participants were asked to indicate both the environmental issues that needed to be addressed and the ones that were being addressed. As can be seen in Figure 2, there is a clear distinction between the issues indicated in the two cases.
The issues noted in both cases, are predominantly similar - sustainable mobility, urban nature, waste management, air quality and energy. However, there is a distinct difference between the pertinence of the issues in the two cases. On the one hand, participants indicated a broad list of problem areas in relation to issues that need to be addressed, while, on the other hand, the majority of solutions actually imple-mented, were in sustainable energy, ranked no. 5 on the list of issues, and no. 1, with a significant gap over other areas, on the solution list. Sustainable energy is obviously the most lucrative area for municipalities, probably due to financial backing from the EU and high business interest. Conversely, sustainable mobility and innovation development, revealed an opposed trend; sustainable mobility ranked no. 1 on the list of issues, and at the end of the list, on solutions, innovation development was ranked no. 2 on the list of issues, and at the end of the list, on solutions. It should be noted, that most climate adaptation issues, also exhibited comparable trends (ad-aptation to climate change, water management, air quality), interestingly, the same disparity between issues and solutions was also associated with citizen engagement.
Figure 3: Top areas of environmental initiatives
Key factors for successful smart innovation in citiesRespondents were asked to note key factors that are required for smart innova-
tion to succeed in their city, in a free text interview (Figure 4). 26% of participating city officials articulated that finding economic resources and funding is a crucial key factor and 24% indicated that the leadership of the city mayor and CEO is a crucial

Municipal Innovation and Sustainability Readiness 159
key factor. Although, economic factors were identified as the leading determinants for success, all other factors relate to governance and to the specific norms and cul-ture of the municipality, including the need to develop better understanding and capacity of the new ecosystems, indicating – a knowledge and understanding barrier between “Tech” language and “administrative” language.
In order to embrace innovation and sustainable development practices, leader-ship of the city mayor and CEO are dominant and essential, twined with clear strategic vision and plans. Cooperation is also a distinct key factor, both within the municipality and with external agents through the establishment of public/private contact networks; with SMEs, local stakeholders, research institutions and the mu-nicipal teams.
Figure 4: Key factors to the successful embracing of innovation in municipalities
Respondents indicated an array of crucial key factors. One city official explained that four elements need to be fulfilled together to enable innovation in the city: 1. Leadership: “a clear vision of the innovation and putting the right people in the right place to execute this vision”; 2. Citizens’ participation: “without the support of the people, and without the emphasis on their awareness of the importance of smart innovation we cannot progress”; 3. Involvement of the private sector: “This can help provide capital and support the financial needs of innovation, in addition to sharing experiences those companies have that might not exist within the public sector”; 4. Sustainability and continuation: “Smart cities and smart innovation should become a priority for governmental organizations. This will guarantee the continuation and the sustainability of projects especially when they save resources and support the economy”. Another respondent outlined similar criteria but rephrased them differ-ently: “applying information and communication technologies, improving the qual-ity of life of citizens, increasing the competitiveness of its industrial fabric and guar-anteeing environmental sustainability. These objectives require fostering a change in

160 A. Sharon and O. Ronen
the management model”. The need for integrative, holistic approach was articulated further: “greater technical, political and social coordination, strategically planning with an integrated approach beyond the departmentalization of municipal services, involving the social and economic fabric throughout the process, always keeping people and quality of life as a priority axis.”
Barriers
This section presents findings on the challenges encountered in adopting smart initiatives by municipalities and in applying environmental innovation in their cit-ies (Figure 5).
Figure 5: Top barriers to advance smart initiatives
Barriers to Innovation for climate and sustainabilityParticipating city officials were asked to note barriers to adopting innovative prac-
tices and technologies for climate and sustainability challenges. The principal bar-rier, as can be seen in the graph above, is financial resources and economic consid-erations, followed by the administrative aspects, such as bureaucracy, administration processes and organizational culture.
“There is an ongoing lack of availability of investment in innovation projects.”“Increasing economic and financial constraints also due to the COVID emergency period.”
Technological know-how was indicated as another barrier. Officials explained that they experience deficiency in communication and understanding when evaluat-ing innovative solutions in comparison to traditional processes. City officials find it challenging to be up-to-date with rapid technological innovation and to be profi-cient with tech language, and they find that SME managers find it hard to be profi-cient with the public administration language and administration processes such as tenders and forms, creating a barrier on both sides:

Municipal Innovation and Sustainability Readiness 161
“Municipality’s management is currently a barrier to sustainable develop-ment, since they are not knowledgeable in the field”.“Knowledge gaps - companies do not know who to turn to, city professionals do not necessarily know the appropriate technologies.”
Legislation and national policies were a barrier for some cities in Israel and the Palestinian Authority but not for EU cities.
Innovation for climate and sustainabilityRespondents were asked to indicate barriers to working with innovation stake-
holders and SMEs in the fields of sustainability and climate change (Figure 6). Most of the respondents - 62% of city officials - reported ‘no barriers’ to working with innovative SMEs. The barrier that were noted, relate mostly to technical barriers due largely to legislation and ethics (such as complex tender processes and anti-corruption laws), financial resources, and bureaucratic processes:
“No barriers to working with SMEs and startups, the municipality is open to all suggestions." “We always try to collaborate with them. We try to identify companies with good references and try to facilitate and encourage synergies between com-panies.”
Figure 6: Barriers to working with SME and Start-ups
Differences between large and medium size citiesThough these results are of a sample of only 34 cities, they indicate clear differ-
ences between large and smaller to medium cities of the region. Tables 5-6 compare the ranking of main barriers to implementation of innovative sustainability solu-tions, of the two groups of cities.
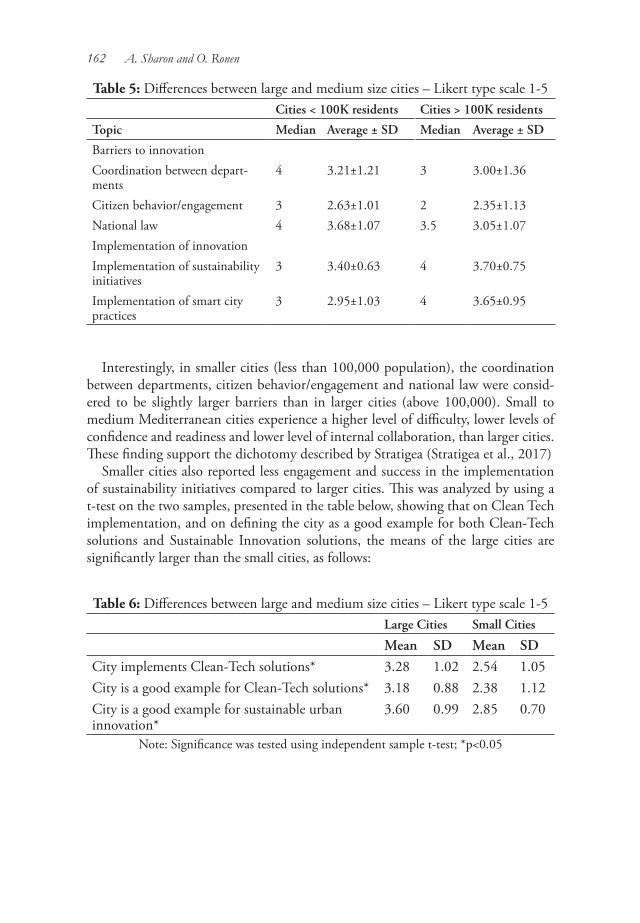
162 A. Sharon and O. Ronen
Table 5: Differences between large and medium size cities – Likert type scale 1-5 Cities < 100K residents Cities > 100K residents
Topic Median Average ± SD Median Average ± SD
Barriers to innovationCoordination between depart-ments
4 3.21±1.21 3 3.00±1.36
Citizen behavior/engagement 3 2.63±1.01 2 2.35±1.13National law 4 3.68±1.07 3.5 3.05±1.07Implementation of innovationImplementation of sustainability initiatives
3 3.40±0.63 4 3.70±0.75
Implementation of smart city practices
3 2.95±1.03 4 3.65±0.95
Interestingly, in smaller cities (less than 100,000 population), the coordination between departments, citizen behavior/engagement and national law were consid-ered to be slightly larger barriers than in larger cities (above 100,000). Small to medium Mediterranean cities experience a higher level of difficulty, lower levels of confidence and readiness and lower level of internal collaboration, than larger cities. These finding support the dichotomy described by Stratigea (Stratigea et al., 2017)
Smaller cities also reported less engagement and success in the implementation of sustainability initiatives compared to larger cities. This was analyzed by using a t-test on the two samples, presented in the table below, showing that on Clean Tech implementation, and on defining the city as a good example for both Clean-Tech solutions and Sustainable Innovation solutions, the means of the large cities are significantly larger than the small cities, as follows:
Table 6: Differences between large and medium size cities – Likert type scale 1-5Large Cities Small Cities
Mean SD Mean SDCity implements Clean-Tech solutions* 3.28 1.02 2.54 1.05City is a good example for Clean-Tech solutions* 3.18 0.88 2.38 1.12City is a good example for sustainable urban innovation*
3.60 0.99 2.85 0.70
Note: Significance was tested using independent sample t-test; *p<0.05
Municipal Innovation and Sustainability Readiness 163
DISCUSSION
Today, Mediterranean cities are lagging behind North European cities in address-ing climate change challenges and mainstreaming sustainability. There are certainly differences both in economic abilities and in needs, between the two regions. The emerging convergence of sustainability and innovation may offer a stronger incen-tive for Mediterranean cities to promote expansive environmental practices. The preliminary study of 34 cities set out to identify the readiness of municipalities to incorporate innovation as a driver for sustainability and climate policy.
There was much interest in adopting innovative solutions, but less experience, with only one fifth of the participating authorities indicated they were already work-ing to develop innovative and large-scale environmental initiatives. These were pre-dominantly the larger municipalities. The smaller cities tend to veer more towards the challenges and barriers that hinder such initiatives.
Readiness to Embrace Innovation and Green Solutions
In general, the participating cities, large and small, indicated a positive attitude to incorporating innovation as a leverage to sustainability. They seem to be familiar with both sustainability and climate challenges and the concept of innovation eco-systems. Large cities have more experience in incorporating innovative projects in these areas, especially relating to sustainable energy. The study revealed an interest-ing discrepancy between issues that need to be addressed and issues that are being addressed. Opportunities for sustainable energy are prevalent and already lucrative, whereas, the hard-core environmental areas, such as nature and waste, are not as attractive. This disparity can create opportunities for both municipalities and inno-vative SMEs to work together in developing appropriate solutions. The participants noted economic and governance issues that can hinder collaboration but overall, they demonstrated an interest in innovative and sustainable initiatives to address these needs, indicating only few barriers for collaborations with external sources.
Overall, we found that the concerns for mainstreaming innovative sustainabil-ity are about capacity rather than technology. Cities have difficulty in creating an innovation-oriented climate because of limited resources, knowledge and commu-nication issues and because of the effort required to drive change. However, the COVID-19 crisis has shown how quickly local authorities can re-organize, adapt and respond in a most impressive way. When in crisis, barriers fall.
In addition to the initiatives of leading innovative Mediterranean cities such as Barcelona, Genoa, or Tel Aviv-Yafo, other participant cities show desire to embrace innovation and use it for their benefit. Large cities are more open to risk taking, show slightly better communications and collaboration between departments and slightly better citizen engagement than smaller cities. Still, small cities show initia-tives and readiness to participate in national and regional programs.
164 A. Sharon and O. Ronen
A Path to Resolve Challenges and Barriers
When asked to pinpoint major challenges and barriers, participants noted issues with enablers - factors that cut across all activities, rather than any specific applica-tion areas (such as electricity, air quality or waste). Funding for innovative projects emerged as a significant barrier for innovative environmental and climate initiatives. This was collaborated by the dominance of sustainable energy enterprises that come with substantial funding opportunities, contrary to other issues, such as mobility and climate that are perceived as more pertinent, are less addressed and resolved.
Governance emerges as the next area for attention, both as an obstacle but also as the pathway to resolution. Bureaucracy and to a smaller extent issues of legislative barriers, vision and strategy, municipal work culture and technological infrastruc-ture, were all noted as barriers. Emphasizing communication, collaboration and learning, fueled by political will and a mental climate for green innovation, led by the mayor and CEO and assisted by an integrated professional municipal team that work in open collaboration across the municipality, reveals a road to resolve the challenges.
Sharing up-to-date knowledge, skills and nurturing a sense of ability, can be acted on with relative ease since enough experience and knowledge has been gained, and there is a wealth of case studies, solutions, initiatives and networks for cities to en-gage in. Cities can learn by direct experience and by the experience of other cities. These are catalysts for overcoming the barriers. We already seem to have entered the second wave of municipal innovation adoption. The pioneers have already shown the value. Now is the turn of more cities to reap the benefits. If there is the political will and understanding that every authority has great human, social, economic and environmental potential, the way is paved for innovative and environmental solu-tions that will yield great benefit.
Discourse and collaboration between cities, especially between stronger, ex-perienced innovative cities and less experienced cities, holds potential for varied Mediterranean cities. Clusters or regional models offer a suitable platform for en-gagement. Similarly, collaboration between solution providers to create clusters of innovative, sustainable solutions can make it easier for cities to find and implement solutions. Instead of competing and creating a sense of overwhelming confusion, they can cooperate through integrated solutions.
The study results indicate that there is a positive aptitude for incorporating sus-tainable innovation by cities across the Mediterranean, more so in larger cities than smaller ones. Although there are already municipalities with successful initiatives, even they concede that challenges, barriers and gaps remain. None of the study participants indicated they have no need for innovation or for a green environment. Many did express the lack of up-to-date knowledge and barriers to collaboration with entities outside the municipality. If cities and SMEs work together to resolve the major challenges, they may enjoy a beneficial breakthrough in areas such as mo-bility, nurturing urban nature, and addressing climate change.

Municipal Innovation and Sustainability Readiness 165
Funding issues certainly came up as a prominent barrier to sustainable innova-tion; this aspect may be linked to limited understanding of the new and emerging sustainable innovation ecosystem. As noted, numerous cities in the region have al-ready bridged the innovation gap and are benefiting from new economic opportuni-ties. As an example, cities in the region are working vigorously towards zero energy dependency by increasing energy use efficiency and establishing sustainable electric-ity generation systems in their territory. The city of Malaga has implemented energy management systems in public service buildings, in single-family homes in social buildings and in city facilities such as public lighting and irrigation facilities. Malaga has also established photovoltaic energy installations. The city reports savings of 16% for street lighting and savings of 40% in electricity consumption of public buildings and traffic lights (Malaga Smart). An annual saving of 1.5 million euros in the electricity consumption of public lighting was achieved in 2015. Kfar Sava in central Israel is setting up dozens of solar systems on the roofs of public facilities (Image 1), along with public engagement and communication, to generate revenue and to become an energy self-sufficient city.
Image 1: Innovative use of sports ground for the production of solar-based electricity, providing a win-win solution with revenue for the municipality in Kfar
Sava, Israel. Source: City of Kfar Sava
SUMMARY RECOMMENDATIONS
Readiness to embrace innovative and green solutions:• Municipalities are open to innovative sustainable initiatives to economic,
social and environmental issues
166 A. Sharon and O. Ronen
• Barriers in across the board, issues: financing, knowledge, work processes, communication
• Large gap between needs and execution in all application fields, except for breakthrough in sustainable self-sufficient energy
• Larger cities have better internal collaboration, citizen engagement and are more open to risk taking
• Openness for working with SMEs, gaps of knowledge, admin processes, resources
• Constraints for mainstreaming innovative sustainability are about capacity rather than technology
A Path to Resolve Challenges and Barriers:• Communication, collaboration and learning are key• Fueled by political will and a mental climate for green innovation, led by the
mayor and CEO• Assisted by an integrated professional municipal team in open collaboration
across the municipality• Creating clusters of collaboration - regional clusters, large and small cities,
diverse SMEs creating solutions together• Crucial role for knowledge management - horizontal coordination, sharing
knowledge, skills, learning from experience, nurturing a sense of ability• Solve funding barriers by revenue generating solutions, nurturing local
economy, collaboration in city clusters
NOTES
1. Smart Cities Expo World Congress in Barcelona, http://www.smartcityexpo.com/
2. http://www.enicbcmed.eu/projects/sme4smartcities3. http://www.enicbcmed.eu/4. The interviewing process was stretched over nine month due to COVID19
restrictions5. Malaga Smart - Energy (malaga.eu)
REFERENCES
Ahvenniemi, H., Huovila, A. Pinto-Seppa, I. and Iraksinen, M. (2017) What are the differences between sustainable and smart cities?. Cities, 60: 234-245.
Anthopoulos, L. (2015) Defining smart city architecture for sustainability. In Proceedings of 14th Electronic Government and 7th Electronic Participation
Municipal Innovation and Sustainability Readiness 167
Conference (IFIP2015), 140-147. Arcadis Sustainable Cities Mobility Index (2017) https://www.arcadis.com/en/
global/our-perspectives/sustainable-cities-mobility-index-2017/Aylett A. (2014) Progress and Challenges in the Urban Governance of Climate
Change: Results of a Global Survey, MIT, Cambridge, MA. https://www.preventionweb.net/publications/view/38666
-----. (2015) Institutionalizing the urban governance of climate change adaptation: Results of an international survey, Urban Climate, 14, 1: 4-16. http://www.sciencedirect.com/science/article/pii/S2212095515300031
Bloomberg, M. R., & Aggarwala, R. T. (2008) Think locally, act globally. American Journal of Preventive Medicine, 35(5), 414-423.
Bucero, G.. A. (2020) Accelerating Green: How Small and Medium Enterprises can contribute towards Mainstreaming Urban Nature-Based Solutions. MS thesis. Faculty of Sciences, Utrecht University,.
BSI, PAS 180 Smart cities Vocabulary, https://www.bsigroup.com/en-GB/smart-cities/Smart-Cities-Standards-and-Publication/PAS-180-smart-cities-terminology/
Butler, T., & Hackney, R. (2015) Understanding digital eco-innovation in municipalities: an institutional perspective. ECIS Research Papers, No.21,
Caragliu, A., Del Bo, C. and Nijkamp, A. (2009) Smart cities in Europe. University of Amsterdam, Faculty of Economics, Business Administration and Econometrics, https://www.researchgate.net/publication/46433693_Smart_Cities_in_Europe
Desdemoustier, J., Crutzen, N. and Giffinger R. (2019) ‘Municipalities’ understanding of the Smart City concept: An exploratory analysis in Belgium.” Technological Forecasting and Social Change, 142: 129-141.
ENI CBC MED, SME4SMARTCITIES Intelligent Cities Challenge, http://www.enicbcmed.eu/projects/sme4smartcities
-----. The Programme at a glance, http://www.enicbcmed.eu/about-us/the-programme-at-a-glance
-----. Developing innovative solutions for Mediterranean smart cities: launching of the SME4SMARTCITIES project, http://www.enicbcmed.eu/developing-innovative-solutions-mediterranean-smart-cities-launching-sme4smartcities-project
European Commission (2019) Analysis of SMEs participation in public procurement and measures to support it, https://ec.europa.eu/growth/content/analysis-smes%E2%80%99-participation-public-procurement-and-measures-

168 A. Sharon and O. Ronen
support-it_en Fabres, J. & Kurvits, T. & Nilsen, R. & Pravettoni, R. & Agardy, T. (2012) State
of the Mediterranean Marine and Coastal Environment. 25-35. https://planbleu.org/en/publications/state-of-the-mediterranean-marine-and-coastal-environment/
Giffinger, R., Fertner, C. Kramar H., Kalasek R., Pichker-Milanowitc, A., Neirjers. E. et al. (2007) Smart cities – Ranking of European medium-sized cities report, Vienna University of Technology http://www.smart-cities.eu/download/smart_cities_final_report.pdf
IMD Business School (2020) Smart Cities city ranking, https://www.imd.org/smart-city-observatory/smart-city-index/
International Telecommunications Union (ITU) (2015) Technical Specifications on “Setting the framework for an ICT architecture of a smart sustainable city” (SSC-0345), https://www.itu.int/en/ITU-T/focusgroups/ssc/Documents/website/web-fg-ssc-0345-r5-ssc_architecture.docx
IPCC (2015) Special Report: Global Warming Of 1.5 ºC, Chapter 03: Impacts of 1.5ºC global warming on natural and human systems, https://www.ipcc.ch/sr15/chapter/chapter-3/
Municipality of Malaga (2016) Malaga Smart, https://malagasmart.malaga.eu/en/sustainable-and-safe-habitat/energy/#.YC-lhDLit1A
Leka, A., & Nicolaides, C. (2017) Small and medium-sized cities and insular communities in the Mediterranean: Coping with sustainability challenges in the smart city context. In Stratigea, A. Kyriakides,.E. and Nicolides, C. (Eds.), Smart Cities in the Mediterranean. Springer, Cham, 3-29.
Martin, C. J., Evans, J. and Karvonen, A. (2018) Smart and sustainable? Five tensions in the visions and practices of the smart-sustainable city in Europe and North America. Technological Forecasting and Social Change 133: 269-278.
McCrudden, C. (2004) Using public procurement to achieve social outcomes. Natural Resources Forum. 28. 4 : 257-267.
Monzon, A. (2015) Smart cities concept and challenges: Bases for the assessment of smart city projects. 2015 International Conference on Smart Cities and Green ICT Systems (SMARTGREENS). IEEE.
Nilsson, M., Griggs, D. and Visbeck M. (2016) Policy: Map the Interactions between Sustainable Development Goals. Nature News, 534.7607: 320.
OECD (2018) Key Data on Local and Regional Governments in the EU..Reckien, D., Salvia, M., Heidrich, O., Church, J. M., Pietrapertosa, F., De Gregorio-
Hurtado, S. & Dawson, R. (2018) How are cities planning to respond to
Municipal Innovation and Sustainability Readiness 169
climate change? Assessment of local climate plans from 885 cities in the EU-28. Journal of Cleaner Production, 191: 207-219.
Rosenzweig C., Solecki, W.D., Hammer, S.A. and Mehrota, S. (Eds.) (2011) Climate Change and Cities: First Assessment Report of the Urban Climate Change Research Network (UCCRN), Urban Climate Change Research Network Center for Climate Systems Research Earth Institute, Columbia University, Cambridge University Press, London.
Schaper, Michael, (ed.) (2010) Making Ecopreneurs: Developing Sustainable Entrepreneurship. CRC Press.
Stratigea, A. Kyriakides,.E. and Nicolides, C. (Eds.) (2017) Smart Cities in the Mediterranean. Springer, Cham. Springer
Stratigea, A., and Panagiotopoulou, M. (2015) Smart Cities at the Service of Urban Sustainability-A Flavor of the Mediterranean Experience. Journal of Regional & Socio-Economic Issues 5.3): 7-30.
Sharon, A. (2019) What is really a smart city, Israel Smart Cities Institute, https://israelsmartcities.org/really_smart_city/
Thomson, J., and Jackson, T. (2007) Sustainable procurement in practice: Lessons from local government. Journal of Environmental Planning and Management 50, 3: 421-444.
UN Environment Program (UNEP) (2020) Cities and climate change . https://www.unenvironment.org/explore-topics/resource-efficiency/what-we-do/cities/cities-and-climate-change
Vienna University of Technology (2014) The European Smart Cities Model 3.0, http://www.smart-cities.eu/?cid=2&ver=3
Wamsler, C., Brink, E., & Rivera, C. (2013) Planning for climate change in urban areas: From theory to practice. Journal of Cleaner Production, 50: 68-81.
Westman, L., Moores, E., & Burch, S. L. (2021) Bridging the governance divide: The role of SMEs in urban sustainability interventions. Cities, 108, 102944.
Zygiaris S. (2013) Smart city reference model: Assisting planners to conceptualize the building of smart city innovation ecosystems. Journal of the Knowledge Economy, 4: 217–231. https://link.springer.com/article/10.1007/s13132-012-0089-4

The Good and the Bad
Keystone Practices to Enable Smart Cities to Flourish
Geography Research Forum • Vol. 40 • 2020: 171-192.
* School of Information Sciences, University of Illinois at Urbana-Champaign, IL., USA. [email protected]
This paper draws on the notion of creative urban ecologies as a way to characterize a thriving ‘smart’ city both in terms of the technology and data in use and also in terms of the city’s capacity to learn and adapt. What does it take for a city and her inhabitants to remain resilient in the face of challenges like climate change or dis-ease outbreaks? How does a global city use data effectively to deal with situations where information will inevitably remain incomplete, uncertain and dynamic? How can and should data serve the ultimate end goal of urban well-being? Draw-ing on the author’s own engagements with creative information practices, data ethics and trust-building strategies, the paper presents a human-centred approach to ‘smart city’ initiatives. Creating smarter cities calls upon us to work with a com-plex and ever-evolving mix of people within a built environment constructed upon an existing ecosystem using ever ‘smarter’ technologies. Thriving in and adapting to change in such contexts involves a capacity for imaginative problem solving and problem finding as much as it involves technical know-how. The paper offers a framework for building resilience into the fabric of an urban ecology, introducing four critical operating principles, and closes by speculating how supporting five keystone practices can create a city that is ‘smart’, sustainable and compassionate.Keywords: Data ethics, trust-building, codesign, creative ecology, community building, resilience, urban ecology
Theresa Dirndorfer Anderson*University of Illinois at Urbana-Champaign
INTRODUCTION
During the Australian spring and summer of 2019-2020, horrific bushfires swept across the country, laying bare both ecological and urban vulnerabilities. More than 12.6 million hectares burnt, with thirty-three human lives lost, over one billion animals killed and 11.3 million Australians affected by smoke.
While metropolitan Sydney was spared from the most cataclysmic of the fire-storms, the fallout of smoke, haze, and ash shrouded the city and surrounding com-munities for weeks on end, leading to this region having some of the worst air quality on the planet during that period. And as the summer heat persisted, water catchments already strained by years of drought were stretched further by the fire
T. D. Anderson172
crisis and communities found themselves facing severe water restrictions. In the aftermath of the fires, drought and economic impact, the resilience of both the community and the land was already apparent. Before the cleanup could be com-pleted or government authorities could finalise their review of the social, economic and ecological fallout of the firestorms of that long, hot summer, there was a new enemy to fight along new battlefronts with the declaration of the COVID-19 global pandemic and the establishment of stringent limitations on human movements, including state and international border closures and quarantine requirements.
Both crises, in their own way, confront the city of Sydney and her residents with situations that extend beyond the reach of existing understandings and contem-porary experience. Firefronts on the fringes of Sydney during bushfire season were nothing new, but the scale of these most recent fires had made the behaviour of outbreaks harder to model. Sydney had also experienced quarantine conditions be-fore – the city’s historic Quarantine Station remains a very visible reminder of how the city used physical barriers and social distancing to tackle the Spanish Influenza outbreak of 1918. But, one hundred years later, with jet aircraft rather than troop-ships the main potential risk of disease to the city, the scale of this current pandemic confronts us at a new quickfire pace in the modern, technologically-enabled ways of a global city like Sydney. And even though data technologies are being deployed in rapid-fire fashion to aid in the fight against this disease, the technical and political concerns with contact tracing apps, for instance, provide us with cautionary tales as more of the data technologies we have come to associate with ‘smart cities’ are brought on line.
Even without such dramatic shocks to the city’s rhythms as might be caused by events like a disease outbreak or bushfire, residents of cities like Sydney experience a range of chronic stresses such as personal safety, affordable housing and transport congestion challenging their resilience. As the world continues to deal with the ongoing challenge of a global pandemic and concerns about climate change, the erosion of public trust accompanying these crises appears to be accelerating calls for fresh thinking about ways cities like Sydney can effectively use data to prepare for and stave off similar crises in the future. In early 2020, the dial of the Society for Atomic Scientists’ Doomsday Clock was moved closer than ever before to the symbolic midnight “doomsday” hour, entering into the realm of the two-minute warning, “...when danger is high and the margin for error low”. In a statement explaining the reasons for their decision released 23 January 2020, the editor of the Bulletin wrote:
“Humanity continues to face two simultaneous existential dangers—nuclear war and climate change—that are compounded by a threat multiplier, cyber-enabled information warfare, that undercuts society’s ability to respond. The international security situation is dire, not just because these threats exist, but because world leaders have allowed the international political infrastructure for managing them to erode.”
It was time, the announcement went on to say, for new, creative responses:
Keystone Practices to Enable Smart Cities to Flourish 173
“If decision makers continue to fail to act—pretending that being inside two minutes is no more urgent than the preceding period—citizens around the world should rightfully echo the words of climate activist Greta Thunberg and ask: ’How dare you?’Public engagement and civic action are needed and needed urgently” (Meck-lin, 2020: Statement from the President and CEO – Inside the two-minute warning).
We hear much about how building up our individual and collective resilience can see us through the uncertainty of such events; how innovation and creativity can help us respond successfully to the challenges we face. As a data ethicist AND a Sydney resident myself, these events compel me to speculate about the conditions needed to enable a modern, data-informed city to flourish in the midst of such crises.
This essay is the product of that reflection, focusing on ways that insight from my own engagements with creative information practices, data ethics and trust-building strategies might contribute to ‘smart city’ initiatives, enabling resilient, sustainable and compassionate urban communities. Having spent many years examining the anthropology of ideas and conditions that can kickstart individual and collective creativity, I have long been intrigued by the dynamic relationship between creativity, risk and uncertainty. As an educator in the information and data science domains, I have integrated that creative-analytic focus on information and data ethics. And as an advocate for social justice, I design training to raise awareness about the issues of data justice and to help data professionals respond to public concerns related to the deployment and use of data sharing platforms. What does it take for a modern city (and her inhabitants) to remain resilient in the face of challenges like climate change or disease outbreaks? How does a global city use data effectively to deal with situa-tions where information will inevitably remain incomplete, uncertain and dynamic? How can and should data serve the ultimate end goal of urban well-being?
A SMART CITY AS A CREATIVE INFORMATION ECOLOGY: AN ECOLOGICAL VIEW OF THE CITY AS A HUMAN-TECHNOLOGY PARTNERSHIP
What does it mean to be a ‘smart city’? For the purpose of this essay, I draw on the following broad definition from the August 2020 Roadmap produced by Standards Australia where
“In its simplest form, it is generally defined in terms of a city’s goals enabled by data and technology. These goals should ultimately be about improving the lives of citizens. In the context of Australian cities, they may include sus-tainability, resilience, liveability, productivity and workability. The emphasis and specifics may vary from city to city. From a city’s perspective, advances in data and technology have unlocked new, more cost-effective and produc-
T. D. Anderson174
tive ways for ‘cities’ to undertake existing tasks. But the Smart City impact goes far beyond just ‘doing things better.’ Data and technology have enabled very innovative solutions to existing and emerging problems, and important-ly, provided opportunities to innovate highly novel products and services.” (Standards Australia, 2020: 9)
Many smart city initiatives are connected to efforts that address the social resil-ience, health and wellbeing of a community.
Alongside the development of data technologies to deploy in our cities, there is growing concern about what might be getting overlooked in the process (see for instance Green, 2019a; OECD, 2020). Creating smarter cities calls upon us to work with a complex and ever-evolving mix of people within a built environment con-structed upon an existing ecosystem using ever ‘smarter’ technologies. Thriving in and adapting to change in such contexts involves a capacity for imaginative problem solving and problem finding as much as it involves technical know-how. Despite all the benefits likely to emerge for cities from increased application of data technolo-gies, there are inevitable (and critical) data limitations that must give us pause as we continue to expand the deployment of smart city technologies. Human experience remains richer than what can be codified within any AI or data technologies at our disposal. The thesis proposed here is that a resilient smart city is one where human as well as machine intelligence is maximised. This argument is premised on a belief that preparing for unknown futures in a technology-infused society requires human agility and experimentation.
Florida’s (2001; 2012) discussion of the creative class as an economic force for this century is very appropriate here:
“It was the rise of this new class and of creativity as an economic force that was the underlying factor powering so many of the seemingly unrelated and epiphenomenal trends we had been witnessing; from advent of whole new industries and businesses, to changes in the way we lived, worked, and con-sumed, extending even into the rhythms, patterns, desires, and expectations that governed our daily lives” (Florida, 2012: Preface).
It is also important to appreciate that Florida’s notion of a creative class was about more than supporting a privileged sector of society:
“The key thesis of my argument is as simple as it is basic: Every human be-ing is creative. That the Creative Class enjoys vast privileges is true, but to acknowledge that fact is not to endorse it. The essential task before us is to unleash the creative energies, talent, and potential of everyone else—to build a society that acknowledges and nurtures the innate creativity of each and every human being” (Florida, 2012: Preface).
The creative hubs and innovation centres so commonplace in our cities seem to confirm Florida’s depiction of tech-entrepreneurs favouring urban living over sub-urbia. In many countries, reports commissioned to enable governments and work-forces to better manage transition from work in traditional sectors to the creative and cultural sector ( e.g., European Commission, 2010; Green &Hannon, 2007; Hill, 2020; Newbigin, 2010; Pratt, 2012; Tims & Wright, 2007; Wright et al.,
Keystone Practices to Enable Smart Cities to Flourish 175
2009) seem to extend Florida’s thesis to the building of creative cities. And current discourses of the ‘smart city’ seem to extend that vision of creativity and innovation even further (e.g., Ministry for Housing & Urban Affairs, 2020; OECD, 2020; Standards Australia, 2020).
Descriptions of this kind of urban landscape depict an environment capable of enabling a culture of creative cooperation in the midst of dynamic information and knowledge network transformations. Thus, the framework I use to examine data technologies in the urban landscape builds on the information ecology construct of Nardi & O’Day (1999), the wider notion of the creative ecology envisioned by Howkins (2009) and Florida’s (2012) discussion of the creative class. Succeeding in the information-intensive environments characterised by a smart city means cul-tivating a sustainable creative ecology capable of supporting and nurturing agile engagements with all of the interconnecting parts of such spaces.
An ecological perspective with its accompanying language of interdependencies, diversity, networks and mixing zones seems a very apt way to describe the complex-ity of any modern city. Howkins defines creative ecology
“...as a niche where diverse individuals express themselves in a systemic and adaptive way, using ideas to produce new ideas and where others support this endeavour even if they don’t understand it” (2009: 11-12).
Howkins suggests the strength of such ecology lies in the relationships rather than the infrastructure and the continual learning and creating of meaning taking place. His holistic approach builds on Bateson’s ecology of mind, Naess’s ecology of wis-dom and explorations of urban ecologies and network ecologies. Howkins identifies four aspects of ecological thinking relevant for creativity and innovation: diversity, change, learning and adaptation (Howkins, 2009: 45). Drawing on this work, an ecological perspective of the city provides a holistic appreciation of habitats and interdependencies that allow species (or ideas) to thrive, which in turn enriches an awareness of the self in that space.
Like Howkins (2009), Nardi & O’Day (1999) draw attention to the power of the ecology metaphor as part of a more systemic understanding of the way people work in sociotechnical contexts. Their depiction of the informational space as an eco-system draws attention to the interdependencies, networks and complexities when people work with information and informative artefacts. Because the data technolo-gies associated with smart city initiatives are designed with the intention to inform people, practice and policy, it seems very appropriate to consider the smart city as an information ecology.
Thinking of the smart city as both a creative and an information ecology sensitises us to its character as a diverse and adaptive community with complex information flows generated by both human and material components. Creativity, generally as-sociated with the generation of new ideas, is a natural part of this ecological perspec-tive on adaptation and learning. For Bateson, the word ‘idea’ is synonymous with the word ‘difference’. So in defining information as “a difference which makes a

T. D. Anderson176
difference” (Bateson, 1987: 459), he ties the generation of ideas to information at a fundamental level. I would argue that creativity is not the end, but rather the means for accomplishing our goals, whatever they may be. Like information, creativity is an enabler. If a smart city is to be capable of responding to change and complexity, it must also be a sustainable creative ecology capable of supporting and nurturing agile engagements with all the information generated in such a data-intensive context.
ENABLING HUMAN CAPABILITIES ALONGSIDE GROWING MACHINE INTELLIGENCE
Cautionary tales about overlooking the human side of technological change are not a new phenomenon. The Doomsday Clock referred to in the introduction to this essay, for instance, traces its origins back to a time when the Cold War’s threat of nuclear catastrophe loomed large in the minds of politicians and the public. It was an era shaped by two relatively new technologies: computational technologies and nuclear power. Vannevar Bush is often credited with being one of the first vi-sionaries to imagine what a hyper-connected world would look like. Passages of his 1945 essay As We May Think – written in the dawning of a nuclear age that saw the Second World War transform into Cold War – offer evocative descriptions of situ-ations where machine intelligence could address the limitations of human actions:
“There may be millions of fine thoughts, and the account of the experience on which they are based, all encased within stone walls of acceptable archi-tectural form; but if the scholar can get at only one a week by diligent search, his syntheses are not likely to keep up with the current scene” (Bush, 1945, Part 5).
Achieving faster, better information access, he surmised, was critical for human-ity’s future.
Like the frightening world of the early Cold War era of the time of that essay, today’s pressing concerns about global security and safety seem to call out for better, more efficient and more effective access to information about our surroundings if we are to solve many of the world’s urgent problems. And yet, even then, amidst his envisioning of machines that could support our thinking, Bush cautioned against any assumption about total reliance on them for all our thinking:
“Much needs to occur, however, between the collection of data and observa-tions, the extraction of parallel material from the existing record, and the final insertion of new material into the general body of the common record. For mature thought there is no mechanical substitute” (Bush, 1945, Part 3).
For me, such imaginings of technology augmenting human cognitive activity point to the need to hold on to and nurture the creative, inventive qualities of the human mind even as we design machines that can support and extend our thinking.
There is another cautionary tale to draw from past imaginings about techno-logically-enabled futures that appears very appropriate to the deployment of data technologies in our cities. Speaking at a 1984 conference at which thought leaders
Keystone Practices to Enable Smart Cities to Flourish 177
and educators gathered to discuss a “Brave New World” of technological change precipitated by the growing availability of computational technologies, Barry Jones (Australia’s Minister for Science at that time) expresses his concern about disparities in the growth of machine intelligence and human intelligence:
“Machines are doubling their intellectual capacity every few years, but people are not. If artificial intelligence outstrips human intelligence, if technology is smarter than its displaced human equivalent, then the power of the people who own the machines will be expanded to an almost unimaginable degree. What are the implications for our political system?“In Australia, the current generation of managers grew up before the techno-logical revolution. They do not fully understand its significance — and have an instinctive anxiety that if the number of Indians is reduced, fewer chiefs will be needed as well. When the existing technology is used at full capacity, or when new generations of managers arrive on the scene, the impact may be enormous unless we adopt appropriate social responses. It is time to examine the implications.” (Jones, 1984: 19-20).
It is not hard to imagine this statement’s applicability to contemporary discus-sions about the deployment of automated technologies and other data innovations within smart city initiatives, drawing attention to social and ethical consequences and deployment in line with the public interest (e.g., Green, 2019b; OECD, 2020).
These two historical visions of human-machine futures serve to remind us of the perennial nature of the sociotechnical and ethical concerns associated with human-machine partnerships. In the midst of our current discussions about data integration in the modern city, they also serve to remind us that there is something innately hu-man and constant about striving to overcome the challenges of our time.
To flourish in a ‘smart city’ I therefore contend takes more than a mastery of particular tools or systems. As the data technologies deployed in our cities grow smarter, it will be equally important to ensure that processes are in place to ensure that we continue to nurture the human capacity for learning, wonderment, experi-mentation, risk-taking and creativity. Through the co-mingling of creative literacies and technical literacies, we can more effectively engage with data in the unexpected and often exponentially changing ways it will confront us in the dynamic setting of a smart city. When we give ourselves permission to imagine and adapt our thinking beyond the information given, we will learn to make best use of all the data created, collected and analysed through ‘smart city’ technologies. In short, there is a need for artful as well as skilful engagements with all the information these processes pro-duce. And finally, if ALL residents of a city are to reap the rewards of ‘smart’ tools (rather than simply those who own those tools), then we must nurture a culture of creative cooperation and lifelong learning for all inhabitants of our cities.

T. D. Anderson178
THE ROLE OF UNCERTAINTY AND RISK FOR BUILDING INDIVIDUAL AND COLLECTIVE RESILIENCE
Another rich conceptual area of value for this discussion concerns the role played by exposure to risk and uncertainties in relation to both resilience and creativity. In this section I will point briefly to some key findings from my earlier explorations of this relationship that are of particular value for enabling the culture of creative cooperation that can support a city’s strategic deployment of data technologies.
In Anderson (2006; 2013) I illustrate how working through uncertainty can be a mediating strategy for knowledge generation, portraying experts thriving in their information landscapes because they had developed capacities to not only manage uncertainty but to embrace it. Uncertainty is often associated with risk, fear and danger. It is, however, a natural experience within the process of information seek-ing and meaning making. Furthermore, the perception and strategic use of uncer-tainty can be both a positive and negative influence on our behaviour.
Uncertainty impacts the whole self, and while it is not always a positive experi-ence, my scholarly (and personal) investigations into the anthropology of uncer-tainty have helped me to come closer to understanding how uncertainty can be an enabler in some situations, but an obstacle in others. Ultimately this led me to dive deeper into uncertainty and risk in terms of the role they play in human behaviour – starting with an exploration of the role in terms of individual behaviour before looking at the wider implications for us as families and communities. I grew particu-larly fascinated by the productive contribution that working with and through risk and uncertainty can have in our lives, encapsulating what I’d learnt into a depiction of four phases states contributing to creativity and innovation (Anderson, 2013). When we can learn to manage our reaction to uncertainty and develop a toler-ance for the discomfort it can cause in such instances, we put ourselves in a better position to build on the positive effects and mitigate some of the potential pitfalls. When we allow ourselves the space to be creative and inventive in our worlds, new insight emerges to enable us to handle the complexities we face.
Before exploring these productive capacities further, it is important to recognize that there are risks and uncertain situations that seem to have little creative po-tential. Risks to family security (e.g., job loss, housing concerns), to health (e.g., disease outbreaks, surgery, illness), or to personal security (e.g., crime, terrorism) are examples that many of us can appreciate. However, even in such circumstances, individual judgments vary with regard to where to draw the line in terms of threats to our security and acceptable risks. A review of research into terrorism threats, for instance, found great variance in terms of the perception of risk and potential ter-rorism threats within different communities at different points in time (Maguen et. al, 2008). Perception is a powerful determinant when it comes to developing a tol-erance of risk and uncertainty in society collectively and in our own lives. My own exploration of the risk landscapes of childhood in relation to mobile phone use and
Keystone Practices to Enable Smart Cities to Flourish 179
cyberbullying points to the detrimental impact of framing the child as a victimised consumer and privileging the perspective of the parent/teacher (Anderson, 2010). There is a powerful social element at play in the way we approach risk. Boholm (2015) supports the view that risk and uncertainty are extremely contextual. Her work also helps us understand how public talk of economic and political uncer-tainty and a generalised aversion to risk can shape our personal perception.
Wallerstein (1998), an historical social scientist who has written extensively about change and dynamics in global systems, has something to contribute to this explora-tion of uncertainty and its role in human experience. His observations about human social systems in periods of transition suggest that fear and panic kick in when we perceive our situation to be precarious, individually and collectively. This fear can be brought on by the major impact that seemingly small inputs can have on our stability (Wallerstein, 1998: 320). The cascading effect of the sub-prime credit crisis earlier this century, job losses accompanying digitisation and automation strategies and our current global trust deficit all seem to confirm his assessment. In such times it can be difficult to find a balance between desirable and undesirable uncertainty that we can live with, but it is helpful to remember that in times of upheaval, crea-tivity and risk taking can become tools for moving from old ways into the new ones necessitated by change. Wallerstein’s words at the end of the 20th ring as true today as they did then:
“If we were certain of the future, there could be no moral compulsion to do anything. We would be free to indulge in every passion and pursue every egoism, since all actions fall within the certainty that has been ordained. If everything is uncertain, then the future is open to creativity, not merely hu-man creativity but the creativity of all nature. It is open to possibility and, therefore, to a better world” (Wallerstein, 1998: 322).
When we do not know, we must imagine.Emotionally, intellectually and physically, humans need some form of risk and
uncertainty for motivation, interest, excitement and intellectual curiosity – all of which are ingredients for innovation, creativity and imagination. Not knowing can often motivate us and compel us forward. However, too much ‘not knowing’ can overwhelm and cause us distress. At such a point, an individual might be said to be experiencing undesirable uncertainty, unproductive or negative, associated with frustration, information overload and risks beyond the tolerable. My own research on uncertainty (Anderson, 2006) has shown that positive and negative forms (as experienced at any one moment) are inextricably intertwined but one key to work-ing through any kind of uncertainty is developing a tolerance for it. In fact, it seems that desirable uncertainty appears to emerge through the interplay between positive and negative forms in our individual practices. Thus, working with and through the uncertainties that we experience plays a critical role in creative, innovative activity.
In the ever evolving circumstances characteristic of the creative information ecol-ogy of the city, a body of research like that explored in this section suggests that tolerating uncertainty can serve a critical function for information discovery and
T. D. Anderson180
use. Furthermore, building a tolerance for uncertainties warrants support in the design of our cities and the data systems we develop to deploy in them. The holistic experience of both the positive and negative forms of uncertainty shape our ability to tolerate challenging encounters. And because productive and unproductive forms are closely bound to one another in any given situation, there is an intricacy to this positive-negative relationship to suggest that they are not easily uncoupled from one another. Acknowledging this complex positive-negative blend has implications for system design and for the training of our data specialists within such systems.
The demand for workers possessing such transformative capacity to effectively en-gage with exponential increases of information and the uncertainty characteristic of shifting knowledge landscapes is particularly acute in data-intensive environments where possessing the analytic skills one needs to manipulate data is not enough. More than a decade ago when the challenges of the digital economy sparked reports about the challenges to education, Adams (2006) and Moyle (2010), for instance, already suggested that flourishing in these new environments does not necessar-ily involve a mastery of particular tools or systems, but rather a capacity for life-long learning, experimentation and risk-taking. To derive the meaningful insights that transform data into information takes creativity and curiosity (see for instance Parmar et al., 2014).
Learning to tolerate uncertainties not only supports our creative capacities as in-dividuals and as a community; it also plays a big part in our individual and collective resilience. Creativity and resilience are both complex, process-oriented phenomena that appear closely intertwined. Both resilience and creativity are often described in terms of bendiness, elasticity and flexibility. A resilient person is one who demon-strates an ability to bounce back and perform what Masten & Powell (2003) refer to as “ordinary magic”. Luthar et al. (2000), for instance, frame resilience as a dy-namic, developmental and progressive adaptation to vulnerabilities and adversities. In experiencing and learning from adversity, new strengths emerge – and possibly new vulnerabilities as well. Creative adaptation, which Meneely & Portillo (2005) connect to agility and flexible thinking, is theoretically very close to the flexibility associated with resilience. Metzl & Morrell (2008) posit creativity as an inherent predictor and facilitator of resilience. Wolin & Wolin (2010) depict creativity as one of the seven types of resilience in their resilience mandala. It also figures strongly in Robinson’s (2010) adaptive resilience cycle.
Amabile (1998), through her research on creativity in organisational contexts, posits creative thinking as a confluence of different kinds of thinking and doing. She asserts that creativity is a function of three components: creative thinking skills, expertise and motivation (1998: 78-9). Her work suggests that nurturing creativity does not involve choosing one or the other of these components, but rather nurtur-ing creative capacities through different ways of thinking and being in context.
Keystone Practices to Enable Smart Cities to Flourish 181
Thus, applying imagination, we could argue, is a necessary skill for any profes-sional. When discussing the power of creativity, Sir Ken Robinson offers an evoca-tive perspective on the difference between imagination and creativity:
“Imagination is not the same as creativity. Creativity takes the process of im-agination to another level. My definition of creativity is ‘the process of having original ideas that have value.’ Imagination can be entirely internal. You could be imaginative all day long without anyone noticing. But you never say that someone was creative if that person never did anything. To be creative you actually have to do something. It involves putting your imagination to work to make something new, to come up with new solutions to problems, even to think of new problems or questions.“You can think of creativity as applied imagination” (Robinson, 2009: 67).
Applied imagination is one way to frame the tension between applying standards (such as those associated with effective deployment of data technologies in a smart city initiative) and breaking away from those standards in response to new and un-charted challenges in a given context.
Beyond enhancing our collective ability to be comfortable with uncertainty, building resilience into the fabric of such a creative information ecology helps a city (and its inhabitants) to productively engage with risk and adversity. Building the resilience to handle these complexities requires agility in all that we do, whether working on a task, with other people or technologies and handling information. Working effectively in hyper-coordinated and information-intensive landscapes in-evitably involves working well with both people and technologies. It also goes hand-in-hand with learning to be at one’s inventive and agile best. Critically, nurturing a creative information ecology extends beyond individual practice and learning. It flourishes through practice and in community as learners develop their individual and collective creative capacities. The agility born from shared experimentation and reformation enhances our collective capacities for skilfully handling and generating useful data.
An ecological perspective in which the focus is on understanding how and where resilience occurs is very evident in process-oriented discussions of Deakin Crick et al. (2013), Keye & Pidgeon (2013), Luthar et al. (2000), Masten & Powell (2003), Meneely & Portillo (2005), and Robinson (2010). Resilience is not something one can measure directly. Instead, as Luthar et al. (2000) assert, it is inferred by the presence of both significant risk factors and competency indicators. Through en-gaging with risk, a capacity for resilience can emerge. Similarly, through practice and making sense of experience and past knowledge, our inventiveness is nurtured. Csikszentmihalyi (1996: 28) speaks of “the work of creativity.” Metzl & Morrell (2008) draw on this transformative view of creativity as recognition of the role it can play as an agent of potential change within the process of resiliency. These theoretical connections between resilience, creativity and uncertainty suggest that engagements with creative processes and reality-based situations calling for adap-tive solutions can promote the resilient agency needed in challenging workworlds.

T. D. Anderson182
Meneely & Portillo (2005) assert that an individual exhibiting adaptable thinking is also likely to possess the flexibility necessary to design and potentially transform their domain with original and imaginative solutions.
Nurturing resilience is acknowledged as a critical component for effective learn-ing, with strong evidence of the influence resilient dispositions can have on organisa-tional and individual creativity and innovative problem solving (e.g., Deakin Crick & Goldspink, 2014; Keye & Pidgeon, 2013; Robinson, 2010; Howkins, 2009). This notion of learning power posits the learner’s engagement with information and knowledge within a framework of human-learning principles and the dynamics of complex adaptive systems. Awareness of one’s own learning power is but the starting point, as the true power emerges when this self-awareness is converted into strategies one applies to the acquisition and production of new knowledge (Deakin Crick et al., 2013). Within this learning power framework, developing one’s creative capaci-ties and critical curiosity contributes to a learner’s resilient agency (Deakin Crick & Goldspink, 2014). Learning is how we adapt, even if it means we have to take the risk of learning from mistakes.
Adaptive behaviour is a cornerstone of Howkins (2009) creative ecology, so this perspective on resilience connects very strongly with his depiction of “… a network of habitats where people change, learn and adapt.” Taking this ecological view has a profound impact on the way we engage with ideas and established facts in all areas of human understanding, and our efforts to navigate the tenuous lines between certainties-uncertainties and creativity-control. In ecological terms, resilience ena-bles one to thrive no matter what changes occur to the system. The dynamism and complexity of any urban landscape requires that we foster our abilities to be creative, innovative, anticipatory and imaginative about any situation that might emerge, especially in relation to data collected as a representation of that landscape.
SMART DATA USE IN A CREATIVE INFORMATION ECOLOGY: OPERATING PRINCIPLES FOR FLOURISHING
Building on the theoretical understandings presented in the previous sections of this essay, a resilient city has the capacity to recover quickly from challenges, con-tinuously learning in the face of uncertainty and fluidity of knowledge. This work-ing understanding forms the basis for four critical operating principles that I believe can enable a smart city to flourish.
1: Data is never complete, information never certain, but action is still required.
As the experiences of the Australian bushfires of 2019-2020 and the COVID19 pandemic remind us, data can never tell the full story. Accounts about the fire be-haviour and the limits of data modelling in light of an unprecedented crisis, for
Keystone Practices to Enable Smart Cities to Flourish 183
instance, confirmed what many firefighters already knew: that responding to a fire with sufficient speed and efficacy in spite of incomplete information calls on per-sonal experience, i.e., to develop an intuitive understanding of fire, as well as data. As discussed in earlier sections of this essay, the human capacity for imaginative problem solving and problem finding must be nurtured alongside technical know-how. David Levy wrote:
“We would seem, then, to be losing the time ’to look and to think’ at the very moment we have produced extraordinary tools for investigating the world and ourselves and for sharing our findings” (Levy, 2007: 238).
I have echoed Levy’s comments in my own work (Anderson, 2011; 2013), dig-ging deeper into the role that intuition, insight and serendipity play in idea genera-tion and scholarship. Alongside the data technologies we build to augment our ways of seeing and being in the world, we need to ensure we are also nurturing all aspects of human intelligence. We must keep the human in our technology design as we design and deploy machines that can support and extend our thinking.
2: Indecision in light of the indeterminacy of information is a threat to the resilience of an urban ecology.
Navigating risk landscapes is critical for the developmental processes described in the resilience frameworks of Luthar et al. (2000) and Metzl & Morrell (2008). We learn by doing. And we can, ironically, learn a lot more sometimes from mistakes than we can by succeeding at the first attempt. Failing at something can also be a precursor to innovation and new ideas when those experiences of failure are framed as opportunities for learning. Matson’s (1990) “Intelligent Fast Failure” is an ex-ample of a technique that seeks to naturalise the practice. Robinson (2010) asserts that organisations with the strongest adaptive resilience tend to see risk as integral. That the Society of Atomic Scientists referred to indecision as a threat to human-ity in their April 2020 Statement about the COVID Crisis (Bulletin Science and Security Board, 2020) signals that we are losing this necessary human ability to sit in and respond to uncertainty and indeterminacy. That announcement also noted that there is a risk in overestimating humankind’s ability to control the escalation of a crisis. Perhaps the increasing datafication of our world has led us into a false sense of security about the capacity of data and technology to ‘know’ our world and help us to make the ‘right’ decision.
3. Communal Wellbeing should drive the ethics of the system.
To build a resilient culture, I have argued, we need to find ways to individually and collectively engage with risk and adversity. Good governance frameworks are enabling stewarding all data assets and overseeing outcomes in line with the core values of the community. Such a framework provides the assurances of safety and security necessary to enable a community to sit (more) comfortable in uncertainties.

T. D. Anderson184
It is therefore critically important that the welfare of the most vulnerable mem-bers of any community are looked after and that multi-stakeholder perspectives figure in the governance of any data deployments. The principles of Indigenous Data Governance (IDG) offer guidance that can be applied to the welfare of the city, particularly by alerting us to the powerful controls that data can exert on the most vulnerable sectors of a community. As Carroll et al. (2019) articulate in their exploration of IDG:
“Indigenous data governance can thus be described as a reciprocal relation-ship between data for governance and governance of data. The first is a matter of quality, relevance, and access: can Native nations obtain the data they need for governance? The second is a matter of ownership and control: can Native nations manage, protect, and use that data?” (Carroll et al, 2019: 5).
Similarly, data governance in service of urban communities should enable the collection and use of accurate, relevant, and timely data for policy and decision-making, where terms, conditions and relevancy are collectively and dynamically determined. If we allow the wellbeing of a city and her inhabitants – as is so often cited as the motivation for the deployment of data technologies, and to determine the ethics of the system – then it follows that the governance of that system (and its constituent technologies and data) should be in the service of a community’s “foun-dational capacity” (Carroll et al, 2019) to make and implement strategic decisions about their affairs.
4. Design WITH the city rather than FOR the city.
Building on Boholm’s (2015) discussion of risk in my work I argue that one of the best ways to navigate uncertainty and risk is through open and honest sharing with-in trusted relationships that can support your learning and growing. Governments and leaders have a moral and social obligation to reassure the public about their management of data and analytics processes by using controls, processes and stand-ards, providing greater transparency about the way data is used, and articulating the value of any of the resulting systems and technologies they put in place (see for example discussion in OECD, 2017; Standards Australia, 2020). Approaching the governance framework for the data collected by and about the city and her inhab-itants in a manner described in the previous section can go some way to building such trust. Overseeing the data on behalf of a community, however, is insufficient on its own. Participatory approaches that get the community involved in the design process from start to finish are powerful tools for building trust into the network.
Increasingly citizens will expect to be involved in the design of the processes by which data about them is collected and used. In their 2017 article for The Conversation, Cooray and colleagues assert that
“In future, citizens will want to drive new ways of interacting with and con-suming city services by being actively involved. Therefore, providers of these services need to enable the public to contribute and create more individual-
Keystone Practices to Enable Smart Cities to Flourish 185
ised solutions in a citizen-friendly way” (Cooray et al., 2017).The Benton Report released earlier this year (Riedl, 2020) echoes these concerns,
providing examples of smart city co-building and ethical test beds involving com-munity input.
Jer Thorp’s 2016 Medium post reflects on a particular situation in which big data analysis was so removed from the high school students purportedly represented in that data that a cascading set of errors resulted in mislabelling with potentially det-rimental consequences. As he sets the scene for his discussion of ways to ‘turn the data around’ he observes:
“It’s a world that flows in one direction: data comes from us, but it rarely re-turns to us. The systems that we’ve created are designed to be unidirectional: data is gathered from people, it’s processed by an assembly line of algorithmic machinery, and spit out to an audience of different people — surveillors and investors and academics and data scientists. Data is not collected for high school students, but for people who want to know how high school students feel. This new data reality is from us, but it isn’t for us” (Thorp, 2016).
If we want to build data systems that respect the citizens from whom the data is sourced, we should be taking into account the wellbeing of people from whom the data is taken in the first place and create public, shared data spaces. Public value and public inclusion need to be foregrounded to mitigate the risk of reiterating – or worse still, amplifying – inequities and distrust in the design of government services.
CLOSING THOUGHTS: KEYSTONES ENABLING A SMART CITY TO THRIVE
As discussed in earlier sections of this paper, applying an ecological perspective to our discussion of a smart city draws attention to sociotechnical interdependen-cies, complexity and ever evolving networks of action. And, as I have asserted in the previous section, respecting all members of that urban ecology as first-class citizens means designing smart city technologies WITH the city’s inhabitants and not sim-ply seeking to design with their welfare in mind. Staying with this ecological per-spective, I close this essay with reflection on some practices that we can put in place to set us up for success as flourishing, creative, learning, compassionate cities capable of harnessing the full productive potential of data technologies.
Within any ecology, it is also possible to identify keystone species. Like the key-stone at the apex of a masonry arch, the strength and security of keystone species shapes the overall health of the ecosystem; and trust is a keystone for building and maintaining a flourishing modern city.
Global communications firm Edelman has been studying trust for twenty years, sharing their findings through the Edelman Trust Barometer and ongoing global surveys. Their 2020 findings on trust in business, government, media and NGOs reveal an erosion of trust in all four sectors, which Edelman attributes to
T. D. Anderson186
“...people’s fears about the future and their role in it, which are a wake-up call for our institutions to embrace a new way of effectively building trust: balancing com-petence with ethical behavior”. (https://www.edelman.com/trustbarometer)
As my own explorations in this matter have shown, there is a link between vul-nerability, uncertainty and trust. Trust is what allows us to move beyond doubt and into a more productive and positive engagement with the unknowns of our worlds – in the present and in our possible futures. We are more likely to tolerate the un-certainty of any situation we face when we have a sense of trust about the people or setting involved. In the early stages of the declaration of the global COVID-19 pandemic, consulting firm McKinsey made similar observations:
“In crises, the state plays an essential and expanded role, protecting people and organizing the response. This power shift transforms long-held expecta-tions about the roles of individuals and institutions” (Craven et al., 2020).
In light of this erosion of trust, they argue, a rethinking of the social contract is taking place. These comments are consistent with the observations presented earlier in this essay about the growing demand for digital inclusion and socially-responsible technology. In line with this concern, I propose five Keystone Practices for creating this critical climate of trust:
• Community• Civility• Communication• Connection• Commitment
The notion of Community has permeated this essay. An urban ecology is by very definition a communal entity. If we are to preserve and protect the fragile ecology of our modern cities as we look to data and technology to help us tackle the wicked problems of our time, the complexity of all these constituent parts needs to be front of mind. Civility involves showing mutual respect and empathic understanding. Alongside the erosion of trust we are witnessing a rise in hate-speech and efforts to shut down opposing viewpoints. As noted earlier about the perception of risk and tolerance of uncertainty, in the midst of our contemporary uncertainties, such behaviours are detrimental. It is increasingly recognised that listening shows lead-ership. One does not need to agree with another’s point-of-view to listen to their concerns. Ensuring there are platforms for civil discourse where ALL members of a community listen to and learn from the concerns and fears of others is a keystone practice. Following on from civility, Communication that is consistent and hon-estly presents not only what is known, but what is not known (aka: uncertain). For a government or the leadership of a city, for instance, practicing open, honest and consistent communication about reasons for taking specific actions contributes to the transparency about the decisions undertaken for and on behalf of citizens. Furthermore, communication must run both ways – which returns us to the value of listening and seeking out the views of others. Connection points to deeper un-
Keystone Practices to Enable Smart Cities to Flourish 187
derstanding about and appreciation of the complexities of our world, and to the role that intuitive understandings play in our individual and collective sensemak-ing, connecting to the world around us. Indigenous knowledge perspectives speak about grounding in country (locality). Such principles for country-centred design grounded in the deeply abiding practices of first nation peoples is not only a way to pay respect to the land and her inhabitants but also to sensitise us to forms of evidence that extend beyond what might be directly visible at any point in time. Commitment points to the need for professionalism. Linking back to the discus-sion about the role that competence plays in trust building, as data professionals we need to nurture social and technical competencies; creative and analytic; communal and individual. Building on the earlier point about civility, it involves patience and persistence, as well as listening. Consequently, there must be a commitment to com-munication in line with the mechanisms for feedback Thorp (2016) describes.
Supporting these six keystone facets of an urban ecology can create a city that is ‘smart’, sustainable and compassionate. Reflecting on recent displays of leader-ship, New Zealand Prime Minister Jacinda Ardern’s landslide re-election victory in October 2020 points to growing appreciation for empathic and inclusive leader-ship displaying these qualities. Thus, the keystones presented here for building the trusted partnerships are necessary to create the ‘smart city’ data technology and urban data ecology.
NOTES
1. See https://www.abc.net.au/news/science/2020-03-05/bushfire-crisis-five-big-numbers/12007716.
2. See news reports of the scale of the firestorms such as: https://www.abc.net.au/news/2020-01-03/scientific-modelling-not-coping-with-current-bushfires/11839356.
3. Story about returning WW1 soldiers placed into quarantine in Manly: https://www.dailytelegraph.com.au/newslocal/manly-daily/troops-returned-from-hell-of-war-to-the-flu-terror-and-snakeinfested-quarantine/news-story/f7ad25b6c0fa40c98058f76d2a63126e.
4. The Editor of the Bulletin provides the following explanation of the Doomsday Clock’s origins: “Founded in 1945 by University of Chicago scientists who had helped develop the first atomic weapons in the Manhattan Project, the Bulletin of the Atomic Scientists created the Doomsday Clock two years later, using the imagery of apocalypse (midnight) and the contemporary idiom of nuclear explosion (countdown to zero) to convey threats to humanity and the planet. The decision to move (or to leave in place) the minute hand of the Doomsday Clock is made every year by the Bulletin’s Science and Security Board in consultation with its Board of Sponsors, which includes 13 Nobel
T. D. Anderson188
laureates. The Clock has become a universally recognized indicator of the world’s vulnerability to catastrophe from nuclear weapons, climate change, and disruptive technologies in other domains.” https://thebulletin.org/doomsday-clock/current-time/#full-statement.
5. The term creativity is not formally defined in this paper but falls within the scope of discussion within the Adelphi Charter (Royal Society, 2006) and the creative ecology portrayed by Howkins (2009: 9), who contends that creativity ‘can be described but not defined and indeed has always been conditional’.
6. See for instance press releases here: https://smart-cities.com.au; http://smartcities.gov.in/content; https://israelsmartcities.org; https://www.transportation.gov/smartcity.
7. See: http://playnpause.org for a brief encapsulation of these four phases states.8. See for instance https://www.abc.net.au/news/2020-01-03/scientific-modelling-
not-coping-with-current-bushfires/11839356. https://www.abc.net.au/news/2020-03-17/coronavirus-cases-data-reveals-how-covid-19-spreads-in-australia/12060704.
9. See for instance: https://www.smh.com.au/national/is-jacinda-ardern-the-world-s-most-effective-leader-20200507-p54qp7.html; https://www.aljazeera.com/news/2020/11/2/jacinda-ardern-names-incredibly-diverse-new-zealand-cabinet.
REFERENCES
Adams, K. (2006) The sources of innovation and creativity: A paper commissioned by the National Centre on Education and the Economy for the New Commission on the Skills of the American Workforce. September 2005. Retrieved from http://www.fpspi.org/pdf/innovcreativity.pdf.
Amabile, T. M. (1998) How to kill creativity (cover story). Harvard Business Review, 76(5): 76-87.
Anderson, T.D. (2006) Uncertainty in action: Observing information seeking within the creative processes of scholarly research. Information Research, 12(1) paper 283. Available at http://InformationR.net/ir/12-1/paper283.html.
-----. (2010) Mobile design: Giving voice to children and young people. In: Donald, S. H., Anderson, T. D., & Spry, D. (Eds.). Youth, society and mobile media in Asia. London: Routledge. 135-151.
-----. (2011) Beyond eureka moments: Supporting the invisible work of creativity and innovation. Information Research. 16(1) paper 471. http://InformationR.net/ir/16-1/paper471.html.
-----. (2013) The 4Ps of innovation culture: Conceptions of creatively engaging with
Keystone Practices to Enable Smart Cities to Flourish 189
information. Information Research, 18(3) paper C28. Available: http://www.informationr.net/ir/18-3/colis/paperC28.html.
Bateson, G. (1987) Steps to an Ecology of Mind. Northvale, NJ & London: Jason Aronson.
Boholm, A. (2015) Anthropology and Risk. London: Routledge.Bulletin Science and Security Board (April 15, 2020) “COVID-19 and the
Doomsday Clock: Observations on managing global risk”, Available: https://thebulletin.org/2020/04/covid-19-and-the-doomsday-clock-observations-on-managing-global-risk/
Bush, V. (1945, July) As we may think, The Atlantic Monthly, 176(7), 641-649. Retrieved from http://www.theatlantic.com/magazine/archive/1969/12/as-we-may-think/3881/
Carroll, S. R., Rodriguez-Lonebear, D., & Martinez, A. (2019) Indigenous Data Governance: Strategies from United States Native Nations. Data Science Journal, 18(1), 31. DOI: http://doi.org/10.5334/dsj-2019-03
Cooray, M., Duus, R., & Bundgaard, L. (2017, Aug 23) Technology is not Enough to Create Connected Cities – Here’s why. https://theconversation.com/technology-is-not-enough-to-create-connected-cities-heres-why-82740
Craven, M., Mysore, M., Singhai, S., Willson, M. (2020) McKinsey COVID-19: Briefing note #5, April 13, 2020, https://www.mckinsey.com/business-functions/risk/our-insights/covid-19-implications-for-business
Csikszentmihalyi, M. (1996) Flow and the Psychology of Discovery and Invention. Harper Perennial, New York.
Deakin Crick, R. & Goldspink, C. (2014) Learner dispositions, self-theories and student engagement. British Journal of Educational Studies, 62:1: 19-35.
Deakin Crick, R., Haigney, D., Huang, S., Coburn, T. & Goldspink, C. (2013) Learning power in the workplace: The effective lifelong learning inventory and its reliability and validity and implications for learning and development. The International Journal of Human Resource Management, 24:11, 2255-2272.
European Commission. (2010) Unlocking the potential of cultural and creative industries. Green Paper, Brussels, COM(2010)183. Retrieved from http://ec.europa.eu/culture/our-policy-development/doc/GreenPaper_creative_industries_en.pdf.
Florida, R. (2001) The Rise of the Creative Class. New York: Basic Books.-----. (2012) The Rise of the Creative Class, Revisited, New York: Basic Books.Green, B. (2019a) Cities are not technology problems: What smart cities companies
get wrong. Metropolis, 4 March 2019. Available: https://www.metropolismag.

T. D. Anderson190
com/cities/ben-green-smart-enough-city/-----. (2019b) The Smart Enough City: Putting Technology in its Place to Reclaim Our
Urban Future. Boston: The MIT Press.Green, H. & Hannon, C. (2007) Their space: Education for a digital generation
[Pamphlet] Retrieved from http://www.demos.co.uk/files/Their%20space%20-%20web.pdf.
Hill, Adrian V (ed.) (2020) Foundries of the Future: A Guide to 21st Century Cities of Making. With contributions by: Ben Croxford, Teresa Domenech, Birgit Hausleitner, Adrian Vickery Hill, Han Meyer, Alexandre Orban, Víctor Muñoz Sanz, Fabio Vanin and Josie Warden. Delft. TU Delft Open, 2020.
Howkins, J. (2009) Creative Ecologies: Where Thinking is a Proper Job. St. Lucia, Queensland: University of Queensland Press.
Jones, B. (1984) Facing the brave new world: Will the sleepers wake in time?” In Randell, S. (ed.). The Human Face of Technological Change: Theme Papers from the Silver Jubilee Conference of the Australian College of Education (25th, Australian Capital Territory, Canberra, May 5-9, 1984). Carlton VIC: Australian College of Education. pp. 13-20. ISBN 0909587329.
Keye, M. D., & Pidgeon, A. M. (2013) Investigation of the relationship between resilience, mindfulness, and academic self-efficacy. Open Journal of Social Sciences, 1(06): 1-4.
Levy, D. M. (2007) No time to think: Reflections on information technology and contemplative scholarship. Ethics and Information Technology, 9(4): 237-249.
Luthar, S. S., Cicchetti, D., & Becker, B. (2000) The construct of resilience: A critical evaluation and guidelines for future work. Child development, 71(3): 543-562.
Maguen, S., Papa, A., & Litz, B. T. (2008) Coping with the threat of terrorism: A review. Anxiety, Stress & Coping, 21(1): 15-35.
Masten, A. S., & Powell, J. L. (2003) A resilience framework for research, policy, and practice. In S.S. Luthar (Ed.) Resilience and vulnerability: Adaptation in the Context of Childhood Adversities New York: Cambridge University Press, 1-25.
Matson, J. V. (1990) Failure as part of the success equation. The Journal of Creative Behavior, 24(4): 275-278.
Mecklin, John (Editor) (2020) Closer than Ever: It is 100 seconds to midnight. 2020 Doomsday Clock Statement, Science and Security Board Bulletin of the Atomic Scientists Editor, John Mecklin. https://thebulletin.org/wp-content/uploads/2020/01/2020-Doomsday-Clock-statement.pdf;https://thebulletin.

Keystone Practices to Enable Smart Cities to Flourish 191
org/doomsday-clock/current-timeMeneely, J., & Portillo, M. (2005) The adaptable mind in design: Relating
personality, cognitive style, and creative performance. Creativity Research Journal, 17(2-3): 155-166.
Metzl, E. S., & Morrell, M. A. (2008) The role of creativity in models of resilience: Theoretical exploration and practical applications. Journal of Creativity in Mental Health, 3(3): 303-318.
Ministry of Housing & Urban Affairs, Government of India (2020) Climate Smart Cities Assessment Framework 2.0, Available https://smartnet.niua.org/csc/assets/pdf/CSCAF_2_Booklet.pdf
Moyle, K. (2010) Building innovation: Learning with technologies. Australian Education Review, Number 56. Retrieved from http://research.acer.edu.au/aer/10.
Nardi, B. & O’Day, L. (1999) Information Ecologies: Using Technology with Heart. Cambridge, MA: MIT Press.
Newbigin, J. (2010) The Creative Economy: An Introductory Guide. British Council’s Creative And Cultural Economy Series, London: British Council. Available. https://creativeconomy.britishcouncil.org/media/uploads/files/English_GuideToolkit_30_withCoverLR.pdf
OECD (2017) Embracing Innovation in Government Global Trends. World Government SummitDubai, United Arab Emirates, 12-14 February 2017 Available:https://www.oecd.org/gov/innovative-government/embracing-innovation-in-government.pdf
----- (2020) Smart Cities and Inclusive Growth. Building on the outcomes of the 1st OECD Roundtable on Smart Cities and Inclusive Growth. Available: https://www.oecd.org/cfe/cities/OECD_Policy_Paper_Smart_Cities_and_Inclusive_Growth.pdf
Parmar, R., Mackenzie, I., Cohn, D., & Gann, D. (2014) The New Patterns of Innovation. Harvard Business Review, 92(1-2), 86-95.
Pratt, A. C. (2012) A world turned upside down: The creative economy, cities and the new austerity. In: A. Beauclair & E. Mitchell (Eds), Smart, Creative, Sustainable, Inclusive: Territorial Development Strategies in the Age of Austerity,. Brighton: Regional Studies Association, 13-19.
Riedl, Denise Linn (June 2020) Toward Inclusive Urban Technology. Evanston, IL: Benton Institute for Broadband & Society. https://www.benton.org/publications/inclusive-urban-tech
Robinson, K. (2009) The Element (written with Lou Aronica). London: Penguin.
T. D. Anderson192
Robinson, M. (2010) Making adaptive resilience real. Arts Council, England. Available http://www.artscouncil.org.uk/media/uploads/making_adaptive_resilience_real.pdf.
Royal Society for the Encouragement of Arts Manufactures & Commerce (RSA) (2006) Promoting Innovation and rewarding creativity: A Balanced Intellectual Property Framework for the Digital Age. London: RSA.
Standards Australia (2020) Smart Cities Standards Roadmap, available: https://www.standards.org.au/getmedia/bfe42f98-011e-4798-8fa5-5b70c8a2a6bd/SA_Smart_Cities_Roadmap.pdf.aspx)
Tims, C. & Wright, S. (2007) So What Do You Do? A New Question for Policy in the Creative Sector. London: Demos. Retrieved 30 September, 2013 from http://creative-blueprint.co.uk/library/item/so-what-do-you-do.
Thorpe, J, (2016, 19 Nov) Turning Data Around, Medium, Available: https://medium.com/memo-random/turning-data-around-7acea1f7479c
Wallerstein, I. (1998) Uncertainty and creativity. The American Behavioral Scientist, 42(3): 320-322.
Wolin, S. J., & Wolin, S. (2010) The Resilient Self: How Survivors of Troubled Families Rise Above Adversity. New York: Villard.
Wright, S., Newbigin, J., Kieffer, J., Holden, J. & Bewick, T. (Eds) (2009) After the Crunch, Creative & Cultural Skills and Counterpoint, British Council Think Tank. Retrieved from:http://creativeconomy.britishcouncil.org/media/uploads/resources/russia-projects-creative-economy-after-the-crunch.pdf.
Smart Tourism Cities and Sustainability 193
Big, Thick, Small and Short - The Flaws of Current Urban Big Data Trends
Geography Research Forum • Vol. 40 • 2020: 193-206.
* Faculty of Architecture and Town Planning , The Technion Institute of Technology, Haifa, Israel; and CEO-Suits LTD, Israel. [email protected]
Rafi Rich*The Technion
The last decade of the 20th century, as the internet emerged, saw a data revolu-tion. Relatively cheap digital storage and over 1.5 billion gigabytes of available data that could now be used. This also created new challenges; new types of data, coined in 2001 as “Big Data” (due to its three-dimensional characteristics): Vol-ume, Velocity and Variety (Laney, 2001), has to be managed differently. Many cities and city planners hailed the new revolution as the ultimate solution for urban problems. Unfortunately, there is little evidence that data centered cities are succeeding in overcoming urban challenges. In fact, there is a growing un-derstanding that in order to infuse data centered decision making, specifically in urban planning, new models and processes, designed by and for cities are needed. This article examines the origins and the evolution of current Big Data and Smart City trends, from the development of Forrester’s System Dynamic Model, through the emergence of the data corporations and the introduction of the Smart City Model. The analysis depicts how the Big Data actors determine the framing of urban data utilization and alternate ways of collecting and utilizing data for urban management and planning, more in tune to the needs and features of cities in the 21st century.Keywords: Big Data, System Dynamics, Smart city, Thick Data, Urban Dynam-ics, Urban Planning, Civic Engagement
In recent years, ‘smart city’ has become one of the terms commonly used by mayors and managers to present their advanced, innovative agenda and activities. Similarly, as data has been coined ‘the new oil’, cities have been embracing sensors and big data for the benefit of better-informed city leaders and optimization of urban services. However, there is little evidence that these investments actually con-tribute to reducing urban stresses or enhancing economic growth for all. One of the main reasons for this is the over-reliance on big data and lab-based concepts, which are unsuitable for most urban scenarios. While it is true that evidence-based man-agement may improve our cities, the path chosen by many cities since the beginning of the smart city movement has echoed general technological advancement, fit for

194 R. Rich
commercial, scientific and industrial arenas, rather than creating new models and processes designed for cities and based on local needs and policies.
This article examines the origins and the evolution of current big data and smart city trends, focusing on the historical role of IBM and the theory of System Dynamics in determining current flawed urban data analysis. The article proposes a more feasible process of collecting and utilizing data for urban management and planning, more in tune with the needs and especially the capacities of 21st century cities and communities.
IBM & CISCO’S FIRST STEPS
Data has been utilized in cities as early as 1849, when William Farr created a data-based research, examining the urban aspects of the cholera outbreak, but only in the 20th century did data become part of urban decision making. In 1974, Los Angeles published its data based urban analysis of Los Angeles (Los Angeles Community Analysis Bureau, 1974), created to improve housing decisions (Vallianatos, 2015), and RAND institute assisted NYC in optimizing fire response between 1967-1974 (Flood, 2010). However, our focus on the role of IBM in the current era of smart cities and urban data strategies is a result of interest by commercial tech vendors, imitated by IBM, in the beginning of the 21st century.
In 2008, IBM launched the ‘smarter planet’ initiative as a new strategic agenda for progress and growth amid the global economic crisis, through “instrumenta-tion, interconnectedness and intelligence”. The vision was to “inject” computational powers into everything as a system of systems – an internet of things (IoT) produc-ing oceans of raw data and processing it through IBM’s tools. As part of this strategy, IBM launched in 2009 the Smarter Cities campaign, proposing a “comprehensive approach to helping cities run more efficiently, save money and resources, and im-prove the quality of life for citizens” (IBM, no date).
This goal was attained by introducing a new analytics software and services, named ‘System Dynamics for Smarter Cities’:
”…To help planners and policy makers better understand and manage the dynamic behavior of cities…an interactive model that allows leaders to ob-serve how the core systems of a city – such as the economy, housing, educa-tion, public safety, transportation, health care, government services and utili-ties – work together and affect one another (IBM, 2011)1.
However, while Cisco launched a similar initiative only a year after IBM2, for several years both competed as the smart city leaders3. Although, later, other tech companies followed, the IBM model is the most dominant smart city approach, based on a controversial application of business and industrial theory of MIT pro-fessor Jay Forrester, to urban and social issues since the late 1950’s.
Big, Thick, Small and Short - The Flaws of Current Urban Big Data Trends 195
FORRESTER AND URBAN DYNAMICS – FROM U.S. NAVY SIMULATORS TO CITIES
Jay W. Forrester, an MIT professor (1918-2016), pioneered computational sim-ulations, designing computer-based aircraft simulators for the U.S. navy, which evolved into the design of the “whirlwind digital computer”, the first digital com-puter, built for experimental development of military combat information sys-tems. This computer was a key component in the development of the U.S. Semi-Automatic Ground Environment (SAGE) in the later 1950’s, built and integrated by IBM. SAGE coordinated data from many radar sites and processed it to produce a single unified image of the airspace over a wide area to enable coordinated U.S. air defense during the cold war (Forrester, 1989). When Forrester left engineering to accept a post at Sloan School of Management in MIT, his research and activities were focused on exploring this idea of coordinated systems, or ‘system of systems’, by applying computing and mathematical models to understand complex business and industrial systems and their potential flows and actions focused on predicting possible outcomes.
This model, developed in the late 1950’s, was called System Dynamics, and published initially in 1958, as an article called ‘Industrial Dynamics – A Major Breakthrough for Decision Makers’ in Harvard Business Review (Forrester, 1978). Forrester recalls:
“For that article I needed computer simulations and asked Bennett4 just to code up the equations so we could run them on our computer. However, Dick Bennett was a very independent type. He said he would not code the program for that set of equations but would make a compiler that would automatically create the computer code. He called the compiler “SIMPLE,” meaning “Simulation of Industrial Management Problems with Lots of Equa-tions. Bennett’s insistence on creating a compiler is another of the important turning points; it accelerated later modeling that rapidly expanded system dynamics” (Forrester, 1989).
While this action became one of the accelerators of business oriented computer simulations, it also gave place to the future over-reliance on lab-based policies, and structuring of problems and challenges so that they may fit into simplified equa-tions, as in the future evolution of system dynamics into urban and social issues.
In 1968, the Mayor of Boston, John Frederick Collins, was invited to take a post of visiting professor of urban affairs at MIT. As the occupier of the office next door to Forrester’s, they began discussing urban problems. Forrester decided to explore the potential of his system dynamics model to solve urban complexities. In 1969, Forrester published the book Urban Dynamics, which considered how system dy-namics could be used to understand America’s urban crisis (Forrester, 1969).
“The problems of our aging urban areas are examined here by using recently developed methods for understanding complex social systems...the nature of the urban problem, its causes, and possible corrections are examined in terms

196 R. Rich
of interactions between components of the urban system” (Forrester, 1969, ix).“Our social systems are far more complex and harder to understand than our technological systems. Why, then, do we not use the same approach of making models of social systems and conducting laboratory experiments on those models before we try new laws and government programs in real life” (Forrester, 1971, 226).
Through repeated computer simulations, Forrester analyzed the changing ratios of (generic) critical urban development factors such as population, housing, and industry, and showed how the changes would affect a city’s growth.
Forrester believed that systems seek to be in equilibrium, and therefore actions lead to “Boom & Bust Effect” as the city seeks to regain its equilibrium. Based on these lab-based models, he stated (gaining controversy and negative attention) that low-cost housing and job training are wrong strategies, because they will lead to other problems such as overpopulation and greater tax demands on the underem-ployed, therefore they will create a vicious cycle of city failure.
While laboratory models may have enabled crystallized answers to urban prob-lems, real-life trials in the 1970’s (mostly in cities close to the MIT Urban Dynamics Lab), were rejected by governmental departments, city officials and planners. Louis E. Alfeld, the director of the Urban Systems Lab at the time, wrote about these tri-als, twenty years later, explaining the failure due to lack of interest and conservatism:
“the members [of the HUD committee] had neither the time nor the inclina-tion to study system dynamics…Since the committee, trained in traditional econometric modeling, would not accept any of the model relationships without support from solid literature references or published data, they es-sentially rejected everything” (Alfeld, 1995a, 199).
But Alfeld also admitted that the models lacked flexibility and lacked a robust connection to the ‘field’:
“… by attempting to rebalance all of the forces at a single stroke, we placed ourselves outside the bounds of political realism. Acceptable answers, alter-native trade-off options, and consensus building (instead of criticism) could have produced a successful outcome (Alfeld, 1995b, 204).
This Notion was echoed in Forrester’s own recount in 1993 of the history of urban dynamics.
“...There is an unwillingness to accept the idea that families, corporations, and governments belong to the same general class of dynamic structures as do chemical refineries and autopilots for aircraft… The concept of a system implies that people are not entirely free agents but are substantially responsive to their surroundings” (Forrester, 1993, 7).
Lacking urban planning or social sciences background, the main error of Forrester’s urban dynamics was the over-simplification of people and communities, comparing urbanism to industry and human decision to factory assembly lines.
Big, Thick, Small and Short - The Flaws of Current Urban Big Data Trends 197
While machines and financial systems seek equilibrium, people and communities seek joy, satisfaction and gratification.
Forrester’s wish to identify exact numbers and equations for each urban chal-lenge may have enabled simulations and “right’s and wrong’s” ((later ech-oed in the popular game SIMCITY (Starr, 1994), and in current trends of City-information Modelling)). It was based on the idea that people are not “free agents” and therefore their actions may be predicted and influenced. People are indeed “social animals” preferring to be part of a group or a commu-nity, they respond to their surroundings, but this response is emotional, rather than mechanical. People are free agents, but they may choose to be part of a structured community, while still making their own decisions, and therefore are not necessarily predictive or measurable, as urban dynamics suggests.
One of the reasons that the real-life trials of urban dynamics failed was lack of evidence and sufficient data to engage planners and civic leaders. But the fact was that when IBM returned to urban dynamics with the “Smarter Cities” campaign 40 years later, they made the same mistakes, even though they had access to larger and more complex data. This flawed structuring and simplification of cities and people, originating with IBM, determined that cities and people are part of a “structure”, and caused the downfall of Forrester’s theory and will probably fail currently, 40 years later.
IBM, DATA AND THE (NEW) SYSTEM DYNAMICS
The last decade of the 20th century, as the internet emerged, saw a data revo-lution: relatively cheap digital storage and over 1.5 billion gigabytes of available data that could now be used. This also created new challenges; new types of data, coined in 2001 as “Big Data” (due to its three-dimensional characteristics): Volume, Velocity and Variety (Laney, 2001), has to be managed differently.
At the time, IBM was in the midst of shifting the business focus from hardware to software, taking a major role in creating services to manage, “crunch” and analyze data. This new potential to create new knowledge, due to access to data, and the potential of creating “sophisticated analytics and algorithms that could make sense of it all” became the core component in launching the ‘Smarter Planet’ initiative, IBM’s growth strategy in 20085. In 2008, Wired published an inspirational article titled: ‘The End of Theory: The Data Deluge Makes the Scientific Method Obsolete’ (Anderson, 2008). The article by the magazine’s editor in chief, Chris Andersen, proposed Big Data as a substitute to science as we know it:
“This is a world where massive amounts of data and applied mathematics replace every other tool that might be brought to bear. Out with every theory of human behavior, from linguistics to sociology. Forget taxonomy, ontology, and psychology. Who knows why people do what they do? The point is they do it, and we can track and measure it with unprecedented fidelity. With

198 R. Rich
enough data, the numbers speak for themselves” (Anderson, 2008).Andersen proposed to stop using data to improve existing scientific methods, and
instead, change scientific methods by relying on new access to large quantities of relevant data. Andersen closes the article by stating: “There’s no reason to cling to our old ways. It’s time to ask: What can science learn from Google?”
At the same year, 2008, influenced by the financial crisis, IBM sought to create new markets by focusing on government, and introduces the ‘smarter cities’ cam-paign. However, contrary to the proposal made by Wired to embrace new scientific models, IBM chose to revive ‘system dynamics’, hoping to achieve better results than Forrester, through cheaper and more sophisticated data collection, storage and analysis, introducing a new urban dynamic which is more responsive and evidence-based.
In 2011, IBM announced their first smart city partnership with the city of Portland, introducing the ‘system dynamic for smarter cities platform’ as “an in-teractive model of the relationships that exist among the city’s core systems” (IBM Press Release, 2011).
“…a simulation model and decision support system for city leaders with pre-dictive capabilities, the model offers the ability to create countless what-if scenarios that show the impact including positive and negative consequenc-es then a proposed policy decision could have on the city and its citizens.” (IBM, 2011)
In Fast Company magazine, Greg Lindsay criticized the ambitions of the plat-form and over-reliance on data and algorithms, in an article titled “IBM Partners with Portland to Play SimCity For Real”:
“Systems Dynamics for Smarter Cities, tries to quantify the cause-and-effect relationships between seemingly uncorrelated urban phenomena. What is the connection, for example, between public transit fares and high school gradu-ation rates? Alternatively, obesity rates and carbon emissions? To find out, simply round up experts to hash out the linkages, translate them into algo-rithms, and upload enough historical data to populate the model. Then turn the knobs to see what happens when you nudge the city in one direction”. (Lindsay, 2011)
The 2011 Portland campaign which was to be part of Portland’s stra-tegic plan, failed, as Forrester’s 1970’s real life trials, to transfer the math-ematics and aggregation of numerous datasets to real urban impact. Anthony Townsend, in his influential book ‘Smart Cities: Big Data, Civic Hackers, and the Quest for a New Utopia’, explained:
“IBM developed a computer model of Portland that dwarfed Forrester’s ‘Sys-tem Dynamics for Smarter Cities’, as the apparatus was blithely named, wove together more than three thousand equations. Forrester’s had used just 118 (only 42 of which, a subsequent analysis determined, really shaped the re-sults). On a website used to interact with the model, diagrams reminiscent of those in Urban Dynamics dissected the city into a spaghetti-like tangle of interacting variables… a spiderweb of relationships that quickly ballooned

Big, Thick, Small and Short - The Flaws of Current Urban Big Data Trends 199
to over seven thousand equations (a number that was deemed too complex), was pruned back to six hundred (too simple), and then eventually built back up to the roughly three thousand contained in the final revision.” (Townsend, 2013, 80)
While Forrester’s model gave debatable predictions, the new IBM’s model, with much more data and algorithms, produced even more simplistic predictions such as linking cycling to the reduction of carbon emission and obesity. While the results may have been a tactical marketing decision to improve municipal acceptance, they failed to influence more cities to choose the system.
“The challenge for models like these in the future will invariably lie in better balancing the value gained (which is still too small) with the effort required by the city to maintain and operate it (still too high)”(Townsend, 2013, 85).
However, although IBM’s gamble on complex data analytics failed, IBM’s pri-macy in smart cities led to the fact that practically every smart city project since built upon this experience, using, collecting and analyzing big data that add little or no value.
THE PROBLEM WITH DEFINING BIG DATA
One of the primary problems with data and cities is that the term Big Data is incorrectly used, mistaking any ‘data’ as ‘big’ and every analysis of data as big-data analytics. The result of this branding of data is that there is too little discussion about the role of data in civic management, what kind of data is essential and how it can be managed.
From the technical perspective, big data, as coined by Doug Laney in 2012 at Gartner, related initially to the challenge of managing and using vast amounts of available data (the three “V”s)6. Over the years, more “V”s were added (in 2019 researchers identifies up to 51 “V”s (Rijmenam, 2013), among them, four relate to the urban context:
• Veracity and Variability – representing variation in data flows and data sources imposing a need to clean, validate and transform data from different sources to make sense;
• Visualization – making vast amounts of data easy to understand, read and act upon;
• Value – representing a variance of importance between certain data volumes.Big data, according to Laney (, relates to amounts of data, but size is not the
main factor. The main issue in Big Data is the complexity of collecting, managing and validating the data. This complexity is the largest barrier to making sense of this data, towards real value creation. While many cities still see Big Data mainly as large data-sets that may be used to understand current and future trends, they miss the real opportunity to use data as part of urban policies, neglecting a discussion regard-

200 R. Rich
ing what data needs to be collected (and how) and how such data may influence decision making and urban sustainability and resilience. This size-based definition has been influenced by tech vendors such as IBM and, by national and global policy makers that need statistically oriented global data, rather than localized complex information.
In 2017, The World Bank published a report on big-data and government, defin-ing Big Data as “the exponential growth of data, particularly the data flowing from ubiquitous mobile phones, satellites, ground sensors, vehicles and social media” (World Bank, 2017, 1). The report explains the potential of Big Data in service de-livery, policy-making and citizen engagement, and calls for governments to be active by producing more data sets, consuming Big Data to create responsive governments, and facilitating usage and creation of Big Data by investing in research and steward-ship as well as promoting relevant strategies.
However, the World Bank’s definition of Big Data focuses on growth (in size) of data and the expressed interest and motivation for more responsive governments by collecting, storing and analyzing big amounts of data, to enable statistic and comparative data (between cities and states), to ensure transparency and financial governance. Such focus is relevant for global governance but has less value for na-tional governments and very little value for local authorities, since it focuses on large quantities instead of depth of data essential for actions.
While global organizations need data to compare between countries and regions, to define how and where to finance infrastructure, central governments need data to manage nation-wide infrastructure loads (such as energy, transportation etc.) and to enable regional execution and budgeting of such structures. City leaders, need data to surmise real demands based on localized data, such as population per bus stops, how many people do not have alternatives to public transportation due to age, disabilities or any other reason, or suffer from energy or digital poverty, and what actions are needed (and where) to reduce such exclusion as well as encourage behavioral change. While cities need to develop inclusive solutions that may call for tailor-made actions due to difference in culture, and demography of socio-economic backgrounds, national governments chose nation-wide strategies that rarely differ between cities and regions.
Due to these differences, it may be wrong to copy data trends – either from the business sector that seek big data to enable continuous calibration of the equilibri-um of systems through complex and varied data sets, or from national or global bod-ies that seek large data to enable balanced management and transparency through large quantities of statistical data. In many ways, needs for data in cities are similar in complexity to the needs of businesses, as the lack of correct data is crucial in both. However, while businesses are privately owned and have to answer only to the law and stock owners, data collected, managed and used by local authorities greatly impacts human lives and welfare, economic resilience of the local businesses and the future of the environment within city boundaries.
Big, Thick, Small and Short - The Flaws of Current Urban Big Data Trends 201
As cities are civic entities, they are obligated to their stakeholders and commu-nity, and need to create guidance to ensure these strictures, the EU translated this dilemma into regulations to guide data providers7. In 2013, the city of Copenhagen, decided to invest in the creation of a marketplace for the exchange of public, and private sector data. The Hitachi Corporation won the tender for this enterprise and worked together with the city and with the region in order to create a cooperative and transparent data platform. The report of the project identifies three key drivers for success:
• Start with the use case, as it is key to engage the data community that will use the data;
• Create a data competence hub, where the data community can meet and get support;
• Create simple standards and guidelines for data publishing (Municipality of Copenhagen, 2018).
This was an innovative approach to test the readiness of the market to deliver new data-sharing solutions and to establish regulations and data security measures. Despite the experience and success of cities such as Copenhagen to provide effec-tive data management, smaller, and less prosperous cities (that are less attractive for global companies such as Hitachi), may accede to private sector’s ‘data miners’ that could abuse the public interest and substantially compromise the value of such data.
Due to these challenges, biases and financial and organizational burdens, it is es-sential that cities create their own urban data strategy. This will be aimed at defining what should be collected and managed, how and by whom, based on the unique character and capacity of the local authority, as well as the culture, level of trust and collaborative opportunities within the city. Such strategy should enable a clear view of what really has to be collected (and where) and what are the prices to be paid (which are worthwhile for the city and its residents). As costs and logistics are large obstacles to urban data based governance (as well as the consequences of managing such complex data), there is another, much less intrusive and costly approach to data that should be considered - Thick Data.
THICK DATA
While Big Data delivers answers in ‘big numbers’ that facilitate understanding of “what” happened, it constantly fails to explain “why” an occurrence occurs. Big Data can indicate exactly where car accidents happen, or in which street in the same neighborhood families prefer to live; it will not reveal the reason why this occurs. System dynamics as well as current day artificial intelligence (AI) tools can predict future urban patterns that can propose and influence urban decisions based on algorithms or machine learning, but they fail to reveal the urban dynamics that compound the situation. Urban situations are based on a complex choreography
202 R. Rich
between cultures, needs, places and trends, which may vary over time, age group or political affiliations (going generations back). Predictive analytics are limited in pre-dicting the preference of individuals or a community, even if the best historical data has been collected and analyzed. While such data may generate a large part of the answer, it misses the qualitative aspects that complete the picture needed for urban decision makers and planners.
Tricia Wang, a global tech ethnographer, was one of the first to coin the term “Thick Data”, following her research for Nokia in China in 2009 (Wang, 2013). Wang spent time with migrants, street vendors and internet café users, talking to them and digging deeply into their stories. She concluded that low-income con-sumers were ready to pay for smarter phones. Nokia, at the time the world’s largest cellular company, rejected Wang’s conclusions based on the company’s big data of millions of data points, compared to Wang’s 100 participants (what now is known to be Nokia’s big business mistake).’Thick Data’ as Wang defines, is:
“….a qualitative approach, obtaining ethnographic data that allows to reveal contexts and emotions of the studied subjects. While Big Data requires an al-gorithmic process usually carried out by statesmen and mathematicians, Thick Data is the ground of anthropologists, sociologists, and social scientists……Thick Data is the best method for mapping unknown territory. […]. When organizations want to know what they do not already know, they need Thick Data because it gives something that Big Data explicitly does not - inspiration. […]When organizations want to build stronger ties with stakeholders, they need stories. Stories contain emotions, something that no scrubbed and nor-malized dataset can ever deliver…Thick Data approaches reach deep into people’s hearts. Ultimately, a relationship between a stakeholder and an or-ganization/brand is emotional, not rational”.
This Concept of ‘Thick’’, also termed ‘Small’ Data by Danish author and column-ist Lindstrom (Lindstorm, 2016), is especially relevant for cities, because it follows the traditional way cities and towns were managed. Mayors met the community at town hall meetings or under the largest tree in the town square and made deci-sions through conversation, considering public wisdom, culture and intuition. Such social intuition, or the “inspiration” described by Wang, is missing in many of our municipalities as they are engulfed with big data analysis and mechanisms. In the new Big Data era, intuition is substituted for algorithms and lab-based experiments that fail to inspire the community to become part of the solution.
In addition to the qualitative advantage of Thick Data over the unpersonal attrib-utes of Big Data, Thick Data has potential significant importance in encouraging accountability and civic engagement, since it prefers quality over quantity, narratives over dry facts, and therefore reduces bias evident in big numbers, while enabling lo-cal social sentiments to be heard. Such, sometimes unique, voices that may have no impact on the result of statistic large scale evaluation, are important in understand-ing impacts of scenarios and civic action, especially in current day’s task to create more inclusive built environments.
Big, Thick, Small and Short - The Flaws of Current Urban Big Data Trends 203
In 2019, 50 years after Urban Dynamics and 10 years after the Smart City Based ‘Urban System Dynamics’ framework was introduced, the IBM Centre for Business Government published a report, slightly backing off from ‘system dynamics for cit-ies’, recognizing the need for Thick Data. The report stated that the best practice is actually to reduce reliance on lab-based Big Data and start using “mixed analytics” which can increase accuracy and improve the interpretation by adding contextual knowledge about citizen concerns (Ang, 2019).8
IBM’s report defines six principles, very different from their previous models, combining Big and Thick data:
1. Big Data is a means to an end, rather than an end;2. Thick Data can identify unexpected problems or previously unexpressed
needs;3. Thick Data can inform the analysis of big data;4. Mixed analytics can offer both scale and depth;5. Applying technology is a social activity, not an isolated technical task;6. The best solutions are not always high-tech.
CONCLUSION
Thick Data may be the missing part of the puzzle to enable “smart”’ but inclu-sive and sustainable cities. As shown, such data depends on the urban community’s willingness to share their wishes, beliefs and ideas, an impossible fit without gaining and retaining trust. The Edelman Trust Barometer9, the most comprehensive study of trust in the world, with over two million respondents, has been measuring trust for the past 20 years in business, government, media, and NGOs. As can be seen in the graph below, out of the four sectors, governments earns the lowest level of trust, 50%. The business sector and NGO’s are 8% higher while local governments score 53%. 66% of the respondents stated, “They do not believe that the current leaders will be successful in addressing our challenges”, and a similar percentage are concerned that governments do not understand emerging technology enough to regulate it effectively. Evidently, people perceive governments, both local and na-tional, as the controllers of data, but do not trust them to fulfill their role effectively.
Conversely, cities do need data in order to provide better services, improve qual-ity of life and sustainability, not the exact data - but the story connected to a place, combined with the average demography and the needs of each area. This type of data – localized and personalized—is even more dependent on cooperation and trust. While cities around the world such as Tel Aviv, Jerusalem, London, Boston, Paris and others are embracing sub city governance models with formal or informal leaderships, and with new urban prototypes such as “20-minute-city” models to celebrate hyper localism, data may be treated similarly. However, as the Edelman survey proved, people do not trust the city to protect their data, and to hide their

204 R. Rich
identity, therefore the data should be owned and managed by the community itself - sharing only unidentifiable data with municipal entities and platforms.
Community trust, based on shared interests and understanding, may substitute the need for sophisticated data prediction tools. People will be willing to share thicker information about themselves in order to provide insights for the common good. Mayors and civic leaders will be able to reduce conflicts and budget biases, as they obtain correct and current demand maps of each community, allowing for better tailor-made resource allocation. Localized data and information networks can be expanded to additional city stakeholders as data becomes more robust and reliable. Producers, suppliers and local economic stakeholders will utilize this type of data to reduce financial risks (and costs) in commerce and business.
Such new databased urban processes call for new strategies, and structures, com-bined with leadership and trust, to enable sub-urban data networks (including, train-ing, digital infrastructure and co-ownership mechanisms). The impact and value of the data that the community can generate and utilize, will enable real inclusivity, resilience and stability, essential towards responding to our 21st century challenges.
NOTES
1. ‘IBM and City of Portland Collaborate to Build a Smarter City’, IBM Press release Portland, Oregon, USA - 09 Aug 2011
2. Cisco has launched a data-based carbon emission initiative with the Clinton Foundation in 2006, but launched its commercial ‘smart & connected community’ initiative only in 2010. https://www.cisco.com/c/en/us/solutions/industries/smart-connected-communities.html
3. Based on Navigant Research Report on Smart City Suppliers, IBM was the leading supplier until Cisco took the lead in 2017. In 2020, Microsoft took the lead of the market with Cisco & Huawei not far behind, and IBM out of the leading 10 companies https://guidehouseinsights.com/reports/guidehouse-insights-leaderboard-smart-city-platform-suppliers
4. Bennet was a computer programmer working for Forrester5. IBM100 – Smarter Planet, https://www.ibm.com/ibm/history/ibm100/us/
en/icons/smarterplanet/6. https://blogs.gartner.com/doug-laney/files/2012/01/ad949-3D-Data-
Management-Controlling-Data-Volume-Velocity-and-Variety.pdf. Laney’s 2001 article was later removed from Gartner Blogs and replaced in 2013 with the post “Gartner’s Big Data Definition Consists of Three Parts, Not to Be Confused with Three “V”s” (Sicular, 2013)
7. The EU regulations for GDPR require agreement from all data providers before they are used but these directives are not yet accepted globally.
8. This report is a clear change from previous IBM ideology, stated in recent report “Ten Actions to Implement Big Data Initiatives: A Study of 65 Cities”
Big, Thick, Small and Short - The Flaws of Current Urban Big Data Trends 205
praising Big Data and complex data rich environments.9. https://www.edelman.com/trustbarometer
REFERENCES
Alfeld L. E. (1995a) Urban dynamics-The first fifty years, System Dynamics Review, 11, 3: 199-217.
-----. (1995b) Urban dynamics-The first fifty years, System Dynamics Review, 11, 3: 204.
Anderson, C. (2008) The end of theory: The data deluge makes the scientific method obsolete, Wired, 06.23.08.
Ang, Yuen Yuen (2019) Integrating big data and thick data to transform public services delivery. IBM Centre for Business Government
Flood, J. (2010) Why the Bronx burned, New York Post, https://nypost.com/2010/05/16/why-the-bronx-burned/
Forrester, J. W. (1969) Urban Dynamics. Waltham: Pegasus Communications. -----. (1971) Counterintuitive behavior of social systems. Technology Review, 73, 3:
52-68.-----. (1978) Industrial Dynamics: A Major Breakthrough for Decision Makers. Cambridge,
Mass.: The MIT Press-----. (1989) The beginning of system dynamics. Banquet Talk at the International
Meeting of the System Dynamics Society Stuttgart, Germany July 13, l989-----. (1993) System Dynamics and the Lessons of 35 Years. In Kenyon B. De Greene
(ed.) Systems-Based Approach to Policy-making. Norwell, MA: Kluwer Academic Publishers, 1993, 1-36.
IBM (no date), Smarter Planet, https://www.ibm.com/ibm/history/ibm100/us/en/icons/smarterplanet/
IBM (2011) IBM Smarter City: Portland, Oregon clip transcript, www.youtube.com/watch?v=uBYsSFbBeR4
IBM (2011) Press release: IBM and city of Portland collaborate to build a smarter city, https://www.prnewswire.com/news-releases/ibm-and-city-of-portland-collaborate-to-build-a-smarter-city-127298003.html
Laney, D. (2001) 3D Data Management: Controlling Data Volume, Velocity and Variety. META Group Research Note, 6. https://blogs.gartner.com/doug-laney/files/2012/01/ad949-3D-Data-Management-Controlling-Data-Volume-Velocity-and-Variety.pdf
206 R. Rich
Lindsay G. (2011) IBM Partners with Portland to Play SimCity For Real, Fast Company, 08-08-11, https://www.fastcompany.com/1678375/ibm-partners-with-portland-to-play-simcity-for-real
Lindstrom, M. (2016) Small Data: The Tiny Clues that Uncover Huge Trends. New York St. Martin’s Press.
Los Angeles Community Analysis Bureau (1974) State of the city ii: A cluster analysis of Los Angeles, City of Los Angeles.
Municipality of Copenhagen (2018) City Data Exchange – Lessons Learned from a Public/Private Data Collaboration, https://cphsolutionslab.dk/media/site/1837671186-1601734920/city-data-exchange-cde-lessons-learned-from-a-public-private-data-collaboration.pdf
Rijmenam, M. van. (2013) Why The 3V’s Are Not Sufficient to Describe Big Data, Datafloq.https://datafloq.com/read/3vs-sufficient-describe-big-data/166
Starr, P. (1994) Seductions of Sim: Policy as a simulation game. The American Prospect, 17: 19-29
Townsend, A. M. (2013) Smart Cities: Big Data, Civic Hackers, and the Quest for a New Utopia. New York: W. W. Norton & Company.
Sicular, S. (2013) Gartner’s Big Data Definition Consists of Three Parts, Not to Be Confused with Three “V”s, Gartner Blogs. https://blogs.gartner.com/svetlana-sicular/gartners-big-data-definition-consists-of-three-parts-not-to-be-confused-with-three-vs/
Vallianatos, M. (2015) Uncovering the Early History of “Big Data” and the “Smart City” in Los Angeles, Boom California, https://boomcalifornia.org/2015/06/16/uncovering-the-early-history-of-big-data-and-the-smart-city-in-la/
Wang, T. (2013) Big data needs thick data, Ethnography Matters, 13 , https://medium.com/ethnography-matters/why-big-data-needs-thick-data-b4b3e75e3d7
World Bank (2017) Big data in action for government: Big data innovation in public services, policy, and engagement, http://hdl.handle.net/10986/26391
BOOK REVIEWS
Geography Research Forum • Vol. 40 • 2020: 207-225.
HANDBOOK OF URBAN GEOGRAPHY, Edited by Tim Schwanen and the late Ronald van Kempen, Cheltenham, UK: Edward Elgar, 2019
This book was written and edited with a great passion for the content world of ur-ban geography. Its editors seek to achieve two goals: to deepen the foundations of this content world, and to examine the borders of this field and the ways in which it engages with other disciplines such as sociology, economics, anthropology, etc. They refer to the movement between the center of the field and a tour of its borders as “engaged pluralism” – an attempt to produce, in their words, an open interdiscipli-nary discussion that challenges the borders of knowledge (p. 6).
To achieve this goal, the editors offer 29 chapters – an impressive effort for a book – organized into seven sections: 1) the theory and methodology of urbanism; 2) urban networks; 3) urban development; 4) urban inequality; 5) urban socialites; 6) urban politics; and 7) urban sustainabilities.
In the introduction, the editors explain that they devoted significant thought to the chapters’ assembly into the different sections with the aim of furthering the goal of engaged pluralism. They assert that they intentionally wove chapters deal-ing with technology and the digital world into the different sections and did not develop the topic as a section in its own right. The introduction also offers a review of urban theory, highlighting the concept of “urbanism” and its development from an approach that cultivates thinking on “city sciences” in the direction of the critical thinking embodied in the concept of planetary urbanism. From a theoretical per-spective, the editors state, the book is committed more to the Marxist materialist approach, on the one hand, and to the approaches of city sciences and advanced spatial analysis, on the other. The authors also explain that the book was written “from the North” to a greater extent than they intended; that is to say, they did not succeed in importing a theory or case studies from the Global South in the ways they had initially sought to.
The book is well written. The chapters are not long, enabling a reading of the dif-ferent sections in a single sitting. The book’s first goal – to present the discipline in its various colors – is fully achieved. The authors maintain that the book is intended for research students at various stages, and this is in fact the case. Indeed, as I read through it, I found myself giving chapters and conveying insights to the research students I am currently advising. This is a manifestation of the book’s strength: its systematic presentation of core topics. The classics of the field are also dealt with
Book Reviews208
nicely, and the book offers definitions of a broad spectrum of basic concepts in urban geography. In this way, the book provides a wonderful service for lecturers teaching basic and advanced courses in urban geography, as well as neighboring disciplines such as urban sociology.
Another strength of the book is the fact that it has no qualms about presenting views that run against the tide, such as the understanding that suburbs are places where we find prosperous communities and social mobility, and a critical discus-sion of both the concept of gentrification and the limitations of the new technol-ogy-based tools. I was particularly impressed by the final subject. For example, in Chapter 5, “Big Data and the City,” it is clear that the authors are not writing based on a technological fetish but are rather presenting an interesting discussion that brings readers back to the power of the qualitative study. To use the words of Jane Jacob, it is in the chapter on big data that the authors cause us to rethink urban “clues”: that is, original way to learn a phenomena by unusual indicators of (for example, stores that sell pet products and health food stores can be viewed as signs of gentrification).
But does the book achieve its second goal? Does it succeed in crossing the disci-plinary borders and presenting a new agenda with which to embark into the third decade of the twenty-first century? Here, the answer is somewhat more complicated. On the one hand, it does. The relationship between urban geography and urban sociology is dealt with nicely in the book, and it is clear that the authors and the editors are well versed in social theory and on this basis seek to contribute to urban geography; for example, the topics of inequality, networks of segregation, and urban diversity are the subject of considerable attention.
On the other hand, I believe that we can and should ask where else this fascinat-ing, central field can take us (to extend the metaphor proposed by the editors) not only in examining this discipline’s borders with its counterparts in the social sci-ences but also in asking a question about the horizon of the field: Where is the field headed?
Here, I think a great deal of work is still in order. I will try here to outline two possibilities (out of many) for dealing with the future of the field. For example, the introduction to the section on urban inequality (p. 242) states that both the ques-tion of inequality and the theories employed are associated with thinking from the left-wing of the political map. This is true of the work as a whole, in which the edi-tors maintain that Marxist approaches are prominent throughout the book.
In an era in which most countries – including the United States and the countries of Europe – are being led by right-wing conservative governments (or centrist par-ties), perhaps the time has come for a discussion of urban geography through “right-wing” eyes. Today, in the year 2020, we cannot limit ourselves to criticism embodied in the concept of “neoliberalism” and hyper-capitalism. It is not enough to talk about diversity; we must also demonstrate theoretical and intellectual diversity. Why must we offer “right-wing” readings of cities? Firstly, in order to enable the discourse

Book Reviews 209
on urban geography to engage the existing reality in a complex manner. The left-wing discourse on processes of urban development (for example) often suffers from cliché and self-righteous views. We must present the complexity of the development processes and the inequality in a much more complex manner, thereby producing a new theoretical toolbox that provides our students with tools, connects with these theoretical frameworks, and critiques them in a deep and fundamental manner.
A second direction in which new ground can be broken pertains to the relation-ship between technology and the new methodologies of research in the field. The new geographical information systems have broken extremely impressive ground, providing access to impressive tools for mapping and spatial calculation for scholars and the public sector alike. Many startup companies, such as Waze and Airbnb, have produced a spatialization of movement and splintered tourism in cities, changing the face of cities beyond recognition. We have a great deal of work to do in order to illuminate the implications of these methodologies both in our own hands – that is, those of the research community – and in the hands of the entrepreneurs whose actions change cities. In my view, the book’s chapters on technology are the most interesting and original, although still missing is a statement by the editors regard-ing the new horizons these technologies open up to urban geography. What does the dominance of virtual realities do to geographical space in the common sense of the word? What theory of space can we propose in the era of cyberspace? How should we understand the concept of “neighborhood” in an era in which neighbor-hood communication occurs on Facebook pages and within Whatsapp groups, as opposed to in the neighborhood grocery store, which has long since ceased to exist? These and many other questions remain unanswered in this book.
However, it seems to me that the strong basis laid by the book’s editors constitute sturdy and impressive foundations on which to build the next level of the content world of urban geography.
Meirav Aharon-GutmanThe Technion
ETHNIC SPATIAL SEGREGATION IN EUROPEAN COUNTRIES, by Hans Skifter Andersen, Routledge: London and New York, 2019.
Sociologists and other social scientists have been studying ethnic segregation for at least the last one hundred years. During the 1920s and 1930s, the Chicago School of Sociology looked at patterns of assimilation of white ethnic groups and the move-ment to suburbia. Beginning in the 1950s and continuing to the present, social scientists have measured the extent of racial segregation in American cities and have debated how to deal with the “ghetto problem.” European research on ethnic seg-regation is much sparse in part because immigration has been much more recent.
Book Reviews210
However, European policy makers worry that their dense multi-ethnic neighbor-hoods may be becoming more like American ghettos.
Ethnic Spatial Segregation in European Cities by Hans Skifter Andersen adds to the limited European research literature on segregation. Whereas in America, ethnic clusters are often dominated by a single group, e.g. African Americans, Hispanics and others, in many European countries enclaves may contain several different groups, so-called multi-ethnic neighborhoods. The most important kind of seg-regation is the separation of the whole group of ethnic minorities from the native majority. This book attempts to uncover “explanations for why ethnic segregation has emerged and is maintained in European cities” (p.1). The author acknowledges he does not discuss the consequences of ethnic segregation, an extremely important, but separate and comprehensive research area.
The book is divided into three parts. After an introductory chapter, which also summarizes the book’s major findings, the first section examines differences between natives and ethnic minorities in housing and neighborhood preferences. The second section looks at the relative importance of native and immigrant in- and out-migra-tion flows in accounting for the creation of multi-ethnic neighborhoods. The final section examines the role of housing, planning, and welfare policies in countering patterns of ethnic segregation.
If immigrants have different preferences toward homeownership, then this could contribute to patterns of segregation. But do immigrants have different housing preferences? A longitudinal study from three Nordic countries, using register-based administrative data, compared immigrants and natives to see whether differences in tenure preferences were due simply to economics and demographic differences. Results in all three cities showed a big difference in movement toward homeowner-ship between immigrants from Africa and western Asia (specific countries are not given) when background demographic characteristics were controlled. The results indicate that cultural factors play a key role in achieving homeownership. Skifter Andersen, unfortunately, does not specify what these cultural factors are, how they vary between different immigrant groups, or how they impact attitudes toward homeownership.
Immigrant neighborhood preferences do play a role in explaining ethnic seg-regation according to a 2005 Danish study. Only a few respondents wanted to live in a multi-ethnic immigrant neighborhood. Most wanted to live in a neigh-borhood where there was a fifty-fifty split between immigrants and native Danes. Furthermore, an index of cultural integration proved significant in predicting in-terest in living in dense multi-ethnic communities, which lead the author to state: “Some ethnic groups…could have a culture that promotes a stronger wish to live in enclaves to maintain a separate cultural identity” (p.76). Regrettably, the author does not indicate which cultures are most likely to have an interest in living in an ethnic enclave or why.
Book Reviews 211
The spatial assimilation hypothesis posited by the Chicago School of Sociology states that over time immigrants give up their distinctive attitudes and behavior and simultaneously disperse from their ethnic enclaves. Because over the last 35 to 40 years the composition of recent immigrant populations has changed, it is possible that the spatial assimilation model is no longer operative. But it is, according to analysis of a data base of information on immigrants and native Danes and their housing from 1985 to 2008—a source that makes it possible to look at changes in the immigrant’s situation from time of their arrival and changes over the next 25 years. The proportion living in dense multi-ethnic neighborhoods increases in the first six to ten years, stagnates after 11 to 15 years, and then begins to fall. Because income was controlled, the results imply that spatial dispersion is not simply a prod-uct of economics; other variables are operative, likely cultural ones. Unfortunately, the author does not say which cultural variables are important or how they affect preferences or behavior.
Shifting from preferences to behavior, the question is: What type of migration behavior is most important in accounting for multi-ethnic neighborhoods, the at-traction of minorities, the retention of minorities, the avoidance of natives, or the flight of natives? In fact, native population avoidance is the most important of the four processes in accounting for the existence of immigrant-dense neighborhoods. Unfortunately, Skifter Andersen does not identify the underlying reasons for this avoidance. Is it because of native prejudice, a preference for homogenous white neighborhoods, or because of a concern about declining neighborhood social status, including rising crime rates and falling school quality?
While demand-side factors play an important role in explaining patterns of ethnic segregation in Europe, so does the extent to which the supply of housing, particu-larly rental housing, is available. A comparative study on the special importance of housing policies for the housing situation of ethnic minorities in four Nordic coun-tries highlights the special importance of housing policy in the Nordic countries. The case study of Norway shows that a lack of sufficient rental housing can push ethnic minorities into owner occupation which can result in less ethnic segmenta-tion. This can be seen as a good thing, but the price is that many live in overcrowded conditions. The Danish case study shows that the situation of ethnic minorities is affected by the regulation of the rental housing market. Strong rent controls reduce possibilities for ethnic minorities, because the policy leads to queues and landlords then tend to choose friends or acquaintances rather than ethnic minorities who lack informal contacts. The Finnish case study shows that if housing allocation is simply on the basis of need, ethnic minorities tend to be very concentrated in this type of housing. On the other hand, the universalist housing allocation scheme in Sweden, which gives equal status to all tenures, “has resulted in a modest ethnic segmenta-tion of the housing market and in a smaller over-representation of ethnic minorities in social housing” (p.159).
Book Reviews212
Scholars have speculated that much of the ethnic segregation in the Nordic countries can be attributed to the existence of large spatial concentrations of mar-ginally and socially segregated housing—the so-called social housing hypothesis. Skifter Andersen’s research highlights a more complicated situation. Copenhagen and Stockholm confirm the social housing hypothesis; high concentrations of im-migrants are found on social housing estates that are segregated from other tenures. Helsinki, however, which has the highest level of ethnic tenure segmentation (not surprising because immigrants are over-represented in social housing), has the low-est level of ethnic segregation due to the tenure-mixing policies officials have im-plemented at the neighborhood level. Social housing and market-rate housing exist side-by-side in Helsinki’s large forested suburban housing estates. And although Oslo has a low rate of ethnic tenure segregation (due to the large number of im-migrants in home-ownership), the city has higher concentrations of immigrants in some neighborhoods than Copenhagen; typically, these are Danish immigrants residing in ethnically dense, housing cooperatives— cooperative housing being con-sidered a form of homeownership.
Similarly, researchers have argued that differences across Europe in welfare state type (social democratic, liberal, corporatist, Latin rim, Eastern European) would account for differences in ethnic segregation; more specifically, that the universal-istic countries (Scandinavia and Netherlands) would have the lowest levels of seg-regation. This is clearly not the case. There is no such relationship between welfare state categories and national level variables that might influence segregation: (1) incomes of ethnic minorities; (2) preferences for ethnic homogeneity; (3) housing policies (the Netherlands and Denmark have unitary rental markets where social and rental housing markets compete, but they have relatively high levels of ethnic segregation anyway); (4) homeownership rates; (5) levels of housing discrimination. Furthermore, there is no clear-cut evidence to support the assumption that because social democratic countries have the most sophisticated spatial planning systems this would enable them to address spatial inequalities. In reality, social democratic countries have a relatively high degree of ethnic segregation, because building pro-duction is dominated by large developers. This has led to development of large areas of Sweden and the Netherlands with relatively homogenous housing and popula-tions.
My reactions to the book are mixed. On one hand, Skifter Andersen does an excellent job in reviewing the European and American literature on ethnic segre-gation. In addition, he succeeds in showcasing the Nordic countries’ impressive empirical research that takes advantage of existing population registers which make highly valuable longitudinal studies possible. On the other hand, the book suffers from three interrelated flaws. First, the book lacks a concluding chapter. Chapter 1 summarizes the findings of all seven subsequent chapters, but fails to bring them together or to indicate what contributions the book makes to segregation literature. Second, because Skifter Andersen mostly relies on empirical studies, we gain a better

Book Reviews 213
understanding of what is happening in Europe vis à vis segregation, but not why it is happening. Why, for example, are Somalis the most segregated immigrant group across Europe? Is it skin color, religion or rural origin? Or why do Greeks have both a high level of preference for neighborhood ethnic homogeneity and a high propen-sity to discriminate against minorities?
Finally, I was disappointed that the book failed to weigh in on what, if anything, European countries should do to handle their ethnic segregation problems. At the end of the book (pp.215-216), Skifter Andersen comes close, but fails to offer any recommendations:
In some countries in the Social Democratic and Corporatist clusters, ethnic mi-norities are to a high degree clustered in social housing and the spatial location of this housing is of basic importance for ethnic segregation. More developed planning systems in these countries should in theory have made it possible to spread out social housing in the city, but for different reasons these have not always been used, leading to large neighborhoods with concentrations of social housing and ethnic minorities.
There is nothing to indicate what the reasons are for not implementing pro-integration policies. Nor does he provide suggestions for responding to the “wick-ed” policy questions facing European planners. Should they promote scattered-site housing strategies (whereby all localities in a metropolitan area are assigned a certain quota of new or rehabilitated affordable housing) even though such policies will be resisted by middle-class communities? Should housing companies and housing as-sociations utilize “benign quotas” to achieve integration by restricting the entry of ethnic minority residents, even though such policies are usually opposed by these minorities? As one of the most prominent European housing researchers, my hope is that Skifter Andersen will tackle these and related questions in his next book.
David VaradyUniversity of Cincinnati
SMART CITIES IN THE POST-ALGORITHMIC ERA: INTEGRATING TECHNOLOGIES, PLATFORMS AND GOVERNANCE, edited by Nicos Komninos and Cristina Kakderi, Cheltenham UK and Northampton MA: Edward Elgar, 2020.
The concept of smart cities has become widely applied and studied as of the 1990s. However, this edited volume presents a rather fresh, challenging and even provoca-tive perspectives for smart cities. Traditionally, smart cities have been viewed as be-ing able to ‘address more effectively complex contemporary problems of growth and sustainability and provide more intelligent systems of decision-making and innova-tion’ (p. 1). Smart cities have been further assumed to be IT (information technol-
Book Reviews214
ogy) based, technologies which are termed in this book as the ‘algorithmic logic’. This volume claims for a wider platform required for contemporary smart cities, so that IT ‘can be much more effective if combined with other sources of intelligence available in cities, such as human intelligence, creativity and innovation, and col-lective and collaborative intelligence within institutions or over platforms’ (p. 2). Smart cities are viewed, therefore, as no less social entities as technological and or-ganizational ones.
A wide group of scholars from Greece, joined by scholars from numerous other countries, addressed the book topic along three parts, each including four chapters: an assessment of smart city study so far and contemporary study challenges (Part I); proposed smart city crossroads with IoT (Internet of things), social media and data science (Part II); and finally, attempted connections between smart cities, participa-tory governance and digital platforms (Part III).
The book opens with an introductory essay (Komninos, Panori and Kakderi), followed by a critical review of smart city study so far (Mora, Reid and Angekidou). Three chapters, which present challenges for smart city study, come next: the al-gorithmic city and transformations in politics, governance and service provision (Anttiroiko), smart cities as ecosystems of innovation (Schaffers), and the creation of intelligence in smart cities (Komninos and Panori).
Part II begins with a chapter investigating the essential technological require-ments for a smart city (Loscri, Mitton and Petrolo), followed by chapters which provide insights concerning the penetration of social media and digital technologies into daily life, bringing about new ways for interaction (Vakali and Moustaka), the role of IT in transformations of public services (Tsampouladitis, Bechtsis and Kompatsiaris), and the opportunity for technologists to innovate spatial dynamics (Zhang, Duarte and Ratti).
The third part of the book elaborates on a variety of aspects, ranging from plan-ning for smart cities (Angelidou and Mora), through quality of life in smart cities (Özdemir, Kourtit and Nijkamp), ‘sharing’ in smart cities (Oskam), to ‘zero initia-tives’ which emerge in smart cities (Kakderi).
The book presents numerous novelties. In its first part the study of smart cities so far is differentiated along numerous paths: experimental, ubiquitous, corporate, European and holistic (Mora, Reid and Angekidou). It is proposed to interpret and analyze the smart city along four dimensions: data and algorithms, physical space, local governance and local economy and society (Anttiroiko). Furthermore, it is sug-gested to put an emphasis on collaborative urban innovation processes (Schaffers), side by side with the identification of layers of urban intelligence: human, artificial, collective, and collaborative (Komninos and Panori).
The second part of the book introduces some additional fresh and innovative suggestions. Thus, future smart cities are viewed as being identified by clouds of meshed things (Loscri, Mitton and Petrolo). Smart city users on their part are iden-tified and differentiated along participatory, opportunistic, and opportunistic mo-
Book Reviews 215
bile sensing (Vakali and Moustaka). At the governmental level, it is proposed to move from e-government to we-government, involving higher citizen participation (Tsampouladitis, Bechtsis and Kompatsiaris). At yet another level of urban services, the concept of underworlds is introduced, as relating to a combination of urban analysis, robotics, bioengineering and genomics (Zhang, Duarte and Ratti).
The third part of the book explores several new or readdressed ideas, as well. Thus, the interrelationships between smart cities and spatial planning are explored (Angelidou and Mora). Spatial planning in smart cities is further highlighted from the perspectives of social policy and quality of life (Özdemir, Kourtit and Nijkamp). At the individual and community levels, the concept of ‘sharing’ is presented, in the sense of widening digital relationships for individuals, extending even beyond city levels (Oskam). Finally, the ‘vision zero’ notion is presented, attempting at zero negative impacts for urban strategies (Kakderi).
As common with edited volumes, the approaches and the levels of discussion range widely among chapters and authors, but the book in general may well wet the study appetite of scholars, students and practitioners alike, when searching for study challenges regarding smart cities. The global Corona crisis, which emerged simultaneously with the publication of the book, invites a companion volume on smart cities during and following the crisis.
Aharon Kellerman University of Haifa
HANDBOOK OF GEOTOURISM, edited by Ross Dowling and Davis Newsome, Cheltenham, UK: Elgar Publishers, 2018
The volume edited by Dowling and Newsome is a detailed research textbook writ-ten for scholars, practitioners, educators and students. Geotourism is ‘geological’ or ‘geographical’ tourism based on geological features, which is significantly connected to both landscape and ecotourism. The emphasis in the book is on what tourism experts should know about the Earth Sciences and what geologists need to know about the operation and development of tourism. Geotourism principles, like eco-tourism, not only incorporates sustainable tourism principles but also encourages their practice. Geotourism is thus the application of sustainable tourism principles, an approach to these principles and a way to connect individuals to the geologic nature of an area’s ‘sense of place’.
Geotourism is tourism of geology and landscape usually undertaken at geosites. It fosters conservation of geological attributes (geoconservation) as well as an un-derstanding of geoheritage and geodiversity. The geological knowledge gained at a geosite may be used to inform its biotic and cultural features so that a more holistic view of the environment can be developed. This should then lead to a more en-
Book Reviews216
hanced understanding and appreciation of the world as it is built on its geological foundations. The editors suggest that geotourism could be viewed through different perspectives along a geological spectrum that also includes an international perspec-tive. This encompasses various political and governance approaches, societal models, funding methods, conservation approaches and visitor pressures. An international perspective allows us to appreciate specific settings and situations. Geographically, different geo-attractions have their own subjects, and a major consideration for the future will be dealing with visitor demand and contrasting visitor attitudes.
Geotourism includes information about the environment – geological and be-yond – so that tourists learn about the site or setting that they are visiting. Geo-education comprises the interpretive aspects of geotourism, usually through pre-visit and on-site pamphlets; overlooks and geosite panel design and location; self-guiding trails; geological gardens; guided tours and visitor centers. Geotourism benefits in-clude the employment of locals as guides and staff to service geotourism activities and facilities. The accommodation sector has the potential to contribute to local communities through employment opportunities, events, retail and the provision of services.
The first section of the book, Geology and Tourism, examines the links between geology and tourism from a variety of standpoints. These include how tourism professionals can present geology and geological information; explanations of key geological terms such as geodiversity, geoheritage and geoconservation; the relation-ship between geotourism and the cultural landscape; geotourists; the application of geographic information systems in geotourism; and a targeted literature review of geotourism. This part actually sets the scene for the interdisciplinary nature of geotourism providing insight into how geology and tourism are interlinked. The second section, Geotourism, Society and Sustainability includes public-private part-nerships for sustainable development; the significance of show caves; the issues of management (including risks) of geotourism in volcanic regions, caves and glaciers; and the potential contribution of geotourism. The topics are analyzed in more detail through case studies from the Philippines, Italy and Africa.
The third section of the book, Geotourism in Urban Areas comprises three chap-ters which profile examples from Australia, the USA and Brazil. The fourth section, Interpretation and Education Strategies, brings together a range of views on the presentation of geotourism in public settings. The section includes topics on geo-tourism interpretation and education as well as examples of geoliteracy in geoscience education (USA); ‘The day of geosites’ (Germany), and the importance of stories (Australia).
The fifth part, Contribution to Geoparks, shows how geotourism is contribut-ing to the development of ten geoparks on four continents: Europe, Asia, North America and South America. Geotourism is the engine that drives geoparks, gener-ating funds to foster community welfare and conservation. The sixth and final part of the book, presents case studies in geotourism and showcases the use of geotourism

Book Reviews 217
as a development tool in geological environments on several continents. The sites include Malta, the Czech Republic, Namibia, the Philippines, and New Zealand. This chapter of the book provides an overview of the implementation of geotourism in the world today as well as suggestions and directions for potential future research.
The book is enriched by the contribution of many experts in the field to the writ-ing, which is clear, relevant and interesting. The chapters present a variety of disci-plines connected to geotourism as well as cases from many different geographic areas around the world. The book also offers high quality color photographs that illustrate the geotourism case studies examined. The maps, tables and flow charts in the book also add considerably to readers’ understanding of the written theory. Among the major problems facing geotourism and its proper management is overcrowding. The authors address this issue, which is becoming more widespread at natural attractions as they are marketed as tourism sites under the geotourism banner. In some coun-tries, this phenomenon led to overtourism problems. To deal with this problem, geotourism management has become significantly more important for planning, developing and operating geo-sites in a manner that maintains the delicate balance between people and nature.
The editors have succeeded remarkably well in creating a multidisciplinary sour-cebook that links the characteristics of geological and geographic natural phenom-ena to their socioeconomic value both as tourist destinations and as sources of re-gional development. The great advantage of the book lies in the many phenomena and aspects discussed and the many case studies and examples of geotourism of-fered from around the world. At times it is evident that the editors had a dilemma: whether to expand the issues addressed or to delve more deeply into theoretical discussion. In some cases, geology and geography overcome tourism. That said, in issues of tourism management, the book contributes valuable data and findings. In recent years, additional information and knowledge in tourism research has ac-cumulated especially about issues connected to sustainable and ecological tourism, visitor management and management of the tourism experience. Follow-up studies can certainly use the paradigms in this book and suggest additional applications in the many important areas and subjects discussed in this book.
Alon GelbmanKinneret Academic College
SETTLING HEBRON. JEWISH FUNDAMENTALISM IN A PALESTINIAN CITY, by Tamara Neuman Philadelphia PA: University of Pennsylvania Press, 2018.
In the heart of the largest Palestinian city in the occupied territories, counted 250,000 residents, is located a Jewish settlement of 700 residents, in fact 8000 resi-

Book Reviews218
dents, together with “Kiriat-Arba”, a nearby Jewish settlement. The legal status of this odd reality is the result of “Hebron Agreement” in 1997, following half-hearted government authorization to an unlawful invasion of “ideological settlers” group.
This phenomenon represents a radical case of space designed by a colonial regime. Since the colonial aggression hurts life itself, Jewish Hebron within the occupied territory brings destruction and violence which ensembles with the condition of urbicide (Graham, 2003).
This kind of process blurs the distinction between fortress and ghetto for the Jewish settlement, as Marcuse (1997) defines the two polar neighborhoods in the city. This very fortress assumes ghetto’s features. It is an outcome of life within limi-tations and uncertainty: solid boundaries and limited space; living as a minority in the hostile Palestinian environment; the surveillance of peace activist organizations; the Israeli legal system; and military control.
In this setting, Tamara Neuman, a political anthropologist, examines everyday life of the Jewish “ideological settlers” from Kiryat-Arba community in the occupied Palestinian West Bank. She perceives that their discourse outlines a unique world-view. Her research is an in-depth interesting ethnographic analysis of practice and politics of that ideological community in a military zone. The created political and territorial conditions reflect a dissonance between the lives in the enclave and their imagined biblical utopian landscape. Their narrative lacks historical specificity; its platform is built on collected chosen events that produce sense of victimization and fatalism as their symbolic identity.
The book is composed of six chapters. Chapter 1, “Orientations”, aims to expose the complex social field by focusing on three perspectives on religious settlement. It represents three actors in the scene: the ideological settlers, soldiers, and Palestinian farmers. These three groups have drastically different perspectives surrounded by intersecting realities. While settlers speak of Jewish origins on Palestinian lands, an Israeli soldier focuses on the danger these settlers place on fellow soldiers and how the occupation skews an ethical dilemma for him as a soldier, and a Palestinian farmer underscores the hardship inflicted by settlers on his family’s life.
Chapter 2 “Between Legality and Illegality” – provides a brief historical overview of the claims and practices that paved the way for the settlement to win recognition. Particularly, it pays close attention to what settlers’ term “the Jewish origins” of the contested region, which is situated within the legal gray zone of military occupation. It exposes how the settlers are able to change territorial boundaries, push legal limits, and preserve religious values in a way that establish their distinct place. This process is responsible for the making of gray spaces (Roded, 2011).
Chapter 3 “motherhood and property takeover” further builds on this changes of boundaries and introduces another angle, namely, “the lens of gender”, specifi-cally events of protest. Cycles of pregnancy and childbirth domesticate spaces and enhencing the community to take over Palestinian property (the case of Hadassah house, for example).

Book Reviews 219
Chapter 4 “Spaces of the Everyday” describes the settlers presence in Hebron ethnicizing spaces by explanatory reorientation of Jewish tradition. The ethnog-raphy focuses on the micro-level disputes on boundaries, and daily signs of non-recognition of the Palestinians. It tries to eliminate the existence of the ‘other’ and its landscape on the way to segregation and exclusivity, while highlighting the irony and impossibility of this practice.
In Chapter 5, “Religious Violence”, Neuman is focusing on religious violence and explores the rites in the context of the partitioned space of the Tomb of Patriarchs. Here she offers her analysis of the 1994 Goldstein massacre, which took place in-side the Tomb. She also outlines how sacred place and residential areas trapped the Palestinians between the armed settlers and the military rule. Thus, the tactic to expand religious domains of control, that is due to the legal gray zone, they go un-punished; the guns are present in every sphere of settler life; and the use of force, all these features and practices are blurring the line between civilians and soldiers and encourages direct violence in Hebron.
Chapter 6 “Lost tribes and the quest of origins” returns to the question of the settlers’ Judaization of space and bringing back Jews to ‘their’ place of origin, mean-ing Hebron. They bring nontraditional Jews from remote places like Bnei-Menashe in India and convert them to Judaism. Suddenly these ethnic differences are less important. The alienation that come out of this strategy appears to be odd and the cultural gaps are greater even than those vis a vis the Palestinians.
The chapter that concludes the book aims to enrich it with additional and wider perspectives and scale, in revising ideology as an elusive concept, raising fieldwork dilemmas, which arose when she had to choose among all daily life aspects, and the influence of the ideological settlers beyond Hebron.
Neuman concludes: “In sum, the realm of practice in ideological settlements such as Hebron, has served as a social laboratory – testing limits, creating new realities, and instituting changes that have had far-reaching implications for not only remak-ing Jewish understandings of authenticity and Israeli nationalism, but shifting the terms of the Israeli-Palestine conflict from a dispute over land, to one mainly ex-pressed in an ethno-religious register” (p. 191).
In the book “Settling Hebron”, Neuman opens a wide and complex spectacle through her thick description and thorough analysis, bonding together history, so-ciology, culture and ideology of Hebron. She is doing so through choosing very important and unique viewpoints and orchestrates it into a dynamic and inter-related way of life of religious ideological group in one place within the occupied territories. Processes like crawling “grayness” and urbicide (Roded, 2011; Tzfadia, 2014) receive visibility and livability here. This case represents the ways of colonial regime to produce conditions, which encourages a radical religious group to develop and expand its domination and deepens colonialism with its own initiation and promotion.
Book Reviews220
We can close this review with the insight of Rob Shields (1991) on places on the margin. They may actually be located on the geographic periphery, but their marginality may make them centers of subversion. Their cultural distance from the normative centers of societies on the outer edges of the influence of social conven-tion, present an opportunity for acting outside the boundary of prevailing norms, or romanticized sites of differences and otherness.
Batya Roded Ben Gurion University of the Negev
REFERENCESGraham, S. (2003) Lessons in urbicide. New Left Review, 19: 63–78.Marcuse, P. (1997) The ghetto of exclusion and the fortified enclave: New patterns
in the United States. American Behavioral Scientist, 41(3): 311–327.Roded, B. (2011) The Grey space between fortress and gheto: The case of the Jewish
settlement in Hebron. Israeli Sociology, 12(2): 29-56 (in Hebrew).Shields, R. (1991) Places on the Margin: Alternative Geographies of Modernity.
London: Routledge.Tzfadia, E. (2014) Informality as control: the legal geography of colonization of the
West Bank. In F. Chiodelli, B. De Carli, and M. Falletti (eds). Cities to be Tamed? Spatial Investigations across the Urban South. Newcastle: Cambridge Scholars Publishing, 192-214.
DEFINING LANDSCAPE DEMOCRACY: A PATH TO SPATIAL JUSTICE, edited by Shelley Egoz, Karsten JØrgensen and Deni Ruggeri. Cheltenham, UK: Elgar Publishers, 2018
Recently, a lively debate erupted in my hometown, Tel Aviv, Israel. The debate had to do with the City’s decision to build a school on the grounds of the Levinsky Garden. The garden is situated a few meters from Israel’s biggest central bus station, at the heart of Tel-Aviv’s backyard. The City’s decision meant destroying the only green space in an already overly dense and highly polluted area. No public discus-sion or participation processes were held prior the decision. Interestingly, this one-sided top-down decision was enacted in a politically sensitive neighborhood, where lower income Israeli families, gentrifiers and African asylum seekers have reached the brink of urban riots.
These events were unfolding as I set to read and review the book “Defining Landscape Democracy: A Path to Spatial Justice”. I was, therefore, thrilled at the opportunity to find a definition of landscape democracy. Moreover, I hoped that
Book Reviews 221
such a definition would provide tools for unpacking, criticizing and constructively challenging decisions like those embraced by the City of Tel Aviv.
Providing a strict definition, however, is an impossible task, since each of the idi-oms – ‘landscape’ and ‘democracy’- has multiple meanings and dimensions. A quick review of the articles in the book immediately reveals this multiplicity. ‘Landscape’, for example, according to Makhzoumi has tangible manifestations that express hu-man culture and politics, but also intangible sentiments such as identity and belong-ing. As such, Egoz et.al. add, ‘landscape’ must be realized as a common good, which “…forms the basic infrastructure for life and wellbeing of all humans and natural environment.” (p.62) Against this inclusionary vision, Waterman warns from the dark side of ‘landscape’ as it can be manipulated in the service of secluded sanctu-aries for the well-offs or for nationalist-purposed. (p.145) Even more problematic is defining ‘democracy’. Knudtzon, for example, argues that ‘democracy’ is a “con-tested concept”, as she identifies “four typical version of democracy – liberal, partici-patory, deliberative and radical.” (p.5) Egoz et.al. remind us not to take for granted the automatic link between democracy, equality and liberty, without considering embedded power relations. (p.64) Makhzoumi goes further to argue that “in the Arab Middle East…‘democracy’ is held suspect”, since it is identified with the ruth-less colonial regimes that ruled the area during much of the 20th century. (p.29)
If this was not complicated enough, the book is trying to define ‘landscape de-mocracy’ in the midst of a world-wide crisis of the democratic regime. Under global neoliberalization (Brenner, 2010) citizens became consumers of goods as well as of politics (Dean, 2009). According to Rancière, this post-democratic/post-political condition is based on a broad-based consensus that was reached by those who have a part in a given society (Rancière, 2010). In the seemingly cozy water of the con-sensus, ‘politics’ is increasingly reduced to ‘policing’. That is, the aggregate set of procedures, activities and policies, formal and informal, that enables and legitimizes the existing order, while positioning everyone in their proper place.
Around 2011 a world-wide social protest erupted in various urban centers. Despite living in democratic countries, the protesters demanded “democracy, now”. They, thus, asserted dissensus towards the ‘police’ (Rancière, 2010), asking to recon-stitute ‘the political’ (Swyngedou, 2011). The latter term refers to the ontological dimension of the “non-existence of society” (Ibid). It highlights the inherent disa-greement (and even antagonism) between people, and the absence of ground for constituting a society. As opposed to ‘politics’ (‘police’), ‘the political’ is an open arena, where those who have no part can claim it (Zizek, 2006). This is what the voices of the social protest called for. They did so, echoing the above-mentioned claim by Egoz et.al, by occupying public space, claiming a right to the city in its deepest sense of struggling for ‘real democracy’ (Purcell, 2013).
Seemingly, the social protest of 2011 has failed in achieving these stages. However, the discontent with the post-democratic condition keeps growing. Thus, it comes as no surprise to witness the occasional social protest’s eruptions in different cities
Book Reviews222
around the world. Additionally, no one should really be surprised with the growing anti-institutional and anti-party sentiments. Often, and against the inclusive logic of ‘the political’, it results in the election of populist regimes, which are anti-elitist but also anti-pluralist (Müller, 2016).
Accordingly, the crisis of the currently existing democracy cannot be more evi-dent. This point and the complexity of defining ‘landscape democracy’ in this time and age, does not escape the eyes of many of the writers of the book. Yiğit-Turan, for example, describes the lively and pluralistic occupation of Gezi Park, Istanbul, Turkey. She finds hope in the ability of often contesting voices to talk to each other and cooperate. (p.218) Yet, she also depicts the violent evacuation of the park, the erasure of all memory of the encampment, and the fact that “any person expressing dissenting ideas was also taken away.” Langhorst, as well, is worried by the erosion of democracy by neo-liberal restructuring. However, he finds hope in the idea of ‘assemblage’. Accordingly, urban space is being continuously ‘assembled’. It there-fore offers an on-going multi-layered and contested spatio-temporality, which is a platform to enable a demand for the right to the city and to counter “…the post-political erosion of the urban public sphere…”. For Geisler, the depicted post-political condition may be just a preview of the crisis of democratic regimes. As the climate change crisis intensifies, he even foresees a decree of martial laws in some cases. However, like Yiğit-Turan and Langhorst, Geisler argues that amidst the cri-sis hope can rise. This may be found in green and ecological democracy practices (i.e. the local empowerment of local communities in India, offering alternative to corporate globalization). Another alternative is via implementing the Public Trust Doctrine. That is, a legal demand from governments to fulfill their commitment to steward the ecological system.
Considering the ‘post-political’ condition, especially in the face of a world-wide and unprecedented ecological crisis, we are currently in an historical crossroad for democracy. This condition can bring to the rise of authoritarian regimes on the one hand or to the rise of ‘real democracies’ on the other hand. As the above writers de-pict, in each scenario landscape democracy plays a vital role in claiming or protect-ing democracy. Such a role cannot be captured in a strict definition. In that regard, the book’s head title – ‘Defining Landscape Democracy’ - is misleading. The book’s editors acknowledge this, and begin the book with a caveat that they are not going to offer “once-and-for-all answers”. However, the secondary title – ‘A Path to Spatial Justice’ – rightly suggests a dynamic and an on-going process. Acknowledging this and the vital role of landscape democracy in advancing ‘real democracy’, the book more than met my expectations of finding tools to constructively challenge cases like the Levinsky Garden. Hence, opening a path for spatial justice.
Eran TzinTel Aviv University
Book Reviews 223
REFERENCES
Brenner, N., Peck, J. and Theodore, N. (2010) After Neoliberalization? Globalizations, 7.3: 327-345.
Dean, J. (2009) Democracy and Other Neoliberal Fantasies: Communicative Capitalism and Left Politics. Durham: Duke University Press.
Rancière, J. (2010) Dissensus: On politics and Aesthetics. Translated by Corcoran, S. London: Continuum International Publishing Group.
Swyngedouw, E. (2011) Interrogating post-democratization: Reclaiming egalitarian political spaces. Political Geography 30,7: 370-380.
Zizek, S. (2006) The Lesson of Rancière. In Rancière, Jacques (ed.)The Politics of Aesthetics, London: Continuum, 69-79.
Purcell, M. (2013) The right to the city: The struggle for democracy in the urban public realm. Policy and Politics 41.3: 311-327.
Müller, J. (2016) What Is Populism? Philadelphia: University of Pennsylvania Press.
AUTOMATED AND AUTONOMOUS SPATIAL MOBILITIES, by Aharon Kellerman Cheltenham UK: Edward Elgar, 2018.
Currently we are beginning to see autonomous vehicles on the roads and increas-ing media references to smart cities and artificial intelligence enabled urban systems, yet there is a dearth of literature on the social implications of these technological advances. The fields that are producing the new technologies have decades of experi-ence and preparation to support their innovation, but the social sciences are only recently recognizing the need to understand their social context. A recent citation count found that less than one percent of the articles on autonomous vehicles are in the social sciences, yet it is the interaction between autonomous systems and society that will be one of the pressing challenges faced by cities and communities in the coming years.
Aharon Kellerman’s recent volume, Automated and Autonomous Spatial Mobilities, is a timely and valueable addition to the spatial and planning literature that helps social scientists frame and understand the concept, evolution and implica-tions of autonomous technologies. The book continues Kellerman’s innovative and transformative research by providing context for emerging autonomous systems. His initial focus on communications and information technologies is a fitting foun-dation because there are so many parallels between the two disruptive technologies.
The introduction discusses the nature of autonomy, focusing on freedom from control and in choices made by individuals, and then translates the personal to the societal. In particular, the recognition that autonomy relates to machines taking on tasks that individuals performed themselves in the past. The very nature of evolving
Book Reviews224
mobility is the history of mechanized movement such as bicycles, trains, automo-biles and aircraft. Increasingly, the use of these forms of transportation is aided by related autonomous systems that manage traffic and system safety.
In chapter two Kellerman addresses the characteristics of autonomy from a con-ceptual perspective, noting how humans have automatic control over many of their individual actions and movements, and then proceeds to trace the origin of autono-mous systems and in particular notes the transfer of these technologies from manu-facturing to mobility. Early examples of autonomous systems include the develop-ment of automatic transmissions and navigation systems that removed the need for the individual to focus on specific driving tasks.
The infrastructure needed to support mobility is considered in chapter three with its discussion of traffic control systems for vehicles, aircraft and ships. Kellerman reminds us that all aspects of mobility required the development of support sys-tems, with traffic lights as we know them starting in the 1920s when there were no automated controls in place. Automated public transit systems (chapter four) have been in place for many years, especially metro and shuttle systems that are driver-less in Europe and the United States. More advanced autopilot systems are used in shipping and aviation on a routine basis with intervention only needed occasionally, while the recent development of drones has added a new form of autonomous flight.
After discussing the link between autonomy and transportation, chapter five of-fers a different perspective, on virtual mobility and information transmission. This topic builds on Kellerman’s long standing research agenda addressing information and communications. Examples presented include automation used in landline and mobile phone systems, the internet and in cyberspace. What distinguishes these forms of autonomy is that they take place in virtual spaces, in contrast to the physi-cal space of transportation.
One technology or great significance yet with little empirical knowledge is auton-omous vehicles (AVs), which are discussed in chapter six. These vehicles represent an accumulation of technologies that facilitate mobility such as cruise control, collision avoidance, automated parking and navigation. Kellerman outlines the history and implications of the many technologies that go into today’s autonomous vehicle, and the six stages of automation from no assistance (level one) to full automation (level five). One element to consider in terms of social context is that all autonomous mobilities to date have been part of transportation systems managed by others, yet the AV is one that each person will be directly linked to each person.
The adoption of AVs depends greatly on public attitudes, that reflect a wide range of factors such as trust, confidence, usefulness, preparedness and cost. Currently, the public has mixed opinions as shown by several citations in the chapter. The challenge for the public is that while the engineering aspects have been long in development, the public has little experience riding in an AV or even seeing one on the street. The social sciences are in a similar position as they are also new to the technology and seek to understand and come to terms with the meaning of mobility evolution.
Book Reviews 225
Autonomous vehicles are not without concerns, as Kellerman notes. Some of the issues that need to be resolved include the cost of AVs, variations in standards and certification, insurance and liability, cybersecurity, privacy, the ethics of AV algorithms, and safety. As AVs are introduced we will also have decades of transi-tion with both human driven and autonomous vehicles populating the same streets. Beyond personal vehicles, AVs are recognized for their ability to revolutionize public transportation, trucking and delivery functions. For these applications, issues in-clude rider comfort and safety in an AV bus, and the employment implications of replacing drivers.
The use of vehicles is a partnership between the private ownership and control of a vehicle that also requires the public provision of roads, traffic control and po-licing. The arrival of AVs will also require changes in the road infrastructure and the advancement of intelligent transportation systems (chapter seven). Some of the anticipated implications include the environmental impacts of AVs, especially when many are electric rather than petrol/diesel powered. AVs will also open tourism and recreational opportunities but there is a segment of the population that enjoys driving, especially outside the daily commute, and this group is often ignored in discussions of new mobilities.
Overall, Aharon Kellerman’s Automated and Autonomous Spatial Mobilities is a valuable contribution to the literature on the spatial and societal issues associ-ated with autonomous mobilities. The volume provides a strong and well written foundation for social scientists to base their understanding and research. As au-tonomous systems are introduced, from vehicles to control mechanisms to artificial intelligence, we need to recognize that social context is imperative and that efforts need to be made to gain social benefit and minimize harm. History shows that new technologies may offer many benefits but they can also be used as a weapon that benefits some groups and marginalizes others. Aharon Kellerman has given us a nu-anced and fitting base from which to explore the social context of the autonomous future to come.
Mark Wilson Michigan State University

INSTRUCTIONS FOR AUTHORS
Geography Research Forum publishes articles on all subjects in human geography and related social sciences. Manuscripts are expected not to exceed 6,000 words (1,500 for book reviews) and typed in double-space. All manuscripts should be carefully edited. The title of the manuscript and name, position, institutional affiliation, address and E-mail address of the author(s) should appear on a separate page; only the title of the manuscript should appear on the opening page. All indications of the author’s identity should be removed from the text of the manuscript. References should appear within the relevant sentence or paragraph, as follows: (Smith, 2010) or (Smith, 2010, 21 (for direct quotes)). Endnotes are accepted, but should be kept at reasonable length and quantity.
The list of references should be arranged alphabetically in the following style: Smith, J.L. (2014) The Frozen City. Antarctica City: Polar Publishing House.Smith, J.L. (2014) Architecture and ice. In Gelida, C.C. (ed.) Frozen Cities. Antarctica City: Polar Publishing House, pp. 3–43.Smith, J.L., Jones, B. and Brown, S. (2014) The evolution of frozen cities in Ant¬arctica. Polar Forum, 15(3):25–32.
An abstract and 6–8 keywords should appear immediately following the author’s name and affiliation. All illustrations should be submitted as black and white high resolution eps, tiff, or PhotoShop files. Captions for tables should appear at the top of the table. Captions for the illustrations should also appear on a separate sheet. All illustrations and tables, including captions, should not exceed the size of 12 cm x 18 cm and be of high resolution (300 dpi). Text in tables should be 10 pt or, if necessary, 9 pt. Acknowledgements should be typed as a note at the end of the manuscript. Please refer to articles in this issue for further style examples. Manuscripts should be submitted by e-mail to the editor as Word or rtf files in their final form.
Submission of a paper implies acceptance of the following conditions:1. the paper reports unpublished work;2. the paper has not been submitted to any other journal;3. the author is fully authorized to submit the material for publication;4. if accepted, the paper will not be republished without the consent of the
publishers.
Send manuscripts by email to: Editor Geography Research Forum Email: [email protected]