Vol. 2 No. 4 December 30, 2014 - KISTI Institutional Repository
81
eISSN : 2287-4577 pISSN : 2287-9099 http://www.jistap.org Vol. 2 No. 4 December 30, 2014 Indexed/Covered by LISA, DOAJ, PASCAL, KSCI, KoreaScience and CrossRef 06 Internal Structure of Information Packages in Digital Preservation 20 h-index, h-type Indices and Role of Corrected Quality Ratio 31 Investigating the Combination of Bag of Words and Named Entities Approach in Tracking and Detection Tasks among Journalists 49 Information Pollution, a Mounting Threat: Internet a Major Causality 61 Ontology Supported Information Systems: A Review
-
Upload
khangminh22 -
Category
Documents
-
view
0 -
download
0
Transcript of Vol. 2 No. 4 December 30, 2014 - KISTI Institutional Repository

eISSN : 2287-4577 pISSN : 2287-9099http://www.jistap.org
Vol. 2 No. 4 December 30, 2014
Indexed/Covered by LISA, DOAJ, PASCAL, KSCI, KoreaScience and CrossRef
06Internal Structure of Information Packages in Digital Preservation
20h-index, h-type Indices and Role of Corrected Quality Ratio
31Investigating the Combination of Bag of Words and Named Entities Approach in Tracking and Detection Tasks among Journalists
49Information Pollution, a Mounting Threat: Internet a Major Causality
61Ontology Supported Information Systems: A Review

Table of Contents
Articles 06
JISTaP Vol. 2 No. 4 December 30, 2014Journal of Information Science Theory and Practice • http://www.jistap.org
2014 Copyright © Korea Institute of Science and Technology Information
Call for Paper 77
Information for Authors 78
Internal Structure of Information Packages in Digital Preservation- Seungmin Lee
06
h-index, h-type Indices and Role of Corrected Quality Ratio - Muzammil Tahira, Rose Alinda Alias, Arayti Bakri, Ani Shabri
20
Investigating the Combination of Bag of Words and Named Entities Approach in Tracking and Detection Tasks among Journalists- Masnizah Mohd, Omar Mabrook A. Bashaddadh
31
Information Pollution, a Mounting Threat: Internet a Major Causality- Ramesh Pandita
49
Ontology Supported Information Systems: A Review- T. Padmavathi, M. Krishnamurthy
61
6
JISTaPJournal of Information Science Theory and Practice
http://www.jistap.org
Internal Structure of Information Packages in Digital Preservation
Seungmin Lee *Department of Library and Information ScienceSookmyung Women’s University, Requblic of KoreaE-mail: [email protected]
Open Access
Accepted date: November 24, 2014Received date: November 12, 2014
*Corresponding Author: Seungmin LeeAssistant professorDepartment of Library and Information ScienceSookmyung Women’s University, Requblic of KoreaE-mail: [email protected]
All JISTaP content is Open Access, meaning it is accessible onlineto everyone, without fee and authors’ permission. All JISTaP content is published and distributed under the terms of the Creative Commons Attribution License (http:/ creativecommons.org/licenses/by/3.0/). Under this license, authors reserve the copyright for their content; however, they permit anyone to unrestrictedly use, distribute, and reproduce the content in any medium as far as the original authors and source are cited. For any reuse, redistribution, or reproduction of a work, users must clarify the license terms under which the work was produced.
ⓒ Seungmin Lee, 2014
ABSTRACTThe description of preserved resources is one of the requirements in digital preservation. The description is gen-erally created in the format of metadata records, and those records are combined to generate information pack-ages to support the process of digital preservation. However, current strategies or models of digital preservation may not generate information packages in efficient ways. To overcome these problems, this research proposed an internal structure of information packages in digital preservation. In order to construct the internal structure, this research analyzed existing metadata standards and cataloging rules such as Dublin Core, MARC, and FRBR to extract the core elements of resource description. The extracted elements were categorized according to their semantics and functions, which resulted in three categories of core elements. These categories and core elements were manifested by using RDF syntax in order to be substantially applied to combine metadata records in digital preservation. Although the internal structure is not intended to create metadata records, it is expected to provide an alternative approach to enable combining existing metadata records in the context of digital preservation in a more flexible way.
Keywords: Digital preservation, Information package, Metadata record, Internal structure
Research PaperJ. of infosci. theory and practice 2(4): 06-19, 2014http://dx.doi.org/10.1633/JISTaP.2014.2.4.1
7 http://www.jistap.org
Internal Structure of Information Packages in Digital Preservation
1. INTRODUCTION
With the rapid increase of resources in digital formats, there is growing attention to the preservation of those resources. In this changed information environment, the importance of digital preservation is now becoming a hot issue in many communities, including the library and information science field. The preservation of tradi-tional resources in printed formats has long been done in systematic ways. However, that of digital resources seems to be extremely different from the traditional ar-chiving of resources.
In its initial stage, the major object of digital preser-vation was born-digital resources. With the advantages of digital preservation in preserving resources, however, any type of resources, including printed materials, is now the object of digital preservation. These resources in analog formats are transformed or converted into digital formats and preserved in digital archives.
The process of digital preservation consists of mul-tiple phases that many experts from various fields need to participate in, including acquisition, archiving processes, storage, and dissemination of the resources preserved. In each phase, the target resource of digital preservation needs to be described in order to provide additional information. Therefore, the description of preserved resources is considered as the core of digital preservation. It can support an effective and efficient ap-proach to resource management which is optimized for digital preservation.
Resource description is generally created in the for-mat of metadata records using metadata standards. Digital preservation has also adopted various metadata standards, including rights, technical, administrative, and structural metadata, in order to provide detailed descriptions of preserved resources. In each phase of digital preservation, many metadata records are used to fully support the preservation process, which generates different types of information packages. However, these metadata standards adopt heterogeneous elements and the records generated based on these standards are con-sidered as independent records. This has resulted in in-efficiency in generating information packages and may not fully support each phase of the process of digital preservation.
In order to support efficient administration and management of digital preservation, heterogeneous
metadata records need to be combined in a more flexi-ble way during the process of digital preservation. From this perspective, this research proposes an approach to combine metadata records generated by heterogeneous metadata standards and to support the generation of information packages in digital preservation. This ap-proach considers a set of metadata records as an inde-pendent unit which can also be used as an information package that can support the process of digital preser-vation. In order to constitute information packages, an internal structure of the information packages needs to be constructed based on the elements used in a set of metadata records.
To achieve this goal, this research analyzes the core elements used in metadata records in the context of digital preservation. By extracting the core aspects of resource description in the process of digital preser-vation, the criteria for combining different metadata records can be established. Based on the core aspects, an internal structure for combining metadata records is constructed. This research also adopted Resource Description Framework (RDF) in order to manifest the internal structure of information packages, which can be substantially applied in the combination of metadata records and the generation of information packages. This internal structure can clearly show the components of information packages and establish the relationships between metadata records optimized for digital preser-vation.
2. CONCEPTUAL FOUNDATIONS
2.1. Concept of Resource Description and Digital Preservation
With the development of Information and Com-munication Technology (ICT), various types of infor-mation resources are rapidly increasing and have been published in digital format on the Web. In addition, ICTs can play an important role in support of the use of those resources. In this changed information environ-ment, the importance of digital preservation gains more weight in the management and re-use of information resources.
Although there are a variety of formats of information resources, most resources in both printed and digital formats are generally preserved in digital format be-

8
JISTaP Vol.2 No.4, 06-19
cause digital formatting has advantages in preserving resources from the perspective of retention and re-use of those resources.
Digital preservation refers to the series of managed activities necessary to ensure continued access to digital resources for as long as necessary (Digital Preservation Coalition, 2012). It includes all of the actions required to maintain access to digital resources beyond the limits of media failure or technological change (Gomes, Miranda & Costa, 2011).
In order to process digital preservation, it is required to identify and retrieve all related components for the purpose of preserving a digital object. From this perspective, the process of digital preservation is in-separable from accessing the preserved object, which can be supported by resource description (Vardigan & Whiteman, 2007). For these reasons, the object needs to be re-created in a surrogate form, which is mainly gen-erated in the format of metadata records.
In order for successful digital preservation, funda-mental principles for resource description need to be established. More specifically, metadata standards that can support the description of the preserved resources may be the core of the process of digital preservation. However, there are many limitations in establishing ap-propriate disciplines that can be applied to digital pres-ervation. From this perspective, many research efforts have been conducted to address these challenges and to develop digital preservation activities.
According to Heslop, Davis, and Wilson (2002), the object preserved in digital archives is often not an original physical object but a conceptual or virtual ob-ject that contains, replicates, or embodies the original object’s significant properties or essential qualities. It refers to the characteristics that need to be preserved as descriptive records. For these reasons, many research studies have made standardized conceptual models for supporting the description of preserved objects that can suit the purpose of their communities (Lynch, 2003).
However, it is possible that a preserved resource can change its format during its conversion or transforma-tion process in order to be included in digital preserva-tion. Metadata is required in this process and describes every aspect related to the resource from its origins to the current status in the digital preservation process. At this point, one important thing is that every change or property needs to be described in a standardized and
formal way (Calhoun, 2006). The description of pre-served resources is the core of digital preservation. In order to support resource description in digital preser-vation, many reference models and strategies have been proposed, including the Open Archival Information System (OAIS) Reference Model and DCC Curation Lifecycle Model.
In digital preservation communities, there have been many efforts to efficiently conduct digital preservation by standardizing the process of preserving resources in any format, including both born-digital and digitized resources. OAIS Reference Model is a representative model designed to support the overall process of digital preservation. The process provided by OAIS model con-sists of six steps. Each step requires different packages of additional information or metadata, and also needs different values for the same elements according to the purpose of each step, although they describe the same resource. From this perspective, the OAIS Reference Model defines long-term preservation in terms of the concept of an information package, for example, digital content and its associated metadata as a single package moving into (Submission Information Package: SIP), through (Archival Information Package: AIP), and out of (Dissemination Information Package: DIP) the archi-val system (Lane, 2012). Different metadata records may constitute different information packages. However, current approaches lack a well-defined architecture to support the use of preserved resources.
2.2. Challenges in Resource Description for Digital Preservation
Digital preservation is expected to provide a way of utilizing and reusing resources and the efficient long-term management of valuable resources. Because of arbitrary generation of information packages in the pro-cess of digital preservation, however, there are problems with resource description and the generation of infor-mation packages (IMS, 2003). In addition, because each set of metadata records is generated based on hetero-geneous metadata standards and is independent from other records, they may not be efficiently reused when the process goes on. Therefore, each step may generate metadata records for the same resource redundantly. It may increase the complexity of the overall process of digital preservation. For these reasons, practical issues are considered in order to make appropriate use of re-

9 http://www.jistap.org
Internal Structure of Information Packages in Digital Preservation
source description in the context of digital preservation. There is also a need to develop approaches and models for the re-use and connection of metadata records.
Resources for preservation go along with resource description. This description as additional information will have to be linked together in some way and meth-ods of updating the resources and related information will have to be considered (NLII, 2003). From this per-spective, a preserved resource is any resource that can be used to facilitate information activities and has been described using metadata. A resource cannot be regard-ed as a resource in digital preservation until it is made explicit through the addition of metadata. For these reasons, there is a growing awareness that preserving in-formation resources will need to be expanded to include appropriate description through information packages by combining interrelated and relevant metadata re-cords (Beagrie, 2002; Crow, 2002).
To fully support resource description in the context of digital preservation, metadata records that deal with every aspect of the preserved resource should be gen-erated in each phase of digital preservation (Hedstrom, 1998). Because the same resource is described based on different metadata standards, the description can vary according to the unique purpose of each phase in the process of digital preservation. In the current status of digital preservation, however, the adoption of heteroge-neous metadata standards has resulted in the inefficien-cy of generating information packages. This is mainly because the current reference models provide heteroge-neous metadata records in each phase. For this reason, each metadata record is considered as an independent unit that may be isolated in each phase and may not be able to be fully reused in other phases
3. METHODOLOGY
To overcome the limitations and problems in resource description when preserving various resources, it is re-quired to have a standardized way for resource descrip-tion that can be applied to the overall process of digital preservation. The purpose of this research is to manifest a conceptual framework that represents each aspect of a variety of resources and supports the process of digital preservation by providing detailed resource description.
This research consists of three phases: (1) analysis of
the core aspects of metadata records in the context of digital preservation, (2) conceptualization of the inter-nal structure of information packages optimized for digital preservation processes, and (3) the manifestation of internal structure to generate information packages.
This research begins with a review of the concept and role of resource description. This may be the foundation of digital preservation because it provides detailed de-scription of preserved resources. In digital preservation, each resource description is not independent but inter-related with each other and provides a set of descrip-tions to support each phase of digital preservation. By reviewing the core aspects of resource description, the embedded meanings and the substantial functions of the description can be identified. Based on the reviews of resource description, the combination of metadata records can be achieved in a more flexible way and can support the overall process of digital preservation.
Based on the notion of resource description, the essential components of metadata records in digital preservation would be extracted. The existing metadata standards can be used to extract the core elements of metadata records for digital preservation. The identified elements are categorized according to their intended use and the relationships among the elements. These categories constitute the basic framework of the internal structure with multi-layered structure for generating information packages.
A structured framework for combining metadata records is constructed on the basis of the internal struc-ture of information packages. This framework is not for acquiring metadata interoperability, but is a conceptual foundation that can combine existing metadata records in order to satisfy the purpose of each phase of the pro-cess of digital preservation. Each of the core elements that constitute the internal structure can be used as a reference point that provides a flexible combination of metadata records and generates various information packages applied in digital preservation.
In order to manifest the internal structure of informa-tion packages, this research adopts Resource Descrip-tion Framework (RDF) so that the existing metadata records can be combined in a flexible way, which is an optimized way for each phase of digital preservation.
The approach proposed in this research might be helpful to clarify the internal structure of information packages, so that the management and description of

10
JISTaP Vol.2 No.4, 06-19
resources contained in digital archives can be supported.
4. CONSTRUCTION OF INTERNAL STRUCTURE OF INFORMATION PACKAGE
To provide more efficient ways of utilizing informa-tion packages and to support digital preservation, meta-data records applied to each phase need to be combined according to the unique purpose of each phase. In order to achieve the combination of metadata records, the internal structure of information packages should be established.
4.1. Layers of Metadata Records The combination of metadata records requires a set
of elements that can uniquely identify each metadata record. The element set can be used as primary keys of connecting metadata records. By using the key ele-ments, heterogeneous metadata records can retain their intrinsic elements that may fully satisfy the purpose of each phase. In addition, each metadata record can be applied in a more flexible way in generating information packages whenever it is required. In setting up a set of elements as primary keys, however, the core elements used in metadata records should be identified, which can be manifested as the internal structure of metadata records.
An element can be related to other elements if they share some meanings. This establishes element rela-tionships. This relationship makes the meaning and functions of each element clear. Each element can have attributes that describe certain aspects of the element and prescribe the range of the meaning of the element. These attributes can be also considered as components of resource description. However, most of these attri-butes can be applied to only one element, although some attributes can be broadly applied to other elements. The attribute may not be important in constructing the in-ternal structure of information packages because it does not establish relationships with other elements and the range of the meaning is relatively narrow. Therefore, this research does not consider the attribute as the compo-nent of information packages.
The elements traditionally used to describe an in-formation resource are linearly enumerated in one-di-mensional structure. Although this linear structure can
clearly show the meanings of the elements embedded in information packages, it cannot fully show the rela-tionships among elements if one element has multiple relationships with other elements. In some cases, hier-archical structure can be more efficient to show the re-lationships among elements. However, not all elements do have a hierarchical relationship and the hierarchical structure may not provide the space for the enumera-tion of the meaning of each element.
In this research, a hybrid approach was used that combines linear and hierarchical structure. It can have multiple layers with enumeration of elements. Each el-ement in each layer has hierarchical relationships with other elements in other layers. This multi-layered struc-ture can enumerate the meanings of elements in detail and can also show the hierarchical relationships among elements.
4.2. Identification of Core Elements for Information Packages
In order to construct the internal structure of infor-mation packages, the components of an information package need to be transformed to a set of descriptive elements that can be substantially applied to the de-scription of preserved resources. The elements of infor-mation packages can be transformed from each aspect of the information resources.
The elements of an information package may be sim-ilar to the traditional descriptive elements for informa-tion resources. However, they may be related to other elements in multiple layers. This is because an informa-tion package is a group of metadata records that share the same contents. In order to comprehensively com-bine different metadata records for the same resource, the elements used in metadata records should be tied in a structured format.
In order to extract the core elements for resource description in the context of digital preservation, this research used two existing metadata standards (Dublin Core and MARC) and one cataloging rule (FRBR). Dublin Core is one of the most representative metadata standards across communities and provides core ele-ments in describing resources in any format. Although MARC was originally designed for printed materials in the library community, it is now applied to any for-mat of resources both in printed and digital formats. These metadata standards are expected to identify the

11 http://www.jistap.org
Internal Structure of Information Packages in Digital Preservation
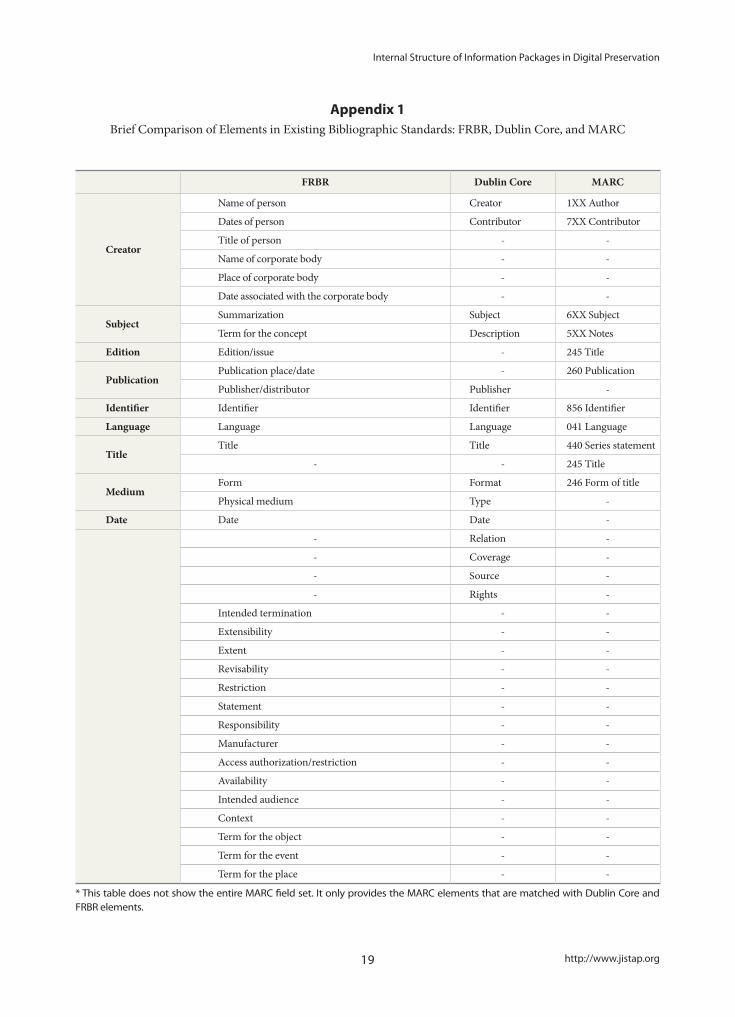
elements that can be essentially used in the resource description for digital preservation. Functional Require-ments for Bibliographic Records (FRBR) is not a meta-data standard, but a kind of cataloging rule. However, it provides a conceptual structure in describing resources and in supporting the establishment of relationships between elements used in resource description. It can be also used to combine inter-related elements when de-scribing resources. By analyzing these three standards, the essential elements for digital preservation can be extracted (see Appendix 1). The core elements that can be applied to generate information packages appear to be nine elements (see Table 1).
Although these elements may be used as a set of core elements in digital preservation, each element cannot properly identify the preserved resources. Therefore, a set of core elements need to be connected as an in-dependent unit. By using the set of elements, it can properly function as core elements that can support the generation of information packages.
4.3. Multi-Layered Element Relationships for Information Packages
The internal structure of an information package with semi-hierarchical structure proposed in this research consists of three layers with hierarchies: content, carrier, and publication. The layer ‘content’ can be defined as a set of bibliographic elements that describes specific as-
pects of a resource related to the content of the resource, such as title, creator, and subject. The layer ‘carrier’ is a set of elements that describes the medium of resource which manifests and communicates its contents. Repre-sentative elements contained in the ‘carrier’ layer include medium, language, date, and identifier. The bibliograph-ic elements that represent the information related to the publication of the content and media are categorized in the ‘publication’ layer. It includes the elements such as publisher and edition, which are related to the publica-tion of the resource.
These layers were based on the categories of inter-re-lated elements extracted from the three standards. Each layer contains related elements as sub-elements and es-tablishes certain types of relationship with one or more elements. These relationships are established when one element has effect on the meaning of the related ele-ments in constructing an internal structure of the infor-mation package.
This research adopted the social network theory when establishing element relationships. The social network theory seems to be useful to identify the relationship between elements in information packages because each element can be seen as a component of element rela-tionships within bibliographic description. The relation-ship between elements in information packages can be divided into three main types according to strength of relations: strong, medium, and weak ties. The strength
Table 1. Core Elements of Information Packages
Core Element Definition
Creator A group of creators responsible for the content of individual information resources that share the same or variation of the original content
Title A group of names of information resources that share the same or a variation of content
Subject A set of one or more terms that represent the content contained in an information package
Publication Information related to the manifestation of the same or a variation of content in individual information resources
Language Specific languages used to represent the same or a variation of content contained in an information package
Edition A certain version of individual information resources contained in an information package
Identifier A set of characters assigned to individual information resources contained in an information package
Date Information related to the date of individual resources contained in an information package
Medium Formats of individual information resources contained in an information package

12
JISTaP Vol.2 No.4, 06-19
of relationship refers to the closeness between two or more components and the range of the function of each component. This strength of relationship can represent the detailed relationships with related elements and can play an important role in constructing the internal structure of information packages.
4.3.1. Content layerAmong the nine elements provided in Table 1, Cre-
ator and Title are connected with strong ties. The ele-ment Title also establishes a strong tie with the element Subject (see Fig. 1). These two strong ties establish a weak tie among the elements Creator and Subject. These three elements are the ones that describe the content of the information package. The content of the information package is not changed or affected by other parts of the information package, no matter what forms the infor-mation package takes. The three elements that describe the content do not describe or prescribe other elements.
This means that the meaning of these three elements is not changed or affected by other elements. They can be considered to be grouped together because they are all related to the content of the information package.
4.3.2. Carrier layerThe elements Language, Identifier, Date, and Medi-
um specify each aspect of the carrier of information resources. They only describe and prescribe the ele-ments in other layers. The meanings of these elements can be changed according to context and the element value can be also changeable. These elements can be grouped together because they are related to the carrier of the information package. However, there is no direct relationship among these elements. These elements can only be connected through other elements. This type of connection establishes weak ties among these elements (see Fig. 2).
Title
Creator Subject
Fig. 1 Element relationships in Content layer
Medium Language
Identifier
Fig. 2 Element relationship in Carrier layer
Date

13 http://www.jistap.org
Internal Structure of Information Packages in Digital Preservation
Edition
Fig. 3 Element relationship in Publication layer
Publisher
4.3.3. Publication layerThe elements Publisher and Edition share many char-
acteristics and can be considered as similar elements in the context of digital preservation. This is because Edition is also a kind of publication of an information resource. In terms of bibliographic information, how-ever, these two elements describe different aspects of information resources. Therefore, Publisher and Edi-tion should be considered as different elements in the internal structure of information packages. These two elements are described by other elements, and simul-taneously describe and prescribe the meaning of other elements. These elements represent the process of pub-lishing information resources in order to transmit and communicate information. Therefore, these elements can be considered as a manifestation of the carrier of information. They are also related to the content of an information package. The elements Publisher and Edi-tion establish a strong tie and can be grouped together because they are related to the publication process of information packages (see Fig. 3).
4.4 Construction of Internal StructureThe internal structure of information packages can
be divided into two parts: layer-level and element-level. The relationships in layer-level construct the framework of the internal structure of an information package. The layer-level relationship concentrates on creating layers by combining elements that have the same or similar meanings and representing the relationships between the layers. The layer relationship adopts a hierarchical structure that can clearly represent hierarchical rela-tionships among elements in different layers. This hi-erarchical structure is also useful to represent multiple relationships if an element establishes relationships with more than one element.
Linear structure is used to represent element relation-ships in each layer in element-level. Each layer enumer-ates elements that have the same or similar meaning and
functions. The linear structure is efficient to describe the detailed meanings and characteristics of each element in element-centered aspects which hierarchical structure cannot clearly represent. In addition, the element rela-tionships that do not establish hierarchical relationship can be clarified by using linear structure.
By using the structure that combines hierarchical and linear structure, the meanings and functions of the elements in information packages can be clearly represented. The proposed internal structure of infor-mation packages consists of three layers: Content layer, Publication layer, and Carrier layer. Each layer adopts linear structure to enumerate the embedded elements. The enumerated elements are connected with other ele-ments by establishing specific relationships (see Fig. 4).
The Content layer is placed on the top of the internal structure. The elements embedded in the Content layer are connected with each other by establishing strong ties with the element Title. Although the elements Creator and Subject are not directly connected, the weak ties are established through the element Title. The elements in the Content layer are described and prescribed by the elements in other layers.
The Publication layer is placed in the middle of the internal structure. It functions as a mediator that con-nects the Content layer and the Carrier layer. The two elements embedded in the Publication layer establish strong relationships and describe the element Title in the Content layer. The two elements in the Publication layer do not establish any direct relationship with the elements Creator and Subject in the Content layer, thus weak relationships are established with those elements through the element Title. Therefore, the Publication layer can be considered to describe the Content layer. The Publication layer is also described by the Carrier layer.
The Carrier layer is placed at the bottom of the inter-nal structure. The elements in this layer describe all ele-ments in the Publication layer. This element relationship

14
JISTaP Vol.2 No.4, 06-19
is established by medium ties between the Publication and the Carrier layers. The elements in the Carrier layer also describe the elements in the Content layer. There-fore, the Carrier layer establishes medium ties with both the Publication layer and weak ties with the Content lay-ers. However, not all of the elements in the Carrier layer describe all of the elements in the Content layer. There-fore, the relationship between the Content and Carrier layers is not a layer-level relationship. The relationship can be considered as an element-level relationship. Al-though the elements embedded in the Carrier layer are mainly related to represent the characteristics of the car-rier of information, these elements are also used to de-scribe the elements in the Publication and the Content layers. The elements in the Carrier layer play important roles in connecting all components of the information package through certain types of relationships.
Synthetically, the layer-level relationship constructs the framework of the internal structure of the informa-tion package. This layer relationship is established by the relationships between the elements embedded in each layer. Therefore, the element relationship among ele-ments embedded in each layer provides the foundation of constructing the internal structure of the information package. The elements function as internal nodes that
connect each layer. They can also function as external nodes to connect other information packages that con-tain the same element values.
5. MANIFESTATION OF INTERNAL STRUCTURE
The proposed internal structure of information packages identifies the core elements that constitute an information package and the element relationships that connect the components of the information package. The internal structure can clearly identify the meanings and functions of the elements of information packages.
Once the categories of core elements are established, they can be used to combine a set of metadata records in digital preservation. However, these categories and elements are not designed for substantially describing resources. They are intended to be used to combine metadata records that describe preserved resources in a standardized way. In order to achieve the combination of records, the categories and core elements need to be manifested in a formal format of metadata. This re-search applied Resource Description Framework (RDF) based on eXtensible Markup Language (XML) and con-
Content Layer
Creator Subject
Title
Publication
Date Identifier
Language Medium
Carrier Layer
Edition/Version
Fig. 4 Proposed internal structure of information package
Publication Layer
15 http://www.jistap.org
Internal Structure of Information Packages in Digital Preservation
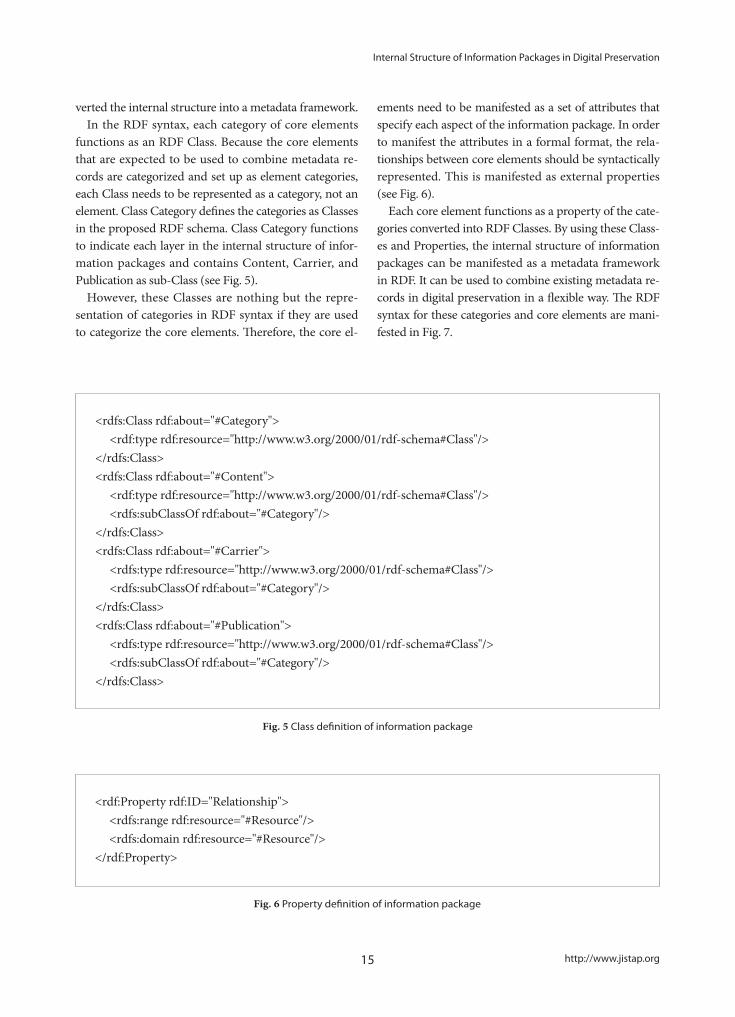
verted the internal structure into a metadata framework.In the RDF syntax, each category of core elements
functions as an RDF Class. Because the core elements that are expected to be used to combine metadata re-cords are categorized and set up as element categories, each Class needs to be represented as a category, not an element. Class Category defines the categories as Classes in the proposed RDF schema. Class Category functions to indicate each layer in the internal structure of infor-mation packages and contains Content, Carrier, and Publication as sub-Class (see Fig. 5).
However, these Classes are nothing but the repre-sentation of categories in RDF syntax if they are used to categorize the core elements. Therefore, the core el-
ements need to be manifested as a set of attributes that specify each aspect of the information package. In order to manifest the attributes in a formal format, the rela-tionships between core elements should be syntactically represented. This is manifested as external properties (see Fig. 6).
Each core element functions as a property of the cate-gories converted into RDF Classes. By using these Class-es and Properties, the internal structure of information packages can be manifested as a metadata framework in RDF. It can be used to combine existing metadata re-cords in digital preservation in a flexible way. The RDF syntax for these categories and core elements are mani-fested in Fig. 7.
<rdfs:Class rdf:about="#Category"> <rdf:type rdf:resource="http://www.w3.org/2000/01/rdf-schema#Class"/></rdfs:Class><rdfs:Class rdf:about="#Content"> <rdf:type rdf:resource="http://www.w3.org/2000/01/rdf-schema#Class"/> <rdfs:subClassOf rdf:about="#Category"/></rdfs:Class><rdfs:Class rdf:about="#Carrier"> <rdfs:type rdf:resource="http://www.w3.org/2000/01/rdf-schema#Class"/> <rdfs:subClassOf rdf:about="#Category"/></rdfs:Class><rdfs:Class rdf:about="#Publication"> <rdfs:type rdf:resource="http://www.w3.org/2000/01/rdf-schema#Class"/> <rdfs:subClassOf rdf:about="#Category"/></rdfs:Class>
Fig. 5 Class definition of information package
<rdf:Property rdf:ID="Relationship"> <rdfs:range rdf:resource="#Resource"/> <rdfs:domain rdf:resource="#Resource"/></rdf:Property>
Fig. 6 Property definition of information package

16
JISTaP Vol.2 No.4, 06-19
<rdf:Property rdf:ID="creator"> <rdfs:range rdf:resource="#Content"/></rdf:Property><rdf:Property rdf:ID="title"> <rdfs:range rdf:resource="#Content"/></rdf:Property><rdf:Property rdf:ID="subject"> <rdfs:range rdf:resource="#Content"/></rdf:Property><rdf:Property rdf:ID="publication"> <rdfs:range rdf:resource="#Publication"/></rdf:Property><rdf:Property rdf:ID="language"> <rdfs:range rdf:resource="#Carrier"/></rdf:Property><rdf:Property rdf:ID="edition"> <rdfs:range rdf:resource="#Publication"/></rdf:Property><rdf:Property rdf:ID="identifier"> <rdfs:range rdf:resource="#Carrier"/></rdf:Property><rdf:Property rdf:ID="date"> <rdfs:range rdf:resource="#Carrier"/></rdf:Property><rdf:Property rdf:ID="medium"> <rdfs:range rdf:resource="#Carrier"/></rdf:Property>
Fig. 7 RDF definitions of information package
As shown in Fig. 7, the nine core elements function as properties of the Class Category. Each property is expected to function as a mediator that combines the external elements used in the overall process of digital preservation. Based on the core elements as properties, the elements in information packages can be inter-re-lated with each other and can provide more detailed re-source description according to the phases of the overall process of digital preservation.
The elements can also integrate all the aspects of pre-served resources that most of the types of the current
resources contain. Therefore, the proposed structure can support the description of preserved resources opti-mized for each phase of the process of digital preserva-tion. It can also clearly represent the details of preserved resources and establish relationships across metadata records created during the preservation process.
Although the internal structure of information pack-ages are manifested using RDF syntax, this structure can be used to connect external metadata records cre-ated in other communities. Because the core elements are extracted from the existing metadata standards that

17 http://www.jistap.org
Internal Structure of Information Packages in Digital Preservation
are commonly adopted in a variety of communities, the metadata records used in those communities can be ap-plied to the generation of information packages via the core elements. From this perspective, the core elements and element categories can be considered as reference points to combine metadata records generated in com-munities other than digital preservation.
The Classes and Properties in the internal structure of information packages can also have a specific set of metadata elements from other metadata standards as a subset of each element. By adopting those external elements, the internal structure can provide more de-tailed descriptions for preserved resources. Therefore, the internal structure can be considered as an umbrella structure for both resource description in digital preser-vation and a conceptual structure for integrating meta-data standards. With these strengths, the internal struc-ture proposed in this research is expected to be used as a conceptual foundation for generating information packages that can be flexibly applied to satisfy specific purposes of resource description across communities.
6. CONCLUSION
With the rapid increase of information resources in digital format, the importance of digital preservation gains more weight across communities. Although many research efforts have been conducted to support the process of digital preservation and have provided stan-dardized models and strategies, they have limitations because of inefficient and inconsistent description of preserved resources. In addition, the use of information packages in each phase of digital preservation may not fully support the unique purpose of digital preservation and/or resource description. To overcome these lim-itations and to address the current problems in digital preservation, this research proposed an internal struc-ture of information packages generated in the process of digital preservation.
The internal structure is based on the core elements that are commonly used in creating metadata records across communities. The set of core elements describes the common characteristics of a variety of information resources and functions as a reference point in gen-erating information packages in the context of digital preservation. The core elements were extracted from
the existing metadata standards such as Dublin Core and MARC. In addition to these standards, a kind of cataloging rule, which is FRBR, is also analyzed to pro-vide conceptual relationships across the extracted core elements. These extracted elements were categorized according to their semantics and functions in describ-ing information resources. The categories of the core elements consist of three groups of elements, which are content-related, publication-related, and carrier-related elements. Each category constitutes a layer that can pro-vide a space for enumeration of the core elements and can provide detailed description of preserved resources. The three layers also constitute a hierarchical structure in resource description for generating information packages.
Based on the constructed internal structure of infor-mation packages, this research manifested each category and core element in RDF syntax. This can provide a standardized format of converting the categories and core elements in a metadata format. Through the RDF syntax, the internal structure of information packages can be applied to substantially generate information packages by combining metadata records created during the process of digital preservation.
In digital preservation, information packages play an important role because they can satisfy the unique purpose of each phase of digital preservation and pro-vide detailed description of preserved resources. The internal structure of information packages proposed in this research is designed to support the combination of metadata records for the same resource created by heterogeneous metadata standards. Although this ap-proach is not intended to substantially describe actual information resources, it is expected to provide an alter-native approach to combine existing metadata records in the context of digital preservation, and functions as a conceptual foundation of generating information pack-ages in a more flexible way.
REFERENCES
Beagrie, N. (2002). A continuing access and digital pres-ervation strategy for the Joint Information Systems Committee (JISC), 2002-2005. Retrieved September 18, 2014, from http://www.jisc.ac.uk/uploaded_documents/dpstrategy2002b.rtf

18
JISTaP Vol.2 No.4, 06-19
Calhoun, K. (2006). The changing nature of the catalog and its integration with other discovery tools. Wash-ington, D.C.: Library of Congress. Retrieved Sep-tember 29, 2014, from http://www.loc.gov/catdir/calhoun-report-final.pdf
Crow, R. (2004). The case for institutional repositories: A SPARC position paper. The Scholarly Publishing and Academic Resources Coalition, 2002. Re-trieved October 15, 2014, from http://www.arl.org/sparc/IR/ir.html
Digital Preservation Coalition (2012). Digital pres-ervation handbook. Retrieved October 27, 2014, from http://www.dpconline.org/advice/preser-vationhandbook/topic/168-introduction-defini-tions-and-concepts
Gomes, D., Miranda, J., & Costa, M. (2011). A survey on Web archiving initiatives. In Proceedings of the 15th International Conference on Theory and Prac-tice of Digital Libraries (TPDL ’11): Research and Advanced Technology for Digital Libraries, 408-420. Berlin: Springer-Verlag.
Hedstrom, M. (1998). Digital preservation: A time bomb for digital libraries. Computers and the Hu-manities, 31, 189-202.
Heslop, H., Davis, S., & Wilson, A. (2002). An approach to the preservation of digital records. National Archives of Australia. Retrieved October 22, 2004, from http://www.naa.gov.au/recordkeeping/er/dig-ital_preservation/Green_Paper.pdf
IMS (2003). IMS Digital Repositories Specification. Retrieved October 15, 2014, from http://www.ims-global.org/digitalrepositories/index.cfm
Lane, H. (2012). Models for the EU Arctic Information Centre: Engaging the polar libraries colloquy. In Proceedings of the 24th polar libraries colloquy: Cold regions: Pivot points, focal points, 169-170. Boulder, CO, USA, June 11-14.
Lynch, C. A. (2003). Institutional repositories: Essential infrastructure for scholarship in the digital age. ARL Bimonthly Report, 226. Retrieved September 15, 2004, from http://www.arl.org/newsltr/226/ir.html
NLII (National Learning Infrastructure Initiative) (2003). Learning objects (NLII 2002-2003 Key Themes). Retrieved September 20, 2014, from http://www.educause.edu/nlii/keythemes/Learnin-gObjects.asp#nlii_research
Vardigan, M., & Whiteman, Cole. ICPSR meets OAIS: Applying the OAIS reference model to the social science archive context. Archival Science, 7, 73-87.
19 http://www.jistap.org
Internal Structure of Information Packages in Digital Preservation
FRBR Dublin Core MARC
Creator
Name of person Creator 1XX Author
Dates of person Contributor 7XX Contributor
Title of person - -
Name of corporate body - -
Place of corporate body - -
Date associated with the corporate body - -
SubjectSummarization Subject 6XX Subject
Term for the concept Description 5XX Notes
Edition Edition/issue - 245 Title
PublicationPublication place/date - 260 Publication
Publisher/distributor Publisher -
Identifier Identifier Identifier 856 Identifier
Language Language Language 041 Language
TitleTitle Title 440 Series statement
- - 245 Title
MediumForm Format 246 Form of title
Physical medium Type -
Date Date Date -
- Relation -
- Coverage -
- Source -
- Rights -
Intended termination - -
Extensibility - -
Extent - -
Revisability - -
Restriction - -
Statement - -
Responsibility - -
Manufacturer - -
Access authorization/restriction - -
Availability - -
Intended audience - -
Context - -
Term for the object - -
Term for the event - -
Term for the place - -
* This table does not show the entire MARC field set. It only provides the MARC elements that are matched with Dublin Core and FRBR elements.
Appendix 1Brief Comparison of Elements in Existing Bibliographic Standards: FRBR, Dublin Core, and MARC

20
JISTaPJournal of Information Science Theory and Practice
http://www.jistap.org
h-index, h-type Indices, and the Role of Corrected Quality Ratio
Open Access
Accepted date: November 16, 2014Received date: October 23, 2014
*Corresponding Author: Muzammil TahiraDepartment of Information Systems Faculty of Computing Universiti Teknologi Malaysia (UTM), MalaysiaE-mail: [email protected]
All JISTaP content is Open Access, meaning it is accessible onlineto everyone, without fee and authors’ permission. All JISTaP content is published and distributed under the terms of the Creative Commons Attribution License (http:/ creativecommons.org/licenses/by/3.0/). Under this license, authors reserve the copyright for their content; however, they permit anyone to unrestrictedly use, distribute, and reproduce the content in any medium as far as the original authors and source are cited. For any reuse, redistribution, or reproduction of a work, users must clarify the license terms under which the work was produced.
ⓒ Muzammil Tahira, Rose Alinda Alias, Arayti Bakri, Ani Shabri, 2014
ABSTRACTThis study examines the foremost concerns related to most noted research performance index. The most popular and widely acceptable h-index underestimates the highly visible scientist, the middle order group, due to citation distribution issues. The study addresses this issue and uses ‘Corrected Quality Ratio’ (CQ) to check the implicit un-derpinnings as evident in h-index. CQ helps to incorporate the aspects of a good research performance indicator. This simple revision performs more intimately and logically to gauge the broader research impact for all groups and highly visible scientists with less statistical error.
Keywords: Scientometric, Research Performance Evaluation, Corrected Quality Ratio, h-index, H', h-cpp, g-index, R-index, A-index, m-index, q2-index
Research PaperJ. of infosci. theory and practice 2(4): 20-30, 2014http://dx.doi.org/10.1633/JISTaP.2014.2.4.2
Muzammil Tahira *Department of Information Systems Faculty of Computing Universiti Teknologi Malaysia (UTM), MalaysiaE-mail: [email protected]
Arayti Bakri Department of Information Systems Faculty of Computing Universiti Teknologi Malaysia (UTM), MalaysiaE-mail: [email protected]
Rose Alinda AliasDepartment of Information Systems Faculty of Computing Universiti Teknologi Malaysia (UTM), MalaysiaE-mail: [email protected]
Ani ShabriDepartment of Mathematical SciencesFaculty of Science Universiti Teknologi Malaysia (UTM), MalaysiaE-mail: [email protected]

21 http://www.jistap.org
h-index, h-type Indices, and the Role
1. INTRODUCTION
Metrics/indices play a crucial role for peer-based, metrics-based, or hybrid research evaluation ap-proaches. Selection and usage of indices to appraise quantity and impact of the productive core is a sen-sitive subject for Research Performance Evaluation (RPE). In evaluative scientometric studies, these pa-rameters are measured by Activity Indicator (AI), Ob-served Impact Indicator (OII), journal related indices, and/or other newly introduced global indices (h and h-type indices). These indicators stand for the quantity, impact, influence, or quality of the scholarly commu-nication. AI measures the quantity of the productivity core (publication) while OII stands for impact of pro-ductivity core (citation and its subsequent metrics).
Disciplinary perspectives, the use of indicators in different contexts, the arbitrary nature of indicators, and electronic publishing scenarios have turned the attention of scientometricians, policymakers, and researchers of other fields to modifying the existing in-dices and to discovering new metrics to gauge quantity and quality. Citation, its subsequent metrics, and the root indicator publications have a sound place in the decision-making process.
In 2005, Hirsch proposed h-index, which was imme-diately noticed by the scientometricians and warmly welcomed by all stakeholders. It is defined as: “A scientist has index h if h of his/her Np papers has at least h cita-tions each and the other (Np − h) papers have no more than h citations each” (Hirsch, 2005, p. 16569). The said index aims to measure the impact of scholarly commu-nication in terms of quality (citation) and productivity (publication) in an objective manner. It represents the most productive core of an author’s output in terms of the most cited papers (Burrell, 2007). A continuous de-bate among scientometricians, policymakers, as well as researchers of other fields has made h-index one of the hottest topics in the history of scientometric research.
2. BACKGROUND OF THE STUDY
Rousseau (2006) introduced the term Hirsch core (h-core), which is a group of high-performance publi-cations with respect to the scientist’s career (Jin, et al., 2007). A good indicator should be intuitive and sensi-
tive to the number of uncited papers (Tol, 2009). Such an index should exceed from h-core papers (Vinkler, 2007) and “must assign a positive score to each new citation as it occurs” (Anderson, et al., 2008). Notwith-standing, h-index also suffers from several implicit disadvantages such as sensitivity to highly cited paper (Egghe, 2006a; Egghe, 2006b; Norris & Oppenheim, 2010), giving more weight to one or few highly cited publications (Glänzel, 2006; Egghe, 2006a; Costas & Bordons, 2007), lacking in sensitivity to performance change (Bihui, et al., 2007), disadvantaging earlier ca-reer work (Glanzel, 2006; Burrell, 2007), and being time dependent (Burrell, 2007). While highly cited papers may represent breakthrough results in computing h-in-dex (Vinkler, 2007), this index is also criticized for its lack in accuracy and precision (Lehmann, et al., 2005).
Soon after h-index, several modification and im-provements have been proposed. Due to its persuasive nature, the field dependence, self-citation, multi-au-thorship, and career length were also taken into ac-count (Bornmann, et al., 2011; Norris & Oppenheim, 2009). It is important to note that most of the new indices focused on h-core only, while citation distribu-tion in the head and tail cores remain ignored due to their formulaic limitations (Pathap, 2010; Bornmann, et al., 2011; Zahang, 2009; 2013). Fig. 1 shows the head, tail, and h-core. The publications and citations, which define h-index, are called h-core; whereas pub-lications with citations more/less than h-core are de-fined as head and core, respectively.
Fig. 1 h, head, and tail core (a modification of Harish’s h-index figure)

22
JISTaP Vol.2 No.4, 20-30
The literature reveals that the h-index not only in-corporates quantity and quality, but it is also simple, efficient, and has ease in use. It laurels over the other research evaluation metrics due to a blend of objectivi-ty and subjectivity, and its scientific and persuasive na-ture. This index is insensitive to highly as well as zero cited articles and is robust (van Raan 2006; Cronin & Meho 2006; Imperial & Navarro 2007; Oppenheim 2007; Luz et.al., 2008; Bornmann, et al., 2008; Bouabid & Martin 2008; Lazaridis 2009, Norris and Oppen-heim, 2010, Tahira, et al., 2013). These underpinnings have led to the introduction of numerous h-type in-dices, mostly focused on citation distribution issues. We refer to review studies by Norris and Oppenheim (2010) and Bornmann, et al., (2011). Though h-index has made its place for Research Performance Evalua-tion (RPE), yet there is a need to address its inherent reservations more intimately and logically.
3. METHODOLOGY
The actor CPP was considered as a multiplicative connection to the Corrected Quality Ratio (CQ) to incorporate the overall quality of production (Lindsey, 1978). The hG-H model used it to link to publications (Schubert & Glänzel, 2007) and in p-index with citation as quantity indicator (Parthap, 2010). We are consider-ing CPP actor to deal with the core issue of the citation distribution as evident in classic h-index. The aim is to address the implicit dimensions of original h-index.
Our proposed index uses ‘Citation Per Publication’ (CPP) as a balancing correction to improve the original h-index underpinnings related to citation distribution issues in the head and tail cores. It is expressed as a multiplicative connection between h and CPP with the geometric mean of these functions ( ) (Fig. 1). We employed a geometric mean to compute differ-ent functions, which are multiplied together to pro-duce a single “figure of merit” (Spizman & Weinstein, 2008).
Keeping in view the foundation issues of original h-index (see Table 1), we have designed three catego-ries from the proposed h-type indices: modified h-in-dices, h-type indices dependent on h-core, and h-type indices independent of h-core. These categories are concerned with h-core, head, and tail citation distri-
butions. For the present study, we have considered at least one index from these categories. To avoid redun-dancy, a few indices which fall in these categories, like hw (Egghe & Rousseau, 2008) and v-index (Riikonen & Vihinen, 2008), are not considered. These selected indices along with the proposed h-cpp index are ex-amined and evaluated to check their performance for evaluation purposes.
Two experiments are conducted at the author level. Jacso wrote a series of articles on pros and cons of popular online referenced enhanced databases e.g. Google scholar, Scopus, and Web of Science (WoSTM) (Jacso, 2005a; 2005b; 2008a; 2008b; 2008c). He found WoSTM appropriate for calculating h-index scores (Jac-so, 2008c).
The study first refers to the case of the first 100 most productive Malaysian related engineers’ data from WoSTM over a ten year period (2001-2010). Our research term was ‘Malaysia’ and we limited to only those engineering categories from WoSTM that have the word ‘engineering’ in common. The term ‘Malay-sian related engineers’ is used for researchers who are affiliated to with11 selected Malaysian universities (> 50 publications) under nine WoSTM engineering cat-egories for document type articles and reviews only. The second data set used as the benchmark is the 100 most prolific economists dataset from Tol’s study (Tol, 2009), with his permission.
4. EMINENCE OF SCIENTISTS
The eminence of scientists is manifested by their ac-tivity and impact indicators. Overall, much fluctuation is observed among scientists’ positions when applying the original h, H’, and h-cpp indices. The CPP as a quality measure is criticized owing to its penalizing of high productivity (Hirsch, 2005; Tahira, et al., 2013). This fact is evident in Table 2. We discuss the position-ing order of these authors by employing the four Cole and Cole (1973) criteria based on publication and cita-tion behavior of author publishing.
A noteworthy fluctuation is observed in the position-ing order of Malaysian related engineers by employing these indices (Beside these indices, there are various other potential indices. Such discrepancies in results lead to introducing new indices. All of these indices

23 http://www.jistap.org
h-index, h-type Indices, and the Role
either give some insight or add value in one or anoth-er way. Here, the question immediately arises, which index is the best to accomplish different dimensions of performance evaluation, with less reservation, or is there any possible improvement to handle the quantity and quality aspects of research evaluation?
Publication is a base and other measures such as activity, observed, expected, and relative impact indica-tors are developed from it. Publication is an indicator rather easy to handle and can be manipulated purpose-ly. Eventually, these strategies have effect on impact in-
dices. Let us elaborate the case with four group analysis at author level.
To explore the effect of these strategies on publica-tions and impact behavior, we applied Cole and Cole (1967; 1973) dichotomous cross classification criteria on our 100 most productive Malaysian related engi-neers’ data. We used Coastas and Bordons’ (2008) de-nomination of the groups as mentioned in Table 2. We categorized four groups employing the threshold strat-egy for P and CPP of their fifty percentiles. The median of the ‘total number of documents’ and ‘citations per
Table 1. Salient Features of h-type Indices of Three Designed Categories
Focused Indices Category Definition Advantages Disadvantages
g-index Modified
“The g-index is the highest number g of articles that together received g2 or more citations” (Egghe, 2006a, p. 8)
More weight to highly cited publication (HCP)
It is an integer, with long core, lack of thresholds, and lack of precision, ignoring citation distribution (Tol, 2009), and in particular cases fabricating articles with zero citations (Zhang, 2009)
q2–Index Modified
A composite index computed by the product of the h-index and median of the h-core citations (Cabrerizo et al., 2010)
This is a composite indicator, provide a balanced view of scientific production and solves the central tendency issues
Covers only the core of citation above the h-index
m-index h-core dependent
“m-index is the median number of citations received by papers in the Hirsch core” (Bornmann et al, 2008)
Resolves the issue of central tendency
Based on h-core, ignores the citations above and below the core
A-index h-core dependent
A-index is the average number of citations received by the articles in the h-core (Jin, 2006)
A simple variant
h-core dependent, “the better scientist is ‘punished’ for having a higher h-index as the A-index involves a division by h” (Jin et al., 2007 p. 857)
R-index h-core dependent
R-index (Jin et al., 2007) is the square root of the total number of citations received by the articles in the h-core
Real number and is a modification of A-index
Insensitive to HCP, h-core dependent
e-index h-core dependent
e-index (Zhang, 2009) is defined as to complement the h-index. It deals with the ignored excess citations, the excess citations received by all papers in the h-core (p. 1)
Complement to h-index, covers the excess citations, ignores by h-index, helpful for similar- h-index issue
More weight to HCP ignores the tail end
hg- index h-core independent
hg, a composite index (Alonso et al., 2010), is the square root of the product of h and g indices
Incorporates the strengths of both indices
An integer, ignores the zero and less below the g-core citations as well as incorporating the weaknesses of both
H’-index
Deals with h-core, head and tail cores
It deals with the citation distribution function with head and tail ratio. It also incorporates the above mentioned e-index and formalizes ash'= e.h/t (Zhang, 2013, p.2)
A real number which deals with the citation distribution issues and incorporates excess and tail h- citations
Not simple to calculate, insensitive to zero citation. Formulaic issue, if the denominator is zero (tail core is zero) the value goes infinite

24
JISTaP Vol.2 No.4, 20-30
document rate’ of this case was (P50=17) and (P50=4.6), respectively. Researchers are classified into four groups and are named as ‘top producer,’ ‘big producer,’ ‘selec-tive,’ and ‘silent’ groups (as illustrated in Table 2).
5. DESCRIPTIVE ANALYSIS AND BOX PLOTS ILLUSTRATIONS OF FOUR GROUPS
Selective researchers’ average Citation per Publication (CPP) as calculated from their group data is almost the same as for top producers (8.712 and 8.012) (See Table 3). On the other hand, big and low producer groups have the same average value of CPP (3.285 and 3.287). The four groups of Malaysian related engineers are compared for their performances via box plot illustra-tions (Fig. 2a-c). In accordance to h and g indices, the plots of the revised index demonstrate a better median for extreme upper and lower values.
6. SIGNIFICANCE IN THE DIFFERENCE BE-TWEEN TYPES OF SCIENTISTS
Raan empirically concluded that the h-index is not so good for discriminating among excellent and good peer rated chemistry groups. Costas and Bordons (2007) observed that highly visible scientists might be underestimated. The performance evaluation of tradi-
tional metrics (total publication and total citation) and h-index is observed to be similar in the case study at institutional level for two groups (RU and non-RU Ma-laysian universities) in engineering departmental data. We found that only CPP has an exception for RU and non-RU universities (Tahira, et al., 2013). On the other hand, at researcher level, Coastas and Bordons (2008) compared the h and g-indices for four group analysis. They argued that the g-index is slightly better in distin-guishing author due to a longer core. Schreiber (2010) also made such observation.In order to determine if the proposed revision creates any difference between types of scientists, we employed Mann-Whitney U on six variables as shown in Table 4. We hypothesized that these indices are good for discriminating at group level. The test statistics is ex-amined by the Asymptotic Sig. (2-tailed) and Exact Sig. (2-tailed) and with their point of probability. With reference to h and g indices, we can see no signif-icant difference between big producers and selective re-searchers, whereas the h-cpp does discriminate among all groups including big producers and selective re-searchers. In Coastas and Bordons’ (2008) case, similar findings were observed for these two groups of Natural Resource Scientists in relation to h and g indices. They argued that the g-index is slightly better because it is sensitive to selective scientists, and this group shows in average a higher g-index/h-index ratio and better posi-tioning in g-index ranking.
Table 2. Typology of Malaysian Related Engineers
Type I“Top researchers”P>17CPP>4.6Total No. of authors=19
Type II“Big producers”P>17CPP<=4.6Total No. of authors=24
Type III“Selective researchers”P<=17CPP>4.6Total No. of authors=30
Type IV“Low researchers”P<=17CPP<=4.6Total No. of authors=27
High Low
Citation Per Publication (CPP) P50=4.6
No.
of a
rtic
les
(P)
P50=
17
Low
Hig
h

25 http://www.jistap.org
h-index, h-type Indices, and the Role
Table 3. Descriptive Analysis
Groups Indicators Mean and SD Median Std. Dev. Range (min-max)
Group1(N=19)
TP 41.21 30 24.357 19-1138
TC 380.47 237 312.152 90-1138
CPP 8.712 8.3 2.967 4.711-16.492
Group 2 (N=24)
Tp 29.17 27 10.937 18-66
TC 97.67 94.50 53.117 16-283
CPP 3.2846 3.395 1.006 0.842-4.5
Group 3(N=30)
TP 13.73 13.5 1.799 11-21.357
TC 110.8 89 57.339 57-299
CPP 8.043 6.630 4.012 4.615-21.357
Group 4(N=27)
TP 14.22 14 2.063 11-17
TC 46.3 45 14.18 23-72
CPP 3.267 3.4 0.9026 1.588-4.6
Fig. 2 (a-c). Box plot illustrations of h-index, g-index, and h-cpp
(a) (b)
(c)

26
JISTaP Vol.2 No.4, 20-30
7. VALIDATION OF REVISED INDEX
High correlation is observed in several studies among h-type indices. On the basis of correlation, it is not justified to differentiate and make a difference among the performance of different indices. For the evaluation of models in Table 1, we apply correlation analysis and three stage statistical techniques: Multiple regressions (R) with their Mean Square Error (MSE) and Mean Absolute Error (MAE). MSE and MAE can help out to differentiate the performance of these models better (Willmott & Matsuura, 2005).
At first, we evaluate the case of the 100 Malaysian re-lated engineers and after that we re-examine a dataset of the 100 most prolific economists of in Tol’s study for the same set of indices.
8. MALAYSIAN RELATED ENGINEERS CASE
A whole set of h-type indices are considered for the first case (Table 5); the results indicate that all indices show a high correlation with the traditional metrics, but this relation is stronger with the OII. Only H' shows no correlation with AI and A. H' and h-cpp have a high correlation with CPP (>0.8). A-index is h- core depen-dent, and the last two models address the head and tail citation distribution. On the other hand, g (a modified and a substitute of h-index) and R (h-core dependent) exhibit very good correlation (>0.7), while q2 and hg as composite indices gives >0.7 and >0.2 values with CPP.
The proposed model (h-ccp) exhibits a high significant ‘R’ like other studied indices with the exception from g and R, while low values of MSE and MAE are observed for h-cpp compared to all competitors’ indices (Table 6).
Table 4. Statistical Significance in Differences Between Types of Scientists (Mann-Whitney U)
Indices Type of Researchers Top Researchers Big Producers Selective Researchers
Asy. Sig. Exact. Sig. Asy. Sig. Exact. Sig. Asy. Sig. Exact. Sig.
P
Big producersSelective researchersLow researchers
NS0.0000.000
NS, P=.0020.0000.000
-0.0000.000
-0.000.000
--NS
--NS, P=.002
C
Big producersSelective researchersLow researchers
0.0000.0000.000
0.0000.0000.000
-NS0.000
-NS. P=.0030.000
--0.000
--0.000
CPP
Big producersSelective researchersLow researchers
0.000NS0.000
0.000NS, P=.0020.000
-0.000NS
-0.000NS, .004
--0.00
--0.000
h-index
Big producersSelective researchersLow researchers
0.0000.0000.000
0.0000.0000.000
-NS0.000
-NS, P=.0050.000
--0.000
--0.000
g-Index
Big producersSelective researchersLow researchers
0.0000.0000.000
0.0000.0000.000
-NS0.000
-NS, P=.0010.000
--0.000
--0.000
h-cpp
Big producersSelective researchersLow researchers
0.0000.0000.000
0.0000.0000.000
-0.0000.000
-0.0000.000
--0.000
--0.000
Statistical significance when p < 0.05

27 http://www.jistap.org
h-index, h-type Indices, and the Role
9. PROLIFIC ECONOMICS RESEARCHERS
In the second case (based on Tol’s study), we could evaluate h, g, h-cpp, and hg models due to the non-availability of authors’ all citation data. High or-der correlation of these indices with OII (C and CPP) is presented in Table 7. It is observed that among all indices, h-cpp shows a better correlation with CPP, whereas for C, the correlation is higher than h and less
for g and hg indices.All of the studied models (Table 8) have significantly
high values of R (>0.9). Revised index depicts a slight-ly higher value of R than h and hg indices. However, h-cpp indicates low values of MSE and MAE for all cases. The revised index is intuitively reasonable and simple to compute. The new development provides a better model fit with less statistical errors.
Table 6. Results of Regression Analysis
Results h-index h-cpp g-index A-index R-index m-Index q-index H’-index hg-index
R 0.9400 0.9604 0.9729 0.8916 0.9842 0.7993 0.9505 0.8928 0.9758
MSE 0.6377 0.3580 0.8148 14.64 0.4475 11.244 4.3754 23.15 0.8525
MAE 0.8049 0.4744 0.8886 2.917 0.5267 2.591 0.9252 1.83 0.6908
Table 7. Results of Correlation Matrix
Indices P C CPP h-index g-index h-cpp index hg-index
P 1 .501** .228* .591** .525** .443** .562**
C .501** 1 .908** .888** .954** .914** .934**
CCP .228* .908** 1 .802** .895** .912** .862**
** Pearson Correlation is significant at the 0.01 level (2-tailed)* Pearson Correlation is significant at the 0.05 level (2-tailed)
Table 5. Results of Correlation Matrix
Indices P C CPP h-Index
h-cpp
g-index
A-index
R-index
m-Index
q-index
H’-index
hg-index
P 1 .820** 0.185 .797** .629** .757** .445** .708** .493** .728** 0.072 .785**
C .820** 1 .600** .926** .893** .943** .720** .929** .710** .915** .422** .816**
CPP 0.185 .600** 1 .608** .813** .722** .842** .792** .707** .721** .881** .283**
** Pearson Correlation is significant at the 0.01 level (2-tailed).* Correlation is significant at the 0.05 level (2-tailed).
Table 8. Results of Regression Analysis
Results h-index h-cpp g-index hg-index
R 0.9125 0.9593 0.9644 0.9490
MSE 16.869 12.110 35.197 21.828
MAE 3.051 2.545 4.451 3.473

28
JISTaP Vol.2 No.4, 20-30
10. CONCLUDING REMARKS
The sole use of CPP as a quality measure is criticized owing to its penalizing of high productivity (Hirsch 2005, Tahira, et al., 2013). When this actor (CPP) is used with other metrics/indices as CQ, it characterizes the scientific output of researchers with aggregated values in a more balanced way as observed in cases of P-index (Parthap, 2009) and recent proposed develop-ment h-cpp. This incorporation holds h as represen-tative of ‘Quantity of the Productive Core’ and CPP as ‘Impact of the Productive Core. Previously the actor CPP was used with P and C to equate with the value of h-index’ (Schubert & Glanzel, 2007; Parthap, 2010).
In order to tackle the implicit disadvantages of h-in-dex, we have proposed a revision named h-cpp and empirically examined it for research performance eval-uation. The incorporation of CPP as CQ with h-index makes it sensitive to hyper-cited articles, less below the index publications, zero citations, and similar h-index. CPP is a potential actor along with h-index to rectify inaccuracy and unfairness for broader impact. Reflec-tion on h-type indices shows that another potential evaluative composite index is P-index. This composite index incorporates CPP as corrected quality ratio with an assumption that h2 is nearly proportional to the ‘C,’ and this index assigns more weight to total citations and aims to equate with h-index.
The beauty of the revised index is working closely with the h-index theory and inclusion of the implicit di-mensions with a sort of normalization in dataset. Its val-ue can be greater, equal, or less than the classic h-index. A single number cannot reflect all aspects (van Raan, 2005). Although this revision checks the h-index robust-ness as several other h-type indices: g, hg, q2 etc., h-cpp as a composite indicator can be more informed, eco-nomical, and robust for RPE and incorporates the reser-vations of a good index for research. The fact that stands out as fundamental is the need to address the existing underpinnings logically to incorporate the reservations of a good index for research evaluation purpose in a sin-gle composite number. Another possibility is to bracket CPP with h-index in one set (representing both quantity and impact core) for evaluation purposes rather than use of CQ. We suggest more discussion and analysis at different aggregate levels with various composite indices to explore the dimensions of research activity.
ACKNOWLEDGEMENTS
One of the authors would like to thank Universiti Teknologi Malaysia and the Higher Education Com-mission of Pakistan for the award of the International Doctoral Fellowship (IDF) and Partial Support Grant.
REFERENCES
Alonso, S., Cabrerizo, F. J., Herrera-Viedma, E., & Her-rera, F. (2010). hg-index: A new index to character-ize the scientific output of researchers based on the h- and g- indices. Scientometrics, 82(2), 391-400.
Anderson, T. R., Hankin, R. K. S., & Killworth, P. D. (2008). Beyond the Durfee square: Enhancing the h-index to score total publication output. Sciento-metrics, 76, 577-588.
Bihui, J., LiMing, L., Rousseau, R., & Egghe, L. (2007). The R- and AR-indices: Complementing the h-in-dex. Chinese Science Bulletin, 52(6), 855-963.
Bornmann, L., Mutz, R., Hug, S. E., & Daniel, H.D. (2011) A multilevel meta-analysis of studies re-porting correlations between the h index and 37 different h index variants. Journal of Informetrics, 5(3), 346-359.
Bornmann, L., Wallon, G., & Ledin, A. (2008). Is the h index related to (standard) bibliometric measures and to the assessments by peers? An investigation of the h index by using molecular life sciences data. Research Evaluation, 17(2), 149–156.
Bouabid, H., & Martin, B. (2009). Evaluation of Moroc-can research using a bibliometric-based approach: Investigation of the validity of the h-index. Sciento-metrics, 78(2), 203-217.
Burrell, Q. L. (2007). On the h-index, the size of the Hirsch core and Jin’s A-index. Journal of Informet-rics, 1, 170–177.
Cabrerizo, F.J., Alonso, S., Herrera-Viedma, E., & Her-rera, F. (2009). q2-Index: Quantitative and qualita-tive evaluation based on the number and impact of papers in the Hirsch Core. Journal of Informetrics, 4(1), 23-28.
Costas, R., & Bordons, M. (2007). The h-index: Ad-vantages, limitations and its relation with other bibliometric indicators at the micro level. Journal of Informetrics, 1, 193-203.

29 http://www.jistap.org
h-index, h-type Indices, and the Role
Cronin, B., & Meho, L. (2006). Using the h-index to rank influential information scientists. Journal of the American Society for Information Science and Technology, 57(9), 1275-1278.
Egghe, L. (2006a). An improvement of the h-index: The g-index. ISSI Newsletter, 2(1), 8-9.
Egghe, L. (2006b). Theory and practice of the g-index. Scientometrics, 69(1), 131-152.
Egghe, L., & Rousseau, R. (2008). An h-index weighted by citation impact. Information Processing & Man-agement, 44(2), 770–780.
Egghe, L. (2012). Remarks on the paper of A. De Visscher, “What does the g-index really measure?” Journal of the American Society for Information Sci-ence and Technology, 63(10), 2118-2121.
Glänzel, W. (2006). On the opportunities and limita-tions of the h-index. Science Focus, 1(1), 10-11.
Hirsch, J. E. (2005). An index to quantify an individ-ual’s scientific research output. Proceedings of the National Academy of Sciences, 102(46), 16569-72.
Imperial, J., & Navarro, A. (2007). Usefulness of Hirsch’s h-index to evaluate scientific research in Spain. Scientometrics, 71(2), 271–282.
Jin, B. H., Liang, L. M., Rousseau, R., & Egghe, L. (2007). The R- and AR-indices: Complementing the h-in-dex. Chinese Science Bulletin, 52(6), 855-863.
Jin, B. H. (2006). h-Index: An evaluation indicator pro-posed by scientist. Science Focus, 1(1), 8-9.
Lazaridis, L. (2010). Ranking university departments using the mean h-index. Scientometrics, 82(2), 11-16.
Lehmann, S. A. D., Jackson, & Lautrup, B. (2008). A quantitative analysis of indicators of scientific per-formance. Scientometrics 76(2), 369-390.
Lindsey, D. (1978). The corrected quality ratio: A com-posite index of scientific contribution to knowl-edge. Social Studies of Science, 8(3), 349-354.
Luz, M. P. et. al. (2008). Institutional H-Index: The performance of a new metric in the evaluation of Brazilian Psychiatric Post-graduation Programs. Scientometrics, 77(2), 361-368.
Mehta, C. R., & Pate, N. R. (2011). IBM SPSS Exact Tests. IBM.P.236. Retrieved on September, 30, 2013, from http://admin-apps.webofknowledge.com/jcr/jcr?pointofentry= home&sid= 4bowr-74js6miuqyl3av.
Moed, H. F. (2008). UK research assessment exercise:
Informed judgments on research quality or quanti-ty? Scientometrics, 74(1), 153-161.
Norris, M., & Oppenheim, C. (2010). The h-index: A broad review of a new bibliometric indicator. Jour-nal of Documentation, 66(5), 681-705.
Oppenheim, C. (2007). Using the h-index to rank in-fluential British researchers in information science and librarianship. Journal of the American Society for Information Science and Technology, 58(2), 297-301.
Parthap, G. (2010). The 100 most prolific economists using the p-index. Scientometrics, 84(1), 167–172.
Riikonen, P., & Vihinen, M. (2008) National research contributions: A case study on Finnish biomedical research. Scientometrics, 77(2), 207-222.
Rousseau, R. (2006). New developments related to the Hirsch index. Industrial Sciences and Technolo-gy, Belgium. Retrieved from http://eprints.rclis.org/6376/.
Cole, S., & Cole, J.R. (1973). Social stratification in sci-ence. Chicago: University Press.
Schreiber, M. (2010). Revisiting the g-index: The av-erage number of citations in the g-core. Journal of the American Society for Information Science and Technology, 61(1), 169-174.
Schreiber, M. (2010). Twenty Hirsch index variants and other indicators giving more or less preference to highly cited papers. Retrieved on October 31, 2013, from arxiv.org/pdf/1005.5227
Schreiber, M. (2013). Do we need the g-index? Re-trieved on October 27, 2013, from http://arxiv.org/ftp/arxiv/papers/1301/1301.4028.pdf
Schubert, A., & Glänzel, W. (2007). A systematic anal-ysis of Hirsch-type indices for journals. Journal of Informetrics, 1, 179-184.
Spizman, L., & Weinstein. M. A. (2008). A note on uti-lizing the geometric mean: When, why and how the forensic economist should employ the geomet-ric mean. Journal of Legal Economics, 15(1), 43-55.
Tahira, M., Alias, R. A., & Bakri, A. (2013). Scientomet-ric assessment of engineering in Malaysian univer-sities. Scientometrics, 96(3), 865–879.
Tol, R. S. J. (2009). The h-index and its alternatives: An application to the 100 most prolific economists. Scientometrics, 80(2), 319–326.
Willmott, C. J., & Matsuura, K. (2005). Advantages of the Mean Absolute Error (MAE) over the Root
30
JISTaP Vol.2 No.4, 20-30
Mean Square Error (RMSE) in assessing average model performance. Climate Research, 30, 79–82.
van Raan, A. F. J. (2005). Fatal attraction: Conceptual and methodological problems in the ranking of universities by bibliometric methods. Scientomet-rics, 62(1), 133-143.
van Raan, A. F. J. (2006). Comparison of the Hirsch-in-dex with standard bibliometric indicators and with peer judgment for 147 chemistry research groups. Scientometrics, 67(3), 491-502.
Vinkler, P. (2007). Eminence of scientists in the light of the h-index and other scientometric indicators. Journal of Information Science, 33, 481-491.
Zhang, C. T. (2009). The e-index, complementing the h-index for Excess Citations. PLOS ONE 4(5), e5429.
Zhang, C.T. (2013). The h' Index, effectively improving the h-index based on the citation distribution. PLOS ONE, 8(4), e59912.
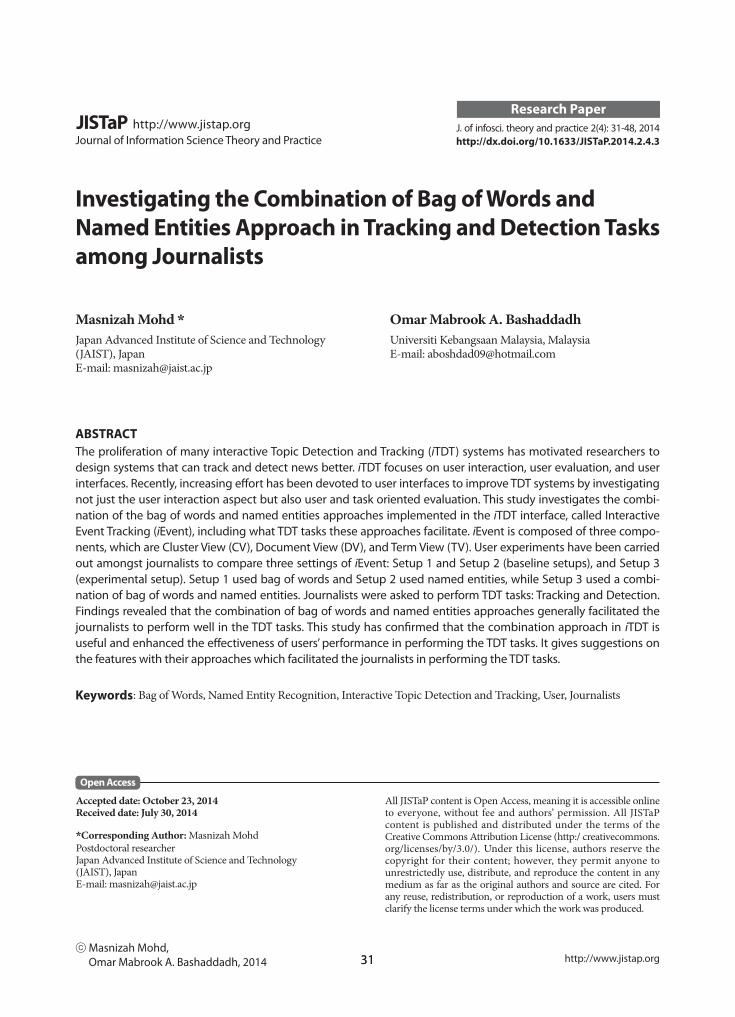
31 http://www.jistap.org31
JISTaPJournal of Information Science Theory and Practice
http://www.jistap.org
Investigating the Combination of Bag of Words and Named Entities Approach in Tracking and Detection Tasks among Journalists
Masnizah Mohd *Japan Advanced Institute of Science and Technology (JAIST), Japan E-mail: [email protected]
Omar Mabrook A. BashaddadhUniversiti Kebangsaan Malaysia, MalaysiaE-mail: [email protected]
Open Access
Accepted date: October 23, 2014Received date: July 30, 2014
*Corresponding Author: Masnizah MohdPostdoctoral researcherJapan Advanced Institute of Science and Technology (JAIST), Japan E-mail: [email protected]
All JISTaP content is Open Access, meaning it is accessible onlineto everyone, without fee and authors’ permission. All JISTaP content is published and distributed under the terms of the Creative Commons Attribution License (http:/ creativecommons.org/licenses/by/3.0/). Under this license, authors reserve the copyright for their content; however, they permit anyone to unrestrictedly use, distribute, and reproduce the content in any medium as far as the original authors and source are cited. For any reuse, redistribution, or reproduction of a work, users must clarify the license terms under which the work was produced.
ⓒ Masnizah Mohd, Omar Mabrook A. Bashaddadh, 2014
Research PaperJ. of infosci. theory and practice 2(4): 31-48, 2014http://dx.doi.org/10.1633/JISTaP.2014.2.4.3
ABSTRACTThe proliferation of many interactive Topic Detection and Tracking (iTDT) systems has motivated researchers to design systems that can track and detect news better. iTDT focuses on user interaction, user evaluation, and user interfaces. Recently, increasing effort has been devoted to user interfaces to improve TDT systems by investigating not just the user interaction aspect but also user and task oriented evaluation. This study investigates the combi-nation of the bag of words and named entities approaches implemented in the iTDT interface, called Interactive Event Tracking (iEvent), including what TDT tasks these approaches facilitate. iEvent is composed of three compo-nents, which are Cluster View (CV), Document View (DV), and Term View (TV). User experiments have been carried out amongst journalists to compare three settings of iEvent: Setup 1 and Setup 2 (baseline setups), and Setup 3 (experimental setup). Setup 1 used bag of words and Setup 2 used named entities, while Setup 3 used a combi-nation of bag of words and named entities. Journalists were asked to perform TDT tasks: Tracking and Detection. Findings revealed that the combination of bag of words and named entities approaches generally facilitated the journalists to perform well in the TDT tasks. This study has confirmed that the combination approach in iTDT is useful and enhanced the effectiveness of users’ performance in performing the TDT tasks. It gives suggestions on the features with their approaches which facilitated the journalists in performing the TDT tasks.
Keywords: Bag of Words, Named Entity Recognition, Interactive Topic Detection and Tracking, User, Journalists

32
JISTaP Vol.2 No.4, 31-48
1. INTRODUCTION
A vast amount of information arrives every day through a variety of news media such as newswires, TV, newspapers, radio, and website sources. In addi-tion, the significant growth and dynamic environment of digital information creates challenges in informa-tion retrieval (IR) technology. The amount of constant information which readers can effectively use is still limited compared to the continuous growth of rapidly changing online information. Thus it has become in-creasingly important to provide and enhance methods to find and present textual information effectively and efficiently. Technologies have been proposed to solve the information overload issues, including information customization, search engines, and information agen-cy. Therefore research on Topic Detection and Track-ing (TDT) serves as a core technology for a system that monitors news broadcasts. It helps to alert information professionals such as journalists to interesting and new events happening in the world. Journalists are keen to track and, in particular, to know the latest news about a story from a large amount of information that arrives daily.
Most TDT research has concentrated primarily on the design and evaluation of algorithms to implement TDT tasks such as stream segmentation, story detec-tion, link detection, and story tracking. Bag of words (BOW) and named entities (NE) approaches are wide-ly implemented either in document representation or in user interface design of TDT systems (Kumaran & Allan, 2004). Meanwhile Interactive Topic Detection and Tracking (iTDT) refers to the TDT works which focus on user interaction, user evaluation, and user interfaces aspects (Mohd et al., 2012).
In this research we did not discuss the interface de-sign or features but focused on the approaches used: either BOW or NE or their combination. The objectives of this research are: (i) to implement the combined ap-proach of BOW and NE in iTDT interface and, (ii) to investigate the usability of this approach on the iTDT interface in assisting journalists to perform the TDT tasks. This is important to answer questions, e.g., which approach aims to facilitate journalists to perform TDT tasks? Will the use of a combined approach of BOW and NE improve iTDT? What are the TDT tasks facili-tated through the use of this combined approach?
2. RELATED WORK
The focus of this section is to review related works on iTDT with a view to identifying best approaches used in the design of iTDT interfaces. The previous scholarly studies in TDT tried to build better docu-ment models, enhancing and developing similarity metrics or document representations. A large number of research efforts have focused on enhancing and improving document representations by applying Nat-ural Language Processing (NLP) technology such as Named Entity Recognition (NER) (Yang et al., 1999, Makkonen et al., 2004, Kumaran & Allan, 2004, Zhang et al., 2004). Some research tended towards interactive TDT through casting its attention on the graphical user interface (GUI), rather than on laboratory experi-ments such as TDT Lighthouse (Leuski & Allan, 2000), TimeMine (Swan & Allan, 2000), Topic Tracking Visu-alization Tool (Jones & Gabb, 2002), Event Organizer (Allan et al., 2005), Stories in Time (Berendt & Subasic, 2009) and Interactive Event Tracking System (iEvent) interface (Mohd et al., 2012), which are all examples of TDT studies that investigate some approaches to enhancing and improving TDT systems’ and users’ performance. Based on the works reviewed, none of them investigate the effectiveness of their interfaces using the combination of a bag of words (BOW) and named entities (NE) approach. We review and discuss the approaches used in these related studies and we concentrate in iEvent as the baseline setup.
2.1. Interactive Event Tracking (Ievent) Interface
The Interactive Event Tracking System (iEvent) in-terface (Mohd et al., 2012) is a prototype system that includes the design of a novel iTDT system interface to facilitate professionals such as journalists and infor-mation analysts in performing TDT tasks. This system consists of two settings: Setup 1 is the baseline Setup that uses the BOW approach and Setup 2 is the experi-mental Setup that uses the NE approach to present the information to the user in a meaningful way using the following components: Cluster View (CV), Document View (DV), and Term View (TV).
iEvent incorporates a number of components and features into a single interface, such as cluster labelling, top terms, histogram with the timeline, document

33 http://www.jistap.org
Investigating the Combination
content, and keyword. Moreover, it implements good approaches, such as BOW and NE. However, these approaches are only implemented separately, each one in a single setup. Clearly the BOW offers a better expla-nation in the Detection task as it resembles the What. Meanwhile NE provides specific information on the Who, Where, and When in performing the Tracking task (Mohd et al., 2012). The major problem with this kind of application and approach is that neither sup-ports both tasks (Detection and Tracking) to gather information. So this research attempts to solve this problem by adding a new Setup called Setup 3. This new Setup, which will be considered as an experimental Setup which uses a combination approach (BOW+NE), is intended to offer a better explanation and provide in-formation on the Who, Where, When, and What to the user.
The reviewed works in iTDT used different approach-es to extract, organize, and represent information from the news sources to the user such as BOW, NE, query, graphical visualization, text summarization, and other approaches. But none of these works supports tracking and detection tasks at the same time. Therefore, the combination of BOW and NE could enhance user per-formance in TDT tasks.
3. THE USE OF BAG OF WORDS AND NAMED ENTITIES IN INTERACTIVE EVENT TRACKING SYSTEM (iEVENT) INTERFACE
There are four features out of seven of iEvent which distinguish between three approaches: BOW, NE, and a combination of BOW and NE across setups, as apparent in Table 1. The descriptions are:
a. BOW are the keywords aiming to provide the What and were implemented in Setup 1. Most frequent keywords were offered in the features of iEvent.
b. NE are the significant keywords that aim to pro-vide the Who, Where and When and were imple-mented in Setup 2. Most frequent named entities were offered in the features of iEvent.
c. Combination of BOW and NE that aim to pro-vide the What, Who, Where and When and were implemented in Setup 3. Most frequent keywords and named entities were offered in the features of iEvent.
The four features of iEvent that are different between the setups are: ‘CV: cluster labelling,’ ‘CV: top terms,’ ‘DV: document content,’ and ‘TV: keyword approach.’ Each was using a combination of BOW and NE in Setup 3 (experimental setup) and using BOW alone in Setup 1 (baseline setup) and NE alone in Setup 2 (baseline setup). We extracted the named entities using ANNIE (A Nearly-New Information Extraction system), which is an information extraction component of the General Architecture for Text Engineering (GATE). We used it for its accurate entity, pronoun, and nominal co-refer-ences extraction (Cunningham et al., 2002).
Table 1. The Differences of the Three Setups
Baseline Setup Experimental SetupSetup 1 Setup 2 Setup 3
CLUSTER VIEW (CV)cluster labellingtop terms cluster visualization DOCUMENT VIEW (DV)histogram with the timeline document content TERM VIEW (TV)keyword approach histogram with the time line
BOWBOW×
×BOW
BOW×
NENE×
×NE
NE×
BOW+NEBOW+NE×
×BOW+NE
BOW+NE×
NE=Named Entities; BOW=Bag of words ×=unavailable

34
JISTaP Vol.2 No.4, 31-48
3.1. Cluster View (CV)The Cluster View visualized information related
to the size and density of a cluster, and displayed the ten most frequent terms (Top terms) in the cluster. The main difference here is in the Cluster labelling feature (refer to Fig. 1) and top ten terms feature (refer to Fig. 2). Clusters were generated using single pass clustering (Mohd et al., 2012) and were labelled using the three most frequently named entities; for exam-ple, Cluster 30 was labelled using keywords in Setup 1, named entities in Setup 2, and a combination of BOW and NE in Setup 3.
When the user clicked on Cluster 30, there was ad-ditional information presented on the top ten terms as shown in Fig. 2. The difference in these features between the three setups is that the user was provid-ed with mixed BOW and NE in Setup 3 instead of using BOW only in Setup 1 and NE only in Setup 2.
3.2. Document View (DV)Document View provided the user with information
about the document timeline in a histogram form and the document content in a cluster. There was no differ-ence in timeline across setups where this feature was showing the occurrence and the number of documents (document frequency) for a specific date. This support-ed the journalist in viewing the information flow in a press article or in analyzing the discourse.
However, as shown in Fig. 3, users could see a small difference in the document content, especially between Setup 3 (experimental Setup) and Setup 2 (baseline Set-up) and a significant difference with Setup 1 (baseline Setup). The types of term such as Who, What, Where, and When are highlighted according to the setup.
Cascading Style Sheets (CSS) were used to differen-tiate three types of named entities with different colors and terms assigned, as shown in Table 2.
BOW (Setup 1)
Approach
Named Entities (Setup 2)
Top Ten Terms
BOW+NE (Setup 3)
BOW (Setup1)
NE (Setup 2)
BOW+NE (Setup 3)
Fig.1 Cluster labelling of the three approaches
Fig. 2 Top ten terms of the three approaches
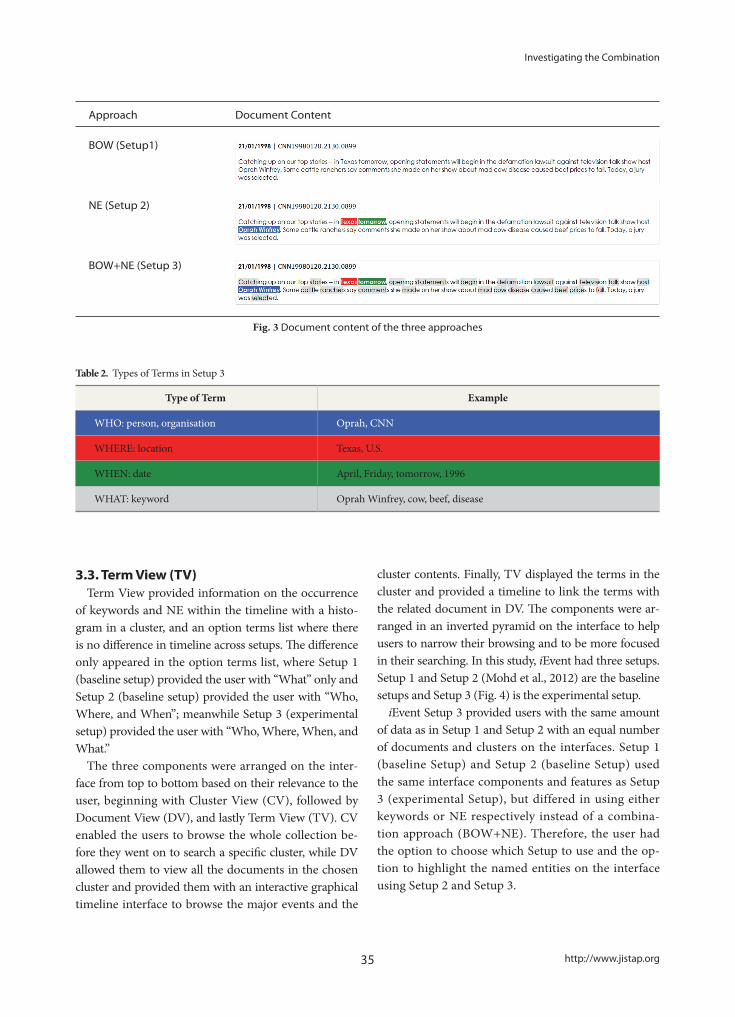
35 http://www.jistap.org
Investigating the Combination
Table 2. Types of Terms in Setup 3
Type of Term Example
WHO: person, organisation Oprah, CNN
WHERE: location Texas, U.S.
WHEN: date April, Friday, tomorrow, 1996
WHAT: keyword Oprah Winfrey, cow, beef, disease
3.3. Term View (TV)Term View provided information on the occurrence
of keywords and NE within the timeline with a histo-gram in a cluster, and an option terms list where there is no difference in timeline across setups. The difference only appeared in the option terms list, where Setup 1 (baseline setup) provided the user with “What” only and Setup 2 (baseline setup) provided the user with “Who, Where, and When”; meanwhile Setup 3 (experimental setup) provided the user with “Who, Where, When, and What.”
The three components were arranged on the inter-face from top to bottom based on their relevance to the user, beginning with Cluster View (CV), followed by Document View (DV), and lastly Term View (TV). CV enabled the users to browse the whole collection be-fore they went on to search a specific cluster, while DV allowed them to view all the documents in the chosen cluster and provided them with an interactive graphical timeline interface to browse the major events and the
cluster contents. Finally, TV displayed the terms in the cluster and provided a timeline to link the terms with the related document in DV. The components were ar-ranged in an inverted pyramid on the interface to help users to narrow their browsing and to be more focused in their searching. In this study, iEvent had three setups. Setup 1 and Setup 2 (Mohd et al., 2012) are the baseline setups and Setup 3 (Fig. 4) is the experimental setup.
iEvent Setup 3 provided users with the same amount of data as in Setup 1 and Setup 2 with an equal number of documents and clusters on the interfaces. Setup 1 (baseline Setup) and Setup 2 (baseline Setup) used the same interface components and features as Setup 3 (experimental Setup), but differed in using either keywords or NE respectively instead of a combina-tion approach (BOW+NE). Therefore, the user had the option to choose which Setup to use and the op-tion to highlight the named entities on the interface using Setup 2 and Setup 3.
Approach Document Content
BOW (Setup1)
NE (Setup 2)
BOW+NE (Setup 3)
Fig. 3 Document content of the three approaches

36
JISTaP Vol.2 No.4, 31-48
4. USER EXPERIMENT
4.1. Experimental DataWe used a dataset that consisted of a collection of
documents chosen from TDT2 and TDT3 corpuses which contained 1,468 CNN news documents. We used a copy of the dataset from the iEvent experiment (Mohd et al., 2012) which involved 28 topics from the TDT2 corpus and 25 topics from the TDT3 corpus. Generally, the number of documents chosen will be adequate for the experiment where the collection’s size is enough to produce clusters to be displayed on the user interface. CNN news stories were chosen because the stories from this source are mostly short, and modelling such stories is, we believe, a good first step before dealing with more complex datasets. Moreover, the dataset used was from 1998 as mentioned above, because users would have no familiarity with or interest in the topics during the eval-uation of iEvent.
4.2. Evaluation UsersThe users were a mixture of journalists and post-
graduate journalism students at the Universiti Ke-bangsaan Malaysia. Ten users were chosen, of whom three were female. 50% of the respondents were jour-nalists and the remaining proportion were journal-ism students.
4.3. Experiment EvaluationThe evaluation of text classification effectiveness
in an IR experimental system is often based on statistical measurements. These measurements are precision, recall, and F1-measure (Rijsbergen, 1979; Kowalski, 1997). In our case, the retrieved documents indicated those that had been classified by the system as positive instances of an event and the relevant doc-uments were those that had been manually judged to be related to an event.
We treated each cluster as if it were the desired set of documents for a topic. The selection of topics for the Tracking in this experiment were based on the F1-measure (Mohd et al., 2012; Lewis & Gale, 1994; Pons-Porrata et al., 2004). To validate whether the iEvent interface with combined BOW+NE helps the user to perform the TDT tasks, users were given a bad cluster to track or a bad topic to detect, based on the F1-measure. The chosen topics and clusters given in the user experiment had a combination of good and poor (94.7% - 50.9%) clustering performance ac-cording to F1-measure (Mohd et al., 2012).
4.4. User Tasks with iEventThere were two tasks, Tracking and Detection,
which were given to the users.
Fig. 4 Bag of Words and Named Entities setup (BOW+NE)
Cluster View
Document View
Term View

37 http://www.jistap.org
Investigating the Combination
4.4.1. Tracking TaskThe definition of the Tracking task was to track the
cluster that contained the identified topic. The user had to track the cluster that included the given topic and show that a sufficient amount of information on the event was provided by the system. This is consis-tent with the mission of a news journalist. Reporting and Profiling are sub-activities of this task where Re-porting is defined as writing an article about a given topic; it requires the user to write an article about a topic through the formulation of significant facts. Meanwhile, Profiling is defined as drafting signifi-cant keywords as an outline for a topic. These tasks were considered to simulate natural news monitor-ing behavior by users. We aimed to create a type of interaction between the users and iEvent where the latter could perform their own daily news tasks, such as everyday news monitoring and reporting tasks. To facilitate this, we placed the tasks within simulated cases (Borlund, 2002; Borlund & Ingwersen, 1997) shown in Fig. 5, where an example is given of a sim-ulated case in a Topic Tracking task, since the given task’s scenarios should reflect and support a real news monitoring situation.
The steps in carrying out the Tracking task were:1. A topic summary was given to the users.2. Based on the information contained in the topic
summary, the users were asked to track the relat-ed cluster.
3. The users investigated the documents in the relat-ed cluster they found.
4. The users were asked to draft the important facts or points to execute the Reporting task.
5. They listed out the dealing cluster.6. The users created a profile by drafting useful key-
words to perform the profiling task. 7. The users expressed their opinion on the features
provided by iEvent when performing the Track-ing task by completing a questionnaire.
4.4.2. Detection TaskThe detection task was the second task performed by
the users. It is defined as identifying the topic dealt by a definite cluster. This is consistent with a journalist’s task of identifying significant events that happened on a definite day (Mohd et al., 2012). The steps to carry out the Detection task are:
1. A specific cluster was given to the users with a list of twenty topics.
2. They were then asked to detect the topics from the documents contained in a specific cluster us-ing any features of iEvent to perform this task.
3. The users were asked to rank a maximum of three topics from the list of twenty topics given, if they felt that the specific cluster contained more than one.
4. Finally, they expressed their opinion on the fea-tures provided by iEvent whilst performing the Detection task by completing a questionnaire.
In the Tracking task, there were six topics used and the users were given 15 minutes to complete each top-
Fig. 5 Simulated situation
It is early Spring 1998 in Washington, D.C. The last-minute negotiations Friday between tobacco companies (Philip Morris Inc., R.J. Reynolds Tobac-co Co., Brown & Williamson Tobacco Co., Lorillard Tobacco Co., and United States Tobacco Co.) and Texas officials paid off in the form of a $15.3 billion settlement. Texas Attorney General Dan Morales said the deal would be of particular benefit to the state’s children and taxpayers who have footed extra health care costs. The debate and activity of devising a National Tobacco Company Settlement seemed comfortable for everyone. You have been asked to write an article on the out-come of the National Tobacco Settlement. This topic is likely to generate events such as Clinton works with Congress on tobacco legislation, internal memos threaten national tobacco settle-
SIMULATED SITUATION
ment, individual state tobacco settlements, hearings about national tobacco settlement, tobacco company sells high-nicotine cigarettes overseas, White House presses for national settlement, additional tobacco memos released, and budget would put tobacco settlement money into Medicare.

38
Users
Session 1 Session 2 Session 3Tracking Detection Tracking Detection Tracking Detection
T1 T2 D1 D2 T3 T4 D3 D4 T5 T6 D5 D6
1- 3 S1 S1 S1 S1 S2 S2 S2 S2 S3 S3 S3 S3
4-6 S2 S2 S2 S2 S3 S3 S3 S3 S1 S1 S1 S1
7-10 S3 S3 S3 S3 S1 S1 S1 S1 S2 S2 S2 S2
*S1=Setup 1 (baseline setup); S2=Setup 2 (baseline setup); S3=Setup 3 (experimental setup)
JISTaP Vol.2 No.4, 31-48
ic. They were given a total of 1:30 hours to attempt the entire Tracking task in three sessions.
In the Detection task there were also six clusters given where the users spent a maximum of 10 minutes to complete each cluster. In total, they were given one hour to complete the task in three sessions. Finally, at the conclusion of the tasks, the users completed a questionnaire which took approximately 5 minutes. The whole user experiment took about 2 hours 30 minutes to 3 hours excluding a short training session.
Users were given an opportunity to carry out the tasks using the interface. A Latin Square design (Spärck-Jones, 1981; Spärck-Jones & Willett, 1997; Doyle, 1975) was used which allowed us to evaluate the same topic using different setups. Fig. 6 shows the experimental design, where the order of topics as-signed in the Tracking tasks and the order of clusters given in the Detection task were rotated to avoid any learning factor.
Topic 1 (Oprah Lawsuit), for example, has an oppor-tunity to change sequentially from first until sixth in order during the Tracking task. The clusters assigned in the Detection task were hidden during execution of the Tracking task to avoid any intersection of clusters that may have affected users’ performance. The clusters were completed using single pass clustering with the threshold t=1.48 which created 57 clusters.
5. RESULTS
5.1. General FindingsDuring the experiment, 120 tasks were performed.
50% of these tasks were Tracking while the remaining
tasks were Detection. The general results showed that 90% of the users liked to use iEvent in both tasks and 10% of users disliked iEvent because they were accus-tomed to other news tools. Those who disliked iEvent were all journalists that had an average age of 30-40 years and average working experience of more than 10 years. From the interview session, these participants had previously used news network tools such as Ber-nama.com.
The results also revealed that more than 70% of the users that used iEvent in the Tracking task found that the combination approach (BOW+NE) in Setup 3 provided more assistance in conducting the task compared with approximately 17% who found that the keywords in Setup 1 provided more assistance and 13% who found that named entities in Setup 2 provided more assistance. Meanwhile, 90% of all users considered that Setup 3 facilitated the Detection task. During the post-study interviews the users confirmed that the use of a combination of BOW and NE would help journalists to conduct their tasks since it provides significant information on the Who, Where, When, and What of an event at the same time.
A possible explanation for these results might be the users’ success in performing both tasks (see Fig. 7). It is clear that there was a change in the users’ topic interest after using iEvent across setups. The Kruskal-Wallis Test confirmed that there was no statistically significant difference (p=0.742) in topic interest before using iEvent across setups. Meanwhile, there was a statistically sig-nificant difference (p=0.010) in topic interest after using iEvent across setups. The users were more interested in a topic in the Tracking task after using Setup 3 (mean=4.05 sd=0.686) as shown in Fig. 7.
Fig. 6 Experimental Design
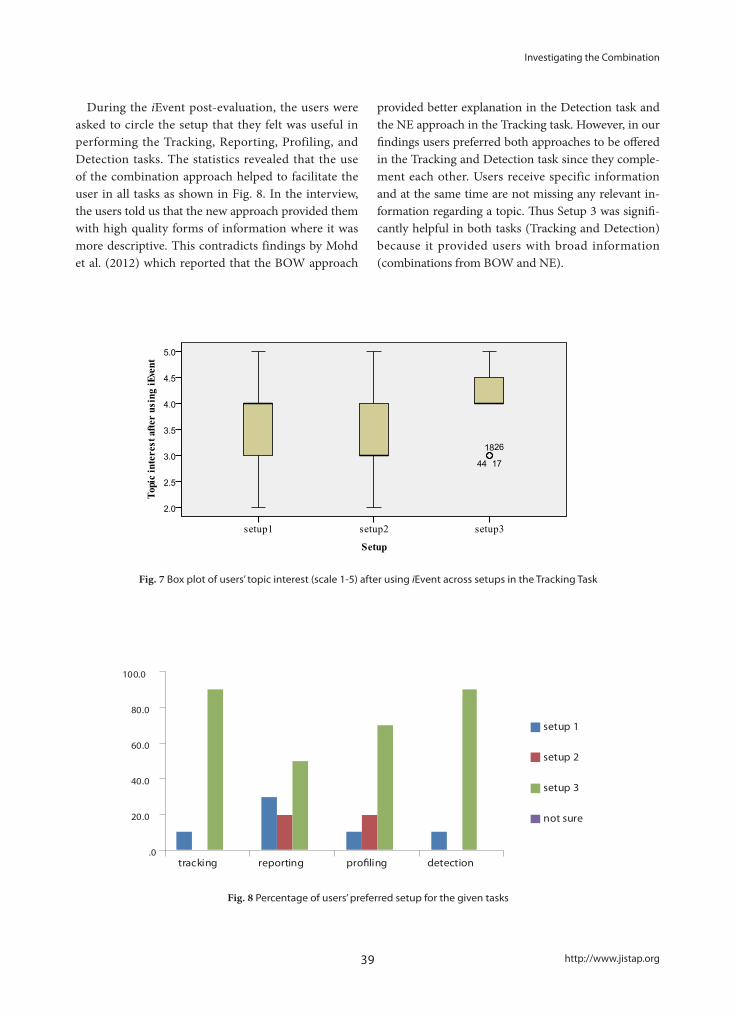
39 http://www.jistap.org
Investigating the Combination
During the iEvent post-evaluation, the users were asked to circle the setup that they felt was useful in performing the Tracking, Reporting, Profiling, and Detection tasks. The statistics revealed that the use of the combination approach helped to facilitate the user in all tasks as shown in Fig. 8. In the interview, the users told us that the new approach provided them with high quality forms of information where it was more descriptive. This contradicts findings by Mohd et al. (2012) which reported that the BOW approach
provided better explanation in the Detection task and the NE approach in the Tracking task. However, in our findings users preferred both approaches to be offered in the Tracking and Detection task since they comple-ment each other. Users receive specific information and at the same time are not missing any relevant in-formation regarding a topic. Thus Setup 3 was signifi-cantly helpful in both tasks (Tracking and Detection) because it provided users with broad information (combinations from BOW and NE).
Fig. 7 Box plot of users’ topic interest (scale 1-5) after using iEvent across setups in the Tracking Task
Fig. 8 Percentage of users’ preferred setup for the given tasks
.0
20.0
40.0
60.0
80.0
100.0
tracking reporting pro�ling detection
setup 1
setup 2
setup 3
not sure

40
JISTaP Vol.2 No.4, 31-48
5.2. Tracking TaskFirst, the users’ overall opinions on the use of the com-
bination approach (BOW+NE) in Setup 3 were exam-ined. Next, we investigated the users’ performance in the Reporting task, such as the amount of news written, and in the Profiling task, such as the amount and the types of keywords given to write a profile of a story (terms, NE, or a combination). Finally, we investigated whether the users agreed that the use of the combination approach in iEvent was perceived as useful, effective, helpful, and interesting in performing the TDT tasks.
5.2.1. Overall OpinionsUsers’ opinions of iEvent during the Tracking task
were analysed between setups. We investigated whether they perceived iEvent as easy, relaxing, simple, satisfy-ing, and interesting across setups. The Kruskal-Wallis Test confirmed that there was a statistically signifi-
cant difference in users’ opinion of easy (p=0.027) in conjunction with the setups. However, there was no statistically significant difference in simple (p=0.111), satisfying (p=0.390), relaxing (p=0.314), and interest-ing (p=0.155). Setup 3 was significantly stronger in easy (scale 4, 5) than Setup 1 and Setup 2 during the Tracking task, as appears in Table 3. Scale 1, 2, and 3 are treated as negative due to the zero value that appeared in scale 1 (Linacre, 2006). Meanwhile, scale 4 and 5 are considered as positive.
Easy A ratio of 9 users to 1 found that Setup 3 was easier
than the other Setups. 65% of users agreed that Setup 3 (mean=4.15 sd=0.587) was easy (scale 4) and 25% of them gave scale 5. Interestingly, none of the users found it difficult. This indicates that the use of the combination approach made the Tracking task easier.
Table 3. Summary Percentage of Users’ Opinions (easy, relaxing, simple, satisfying, and interesting) Across Setup in Tracking Task
Scale (%) (%)1 2 3 4 5 (-)ive (+)ive Ratio
Easy
Setup1 0 5 30 55 10 35 65 2:1
Setup2 0 10 30 45 15 40 60 3:1
Setup3 0 0 10 65 25 10 90 9:1
Relaxing
Setup1 0 10 25 60 15 35 75 2:1
Setup2 0 15 30 35 20 45 55 1:1
Setup3 0 5 10 65 20 15 85 6:1
Simple
Setup1 0 15 30 35 20 45 55 1:0
Setup2 0 15 45 40 0 60 40 2:1
Setup3 0 5 30 40 25 35 65 2:1
Satisfying
Setup1 0 15 5 60 20 20 80 4:1
Setup2 0 10 30 45 15 40 60 3:1
Setup3 0 0 20 60 20 20 80 4:1
Interesting
Setup1 0 5 30 45 20 35 65 2:1
Setup2 0 5 30 55 10 35 65 2:1
Setup3 0 0 15 55 30 15 85 6:1
(-) ive =scale 1, 2,3; (+) ive = scale 4, 5(Scale from 1 to 5, higher=better; highest value shown in bold)
41 http://www.jistap.org
Investigating the Combination
Relaxing, Simple, Satisfying, and Interesting As mentioned above, the Kruskal-Wallis Test con-
firmed that there was no statistically significant differ-ence (p>0.05) in users’ opinions with regard to relaxing, satisfying, and interesting. It clearly appears, however, that Setup 3 scored higher in terms of scale and ratio compared with Setup 1 and Setup 2, as shown in Table 3.
In the interview session, the users agreed that the use of the combination approach (BOW+NE) provided them with good findings and quick and precise infor-mation on the Who, Where, When, and What of an event, which made the Tracking task easy using Setup 3.
Interestingly, the satisfaction factor was also related to the high percentage of correct clusters tracked. This pro-vides strong evidence that iEvent helped significantly to facilitate users in tracking the correct cluster (mean=3.98 sd=0.129). The Kruskal-Wallis Test also confirmed that there was no statistically significant difference in the number of correct clusters to be tracked (p=0.368) in conjunction with the setups. This indicates that the users managed to track the correct clusters using all setups. We classified the correctness of cluster as tracked into four categories:
a. None - where users did not provide any informa-tion or they did not complete the task.
b. Wrong - where users tracked the wrong cluster.c. Partially Correct - where users list out the minor
cluster as their main finding.d. Correct - where users list out the major cluster as
their main finding.The complete Tracking task was successful with
98.33% of tasks as correct and 1.67% as partially correct because sometimes a wrong cluster was chosen that caused wasted time in performance of the task (15 min-utes). Moreover, users were confused by some terms, e.g. Merge, Texas, in topics which were highlighted in a cluster on a wrong topic.
The average time taken to conduct this task success-fully across setups was approximately 12 minutes, 13 seconds. The users spent about 11 minutes, 35 seconds using the combination approach (BOW+NE) in Setup 3, 11 minutes, 20 seconds using NE in Setup 2, and 13 minutes, 45 seconds for BOW in Setup 1. The time taken in Setup 3 represents a mid-point between the shorter time that was taken in Setup 2 and the longer time in Setup 1. A possible explanation for the mid-time taken in Setup 3 was that it represented a compromise
between the specific information (NE) provided by Set-up 2 and the general information provided by Setup 1 (BOW). Since Setup 3 provided the users with a mean-ingful information, both tasks are facilitated.
5.2.2. Reporting TaskThe Reporting task is one of the sub activities in Track-
ing. In this section, we report the findings of users’ per-formance during this task after analysis of the number of lines that users wrote across setups. There was no statisti-cally significant difference in the amount of news written in conjunction with the setups (Kruskal-Wallis Test, p=0.536), as shown in Fig. 9. The users managed to write almost the same number of lines in the report on average using Setup 1 (mean= 7.50 sd=2.819), Setup 2 (mean=6.45 sd=2.605) and Setup 3 (mean=7.45 sd=2.762).
5.2.3. Profiling TaskThe users were asked to write important keywords
as a profile for a topic where there were three types of keywords: named entities, terms, and combination (terms and named entities). For example, users might write keywords such as Exxon (NE), merge two com-panies (terms), and Exxon merge (combination) for the topic Mobil-Exxon Merger. We analysed the types of keywords provided by the users. The Kruskal-Wallis Test confirmed that there was no statistically significant difference between the types of keywords and the setups used in the Profiling task (p=0.504).
Findings revealed that users had a tendency to pro-vide more terms when they were using Setup 1 and larg-er named entities when using Setup 2. When they were provided with a combination of BOW and NE in Setup 3, however, the results indicated that they prefer to use NE as the important terms in the profile of the task. Fig. 10 shows that Setup 3 provided users with a larger amount of information (34.74%) compared with Setup 1 (32.83%) and Setup 2 (31.93%). The users interviewed agreed that the new approach (BOW+NE) provided a high quality source of information (balance distribution of terms and named entities), thus it was suitable for use in the Profiling task.
We can conclude, therefore, that the combination of BOW and NE is a good approach in this task. Users are provided with broad terms, and at the same time the combination automatically provides them with highly significant terms (NE).

42
JISTaP Vol.2 No.4, 31-48
Fig. 9 Amount of lines written
Fig. 10 Percentage for types of keywords across setups

43 http://www.jistap.org
Investigating the Combination
Fig. 11 Box plot on effectiveness (scale 1-5) of the ‘CV: keyword approach’ feature across Setups
5.2.4. FeaturesThis section deals with analysing each feature of
iEvent across setups that users perceived as being use-ful, effective, helpful, and interesting during the Track-ing task.
Useful There was a statistically significant difference shown
in the evaluation of the ‘CV: cluster labelling’ feature across setups (Kruskal-Wallis Test, p=0.030). The ‘CV: cluster la-belling’ feature in Setup 3 of iEvent was more useful (mean=4.15 sd=0.875) compared to Set-up 1 (mean=3.85 sd=1.137) and Setup 2 (mean=3.30 sd=1.031). It is clear from Table 4 that users found the ‘CV: cluster labelling’ feature useful when they were us-ing Setup 3.
A ratio of 9 users to 1 found that the combination ap-proach (BOW + NE) that was used in the ‘CV: cluster
labelling’ feature in Setup 3 of iEvent was significantly useful with 35% and 55% of users agreeing that it was useful (scale 4, 5), respectively as it seems to show in Table 4.
We can conclude that users found the combination approach (BOW+NE) used in the ‘CV: cluster labelling’ features in Setup 3 of iEvent more useful than other ap-proaches used in Setup 1 and Setup 2.
Effective There was also a statistically significant difference
shown in the evaluation of the ‘CV: keyword approach’ feature across setups (Kruskal-Wallis Test, p=0.049). Setup 2 was more effective (mean=4.20 sd=0.523) com-pared to Setup 3 (mean=4.50 sd=0.668) and Setup 1 (mean=3.80 sd=1.105). Users found this feature in Set-up 2 and 3 of iEvent more effective as shown in Fig. 11.
Table 4. ‘CV: cluster labelling’ Feature Across Setups Perceived as Useful
FEATURES Scale (%) (%)
1 2 3 4 5 (-)ive (+)ive Ratio
CV: cluster labelling
Setup 1 0 20 10 35 35 20 70 4:1
Setup 2 0 30 20 40 10 30 50 2:1
Setup 3 0 10 0 55 35 10 90 9:1
(-) ive= scale 1, 2; (+) ive=scale 4, 5(Scale from 1 to 5, higher=better; highest value shown in bold)

44
JISTaP Vol.2 No.4, 31-48
Helpful For this opinion value, the Kruskal-Wallis Test also
confirmed that there was a statistically significant dif-ference across setups shown in the evaluation of the ‘CV: cluster labelling’ feature (p=0.011, with mean= 4.30 sd=0.923), in that Setup 3 of iEvent was more helpful than Setup 1 (mean=3.75 sd=1.251) and Setup 2 (mean=3.25 sd=1.020). Users found this feature was helpful when they were using Setup 3, as shown in Table 5. A ratio of 16 users to 1 found that the combi-nation approach (BOW+NE) used in the ‘CV: cluster labelling’ feature in Setup 3 of iEvent was significantly helpful, with 55% of users agreeing that it was very helpful (scale 5).
This indicates that users found the combination
approach that was used in the ‘CV: cluster labelling’ features in Setup 3 of iEvent more helpful than Setup 1 and Setup 2.
Interesting For this opinion, the Kruscal-Wallis Test confirmed
there was a statistically significant difference (p<0.05) on two features across setups. These were the ‘CV: top terms’ feature (p=0.002) and ‘CV: cluster labelling’ fea-ture (p=0.022).
The evaluation shows that all features of iEvent were perceived as being interesting in Setup 3 (scale 4, 5) compared to Setup 1 and Setup 2, as shown in Fig. 12. These are ‘CV: top terms’ (mean=4 sd=0973) and ‘CV: cluster labelling’ (mean=4.25 sd=0.851) features.
Fig. 12 Box plot on Interestingness (scale 1-5) of ‘CV: cluster labelling’, ‘CV: top terms’ features across Setups
Table 5. ‘CV: cluster labelling’ Features Across Setups Perceived as Helpful
FEATURES Scale (%) (%)
1 2 3 4 5 (-)ive (+)ive Ratio
Setup 1 5 15 15 30 35 20 65 3:1
Setup 2 0 25 40 20 15 25 35 1:1
Setup 3 0 5 15 25 55 5 80 16:1
(-) ive= scale 1, 2; (+) ive=scale 4, 5(Scale from 1 to 5, higher=better; highest value shown in bold)
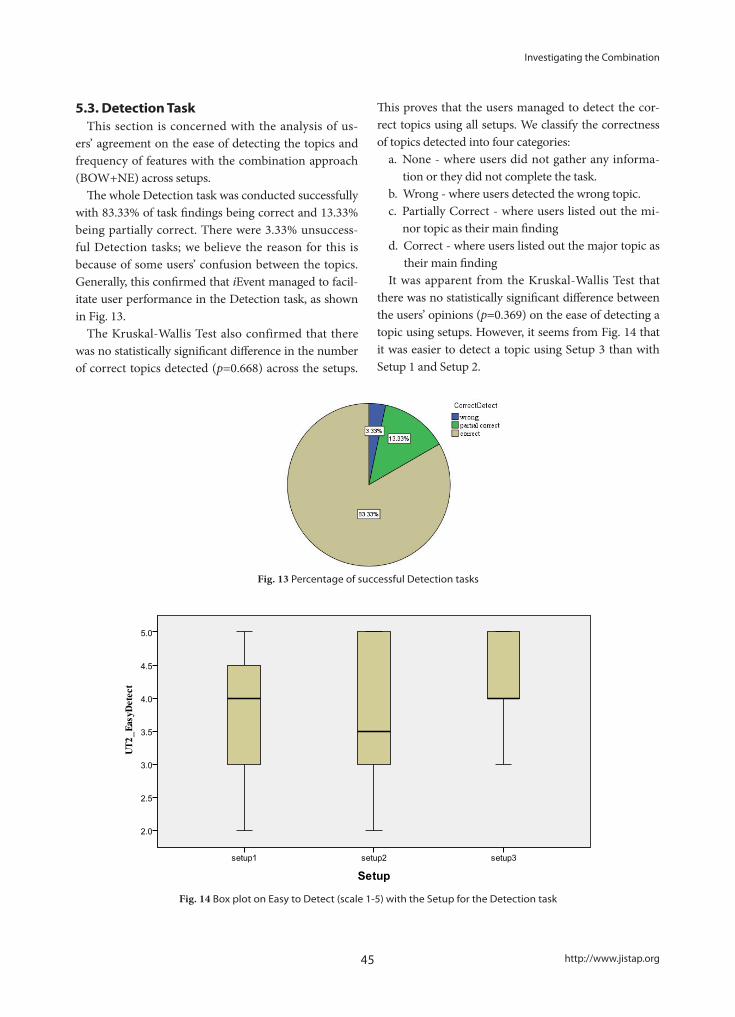
45 http://www.jistap.org
Investigating the Combination
5.3. Detection TaskThis section is concerned with the analysis of us-
ers’ agreement on the ease of detecting the topics and frequency of features with the combination approach (BOW+NE) across setups.
The whole Detection task was conducted successfully with 83.33% of task findings being correct and 13.33% being partially correct. There were 3.33% unsuccess-ful Detection tasks; we believe the reason for this is because of some users’ confusion between the topics. Generally, this confirmed that iEvent managed to facil-itate user performance in the Detection task, as shown in Fig. 13.
The Kruskal-Wallis Test also confirmed that there was no statistically significant difference in the number of correct topics detected (p=0.668) across the setups.
This proves that the users managed to detect the cor-rect topics using all setups. We classify the correctness of topics detected into four categories:
a. None - where users did not gather any informa-tion or they did not complete the task.
b. Wrong - where users detected the wrong topic.c. Partially Correct - where users listed out the mi-
nor topic as their main findingd. Correct - where users listed out the major topic as
their main findingIt was apparent from the Kruskal-Wallis Test that
there was no statistically significant difference between the users’ opinions (p=0.369) on the ease of detecting a topic using setups. However, it seems from Fig. 14 that it was easier to detect a topic using Setup 3 than with Setup 1 and Setup 2.
Fig. 14 Box plot on Easy to Detect (scale 1-5) with the Setup for the Detection task
Fig. 13 Percentage of successful Detection tasks

46
JISTaP Vol.2 No.4, 31-48
As mentioned previously in Section 5.1 (General Findings), during the post-evaluation interview the users found that the combination approach (BOW+NE) was more descriptive because they had to detect the topic dealt by a specific cluster in the Detection task, and Set-up 3 (combination approach) provided users with Who, Where, When, and What information at the same time.
As shown in Table 6, 55% of users agreed that it was easy (scale 4) to detect a topic using Setup 3 (mean=4.40, sd=0.699). Surprisingly, none of the users found that it was hard to detect a topic using any of the setups. 85% of users found that Setup 3 makes the Detection task easier than Setup 1 and Setup 2.
Further analysis on the interaction logs proved that us-ers had a higher activity for the ‘DV: document content’ feature in Setup 3 (77.3%) compared to Setup 1 (68.8%) and Setup 2 (65.7%). These results clarified that users clicked less on the ‘DV: document content’ feature with NE (Setup 2) and BOW (Setup 1), than with the combi-nation approach (BOW+NE) in Setup 3. Highlighting BOW and NE in the ‘DV: document content’ feature has provided users with quick and significant informa-tion rather than displaying plain document content. In addition, it provided users with links to highlight other clusters which had the NE or BOW in the document content by clicking on the terms or named entities. Addi-tionally, in the successful attempts at the Detection task, the users took less time using the combination approach (BOW+NE) (00:04:22) compared to using NE (00:04:41) and keywords (00:04:50).
Furthermore, the interaction logs showed that there was slight activity in the ‘TV: keyword approach’ feature. This was seen clearly in Setup 3 and less clearly in the other two Setups. This may be due to users attempting to use Who, Where, When, and What terms.
These results indicate that the combination approach
(BOW+NE) used in the ‘DV: document content’ feature provided them with all the terms, and the NE used in the ‘DV: document content’ feature helps them to make a quick decision in respect to a topic in the Detection task.
6. DISCUSSION
In general, most of the features in Setup 2 (NE) fa-cilitated users in the Tracking task. Meanwhile, Setup 1 (BOW) facilitated them in the Detection task. Interest-ingly, users agreed that most of the features in the com-bination approach (BOW+NE) facilitated performance of both tasks. Users found, however, that the use of the combination approach (BOW+NE), for example in the ‘DV: document content’ feature, also provided them with broader information that helped them to detect the topic quickly. This proves that the combination approach (BOW+NE) was effective and efficient in both tasks. Table 7 shows the features with their approaches which facilitated users in performing the TDT tasks.
The Kruskal-Wallis Test confirmed that there was no statistically significant difference between the successful Tracking (p=0.368) and Detection task (p=0.668) across setups. It is seems clear that there is consensus that the combination approach (BOW+NE) helped the users in both tasks; moreover, most of them agreed that it was useful and interesting.
Future analysis on the interaction logs enabled us to make a comparison of the mean number of clicks among the successful tasks between setups, as shown in Table 8.
It seems from Table 8 that there is a disparity in mean number of clicks between the approaches that were used in performing tasks across setups. This can be seen clearly between Setup 1 and Setup 2 where mean clicks in Setup 2 in the Tracking task are higher than for Setup
Table 6. Percentage of User Opinions on Ease of Detecting a Topic Across Setups
Scale (%) (%)1 2 3 4 5 (-)ive (+)ive
Setup 1 0.0 10 25 40 25 10 65
Setup 2 0.0 15 35 15 35 15 50
Setup 3 0.0 0 15 55 30 0 85
(-) ive=scale 1, 2; (+) ive= scale 4, 5(Scale from 1 to 5, higher=better; highest value shown in bold)

47 http://www.jistap.org
Investigating the Combination
1. Meanwhile, the mean number of clicks in Setup 1 is higher in the Detection task. Surprisingly, it is clear that the mean clicks in Setup 3 was closely equal to the mean average of each task in both Setup 1 and Setup 2, showing that the combination approach (BOW+NE) facilitated both tasks. There are two explanations for the previous findings in interaction logs: First, the higher number of clicks indicates a lack of information or high-er interaction between the users and the system; second, the average number in clicks provided by Setup 3 may indicate that users are provided with enough informa-tion to perform both tasks.
7. CONCLUSIONS
Users are provided with the two types of information and they can choose to display either keywords or key-words with named entities highlighted. A combination of this information is interesting since named entities are high quality pieces of information and keywords are descriptive. Rather than providing users with the Who, Where, and When it would be interesting to provide the What in one setting and investigate its effects. Thus, this study has presented an experimental study conducted with journalists to investigate the combination of bag
of words and named entities (BOW+NE) approaches implemented in the iTDT interface called the Interac-tive Event Tracking (iEvent) system; this includes what TDT tasks these approaches facilitate. The combination approach (BOW+NE) in Setup 3 has provided the users with focused information to facilitate both tasks and enhanced interaction between users and the system. Users provided a large number of terms (BOW and NE) during the Profiling task using Setup 3, which in-dicates that the iTDT with the combination approach (BOW+NE) is useful in helping journalists to perform their tasks. It has provided users with descriptive and significant information. Overall these findings revealed that the use of a combination approach (BOW+NE) effectively enhanced the iTDT interface and created more interaction between users and the system in both tasks (Tracking and Detection). Journalists require both descriptive information in the Detection task and sig-nificant information in the Tracking task. Therefore the combination approach (BOW+NE) in Setup 3 has pro-vided users with focused information to facilitate both tasks and enhanced interaction between users and the system. As a further contribution, this article confirms the value of the combination approach in iTDT which has facilitated the journalists in performing the Tracking and Detection tasks.
Table 7. Comparison of Features, with Approaches, Which Facilitated TDT tasks
Keywords Named entities BOWs+NE
CLUSTER VIEW (CV)
cluster labelling Detection Tracking Both
top terms Detection Tracking Both
DOCUMENT VIEW (DV)
document content Tracking Both
TERM VIEW (TV)
keyword approach Detection Tracking Both
Both= Tracking+Detection tasks
Table 8. Comparison of Features, with Approaches, Which Facilitated TDT tasks
Task Mean of click
Setup 1 Setup 2 Setup 3Tracking 23 37 31
Detection 32 25 28
(Highest value shown in bold)

48
JISTaP Vol.2 No.4, 31-48
REFERENCES
Allan, J., Harding, S., Fisher, D., Bolivar, A., Guz-man-Lara, S., & Amstutz, P. (2005). Taking topic detection from evaluation to practice. Proceedings of the 38th Hawaii International Conference on Sys-tem Sciences (HICSS’05) (pp. 101.1). Washington: IEEE Computer Society.
Berendt, B., & Subasic, I. (2009). STORIES in time: A graph-based interface for news tracking and dis-covery. WI-IAT ‘09 Proceedings of the 2009 IEEE/WIC/ACM International Joint Conference on Web Intelligence and Intelligent Agent Technology, (pp. 531- 534). Washington: IEEE Computer Society.
Borlund, P. (2002). Experimental components for the evaluation of interactive information retrieval sys-tems. Journal of Documentation, 56(1), 71-90.
Borlund, P., & Ingwersen, P. (1997). The development of a method for the evaluation of interactive infor-mation retrieval systems. Journal of Documenta-tion, 53(3), 225–250.
Cunningham, H., Maynard, D., Bontcheva, K., & Tab-lan, V. (2002). GATE: A framework and graphical development environment for robust NLP tools and applications. In Proceedings of the 40th Anni-versary Meeting of the Association for Computation-al Linguistics (pp. 168–175). Philadelphia: PA.
Doyle, L. B. (1975). Information retrieval and processing. California: Melville.
Jones, G. J. F., & Gabb, S. M. (2002). A visualisation tool for topic tracking analysis and development. Proceedings of the 25th annual international ACM SIGIR conference on Research and development in information retrieval (pp. 389-390). New York: ACM Press.
Kowalski, G. (1997). Information retrieval systems – Theory and implementation. London: Kluwer Aca-demic.
Kumaran, G., & Allan, J. (2004). Text classification and named entities for new event detection. Proceedings of the 27th annual international ACM SIGIR con-ference on research and development in information retrieval (pp. 297–304). New York: ACM Press.
Leuski, A., & Allan, J. (2000). Lighthouse: Showing the way to relevant information. In Proceedings of the IEEE Symposium on information Visualization (pp. 125-129). Washington, IEEE Computer Society.
Lewis, D. D., & Gale, W. A. (1994). A sequential algo-rithm for training text classifiers. Proceedings of the 17th annual international ACM SIGIR conference on Research and development in information re-trieval (pp. 3-12). New York: Springer-Verlag.
Linacre, J. M. (2006). WINSTEPS Rasch measurement computer program. Chicago: Winsteps.
Makkonen, J., Ahonen-Myka, H., & Salmenkivi, M. (2004). Simple semantics in topic detection and tracking. Information Retrieval, 7(3-4), 347-368.
Mohd, M., Crestani, F., & Ruthven, I. (2012). Evaluation of an interactive topic detection and tracking inter-face. Journal of Information Science, 38(4), 383-398.
Pons-Porrata, A., Berlanga-Llavori, R., Ruiz-Shulcloper, J., & Perez-Martinez, J. M. (2004). JERARTOP: A new topic detection system. In Proceeding of Prog-ress in Pattern Recognition, Image Analysis and Ap-plications (pp. 71-90). New York: Springer-Verlag.
Rijsbergen, C. J. (1979). Information retrieval, 2nd ed. London: Butterworths.
Spärck-Jones, K. S., & Willett, P. (1997). Readings in information retrieval. San-Francisco: Morgan Kaufmann.
Spärck-Jones, K. S. (1981). Information retrieval experi-ment. London: Butterworth-Heinemann Newton.
Swan, R., & Allan, J. (2000). Automatic generation of overview timelines. Proceedings of the 23rd annual international ACM SIGIR conference on Research and development in information retrieval (pp. 49-56). New York: ACM Press.
Yang, Y., Carbonell, J. Q., Brown R. D., Pierce, T., Ar-chibald, B. T., & Lin, X. (1999). Learning approach-es for detecting and tracking news events. IEEE Intelligent Systems Special Issue on Applications of Intelligent Information Retrieval, IEEE Educational Activities Department, 14(4), 32 -43.
Zhang, K., Zi, J., & Wu, L. G. (2007). New event detec-tion based on indexing-tree and named entities. SIGIR ‘07 Proceedings of the 30th annual inter-national ACM SIGIR conference on Research and development in information retrieval (pp. 215- 222). Netherlands: ACM Press.

49 http://www.jistap.org
JISTaPJournal of Information Science Theory and Practice
http://www.jistap.org
Information Pollution, a Mounting Threat: Internet a Major Causality
Ramesh Pandita *Central LibraryBGSB University, India E-mail: [email protected]
Open Access
Accepted date: November 10, 2014Received date: December 3, 2013
*Corresponding Author: Ramesh PanditaAssistant LibrarianCentral LibraryBGSB University, India E-mail: [email protected]
All JISTaP content is Open Access, meaning it is accessible onlineto everyone, without fee and authors’ permission. All JISTaP content is published and distributed under the terms of the Creative Commons Attribution License (http:/ creativecommons.org/licenses/by/3.0/). Under this license, authors reserve the copyright for their content; however, they permit anyone to unrestrictedly use, distribute, and reproduce the content in any medium as far as the original authors and source are cited. For any reuse, redistribution, or reproduction of a work, users must clarify the license terms under which the work was produced.
ⓒ Ramesh Pandita, 2014
ABSTRACTThe present discourse lasts around, information pollution, causes and concerns of information pollution, internet as a major causality and how it affects the decision making ability of an individual. As, information producers in the process to not to lose the readership of their content, and to cater the information requirements of both the electronic and the print readers, reproduce almost the whole of the printed information in digital form as well. Abundant literature is also equally produced in electronic format only, thereon, sharing this information on hun-dreds of social networking sites, like, Facebook, Twitter, Blogs, Flicker, Digg, LinkedIn, etc. without attributions to original authors, have created almost a mess of this whole information produced and disseminated. Accordingly, the study discusses about the sources of information pollution, the aspects of unstructured information along with plagiarism. Towards the end of the paper stress has been laid on information literacy, as how it can prove handy in addressing the issue with some measures, which can help in regulating the behaviour of information producers.
Keywords: Information, Information Pollution (IP), Internet, WWW, Social Media, Print & Electronic Document
Research PaperJ. of infosci. theory and practice 2(4): 49-60, 2014http://dx.doi.org/10.1633/JISTaP.2014.2.4.4
1. INTRODUCTION
On day-to-day basis, people consume information acquired from different sources, be they formal or
informal, printed or electronic, online or offline, word of mouth or an issued undertaking on a variety of sub-jects, mostly concerning to education, health, business, news, entertainment, religion, philosophy and many

50
more. The worrying aspect is, consumers of informa-tion hardly look for the authenticity of the information they consume, which otherwise may be polluted to a greater degree and in many ways. Morrison & Stein (1999) in their study, while viewing their concerns about the information pollution, observed that more than 20% of all the future jobs will be involved in lo-cating, assessing and checking the authenticity of the information to be consumed, and thereafter same shall be provided for consumption. Harris (1999) while highlighting the role and importance of information argues that information serves as the foundation in our lookout in understanding the world, be it by thinking, judgment or through our belief system.
People are very much familiar with the pollutions as-sociated with, air, noise, soil, water etc., which are very common. Humans could not timely realize the im-portance of protecting different kinds of ecologies and environments as such have started suffering on these accounts. Now the irony is, the situation has reached to the stage, that despite putting in all possible efforts humans are unable to reverse this effect completely. Accordingly, information pollution is very much in existence for a quite long now, but it is the consumers of information, who have not yet realized the pollu-tion associated with it and the worrying aspect here again is, by the time people will realize the need and importance of pollution free information, things may again slip out of our hands and the situation may again become irreversible.
The question arises, what is pollution free informa-tion or the other way round what does authentic or reliable information mean? If we look at the dictionary meaning of the word “authentic”, it means “genuine, true, real, veritable, what is not false, or uncontami-nated. Availability or provision of the right kind of in-formation means, what is free from false or misrepre-sentation of facts and trustworthy, which is supported by evidence. Authentic also means, what is vested with authority, having a legal validity, which is verifiable to establish its genuineness. In legal terms “authentic” means credible, competent, and reliable with all neces-sary formalities required.
In the present discourse attempt has been made to assess the different aspects and facets of ‘Information Pollution’ and the role of the web in furthering it, es-pecially the way social media has come into force to
deliver and regulate the information dissemination techniques among netizens. The younger generation in the age group of 15-35 years are more vulnerable to this menace, as it is these people who most of the time remain hanged to the internet, of course not by choice every time but out of compulsion as well, given their job requirements. The Internet has definitely helped us to cut across the space and time constraint, but at the same time, the worrying part is mishandling of tech-nology, whereby the same technological blessing has begun to turn into a curse.
2. INFORMATION AS A RESOURCE
Importance of Information as one of the greatest resource in the human life can be gauged from various facts. Be it about the transition of human life from wanderers to settle ones, from hunters and food gath-erers to food growers and to cover these phases of life, it is the information, which has come to the rescue of early man. By accumulating information and convert-ing it into knowledge. Humans developed sense for accumulation of information on various aspects of life and the continuous and constant propagation of same to the coming generations has led us to be known as present day men of science and technology, what we often dub as an information society.
Information has refined the course of life to leaps and bounds; this as a result has replaced the age old concept of division of the world on the basis of wealth to the division of the world on the basis of accumu-lation & exploitation of information. Polarization of the world on the basis of ‘Information Rich’ and’ In-formation Poor’ countries has itself become a decisive factor, which has led countries to be distinguished as developed and developing countries. The accumula-tion of information is not an end in itself, what is more important is to exploit this information to its optimum for the welfare and betterment of society. Need is to put more emphasis on the production, handling, or-ganization, dissemination, usage and exploitation of quality information, given this fact, no force on earth can deprive a country from becoming economically rich, thereby unfolding the economic attributes of in-formation.
JISTaP Vol.2 No.4, 49-60

51 http://www.jistap.org
Information Pollution, a Mounting Threat
3. INFORMATION POLLUTION
In the modern times, it was Dr. Paek-Jae-Cho, former CEO cum president of Korean Telecommu-nication Corp. (KTC), who actually coined the term information pollution, unleashed by Information Technology (IT) alongside, especially by the Web, a byproduct of IT. Dr. Chou in 2002 during his speech at a 14th biennial conference of International Telecom-munications Society (ITS) talked about the side effects of Information Technology and the undesirable effects it had over society at large in the form of infollution, which means inofmatization pollution. Information pollution is broadly referred as an outcome of infor-mation revolution, wherein people are supplied with contaminated information, which is of less impor-tance, irrelevant, unreliable and unauthentic, which lacks exactness and precision, which always has an adverse effect on society at large.
It is not that information pollution may have gone unnoticed among consumers of information, but what made them pay lenient view towards the production, distribution and equally consumption of contaminated information is due to lack of realization towards the detrimental effect all this is going to have on human activities in the long run.
4. RELATED LITERATURE
Researchers across the globe have raised concerns towards the information pollution from time to time, but the people still don't grow conscious of the need and importance of pollution free information and the situation is more adverse in developing and under de-veloping countries.
Nielsen (2003) is of the view that the excessive con-tent mostly distracts the information seeker form its real essence and people find it difficult to extract use-ful information. Nielsen in his article has highlighted about the importance of brevity of information and how actually long and undesirable information makes it difficult for people to extract the most relevant & useful information. Cameron and Curtin (1985) in their study of tracing sources of information pollution discussed about the print media for having an unwrit-ten policy on advertising. McCloskey and Zaragoza
(1985) in their study did an experiment to assess, how misleading post event information plays its part in memory impairment.
Eva et al (2000) in their study discussed about over-coming the misleading information by applying the reasoning strategies and they actually found how nov-ice diagnosticians overcome such a problem with such application. Researchers in their study argue about the misconceptions of scholars about political ignorance among people for individual reasons, which otherwise is not so and is just an outcome of quality of informa-tion environment. Alba, Hutchinson and Lynch (1991) in their study of memory and decision making argued about how people are actually bombarded with infor-mation from all corners which differ in credibility and how the memory of people should be as accurate as possible. Since people are the consumers of different sort of products, as such, have to see by themselves whether the information circulated about the consum-ables they go for, is true or false.
Had people not come across the polluted or con-taminated information, they would hardly look for the authenticity and credibility of information supplied and the sources thereof. Since people look for authen-tic and credible information, this in itself corroborates the fact that there is large scale contamination of infor-mation, vis-à-vis information pollution. Hasher, Gold-stein & Toppino (1977) in their article frequency and the conference of referential validity deliberated about how the memory of the original context is as import-ant as memory for the claim. People tend to hold the information true once it is seconded by some familiar source, despite not remembering or recalling the origi-nal context or the source of the claim.
Information overload is equally a term in vogue these days, which can also be considered as one of the forms of information pollutions and is being seen as one of the reasons affecting the decision making ability of a person. Milford & Perry (1977) are of the view that information overload can be considered as that information, which is over and above the pro-cessing capacity. This definitely can be termed both for machines and humans. Simon (1979) argues that cognitive capacity is important for decision making and its limited capacity reduces the quality of decision making.

52
JISTaP Vol.2 No.4, 49-60
Information overload is also being seen more as a reason of distraction rather sharpening the focus. Woodhead (1965) and Eschenbrenner (1971) is of the view that the more there is distraction more there are chances of decrease in decision accuracy. Information Technology or Computers are also being seen as grow-ing sources of distraction and interruption, argues Panko (1992). Baecker et al (1995) is of the view that people associated with computer related activities suf-fer from cognitive loads, hence are more susceptible to interference from interruptions. As per Reuters (1997) in 1000 Fortune companies, 50% of management staff are always left overwhelmed with the number of mes-sages they receive and this interruption is being seen over six times an hour. Speier, Valacich & Vessy (1999) on the information overload perspective undertook a study, entitled “the influence of task interruption on individual decision making” and observed that inter-ruptions are very detrimental in decision making even in simpler tasks and the need is to understand how the negative influence of interruptions can be mitigated to improve the individual decision making.
5. SOURCES OF FORMATION POLLUTION
It won’t be perhaps inappropriate to say that there are as many sources of information pollutions as there are sources of information production. One or the other way, intentionally or unintentionally, overtly or covertly there is always some sort of infor-mation distortion & information contamination, but mostly gets unnoticed. Some of the major sources of information pollution include.
5.1. Information TechnologyInformation Technology, if on one hand has revo-
lutionized the information production, its handling and dissemination; at the same time it is being seen as one of the worst polluters of information. The Internet is indeed a blessing in its own way and one can imagine how the recourse of life will suffer in its absence, especially in the present day world, where most of the routine activities, which previously oth-erwise were used to be handled manually by running from pillar to post are now being handled by tech-nology in automated form by seating at one place.
Information Technology is actually supplemented by its various subsystems in the course of information pollution, which include.
5.1.1. World Wide Web (WWW) The web has become one of the largest sources of
information, which has amassed data stored with hundreds and thousands of servers across the length and breadth of the globe. A good proportion of this stored information on these servers is structured to a good extent, but the major portion of the informa-tion is cluttered and unstructured. Richmond (1998) in his study about evaluating the web resources, suggested ten C’s to be followed while going ahead with information seeking on the internet. These C’s include, content, credibility, critical thinking, copy-right, citation, continuity, censorship, connectivity, comparability and context. Alexander and Tate (1999) while deliberating upon the reliability of the Web re-sources by judging them for accuracy, authority, cur-rency, coverage and objectivity, while as Fritch and Cromwell (2001) are of the view that one should eval-uate the information retrieved from the web should be based on author competence & trustworthiness, document validity and overt & covert affiliation with an institution.
The greatest difficulty with the web is ■ Source of unstructured information■ Supplier of unsolicited information■ Unregulated information production and dissem-
ination■ Absence of mechanism to check superfluous &
distorted information
5.1.1.1. SOCIAL MEDIASocial Media is the latest Internet offering, which
has brought a revolution in the lives of common masses in its own way, even one should not be having hesitations in admitting the fact, that social media has ushered a new dawn of freedom of expression. Social media has empowered common masses by becoming their mouthpiece, whereby people express their views and opinions on a range of issues freely, frankly and fearlessly. Haider and Koronios (2003) in their study on authenticity of information in cyber-space voiced their concerns about the freedom of ex-pression. The authors are of the view that freedom of

53 http://www.jistap.org
Information Pollution, a Mounting Threat
expression should be defended as long as the content is not inciting violence, derogatory, affecting public opinion, fomenting communal hatred. Social media, if on one hand has introduced us to the world of real freedom of expression, on the other hand it has also brought us closer to the dangers of absolute freedom of expression. I am reminded of Elbert Hubbard, who has said, ‘responsibility is the price of freedom’, right-ly for the fact that excessive freedom involves dangers of its own kind.
5.1.1.2. SPAM Electronic messaging in the form of emails has not
just overcome the space and time barriers, but has equally empowered humans to seek a timely solution of the problems, which otherwise used to remain missing in the conventional methods of exchange of information. Over a period of time, this form of information exchange does not fascinate the internet users to the same extent as it used to, a decade or so back. Spam is the name given to those electron-ic messages, which one receives from people not known to the recipient, as these messages are mostly promotional in nature. Stover and Nielsen (2002) argued about the depleting usability of emails, where with each passing day, it is becoming less useful for personal as well as for professional reasons. Some of the reasons cited include, delivery of lot of undesired stuff, which hardly benefits readers, time consuming activity and abundance of junk mail, which users treat more as a personal assault. Instant messaging (IM) is what the authors see as a substitute for emails and that is where we are as on date. Most of the time people respond more quickly any IM, be it on social networking sites or the other IM chats.
5.2. Mobile PhonesThe growing trend towards flashing the instant
messages on mobile phones by service providers of various business houses with the view to promote their products creates information pollution in its own way. It is always distracting and disturbing, when all of a sudden mobile phone of any third person starts ringing at important places, especially like libraries, classrooms or while being in the mid of a meeting, seminar, conference or an important lecture. Ling (2004) believes that “clashes with many
social situations, particularly those governed by a heightened sense of normative expectations (p.125)”. Brette et al. (2006) in their study on mobile phones have opined that given the constructive use of mo-bile technology, it won’t be appropriate to suggest banning the use of mobile phones at sensitive places. Though preventing mobiles to ring at sensitive places will be well supported by people at large, but this sort of practice is not going to be the solution of the prob-lem, as it may prove tempting instructors and institu-tions.
5.3. Books and JournalsHundreds of journals are being published with
common titles, mostly confusing, with heavy prices, which makes it difficult to the seeker of information to get a desired piece of information. These subscrip-tions instead of helping one to get the relevant piece of information, leads one to get lost in information clutter, which is mostly unorganized. Hundreds of research projects get daily bogged down due to the use of the polluted information, with the result, these huge heaps of information produced questions its own credibility and authority.
5.4. Information Explosion The concept of information explosion may be new
to people passively associated with the production and consumption of information, but not to the people actively engaged with production, handling, dissemination, organization and exploitation of in-formation. An information explosion occurs when the emphasis is paid on a quantitative aspect of infor-mation production and quality aspect is overlooked, hence resulting in information pollution. Sustainable production and consumption of information is a key to proportionate growth and development. Producers of information should be equally concerned about its purposive consumption. Hybrid publishing has be-come the order of the day, as same information pro-duced and reproduced in both electronic and print formats. Indeed important to protect the interest of both the type and kind of users, but definitely there is a need to look for a middle path.
Information explosion cannot be substituted for information pollution, information explosion simply means exponential growth of information, whereby

54
JISTaP Vol.2 No.4, 49-60
consumers of a particular kind of information are not able to consume all the relevant information pro-duced in their chosen field and the information pro-duced may not necessarily be contaminated or pol-luted. The former is a quantitative aspect, while as the lateral is the quality aspect, so there is always need to regulate the two and the former cannot be compro-mised at the cost of lateral. Information pollution on the other hand can be referred to a situation, wherein people are supplied with contaminated, unreliable, unauthentic, irrelevant information. Information explosion is equally an outcome of duplication of information, reproducing the same information in different formats, multiplication of information and other similar activities, which are least desirable.
5.5. Unorganized Information Proper and systematic organization of information
is as important as the creation of information itself. Improper and unorganized information is nothing more than a heap of straw. The internet, if on one hand has helped us to overcome the barriers of space and time with its unblemished speed and delivery, on the other hand it has also become one of the largest sources of unstructured information, which as a re-sult has converted it into one of the time consuming information data banks, and is gradually eclipsing the speed and delivery distinction it has. Need is to pay attention towards those institutions or organizations which are actively engaged in the organization of knowledge and information and Libraries and infor-mation centers being one of them.
5.6. PlagiarismPlagiarism means differently to different people,
but in every case it involves the intellectual theft, one or the other way. The definition of plagiarism given in the Collins Dictionary of English language reads as, plagiarism is the act of plagiarizing ideas, passag-es, etc., from another’s work and presenting them as one’s own without acknowledging the actual source, Hanks (1979). Fialkoff (1993), according to the As-sociation of American Historians, “plagiarism is a misuse of the writings of another author, including limited borrowing without attribution of another’s distinctive and research findings”.
There are a good number of recorded instances
when incidents of plagiarism came to the fore and ruined the careers of well know personalities of their respective fields. Be it Nina Totenberg, who in 1972 was alleged of copying content from Washington post for her article, which she had written for na-tional observer or the Mike Barnicle, who in 1998 faced suspension for using jokes of George Carlin without attribution. An incident of plagiarism was also reported against Ambrose by the daily standard for his book, The Wild Blue: The Men and Boys Who Flew the B-24s over Germany, with Thomas Childers book, Wings of Morning and other books by Dou-bleday and Simon & Schuster. The Forbes.com went ahead with its investigation and observed that the Wild Blue reflected a pattern, which was found sim-ilar through Ambrose’s doctoral thesis from 1963. Goodwin was next to follow the suit for plagiarizing the content from Kathleen Kennedy: Her Life and Times by Lynne McTaggart's (Doubleday, 1983) in her book, The Fitzgeralds and the Kennedys (Simon & Schuster, 1987). In the subsequent editions the footnotes and acknowledgements were added from McTaggart’s book. All this resulted her to resign from Harvard’s board of overseas, from the Pulitzer Prize board along with cancellation of various speaking in-vitations.
Plagiarism is an information pollution of its own kind, though people may dub it only to steeling of others work or intellectual theft without acknowledg-ing the others work, but the fact is reproducing oth-ers information by labeling it own, leads to confusion to seeker of information as what to rely on and the authoritative source of information thereof.
6. CONCERNS OF INFORMATION POLLUTION
Pollution of every sort affects living beings in its own way and so are its consequences.
6.1. EcologicallyThough, by and large it may appear that informa-
tion pollution only affects human beings actively only, but the fact is this pollution has an ambit of its own kind, which encompasses the whole of the ecol-ogy and environment in which we all dwell. Needless

55 http://www.jistap.org
Information Pollution, a Mounting Threat
to say that our research findings, our activities, our all other day to day activities have direct bearing with the environment, we dwell in, thereby information pollution affects our ecology and environment in a passive way.
6.2. Decision MakingInformation overload has a profound impact on
the decision making ability of a person says Buchan-an and Kock (2001). The author quoted the popular press term “Information Fatigue Syndrome” which is comprehended as hampering the decision mak-ing ability of a person. Allen and Griffeth (1997) in their study pointed out that traditionally the decision making ability of people used to be hampered for the want of required information for decision making, while in the present day world the decision making ability is hampered due to information overload, as what to believe and what not. Availability and supply of abundance information on any given topic ham-pers the decision making ability of a person for var-ied reasons. Information overload or excessive infor-mation always creates doubts about the authenticity and reliability of information, as which piece of infor-mation is more authentic and thereof to make use of. Decision making ability of individual recedes hence, becomes difficult to arrive at a conclusion on any give problem. Decision making ability of individuals, institutions and for that matter even of organizations gets hampered due to supply of polluted information.
6.3. Health Eastin (2001) in his study about the credibility of
online health information raised concerns about the vast amount of health information available and ac-cessible to masses via internet is not always authored by medical professionals. The author in his study laid emphasis on the greater need to ascertain the credi-bility of information available. The author conducted a study with 125 subjects to assess the health relat-ed website on six different assignments and found, that message credibility is more related with source expertise. To have a strong and robust health sector in a country, need is to work on areas, whereby all the health related information generated or collect-ed from different quarters is put to the litmus test, before applying the same for the cure of the mass-
es. Health care professionals advocate the hymn, ‘prevention is better than cure’ but the fact remains, both are the faces of the same coin and none of them can be neglected on each other’s behest. Supplying contaminated information or without checking the authenticity and credibility of information can always downplay with the health of the masses.
7. SOME PREVENTIVE MEASURES
As is said prevention is better than cure, given this fact by no means it would be extraneous to say, that there is greater need to pay more heed of taking pre-ventive measures in every sphere of human activity rather waiting for things to grow beyond control and then look for curative measures. Since Information pollution, like environmental pollution is man-made, as such, can be handled more effectively by working on its preventive measures rather looking at its cura-tive part. There cannot be anything better than sen-sitizing people about the prevention of information pollution on the parallel lines to that of environmen-tal pollution.
7.1. Information Literacy(IL)Postman (1992, 61) stated that “we are driven to fill
our lives with the quest to access Information”, and the human creativity is immensely influenced by informa-tion. Information Literacy proves very handy in over-coming information pollution issues, where individual perceptions of people come into play to judge the au-thenticity and reliability of information they are being provided or supplied with. Information literacy plays a very vital role while retrieving information from the web, especially when the authenticity and reliability of information available on the web is being questioned. Braun (1997) in in his study invited the attention of seeker of information towards the aspects that infor-mation literacy is not only about being able to locate relevant information, but also encompasses the ability of an individual to interpret, evaluate, and apply the retrieved relevant information.
Need is to introduce information literacy as a part of the curriculum from the very beginning of formal schooling. The more we pay attention towards the use of authentic and authoritative information, the more it

56
will lead us to produce refined and pure information, with emphasis on sustainable information production and its consumption with minimal information pollu-tion.
IL develops Professional Competence IL leads Valuing Information IL leads Skill Development IL leads to Bridge Knowledge Gap IL leads to flow of Information from Informa-
tion Haves to Information Have-nots IL leads to Information Economy
Information Literacy also Leads to:• Valuing information and its use.• Considering appropriate sources of information
and its usage• Using information to learn.• Learning to make use of information in a variety
of ways. • Developing Information competency to access,
evaluate, organize, exploit, create, or even dissemi-nate information.
• According to ALA 1989, IL is about being definite about the problem,
• Technological literacy.• Developing skills to extract most authentic, reli-
able and exact information.
Information literacy apart from increasing the deci-sion making ability of the person helps in prioritizing the need and use of information.
7.2. CensorshipCensorship is the age old tool, which has proved
instrumental in regulating the behaviour of people who believe in getting more involved with publishing provocative and anti social content. Censorship has helped to play a constructive role in the dissemina-tion of authentic and reliable information published through conventional means. Contrary to this fact, in the absence of censorship of content published on various websites, blogs and social networking sites goes irrepressible. Deibert (2008) in his article, the geopolitics of internet control raises the issue of information flow across boarder in the light of the sovereignty of a state. The author argues that over a
period of time, the role of the Internet has changed considerably, when it was rated as a medium of free flow of information and more of freedom of ex-pression. Today the Internet has become an area of concern, especially in the absence of censorship and others. The author highlights the sensitive areas like national security, cultural sensitivity & social values which appear to be getting eroded by the free flow of unregulated information on the Web. Absence of censorship, on content published on the Internet has not just boosted the information pollution, but has also invited the dangers of inciting social unrest. Pan-dita (2013) correlated need and importance & prev-alence of censorship to the time of Adam and Eve, when they were prohibited from eating the forbidden fruit in Eden Garden. The author further believes that censoring content which is sacrilegious, com-munal, derogatory, or provocative in one or the other form and which can easily stimulate social unrest by no means should be rated as a curb on freedom of expression.
7.3. Framing and Enforcing LawsAlthough people are very much conscious of laws
and regulations and the law-fearing people always try to abide by all such regulations, which are there to ensure public welfare and betterment. People have got every right to not to be disturbed unnecessarily. Schellekens and Prins (2006) undertook a study on the role of law in regulating the authentic information on the web, given the increasing difficulty in ascertaining the reliability of available information. The authors further argue that social norms towards regulation or self-regulation of content disseminated on the web has yet to come fully into force and wherever these norms exist to some extent, they are not away from their own limitations. The authors are of the view that self-regulation can be easily taken as a stepping stone towards promoting social norms in this regard. As is known, information does not mean only the written content; it can be a voice call, video call, photograph, cryptographic writing, or even any other kind of phys-ical arrangement. To regulate information production and its communication behaviour, there is always need to put in place regulations, which if not adhered to, should be enforced to avoid information pollution or its contamination.
JISTaP Vol.2 No.4, 49-60

57 http://www.jistap.org
Information Pollution, a Mounting Threat
7.4. Information EthicsFloridi (2002) in his article discussed about infor-
mation ethics and how these ethics can actually be brought into practice to bridge the digital divide. The author has emphasized on the formulation of univer-sal common ethical standards to fight information entropy, which can be in the form of destruction, corruption, pollution and depletion of information. The author further pleads that the ethical use of ICT is imperative for the sustainable development of an eq-uitable information society. The author has correlated the need of ethics to be extended from the biosphere to the info-sphere. Information ethics can be applied at any level of information systems, which ranges from its creation, collection, dissemination, exploitation and many more, which allow free and fair use of informa-tion. Information ethics is something which can only be handled by self regulatory mechanism. Information Literacy can play an important part in evolving infor-mation ethics among producers and consumers of in-formation. People can be sensitized about information ethics in the areas of Verbal Communication, Han-dling and use of Information Technology, Avoiding Plagiarism, Copyright Violation, Intellectual Property Rights, Censorship, Information Hacking, to various other information abuses.
7.5. Other Proposed SolutionsJakob Nielsen (2004) in his ten step solution to
cleaning information pollution, both at personal and professional level advocated of having self-restraint in checking emails. The author suggests don’t reply all emails, don’t use Instant Messaging, write very brief and to the point, keep customers informed through web portals, avoid reply to least important quires etc. Orman (1984) finds information pollution in the form of information overload, which is irrelevant, unsolic-ited, redundant and low-value, as such affects human activities in more serious and detrimental way. Orman apart from advocating of having a conscious approach towards writing precisely and clearly is also of the view that at the organizational level, we should pay emphasis on the time and stress management among the personnel of an organization, as all these measures will help in tackling the information pollution to a great deal. Bray (2008) advocates of replacing technol-ogies which frequently trouble, with lesser troubling
technologies as a measure in curbing information pol-lution. The author suggested the need for examining the information science artifacts. The author is of the view that internet empowerment is accompanied with ‘information pollution’ and ‘information overload’ hamper the quality of decision making ability of an in-dividual. The researcher points towards cognitive stud-ies which have shown humans have a limit towards information consumption to which one can show con-scious focus and once reached to its limit the situation is termed as information consumption saturation level and the whole process he termed can lead to decision paralysis.
8. DISCUSSION AND CONCLUSION
Every single activity of each individual is bound to generate one or the other sort of information and the unprecedented creation and dissemination of infor-mation since long back is being rated as information explosion and rightly so, for the fact that people used to find it difficult to consume all the created relevant information of their concerned filed. People mostly faced information explosion out of duplication of information, reproducing the same information in different formats, multiplication of information and other similar activities which have otherwise been undesirable. People are yet to overcome the problems faced by the deluge of information generated through conventional means of publication viz. Print etc., and thereon coming into being of IT and ICT applications laced with the web, added to the woes of the people.
The menace of information pollution is looming larger over society, people day in and day out suffer at the hands of information pollution, but have not grown aware of the prevalence of information pollu-tion and the need & importance of consuming infor-mation, which is free from contamination. The distor-tion of facts in the production of new information is so minute that it hardly makes any profound impact on the daily dwelling methods, but when these minute distortions assume a greater role & significance and then it starts becoming a cause of worry for us.

58
JISTaP Vol.2 No.4, 49-60
SOFT TARGETS OF INFORMATION POLLUTION
Society:Information circulated in the interest of general masses as a group, section, community or so-ciety at large should by no means be polluted, which otherwise is bound to have far reaching consequences. Information disseminated in the areas like, health, education; economics, politics & religion, etc., are of general interest and supplying any contaminated infor-mation in these spheres can prove suicidal.
Business:Business activities are solely dependent on decision making ability of the top management, given this fact, there is always need to supply filtered infor-mation, which otherwise can translate productivity and growth into a loss.
Education:Education is one of the priority sectors of any nation and to supply contaminated information among researchers and students can crush the scientif-ic temper of young minds and this can only be avoid-ed by disseminating information, which is devoid of contamination & pollution and by equally promoting information literacy programmes.
SOFT SOURCES OF INFORMATION POLLUTION
Media:Media in general and electronic in particular has somewhere forgotten its role & responsibility to pass on authentic and credible information to society at large. Sensationalizing news items beyond their being so has become the order of the day. Media is somewhere required to be reminded and called for professional ethics involved, with total impartiality, by paying regard to public sentiments and many more.
Internet:People most of the time complain of in-ternet being one of the time consuming sources of information and to extract the most exact, reliable and authentic information from the web is almost impos-sible due to information cluttering. People do show faith in the authenticity of uploaded information, es-pecially when it comes to retrieving information from the official websites of govt., while as the case is not so with other web sources. The content going uncensored and uncut on social media, without scrutiny is an area of concern. Spreading messages, which are blas-
phemous, derogatory, sacrilegious and communal in nature is a common practice these days. Authenticity of information posted on social media has always been worrisome. People without ascertaining facts about the information start believing in it and upon seeing the derogatory content in actual start reacting to it. In the normal course, one receives far more spam mails than the desired or relevant ones. Modern day lottery frauds and the prize money offered to recipients, is a menace of its own kind, whereby innocent people are being duped of their hard earned money. All these activities either actively or passively are an outcome of information pollution and people apart from violating communication laws, least bother about the inconve-nience caused to others.
Having legal provisions and enforcing laws to em-power people with the Right to Information is a wel-come step, but what is more important is to ensure that people should get the authentic and reliable in-formation. Thereby, the need is to enforce legislations which will ensure Right to Right Information instead of mere Right to Information. Most of the time people are supplied with irrelevant, superfluous and distorted information, which is least of any use, which can also be termed as redundant and unsolicited information.
Information pollution control is more a subject of self-regulation and ethical, where checks and balances are intrinsic and is as much an intentional act as it is unintentional. However, when it comes to willful, in-tentional, and deliberate act of distorting facts by the individuals or the organizations, the issue becomes more serious. Production of reliable, valid and au-thentic information at a faster pace should indeed be our prime consideration, but in no case it should come to us at the cost of information pollution. If technology is proving as a blessing on one hand, on the other hand its mishandling is proving equally a curse and to reap maximum benefits from all quarters of IT need is to take good care of technology and technology will itself take good care of us’.
REFERENCES
Alba, J. W., Hutchinson , J. W., & Lynch, J. G., (1991). Memory and Decision Making. Handbook of Con-sumer Behavior, ed. Thomas S. Robertson and Har-

59 http://www.jistap.org
Information Pollution, a Mounting Threat
old K. Kassarjian, Englewood Cliffs, NJ: Prentice Hall, 1–49
Alexander, J. E., & Tate, M. A. (1999). Web Wisdom: How to Evaluate and Create Information Quality on the Web. Mahwah, New Jersey: Lawrence Erlbaum Associates.
Allen, D. G., Griffeth, R. W. (1997). Vertical and later-al information processing: The effects of gender, employee classification level and media richness on communication and work outcomes. Human Relations. 50, 1239–1260
Baecker, R. M., Grudin, J., Buxton, W. A. S., & Green-berg, S. (1995). Readings in human-computer inter-action: Toward the year 2000. San Francisco, CA: Morgan Kauffman
Barnes, F., & Childers, T. (2002). Stephen Ambrose, Copycat. The Weekly Standard.
Barun, J. (1997). Past, possibilities and potholes on the information super highway. Social Education. 61 (3), 149-153.
Biden, J. R., Biden, J., Wildthyme, I., Lord, T., Leifeld, R., Blair, J., & King, M. L. Plagiarism. In Encyclopedia.
Black, H. C. (1968). Black's Law Dictionary: Definitions of the Terms and Phrases of American and English Jurisprudence, Ancient and Modern, 4th Ed., St. Paul, Minnesota: West Publishing Company, p.168.
Bleakly, A., & Carrigan, J. L. (1994). Resource-Based Learning Activities: Information Literacy For High School Students. American Library Association, Chicago, IL.
Bray, D. A. (2008). Information Pollution, Knowledge Overload, Limited Attention Spans, and Our Responsibilities as IS Professionals. Global In-formation Technology Management Association (GITMA) World Conference. Available at SSRN: <http://ssrn.com/abstract=962732>
Buchanan, J., & Kock, N. (2001). Information overload: A decision making perspective. In Multiple Criteria Decision Making in the New Millennium (pp. 49-58). Springer Berlin Heidelberg.
Cameron, G. T., & Curtin, P. A. (1995). Tracing sources of information pollution: A survey and experimen-tal test of print media's labeling policy for feature advertising. Journalism & Mass Communication Quarterly, 72(1), 178-189
Campbell, S. W. (2006). Perceptions of mobile phones in college classrooms: Ringing, cheating, and class-
room policies. Communication education, 55(3), 280-294.
Clark, D. T., Gottfried B. A. (1957). University Dictio-nary of Business and Finance, New York: Crowell, p168
Crader, Bo. (2002). A historian and her sources. the weekly Standard, Retrieved on September 25, 2013, from http://www.weeklystandard.com/Content/Public/Articles/000/000/000/793ihurw.asp
Deibert, R. J. (2009). The geopolitics of internet control: Censorship, sovereignty, and cyberspace. The Rout-ledge handbook of internet politics, 323-336
Eastin, M. S. (2001). Credibility assessments of online health information: The effects of source expertise and knowledge of content. Journal of Comput-er-Mediated Communication, 6(4), 0-0.
Eschenbrenner, A. J. (1971). Effects of intermittent noise on the performance of a complex psychomo-tor task. Human Factors, 13, 59-63
Eva, K. W., Hatala, R. M., LeBlanc, V. R., & Brooks, L. R. (2007). Teaching from the clinical reasoning lit-erature: combined reasoning strategies help novice diagnosticians overcome misleading information. Medical education, 41(12), 1152-1158
Falkinger, J. (2008). Limited Attention as a Scarce Re-source in Information-Rich Economies. The Eco-nomic Journal, 118(532), 1596-1620.
Fialkoff, F. (1993). There’s no excuse for plagiarism, Li-brary Journal, 118(17), p. 56
Floridi, L. (2002). Information ethics: an environmen-tal approach to the digital divide. Philosophy in the Contemporary World, 9(1), 39-45
Fritch, J. W., & Cromwell, R. L. (2001). Evaluating In-ternet resources: Identity, affiliation, and cognitive authority in a networked world. Journal of the American Society for Information science and Tech-nology, 52(6), 499-507
Haider, A., & Koronios, A. (2003). Authenticity of Infor-mation in Cyberspace: IQ in the Internet, Web, and e-Business (Doctoral dissertation, Massachusetts Institute of Technology).
Hanks, P. (Ed.) (1979). Collins Dictionary of the English Language (Glasgow, William Collins)
Harris, R. (1999). WebQuester: A guidebook to the Web. Boston: McGraw-Hill.
Hasher, L., David, G., & Thomas, T. (1977). Frequency and the Conference of Referential Validity, Journal

60
JISTaP Vol.2 No.4, 49-60
of Verbal Learning and Verbal Behavior, 16(Febru-ary), 107–12.
Information Pollution, Information pollution. Re-trieved on Sept 21, 2013 from http://en.wikipedia.org/wiki/Information_pollution#Related_terms
Lewis, M. (2002). Plagiarism Controversy: Am-brose Problems Date to Ph.D Thesis, Retrieved on October 02, 2013, from http://www.forbes.com/2002/05/10/0510ambrose.html
Ling, R. (2004). The mobile connection: The cell phone’s impact on society. San Francisco: Morgan Kaufman Publishers
Maurice, S., & Corien, P. (2006). Unreliable informa-tion on the internet: a challenging dilemma for the law, Journal of Information, Communication and Ethics in Society, 4(1), pp.49 – 59
McCloskey, M & Zaragoza, M. (1985). Misleading post event information and memory for events: Argu-ments and evidence against memory impairment hypotheses. Journal of Experimental Psychology: General, 114(1), 1-16.
Milford, J. T., & Perry, R. P. (1977). A methodological study of overload. Journal of General Psychology, 97, 131 – 137
Morrison, J. L., & Stein, L. L. (1999). Assuring integrity of information utility in cyber-learning formats. Reference Services Review, 27(4), 317-326.
Netizens. (n.d). Retrieved on September 21, 2013 from http://www.thefreedictionary.com/Netizens
Nielsen, J. (2003). Information Pollution. Retrieved on October 20, 2013, from http://www.nngroup.com/articles/information-pollution/
Nielsen, J. (2004). Ten Steps for Cleaning Information Pollution. Retrived on April 03, 2014 from http://www.nngroup.com/articles/author/jakob-nielsen/
Orman, L. (1984). Fighting Information Pollution with Decision Support System. Journal of Management Information Systems. Edition 2. pp.64-71
Pandita, R. (18 February 2013). Censorship and Social Media. Retrieved on April 01, 2014 from http://www.dailyexcelsior.com/censorship-and-so-cial-media/
Pandita, Ramesh., & Singh, S. (2012). Information Literacy: An Indispensable Tool to Develop Profes-sional Competence in Digital Environment. Pro-ceedings of 13th MALIBNET (Management Libraries Network) conference, held at IIM, Indore, October
2-3, pp. 331-337Panko, R. R. (1992). Managerial communication pat-
terns. Journal of Organizational Computing, 2( l), 95- 122
Postman, N. (1992). Technopoly. New York; Vintage Books
Random House. (1993). The Random House Un-abridged Dictionary, New York: Random House, Inc, p. 197
Reuters. (1997). Gallup-San Jose St. University Survey, June 24
Richmond, B. (1998). CCCCCCC.CCC (Ten Cs) for Evaluating Internet Resources, Emergency Librari-an, 25 (5), 20-23
Simon, H. A. (1979). Information processing models of cognition. Annual Review of Psychology. 30, 363-396
Speier, Cheri., Valacich, Joseph S., & Vessy Iris. (1999). The Influence of Task Interruption on Individual Decision Making: An Information Overload Per-spective. Decision Science. 30(2), 337-360.
Stover, A., & Nielsen, J. E-mail newsletter usabil¬ity: 79 design guidelines for subscription, newsletter content and account maintenance based on usabil-ity studies. Nielsen Norman Group, Fremont, CA. 2002; see http://www.nngroup.com/reports/news-letters/.
Totenberg, N. (1992). Nina Totenberg. US NEWS & WORLD REPORT, 112(7), 21.
Woodhead, M. M. (1965). The effects of bursts of noise on an arithmetic task. American Journal of Psychol-ogy, 77, 627-633.

61 http://www.jistap.org
JISTaPJournal of Information Science Theory and Practice
http://www.jistap.org
Ontology Supported Information Systems: A Review
T. Padmavathi CSIR-Central Food Technological Research InstituteFood Science & Technology Information Services (FOSTIS/Library), IndiaE-mail: [email protected]
M. Krishnamurthy *Documentation Research & Training Centre (DRTC)Indian Statistical Institute, IndiaE-mail: [email protected]
Open Access
Accepted date: October 23, 2014Received date: April 8, 2014
*Corresponding Author: M. Krishnamurthy Associate professorDocumentation Research & Training Centre (DRTC)Indian Statistical Institute, IndiaE-mail: [email protected]
All JISTaP content is Open Access, meaning it is accessible onlineto everyone, without fee and authors’ permission. All JISTaP content is published and distributed under the terms of the Creative Commons Attribution License (http:/ creativecommons.org/licenses/by/3.0/). Under this license, authors reserve the copyright for their content; however, they permit anyone to unrestrictedly use, distribute, and reproduce the content in any medium as far as the original authors and source are cited. For any reuse, redistribution, or reproduction of a work, users must clarify the license terms under which the work was produced.
ⓒ T. Padmavathi, M. Krishnamurthy, 2014
Research PaperJ. of infosci. theory and practice 2(4): 61-76, 2014http://dx.doi.org/10.1633/JISTaP.2014.2.4.5
ABSTRACTThe exponential growth of information on the web far exceeds the capacity of present day information retrieval systems and search engines, making information integration on the web difficult. In order to overcome this, se-mantic web technologies were proposed by the World Wide Web Consortium (W3C) to achieve a higher degree of automation and precision in information retrieval systems. Semantic web, with its promise to deliver machine understanding to the traditional web, has attracted a significant amount of research from academia as well as from industries. Semantic web is an extension of the current web in which data can be shared and reused across the internet. RDF and ontology are two essential components of the semantic web architecture which support a common framework for data storage and representation of data semantics, respectively. Ontologies being the backbone of semantic web applications, it is more relevant to study various approaches in their application, usage, and integration into web services. In this article, an effort has been made to review the research work being under-taken in the area of design and development of ontology supported information systems. This paper also briefly explains the emerging semantic web technologies and standards.
Keywords: Ontologies, Ontology based Information Systems (OBIS), OBIS-Food Science & Technology, Information Systems Storage, Information Systems Retrieval
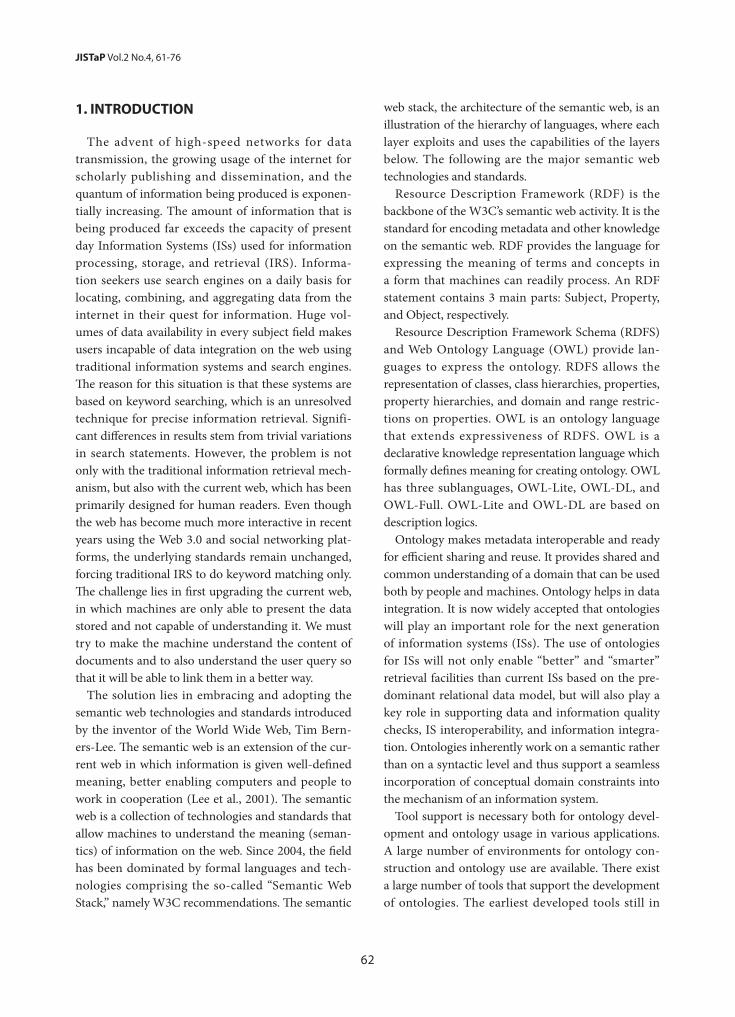
62
1. INTRODUCTION
The advent of high-speed networks for data transmission, the growing usage of the internet for scholarly publishing and dissemination, and the quantum of information being produced is exponen-tially increasing. The amount of information that is being produced far exceeds the capacity of present day Information Systems (ISs) used for information processing, storage, and retrieval (IRS). Informa-tion seekers use search engines on a daily basis for locating, combining, and aggregating data from the internet in their quest for information. Huge vol-umes of data availability in every subject field makes users incapable of data integration on the web using traditional information systems and search engines. The reason for this situation is that these systems are based on keyword searching, which is an unresolved technique for precise information retrieval. Signifi-cant differences in results stem from trivial variations in search statements. However, the problem is not only with the traditional information retrieval mech-anism, but also with the current web, which has been primarily designed for human readers. Even though the web has become much more interactive in recent years using the Web 3.0 and social networking plat-forms, the underlying standards remain unchanged, forcing traditional IRS to do keyword matching only. The challenge lies in first upgrading the current web, in which machines are only able to present the data stored and not capable of understanding it. We must try to make the machine understand the content of documents and to also understand the user query so that it will be able to link them in a better way.
The solution lies in embracing and adopting the semantic web technologies and standards introduced by the inventor of the World Wide Web, Tim Bern-ers-Lee. The semantic web is an extension of the cur-rent web in which information is given well-defined meaning, better enabling computers and people to work in cooperation (Lee et al., 2001). The semantic web is a collection of technologies and standards that allow machines to understand the meaning (seman-tics) of information on the web. Since 2004, the field has been dominated by formal languages and tech-nologies comprising the so-called “Semantic Web Stack,” namely W3C recommendations. The semantic
web stack, the architecture of the semantic web, is an illustration of the hierarchy of languages, where each layer exploits and uses the capabilities of the layers below. The following are the major semantic web technologies and standards.
Resource Description Framework (RDF) is the backbone of the W3C’s semantic web activity. It is the standard for encoding metadata and other knowledge on the semantic web. RDF provides the language for expressing the meaning of terms and concepts in a form that machines can readily process. An RDF statement contains 3 main parts: Subject, Property, and Object, respectively.
Resource Description Framework Schema (RDFS) and Web Ontology Language (OWL) provide lan-guages to express the ontology. RDFS allows the representation of classes, class hierarchies, properties, property hierarchies, and domain and range restric-tions on properties. OWL is an ontology language that extends expressiveness of RDFS. OWL is a declarative knowledge representation language which formally defines meaning for creating ontology. OWL has three sublanguages, OWL-Lite, OWL-DL, and OWL-Full. OWL-Lite and OWL-DL are based on description logics.
Ontology makes metadata interoperable and ready for efficient sharing and reuse. It provides shared and common understanding of a domain that can be used both by people and machines. Ontology helps in data integration. It is now widely accepted that ontologies will play an important role for the next generation of information systems (ISs). The use of ontologies for ISs will not only enable “better” and “smarter” retrieval facilities than current ISs based on the pre-dominant relational data model, but will also play a key role in supporting data and information quality checks, IS interoperability, and information integra-tion. Ontologies inherently work on a semantic rather than on a syntactic level and thus support a seamless incorporation of conceptual domain constraints into the mechanism of an information system.
Tool support is necessary both for ontology devel-opment and ontology usage in various applications. A large number of environments for ontology con-struction and ontology use are available. There exist a large number of tools that support the development of ontologies. The earliest developed tools still in
JISTaP Vol.2 No.4, 61-76

63 http://www.jistap.org
Ontology Supported Information Systems
use were created more than a decade ago. These tools include Ontolingua, Protégé, WebODE, OntoEdit, We-bOnto, OILEd, DUET, KOAN, and OntoSaurus. There are also many other tools that have different purposes.
Inferences on the semantic web are used to derive a new relationship. For the semantic web, an inference is a process to infer a new relationship from existing re-sources and some additional information in the form of a “set of rules.” Inferences are required for process-ing given knowledge available on the semantic web. Inference base techniques are also used to check data inconsistency at the time of data integration. Inference engines include FaCT, FaCT++, Racer, Pellet, Hoolet, JESS, JENA, and F-OWL.
SPARQL query language is used to retrieve informa-tion from the web of data. The web of data, typically represented using RDF as a data format, needs its own RDF-specific query language and facilities. SPARQL, as a declarative query language similar to SQL, allows for specifying queries against data in RDF.
This paper reviews the various approaches used in the design and development of ontology supported information systems in general and food domains in particular, and highlights important related issues. The remaining part of this paper is organised as follows. Section 2 gives a general introduction to context in on-tology-based information systems; Section 3 outlines methodologies to build ontologies for information systems; Section 4 focuses on ontology-based informa-tion systems in food science & technology (FST), and conclusions are presented in section 5.
2. ONTOLOGY BASED INFORMATION SYSTEMS (OBIS)
Wand and Weber (1989) first proposed the represen-tational model of an information system in the mid to late 1980s. They explored theories of ontology in terms of a grammar to describe the real-world for the purpose of IS modeling. Wand and Weber’s (1990) approach was to model information systems within the context of a theory of ontology which is a modification and extension of one developed by Bunge. An interesting approach to understanding how ontology can support modeling was the framework introduced by Wand and Weber in 2002. They used a set of constructs and rules
that they term conceptual-modeling grammar, along with a set of procedures and conceptual-modeling methods that guide the information systems designer in building conceptual schemas, viz conceptual-modeling script. Wand and Weber (2004) hold the view that a good conceptual model is the key to a good information system.
An ontology based on common-sense realism, which has received some attention in information systems, was the work of Chisholm (1996). The ontology is robust, located in the common-sense realism school of thought, and deals with static and dynamic aspects. His view on ontology was that there are only two kinds of entities, attributes and the individual things that have these attri-butes. Everything else, including propositions, states of affairs, possible worlds, and sets, can be understood in terms of these two categories. He stated that attributes are possible objects of thought—more specifically, what we can attribute, either directly (to ourselves) or indi-rectly (both to ourselves and other things). He suggests that his ontology may provide an appropriate frame-work for analysing the reality of information systems research.
The Framework for Information Systems Concepts (FRISCO) ontology produced by the FRISCO task group within Working Group 8.1 of the International Federation of Information Processing (IFIP) is a first step towards a well founded, general theory of Informa-tion Systems (IS) (Falkenberg et al., 1998). Four features make the FRISCO approach unique in this field: i) its close relation to philosophy, ii) its semiotic basis, iii) its “world view” (general ontology), and iv) its layered structure.
Guarino (1998) coined the term Ontology-Driven Information Systems (ODIS) whereby he envisioned the use of ontologies in two distinct stages of Information Systems: 1) at development time, and 2) at run time. At development time, an ontology can be used in the con-ceptual modeling phase of IS, representing the knowl-edge of a given domain and supporting the creation of IS components. At run time, an ontology can be used as another part of the information system driving all of its aspects and components, that is, the system runs in accordance with the content of the ontology (Uschold, 2008).
Milton and Kazmierczak (2004) developed qualita-tive methods, the method of conceptual comparison,

64
JISTaP Vol.2 No.4, 61-76
for conceptually evaluating individual data modelling languages through ontologies. They carry out a com-parison of ontological meta-model for a data modelling language using a philosophical ontology as an external reference. Their theory was based on ontology in order to further understand the fundamental nature of data modelling languages (conceptual modelling grammar). They applied their own methods to analyse grammar and use Chisholm’s ontology as a foundation (Chisholm, 1996). They find a good degree of overlap between all of the data modelling languages analysed and the core con-cepts of Chisholm’s ontology, and conclude that the data modelling languages investigated reflect an ontology of commonsense-realism.
The extension, critique, and discussion of the BWW (Bunge-Wand-Weber) ontology have contributed to ad-vancing the field and to driving the interests of research-ers toward ontology at the conceptual modeling of IS (Lyytinen, 2006). The increasing use of ontologies in in-formation systems (IS) and the proliferation of concep-tual modeling methods lacking theoretical foundations have caught the attention of researchers and guided them to investigate theories of ontology in information systems (Rosemann & Wyssusek, 2005).
Fonseca (2007) offers a slightly different but comple-mentary viewpoint of the use of ontologies in Infor-mation Systems. The author discusses the distinction between the creation and the use of ontologies in IS in terms of the purpose of the ontologies. In the context of ODIS, ontologies of information systems represent the underpinning theories and structures used to describe the IS domain. These ontologies provide support to the creation of better modeling tools as they become refer-ences of how the IS domain is organized.
The literature reviewed below deals with OBIS that describe a given domain covering agriculture, agricul-ture-pests, materials science, and general frameworks. This kind of ontology on domain specific information system helps to build and support better conceptual schemas and other IS components as suggested by Gua-rino (1998) in his concept of ontology driven informa-tion systems.
The objective of the AGROVOC Concept Server (CS) was to provide a framework for sharing common ter-minology, concept definitions, and relations within the agricultural community (Sini et al., 2008). The CS offers a centralised facility where the agricultural information
management community can build and share agricul-tural knowledge within a collaborative environment by exploiting new semantic technologies, i.e. OWL mod-elling language. The CS serves as a starting point for the development of specific domain ontologies which are capable of arranging complex multilingualism and ter-minology information.
Ontology-based information retrieval systems de-signed to capture semantic relations in Indian Agricul-tural Research domain ontology for providing value added information services were developed by Angrosh and Urs (2007). They considered the case of Agricultur-al Electronic Theses and Dissertations (ETDs) present in Vidyanidhi Digital Library. Their aim was to facili-tate the derivation of semantic metadata by capturing contextual information pertinent to the domain. The authors also examined the use of description logics and facet relations for developing ontology-based knowl-edge management systems for digital libraries. The knowledge representation languages identified were web ontology language (OWL) and Karlsruhe Ontology (KAON) language. Their results showed that the use of description logics and facet relations was very promis-ing. Ontologies, specifically when based on knowledge representation formalisms, added value and enhanced the search experience.
Yuanyuan (2010) presented a knowledge represen-tation method for agricultural intelligent information systems by taking an example of the Cotton Planting and Management Expert System. Based on knowledge characteristics of agricultural intelligent information systems, a knowledge representation method was ex-plored by two levels: knowledge organization structure and knowledge describing language. The knowledge organization structure was based on a frame knowl-edge unit and solving knowledge unit. The knowledge representation approach adopted OWL as knowledge describing language. The knowledge organization was implemented by mapping knowledge with ontology lev-el. He found that this approach provides a great degree of knowledge interoperability and knowledge sharing.
Angrosh and Urs (2006) have worked on creating semantic metadata based information systems for devel-oping an agri-pest domain specific model. The agricul-ture-pest-disease-pesticide domain specific knowledge was utilized for mapping content related data with domain knowledge. The semantic metadata derived

65 http://www.jistap.org
Ontology Supported Information Systems
through domain specific ontology would be tapped by information retrieval mechanisms in order to provide search strategies to yield higher precision rates. The metadata facilitates an end-user in finding the required information. Their knowledge base was used to retrieve information through contextually relevant entry points.
The challenge associated with integrating heteroge-neous databases in the material’s science domain was highlighted by Cheung et al. (2009). They found that materials scientists and nanotechnologists were strug-gling with the challenge of managing the large volumes of multivariate, multidimensional, and mixed media data sets being generated from the experimental, charac-terization, testing, and post-processing steps associated with their search for new materials. Materials scientists demand data management and integration tools that en-able them to search across these disparate databases and correlate their experimental data with external, publicly available data, in order to identify new fertile areas for searching. MatOnto, a machine-processable ontology, was used to integrate data across disparate databases. MatOnto was based on OWL, which provides a single web-based search interface. The authors also developed MatSeek to provide a federated search interface over the critical materials science databases.
To overcome the problems of poor retrieval perfor-mance and low retrieval quality in traditional retrieval methods, a non-metallic pipe retrieval system based on ontology technology was designed by Rong and Jun (2012). The ontology files in html format were de-scribed in OWL language. After that, they were saved in a MySQL database based on Jena. They introduced the retrieval algorithm and retrieval process of the system, and realized the semantic analysis of query condition with two functions, keywords query and query expan-sion. They found that the ontology technology promot-ed recall and precision compared to traditional retrieval systems.
Wessel and Moller (2009) present a formal and imple-mented generic framework for building ontology-based information systems (OBISs). Their framework offers a means for (i) the extensional layer, (ii) the intensional layer, and (iii) the query component. Being ontolo-gy-based, they have developed a framework-based ap-proach strongly influenced by description logics (DLs) but also support the integration of reasoning facilities for other formalisms. They claim this by using case
studies—that their framework can cover regions in the system design space instead of just isolated points. The main insights gained with this framework were present-ed in the context of ontology-based query answering as part of a geographical information system (GIS). The focus of the case study was the DLMAPS system, which implements ontology-based spatio-thematic query an-swering in the domain of digital city maps.
3. METHODOLOGIES TO BUILD ONTOLOGIES FOR INFORMATION SYSTEMS
In order to understand the research on ontologies in information systems, the major literature on the topic has been reviewed. A frequently used ontology that has been adapted and used in information systems is a sci-entific ontology by Mario Bunge (Bunge, 1977, 1979). It is characterised by an approach that considers the real world as known to science and proceeds in a clear and systematic way. His ontology introduced the concept of hierarchy of systems. Bunge’s ontology differenti-ates explicitly a hierarchy of distinct ontological levels: physical, chemical, biological, psychological, and social/technical.
Two pioneering papers have described the devel-opment of building ontologies. One was by Noy and McGuinness (2001) and another by Guarino (1997). A comparative review of the state-of-the-art in ontology design was described by Noy and Hafner (1997). Lopez and Gomez-Perez (1999) have laid down guidelines for developing a chemical ontology using two ontology building tools: MethOntology and Ontology Design (ODE). MethOntology provides guidelines for specify-ing ontologies at the knowledge level, as a specification of a conceptualization. ODE enables ontology construc-tion, covering the entire life cycle and automatically implementing ontologies.
According to Nicola et al. (2009) ontology building exhibits a structural and logical complexity that is com-parable to the production of software artefacts. Ontol-ogy and software development share some common qualities. Considering this feature, they proposed an ontology development methodology called UPON, i.e., Unified Process for Ontology. This system was based on a unified software development process or unified pro-

66
JISTaP Vol.2 No.4, 61-76
cess (UP), which is a widely used standard in software engineering. The strength of the proposed approach lies in the UP being a highly scalable and customiz-able methodology. It can be tailored to fit a number of variables: the ontology size, the domain of interest, the complexity of the ontology to be built, the experience and skill of the project experts, and their organization. UPON, when compared with the main ontology build-ing methodologies, showed that within its scope the features are aligned and sometimes outperform the best solutions.
Clustering-based methods are another strategy useful in ontology construction. A clustering-based method for creating cultural ontologies for community oriented information systems has been described by Srinivasan et al. (2009). This semi-automated method merges distrib-uted annotation techniques, or subjective assessments of similarities between cultural categories, with established clustering methods to produce “cognate” ontologies. They concluded that a semi-automated method was useful in resolving the twin problems of scalability and interoperability of developing ontology.
Another approach to semi-automatically constructing domain ontology was proposed by Lin and Hanqing (2009). They adopted an approach of Non-dictionary Chinese word Segmentation techniques based on N-Gram to acquire domain candidate concepts. The method was based on natural language processing (NLP) in the recognition of domain concept property relation, extracted subject, predicate, and object values of sen-tences. This triangle data was treated as the triplet of data, object type, and property.
Another semi-automated system based on Chinese word partition and data mining was proposed by Dan et al. (2010). The semi-automatic domain ontology system designed consisted mainly of three parts: the extraction module of domain concepts, taxonomy, and non-taxon-omy relations. A statistical analysis method, generalized suffix tree and clustering method, and association rule mining method are respectively adopted in the above three parts. By using ontologies, they could define a description base for scholarly events to enable software agents to crawl and extract scholarly event data, and to facilitate unified access to this data. The collected data was mined for non-obvious knowledge.
Conversion, traditional knowledge organisation techniques (e.g., facet analysis) and or use of existing
vocabulary tools is one of the sub-systems adopted in ontology construction. The same is demonstrated by the literature reviewed below. An experiment to convert a controlled vocabulary into ontology using a traditional knowledge organization tool was reported by Qin and Poling (2001). They used the controlled vocabulary of ERIC descriptors to develop the ontology on educa-tion and educational materials using Ontolingua. The method discussed the preliminary planning and steps involved in converting the existing GEM vocabulary to an ontology. The conversion reduced the duplication of effort involved in building an ontology from scratch by using the existing vocabulary. A mechanism was also established for allowing differing vocabularies to be mapped onto the ontology. According to them, the major difference between a thesaurus and an ontology, lies in the values added through deeper semantics in describing digital objects, both conceptually and rela-tionally.
Park (2008) demonstrated how knowledge organi-zation approaches in library and information science would improve ontology design and present faceted classification as an appropriate method for structuring ontology. Jun and Yuhua (2009) introduced an auto-matic approach for ontology building by integrating traditional knowledge organization resources viz., a classification scheme, thesauri. The method first builds a primary ontology describing the classes and relation-ships involved in bibliographic data with OWL. Then the primary ontology is filled with instances of classes and their relations extracted from catalogue datasets and the thesauri and classification schemes used in cata-loguing. Based on this ontology, they have implemented an online system to demonstrate the proposed methods and functions with thousands of bibliographic data and a subdivision of the Chinese Classified Thesaurus.
A prototype ontology using traditional knowledge organisation techniques such as content analysis, facet analysis, and clustering for the Accelerator Driven Sys-tems (ADSs) domain was developed by Deokattey et al. (2010). Descriptors from the INIS thesaurus were used to organize the information on ADSs, and a suitable knowledge organization tool was developed. A map-ping/merging system was used for knowledge organiza-tion.
Another application of ontology in the library field is presented by Liao et al. (2010). They developed a novel

67 http://www.jistap.org
Ontology Supported Information Systems
library recommender system, i.e. a personal ontology recommender (PORE) for English collections. In the PORE system, the traditional cataloging scheme, clas-sification for Chinese libraries, is used as the reference ontology. The system offers a friendly user interface and provides several personalised services. This system was implemented and tested in the Library of National Chung Hsing University in Taiwan.
Jiang and Tan (2010) objected that traditional on-tology construction systems employ shallow natural language processing techniques and focus only on con-cept and taxonomic relation extraction. To overcome this drawback, the authors proposed a system, known as Concept-Relation-Concept Tuple-based Ontology Learning (CRCTOL), for mining ontologies automat-ically from domain specific documents. The system i) adopts a full text parsing technique to obtain a more detailed syntactic level of information, ii) employs a combination of statistical and lexicosyntactic methods, including a statistical algorithm that extracts key con-cepts from a document collection, iii) uses a word sense disambiguation algorithm that disambiguates words in the key concepts, iv) uses a rule-based algorithm that extracts relations between the key concepts, and v) has a modified generalized association rule mining algorithm that prunes unimportant relations for ontology learning. They found that compared to traditional methods, their system produced ontologies that are more concise and accurate, and contained richer semantics.
The domain ontology evolution approach is yet another approach useful in constructing ontology. A study by Poli (2002) highlights ontological sub-theories and uses of domain analysis for developing an ontology. This methodology in the field of Artificial Intelligence utilises domain analysis, an integral part of Library & Information Science. Prieto-Diaz (2003) has also used a similar domain analysis with a faceted approach to build ontologies with a software tool called ‘DARE.’
4. OBIS IN THE DOMAIN OF FOOD SCIENCE & TECHNOLOGY (FST) & ALLIED SUBJECTS
In this section relevant literature on the FST domain was reviewed. The ontology related to cooking and pro-cessed foods, beverages, seafood, and health, nutrition, and diet and food safety are discussed below.
The taxonomy of food can be defined by classifying on the basis of origin, i.e. plants or animals. In addi-tion, the cooking ontology presented by Batista et al. (2006) and by Ribeiro et al. (2006) and fishery ontology (Gangemi, 2002, 2004) can be useful for the definition of a taxonomy for processed food, since recipe concepts introduced in the ontology interconnect food concepts with each other.
For the definition of the beverage taxonomy, the beer ontology by Heflin (2000) and the wine ontology by Graça et al. (2005); and Noy and McGuinness (2001) can be reused.
For a detailed definition of particular ontologies devoted to the modeling of specific food domains, im-portant consideration are provided by works of Chifi et al. (2007); Drummond et al. (2007); Graça et al. (2005); Heflin (2000); Noy and McGuinness (2001); Wang et al. (2012); and Yue et al. (2005). While the aforementioned ontologies deal with some smaller areas of the food sec-tor, these ontologies could be integrated and combined with each other with the main aim of defining a new complete food taxonomy, which includes food and bev-erages under the same main class.
The food ontologies proposed by Snae and Bruckner (2008), FOODS and the PIPS project (Cantais et al., 2005), diabetes control (Hong & Kim, 2005; Li & Ko, 2007), and a personalized food recommender system for athletes (Suksom, 2010; Tumnark, 2013) may be considered as a guide for the development of ontologies for specific health problems/nutrition.
4.1. Cooking and Processed FoodAn ontology for the cooking domain, integrated
within a dialog system, was developed by Ribeiro et al. (2006). Ontology building activities like brain-storm sessions, knowledge validation and disambigu-ation, conceptualization and formalization, or evalu-ation were done through coordination of experts. The ontology comprehends four main modules covering the key concepts of the cooking domain (actions, food, recipes, and utensils) and three auxiliary mod-ules (units and measures, equivalencies, and plate types). The ontology building process was influenced by METHONTOLOGY, which followed the phases of specification, knowledge acquisition, conceptualiza-tion, implementation, and evaluation.
Another ontology for a cooking domain was devel-

68
JISTaP Vol.2 No.4, 61-76
oped by Batista et al. (2006). The ontology building process was influenced by the methodology proposed by Lopez et al. (1999) which mainly consisted of specification, knowledge acquisition, conceptualiza-tion, implementation, and evaluation. The knowledge model was formalized using Protégé, which was also used to generate the ontology code automatically. The ontology comprehends four main modules covering key concepts of cooking domain (actions, food, rec-ipes, and utensils) and two auxiliary modules (units, measures, and equivalencies).
Drummond et al. (2007) have focused their atten-tion on the definitions of taxonomy and ontology related to the knowledge of pizza. They divided the domain into pizza topping and pizza bases. Differ-ent types of toppings were proposed with the main element of the topping (cheese, meat, seafood, vege-table, pepper). This ontology contains all constructs required for the various forms of pizza made around the globe.
4.2. BeveragesA beer ontology was developed by Heflin (2000).
His ontology models brewers and types of beer based on a SHOE (Simple HTML Ontology Extension) framework. In this ontology, relationships are de-clared between one or more arguments. Relationship arguments are either type or categories.
Graca et al. (2005) proposed a wine ontology. They found that many times, winemakers use their meth-ods to produce their product. The experts composed a vocabulary for wine characteristics which was supported by their senses and descriptive capability, which is ambiguous and not measurable. Their wine ontology covered maceration, fermentation process-es, grape maturity state, wine characteristics, and classification according to country and region where the wine was produced. They stated that the develop-ment process followed four phases: i) knowledge ac-quisition, ii) conceptualization, iii) formalization, and iv) evaluation. Their inference was based on queries defined using F-logic, taking advantage of OntoEdit’s built-in-inference engine. They concluded that the outcome was a useful and comprehensive ontology in the enology field, which they plan to use in a system that allows searching for wines using any combina-tion of features.
4.3. SeafoodIn the fisheries domain, an ontology supporting
semantic interoperability among existing fishery in-formation systems was presented by Gangemi et. al. (2002). As different fishery information systems pro-vide different views of the domain, they consider the paradigm of ontology integration, namely the inte-gration of schemas that are arbitrary logical theories and hence can have multiple models. A thesaurus, topic trees, and reference tables used in the systems to be integrated were considered as informal schemas conceived to query semi-formal or informal data-bases such as texts and tagged documents. In order to benefit from the ontology integration framework, they transformed informal schemas into formal ones by applying the techniques of three methodologies: OntoClean, ONIONS, and OnTopic. They found that integration and merging are shown to benefit from the methods and tools of formal ontology.
Gangemi (2004) focused on the Core Ontology of Fishery (COF) and its use for the reengineer-ing, alignment, refinement, and merging of fishery Knowledge Organization Systems (KOSes). They have reengineered and aligned legacy thesauri by using formal ontological methods, and are deploying the resulting ontology library for services dedicated to fish management document repositories and da-tabases. A UML activity diagram was defined that summarized the main steps of the methods that were followed to create the Fishery Ontology Library. The global lifecycle was referred to as ONIONS@FOS, since it is an adaptation of the ONIONS methodolo-gy. COF has been designed by using the DOLCE-Li-te-Plus ontology, developed within the WonderWeb European project. Preliminary exploitation showed that formal ontologies give smoothness and increase control to some functionalities, such as integrated information retrieval from distributed document systems over the web, and integrated querying of dis-tributed dynamic databases.
4.4. Health Care, Nutrition, and DietSnae and Bruckner (2008) proposed a food on-
tology related to nutritional concepts, which is de-scribed as Food-Oriented Ontology-Driven Systems (FOODS). FOODS was mainly devoted to assisting customers through an appropriate suggestion of

69 http://www.jistap.org
Ontology Supported Information Systems
dishes and meals with the help of individual nutri-tional profiles. The ontology contains specifications of ingredients, substances, nutrition facts, recom-mended daily intakes for different regions, dishes, and menus. FOODS comprises a) a food ontology, b) an expert system using the ontology, and some knowledge about cooking methods and prices, and c) a user interface suitable for novices in computers and diets as well as for experts. The food ontology was categorized by nine main concepts: regional cuisine, dishes, ingredients, availability, nutrients, nutrition based diseases, preparation methods, utensils, and price. The combination of bottom-up and top-down approaches was chosen to develop the ontology by using Protégé as the tool of choice for setting up the ontology in OWL-DL.
Another food ontology oriented to the nutritional and health care domain was developed by Cantais et al. (2005) for assisting in sharing knowledge between the different stakeholders involved in the Person-alised Information Platform for Health and Life Ser-vices (PIPS). It is mainly addressed to the provision of nutritional advice to diabetic patients. They also provide a brief description of the food ontology de-velopment process and its main features. Their ontol-ogy was developed through a collaborative process that includes domain experts, database experts, and ontology engineers. They used the Eurocode2 coding system which provided the backbone of the class hi-erarchy.
Li and Ko (2007) proposed an automated mecha-nism that constructs a well-rounded food ontology structure that can be utilized by diabetes educators or patients themselves for various value added ap-plications or services. Their study was based on the dataset provided from the food nutrition composi-tion database of the Department of Health, Taiwan. The dataset was grouped into 18 major categories. They proposed methods for generating more intu-itive ontology concepts, relations, and restrictions. The methods include generating an ontology skeleton with hierarchical clustering algorithms (HCA), class naming by intersection naming, and instance ranking by granular ranking and positioning.
Hong and Kim (2005) implemented a web-based expert system for nutrition counseling and manage-ment based on ontologies for diabetes control. Their
system uses food, dish, and menu databases which are fundamental data in order to assess the nutri-ent analysis. Clients can search food composition and conditional food based on nutrient name and amount. Their system organizes food according to Korean menus and can read the nutrient composition of each food, dish, and menu.
The research work of Fudholi et al. (2009) was de-signed and developed for daily menu assistance in the context of a health control system for the popula-tion. Their project uses ontology to model a nutrition needs domain, implementing a rule-based inference engine. The system was implemented as a semantic web application, where users enter abstinence foods and personal information so the system can calculate several parameters and provide an appropriate menu from the database.
Suksom et al. (2010) implemented a rule-based personalized food recommender system aimed to assist users in daily diet selections based on some nu-trition guidelines and ontology. Their work focused on personalization of recommendation results by adding the user’s health status information that may affect his/her nutrition need. The design of the sys-tem uses a knowledge-based framework consisting of two main components: a knowledge base and rec-ommender engine. The knowledge engineering ap-proach was used in modeling the relevant user profile as well as food and nutrition knowledge in an ontolo-gy form. The construction of the knowledge base was developed through collaboration of domain experts, nutrition guides, and clinical practice guidelines. It consisted of two forms of knowledge: ontology and rules. The ontology-based knowledge represented the knowledge structure of food and their relations. The rule-based knowledge represented the decision mod-el used in generating recommendation results.
Tumnark et al. (2013) proposed ontology-based personalized dietary recommendations for weightlift-ing to assist athletes in meeting their requirements. They extended the personalized food ontology de-fined in Suksom by adding information related to athletes’ training programs that may affect their nu-trition needs and unify the food and sports ontolo-gies. The development of the ontology involved spec-ification and definition of the four main elements of the ontology such as classes or concepts, the individ-

70
JISTaP Vol.2 No.4, 61-76
uals, the properties, and all the relationships. The on-tology was modelled following a top-down approach around four main concepts: athlete, food, nutrition, and sports. Their recommendations were based on sport nutrition guidelines, which were transformed into rule-based knowledge.
4.5. Food TraceabilitySalampasis et al. (2008) tried to solve the problem
of developing traceability systems from a semantic web (SW) perspective. They present a traceability solution that considers food traceability as a complex integrated business process problem which demands information sharing. They propose a generic frame-work for traceability applications consisting of three basic components: i) an ontology management com-ponent based on OWL, ii) an annotation component for “connecting” a traceable unit with traceability information using RDF, and iii) traceability core ser-vices and applications.
TraceALL, a food traceability system based com-pletely on solid existing standards of the semantic web initiative, was described for the first time by Salampasis et al. (2012). TraceALL is a semantic web, ontology-based, service-oriented framework that aims to provide the necessary infrastructure enabling food industries (particularly SMEs) to implement traceability applications using an innovative generic framework. It provides a formal, ontology-based, general-purpose methodology to support knowl-edge representation and information modelling in traceability systems. Their system provides a set of core services for storing, processing, and retrieving traceability information in a scalable way. In addi-tion, they uniquely identify a Traceability Resource Unit (TRU) using a Uniform Resource Locator (URL) code. TraceALL facilitates the development of next generation traceability applications from a food safe-ty perspective.
The Food Track & Trace Ontology (FTTO) devot-ed to managing food traceability was developed by Pizzuti et al. (2014) to connect with a Global Track & Trace Information System (GTTIS). A traceability system prototype was proposed as part of the general framework to assist the process of information ex-traction and unification in compliance with legal and quality requirements. The FTTO ontology supports
the management of a unique body of knowledge based on natural language and its corresponding syn-onyms, through the integration of different concepts and terms coming from heterogeneous sources of information. It includes the most representative food concepts involved in the supply chain held together in a single ordered hierarchy, able to integrate and connect the main features of the food traceability do-main. The sources of information used in the knowl-edge acquisition phase consist mainly of thesaurus and food databases, books, and the internet. The Co-dex Alimentarius Classification of Food and Animal Feeds were referred to in order to build the food clas-sification tree. The knowledge model was formalized using Protégé, which was also used to generate the ontology code automatically. The resulting ontology comprehends four main modules covering the key concepts of the tracking domain: Actor, Food Prod-uct, Process, and Service Product. Their proposed structure solved a few existing problems related to food traceability.
Vegetable supply chain technology has shown its influence in the development of vegetable industries. The development of information technology has changed the traditional mode of vegetable supply chains profoundly. Yue et al. (2005) presented an ontology-based metadata organization for vegetable supply chain knowledge searching systems. The au-thors build three ontologies which are user ontology, content knowledge ontology, and vegetable supply chain domain ontology. They formalized the metada-ta using RDF (Resource Description Framework) and implemented the searching system on the knowledge database of the vegetable supply chains. Through the semantic searching, the users can get more suitable knowledge of vegetable supply chains.
Chifu et al. (2007) proposed an ontological model approach which allows semantic annotation of web services aiming at automatic web services composi-tion for food chain traceability. The model was imple-mented in the framework of the Food-Trace project (Food Trace) for traceability in the domain of a meat industry. The model consists of a core ontology and two categories of taxonomic trees: business service description and business product description trees. The domain-specific concept of this ontology was organized into a taxonomy that is automatically built

71 http://www.jistap.org
Ontology Supported Information Systems
out of textual descriptions from web sites of Roma-nian meat industry companies. Their ontology was used for adding semantics to web service description language (WSDL) and descriptions, as the vocabulary in the automated planning of the service composition and as vocabulary for an ontological driven user in-terface.
Wang et al. (2012) proposed a quality and safety traceability system of fruit and vegetable products based on ontology. Their work analyses the process of fruit and vegetable products from farm to sale terminal. In their work, authors first introduce the working principles of a traceability system and the collection of traceability information. Then, the the-ory of ontology is introduced to build a quality and safety traceability information ontology of fruit and vegetable products. Finally, a semantic model for the traceability of fruit and vegetable products is defined, dividing this domain into a set of sub-systems.
An integrated information system to integrate data from heterogeneous resources in order to strengthen food-borne pathogen risk management, surveillance, and prevention systems was developed by Yan et al. (2011). Their system laid the groundwork for a standard interoperable protocol which serves as a nation-wide food-borne pathogen-related warning system. The technical aspects in the establishment of a comprehensive food safety information system consists of the following steps: a) computational collection and compiling publicly available informa-tion, b) development of ontology libraries on food-borne pathogens and design of automatic algorithms with formal inference and fuzzy and probabilistic reasoning to address the consistency and accuracy of distributed information, c) integration of collect-ed pathogen profiling data, and d) development of a computational model in semantic web for greater adaptability and robustness.
5. CONCLUSIONS
An attempt was made to review the representation of information and semantic retrieval in the context of ontology-based information systems. We identified the trends used in the design and development of ontology supported information systems in general and food do-
mains in particular.The research on OBIS has been accomplished with the
creation of ontologies that study the information sys-tem as an object by itself, with the objective of creating better modeling tools. We have identified that in most of our review a distinction was made between research on ontologies for IS and ontologies of IS. The field of ontologies for IS was well-represented by the work of Guarino on ontology-driven information systems. The work of the FRISCO, Wand and Weber, Milton and Ka-zmierczak, which are exemplars in their work represent models of an information system. In their ontology, they have used methods, tools, and theories developed within the philosophical discipline of ontology to find the basic constructs of information systems. The work of Agrovac, Matseek, and others show that the ontolo-gies can be reused for terminology standardisation and interoperability.
From the literature reviewed, it was evident that a number of ontology development methodologies have evolved and been tested successfully. Some of them describe how to build an ontology from scratch or re-use other ontologies. It was observed in the literature reviewed that most of the work proposed uses i) auto-matic or semiautomatic methods, clustering, faceted classification, extraction, and domain analysis for on-tology construction, ii) ontologies can be represented as graphs, description logic, web standards, or a simple hierarchy, iii) many ontology creation tools viz., Protégé and OilEd have been created to facilitate ontology gen-eration in a semi-automatic or manual way.
The research in the field of FST reviews various approaches used in the design and development of ontology-based information systems in the food do-main, as their primary users are food technologists. The reviewed works reveal that either a small section of the food domain was targeted or the ontology is built for a specific application. From our study, it can be con-cluded that food taxonomies interconnect with each other and hence the food concepts can be shared and reused across various food related application-specific scenarios. Ontologies can be integrated and combined with each other with the main aim of defining a new complete food taxonomy. We have found how a sub-on-tology can be identified from an application ontology, which can act as a core ontology for the food domain, as it proved to be self-sufficient.

72
JISTaP Vol.2 No.4, 61-76
There are still some research challenges. Ontology tools have to support more expressive power and scal-ability with a large knowledge base and reasoning in querying and matching. Also, they need to support the use of high level language, modularity, and visualization.
ACKNOWLEDGEMENTS
The authors express their thanks to the Director, CFTRI, Mysore for his encouragement and Mr. Sanjai Lal, K.P., Department of Central Instrumentation & Facilities Services, CFTRI, Mysore for his valuable sug-gestions.
REFERENCES
Angrosh, M. L., & Urs, S. R. (2006). Ontology-driven knowledge management systems for digital librar-ies: Towards creating semantic metadata-based information services. Information Studies, 12(3), 151-168.
Angrosh, M. A., & Urs, S. R. (2007). Development of Indian agricultural research ontology: Semantic rich relations based information retrieval system for Vidyanidhi Digital Library. Asian Digital Li-braries. Looking Back 10 Years and Forging New Frontiers. Lecture Notes in Computer Science, 4822, 400-409.
Asuncion, G. P., & Oscar, C. (2002). Ontology languag-es for the semantic web. IEEE Intelligent Systems, 17(1), 54-60.
Batista, F., Paulo, J., Mamede, N., Vaz, H., & Ribeiro, R. (2006). Ontology construction: Cooking domain. Artificial Intelligence Methodology Systems and Ap-plications, 4183, 213-221.
Brickley, D., & Guha, R. V. (2003). RDF vocabulary description language 1.0: RDF schema. Retrieved July 10, 2014, from http://www.w3.org/TR/rdf-schema/
Bunge, M. (1977). Treatise on basic philosophy: Vol. 3. Ontology I: The Furniture of the World. Boston, MA: Reidel.
Bunge, M. (1979). Treatise on basic philosophy: Vol. 4. Ontology II: A World of Systems. Boston, MA: Reidel.
Cantais, J. et al. (2005). An example of food ontology for diabetes control. In Proceedings of the Inter-national Semantic Web Conference workshop on Ontology Patterns for the Semantic Web. Retrieved July 10, 2014, from http://www.inf.ufsc.br/~g-authier/EGC6006/material/Aula%205/An%20example%20of%20food%20ontology%20for%20diabetes%20control.pdf
Changrui, Y., & Yan, L. (2012). Comparative research on methodologies for domain ontology develop-ment advanced intelligent computing theories and applications with aspects of artificial intelligence. Lecture Notes in Computer Science, 6839, 349-356.
Chang-Shing, L., Mei-Hui, W., Huan-Chung, L., & Wen-Hui, C. (2008). Intelligent ontological agent for diabetic food recommendation. In IEEE World Congress on Computational Intelligence (pp. 803-810).
Cheung, K., Jane, H., & John, D. (2009). MatSeek: An Ontology-based federated search interface for materials scientists. IEEE Intelligent Systems, 24(1), 47-56.
Chifu, V. R., Salomie, I., & Chifu, E. S., (2007). Ontol-ogy-enhanced description of traceability services. Presented at the IEEE International Conference on Intelligent Computer Communication and Process-ing (pp. 1-8).
Chisholm, R. M. (1996). A Realistic theory of categories: An essay on ontology. London: Cambridge Univ. Press.
Dan, Z., Li, Z., & Hao, J. (2010). Research on semi-au-tomatic domain ontology construction. 7th Web Information Systems and Applications Conference (WISA) (pp. 115-118).
Deokattey, S., Neelameghan, A., & Kumar, V. (2010). A method for developing a domain ontology: A case study for a multidisciplinary subject. Knowledge Organization, 37(3), 173-184.
De Nicola, A., Missikoff, M., & Navigli, R. (2009). A software engineering approach to ontology build-ing. Information Systems, 34(2), 258-275.
Falkenberg, E. D., et al. (1998). A framework of infor-mation system concepts: The FRISCO report. Re-trieved August 10, 2014, from http://www.idem-ployee.id.tue.nl/g.w.m.rauterberg/lecturenotes/FRISCO-report-1998.pdf.
Fonseca, F., & Martin, J. (2007). Learning the differ-

73 http://www.jistap.org
Ontology Supported Information Systems
ences between ontologies and conceptual schemas through ontology-driven information systems. Journal of the Association for Information Systems, 8(2), 129-142.
Fallside, D., & Walmsley, P. (2004). XML schema part 0: Primer (2nd ed.). Retrieved July 10, 2014, from http://www.w3.org/TR/xmlschema-0/
Fudholi, D. H., Maneerat, N., & Varakulsiripunth, R. (2009). Ontology based daily menu assistance system. ECTI-CON, 6th International Conference on Electrical Engineering/Electronics, Computer, Telecommunications and Information Technology (pp. 694-697).
Gangemi, A., et al. (2002). A formal ontological frame-work for semantic interoperability in the fishery domain. Retrieved June 5, 2014, from citeseerx.ist.psu.edu/viewdoc/download?doi=10.1.1.6.2343
Gangemi, A., et al. (2004). A core ontology of fishery and its use in the fishery ontology service. Re-trieved June 5, 2014, from ceur-ws.org/Vol-118/slides4.pdf
Gangemi, A., Steve, G., & Giacomelli, F. (1996). ON-IONS: An ontological methodology for taxonomic knowledge integration. Retrieved June 5, 2014, from search path: http://citeseerx.ist.psu.edu/viewdoc/summary?doi=10.1.1.22.3972
Graca, J., et al. (2005). Ontology building process: the wine domain. In Proceedings of the 5th Confer-ence of the European Federation for Information Technology in Agriculture, Food and Environment. Retrieved June 5, 2014, from www.inesc-id.pt/pt/indicadores/Ficheiros/3615.pdf
Gomez-Perez, A., Fernandez-Lopez, M., & de Vicente, A. (1996). Towards a method to conceptualize domain ontologies. In ECAI96 Workshop on Onto-logical Engineering (pp. 41-51). Budapest.
Guarino, N. (1997). Understanding, building, and using ontologies. International Journal of Human Computer Studies, 46, 293-310.
Guarino, N. (1998). Formal ontology in information systems. Amended version of a paper appearing in Guarino, N. (Ed.), Proceedings of FOIS ’98 (pp. 3-15). Amsterdam: IOS Press.
Grimm, S., Hitzler, P., & Abecker, A. (2007). Knowl-edge representation and ontologies logic, ontolo-gies and semantic web languages. Retrieved from knoesis.wright.edu/pascal/resources/publications/
kr-onto-07.pdfGruber, T. R. (1993). A translation approach to porta-
ble ontology specifications. Knowledge Acquisition, 5(2), 199-220.
Gruber, T. R. (1993). Toward principles for the design of ontologies used for knowledge sharing in for-mal ontology in conceptual analysis and knowl-edge representation. In Guarino, N., & Poli, R. (Eds). International workshop on formal ontology. Kluwer Academic Publishers. Retrieved June 5, 2014, from http://www-ksl.stanford.edu/KSL_Ab-stracts/KSL-93-04.html
Heflin, J. (2000). Beer ontology 1.0 (Draft) [Online]. Retrieved June 5, 2014, from http://www.cs.umd.edu/projects/plus/SHOE/onts/beer1.0.html
Hong, S. M., & Kim, G. (2005). Web expert system for nutrition counseling and menu management. Journal of Community Nutrition, 7(2), 107-113.
Horrocks, I., Patel-Schneider, P., & van Harmelen, F. (2003). From SHIQ and RDF to OWL: The mak-ing of a web ontology language. Journal of Web Semantics, 1, 7-26.
Horridge, D. N., & Stevens, M. (2007). Pizza On-tology 1.5. Retrieved August 5, 2014, from http://130.88.198.11/tutorials/protegeowltutorial/resources/ProtegeOWLTutorialP4_v1_3.pdf
Jiang, X., & Tan, A. H. (2010). CRCTOL: A seman-tic-based domain ontology learning system. Jour-nal of the American Society for Information Science and Technology, 61(1), 150-168.
Jun, W., & Yuhua, C. (2009). An automatic approach to ontology building by integrating traditional knowledge organisation resources. Journal of the China Society for Scientific and Technical Informa-tion, 28(5), 651-657.
Kishore, R., & Sharman, R. (2004). Computational on-tologies and information systems I: Foundations. Communications of the Association for Information Systems, 14(8). Retrieved June 5, 2014, from http://aisel.aisnet.org/cais/vol14/iss1/8
Kogut, P., Cranefield, S., & Hart, L. (2002). UML for ontology development. The Knowledge Engineer-ing Review, 17(1), 61-64.
Kremen, P., & Kouba, Z. (2012). Ontology-driven in-formation system design. IEEE Transactions on Systems, Man, and Cybernetics—Part C: Applica-tions and Reviews, 42(3), 334-344.

74
JISTaP Vol.2 No.4, 61-76
Lee, T. B., Lassila, H., & Hendler, J. (2001). The seman-tic web. Scientific American, 284(5), 34-43.
Liao, I. En., Hsu, W. C., Cheng, M. S., & Chen, L. P. (2010). A library recommender system based on a personal ontology model and collaborative fil-tering technique for English collections. The Elec-tronic Library, 28(3), 386-400.
Li, H. C., & Ko, W. M. (2007). Automated food ontolo-gy construction mechanism for diabetes diet care. Proceedings of the Sixth International Conference on Machine Learning and Cybernetics (pp. 2953-2958). Hong Kong.
Lin, He., & Hanqing, H. (2009). Research on semi-au-tomatic construction of domain ontology based on statistical NLP technique. Journal of the China Society for Scientific and Technical Information, 28(2), 201-207.
Lopez, M. F., Gomez-Perez, A., & Sierra, P. J. (1999). Building a chemical ontology using Methontology and the ontology design environment. IEEE Intel-ligent Systems, 4(1), 37-46.
Lopez, M. F., Gomez-Perez, A., & Juristo, N. (1997). METHONTOLOGY: From ontological art to-wards ontological engineering. In AAAI Sympo-sium on Ontological Engineering (pp. 33-40). Stan-ford.
Lopez, M. F., Gómez-Pérez, A., & Suárez-Figuero, M. C. (2013). Methodological guidelines for reusing general ontologies. Data & Knowledge Engineer-ing, 86, 242-275.
Lyytinen, K. (2006). Ontological foundations of con-ceptual modeling - A critical response. Scandina-vian Journal of Information Systems, 18(1), 81-84.
McGuinness, D., & van Harmelen, F. (2004). OWL web ontology language: Overview. Retrieved June 5, 2014, from http://www.w3.org/TR/owl-features/
Milton, S. K., & Kazmierczak, E. (2004). An ontology of data modeling languages: A study using a com-mon-sense realistic ontology. Journal of Database Management, 15(2), 19-38.
Noy, N. F. & McGuinness, D. L. (2001). Ontology de-velopment 101: A guide to creating your first on-tology. Retrieved June 5, 2014, from http://www.ksl.stanford.edu/people/dlm/papers/ontology-tu-torial-noy-mcguinness.pdf
Noy, N. F. & Hafner, C. D. (2011). The state-of-the-art in ontology design: A survey and comparative
review. AI Magazine, 18(3), 53-74.Nguyen, V. (2011). Ontologies and information
systems: A literature survey report number: DSTO-TN-1002. Retrieved July 10, 2014, from http://dspace.dsto.defence.gov.au/dspace/han-dle/1947/10144
Papadakis, I. (2009). Subject-based information re-trieval within digital libraries employing LCSHs. D-Lib Magazine, 15, 9-10.
Park, O. N. (2008). Opening ontology design: A study of the implications of knowledge organization for ontology design. Knowledge Organization, 35(4), 209-221.
Ping-Ping, Li., & Shu-bin, Li. (2009). Semantic web-based knowledge organization methods and their application. Zhonghua Yixue Tushu Qingbao Zazhi/Chinese Journal of Medical Library and In-formation Science, 18(4), 8-11.
Pinto, H. S., & Martins, J. P. (2004). Ontologies: How can they be built? Knowledge and Information Sys-tems, 6, 441-464.
Pizzuti, T. et al. (2014). Food track & trace ontology for helping the food traceability control. Journal of Food Engineering, 120, 17-30.
Poli, R. (2002). Ontological methodology. Internation-al Journal of Human Computer Studies, 56, 639-664.
Prieto-Diaz, R. (2003). A faceted approach to building Ontologies. (Personal communication).
Qin, J. & Paling, S. (2001). Converting a controlled vocabulary into an ontology: The case of GEM. In-formation Research, 6(2). Retrieved July 20, 2014, from http://InformationR.net/ir/6-2/paper94.html
Ribeiro, R. et al. (2006). Cooking an ontology. Lecture Notes in Computer Science, 4183, 213-221.
Rong, G., & Jun, W. (2012). Design and implementa-tion of domain ontology-based oilfield non-metal-lic pipe information retrieval system. International Conference on Computer Science and Information Processing (CSIP) (pp.813-816).
Rosemann, M., & Wyssusek, B. (2005). Enhancing the Expressiveness of the BWW Ontology. In Pro-ceedings of the Eleventh Americas Conference on Information Systems (pp. 2803-2810). Omaha, NE, USA.
Salampasis, M. (2012). TraceALL: A semantic web framework for food traceability systems. Journal

75 http://www.jistap.org
Ontology Supported Information Systems
of Systems and Information Technology, 14(4), 302-317.
Saravanan, M., Ravindran, B., & Raman, S. (2009). Improving legal information retrieval using an ontological framework. Artificial Intelligence and Law, 17(2), 101-124.
Sini, M., Salokhe, G., & Pardy, C. (2007). Ontolo-gy-based navigation of bibliographic metadata: Example from the Food, Nutrition and Agricul-ture Journal. In International Conference on Solid Dielectrics (pp. 64-76). Winchester, Hampshire, UK.
Sini, M., Lauser, B., Salokhe, G., Keizer, J., & Katz, S. (2008). The AGROVOC concept server: Rationale, goals and usage. Library Review, 57(3), 200-212.
Snae, C., & Brückner, M. (2008). FOODS: A food-ori-ented ontology-driven system. Second IEEE In-ternational Conference on Digital Ecosystems and Technologies (pp. 168-176).
Srinivasan, R., Pepe, A., & Rodriguez, M. (2009). A clustering-based semi-automated technique to build cultural ontologies. Journal of American So-ciety for Information Science & Technology, 60(3), 608-620.
Suksom, N., Buranarach, M., Thein, Y.M., Supnithi, T., & Netisopakul, P. (2010). A knowledge-based framework for development of personalized food recommender system. In 5th International Con-ference on Knowledge, Information and Creativity Support Systems (pp. 274-277).
Tumnark, P., Oliveira, L., & Santibutr, N. (2013). On-tology-based personalized dietary recommenda-tion for weightlifting. In International Workshop on Computer Science in Sports (IWCSS) (pp. 44-49).
Uschold, M., & Gruninger, M. (1996). Ontologies: Principles methods and applications. The Knowl-edge Engineering Review, 11(2), 93-155.
Uschold, M., & King, M. (1995). Towards a methodol-ogy for building ontologies. In IJCAI95 Workshop on Basic Ontological Issues in Knowledge Sharing. Montreal. Retrieved July 20, 2014, from www1.cs.unicam.it/insegnamenti/reti_2008/Readings/Uschold95.pdf
Uschold, M. (2008). Ontology-Driven information systems: Past, present and future. In Proceedings of the Fifth International Conference: Formal Ontolo-
gy in Information Systems (pp. 3-18). Netherlands: IOS Press.
Wand, Y., & Weber, R. (1989) “An ontological evalua-tion of systems analysis and design methods,” in E. D. Falkenberg and P. Lindgreen (Eds.) Information System Concepts: An In-depth Analysis (pp. 79-107). Amsterdam: North-Holland.
Wand, Y., & Weber, R. (1990). An ontological model of an information system. IEEE Transactions on Software Engineering, 16, 1282-1292.
Wand, Y., & Weber, R. (2002). Research commentary: information systems and conceptual modeling - a research agenda. Information Systems Research, 13(4), 363-376.
Wand, Y., & Weber, R. (2004). Reflection: Ontology in information systems. Journal of Database Manage-ment, 15(2), iii-vi.
Weber, R. (1997). Ontological Foundations of Informa-tion Systems. Coopers and Lybrand: London.
Wang, Y., Yang, Y., & Gu, Y. (2012). Research on quality and safety traceability system of fruit and vegetable products based on ontology. Journal of Convergence Information Technology, 7, 86-93.
Wessel, M., & Moller, R. (2009). Flexible software architectures for ontology-based information sys-tems. Journal of Applied Logic, 7(1), 75-99.
World Wide Web Consortium (W3C) Standards & Drafts. Retrieved May 7, 2014, from http://www.w3.org/TR/
Wyssusek, B. (2004). Ontology and ontologies in in-formation systems analysis and design: A critique. Paper presented at the Tenth Americas Conference on Information Systems. New York. Retrieved July 20, 2014, from http://citeseerx.ist.psu.edu/view-doc/summary?doi=10.1.1.60.7091
Yan, X. (2011). From ontology selection and semantic web to an integrated information system for food-borne diseases and food safety. Advances in Exper-imental Medicine and Biology, 696, 741-750.
Yuanyuan, W., Rujing, W., Xue, W., & Yimin, H. (2010). Ontology-based knowledge representation for agricultural intelligent information systems. Inter-national Conference on Management and Service Science (MASS) (pp. 1-4).
Yue, J., Wen, H., Zhang, X., & Fu, Z. (2005). Ontology based vegetable supply chain knowledge express-ing, In SKG ‘05. Presented at the First Internation-

76
JISTaP Vol.2 No.4, 61-76
al Conference on Semantics, Knowledge and Grid (pp. 130-130).
Zhang, D., Zhang, Li., & Jiang, H. (2010). Research on semi-automatic domain ontology construction. In WISA ‘10 Proceedings of the 2010 Seventh Web Information Systems and Applications Conference (pp. 115-118).

77
Mobile User Behavior Pattern Analysis
http://www.jistap.org
We would like to invite you to submit or recommend papers to Journal of Information Science Theory and
Practice (JISTaP, eISSN: 2287-4577, pISSN: 2287-9099), a fast track peer-reviewed and no-fee open access
academic journal published by Korea Institute of Science and Technology Information (KISTI), which is
a government-funded research institute providing STI services to support high-tech R&D for researchers in
Korea. JISTaP marks a transition from Journal of Information Management to an English-language international
journal in the area of library and information science.
JISTaP aims at publishing original studies, review papers and brief communications on information science
theory and practice. The journal provides an international forum for practical as well as theoretical research
in the interdisciplinary areas of information science, such as information processing and management,
knowledge organization, scholarly communication and bibliometrics.
We welcome materials that reflect a wide range of perspectives and approaches on diverse areas of
information science theory, application and practice. Topics covered by the journal include: information
processing and management; information policy; library management; knowledge organization; metadata
and classification; information seeking; information retrieval; information systems; scientific and technical
information service; human-computer interaction; social media design; analytics; scholarly communication
and bibliometrics. Above all, we encourage submissions of catalytic nature that explore the question of how
theory can be applied to solve real world problems in the broad discipline of information science.
Co-Editors in Chief : Gary Marchionini & Dong-Geun Oh
Please click the “e-Submission” link in the JISTaP website (http://www.jistap.org), which will take you to a login/
account creation page. Please consult the “Author’s Guide” page to prepare your manuscript according to the
JISTaPmanuscript guidelines.
Any question? Hea Lim Rhee (managing editor): [email protected]
Call for PaperJournal of Information Science Theory and practice (JISTaP)
77

JISTaP Vol.2 No.1, 06-21
7878

79
Mobile User Behavior Pattern Analysis
http://www.jistap.org79

JISTaP Vol.2 No.1, 06-21
8080

81
Mobile User Behavior Pattern Analysis
http://www.jistap.org81

2014 Copyright © Korea Institute of Science and Technology Information
Editorial Board
Co-Editors-in-ChiefGary Marchionini
University of North Carolina, USADong-Geun Oh
Keimyung University, Korea
Associate EditorsHeeyoon Choi
Korea Institute of Science and Technology Information, KoreaHonam Choi
Korea Institute of Science and Technology Information, KoreaKiduk Yang
Kyungpook National University, Korea
Managing EditorsHea Lim Rhee
Korea Institute of Science and Technology Information, KoreaYonggu Lee
Keimyung University, Korea
Beeraka Ramesh BabuUniversity of Madras, India
Pia BorlundUniversity of Copenhagen, Denmark
France BouthillierMcGill University, Canada
Kathleen BurnettFlorida State University, USA
Boryung JuLouisiana State University, USA
Noriko KandoNational Institute of Informatics, Japan
Shailendra KumarUniversity of Delhi, India
Mallinath KumbarUniversity of Mysore, India
Fenglin LiWuhan University, China
Thomas MandlUniversiät Hildesheim, Germany
Lokman I. MehoAmerican University of Beirut, Lebanon
Jin Cheon NaNanyang Technological University, Singapore
Dan O’ConnorRutgers University, USA
Alice R. RobbinIndiana University, USA
Christian SchloeglUniversity of Graz, Austria
Ou ShiyanNanjing University, China
Paul SolomonUniversity of South Carolina, USA
Sujin ButdisuwanMahasarakham University, Thailand
Folker CaroliUniversität Hildesheim, Germany
Seon Heui ChoiKorea Institute of Science and Technology Information, Korea
Eungi KimKeimyung University, Korea
Joy KimUniversity of Southern California, USA
Kenneth KleinUniversity of Southern California, USA
M. KrishnamurthyDRTC, Indian Statistical Institute, India
S.K. Asok KumarThe Tamil Nadu Dr Ambedkar Law University, India
Hur-Li LeeUniversity of Wisconsin-Milwaukee, USA
P. RajendranSRM University, India
B. RameshaBangalore University, India
Soo Young RiehUniversity of Michigan, USA
Taesul SeoKorea Institute of Science and Technology Information, Korea
Tsutomu ShihotaSt. Andrews University, Japan
Ning YuUniversity of Kentucky, USA
Editorial Board Consulting Editors

General Information
2014 Copyright © Korea Institute of Science and Technology Information
LI S A DOAJDIRECTORY OFOPEN ACCESSJOURNALS