Vitamin D Deficiency in HIV Infection: Not Only a Bone Disorder
Upload
independentCategory
view
4download
0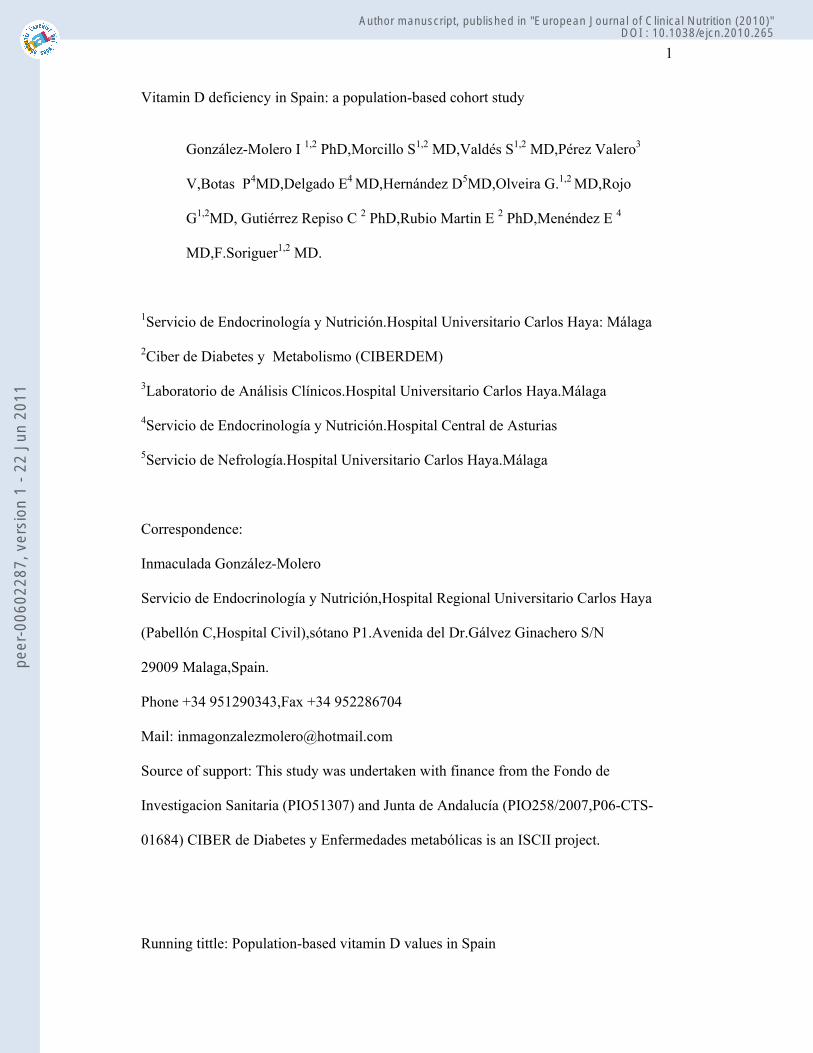
1
Vitamin D deficiency in Spain: a population-based cohort study
González-Molero I 1,2 PhD,Morcillo S1,2 MD,Valdés S1,2 MD,Pérez Valero3
V,Botas P4MD,Delgado E4 MD,Hernández D5MD,Olveira G.1,2 MD,Rojo
G1,2MD, Gutiérrez Repiso C 2 PhD,Rubio Martin E 2 PhD,Menéndez E 4
MD,F.Soriguer1,2 MD.
1Servicio de Endocrinología y Nutrición.Hospital Universitario Carlos Haya: Málaga
2Ciber de Diabetes y Metabolismo (CIBERDEM)
3Laboratorio de Análisis Clínicos.Hospital Universitario Carlos Haya.Málaga
4Servicio de Endocrinología y Nutrición.Hospital Central de Asturias
5Servicio de Nefrología.Hospital Universitario Carlos Haya.Málaga
Correspondence:
Inmaculada González-Molero
Servicio de Endocrinología y Nutrición,Hospital Regional Universitario Carlos Haya
(Pabellón C,Hospital Civil),sótano P1.Avenida del Dr.Gálvez Ginachero S/N
29009 Malaga,Spain.
Phone +34 951290343,Fax +34 952286704
Mail: [email protected]
Source of support: This study was undertaken with finance from the Fondo de
Investigacion Sanitaria (PIO51307) and Junta de Andalucía (PIO258/2007,P06-CTS-
01684) CIBER de Diabetes y Enfermedades metabólicas is an ISCII project.
Running tittle: Population-based vitamin D values in Spain
peer
-006
0228
7, v
ersi
on 1
- 22
Jun
201
1Author manuscript, published in "European Journal of Clinical Nutrition (2010)"
DOI : 10.1038/ejcn.2010.265
2
ABSTRACT
Background: Vitamin D deficiency is common worldwide.No homogenous reference
values have yet been established and no studies of values have been done in Spain
involving a large number of participants.
Objective: To study the population concentrations of vitamin D in a representative
sample of the Spanish population.
Subjects/Methods: The study involved two cohorts from Spain,the Asturias Study and
the Pizarra Study,which are two prospective,population-based studies involving 2260
participants.In 1262 subjects (age: 20-83 years) we studied 25-hydroxyvitamin D,intact
parathyroid hormone (iPTH),calcium,phosphorus and creatinine.
Results: The median population values of 25-hydroxyvitamin D and iPTH were 22.46
ng/mL and 42.29 pg/mL,respectively.The values of 25-hydroxyvitamin D were
significantly higher in summer and correlated with age (beta=-
0.05±0.01,p<0.0001),creatinine (beta=6.42±1.17,p<0.0001),and iPTH (-
0.07±0.01,p<0.0001),but not with calcium,phosphorus or sex.The increase in iPTH with
age was seen whatever the values of 25-hydroxyvitamin D,and was greater in the older
persons.The concentration of iPTH rose continuously with effect from 25-
hydroxyvitamin D values below ≈30 ng/mL.Values above ≈35 ng/mL were associated
with a significantly lower concentration of iPTH.
Conclusions: One third (33.9%) of the Spanish population may be at risk for Vitamin D
deficiency.25-hydroxyvitamin D values above 30 ng/mL can safely discard “hyper
PTH”.The increase in iPTH concentration is greater in older persons for similar values
of 25-hydroxyvitamin D.
Keywords: Vitamin D deficiency.
peer
-006
0228
7, v
ersi
on 1
- 22
Jun
201
1
3
INTRODUCTION
Previtamin D is synthesized in the skin after sun exposure and can also be
ingested with foods having high concentrations of vitamin D.Previtamin D is
metabolized in the liver to 25-hydroxyvitamin D and converted in the kidney to the
active form 1,25-dihydroxyvitamin D (Dusso et al.,2005;Holick,2007).
Vitamin D deficiency can cause a decrease in bone mineral density,secondary
hyperparathyroidism and osteomalacia,and it has also recently been associated with
numerous other disorders,such as cancer,cancer,diabetes,hypertension,and autoimmune
diseases (Holick,2010).
Vitamin D deficiency is common,though its prevalence varies depending on the
characteristics of the study population (Adami et al,2009;Annweiler et al.,2009;
Bouuaert et al.,2008;Carnevalle et al.,2001;Hintzpeter et al.,2008;Hintzpeter et al.,2008;
Hypponen et al.,2007;Isaia et al.,2003; Lips,2010;Zittermann et al.,2009)
Despite numerous studies,the reference values of 25-hydroxyvitamin D have
not yet been definitively established,and various different cut-off levels have been
proposed for the criterion for vitamin D deficiency.A recent consensus document
(Henry et al 2010) concluded that the minimum desirable concentration of 25-
hydroxyvitamin D should be 20-25 ng/mL.
The nutritional deficiency of vitamin D is generally studied by measuring the
reserves of vitamin D according to the concentration of 25-hydroxyvitamin D
(Holick,2010),either alone or else combined with the measurement of parathyroid
hormone (iPTH).
Even though Spain is a country with many hours of sunshine,most studies in
Spain show a high prevalence of vitamin D deficiency.However,many of these studies
have included persons aged 65 years or over,frequently institutionalized persons
peer
-006
0228
7, v
ersi
on 1
- 22
Jun
201
1

4
(thus,not representative of the general population and with different rates of sun
exposure,activity and diet),or else involved only a few persons,with the largest study in
the last ten years in the general population (Mata–Granados et al.,2008) including just
215 persons.Thus,no representative studies involving a large sample of healthy persons
have been carried out in Spain.The mean levels of 25-hydroxyvitamin D in middle aged
people range from 14-25.9 ng/mL,with 26% to 85.1% of persons having values below
20 ng/ml (Calatayud et al.,2009;González Solanellas et al.,2008;Mata-Granados et
al.,2008).In persons aged 60 years or more,the mean 25-hydroxyvitamin D
concentration is even lower: 6.95-17 ng/ml,with 46.4% to 85% having values below 20
ng/ml (Gomez-Alonso et al.,2003;Niño Martín et al.,2008 ; Pérez-Llamas et
al.,2008;Rodríguez Sangrador et al.,2008;Vaquero et al.,2004).
There is a well defined negative correlation between iPTH and 25-
hydroxyvitamin D (Chapuy et al.,1997;Cristensen et al.2010;Ho-Pham et al.,2010;
Khosla et al.,1997;Leboff et al.,1999; Malaban et al.,1998;Thomas et al.,1998;Vieth et
al,2003;von Muhlen.,2005),but the features of this relation and the influence of age
have not been fully defined.iPTH seems to be higher in older people than in young
people (Arabi et al.,2010;Christensen et al.,2010),but it has been suggested that the
relationship between Vitamin D and iPTH is different in older persons compared to
young persons,such that for the same levels of 25-hydroxyvitamin D older persons
could have higher iPTH (Arabi et al.,2010;Vieth et al.,2003)
The aims of this study were,firstly,to examine the values of 25-hydroxyvitamin
D in a representative sample of the Spanish population and,secondly,to examine the
influence of age in the relation between 25-hydroxyvitamin D and iPTH.
peer
-006
0228
7, v
ersi
on 1
- 22
Jun
201
1

5
SUBJECTS AND METHODS
Study sample
The study was carried out in two population-based cohorts,one in the north and the
other in the south of Spain,both studied at the same time and using similar methods.The
study populations and the design of these two surveys have been described previously
(Soriguer et al.,2002;Soriguer et al.,2008;Valdes et al.,2007).The Asturias Study is a
prospective,population-based survey of diabetes and cardiovascular risk factors.The
baseline examination was carried out during 1998-1999,when 1034 individuals were
randomly selected to determine the prevalence of diabetes and prediabetes in the region
of Asturias (northern Spain).In 2004-2005,these same subjects were invited for a
follow-up examination,700 of whom accepted (Valdes et al.,2007).The Pizarra study is
a population-based prospective study undertaken in a population from
Andalusia,southern Spain.The first phase of the study (1996-1998) included 1226
individuals,selected randomly from the municipal register of Pizarra,Malaga,Spain.Of
the original cohort,784 persons were reassessed in 2002-2004 (Soriguer et
al.,2002;Soriguer et al.,2008).The final sample size was 1484 persons:700 from
Asturias,784 from Pizarra).
Persons were excluded from the study if they were institutionalized,had chronic
disorders that could affect phosphocalcium metabolism,or if their creatinine was greater
than 1.9 mg/dL,calcium >10.9 mg/dL or phosphorus <2.5 mg/dL.Thus,the total number
of persons finally studied was 1262.
All the participants completed a clinical survey and underwent an
anthropometric study,as well as providing a venous blood sample that was centrifuged
at the time of study and the plasma separated and frozen at –80ºC until later analysis.In
peer
-006
0228
7, v
ersi
on 1
- 22
Jun
201
1

6
both cohorts measurements were made simultaneously of 25-hydroxyvitamin
D,iPTH,calcium,phosphorous and creatinine in the same laboratory.
The 25-hydroxyvitamin D was measured by electrochemoluminiscence(ECLIA
immunoassay,Modular Analytics E170®,Roche).The value is given in ng/mL.The
analytical sensitivity was 4-100 ng/mL.Analytical coefficient of variation (CV):7.3%
iPTH was measured by electrochemoluminescence(ECLIA
immunoassay,Modular Analytics E170®,Roche).The value is given in pg/mL.The assay
sensitivity was 1.20-5000 pg/mL.Analytical CV:7.02%.Normal values in our laboratory
are:15-60 pg/mL.
The creatinine was measured by spectrophotometry (Dimension
Vista®,Siemens).The value is given in mg/dL.Sensitivity was 0.1-20 mg/dL.Analytical
CV:2.7%.
The calcium was measured by spectrophotometry (Dimension
Vista®,Siemens).The value is given in mg/dL.The sensitivity was 5-15
mg/dL.Analytical CV:3.7%.
The phosphorus was measured by spectrophotometry(Dimension Vista®
System,Siemens).The value is given in mg/dL (conversion factor: mg/dL x 0.323 =
mmol/L).The sensitivity was 0.1-9 mg/dL and the analytical CV was 4.8%.
The solar radiation was measured in watts per square meter(W/m2).The data
were obtained from the official information provided by the national meteorological
stations.To transform the units into Joules per square meter(Joules/m2),the power in
W/m2 should be multiplied by 86,400(seconds in a day).
The project was approved by the ethics committees of Carlos Haya Hospital in
Malaga and the Hospital Central in Asturias.
peer
-006
0228
7, v
ersi
on 1
- 22
Jun
201
1

7
Statistical analysis
The continuous variables are presented as the mean and standard deviation or
percentiles and the classification variables as proportions.Adjustment of the variables to
normality was done with the Shapiro test.The statistical difference between the means
of the continuous variables was calculated with the ANOVA test for one or more
ways,and for the qualitative variables with the Chi2test.
The correlation between variables was measured by calculating the linear
coefficient of correlation (Pearson’s r) and the regression by designing multiple linear
regression models.
The most suitable cut-off point to identify the population reference value of
25-hydroxyvitamin D was calculated by designing ROC curves and calculating the
positive and negative predictive value(PPV and NPV).
The strength of association between two variables,adjusted for third
variables,was measured using the Odds Ratio (OR),calculated from the coefficient of a
logistic regression model.In all cases the level of rejection of a null hypothesis was set
at α=0.05 for two tails.(In all models sex was coded as male=0 and female=1)
RESULTS
The mean age of the study participants was 50.3±14.4 years(range:20-83
years),with 57% women and 43% men.The median 25-hydroxyvitamin D and iPTH
concentrations were 22.46 ng/mL and 42.29 pg/mL,respectively.Table 1 summarizes the
population distribution by percentiles of 25-hydroxyvitamin D,creatinine, iPTH,calcium
and phosphorus.
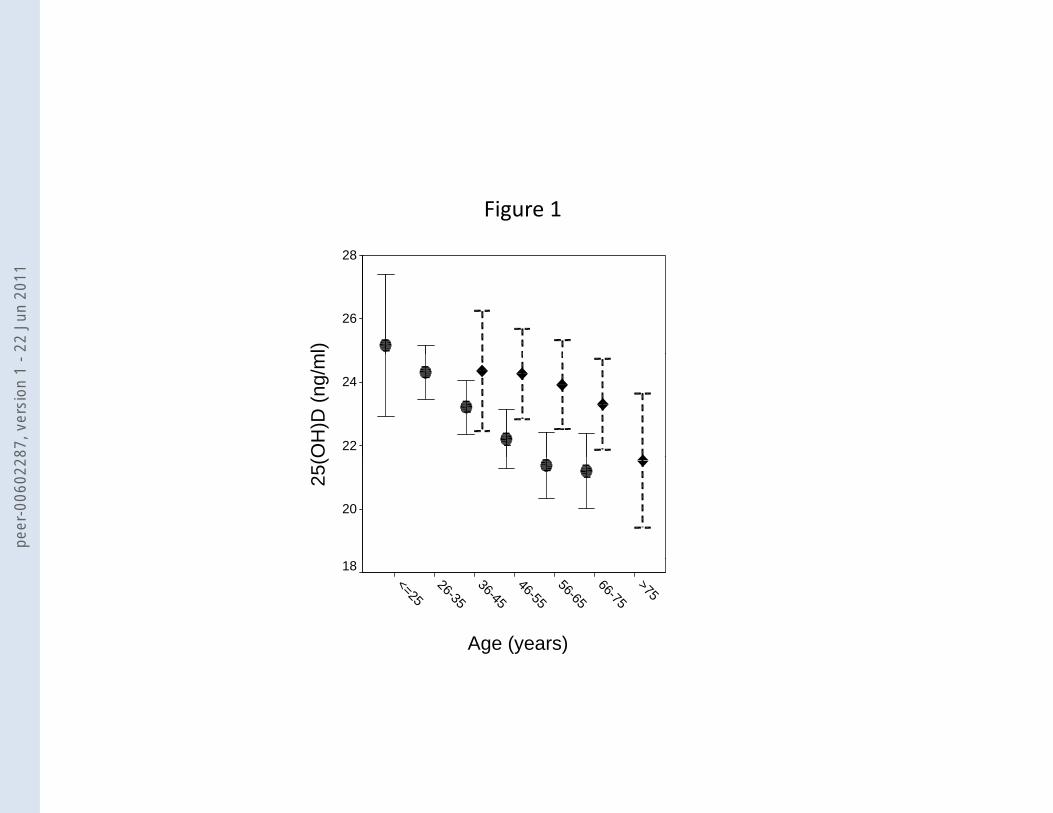
As the age increased,the concentration of 25-hydroxyvitamin D fell (p<0.0001)
and that of iPTH rose (p<0.0001),after adjusting for sex,plasma creatinine,individual
peer
-006
0228
7, v
ersi
on 1
- 22
Jun
201
1
8
study (Asturias or Pizarra) and the month of blood extraction (Figure 1).In both men
and women the plasma creatinine concentration rose significantly with age,after
adjusting for the particular study and the study month (p<0.0001)
(R2=0.43,p<0.001).The concentration of plasma calcium did not change significantly
with age(Data not shown).
The values of 25-hydroxyvitamin D were significantly higher in the summer
months in both cohorts (P<0.0001,adjusted for age,sex and creatinine),months that
coincide with greater sunlight (Figure 2).In summer,the proportion of persons with
25-hydroxyvitamin D levels >30 ng/mL was greater than in spring or winter:
23.3%,12.8% and 9.3%,respectively (p<0.001 after adjusting the logistic model for
age,creatinine,sex and the individual study).The proportion of persons with
25-hydroxyvitamin D values <20 ng/mL was higher in winter than in spring or summer:
37.2%,34.4% and 26.5%,respectively (p<0.001 after adjusting the logistic model for
age,creatinine,sex and the individual study).
The values of 25-hydroxyvitamin D rose as the plasma creatinine levels
increased,after adjusting for age (p<0.001) and iPTH (p<0.0001).
The values of 25-hydroxyvitamin D were significantly lower in the Pizarra
Study than in the Asturias Study (22.75±6.23 ng/mL vs.23.75±7.17 ng/L,p=0.01).In
parallel,the values of iPTH were significantly higher in Pizarra than in Asturias
(47.00±19.22 pg/mL vs.44.67±16.69 pg/mL; p=0.02).
The concentration of 25-hydroxyvitamin D,iPTH and calcium did not differ
significantly depending on sex after adjusting the contrast hypothesis for age and the
individual study(data not shown).
A multiple linear regression model showed that the concentration of
25-hydroxyvitamin D correlated significantly with age (beta=-
peer
-006
0228
7, v
ersi
on 1
- 22
Jun
201
1

9
0.03±0.01,p<0.0001),plasma creatinine(beta=6.66±1.17,p<0.0001) iPTH(-
0.07±0.01,p<0.0001),and body mass index (BMI) (-0.14±0.03,p<0.000) but not with
calcium,phosphorus or sex.The full model explained 8.3% of the variance in the values
of 25-hydroxyvitamin D (p<0.0001).
In a multiple linear regression model the iPTH correlated significantly with age
(beta=0.27±1.15; p<0.0001),sex(beta=4.07±1.15; p<0.0001),25-hydroxyvitamin D
(beta=-0.45±0.07,p<0.0001),plasma creatinine(beta=6.08±3.01,p=0.02),phosphorus(-
4.90±1.00,p<0.0001),and BMI(0.32±0.09, p<0.001) but not with calcium.The full
model explained 14% of the variance in iPTH(p<0.0001).
In a multiple linear regression model the levels of phosphorus correlated
significantly with age (beta=-0.002±0.001,p=0.05),sex
(beta=0.22±0.03,p<0.0001),calcium
(beta=0.18±0.03,p<0.0001),creatinine(beta=0.17±0.08,p=0.06),and iPTH (beta=-
0.004±0.001,p<0.0001) but not with 25-hydroxyvitamin D or BMI.
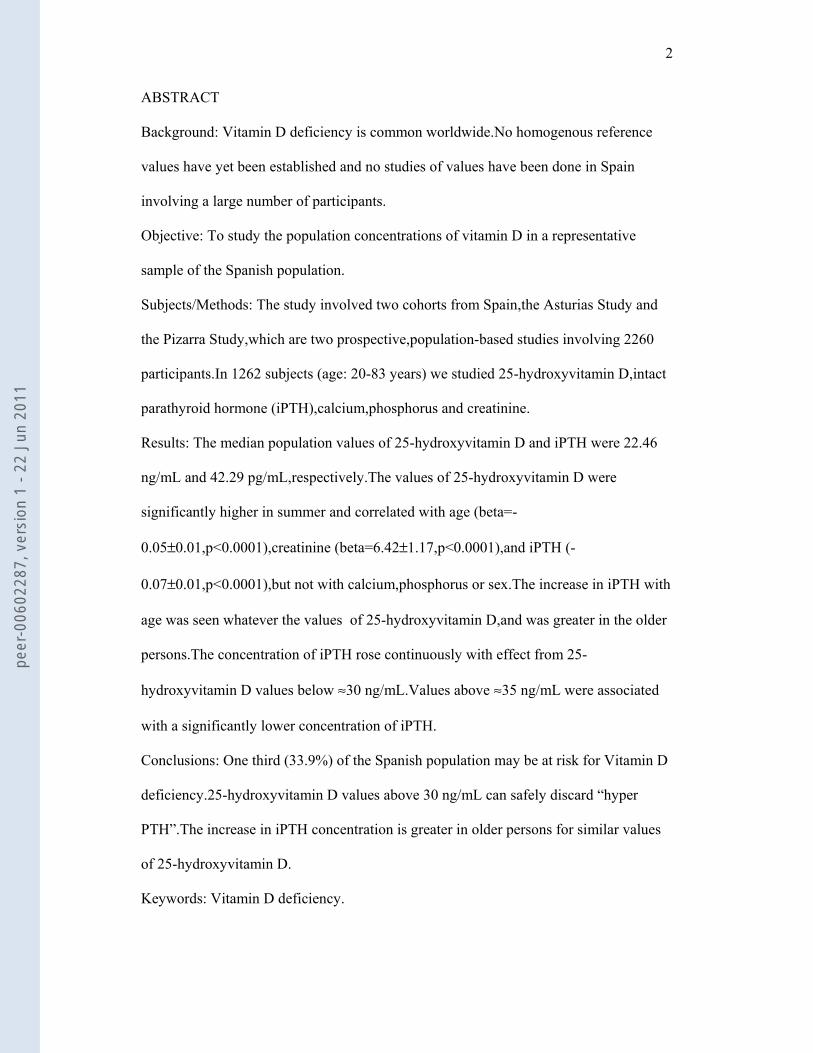
The increase in iPTH with age was seen whatever the values of
25-hydroxyvitamin D,and were greater in older persons (Figure 3).
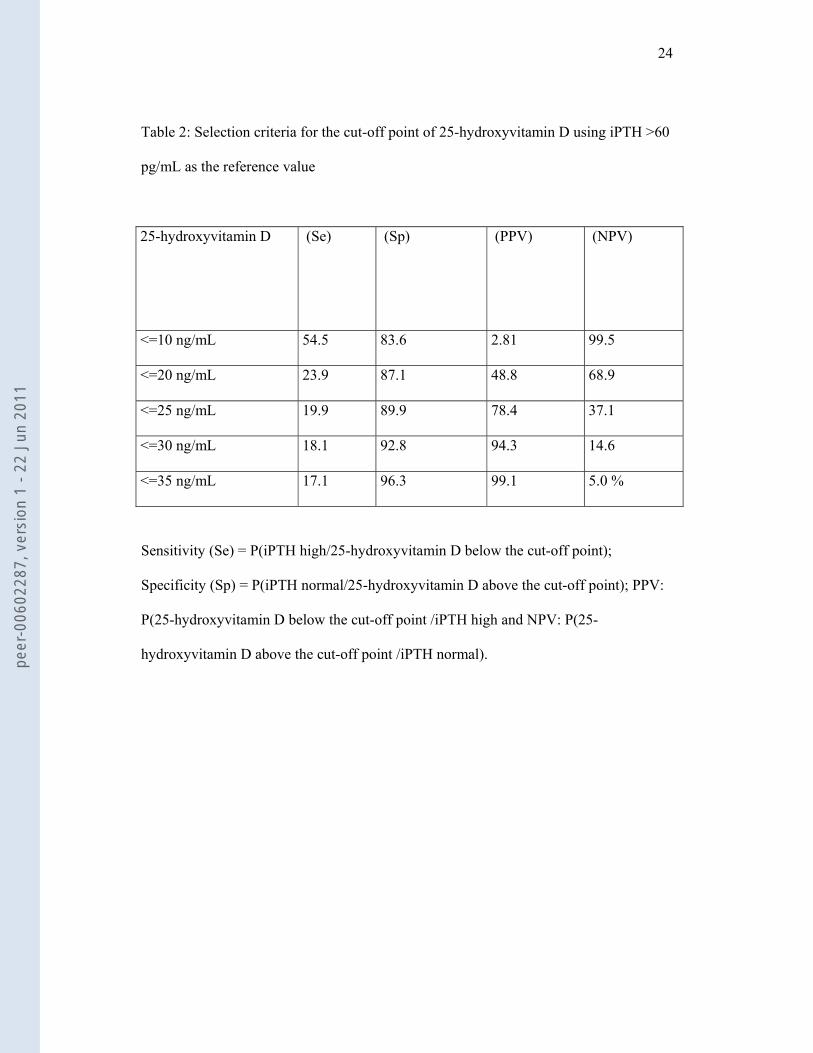
Table 2 summarizes the sensitivity,specificity,PPV and NPV,considering the
iPTH value (>60 pg/mL) as the biological reference criterion of hypovitaminosis D,for
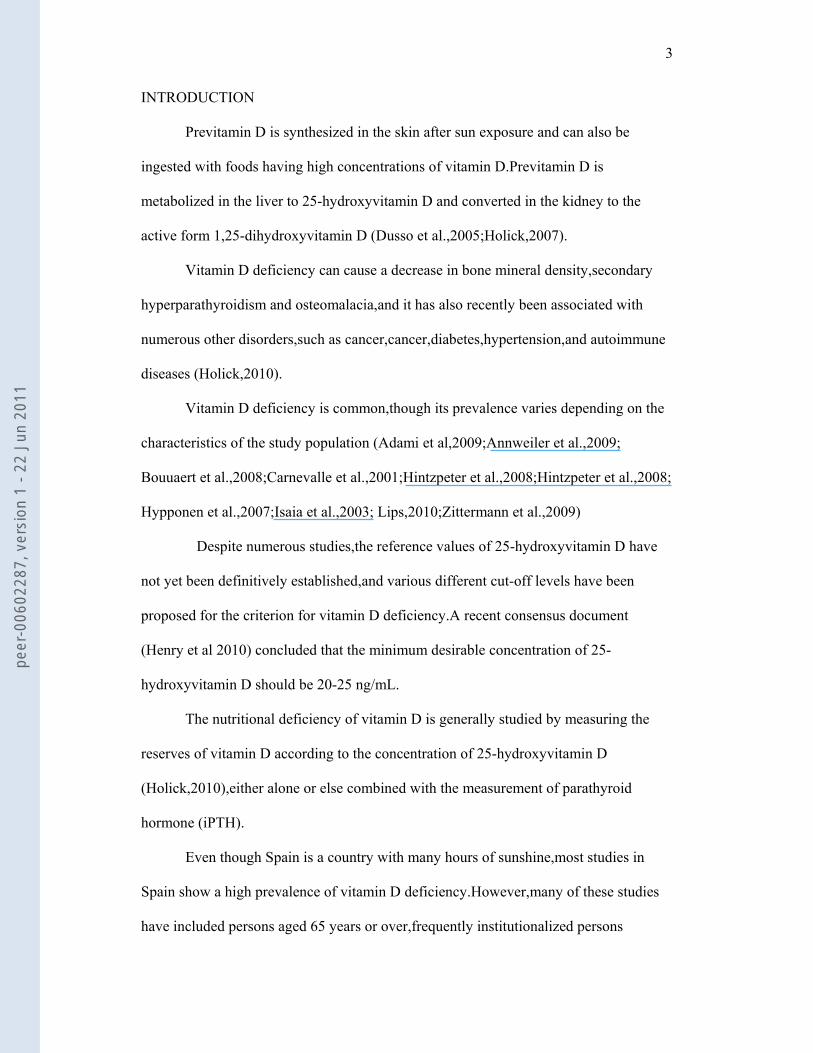
different cut-off values of 25-hydroxyvitamin D.The iPTH levels rose continuously with
effect from 25-hydroxyvitamin D values lower than ≈30 ng/mL.Values above ≈35
ng/mL were associated with significantly lower levels of iPTH (Figure 4).
The area under the ROC curve (25-hydroxyvitamin D value according to iPTH)
was 0.62±0.021(95% CI,0.58-0.66)(p<0.0001)
Logistic regression models: The variable best predicting concentrations of 25-
hydroxyvitamin D below 20 ng/mL was the value of plasma creatinine(Beta:-1.66;OR
peer
-006
0228
7, v
ersi
on 1
- 22
Jun
201
1

10
0.19;p<0.0001),followed by the value of iPTH.Inclusion in the model as a dependent
variable of another different cut-off point for iPTH (≤65 pg/mL) did not change
substantially the strength of the prediction.The variables most strongly associated with
values of iPTH (<=60 or >60 pg/mL) were plasma phosphorus (Beta:-0.77; OR:0.46;
p<0.0001) and 25-hydroxyvitamin D (Beta:0.53; OR:1.70;p=0.001).
DISCUSSION
If we use the reference value of 20 ng/mL,33.9% of the Spanish population are
at risk for vitamin D deficiency,with no significant differences between the study in the
north and the study in the south (prevalences of 31.3% and 35.0% respectively).Several
studies have been undertaken in Spain on the vitamin D nutritional situation,especially
during the 1990s.Most of these studies coincided concerning the presence of vitamin D
deficiency,but the prevalence figures for the deficit varied,probably because most were
done with opportune or institutionalized samples,and generally involved a low number
of persons (Calatayud et al.,2009;Gomez-Alonso et al.,2003;González-Solanellas et
al.,2008;Mata-Granados et al.,2008;Pérez-Llamas et al.,2008;Vaquero et al.,2004).In
other countries in Europe,the percentages of deficiency and insufficiency vary
(Lips,2010).Italy has prevalence levels of 17% below 12 ng/ml in winter in the south
(Carnevalle et al,2001) and one third of healthy women below 20 ng/ml in the north
(Adami et al,2009),which is very similar to our prevalence.Germany has lower levels of
vitamin D than in our study: the prevalence of vitamin D insufficiency in the German
National Health Interview and Examination Survey was more than 50% in the general
population and 60% in children (Hintzpeter et al.,2008;Hitzpeter et al.,2008),with the
DEVID (The vitamin in Deutschland) study reporting mean levels of 41±22 nmol/L
(Zittermann et al.,2009).In the British population,the prevalence is greater than in Spain:
peer
-006
0228
7, v
ersi
on 1
- 22
Jun
201
1

11
Hypponen et al reported a prevalence of hypovitaminosis D <75 nmol/L in 87.1% of
participants in winter and in 60.9% in summer (Hypponen et al.,2007).In elderly
people,the prevalence of hypovitaminosis D in France,Belgium,Italy and other countries
is more than 60% (Annweiler et al.,2009;Bouuaert et al.,2008;Isaia et al.,2003).
In agreement with other studies,we found a negative correlation between levels
of 25-hydroxyvitamin D and iPTH (Adami et al.,2010;Arabi et al.2010;Christensen et
al,2010;Ho pham et al.,2010).On the other hand,the variability in iPTH with seasonal
climate changes was lower than that for 25-hydroxyvitamin D,as occurred elsewhere
(von Muhlen et al.,2005) and the correlation between iPTH and 25-hydroxyvitamin D
was less obvious in spring and summer (data not shown),as in other studies (Maeda et
al.,2010),probably related with the different turnover of vitamin D3 and iPTH at a time
when the production of vitamin D3 in the skin is greater.In general,most studies assume
that iPTH reaches a plateau when 25-hydroxyvitamin D values reach a particular
concentration (Chapuy et al.,1997;Khosla et al.,1997;Leboff et al.,1999;Malaban et
al.,1998;Thomas et al.,1998; von Muhlen et al.,2005).This observation has led to the use
of iPTH levels as a biological marker for the nutritional status of vitamin
D(Holick,2007).Others have found no plateau concerning iPTH vs.25-hydroxyvitamin
D,suggesting that the choice of an optimum or desirable concentration of 25-
hydroxyvitamin D,as based solely on iPTH,could be arbitrary (Vieth et al,2003;Ho-
Pham et al,2010).Some studies have used linear or exponential models to predict the
cut-off point of 25-hydroxyvitamin D values above which the iPTH concentration
becomes stable (Chapuy et al.,1997).In our study the 25-hydroxyvitamin D*iPTH plot
was very similar to that reported by others (Vieth et al.,2003).However,despite the high
level of statistical significance of the various mathematical adjustments,none of the
mathematical models used explain more than about 5% of the variance in iPTH (data
peer
-006
0228
7, v
ersi
on 1
- 22
Jun
201
1
12
not shown).In our study,using the cut-off values suggested in the ROC curve,we
calculated the predictive values of “hyper iPTH” using various different cut-off points
of 25-hydroxyvitamin D.A 25-hydroxyvitamin D cut-off point of ≤30 ng/mL was able
to diagnose “hyper iPTH” with a low degree of certainty (18.1%),whereas 25-
hydroxyvitamin D concentrations above 30 ng/mL were associated with a high degree
of certainty (92.8%) at discarding “hyper iPTH”.
In our study,as in others,the levels of 25-hydroxyvitamin D fell with age,at the
same time as the iPTH increased (Arabi et al 2010.;Vieth et al.,2003) and the
phosphorus decreased.Only a few studies have examined the effect of age and kidney
function on turnover of 25-hydroxyvitamin D (Vieth et al.,2003;Cristensen et
al.;2010).In our study,age and plasma creatinine were closely related (r=0.25,p<0.0001)
and the levels of 25-hydroxyvitamin D correlated positively with the plasma
creatinine,independently of the iPTH levels.In the study by Vieth (Vieth et al.,2003),the
correlation between age and creatinine was just seen in the older persons,the correlation
between 25-hydroxyvitamin D and creatinine only in the younger persons and the
change in iPTH correlated with the creatinine only in the older persons,not the
younger.Von Mulhen (von Mulhen et al.,2005) on the other hand,found no correlation
between creatinine clearance and levels of iPTH or vitamin D.Although most reports
have documented a vitamin D deficiency in uremic patients especially due to chronic
kidney disease related comorbidities (LaClair et al.,2005 ; Mehrotra et al.,2008),other
have not (Craver et al.,2007).Indeed,25-hydroxyvitamin D levels remained unchanged
and levels of 1,25-dihydroxyvitamin D fell as the kidney disease progressed.In another
study in patients with normal renal function,levels of vitamin D3 correlated positively
with the creatinine (Vieth et al.,2003),as they did in our study.We do not have an easy
explanation for this issue.It is plausible that a slight impaired renal function may be
peer
-006
0228
7, v
ersi
on 1
- 22
Jun
201
1

13
associated with a lower production of 1-25-hydroxyvitamin D,which induces an
increase in iPTH values.The fact that iPTH levels correlated with serum creatinine in
our study independently of vitamin D levels,supports this argument.Lastly,we only
included patients without chronic clinical disorders but with many hours of sunshine
exposure,which may also contribute to maintenance stable 25-hydroxyvitamin D
levels,even in presence of slight renal failure.Further studies are needed to clarify this
concern.
The fall in 25-hydroxyvitamin D with age seen in this study seems consistent
with the findings of others (Arabi et al.2010;Chapuy et al.,1997;Jacques et al.,1997;
Malabanan et al.,1998;Mezquita Raya et al.,2001 ;Von Muhlen.et al.,2005;Vieth et
al.,2003),though not all (Christensen et al.,2010 ; Harris et al.,2000; Tangpricha et
al.,2002;).The rise in iPTH levels with age seems to occur whatever the levels of 25-
hydroxyvitamin D and does not seem to be explained just by the vitamin D3 nutritional
status.These results have also been found by others (Vieth et al.,2003;Arabi et
al.;2010).It seems,therefore,that aging is accompanied by a reduction in the production
by the skin of vitamin D3 (MacLaughlin et al.,1985) together with some form of
resistance to the effects of 25-hydroxyvitamin D,as has also been seen in older persons
for 1,25-hydroxyvitamin D (Pattanaungkul et al.,2000) and proposed by others (Vieth et
al.,2003).These reasons,together with the reduction in gut absortion of vitamin D in
older persons (Bhutto et al.,2008),may contribute to the changes in levels of 25-
hydroxyvitamin D and iPTH with age.
If we use a concentration of 25-hydroxyvitamin D as a criterion for nutritional
deficiency,e.g.,≤20 ng/mL,those persons studied in summer,spring and winter had a
prevalence of vitamin D3 deficiency of 26.9%,34.5% and 37.2%,respectively
(p=0.01).However,if we use iPTH ≤60 pg/mL,the prevalence of nutritional deficiency
peer
-006
0228
7, v
ersi
on 1
- 22
Jun
201
1
14
was 15.8%,19.9% and 19.8%,respectively,with no significant differences between
seasons.Using the measurement of both 25-hydroxyvitamin D and iPTH,though,did not
substantially improve the discriminative capacity,as although 61.6% of the persons
studied in summer had simultaneous high concentrations of 25-hydroxyvitamin D and
iPTH ≤60 pg/mL,only 8.9% of those studied in winter had low concentrations of 25-
hydroxyvitamin D and high levels of iPTH.The results of this study carried out in a
representative Spanish population show the difficulties involved in establishing with
precision a diagnosis of the nutritional status of vitamin D by measuring the
concentrations of 25-hydroxyvitamin D and iPTH.
At this time the aims of an adequate nutritional supplement with vitamin D
should be to reach a sufficient concentration of 25-hydroxyvitamin D to achieve levels
of iPTH ≤60 pg/mL.However,with the simultaneous measurement of
25-hydroxyvitamin D and iPTH the validation of this objective is far from being
satisfactorily achieved.Nonetheless,our results suggest,like others (Heaney et
al.,2000;von Muhlen et al.,2005),that values of 25-hydroxyvitamin D above 30 ng/mL
could prevent secondary hyperparathyroidism in most persons.Even so,numerous gaps
still remain concerning the best criterion for the diagnosis of vitamin D
deficiency.Future prospective studies with large series of populations would therefore
appear necessary,using clinical and risk prevention criteria to identify the most suitable
criteria to define vitamin D deficiency.
The authors do not have any financial or personal relationships with other people or
organisations that could inappropriately influence their work.
peer
-006
0228
7, v
ersi
on 1
- 22
Jun
201
1

15
REFERENCES
Adami S,Bertoldo F,Braga V,Fracassi E,Gatti D,Gandolini G et al (2009).25-hydroxy
vitamin D levels in healthy premenopausal women: association with bone turnover
markers and bone mineral density.Bone 45(3):423-426.
Annweiler C,Beauchet O,Berrut G,Fantino B,Bonnefoy M,Herrmann FR (2009).Is there
an association between serum 25-hydroxyvitamin D concentration and muscle strength
among older women? Results from baseline assessment of the EPIDOS study.J Nutr
Health Aging 13,90-95.
Arabi A, Baddoura R, El-Rassi R, Fuleihan G (2010).Age but not gender modulates the
relationship between PTH and vitamin D.Bone 47,408-412
Bhutto A,Morley JE (2008).The clinical significance of gastrointestinal changes with
aging.Curr Opin Clin Nutr Metab Care. 11,651-660
Boüüaert C,Vanmeerbeek M,Burette P,Cavalier E,Seidel L,Blockx S,et
al(2008).Vitamin D deficiency in elderly men living in urban areas,at home or in
institutions.Presse Med 37,191-200.
Calatayud M,Jódar E,Sánchez R,Guadalix S,Hawkins F(2009).Prevalencia de
concentraciones deficientes e insuficientes de vitamina D en una población joven y
sana.Endocrinología y Nutrición 56,164-169
.
peer
-006
0228
7, v
ersi
on 1
- 22
Jun
201
1

16
Carnevale V,Modoni S,Pileri M,Di Giorgio A,Chiodini I,Minisola S,et
al.(2001).Longitudinal evaluation of vitamin D status in healthy subjects from southern
Italy: seasonal and gender differences.Osteoporos international 12,1026-1030
Craver L,Marco MP,Martínez I,et al (2007).Mineral metabolism parameters throughout
chronic kidney disease stages 1-5--achievement of K/DOQI target ranges.Nephrol Dial
Transplant 22,1171-1176.
Chapuy MC,Preziosi P,Maamer M,Arnaud S,Galan P,Hercberg S,et al
(1997).Prevalence of vitamin D insufficiency in an adult normal population.
Osteoporos Int 7,439-443
Christensen M,Lien E,Hustad S,Almas B(2010).Seasonal and age-related differences in
serum 25-hydroxyvitamin D,1,25-dihydroxyvitamin D and parathyroid hormone in
patients from Western Norway.Scandinavian Journal of Clinical & Laboratory
Investigation 70,281–286
DeLuca HF(2004).Overview of general physiologic features and functions of vitamin
D.Am J Clin Nutr 80,1689- 1696.
Dusso AS,Brown AJ,Slatopolsky E (2005).Vitamin D.Am J Physiol Renal Physiol
289,8-28.
Gómez-Alonso C,Naves-Díaz ML,Fernández-Martín JL,Díaz-López JB,Fernández-
Coto MT,Cannata-Andía JB (2003).Vitamin D status and secondary
peer
-006
0228
7, v
ersi
on 1
- 22
Jun
201
1

17
hyperparathyroidism: the importance of 25-hydroxyvitamin D cut-off levels.Kidney Int
63,S44-S48.
Gonzalez Solanellas M,Romagosa Pérez-Portabella A,Zabaleta del Olmo E,et
al.(2008).Vitamin D Deficiency in Women of Reproductive Age.Atencion
primaria.40,393-399
Harris SS,Soteriades E,Coolidge JA,Mudgal S,Dawson-Hughes B (2000).Vitamin D
insufficiency and hyperparathyroidism in a low income,multiracial,elderly population.J
Clin Endocrinol Metab 85,4125-4130
Heaney RP,Dowell MS,Hale CA,Bendich A (2003).Calcium absorption varies within
the reference range for serum 25-hydroxyvitamin D.J Am Coll Nutr 22,142-146.
Heaney RP.Vitamin D: How much do we need,and how much is too much?
(2000).Osteoporos Int 11,553–555
Henry HL,Bouillon R,Norman AW,Gallagher JC,Lips P,Heaney RP et al (2010) 14th
Vitamin D Workshop consensus on vitamin D nutritional guidelines,J Steroid Biochem
Mol Biol 121,4-6
Hintzpeter,B,Mensink,GB,Thierfelder,W,Muller,M.J,et al.(2008).Vitamin D status and
health correlates among German adults.Eur J Clin Nutr 62,1079–1089
peer
-006
0228
7, v
ersi
on 1
- 22
Jun
201
1
18
Hintzpeter B,Scheidt-Nave C,Muller M.J,Schenk,L,et al.(2008).Higher prevalence of
vitamin D deficiency is associated with immigrant background among children and
adolescents in Germany.J Nutr 138,1482–1490.
Ho-Pham LT,Nguyen ND,Lai TQ,Eisman JA,Nguyen TV (2010).Vitamin D status and
parathyroid hormone in a urban population in Vietnam.Osteoporos Int Apr 23.[Epub
ahead of print]
Holick MF (2007).Vitamin D Deficiency.N Engl J Med 357,266-81.
Holick MF (2010).Vitamin D: extraskeletal health. Endocrinol Metab Clin North Am
39(2):381-400
Hyppönen E,Power C (2007).Hypovitaminosis D in British adults at age 45 year
nationwide cohort study of dietary and lifestyle predictors.Am J Clin Nutr 85,860-8.
Isaia G,Giorgino R,Rini GB,Bevilacqua M,Maugeri D,Adami S (2003).Prevalence of
hypovitaminosis D in elderly women in Italy: clinical consequences and risk
factors.Osteoporos Int 14,577-82.
Jacques PF,Felson DT,Tucker KL,Mahnken B,Wilson PW,Rosenberg IH,et
al.(1997).Plasma 25-hydroxyvitamin D and its determinants in an elderly population
sample.Am J Clin Nutr 66,929-936
peer
-006
0228
7, v
ersi
on 1
- 22
Jun
201
1
19
Khosla S,Atkinson EJ,Melton LJ,Riggs BL (1997).Effects of age and estrogen status on
serum parathyroid hormone levels and biochemical markers of bone turnover in women:
a population-based study.J Clin Endocrinol Metab 82,1522-1527
LaClair RE,Hellman RN,Karp SL,Kraus M,Ofner S,Li Q,et al.(2005).Prevalence of
calcidiol deficiency in CKD: a cross-sectional study across latitudes in the United
States.Am J Kidney Dis 45:1026-1033.
LeBoff MS,Kohlmeier L,Hurwitz S,Franklin J,Wright J,Glowacki J (1999).Occult
vitamin D deficiency in postmenopausal US women with acute hip fracture.JAMA
281,1505-1511
Lips P (2010).Worldwide status of vitamin D nutrition.J Steroid Biochem Mol Biol
Mar 1.[Epub ahead of print]
MacLaughlin J,Holick MF (1985).Aging decreases the capacity of human skin to
produce vitamin D3.J Clin Invest 76,1536-1539
Maeda S.,Kunii I,Hayashi L,Lazaretti-Castro M (2010).Increases in summer serum 25-
hydroxyvitamin D (25OHD) concentrations in elderly subjects in Sao Paulo,Brazil vary
with age,gender and ethnicity.BMC Endocrine Disorders 14,10-12
Malabanan A,Veronikis IE,Holick MF (1998).Redefining vitamin D insufficiency.
Lancet 351,805-806
peer
-006
0228
7, v
ersi
on 1
- 22
Jun
201
1

20
Mata-Granados JM,Luque de Castro MD,Quesada JM (2008).Inappropriate serum
levels of retinol,α-tocopherol,25 hydroxyvitamin D3 and 24,25 dihydroxyvitamin D3
levels in healthy Spanish adults:Simultaneous assessment by HPLC.Clinical
Biochemistry 41,676-680
Mehrotra R,Kermah D,Budoff M,Salusky IB,Mao SS,Gao YL,et
al.(2008).Hypovitaminosis D in chronic kidney disease.Clin J Am Soc Nephrol 3,1144-
1151
Mezquita-Raya P,Munoz-Torres M,Luna JD,et al.(2001).Relation between vitamin D
insufficiency,bone density,and bone metabolism in healthy postmenopausal women.J
Bone Miner Res 16,1408-1415
Niño Martín V and Pérez Castrillón JL (2008).Niveles de vitamina D en población
mayor de 65 años.Revista Española de Enfermedades Metabólicas Óseas 17,11-14
Pattanaungkul S,Riggs BL,Yergey AL,Vieira NE,O’Fallon WM,Khosla S
(2000)Relationship of intestinal calcium absorption to 1,25-dihydroxyvitamin D
[1,25(OH)2D] levels in young versus elderly women: evidence for age related intestinal
resistance to 1,25(OH)2D action.J Clin Endocrinol Metab 85,4023-4027
Pérez-Llamas F,López-Contreras MJ,Blanco MJ,López-Azorín F,Zamora S,Moreiras
O(2008).Seemingly paradoxical seasonal influences on vitamin D status in
nursing-home elderly people from a Mediterranean area.Nutrition 24,414-420
peer
-006
0228
7, v
ersi
on 1
- 22
Jun
201
1

21
Rodríguez Sangrador M,Beltrán de Miguel B,Quintanilla Murillas L,Cuadrado Vives
C,Moreiras Tuny O (2008).The contribution of diet and sun exposure to the nutritional
status of vitamin D in elderly Spanish women: the five countries study (OPTIFORD
Project)] Nutr Hosp 23,567-76.
Soriguer F; Esteva I; Rojo-Martinez G,et al.(2002).Prevalence of diabetes mellitus type
LADA in South Spain.Diabetes Res Clin Pract 56,213-220.
Soriguer F,Rojo-Martínez G,Almaraz MC,et al.(2008).Incidence of type 2 diabetes in
southern Spain (Pizarra Study).Eur J Clin Invest 38,126-133.
Souberbielle JC,Cormier C,Kindermans C,Gao P,Cantor T,Forette F,
Baulieu EE (2001).Vitamin D status and redefining serum parathyroid hormone
reference range in the elderly.J Clin Endocrinol Metab 86,3086-3090
Tangpricha V,Pearce EN,Chen TC,Holick MF (2002).Vitamin D insufficiency
among free-living healthy young adults.Am J Med 112,659-662
Thomas KK,Lloyd-Jones DH,Thadhani RI,et al.(1998).Hypovitaminosis D in medical
inpatients.N Engl J Med 338,777-783
Valdés S,Botas P,Delgado E,Alvarez F,Cadórniga FD(2007).Population-based
incidence of type 2 diabetes in northern Spain: the Asturias Study.Diabetes Care
30,2258-2263.
peer
-006
0228
7, v
ersi
on 1
- 22
Jun
201
1

22
Vaquero MP,Sánchez-Muniz FJ,Carvajal A,García-Linares MC,García-
Fernández MC,García-Arias MT (2004).Mineral and vitamin status in elderly
persons from Northwest Spain consuming an Atlantic variant of the
Mediterranean diet.Ann Nutr Metab 48,125-133.
Vieth R,Milojevic S,Peltekova V (2000).Improved cholecalciferol nutrition in rats is
noncalcemic,suppresses parathyroid hormone and increases responsiveness to 1,25-
dihydroxycholecalciferol.J Nutr 130,578-584
Vieth R,Ladak Y,Walfish P(2003).Age-related changes in the 25-hydroxyvitamin D
versus parathyroid hormone relationship suggest a different reason why older adults
require more vitamin D.J Clin Endocrinol Metab 88,185-191
von Mühlen DG,Greendale GA,Garland CF (2005).Vitamin D,parathyroid hormone
levels and bone mineral density in community-dwelling older women: The Rancho
Bernardo Study.Osteoporos Int 16,1721-1726
Zittermann,A,von Helden,R,Grant,W B,Kipshoven C,Ringe JD (2009).An estimate of
the survival benefit of improving vitamin D status in the adult German
population.Dermato-Endocrinology 1,119-120
peer
-006
0228
7, v
ersi
on 1
- 22
Jun
201
1

23
Table 1: Population distribution of the levels of 25-hydroxyvitamin
D,creatinine,iPTH,calcium and phosphorus
Percentiles
5 10 25 50 75 90 95
25-hydroxyvitamin D
(ng/mL) 13.58 15.41 18.56 22.46 26.97 31.11 34.69
Creatinine(mg/dl)
(Male) 0,7 0,7 0,8 0,9 1 1,1 1,2
Creatinine(mg/dl)
(Female) 0,5 0,5 0,6 0,7 0,8 0,9 0,9
iPTH (pg/mL) 23.83 26.76 33.10 42.29 54.75 69.04 78.95
Ca (mg/dL) 8.70 8.90 9.10 9.40 9.60 9.90 10.10
P (mg/dL) 2.70 2.90 3.20 3.50 3.80 4.10 4.30
Data are expresed in percentiles.
peer
-006
0228
7, v
ersi
on 1
- 22
Jun
201
1
24
Table 2: Selection criteria for the cut-off point of 25-hydroxyvitamin D using iPTH >60
pg/mL as the reference value
25-hydroxyvitamin D (Se) (Sp) (PPV) (NPV)
<=10 ng/mL 54.5 83.6 2.81 99.5
<=20 ng/mL 23.9 87.1 48.8 68.9
<=25 ng/mL 19.9 89.9 78.4 37.1
<=30 ng/mL 18.1 92.8 94.3 14.6
<=35 ng/mL 17.1 96.3 99.1 5.0 %
Sensitivity (Se) = P(iPTH high/25-hydroxyvitamin D below the cut-off point);
Specificity (Sp) = P(iPTH normal/25-hydroxyvitamin D above the cut-off point); PPV:
P(25-hydroxyvitamin D below the cut-off point /iPTH high and NPV: P(25-
hydroxyvitamin D above the cut-off point /iPTH normal).
peer
-006
0228
7, v
ersi
on 1
- 22
Jun
201
1

25
Legends to the figures
Figure 1: Concentrations of 25-hydroxyvitamin D (a)
• Pizarra
♦ Asturias
Figure 2: Plasma concentration of 25-hydroxyvitamin D and iPTH according to the
mean daily radiation.
Figure 3: Concentration of iPTH according to age intervals and values of 25-
hydroxyvitamin D
Figure 4: Concentration of iPTH according to levels of 25-hydroxyvitamin D.
peer
-006
0228
7, v
ersi
on 1
- 22
Jun
201
1
28
Figure 1
ml)
28
26O
H)D
(ng/
m
24
22
25(O
20
Age (years)
>7566-75
56-6546-55
36-4526-35
<=25
18
peer
-006
0228
7, v
ersi
on 1
- 22
Jun
201
1

Figure 2
60D
50
40
Mea
n ±
SD
30
2020
1025 (OH) Vit D (ng/ml)
Radiation (w/m2)
Month
DNOSAJJMAMFJ0 PTHi (pg/ml)
peer
-006
0228
7, v
ersi
on 1
- 22
Jun
201
1

200
Figure 3
Age (Years)
PTH
i
100
<=25
26-35
36-45
46-55
56-65
66-75
25 (OH) Vit D
>=P7550-7525-50<=P250 >75
peer
-006
0228
7, v
ersi
on 1
- 22
Jun
201
1

Figure 4
180
160
Figure 4
)160
140
120
PTH
i (pg
/ml)
100
80
60
40
20
6050403020100
20
0
25 (OH) Vit D (ng/ml)
peer
-006
0228
7, v
ersi
on 1
- 22
Jun
201
1
Copyright © 2022 FDOKUMEN