Vitamin D deficiency in pregnancy and gestational diabetes: Burris et al
15
Vitamin D Deficiency in Pregnancy and Gestational Diabetes Heather H Burris, MD, MPH 1 , Ms. Sheryl L. Rifas-Shiman, MPH 2 , Ken Kleinman, ScD 2 , Augusto A. Litonjua, MD, MPH 3,4 , Susanna Y. Huh, MD, MPH 5 , Janet W. Rich-Edwards, ScD 6,7 , Carlos A. Camargo Jr., MD, DrPH 3,8 , and Matthew W. Gillman, MD, SM 2,9 1 Department of Neonatology, Beth Israel Deaconess Medical Center and Division of Newborn Medicine, Department of Pediatrics, Children’s Hospital Boston, and Harvard Medical School, Boston, MA 2 Obesity Prevention Program, Department of Population Medicine, Harvard Medical School and Harvard Pilgrim Health Care Institute, Boston, MA 3 Channing Laboratory, Department of Medicine, Brigham and Women’s Hospital, Harvard Medical School, Boston, MA 4 Division of Pulmonary and Critical Care, Department of Medicine, Brigham & Women’s Hospital, Boston, MA 5 Division of Gastroenterology and Nutrition, Department of Pediatrics, Children’s Hospital Boston, Harvard Medical School, Boston, MA 6 Division of Women’s Health, Department of Medicine, Brigham and Women’s Hospital, Harvard Medical School, Boston, MA 7 Department of Epidemiology, Harvard School of Public Health, Boston, MA 8 Department of Emergency Medicine, Massachusetts General Hospital, Harvard Medical School, Boston, MA 9 Department of Nutrition, Harvard School of Public Health, Boston, MA Abstract Objective—We examined the association of second trimester maternal plasma 25- hydroxyvitamin D (25[OH]D) during pregnancy with gestational diabetes mellitus(GDM). Study Design—Among 1314 pregnant women participating in Project Viva, a birth cohort study, we measured 25(OH)D levels at 26–28 weeks’ gestation during GDM screening using a 1- hour 50g glucose challenge test. Results—We found 25(OH)D levels <25nmol/L in 44/1087(4.0%) women with normal glucose tolerance, 9/159(5.7%) women with impaired glucose tolerance and 9/68(13.2%) women with © 2012 Mosby, Inc. All rights reserved. Reprints requests and correspondence to: Dr. Heather H. Burris, MD MPH, 330 Brookline Avenue RO 318, BIDMC-Neonatology, Boston, MA 02215, USA [email protected]; phone (617)667-3276; fax (617)667-7040. Publisher's Disclaimer: This is a PDF file of an unedited manuscript that has been accepted for publication. As a service to our customers we are providing this early version of the manuscript. The manuscript will undergo copyediting, typesetting, and review of the resulting proof before it is published in its final citable form. Please note that during the production process errors may be discovered which could affect the content, and all legal disclaimers that apply to the journal pertain. CONFLICT OF INTEREST/PERSONAL FINANCIAL DISCLOSURE: “Disclosure: None of the authors have a conflict of interest.” Presentation information: This research was presented as a poster at the Obesity Society's 29th Annual Scientific Meeting, Orlando, FL, October 1–5, 2011. NIH Public Access Author Manuscript Am J Obstet Gynecol. Author manuscript; available in PMC 2013 September 01. Published in final edited form as: Am J Obstet Gynecol. 2012 September ; 207(3): 182.e1–182.e8. doi:10.1016/j.ajog.2012.05.022. NIH-PA Author Manuscript NIH-PA Author Manuscript NIH-PA Author Manuscript
-
Upload
hms-harvard -
Category
Documents
-
view
1 -
download
0
Transcript of Vitamin D deficiency in pregnancy and gestational diabetes: Burris et al

Vitamin D Deficiency in Pregnancy and Gestational Diabetes
Heather H Burris, MD, MPH1, Ms. Sheryl L. Rifas-Shiman, MPH2, Ken Kleinman, ScD2,Augusto A. Litonjua, MD, MPH3,4, Susanna Y. Huh, MD, MPH5, Janet W. Rich-Edwards,ScD6,7, Carlos A. Camargo Jr., MD, DrPH3,8, and Matthew W. Gillman, MD, SM2,9
1Department of Neonatology, Beth Israel Deaconess Medical Center and Division of NewbornMedicine, Department of Pediatrics, Children’s Hospital Boston, and Harvard Medical School,Boston, MA2Obesity Prevention Program, Department of Population Medicine, Harvard Medical School andHarvard Pilgrim Health Care Institute, Boston, MA3Channing Laboratory, Department of Medicine, Brigham and Women’s Hospital, HarvardMedical School, Boston, MA4Division of Pulmonary and Critical Care, Department of Medicine, Brigham & Women’s Hospital,Boston, MA5Division of Gastroenterology and Nutrition, Department of Pediatrics, Children’s Hospital Boston,Harvard Medical School, Boston, MA6Division of Women’s Health, Department of Medicine, Brigham and Women’s Hospital, HarvardMedical School, Boston, MA7Department of Epidemiology, Harvard School of Public Health, Boston, MA8Department of Emergency Medicine, Massachusetts General Hospital, Harvard Medical School,Boston, MA9Department of Nutrition, Harvard School of Public Health, Boston, MA
AbstractObjective—We examined the association of second trimester maternal plasma 25-hydroxyvitamin D (25[OH]D) during pregnancy with gestational diabetes mellitus(GDM).
Study Design—Among 1314 pregnant women participating in Project Viva, a birth cohortstudy, we measured 25(OH)D levels at 26–28 weeks’ gestation during GDM screening using a 1-hour 50g glucose challenge test.
Results—We found 25(OH)D levels <25nmol/L in 44/1087(4.0%) women with normal glucosetolerance, 9/159(5.7%) women with impaired glucose tolerance and 9/68(13.2%) women with
© 2012 Mosby, Inc. All rights reserved.
Reprints requests and correspondence to: Dr. Heather H. Burris, MD MPH, 330 Brookline Avenue RO 318, BIDMC-Neonatology,Boston, MA 02215, USA [email protected]; phone (617)667-3276; fax (617)667-7040.
Publisher's Disclaimer: This is a PDF file of an unedited manuscript that has been accepted for publication. As a service to ourcustomers we are providing this early version of the manuscript. The manuscript will undergo copyediting, typesetting, and review ofthe resulting proof before it is published in its final citable form. Please note that during the production process errors may bediscovered which could affect the content, and all legal disclaimers that apply to the journal pertain.
CONFLICT OF INTEREST/PERSONAL FINANCIAL DISCLOSURE:“Disclosure: None of the authors have a conflict of interest.”
Presentation information: This research was presented as a poster at the Obesity Society's 29th Annual Scientific Meeting, Orlando,FL, October 1–5, 2011.
NIH Public AccessAuthor ManuscriptAm J Obstet Gynecol. Author manuscript; available in PMC 2013 September 01.
Published in final edited form as:Am J Obstet Gynecol. 2012 September ; 207(3): 182.e1–182.e8. doi:10.1016/j.ajog.2012.05.022.
NIH
-PA Author Manuscript
NIH
-PA Author Manuscript
NIH
-PA Author Manuscript
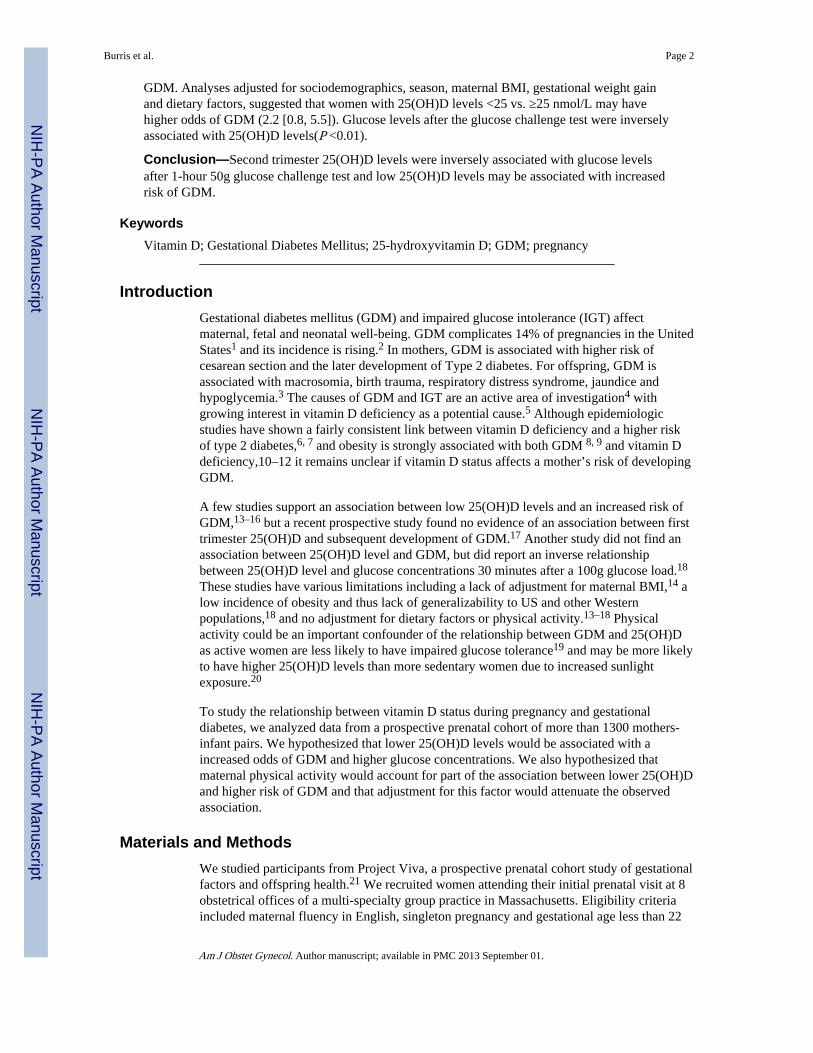
GDM. Analyses adjusted for sociodemographics, season, maternal BMI, gestational weight gainand dietary factors, suggested that women with 25(OH)D levels <25 vs. ≥25 nmol/L may havehigher odds of GDM (2.2 [0.8, 5.5]). Glucose levels after the glucose challenge test were inverselyassociated with 25(OH)D levels(P <0.01).
Conclusion—Second trimester 25(OH)D levels were inversely associated with glucose levelsafter 1-hour 50g glucose challenge test and low 25(OH)D levels may be associated with increasedrisk of GDM.
KeywordsVitamin D; Gestational Diabetes Mellitus; 25-hydroxyvitamin D; GDM; pregnancy
IntroductionGestational diabetes mellitus (GDM) and impaired glucose intolerance (IGT) affectmaternal, fetal and neonatal well-being. GDM complicates 14% of pregnancies in the UnitedStates1 and its incidence is rising.2 In mothers, GDM is associated with higher risk ofcesarean section and the later development of Type 2 diabetes. For offspring, GDM isassociated with macrosomia, birth trauma, respiratory distress syndrome, jaundice andhypoglycemia.3 The causes of GDM and IGT are an active area of investigation4 withgrowing interest in vitamin D deficiency as a potential cause.5 Although epidemiologicstudies have shown a fairly consistent link between vitamin D deficiency and a higher riskof type 2 diabetes,6, 7 and obesity is strongly associated with both GDM 8, 9 and vitamin Ddeficiency,10–12 it remains unclear if vitamin D status affects a mother’s risk of developingGDM.
A few studies support an association between low 25(OH)D levels and an increased risk ofGDM,13–16 but a recent prospective study found no evidence of an association between firsttrimester 25(OH)D and subsequent development of GDM.17 Another study did not find anassociation between 25(OH)D level and GDM, but did report an inverse relationshipbetween 25(OH)D level and glucose concentrations 30 minutes after a 100g glucose load.18
These studies have various limitations including a lack of adjustment for maternal BMI,14 alow incidence of obesity and thus lack of generalizability to US and other Westernpopulations,18 and no adjustment for dietary factors or physical activity.13–18 Physicalactivity could be an important confounder of the relationship between GDM and 25(OH)Das active women are less likely to have impaired glucose tolerance19 and may be more likelyto have higher 25(OH)D levels than more sedentary women due to increased sunlightexposure.20
To study the relationship between vitamin D status during pregnancy and gestationaldiabetes, we analyzed data from a prospective prenatal cohort of more than 1300 mothers-infant pairs. We hypothesized that lower 25(OH)D levels would be associated with aincreased odds of GDM and higher glucose concentrations. We also hypothesized thatmaternal physical activity would account for part of the association between lower 25(OH)Dand higher risk of GDM and that adjustment for this factor would attenuate the observedassociation.
Materials and MethodsWe studied participants from Project Viva, a prospective prenatal cohort study of gestationalfactors and offspring health.21 We recruited women attending their initial prenatal visit at 8obstetrical offices of a multi-specialty group practice in Massachusetts. Eligibility criteriaincluded maternal fluency in English, singleton pregnancy and gestational age less than 22
Burris et al. Page 2
Am J Obstet Gynecol. Author manuscript; available in PMC 2013 September 01.
NIH
-PA Author Manuscript
NIH
-PA Author Manuscript
NIH
-PA Author Manuscript
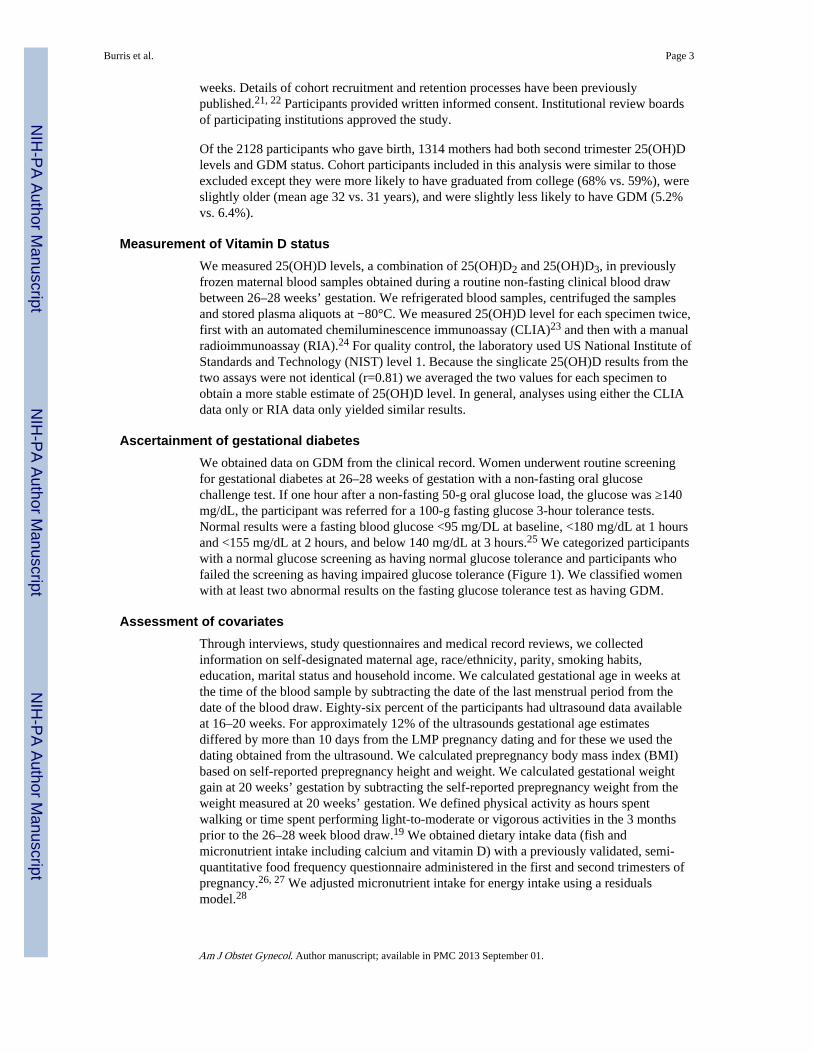
weeks. Details of cohort recruitment and retention processes have been previouslypublished.21, 22 Participants provided written informed consent. Institutional review boardsof participating institutions approved the study.
Of the 2128 participants who gave birth, 1314 mothers had both second trimester 25(OH)Dlevels and GDM status. Cohort participants included in this analysis were similar to thoseexcluded except they were more likely to have graduated from college (68% vs. 59%), wereslightly older (mean age 32 vs. 31 years), and were slightly less likely to have GDM (5.2%vs. 6.4%).
Measurement of Vitamin D statusWe measured 25(OH)D levels, a combination of 25(OH)D2 and 25(OH)D3, in previouslyfrozen maternal blood samples obtained during a routine non-fasting clinical blood drawbetween 26–28 weeks’ gestation. We refrigerated blood samples, centrifuged the samplesand stored plasma aliquots at −80°C. We measured 25(OH)D level for each specimen twice,first with an automated chemiluminescence immunoassay (CLIA)23 and then with a manualradioimmunoassay (RIA).24 For quality control, the laboratory used US National Institute ofStandards and Technology (NIST) level 1. Because the singlicate 25(OH)D results from thetwo assays were not identical (r=0.81) we averaged the two values for each specimen toobtain a more stable estimate of 25(OH)D level. In general, analyses using either the CLIAdata only or RIA data only yielded similar results.
Ascertainment of gestational diabetesWe obtained data on GDM from the clinical record. Women underwent routine screeningfor gestational diabetes at 26–28 weeks of gestation with a non-fasting oral glucosechallenge test. If one hour after a non-fasting 50-g oral glucose load, the glucose was ≥140mg/dL, the participant was referred for a 100-g fasting glucose 3-hour tolerance tests.Normal results were a fasting blood glucose <95 mg/DL at baseline, <180 mg/dL at 1 hoursand <155 mg/dL at 2 hours, and below 140 mg/dL at 3 hours.25 We categorized participantswith a normal glucose screening as having normal glucose tolerance and participants whofailed the screening as having impaired glucose tolerance (Figure 1). We classified womenwith at least two abnormal results on the fasting glucose tolerance test as having GDM.
Assessment of covariatesThrough interviews, study questionnaires and medical record reviews, we collectedinformation on self-designated maternal age, race/ethnicity, parity, smoking habits,education, marital status and household income. We calculated gestational age in weeks atthe time of the blood sample by subtracting the date of the last menstrual period from thedate of the blood draw. Eighty-six percent of the participants had ultrasound data availableat 16–20 weeks. For approximately 12% of the ultrasounds gestational age estimatesdiffered by more than 10 days from the LMP pregnancy dating and for these we used thedating obtained from the ultrasound. We calculated prepregnancy body mass index (BMI)based on self-reported prepregnancy height and weight. We calculated gestational weightgain at 20 weeks’ gestation by subtracting the self-reported prepregnancy weight from theweight measured at 20 weeks’ gestation. We defined physical activity as hours spentwalking or time spent performing light-to-moderate or vigorous activities in the 3 monthsprior to the 26–28 week blood draw.19 We obtained dietary intake data (fish andmicronutrient intake including calcium and vitamin D) with a previously validated, semi-quantitative food frequency questionnaire administered in the first and second trimesters ofpregnancy.26, 27 We adjusted micronutrient intake for energy intake using a residualsmodel.28
Burris et al. Page 3
Am J Obstet Gynecol. Author manuscript; available in PMC 2013 September 01.
NIH
-PA Author Manuscript
NIH
-PA Author Manuscript
NIH
-PA Author Manuscript

Statistical analysisWe first performed bivariate analyses to determine maternal and infant characteristicsassociated with previously described clinical categories of vitamin D status:29–32 severedeficiency (<25 nmol/L), deficiency (25 to <50 nmol/L), insufficiency (50 to <75 nmol/L),and sufficiency (≥75 nmol/L). We further dichotomized 25(OH)D levels at 25 nmol/Lbecause preliminary analyses of the odds of GDM demonstrated a threshold; compared towomen with 25(OH)D levels <25 nmol/L, women with levels 25–<50, 50–<75 and ≥75 hadunadjusted odds ratios for GDM of 0.25, 0.32, and 0.20, respectively. We usedmultivariable-adjusted multinomial logistic regression models to examine associationsbetween severe vitamin D deficiency and the odds of developing GDM or IGT compared towomen with normal glucose tolerance. We excluded covariates that did not confound therelationship between 25(OH)D level and the odds of GDM.
To analyze the relationship between vitamin D status and blood glucose measurement afterthe 1-hour glucose challenge screening test, we conducted analyses predicting glucose as acontinuous variable using multivariate linear regression models. In these models, we used25(OH)D as a continuous independent variable and adjusted for the same covariates as theGDM analyses.
As is common in large epidemiologic studies, many covariates were missing on somesubjects. We used chained equations to multiply impute values for these covariates.33–35 Wegenerated 10 imputed data sets; all model results are generated by appropriately combiningthese results.36 To avoid incorrect imputations, all 2128 Viva subjects were used in theimputation process;34 however, only those with observed 25OHD are included in theanalysis. All analyses were performed in SAS version 9.3.
ResultsSecond Trimester 25-hydroxyvitamin D levels
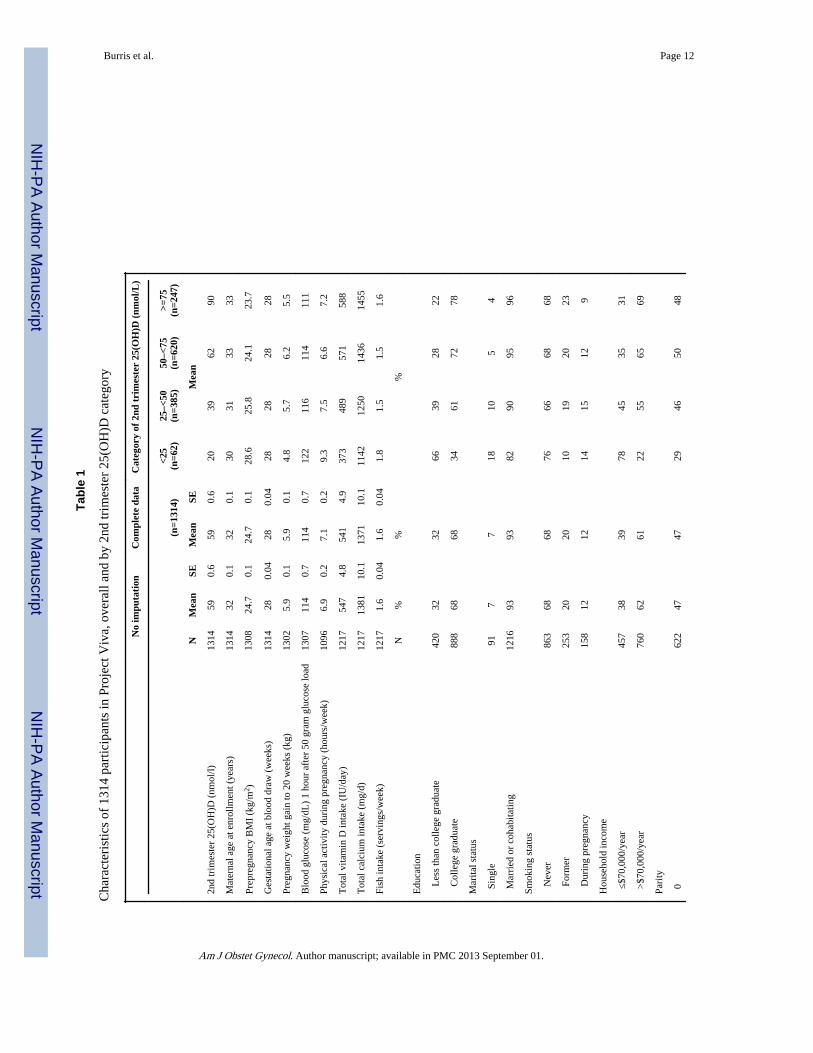
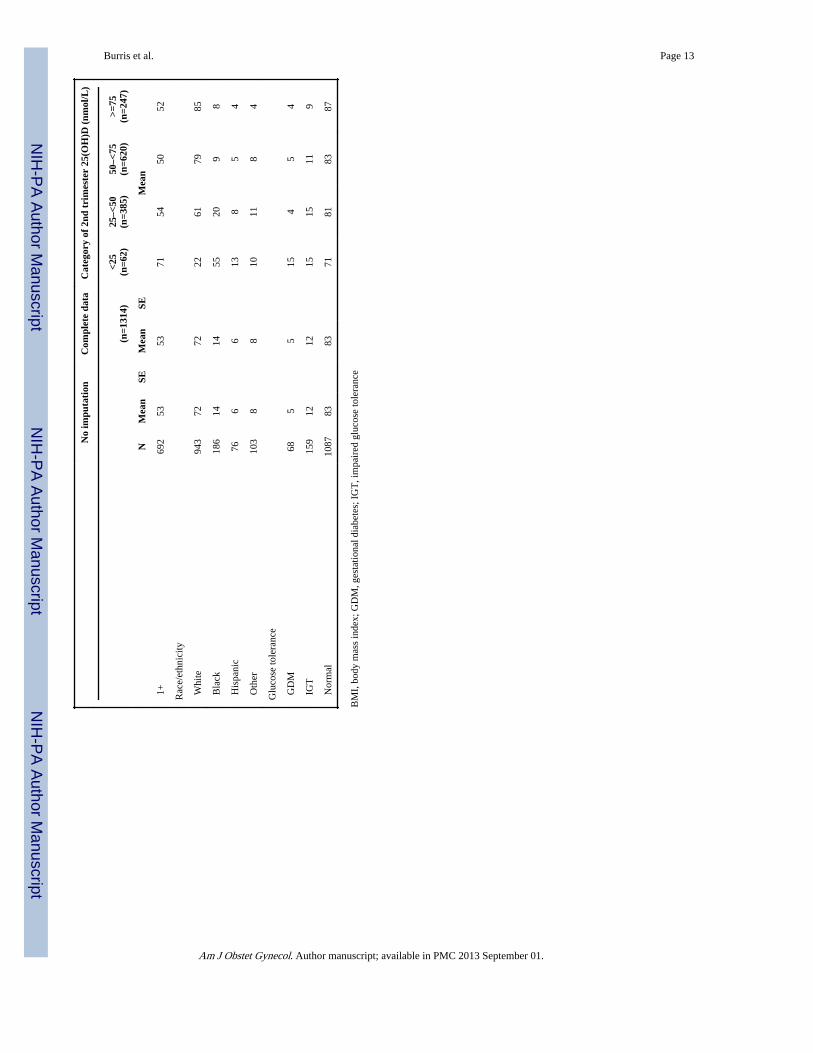
Mean [SE] 25(OH)D level was 59 [0.6] nmol/L. 25(OH)D levels were lower among womenwith higher BMI, lower pregnancy weight gain, lower vitamin D intake, and lower calciumintake (Table 1). Women with lower levels were more likely to have less than a collegeeducation, be single, be from households with <$70,000 annual income, and be non-white.Counter to our expectations, physical activity appeared to be inversely associated with25(OH)D level, with women in the lowest category (<25 nmol/) reporting 9.3 hours/week ofphysical activity versus 7.2 hours/week among women with 25(OH)D levels ≥75 nmol/L.Younger women in our cohort reported more physical activity (Pearson correlationcoefficient −0.15, P<0.001) and had lower 25(OH)D levels than older women (Pearsoncorrelation coefficient 0.15, P<0.001). We do not have data on whether physical activity wasindoor or outdoor.
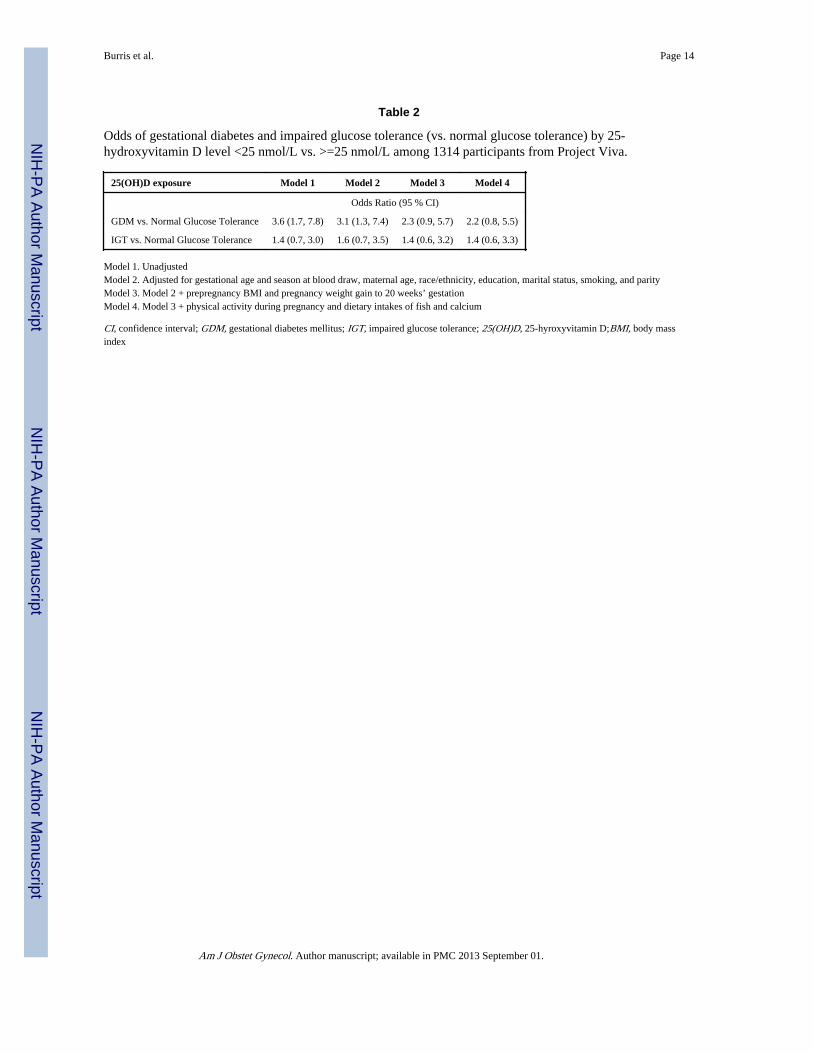
Gestational Diabetes Mellitus and Impaired Glucose ToleranceSixty-eight (5.2%) women met criteria for GDM. Unadjusted analysis revealed that womenwith 25(OH)D levels <25 vs. ≥25 nmol/L had significantly increased odds of GDM (OR 3.6,95% CI 1.7, 7.8) (Table 2). Adjustment for race/ethnicity, age, education, marital status,smoking, parity and season of blood draw made little difference to this estimate (OR 3.1,95% CI 1.3, 7.4). Additional adjustment for maternal BMI attenuated the association and theconfidence interval included the null value (OR 2.2, 95% CI 0.9, 5.6). Further adjustmentfor pregnancy weight gain made little difference (OR 2.3, 95% CI 0.9, 5.7). Addition ofphysical activity and dietary intakes of fish and calcium also made little difference (OR 2.2,95% CI 0.8, 5.5).
Burris et al. Page 4
Am J Obstet Gynecol. Author manuscript; available in PMC 2013 September 01.
NIH
-PA Author Manuscript
NIH
-PA Author Manuscript
NIH
-PA Author Manuscript

For the 159 (12.1%) women with IGT, we did not detect an association between IGT and25(OH)D level <25 vs. ≥25 nmol/L (unadjusted OR 1.4, 95% CI 0.7, 3.0; adjusted OR 1.4,95% CI 0.6, 3.3).
Blood glucose measurementsMean (SE) blood glucose after 50 gram, 1-hour oral glucose load was 114 (0.7) mg/dl.Women with 25(OH)D levels <25 vs. ≥25 nmol/L had higher glucose levels (8.1 mg/dl[95% CI 1.3, 14.9) (Table 3). Adjustment for the same covariates as the GDM analysis didnot materially change this estimate (7.2 [95% CI 0.2, 14.2]). For each 25 nmol/L decrease incontinuous 25(OH)D level, blood glucose levels were 2.7 mg/dl higher (95% CI 1.0, 4.4).Adjustment for the same covariates as the models for GDM did not materially change thisestimate (2.4 (95% CI 0.6, 4.2). With each increase in 25(OH)D category, blood glucoselevels decreased (P Trend <0.01) (Figure 2).
CommentThe association between 25(OH)D levels and GDM in the literature is not entirely clear.Farrant et al studied 559 pregnant women in India and found no association between secondtrimester 25(OH)D levels and GDM.18 However, among a subset of mothers with levels <50nmol/L, they found an inverse association between 25(OH)D levels and 30-minute glucoseconcentrations after a glucose load, a finding consistent with our results. This study did notadjust for dietary factors or physical activity. A recent study by Makgoba et al of 90 cases ofGDM and 158 controls reported no association between first trimester blood samples andsubsequent development of GDM, however, consistent with our findings, they did find aninverse correlation between 25(OH)D levels and glucose measurements after a 2-hourfasting glucose tolerance test.17 This case-control study also did not adjust for dietary factorsor physical activity which may confound the association between vitamin D status andGDM.
A few studies have found a link between low 25(OH)D level and GDM however, noneadjusted for dietary factors or physical activity. Soheilykhah et al found in a matched case-control study of 54 women with GDM and 39 women with impaired glucose tolerance (IGT)compared to 111 non-GDM control women in Iran, that maternal 25(OH)D concentrations at24–28 weeks of gestation were significantly lower than non-GDM controls.16 They foundthat 83% of GDM women had 25(OH)D levels <50 nmol/L vs. 71% of controls. Maghbooliet al found in a study of 741 women in Iran that among the 29 % of participants with25(OH)D levels <15 nmol/L, the prevalence of GDM was significantly higher compared towomen with 25(OH)D levels ≥ 35 nmol/L.13 Clifton-Bligh et al found in a study of 264women that among the 32% of women with GDM, 25(OH)D levels were significantly lowerthan among women without gestational diabetes.14 Zhang et al. found in a nested case-control study of 57 cases of GDM, that maternal 25(OH)D levels at 16 weeks’ gestationwere 20% lower among women who later developed GDM.15 Our finding of an inverseassociation between glucose and 25(OH)D concentration are consistent with these studies.
We noted a threshold phenomenon between 25(OH)D <25 nmol/L vs. ≥ 25 and the odds ofGDM but an inverse linear relationship with glucose levels obtained during the 50-gram, 1-hour glucose load screening test. Compared to women with 25(OH)D levels <25 nmol/L,women at each level (25–<50, 50–<75 and ≥75 nmol/L) had similarly decreased odds ofGDM (unadjusted odds ratios: 0.25, 0.32 and 0.20 respectively), but they had successivelylower glucose measurements with rising category of 25(OH)D (Figure 2). We recognize thatthere is continued uncertainty regarding the clinical significance of various glucose levelsafter the 1-hour glucose load screening test in the absence of a GDM diagnosis and wespeculate that the difference in the pattern of associations between 25(OH)D levels and these
Burris et al. Page 5
Am J Obstet Gynecol. Author manuscript; available in PMC 2013 September 01.
NIH
-PA Author Manuscript
NIH
-PA Author Manuscript
NIH
-PA Author Manuscript

two outcomes may be a function of the different test characteristics between the screeningand diagnostic tests. The 3-hour GTT may be more of a blunt instrument that that does notdetect subtle differences in glucose tolerance. As a post-hoc analysis, we examined theglucose measurements from the 3-hour fasting glucose tolerance test for the 194 womenwho failed the 1-hour, 50 gram glucose load screening test. At each of the time points, wedid not observe a threshold effect nor a linear relationship with 25(OH)D and glucosevalues. For example, compared to women with 25(OH)D levels ≥ 75 nmol/L, fastingglucose levels were 6.5, −0.5 and 2.2 mg/dL higher among women with 25(OH)D levels<25, 25–<50, and 50–<75 nmol/L respectively. We speculate that the absence of arelationship between blood glucose and 25(OH)D observed during the 3-hour testing may besecondary to chance given the small numbers of women who underwent this confirmatorytesting.
Our study has several strengths including a large sample size, a healthy population, and theability to account for dietary factors and physical activity. Adjustment for self-reporteddietary intakes of calcium and fish and physical activity did not materially change the higherodds of GDM among women with 25(OH)D levels <25 vs. ≥25 nmol/L suggesting vitaminD has an independent association with glucose tolerance from foods and nutrients withwhich it tracks closely. We were initially surprised by our finding that women with thelowest 25(OH)D levels reported the most physical activity during pregnancy since thisdiffers from population data in predominantly non-pregnant adults.37 This relationship waslikely confounded by age as younger women in our cohort reported more physical activity.Additionally, we did not have data on whether activity was indoor or outdoor and it wasentirely based on self-report. The significant attenuation by incorporating self-reported BMIinto models estimating the odds ratio for GDM (OR of 3.1, 95% CI 1.3, 7.4 to an OR of 2.2,95% CI 0.9, 5.6) among women with 25(OH)D levels <25 nmol/L vs ≥ 25 is likely due toconfounding. Obesity is closely associated with both GDM8, 9 and low 25(OH)Dlevels.10–12 However, while our adjusted confidence interval crossed 1, our data do noteliminate the likelihood of a persistent association between low 25(OH)D and GDM amongobese women. Additionally, we postulate that low 25(OH)D levels may be along the causalpathway between obesity and GDM. Subjects with low 25(OH)D levels can have secondaryhyperparathyroidism12 which can increase insulin resistance.38, 39 Our work raises thepossibility that obese women may benefit from vitamin D supplementation and that such anintervention might decease their risk of GDM. Randomized controlled trials are needed toconfirm this assertion.
Our study is limited by its cross-sectional design. We measured 25(OH)D levels from thesame blood draw as the screening 1-hour glucose load test. While we sampled the bloodbefore the formal diagnosis of GDM, the onset of glucose intolerance likely predates theblood draw. Thus, we cannot rule out reverse causation such as physiologic changesresulting from hyperglycemia that might lower 25(OH)D levels. We think this is unlikelybecause our results are consistent with Zhang et al. who sampled blood much earlier inpregnancy presumably prior to the onset of glucose intolerance.15 Furthermore, we think itis unlikely that patient behaviors such as dietary changes are responsible our findingsbecause we obtained 25(OH)D level prior to the patients and caregivers learning the resultsof the screening test and prior to the diagnosis of GDM. However, if reverse causation isresponsible for our findings, this could be clinically useful, as women with GDM are morelikely to have low 25(OH)D levels and may benefit from initiation of vitamin Dsupplementation for general health benefits. With regard to the potential benefits ofsupplementation on GDM, randomized trials are needed to support or refute this possibility.Lastly, we acknowledge the uncertainty among researchers about the optimal method ofmeasuring 25(OH)D levels.40, 41 We measured 25(OH)D using two established assays
Burris et al. Page 6
Am J Obstet Gynecol. Author manuscript; available in PMC 2013 September 01.
NIH
-PA Author Manuscript
NIH
-PA Author Manuscript
NIH
-PA Author Manuscript

(CLIA 23and RIA24) and used the average of the two values to estimate the 25(OH)D levelsof each participant for analysis.
In conclusion, our results suggest that second trimester 25(OH)D levels <25 vs. ≥25nmol/Lmay be associated with increased odds of GDM but not IGT, and that 25(OH)D levels wereinversely correlated with blood glucose measurement after a 1-hour, 50 gram glucose load.As maternal obesity rates increase,42 and the incidence of GDM also rises,2 it is becomingincreasingly important to understand modifiable risk factors such as vitamin D status.Ultimately, randomized controlled trials will be needed to test if vitamin D supplementaffects GDM risk and thereby leads to improved maternal and perinatal outcomes.
AcknowledgmentsThis work was funded by the NIH (R01 HD034568, R01 HD064925, K24 HL 06804) the Harvard Pilgrim HealthCare Foundation, and the Klarman Scholars Program at Beth Israel Deaconess Medical Center.
References1. Jovanovic L, Pettitt DJ. Gestational diabetes mellitus. JAMA. 2001; 286:2516–2518. [PubMed:
11722247]
2. Ferrara A, Kahn HS, Quesenberry CP, Riley C, Hedderson MM. An increase in the incidence ofgestational diabetes mellitus: Northern California, 1991–2000. Obstet Gynecol. 2004; 103:526–533.[PubMed: 14990417]
3. Kjos SL, Buchanan TA. Gestational diabetes mellitus. N Engl J Med. 1999; 341:1749–1756.[PubMed: 10580075]
4. Harlev A, Wiznitzer A. New insights on glucose pathophysiology in gestational diabetes and insulinresistance. Curr Diab Rep. 2010; 10:242–247. [PubMed: 20425589]
5. Dror DK. Vitamin D status during pregnancy: maternal, fetal, and postnatal outcomes. Curr OpinObstet Gynecol. 2011; 23:422–426. [PubMed: 21986726]
6. Pittas AG, Lau J, Hu FB, Dawson-Hughes B. The role of vitamin D and calcium in type 2 diabetes.A systematic review and meta-analysis. J Clin Endocrinol Metab. 2007; 92:2017–2029. [PubMed:17389701]
7. Ozfirat Z, Chowdhury TA. Vitamin D deficiency and type 2 diabetes. Postgrad Med J. 2010; 86:18–25. quiz 24. [PubMed: 20065337]
8. Chu SY, Callaghan WM, Kim SY, et al. Maternal obesity and risk of gestational diabetes mellitus.Diabetes Care. 2007; 30:2070–2076. [PubMed: 17416786]
9. Solomon CG, Willett WC, Carey VJ, et al. A prospective study of pregravid determinants ofgestational diabetes mellitus. JAMA. 1997; 278:1078–1083. [PubMed: 9315766]
10. Parikh SJ, Edelman M, Uwaifo GI, et al. The relationship between obesity and serum 1,25-dihydroxy vitamin D concentrations in healthy adults. J Clin Endocrinol Metab. 2004; 89:1196–1199. [PubMed: 15001609]
11. Cheng S, Massaro JM, Fox CS, et al. Adiposity, cardiometabolic risk, and vitamin D status: theFramingham Heart Study. Diabetes. 59:242–248. [PubMed: 19833894]
12. Holick MF. Vitamin D deficiency. N Engl J Med. 2007; 357:266–281. [PubMed: 17634462]
13. Maghbooli Z, Hossein-Nezhad A, Mirzaei K, et al. Association between retinol-binding protein 4concentrations and gestational diabetes mellitus and risk of developing metabolic syndrome afterpregnancy. Reprod Sci. 2009; 17:196–201. [PubMed: 19897788]
14. Clifton-Bligh RJ, McElduff P, McElduff A. Maternal vitamin D deficiency, ethnicity andgestational diabetes. Diabet Med. 2008; 25:678–684. [PubMed: 18544105]
15. Zhang C, Qiu C, Hu FB, et al. Maternal plasma 25-hydroxyvitamin D concentrations and the riskfor gestational diabetes mellitus. PLoS One. 2008; 3:e3753. [PubMed: 19015731]
16. Soheilykhah S, Mojibian M, Rashidi M, Rahimi-Saghand S, Jafari F. Maternal vitamin D status ingestational diabetes mellitus. Nutr Clin Pract. 2010; 25:524–527. [PubMed: 20962313]
Burris et al. Page 7
Am J Obstet Gynecol. Author manuscript; available in PMC 2013 September 01.
NIH
-PA Author Manuscript
NIH
-PA Author Manuscript
NIH
-PA Author Manuscript

17. Makgoba M, Nelson SM, Savvidou M, Messow CM, Nicolaides K, Sattar N. First-trimestercirculating 25-hydroxyvitamin d levels and development of gestational diabetes mellitus. DiabetesCare. 2011; 34:1091–1093. [PubMed: 21454797]
18. Farrant HJ, Krishnaveni GV, Hill JC, et al. Vitamin D insufficiency is common in Indian mothersbut is not associated with gestational diabetes or variation in newborn size. Eur J Clin Nutr. 2009;63:646–652. [PubMed: 18285809]
19. Oken E, Ning Y, Rifas-Shiman SL, Radesky JS, Rich-Edwards JW, Gillman MW. Associations ofphysical activity and inactivity before and during pregnancy with glucose tolerance. ObstetGynecol. 2006; 108:1200–1207. [PubMed: 17077243]
20. Looker AC. Do body fat and exercise modulate vitamin D status? Nutr Rev. 2007; 65:S124–S126.[PubMed: 17867388]
21. Gillman MW, Rich-Edwards JW, Rifas-Shiman SL, Lieberman ES, Kleinman KP, Lipshultz SE.Maternal age and other predictors of newborn blood pressure. J Pediatr. 2004; 144:240–245.[PubMed: 14760269]
22. Stuebe AM, Oken E, Gillman MW. Associations of diet and physical activity during pregnancywith risk for excessive gestational weight gain. Am J Obstet Gynecol. 2009; 201:58, e1–e8.[PubMed: 19467640]
23. Ersfeld DL, Rao DS, Body JJ, et al. Analytical and clinical validation of the 25 OH vitamin Dassay for the LIAISON automated analyzer. Clin Biochem. 2004; 37:867–874. [PubMed:15369717]
24. Hollis BW, Kamerud JQ, Selvaag SR, Lorenz JD, Napoli JL. Determination of vitamin D status byradioimmunoassay with an 125I-labeled tracer. Clin Chem. 1993; 39:529–533. [PubMed:8448871]
25. American Diabetes Association. Gestational diabetes mellitus. Diabetes Care. 2004; 27(Suppl1):S88–S90. [PubMed: 14693936]
26. Willett WC, Sampson L, Stampfer MJ, et al. Reproducibility and validity of a semiquantitativefood frequency questionnaire. Am J Epidemiol. 1985; 122:51–65. [PubMed: 4014201]
27. Rifas-Shiman SL, Rich-Edwards JW, Willett WC, Kleinman KP, Oken E, Gillman MW. Changesin dietary intake from the first to the second trimester of pregnancy. Paediatr Perinat Epidemiol.2006; 20:35–42. [PubMed: 16420339]
28. Willett, W. Nutritional epidemiology. New York: Oxford University Press; 1998.
29. Bischoff-Ferrari HA, Giovannucci E, Willett WC, Dietrich T, Dawson-Hughes B. Estimation ofoptimal serum concentrations of 25-hydroxyvitamin D for multiple health outcomes. Am J ClinNutr. 2006; 84:18–28. [PubMed: 16825677]
30. Ginde AA, Sullivan AF, Mansbach JM, Camargo CA Jr. Vitamin D insufficiency in pregnant andnonpregnant women of childbearing age in the United States. Am J Obstet Gynecol. 2010;202:436, e1–e8. [PubMed: 20060512]
31. Holmes VA, Barnes MS, Alexander HD, McFaul P, Wallace JM. Vitamin D deficiency andinsufficiency in pregnant women: a longitudinal study. Br J Nutr. 2009; 102:876–881. [PubMed:19331703]
32. van den Ouweland JM, Beijers AM, Demacker PN, van Daal H. Measurement of 25-OH-vitamin Din human serum using liquid chromatography tandem-mass spectrometry with comparison toradioimmunoassay and automated immunoassay. J Chromatogr B Analyt Technol Biomed LifeSci. 2010; 878:1163–1168.
33. Little, RJA.; Rubin, DB. Statistical analysis with missing dataWiley series in probability andstatistics. Hoboken, N.J.: Wiley; 2002.
34. White IR, Royston P, Wood AM. Multiple imputation using chained equations: Issues andguidance for practice. Stat Med. 2011; 30:377–399. [PubMed: 21225900]
35. van Buuren, S.; Oudshoom, CGM. Flexible multivariate imputation by MICE. Leidon: TNOPreventie en Gezonheid, TNO/PG 99.054.http://web.inter.nl.net/users/S.van.Buuren/mi/docs/rapport99054.pdfhttp://web.inter.nl.net/users/S.van.Buuren/mi/docs/rapport99054.pdf 1999.
36. Rubin, DB. Multiple imputation for nonresponse in surveysWiley classics library. Hoboken, N.J.:Wiley-Interscience; 2004.
Burris et al. Page 8
Am J Obstet Gynecol. Author manuscript; available in PMC 2013 September 01.
NIH
-PA Author Manuscript
NIH
-PA Author Manuscript
NIH
-PA Author Manuscript

37. Scragg R, Camargo CA Jr. Frequency of leisure-time physical activity and serum 25-hydroxyvitamin D levels in the US population: results from the Third National Health andNutrition Examination Survey. Am J Epidemiol. 2008; 168:577–586. discussion 587-91.[PubMed: 18579538]
38. McCarty MF, Thomas CA. PTH excess may promote weight gain by impeding catecholamine-induced lipolysis-implications for the impact of calcium, vitamin D, and alcohol on body weight.Med Hypotheses. 2003; 61:535–542. [PubMed: 14592784]
39. Alvarez JA, Ashraf AP, Hunter GR, Gower BA. Serum 25-hydroxyvitamin D and parathyroidhormone are independent determinants of whole-body insulin sensitivity in women and maycontribute to lower insulin sensitivity in African Americans. Am J Clin Nutr. 2010; 92:1344–1349.[PubMed: 20861177]
40. Ross, AC. Institute of Medicine (U.S.). Dietary reference intakes for calcium and vitamin D.Washington, DC: National Academies Press; 2011. Committee to Review Dietary ReferenceIntakes for Vitamin D and Calcium.
41. de la Hunty A, Wallace AM, Gibson S, Viljakainen H, Lamberg-Allardt C, Ashwell M. UK FoodStandards Agency Workshop Consensus Report: the choice of method for measuring 25-hydroxyvitamin D to estimate vitamin D status for the UK National Diet and Nutrition Survey. BrJ Nutr. 2010; 104:612–619. [PubMed: 20712915]
42. Aviram A, Hod M, Yogev Y. Maternal obesity: implications for pregnancy outcome and long-termrisks-a link to maternal nutrition. Int J Gynaecol Obstet. 2011; 115(Suppl 1):S6–S10. [PubMed:22099446]
Burris et al. Page 9
Am J Obstet Gynecol. Author manuscript; available in PMC 2013 September 01.
NIH
-PA Author Manuscript
NIH
-PA Author Manuscript
NIH
-PA Author Manuscript

Figure 1.Categorization of glucose tolerance based on 50 g, 1-hour, non-fasting glucose challengetest, and subsequent, fasting 100 g, 3-hour glucose tolerance test, Project Viva.
Burris et al. Page 10
Am J Obstet Gynecol. Author manuscript; available in PMC 2013 September 01.
NIH
-PA Author Manuscript
NIH
-PA Author Manuscript
NIH
-PA Author Manuscript

Figure 2.Adjusteda glucose β (95% CI) after 50g, 1-hour, GCT by 25(OH)D) category
Burris et al. Page 11
Am J Obstet Gynecol. Author manuscript; available in PMC 2013 September 01.
NIH
-PA Author Manuscript
NIH
-PA Author Manuscript
NIH
-PA Author Manuscript
NIH
-PA Author Manuscript
NIH
-PA Author Manuscript
NIH
-PA Author Manuscript
Burris et al. Page 12
Tabl
e 1
Cha
ract
eris
tics
of 1
314
part
icip
ants
in P
roje
ct V
iva,
ove
rall
and
by 2
nd tr
imes
ter
25(O
H)D
cat
egor
y
No
impu
tati
onC
ompl
ete
data
Cat
egor
y of
2nd
tri
mes
ter
25(O
H)D
(nm
ol/L
)
(n=1
314)
<25
(n=6
2)25
–<50
(n=3
85)
50–<
75(n
=620
)>=
75(n
=247
)
NM
ean
SEM
ean
SEM
ean
2nd
trim
este
r 25
(OH
)D (
nmol
/l)13
1459
0.6
590.
620
3962
90
Mat
erna
l age
at e
nrol
lmen
t (ye
ars)
1314
320.
132
0.1
3031
3333
Prep
regn
ancy
BM
I (k
g/m
2 )13
0824
.70.
124
.70.
128
.625
.824
.123
.7
Ges
tatio
nal a
ge a
t blo
od d
raw
(w
eeks
)13
1428
0.04
280.
0428
2828
28
Preg
nanc
y w
eigh
t gai
n to
20
wee
ks (
kg)
1302
5.9
0.1
5.9
0.1
4.8
5.7
6.2
5.5
Blo
od g
luco
se (
mg/
dL)
1 ho
ur a
fter
50
gram
glu
cose
load
1307
114
0.7
114
0.7
122
116
114
111
Phys
ical
act
ivity
dur
ing
preg
nanc
y (h
ours
/wee
k)10
966.
90.
27.
10.
29.
37.
56.
67.
2
Tot
al v
itam
in D
inta
ke (
IU/d
ay)
1217
547
4.8
541
4.9
373
489
571
588
Tot
al c
alci
um in
take
(m
g/d)
1217
1381
10.1
1371
10.1
1142
1250
1436
1455
Fish
inta
ke (
serv
ings
/wee
k)12
171.
60.
041.
60.
041.
81.
51.
51.
6
N%
%%
Edu
catio
n
L
ess
than
col
lege
gra
duat
e42
032
3266
3928
22
C
olle
ge g
radu
ate
888
6868
3461
7278
Mar
ital s
tatu
s
Sin
gle
917
718
105
4
Mar
ried
or
coha
bita
ting
1216
9393
8290
9596
Smok
ing
stat
us
N
ever
863
6868
7666
6868
Fo
rmer
253
2020
1019
2023
D
urin
g pr
egna
ncy
158
1212
1415
129
Hou
seho
ld in
com
e
≤$7
0,00
0/ye
ar45
738
3978
4535
31
>$7
0,00
0/ye
ar76
062
6122
5565
69
Pari
ty
062
247
4729
4650
48
Am J Obstet Gynecol. Author manuscript; available in PMC 2013 September 01.
NIH
-PA Author Manuscript
NIH
-PA Author Manuscript
NIH
-PA Author Manuscript
Burris et al. Page 13
No
impu
tati
onC
ompl
ete
data
Cat
egor
y of
2nd
tri
mes
ter
25(O
H)D
(nm
ol/L
)
(n=1
314)
<25
(n=6
2)25
–<50
(n=3
85)
50–<
75(n
=620
)>=
75(n
=247
)
NM
ean
SEM
ean
SEM
ean
1+
692
5353
7154
5052
Rac
e/et
hnic
ity
Whi
te94
372
7222
6179
85
Bla
ck18
614
1455
209
8
His
pani
c76
66
138
54
Oth
er10
38
810
118
4
Glu
cose
tole
ranc
e
GD
M68
55
154
54
IG
T15
912
1215
1511
9
Nor
mal
1087
8383
7181
8387
BM
I, b
ody
mas
s in
dex;
GD
M, g
esta
tiona
l dia
bete
s; I
GT
, im
pair
ed g
luco
se to
lera
nce
Am J Obstet Gynecol. Author manuscript; available in PMC 2013 September 01.
NIH
-PA Author Manuscript
NIH
-PA Author Manuscript
NIH
-PA Author Manuscript
Burris et al. Page 14
Table 2
Odds of gestational diabetes and impaired glucose tolerance (vs. normal glucose tolerance) by 25-hydroxyvitamin D level <25 nmol/L vs. >=25 nmol/L among 1314 participants from Project Viva.
25(OH)D exposure Model 1 Model 2 Model 3 Model 4
Odds Ratio (95 % CI)
GDM vs. Normal Glucose Tolerance 3.6 (1.7, 7.8) 3.1 (1.3, 7.4) 2.3 (0.9, 5.7) 2.2 (0.8, 5.5)
IGT vs. Normal Glucose Tolerance 1.4 (0.7, 3.0) 1.6 (0.7, 3.5) 1.4 (0.6, 3.2) 1.4 (0.6, 3.3)
Model 1. UnadjustedModel 2. Adjusted for gestational age and season at blood draw, maternal age, race/ethnicity, education, marital status, smoking, and parityModel 3. Model 2 + prepregnancy BMI and pregnancy weight gain to 20 weeks’ gestationModel 4. Model 3 + physical activity during pregnancy and dietary intakes of fish and calcium
CI, confidence interval; GDM, gestational diabetes mellitus; IGT, impaired glucose tolerance; 25(OH)D, 25-hyroxyvitamin D;BMI, body massindex
Am J Obstet Gynecol. Author manuscript; available in PMC 2013 September 01.

NIH
-PA Author Manuscript
NIH
-PA Author Manuscript
NIH
-PA Author Manuscript
Burris et al. Page 15
Table 3
Differences (beta coefficients) of blood glucose (mg/dl) after 50 gram 1-hour glucose challenge test for GDMby 25-hydroxyvitamin D level among 1314 participants from Project Viva.
25(OH)D exposure Model 1 Model 2 Model 3 Model 4
Blood glucose β (mg/dl)
Continuous 25(OH)D (per 25 nmol/L Decrease) 2.7 (1.0, 4.4) 3.2 (1.4, 5.0) 2.3 (0.6, 4.1) 2.4 (0.6, 4.2)
4-categories of 25(OH)D level (nmol/L)
<25 11.4 (4.0, 18.8) 13.5 (5.8, 21.3) 10.6 (2.8, 18.3) 10.7 (2.9, 18.5)
25–<50 5.4 (1.2, 9.6) 6.3 (2.0, 10.7) 4.6 (0.4, 8.9) 4.6 (0.3, 9.0)
50–<75 3.3 (−0.6, 7.2) 3.7 (−0.2, 7.6) 3.1 (−0.7, 7.0) 3.0 (−0.8, 6.8)
≥75 0.0 (ref) 0.0 (ref) 0.0 (ref) 0.0 (ref)
<25 v. ≥25 nmol/L 8.1 (1.3, 14.9) 9.1 (2.0, 16.1) 7.1 (0.1, 14.0) 7.2 (0.2, 14.2)
Model 1. UnadjustedModel 2. Adjusted for gestational age and season at blood draw, maternal age, race/ethnicity, education, marital status, smoking, and parityModel 3. Model 2 + prepregnancy BMI and pregnancy weight gain to 20 weeks’ gestationModel 4. Model 3 + physical activity during pregnancy and dietary intakes of fish and calcium
CI, confidence interval; GDM, gestational diabetes mellitus; 25(OH)D, 25-hyroxyvitamin D; BMI, body mass index
Am J Obstet Gynecol. Author manuscript; available in PMC 2013 September 01.