Visualization of molecular composition and functionality of cancer cells using...
8
1 2 Visualization of molecular composition and functionality 3 of cancer cells using nanoparticle-augmented 4 ultrasound-guided photoacoustics 5 Srivalleesha Mallidi Q1 a,1 , Seungsoo Kim a , Andrei Karpiouk a , Pratixa P. Joshi a , 6 Konstantin Sokolov a,c , Stanislav Emelianov a,b,c, * 7 a Department of Biomedical Engineering, University of Texas at Austin Q2 , Austin, TX 78712, United States 8 b Department of Electrical and Computer Engineering, University of Texas at Austin Q3 , Austin, TX 78712, United States 9 c Department of Imaging Physics, University of Texas M.D. Anderson Cancer Center, Houston, TX 77030, United States 10 11 12 13 1. Introduction 14 Q5 Molecular imaging techniques capable of good penetration 15 depth in living tissue remain an important challenge in basic and 16 clinical science including modern biology and medicine [1–4]. 17 Optical imaging can provide unprecedented wealth of molecular 18 specific information. However, tissue turbidity limits penetration 19 depth of light in vivo to a few hundred micrometers for high- 20 resolution imaging modalities such as confocal microscopy, optical 21 coherence tomography (OCT), or two-photon fluorescence [5–8]. 22 Approaches based on diffusely scattered light such as diffuse 23 optical tomography (DOT) can extend this limit to several 24 centimeters, but they suffer from low resolution and rely on 25 complex reconstruction algorithms that require a priori knowledge 26 of tissue optical properties. A unique solution to this problem is the 27 recently emerging photoacoustic imaging technique that combines 28 optical excitation and ultrasound detection [9–12]. This imaging 29 approach relies on ‘‘one-way’’ propagation of diffusive photons 30 into the tissue where the photoacoustic signal is generated 31 through thermal interaction of pulsed laser light with photo- 32 absorbers. Hence the contrast mechanism in photoacoustic 33 imaging is primarily related to the optical absorption properties Photoacoustics xxx (2015) xxx–xxx A R T I C L E I N F O Article history: Received 31 July 2014 Received in revised form 5 December 2014 Accepted 11 December 2014 Keywords: Photoacoustic imaging Epidermal growth factor receptor Multi-wavelength imaging Gold nanoparticles Three-dimensional imaging Molecular imaging A B S T R A C T Assessment of molecular signatures of tumors in addition to their anatomy and morphology is desired for effective diagnostic and therapeutic procedures. Development of in vivo imaging techniques that can identify and monitor molecular composition of tumors remains an important challenge in pre-clinical research and medical practice. Here we present a molecular photoacoustic imaging technique that can visualize the presence and activity of an important cancer biomarker – epidermal growth factor receptor (EGFR), utilizing the effect of plasmon resonance coupling between molecular targeted gold nanoparticles. Specifically, spectral analysis of photoacoustic images revealed profound changes in the optical absorption of systemically delivered EGFR-targeted gold nanospheres due to their molecular interactions with tumor cells overexpressing EGFR. In contrast, no changes in optical properties and, therefore, photoacoustic signal, were observed after systemic delivery of non-targeted gold nanoparticles to the tumors. The results indicate that multi-wavelength photoacoustic imaging augmented with molecularly targeted gold nanoparticles has the ability to monitor molecular specific interactions between nanoparticles and cell-surface receptors, allowing visualization of the presence and functional activity of tumor cells. Furthermore, the approach can be used for other cancer cell- surface receptors such as human epidermal growth factor receptor 2 (HER2). Therefore, ultrasound- guided molecular photoacoustic imaging can potentially aid in tumor diagnosis, selection of customized patient-specific treatment, and monitor the therapeutic progression and outcome in vivo. ß 2015 The Authors. Published by Elsevier GmbH. This is an open access article under the CC BY-NC-ND license (http://creativecommons.org/licenses/by-nc-nd/4.0/). Abbreviations: AuNPs, gold nanoparticles; EGFR, epidermal growth factor receptor; PA, photoacoustic. * Corresponding author at: Department of Q4 Biomedical Engineering, University of Texas at Austin, Austin, TX 78712, United States. Tel.: +1 512 773 2913. E-mail address: [email protected] (S. Emelianov). 1 Present address: Wellman Center for Photomedicine, 40 Blossom Street, Boston, MA 02114, United States. G Model PACS 30 1–8 Please cite this article in press as: Mallidi S, et al. Visualization of molecular composition and functionality of cancer cells using nanoparticle-augmented ultrasound-guided photoacoustics. Photoacoustics (2015), http://dx.doi.org/10.1016/j.pacs.2014.12.003 Contents lists available at ScienceDirect Photoacoustics jo ur n al ho m epag e: ww w.els evier .c om /lo cat e/pac s http://dx.doi.org/10.1016/j.pacs.2014.12.003 2213-5979/ß 2015 The Authors. Published by Elsevier GmbH. This is an open access article under the CC BY-NC-ND license (http://creativecommons.org/licenses/by-nc-nd/ 4.0/).
Transcript of Visualization of molecular composition and functionality of cancer cells using...

1
2 Visualization of molecular composition and functionality
3 of cancer cells using nanoparticle-augmented
4 ultrasound-guided photoacoustics
5 Srivalleesha MallidiQ1a,1, Seungsoo Kim a, Andrei Karpiouk a, Pratixa P. Joshi a,
6 Konstantin Sokolov a,c, Stanislav Emelianov a,b,c,*
7 aDepartment of Biomedical Engineering, University of Texas at AustinQ2 , Austin, TX 78712, United States
8 bDepartment of Electrical and Computer Engineering, University of Texas at AustinQ3 , Austin, TX 78712, United States
9 cDepartment of Imaging Physics, University of Texas M.D. Anderson Cancer Center, Houston, TX 77030, United States10
11
1213 1. Introduction
14 Q5 Molecular imaging techniques capable of good penetration
15 depth in living tissue remain an important challenge in basic and
16 clinical science including modern biology and medicine [1–4].
17 Optical imaging can provide unprecedented wealth of molecular
18 specific information. However, tissue turbidity limits penetration
19depth of light in vivo to a few hundred micrometers for high-
20resolution imaging modalities such as confocal microscopy, optical
21coherence tomography (OCT), or two-photon fluorescence [5–8].
22Approaches based on diffusely scattered light such as diffuse
23optical tomography (DOT) can extend this limit to several
24centimeters, but they suffer from low resolution and rely on
25complex reconstruction algorithms that require a priori knowledge
26of tissue optical properties. A unique solution to this problem is the
27recently emerging photoacoustic imaging technique that combines
28optical excitation and ultrasound detection [9–12]. This imaging
29approach relies on ‘‘one-way’’ propagation of diffusive photons
30into the tissue where the photoacoustic signal is generated
31through thermal interaction of pulsed laser light with photo-
32absorbers. Hence the contrast mechanism in photoacoustic
33imaging is primarily related to the optical absorption properties
Photoacoustics xxx (2015) xxx–xxx
A R T I C L E I N F O
Article history:
Received 31 July 2014
Received in revised form 5 December 2014
Accepted 11 December 2014
Keywords:
Photoacoustic imaging
Epidermal growth factor receptor
Multi-wavelength imaging
Gold nanoparticles
Three-dimensional imaging
Molecular imaging
A B S T R A C T
Assessment of molecular signatures of tumors in addition to their anatomy and morphology is desired
for effective diagnostic and therapeutic procedures. Development of in vivo imaging techniques that can
identify and monitor molecular composition of tumors remains an important challenge in pre-clinical
research and medical practice. Here we present a molecular photoacoustic imaging technique that can
visualize the presence and activity of an important cancer biomarker – epidermal growth factor receptor
(EGFR), utilizing the effect of plasmon resonance coupling between molecular targeted gold
nanoparticles. Specifically, spectral analysis of photoacoustic images revealed profound changes in
the optical absorption of systemically delivered EGFR-targeted gold nanospheres due to their molecular
interactions with tumor cells overexpressing EGFR. In contrast, no changes in optical properties and,
therefore, photoacoustic signal, were observed after systemic delivery of non-targeted gold
nanoparticles to the tumors. The results indicate that multi-wavelength photoacoustic imaging
augmented with molecularly targeted gold nanoparticles has the ability to monitor molecular specific
interactions between nanoparticles and cell-surface receptors, allowing visualization of the presence
and functional activity of tumor cells. Furthermore, the approach can be used for other cancer cell-
surface receptors such as human epidermal growth factor receptor 2 (HER2). Therefore, ultrasound-
guided molecular photoacoustic imaging can potentially aid in tumor diagnosis, selection of customized
patient-specific treatment, and monitor the therapeutic progression and outcome in vivo.
� 2015 The Authors. Published by Elsevier GmbH. This is an open access article under the CC BY-NC-ND
license (http://creativecommons.org/licenses/by-nc-nd/4.0/).
Abbreviations: AuNPs, gold nanoparticles; EGFR, epidermal growth factor receptor;
PA, photoacoustic.
* Corresponding author at: Department ofQ4 Biomedical Engineering, University of
Texas at Austin, Austin, TX 78712, United States. Tel.: +1 512 773 2913.
E-mail address: [email protected] (S. Emelianov).1 Present address: Wellman Center for Photomedicine, 40 Blossom Street, Boston,
MA 02114, United States.
G Model
PACS 30 1–8
Please cite this article in press as: Mallidi S, et al. Visualization of molecular composition and functionality of cancer cells using
nanoparticle-augmented ultrasound-guided photoacoustics. Photoacoustics (2015), http://dx.doi.org/10.1016/j.pacs.2014.12.003
Contents lists available at ScienceDirect
Photoacoustics
jo ur n al ho m epag e: ww w.els evier . c om / lo cat e/pac s
http://dx.doi.org/10.1016/j.pacs.2014.12.003
2213-5979/� 2015 The Authors. Published by Elsevier GmbH. This is an open access article under the CC BY-NC-ND license (http://creativecommons.org/licenses/by-nc-nd/
4.0/).
34 of the tissue being imaged. Beyond the depth of ballistic photons,
35 the spatial resolution of photoacoustic imaging is determined
36 by the ability of the ultrasound transducer to resolve the three-
37 dimensional distribution of photoabsorbers that generate photo-
38 acoustic transient waves. Photoacoustic imaging can visualize
39 optical absorption properties of tissue at sufficient depth, and
40 salient features of photoacoustic imaging are described in several
41 reviews in recent years [9–15]. Furthermore, a synergistic
42 integration of photoacoustic imaging with clinically available
43 ultrasound imaging systems is also possible and is being pursed
44 [9–12].
45 Endogenous contrast in photoacoustic imaging is largely
46 limited to hemoglobin and melanin molecules. In other applica-
47 tions, detection of lipid and collagen is possible with photoacoustic
48 imaging [13,16–18]. Detection of other biomarkers or functionality
49 associated with tumors requires availability of molecular probes or
50 molecular specific contrast agents targeted to these biomarkers
51 [14,15,19,20]. Plasmonic gold and silver nanoparticles are ideally
52 suited for photoacoustics because of their high absorption cross-
53 sections [10,11,20]. Molecular specificity is conferred to these
54 plasmonic nanoparticles via conjugation to probe molecules such
55 as antibodies [21,22]. However, the sole addition of a targeting
56 moiety is often not sufficient for sensitive molecular imaging
57 because of the background signal generated by the non-specific
58 delivery of contrast agents to the imaging site. In cancer imaging,
59 non-specific delivery of contrast agents is related to leaky
60 vasculature of the tumor i.e., contrast agents accumulate in the
61 tumor site primarily due to the enhanced permeability and
62 retention (EPR) effect. As done in immunohistological protocols,
63 extensive blocking and washing steps cannot be applied in vivo to
64 remove non-specific binding. Multiple innovative strategies have
65 been developed to enable highly specific molecular imaging – for
66 example, in fluorescence imaging, various activatable probes
67 and beacons are used to provide signal only in the presence of a
68 biomarker of interest or detect a change in the signal on a cue from
69 the tumor micro-environment [23–25]. However, again, most of
70 these approaches are limited to optical modalities that do not
71 possess sufficient penetration depth in vivo.
72 We and other groups have previously showed that targeted
73 plasmonic nanoparticles by themselves can be used in a similar
74 way as activatable contrast agents in molecular optical imaging
75 [10,14,15,19,20,26–28]. The approach is based on the phenomenon
76 of plasmon resonance coupling between closely spaced noble
77 metal nanoparticles [26,27,29,30]. The coupling results in strong
78 optical changes including red spectral shift and broadening of
79 nanoparticle extinction spectra [21,26,27,29–31]. The formation of
80 closely spaced assemblies can be mediated by specific interactions
81 between targeted gold nanoparticles and a biomolecule of interest
82 such as a cancer biomarker, e.g. epidermal growth factor receptor
83 (EGFR) [31]. Confocal reflectance and dark-field optical imaging of
84 EGFR positive cancer cells labeled with anti-EGFR antibody
85 conjugated spherical gold nanoparticles showed a red shift of
86 more than 100 nm in nanoparticle plasmon resonance frequency
87 [27,31]. Further studies revealed that the observed optical changes
88 are associated with EGFR activation and trafficking – key signaling
89 pathways that determine cell behavior in normal and cancerous
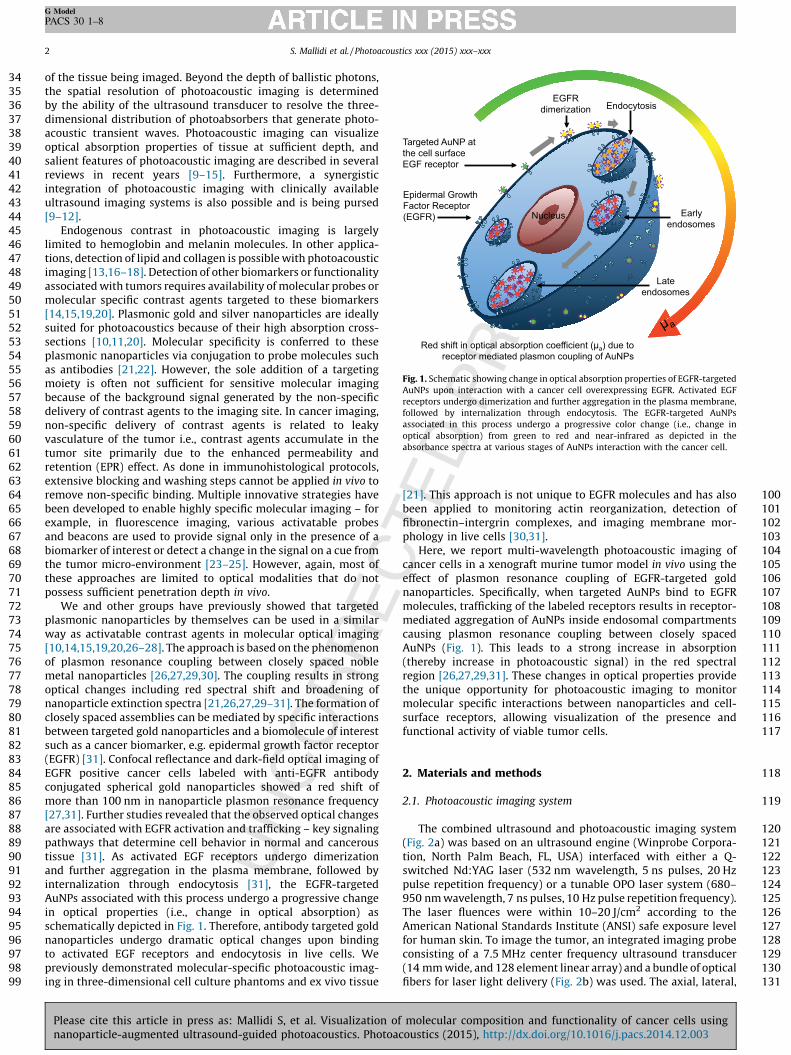
90 tissue [31]. As activated EGF receptors undergo dimerization
91 and further aggregation in the plasma membrane, followed by
92 internalization through endocytosis [31], the EGFR-targeted
93 AuNPs associated with this process undergo a progressive change
94 in optical properties (i.e., change in optical absorption) as
95 schematically depicted in Fig. 1. Therefore, antibody targeted gold
96 nanoparticles undergo dramatic optical changes upon binding
97 to activated EGF receptors and endocytosis in live cells. We
98 previously demonstrated molecular-specific photoacoustic imag-
99 ing in three-dimensional cell culture phantoms and ex vivo tissue
100[21]. This approach is not unique to EGFR molecules and has also
101been applied to monitoring actin reorganization, detection of
102fibronectin–intergrin complexes, and imaging membrane mor-
103phology in live cells [30,31].
104Here, we report multi-wavelength photoacoustic imaging of
105cancer cells in a xenograft murine tumor model in vivo using the
106effect of plasmon resonance coupling of EGFR-targeted gold
107nanoparticles. Specifically, when targeted AuNPs bind to EGFR
108molecules, trafficking of the labeled receptors results in receptor-
109mediated aggregation of AuNPs inside endosomal compartments
110causing plasmon resonance coupling between closely spaced
111AuNPs (Fig. 1). This leads to a strong increase in absorption
112(thereby increase in photoacoustic signal) in the red spectral
113region [26,27,29,31]. These changes in optical properties provide
114the unique opportunity for photoacoustic imaging to monitor
115molecular specific interactions between nanoparticles and cell-
116surface receptors, allowing visualization of the presence and
117functional activity of viable tumor cells.
1182. Materials and methods
1192.1. Photoacoustic imaging system
120The combined ultrasound and photoacoustic imaging system
121(Fig. 2a) was based on an ultrasound engine (Winprobe Corpora-
122tion, North Palm Beach, FL, USA) interfaced with either a Q-
123switched Nd:YAG laser (532 nm wavelength, 5 ns pulses, 20 Hz
124pulse repetition frequency) or a tunable OPO laser system (680–
125950 nm wavelength, 7 ns pulses, 10 Hz pulse repetition frequency).
126The laser fluences were within 10–20 J/cm2 according to the
127American National Standards Institute (ANSI) safe exposure level
128for human skin. To image the tumor, an integrated imaging probe
129consisting of a 7.5 MHz center frequency ultrasound transducer
130(14 mm wide, and 128 element linear array) and a bundle of optical
131fibers for laser light delivery (Fig. 2b) was used. The axial, lateral,
Targeted AuNP at
the cell surface
EGF receptor
Nucleus
Late
endosomes
EGFR
dimerization Endocytosis
Early
endosomes
Epidermal Growth
Factor Receptor
(EGFR)
Red shift in optical absorption coefficient ( µa) due to
receptor mediated plasmon coupling of AuNPs
µ a
Fig. 1. Schematic showing change in optical absorption properties of EGFR-targeted
AuNPs upon interaction with a cancer cell overexpressing EGFR. Activated EGF
receptors undergo dimerization and further aggregation in the plasma membrane,
followed by internalization through endocytosis. The EGFR-targeted AuNPs
associated in this process undergo a progressive color change (i.e., change in
optical absorption) from green to red and near-infrared as depicted in the
absorbance spectra at various stages of AuNPs interaction with the cancer cell.
S. Mallidi et al. / Photoacoustics xxx (2015) xxx–xxx2
G Model
PACS 30 1–8
Please cite this article in press as: Mallidi S, et al. Visualization of molecular composition and functionality of cancer cells using
nanoparticle-augmented ultrasound-guided photoacoustics. Photoacoustics (2015), http://dx.doi.org/10.1016/j.pacs.2014.12.003

132 and elevational resolution of the transducer are 250, 300, and
133 500 mm, respectively.
134 The integrated probe was attached to a three-dimensional
135 positioning stage to facilitate volumetric ultrasound and photo-
136 acoustic imaging by moving the probe in steps of 400 mm in
137 horizontal direction (orthogonal to the imaging plane). The light
138 source, ultrasound imaging system and the positioning axes were
139 interfaced to capture spatially co-registered RF ultrasound and
140 photoacoustic data as described elsewhere [32]. Ultrasound and
141 multi-wavelength photoacoustic RF data were acquired at each
142 position of the integrated probe and stored for off-line processing.
143 2.2. Multi-wavelength photoacoustic image analysis
144 The collected RF data is beamformed using delay-and-sum
145 approach as published previously. The absolute values of the
146 photoacoustic analytic signals obtained at various wavelengths
147 were normalized to compensate for the wavelength dependent
148 laser fluence output. The multi-wavelength photoacoustic images
149 were analyzed using intraclass correlation to identify regions of
150 oxygenated/deoxygenated blood and nanoparticles [28]. Intraclass
151 correlation is a method used in assessing agreement between
152 different observers or different methods when used on the same
153 set of subjects. The normalized spectrum of the photoacoustic
154 signal at a pixel was compared individually to the known spectra of
155 endocytosed nanoparticles [21] (Fig. 3) and oxygenated/deoxy-
156 genated hemoglobin [33]. The procedure is repeated for every pixel
157 in the multi-wavelength photoacoustic image stack, and the
158 resulting correlation coefficients were used to form an image. To
159 obtain the spatial distribution of endocytosed nanoparticles,
160 oxygenated blood, and deoxygenated blood, the correlation maps
161 were thresholded (correlation coefficient greater than 0.75 were
162 considered positive) and pseudocolored orange, red and blue for
163 endocytosed AuNPs, oxygenated hemoglobin, and deoxygenated
164hemoglobin, respectively. The distribution map was displayed over
165the ultrasound image i.e., ultrasonic image was displayed if the
166correlation-based signal was smaller than a user-defined threshold
167or vice versa.
1682.3. Preparation of bioconjugated AuNPs
169Gold nanoparticles (20 nm in diameter) were prepared using
170citrate reduction of tetrachloroauric (III) acid (HAuCl4) under reflux
171(Frens method). TEM image of the nanoparticles is shown in Fig. 3
172inset. Anti-EGFR monoclonal antibody (C225, Sigma) was conju-
173gated to the AuNPs using procedure described by Kumar et al. [30].
174Briefly, the carbohydrate moiety on the Fc region of the antibody
175(Ab) was oxidized to an aldehyde by addition of 100 mM NaIO4 to a
1761 mg/mL Ab solution in HEPES (1:10 by volume). The Ab was then
177allowed to react with a hydrazide PEG di-thiol heterobifunctional
178linker (Sensopath Technologies, Inc.), where the hydrazide portion
179of the linker covalently bonded to the aldehyde portion of the Ab,
180yielding an exposed di-thiol moiety which could react strongly
181with the AuNPs. The Ab-linker was centrifuged in a 100 kD MWCO
182filter (Amicon) and resuspended in 40 mM HEPES at pH 8 (5 mg/
183mL). The Ab-linker was mixed with AuNPs (12 mL, 4 � 1010 par-
184particles/mL) at a 1:1 volume ratio and reacted on a shaker for
18530 min at room temperature. Any remaining bare gold was capped
186with mPEG-SH (1.2 mL, 10�5 M, 5 kD, Creative PEGWorks) and the
187particles were washed via centrifugation at 1500 g in the presence
188of PEG (15 kD, Sigma). The non-targeted AuNPs were prepared by
189reacting AuNPs (12 mL, 4 � 1010 particles/mL) with mPEG-SH
190(1.2 mL, 10�5 M, 5 kD, Creative PEGWorks). The resulting PEGy-
191lated particles were also washed in the presence of PEG via
192centrifugation at 1500 g. Both the EGFR-targeted and non-targeted
193(PEGylated) AuNPs were sterile filtered before being administered
194to the nude mice. The molecular specificity of the EGFR-targeted
195AuNPs was also tested with cells possessing positive expression of
196EGFR (A431 cells) using previously published protocols [21]. The
197absorbance spectra of the A431 cells incubated 30 min with non-
198targeted AuNPs or EGFR-targeted AuNPs are shown in Fig. 3. The
199cells mixed with PEGylated AuNPs have an absorbance peak
200around 520 nm similar to a suspension of isolated gold nanopar-
201ticles. The absorbance of cells incubated with EGFR-targeted
202AuNPs has the peak red-shifted and broadened due to EGFR-
203mediated aggregation of gold nanoparticles [21]. These absorbance
204spectra were used as a guideline in multi-wavelength photo-
205acoustic image analysis. Approximately 250 mL of nanoparticle
Fig. 2. (a) The schematic of the combined ultrasound and photoacoustic imaging
system used in this study. (b) Custom designed water-tank with optical window to
allow ultrasound and photoacoustic imaging of subcutaneous tumors in mice. The
optical fibers required for light delivery were attached to the ultrasound transducer
to sequentially obtain ultrasound and photoacoustic images at the same tumor
cross-section.
Fig. 3. The absorbance spectra of the A431 cells incubated for 30 min with
PEGylated AuNPs or EGFR-targeted AuNPs. The inset shows TEM image of
PEGylated AuNPs (�20 nm in diameter).
S. Mallidi et al. / Photoacoustics xxx (2015) xxx–xxx 3
G Model
PACS 30 1–8
Please cite this article in press as: Mallidi S, et al. Visualization of molecular composition and functionality of cancer cells using
nanoparticle-augmented ultrasound-guided photoacoustics. Photoacoustics (2015), http://dx.doi.org/10.1016/j.pacs.2014.12.003

206 solution consisting about 500 mg of gold was injected directly into
207 the tumor region using a 27 gauge needle or injected into the
208 mouse blood stream using a tail vein catheter (MTV01, SAI Infusion
209 Technologies).
210 2.4. Murine tumor models
211 The tumors were inoculated in immunodeficient, albino colored
212 female Nu/Nu mice. The mice were anesthetized with an
213 intraperitoneal injection of Avertin (0.4–0.75 mg per gram of body
214 weight). Either human epithelial carcinoma cell line (A431 cell line)
215 or human breast cancer cell line (MDA-MB-435 cell line) were
216 utilized in our experiments. Approximately 4–5 � 106 cells sus-
217 pended in 300mL of phosphate buffered saline was injected
218 subcutaneously in the flank of the mice. The tumors were inoculated
219 on the lower peripheral region of the mouse to cause minimal tissue
220 motion due to cardiac and respiratory cycle of the mouse during
221 the in vivo imaging procedures. The animal facility was maintained
222 under a 12-hr light/dark cycle at a temperature of 20–22 8C and a
223 relative humidity of 20–50%. The weight of the mice and the tumor
224 size were monitored until the tumors were approximately0.6–1 cm
225 in diameter (approximately 3 weeks post implantation). All methods
226 used in this study were approved by the Animal Care and Use
227 Committee at the University of Texas at Austin. Each experimental
228 group in this study had at least 3 mice.
229 During the imaging procedures, the mouse was anesthetized
230 using isoflurane gas. Isoflurane was chosen due to its less toxic
231 nature on the mouse’s metabolism. Specifically a dose of 1%
232 isoflurane mixed with pure oxygen at a 1 L/min flow rate was used.
233 The body temperature of the animal was maintained at 37 8C using
234 a heating pad (THM 100, Indus Instruments). The heart rate of the
235 mouse was monitored every 15 min during the imaging procedure
236 to ensure well-being. A commercially available ultrasound gel
237 (Aquasonic Gel, Parker Laboratories) was applied to the tumor
238 region to establish contact between the mouse skin and flexible
239 window (polyethylene film) at the bottom of a custom-built water
240 tank (Fig. 2b). The transducer with the fiber bundle was placed in
241 the water tank to facilitate in vivo imaging.
2422.5. Histological analysis details
243The tumors were extracted after euthanizing the mice via
244approved protocols. The tumors were stored in formalin for 24 h
245and transferred to 70% ethanol for storage until tissue processing.
246The tumors were placed in paraffin cassettes for immunohis-
247tochemistry in a similar orientation as the imaging cross-section to
248facilitate qualitative comparison of ultrasound and photoacoustic
249images with histology images. The hematoxylin and eosin stain
250(H&E stain) was performed to identify the tissue structure. The
251hematoxylin colors basophilic structures (such as the cell nucleus),
252and the eosin dye colors eosinophilic structures (intracellular or
253extracellular protein such as cytoplasm) bright pink. Silver staining
254procedure [34] was utilized to identify the presence of AuNPs in
255the tumor tissue. When AuNP labeled tissue are silver stained, the
256produced bimetallic nanoparticles can be easily observed using
257bright field microscopy even in the presence of standard
258histological stains. A counter stain using nuclear fast red was
259performed to enhance contrast between the AuNPs and the tissue
260when observed under a brightfield microscope.
2613. Results and discussion
262In the first set of mice the molecular-specific nanoparticles were
263injected directly to the tumor region to evaluate if photoacoustic
264imaging (Fig. 4) can monitor interactions between tumor cells
265and AuNPs. Mice with subcutaneous tumors formed using EGFR
266expressing A431 human keratinocytes were injected with either
267EGFR-targeted AuNPs or PEGylated AuNPs directly into the tumors.
268Ultrasound and multi-wavelength photoacoustic imaging of the
269central cross-section of the tumor was performed before and
270immediately after intratumoral injection. In addition, 3D images
271were acquired at 2 h and 4 h after intratumoral injection of the
272nanoparticles.
273Ultrasound images show mouse skin as a hyperechoic region
274within the tumor region demarcated by a white inset in Fig. 4a
275and d. The corresponding photoacoustic images (obtained at
276720 nm wavelength illumination, i.e., away from the �520 nm
Fig. 4. Ultrasound and photoacoustic images of EGFR-positive A431 tumors directly injected with either (a–c) PEGylated or (d–f) EGFR-targeted AuNPs. (g) The photoacoustic
signal (obtained at 720 nm wavelength illumination) from the tumor region is plotted as a function of time (n = 3 mice per group). No significant (p-value > 0.05) increase in
the photoacoustic signal was observed when tumors were injected with PEGylated AuNPs. However the photoacoustic signal increased over time after injection of EGFR-
targeted AuNPs indicating nano-molecular interactions between the nanoparticles and the cancer cells resulting in a plasmon resonance coupling of the AuNPs. The scale bar
represents 5 mm.
S. Mallidi et al. / Photoacoustics xxx (2015) xxx–xxx4
G Model
PACS 30 1–8
Please cite this article in press as: Mallidi S, et al. Visualization of molecular composition and functionality of cancer cells using
nanoparticle-augmented ultrasound-guided photoacoustics. Photoacoustics (2015), http://dx.doi.org/10.1016/j.pacs.2014.12.003

277 peak absorption of individual gold nanospheres) of tumors injected
278 with either PEGylated AuNPs or EGFR-targeted AuNPs are shown
279 in Fig. 4c and f, respectively. Clearly the tumor injected with EGFR-
280 targeted AuNPs show an increase in the photoacoustic signal at
281 720 nm (Fig. 4f) whereas no increase in the photoacoustic signal
282 was observed in the tumor injected with PEGylated AuNPs (Fig. 4c).
283 This change in the photoacoustic signal is due to the molecular
284 interactions of EGFR-targeted AuNPs with EGFR overexpressing
285 tumor cells (Fig. 4f). No change in the photoacoustic signal was
286 observed in the tumor injected with PEGylated AuNPs (i.e., no
287 increase while background signal remains the same over time).
288 Given that the non-targeted nanoparticles do not interact with
289 cancer cells, there is no receptor-mediated endocytosis and,
290 therefore, no plasmon coupling and no red-shift in the optical
291 absorption of the PEGylated AuNPs in the tissue was observed.
292 Quantitative analysis of the temporal changes in the photoacoustic
293 signals indicate a clear enhancement at 720 nm in the tumor
294 injected with EGFR-targeted AuNPs (Fig. 4g). The photoacoustic
295 signal amplitude was normalized with respect to the photo-
296 acoustic signal obtained at 532 nm irradiation to compensate for
297 possible differences in the AuNPs concentration in the imaging
298 planes. Furthermore, the photoacoustic signal from tumor injected
299 with EGFR-targeted AuNPs increased as a function of time (Fig. 4g)
300 due to the continuous trafficking of EGFR-targeted AuNPs from the
301 cell membrane to early endosomes and later to late endosomes/
302 multivesicular bodies resulting in a time-dependent red shift in
303 optical properties of AuNPs [31]. In contrast, the tumor injected
304 with PEGylated AuNPs showed insignificant temporal change in
305 the photoacoustic signal from the tumor region. The results
306 presented in Fig. 4 suggest that the combined ultrasound and
307photoacoustic imaging has the ability to monitor molecular
308interactions of epidermal growth factor receptor (EGFR) with
309molecular-specific AuNPs.
310In the next series of experiments we validated our imaging
311approach using an intravenous administration of AuNPs in three
312groups of mice (Fig. 5). The first and the second group had EGFR-
313positive A431 tumors. The third group was inoculated with EGFR-
314negative breast adenocarcinoma MDA-MB-435 cell line. The first
315and the third group were injected with EGFR-targeted AuNPs. In
316the second group PEGylated AuNPs were administered at the
317concentration two times higher than that used in the other two
318groups. Ultrasound and multi-wavelength photoacoustic images of
319tumor regions were acquired at the same spatial locations before
320and up to 4 h after administration of AuNPs. Multi-wavelength
321photoacoustic images were analyzed to identify regions containing
322endocytosed nanoparticles, oxygenated blood, and deoxygenated
323blood [28].
324In all animals (Figs. 6 and 7), the tumor region was easily
325identified in ultrasound images. Typically, the subcutaneous tumor
326appears as a hyperechoic region (skin, top of the image) with a
327hypoechoic area denoting the tumor. In the first group of mice
328with EGFR-positive tumor and injected with molecular-specific
329AuNPs, photoacoustic images obtained at 720 nm excitation (Fig. 6a)
330clearly indicate an increase in the photoacoustic signal over time
331after administration of EGFR-targeted AuNPs. Similar to results
332shown in Fig. 4, the photoacoustic images in Fig. 6a show an increase
333of the photoacoustic signal amplitude over time and, therefore,
334indicate both successful delivery of the nanoparticles and their
335receptor-mediated interaction with cancer cells. To identify regions
336associated with either endogenous (oxy/deoxy-hemoglobin) or
Fig. 5. In this study three groups of mice were used. The first and the second group of mice had xenografts of A431 cells that overexpress EGFR. The third group of mice, serving
as a control, was inoculated using EGFR-negative MDA-MB-435 cells. The first and the third groups were injected with EGFR-targeted AuNPs. PEGylated AuNPs were
administered to the second group. Over time, nanoparticles extravasated into the tumor via the leaky tumor vasculature. Despite significant accumulation of AuNPs in tumor
region, no plasmon coupling effect was observed in the tumors from the second and third group. On the other hand, EGFR-targeted AuNPs underwent receptor-mediated
aggregation in tumors belonging to the first group of mice. The receptor-mediated aggregation resulted in a strong red-shift in the optical absorption properties of AuNPs.
S. Mallidi et al. / Photoacoustics xxx (2015) xxx–xxx 5
G Model
PACS 30 1–8
Please cite this article in press as: Mallidi S, et al. Visualization of molecular composition and functionality of cancer cells using
nanoparticle-augmented ultrasound-guided photoacoustics. Photoacoustics (2015), http://dx.doi.org/10.1016/j.pacs.2014.12.003

337 exogenous (endocytosed nanoparticles) chromophores, spectro-
338 scopic photoacoustic imaging was carried out (Fig. 6b). The images
339 show a heterogeneous distribution of AuNPs in the tumor region
340 that correlated well with viable tumor regions identified in the
341adjacent H&E stained tissue slices (Fig. 6c). Indeed, the central tumor
342regions were necrotic (e.g., area outlined by white square in Fig. 6c)
343while the peripheral areas of the tumor contained viable cells (e.g.,
344area outlined by yellow square in Fig. 6c). Silver stain of gold
Fig. 6. (a) Ultrasound images shown in grayscale overlaid with photoacoustic images obtained at 720 nm before and after I.V. administration of EGFR-targeted AuNPs in
mouse with A431 EGFR expressing tumor (Group 1). (b) Multi-wavelength photoacoustic images are pseudo-colored to show oxygenated areas in red, deoxygenated areas in
blue, and molecular specific interactions between Au NPs and cancer cells in orange. H&E stain (c) and Silver stain (d) of tumor section taken at the imaging cross-section after
injection of AuNPs Dark regions in the silver stained section showthe presence of AuNPs. There is a clear time-dependent increase in the photoacoustic signal at 720 nm after I.V
injection of EGFR-targeted AuNPs indicating receptor-mediated aggregation of AuNPs in cellular endosomes. The aggregation leads to plasmon resonance coupling between
AuNPs that results in a red-shift in optical absorption of the nanoparticles. As photoacoustic signal is proportional to optical absorption of the tissue, a time-dependent increase in
photoacoustic signal is observed due to the plasmon resonance coupling effect. 3-D Ultrasound (grayscale) and overlaid photoacoustic images (red scale) of an EGFR-expressing
tumor (e) before and (f) 4 hafter administration of EGFR-targeted gold nanoparticles. The bounding box represents a 12 mm � 12 mm � 13.3 mm field of view. A heterogeneous
distribution of the PA signal associated with receptor-mediated endocytosis of AuNPs in the tumor is clearly visible in (f).
Fig. 7. Ultrasound images are shown in grayscale. Multi-wavelength photoacoustic images are pseudo-colored to show oxygenated areas in red, deoxygenated areas in blue,
and aggregated Au NPs in orange. The histology sections of the tumors are taken approximately near the imaging cross-section. Dark regions in silver stained sections show
presence of AuNPs. The data in (a and b) represent the results obtained for Group 3 mice (MDA-MB-435 tumor, EGFR-targeted AuNPs) and in (c and d) from Group 2 mice (A31
tumors, PEGylated AuNPs). Despite significant accumulation of AuNPs in the tumors, there were no detectable photoacoustic signals at 720 nm due to lack of interactions
between the AuNPs and the cancer cells.
S. Mallidi et al. / Photoacoustics xxx (2015) xxx–xxx6
G Model
PACS 30 1–8
Please cite this article in press as: Mallidi S, et al. Visualization of molecular composition and functionality of cancer cells using
nanoparticle-augmented ultrasound-guided photoacoustics. Photoacoustics (2015), http://dx.doi.org/10.1016/j.pacs.2014.12.003

345 nanoparticles in tissue slices showed that nanoparticles were
346 present within the entire tumor region (Fig. 6d). However, the
347 observed increase in the photoacoustic signal was localized only to
348 the viable regions of the tumor. This result indicates sensitivity of
349 our method toward the presence of functional EGFR-expressing
350 tumor cells. Fig. 6e and f shows a 3D ultrasound and spectroscopic
351 photoacoustic images of the tumor from an animal in the first group
352 before and 4 h after intravenous injection of EGFR-targeted AuNPs
353 respectively. These 3D images clearly demonstrate that AuNPs
354 did not have a homogeneous distribution in the tumor. The 3D
355 photoacoustic images visualized in context of the anatomical
356 structure of tumor provide us with the functional map of the viable
357 EGFR expressing tumor cells that interacted with the injected
358 molecular specific contrast agent. In this particular tumor, the viable
359 regions are located mostly at the tumor periphery while the necrotic
360 core or the central region of the tumor did not have a detectable PA
361 signal. No increase in the photoacoustic signal at NIR wavelengths
362 was observed in the other two groups after AuNP administration.
363 Spectroscopic photoacoustic images (Fig. 7a and c) do not indicate
364 the presence of endocytosed nanoparticles despite the accumulation
365 of AuNPs in the tumor as shown by silver staining of tissue sections
366 (Fig. 7b and d). The mice in the second group had the EGFR-positive
367 tumor, and the animals were injected with nonspecific PEGylated
368 AuNPs. Consequently, there were no molecular/cellular interactions
369 between PEGylated nanoparticles and tumor cells, and the 720-nm
370 photoacoustic images did not show an increase in photoacoustic
371 response in spite of injecting double the amount of AuNPs in the
372 second group. Finally, the third group of mice had tumors that did
373 not have EGFR expression, and the injected EGFR-targeted AuNPs
374 just extravasated into the tumor but did not undergo any nano-
375 molecular interactions with tumor cells. Therefore, there was no
376 plasmon resonance coupling between the nanoparticles and no
377 change in the photoacoustic signal at 720 nm. The results presented
378 in Figs. 6 and 7 clearly indicate molecular specificity of EGFR-
379 targeted AuNPs and the ability of photoacoustic imaging to visualize
380 depth-resolved nano-molecular interactions in vivo.
381 To further quantify these results, the photoacoustic signals
382 obtained at 720 nm wavelength illumination in the viable and
383 necrotic regions of the tumor were compared at various time
384 points before and after injection of AuNPs (Fig. 8). In each case, to
385 compensate for the difference in AuNPs uptake between the tumors,
386 720-nm photoacoustic signals were normalized with photoacoustic
387 signals obtained at 532 nm. Clearly, in the first group (Fig. 8a), the
388 photoacoustic signal in the viable cell region of the tumors increased
389 over time indicating delivery and receptor-mediated interaction
390 of targeted nanoparticles with cancer cells. On the other hand, the
391 necrotic region of the same tumors did not have an increase in
392 the photoacoustic contrast at 720 nm. In groups 2 and 3 (Fig. 8b and
393c), the photoacoustic signal did not increase over time in either the
394viable or necrotic regions of the tumors (p-value >0.05).
395Plasmonic nanoparticles with different optical absorption
396properties can be conjugated to various cancer specific biomarkers
397such as growth factor receptors and integrins [22,35]. The
398ultrasound-guided spectroscopic photoacoustic imaging could
399be used to image the multiplex labeling and interactions of
400nanoparticles with cancer cells in vivo [28]. Identification of the
401molecular basis of tumor dissemination is driving drug develop-
402ment to discover or synthesize inhibitors that block key pathways
403in this process. Ultrasound-guided photoacoustic imaging can aid
404in understanding the molecular signature of cancers, thus guiding
405implementation of specific therapeutic procedures specific to a
406particular tumor. Furthermore, studies have shown that AuNPs are
407promising phototherapeutic agents. Using our imaging technique,
408guidance and monitoring of photothermal therapeutic procedures
409could also be feasible [32,36,37].
4104. Conclusion
411We demonstrated that molecular targeted AuNPs and spectro-
412scopic photoacoustic imaging has the potential to detect cancer
413cells in vivo based on their molecular functionality. In particular,
414EGFR-targeted AuNPs underwent molecular-specific endocytosis
415leading to plasmon resonance coupling. The phenomena resulted
416in an increase in optical absorption of AuNPs in the NIR region
417and hence an increase in the photoacoustic signal. We evaluated
418feasibility of photoacoustic imaging in detection of plasmon
419resonance coupling of targeted AuNPs in tumors expressing EGFR.
420Multi-wavelength photoacoustic images obtained before and after
421intravenous injection of EGFR-targeted AuNPs clearly showed a
422significant increase in red-NIR absorption of the tumor region due
423to formation of AuNP Q6aggregates. Furthermore, we demonstrated
4243D capabilities of the imaging system in obtaining molecular
425signatures of tumor cells.
426Conflict of interest statement
427The authors state no conflict of interest.
428Acknowledgments
429Partial support from the Q7National Institutes of Health under
430grants EB008101 and CA149740 is gratefully acknowledged. The
431authors would also like to thank the Animal Resource Center at the
432University of Texas at Austin, the Histology facility at the Research
433Park at University of Texas Smithville and Ms. Kelsey Kubelick for
434proof reading the manuscript.
MDA-MB-435 Tumor EGFR targeted AuNPs
A431 Tumor PEGylated AuNPs
0
20
40
60
Viable Necrotic
Re
lative
ch
an
ge
in
PA
sig
na
l
0
20
40
60
Viable Necrotic
Re
lative
ch
an
ge
in
PA
sig
na
l
0
20
40
60
Viable Necrotic
30 min 2 hours 4 hours
Re
lative
ch
an
ge
in
PA
sig
na
l **
*
(a) (b) (c)
A431 Tumor EGFR targeted AuNPs
Fig. 8. The graphs depicting change in PA signal at 720 nm relative to the photoacoustic signal at 532 nm at 30 min (blue bars), 2 h (red bars), and 4 h (green bars) post I.V
injection of AuNPs. The data are summarized from (a) Group 1 mice (A431 tumors, EGFR-targeted AuNPs), (b) Group 2 mice (A431 tumors, PEGylated AuNPs) and (c) Group 3
mice (MDA-MB-435 tumor, EGFR-targeted AuNPs). Only viable regions in Group 1 mice showed an increase in PA signal at 720 nm that is associated with receptor-mediated
plasmon resonance coupling of AuNPs. The error bars indicate S.E.M.
S. Mallidi et al. / Photoacoustics xxx (2015) xxx–xxx 7
G Model
PACS 30 1–8
Please cite this article in press as: Mallidi S, et al. Visualization of molecular composition and functionality of cancer cells using
nanoparticle-augmented ultrasound-guided photoacoustics. Photoacoustics (2015), http://dx.doi.org/10.1016/j.pacs.2014.12.003

435 References
436 [1] Bremer CC, Ntziachristos VV, Weissleder RR. Optical-based molecular imaging:
437 contrast agents and potential medical applications. Eur Radiol 2003;13:438 231–43.
439 [2] Cassidy PJ, Radda GK. Molecular imaging perspectives. J R Soc Interface
440 2005;2:133–44.441 [3] McLarty K, Reilly RM. Molecular imaging as a tool for personalized and
442 targeted anticancer therapy. Clin Pharmacol Ther 2007;81:420–4.443 [4] Pysz MA, Gambhir SS, Willmann JK. Molecular imaging: current status and
444 emerging strategies. Clin Radiol 2010;65:500–16.445 [5] Ntziachristos V. Going deeper than microscopy: the optical imaging frontier in
446 biology. Nat Publ Group 2010;7:603–14.
447 [6] Luker GD, Luker KE. Optical imaging: current applications and future direc-448 tions. J Nucl Med 2007;49:1–4.
449 [7] Dhawan AP, D’Alessandro B, Xiaolei F. Optical imaging modalities for biomed-450 ical applications. IEEE Rev Biomed Eng 2010;3:69–92.
451 [8] Balas C. Review of biomedical optical imaging—a powerful, non-invasive,
452 non-ionizing technology for improving in vivo diagnosis. Meas Sci Technol453 2009;20:104020.
454 [9] Bayer CL, Luke GP, Emelianov SY. Photoacoustic imaging for medical diag-455 nostics. Acoust Today 2012;8:15–23.
456 [10] Luke GP, Yeager D, Emelianov SY. Biomedical applications of photoacoustic457 imaging with exogenous contrast agents. Ann Biomed Eng 2011;40:422–37.
458 [11] Mallidi S, Luke GP, Emelianov SY. Photoacoustic imaging in cancer detection,
459 diagnosis, and treatment guidance. Trends Biotechnol 2011;29:213–21.460 [12] Xu M, Wang LV. Photoacoustic imaging in biomedicine. Rev Sci Instrum
461 2006;77:041101.462 [13] Wang B, Su JL, Karpiouk AB, Sokolov KV, Smalling RW, Emelianov SY. Intra-
463 vascular photoacoustic imaging. IEEE J Quantum Electron 2010;16:588–99.
464 [14] Emelianov SY, Li PC, O’Donnell M. Photoacoustics for molecular imaging and465 therapy. Phys Today 2009;62:34.
466 [15] Wang LV. Multiscale photoacoustic microscopy and computed tomography.467 Nat Photon 2009;3:503–9.
468 [16] Sethuraman S, Amirian JH, Litovsky SH, Smalling RW, Emelianov SY. Spectro-469 scopic intravascular photoacoustic imaging to differentiate atherosclerotic
470 plaques. Opt Express 2008;16:3362–7.
471 [17] Wang B, Su JL, Amirian J, Litovsky SH, Smalling R, Emelianov SY. Detection of472 lipid in atherosclerotic vessels using ultrasound-guided spectroscopic intra-
473 vascular photoacoustic imaging. Opt Express 2010;18:4889–97.474 [18] Sethuraman S, Amirian JH, Litovsky SH, Smalling RW, Emelianov SY. Ex vivo
475 characterization of atherosclerosis using intravascular photoacoustic imaging.
476 Opt Express 2007;15:16657–66.477 [19] Kim C, Favazza C, Wang LV. In vivo photoacoustic tomography of chemicals:
478 high-resolution functional and molecular optical imaging at new depths.479 Chem Rev 2010;110:2756–82.
480 [20] Yang X, Stein EW, Ashkenazi S, Wang LV. Nanoparticles for photoacoustic
481 imaging. Wiley Interdiscip Rev: Nanomed Nanobiotechnol 2009;1:360–8.
482[21] Mallidi S, Larson T, Aaron J, Sokolov K, Emelianov S. Molecular specific optoa-
483coustic imaging with plasmonic nanoparticles. Opt Express 2007;15:6583–8.484[22] Li P-C, Wang C-RC, Shieh D-B, Wei C-W, Liao C-K, Poe C, et al. In vivo photo-
485acoustic molecular imaging with simultaneous multiple selective targeting486using antibody-conjugated gold nanorods. Opt Express 2008;16:18605–15.
487[23] Urano YY. Novel live imaging techniques of cellular functions and in vivo
488tumors based on precise design of small molecule-based ‘Activatable’ fluo-489rescence probes. Curr Opin Chem Biol 2012;16:602–8.
490[24] Kobayashi HH, Choyke PLPL. Target-cancer-cell-specific activatable fluores-491cence imaging probes: rational design and in vivo applications. Acc Chem Res
4922011;44:83–90.
493[25] Weissleder R, Pittet MJ. Imaging in the era of molecular oncology. Nature4942008;452:580–9.
495[26] Sokolov K, Follen M, Aaron J, Pavlova I, Malpica A, Lotan R, et al. Real-time496vital optical imaging of precancer using anti-epidermal growth factor re-
497ceptor antibodies conjugated to gold nanoparticles. Cancer Res 2003; 63:4981999–2004.
499[27] Aaron JS, Nitin N, Travis K, Kumar S, Collier T, Park SY, et al. Plasmon resonance
500coupling of metal nanoparticles for molecular imaging of carcinogenesis in501vivo. J Biomed Opt 2007;12:034007.
502[28] Mallidi S, Larson T, Tam J, Joshi PP, Karpiouk A, Sokolov K, et al.503Multiwavelength photoacoustic imaging and plasmon resonance coupling
504of gold nanoparticles for selective detection of cancer. Nano Lett 2009;9:
5052825–31.506[29] Sokolov K, Aaron J, Hsu B, Nida D, Gillenwater A, Follen M, et al. Optical
507systems for in vivo molecular imaging of cancer. Technol Cancer Res Treat5082003;2:491–504.
509[30] Kumar S, Aaron J, Sokolov K. Directional conjugation of antibodies to nano-510particles for synthesis of multiplexed optical contrast agents with both
511delivery and targeting moieties. Nat Protoc 2008;3:314–20.
512[31] Aaron J, Travis K, Harrison N, Sokolov K. Dynamic imaging of molecular513assemblies in live cells based on nanoparticle plasmon resonance coupling.
514Nano Lett 2009;9:3612–8.515[32] Kim SS, Chen Y-SYS, Luke GPGP, Emelianov SYSY. In vivo three-dimensional
516spectroscopic photoacoustic imaging for monitoring nanoparticle delivery.
517Biomed Opt Express 2011;2:2540–50.518[33] Prahl, S. http://omlc.org/spectra/hemoglobin/.
519[34] Perrault SD, Chan WCW. In vivo assembly of nanoparticle components to520improve targeted cancer imaging. Proc Natl Acad Sci U S A 2010;107:11194–99.
521[35] Bayer CLCL, Chen Y-SYS, Kim SS, Mallidi SS, Sokolov KK, Emelianov SS.522Multiplex photoacoustic molecular imaging using targeted silica-coated gold
523nanorods. Biomed Opt Express 2011;2:1828–35.
524[36] Shah J, Aglyamov SR, Sokolov K, Milner TE, Emelianov SY. Ultrasound imaging525to monitor photothermal therapy: feasibility study. Opt Express 2008;16:
5263776–85.527[37] Shah J, Park S, Aglyamov S, Larson T, Ma L, Sokolov K, et al. Photoacoustic
528imaging and temperature measurement for photothermal cancer therapy. J
529Biomed Opt 2008;13:034024.
S. Mallidi et al. / Photoacoustics xxx (2015) xxx–xxx8
G Model
PACS 30 1–8
Please cite this article in press as: Mallidi S, et al. Visualization of molecular composition and functionality of cancer cells using
nanoparticle-augmented ultrasound-guided photoacoustics. Photoacoustics (2015), http://dx.doi.org/10.1016/j.pacs.2014.12.003