Visualization is in the mind of the beholder
22
VISUALIZATION IS IN THE MIND OF THE BEHOLDER ANNA SIERPINSKA [Abstract] My aim in this paper is to discuss the complexity of visualization and the roles of different kinds of visualization in mathematics teaching and learning. On the example of a teaching experiment about iteration of functions, I show how teacher-generated computer animations may lead students to developing erroneous figural ideas about the mathematical concept thus illustrated. I point to the difficulty, for the students, to strike a balance between visual and analytic thinking. I also analyze the factors that may contribute to achieving this balance. I distinguish three kinds of factors of conceptual change in students: the social context of the teaching situations, the mathematical problems the students are given to investigate and the teacher interventions. In my experiment, the highest conceptual "leaps" towards the more balanced conceptions appeared to occur in situations of indirect, written and oral communication with feedback from the addressee. Small group discussions were less likely to contribute to the visual-analytic balance. Investigating more complicated functions and "monster examples" was better in that respect than looking at iterations of linear functions. I propose that, whenever possible and sensible, students should be given the opportunity to create their own visualizations, rather than merely watch teacher-generated visualizations. In mathematicians' daily work, thinking in terms of explicit formal representations and non-verbal, visual imagery complement each other. But these two modes of thinking often become polarized in the reflection on and planning of the teaching of mathematics as if this distinction was not only methodological but a material one. Indeed, mathematics educators seem to have always been torn between the symbolic and propositional aspects of mathematical thinking and the non-symbolic and analog aspects on the other; between mathematical language and mathematical imagery; analytic thinking and visualization. Presently, the former perspective figures most prominently in the so-called "discursive" or "communicational" approaches as presented, for example, in ([10]), where learning mathematics is identified with becoming initiated into mathematical discourse. Visual aspects of mathematical thinking are highlighted in research stressing the embodied character of our mind (e.g., [2], [3], [4]). Discursive approaches in mathematics education are founded on socio-cultural epistemological theories (with references to Vygotsky, [25], and further developments such as Activity Theory) and theories of cognition based on the assumption that learning is situated within communities of practice ([26]). The 'embodied cognition' position draws on foundational work in cognitive science ([23]) and its applications to mathematics ([11], [13]). There is no contradiction between the two viewpoints: visualization is often shaped by language and other cultural conventions and cultural conventions are bound by the constraints of the physical organization of the human body. In mathematics, if one grasps an idea visually at first, one feels the need to represent it in a symbolic and propositional form; and if the first encounter with an idea is through such form (e.g. a formal definition), one tries to "visualize it". The problem with "approaches" in mathematics education is, however, their tendency to reduce the description of the processes of teaching and learning mathematics to one single idea such as "mathematics is a discourse" or "behind each mathematical concept there is a metaphor grounded in human bodily experience". This, of
Transcript of Visualization is in the mind of the beholder

VISUALIZATION IS IN THE MIND OF THE BEHOLDER
ANNA SIERPINSKA
[Abstract] My aim in this paper is to discuss the complexity of visualization and the roles ofdifferent kinds of visualization in mathematics teaching and learning. On the example of ateaching experiment about iteration of functions, I show how teacher-generated computeranimations may lead students to developing erroneous figural ideas about the mathematicalconcept thus illustrated. I point to the difficulty, for the students, to strike a balance betweenvisual and analytic thinking. I also analyze the factors that may contribute to achieving thisbalance. I distinguish three kinds of factors of conceptual change in students: the social contextof the teaching situations, the mathematical problems the students are given to investigate andthe teacher interventions. In my experiment, the highest conceptual "leaps" towards the morebalanced conceptions appeared to occur in situations of indirect, written and oral communicationwith feedback from the addressee. Small group discussions were less likely to contribute to thevisual-analytic balance. Investigating more complicated functions and "monster examples" wasbetter in that respect than looking at iterations of linear functions. I propose that, wheneverpossible and sensible, students should be given the opportunity to create their ownvisualizations, rather than merely watch teacher-generated visualizations.
In mathematicians' daily work, thinking in terms of explicit formal representations andnon-verbal, visual imagery complement each other. But these two modes of thinking oftenbecome polarized in the reflection on and planning of the teaching of mathematics as if thisdistinction was not only methodological but a material one. Indeed, mathematics educatorsseem to have always been torn between the symbolic and propositional aspects ofmathematical thinking and the non-symbolic and analog aspects on the other; betweenmathematical language and mathematical imagery; analytic thinking and visualization.Presently, the former perspective figures most prominently in the so-called "discursive" or"communicational" approaches as presented, for example, in ([10]), where learningmathematics is identified with becoming initiated into mathematical discourse. Visualaspects of mathematical thinking are highlighted in research stressing the embodiedcharacter of our mind (e.g., [2], [3], [4]). Discursive approaches in mathematics educationare founded on socio-cultural epistemological theories (with references to Vygotsky, [25],and further developments such as Activity Theory) and theories of cognition based on theassumption that learning is situated within communities of practice ([26]). The 'embodiedcognition' position draws on foundational work in cognitive science ([23]) and itsapplications to mathematics ([11], [13]).
There is no contradiction between the two viewpoints: visualization is often shaped bylanguage and other cultural conventions and cultural conventions are bound by theconstraints of the physical organization of the human body. In mathematics, if one graspsan idea visually at first, one feels the need to represent it in a symbolic and propositionalform; and if the first encounter with an idea is through such form (e.g. a formal definition),one tries to "visualize it". The problem with "approaches" in mathematics education is,however, their tendency to reduce the description of the processes of teaching and learningmathematics to one single idea such as "mathematics is a discourse" or "behind eachmathematical concept there is a metaphor grounded in human bodily experience". This, of

2
course, is much easier than to take into account more aspects of the full complexity ofthese processes.
Moreover, we don't really have a choice between visualizing and not visualizing inlearning and doing mathematics. Visualization is not a matter of didactic choice; it is acognitive necessity. Research in neuropsychology suggests that non-symbolic and analog(as opposed to propositional) cognitive processes pervade all our thinking, even thoseprocesses that are considered highly symbolic such as language and mathematics ([7]).
But there are different kinds of visualization and not all are always useful inmathematical thinking. Furthermore, mathematics seems to grow thanks to processes ofmental struggle between visualizations and their questioning by analytic thinking, whichlead to new, more complex and abstract visualizations. I will elaborate on these ideas in thispaper, illustrating them with examples from my own and other people's research.
What do we mean by "visualization"?
"Visualization" in mathematics education has a very broad meaning and its use may beambiguous. Here is how its various meanings have been described:
Visualization is the ability, the process and the product of creation, interpretation, use of andreflection upon pictures, images, diagrams, in our minds, on paper or with technological tools,with the purpose of depicting and communicating information, thinking about and developingpreviously unknown ideas and advancing understandings [8]. (p. 75) (quoted in [1], p. 217)
In the context of mathematics teaching and learning it is useful to distinguish betweeninternal or mental visualization by the cognitive subject while thinking about a problem,and the production of external, static or dynamic pictures or physical objects aimed atcommunicating an already well understood abstract idea to others. Internal visualizationsmay consist in descriptive and figural images, resembling physical objects, but they mayalso contain abstract configurations of vague symbolic forms.
Internal visualization
People differ in their preference for the kind of internal visualizations. Thesepreferences are sometimes (e.g. [21]) related with mathematical achievement.
Children who face difficulties in mathematics appeared to translate mathematical symbols to visualimages of real objects and actions with them (descriptive and figural images). The objects in themind were real things and actions were analogues of those that children may carry with realthings.… Lower achieving children seemed unable to detach themselves from the search ofsubstance and concreteness.… High achieving children, on the other hand, seem to interpretmathematical symbolism and use their visual representations differently. Their visual images aredominated by numerical symbols, which are used as triggers for thought. Symbols appear to flashas memory reminders momentarily coming to the fore as new transformations or precursors ofverbal comments. The detail both of the object and the action is filtered out to give a focus on themore abstract, 'mathematized', qualities of the symbol. ([21])
But "flashing symbols" as internal visualizations are not always efficient inmathematical thinking, as the following example shows, and they do not distinguishbetween experts and novices in mathematics. A university professor and an undergraduatestudent were asked to prove that the derivative of an even function is odd. The professorsaid,

3
"Let's see, an even function. There is only one thing about it, and that its graph is reflected acrossthe axis. Yeah, and you can be quite convinced that it is true by looking at the picture. If you saidenough words about the picture, you'd have a proof." (Quoted in [14])
The student said,
"So my understanding of derivative is that you subtract the power by one. Right, so if you have aneven function, the power is even, so it always comes out to be odd. That's my… my intuitiveunderstanding of the problem. And then, I don't know, I tried to get somewhere, but I reallycouldn't, so I just write down the formula for the, I guess the definition for what the derivative is.So that's what I have. And I couldn't get anywhere from there." (Quoted in [14]).
The student appears to experience "flashing symbols" as he thinks about the problem.The language of algebraic expressions has become, for him, an obstacle to understandingthis simple relationship.
The professor, on the other hand, doesn't see "flashing symbols", but his internalvisualization does not consist in "visual images of real objects and actions with them",either. For him, what is important about the graph of an even function is not so much itsshape, as the relation of this shape to the y-axis, namely its symmetry about this axis. Hevisualizes the derivative by the position of a tangent relative to the x-axis, and putting thetwo visualizations together, he obtains symmetry of the tangents about the y-axis. Heneeds to now symbolize this symmetry in terms of the opposite signs of their angularcoefficients, and interpret the angular coefficient as the derivative to obtain the convictionthat the derivative of an even function is odd. The professor's inner visualization isfocused on relationships between shapes, not on shapes in isolation from each other, and itis strongly intertwined with analytic thinking.
For many, mathematics is its phenomenon: pages upon pages of technical language andsymbolic notation so unlike the ordinary prose. For these people, the symbols are butshapes, drawings symbolizing mysterious meanings. Already pre-schoolers may have thisvision of mathematics (see Figure 1).
FIGURE 1. A 6-year-old child's representation of mathematics
They see with their eyes, not with their minds. But eyes are not necessary for doingmathematics.
It is easy to understand how well meaning people who know little about mathematics mightassume that the subject's technical notation would create insurmountable barrier for blind people.But in fact, mathematics is in some ways more accessible for the blind than other professions. Onereason is that mathematics requires less reading because mathematical writing is compact comparedto other kinds of writing. 'In mathematics', [one blind mathematician noted], 'you read a couple ofpages and get a lot of food for thought.' In addition, blind people often have an affinity for theimaginative, Platonic realm of mathematics.… For example… sighted students… when they thinkabout two intersecting planes, they see the planes as two-dimensional pictures drawn on a sheet ofpaper. 'For them… geometry is these pictures… They have no idea of the planes existing in their

4
natural space.' Because blind students do not use drawings, it is natural for them to think about theplanes in an abstract way. ([9])
Blind mathematicians' experience has contributed much to our understanding of theinternal mathematical visualization. According to Jackson ([9]) who interviewed BernardMorin, the blind French mathematician famous for his visualization of how to turn a sphereinside out,1 this visualization may have more to do with spatial orientation or feeling howthings are positioned with respect to each other than with knowing the details of each ofthese things, and therefore - more with the sense of touch than with the sense of vision.
One thing that is difficult about visualizing geometric objects is that one tends to see only theoutside of the objects, not the inside, which might be very complicated. By thinking carefullyabout two things at once, Morin has developed the ability to pass from outside to inside…. Thiskind of spatial imagination seems to be less dependent on visual experiences than on tactile ones.([9])
Morin differentiated the internal mathematical visualizations into "time-like" and"space-like".
Bernard Morin believes that there are two kinds of mathematical imagination. One kind, which hecalls 'time-like', deals with information by proceeding through a series of steps. This is the kind ofimagination that allows one to carry out long computations. 'I was never good at computing' Morinremarked, and his blindness deepened this deficit. What he excels at is the other kind ofimagination, which he calls, 'space-like' and which allows one to comprehend information all atonce. ([9])
Summarizing the above distinctions, we could tentatively identify three kinds ofinternal mathematical visualization: "space-like", "time-like" and "text-like", with thespace-like visualizations differentiated into "figural" and "structural". (See Figure 2)
Internal visualizations
Space-like Time-like Text-like
FiguralVisual images of realobjects and actions onthem; focus on details ofindividual objects
StructuralImagining aconfiguration all at once,focusing on its structure,i.e. on relationshipsbetween its elements, noton the elementsthemselves
Imagining a series ofsteps
"Flashing symbols"
FIGURE 2. Kinds of internal visualization
All visualizations, even the most abstract, structural visualizations must be constantlyrevised and probed with analytic means, because they are all based on some particularcases, typical or paradigmatic examples, and may thus create an obstacle to understandingthe general concept. For example, according to Hilbert (1900, quoted in [22]) the
1 ( http://www.geom.uiuc.edu/locate/oi )

5
paradigmatic example of a binary relation is that of the linear order of points on a straightline.
Who does not always use along with the double inequality a > b > c the picture of three pointsfollowing one another on a straight line as the geometric picture of the idea 'between'? (Hilbert,1900, quoted in [22])
If a student has this picture in mind when studying abstract algebra and especially thenotion of equivalence relation, he or she has a limited understanding of the notion oftransitive property. Given the task of deciding if the relation ~ in the set S = {a, b, c}given by a ~ a, a ~ b, b ~ a and b ~ b is an equivalence relation, 82 % out of 68 students saidthat it isn't because it is not transitive and they used the following argument, "You needthree elements to make the transitivity hold" ([22]).
But analytic thinking is not the ultimate authority in mathematics. It is alsoconstrained; it is bound by the choice of notation, terminology, definitions, language. Therelevance, the sense and sensibility of its products must be constantly checked using thesynthetic powers of the visual mind. It wouldn't make sense to construct the generalnotion of equivalence relation, if there weren't many natural and useful examples of it.
It is amazing to realize that generalization processes of mathematical thought are aresultant of two "specialization" tendencies: visual images based on special cases andanalytic representations embedded in a particular language.
External visualizations
While internal visualizations may be concrete or abstract, an external visualization isalways, primarily, a concrete object (even if it is an equation). Only its mentalinterpretation may have various degrees of abstraction.
The creator of the external visualization has a certain mental visualization and ananalytic understanding of it, which he or she wants to communicate this way. Butcommunication often fails: the interpreter cannot decode the external visualization in termsof the abstract idea, which, for the creator, it represents, because he or she hasn't developedthis idea yet. There is no one-to-one correspondence between external visualizations andabstract ideas; external visualization is not an invertible operation.
This is the source of many problems in communicating mathematics. Mathematics is,essentially, internal visualizations of all kinds. Translated into sentences, equations,concrete figures and diagrams, these visualizations lose exactly those features that makethem so efficient for thinking.
But there is no way of communicating mathematics other than by using some"materializations" of the internal visualizations, whether verbal descriptions, symbolicexpressions in a formal notation or external visualizations such as geometric figures,pictures, diagrams, computer animations, or physical devices. The only question is, whatkinds of materializations to use and in what way.
It is a widely held belief among mathematics teachers and educators that externalvisualizations are a better means of communicating mathematics than verbal and formalsymbolic expression and much creativity has been spent on inventing them. Theproponents of such visualizations posit that "for many students and many teachersproficiency in specific concretisations forms the backbone and principal motivation of

6
activity within the classroom" ([6]). Results of systematic inquiry into using externalvisualizations in actual classrooms have been, however, if not quite disappointing then atleast ambiguous from the point of view of students' learning, especially long-term learning.The external visualization that attracted perhaps the most attention among both teachersand researchers is the balance metaphor for the introduction of equations in high school. In[24], arguments for and against the use of the balance metaphor are synthesized andresearch is conducted in the aim of verifying its impact on students' understanding. Theresearch confirmed the opinion, shared by the defenders and the opponents of the balancemodel alike, that it does create an obstacle when students start dealing with equations in anextended domain of numbers, including not only positive but also negative numbers.Students become attached to the model and want to always use it when interpreting andsolving equations. But, the author says, "The presence of negative integers, because of theirabstract nature, necessitates an algebraic understanding of letters, which is in conflict withthat introduced by the balance model". Researchers have proposed other models for theteaching of equations - for example, the metaphor of comparison of areas – but also thisvisualization led to mediocre results and many mistakes in students (e.g., [15]).
I have a few examples from my own research, where the teacher's visualization of anabstract mathematical idea strongly interfered with students' understanding ([16], [18],[19]). But the conclusion is not that external visualizations should be simply avoided inteaching. The remaining part of this paper is devoted to describing a teaching situation,where external visualizations had a strong impact on students' thinking, yet students wereable to develop quite elaborate conceptions. The focus is on factors which contributed tothis development.
Example: Struggling to balance figural visualizations and analytic thinking aboutiteration of functions
The teaching experiments, from which this example is drawn, were conducted in theyears 1987-89 in Warsaw, Poland.2 In these nostalgic times of "microcomputers", thedynamic representations of iterations of functions used in the experiments wereprogrammed in BASIC on a ZX-Spectrum computer and displayed using a TV screen.
The rationale
At the time of my research, the concept of convergence of sequences was introduced toupper secondary students in Poland quite formally, using the epsilon-N definition andrequiring students to write formal proofs that a sequence given by an analytic formula has agiven limit. Students were rarely given a chance to even discover the "world of infinitesequences" as worthy of thinking about and exploring, which, for me, was one of the basicconditions for understanding this concept ([17]).
There are many entry points into this world; the one that appealed to me by therichness of non-trivial opportunities for mathematical exploration was the context ofiterations of functions and attractive fixed points.
2 A report of this research was published in the form of a preprint ([16]).

7
In this context, I thought, the difference between convergence and non-convergence ofsequences is so striking, especially if represented using dynamic computer graphics, thatstudents would at least identify convergence as a property worth studying and exploring.Further, invention and exploration of functions whose iteration sequences would approachthe fixed point in a small interval only, or on one side of the fixed point, or other kinds of"singularities", would offer the students a chance to experience the need to clarify thenotion of "attractive fixed point" and make it more precise. The definition would thusappear as a solution to personally experienced conceptual struggles of the students ratherthan as school "subject matter" whose only justification is that it is part of an officialcurriculum.
A formal introduction to convergence makes it difficult for the students to see itsrelevance in mathematics. This relevance can only be brought to students' awareness innon-trivial mathematical contexts. The problem, for mathematics educators, is to findcontexts that are both non-trivial mathematically and accessible for secondary schoolstudents. Iteration of functions is one of such contexts.
The possibility of providing students with vivid, computer-generated, dynamicnumerical and graphical representations of attractive and various kinds of non-attractivefixed points of functions, appealed to me both from a pedagogical point of view asmotivating for secondary school students, and from a cognitive point of view, assupporting the development of a balance between analytical thinking about convergenceand mental imagery.
Students
I conducted teaching experiments with three groups of students. Chronologically, thefirst experiment involved a group of 16-year-old students from Grade 2 of a humanitiesstream of a secondary school of the "lyceum" type in Warsaw; this group is labelled ZII.The second experiment involved a group of 17-year-old students from Grade 3 of the sameschool; this group is labelled ZIII. The third experiment involved a group of 15-year-oldstudents from Grade 1 of a mathematics and physics stream of a different "lyceum" inWarsaw; this group is labelled CI. CI and ZII students have not been exposed to notions ofsequences and limits of sequences prior to the experiments. ZIII students were introducedto these notions formally in their mathematics course, using the epsilon-N definition interms of absolute value (not neighbourhoods).
Although many students took part in the experiments, I decided to follow closely thebehaviour and development of understanding in only five students from all groups: Agnesand Ewa from ZIII, Darek and Gutek from ZII and Robert from CI.
The choice of the groups of students was opportunistic, depending on the willingnessof their teachers to cooperate with me and let me into their classrooms to makeannouncements about the experiments and recruit volunteers for extra work after classes.
Sessions with students
At least one session in each group was held during the teacher's scheduled class timeand it was conducted by a group of students; those who volunteered to stay after classesfor the preparatory sessions. In the preparatory sessions, the volunteers listened to my

8
introduction to the topic (about 30 minutes computer-assisted lesson), solved problems insmall groups, communicated their understanding to single students from their classes whohad not attended the sessions so far. The latter communication could be
• direct, using any means of communication (verbalization, drawing, gestures);• indirect written, no drawing permitted;• indirect oral, where a curtain separated the interlocutors.The rather unnatural conditions of the last two kinds of situations were imposed in the
aim of obtaining interaction, in the students' minds, between visual imagery and analyticalthinking. These situations were meant to simulate those, more natural in a mathematician'slife, of indirect communication of one's knowledge or research results through publiclecturing and writing, for the purposes of teaching or publication. Such situations force theuse of notational conventions and analytic thinking necessary for a deductive organizationof knowledge that, otherwise, could remain implicit and imprecise. They also generate newquestions that feed back into the process of thinking and contribute to the development ofmathematics.
The first session with the volunteers had two parts: my introductory lesson of about30 minutes and an hour of problem solving in small groups.
The introductory lesson
The introductory lesson was started by stating the following problem:
Given a mapping ƒ : A ‡ A, what happens to an argument xo in A, if we repeat the mappinginfinitely many times? In other words, what can be said about the sequence xo, ƒ(xo), ƒ(ƒ(xo)),ƒ(ƒ(ƒ(xo))), etc. ?
This was followed by examples of iterations of plane mappings such as reflection,dilation about a point with ratio –1/2, compositions of a reflection with dilations withratios -.75 and -1.5. The discussion of these examples contained the introduction of theterms "fixed point", "attractive fixed point", and "repellent fixed point". The term "fixedpoint" of a mapping was defined as a "point, which is not changed by the mapping". Theother two terms were not defined; I only said, pointing to an example, that "in this case, thefixed point of the mapping is attractive (vs. not attractive, repellent). Each example wasillustrated on the screen with dynamic figures of the consecutive images ƒn(xo), of a chosenpoint xo under the given mapping ƒ. The consecutive images were appearing on the screenfor a few seconds, accompanied by a sound.
I started with plane transformations because visualizations of the consecutive terms ofthe iteration sequence are closer to the mathematical objects themselves than invisualizations of iterations of real functions using their graphs and the y=x line (Figure 3),and therefore their interpretation is less prone to error. It depends less on analytic thinking.

9
FIGURE 3. Iteration of a dilation and of a linear function, represented graphically
Then six examples of functions from R to R were studied. I delayed the graphicalrepresentation of the iteration till the second example, aiming at focusing students' attentionon the definition of the iteration sequence.Example 1. ƒ(x) = 2x + 1, where x Œ R; iteration sequences for xo = 1, -1 (-1 is the fixedpoint)
Only the formula appeared on the screen. I said, "Let us take an initial value of x equalto 1. Let us operate on it with the function ƒ. We get 3. Now, let us act on 3. We get 2times 3 plus 1 equals 7. Now, let us act on 7. We get 2 times 7 plus 1 equals 15. Now, letus act on 15. We get 2 times 15 plus 1 equals 31. Now, let the computer work for us.Look!" The screen displayed 11 terms of the sequence, till the value of 2047. Then I said:"Let us start from –1 now: 2 times –1 plus 1 equals –1. Let the computer work it out forus; it is always –1. Minus 1 is the fixed point of the function. It does not change under thefunction."Example 2. ƒ: (-1, 4) ‡ (-1, 4), defined by ƒ(x) = x(1-x)/3 + 3.
The screen displayed only the graph of the function, not the formula. I said, "Given thegraph of a function, its iteration has an interesting graphical representation". I showed theconstruction of this representation very slowly on the screen, and carefully explained eachstep (see Figure 4). The initial argument was taken to be 2. I gave reasons for drawing theline y = x, and said, "Since the graph of the function intersects with this line, the functionhas a fixed point, whose approximate value can be read off the graph". Next, numericalvalues of 100 terms of the iteration sequence were shown on the screen. I drew students'attention to the fact that the sequence was made of two alternating subsequences, onetending to 1, and the other tending to 3. I declared that the fixed point could not beconsidered an attractive fixed point in this case.Example 3. ƒ(x) = 0.75x – 1, where x Œ R; xo = 1, and several other values.
Both the formula and the graph were shown on the screen, and the graphicalrepresentation of the iteration sequence was displayed dynamically, step by step, butwithout detailed verbal explanation this time. The final picture was as in the right part ofFigure 3. When this picture was displayed, I asked the students: "What does it tend to?"

10
The students' answers were invariably, in all groups, "To the intersection point".Therefore, in spite of delaying the graphical representation and focusing on the definition ofiteration, once the graphical representation was shown, students' attention was totally onthe impressive pictures. They no longer attended to the sequence of arguments of thefunction. So I said, "Oh, but what does the sequence of arguments tend to?" I showed howthe arguments represented on the x- axis tend to –4, and I said, "It tends to –4, which is thefixed point of the function". Numerical values of up to 20 terms of the iteration sequencewere then displayed on the screen. Several different values of the initial argument xo weretaken and it was observed that the sequences always tend to –4. No analytic validation wasdiscussed at this point, because the students were not assumed to know or be able to usethe notion of limit in a formal way. The proposed context was expected to bring them toidentify the idea of limit as worthy of being defined and studied as a mathematical conceptin its own right.
FIGURE 4. Snapshots of the screen display for Example 2: ƒ(x) = (1-x)x/3 + 3, xo = 2.
Example 4. ƒ(x) = -x + 1, where x Œ R; several values of xo are taken.Graphical representations of several iteration sequences were displayed. Students
observed that the iteration sequences are always made of two alternating numbers. I thenproved this property algebraically on the board: the sequences are always of the formxo, -xo+1, xo, -xo + 1, etc. Example 5. ƒ(x) = 2x + 1, where x Œ R; several values of xo are taken.

11
Iteration sequences were presented numerically and graphically; students observed thatthe sequences always "run away from the fixed point". One student (Gutek) added that"they run like a March hare", which indicates that he attended mostly to the auxiliary littlehorizontal and vertical segments of the graphical representation, and not to the sequence ofreal numbers ƒn(xo).
Example 6. ƒ(x) =
†
-5x + 8 for x <97
-1/3x + 2 for x ≥97
Ï
Ì Ô
Ó Ô
The formula and a graph of the function were displayed on the screen (Figure 5).Gutek's reaction was, "But here, there are two functions!" I explained that this isconsidered to be a single function, defined with different formulas in different intervals.Using the initial value xo = 1, I made the students observe that the function may produce an
FIGURE 5. The final state
alternating sequence of the type a, b, a, b, etc., just as the function –x + 1. I also pointed tothe fact that, if the initial point is taken outside of the interval (1, 3) then the iterationsequence runs away from the fixed point, but if it is taken inside the interval then theiteration sequence comes closer and closer to the fixed point.
Right after the introductory lesson, students were given the following problem to thinkabout in pairs.
Find functions such that x = 2 gives rise to the iteration sequence 2 ‡ 3 ‡ 2 ‡ 3 ‡ …, andwhich have an attractive fixed point in the interval (2, 3).
In the next session, the problem to solve in small groups was, "Which linear functionshave attractive fixed points?"
Analysing the evolution of students' understanding of iterations of functions andattractive fixed points
In analysing the recorded students' utterances I was looking for answers to questions listedin Table 1.
12
Students' answers to questions in Table 1 could be explicit or implicit. They were moreexplicit ("verbalized") in situations of formulation of a written message for a classmate, orduring a whole class lesson conducted by them. But they were more implicit ("non-verbalized") during investigations in small groups. Students sometimes verbalized theirunderstandings using a "restricted code", and sometimes an "elaborate code", in the sense ofBernstein ([5]). Sometimes a student would use an elaborate language but it was clear fromthe context that his or her understanding was more in line with the thinking style relatedwith the restricted code; in this case, their utterance was classified as verbalized in a"pseudo-elaborate code" ([12]).
TABLE 1Questions raised in analysing students' utterances
FUN (function) For me, the explored mathematical objects were functions. What werethe explored mathematical objects for the students?
IT (iteration) For me, the operation performed on these objects was iteration. Whatwas this operation for the students?
For me, the result of this operation were sequences of numbers,obtained using the recursive rule, xo , xn+1 = ƒ(xn). What was the result ofthe operation for the students?
I classified the iteration sequences according to their convergence ornon-convergence to the fixed point of the function. According to whatproperties were the results classified for the students?
FP (fixed point) For me, the fixed point of a function ƒ was an argument x such thatƒ(x) = x. What did the students understand by "fixed point"?
ATP (attractive fixedpoint)
For me, a fixed point c of a function ƒ was attractive in an interval(a,b) if, for any xo Œ (a, b), the iteration sequence with initial value xo had alimit and this limit was equal to c. What did the students understand by"attractive fixed point"?
The restricted code is assumed to reflect a construction of meanings on the basis ofdirect data and contextual relations (i.e. relations based on associations inferred from directexperience and contiguity in time and space rather than on the basis of logical conceptualanalysis). In the restricted (vs. elaborate) code, the communication of meanings is implicit(respectively, explicit); the meanings are specific (respectively, universal), and dependentupon (respectively, independent from) the context. The restricted (respectively, elaborate)code is characterized by the lack (respectively, presence) of complex syntacticalconstructions ([5], [12]).
In this paper, I describe my observations regarding the IT questions only.
Students' conceptions of iteration of functions
In this section I address the question: For me, the operation performed on the objectsof study [functions] was iteration. What was this operation for the students? I cannotavoid mentioning what these "objects of study" were for the students in answering this

13
question. Table 2 contains the range of students' understandings of function and iteration offunction; from the most distant from my own view to those the closest to it.
The subsequent questions related to students' understanding were, "What, for thestudents, was the result of the operation performed on their perceived objects of study?"and "According to what properties were the results classified?" I compile the answers tothese questions in Table 3, which also includes the corresponding understandings of theoperation.
TABLE 2Students' understandings of functions and of the operation of iteration of functions
Object of study Operation performed on the object of studyDrawing little horizontal and vertical segments between two curves.Curves in the plane, viewed as
geometrical objects but not in ananalytic way; idealizations of lineson paper, or trajectories of movingpoints. They are classifiedaccording to their shape (a"parabola", a "sine"). The curvesneed not be placed in a system ofcoordinates; sometimes axes areseen as part of the curve. Theremay be restrictions regarding theshape of the curve: open,continuous, extendable toinfinity…
Transforming an initially chosen point of the curve, without seeing anylink between the terms of the sequence ƒn(xo) and this transformation.
Algebraic expressions Finding the values of an algebraic expression for some chosen valuesof the variables, not necessarily related to the sequence ƒn(xo).
Transformations of independentvariables into dependent variablesaccording to an analytic rule,creating tables of values
Finding the values of a dependent variable for some chosen values ofthe independent variable, not necessarily related to the sequence ƒn(xo).
Curves in the plane viewedanalytically, as sets of points (x,y), where x and y are related toeach other somehow. Thisrelationship may be represented byan equation. The curve, however,does not represent the relation;rather, it is represented by theequation.
Transforming an initially chosen point of a curve with explicit linkbetween the transformation and the iteration sequence ƒn(xo).
Relationships between independentand dependent variables, whichmust be represented by a formulaand a graph
Finding the values of the terms of the iteration sequence ƒn(xo), withreference to the graphical representation of the relationship, as if thisrepresentation was conceptually essential for the sequence.
Relationships between independentand dependent variables
Finding the values of the terms of the iteration sequence ƒn(xo), withno reference to a graphical representation.

14
The conceptions in Table 3 are ordered from those relying almost exclusively on figuralvisualizations to those, in which the understanding of the graphical representations is basedon a visualization that is more structural (focused on relations between elements) and moreconsciously intertwined with analytic thinking. The last conception (15) may be based onvisual imagery related to the graphical representations, but the student does not think it isnecessary to mention features of this representation in formulating a definition of iteration.
TABLE 3Students' understandings of the operation of iteration and of iteration sequences
The operation The result of the operation The discriminating property ofthe result
1 Drawing segments A "spiral line" or a "broken line" Direction of movement, or theshape of the line
2 A trajectory of the point: A"spiral line" or a "broken line"
Direction of movement, or theshape of the trajectory
3 Whether the sequence of points orthe initial point tends to theintersection point; it is importantto say what is the shape of thetrajectory.
4
Transforming a point, w/olink to iteration
A sequence of points on a numberline or in a two-coordinate system
Whether the sequence of points orthe initial point tends to theintersection point.
5 Finding the values of analgebraic expression
6 Finding the values of adependent variable
A sequence of numbers Whether the sequence tends tosome definite number or not; it isimportant to say what is theshape of the graphicalrepresentation of the sequence.
7 Whether the sequence of points orthe initial point tends to theintersection point; it is importantto say what is the shape of thetrajectory.
8
A sequence of points on a numberline or in a two-coordinate system
Whether the sequence of points orthe initial point tends to theintersection point.
9
Transforming a point, withlink to iteration
A sequence of numbers – the x-coordinates of a sequence ofpoints
Whether the sequence of numberstends to the x-coordinate of theintersection point.
10 A sequence of points on a numberline
[sequences are not classified; noproperty is distinguished]
11 Whether the sequence of points orthe initial point tends to theintersection point; it is importantto say what is the shape of thetrajectory.
12
Finding values of theiteration sequence, with ref.to the graphical rep. A sequence of points on a number
line or in a two-coordinate system
Whether the sequence of points orthe initial point tends to theintersection point.
15
13 A sequence of numbers Whether the sequence of points orthe initial point tends to theintersection point; it is importantto say what is the shape of thetrajectory.
14 A sequence of numbers – the x-coordinates of a sequence ofpoints
Whether the sequence of numberstends to the x-coordinate of theintersection point.
15
Finding values of theiteration sequence, with noref. to the graphical rep.
A sequence of numbers Whether the sequence tends tosome definite number or not.
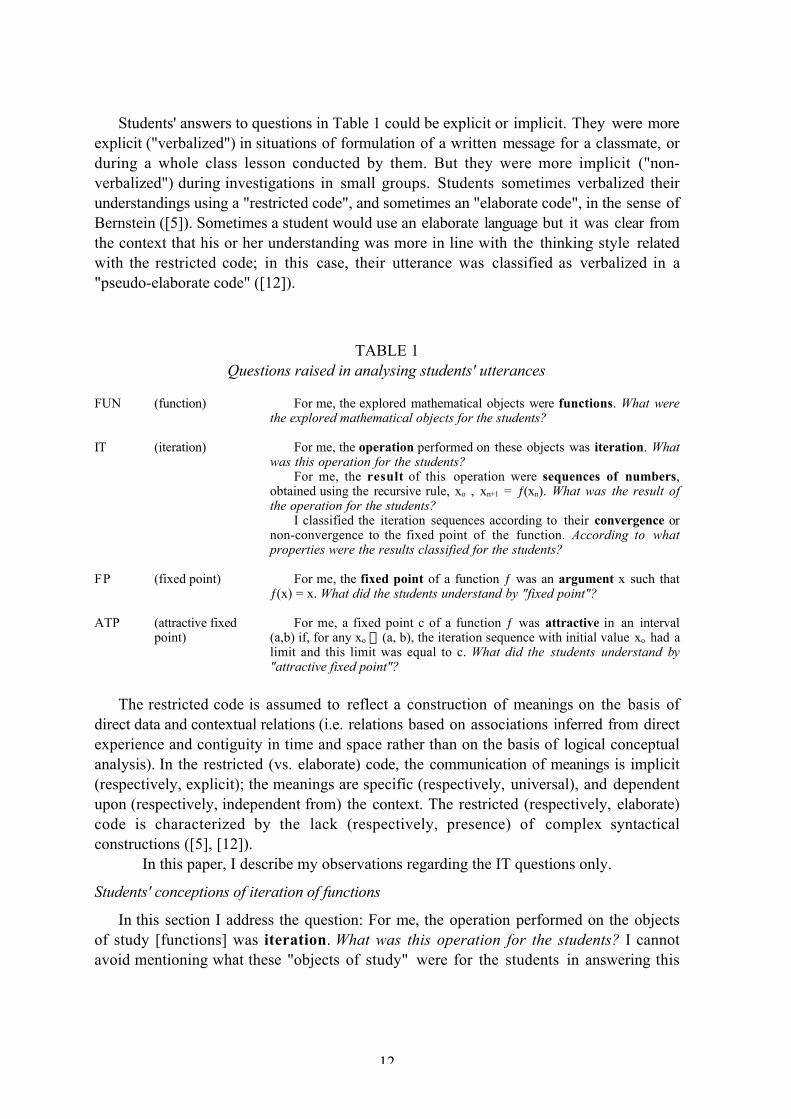
Conception 13 presents an apparent inconsistency; the student defines the operationof iteration without reference to its graphical representation, but still finds it important tomention the shape of this graphical representation when classifying the iteration sequences.This could be a symptom of using an elaborate code in public speech while still thinking ina style corresponding to the restricted code.
During the sessions students' conceptions changed, sometimes becoming morestructural-visual and analytic, sometimes more figural (see Table 4).
TABLE 4Changes in students' expressed conceptions of iteration of functions
Student's name and group Conceptual itineraryAgnes (ZIII) 10 ‡ 15Ewa (ZIII) 2 ‡ 5 ‡ 2 ‡ 6Gutek (ZII) 1 ‡ 13 ‡ 2 ‡ 4 ‡ 14Darek (ZII) 2 ‡ 11 ‡ 15 ‡ 1 ‡ 14Robert (CI) 1 ‡ 2 ‡ 11 ‡ 3 ‡ 12 ‡ 3 ‡ 12 ‡ 14 ‡ 12 ‡ 15
For example, Agnes started from conception 10 and then slowly moved towards 15,but these conceptions were never clearly expressed in a more elaborate code. She was theleast affected by the graphical animations on the screen, compared to the other fourstudents, and understood the operation as a repetition of one and the same mapping fromthe beginning. In fact, she explicitly disapproved of representing functions in a two-coordinate system; she said she wanted to "have everything on one axis".
Ewa, who worked with Agnes in the small group setting, was impressed by thegraphical representations and her first conception was the dynamic and visual conception2. Under the influence of Agnes, she would be switching between the algebraic 5 or thefunctional 6, and the visual conception 2, but without making any connection betweenthese two types of conceptions. She never paid attention to how the sequences wereconstructed and thought that the values were calculated for an arbitrary set of arguments.She also never went beyond the restricted code in her verbal expression. Neither Ewa norAgnes had an opportunity to communicate their understandings to a wider audience. Theyonly worked in the small groups.
Gutek was also very impressed by the graphical representations and, at first, heperceived them in a figural way (conception 1). When he was given the task of

16
communicating the idea of iteration and attractive fixed points in a computer-aided lectureto his class, his expressed conception became 13, but he returned to the more visual 2 in aproblem-solving session in a small group. His verbal expression in the lecture was elaboratebut the conceptualisation was not quite consistent. His subsequent work on preparing awritten message for a peer brought him slowly to the more elaborate conception 4 and thento 14.
Like Ewa and Gutek, Darek's first understanding was strongly figural (1), but he wasquickly able to formulate descriptions close to 11 and 15, in a highly elaborate code. Buthe would hold this last conception only on a theoretical level of definitions, not when hehad to actually verify if a concrete function has an attractive fixed point in some interval.Then he would use his first, figural conception 1. He seemed to have a tendency tomechanically draw the segments without making the link with their analytic meaning. It isonly a conflict of interpretation between himself and another student that made him realizethe analytic meaning of these drawings; he expressed conception 15 again, but now heseemed to have a conceptual, and not only a verbal grasp of it. I will describe this conflictsituation more in detail later.
Robert's (CI) conceptual itinerary shows a lot of instability but also an overalltendency towards the most abstract and analytic conception 15, expressed in elaboratecode. At the beginning he had a tendency to applying the "graphical test" rathermechanically. But this led him to mistakes and their realization would bring him to a morebalanced use of the visual and the analytic ways of thinking about attractive fixed points.
Factors of change in students' conceptions of iterations of functions
I distinguished three kinds of factors of conceptual change in students: the socialcontext of the situations, the mathematical problems the students were given to investigateand the teacher interventions.
Social contexts
The highest conceptual "leaps" towards the more balanced conceptions appeared tooccur in situations of preparing a written (but without using drawings) presentation andexplanation of the mathematical ideas first encountered as a student (listening to a lecture,solving problems), and of confrontation with the addressee of the message. This factorcould have such positive influence for the following reasons:
• Students feel responsible for the validity of what they write, because they are inthe position of "owners" (not "subjects") of knowledge;
• Writing without using drawings forces the students to make their understandingsmore explicit and more analytical;
• Students attempt to write a mathematical text that will look like the mathematicaltexts they know, therefore they use what they think is the official mathematical"genre", with its explicit definitions, theorems and its generality and consistency;this brings them to also thinking in more general terms and makes them moresensitive to contradictions.
For example, when preparing a written message for Irena (ZII), who had not taken partin the sessions before, Darek was working with a girl named Monika (from the same

17
group). Monika proposed to explain the concept of attractive fixed point on an exampleand write practical instructions, how to verify if the intersection point is attractive or not,using the graphical test. Darek protested vehemently:
"No, not this way! It must be general! Why are you talking about drawing line segments? Therepresentations of the numbers should come closer and closer to some point. We pull and pull thesequence according to the formula until it comes to this attractive point." (Darek, ZII)
It is in this context that his leap from conception 2 to conception 11 occurred.When solving Problem 2 (which linear functions have attractive fixed points), Gutek
only tested graphically some linear functions and formulated a statement, which heconsidered true without further analytical justification. But when writing the message forIrena, he couldn't just draw; he had to teach another person how to verify if a fixed point isattractive or not, and he was not allowed to use drawings in his explanation. He tried toformulate a general definition:
"The fixed point is contractive if, by consecutive transformations of an arbitrary point of the x-axis- except the fixed point; except, I mean, the value of the fixed point itself - this point comes closerand closer. And we should finally get the fixed point". (Gutek, ZII)
(Note that Gutek says 'contractive' rather than the 'attractive', which was the officialterm introduced in the lecture. He substitutes a personal metaphor for the technical term.This could be interpreted as a symptom of a creative act of understanding. ([20], p. 96))
He then immediately offered an alternative formulation, making more precise themeaning of "consecutive transformations" and using the notion of distance:
"The fixed point is contractive if, by repeating the function constantly, the distance from the fixedpoint comes closer and closer to zero, until infinity". (Gutek, ZII)
I classified it as an expression of conception 14.During the confrontation of the authors of the written messages (Darek and Monika,
and another girl, Aga, who had worked with Gutek; Gutek was absent) with Irena, theauthors and the addressee were separated by a curtain, to enhance verbal communication.Irena first read the messages and tried to understand them. She was asking questions andthe authors provided her with clarifications. Then I asked Irena to solve the followingproblem:
Let ƒ be a function from R to R, defined by the formula ƒ(x) = -2x + 1. Check if this function hasa fixed point. If yes, is this fixed point attractive?
The students behind the curtain were supposed to help her, if she had troubleunderstanding or solving the problem. While Irena was calculating the initial values of theiteration sequence using the definitions provided in the messages (xo arbitrary in an interval,and xn+1 = ƒ(xn) ), with xo = 1, and obtaining –1, 3, –5, the students behind the curtain wereusing a graphical test, without thinking about its analytic meaning. Darek came to theconclusion that attractiveness of the fixed point "depends on whether you go up or downfrom the initial point xo" on the x-axis; if you go up parallel to the y-axis to the graph of thefunction and then horizontally to the y=x axis, etc., then the fixed point is attractive; if yougo down, the point is repellent. He managed to convince Aga and Monika about thisrelativity of attractiveness. But Irena claimed that the point is repellent. Darek said,
"It is repellent because you have started by going down. If you go up at the beginning, the fixedpoint will be attractive. Try to go up now, Irena!" (Darek, ZII)

18
He thus returned to the figural conception 1 from his highly theoretical conception 15,displayed during the session of preparing the written message. But Irena was not confused.
"No! You are wrong! Your reasoning is wrong, because, we have the graph of the function, of thefunction –2x + 1. If you take a point xo, it is some real number, and you put it in place of x in theformula and you compute, then you don't get +1. You get –1! And so you are bound to go down!"(Irena, ZII)
Darek was taken aback. The shock of the shame made him recapitulate the process ofgraphical testing in more analytic terms now (conception 14):
"So first you have the fixed point on the axis y=x. It has its corresponding place on the x-axis. Andall the points you will get on the line y=x will have their corresponding places on the x-axis,namely, their perpendicular projections. This way, you get numbers on the x-axis and you knowwhether the fixed point is attractive or not". (Darek, ZII)
In other communication situations, such as the computer-aided lecture by a student anddirect oral communication of knowledge to a peer (without a curtain) and drawings allowed,students also moved to more balanced conceptions of iteration but the changes were lessspectacular. On the other hand, the situation of solving problems in a small group madestudents express more one-sidedly figural conceptions and in less elaborate language.
I noticed that the constraint of indirect oral communication (through a curtain), with nodrawings allowed, did not automatically produce a more elaborate discourse in the students.In this kind of situation, Robert (CI) used a concrete style of speech reflecting conceptions2 or 3, based on figural understandings of iterations. He may have tried to make the ideaseasier for his peers this way; perhaps speaking in concrete terms was meant to compensatefor not being able to use drawings in the communication.
Mathematical contexts
It appeared that more complicated functions, such as quadratic functions and functionsdefined with different formulas in different intervals, as well as not continuous at somepoint, provoked students to use more balanced visual-analytic thinking about iterations. Onthe other hand, investigation of plain linear functions (as in Problem 2) was easily donewith graphical means alone for the students and they did not bother using analyticalunderstanding. This context was also too familiar for them to raise doubts about theirconjectures and encourage seeking alternative means of verification.
Numerical representations of iteration sequences were not as helpful as expected. Anovice in the area of convergence of sequences seems to notice little in a table of numericalvalues.
Teacher interventions
Among interventions that appeared to enhance more elaborate and balancedconceptions in students were those that provided non-examples highlighting the importanceof some assumptions in a definition, apparently missed by the students. Repeating adefinition to a student who appeared to ignore it in solving a problem, and directly tellingthe student what is wrong with his or her conception was helpful. But it was rather riskyfor me to intervene in a small group's discussion. As I could see after transcribing the tapes,some interventions completely disrupted the students' line of thought and led to lessadvanced conceptions.

19
Final reflections and suggestions
In the teaching experiments described in the previous section, the teacher-generatedvisualization gave rise to initially very primitive, "figural", conceptions. But perhapswithout the initial vivid and dynamic computer animations, no student would havevolunteered to spend so many hours after school on mathematical investigations.
Nevertheless, I propose that, whenever possible and sensible, students should be giventhe opportunity to create their own visualizations, and to explain them to their peers. Itwould be interesting to find what kind of internal and external visualizations students ofdifferent levels of expertise would spontaneously produce; what would be the evolution ofstudents' conceptions if the introductory lesson was reduced to only the general statementof the problem of iteration of functions and students would immediately go to work onexploring iteration sequences of various functions, individually or in groups. When Iformulated the problem to a young teacher of my acquaintance, his first reaction was tothink about the slope of the function. He said that the behaviour of the iteration sequencedepends on the slope of the function and how it is changing; for some functions thesequence may grow "almost exponentially", for others, one would get something like a"dying signal". When I asked him how he would represent iterations graphically, henaturally thought of representing the iteration sequence by a graph in NxR coordinatesystem, independently from the graph of the function itself. But he was more interested inusing the computer to produce the numerical approximations of the sequence than inmaking graphical representations with it. For graphical representation, he thought theywould be more appropriate for iterating geometric transformations. An example he thoughtabout was iteration of a dilation of a triangle, thus producing shrinking or expanding shapes.
FIGURE 6. Spontaneous graphical representations of iteration sequences by a teacher
When I called him the next day, he had already experimented with some functions, suchas (1-x)/x, 4-x, sqrt(4x – x2) and was representing the iteration sequences by points on thegraph: (xn , ƒ(xn)) (Figure 6). He was distinguishing between "dead-ends", obtained from thefirst function by taking xo = 1, which gives only a finite sequence {1, 0}; "infinite circuits",like {-1, 5, -1, 5,…} obtained from the second function; constant sequences, like the oneobtained from the third function by taking xo = 2; and convergent sequences, obtained fromthe third function by taking, for example xo = 1.

20
Thus, not showing this teacher any dynamic representations, and not even writinganything (we communicated by phone), did not make the problem any less attractive forhim. He was quite enthusiastic about the range of possibilities and the freedom ofexploration that the problem offered. He became quite excited about the possibility ofinventing functions that would have interesting iteration sequences. Of course, this was ateacher, and one very devoted to and curious about his subject. Would the same happenwith a high school student, not necessarily very excited about mathematics in general?
In my experience, students appeared to learn a lot by teaching their peers. But theygained most by preparing their lessons in writing and by being confronted with their peers'understanding of the writing. I think that all students, and not only those who plan tobecome teachers, should be given an opportunity to teach their peers. But the studentshould not be left alone in preparing lessons (teacher's guidance is needed) and their lessonsshould leave space for the addressees of their lessons to react and put what they wouldhave learned to the test. There should be sufficient time for preparation of lessons. Hastemay produce "empty speech" in students, who would resort to pseudo-elaborate code,reciting definitions and theorems, rather than explaining their understanding of concepts toothers.
Another lesson from this experience was that problems and examples on whichstudents are supposed to sharpen their understanding of a concept should not be toofamiliar or too easily solved without analytic thinking about the concept. In particular, amore balanced visual-analytic thinking seems to be fostered by "monster examples", whichrepresent extreme or non-prototype cases of a concept; this was the case of certain trivialsolutions to the first problem students had to solve in small groups (to find examples offunctions with a period trajectory 2 ‡ 3 ‡ 2, etc. and an attractive fixed point in the openinterval (2,3)), e.g.,
ƒ(x) =
†
3 for x £ 22.5 for 2 < x < 3
2 for 3 £ x
Ï
Ì Ô
Ó Ô
which helped students realize that their understanding of iteration and attractive fixed pointwas distorted by irrelevant visual details of the graphical "test".
In this and other experiences with external visualizations in the teaching ofmathematics, I had a chance to observe students both enjoy and struggle with theoverwhelming power of visualization over their thinking. They engaged in the mathematicalactivities because they were attracted by these visualizations and what they could do withthem; but they were frustrated by finding how often their eyes deceived them to attend toirrelevant aspects and miss the main conceptual point of the representation.
The conclusion is not that external visualizations cause internal cognitive obstacles andshould be avoided in the teaching of mathematics. Rather, the implication is that,
• internal visualization is an unavoidable and important part of mathematical thinkingand the development of its more sophisticated (structural, spatial) forms shouldbecome one of the goals of teaching mathematics; and,
• mathematicians' external visualizations may be opaque to the novice; theirunderstanding requires time and well constructed tasks for the students; "a picture
21
may be worth a thousand words", but the use of teacher-generated visualizations inteaching neither shortens the time of students' learning nor makes it easier.
References
1. A. Arcavi, The role of visual representations in the learning of mathematics,Educational Studies in Mathematics 52(3) (2003), 215-241.
2. F. Arzarello, & O. Robutti, From body motion to algebra through graphing,Proceedings of the 12th ICMI Study Conference on The Future of the Teaching andLearning of Algebra, The University of Melbourne, Australia, December 9-14,2001, Vol. 1, 33-40.
3. L. Bazzini, From grounding metaphors to technological devices: A call forlegitimacy in school mathematics, Educational Studies in Mathematics 47(3) (2001),259-271.
4. L. Bazzini, Il pensiero analogico nell'apprendimento della matematica:considerazioni theoriche e didattiche, L'Inseignamento della Matematica e dellescienze Integrate, 18A(2) (1995), 107-129.
5. B. Bernstein, Class, Codes and Control, Routledge and Kegan Paul, 1977.6. T. Brown, F. Eade, & D. Wilson, Semantic innovation: Arithmetical and algebraic
metaphors within narratives of learning, Educational Studies in Mathematics 40(1)(1999), 53-70.
7. M.C. Corballis, Mental rotation and the right hemisphere, Brain and Language 57(1)(1997), 100-121.
8. R. Hershkowitz, D. Ben-Chaim, C. Hoyles, G. Lappan, M. Mitchelmore &S. Vinner, Psychological aspects of learning geometry, in P. Nesher & J. Kilpatrick(eds), Mathematics and Cognition, ICMI Study Series, Cambridge University Press(1989), 70-95.
9. A. Jackson, The world of blind mathematicians, Notices of the AMS, November2002, 1246-1251.
10. C. Kieran, E. Forman, & A. Sfard (eds), Bridging the individual and the social:discursive approaches to research in mathematics education, Special issue ofEducational Studies in Mathematics 46 (1-3) (2001), 13-271.
11. G. Lakoff & R. Nuñez, Where mathematics comes from, Basic Books, 2000.12. M. Marody, Technologie Intelektu, Panstwowe Wydawnictwo Naukowe, 1987.13. R. Nuñez, Mathematical ideas analysis: What embodied cognitive science can say
about the human nature of mathematics, Proceedings of the 24th Annual Conferenceof the International Group for the Psychology of Mathematics Education,Hiroshima, Japan, July 19-26, (2000), Vol. 1, 3-22.
14. M. Raman, Key ideas: what are they and how they can help us understand howpeople view proof? Educational Studies in Mathematics 52(3) (2003), 319-325.
15. T. Rojano, E. Filloy-Yague & A. Solares, Cognitive tendencies and the interactionbetween semantics and algebraic syntax in the production of syntactic errors,Proceedings of the 26th Annual Conference of the International Group for thePsychology of Mathematics Education in Norwich, U.K. (2002), Vol. 4, 129-136.

22
16. A. Sierpinska, On 15-17 years old students' conceptions of functions, iterations offunctions and attractive fixed points, Preprint 454, Institute of Mathematics, Pol.Acad. Sci., Warsaw, Poland, 1989.
17. A. Sierpinska, Some remarks on understanding in mathematics, For the Learning ofMathematics 10(3) (1990), 24-36.
18. A. Sierpinska, On some aspects of students’ thinking in linear algebra, in J.-L.Dorier (ed.), On the Teaching of Linear Algebra, Kluwer Academic Publishers(2000), 209-246.
19. A. Sierpinska, On understanding the notion of function, in E. Dubinsky & G. Harel(eds), The concept of function: Elements of Pedagogy and Epistemology. Notes andReports Series of the Mathematical Association of America, Vol. 25 (1992), 25-58.
20. A. Sierpinska, Understanding in Mathematics, London: The Falmer Press, 1994.21. D.A. Stylianou & D. Pitta-Pantazi, 2002, Visualization and high achievement in
mathematics: A critical look at successful visualization strategies, in F. Hitt (ed.),Representations and mathematics visualization, Proceedings of a Working Group atthe PME-NA Conference, CINVESTAV-IPN, Mexico (2002), 31-45.
22. D.O. Tall & E.-T. Chin, University students' embodiment of quantifier, Proceedingsof the 26th Annual Conference of the International Group for the Psychology ofMathematics Education in Norwich, U.K. (2002), Vol.4, 273-280.
23. F.J. Varela, E. Thompson & E. Rosch, The Embodied Mind. Cognitive Science andHuman Experience, The MIT Press, 1991.
24. J. Vlassis, The balance model: hindrance or support for the solving of linearequations with one unknown, Educational Studies in Mathematics 49(3) (2002),341-359.
25. L.S. Vygotsky, The genesis of higher mental functions, in J. Wertsch (ed.), TheConcept of Activity in Soviet Psychology, Sharpe, 1931/1981.
26. E. Wenger (ed.), Communities of Practice: Learning, Meaning and Community,Cambridge University Press, (1998), 43-102.
Anna SierpinskaConcordia UniversityDepartment of Mathematics & Statistics7141 Sherbrooke St. WestMontreal, PQ, H4B 1R6<[email protected]>