Visual search improvement in hemianopic patients after audio-visual stimulation
13
doi:10.1093/brain/awh656 Brain (2005), 128, 2830–2842 Visual search improvement in hemianopic patients after audio-visual stimulation Nadia Bolognini, 1,2 Fabrizio Rasi, 2,3 Michela Coccia 4 and Elisabetta La `davas 1,2 1 Dipartimento di Psicologia, Universita ` degli Studi di Bologna, Bologna, 2 CsrNC, Centro di studi e ricerche in Neuroscienze Cognitive, 3 Dipartimento di Neuroscienze, Ospedale Bufalini, Cesena and 4 Clinica di Neuroriabilitazione, Azienda Ospedali Riuniti Lancisi-Salesi- Umberto I, Ancona, Italy Correspondence to: Elisabetta La `davas, Department of Psychology, University of Bologna, Viale Berti Pichat, 5-40127 Bologna, Italy E-mail: [email protected] One of the most effective techniques in the rehabilitation of visual field defects is based on implementation of oculomotor strategies to compensate for visual field loss. In the present study we develop a new rehabilitation approach based on the audio-visual stimulation of the visual field. Since it has been demonstrated that audio- visual interaction in multisensory neurons can improve temporally visual perception in patients with hemian- opia, the aim of the present study was to verify whether a systematic audio-visual stimulation might induce a long-lasting amelioration of visual field disorders. Eight patients with chronic visual field defects were trained to detect the presence of visual targets. During the training, the visual stimulus could be presented alone, i.e. unimodal condition, or together with an acoustic stimulus, i.e. crossmodal conditions. In the crossmodal con- ditions, the spatial disparity between the visual and the acoustic stimuli were systematically varied (0, 16 and 32 of disparity). Furthermore, the temporal interval between the acoustic stimulus and the visual target in the crossmodal conditions was gradually reduced from 500 to 0 ms. Patients underwent the treatment for 4 h daily, over a period of nearly 2 weeks. The results showed a progressive improvement of visual detections during the training and an improvement of visual oculomotor exploration that allowed patients to efficiently compensate for the loss of vision. More interesting, there was a transfer of treatment gains to functional measures assessing visual field exploration and to daily-life activities, which was found stable at the 1 month follow-up control session. These findings are very promising with respect to the possibility of taking advantage of human mul- tisensory capabilities to recover from unimodal sensory impairments. Keywords: multisensory integration; visual field defect; oculomotor compensation; rehabilitation Abbreviations: RT = reaction time; SC = superior colliculus; SOA = stimulus onset asynchrony Received June 17, 2005. Revised August 30, 2005. Accepted September 2, 2005. Advance Access publication October 11, 2005 Introduction Visual field defects are common consequences of posterior brain injury. Nearly 80% of patients with unilateral post- chiasmal brain damage acquired a homonymous visual field defect (Zihl, 1994), in which there is the loss of vision in one hemifield, which corresponds retinotopically to the damaged area (Zihl and Kennard, 1996). Spontaneous com- plete recovery from scotoma is very unusual, occurring in <20% of all patients. Recovery depends on the underlying pathology: homonymous visual field defects from vascular disease seem to have a poor prognosis for a spontaneous recovery, while a more remarkable recovery from scotoma often occurs after traumatic damage (Zihl and von Cramon, 1985). Recovery of vision normally occurred within 8–12 weeks, after that further recovery is negligible (Pambakian and Kennard, 1997; Zihl, 2000). Impairments in visual exploration and reading represent the most common consequences of visual field disorders. Patients with visual field disorders exhibit impairments of visual orientation and a typical defective oculomotor scanning behaviour. Consequently, patients omit objects and relevant parts of scene located in their blind hemifield (Zihl, 1995, 2000; Zihl and Hebel, 1997; Hildebrandt et al., 1999; Pambakian et al, 2000; Tant et al., 2002). Moreover, visual field sparing of <5 is typically associated with impaired reading, which constituted a major source of visual disability. It is well known that parafoveal field regions form a # The Author (2005). Published by Oxford University Press on behalf of the Guarantors of Brain. All rights reserved. For Permissions, please email: [email protected] by guest on June 2, 2016 http://brain.oxfordjournals.org/ Downloaded from
-
Upload
independent -
Category
Documents
-
view
0 -
download
0
Transcript of Visual search improvement in hemianopic patients after audio-visual stimulation

doi:10.1093/brain/awh656 Brain (2005), 128, 2830–2842
Visual search improvement in hemianopicpatients after audio-visual stimulation
Nadia Bolognini,1,2 Fabrizio Rasi,2,3 Michela Coccia4 and Elisabetta Ladavas1,2
1Dipartimento di Psicologia, Universita degli Studi di Bologna, Bologna, 2CsrNC, Centro di studi e ricerche inNeuroscienze Cognitive, 3Dipartimento di Neuroscienze, Ospedale Bufalini, Cesena and 4Clinica di Neuroriabilitazione,Azienda Ospedali Riuniti Lancisi-Salesi- Umberto I, Ancona, Italy
Correspondence to: Elisabetta Ladavas, Department of Psychology, University of Bologna, Viale Berti Pichat,5-40127 Bologna, ItalyE-mail: [email protected]
One of the most effective techniques in the rehabilitation of visual field defects is based on implementation ofoculomotor strategies to compensate for visual field loss. In the present study we develop a new rehabilitationapproach based on the audio-visual stimulation of the visual field. Since it has been demonstrated that audio-visual interaction in multisensory neurons can improve temporally visual perception in patients with hemian-opia, the aim of the present study was to verify whether a systematic audio-visual stimulation might induce along-lasting amelioration of visual field disorders. Eight patients with chronic visual field defects were trained todetect the presence of visual targets. During the training, the visual stimulus could be presented alone, i.e.unimodal condition, or together with an acoustic stimulus, i.e. crossmodal conditions. In the crossmodal con-ditions, the spatial disparity between the visual and the acoustic stimuli were systematically varied (0, 16 and 32�
of disparity). Furthermore, the temporal interval between the acoustic stimulus and the visual target in thecrossmodal conditions was gradually reduced from 500 to 0ms. Patients underwent the treatment for 4 h daily,over a period of nearly 2 weeks. The results showed a progressive improvement of visual detections during thetraining and an improvement of visual oculomotor exploration that allowed patients to efficiently compensatefor the loss of vision. More interesting, there was a transfer of treatment gains to functional measures assessingvisual field exploration and to daily-life activities, which was found stable at the 1 month follow-up controlsession. These findings are very promising with respect to the possibility of taking advantage of human mul-tisensory capabilities to recover from unimodal sensory impairments.
Keywords: multisensory integration; visual field defect; oculomotor compensation; rehabilitation
Abbreviations: RT = reaction time; SC = superior colliculus; SOA = stimulus onset asynchrony
Received June 17, 2005. Revised August 30, 2005. Accepted September 2, 2005. Advance Access publication October 11, 2005
IntroductionVisual field defects are common consequences of posterior
brain injury. Nearly 80% of patients with unilateral post-
chiasmal brain damage acquired a homonymous visual
field defect (Zihl, 1994), in which there is the loss of vision
in one hemifield, which corresponds retinotopically to the
damaged area (Zihl and Kennard, 1996). Spontaneous com-
plete recovery from scotoma is very unusual, occurring in
<20% of all patients. Recovery depends on the underlying
pathology: homonymous visual field defects from vascular
disease seem to have a poor prognosis for a spontaneous
recovery, while a more remarkable recovery from scotoma
often occurs after traumatic damage (Zihl and von
Cramon, 1985). Recovery of vision normally occurred within
8–12 weeks, after that further recovery is negligible
(Pambakian and Kennard, 1997; Zihl, 2000).
Impairments in visual exploration and reading represent
the most common consequences of visual field disorders.
Patients with visual field disorders exhibit impairments
of visual orientation and a typical defective oculomotor
scanning behaviour. Consequently, patients omit objects
and relevant parts of scene located in their blind hemifield
(Zihl, 1995, 2000; Zihl and Hebel, 1997; Hildebrandt et al.,
1999; Pambakian et al, 2000; Tant et al., 2002). Moreover,
visual field sparing of <5� is typically associated with impaired
reading, which constituted a major source of visual disability.
It is well known that parafoveal field regions form a
# The Author (2005). Published by Oxford University Press on behalf of the Guarantors of Brain. All rights reserved. For Permissions, please email: [email protected]
by guest on June 2, 2016http://brain.oxfordjournals.org/
Dow
nloaded from

‘perceptual window’ for reading, subserving letter identi-
fication and playing a crucial role in both text recognition
and guidance of eye movements in reading (Chedru et al,
1973; Zihl, 1995; Pambakian et al, 2000). Thus, parafoveal
field loss affects reading at the sensory level, preventing
patients from perceiving a word as a whole and impairing
the visual guidance of eye movements in reading. As a con-
sequence, the reading performance, i.e. correctly read words,
is markedly reduced (Poppelreuter, 1971/1990; Morris et al.,
1990; Zihl, 1995, 2000).
Patients with visual field defects complain about many
difficulties in daily-life activity: as the visual field defect
restricts the patient’s overview, they complain of difficulties
with noticing persons or relevant objects, avoiding obstacles,
driving, walking and many other activities (Pambakian and
Kennard 1997; Zihl, 2000).
Some of the most useful approaches to the treatment of
hemianopia are based on making up for visual field loss
by oculomotor compensation. Usually, the training involves
psychophysical techniques based on a top-down mechanism,
aimed at strengthening the patient’s attention for the blind
hemifield and improving their ability to explore the visual
field with saccadic movement (Zihl, 1981, 1995, 2000;
Kerkhoff et al., 1992, 1994; Pambakian and Kennard, 1997;
Kerkhoff, 1999, 2000; Nelles et al., 2001; Pambakian et al.,
2004). Two procedures have been used: a training to enlarge
saccade amplitudes or a training to implement visual search
by using search paradigms. With these trainings, some
authors have obtained an amelioration of explorative eye
movements and of visual exploration, that enabled hemi-
anoptic patients to overcome and efficiently compensate
for the visual field loss (Zihl, 1980, 1981, 2000; Kerkhoff
et al., 1992, 1994; Pambakian and Kennard 1997; Kerkhoff,
1999, 2000; Nelles et al., 2001; Pambakian et al., 2004). These
procedures, however, require patients to voluntarily maintain
attention oriented to the affected hemifield. Moreover, in
patients with additional lesion to the striate cortex, such as
injury to the thalamus, parieto-occipital structures and white
matter, the treatment effect was smaller (Zihl, 2000).
In the present study we developed a new approach to the
compensatory visual field training based mainly on a bottom-
up mechanism, involving a multisensory integration mecha-
nism, that seems to be very promising because it does not
require patients’ ability to voluntarily maintain attention
oriented to the affected field (Pizzamiglio et al., 1992;
Ladavas et al., 1994), which may be difficult for brain-
damaged patients.
Neurophysiological studies in animals (Stein andMeredith,
1993) have shown, in superior colliculus (SC) and regions
of cortex, the existence of neurons responding to stimuli
from different sensory modalities. In particular, multisensory
neurons form a major component of the output circuitry
of SC, since nearly three-quarters of the SC’s neurons with
descending efferent projections to brain stem motor areas are
multisensory. Thus, multisensory integration might play
a significant role in behaviours mediated by SC, as the
attentive and orientation behaviours as well as saccadic eye
movements (Stein, 1998).
Recent behavioural studies in humans have documented
that audio-visual interaction can improve visual detection
(Frassinetti et al., 2002a, b; Bolognini et al., 2005a), and visual
localization (Hairston et al., 2003) and reduce saccadic reac-
tion times (RTs) (Harrington and Peck, 1998; Hughes et al.,
1998; Colonius and Arndt, 2001; Corneil et al., 2002; Arndt
and Colonius, 2003). In particular, it has been found that a
sound, spatially and temporally coincident to a visual stimu-
lus, can improve visual perception in the blind hemifield of
hemianopic patients (Frassinetti et al., 2005). Based on these
findings, we investigated the possibility to induce a long-
lasting amelioration of visual field defects by using a training
based on a systematic audio-visual stimulation of the visual
field. For this purpose, eight patients with homonymous
hemianopia or quadrantopia underwent the audio-visual
training over a period of 2 weeks.
The improvement of patients’ performance in the training
sessions was assessed by measuring in each session the per-
centages of visual detections in the unimodal and crossmodal
conditions. Furthermore, to evaluate the effect of the audio-
visual training on visual disorders, different visual abilities,
i.e. visual detections, visual exploration and reading abilities,
were assessed before and after the treatment. In particular, to
assess whether the improvement is due to an enlargement of
the visual size or to the ability to compensate for visual field
loss by using eye movements, visual detection in the blind
hemifield was measured using different tests under two dif-
ferent conditions: Eye-Movements Condition and Fixed-Eyes
Condition. If the improvement is due to a restitution of visual
field, one might expect an amelioration in each condition. On
the other hand, if the improvement is to be ascribed only to
the implementation of oculomotor compensatory strategies,
without a restitution of visual field, one might expect an
improvement only in the Eye-Movements Condition.
Finally, to evaluate the transfer of the training’s gain to
daily life, a questionnaire investigating the most impaired
daily activities was given to the patients before and after
the treatment.
Subjects and methodsSubjectsSelection of patients was based on complete availability of visual
perimetry (see Fig. 1A and B). Eight patients with chronic visual field
defect participated in the study. They gave informed consent to
participate according to the Declaration of Helsinki (International
Committee of Medical Journal Editors, 1991) and the Ethical Com-
mittee of the Department of Psychology, University of Bologna.
Details concerning sex, age, length of illness, lesion sites and the
presence of visual field defect are reported in Table 1. The patients
had suffered unilateral lesion in the right or left posterior hemi-
sphere, as confirmed byMRI scanning (see Fig. 2A and B). The lesion
of each patient was reconstructed and areas involved by the lesion
were also coded using the method introduced by Damasio and
Damasio (1989) (see Table 2).
Audio-visual training of hemianopia Brain (2005), 128, 2830–2842 2831
by guest on June 2, 2016http://brain.oxfordjournals.org/
Dow
nloaded from

Patients showed a normal hearing, as measured by audiometry in
each ear, with no sign of asymmetry between ears, and a normal or
corrected binocular visual acuity for near and far space. Patients with
neglect were excluded from the study.
All patients underwent a neuropsychological examination of
visual field disorders that consisted in the assessment of: (i) visual
detections; (ii) visual scanning; (iii) hemianopic dyslexia; (iv) self
evaluation questionnaire of activities of daily living.
Assessment of visual field disordersAssessment of visual detectionsIn order to investigate whether patients were able to compensate
for the visual field loss by using eye movements, patients underwent
each test under two conditions. In the Eye-Movements Condi-
tion, patients were free to use eye movements to detect the visual
target. Otherwise, in the Fixed-Eyes Condition, eye movements
were not allowed and the fixation was monitored by the
experimenter.
Unimodal visual test. Visual detections were assessed by using the
apparatus employed for the presentation of the training procedure
(see Subjects and methods). A visual target was presented for 100 ms
in different spatial positions, at 8, 24, 40 and 56� from either side of
the central fixation point. 120 trials were presented: 12 trials for each
of the 8 visual positions and 24 trials in which no visual stimulus was
presented, i.e. catch trials. The total number of trials was equally
distributed in three blocks. Patients were instructed to press a
A B
Fig. 1 (A) The figure depicts the reconstruction of the visual field based on the computerized perimetry for each patient of G1.LE = left eye; RE = right eye. Black areas: regions of lost vision; black with white dots areas: amblyopic regions; white areas: intact regions.(B) The figure depicts the reconstruction of the visual field based on the computerized perimetry for each patient of G2. LE = left eye;RE = right eye. Black areas: regions of lost vision; black with white dots areas: amblyopic regions; white areas: intact regions.
Table 1 Summary of the clinical data
Group Patient Age/sex Onset ofillness (months)
Lesion site Visual field defect
G1 DC 77, F 10 Right occipital Left homonymous hemianopiaMS 42, F 12 Left parietal-occipital Right lower quadrantanopiaQT 70, M 4 Right occipital Left homonymous hemianopiaVC 40, F 13 Left temporo-occipital Right homonymous hemianopia
G2 MM 47, F 7 Right occipital Left homonymous hemianopiaBV 55, M 15 Right temporo-parietal Left homonymous hemianopiaSP 56, F 24 Not available Right homonymous hemianopiaAQ 70, M 11 Left temporo-occipital Right homonymous hemianopia
2832 Brain (2005), 128, 2830–2842 N. Bolognini et al.
by guest on June 2, 2016http://brain.oxfordjournals.org/
Dow
nloaded from

response button after the detection of the targets and visual detec-
tions for each spatial position were recorded.
Computerized visual field test. The stimulus array was of 52� · 45�
(horizontally and vertically, respectively), projected on the wall.
The viewing distance was 120 cm. Targets were white dots (1�),presented for 100 ms at different positions on a black background.
The fixation point was a red cross presented on the centre of the slide.
The total number of targets presented was 96, i.e. 24 targets for each
quadrant of the visual field. The task was to press a response button
after the detection of the target. Visual detections and RTs were
measured.
Assessment of visual scanningVisual search test. This test consisted three subtests: the E–F test, the
Triangles test and the Number test. Patients were shown the stimulus
arrays (52� · 45�, horizontally and vertically respectively) projected
on slides at a distance of 120 cm and they were required to actively
explore the visual field by using eye, but not head, movements to
search for visual targets.
E–F test (modified from Zihl, 2000). Each stimulus array contained
21 stimuli, distributed at random over the array. The stimuli con-
sisted of green letters, projected on a black background. 20 trials were
presented: 16 trials in which the target was present and 4 in which the
target was absent. Patients were instructed to fixate the red cross
located in the centre of the slide (i.e. fixation point) and to search,
after the disappearance of the cross, for a single target (i.e. the green
letter ‘F’) embedded among distracters (the green letters ‘E’). They
had to report the presence of the target, by pressing a ‘yes’ key
response if the target was present and a ‘no’ key response if it was
absent. Correct responses and RTs were recorded.
A B
Fig. 2 The figure depicts the graphical reconstruction of the lesion according to Damasio and Damasio’s atlas (1989) for each patientof (A) G1 and (B) G2.
Table 2 Summary of lesion data: anatomical areas involved (x) by lesion are coded using the method introduced byDamasio and Damasio (1989)
Group Patient Frontal lobe Temporal lobe Parietal lobe Occipital lobe
F2 F8 T3 T4 T5 T6 T7 T8 T9 T10 T11 T12 P1 P2 P3 P5 P6 O1 O2 O3 O4 O5 O6 O7
G1 DC x x x x x xMS x x x x x x xQT x x x x x x x xVC x x x x x x x x x x x x x x
G2 BV x x x x x x x x x x x x x x x x x x xMM x x x x xSP Not availableAQ x x x x x x x x x x x
Audio-visual training of hemianopia Brain (2005), 128, 2830–2842 2833
by guest on June 2, 2016http://brain.oxfordjournals.org/
Dow
nloaded from

Triangles test (modified from Zihl, 2000). Patients were shown stimu-
lus arrays, each containing 21 stimuli, distributed at random over the
array and presented on a black background. Different shapes of the
same size were used as stimuli: yellow squares as distracters and
yellow triangles as targets. The number of targets presented in
each trial varied from 0 to 13. As the number of targets increased,
the number of distracters decreased, thus in each stimulus array there
were always 21 stimuli. The total number of trials was 20. Patients
were instructed to fixate a red cross presented in the centre of
the slide (i.e. fixation point) and, after the disappearance of the
cross, to search and report the total number of targets. Moreover,
after having found a target, patients had to indicate it by using a
light pointer.
Correct responses and time for searching performance were
recorded.
Number test (modified from Zihl, 2000). Eight stimulus arrays,
each containing 15 numbers (from number 1 to 15) distributed at
random over a black background, were presented. The task was to
point to the individual numbers in an ascending order using a light
pointer.
Time for error-free searching performance was recorded.
Assessment of hemianopic dyslexiaOnly dyslexia for single word reading task was assessed. Stimuli
comprised 48 letter strings, 24 of 9 and 24 of 11 letters in length.
Each string was always composed of upper-case letters (0.7 · 0.7 cm;
0.95� · 0.95�) separated by a single character space (0.7 · 0.7 cm;
0.95� · 0.95�). Stimuli were printed in white against a black back-
ground, and they were displayed horizontally at the centre of the
video screen, one at the time. Half of the stimuli (n = 24) were
common Italian words, and the remaining half (n = 24) were
non-words generated by changing two letters of each word. The
substituted letters were located at the beginning and at the end
of the stimulus. All non-word strings were pronounceable and
orthographically legal. Compound words were not used. Word
and non-word stimuli were presented separately. Subjects received
the two lists in separate block of trials. A fixation cross was pre-
sented in the centre of the video screen. After the central cross
was extinguished, the stimulus was displayed for a maximum of
4000 ms. The subject’s task was to look at the string and to report
verbally what he had read. Responses were recorded.
ADL—self evaluation questionnaire of activities of dailyliving (modified from Kerkhoff et al., 1994)A questionnaire based on 10 items describing the most frequent
visual impairments of patients with visual field defect was completed
by patients. The following items were presented: 1, seeing obstacles;
2, bumping into objects/obstacles; 3, losing the way; 4, finding
objects on the table; 5, finding objects in the room; 6, finding
objects in the supermarket; 7, walking in a crowd; 8, reading; 9,
to go upstairs/downstairs on the staircase; 10, crossing the streets.
For each item, patients had to judge on a five point scale to what
extent they experienced the problem in question. The scale was as
follows: 0, no problem; 1, rare problem; 2, partially relevant problem;
3, frequent problem; 4, very frequent problem. To minimize the
tendency of the patients to respond in a socially desirable manner
after the training, they were not informed about their ratings at the
beginning of the training.
Audio-visual trainingApparatus and stimuliThe apparatus consisted of a semicircular structure in which the
visual and the acoustical stimuli were positioned. The apparatus
was a plastic horizontal arc (height 30 cm, length 200 cm) fixed
on the table surface.
The acoustical stimuli were eight piezoelectric loudspeakers
(0.4 W, 8 V), located horizontally at the subject’s ear level, at an
eccentricity of 8, 24, 40, 56� in the hemianopic hemifield and in
the intact hemifield. The loudspeakers were covered by a strip of
black fabric, attached to a plastic arc, preventing any visual cues
about their position. The sounds were created by a white-noise
generator (80 dB). Six visual stimuli were located directly in front
of the loudspeakers: the light displays, poking out of the black fabric,
were placed at an eccentricity of 24, 40 and 56� to either side of the
fixation point. Note that we refer to the auditory positions by labels
A1–A8 moving from left to right, and similarly we described
the corresponding visual stimuli positions by labels V1–V6 (see
Fig. 3).
The visual stimulus consisted of the illumination of the red LED
(luminance 90 cd m�2 each). The visual stimulus and the acoustical
target had the same duration of 100 ms. Timing of stimuli was
controlled by an ACER 711TE laptop computer, using a custom
program (XGen-Experimental Software, http://www.psychology.
nottingham.ac.uk/staff/cr1/) and a custom hardware interface.
Training procedurePatients sat on a chair in a low illuminated and sound attenuated
room, at �70 cm in front of the apparatus, facing straight ahead,
with their body midline aligned with the centre of the apparatus.
To present visual targets in the blind region of the visual hemifield,
the central fixation point was moved along the central vertical axis
of the apparatus. The fixation point was on the median plane
for patients with homonymous hemianopia (see Fig. 3), 30� above
the semicircular structure used for stimuli presentation in case
of patients with inferior quadrantopia and 30� below for patients
with superior quadrantopia.
Patients were required to look at the fixation point, a white tri-
angle (1�), and to explore the blind hemifield by shifting their gaze
towards the visual stimulus, without head movements. They were
instructed to detect the presence of the visual target by pressing a
button and to ignore the auditory stimuli, since they were not pre-
dictive of the presence of the visual target. Before each trial, fixation
Fig. 3 Bird’s eye schematic view of the position of loudspeakersand light displays.
2834 Brain (2005), 128, 2830–2842 N. Bolognini et al.
by guest on June 2, 2016http://brain.oxfordjournals.org/
Dow
nloaded from

was monitored visually by the experimenter standing behind the
apparatus, facing the subject. The experimenter starts each trial
only after the correct posture was achieved. The treatment was
carried out under binocular conditions.
Three different kinds of sensory stimulation were presented:
(i) unimodal visual condition, in which only the visual target was
present; (ii) unimodal auditory condition, in which only the auditory
stimulus was present, i.e. catch trial; (iii) crossmodal visual-auditory
condition: a sound presented together with the visual target. In the
crossmodal conditions, the sound could be presented either in
the same position of the visual stimulus, i.e. spatially coincident
crossmodal condition (SP), or in a different position, i.e. spatially
disparate crossmodal condition, at 16 and 32� of nasal (16n, 32n
respectively) or temporal (16t, 32t respectively) disparity from the
visual target.
During the training, the hemianopic hemifield was more inten-
sively stimulated than the intact hemifield. For each block, 48 trials
were presented: 9 unimodal visual trials (6 trials for the hemianopic
hemifield and 3 for the intact hemifield); 8 unimodal auditory trials
(6 for the hemianopic hemifield and 2 for the intact hemifield);
8 crossmodal spatially coincident trials (6 for the hemianopic hemi-
field and 2 for the intact hemifield); 23 crossmodal spatially disparate
trials (20 for the hemianopic hemifield and 3 for the intact hemi-
field). The number of blocks varied for each patient, depending
on individual progress in each stimulus onset asynchrony (SOA)
session (see below).
Since visual exploration in hemianopic patients is usually difficult
and time-consuming, the training was rendered less difficult by
having different temporal intervals between the two stimuli. Thus,
the training was divided in six sessions with different temporal
intervals (SOA) between the acoustic and the visual stimulus. The
treatment started with 500 ms of SOA, i.e. the auditory stimulus
preceded the visual target 500 ms, and the SOA was reduced in
steps of 100 ms (i.e. 400, 300, 200 and 100 ms) up to the last session
of the training, in which the stimuli were simultaneous (i.e. 0 ms of
SOA). Each SOA session terminated when a hit ratio of at least
50% in unimodal visual condition was obtained. Once the patient
reached this criterion, the next SOA session began.
The treatment finished when patients detected >50% of unimodal
visual stimuli for three consecutive blocks of trials in the simul-
taneous presentation of audio-visual stimuli (last SOA session).
This percentage, although it represents a low level of performance,
was positively correlated with visual scanning amelioration in a pilot
experiment aimed to establish the criterion for the end of the treat-
ment. It is worthwhile to remember that due to the target exposition
time (100 ms), the task was very difficult for the patients.
Each daily session lasted �4 h, separated by frequent breaks
according to the patients’ performance and tiredness. All patients
completed the training in 2 weeks.
Testing procedureTreatment efficacy was evaluated by using a multiple-baseline design.
Each patient was tested before the treatment, after treatment and
after a resting period of 1 month. The aim of having different
patients’ visual abilities evaluations was 2-fold: (i) to provide
a pre-treatment and a post-treatment performance assessment;
(ii) to monitor a possible spontaneous recovery of the visual dis-
abilities. Therefore, patients were divided in two groups. The first
group (G1) underwent the first evaluation of the visual field
deficits before the treatment (i.e. baseline), the second evaluation
immediately at the end of the treatment (i.e. post-training) and
a third evaluation was conducted after 1 month from the end of
the treatment (i.e. 1 month). By contrast, the second group (G2)
underwent a first evaluation of the visual field deficits 1 month
before starting the training (i.e. baseline 1) and immediately before
the treatment (i.e. baseline 2). No treatment was provided in the
period occurring between the two baselines. Finally, an assessment
of visual field disorders was carried out immediately at the end of
the treatment (i.e. post-training).
ResultsAll the analyses were carried out using different ANOVAs.
Whenever necessary, pairwise comparisons were conducted
using Newman–Keuls test.
Audio-visual trainingIn order to assess the relative improvement of visual abilities
during the training sessions, the different spatial positions on
the hemianopic hemifield (V1, V2, V3) were collapsed and
one between group (G1 and G2) ANOVA was conducted
on the percentages of visual detections, converted in arcsine
values, in unimodal visual conditions before the treatment
and in training sessions. There were also very few (<9%)
false positives on catch trials, so these too were not analysed
statistically. The main factor was Session: baseline, i.e.
patients’ performance before the treatment, and training
sessions (i.e. SOA 500, 400, 300, 200, 100 and 0 ms). Note
that in the baseline session the audio-visual stimulation was
temporally coincident, i.e. 0 ms of SOA. Session was the
only significant effect [F(6,36) = 20.01, P < 0.000001]: in
each group, the difference between the baseline and each
training session was significant (P < 0.0002 in all compar-
isons) (see Fig. 4).
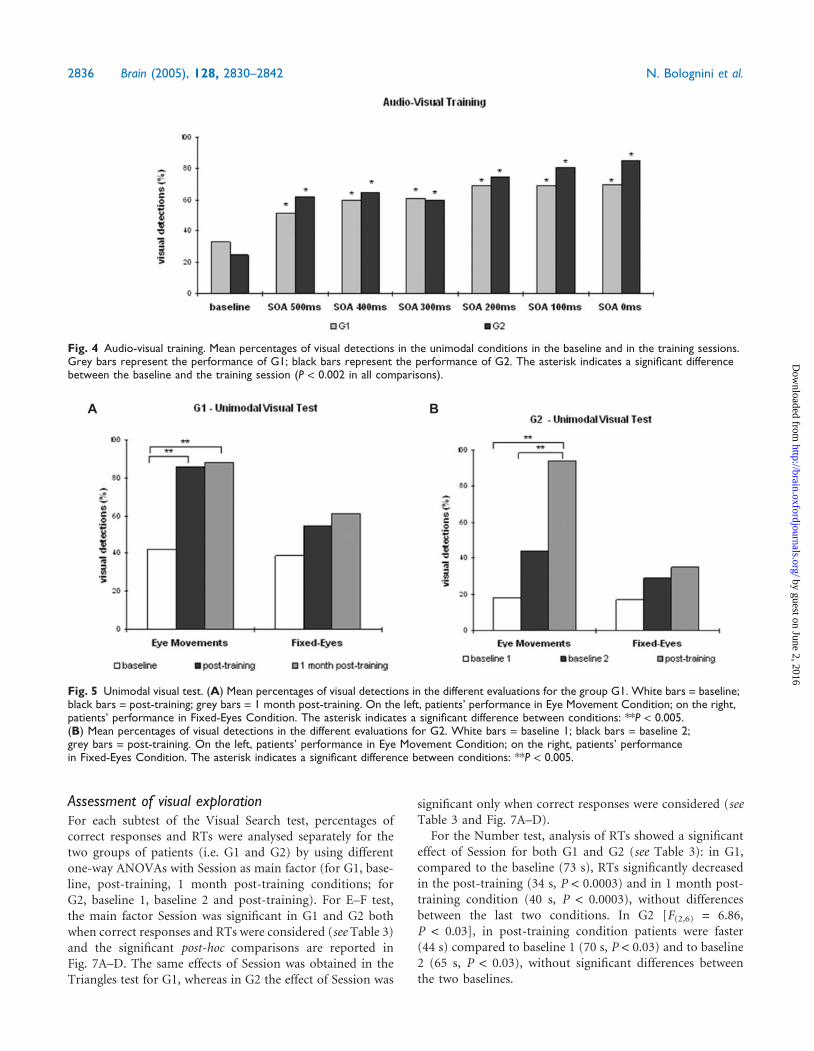
Assessment of visual detectionsFor each group of patients (G1 and G2), the improvement
of visual detections was assessed by using a two-way ANOVA
on the percentages of visual detections to stimuli presented
in the hemianopic hemifield in two tests (Unimodal Visual
Field test and Computerized Visual Field test). Since all
patients had an almost correct performance in the intact
hemifield (near 100% of visual detections), the analyses
were conducted only for the impaired hemifield. The main
factors were Condition (Eye Movements and Fixed-Eyes)
and Session with the following conditions: for group G1,
there were baseline, post-training, 1 month post-training
conditions; for G2, there were baseline 1, baseline 2 and
post-training conditions. In the Unimodal Visual test,
the interaction Condition · Session was significant in G1
[F(2,6) = 5.19, P < 0.05] and in G2 [F(2,6) = 15.01,
P < 0.005] (see Fig. 5A and B).
The same significant effect of the interaction Condition ·Session was obtained in the Computerized Visual Field test
in G1 [F(2,6) = 25.85, P < 0.001], while it was marginally
significant in G2 [F(2,6) = 4.31, P < 0.06] (see Fig. 6A and B).
Audio-visual training of hemianopia Brain (2005), 128, 2830–2842 2835
by guest on June 2, 2016http://brain.oxfordjournals.org/
Dow
nloaded from
Assessment of visual explorationFor each subtest of the Visual Search test, percentages of
correct responses and RTs were analysed separately for the
two groups of patients (i.e. G1 and G2) by using different
one-way ANOVAs with Session as main factor (for G1, base-
line, post-training, 1 month post-training conditions; for
G2, baseline 1, baseline 2 and post-training). For E–F test,
the main factor Session was significant in G1 and G2 both
when correct responses and RTs were considered (see Table 3)
and the significant post-hoc comparisons are reported in
Fig. 7A–D. The same effects of Session was obtained in the
Triangles test for G1, whereas in G2 the effect of Session was
significant only when correct responses were considered (see
Table 3 and Fig. 7A–D).
For the Number test, analysis of RTs showed a significant
effect of Session for both G1 and G2 (see Table 3): in G1,
compared to the baseline (73 s), RTs significantly decreased
in the post-training (34 s, P < 0.0003) and in 1 month post-
training condition (40 s, P < 0.0003), without differences
between the last two conditions. In G2 [F(2,6) = 6.86,
P < 0.03], in post-training condition patients were faster
(44 s) compared to baseline 1 (70 s, P < 0.03) and to baseline
2 (65 s, P < 0.03), without significant differences between
the two baselines.
A B
Fig. 5 Unimodal visual test. (A) Mean percentages of visual detections in the different evaluations for the group G1. White bars = baseline;black bars = post-training; grey bars = 1 month post-training. On the left, patients’ performance in Eye Movement Condition; on the right,patients’ performance in Fixed-Eyes Condition. The asterisk indicates a significant difference between conditions: **P < 0.005.(B) Mean percentages of visual detections in the different evaluations for G2. White bars = baseline 1; black bars = baseline 2;grey bars = post-training. On the left, patients’ performance in Eye Movement Condition; on the right, patients’ performancein Fixed-Eyes Condition. The asterisk indicates a significant difference between conditions: **P < 0.005.
Fig. 4 Audio-visual training. Mean percentages of visual detections in the unimodal conditions in the baseline and in the training sessions.Grey bars represent the performance of G1; black bars represent the performance of G2. The asterisk indicates a significant differencebetween the baseline and the training session (P < 0.002 in all comparisons).
2836 Brain (2005), 128, 2830–2842 N. Bolognini et al.
by guest on June 2, 2016http://brain.oxfordjournals.org/
Dow
nloaded from

Assessment of hemianopic dyslexiaThe percentages of correct responses (i.e. correctly read
letter strings) were analysed separately for each group
using different ANOVAs with Session as main factor: the
effect of Session was significant in both G1 [F(2,6) = 9.28,
P < 0.01] and G2 [F(2,6) = 60.25, P < 0.0001] (see Fig. 8).
ADLThe total rating of the mean subjects’ disability in the three
evaluations were analysed by using a non-parametric
test (Kendall). In both groups a significant difference was
found (see Table 3). Single comparisons, conducted by
using the Wilcoxon signed-rank test, revealed in G1 a mar-
ginal significant difference between the baseline (score = 16)
and post-training evaluations (post-training score = 6,
P < 0.06; 1 month post-training score = 5, P < 0.06), without
differences between the two last conditions (see Fig. 9A).
In G2, only a marginal significant effect was found comparing
the post-training (score = 11) and the two baselines (baseline
1, score = 27; baseline 2, score = 24, P < 0.06 in both
comparisons) (see Fig. 9B).
A B
Fig. 6 Computerized visual field test. (A) Mean percentages of visual detections in the different evaluations for G1. White bars = baseline;black bars = post-training; grey bars = 1 month post-training. On the left, patients’ performance in Eye Movement Condition; on theright, patients’ performance in Fixed-Eyes Condition. The asterisk indicates a significant difference between conditions: **P < 0.005.(B) Mean percentages of visual detections in the different evaluations for G2. White bars = baseline 1; black bars = baseline 2;grey bars = post-training. On the left, patients’ performance in Eye Movement Condition; on the right, patients’ performance in Fixed-EyesCondition. The asterisk indicates a significant difference between the conditions: *P < 0.05.
Table 3 Main effects of the analysis for the audio-visual training and for tests for assessing visual field disorders
Group Main effects
G1 G2
Correct responses RTs Correct responses RTs
E–F test Session Session Session SessionF(2,6) = 14.99,P < 0.005
F(2,6) = 64.82,P < 0.0009
F(2,6) = 44.69,P < 0.0003
F(2,6) = 8.64,P < 0.02
Triangles test Session Session Session SessionF(2,6)= 8.55,P < 0.02
F(2,6)= 18.13,P < 0.003
F(2,6)= 10.7,P < 0.01
F(2,6)= 1.08,P = 0.4
Number test – Session – SessionF(2,6)= 68.44,P < 0.00007
F(2,6) = 6.86,P < 0.03
Total scoreADL Session Session
x2(4,2) = 6.53,P < 0.04
x2(4,2) = 6.5,P < 0.04
Audio-visual training of hemianopia Brain (2005), 128, 2830–2842 2837
by guest on June 2, 2016http://brain.oxfordjournals.org/
Dow
nloaded from

DiscussionIt is well recognized that the possession of multiple ways of
sensing the world offers many potential benefits (Stein and
Meredith, 1993; Spence and Driver, 2004). In the last years,
a vast body of evidence has been provided about the ability
of our brain to take advantage from the integration of
information derived from different sensory modalities (see
Stein and Meredith, 1993; Calvert et al., 2004; Spence and
Driver, 2004). The mechanism of multisensory integration
might become particularly important when a sensory modal-
ity is damaged; the possibility to integrate sensory inputs from
different sensory modalities, related to the same external
event, can enhance the impaired unimodal processing,
improving the perception of sensory events difficult to be
perceived unimodally due to the unimodal sensory defect.
Multisensory neurons have been identified in different
brain structures, such as the SC plus regions of cortex
(Stein and Meredith, 1993). In multisensory neurons of
SC, stimulus combinations produce significant increase
over unimodal response and can influence overt behaviour
(Stein, 1998). Furthermore, the activity of multisensory
neurons of SC shows a response gradient based on the effi-
cacy of the unimodal stimuli: whereas the pairing of weakly
effective stimuli results in a vigorous enhancement of the
A B
C D
Fig. 7 E–F and triangles tests. (A) Mean percentages of correct responses in each evaluation for G1. White bars = baseline; blackbars = post-training; grey bars = 1 month post-training. The asterisk indicates a significant difference between conditions: *P < 0.05;**P < 0.005. (B) Mean RTs in each evaluation for group G1. White bars = baseline; black bars = post-training; grey bars = 1 monthpost-training. The asterisk indicates a significant difference between conditions: **P < 0.005. (C) Mean percentages of correct responsesfor G2. White bars = baseline 1; black bars = baseline 2; grey bars = post-training. The asterisk indicates a significant difference betweenthe conditions: *P < 0.05; **P < 0.005. (D) Mean RTs in each evaluation for G2. White bars = baseline 1; black bars = baseline 2;grey bars = post-training. The asterisk indicates a significant difference between conditions: *P < 0.05.
2838 Brain (2005), 128, 2830–2842 N. Bolognini et al.
by guest on June 2, 2016http://brain.oxfordjournals.org/
Dow
nloaded from

multisensory neuronal activity, the combination of highly
effective stimuli results in little increase in the neuron’s
response. This property is called ‘inverse effectiveness rule’.
The presence of an inverse relationship between stimulus
effectiveness and multisensory enhancement makes intuitive
sense if one considers that the survival value in this system
lies in the ability to detect minimal signals. Stimuli that are
unlikely to produce either neural or behavioural responses by
themselves, benefit most from the multisensory combination.
Minimal cues from different sensory modalities are easier to
detect in combination than they are individually. In animal
studies, the effectiveness of the unimodal signals has been
shown to be a major determinant of the advantage resulting
from multisensory integration (Stein and Meredith, 1993).
According to this property, at the behavioural level, the
beneficial effects of combining different sensory modalities
might be more evident when at least one sensory processing
is weakly effective to induce a behavioural response; thus,
a concurrent stimulation of other senses might enhance
the response of the weak sensory system. Recent studies
in brain-damaged patients (Frassinetti, 2002b; Schendel
and Robertson, 2004; Bolognini et al., 2005b) support this
A B
Fig. 9 ADL. (A) Mean score for G1 in each item of the questionnaire. Black bars = baseline; grey bars = post-training; white bars = 1 monthpost-training. (B) Mean score for G2 in each item of the questionnaire. Black bars = baseline 1; grey bars = baseline 2; white bars =post-training.
Fig. 8 Reading test. Percentages of correct responses in eachevaluation. On the left, G1: white bars = baseline; blackbars = post-training; grey bars = 1 month post-training.On the right, G2: white bars = baseline 1; black bars = baseline 2;grey bars = post-training. The asterisk indicates asignificant difference between the conditions: *P < 0.05;**P < 0.005.
Audio-visual training of hemianopia Brain (2005), 128, 2830–2842 2839
by guest on June 2, 2016http://brain.oxfordjournals.org/
Dow
nloaded from
hypothesis by demonstrating that the sensory information
from a not impaired modality can improved the impaired
processing of information derived from a damaged sensory
system. In particular, in patients with hemianopia,
audio-visual interaction in multisensory neurons can
improve temporally visual perception in the blind hemifield
(Frassinetti et al., 2005).
Based on these findings, we have tried to take advantage of
the existence of integrated audio-visual system to rehabilitate
patients with visual field defects. A systematic audio-visual
stimulation of the visual field, activating multisensory neu-
rons in SC, which is frequently spared in lesions causing
visual field cuts, might affect orientation towards the blind
hemifield and improve oculomotor exploration with long-
lasting effects.
The results of the present study support this hypothesis.
During the training, we observed a progressive improvement
of patients’ performance, as documented by the increase of
visual detections in the unimodal conditions during the dif-
ferent sessions of the training. Since patients were instructed
to use saccadic eye movements for the detection of visual
targets, the amelioration of patients’ performance can be
explained with the implementation of the oculomotor system:
multisensory integration might have enhanced the respon-
siveness of the oculomotor system, reinforcing orientation
towards the blind hemifield and oculomotor visual explora-
tion mediated by multisensory structures, such as the SC.
Thus, the multisensory implementation of the oculomotor
system allows patients to detect the presence of visual events
in the affected areas both with a bimodal and unimodal
stimulation.
The important role of the oculomotor system in mediating
the amelioration induced by the audio-visual training is also
suggested by the results obtained by patients in tests assessing
visual disorders. In all tests assessing visual detections (i.e.
Unimodal Visual test and Computerized Visual Field test),
when patients were let free to use eye movements to perform
the tasks (Eye-Movements Condition), we found an impor-
tant increase of accuracy in the blind area after the training.
In contrast, a weak or no amelioration at all was found in
the same tests under the condition with fixed-eyes. The dis-
crepancy between the two conditions suggests that the
amelioration in visual perception induced by the training is
not due to an enlargement of the visual field, but it is mostly
mediated by the oculomotor system. Our findings are in line
with a previous study on patients with hemianopia (Nelles
et al., 2001), in which saccades were trained with compen-
satory visual field training on a large training board: after
the training, the authors found a marked improvement of
detections and RTs only when patients use explorative eye
movements, but not with eyes fixating.
In the present study, the improvement obtained after the
treatment did not only involve visual detections, but also the
visual scanning behaviour. The improvement of patients’ per-
formance was highly consistent across all the tests assessing
visual exploration (Visual Search tests), both in terms of
accuracy and search times, as documented by the nearly
error-free performance and the reduction of visual scanning
times obtained after the treatment. Patients’ visual search
behaviour became more efficient and faster after the treat-
ment, probably implying an enlargement of the search field,
defined as size of the visual field that a patient can actively
scan via eye movements (Kerkhoff et al., 1994).
The amelioration of visual exploration had also positive
consequences on hemianopic dyslexia: after the training,
we observed an improvement of single word reading perfor-
mance in all patients. Other forms of reading performance
were not evaluated. Furthermore, the efficacy of the audio-
visual treatment was confirmed by patients’ subjective
improvements in daily life, with positive outcomes on their
private life: the reduced scores on self-evaluation question-
naire (i.e. ADL) obtained by patients indicate the transfer
effects of training to daily activities, which were perceived
by patients before the treatment as strongly impaired by
the visual field loss. As patients’ reports indicate, there was
a clear treatment effect on the reduction of visual handicap in
everyday life. Thus, patients learned to use the regained visual
capacities to cope with the visual field defect, ensuring a
gradual transfer and automatization of the compensatory
strategies in daily life.
Finally, the treatment effects were maintained: in group G1,
after 1 month from the end of the treatment, the amelioration
remained stable. This amelioration cannot be ascribed to a
spontaneous recovery of visual disorders for two reasons.
First, it is important to note that all patients were in a chronic
stage of illness since stroke occurred at least 4 months before
the experiment was conducted. Second, in group G2, patients’
performance did not markedly improve between the two
baseline conditions, that were run before the treatment
and 1 month apart from each other. In conclusion, when
both groups were considered (i.e. G1 and G2), a significant
improvement of visual abilities was found only after the
audio-visual training (i.e. post-training).
The results of the present study suggested that audio-visual
training can induce a long-lasting (at least 1 month) activa-
tion of visual responsiveness of the oculomotor system,maybe
mediated by the intact SC (see Table 2). The SC is an impor-
tant oculomotor structure involved in the execution and
initiation of saccades and in target selection (Krauzlis et al.,
2004); moreover, SC is part of the colliculo-geniculo-
pulvinar-extrastriate pathways that mediates some residual
visual functions in hemianopia (Stoerig and Cowey, 1997).
Since the sensory maps of SC are in register with the premotor
maps, crossmodal information can be translated directly
into an appropriate orientation response towards the blind
hemifield.
Furthermore, SC is also involved in spatial orientation and
in crossmodal spatial attention (Krauzlis et al., 2004; Spence
and Driver, 2004; Stein et al., 2004): audio-visual interac-
tion in multisensory neurons of SC can also mediate an
exogenous shift of crossmodal attention towards the blind
hemifield. Since patients with visual defects usually direct
2840 Brain (2005), 128, 2830–2842 N. Bolognini et al.
by guest on June 2, 2016http://brain.oxfordjournals.org/
Dow
nloaded from

their focus of attention to the intact hemifield, the auditory
cue, interacting with the visual input in multisensory
neurons of SC, can reverse this tendency by inducing an
exogenous shift of crossmodal spatial attention towards the
blind hemifield.
An interesting question raised is whether the amelioration
of oculomotor search behaviour is the result of learning or
can be explained directly by the activation of saccadic eye
movements via multisensory neurons located in the SC. It
is possible to speculate that both mechanisms are involved in
the use of the oculomotor system to substitute the lost visual
field. The activation of the multisensory neurons is very
important for the implementation of visual enhancement
in the blind field (Frassinetti et al., 2005). However, for a
permanent amelioration of visual search, a prolonged and
systematic training is required; this might suggest a contri-
bution of some top-down mechanisms in the achievement
of oculomotor compensatory strategies. This issue needs fur-
ther investigation. For example, one way to verify the role of
SC in the compensation of hemianopia is to use different
kinds of visual stimuli. Indeed it has been shown that visual
pathways originating from short wave sensitive cones (i.e.
purple colour) do not send or send very few afferents to
SC (Sumner et al., 2002). As a consequence, if the hypothesis
that SC mediates the effects found in the present study is
correct, we should not obtain an improvement in visual
search tasks when using purple stimuli since SC does not
receive S-cones input. By contrast, if other mechanisms are
responsible for the oculomotor compensation, we should
observe these effects also when using purple stimuli.
The major novelty of the audio-visual training used in the
present study is that it is based on the human innate ability
to integrate information from different sensory modalities.
The functional property of multisensory neurons, i.e. inverse
efficacy rule, makes them well-suited to detect sensory events
when at least one sensory system is damaged. In conclusion,
the audio-visual training represents an innovative and effici-
ent approach to the rehabilitation of visual field deficits, based
on the multisensory system. A systematic audio-visual stimu-
lation of the blind hemifield for a short period of time (2
weeks) can improve oculomotor visual exploration and cross-
modal spatial attention, inducing the implementation of effi-
cient oculomotor strategies that allow patients to compensate
for the loss of vision.
AcknowledgementsWe wish to thank all the patients for volunteering to partici-
pate in this study. We also thank Francesca Frassinetti for
reading CT and MRI scans and lesion reconstruction and
Ciro Barbone for technical help. This work was supported
by a grant from MURST to Elisabetta Ladavas.
References
Arndt P, Colonius H. Two stages in crossmodal saccadic integration: evidence
from a visual-auditory focused attention task. Exp Brain Res 2003; 150:
417–26.
Bolognini N, Frassinetti F, Ladavas E. Acoustical vision of below threshold
stimuli: Interaction among spatially converging stimuli. Exp Brain Res
2005a; 160: 273–82.
Bolognini N, Rasi F, Ladavas E. Visual localization of sounds. Neuro-
psychologia 2005b; 43: 1655–61.
Calvert G, Spence C, Stein BE, editors. The handbook of multisensory
processes. Cambridge MA: MIT Press; 2004.
Chedru F, Leblanc M, Lhermitte F. Visual searching in normal and brain-
damaged subjects (contribution to the study of unilateral inattention).
Cortex 1973; 9: 94–111.
Colonius H, Arndt P. A two-stage model for visual-auditory interaction in
saccadic latencies. Percept Psychophys 2001; 63: 126–47.
Corneil BD, Van Wanrooij M, Munoz D, Van Opstal J. Auditory-visual
interactions subserving goal-directed saccades in complex scene. J Neuro-
physiol 2002; 88: 438–54.
Damasio H, Damasio, AR, editors. Lesion analysis in neuropsychology.
New York: Oxford University Press; 1989.
Frassinetti F, Bolognini N, Ladavas E. Enhancement of visual perception by
crossmodal audio-visual interaction. Exp Brain Res 2002a; 147: 332–43.
Frassinetti F, Pavani F, Ladavas E. Acoustical vision of neglected stimuli:
interaction among spatially converging audiovisual inputs in neglect
patients. J Cogn Neurosci 2002b; 14: 62–9.
Frassinetti F, Bolognini N, Bottari D, Bonora A, Ladavas E. Audio-visual
integration in patients with visual deficit. J Cogn Neurosci 2005; 17:
1442–52.
Hairston WD, Laurienti PJ, Mishra G, Burdette JH, Wallance MT. Multi-
sensory enhancement of localization under conditions of induced myopia.
Exp Brain Res 2003; 152: 404–8.
Harrington LK, Peck CK. Spatial disparity affects visual-auditory
interactions in human sensorimotor processing. Exp Brain Res 1998;
122: 247–52.
Hildebrandt H, Giesselmann H, Sachsenheimer W. Visual search and
visual target detection in patients with infarctions of the left or right
posterior or the right middle brain artery. J Clin Exp Neurolpsychol
1999; 21: 94–107.
Hughes HC, Nelson MD, Aronchick DM. Spatial characteristics of visual-
auditory summation in human saccades. Vision Res 1998; 38: 3955–63.
International Committee of Medical Journal Editors. Statements from the
Vancouver Group. BMJ 1991; 302: 1194.
Kerkhoff G, Munssinger U, Haaf E, Eberle-Strauss G, Stogerer E. Rehabilita-
tion of homonymous scotoma in patients with postgeniculate damage to
the visual system: saccadic compensation training. Restor Neurol Neurosci
1992; 4: 245–54.
Kerkhoff G, Munbinger U, Meier EK. Neurovisual rehabilitation in cerebral
blindness. Arch Neurol 1994; 51: 474–81.
Kerkhoff G. Restorative and compensatory therapy approaches in celebral
blindness—a review. [Review]. Restor Neurol Neurosci 1999; 1: 255–71.
Kerkhoff G. Neurovisual rehabilitation: recent developments and future
directions. J Neurol Neurosurg Psychiatry 2000; 68: 691–706.
Krauzlis RJ, Liston D, Carello CD. Target selection and the superior colliculus:
goals, choices and hypotheses. Vision Res. 2004; 4: 1445–51.
Ladavas E, Menghini G, Umilta C. A rehabilitation study of hemispatial
neglect. Cogn Neuropsychol 1994; 15: 79–95.
Morris RK, Rayner K, Pollatsek A. Eye movement guidance in reading:
the role of parafoveal letter and space information. J Exp Psychol Hum
Percept Perform 1990; 16: 268–81.
Nelles G, Esser J, Eckstein A, Tiede A, Gerhard H, Diener HC. Compensatory
visual field training for patients with hemianopia after stroke. Neurosci Lett
2001; 306: 189–92.
Pambakian AL, Kennard C. Can visual function be restored in patients with
homonymous hemianopia? Br J Ophthalmol 1997; 81: 324–8.
Pambakian AL, Wooding DS, Patel N, Morland AB, Kennard C, Mannan, SK.
Scanning the visual world: a study of patients with homonymous
hemianopia. J Neurol Neurosurg Psychiatry 2000; 69: 751–9.
Pambakian AL, Mannan SK, Hodgson TL, Kennard C. Saccadic visual search
training: a treatment for patients with homonymous hemianopia. J Neurol
Neurosurg Psychiatry 2004; 75: 1443–8.
Audio-visual training of hemianopia Brain (2005), 128, 2830–2842 2841
by guest on June 2, 2016http://brain.oxfordjournals.org/
Dow
nloaded from

Pizzamiglio L, Antonucci G, Judica A, Montenero P, Razzano C, Zoccolotti P.
Cognitive rehabilitation of the hemineglect disorders in chronic
patients with unilateral brain damage. J Clin Exp Neuropsycho. 1992;
14: 901–23.
Poppelreuter W. Disturbances of lower and higher visual capacities
caused by occipital damage. Transl. Zihl J, Weiskrantz L. Oxford: Oxford
University Press (Clarendon); 1971/1990.
Schendel K, Robertson LC. Reaching out to see: arm position can attenuate
human visual loss. J Cogn Neurosci 2004; 16: 935–43.
Spence C, Driver J, editors. Crossmodal space and crossmodal attention.
Oxford: Oxford University Press; 2004.
Stein BE. Neural mechanism for synthesizing sensory information and
producing adaptive behaviors. Exp Brain Res 1998; 123: 124–35.
Stein BE, Meredith MA, editors. Merging of sense. Cambridge, MA: MIT
Press; 1993.
Stein BE, Jiang, W, Standford TR. Multisensory integration in single neurons
of the midbrain. In: Calvert G, Spence C, Stein BE, editors. The handbook
of multisensory processes. Cambridge, MA: MIT Press; 2004.
Stoerig P, Cowey A. Blindsight in man and monkey. Brain 1997;
120: 535–59.
Sumner P, Adamjee T, Mollon JD. Signals invisible to the colliculus and
magnocellular pathway can be capture visual attention. Current Biol
2002, 12: 1312–16.
Tant ML, Cornelissen FW, Kooijman AC, Brouwer WH. Hemianopic visual
field defect elicit hemianopic scanning. Vision Res 2002; 42: 1339–48.
Zihl J. ‘Blindsight’: improvement of visually guided eye movements by
systematic practice in patients with cerebral blindness. Neuropsychologia
1980; 18: 71–7.
Zihl, J. Recovery of visual functions in patients with cerebral blindness. Effect
of specific practice with saccadic localization. Exp Brain Res 1981; 44:
159–69.
Zihl J. Rehabilitation of visual impairments in patients with brain damage.
In: Koijman AC, Looijesijn PL, Welling JA, van der Wildt GJ, editors.
Low vision. Amsterdam: IOS Press; 1994.
Zihl J. Visual scanning behaviour in patients with homonymous hemianopia.
Neuropsychologia 1995; 33: 287–303.
Zihl J. Rehabilitation of visual disorders after brain injury. UK: Psychological
Press 2000.
Zihl J, von Cramon D. Visual field recovery from scotoma in patients with
postgeniculate damage. Brain 1985; 108: 335–65.
Zihl J, Kennard, C. Disorders of higher visual function. In: Brandt T,
Caplan LR, Dichgans J, Diener HC, Kennard C, editors. Neurological
disorders: course and treatment. San Diego: Academic Press; 1996.
Zihl J, Hebel N. Patterns of oculomotor scanning in patients with unilateral
posterior parietal or frontal lobe damage. Neuropsychologia 1997; 35:
893–906.
2842 Brain (2005), 128, 2830–2842 N. Bolognini et al.
by guest on June 2, 2016http://brain.oxfordjournals.org/
Dow
nloaded from