Visioscan® VC 2 - MDPI
10
Citation: Stettler, H.; Crowther, J.; Boxshall, A.; Bielfeldt, S.; Lu, B.; de Salvo, R.; Trapp, S.; Blenkiron, P. Biophysical and Subject-Based Assessment of the Effects of Topical Moisturizer Usage on Xerotic Skin—Part II: Visioscan ® VC 20plus Imaging. Cosmetics 2022, 9, 5. https://doi.org/10.3390/ cosmetics9010005 Academic Editor: Enzo Berardesca Received: 1 December 2021 Accepted: 28 December 2021 Published: 31 December 2021 Publisher’s Note: MDPI stays neutral with regard to jurisdictional claims in published maps and institutional affil- iations. Copyright: © 2021 by the authors. Licensee MDPI, Basel, Switzerland. This article is an open access article distributed under the terms and conditions of the Creative Commons Attribution (CC BY) license (https:// creativecommons.org/licenses/by/ 4.0/). cosmetics Article Biophysical and Subject-Based Assessment of the Effects of Topical Moisturizer Usage on Xerotic Skin—Part II: Visioscan ® VC 20plus Imaging Hans Stettler 1, * , Jonathan Crowther 2, * , Alison Boxshall 3 , Stephan Bielfeldt 4 , Bailu Lu 5 , Raffaella de Salvo 1 , Sonja Trapp 1 and Peter Blenkiron 5 1 Bayer Consumer Care AG, CH-4052 Basel, Switzerland; [email protected] (R.d.S.); [email protected] (S.T.) 2 JMC Scientific Consulting Ltd., Egham TW20 8LL, UK 3 Illuminate Innovation, London EC1N 8UN, UK; [email protected] 4 proDERM GmbH, 22869 Schenefeld, Germany; [email protected] 5 Bayer Healthcare SAS, 74240 Gaillard, France; [email protected] (B.L.); [email protected] (P.B.) * Correspondence: [email protected] (H.S.); jonathan@jmcscientificconsulting.com (J.C.) Abstract: As new biophysical methods become available to the skin researcher it is important to understand the type of information that they are capable of measuring, and how it relates to consumer perception of topical moisturizing products. The aim of the work presented here was to understand what dry skin imaging can reveal about the skin and subject feedback from the use of a topical moisturizing product and how it relates to the consumer usage experience of a topical product. Images from a dry skin camera—the Visioscan ® VC 20plus—during 3 weeks in vivo usage of a topical moisturizing product were analyzed. Subject feedback regarding their skin condition was also collected. Strong statistical improvements (p < 0.05) were observed for a wide range of skin parameters derived from the Visioscan ® VC 20plus. Skin scaliness and smoothness and parameters associated with skin health and appearance (surface, energy, contrast, homogeneity) improved as a result of topical product usage. Subjects reported their skin to feel less dry, to be smoother, and more supple and to look and feel healthier after product usage. The length of time until they felt the need to re-apply the product increased during the study. Keywords: bioengineering; claim substantiation; formulation; dry skin; skin hydration 1. Introduction As discussed in Part I of this article, dry, sensitive, xerotic skin is the most common dermatological disorder impacting up to around 50% of the world’s population [1,2]. Perfor- mance assessment of products formulated to address dry skin development is an important aspect of characterizing their behavior as this enables their benefits to be communicated to the consumer. As the number and type of non-invasive biophysical methods capable of measuring a wide variety of skin parameters have expanded over the last 35 years, their use has become a vital part of research into topical skin products and clinical testing for both the consumer and pharmaceutical markets [3,4]. In addition to new devices, manufacturers are also continuing to develop and refine the devices used to measure the skin. With the development of new and updated measurement techniques, there comes a need to understand what aspects of the skin they can assess, how they compare with earlier versions of the same devices, and how the information they provide relates to actual consumer feedback about topical product usage. Although visual grading of dry skin is still widely used during clinical assessment, it does require the use of grading scales and a trained assessor which is not always possi- ble [5,6]. In addition to the electrical measures of skin hydration which were mentioned in Cosmetics 2022, 9, 5. https://doi.org/10.3390/cosmetics9010005 https://www.mdpi.com/journal/cosmetics
-
Upload
khangminh22 -
Category
Documents
-
view
1 -
download
0
Transcript of Visioscan® VC 2 - MDPI

�����������������
Citation: Stettler, H.; Crowther, J.;
Boxshall, A.; Bielfeldt, S.; Lu, B.; de
Salvo, R.; Trapp, S.; Blenkiron, P.
Biophysical and Subject-Based
Assessment of the Effects of Topical
Moisturizer Usage on Xerotic
Skin—Part II: Visioscan® VC 20plus
Imaging. Cosmetics 2022, 9, 5.
https://doi.org/10.3390/
cosmetics9010005
Academic Editor: Enzo Berardesca
Received: 1 December 2021
Accepted: 28 December 2021
Published: 31 December 2021
Publisher’s Note: MDPI stays neutral
with regard to jurisdictional claims in
published maps and institutional affil-
iations.
Copyright: © 2021 by the authors.
Licensee MDPI, Basel, Switzerland.
This article is an open access article
distributed under the terms and
conditions of the Creative Commons
Attribution (CC BY) license (https://
creativecommons.org/licenses/by/
4.0/).
cosmetics
Article
Biophysical and Subject-Based Assessment of the Effects ofTopical Moisturizer Usage on Xerotic Skin—Part II: Visioscan®
VC 20plus ImagingHans Stettler 1,* , Jonathan Crowther 2,* , Alison Boxshall 3, Stephan Bielfeldt 4, Bailu Lu 5, Raffaella de Salvo 1,Sonja Trapp 1 and Peter Blenkiron 5
1 Bayer Consumer Care AG, CH-4052 Basel, Switzerland; [email protected] (R.d.S.);[email protected] (S.T.)
2 JMC Scientific Consulting Ltd., Egham TW20 8LL, UK3 Illuminate Innovation, London EC1N 8UN, UK; [email protected] proDERM GmbH, 22869 Schenefeld, Germany; [email protected] Bayer Healthcare SAS, 74240 Gaillard, France; [email protected] (B.L.); [email protected] (P.B.)* Correspondence: [email protected] (H.S.); [email protected] (J.C.)
Abstract: As new biophysical methods become available to the skin researcher it is important tounderstand the type of information that they are capable of measuring, and how it relates to consumerperception of topical moisturizing products. The aim of the work presented here was to understandwhat dry skin imaging can reveal about the skin and subject feedback from the use of a topicalmoisturizing product and how it relates to the consumer usage experience of a topical product.Images from a dry skin camera—the Visioscan® VC 20plus—during 3 weeks in vivo usage of atopical moisturizing product were analyzed. Subject feedback regarding their skin condition wasalso collected. Strong statistical improvements (p < 0.05) were observed for a wide range of skinparameters derived from the Visioscan® VC 20plus. Skin scaliness and smoothness and parametersassociated with skin health and appearance (surface, energy, contrast, homogeneity) improved as aresult of topical product usage. Subjects reported their skin to feel less dry, to be smoother, and moresupple and to look and feel healthier after product usage. The length of time until they felt the needto re-apply the product increased during the study.
Keywords: bioengineering; claim substantiation; formulation; dry skin; skin hydration
1. Introduction
As discussed in Part I of this article, dry, sensitive, xerotic skin is the most commondermatological disorder impacting up to around 50% of the world’s population [1,2]. Perfor-mance assessment of products formulated to address dry skin development is an importantaspect of characterizing their behavior as this enables their benefits to be communicated tothe consumer.
As the number and type of non-invasive biophysical methods capable of measuringa wide variety of skin parameters have expanded over the last 35 years, their use hasbecome a vital part of research into topical skin products and clinical testing for both theconsumer and pharmaceutical markets [3,4]. In addition to new devices, manufacturersare also continuing to develop and refine the devices used to measure the skin. Withthe development of new and updated measurement techniques, there comes a need tounderstand what aspects of the skin they can assess, how they compare with earlier versionsof the same devices, and how the information they provide relates to actual consumerfeedback about topical product usage.
Although visual grading of dry skin is still widely used during clinical assessment,it does require the use of grading scales and a trained assessor which is not always possi-ble [5,6]. In addition to the electrical measures of skin hydration which were mentioned in
Cosmetics 2022, 9, 5. https://doi.org/10.3390/cosmetics9010005 https://www.mdpi.com/journal/cosmetics

Cosmetics 2022, 9, 5 2 of 10
Part I of this article, skin dryness can also be captured photographically as dryness impactsits optical properties [7,8]. The Visioscan® dry skin camera (Courage and Khazaka GmbH,Cologne, Germany) uses an ultraviolet A (UVA) light source to illuminate skin and captureslight that is reflected and emitted due to fluorescence. The device has been reported fora wide variety of uses including imaging of psoriasis, sunscreen remanence on the skin,imaging of mosaic melanoderm patterns, in addition to dry skin assessment [9–13].
In previous work, the authors reported the initial results from a 3-week in vivo studylooking at the effects of multi-functional topical moisturizing formulation on a wide rangeof parameters associated with dry skin [14,15]. In Part I of this article, the authors reportedan in-depth analysis of data from the EpsilonTM E100 2D hydration measurement devicecollected during the study. In this second part, the authors perform a similar detailedassessment of the data from the Visioscan® VC 20plus dry skin camera and compare it withfeedback given by the subjects during the study regarding the effects of product usage ontheir skin. Originally produced around 20 years ago, a new version of the Visioscan® hasrecently been released—the VC 20plus—which has a number of significant changes to itsdesign when compared to the previous model. No direct head-to-head comparisons ofthe two versions of the device have been published. New insights into how these types ofmeasurement devices can be used to monitor skin properties are discussed. This researchis aimed at providing guidance into the use of biophysical skin measurement and subjectfeedback to understand consumer feedback from the use of topical moisturizing products.
2. Materials and Methods
Subjects for the in vivo testing were recruited by proDERM GmbH, Schenefeld, Ger-many, and the study complied with the World Medical Association’s Declaration of Helsinki(2000) concerning biomedical research involving human subjects. The study protocol wasapproved by an Institutional Review Board of proDERM GmbH (Schenefeld, Germany,approval number 2020/005). The full study design and test product details have beenreported previously [14,15]. The results from analysis of the Visioscan® VC 20plus imagesand subject questionnaire data collected across the 3 weeks of the study are discussed here.
Dry skin images were collected using a Visioscan® VC 20plus (Courage & KhazakaGmbH, Cologne, Germany). Exposure time for the images was 50 ms. Analysis of thedifferent image parameters was carried out using the device software.
The irradiance spectra of the Visioscan® light sources (VC98 and VC 20plus) weremeasured using an Ocean Insight FX spectrometer between 250 nm and 800 nm. Thespectrometer was calibrated for absolute irradiance with a cosine corrector attached to a600 µm diameter fiber. Irradiance spectra were normalized to the height of the highest peakin the spectra between 250 nm and 800 nm.
On days 2, 8, 15, and 22 of the study (one day after product application began and theend of week 1, 2, and 3), the subjects were asked to compare the condition of the skin onboth legs with a questionnaire using a Visual Assessment Score (VAS) with a scale between−50 and +50 (−50 = untreated leg much more; 0 = no difference; 50 = treated leg muchmore). The subjects were also asked to evaluate the length of time between feeling theneed to reapply the product during week 1, 2, and 3. A four-point scale was used; 1 = <1 h,2 = 1–3 h, 3 = 3–5 h, 4 = > 5 h.
A significance level of 0.05 (alpha) was chosen for statistical analysis of the Visioscan®
VC 20plus data. Comparisons of treatment and untreated sites were performed on differ-ences to baseline scores using multifactorial analysis of variants (ANOVA) with product,subject, and side as factors, and the baseline values as covariates. This was carried outwith commercially available statistics software (Statgraphics Centurion 18). Subject self-assessment data analysis was shown as the VAS scores and analyzed using ANOVA. Subjectdata were analyzed in Microsoft Excel 2016 and JMP v15.

Cosmetics 2022, 9, 5 3 of 10
3. Results and Discussion
While electrical methods to measure skin hydration state are widely used in clinicaltesting [16–18], the optical properties of skin can also be used to derive information on skinmoisturization and hydration. The Visioscan® VC 20plus is a dry skin camera that uses aUVA light source to produce images of the skin under highly controlled lighting conditions.UVA light interacts with the skin in a variety of ways [19]. It can be reflected from theskin surface with the same wavelength, or it can be transmitted deeper into the epidermiswhere it can be attenuated by the melanin. UVA which has passed into the epidermis andis not attenuated by the melanin can pass deeper into the dermis where it can interactwith collagen. Cross-linked collagen fluoresces under UVA, resulting in the emission ofvisible light. Along with fluorescence from collagen, when UVA strikes the surface of theStratum Corneum (SC), if the SC is dry, these dry corneocytes fluoresce resulting in theemission of visible light [19]. In addition to its effects on fluorescence, skin hydration statealso impacts transmission of the light into and through and reflection from the SC [20].Hydration of the SC influences transmission and scattering of UV light in two ways; firstly,liquid water acts on the surface of the SC to reduce light reflection and backscatter, andsecondly, as a result of the take up of water by the corneocytes and into the intracellularregions, internal scattering is reduced. This decrease in internal scattering is due to thereduction in refractive index variation between the different areas within the SC as a resultof hydration [20]. Example images from dry/xerotic and normal, hydrated skin are shownin Figure 1a,b. This combination of reflection and fluorescence increases the brightness ofthe image in areas where the skin is dry and the image properties can then be analyzed toproduce a variety of information on the skin’s properties, which are summarized in Table 1.
Cosmetics 2022, 9, 5 3 of 11
Subject self-assessment data analysis was shown as the VAS scores and analyzed using ANOVA. Subject data were analyzed in Microsoft Excel 2016 and JMP v15.
3. Results and Discussion While electrical methods to measure skin hydration state are widely used in clinical
testing [16–18], the optical properties of skin can also be used to derive information on skin moisturization and hydration. The Visioscan® VC 20plus is a dry skin camera that uses a UVA light source to produce images of the skin under highly controlled lighting conditions. UVA light interacts with the skin in a variety of ways [19]. It can be reflected from the skin surface with the same wavelength, or it can be transmitted deeper into the epidermis where it can be attenuated by the melanin. UVA which has passed into the epidermis and is not attenuated by the melanin can pass deeper into the dermis where it can interact with collagen. Cross-linked collagen fluoresces under UVA, resulting in the emission of visible light. Along with fluorescence from collagen, when UVA strikes the surface of the Stratum Corneum (SC), if the SC is dry, these dry corneocytes fluoresce resulting in the emission of visible light [19]. In addition to its effects on fluorescence, skin hydration state also impacts transmission of the light into and through and reflection from the SC [20]. Hydration of the SC influences transmission and scattering of UV light in two ways; firstly, liquid water acts on the surface of the SC to reduce light reflection and backscatter, and secondly, as a result of the take up of water by the corneocytes and into the intracellular regions, internal scattering is reduced. This decrease in internal scattering is due to the reduction in refractive index variation between the different areas within the SC as a result of hydration [20]. Example images from dry/xerotic and normal, hydrated skin are shown in Figure 1a,b. This combination of reflection and fluorescence increases the brightness of the image in areas where the skin is dry and the image prop-erties can then be analyzed to produce a variety of information on the skin’s properties, which are summarized in Table 1.
Figure 1. Cont.

Cosmetics 2022, 9, 5 4 of 10Cosmetics 2022, 9, 5 4 of 11
Figure 1. Example Visioscan® VC 20plus images for (a) dry/xerotic skin and (b) normal/hydrated skin.
Table 1. Summary of Visioscan® VC 20plus measurement parameters [21].
Parameter Description
SELS—Scaliness (SEsc)
Number of pixels where the grey level is higher than the threshold of SEsc. SEsc is determined by the loop (inflection point) of the second part of the greyscale histogram.
This is the point at which virtual tangents would change their direction. The smaller the SEsc, the less is the desquamation of the stratum corneum and the less scaly the
skin.
SELS—Roughness (SEr) The grey levels beyond the threshold in comparison to the roughness of the whole
image (number of wrinkles on the calculatory lines). The smaller SEr, the rougher the skin.
SELS—Smoothness (SEsm)
This takes the average width of the histogram and the average width of the wrinkles in x and y direction into account. Smooth, even skin shows a lower variety of different grey levels, thus the histogram over the grey level distribution is smaller (more nar-row). The smaller the SEsm the smoother the image (the less different the pixels thus
the less wide the histogram).
SELS—Wrinkles (SEw) The average number and average width of horizontal and vertical wrinkles (calcula-tory lines). The more visible wrinkles (broad, deep wrinkles) the higher this value.
Mean grey scale Mean grey scale value of the pixels in the image. The higher the value the whiter the
pixels and the drier the skin.
Surface
Here, the size of the “wavy” surface of the skin is compared to a fully stretched flat (“ironed”) surface (x:1). The smoother the area was before stretching, the closer the two
values are together. E.g. 113 = the stretched area is 13 % larger than the original sur-face). After topical treatment of the skin, the Surface parameter should decrease.
Volume Volume calculates the virtual amount of liquid needed in the calculation area to fill the
Figure 1. Example Visioscan® VC 20plus images for (a) dry/xerotic skin and (b) normal/hydrated skin.
Analysis of the data from the study after 1, 2, and 3 weeks of product usage aregiven in Table 2 and shown as changes from baseline for the treated and untreated siteson the skin. The SELS (surface evaluation of living skin) parameters—scaliness (SEsc),roughness (SEr), smoothness (SEsm), and wrinkles (SEw)—did show differences betweenthe treated and untreated sites across the 3 weeks of the study. SELS parameters havebeen compared with roughness scores derived from the direct optical assessment of theskin surface, and although the readings from both devices were not directly related, bothprovided information on the roughness of the skin [22]. In the data presented here, typically,the treated site was less scaly (smaller SEsc score), and smoother (smaller SEsm score) thanthe untreated site. However, the roughness score (SEr) did not vary between the treatedand untreated sites across the study and the wrinkle score (SEw) was greater for the treatedsite at week 2 and 3 which was not expected. The reason for the increase in the wrinklescore is not clear, especially as skin smoothness was shown to improve at the same time.One potential explanation is that reduced scaliness and the corresponding decrease inthe number of white pixels in the image, making the texture of the skin more visibletherefore emphasizing the presence of any features such as wrinkles, although the authorsacknowledge that at the moment this is a hypothesis. It should also be noted that theanalysis of the Scaliness results given here resulted in a slightly stronger statistical breakthan was observed in the initial assessment of the data [15]. The analysis carried out hereused ANOVA with the baseline as a covariate while previous data analysis was carried outusing a paired t-test which could account for the observed differences in significance [15].
Mean greyscale is one of the simplest approaches to image analysis for these images.As can be seen in Figure 1, as the skin becomes drier, the image becomes brighter due toincreased fluorescence. The mean greyscale score of the image would therefore be expectedto decrease as the skin becomes more hydrated. While the reduction in mean greyscalescores was greater for the treated site than for the untreated, the difference between the

Cosmetics 2022, 9, 5 5 of 10
two was only significant at the 2-week time point. Mean greyscale is not included in theVisioscan® user manual [21] as a recommended method of analyzing the images but it ismentioned here for completeness as it is a very simple approach to analyze the images.However, it fails to take into account the aspects of the image beyond the simple averagegreyness and as such is not as discriminatory as other approaches. The surface score, whichtakes into account the waviness of the skin derived from the image was more discriminatorythan the roughness (SEr) score, showing significantly reduced surface scores for the treatedsite at all time points throughout the study. This behavior was not observed for the volumescore, which only became statistically significant at the end of week 3 of the study.
Table 1. Summary of Visioscan® VC 20plus measurement parameters [21].
Parameter Description
SELS—Scaliness (SEsc)
Number of pixels where the grey level is higher than the threshold of SEsc. SEsc is determined bythe loop (inflection point) of the second part of the greyscale histogram. This is the point at whichvirtual tangents would change their direction. The smaller the SEsc, the less is the desquamation
of the stratum corneum and the less scaly the skin.
SELS—Roughness (SEr) The grey levels beyond the threshold in comparison to the roughness of the whole image(number of wrinkles on the calculatory lines). The smaller SEr, the rougher the skin.
SELS—Smoothness (SEsm)
This takes the average width of the histogram and the average width of the wrinkles in x and ydirection into account. Smooth, even skin shows a lower variety of different grey levels, thus thehistogram over the grey level distribution is smaller (more narrow). The smaller the SEsm the
smoother the image (the less different the pixels thus the less wide the histogram).
SELS—Wrinkles (SEw) The average number and average width of horizontal and vertical wrinkles (calculatory lines).The more visible wrinkles (broad, deep wrinkles) the higher this value.
Mean grey scale Mean grey scale value of the pixels in the image. The higher the value the whiter the pixels andthe drier the skin.
Surface
Here, the size of the “wavy” surface of the skin is compared to a fully stretched flat (“ironed”)surface (x:1). The smoother the area was before stretching, the closer the two values are together.E.g., 113 = the stretched area is 13 % larger than the original surface). After topical treatment of
the skin, the Surface parameter should decrease.
Volume
Volume calculates the virtual amount of liquid needed in the calculation area to fill the imageuntil the average height of all mountains. The smoother an area before filling up, the less virtualliquid is needed. The result is expressed in mm3. After topical treatment of the skin, the Volume
parameter should decrease.
Energy
Energy is the rate of changes in the color/brightness/magnitude of the pixels over local areas. Ahomogeneous combination of medium grey values (high energy) should indicate a young,
smooth skin. When moisture or anti-aging treatments are applied to the skin, the energy valueshould go up.
Variance Variance is the average of a local variance over an amount of pixels. The actual value of the pixelis compared to the average. High roughness will lead to increased variance values.
ContrastContrast indicates the difference between grey levels of the two neighboring pixels. If the contrastis higher, the higher the different values of two neighbors. A good skin condition will show lower
contrast values.
Entropy Entropy indicates the “mess/disorder” of an image. Smooth, even skin should show a lowerentropy then rough skin.
HomogeneityHomogeneity indicates the uniformity of an image. The larger the difference between the grey
levels in the picture the lower the homogeneity value. A highly hydrated skin has a higherhomogeneity value than a very dry one.
The energy, variance, contrast, entropy, and homogeneity behaved very consistentlythroughout the study, all showing statistically significant differences between the treatedand untreated sites at all time-points except for energy at end of week 3. However, whilea statistical difference between the treated and untreated sites was observed throughoutthe study for these parameters, entropy did not behave in the expected way. Based on

Cosmetics 2022, 9, 5 6 of 10
the description of this parameter in the user manual for the device, smooth, even skinshould show reduced entropy compared to rough skin [21]. However, the opposite wasseen here with the treated site having higher entropy than the untreated site. The entropyscore indicates the “mess/disorder” of an image and when it is higher, more combinationsof different grey levels appear in the image. If the skin is very dry, then more pixels in theimage will be very bright. This could actually reduce the variability of the pixel brightnessin the case of dry skin, i.e., reduce the entropy, which would explain the observed behavior,although further work would need to be carried out to confirm this.
Table 2. Visioscan® VC 20plus data change from baseline at the end of Week 1, 2, and 3. Statisticaldifferences between the Treated and Untreated sites (multifactorial ANOVA) with >95% significance(p < 0.05) are shown in bold and underlined. Data for the SEsc, SEr, SEsm, SEw, mean grey scale,surface and volume scores is given to two decimal places, while the Energy, Variance, Contrast,Entropy and Homogeneity scores are shown to four decimal places.
Parameter Week 1 Week 2 Week 3
Treated Untreated Treated Untreated Treated Untreated
SELS—Scaliness(SEsc) −1.45 +/− 0.19 −0.57 +/− 0.19 −1.02 +/− 0.34 0.36 +/− 0.37 −0.94 +/− 0.43 0.83 +/− 0.43
SELS—Roughness(SEr) 5.13 +/− 2.61 4.47 +/− 2.82 6.83 +/− 2.09 0.65 +/− 2.29 4.01 +/− 3.30 7.57 +/− 3.37
SELS—Smoothness(SEsm) −64.78 +/− 18.15 −1.92 +/− 19.84 −33.34 +/− 15.33 −11.14 +/− 16.77 −29.61 +/− 23.55 −18.00 +/− 24.85
SELS—Wrinkles(SEw) 15.26 +/− 7.97 10.89 +/− 8.11 22.99 +/− 4.86 3.21 +/− 5.11 23.13 +/− 6.18 −0.41 +/− 6.17
Mean grey scale −12.71 +/− 2.92 −7.43 +/− 3.44 −10.47 +/− 2.00 0.26 +/− 2.24 −8.48 +/− 1.89 −4.09 +/− 2.07Surface −154.48 +/− 20.27 −62.62 +/− 21.76 −163.66 +/− 23.95 −30.51 +/− 26.07 −169.75 +/− 24.97 −52.66 +/− 25.58Volume −6.75 +/− 6.64 −4.10 +/− 7.89 −22.77 +/− 5.79 −6.42 +/− 6.51 −24.14 +/− 3.40 −4.51 +/− 3.80Energy 0.0084 +/− 0.0012 0.0030 +/− 0.0012 0.0067 +/− 0.0015 −0.0003 +/− 0.0016 0.0077 +/− 0.0021 0.0016 +/− 0.0021
Variance −1.3238 +/− 0.1691 −0.5450 +/− 0.1815 −1.3293 +/− 0.2042 −0.2416 +/− 0.2224 −1.4230 +/− 0.2120 −0.4198 +/− 0.2167Contrast −0.6486 +/− 0.0941 −0.2526 +/− 0.1009 −0.6234 +/− 0.1243 −0.0779 +/− 0.1353 −0.6738 +/− 0.1035 −0.2701 +/− 0.1062Entropy 0.0627 +/− 0.0086 0.0190 +/− 0.0094 0.0554 +/− 0.0077 0.0127 +/− 0.0084 0.0614 +/− 0.0093 0.0174 +/− 0.0097
Homogeneity 0.0966 +/− 0.0157 0.0371 +/− 0.0166 0.0924 +/− 0.0157 0.0235 +/− 0.0157 0.1021 +/− 0.0144 0.0283 +/− 0.0146
The device used for the work presented here was the Visioscan® VC 20plus and atthis stage, the key differences between this and the previous version of the device, theVisioscan® VC98 which had remained fundamentally unchanged for around 20 years, willbe summarized. The main differences between the Visioscan® VC98 and the Visioscan®
VC 20plus are:
1. Different light source. The VC 20plus has a light-emitting diode (LED) source with areflector compared to the fluorescent light tube of the VC98.
2. Image resolution is higher with the VC 20plus (1280 × 1024 pixels compared to640 × 480 pixels for the VC98).
3. Better focusing with the VC 20plus due to a moveable lens that can adapt to the skinsurface position.
4. The VC 20plus automatically adapts the light for the first image of a subject’s skinsite in a trial then has the same brightness for comparison of follow-up images of thesame subject in the same trial at the same skin site.
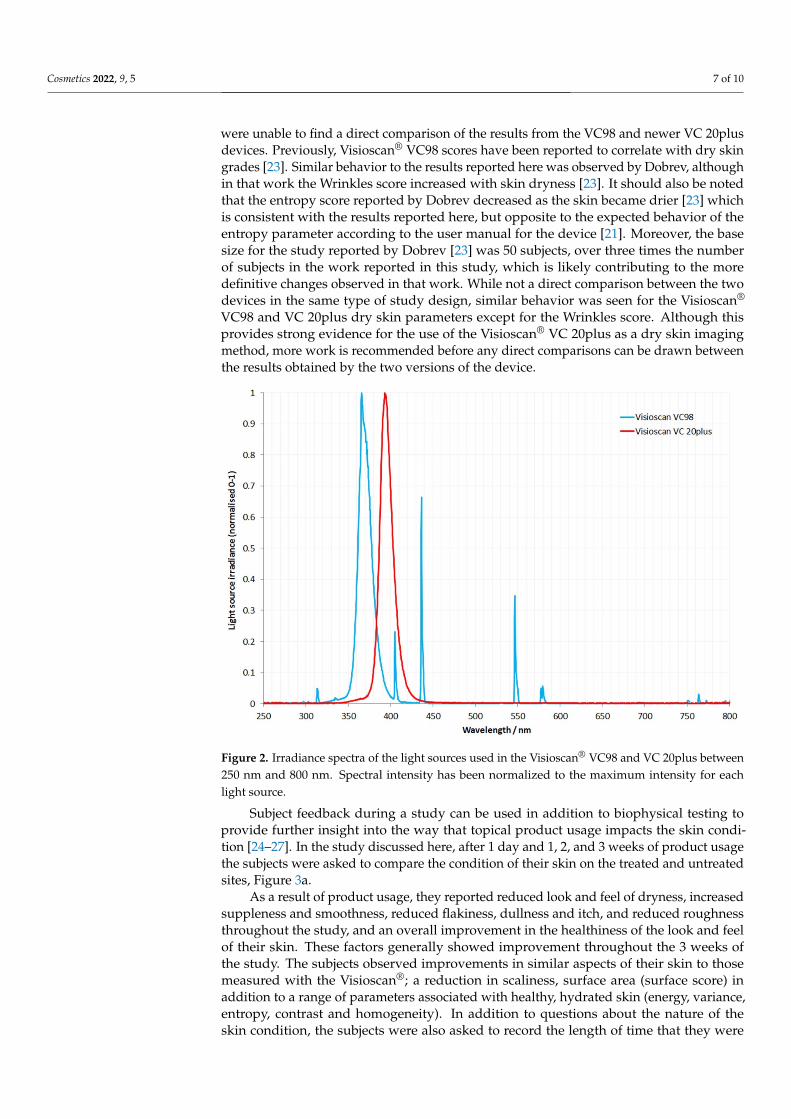
One of the key differences between the two versions of the device is the spectraldistribution of the light source used to illuminate the skin as shown in Figure 2. TheVisioscan® VC 20plus uses an LED illumination source with a peak emission between390 nm and 400 nm, while the previous VC98 used a fluorescent light tube with peakemission at around 365 nm with a number of sharp emission bands also present at longerwavelengths in the visible and infrared parts of the spectrum. Fluorescence of the dryskin is initiated after exposure to UVA, however, the degree of fluorescence is likely to beinfluenced by the wavelength of light that is used to illuminate the skin [19]. In addition,the transmission of the SC is slightly reduced at 365 nm compared to 390–400 nm whichwill also impact how it appears under these illumination wavelengths [20]. The authors
Cosmetics 2022, 9, 5 7 of 10
were unable to find a direct comparison of the results from the VC98 and newer VC 20plusdevices. Previously, Visioscan® VC98 scores have been reported to correlate with dry skingrades [23]. Similar behavior to the results reported here was observed by Dobrev, althoughin that work the Wrinkles score increased with skin dryness [23]. It should also be notedthat the entropy score reported by Dobrev decreased as the skin became drier [23] whichis consistent with the results reported here, but opposite to the expected behavior of theentropy parameter according to the user manual for the device [21]. Moreover, the basesize for the study reported by Dobrev [23] was 50 subjects, over three times the numberof subjects in the work reported in this study, which is likely contributing to the moredefinitive changes observed in that work. While not a direct comparison between the twodevices in the same type of study design, similar behavior was seen for the Visioscan®
VC98 and VC 20plus dry skin parameters except for the Wrinkles score. Although thisprovides strong evidence for the use of the Visioscan® VC 20plus as a dry skin imagingmethod, more work is recommended before any direct comparisons can be drawn betweenthe results obtained by the two versions of the device.
Cosmetics 2022, 9, 5 7 of 11
2. Image resolution is higher with the VC 20plus (1280 × 1024 pixels compared to 640 × 480 pixels for the VC98).
3. Better focusing with the VC 20plus due to a moveable lens that can adapt to the skin surface position.
4. The VC 20plus automatically adapts the light for the first image of a subject’s skin site in a trial then has the same brightness for comparison of follow-up images of the same subject in the same trial at the same skin site. One of the key differences between the two versions of the device is the spectral
distribution of the light source used to illuminate the skin as shown in Figure 2. The Vi-sioscan® VC 20plus uses an LED illumination source with a peak emission between 390 nm and 400 nm, while the previous VC98 used a fluorescent light tube with peak emis-sion at around 365 nm with a number of sharp emission bands also present at longer wavelengths in the visible and infrared parts of the spectrum. Fluorescence of the dry skin is initiated after exposure to UVA, however, the degree of fluorescence is likely to be influenced by the wavelength of light that is used to illuminate the skin [19]. In addition, the transmission of the SC is slightly reduced at 365 nm compared to 390–400 nm which will also impact how it appears under these illumination wavelengths [20]. The authors were unable to find a direct comparison of the results from the VC98 and newer VC 20plus devices. Previously, Visioscan® VC98 scores have been reported to correlate with dry skin grades [23]. Similar behavior to the results reported here was observed by Do-brev, although in that work the Wrinkles score increased with skin dryness [23]. It should also be noted that the entropy score reported by Dobrev decreased as the skin became drier [23] which is consistent with the results reported here, but opposite to the expected behavior of the entropy parameter according to the user manual for the device [21]. Moreover, the base size for the study reported by Dobrev [23] was 50 subjects, over three times the number of subjects in the work reported in this study, which is likely contrib-uting to the more definitive changes observed in that work. While not a direct compari-son between the two devices in the same type of study design, similar behavior was seen for the Visioscan® VC98 and VC 20plus dry skin parameters except for the Wrinkles score. Although this provides strong evidence for the use of the Visioscan® VC 20plus as a dry skin imaging method, more work is recommended before any direct comparisons can be drawn between the results obtained by the two versions of the device.
Figure 2. Irradiance spectra of the light sources used in the Visioscan® VC98 and VC 20plus between250 nm and 800 nm. Spectral intensity has been normalized to the maximum intensity for eachlight source.
Subject feedback during a study can be used in addition to biophysical testing toprovide further insight into the way that topical product usage impacts the skin condi-tion [24–27]. In the study discussed here, after 1 day and 1, 2, and 3 weeks of product usagethe subjects were asked to compare the condition of their skin on the treated and untreatedsites, Figure 3a.
As a result of product usage, they reported reduced look and feel of dryness, increasedsuppleness and smoothness, reduced flakiness, dullness and itch, and reduced roughnessthroughout the study, and an overall improvement in the healthiness of the look and feelof their skin. These factors generally showed improvement throughout the 3 weeks ofthe study. The subjects observed improvements in similar aspects of their skin to thosemeasured with the Visioscan®; a reduction in scaliness, surface area (surface score) inaddition to a range of parameters associated with healthy, hydrated skin (energy, variance,entropy, contrast and homogeneity). In addition to questions about the nature of theskin condition, the subjects were also asked to record the length of time that they were

Cosmetics 2022, 9, 5 8 of 10
comfortable waiting before reapplying the product. No subjects reported that they felt theneed to reapply the product <1 h after application. This distribution of the time periodrankings shifted towards longer time frames throughout the study, indicating that thesubjects were less troubled by their dry skin as the study period progressed, Figure 3b.The test product contained a range of ingredients including glycerine, niacinamide, anddexpanthenol which would be expected to positively improve skin hydration over thecourse of the experiment [28–31], which was observed by both the Visioscan® imaging andthe subject feedback.
Cosmetics 2022, 9, 5 8 of 11
Figure 2. Irradiance spectra of the light sources used in the Visioscan® VC98 and VC 20plus be-tween 250 nm and 800 nm. Spectral intensity has been normalized to the maximum intensity for each light source.
Subject feedback during a study can be used in addition to biophysical testing to provide further insight into the way that topical product usage impacts the skin condi-tion [24–27]. In the study discussed here, after 1 day and 1, 2, and 3 weeks of product usage the subjects were asked to compare the condition of their skin on the treated and untreated sites, Figure 3a.
Figure 3. Subject feedback data during the study. (a) Comparison of the test (treated) and control (untreated) legs (−50 = untreated leg much more; 0 = no difference; 50 = treated leg much more) on day 2, 8, 15, and 22 (after 1 day and 1, 2 and 3 weeks of product usage). Statistical differences be-tween the data for day 2 and day 22; * p < 0.05, ** p < 0.15, *** p < 0.20, **** p < 0.25. (b) Length of time before the subjects thought re-application of the product was required in week 1, 2, and 3.
As a result of product usage, they reported reduced look and feel of dryness, in-creased suppleness and smoothness, reduced flakiness, dullness and itch, and reduced roughness throughout the study, and an overall improvement in the healthiness of the look and feel of their skin. These factors generally showed improvement throughout the
Figure 3. Subject feedback data during the study. (a) Comparison of the test (treated) and control(untreated) legs (−50 = untreated leg much more; 0 = no difference; 50 = treated leg much more) onday 2, 8, 15, and 22 (after 1 day and 1, 2 and 3 weeks of product usage). Statistical differences betweenthe data for day 2 and day 22; * p < 0.05, ** p < 0.15, *** p < 0.20, **** p < 0.25. (b) Length of time beforethe subjects thought re-application of the product was required in week 1, 2, and 3.
At this stage limitations with the study design and analysis should be discussed.Imaging with the Visioscan® only captures a small area of the skin (approximately 1 cm2)with each photograph. This is very different to visual dry skin grading where the assessorlooks at a wide area of the skin to make their assessment of the skin condition. Analysisof a small area could result in focusing on a specific region rather than assessing the

Cosmetics 2022, 9, 5 9 of 10
average condition of the skin in the test area. As discussed previously, the base size of thestudy reported here was relatively small due to the inclusion of a wide range of differentmeasurements [14,15]. This small base size has no doubt contributed to higher errors forthe measures resulting in it being more difficult for some of the measurements to showstatistical breaks at the 95% confidence level.
4. Conclusions
As the range of biophysical methods available to the skin researcher increases, it isimportant to determine what aspects of the skin they can measure and assess, and howrelevant they are to consumer experience during the use of topical moisturizing products.
In the second part of this article, analysis of images from a new dry skin camera—theVisioscan® VC 20plus—has been presented and discussed. Overall, the latest version ofthis camera behaved similarly to the previous version (Visioscan® VC98) with respect todry skin imaging. Through the assessment of a wide range of parameters that the devicecan measure, it has been possible to demonstrate how the use of a topical moisturizingproduct has resulted in an improvement in skin dryness and overall condition. Subjectfeedback data have also been analyzed to give further understanding into the results ofthe biophysical testing. Both subjective feedback and instrumental measurements providevaluable data to understand the use of topical products on the skin and that subjectiveevaluation can be used to validate how instruments evaluate skin properties.
Author Contributions: Conceptualization, B.L., A.B., H.S., S.B., R.d.S., P.B. and J.C.; methodology,J.C., B.L., H.S. and S.B.; software, J.C. and S.B.; validation, H.S., R.d.S., S.B. and J.C.; formal analysis,A.B., J.C., S.B and R.d.S.; investigation, H.S. and S.B.; resources, H.S. and S.B.; data curation, S.B.and J.C.; writing—original draft preparation, J.C. and A.B.; writing—review and editing, H.S., A.B.,B.L., S.B., R.d.S., P.B. and S.T.; visualization, A.B., J.C. and S.B.; supervision, S.B. and H.S.; projectadministration, H.S.; funding acquisition, H.S. and P.B. All authors have read and agreed to thepublished version of the manuscript.
Funding: This research was funded by Bayer Consumer Care AG.
Institutional Review Board Statement: The study was conducted according to the guidelines of theDeclaration of Helsinki (2000), and approved by the Institutional Review Board of proDERM GmbH(Schenefeld, Germany).
Informed Consent Statement: Informed consent was obtained from all subjects involved in the study.
Data Availability Statement: The data are not publicly available due to subject confidentiality.
Conflicts of Interest: H.S., S.T. and R.d.S. are employees of Bayer Consumer Care AG. P.B. and B.L.are employees of Bayer Healthcare SAS. J.C. and A.B. are consultants who have worked with BayerConsumer Care AG and Bayer Healthcare SAS. S.B. is an employee of proDERM GmbH where thestudy was carried out.
References1. Farage, M.A. The Prevalence of Sensitive Skin. Front. Med. 2019, 6, 98. [CrossRef] [PubMed]2. Roussaki-Schulze, A.V.; Zafiriou, E.; Nikoulis, D.; Klimi, E.; Rallis, E.; Zintzaras, E. Objective biophysical findings in patients with
sensitive skin. Drugs Exp. Clin. Res. 2005, 31, 17–24. [PubMed]3. Kligmann, A.M. Perspectives of bioengineering of the skin. In Handbook of Non-Invasive Methods and the Skin; Serup, J.,
Jemec, G.B.E., Eds.; CRC Press: Boca Raton, FL, USA, 1995; pp. 3–8.4. Agache, P.; Humbert, P. (Eds.) Measuring the Skin; Springer: Berlin/Heidelberg, Germany, 2004.5. Byrne, A.J. Bioengineering and subjective approaches to the clinical evaluation of dry skin. Int. J. Cosmet. Sci. 2010, 32, 410–421.
[CrossRef] [PubMed]6. Serup, J. Dry skin (xerosis): Clinical scoring and instrumental characterization. In Bioengineering of the Skin: Skin Surface Imaging
and Analysis; Wilhelm, K.-P., Elsner, P., Berardesca, E., Maibach, H.I., Eds.; CRC Press: Boca Raton, FL, USA, 1997; pp. 275–287.7. Flynn, T.C.; Petros, J.; Clark, R.; Viehman, G. Dry skin and moisturizers. Clin. Dermatol. 2001, 19, 387–392. [CrossRef]8. Rudikoff, D. The effect of dryness on the skin. Clin. Dermatol. 1998, 16, 99–107. [CrossRef]9. Kim, J.H.; Kim, B.Y.; Choi, J.W.; Kim, S.O.; Lee, H.S.; Park, K.C.; Youn, S.W. The objective evaluation of the severity of psoriatic
scales with desquamation collecting tapes and image analysis. Skin Res. Technol. 2011, 18, 143–150. [CrossRef]

Cosmetics 2022, 9, 5 10 of 10
10. Piérard, G.E.; Khazaka, D.; Khazaka, G. Sunscreen remanence on the skin: A noninvasive real time in vivo spectral analysisassessing the quenching of specular ultraviolet A light reflectance. J. Cosmet. Dermatol. 2015, 15, 3–9. [CrossRef]
11. Piérard, G.; Pierard-Franchimont, C.; Dewalque, L.; Charlier, C.; Hermanns-Le, T.; Piérard, S.L.; Delvenne, P. In vivo skinfluorescence imaging in young Caucasian adults with early malignant melanomas. Clin. Cosmet. Investig. Dermatol. 2014, 7,225–230. [CrossRef]
12. Piérard-Franchimont, C.; Piérard, G.E. Beyond a Glimpse at Seasonal Dry Skin: A Review. Exog. Dermatol. 2002, 1, 3–6. [CrossRef]13. Theek, C.; Tronnier, H.; Heinrich, U.; Braun, N. Surface Evaluation of Living Skin (SELS) parameter correlation analysis using
data taken from astronauts working under extreme conditions of microgravity. Skin Res. Technol. 2019, 26, 105–111. [CrossRef]14. Stettler, H.; Crowther, J.M.; Brandt, M.; Lu, B.; Boxshall, A.; Salvo, R.; Laing, S.; Hennighausen, N.; Bielfeldt, S.; Blenkiron, P.
Targeted dry skin treatment using a multifunctional topical moisturizer. Int. J. Cosmet. Sci. 2020, 43, 191–200. [CrossRef]15. Stettler, H.; Crowther, J.M.; Brandt, M.; Boxshall, A.; Lu, B.; de Salvo, R.; Laing, S.; Hennighausen, N.; Bielfeldt, S.; Blenkiron, P.
Multi parametric biophysical assessment of treatment effects on xerotic skin. Skin Health Dis. 2021, 1, e21. [CrossRef]16. Berardesca, E.; Loden, M.; Serup, J.; Masson, P.; Rodrigues, L.M. The revised EEMCO guidance for the in vivo measurement of
water in the skin. Skin Res. Technol. 2018, 24, 351–358. [CrossRef]17. Fluhr, J.W.; Gloor, M.; Lazzerini, S.; Kleesz, P.; Grieshaber, R.; Berardesca, E. Comparative study of five instruments measuring
stratum corneum hydration (Corneometer CM 820 and CM 825, Skicon 200, Nova DPM 9003, DermaLab). Part II. In vivo. SkinRes. Technol. 1999, 5, 171–178. [CrossRef]
18. Alanen, E.; Nuutinen, J.; Nicklén, K.; Lahtinen, T.; Mönkkönen, J. Measurement of hydration in the stratum corneum with theMoistureMeter and comparison with the Corneometer. Skin Res. Technol. 2004, 10, 32–37. [CrossRef]
19. Kollias, N. Skin documentation with multimodal imaging and integrated image analysis. In Bioengineering of the Skin: SkinImaging and Analysis, 2nd ed.; Wilhelm, K.P., Elsner, P., Berardesca, E., Maibach, H.I., Eds.; CRC Press: Boca Raton, FL, USA, 2007;pp. 221–246.
20. Solan, J.L.; Laden, K. Factors affecting the penetration of light through stratum corneum. J. Soc. Cosmet. Chem. 1977, 28, 125–137.21. Visioscan®VC 20plus User Manual; Courage and Khazaka GmbH: Köln, Germany.22. Kottner, J.; Schario, M.; Bartels, N.G.; Pantchechnikova, E.; Hillmann, K.; Blume-Peytavi, U. Comparison of two in vivo
measurements for skin surface topography. Skin Res. Technol. 2012, 19, 84–90. [CrossRef] [PubMed]23. Dobrev, H. Evaluation of dry skin: A comparison between visual score, corneometry and image analysis. In Proceedings of the
16th Congress of the European Academy of Dermatology and Venereology (EADV), Vienna, Austria, 16–20 May 2007.24. Tulina, D.; Béguin, A.; Pong, H.; Cabarbas, M.D.M.; Klokol, D.; Chan, M.K.; Wong, M.B. Evaluation of the in vivo cosmetic efficacy
of the MF3 blue cell serum gel. One- and two-month test results. J. Cosmet. Dermatol. 2017, 17, 193–202. [CrossRef] [PubMed]25. Bruce, S.; Karnik, J.; Dryer, L.; Burkholder, D. Anti-aging proof of concept study: Results and summary. J. Drugs Dermatol. 2014,
13, 1074–1081. [PubMed]26. McCook, J.; Berube, G. Evaluation of hand and body lotions: Correlation of objective and subjective responses. J. Soc. Cosmet.
Chem. 1982, 33, 372.27. Djokic-Gallagher, J.; Rosher, P.; Walker, J.; Hart, V. Objective and subjective in vivo comparison of two emollient products. Clin.
Cosmet. Investig. Dermatol. 2012, 5, 85–91. [CrossRef] [PubMed]28. Soma, Y.; Kashima, M.; Imaizumi, A.; Takahama, H.; Kawakami, T.; Mizoguchi, M. Moisturizing effects of topical nicotinamide
on atopic dry skin. Int. J. Dermatol. 2004, 44, 197–202. [CrossRef]29. Ebner, F.; Heller, A.; Rippke, F.; Tausch, I. Topical Use of Dexpanthenol in Skin Disorders. Am. J. Clin. Dermatol. 2002, 3,
427–433. [CrossRef]30. Gehring, W.; Gloor, M. Effect of Topically Applied Dexpanthenol on Epidermal Barrier Function and Stratum Corneum Hydration.
Results of a human in vivo study. Arzneimittelforschung 2000, 50, 659–663. [CrossRef]31. Fluhr, J.; Darlenski, R.; Surber, C. Glycerol and the skin: Holistic approach to its origin and functions. Br. J. Dermatol. 2008, 159,
23–34. [CrossRef] [PubMed]