Vision impairment and dual sensory problems in middle age
25
For Review Only Vision impairment and dual sensory problems in middle age Journal: Ophthalmic and Physiological Optics Manuscript ID: Draft Manuscript Type: Original Article Date Submitted by the Author: n/a Complete List of Authors: Dawes, Piers; University of Manchester, Psychological Sciences Dickinson, Chris; University of Manchester, Faculty of Life Sciences; Emsley, Richard; University of Manchester, Institute of Population Health Bishop, Paul; University of Manchester, Institute of Human Development Cruickshanks, Karen; University of Wisconsin, School of Medicine and Public Health McCormack, Abby; University of Nottingham, NIHR Nottingham Hearing Biomedical Research Unit; University of Nottingham, School of Medicine Fortnum, Heather; University of Nottingham, NIHR Nottingham Hearing Biomedical Research Unit; University of Nottingham, School of Medicine Moore, David; Cincinnati Children’s Hospital Medical Center, Otorhinolarygnology Norman, Paul; University of Leeds, School of Geography Munro, Kevin; University of Manchester, School of Psychological Sciences; Central Manchester University Hospitals NHS Foundation Trust, Manchester Academic Health Science Centre Keywords: vision impairment, prevalence, dual sensory impairment, epidemiology Ophthalmic and Physiological Optics Ophthalmic and Physiological Optics
-
Upload
independent -
Category
Documents
-
view
0 -
download
0
Transcript of Vision impairment and dual sensory problems in middle age
For Review O
nly
Vision impairment and dual sensory problems in middle age
Journal: Ophthalmic and Physiological Optics
Manuscript ID: Draft
Manuscript Type: Original Article
Date Submitted by the Author: n/a
Complete List of Authors: Dawes, Piers; University of Manchester, Psychological Sciences Dickinson, Chris; University of Manchester, Faculty of Life Sciences; Emsley, Richard; University of Manchester, Institute of Population Health Bishop, Paul; University of Manchester, Institute of Human Development Cruickshanks, Karen; University of Wisconsin, School of Medicine and Public Health McCormack, Abby; University of Nottingham, NIHR Nottingham Hearing Biomedical Research Unit; University of Nottingham, School of Medicine Fortnum, Heather; University of Nottingham, NIHR Nottingham Hearing Biomedical Research Unit; University of Nottingham, School of Medicine Moore, David; Cincinnati Children’s Hospital Medical Center,
Otorhinolarygnology Norman, Paul; University of Leeds, School of Geography Munro, Kevin; University of Manchester, School of Psychological Sciences; Central Manchester University Hospitals NHS Foundation Trust, Manchester Academic Health Science Centre
Keywords: vision impairment, prevalence, dual sensory impairment, epidemiology
Ophthalmic and Physiological Optics
Ophthalmic and Physiological Optics
For Review O
nly
Vision impairment and dual sensory problems
1
Vision impairment and dual sensory problems in middle age 1
2
Running head: Vision impairment and dual sensory problems 3
4
Piers Dawes1, Christine Dickinson
2, Richard Emsley
3, Paul Bishop
4, Karen Cruickshanks
5, 5
Mark Edmondson-Jones6,7
, Abby McCormack6,7
, Heather Fortnum6,7
, David R. Moore8, Paul 6
Norman9, Kevin Munro
1,10 7
8
9 1
School of Psychological Sciences, University of Manchester, 2 Faculty of Life Sciences, 10
University of Manchester, 3
Centre for Biostatistics, Institute of Population Health, University 11
of Manchester, 4 Institute of Human Development, University of Manchester,
5 Population 12
Health Sciences and Ophthalmology and Visual Sciences, School of Medicine and Public 13
Health, University of Wisconsin, 6 NIHR Nottingham Hearing Biomedical Research Unit, 14
University of Nottingham, 7School of Medicine, University of Nottingham,
8 Cincinnati 15
Children’s Hospital Medical Center, 9 School of Geography, University of Leeds,
10 Central 16
Manchester University Hospitals NHS Foundation Trust, Manchester Academic Health 17
Science Centre 18
19
20
21
22
Key words: vision impairment, dual sensory problems 23
24
Correspondence: Piers Dawes 25
Email address: [email protected] 26
27
28
29
30
31
32
33
34
35
Page 1 of 24
Ophthalmic and Physiological Optics
Ophthalmic and Physiological Optics
123456789101112131415161718192021222324252627282930313233343536373839404142434445464748495051525354555657585960

For Review O
nly
Vision impairment and dual sensory problems
2
Purpose 36
Vision and hearing impairments are known to increase in middle age. In this study we 37
describe the prevalence of vision impairment and dual sensory impairment in UK adults 38
aged 40 to 69 years in a very large and recently ascertained data set. The associations 39
between vision impairment, age, sex, socioeconomic status, and ethnicity are reported. 40
Methods 41
This research was conducted using the UK Biobank Resource, with subsets of UK Biobank 42
data analysed with respect to self-report of eye problems and glasses use. Better-eye visual 43
acuity with habitually worn refractive correction was assessed with a logMAR chart (n = 44
116,682). Better-ear speech reception threshold was measured with an adaptive speech in 45
noise test, the Digit Triplet Test (n = 164,770). Prevalence estimates were weighted with 46
respect to UK 2001 Census data. 47
Results 48
Prevalence of mild visual impairment and low vision was estimated at 15.2% (95% CI 14.9-49
15.5%) and 0.9% (95% CI 0.8-1.0%), respectively. Use of glasses was 88.0% (95% CI 87.9-50
88.1%). The prevalence of dual sensory impairment was 3.1% (95% CI 3.0-3.2%) and there 51
was a nine-fold increase in the prevalence of dual sensory problems between the youngest 52
and oldest age groups. Older adults, those from low socioeconomic and ethnic minority 53
backgrounds were most at risk for vision problems. 54
Conclusions 55
Mild vision impairment is common in middle aged UK adults, despite widespread use of 56
spectacles. Possible barriers to optometric care for those from low socioeconomic and 57
ethnic minority backgrounds may require attention. A higher than expected prevalence of 58
dual impairment suggests that hearing and vision problems share common causes. 59
Optometrists should consider screening for hearing problems, particularly among older 60
adults. 61
Page 2 of 24
Ophthalmic and Physiological Optics
Ophthalmic and Physiological Optics
123456789101112131415161718192021222324252627282930313233343536373839404142434445464748495051525354555657585960
For Review O
nly
Vision impairment and dual sensory problems
3
Introduction 62
The primary aim of this study was to provide an objective current estimate of prevalence 63
visual impairment and dual-sensory impairment among UK adults aged 40 to 69 years. 64
Secondary aims were to document associated demographics and prevalence of spectacle 65
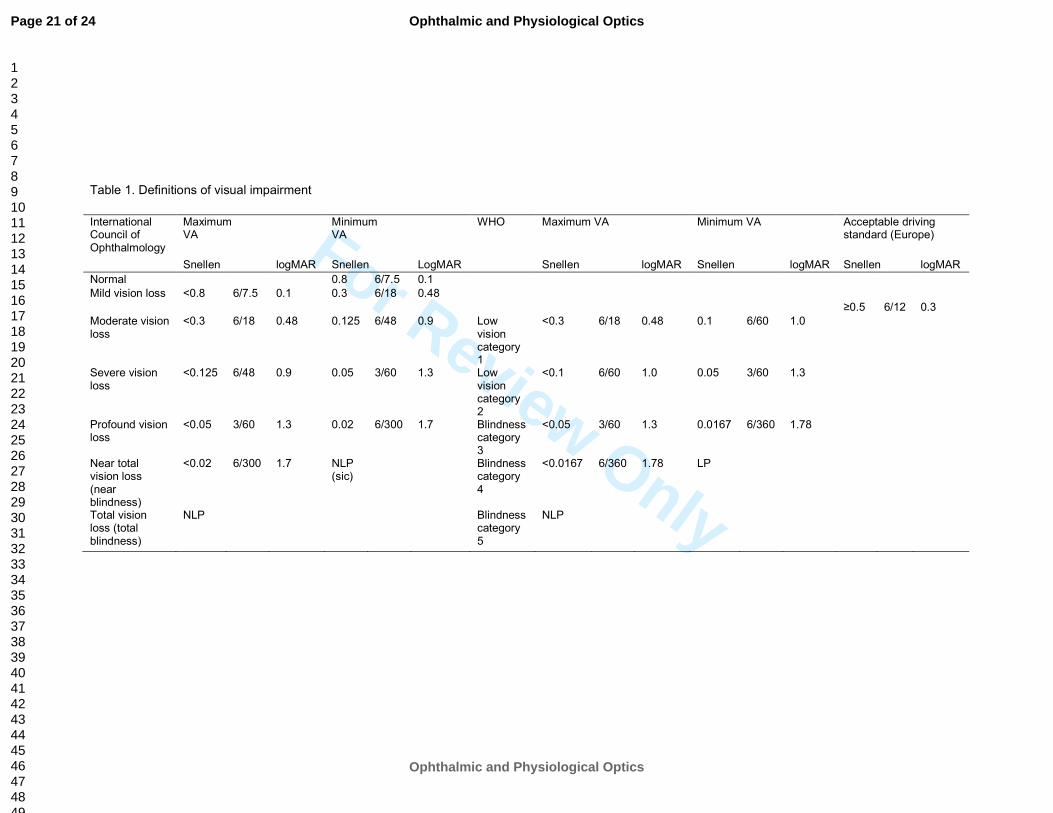
use. Definitions of visual impairment have been recommended by the International Council 66
of Ophthalmology (Table 1); where such detailed reporting is not possible, the WHO 67
categories are used. “Low vision” is considered to mean that the individual may require 68
access to vision rehabilitation in order to prevent activity limitation resulting from that 69
impairment. Mild visual impairment represents a level of visual acuity (VA) which is beyond 70
the 99% confidence limits of the visual performance of the normal population. (1) Although 71
described as ‘mild’, this level of impairment may still have an adverse impact on visual 72
function and quality of life. (2) One particular task where good vision is essential is driving, 73
where the legal VA limit is 6/12. For this reason some studies consider low vision as <6/12 74
rather than <6/18. When considering functional ability it is important to measure habitual 75
acuity (presenting acuity), rather than best corrected. (3) Any difference between the 76
habitual and best corrected acuity is due to uncorrected refractive error (i.e. the lack of up-77
to-date distance spectacles). However, perhaps due to an interest in impairment rather than 78
disability, most population studies tend to assess best-corrected vision. (4) Studies that have 79
assessed both presenting/habitual and best-corrected acuity suggest that there is potential 80
for significant improvement, especially for lower levels of impairment (prevalence of 81
VA<6/12 fell from 2.6% to 0.61% with correction). (5) Two recent studies have suggested an 82
even higher prevalence of habitual mild impairment. (6, 7) Besides an emphasis on best 83
corrected acuity, most previous studies focused on older age groups, because of higher 84
levels of impairment among older adults, and on low vision rather than mild visual 85
impairment, because of its functional significance. (8) 86
87
(insert table 1) 88
89
In previous studies in the UK, the prevalence of low vision (visual acuity <6/18) in those aged 90
between 65 and 74 years has been estimated at 6%, increasing to 32% in those aged over 91
85, based on habitual visual acuity. (9) Mild visual impairment (visual acuity <6/12) was 92
estimated at 16% in 65 to 74 year-olds, rising to 54% in those aged over 85 years. 93
Page 3 of 24
Ophthalmic and Physiological Optics
Ophthalmic and Physiological Optics
123456789101112131415161718192021222324252627282930313233343536373839404142434445464748495051525354555657585960
For Review O
nly
Vision impairment and dual sensory problems
4
Comparable results were obtained in a study of those aged 75 years and older (10). A 94
summary concluded that visual impairment affects ~10% of those aged 65-75 and ~20% of 95
those aged over 75 years. (11) Estimates of the prevalence of visual impairment in younger 96
age groups are summarised in Table 2, and show a considerably lower prevalence. Two US, 97
one Danish and one Icelandic study show that prevalence of best corrected VA <6/12 rises 98
by a factor of at least 30x between the ages of 40 and 80 years. 99
100
(insert table 2) 101
102
A dual sensory problem refers to the co-existence of both vision and hearing difficulties. 103
Some studies suggest increased difficulty with activities of daily living, (12, 13) increased risk 104
of depression, (14) lower quality of life (15) and higher risk of mortality (16) for those with 105
dual sensory problems compared to those with either hearing or visual impairment alone. 106
Estimates of the prevalence of dual sensory problems are rarer than those for either vision 107
or hearing impairment, as studies have usually focused on one or the other. As there is no 108
accepted definition of dual sensory problems, estimates of prevalence also vary widely 109
depending on definition and study population. (17) Based on self-report, 1.3% of US adults 110
aged over 18 years (16) and 21% of those aged over 70 years (12) were reported to have a 111
dual sensory problem. Based on visual acuity and audiometric measures (best-corrected 112
better-eye visual acuity <20/40 and better ear threshold > 25dB HL across 0.5 to 4 kHz), 113
1.5% of those aged over 20 years had dual sensory problems. (18) 114
115
The present study provides a snapshot of vision impairment and dual sensory impairment 116
experienced by UK adults aged 40 to 69 years based on a large and inclusive sample. Vision 117
assessment was based on presenting/habitual visual acuity. Relations between vision 118
impairment, age, sex, socioeconomic status and ethnicity are also described. 119
120
Methods 121
The UK Biobank is a resource for the investigation of the genetic, environmental and 122
lifestyle causes of diseases in middle and older age. Participants were recruited via the UK 123
National Health Service and aimed to be as inclusive and representative as possible of the 124
UK population with reference to the 2001 UK Census. (19) Over the course of 2006-2010, 125
Page 4 of 24
Ophthalmic and Physiological Optics
Ophthalmic and Physiological Optics
123456789101112131415161718192021222324252627282930313233343536373839404142434445464748495051525354555657585960
For Review O
nly
Vision impairment and dual sensory problems
5
503,325 participants were recruited with a response rate of 5.47%. All participants 126
responded to questions on sex and ethnicity based on 2001 UK Census categories. 127
Townsend deprivation score of the area of residence was recorded for each participant. The 128
Townsend index is a proxy measure of socioeconomic status widely used in health studies. 129
(20) It is comprised of four input variables on unemployment, non-home ownership, non-car 130
ownership and household overcrowding. Each variable is standardised with respect to 131
national level and summed to give a single deprivation score for each area. Lower scores 132
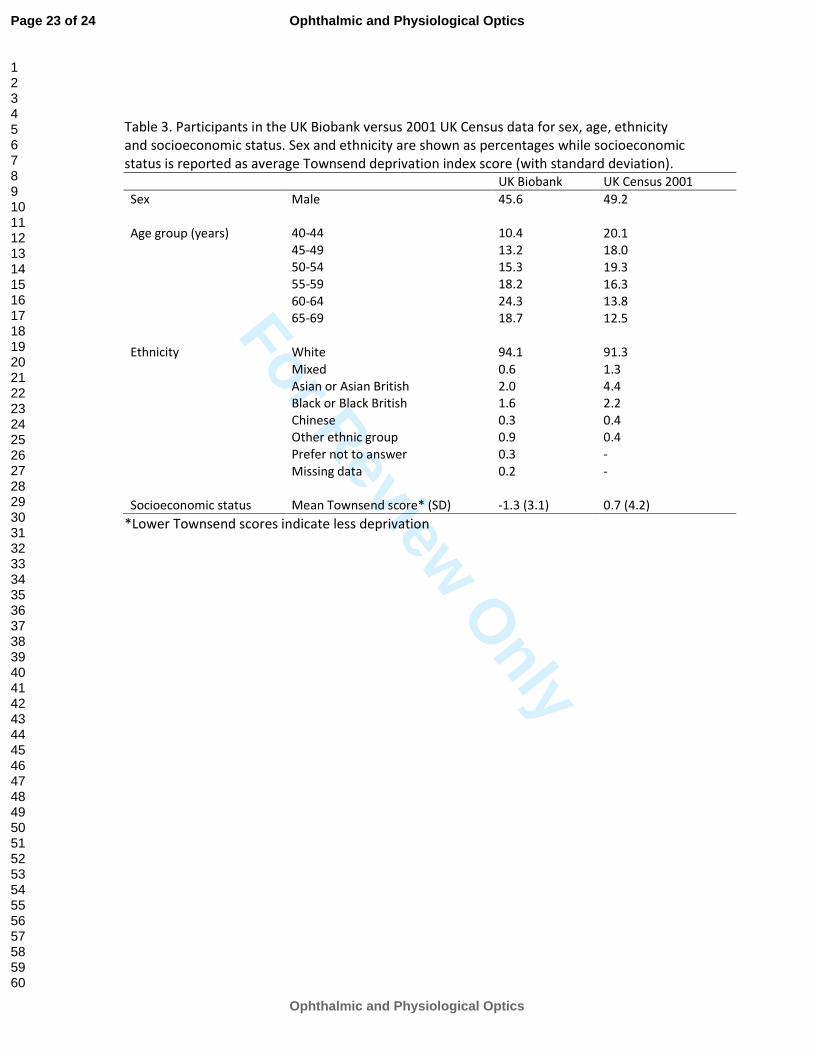
represent less deprived socioeconomic status. Table 3 shows the demographic profile for 133
the UK Biobank sample and for the corresponding section of the UK population. The UK 134
Biobank contained a marginally higher proportion of females, ethnically White people and 135
people living in less deprived areas than the general population. During the course of data 136
collection, additional measures were added to the test protocol such that some measures 137
were completed by a subset of participants. In the present study, prevalence estimates are 138
based on the subset of participants that completed each measure. For visual acuity data and 139
dual sensory impairment, data for 116,682 participants were obtained. Different numbers of 140
participants also completed self-report questions on glasses use and eye problems 141
dependent on when the question was included in the protocol. The sample size for each 142
question is reported below. 143
144
(insert table 3) 145
146
Participants attended a UK Biobank assessment centre and provided informed written 147
consent. They then completed a 90 minute assessment which included questionnaire and 148
physical measures. Questionnaire measures involved lifestyle, environmental and medical 149
factors, with responses collected via a touchscreen computer. Detailed information on the 150
protocol and other data collected may be found elsewhere (http://www.ukbiobank.ac.uk/). 151
152
Vision self-report questions 153
Participants responded to questions on use of glasses or contact lenses, eye problems and 154
reason for using glasses presented via the computerised touchscreen interface. They 155
included 156
Page 5 of 24
Ophthalmic and Physiological Optics
Ophthalmic and Physiological Optics
123456789101112131415161718192021222324252627282930313233343536373839404142434445464748495051525354555657585960
For Review O
nly
Vision impairment and dual sensory problems
6
• “Do you wear glasses or contact lenses to correct your vision? (Yes; No; Prefer not to 157
answer)” (N=499,365); 158
• “Why were you prescribed glasses/contacts? (You can select more than one answer) (For 159
short-sightedness, i.e. only or mainly for distance viewing such as driving, cinema etc (called 160
'myopia'); For long-sightedness, i.e. for distance and near, but particularly for near tasks like 161
reading (called 'hypermetropia'); For just reading/near work as you are getting older (called 162
'presbyopia'); For 'astigmatism'; For a 'squint' or 'turn' in an eye since childhood (called 163
'strabismus'); For a 'lazy' eye or an eye with poor vision since childhood (called 'amblyopia'); 164
Other eye condition; Do not know; Prefer not to answer)” (N=106,043); 165
• “Do you have any other problems with your eyes or eyesight? (Yes; No; Prefer not to 166
answer)” (N=499,365); 167
• “Has a doctor told you that you have any of the following problems with your eyes? (You can 168
select more than one answer) (Diabetes related eye disease; Glaucoma; Injury or trauma 169
resulting in loss of vision; Cataract; Macular degeneration; Other serious eye condition; None 170
of the above; Prefer not to answer; Do not know)” (N=173,671). 171
172
Visual acuity test 173
Visual acuity (VA) testing was based on reading high contrast letters, with the participant 174
seated at a distance of 4 metres. Visual correction was worn for those participants that 175
normally wore glasses or contact lenses for distance, and visual acuity measures were 176
completed monocularly on both eyes. The score was determined as the logMAR size at 177
which 3 out of the 5 letters presented were read correctly. Normal vision was defined as 178
visual acuity (decimal Snellen) ≥0.8, mild impairment as <0.8 and ≥ 0.3 and low vision <0.3 179
and ≥ 0.05. Blindness (<0.05) was not a focus of the current study. Those with visual acuity 180
within the blindness range (n = 4) were excluded from analysis. We are not aware of any 181
standard criteria for dual sensory impairment. In this study, dual sensory impairment was 182
identified based on ‘insufficient’ or ‘poor’ performance on the DTT hearing test combined 183
with visual acuity in the ‘mild impairment’ or ‘low vision’ range. 184
185
Digit Triplet Test 186
The Digit Triplet Test is a speech-in-noise test originally developed in Dutch by Smits and 187
colleagues (21) which provides an objective and ecologically relevant measure of hearing 188
disability and correlates highly with audiometric thresholds (r = 0.77 (21)). The DTT is 189
Page 6 of 24
Ophthalmic and Physiological Optics
Ophthalmic and Physiological Optics
123456789101112131415161718192021222324252627282930313233343536373839404142434445464748495051525354555657585960
For Review O
nly
Vision impairment and dual sensory problems
7
described elsewhere (http://biobank.ctsu.ox.ac.uk/crystal/label.cgi?id=100049). The signal 190
to noise ratio (dB SNR) for the 50% correct speech recognition threshold is estimated via an 191
adaptive tracking method for each ear. Lower scores correspond to better performance. 192
DTT performance was categorised with respect to a normative sample of young normally 193
hearing listeners. (22) Performance cut-offs were based on previously recommended 194
standards, (21, 23) such that insufficient or poor performance corresponds to performance 195
lower (worse) than -2 standard deviations with respect to the normative group, or a 50% 196
correct recognition threshold higher than -5.5 dB. (22) 197
198
Data analysis 199
Analyses were performed with Stata version 12.1. In each subsample, iterative proportional 200
fitting (IPF, or raking; ipfweight command in Stata) was applied in each age category to 201
adjust the subsample margins to known population margins of sex, ethnicity and 202
socioeconomic status from the 2001 UK Census. For socioeconomic status, deciles of 203
deprivation weighted for each five year age-group using 2001 UK Census data were linked to 204
each participant. This allowed for the Biobank sample being selective of people living in 205
slightly less deprived circumstances and that the distribution of people across differently 206
deprived areas varies by age. The 2001 UK Census was selected as the reference population 207
because Biobank recruitment aimed for comparability with this census. Because different 208
subsets of participants completed each measure, the weights were calculated separately 209
within subsamples based on whether the respective outcome variable was observed. It was 210
assumed that any missing data may be ignored because the reason for missing data is not 211
systematically related to the outcome variable nor any other variable. Missing data were 212
largely accounted for by the addition of measures at different points over the course of data 213
collection, and this was unrelated to the hearing or vision status of participants. The 214
iterative proportional fitting procedure involves a stepwise adjustment of sampling weights 215
until the difference between the observed subsample margins and the known population 216
margins across sex, ethnicity and socioeconomic status is less than a specified tolerance, set 217
at 0.2%. Convergence of the fitting procedure was achieved in less than 10 iterations for all 218
subsamples and age categories. All subsamples were weighted and cross tabulations 219
performed to generate the population prevalence estimates. Multinomial logistic regression 220
Page 7 of 24
Ophthalmic and Physiological Optics
Ophthalmic and Physiological Optics
123456789101112131415161718192021222324252627282930313233343536373839404142434445464748495051525354555657585960
For Review O
nly
Vision impairment and dual sensory problems
8
was used to model the association of age, sex, ethnicity and socioeconomic status with 221
vision impairment. 222
223
Results 224
Vision 225
The prevalence of both mild impairment and low vision with habitually worn refractive 226
correction for distance viewing increased with age (Figure 1), with proportional increases of 227
3.6x and 2x between the youngest and oldest age groups for mild impairment and low 228
vision, respectively. 229
230
(insert figure 1) 231
232
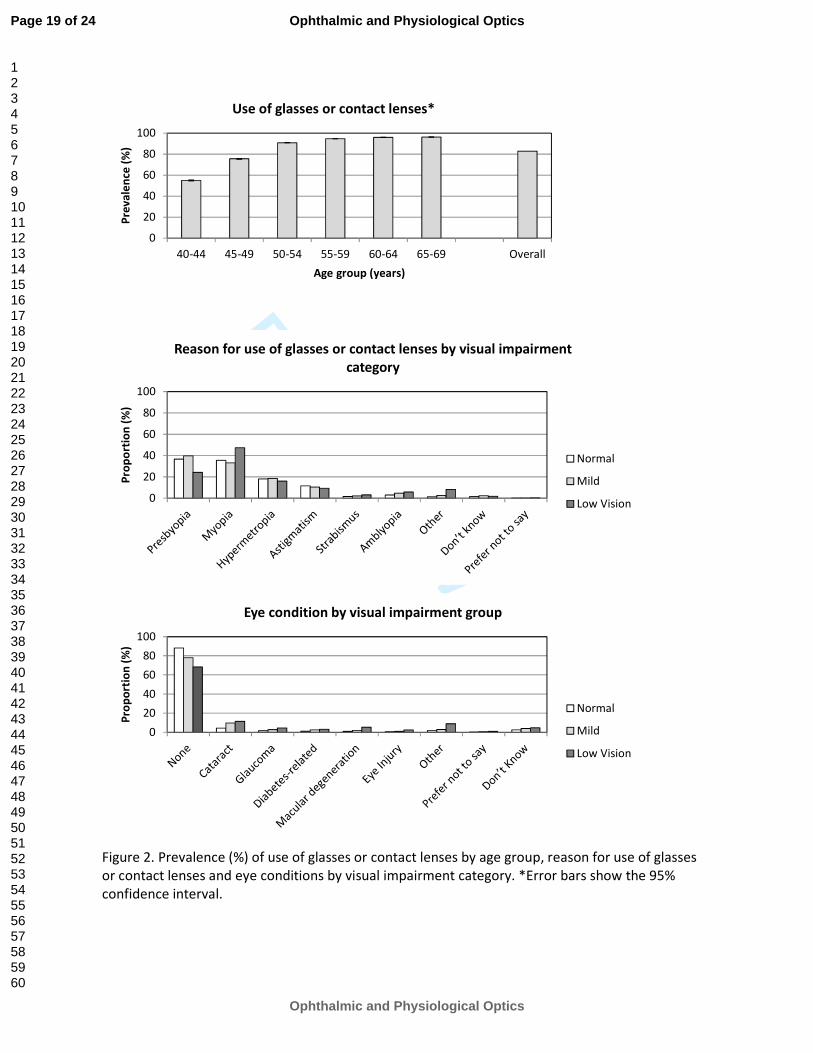
Self-reported use of glasses was common (Figure 2); by age 50 and over 90% of participants 233
reported using glasses or contact lenses. Use of glasses or contact lenses was similar among 234
all categories of visual impairment; 88.1%, 91.0% and 91.3% for normal vision, mild 235
impairment and low vision, respectively. For those with normal vision or mild impairment, 236
the commonest reason for use of glasses was presbyopia (use of glasses for reading or close 237
viewing). Myopia, hypermetropia and astigmatism were next most common. Myopia was a 238
particularly common reason for use of glasses in the low vision group. Eye conditions were 239
more common among those with mild impairment or low vision. The overall rate of eye 240
conditions in the impaired categories was 18.2%. For those in the impaired categories who 241
reported no eye condition, 46.6% used glasses for distance viewinga while 36.8% reported 242
neither an eye condition nor using glasses for distance viewing. Cataracts were the most 243
commonly reported eye condition (~10% of those with mild impairment or low vision), 244
followed by macular degeneration, glaucoma and diabetes-related eye disease. 245
246
(insert figure 2) 247
248
The main effects of age, sex, socioeconomic status, and ethnicity were tested in a logistic 249
regression model for the prevalence of visual impairment (‘mild impairment’ and ‘low 250
a Distance viewing was estimated as the sum of those who report using glasses or contact lenses for either
myopia, hypermetropia or astigmatism.
Page 8 of 24
Ophthalmic and Physiological Optics
Ophthalmic and Physiological Optics
123456789101112131415161718192021222324252627282930313233343536373839404142434445464748495051525354555657585960
For Review O
nly
Vision impairment and dual sensory problems
9
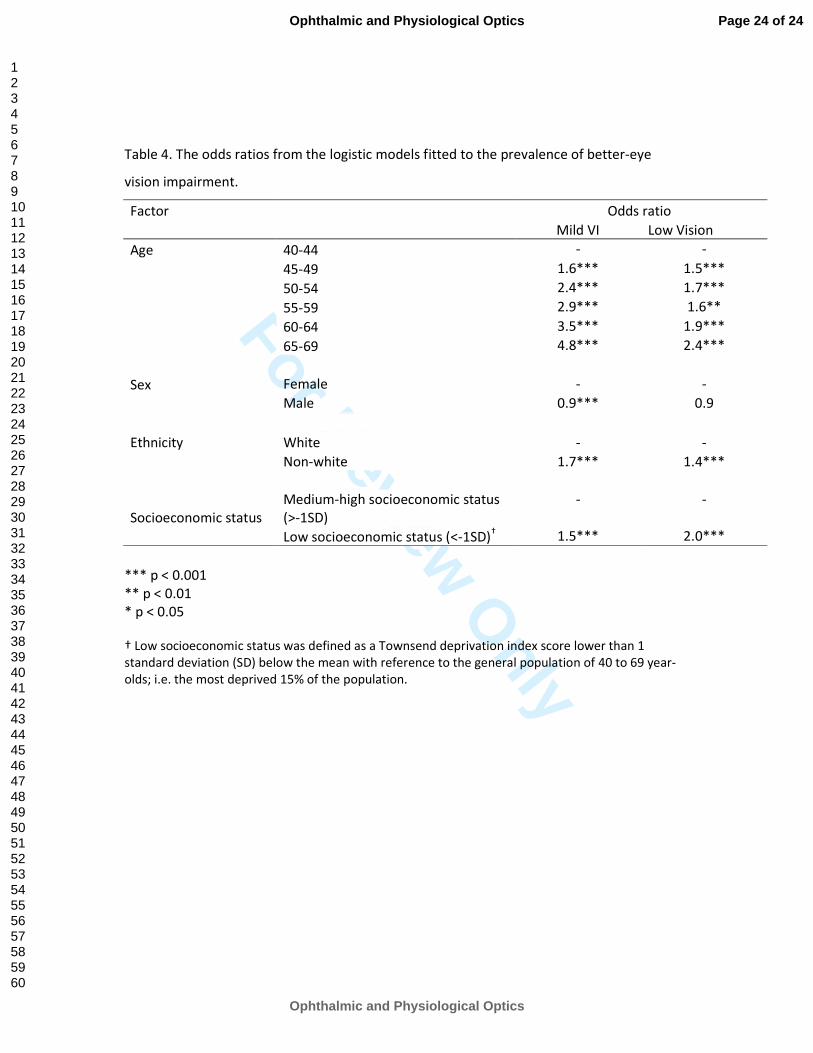
vision’; Table 4). Increasing age was associated with the largest risk for visual impairment. 251
Low socioeconomic background and Non-white ethnicity were associated with higher risk 252
for vision impairment. Although Non-white ethnicity was associated with higher risk of 253
vision impairment than White ethnicity, the proportion of non-Whites who reported an eye 254
problem was significantly lower than the number of Whites (19.7% versus 21.4%; Χ2(1)= 255
6.58, p = 0.01). Use of glasses was also lower among non-Whites compared to Whites 256
(79.1% versus 88.9%; Χ2(1)= 162.3, p < 0.01). Logistic models were re-run to provide risk 257
estimates for ethnic sub-groups compared to White British for vision impairment (mild or 258
low; see Supplemental Tables). Ethnicities at highest risk were Black Other, ‘Don’t know’, 259
Bangladeshi, Black African and Pakistani (ORs 2.0 to 3.5, p < 0.001). Female sex was a small 260
risk for mild visual impairment. The odds ratio for sex was the same for low vision as for 261
mild impairment, although the association was not significant for low vision (perhaps due to 262
a smaller number of participants and reduced statistical power). 263
264
(insert table 4) 265
266
Dual sensory problems 267
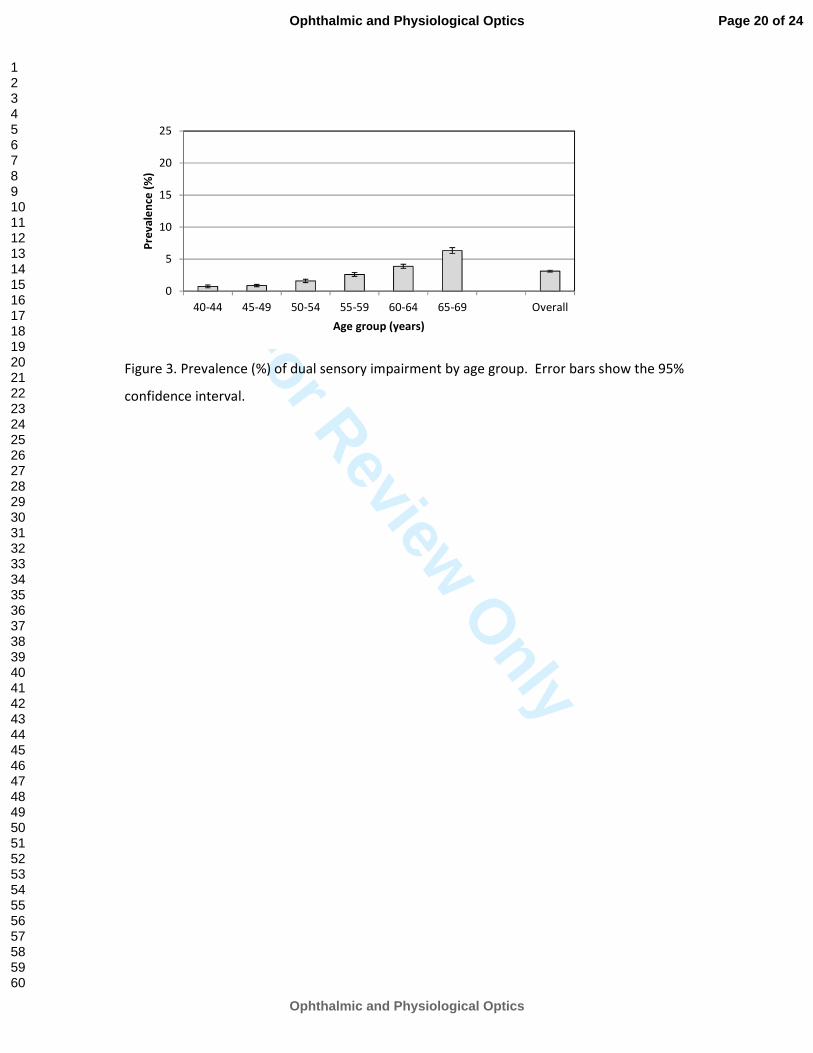
Prevalence of dual sensory problems (Figure 3) has a higher proportional increase with age 268
than for vision impairment alone; a 9x increase between youngest and oldest age groups. 269
Overall, 2.4% of participants had a dual sensory problem. The occurrence of dual sensory 270
problems was significantly greater than if hearing and vision problems occur independently 271
(expected proportion of 1.5%; Χ2(1)= 584, p < 0.01). Average speech in noise recognition 272
thresholds were significantly worse for those with mild or low vision compared to those 273
with normal vision (by 0.5 and 0.6 dB respectively, p<0.01). Risk factors for dual sensory 274
problems followed a similar pattern to those of hearing and vision (not shown here). 275
276
(insert figure 3) 277
278
Discussion 279
Vision 280
The overall prevalence of vision impairment (mild and low vision) was 14.0%, based on 281
visual acuity measures with participants wearing the spectacles or contact lenses habitually 282
Page 9 of 24
Ophthalmic and Physiological Optics
Ophthalmic and Physiological Optics
123456789101112131415161718192021222324252627282930313233343536373839404142434445464748495051525354555657585960
For Review O
nly
Vision impairment and dual sensory problems
10
worn for distance viewing. With the available data, we cannot distinguish the proportion of 283
impairment due to refractive error or to an eye condition. The overall rate of self-reported 284
eye conditions among those with impaired vision was 16.1%. Previous studies concluded 285
that the majority of cases of impairment in western countries were due to imperfectly 286
corrected or uncorrected refractive errors. (24-26) In a population (age 30 years and above) 287
in Finland, of those with VA <0.5, 37% had no documented eye disease: of those only 25% 288
reported using spectacles, 61% had not had an eye examination for 5 years and 35% had 289
never had an eye examination. (27) In a recent UK study, of those with VA <6/18, 28% had 290
uncorrected refractive error. (7) We therefore suspect that refractive error is likely to be the 291
most common cause of visual impairment in this UK sample. Despite the suspicion of high 292
rates of un- or imperfectly corrected refraction, use of glasses was very common, and 293
matches the pattern reported in earlier studies. In an Australian study described earlier, (5) 294
participants aged 40-98 years reported that 56% wore distance spectacles and 87% women 295
and 85% men wore near spectacles. Distance spectacle wear progressively increased 296
throughout age span, but near spectacles increased notably between the 40-49 (approx. 297
60% wearing) and 50-59 (95%+ wearing) age groups (5). High levels of spectacle use have 298
been reported in the UK with older age groups (aged 65+ years); 60.6% had distance specs 299
and 89% had near spectacles. (9) 300
301
It was surprising that refractive error is likely to be the most common cause of visual 302
impairment in this sample, despite the use of spectacles being so common. It may be that 303
spectacles were originally optimally prescribed by an optometrist but the prescription has 304
become outdated. A recent study of 768 Canadians aged over 40 years found the 305
prevalence of presenting acuity <20/40 in the better eye was 2.7%, with over 70% being 306
correctable by refraction, despite the fact that 68% of participants in that study already 307
wore distance correction, and 82.6% near spectacles. (6) The numbers with correctable 308
vision impairment decreased as age increased, but increased in those not tested for >2 309
years. It is recommended that adults under 70 years have an eye examination every 2 years, 310
with an annual examination for those aged over 70 years. Evans and Rowlands (11) felt that 311
additional publicity to raise awareness of the need for regular checks may be necessary, and 312
reviewed other reasons for the high prevalence of correctable visual impairment. They 313
Page 10 of 24
Ophthalmic and Physiological Optics
Ophthalmic and Physiological Optics
123456789101112131415161718192021222324252627282930313233343536373839404142434445464748495051525354555657585960

For Review O
nly
Vision impairment and dual sensory problems
11
include cost (or perceived cost) of spectaclesb, inadequate service provision, lack of a 314
screening programme, poor recognition of the treatability of vision problems and avoidance 315
of healthcare services. For older adults, mobility and cognition problems may limit access to 316
services. Those from ethnic minority backgrounds may perceive language or cultural barriers 317
and tend to be under-represented in ophthalmology case-loads (28, 29) despite being at 318
greater risk of certain eye diseases. 319
320
In the present study, older age was the factor most prominently associated with poor vision. 321
Low socioeconomic status was also associated with higher odds of vision impairment. Male 322
sex was associated with slightly less risk for mild vision impairment, in agreement with 323
previous studies. (25, 30) Non-white ethnicities were associated with increased risk of vision 324
impairment. Examination of risks associated with ethnic subgroups suggested that this 325
association is driven by ethnic subgroups that are at particular risk for vision problems; Black 326
Other, Bangladeshi, Black African, and Pakistani in particular. This is in line with findings of 327
poorer general health within particular ethnic minorities in the UK. (31) Suggested reasons 328
for health inequality centre around culture and lifestyle, socioeconomic factors, reduced 329
uptake of services and biological susceptibility. (32) Despite higher odds of visual 330
impairment, use of glasses and self-reported eye problems were significantly lower in Non-331
whites versus White ethnic groups in the present study. Taken together with previous 332
research (28, 29), this suggests that uptake of vision services may be lower among ethnic 333
minorities. 334
335
Cataracts were the most commonly reported eye condition in mild and low vision 336
categories, while macular degeneration, diabetic retinopathy and glaucoma were 337
proportionally more prominent in the low vision category compared to the mild category. . 338
The pattern of self-reported eye conditions agrees with previous studies. (25, 33-35) The 339
average waiting time for cataract surgery in England (estimated in 2011) was 60 days.(36) It 340
b In the UK, eligibility for free eye tests is currently means tested for individuals between the ages of 16 and 60
(except for a few specific exceptions), and vouchers towards glasses are provided on a means tested basis for
adults of all ages. However for those entitled to an NHS eye examination, this can be carried out in the home
for those who have limited mobility. Optical low vision aids (magnifiers) are however provided free of charge
(by hospital clinics). In contrast, audiological services and hearing aids are freely provided.
Page 11 of 24
Ophthalmic and Physiological Optics
Ophthalmic and Physiological Optics
123456789101112131415161718192021222324252627282930313233343536373839404142434445464748495051525354555657585960

For Review O
nly
Vision impairment and dual sensory problems
12
therefore seems unlikely that a long delay for surgery is the reason that cataracts were the 341
most commonly reported condition. 342
343
Dual sensory problems 344
The prevalence of dual sensory problems was statistically significantly greater than expected 345
if vision and hearing problems occur independently. The proportional increase with age in 346
the prevalence of dual sensory problems was high compared to increases vision impairment 347
and previously reported (22) increases in hearing impairment alone (9x versus 3.3x and 3.9x 348
for vision and hearing impairment, respectively), suggesting that risks for sensory 349
impairment are not simply additive. The tendency for vision and hearing impairments to co-350
occur has been noted previously, with a suggestion that they may share common risk 351
factors. (37-39) Factors associated with vision impairment in the present study were similar 352
to those previously observed for hearing impairment. (22) The consequences of the dual 353
sensory loss may be greater than predicted on the basis of the severity of the hearing and 354
vision losses when considered in isolation. For example, Dickinson and Taylor simulated 355
hearing and vision impairments in healthy volunteers, and found that even minor visual 356
defects significantly compromised speech-reading abilityc when there was a concurrent 357
hearing loss. (40) 358
359
Given the tendency for hearing and vision problems to occur together and the impact of 360
dual sensory problems on quality of life, it may be helpful for audiologists and optometrists 361
to screen for impairments in both hearing and vision. (30) Audiologists could ask patients for 362
the date of their latest eye examination and if more than two years (or one year in those 363
individuals aged over 70 years, according to National Health Service guidelines; 364
http://www.nhs.uk/chq/Pages/1093.aspx?CategoryID=68&SubCategoryID=157), then advise 365
them to go to their local optometrist. Optometrists could also advise patients to request a 366
hearing test. This is not currently readily available in the UK, as this would require a referral 367
to a National Health Service audiology clinic from a general medical practitioner. However, 368
this is set to change with moves in England to open hearing aid provision to commercial 369
competition (the ‘any qualified provider’ scheme). 370
c Speech-reading refers to the ability to recognise speech sounds visually, using movements of the speaker’s
mouth or other sources of visual information.
Page 12 of 24
Ophthalmic and Physiological Optics
Ophthalmic and Physiological Optics
123456789101112131415161718192021222324252627282930313233343536373839404142434445464748495051525354555657585960

For Review O
nly
Vision impairment and dual sensory problems
13
Limitations 371
Potentially the most significant limitation of the current study is that, despite the large 372
number of participants, the low response rate of 5.47% may have introduced unknown 373
biases into prevalence estimates that may not be accounted for by the statistical weighting 374
procedures used in this study. The UK Biobank argued that despite the low response rate, 375
the size and coverage of the sample allows generalisable associations between relevant risk 376
factors and health outcomes. (41) The size and coverage of the UK Biobank sample may also 377
give confidence in the reliability of prevalence estimates reported here. An additional 378
limitation is that UK Biobank recruitment and testing was not designed to cater for those 379
with vision impairment. This may have excluded those with vision problems, and so 380
prevalence figures reported here may be an underestimate. 381
382
The current gold standard acuity test in research is the Early Treatment Diabetic 383
Retinopathy Study (ETDRS) chart. The letter presentation and the testing conditions in the 384
Biobank assessment differ from this; it is unclear how the “crowding” of the letter targets is 385
arranged, and acuity measurements are conducted in a darkened room 386
(http://biobank.ctsu.ox.ac.uk/crystal/field.cgi?id=5201). The procedure to derive the VA 387
score is also unclear, but appears to be similar to the “ETDRS-FAST” used by Camparini and 388
colleagues. (42) Visual acuity was categorised according to ‘better eye’ performance based 389
on recommended cut-offs for mild impairment and low vision. (43, 44) It has been 390
suggested that binocular vision would be a more accurate representation of how the 391
individual functions in everyday life. (45) However binocular VA is determined by the VA in 392
the better eye (http://www.ski.org/Colenbrander/Images/Visual_Impairmnt_Guide.pdf), 393
and two population studies (46, 47) both identified the mean population difference in 394
binocular and better eye VA to be 0.02 logMAR, which Rubin and colleagues (46) noted to 395
be an insignificant difference. Better eye visual acuity estimates are therefore a reasonable 396
approximation of binocular performance in a population-based study. 397
398
Conclusions 399
Older people, those from low socioeconomic and ethnic minority backgrounds are 400
particularly at risk for vision problems. Vision impairment is rather prevalent despite 401
widespread use of spectacles and contact lenses. A high proportion of those who would 402
Page 13 of 24
Ophthalmic and Physiological Optics
Ophthalmic and Physiological Optics
123456789101112131415161718192021222324252627282930313233343536373839404142434445464748495051525354555657585960
For Review O
nly
Vision impairment and dual sensory problems
14
benefit from correction may not receive effective intervention. Possible reasons for low 403
uptake may include lack of recognition of difficulties or lack of awareness of treatment 404
options. Cost may be a particular barrier for vision services. Hearing and vision problems 405
tend to occur together, and the proportional increase with age in those with both hearing 406
and vision problems was higher than for hearing or vision problems separately. This 407
suggests that causes of hearing and vision problems are not merely additive. Audiologists 408
and optometrists should test for dual sensory problems, as these persons are at a much 409
greater disadvantage in daily life. 410
411
Disclosure 412
The authors report no conflicts of interest and have no proprietary interest in any of the 413
materials mentioned in this article. 414
415
Acknowledgements 416
This research was facilitated by Manchester Biomedical Research Centre and ulitised the UK 417
Biobank resource. The Nottingham Hearing Biomedical Research Unit is funded by the 418
National Institute for Health Research. DRM was supported by the Intramural Programme of 419
the Medical Research Council [Grant U135097130]. KJC was supported by R37AG11099, 420
R01AG021917 and an Unrestricted Grant from Research to Prevent Blindness 421
422
This paper presents independent research funded in part by the National Institute for 423
Health Research (NIHR). The views expressed are those of the author(s) and not necessarily 424
those of the NHS, the NIHR or the Department of Health. 425
426
References 427
1. Leat SJ, Legge GE, Bullimore MA. What is low vision? A re-evaluation of definitions. 428
Optometry & Vision Science. 1999;76(4):198-211. 429
2. West SK, Rubin G, Broman AT, Munoz B, Bandeen–Roche K, Turano K. How does visual 430
impairment affect performance on tasks of everyday life?: The SEE Project Archives of 431
ophthalmology. 2002;120(6):774-80. 432
3. Dandona L, & Dandona, R. (2006). . , 4(1), 7. Revision of visual impairment definitions in the 433
International Statistical Classification of Diseases. BMC medicine. 2006;4(1):7. 434
Page 14 of 24
Ophthalmic and Physiological Optics
Ophthalmic and Physiological Optics
123456789101112131415161718192021222324252627282930313233343536373839404142434445464748495051525354555657585960

For Review O
nly
Vision impairment and dual sensory problems
15
4. Resnikoff S, Pascolini D, Mariotti SP, Pokharel GP. Global magnitude of visual impairment 435
caused by uncorrected refractive errors in 2004. Bulletin of the World Health Organization,. 436
2008;86(1):63-70. 437
5. Taylor HR, Liningson PM, Stanislavsky YL, McCarty CA. Visual impairment in Australia: 438
Distance visual acuity, near vision, and visual field findings of the Melbourne Visual Impairment 439
Project. American Journal of Opthalmology. 1997;123(3):328-37. 440
6. Robinson BE, Feng Y, Fonn D, Woods CA, Gordon KD, Gold D. Risk Factors For Visual 441
Impairment-Report From A Population-based Study (CURES). Investigative Ophtalmology and Visual 442
Science. 2011;52(6):4217. 443
7. Khawaja AP, Chan MP, Hayat S, Broadway DC, Luben R, Garway-Heath DF, et al. The EPIC-444
Norfolk Eye Study: rationale, methods and a cross-sectional analysis of visual impairment in a 445
population-based cohort. BMJ open. 2013;3(3). 446
8. Tate R, Smeeth L, Evans J, Fletcher A, Owen C, Rudnicka A. The prevalence of visual 447
impairment in the UK. A review of the literature. London: Royal National Institute for the Blind, 448
2005. 449
9. van der Pols JC, Bates CJ, McGraw PV, Thompson JR, Reacher M, Prentice A, et al. Visual 450
acuity measurements in a national sample of British elderly people. British Journal of Opthalmology. 451
2000;84:165-70. 452
10. Evans JR, Fletcher AE, Wormald RPL, Siu-Woon Ng E, Stirling L, Smeeth L, et al. Prevalence of 453
visual impairment in people aged 75 years and older in Britain: Results from the MRC trial of 454
assessment and management of older people in the community. British Journal of Opthalmology. 455
2002;86:795-800. 456
11. Evans BJW, Rowlands G. Correctable visual impairment in older people: A major unmet 457
need. Ophthalmic and Physiological Optics. 2004;24:161-80. 458
12. Brennan M, Horowitz A, Su Y. Dual sensory loss and its impact on everyday competence. The 459
Gerontologist. 2005;45(3):337-46. 460
13. Crews JE, Campbell VA. Vision impairment and hearing loss among community-dwelling 461
older Americans: Implications for health and functioning American Journal of Public Health. 462
2004;94(5):823-9. 463
14. Capella-McDonnall ME. The effects of single and dual sensory loss on symptoms of 464
depression in the elderly. Int J 465
Geriatr Psychiatry. 2005;20(9):855–61. International Journal of Geriatric Pyschiatry. 2005;20(9):855-466
61. 467
15. Fisher ME, Cruickshanks KJ, Klein B, Klein R, Schubert CR, Wiley TL. Multiple sensory 468
impairment and quality of life. Opthalmic Epidemiology. 2009;16(6):346-53. 469
16. Lam BL, Lee DJ, Gomez-Marin O, Zheng DD, Caban AJ. Concurrent visual and hearing 470
impairment and risk of mortality: The National Health Interview Survey. Archives of Opthalmology. 471
2006;124(1):95-101. 472
17. Smith SL, Bennett LW, Wilson RH. Prevalence and characteristics of dual sensory impairment 473
(hearing and vision) in a veteran population. Journal of Rehabilitation Research & Development. 474
2008;45(4):597-610. 475
18. Swenor BK, Ramulu PY, Willis JR, Friedman D, Lin FR. The Prevalence of Concurrent Hearing 476
and Vision Impairment in the United States. JAMA internal medicine. 2013;173(4):312-3. 477
19. Office for National Statistics. Census 2001: General report for England and Wales. 2005. 478
20. Norman P. Identifying change over time in small area socio-economic deprivation. Applied 479
Spatial Analysis and Policy. 2010;3(2):107-38. 480
21. Smits C, Kapteyn TS, Houtgast T. Development and validation of an automatic speech-in-481
noise screening test by telephone. International Journal of Audiology. 2004;43:15-28. 482
22. Dawes P, Fortnum H, Moore DR, Emsley R, Norman P, Cruickshanks KJ, et al. Hearing in 483
middle age: a population snapshot of 40-69 year olds in the UK. Ear and hearing. in press. 484
Page 15 of 24
Ophthalmic and Physiological Optics
Ophthalmic and Physiological Optics
123456789101112131415161718192021222324252627282930313233343536373839404142434445464748495051525354555657585960
For Review O
nly
Vision impairment and dual sensory problems
16
23. Smits C, Houtgast T. Results from the Dutch speech-in-noise screening test by telephone. Ear 485
& Hearing. 2005;26:89-95. 486
24. Weih LM, VanNewkirk MR, McCarty CA, Taylor HR. Age-specific causes of bilateral visual 487
impairment. Archives of ophthalmology. 2000;118(2):264. 488
25. Attebo K, Mitchell P, Smith W. Visual acuity and the causes of visual loss in Australia. The 489
Blue Mountains Eye Study. Ophthalmology. 1996;103(3):357. 490
26. VanNewkirk MR, Weih L, McCarty CA, Taylor HR. Cause-specific prevalence of bilateral visual 491
impairment in Victoria, Australia: the Visual Impairment Project. Ophthalmology. 2001;108(5):960. 492
27. Laitinen A, Laatikainen L, Härkänen T, Koskinen S, Reunanen A, Aromaa A. Prevalence of 493
major eye diseases and causes of visual impairment in the adult Finnish population: a nationwide 494
population-based survey. Acta Ophthalmologica. 2010;88(4):463-71. 495
28. Lindesay J, Jagger C, Hibbett MJ, Peet SM, Moledina F. Knowledge, uptake and availability of 496
health and social services among Asian Gujarati and white elderly persons. Ethnicity & health. 497
1997;2(1-2):59-69. 498
29. Pardhan S, Mahomed I. The clinical characteristics of Asian and Caucasian patients on 499
Bradford’s Low Vision Register. Eye. 2002;16(5):572-6. 500
30. Klein R, Klein B, Linton K, De Mets D. The Beaver Dam Eye Study: visual acuity. 501
Ophthalmology. 1991;98(8):1310. 502
31. Department of Health. Health Survey for England 1999: The health of minority ethnic 503
groups. London2001; Available from: 504
http://webarchive.nationalarchives.gov.uk/+/www.dh.gov.uk/en/Publicationsandstatistics/Publicati505
ons/PublicationsStatistics/DH_4009393. 506
32. Smith GD, Chaturvedi N, Harding S, Nazroo J, Williams R. Ethnic inequalities in health: a 507
review of UK epidemiological evidence. Critical Public Health. 2000;10(4):375-408. 508
33. Rahmani B, Tielsch JM, Katz J, Gottsch J, Quigley H, Javitt J, et al. The cause-specific 509
prevalence of visual impairment in an urban population. The Baltimore Eye Survey. Ophthalmology. 510
1996;103(11):1721. 511
34. Wang JJ, Foran S, Mitchell P. Age-specific prevalence and causes of bilateral and unilateral 512
visual impairment in older Australians: the Blue Mountains Eye Study. Clinical & experimental 513
ophthalmology. 2001;28(4):268-73. 514
35. Klein R, Wang Q, Klein B, Moss SE, Meuer SM. The relationship of age-related maculopathy, 515
cataract, and glaucoma to visual acuity. Investigative ophthalmology & visual science. 516
1995;36(1):182-91. 517
36. OECD Health Statistics. Waiting times for elective surgery. 2013 [cited 2014 27 February 518
2014]; Available from: http://dx.doi.org/10.1787/health-data-en 519
37. Chia EM, Mitchell P, Rochtchina E, Golding M, Foran S, Golding M, et al. Association between 520
vision and hearing impairments and their combined effects on quality of life. Archives of 521
Opthalmology. 2006;124(10):1465-70. 522
38. Schneck ME, Lott LA, Haegerstrom-Portnoy G, Brabyn JA. Association between hearing and 523
vision impairments in older adults. Ophthalmic and Physiological Optics. 2012. 524
39. Cruickshanks KJ, Wichmann MA, editors. Hearing Impairment and Other Health Conditions in 525
Older Adults: Chance Associations or Opportunities for Prevention? Seminars in Hearing; 2012: 526
Thieme Medical Publishers. 527
40. Dickinson CM, Taylor J. The effect of simulated visual impairment on speech-reading ability. 528
Ophthalmic and Physiological Optics. 2011;31(3):249-57. 529
41. Allen N, Sudlow C, Downey P, Peakman T, Danesh J, Elliott P, et al. UK Biobank: Current 530
status and what it means for epidemiology. Health Policy and Technology. 2012;1(123-126). 531
42. Camparini M, Cassinari P, Ferrigno L, Macaluso C. ETDRS-fast: implementing psychophysical 532
adaptive methods to standardized visual acuity measurement with ETDRS charts. Investigative 533
ophthalmology & visual science. 2001;42(6):1226-31. 534
Page 16 of 24
Ophthalmic and Physiological Optics
Ophthalmic and Physiological Optics
123456789101112131415161718192021222324252627282930313233343536373839404142434445464748495051525354555657585960
For Review O
nly
Vision impairment and dual sensory problems
17
43. World Health Organisation. Chapter VII Diseases of the eye and adnexa 1994 [cited 2013 535
January]; Available from: http://apps.who.int/classifications/apps/icd/icd10online2004/fr-536
icd.htm?gh53.htm+. 537
44. International Council of Ophthalmology. Visual standards. Aspects and ranges of vision loss 538
with emphasis on population surveys. San Francisco, California: 2002. 539
45. Brown MM, Brown GC, Sharma S, Busbee B, Brown H. Quality of life associated with 540
unilateral and bilateral good vision. Opthalmology. 2001;108(4):643-7. 541
46. Rubin GS, Muñoz B, Bandeen–Roche K, West SK. Monocular versus binocular visual acuity as 542
measures of vision impairment and predictors of visual disability. Investigative ophthalmology & 543
visual science. 2000;41(11):3327-34. 544
47. Azen SP, Varma R, Preston-Martin S, Ying-Lai M, Globe D, Hahn S. Binocular visual acuity 545
summation and inhibition in an ocular epidemiological study: the Los Angeles Latino Eye Study. 546
Investigative ophthalmology & visual science. 2002;43(6):1742-8. 547
48. Nissen LR, Sjolie AK, Jensen H, Borch-Johnson K, Rosenberg T. The prevalence and incidence 548
of visual impairment in people of age 20-59 years in industrialised countries: A review. Opthalmic 549
Epidemiology. 2003;10(4):279-91. 550
49. Klein R, Klein BE, Linton KL, De Mets DL. The prevalence and incidence of visual impairment 551
in people of age 20-59 years in industrialized countries: A review. Opthalmic Epidemiology. 552
1991;10(4):279-91. 553
50. Gunnlaugsdottir E, Arnarsson A, Jonasson F. Prevalence and causes of visual impairment and 554
blindness in Icelanders aged 50 years and older: the Reykjavik Eye Study. Acta ophthalmologica. 555
2008;86(7):778-85. 556
51. Buch H, Vinding T, la Cour M, Appleyard M, Jensen GB, Vesti Nielsen N. Prevalence and 557
causes of visual impairment and blindness among 9980 Scandinavian adults: the Copenhagen City 558
Eye Study. Ophthalmology. 2004;111(1):53-61. 559
52. Tielsch JM, Sommer A, Witt K, Katz J, Royall RM. Blindness and visual impairment in an 560
American urban population: The Baltimore Eye Survey. Archives of Opthalmology. 1990;108(2):286-561
90. 562
563
564
Page 17 of 24
Ophthalmic and Physiological Optics
Ophthalmic and Physiological Optics
123456789101112131415161718192021222324252627282930313233343536373839404142434445464748495051525354555657585960

For Review O
nly
Figure 1. Prevalence (%) of visual impairment by age group. Error bars show the 95%
confidence interval for performance outside the normal range (Mild impairment/Low
vision).
0
10
20
30
40
50
40-44 45-49 50-54 55-59 60-64 65-69 Overall
Pre
va
len
ce (
%)
Age group (years)
Low vision
Mild impairment
Page 18 of 24
Ophthalmic and Physiological Optics
Ophthalmic and Physiological Optics
123456789101112131415161718192021222324252627282930313233343536373839404142434445464748495051525354555657585960
For Review O
nly
Figure 2. Prevalence (%) of use of glasses or contact lenses by age group, reason for use of glasses
or contact lenses and eye conditions by visual impairment category. *Error bars show the 95%
confidence interval.
0
20
40
60
80
100
40-44 45-49 50-54 55-59 60-64 65-69 Overall
Pre
va
len
ce (
%)
Age group (years)
Use of glasses or contact lenses*
0
20
40
60
80
100
Pro
po
rtio
n (
%)
Reason for use of glasses or contact lenses by visual impairment
category
Normal
Mild
Low Vision
0
20
40
60
80
100
Pro
po
rtio
n (
%)
Eye condition by visual impairment group
Normal
Mild
Low Vision
Page 19 of 24
Ophthalmic and Physiological Optics
Ophthalmic and Physiological Optics
123456789101112131415161718192021222324252627282930313233343536373839404142434445464748495051525354555657585960
For Review O
nly
Figure 3. Prevalence (%) of dual sensory impairment by age group. Error bars show the 95%
confidence interval.
0
5
10
15
20
25
40-44 45-49 50-54 55-59 60-64 65-69 Overall
Pre
va
len
ce (
%)
Age group (years)
Page 20 of 24
Ophthalmic and Physiological Optics
Ophthalmic and Physiological Optics
123456789101112131415161718192021222324252627282930313233343536373839404142434445464748495051525354555657585960
For Review Only
Table 1. Definitions of visual impairment
International Council of Ophthalmology
Maximum VA
Minimum VA
WHO Maximum VA Minimum VA Acceptable driving standard (Europe)
Snellen logMAR Snellen LogMAR Snellen logMAR Snellen logMAR Snellen logMAR
Normal 0.8 6/7.5 0.1
Mild vision loss <0.8 6/7.5 0.1 0.3 6/18 0.48
≥0.5 6/12 0.3
Moderate vision loss
<0.3 6/18 0.48 0.125 6/48 0.9 Low vision category 1
<0.3 6/18 0.48 0.1 6/60 1.0
Severe vision loss
<0.125 6/48 0.9 0.05 3/60 1.3 Low vision category 2
<0.1 6/60 1.0 0.05 3/60 1.3
Profound vision loss
<0.05 3/60 1.3 0.02 6/300 1.7 Blindness category 3
<0.05 3/60 1.3 0.0167 6/360 1.78
Near total vision loss (near blindness)
<0.02 6/300 1.7 NLP (sic)
Blindness category 4
<0.0167 6/360 1.78 LP
Total vision loss (total blindness)
NLP Blindness category 5
NLP
Page 21 of 24
Ophthalmic and Physiological Optics
Ophthalmic and Physiological Optics
123456789101112131415161718192021222324252627282930313233343536373839404142434445464748495051525354555657585960

For Review O
nly
Table 2. Estimates of the prevalence of visual impairment
Study Setting N Age VA Testing
conditions
Prevalence
Klein et al, 1991 Beaver Dam,
USA
4926 43-54
55-64
65-74
75+
≤6/12 - >6/60
Best
corrected
better eye
0.7%
0.7%
4.7%
19.1%
Gunnlaugsdottir
et al 2008
Reykjavik,
Iceland
1045 >50-80+
50-59
>80
<6/18
<6/12
<6/18
<6/12
<6/18
<6/12
Best
corrected,
better eye
0.96%
2.01%
0%
0.28%
7.9%
11.80%
Buch et al 2004 Copenhagen,
Denmark
9980 20-39
20-64
65-84
80-84
<6/12->6/60 Best
corrected,
better eye
0.13%
0.25%
2.24%
8.29%
Tielsch et al
1990
Baltimore,
US
2490 40-59 <6/18-0.5/60 Best
corrected,
better eye
0.17%
Caucasians
0.83% Blacks
Taylor et al,
1997
Melbourne,
Australia
3268 40-90+ <6/12-≥6/18
<6/18- ≥6/60
<6/60-≥3/60
<6/12-≥6/18
<6/18- ≥6/60
<6/60-≥3/60
Habitual,
better eye
Best
corrected,
better eye
2.6%
0.92%
0.21%
0.61%
0.43%
0.15%
Robinson et al
2013
Ontario,
Canada
768 39-94 <6/7.5 (0.1
logMAR)
<6/12 (0.3
logMAR)
Habitual,
better eye
(weighted
prevalence)
15.2%
2.7%
Khawaja et al
2013
Norwich, UK 8563 48-92 <6/10 (0.22
logMAR)
<6/18 (0.48
logMAR)
Habitual,
better eye
(weighted
prevalence)
5.65%
0.55%
Page 22 of 24
Ophthalmic and Physiological Optics
Ophthalmic and Physiological Optics
123456789101112131415161718192021222324252627282930313233343536373839404142434445464748495051525354555657585960
For Review O
nly
Table 3. Participants in the UK Biobank versus 2001 UK Census data for sex, age, ethnicity
and socioeconomic status. Sex and ethnicity are shown as percentages while socioeconomic
status is reported as average Townsend deprivation index score (with standard deviation).
UK Biobank UK Census 2001
Sex Male 45.6 49.2
Age group (years) 40-44 10.4 20.1
45-49 13.2 18.0
50-54 15.3 19.3
55-59 18.2 16.3
60-64 24.3 13.8
65-69 18.7 12.5
Ethnicity White 94.1 91.3
Mixed 0.6 1.3
Asian or Asian British 2.0 4.4
Black or Black British 1.6 2.2
Chinese 0.3 0.4
Other ethnic group 0.9 0.4
Prefer not to answer 0.3 -
Missing data 0.2 -
Socioeconomic status Mean Townsend score* (SD) -1.3 (3.1) 0.7 (4.2)
*Lower Townsend scores indicate less deprivation
Page 23 of 24
Ophthalmic and Physiological Optics
Ophthalmic and Physiological Optics
123456789101112131415161718192021222324252627282930313233343536373839404142434445464748495051525354555657585960
For Review O
nly
Table 4. The odds ratios from the logistic models fitted to the prevalence of better-eye
vision impairment.
Factor Odds ratio
Mild VI Low Vision
Age 40-44 - -
45-49 1.6*** 1.5***
50-54 2.4*** 1.7***
55-59 2.9*** 1.6**
60-64 3.5*** 1.9***
65-69 4.8*** 2.4***
Sex Female - -
Male 0.9*** 0.9
Ethnicity White - -
Non-white 1.7*** 1.4***
Socioeconomic status
Medium-high socioeconomic status
(>-1SD)
- -
Low socioeconomic status (<-1SD)† 1.5*** 2.0***
*** p < 0.001
** p < 0.01
* p < 0.05
† Low socioeconomic status was defined as a Townsend deprivation index score lower than 1
standard deviation (SD) below the mean with reference to the general population of 40 to 69 year-
olds; i.e. the most deprived 15% of the population.
Page 24 of 24
Ophthalmic and Physiological Optics
Ophthalmic and Physiological Optics
123456789101112131415161718192021222324252627282930313233343536373839404142434445464748495051525354555657585960