Vision, haptics, and attention: New data from a multisensory Necker cube
27
Vision, haptics, and attention: new data from a multisensory Necker cube Marco Bertamini 1 Luigi Masala 2 Georg Meyer 1 Nicola Bruno 3 1 School of Psychology, University of Liverpool, UK 2 Università degli Studi di Padova, Italy 3 Dipartimento di Psicologia, Università di Parma, Italy Running head: Visual-haptic Necker cube Keywords: Vision; Touch; Haptics; Perceptual exploration; Intersensory conflict; Intersensory merging; Intersensory vetoing
Transcript of Vision, haptics, and attention: New data from a multisensory Necker cube

Vision, haptics, and attention: new data from a multisensory Necker cube
Marco Bertamini1 Luigi Masala2 Georg Meyer1 Nicola Bruno3
1 School of Psychology, University of Liverpool, UK 2 Università degli Studi di Padova, Italy 3 Dipartimento di Psicologia, Università di Parma, Italy Running head: Visual-haptic Necker cube Keywords: Vision; Touch; Haptics; Perceptual exploration; Intersensory conflict; Intersensory merging; Intersensory vetoing

Visual-haptic Necker cube 2
Abstract
When looking monocularly at a three-dimensional Necker cube two percepts alternate, a
cube and a truncated pyramid. The latter is due to a depth reversal. We studied the effect of
haptic information by having participants hold the cube with their hands and explore two of its
vertices. Touch reduces the likelihood of the pyramid, consistent with a multisensory view of
three-dimensional form perception. In addition, when the hand alternate between stationary and
haptic exploration, the onset of the hand movement plays a crucial role in inhibiting reversals. A
temporal analysis revealed that suppression occurred within a window lasting a few seconds
from motion onset. In Experiment 1 we monitored eye movements and instructed participants
where to fixate. Although the percept does depend on which vertex is fixated, we ruled out a role
of changes of fixation as a mediating factor for the effect of motion onset. In Experiment 2 we
introduced a change of position of the exploring hand as a new type of transition. This type of
change did not produce the same inhibition generated by the motion onset. We conclude that
motion onset does not simply draw attention towards haptic information. Rather, the influence of
haptics peaks briefly after new information becomes available.

Visual-haptic Necker cube 3 1. Introduction
The Necker cube (Necker, 1832) is a classic example of visually bistable figure (see
Figure 1). During prolonged viewing observers experience reversals in the interpretation of the
cube, which is perceived to alternate between two possible depth arrangements. Less well-known
is that reversals occur also with a three-dimensional wire-frame cube, viewed monocularly, and
even if such cube is held in the hands (Shopland & Gregory, 1964). Unlike the case of a line
drawing, for a wire-frame cube the two percepts differ not only in depth order, they also
correspond to different three-dimensional structures. One such structure is a regular cube, but the
other is an irregular truncated pyramid pointing towards the observer. This is because of the role
of perspective viewing when depth order is incorrect and the farther parts of the cube are
perceived as nearer.
Some classic illusions exist in vision as well as in haptics (Gentaz & Hatwell, 2004), but
in our situation touch information from holding the cube is veridical. In other words, touch
information is consistent only with the regular cube. It is indeed remarkable that the visual
inversion can be attained while holding the cube, although these inversions happen somewhat
less often (Shopland & Gregory, 1964) and for shorter periods (Ando & Ashida, 2003) than the
inversions in the line drawing.
The three-dimensional Necker cube is an ideal experimental model to investigate visual-
haptic multisensory processes during extended periods of exploration. An interesting feature of
visuohaptic exploratory processes is that as exploration progresses through successive
perception-action cycles, new information may change how the two sensory signals are treated.
Statistically, an efficient way to merge two signals is to weight them in proportion to their
reliability (see Ernst & Banks, 2002). There is evidence that such form of multisensory merging

Visual-haptic Necker cube 4 occurs (e.g. Alais & Burr, 2004; van Beers, Sittig & Denier van der Gon, 1999) and may explain
several cases that were classically interpreted as examples of mere visual dominance (e.g. Rock
& Victor, 1964). Integration, however, must be conditional on the existence of a common source
for the two signals. When no such common source can be assumed, individual sensory channels
must be treated in a different way. For instance, when perceiving three-dimensional shape, we
can acquire information about the back of an object by touching it while we simultaneously get
information about its front by viewing it (Newell, Ernst, Tjan, & Bülthoff, 2001). In this case,
the two sources need to combined (Ernst & Bülthoff, 2004) rather than integrated, a process that
requires a more sophisticated approach than computing a weighted average. Finally, there may
also be cases in which the two signals are not merged at all but kept separate. There is evidence
that this may happen when the involved sensory channels are not in spatial or temporal register
(e.g. Stein & Meredith, 1993; Meyer, Wuerger, Roehrbein & Zetzsche, 2005). It has been
proposed that multisensory signal tend to remain separate, even when close spatially and
temporally, if they are in strong conflict (Hillis, Ernst, Banks, & Landy, 2002).
In a recent paper, Bruno, Jacomuzzi, Bertamini and Meyer (2007) have studied the time
course of visual-haptic interactions during prolonged perception. Participants either held or
actively explored a three-dimensional monocularly viewed Necker cube. They reported the onset
of the veridical (cube) or illusory (truncated pyramid) interpretation of the object as a function of
three touch conditions: minimal touch information (cube held by pincer grips on both sides of the
frame), static touch (cube held by hands cupping opposite corners), and active touch (one hand
cupping a corner, opposite hand actively exploring the corner area). The number of reversals and
the duration of alternative percepts were recorded. Veridical information from touch did not
prevent reversals from occurring, and participants sometimes experienced the illusory alternative
(truncated pyramid) despite the touch signal specifying the veridical alternative (cube). This did

Visual-haptic Necker cube 5 not occur simply because the touch signal was disregarded due to the conflict; instead, Bruno et
al. observed that the touch signal had a strong effect in inhibiting the reversal from the veridical
to the illusory interpretation, but only after a transition from stationary to active touch and within
a “vetoing window” of approximately 1-2 seconds occurring after the change in touch
information. This finding may be interpreted as evidence for an adaptive principle of
multisensory merging, which assigns more weight to a sensory modality when its informative
value increases (as is the case in transitions from static to active touch) and then rapidly returns it
to a baseline value when no further changes occur (for an earlier similar proposal see Shimojo &
Shams, 2001). An adaptive principle of this kind may prove useful to understand the temporal
evolution of merging processes during active exploration, where there is a problem of adopting
the correct merging strategy (integrate, combine, or abstain from merging).
The interpretation proposed by Bruno et al. (2007) remained speculative for several
reasons. Two of them are the focus of the present follow-up experiments. In the earlier
experiment, although participants were generally instructed to fixate the center of the cube, the
experimental paradigm did not monitor fixation. In the case of the pictorial Necker cube, it is
known that fixation tends to influence the perceived interpretation (Kawabata, Yamagami &
Noaki, 1978; Toppino, 2003). In a pilot study using the three-dimensional cube, we also
observed that the illusory percept tended to occur more frequently when fixation was on the
lower right inner corner of the cube, than when it was on the upper left inner corner (see Figure
1, right panel; see also Ando & Ashida, 2003). It cannot be excluded, therefore, that cube
reversals were driven by changes in fixation occurring when participants started to move and
when they stopped their exploring hand. The aim of the first study was to rule out the possibility
of this artifact.
A second possibility is that reversals in the earlier study were not driven by a specific

Visual-haptic Necker cube 6 onset of relevant and novel touch information, but simply by other aspects of the manipulation.
Specifically, it could be caused by the verbal command directing attention towards the hand, by
the intention to move the hand, or even by the change in the motor activity of the hand per se.
Such changes could, in principle, induce a temporary enhancement of the touch signal as the
transient signal attracts attention relative to the stable visual signal. To rule out these possibilities
we devised a second experiment whereby participants changed the position of the hand without
changing the informative value of the touch signal. In this experiment following a verbal
command the hand is moved from one vertex to another, so that the changes in motor activity do
not generate novel or additional touch information about the overall shape of the object. In other
words, there is no change in the quality of the information picked up by the hand, as there is
instead in transitions from stationary to moving.
Figure 1. Schematic representations of the participant's visual field in the experimental conditions. Top panel, Stationary and Moving condition of Experiment 1. Bottom panel, Upper and Lower condition of Experiment 2. The drawings were used during the experiment to instruct participants on how to hold the cube. On the right an illustration of the two types of fixation, left and right.
2. General Methods
Visual-haptic Necker cube 7
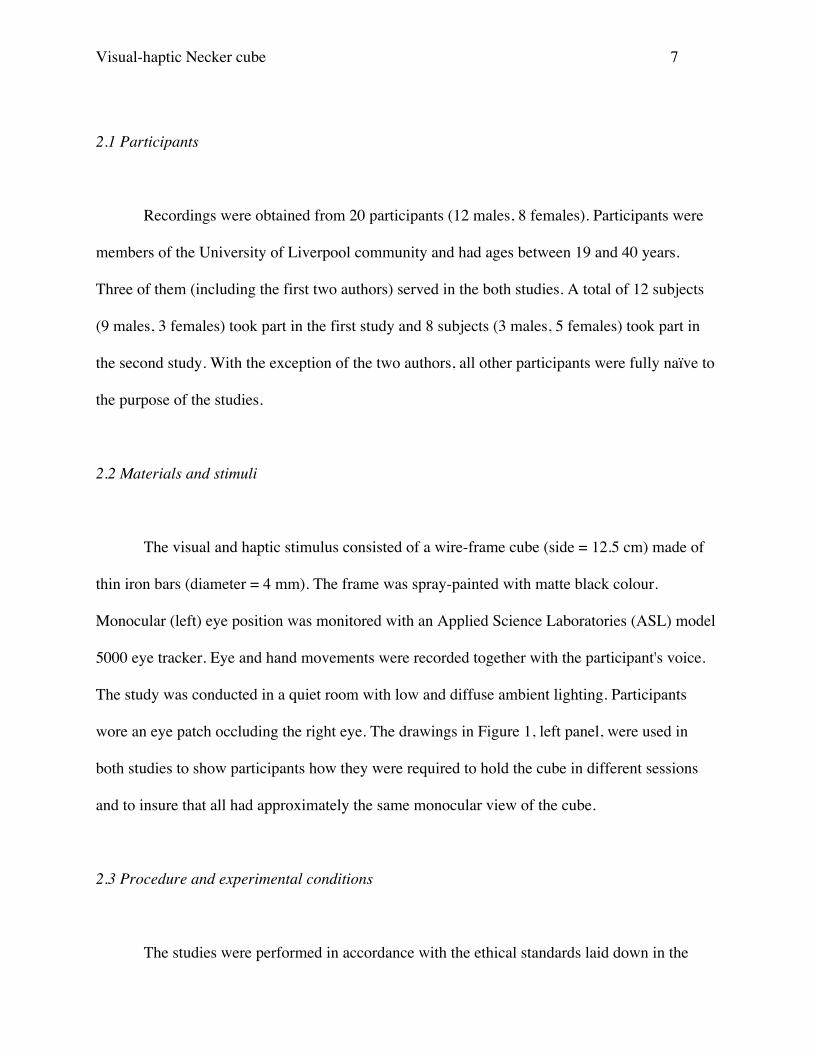
2.1 Participants
Recordings were obtained from 20 participants (12 males, 8 females). Participants were
members of the University of Liverpool community and had ages between 19 and 40 years.
Three of them (including the first two authors) served in the both studies. A total of 12 subjects
(9 males, 3 females) took part in the first study and 8 subjects (3 males, 5 females) took part in
the second study. With the exception of the two authors, all other participants were fully naïve to
the purpose of the studies.
2.2 Materials and stimuli
The visual and haptic stimulus consisted of a wire-frame cube (side = 12.5 cm) made of
thin iron bars (diameter = 4 mm). The frame was spray-painted with matte black colour.
Monocular (left) eye position was monitored with an Applied Science Laboratories (ASL) model
5000 eye tracker. Eye and hand movements were recorded together with the participant's voice.
The study was conducted in a quiet room with low and diffuse ambient lighting. Participants
wore an eye patch occluding the right eye. The drawings in Figure 1, left panel, were used in
both studies to show participants how they were required to hold the cube in different sessions
and to insure that all had approximately the same monocular view of the cube.
2.3 Procedure and experimental conditions
The studies were performed in accordance with the ethical standards laid down in the

Visual-haptic Necker cube 8 1964 Declaration of Helsinki, as well with the guidelines for research involving human
participants provided by the University of Liverpool.
Participation in the experiments was preceded by a demonstration of the Necker cube
phenomenon. The cube was always seen monocularly because this is necessary to generate a
bistable percept. To illustrate how to hold the cube, we showed participants drawings (Figure 1)
that reproduced the monocular views of the cube. Participants were to report any inversion of the
cube, using the words “normal” and “inverted” for the veridical and the illusory alternatives,
respectively.
During training, we asked participants to hold the cube with two-finger pincer grips.
After they reported reversals over a period of about a minute, we asked them to cup their hands
over two vertices of the cube. This Stationary condition of Experiment 1 is illustrated in the left
panel of Figure 1. After they experienced reversals in this condition, we asked them to start
moving their right hand as shown by the arrows in the right panel of Figure 1, that is, to
continuously explore the three sides that converged at the top right vertex of the cube. They were
told to avoid touching other vertices and to avoid bringing their hand to the front or to the back
of the cube. We refer to this exploratory behaviour as the Moving condition. Finally, participants
were told that the experimenter would give them verbal instructions (“move” and “stop”) to start
or stop the hand movement at pseudorandom times. This command was given at intervals
ranging from 5 to 15 s. By avoiding a fixed time, we aimed to reduce the likelihood that
participants could anticipate the command of the experimenter.
In Experiment 2, training was performed exactly as in Experiment 1. After they
experienced reversals in the Moving condition, they practiced the task of the second study, which
involved an active exploration of the cube by continually moving the right hand. Instead of
alternating between Stationary and Moving periods, however, in this second experiment

Visual-haptic Necker cube 9 participants explored the cube by moving their hand from the upper right front vertex (Upper
condition), to the lower right front vertex (Lower condition). This is illustrated in the middle
panel of Figure 1. The experimenter gave a verbal instruction (“move”) to signal when to shift
the hand from one vertex to the other at pseudorandom times as in Experiment 1.
Both experiments consisted of eight two-minute runs: four runs with fixation on the left
front corner and four runs on the right inner corner (Figure 1). These were interleaved.
Experiment 1 involved alternating between Stationary and Moving conditions (replication of the
paradigm used in Bruno et al., 2007). In Experiment 2, participants actively explored the cube by
continually moving their right hand throughout the sessions. Participants were allowed rest
periods between runs.
2.4 Data recording and analysis
The data started to be acquired 10-15 s after verbal instructions were issued at the
beginning of each condition. In both experiments, participants were first asked to fixate either the
left corner or right corner (Figure 1). Because observers had been looking at the cube for several
seconds, and therefore had already experienced reversals, the veridical and the reversed percepts
had a similar likelihood when the recordings started. For both studies, when video recordings
were transcribed, reversals were identified and their timing was recorded. Similarly, transitions
from Stationary to Moving and vice versa (experiment 1) or from Upper to Lower and vice versa
(experiment 2) were identified and recorded. All timings were binned by rounding to the lowest
second, and each two-minute video therefore yielded 120 intervals.
3. Experiment 1: Transitions between moving and stationary hands

Visual-haptic Necker cube 10
The procedure of Experiment 1 closely matched that in Bruno et al. (2007). However,
participants were instructed to fixate the left or the right corner, and their fixation was monitored
to ensure that they followed instructions.
Figure 2. Experiment 1. Cumulative percentage curves of experiencing a reversal from normal to illusory (n⇒i), or from illusory to normal (i⇒n), after a transition from Stationary to Moving (s⇒m) or from Moving to Stationary (m⇒s), separately for the two fixation conditions. A few datapoints exist beyond 10 s, but because they are rare and not reliable they are not included in the graph. Therefore, the sum of all final values of the four curves is close but not equal to 100. Percentages were computed for each subject separately before averaging.
3.1 Results
We first computed the total number of each type of reversal, that is, reversals from the
normal to the illusory percept (n⇒i) or from the illusory to the normal percept (i⇒n), and
separated those occurring when the hand was stationary from those occurring when the hand
moved, separately for the two types of fixation (see Table 1). Participants experienced more

Visual-haptic Necker cube 11 reversals while looking at the lower right inner corner. However, the total frequencies of each
type of reversal while fixating either the one or the other corner did not differ statistically (0.47 <
t(11) < 1.43, 0.17 < p < 0.64). As any given percept could be experienced partly during hand
stationary and partly during hand moving periods, percept durations were not computed. Instead
we focused on number and type of reversals. Summing across all twelve participants (eight 2-
minute runs for subject, 4 with right fixation and 4 with left fixation), we observed a total of
1152 reversals (see Table 1). To test the association between reversal type and haptic condition,
we computed a chi-square and found a significant association: χ (1) = 105.17, p < 0.001.
Therefore, the hand movement influenced the direction of the transition.
Motor Transition (to Moving) (to Stationary) (i⇒n) (n⇒i) (i⇒n) (n⇒i)
Fix. Right 165 84 139 227
Fix. Left 153 71 109 204
Table 1. Experiment 1. Total frequencies of reversals to the normal (i⇒n) and illusory alternative (n⇒i), separately for the two types of motor transitions (from stationary to moving, and from moving to stationary) and fixation (right and left).
Visual-haptic Necker cube 12
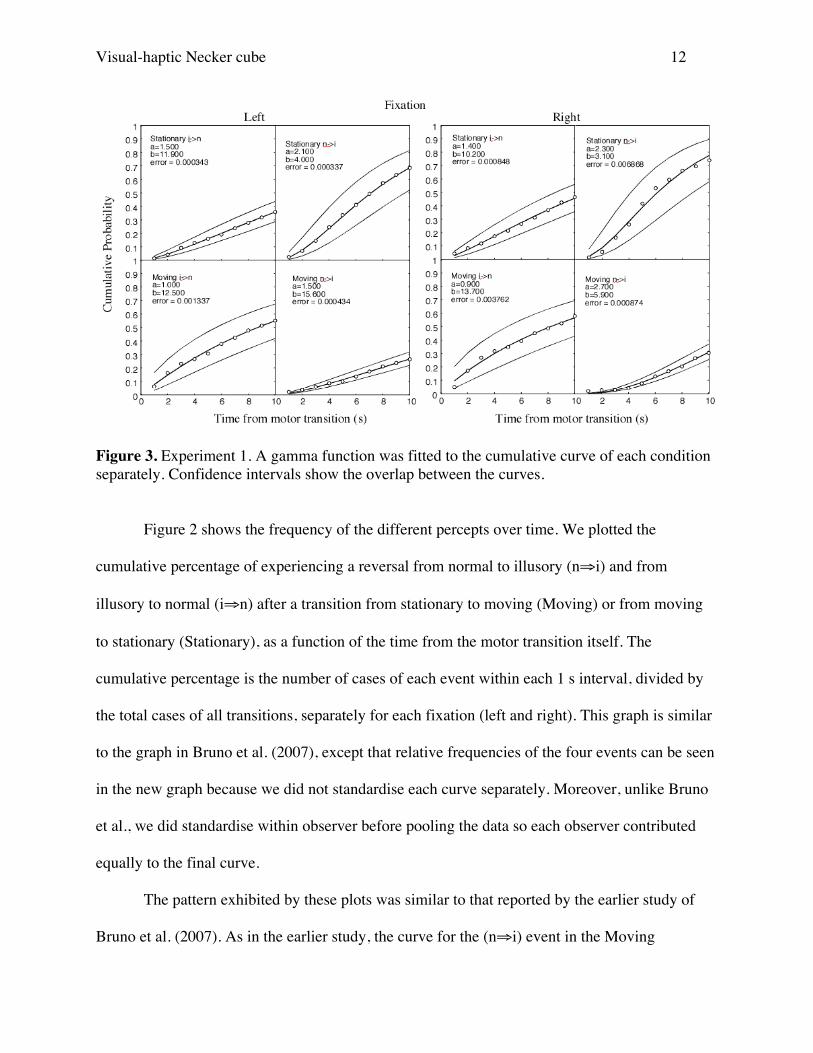
Figure 3. Experiment 1. A gamma function was fitted to the cumulative curve of each condition separately. Confidence intervals show the overlap between the curves.
Figure 2 shows the frequency of the different percepts over time. We plotted the
cumulative percentage of experiencing a reversal from normal to illusory (n⇒i) and from
illusory to normal (i⇒n) after a transition from stationary to moving (Moving) or from moving
to stationary (Stationary), as a function of the time from the motor transition itself. The
cumulative percentage is the number of cases of each event within each 1 s interval, divided by
the total cases of all transitions, separately for each fixation (left and right). This graph is similar
to the graph in Bruno et al. (2007), except that relative frequencies of the four events can be seen
in the new graph because we did not standardise each curve separately. Moreover, unlike Bruno
et al., we did standardise within observer before pooling the data so each observer contributed
equally to the final curve.
The pattern exhibited by these plots was similar to that reported by the earlier study of
Bruno et al. (2007). As in the earlier study, the curve for the (n⇒i) event in the Moving
Visual-haptic Necker cube 13 condition has a unique shape. It reveals a vetoing window in the sense that the illusory percept
was suppressed for a brief period after haptic exploration started. The right fixation plot revealed
a clearer suppression in comparison to the left fixation plot. One possibility for this difference is
that the larger effect in the case of fixation to the right is due to the fact that the moving hand in
our study was always the right hand, and therefore the movement had greater spatial proximity
with fixation for this condition. For example, prioritization of space near the hand has been
reported by Reed, Grubb and Steele (2006), as well as enhancement in vision for objects near the
hands by Abrams, Davoli, Du, Knapp III and Paull (2008).
The (i⇒n) Moving curve has a shape complementary to the (n⇒i) Moving curve: when
the latter is flat (first five seconds) the former is very steep. Interestingly the curves for (n⇒i) are
sigmoidal and different from the curves for the (i⇒n) inversions. Finally, after the first five
seconds all cumulative curves are essentially parallel.
To obtain a formal assessment of the similarities between the curves, we fitted
cumulative gamma functions to the behavioural data for the four types of events. Figure 3 shows
the fit and the 95% confidence intervals. The confidence intervals show differences between the
four conditions, but the data for the left and right fixation conditions all fall within each other's
confidence intervals. Most important to the present investigation, the probability of an inversion
to the illusory alternative in the Moving condition is well below the confidence interval for the
corresponding probability of an inversion to illusion in the Stationary condition.
The analysis presented in Figure 3 was performed on all transitions. We also analysed the
curves for the first change of percept after each transition (excluding all other transitions).
Predictably these are similar to those in Figure 3 for the first five seconds and are depressed later
on. Given the similarity of the two analyses Figure 3 only presents the plot for the full dataset.

Visual-haptic Necker cube 14
Figure 4. Experiment 1. Mean number of reversals, separate those occurred during the first 5 s after motor transition, from those occurred after 5 s. Error bars are 1 SEM.
The confidence intervals in Figure 3 show a clear pattern. In addition, we performed a
second type of analysis following a different strategy. In Figure 4 we split the time in two large
bins: between 1 and 5 s and between 6 and 10 s. The choice of 5 as a criterion is based on
inspection of the curves in Figure 2. It also has the advantage that numbers of datapoints before
and after are similar, so as to maximise the power of any test conducted separately within each
bin. The mean number of reversals is summarized by the bar charts in Figure 4. When fixation
was on the right, during the first 5 s the number of (n⇒i) reversals was 1.9 and 10.9, in the
Moving and Stationary conditions respectively; the number of (i⇒n) reversals was 8.9 (Moving)
and 5.7 (Stationary). After 5 s the number of (n⇒i) reversals was 5.1 (Moving) and 8.0

Visual-haptic Necker cube 15 (Stationary); the number of (i⇒n) reversals was 4.8 (Moving) and 5.9 (Stationary). When
fixation was on the left, during the first 5 s the number of (n⇒i) reversals was 2.6 (Moving) and
8.9 (Stationary); the number of (i⇒n) reversals was 7.9 (Moving) and 4.2 (Stationary). After 5 s
the number of (n⇒i) reversals was 3.3 (Moving) and 8.1 (Stationary); the number of (i⇒n)
reversals was 4.8 for both Moving and Stationary conditions.
To test the relationship between type of transition and type of percept we computed four
Yates’ chi-square tests. Reversal type and haptic condition resulted significantly related during
the first 5 s for right fixation (χ (1) = 4.31, p = 0.03) but did not reach significance for left
fixation (χ (1) = 2.79, p = 0.09). There was no sign of association after 5 s from motor transition:
right fixation χ (1) = 0.01, n.s.; left fixation χ (1) = 0.27, n.s. Our findings are therefore
consistent with the idea that after a few seconds, the illusory and the veridical percepts are
independent of haptic information.
In conclusion, both curve fitting and χ tests of association yielded consistent results. We
also note that we performed analyses including and excluding the two authors as participants and
observed little difference. These results confirm that there is a vetoing window of comparable
length to that reported by Bruno et al. (2007). In addition, these results rule out the possibility
that in the original study at the time of a transition (to Moving) an accompanying change of
fixation was responsible for the suppression.
4. Experiment 2: Changes in Hand position
In Experiment 2 we introduced a change of position for the hand as a new type of
transition. When the experimenter gave a command, observers shifted the moving hand from one
vertex to another (Figure 1). Therefore, haptic exploration never stopped and there were no

Visual-haptic Necker cube 16 corresponding changes in the quality of the touch signal from static to active touch.
4.1 Results
We first computed the total number of each type of reversal, that is, reversals from the
normal to the illusory percept (n⇒i) or from the illusory to the normal percept (i⇒n), separately
in the Upper condition and in the Lower condition, and separately for the two fixations (see
Table 2). Participants experienced more reversals while looking at the right corner, t(7) = 4.67, p
= 0.002. This is consistent with the assumption of attentional prioritization of space near the
hand.
Motor Transition (to Lower) (to Upper) (i⇒n) (n⇒i) (i⇒n) (n⇒i)
Fix. Right 106 85 90 119
Fix. Left 49 53 54 53
Table 2. Experiment 2. Total frequencies of reversals to normal (i⇒n) and illusory percept (n⇒i), separately for the two types of motor transitions (from upper to lower, and from lower to upper) and fixation (right and left).
Summing across all eight participants (eight 2-minute runs for subject, 4 with right
fixation and 4 with left fixation), we observed 609 reversals. To test the association between
reversal type and haptic condition in these data, we computed a chi-square but the association
was not significant: χ(1) = 3.27, p = 0.07.
To test how hand movement influenced reversals over time, we plotted cumulative
percentages as in Experiment 1 (Figure 5). The curves did not follow the same trend found in

Visual-haptic Necker cube 17 Experiment 1 and they tended to overlap. No suppression immediately after a transition seemed
to occur. With left fixation, the total frequencies of normal to illusory reversals were 53 for both
Lower and Upper conditions, and the total frequencies of illusory to normal reversals were 49 for
Lower and 54 for Upper.
Figure 5. Experiment 2. Cumulative percentage curves of experiencing a reversal from normal to illusory (n⇒i), or from illusory to normal (i⇒n), after a transition from Upper to Lower (u⇒l) or from Lower to Upper (l⇒u), separately per fixation. Percentages were computed for each subject separately before averaging.
As in Experiment 1, we fitted cumulative gamma functions to the behavioural data for the
four types of events. Figure 6 shows the fit and the 95% confidence intervals. Probabilities of
perceiving reversals from and to inverted and in the upper and lower conditions are the same
within left and right fixation conditions but we observed significantly more reversals in the fixate
right conditions than the fixate left condition.
Next, we computed reversals occurring during the first 5 s or after 5 s before a new motor
transition occurred. The mean number of reversals per subject is summarized by the bar charts in

Visual-haptic Necker cube 18 Figure 7. For right fixation, during the first 5 s the number of (n⇒i) reversals in the Lower
condition was 4.9 and in the Upper condition was 7.4, and the number of (i⇒n) reversals in the
Lower condition was 8.2 and in the Upper condition was 5.6; after 5 s the number of (n⇒i)
reversals in the Lower condition was 5.7 and in the Upper condition was 7.5, and the number of
(i⇒n) reversals in the Lower condition was 5 and in the Upper condition was 5.6. For left
fixation, during the first 5 s the number of (n⇒i) reversals in the Lower condition was 2.9 and in
the Upper condition was 3.4, and the number of (i⇒n) reversals in the Lower condition was 3
and in the Upper condition was 3.4; after 5 s the number of (n⇒i) reversals in the Lower
condition was 3.7 and in the Upper condition was 3.2, and the number of (i⇒n) reversals in the
Lower condition was 3.1 and in the Upper condition was 3.4.
Figure 6. Experiment 2. A gamma function was fitted to the cumulative curve of each condition separately. Confidence intervals show the overlap between the curves.
To test the relationship between type of transition and type of percept we computed four
Yates' chi-square tests. Unlike Experiment 1, reversal type and condition were not significantly
related. This was the case during the first 5 s (right fixation χ (1) = 0.37, n.s.; left fixation χ (1) =
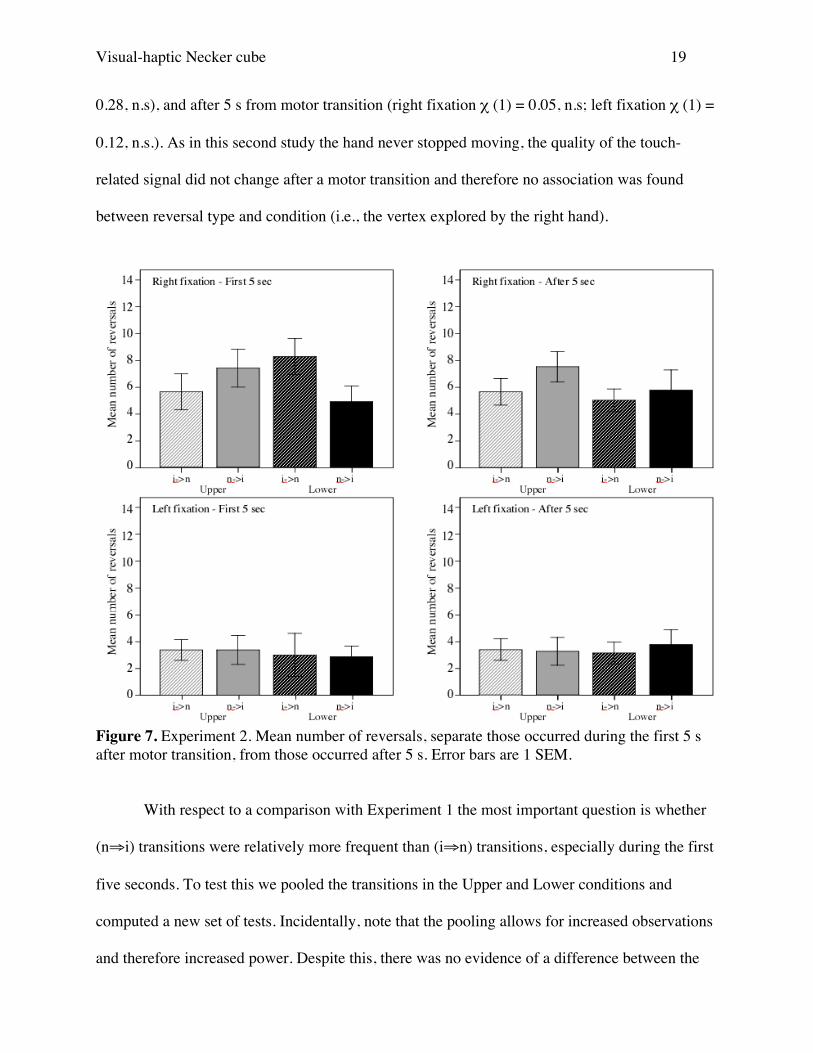
Visual-haptic Necker cube 19 0.28, n.s), and after 5 s from motor transition (right fixation χ (1) = 0.05, n.s; left fixation χ (1) =
0.12, n.s.). As in this second study the hand never stopped moving, the quality of the touch-
related signal did not change after a motor transition and therefore no association was found
between reversal type and condition (i.e., the vertex explored by the right hand).
Figure 7. Experiment 2. Mean number of reversals, separate those occurred during the first 5 s after motor transition, from those occurred after 5 s. Error bars are 1 SEM.
With respect to a comparison with Experiment 1 the most important question is whether
(n⇒i) transitions were relatively more frequent than (i⇒n) transitions, especially during the first
five seconds. To test this we pooled the transitions in the Upper and Lower conditions and
computed a new set of tests. Incidentally, note that the pooling allows for increased observations
and therefore increased power. Despite this, there was no evidence of a difference between the

Visual-haptic Necker cube 20 frequency of the two types of perceptual transitions: during the first 5 s (right fixation χ (1) =
0.80, n.s.; left fixation χ (1) = 0.01, n.s.), and after 5 s from motor transition (right fixation χ (1)
= 2.30, n.s; left fixation χ (1) = 0.14, n.s.).
Both Figure 6 and 7 show a clear difference between left and right fixation. This is a
direct consequence of lower number of reversals for the left fixation, as discussed earlier. This
feature of the data is common to both Experiment 1 and 2, as can be seen by comparing Table 1
and Table 2, but the difference is stronger in Experiment 2. Note, however, that our main
findings are based on the overall pattern and are not specific to one fixation.
In conclusion, our results in experiment 2 suggest that a mere change in the position of
the exploring hand does not produce a vetoing window as does a change in the quality of the
touch signal generated by the onset of active touch.
5. Conclusions
Participants explored a three-dimensional Necker cube haptically and obtained
information that could be either consistent or inconsistent with the current visual interpretation.
Specifically, when observers perceived a truncated pyramid (the illusory alternative), the tactile
signal conflicted with vision. Conversely, when observers perceived a regular cube, the two
signals agreed. Haptic information did not prevent reversals of the Necker cube, but it reduced
the likelihood of the illusory alternative, consistent with the possibility that tactual and visual
signals interacted even when they conflicted. Our results also indicate that multisensory
interactions between unimodal signals during exploration occur in a flexible, adaptive fashion.
When the signal changes (as was the case at the onset of hand motion), it may be given a greater
weight.

Visual-haptic Necker cube 21
In our experiments, the quality of touch-related information varied over time because we
instructed participants to start or stop active movements of the right hand. In the first study, when
a stationary period was followed by the initiation of hand movement, participants experienced a
change in the quality of the haptic information about three-dimensional form. Haptic exploration
decreased the frequency of reversals towards the illusion and increased the frequency of
reversals towards the veridical percept. Of particular interest is the time course of the change
measured from the time of the transition from stationary to moving or vice versa. This change
had a disproportional effect on the probability of perceiving the illusion during a brief temporal
window, as reported in Bruno et al. (2007).
Experiment 1 replicated the finding of Bruno et al. (2007) using a procedure in which
participants were instructed to fixate the left or the right vertex. We monitored eye movements
and we can now exclude that the suppression effect is due to a change in fixation.
In a recent paper, Helbig and Ernst (2008) have studied the effect of attentional shifts in
one modality on cue integration. They used a secondary visual task and found that visual-haptic
cue integration is independent of modality-specific attention. This is relevant with respect to our
own Experiment 2 because its rationale was to retain the attentional cues present in Experiment
1, like the verbal command by the experimenter, whilst at the same time keeping the information
from touch relatively constant. Specifically, in Experiment 2 we used a change in the motion of
the hand that did not provide novel information about the solid shape of the object. The results
did not show a suppression effect in correspondence of the time when the movement of the hand
changed, that is, when the right hand moved from the top to the bottom corner of the cube or vice
versa. Therefore, we conclude that neither a verbal command nor a change in position of the
hand per se are sufficient to generate the suppression effect seen in Experiment 1. The effect may
be mediated by a shift of attention towards the right hand. Although we did not manipulate

Visual-haptic Necker cube 22 attention directly we can exclude on the basis of Experiment 2 that an attention shift was simply
generated by the verbal command by the experimenter.

Visual-haptic Necker cube 23 References
Abrams, R. A., Davoli, C. C., Du, F., Knapp III, W., H., & Paull, D. 2008. Altered vision near
the hand. Cognition, 107(3), 1035-47.
Alais, D., & Burr, D. 2004. The ventriloquist effect results from near-optimal bimodal
integration. Current Biology, 14, 257-262.
Ando H., & Ashida H. 2003. Touch can influence visual depth reversal of the Necker cube.
Perception, 32, 97-97.
Bruno, N., Jacomuzzi, A., Bertamini, M., & Meyer G. 2007. A visual-haptic Necker cube reveals
temporal constraints on multisensory interactions during perceptual exploration.
Neuropsychologia, 45, 469-475.
Ernst, M. O., & Banks, M. S. 2002. Humans integrate visual and haptic information in a
statistically optimal fashion. Nature, 415, 429-432.
Ernst, M. O., & Bülthoff, H. H. 2004. Merging the senses into a robust percept. TRENDS in
Cognitive Sciences, 8, 162-169.
Gentaz, E. & Hatwell, Y. (2004). Geometrical haptic illusions: The role of exploration in the
Müller-Lyer, vertical–horizontal, and Delboeuf illusions. Psychological Bulletin &
Review, 11, 31-40.
Helbig H.B., & Ernst M.O. 2008. Visual-haptic cue weighting is independent of modality-
specific attention. Journal of Vision, 8, 1, 1-16.
Hillis, J.M., Ernst M.O., Banks M. S., & Landy, M.S. 2002. Combining sensory information:
Mandatory fusion within, but not between, senses. Science, 298 (5598), 1627-1630.
Kawabata, N., Yamagami, K., & Noaki, M. 1978. Visual fixation points and depth perception.
Vision Research, 18, 853-854.
Meyer, G. F., Wuerger, S. M., Roehrbein, M., & Zetzsche, C. 2005. Low-level Integration of

Visual-haptic Necker cube 24
Auditory and Visual Motion Signals Requires Spatial Co-localisation. Experimental Brain
Research, 166 (3-4), 538-547
Necker, L. A. 1832. Observations on some remarkable phenomena seen in Switzerland; and an
optical phenomenon which occurs on viewing of a crystal or geometric solid. Philosophy
Magazine, 3, 329-337.
Newell, F. N., Ernst, M. O., Tjan, B., & Bülthoff, H. H. 2001. Viewpoint dependence in visual
and haptic object recognition. Psychological science, 12, 37-42.
Reed, C. L., Grubb, J. D., & Steele, C. 2006. Hands up: attentional priorization of space near the
hand. Journal of Experimental Psychology, 32(1), 166-77
Rock, I., & Victor, J. 1964. Vision and touch: an experimentally created conflict between the two
senses. Science, 143, 594-596.
Shimojo, S. & Shams, L. 2001. Sensory modalities are not separate modalities: plasticity and
interactions. Current Opinion Neurobiology, 11(4), 505-09.
Shopland, J. C., & Gregory, R. L. l964. The effect of touch on a visually ambiguous three-
dimensional figure. Quarterly Journal of Experimental Psychology, 16, 66-70.
Stein, B. E., & Meredith, M. A. 1993. The merging of the senses. Boston, Ma: MIT press.
Toppino, T. 2003. Reversible-figure perception: Mechanisms of intentional control. Perception
& Psychophysics, 65, 1285-1295.
van Beers, R. J., Sittig, A. C., & Denier van der Gon, J.J. 1999. Integration of proprioceptive and
visual position-information: an experimentally supported model. Journal of
Neurophysiology, 81, 1355-1364.

Visual-haptic Necker cube 25
Figures
Figure 1. Schematic representations of the participant's visual field in the experimental
conditions. Top panel, Stationary and Moving condition of Experiment 1. Bottom panel, Upper
and Lower condition of Experiment 2. The drawings were used during the experiment to instruct
participants on how to hold the cube. On the right an illustration of the two types of fixation, left
and right.
Figure 2. Experiment 1. Cumulative percentage curves of experiencing a reversal from normal
to illusory (n⇒i), or from illusory to normal (i⇒n), after a transition from Stationary to Moving
(s⇒m) or from Moving to Stationary (m⇒s), separately for the two fixation conditions. A few
datapoints exist beyond 10 s, but because they are rare and not reliable they are not included in
the graph. Therefore, the sum of all final values of the four curves is close but not equal to 100.
Figure 3. Experiment 1. A gamma function was fitted to the cumulative curve of each condition
separately. Confidence intervals show the overlap between the curves.
Figure 4. Experiment 1. Mean number of reversals, separate those occurred during the first 5 s
after motor transition, from those occurred after 5 s. Error bars are 1 SEM.
Figure 5. Experiment 2. Cumulative percentage curves of experiencing a reversal from normal
to illusory (n⇒i), or from illusory to normal (i⇒n), after a transition from Upper to Lower (u⇒l)
or from Lower to Upper (l⇒u), separately per fixation.

Visual-haptic Necker cube 26 Figure 6. Experiment 2. A gamma function was fitted to the cumulative curve of each condition
separately. Confidence intervals show the overlap between the curves.
Figure 7. Experiment 2. Mean number of reversals, separate those occurred during the first 5 s
after motor transition, from those occurred after 5 s. Error bars are 1 SEM.

Visual-haptic Necker cube 27
Acknowledgments
Nicola Bruno was supported in part by a start-up grant from the University of Parma.