
Vision and visual variation in the peacock blenny
26
UNCORR ECTED PRO OF Vision and visual variation in the peacock blenny E. M. WHITE *†, D. M. G ONC¸ALVES ‡, J. C. P ARTRIDGE * AND R. F. O LIVEIRA ‡ *School of Biological Sciences, University of Bristol, Woodland Road, Bristol, BS8 1UG, U.K. and ‡Unidade de Investigac ¸a ˜o em Eco-Etologia, Instituto Superior de Psicologia Aplicada (ISPA), Rua Jardim do Tabaco 34, 1049-041 Lisboa, Portugal (Received 24 March 2003, Accepted 14 April 2004) Microspectrophotometry (MSP) revealed the presence of a rod and at least two cone classes (mid- and long-wavelength sensitive) in the intertidal peacock blenny Salaria pavo. Both rhodopsin and porphyropsin based visual pigments were found in all fish, together with high individual variation in chromophore ratio. The three morphs (females, males and sneaker males) differed in their spectral sensitivities (as measured with the optomotor response) with sneakers having higher sensitivity at long-wavelengths than either males or females. This long- wave displacement of peak sensitivity could be due elevated proportions of porphyropsin visual pigments in the sneakers’ retinae. The lenses of all morphs exhibited a short-wavelength cut-off and an unusual layer of carotenoid was found behind the retinal pigment epithelium and in the outer segments of some cones. These screening pigments could serve a photo-protective role or to improve visual contrast. No short-wave photoreceptors were located using MSP. This indicates that this cone class may be absent or present at very low numbers in the retina. This is the first in depth study of the visual system of a blenniid fish and indicates potential within-species visual variation that may be related to the species’ habitat and morph-specific behavioural requirements. # 2004 The Fisheries Society of the British Isles Key words: intertidal fishes; light environment; microspectrophotometry; optomotor response; visual variation. INTRODUCTION Both the photic environment and the visual tasks animals have to perform produce selective forces acting upon visual systems (Lythgoe, 1972; McFarland & Munz, 1975; Levine & MacNichol, 1979; Partridge & Cummings, 1999). In some species of fishes, spectral sensitivity has been reported to vary seasonally (e.g. rudd Scardinius erythrophthalmus (L.); Whitmore & Bowmaker, 1989) or during their ontogenetic development (Beaudet & Hawryshyn, 1999). Such shifts can be effected either by changes in the expression of genes encoding the protein (opsin) component of a visual pigment, or by changes in the chromophore moiety which, in fishes, is either a derivative of vitamin A 1 or †Author to whom correspondence should be addressed. Tel.: þ44 0 117 9287591; fax: þ44 0 117 9257374; email: [email protected] Journal of Fish Biology (2004) 65, 1–24 doi:10.1111/j.1095-8649.2004.00446.x, available online at http://www.blackwell-synergy.com 1 # 2004 The Fisheries Society of the British Isles CSE: MB Copyeditor: PRB JFB 446
Transcript of Vision and visual variation in the peacock blenny
UNCORRECTEDPROOF
Vision and visual variation in the peacock blenny
E. M. WHITE*†, D. M. GONCALVES‡, J. C. PARTRIDGE* AND
R. F. OLIVEIRA‡
*School of Biological Sciences, University of Bristol, Woodland Road, Bristol, BS81UG, U.K. and ‡Unidade de Investigacao em Eco-Etologia, Instituto Superior de
Psicologia Aplicada (ISPA), Rua Jardim do Tabaco 34, 1049-041 Lisboa, Portugal
(Received 24 March 2003, Accepted 14 April 2004)
Microspectrophotometry (MSP) revealed the presence of a rod and at least two cone classes
(mid- and long-wavelength sensitive) in the intertidal peacock blenny Salaria pavo. Both
rhodopsin and porphyropsin based visual pigments were found in all fish, together with high
individual variation in chromophore ratio. The three morphs (females, males and sneaker
males) differed in their spectral sensitivities (as measured with the optomotor response) with
sneakers having higher sensitivity at long-wavelengths than either males or females. This long-
wave displacement of peak sensitivity could be due elevated proportions of porphyropsin visual
pigments in the sneakers’ retinae. The lenses of all morphs exhibited a short-wavelength cut-off
and an unusual layer of carotenoid was found behind the retinal pigment epithelium and in the
outer segments of some cones. These screening pigments could serve a photo-protective role or
to improve visual contrast. No short-wave photoreceptors were located using MSP. This
indicates that this cone class may be absent or present at very low numbers in the retina.
This is the first in depth study of the visual system of a blenniid fish and indicates potential
within-species visual variation that may be related to the species’ habitat and morph-specific
behavioural requirements. # 2004 The Fisheries Society of the British Isles
Key words: intertidal fishes; light environment; microspectrophotometry; optomotor response;
visual variation.
INTRODUCTION
Both the photic environment and the visual tasks animals have to performproduce selective forces acting upon visual systems (Lythgoe, 1972; McFarland& Munz, 1975; Levine & MacNichol, 1979; Partridge & Cummings, 1999). Insome species of fishes, spectral sensitivity has been reported to vary seasonally(e.g. rudd Scardinius erythrophthalmus (L.); Whitmore & Bowmaker, 1989) orduring their ontogenetic development (Beaudet & Hawryshyn, 1999). Suchshifts can be effected either by changes in the expression of genes encodingthe protein (opsin) component of a visual pigment, or by changes in thechromophore moiety which, in fishes, is either a derivative of vitamin A1 or
†Author to whom correspondence should be addressed. Tel.: þ44 0 1179287591; fax: þ44 0 1179257374;
email: [email protected]
Journal of Fish Biology (2004) 65, 1–24
doi:10.1111/j.1095-8649.2004.00446.x,availableonlineathttp://www.blackwell-synergy.com
1# 2004TheFisheries Society of theBritish Isles
CSE: MB Copyeditor: PRB JFB 446
UNCORRECTEDPROOF
vitamin A2. Visual pigments based on these chromophores are rhodopsins andporphyropsins respectively. Porphyropsin visual pigments have broader absorp-tion spectra and long-wave displaced absorption maxima compared with theirrhodopsin analogues (i.e. the rhodopsin based on the same opsin). Many speciesshow shifts in the spectral absorptions of their visual pigments with age [(e.g.pollack Pollachius pollachius (L.), Shand et al., 1988; goatfish Upeneus tragulaRichardson, Shand, 1993; white sturgeon Acipenser transmontanus Richardson,Loew & Sillman, 1993; black bream Acanthopagarus butcheri (Munto), Shandet al., 2001)], or the loss or gain of a whole class of receptor [(e.g. brown troutSalmo trutta L., Bowmaker & Kunz, 1987; rainbow trout Oncorhynchus mykiss(Walbaum), Hawryshyn et al., 1989; perch Perca flavescens (Mitchill), Loew &Wahl, 1991; Pacific salmon Oncorhynchus sp., Beaudet et al., 1997)]. Such shiftswill have an effect on the spectral sensitivity of the animals concerned and areoften correlated with changes in light environment experienced by the animalswhether due to seasonal changes in the environment or changes in habitat useby the animals. Differences in visual pigment complement in fish species thatare phylogenetically close have been shown to relate to differences in theirmicrohabitats’ light environment (Cummings & Partridge, 2001). It can thusbe hypothesized that shifts in spectral sensitivity are physiological adaptationsto different visual tasks (Partridge & Cummings, 1999).Although visual pigments have been investigated in a wide range of fishes
from deep-sea to shallow-water species (Bowmaker, 1990, 1996) such informa-tion on intertidal fishes is relatively scarce (Blennius pholis L., Loew & Lythgoe,1978; Lythgoe & Partridge, 1989; Gobius paganellus L., Lythgoe & Partridge,1989). The shallow intertidal is notable as a habitat subject to changes in photicenvironment associated with season and weather conditions and, as with otheraspects of their physiology, intertidal fishes are thus likely to have visualsystems capable of rapid physiological adaptation to changing visual conditions.Such adaptations include shifts in visual pigments and spectral sensitivity. In thepresent study, the spectral absorptions of the retinal photoreceptors of anintertidal fish, the peacock blenny Salaria pavo (Risso), was measured usingmicrospectrophotometry (MSP) and the possibility of within-species variation,explored. The MSP data are related to behavioural spectral sensitivity measuredusing the optomotor response. The optomotor test is a psychophysical approachthat exploits the natural tendency of fishes to stay stationary in a moving bodyof water by fixing an image of their surroundings on the retina and swimming inorder to stay stationary with respect to those surroundings. The method can beused to construct action spectra and has been used previously for other fishspecies (Cronly-Dillon & Muntz, 1965; Schaerer & Neumeyer, 1996; Anstiset al., 1998). Using these techniques specific investigation was made of threemorphs of S. pavo that explore different microhabitats, with differing lightenvironments, and that need to perform different visual tasks.The peacock blenny is native to the Mediterranean and Atlantic coast, from
Morocco to southern France (Zander, 1986). It exhibits a strong sexualdimorphism and dichromatism with males being larger than females and havinga well-developed yellowish head crest (Papaconstantinou, 1979; Patzner et al.,1986). Both sexes have blue dots and stripes in the head and body and aniridescent blue eyespot behind the eye. Females are yellowish-green with dark
1
2 E . M. WHITE ET AL .
# 2004TheFisheries Society of theBritish Isles, Journal of Fish Biology 2004, 65, 1–24
UNCORRECTEDPROOF
vertical bars, which are enhanced during their nuptial colouration displays(Abel, 1993; Almada et al., 1995), while nesting males are olive-green withbrown vertical bars on the flanks and head (Abel, 1993). The mating systemis promiscuous and males guard and care for the eggs (Patzner et al., 1986).In a mudflat area in the Ria Formosa (southern Portugal), where fish were
collected for this study, there is a scarcity of appropriate nest sites and malesnest in bricks used by clam culturists to delimit the frontiers of their fields. Thebricks stay emerged for some hours during low tide and fish remain inside themoist brick holes. The scarcity of nests promotes two notable features of thismating system: (1) only larger males are able to defend nests, which promotes areversal of the sex-roles, with females competing for males and actively courtingthem (Almada et al., 1995); (2) smaller and younger males are unable to defendnests so act as sneakers, imitating the females’ behaviour and morphology toapproach the nesting males, and try to achieve parasitic fertilizations of the eggs(Goncalves et al., 1996). The males’ alternative reproductive tactics are sequen-tial, as sneakers develop into large nesting males (henceforth referred to as‘males’) from one breeding season to the next (D. Goncalves, T. Fagundes &R. Oliveira, unpubl. data).During the breeding season the visual tasks that males, females and sneakers
have to perform are different. Males seldom leave the nest, even to feed, inorder to avoid losing the site to a competitor. Males therefore assess females(and sneakers) as visual targets visualized against the water background.Females feed in seagrass beds and approach bricks to assess males against thebrick background. Sneakers also feed in seagrass beds but spend most of thetime associating with successful nesting males and waiting for spawning epi-sodes to occur (Goncalves et al., 2003). These distinct and critical visual tasksare very likely to be best tackled with visual systems having different spectralsensitivities (Lythgoe & Partridge, 1989, 1991; Partridge & Cummings, 1999).Whether the different morphs have different spectral sensitivities, as their differ-ing visual tasks might suggest, was investigated.
MATERIALS AND METHODS
PREPARATION AND PRESERVATION OF EYES, RETINALTISSUE AND LENSES
Fish used in this study were collected at the Ria Formosa Nature Park, Portugal,during the breeding season (June to July). Five fish, comprising two males, one femaleand two sneakers, were transported in oxygen-saturated water to the Instituto Superiorde Psicologia Aplicada (ISPA), Lisbon. They were dark adapted for a period of >20 h,anaesthetized with 0�1% MS-222 (sodium methanesulphonate, c. 0�05%; Jolly et al.,1972) to cessation of opercular movement and, under dim red illumination from a headtorch, killed by decapitation and destruction of the central nervous system. Eyes wereremoved under dim red illumination with the aid of a magnifying glass. For each fish,one eye was frozen whole in 0�5ml PIPES buffered saline (PIPES 20mM, NaCl 180mM,KCL 19mM, MgCl2 1mM, CaCl2 1mM; mOsmKg�1 425 : pH 6�5) in a 1�5ml Eppendorftube, for use in visual pigment extraction. The other eye was preserved for MSPusing a ‘slow freeze’ method of preservation (Fritches et al., 2000; Cummings &Partridge, 2001). The eye was dissected under dim red light and the retina removed to
VISION IN THE PEACOCK BLENNY 3
# 2004TheFisheries Society of theBritish Isles, Journal of FishBiology 2004, 65, 1–24
UNCORRECTEDPROOF
a coverslip with a small drop of PIPES saline with 10% Dextran 260 000MW and 15%Dextran 12 000MW, which act as cryoprotectants. The retina was teased apart using fineentomological needles to detach individual photoreceptors from other retinal tissue. Thepreparation was covered with a coverslip and squeezed gently between filter papers toexpel excess liquid. The preparation was sealed using black nail varnish and placed in alight-tight aluminium tube. Preparations were maintained at 5� C for 1 h and subse-quently transferred to an �80� C freezer for storage in Lisbon. Samples were transferredto Bristol on dry-ice where they were maintained at �80� C, until use.
Two males, three females and two sneakers were transported live to Bristol, in oxygen-saturated water for fresh retinal and lens examination. They were housed in aquariaunder ‘full spectrum’, daylight simulating light conditions (True-Lite, Duro-Test, U.S.A.)on a 12L : 12D photoperiod, and maintained in the laboratory until use (one to 12weeks). Prior to use, each fish was dark-adapted overnight for a period >12 h. Fishwere collected under dim red light from a head-torch and placed into a light-proof canister for transfer to the darkroom. They were anaesthetized with an overdoseof MS-222 and killed by humane methods in accordance with U.K. Home Officelegislation.
Eyes were removed and divided along the middle line with the aid of an infra-red imageconverter (FJW Optical Systems Inc. Find-R-Scope) attached to a low-power micro-scope. Each eye was opened, the lens removed and the eye cup transferred to a Petri dishof saline (Dulbecco ‘A’ phosphate buffered saline solution, diluted to 425mOsmol kg�1,Oxoid Ltd) for subsequent measurement of lens transmission. For MSP analysis, smallsections of retina were placed on a coverslip and prepared as above.
MSP MEASUREMENTS
The microspectrophotometer used in this study is a computer-controlled, wavelength-scanning instrument of single-beam design (Hart et al., 1998). Absorbance spectra fromindividual rods and cone outer segments were measured from cells from five frozen andseven fresh pairs of retinae from four males, four females and four sneakers, usingmethodologies fully described elsewhere (Hart et al., 1998). For each cell, sample andbaseline scans were measured. Following scanning, each cell was bleached with whitelight from the monochromator for 2min and a further scan made post-bleach. This post-bleach scan was then subtracted from the pre-bleach average in order to produce adifference spectrum for each cell and to confirm photolability.
Data were analysed using a Microsoft Excel macro as described by Hart et al. (1998)using a 21 point unweighted running average and analysed by fitting the rhodopsintemplate of Govardovskii et al. (2000). The lmax was determined using the methods ofMacNichol (1986) modified by Govardovskii et al. (2000), by fitting a least-squaresregression line to the long-wave data between 70 and 30% normalized absorbance. Theshort-wave region was excluded from template-fitting, as this region is most susceptibleto photo-product build-up. Only scans that fitted predetermined selection criteria wereaccepted, specifically: (1) if the template data fell within the noise of the absorbance databetween 80% short wave and 20% long wave absorbance; (2) if absorbance spectra wereflat in the long-wave region following the point of zero absorbance; (3) if absorbancespectra were free from obvious distortions (Levine & MacNichol, 1985); (4) if photo-lability was proved through bleaching.
In total, 1870 scans were made and 582 were accepted, representing measurementsfrom 230 cells. All scans were initially best-fitted by a rhodopsin (A1-based) visualpigment template (Govardovskii et al., 2000) for preliminary analysis. In all fish,however, unusually high variation in the spectral positions of rod and cone pigmentlmax values occurred, and there was variation in bandwidth, suggestive of a mixedchromophore (Bridges, 1972). Due to this variation, the wavelength corresponding tomaximum absorbance, the running average, ‘over-the-top’ (OTT) lmax of the normalizedabsorbance data, which makes no assumptions about visual pigment chromophore wasused.
4 E . M. WHITE ET AL .
# 2004TheFisheries Society of theBritish Isles, Journal of Fish Biology 2004, 65, 1–24
UNCORRECTEDPROOF
VISUAL PIGMENT EXTRACTION AND PARTIAL BLEACHING
Extraction of visual pigments was carried out under dim red light from a head-torchand following the methods of Douglas et al. (1999). Individual retinae were homogenizedin 1ml PIPES buffered saline in a 1�5ml microcentrifuge tube. The detergent, n-dodecylb-D-maltoside (200mM) was added to the homogenate at a ratio of 100ml ml�1. Thesamples were then mixed for 1 h on a rotator wheel (4 rpm) at room temperature, thencentrifuged at 4� C and 23 142 g for 10min. The supernatant was drawn off, decanted intoa quartz cuvette and scanned in a Shimadzu UV2102 PC UV-VIS scanning spectro-photometer (Shimadzu Scientific Instruments Inc., Columbia, U.S.A.). Following thisinitial scan, 50 ml of hydroxylamine (pH 6�5) was added per ml supernatant, mixed byinversion and left to stand for at least 1 h. The sample was then scanned a second time.Partial bleaching of the extract (Knowles & Dartnall, 1977) was carried out using a
light source comprising B-40 narrow band interference filters (Balzers, Liechtenstein) infront of a 4�5V tungsten bulb. These filters have a bandwidth (measured as full width athalf maximum transmission) of c. 15 nm and median wavelengths of transmission of 713,674, 660, 648, 602, 578, 559, 552 and 506 nm (corresponding to their nominal wavelengthsof maximum transmission of 708, 670, 656, 645, 595, 575, 560, 543 and 501 nm). Forbleaching purposes, the sliding lid of the Shimadzu spectrophotometer was opened andthe monochromatic light source placed close to the sample. Initially the sample wasexposed to monochromatic long-wavelength light (713 nm) and then re-scanned. Thiswas then followed by further bleaches and scans at decreasing wavelengths. All absorp-tion spectra were ‘zeroed’ at 700 nm prior to measurement.Data were combined to create average absorbance curves from four independent extracts
for each retina. Difference spectra were then constructed using the curves obtained atvarious stages of the partial bleaching process. These revealed the visual pigments as theybleached. For each difference spectrum, the lmax of the visual pigments were determined bynormalizing the data and fitting visual pigment templates (Govardovskii et al., 2000).Shifts in lmax from long- to short-wavelengths with successive bleaches were taken toindicate the presence of a second visual pigment (Knowles & Dartnall, 1977).Visual pigment extraction was carried out on six frozen whole-eye preparations. Very
low densities of rod visual pigment, however, were detected, due to the very small size ofthe eyes used. Consequently, data had a low signal to noise ratio and only four of thepartial bleaching experiments produced useable results (i.e. a bleaching component wasdetectable). These were averaged to increase signal to noise in the overall sample.
TRANSMISSION OF OCULAR MEDIA
The transmission properties of 18 ocular lenses from four females, three males andthree sneakers were measured using a Shimadzu UV2101PC UV-VIS scanning spectro-photometer fitted with a Shimadzu ISR-260 integrating sphere (Shimadzu ScientificInstruments Inc., Columbia, U.S.A.). Lens holders and references were constructedfrom identical 1� 1� 5 cm aluminium billets into which 1 or 1�5mm diameter holeswere drilled to hold the lens and block transmission of all other light. The aluminiumbillets were placed into quartz cuvettes and positioned in the sample holder in front of theintegrating sphere. Initially, a base-line measurement was made using two identical,empty billets placed in the sample and reference positions. Following base-lining, anindividual lens was carefully placed into the appropriate sized sample billet (such that thelens filled the hole), replaced in the cuvette and a slow scan from 300 to 700 nm wasmade. All scans were acquired using Shimadzu software (UVPC personal SpectroscopySoftware, version 3.51, Shimadzu Scientific Instruments Inc., Columbia, U.S.A.). Forease of comparison, all lens data were normalized to an absorbance of zero (100%transmission) at 700 nm, following the methods of Thorpe et al. (1993).The transmission of the cornea was also measured using fresh tissue from one fish. The
corneas were removed, placed onto a microscope slide with a drop of PIPES bufferedsaline and measured using a CCD spectrophotometer as described below for retinalsectioning.
VIS ION IN THE PEACOCK BLENNY 5
# 2004TheFisheries Society of theBritish Isles, Journal of FishBiology 2004, 65, 1–24
UNCORRECTEDPROOF
OCULAR SECTIONING AND ABSORBANCE MEASUREMENTS
Vertical sections were made through the eye of a freshly killed female peacock blenny.The fish was killed using methods detailed above, and one eye removed and frozen in‘optimum cutting temperature’ compound (OCT compound, B.D.H. LaboratorySupplies, U.K.) with cryospray (Cryospray 134, Bright Instrument Co., U.K.). Sections(20mm thick) were made within a cryostat in a vertical plane sequentially from theanterior to posterior of the body. Each section was placed onto a microscope slide witha drop of glycerol. A coverslip was placed on top and sealed using clear nail varnish.Sections were frozen at �80� C until use. Absorbance spectra (350–800 nm) of small areasof the slide were made using a CCD spectrophotometer (USB2000, Ocean Optics,U.S.A.) via a 500mm diameter, single core fibre optic to a camera body mounted onthe camera port of an Olympus BH-B compound microscope. The fibre optic projects to5mm diameter in the plane of the specimen using a �40 objective. Recordings were madeusing Ocean Optics OOIIBASE32 software and measuring illumination was providedusing the microscope’s in-built light source.
Colour photographs from around the eye were also made using a Nikon F90x cameramounted on the Olympus microscope.
THE OPTOMOTOR RESPONSE
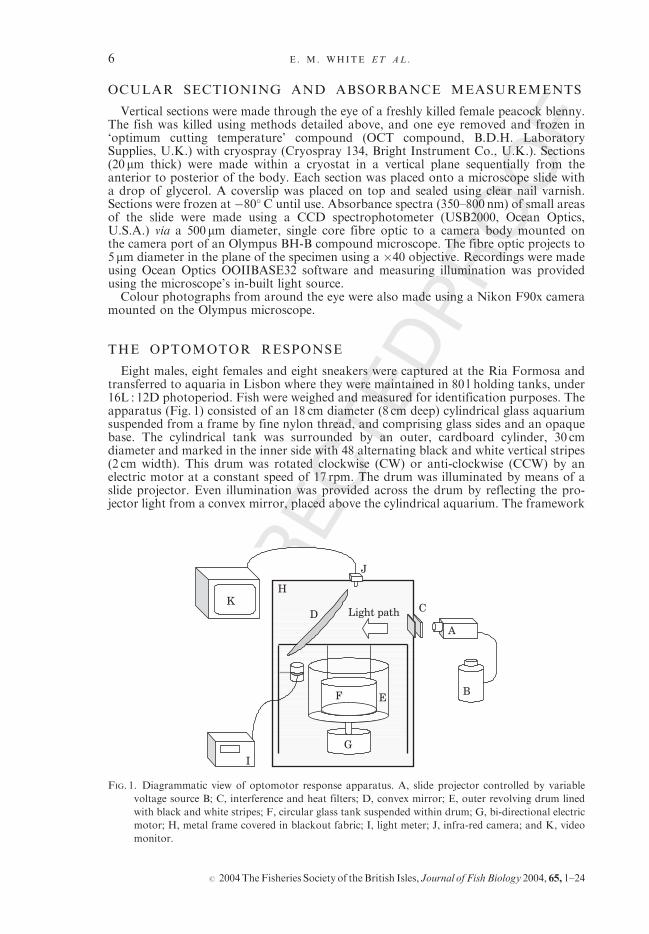
Eight males, eight females and eight sneakers were captured at the Ria Formosa andtransferred to aquaria in Lisbon where they were maintained in 80 l holding tanks, under16L : 12D photoperiod. Fish were weighed and measured for identification purposes. Theapparatus (Fig. 1) consisted of an 18 cm diameter (8 cm deep) cylindrical glass aquariumsuspended from a frame by fine nylon thread, and comprising glass sides and an opaquebase. The cylindrical tank was surrounded by an outer, cardboard cylinder, 30 cmdiameter and marked in the inner side with 48 alternating black and white vertical stripes(2 cm width). This drum was rotated clockwise (CW) or anti-clockwise (CCW) by anelectric motor at a constant speed of 17 rpm. The drum was illuminated by means of aslide projector. Even illumination was provided across the drum by reflecting the pro-jector light from a convex mirror, placed above the cylindrical aquarium. The framework
J
KD
EF
G
H
I
Light path
A
C
B
FIG. 1. Diagrammatic view of optomotor response apparatus. A, slide projector controlled by variable
voltage source B; C, interference and heat filters; D, convex mirror; E, outer revolving drum lined
with black and white stripes; F, circular glass tank suspended within drum; G, bi-directional electric
motor; H, metal frame covered in blackout fabric; I, light meter; J, infra-red camera; and K, video
monitor.
6 E . M. WHITE ET AL .
# 2004TheFisheries Society of theBritish Isles, Journal of Fish Biology 2004, 65, 1–24
UNCORRECTEDPROOF
supporting the drum was screened with blackout fabric to block light from everywherebut the light source. Monochromatic light was provided by placing a coloured narrow-band interference filter (B-40 filters, Balzers, Liechtenstein; 15 nm FWHM bandwidth)and a heat filter in the light path to illuminate the drum. All other light was excluded.Threshold sensitivity at different wavelengths was tested by monitoring the fish’s
responsiveness at decreasing light intensities until the point at which the fish nolonger tracked the moving stripes. Variable light intensity was achieved through theaddition of a transformer and variable power supply to the projector bulb, allowingthe light intensity to be reduced. Fish behaviour was observed by using an infra-redcamera (Henry’s CCTV Co., London, U.K.), with built in infra-red illumination,attached at the top of the convex mirror and providing output to an externaltelevision monitor. White light was provided by removal of the interference andheat filters from the light source such that the drum was illuminated with ‘white’projector light. This was carried out in order to maintain light-adaptation, and hencethe testing of photopic sensitivity.Light levels at threshold were measured using a spectrally calibrated irradiance meter
(International Light Inc., IL1700 Research Radiometer, U.S.A.), fixed beside the drum.Light readings were taken at maximum intensity (to ensure consistency of projectoroutput) and at threshold for every filter and fish.Individual fish were selected from the holding tank and transferred to the experimental
chamber within the optomotor apparatus. Prior to testing, an initial acclimation phasewas allowed. This began with 30 s adaptation under white light from the projector. Themotor was then started and the fish’s responsiveness to the moving stimulus was testedwith both CW and CCW drum rotation under this full intensity white light. Observedresponses consisted of either full tracking of the stripes around the outside of the tank, orhead and body turning in the direction of rotation. An interference filter and heat filterwas placed in the light path and a light measurement at this maximum light intensity wastaken to check consistency of output.Trials consisted of two phases: a rest phase (drum motor off), lasting 10 s and a test
phase, lasting up to 30 s, when the motor was turned on and the fish’s response wasmonitored. Each fish was tested at maximum light intensity. The drum was started (CWor CCW rotation randomized) and a positive response was noted if the fish exhibited aclear response to the moving stripes within a period of 30 s from which latency (i.e. timeto response) was recorded. The light intensity of the projector was then decreased and a10 s rest phase was followed by drum rotation to test the fish at the lower light intensity.Four light intensities were tested in each block before a period of 30 s of white light wasallowed in order to maintain a constant state of light adaptation. The thresholdsensitivity for any given wavelength was taken to be the lowest irradiance at whichthe fish tracked the moving stripes. This was confirmed through the reversal of thedrum and observation of the fish’s behaviour. Measurements at threshold were madeboth in photons cm�2 s�1. In total, each fish was tested using 10 interference filters, withmedian transmissions of: 415, 437, 459, 506, 552, 578, 602, 648, 677 and 713 nm,(corresponding to nominal maximum wavelengths of transmission of 406, 432, 454,501, 575, 595, 645, 670 and 708 nm). Filters were presented in a random order andassessment time for each filter was kept below 3min to avoid dark adaptation(which in preliminary trials was not found to occur within 3min). Statistical comparisonof optomotor thresholds between morphs was carried out using repeated measures,multivariate General Linear Models (GLM) using unrelativized log10-transformedthreshold data.
MODELLING SPECTRAL SENSITIVITY
The scotopic (low light) spectral sensitivity of the peacock blenny was predicted using anadditive model. The absorptance spectra of the rod visual pigments found during MSPwere constructed for different mixtures of rhodopsin and porphyropsin analogues (Parry &Bowmaker, 2000) using the visual pigment templates of Govardovskii et al. (2000).Relative absorptances of the two pigments were calculated taking into account the relative
VIS ION IN THE PEACOCK BLENNY 7
# 2004TheFisheries Society of theBritish Isles, Journal of FishBiology 2004, 65, 1–24
UNCORRECTEDPROOF
rhodopsin and porphyropsin extinction coefficients (Knowles & Dartnall, 1977), cell outersegment lengths and calculated chromophore ratios. They were adjusted for the transmis-sion of the ocular lens, summed in a variable ratio and plotted on a logarithmic scale.
The model assumed that the rod is a visual pigment based upon a single opsin which,when combined with an A1 chromophore, has a lmax of 499 nm and, when combined withA2, has a lmax of 516 nm. An outer segment length of 8mm and maximum correctedabsorbance of 0�016mm�1 was determined from the MSP measurements. The relativephoton catches for the two pigments were adjusted for the lower (70%) relative extinctioncoefficient of porphyropsin and accounted for lens cut-off.
RESULTS
MSP
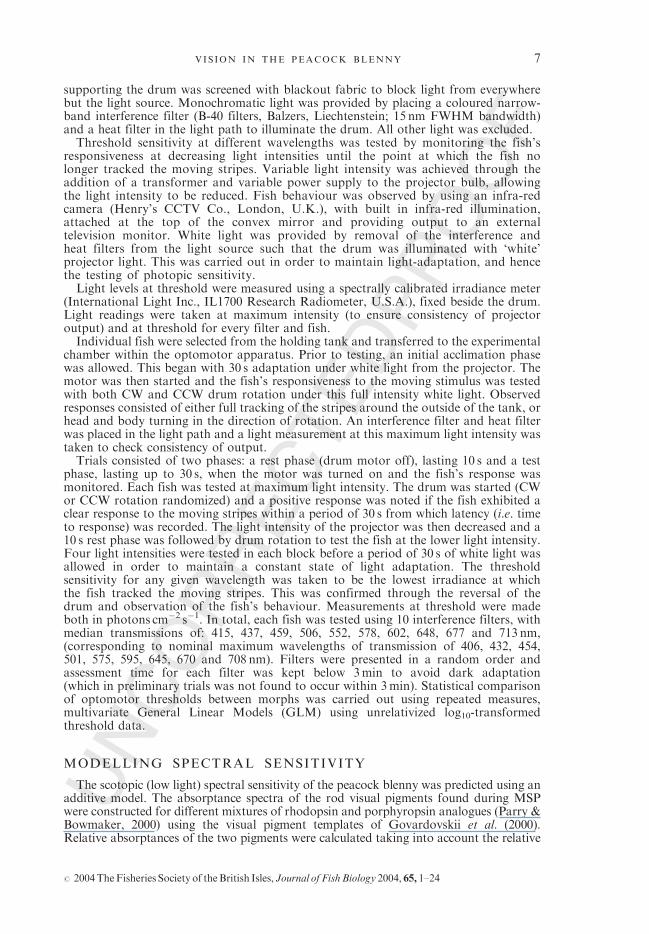
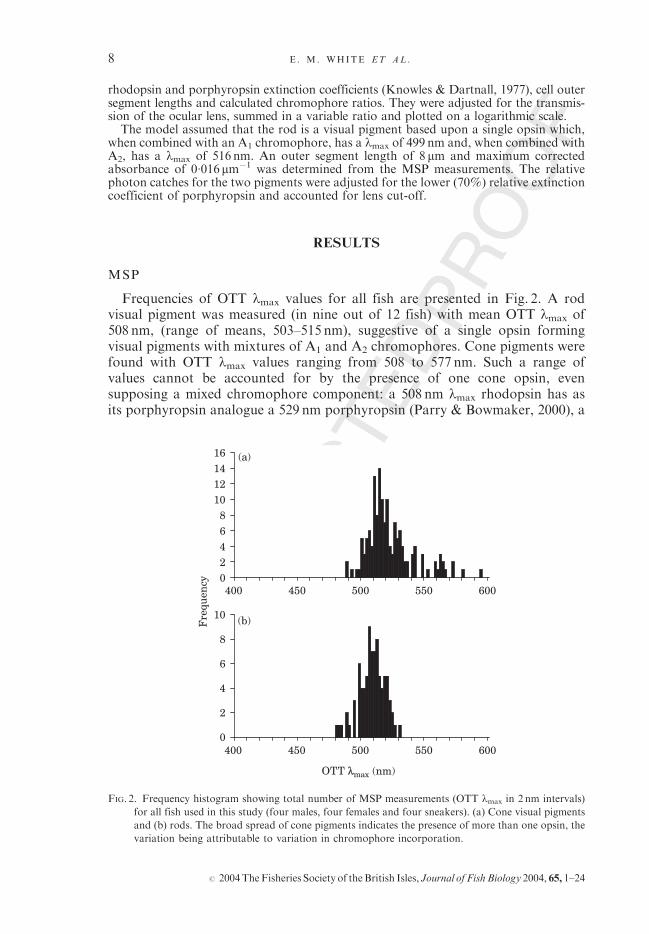
Frequencies of OTT lmax values for all fish are presented in Fig. 2. A rodvisual pigment was measured (in nine out of 12 fish) with mean OTT lmax of508 nm, (range of means, 503–515 nm), suggestive of a single opsin formingvisual pigments with mixtures of A1 and A2 chromophores. Cone pigments werefound with OTT lmax values ranging from 508 to 577 nm. Such a range ofvalues cannot be accounted for by the presence of one cone opsin, evensupposing a mixed chromophore component: a 508 nm lmax rhodopsin has asits porphyropsin analogue a 529 nm porphyropsin (Parry & Bowmaker, 2000), a
02468
10121416
400 450 500 550 600
0
2
4
6
8
10
400 450 500 550 600
OTT λλmax (nm)
Fre
quen
cy
(a)
(b)
FIG. 2. Frequency histogram showing total number of MSP measurements (OTT lmax in 2 nm intervals)
for all fish used in this study (four males, four females and four sneakers). (a) Cone visual pigments
and (b) rods. The broad spread of cone pigments indicates the presence of more than one opsin, the
variation being attributable to variation in chromophore incorporation.
8 E . M. WHITE ET AL .
# 2004TheFisheries Society of theBritish Isles, Journal of Fish Biology 2004, 65, 1–24
UNCORRECTEDPROOF
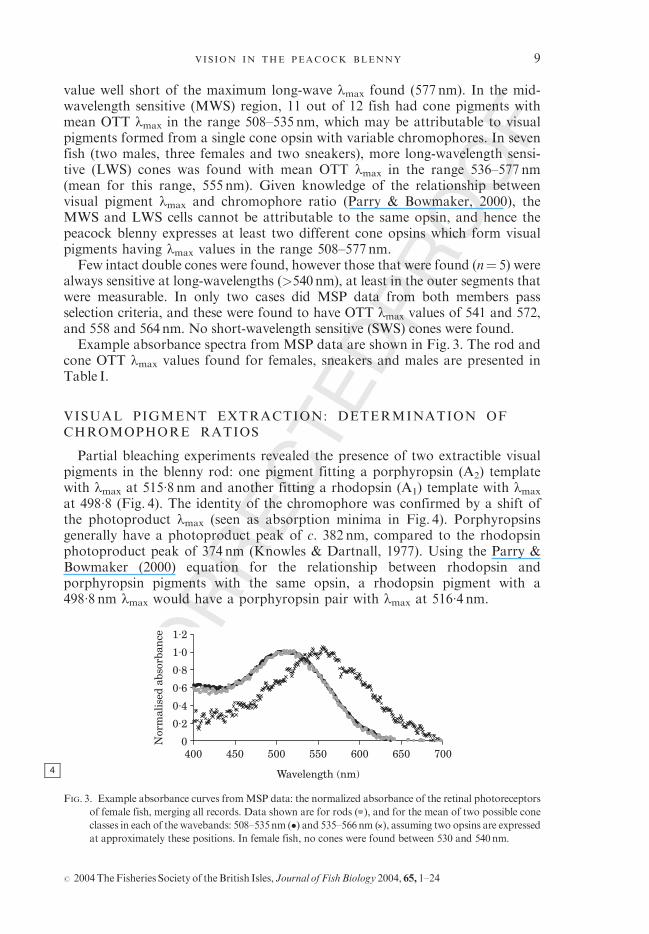
value well short of the maximum long-wave lmax found (577 nm). In the mid-wavelength sensitive (MWS) region, 11 out of 12 fish had cone pigments withmean OTT lmax in the range 508–535 nm, which may be attributable to visualpigments formed from a single cone opsin with variable chromophores. In sevenfish (two males, three females and two sneakers), more long-wavelength sensi-tive (LWS) cones was found with mean OTT lmax in the range 536–577 nm(mean for this range, 555 nm). Given knowledge of the relationship betweenvisual pigment lmax and chromophore ratio (Parry & Bowmaker, 2000), theMWS and LWS cells cannot be attributable to the same opsin, and hence thepeacock blenny expresses at least two different cone opsins which form visualpigments having lmax values in the range 508–577 nm.Few intact double cones were found, however those that were found (n¼ 5) were
always sensitive at long-wavelengths (>540nm), at least in the outer segments thatwere measurable. In only two cases did MSP data from both members passselection criteria, and these were found to have OTT lmax values of 541 and 572,and 558 and 564nm. No short-wavelength sensitive (SWS) cones were found.Example absorbance spectra from MSP data are shown in Fig. 3. The rod and
cone OTT lmax values found for females, sneakers and males are presented inTable I.
VISUAL PIGMENT EXTRACTION: DETERMINATION OFCHROMOPHORE RATIOS
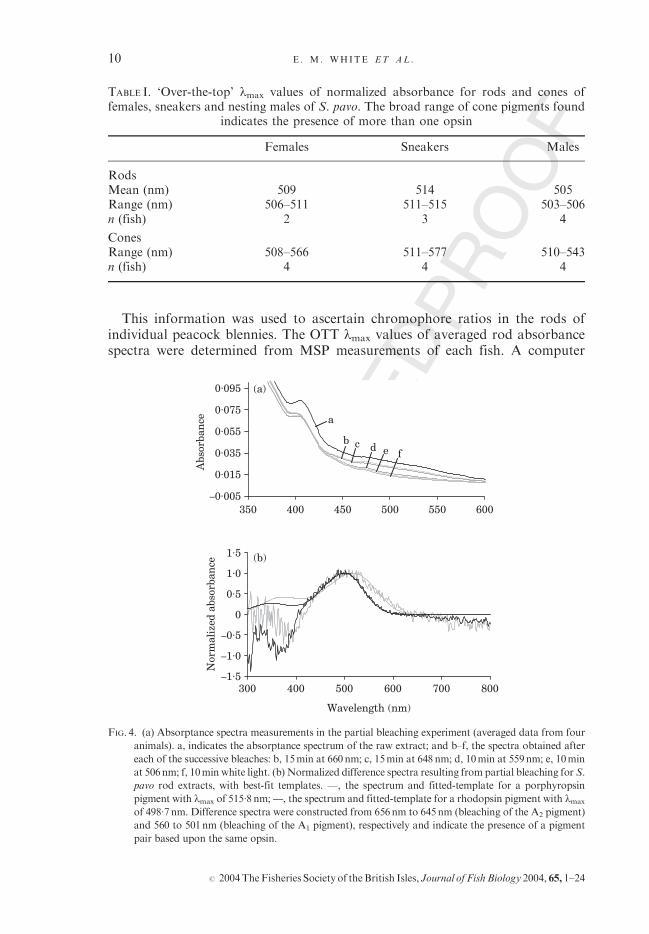
Partial bleaching experiments revealed the presence of two extractible visualpigments in the blenny rod: one pigment fitting a porphyropsin (A2) templatewith lmax at 515�8 nm and another fitting a rhodopsin (A1) template with lmax
at 498�8 (Fig. 4). The identity of the chromophore was confirmed by a shift ofthe photoproduct lmax (seen as absorption minima in Fig. 4). Porphyropsinsgenerally have a photoproduct peak of c. 382 nm, compared to the rhodopsinphotoproduct peak of 374 nm (Knowles & Dartnall, 1977). Using the Parry &Bowmaker (2000) equation for the relationship between rhodopsin andporphyropsin pigments with the same opsin, a rhodopsin pigment with a498�8 nm lmax would have a porphyropsin pair with lmax at 516�4 nm.
0
0·2
0·4
0·6
0·8
1·0
1·2
400 450 500 550 600 650 700
Nor
mal
ised
abs
orba
nce
Wavelength (nm)
FIG. 3. Example absorbance curves fromMSP data: the normalized absorbance of the retinal photoreceptors
of female fish, merging all records. Data shown are for rods ( ), and for the mean of two possible cone
classes in each of the wavebands: 508–535nm (�) and 535–566nm ( ), assuming two opsins are expressed
at approximately these positions. In female fish, no cones were found between 530 and 540nm.
4
VISION IN THE PEACOCK BLENNY 9
# 2004TheFisheries Society of theBritish Isles, Journal of FishBiology 2004, 65, 1–24
UNCORRECTEDPROOF
This information was used to ascertain chromophore ratios in the rods ofindividual peacock blennies. The OTT lmax values of averaged rod absorbancespectra were determined from MSP measurements of each fish. A computer
TABLE I. ‘Over-the-top’ lmax values of normalized absorbance for rods and cones offemales, sneakers and nesting males of S. pavo. The broad range of cone pigments found
indicates the presence of more than one opsin
Females Sneakers Males
RodsMean (nm) 509 514 505Range (nm) 506–511 511–515 503–506n (fish) 2 3 4
ConesRange (nm) 508–566 511–577 510–543n (fish) 4 4 4
–0·005
0·015
0·035
0·055
0·075
0·095
350 400 450 500 550 600
Abs
orba
nce a
bfedc
–1·5
–1·0
–0·5
0
0·5
1·0
1·5
300 400 500 600 700 800
Wavelength (nm)
Nor
mal
ized
abs
orba
nce
(a)
(b)
FIG. 4. (a) Absorptance spectra measurements in the partial bleaching experiment (averaged data from four
animals). a, indicates the absorptance spectrum of the raw extract; and b–f, the spectra obtained after
each of the successive bleaches: b, 15min at 660nm; c, 15min at 648nm; d, 10min at 559nm; e, 10min
at 506nm; f, 10min white light. (b) Normalized difference spectra resulting from partial bleaching for S.
pavo rod extracts, with best-fit templates. , the spectrum and fitted-template for a porphyropsin
pigment with lmax of 515�8nm; , the spectrum and fitted-template for a rhodopsin pigment with lmax
of 498�7nm. Difference spectra were constructed from 656nm to 645nm (bleaching of the A2 pigment)
and 560 to 501nm (bleaching of the A1 pigment), respectively and indicate the presence of a pigment
pair based upon the same opsin.
10 E . M. WHITE ET AL .
# 2004TheFisheries Society of theBritish Isles, Journal of Fish Biology 2004, 65, 1–24
UNCORRECTEDPROOF
model was constructed using Microsoft Excel 2000. This simulated mixtures ofthe known (from extract spectrophotometry) rod visual pigments (using thevisual pigment template of Govardovskii et al., 2000 and taking rhodopsinand porphyropsins lmax values of 498�8 and 516�4 nm, respectively), and itera-tively calculated the OTT lmax values of the mixtures. The model took intoaccount the lower extinction coefficient of porphyropsin and used a value of70% of that of rhodopsin pigments (Knowles & Dartnall, 1977). By matchingthe simulated OTT lmax with the values measured from the rods of each fish byMSP, an estimation of the rhodopsin : porphyropsin (A1 :A2) ratio in thesephotoreceptors was derived. This indicated that individual fish ranged from 4to 60% rhodopsin (mean value for the nine fish for which rod cells were found,30% rhodopsin). Average percentages of rhodopsin for males, females andsneakers were: 47% (range¼ 37�8–57�4; n¼ 4), 27% (range¼ 16�7–37�8; n¼ 2)and 12% (range¼ 3�9–16�7; n¼ 3) respectively.
RETINAL CAROTENOIDS
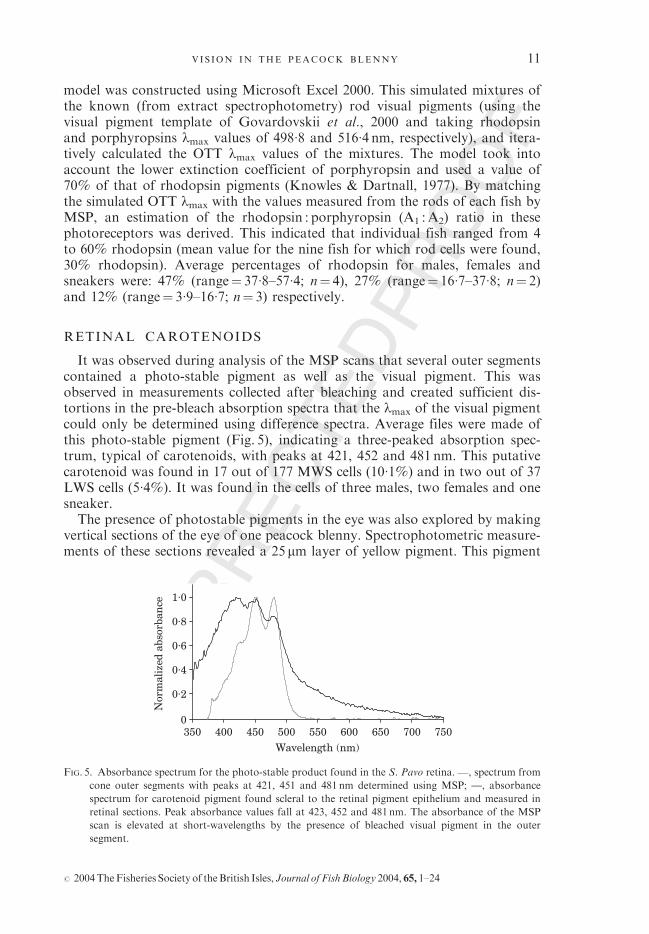
It was observed during analysis of the MSP scans that several outer segmentscontained a photo-stable pigment as well as the visual pigment. This wasobserved in measurements collected after bleaching and created sufficient dis-tortions in the pre-bleach absorption spectra that the lmax of the visual pigmentcould only be determined using difference spectra. Average files were made ofthis photo-stable pigment (Fig. 5), indicating a three-peaked absorption spec-trum, typical of carotenoids, with peaks at 421, 452 and 481 nm. This putativecarotenoid was found in 17 out of 177 MWS cells (10�1%) and in two out of 37LWS cells (5�4%). It was found in the cells of three males, two females and onesneaker.The presence of photostable pigments in the eye was also explored by making
vertical sections of the eye of one peacock blenny. Spectrophotometric measure-ments of these sections revealed a 25mm layer of yellow pigment. This pigment
0
0·2
0·4
0·6
0·8
1·0
350 400 450 500 550 600 650 700 750Wavelength (nm)
Nor
mal
ized
abs
orba
nce
FIG. 5. Absorbance spectrum for the photo-stable product found in the S. Pavo retina. , spectrum from
cone outer segments with peaks at 421, 451 and 481 nm determined using MSP; —, absorbance
spectrum for carotenoid pigment found scleral to the retinal pigment epithelium and measured in
retinal sections. Peak absorbance values fall at 423, 452 and 481nm. The absorbance of the MSP
scan is elevated at short-wavelengths by the presence of bleached visual pigment in the outer
segment.
V IS ION IN THE PEACOCK BLENNY 11
# 2004TheFisheries Society of theBritish Isles, Journal of FishBiology 2004, 65, 1–24
UNCORRECTEDPROOF
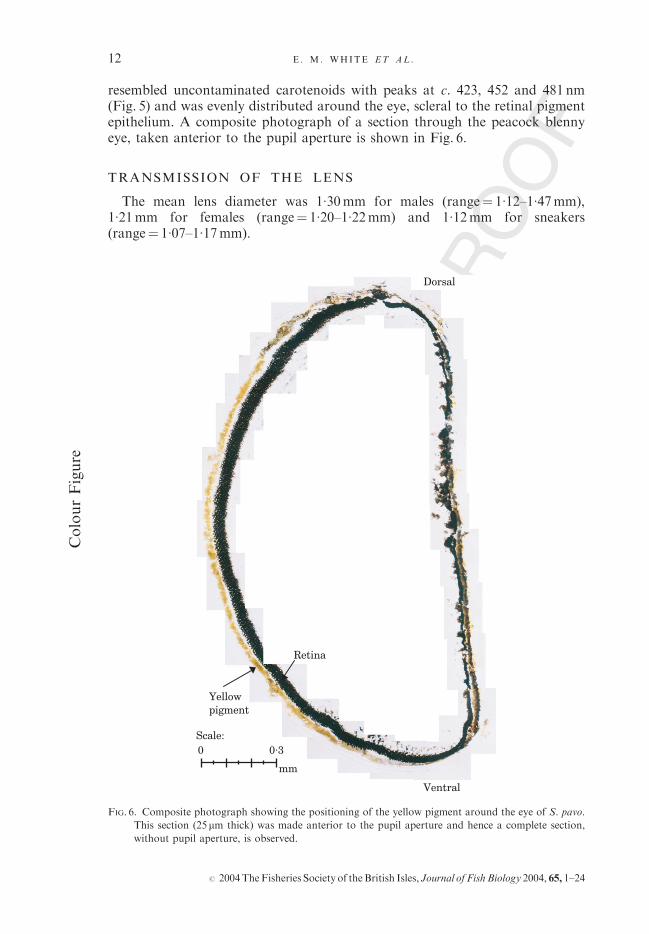
resembled uncontaminated carotenoids with peaks at c. 423, 452 and 481 nm(Fig. 5) and was evenly distributed around the eye, scleral to the retinal pigmentepithelium. A composite photograph of a section through the peacock blennyeye, taken anterior to the pupil aperture is shown in Fig. 6.
TRANSMISSION OF THE LENS
The mean lens diameter was 1�30mm for males (range¼ 1�12–1�47mm),1�21mm for females (range¼ 1�20–1�22mm) and 1�12mm for sneakers(range¼ 1�07–1�17mm).
Retina
Yellowpigment
Scale:
mm
Dorsal
Ventral
0 0·3
FIG. 6. Composite photograph showing the positioning of the yellow pigment around the eye of S. pavo.
This section (25 mm thick) was made anterior to the pupil aperture and hence a complete section,
without pupil aperture, is observed.
ColourFigure
12 E . M. WHITE ET AL .
# 2004TheFisheries Society of theBritish Isles, Journal of Fish Biology 2004, 65, 1–24
UNCORRECTEDPROOF
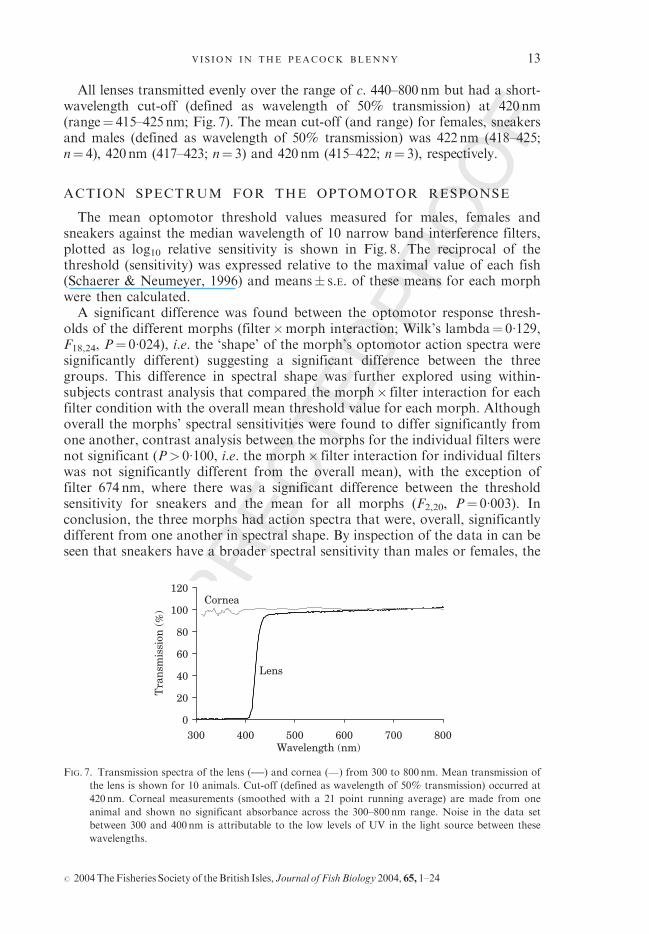
All lenses transmitted evenly over the range of c. 440–800nm but had a short-wavelength cut-off (defined as wavelength of 50% transmission) at 420nm(range¼ 415–425nm; Fig. 7). The mean cut-off (and range) for females, sneakersand males (defined as wavelength of 50% transmission) was 422nm (418–425;n¼ 4), 420nm (417–423; n¼ 3) and 420nm (415–422; n¼ 3), respectively.
ACTION SPECTRUM FOR THE OPTOMOTOR RESPONSE
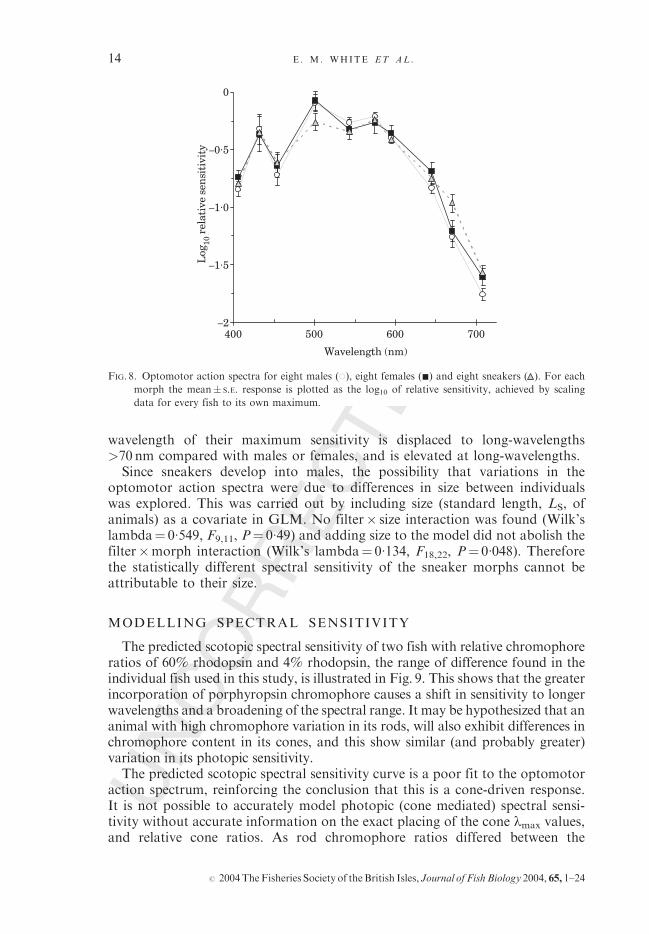
The mean optomotor threshold values measured for males, females andsneakers against the median wavelength of 10 narrow band interference filters,plotted as log10 relative sensitivity is shown in Fig. 8. The reciprocal of thethreshold (sensitivity) was expressed relative to the maximal value of each fish(Schaerer & Neumeyer, 1996) and means� S.E. of these means for each morphwere then calculated.A significant difference was found between the optomotor response thresh-
olds of the different morphs (filter�morph interaction; Wilk’s lambda¼ 0�129,F18,24, P¼ 0�024), i.e. the ‘shape’ of the morph’s optomotor action spectra weresignificantly different) suggesting a significant difference between the threegroups. This difference in spectral shape was further explored using within-subjects contrast analysis that compared the morph� filter interaction for eachfilter condition with the overall mean threshold value for each morph. Althoughoverall the morphs’ spectral sensitivities were found to differ significantly fromone another, contrast analysis between the morphs for the individual filters werenot significant (P> 0�100, i.e. the morph� filter interaction for individual filterswas not significantly different from the overall mean), with the exception offilter 674 nm, where there was a significant difference between the thresholdsensitivity for sneakers and the mean for all morphs (F2,20, P¼ 0�003). Inconclusion, the three morphs had action spectra that were, overall, significantlydifferent from one another in spectral shape. By inspection of the data in can beseen that sneakers have a broader spectral sensitivity than males or females, the
0
20
40
60
80
100
120
300 400 500 600 700 800Wavelength (nm)
Tra
nsm
issi
on (
%)
Cornea
Lens
FIG. 7. Transmission spectra of the lens ( ) and cornea ( ) from 300 to 800 nm. Mean transmission of
the lens is shown for 10 animals. Cut-off (defined as wavelength of 50% transmission) occurred at
420 nm. Corneal measurements (smoothed with a 21 point running average) are made from one
animal and shown no significant absorbance across the 300–800nm range. Noise in the data set
between 300 and 400nm is attributable to the low levels of UV in the light source between these
wavelengths.
V IS ION IN THE PEACOCK BLENNY 13
# 2004TheFisheries Society of theBritish Isles, Journal of FishBiology 2004, 65, 1–24
UNCORRECTEDPROOF
wavelength of their maximum sensitivity is displaced to long-wavelengths>70 nm compared with males or females, and is elevated at long-wavelengths.Since sneakers develop into males, the possibility that variations in the
optomotor action spectra were due to differences in size between individualswas explored. This was carried out by including size (standard length, LS, ofanimals) as a covariate in GLM. No filter� size interaction was found (Wilk’slambda¼ 0�549, F9,11, P¼ 0�49) and adding size to the model did not abolish thefilter�morph interaction (Wilk’s lambda¼ 0�134, F18,22, P¼ 0�048). Thereforethe statistically different spectral sensitivity of the sneaker morphs cannot beattributable to their size.
MODELLING SPECTRAL SENSITIVITY
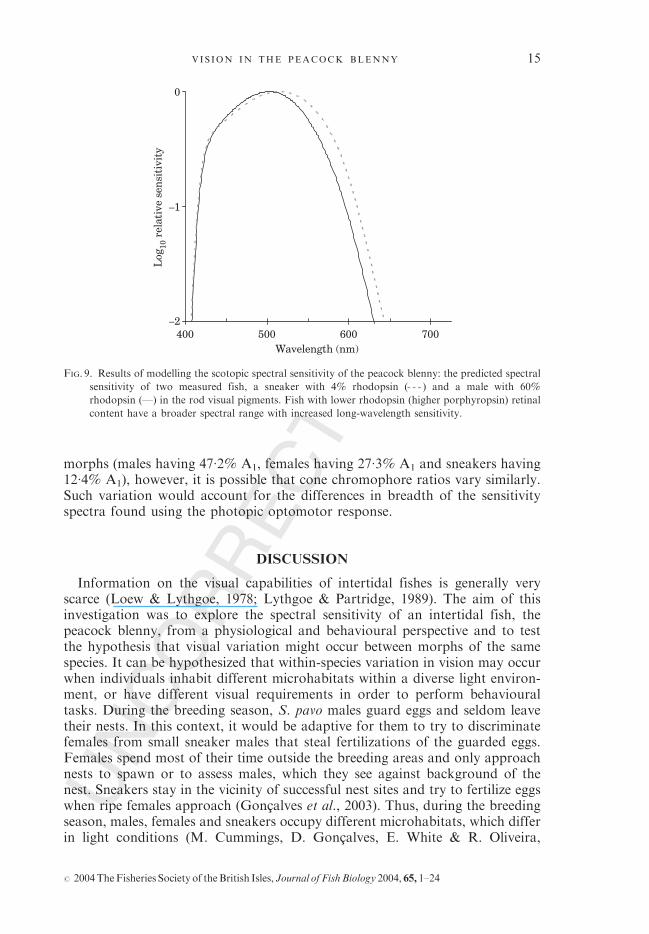
The predicted scotopic spectral sensitivity of two fish with relative chromophoreratios of 60% rhodopsin and 4% rhodopsin, the range of difference found in theindividual fish used in this study, is illustrated in Fig. 9. This shows that the greaterincorporation of porphyropsin chromophore causes a shift in sensitivity to longerwavelengths and a broadening of the spectral range. It may be hypothesized that ananimal with high chromophore variation in its rods, will also exhibit differences inchromophore content in its cones, and this show similar (and probably greater)variation in its photopic sensitivity.The predicted scotopic spectral sensitivity curve is a poor fit to the optomotor
action spectrum, reinforcing the conclusion that this is a cone-driven response.It is not possible to accurately model photopic (cone mediated) spectral sensi-tivity without accurate information on the exact placing of the cone lmax values,and relative cone ratios. As rod chromophore ratios differed between the
–2
–1·5
–1·0
–0·5
0
400 500 600 700
Wavelength (nm)
Log
10 r
elat
ive
sen
siti
vity
FIG. 8. Optomotor action spectra for eight males (*), eight females (&) and eight sneakers ( ). For each
morph the mean� S.E. response is plotted as the log10 of relative sensitivity, achieved by scaling
data for every fish to its own maximum.
14 E . M. WHITE ET AL .
# 2004TheFisheries Society of theBritish Isles, Journal of Fish Biology 2004, 65, 1–24
UNCORRECTEDPROOF
morphs (males having 47�2% A1, females having 27�3% A1 and sneakers having12�4% A1), however, it is possible that cone chromophore ratios vary similarly.Such variation would account for the differences in breadth of the sensitivityspectra found using the photopic optomotor response.
DISCUSSION
Information on the visual capabilities of intertidal fishes is generally veryscarce (Loew & Lythgoe, 1978; Lythgoe & Partridge, 1989). The aim of thisinvestigation was to explore the spectral sensitivity of an intertidal fish, thepeacock blenny, from a physiological and behavioural perspective and to testthe hypothesis that visual variation might occur between morphs of the samespecies. It can be hypothesized that within-species variation in vision may occurwhen individuals inhabit different microhabitats within a diverse light environ-ment, or have different visual requirements in order to perform behaviouraltasks. During the breeding season, S. pavo males guard eggs and seldom leavetheir nests. In this context, it would be adaptive for them to try to discriminatefemales from small sneaker males that steal fertilizations of the guarded eggs.Females spend most of their time outside the breeding areas and only approachnests to spawn or to assess males, which they see against background of thenest. Sneakers stay in the vicinity of successful nest sites and try to fertilize eggswhen ripe females approach (Goncalves et al., 2003). Thus, during the breedingseason, males, females and sneakers occupy different microhabitats, which differin light conditions (M. Cummings, D. Goncalves, E. White & R. Oliveira,
–2
–1
0
400 500 600 700Wavelength (nm)
Log
10 r
elat
ive
sen
siti
vity
FIG. 9. Results of modelling the scotopic spectral sensitivity of the peacock blenny: the predicted spectral
sensitivity of two measured fish, a sneaker with 4% rhodopsin ( ) and a male with 60%rhodopsin (—) in the rod visual pigments. Fish with lower rhodopsin (higher porphyropsin) retinal
content have a broader spectral range with increased long-wavelength sensitivity.
V IS ION IN THE PEACOCK BLENNY 15
# 2004TheFisheries Society of theBritish Isles, Journal of FishBiology 2004, 65, 1–24
UNCORRECTEDPROOF
unpubl. data), and there is variation in the visual tasks that each morph needsto accomplish.MSP revealed the presence of a rod pigment with an average (OTT) lmax of
510 nm, and cone pigments in the range 508 nm–577 nm. There was high indi-vidual variation in rod and cone lmax between and within individuals. The highintraspecific variation in photoreceptor lmax, such as the one observed, iscommonly caused by variations in the chromophoric group (Bridges, 1972).Indeed, partial bleaching experiments revealed two rod visual pigments, one aporphyropsin with lmax at 515�8 nm, and a rhodopsin with lmax of 498�8 nm.Given knowledge of the relationship between the lmax of rhodopsin andporphyropsin pigments (Dartnall & Lythgoe, 1965; Whitmore & Bowmaker,1989, Parry & Bowmaker, 2000) this indicates a rhodopsin and porphyropsinpigment pair based upon the same rod opsin. As the rod pigments of individualfish varied in the A1 :A2 ratio, the cone pigments are also likely to varysimilarly. Thus, the most parsimonious interpretation of the rod and coneabsorbance spectra derived by microspectrophotometry is that they can beexplained as mixtures of at least three pairs of visual pigments, each pairbased on different opsins and being confined to three photoreceptor types(one rod and two cones). Variation in rod and cone lmax seen in MSPmeasurements can thus be interpreted as variation in the chromophoreA1 :A2 ratio in the visual pigments of different fish. Since the range of coneOTT lmax values spreads a 70 nm range, this indicates that at least two coneopsins are present, in addition to variation in chromophore content.The mean rod chromophore utilization for all fish was 30% A1 and 70% A2.
This high A2 content is at variance with previous findings that porphyropsinsare generally associated with freshwater fish visual systems and rhodopsins withmarine environments (Beatty, 1984). The peacock blenny is an exception to thisgeneral ‘rule’ in having a mixed chromophoric system. Mixed systems have,however, been found in other marine fishes such as surfperches (Embiotocidae;Cummings & Partridge, 2001), labrids and scarids (Lythgoe, 1972; Munz &McFarland, 1977), and deep-sea fish (Stomidae) in which individual rods maycontain rhodopsin or porphyropsin analogues based on the same opsin(Bowmaker et al., 1988; Partridge et al., 1989). Mixed chromophoric groupshave been hypothesized to be advantageous in optically variable habitats, inwhich adjustments in the A1 :A2 ratio could provide plasticity in an animal’sspectral sensitivity in response to changes in environmental conditions (Loew &Dartnall, 1976; Levine & MacNichol, 1979; Cummings & Partridge, 2001).Plasticity of this type could also be advantageous for animals that need toperform different visual tasks at different times, e.g. during and outside thebreeding season. In some species, a seasonal variation in the retinal A1 :A2 ratiohas been demonstrated, this being correlated with changes in the environmentallight (Dartnall et al., 1961; Levine & MacNichol, 1979; Muntz & Mouat, 1984).Variation in spectral sensitivity has been reported for three-spined sticklebackGasterosteus aculeatus L., that occupy different photic regimes (McDonald &Hawryshyn, 1995; Boughman, 2001). In this species female sensitivity to redlight has been found to correlate with the degree of male nuptial colouration,which in turn is dependent on the light environment (Boughman, 2001). Three-spined sticklebacks have a dual rhodopsin-porphyropsin based visual system
16 E. M. WHITE ET AL .
# 2004TheFisheries Society of theBritish Isles, Journal of Fish Biology 2004, 65, 1–24
UNCORRECTEDPROOF
(Ali & Wagner, 1975), however, the precise mechanism underlying variation infemale perception has yet to be elucidated.For S. pavo a mixed chromophoric group in the retina could be particularly
advantageous as photic conditions in temperate coastal environments like theRia Formosa are highly variable and the visual tasks animals need to performvary both seasonally (e.g. within and outside the breeding season) and onto-genetically (e.g. sneakers develop into bourgeois males that defend nests;D. Goncalves, T. Fagundes & R.F. Oliveira, unpubl. data). The similarity ofthe S. pavo retina with freshwater species (i.e. in having porphyropsin visualpigments) could also reflect its phylogeny. Salaria pavo is thought to be theclosest relative to the only species of North Atlantic and Mediterranean blennythat inhabits freshwater, Salaria fluviatilis (Asso) (Zander, 1973). Some authorshave argued that S. fluviatilis was a polytopic derivative of S. pavo (Kosswig,1967) while others have suggested that both species derived c. 5–7 million yearsago from an eurythermal and euryhaline common ancestor which tolerated thedesalinization of the Mediterranean in the upper Pliocene (Zander, 1973; Perdiceset al., 2000). The photic conditions of the Mediterranean have probably changedmarkedly during its successive cycles of salinization and desalinization, andS. pavo, or its euryhaline ancestor, may have developed a mixed chromophoricretina during this process, probably highly adaptive under these variableconditions. Future comparative spectral sensitivity and molecular biologystudies among the Salaria spp. could provide valuable data to disentangle theevolutionary history of the genus.Threshold sensitivities, determined using the optomotor response, were found
to vary significantly among S. pavo morphs. Whilst all action spectra followed abroadly similar shape, sneakers had a broader sensitivity that was particularlyelevated at long-wavelengths and had its wavelength of maximum sensitivitydisplaced to longer wavelengths than either females or males. The possibilitythat this variation might be a consequence of size, rather than morph per se wasexplored, but the responses of larger sneakers and females was not found toapproach the responses of smaller males, and no size effect was found overall.It is likely that variation in the optomotor response data obtained from
morphs could be due to differences in chromophore incorporation in retinalcone visual pigments. Chromophore analysis for rod visual pigment extractsdemonstrated differences in the ratio of rhodopsin : porphyropsin in the rodphotoreceptors of different morphs and modelling the effect of this variation onscotopic spectral sensitivity demonstrated the possible magnitude of spectralsensitivity differences. Samples sizes were too small to allow statistical analysis,but there was a distinct trend for high A1 chromophore levels in males (47%,n¼ 4), medium levels in females (27%, n¼ 2), and very low in sneakers (12%,n¼ 3). If similar levels of variation in chromophore ration also occur in the conevisual pigments this may account for the differences detected in the photopicoptomotor responses of individual and morphs. Putatively, such variation inspectral sensitivity may be a manifestation of a physiological adaptation tomorph-specific visual tasks.It is well known that individual fish can change their visual pigment chromophore
utilisation over time. Species such as the rudd (Bridges, 1972; Whitmore &Bowmaker, 1989), and some trout Salmo sp. (Allen et al., 1973), show seasonal
VIS ION IN THE PEACOCK BLENNY 17
# 2004TheFisheries Society of theBritish Isles, Journal of FishBiology 2004, 65, 1–24
UNCORRECTEDPROOF
changes in chromophore content within the retina. Thus it is possible that thechromophore content of the peacock blenny retina might also be variable overtime, allowing adaptation to seasonal changes in the environment or in visual tasksperformed.In all behavioural measures of spectral sensitivity, the resulting curve depends
on the task that the subject is required to do and the visual mechanisms behindit (Jacobs, 1993). In previous experiments on other teleosts, the optomotorresponse, which is based upon the perception of movement, has been found tobe driven predominantly by the long-wavelength photoreceptors (Schaerer &Neumeyer, 1996). In such cases, the resulting action spectrum has provided in asingle maximum and a close fit to the long-wave-sensitive photoreceptor spec-tral sensitivity. In the peacock blenny, however, no single maximum was found,and there were indeed distinct minima, between the short and medium, andmedium and long-wave regions of the spectrum. This is unlike the optomotoraction spectra documented for the goldfish Carassius auratus auratus (L.)(Schaerer & Neumeyer, 1996), zebrafish Danio rerio (Hamilton) (Krauss &Neumeyer, 2003) or guppy Poecilia reticulata pates (Anstis et al., 1998; Endleret al., 2001), which have one maxima. This might indicate that more than onereceptor contributes to motion-detection in the peacock blenny, or it may bethat an alternative mechanism, such as chromatic filtering, may significantlyalter the absorption spectra of retinal cones. A photo-stable carotenoid pigmentsimilar to lutein or zeaxanthin was present in some of the cone outer segmentsscans from MSP (17 out of 177 MWS cells and two of 37 LWS). Carotenoidshave never before been recorded in the outer segments of fish photoreceptors,although they have been found in the lenses and corneas of teleosts and sharks(Muntz, 1973; Zigman & Gilbert, 1978; Kondrashev et al., 1986; McFall-Ngaiet al., 1986; Thorpe et al., 1993), as well as in gecko lenses (Roll, 2000) and inthe retinal oil droplets of birds (Hart, 2001) and reptiles (Liebman & Granda,1975). They are present in the human macula lutea (Snodderly et al., 1983;Sommerberg et al., 1999) and rod and cone outer segments of the humanperifoveal and peripheral retina (Bone et al., 1988; Bone et al., 1997; Sommerberget al., 1999; Rapp et al., 2000). Although the carotenoids found in associationwith the S. pavo cone visual pigment during MSP appeared to be within thecone outer segments, it is possible that they could have contaminated the cellsfrom elsewhere in the retina during the preparation process. Specifically, a25mm thick layer of carotenoid was found distributed throughout the eye,scleral to the retinal pigment epithelium. This carotenoid exhibited absorbancepeaks similar to those found in the MSP scans (421, 452, 481 nm compared with423, 452, 481 nm from MSP). As far as is known, carotenoids have only beenreported in such quantities in the retinae of two other fish species. These are thesouth American cichlid Crenicichla lenticulata Heckel, which has been found tohave large quantities of unidentified photo-stable yellow pigment in the retina(Muntz, 1973), possibly to protect against photo-oxidative damage, and thedeep-sea dragon fish Malacosteus niger Ayres, which possesses a carotenoid-(astaxanthin) based red tapetum (Somiya, 1982; Bowmaker et al., 1988) forenhanced sensitivity of its own far-red bioluminescence (Douglas et al., 1999).Given that the peacock blenny is a highly diurnal species (Plaut & Afik,
2001), it seems likely that the carotenoid layer performs a protective role. In
18 E . M. WHITE ET AL .
# 2004TheFisheries Society of theBritish Isles, Journal of Fish Biology 2004, 65, 1–24
UNCORRECTEDPROOF
wrasse (Labridae) and parrotfishes (Scaridae), carotenoid pigments absorbingmaximally at c. 450 nm are found in the cornea, predominantly concentrated inthe dorsal region (Moreland & Lythgoe, 1968). These pigments selectively filterthe blue component of downwelling light, like an eyeshade, and are thought todecrease short-wavelength damage and chromatic aberration whilst increasingacuity and contrast perception (Walls & Judd, 1933; Heinermann, 1984). Simi-larly, in the human macula, carotenoids are thought to prevent or limit lightand oxygen damage to the retinal cells (Kirschfield, 1982; Schalch, 1992). It isthus possible that in S. pavo carotenoids may be involved in protecting theretina from short-wavelength damage by scavenging free radicals and prevent-ing photo-oxidative damage.Fishes living in shallow waters commonly have a short-wavelength filter in
the lens or cornea (Siebeck & Marshall, 2000; Cummings & Partridge, 2001).Accordingly, while the cornea of the peacock blenny was found to be transpar-ent, the lens was found to be a UV cut-off filter. Apart from shielding the retinafrom UV radiation, this cut-off may be particularly useful in the waters of theRia Formosa, where large amounts of small organic and inorganic particles insuspension scatter light and may produce an obscuring veiling light dominatedby short-wavelengths, as suggested for temperate littoral areas (Lythgoe, 1988;Partridge, 1990).In the MSP investigation, no SWS cones were located although the sample
size of accepted cone scans (145) had a high power (80%) to detect a cone classas rare as 1�4% of the total cone population (Cohen, 1988) and there was noindication of SWS cones in the large number of unaccepted scans. To date,published information on other blenniid species is limited only to the shannyLipophrys (Blennius) pholis (L.) (Loew & Lythgoe, 1978; Lythgoe & Partridge,1989), which was found to have a SWS cone with lmax 454 nm. For S. pavo, thepossibility remains that a whole cone class might have been missed at the MSPsampling stage, since this technique can miss classes of receptors if their occur-rence is low or if they are not uniformly distributed in the retina (Bowmakeret al., 1978). It should be noted, however, that some blue-water fishes, such aswrasse (Labridae; Levine & MacNichol, 1979; Losey et al., 2003) also lack SWScones. This is thought to be an adaptation to the blue space light, which is richin short-wavelength scatter that reduces contrast and degrades the spatialcharacteristics of visualized objects, particularly when these are seen at adistance. Although the waters at the Ria Formosa are blue-green in colour(M. Cummings, D. Goncalves, E. White & R. Oliveira, unpubl. data), most ofthe recent evolutionary history of S. pavo took place in the bluish waters of themediterranean. Support for the presence of two cones (MWS and LWS), andthe absence of SWS cones in S. pavo also comes from studies of the retinal conemosaics of various Blennius species. Blennies appear to fall into two categories:those with double cones, and central and accessory single cones, and those withdoubles and central singles, but lacking accessory singles (Ali & Anctil, 1976).Interestingly, S. pavo is one species lacking accessory single cones (Zaunreiteret al., 1985), as is S. fluviatilis (Ali & Anctil, 1976; listed as Blennius vulgaris).This study provides the first multi-disciplinary investigation of the visual
system of an intertidal fish. High variability in chromophore ratios and lmax
indicates a visual system that is adaptable and suited to the highly variable
VIS ION IN THE PEACOCK BLENNY 19
# 2004TheFisheries Society of theBritish Isles, Journal of FishBiology 2004, 65, 1–24
UNCORRECTEDPROOF
intertidal environment. Furthermore, there is evidence to suggest that the threemorphs (female, sneaker and bourgeois male) of the peacock blenny may havedifferent spectral sensitivities that may be attributable to different chromophoreratios in their retinal photopigments. This may reflect the different visual tasksand different microhabitats with which the morphs are associated.
We are grateful to the direction of the Ria Formosa Nature Park for providingessential logistical support. The authors would like to thank N. Hart for providing theMSP macros, R. Douglas and J. Marshall for their thoughts on carotenoids in the eye,and I. Cuthill, S. Church and M. Cummings for useful discussion. EMW was funded by aUniversity of Bristol Postgraduate Scholarship and DMG by a PRAXIS XXI Ph.D.grant (BD/13436/97). The Portuguese Science and Technology Foundation providedfinancial support (UI&D331/94).
References
Abel, E. F. (1993). Coloration phenomena of Mediterranean blennies (Pisces, Blenniidae).Marine Ecology (PSZNI) 14, 291–312.
Ali, M. A. & Anctil, M. (1976). Retinas of Fishes: An Atlas. Berlin, Heidelberg, NewYork: Springer-Verlag.
Ali, M. A. & Wagner, H.-J. (1975). Visual pigments: ecology and phylogeny. In Vision inFishes. New Approaches to Research (Ali, M. A., ed.), pp. 481–486. New York:Plenum Press.
Allen, D. M., McFarland, W. N., Munz, F. W. & Poston, H. A. (1973). Changes in thevisual pigments of trout. Canadian Journal of Zoology 51, 901–914.
Almada, V. C., Goncalves, E. J., Oliveira, R. F. & Santos, A. J. (1995). Courting females:ecological constraints affect sex roles in a natural population of the blenniid fishSalaria pavo. Animal Behaviour 49, 1125–1127.
Anstis, S., Hutahajan, P. & Cavanagh, P. (1998). Optomotor test for wavelengthsensitivity in guppyfish (Poecilia reticulata). Vision Research 38, 45–53.
Beatty, D. D. (1984). Visual pigments and the labile scotopic visual system of fish. VisionResearch 24, 1563–1573.
Beaudet, L. & Hawryshyn, C. W. (1999). Ecological aspects of vertebrate visual ontogeny.In Adaptive Mechanisms in the Ecology of Vision (Archer, S. N., Djamgoz, M. B. A.,Loew, E. R., Partridge, J. C. & Vallerga, S., eds), pp. 413–437, London: KluwerAcademic Publishers.
Beaudet, L., Novales Flamarique, I. & Hawryshyn, C. W. (1997). Core photoreceptortopography in the retina of sexually mature Pacific Salmonid fishes. Journal ofComparative Neurology 383, 49–59.
Bone, R. A., Landrum, J. T., Fernandez, L. & Tarsis, S. L. (1988). Analysis of themacular pigment by HPLC: retinal distribution and age study. InvestigativeOphthalmology and Visual Science 29, 843–849.
Bone, R. A., Landrum, J. T., Friedes, L. M., Gomez, C.M., Kilburn, M. D., Menendez, E.,Vidal, I. & Wang, W. (1997). Distribution of lutein and zeaxanthin stereoisomers inthe human retina. Experimental Eye Research 64, 211–218.
Boughman, J. W. (2001). Divergent sexual selection enhances reproductive isolation insticklebacks. Nature 411, 944–948.
Bowmaker, J. K. (1990). The visual pigments of fishes. In The Visual System of Fish(Douglas, R. H. & Djamgoz, B. A., eds), pp. 81–107. London: Chapman & Hall.
Bowmaker, J. K. (1996). The visual pigments of fish. Progress in Retinal and Eye Research15, 1–31.
Bowmaker, J. K. & Kunz, Y. W. (1987). Ultraviolet receptors, tetrachromatic colourvision and retinal mosaics in the brown trout (Salmo trout): age-dependentchanges. Vision Research 27, 2102–2108.
20 E . M. WHITE ET AL .
# 2004TheFisheries Society of theBritish Isles, Journal of Fish Biology 2004, 65, 1–24
UNCORRECTEDPROOF
Bowmaker, J. K., Dartnall, H. J. A., Lythgoe, J. N. & Mollon, J. D. (1978). The visualpigments of rods and cones in the rhesus monkey, Macaca mulatta. Journal ofPhysiology 274, 329–348.
Bowmaker, J. K., Dartnall, H. J. A. & Herring, P. J. (1988). Longwave-sensitive visualpigments in some deep-sea fishes: Segregation of ‘‘paired’’ rhodopsins andporphyropsins. Journal of Comparative Physiology A 163, 685–698.
Bridges, C. D. B. (1972). The rhodopsin-porphyropsin visual system. In Handbook ofSensory Physiology, Vol. VII (Dartnall, H. J. A., ed.), pp. 417–480. Berlin:Springer-Verlag.
Cohen, J. (1988). Statistical Power Analysis for the Behavioural Sciences. Hillsdale, NJ:Lawrence Erlbanm Associates.
Cronly-Dillon, J. R. & Muntz, W. R. A. (1965). The spectral sensitivity of the goldfishand the clawed toad tadpole under photopic conditions. Journal of ExperimentalBiology 42, 481–493.
Cummings, M. E. & Partridge, J. C. (2001). Visual pigments and optical habitats ofsurfperch (Embiotocidae) in the California kelp forest. Journal of ComparativePhysiology A 187, 875–889.
Dartnall, H. J. A. & Lythgoe, J. N. (1965). The spectral clustering of visual pigments.Vision Research 5, 81–100.
Dartnall, H. J., Lander, M. R. & Munz, F. W. (1961). Periodic changes in the visualpigments of fishes. In Progress in Photobiology (Christensen, C. & Buchmann, B.,eds), pp. 203–213. Amsterdam: Elsevier.
Douglas, R. H., Partridge, J. C., Dulai, K. S., Hunt, D. M., Mullineaux, C. W. &Hynninen, P. H. (1999). Enhanced retinal longwave sensitivity using a chlorophyll-derived photosensitizer in Malacosteus niger, a deep-sea dragon fish with far-redbioluminescence. Vision Research 39, 2817–2832.
Endler, J. A., Basolo, A. L., Glowacki, S. & Zerr, J. (2001). Variation in response toartificial selection for spectral sensitivity in guppies, Poecilia reticulata. AmericanNaturalist 158, 36–48.
Fritches, K. A., Partridge, J. C., Pettigrew, J. D. & Marshall, N. J. (2000). Colourvision in Billfish. Philosophical Transactions of the Royal Society B 355,1253–1256.
Goncalves, E. J., Almada, V. C., Olivera, R. F. & Santos, A. J. (1996). Female mimicry asa mating tactic in males of the blenniid fish, Salaria pavo. Journal of the MarineBiological Association of the United Kingdom 76, 529–538.
Goncalves, D., Fagundes, T. & Oliveira, R. (2003). Reproductive behaviour of sneakermales of the peacock blenny. Journal of Fish Biology 63, 528–532. doi: 10.1046/j.1095-8649.2003.00157.x.
Govardovskii, V. I., Fyhrquist, N., Reuter, T. & Kuzmin, D. G. (2000). In search of thevisual pigment template. Visual Neuroscience 17, 509–528.
Hart, N. S. (1998). Avian photoreceptors. Ph.D. Thesis, University of Bristol.Hart, N. S. (2001). The visual ecology of avian photoreceptors. Progress in Retinal and
Eye Science 20, 675–703.Hart, N. S., Partridge, J. C. & Cuthill, I. C. (1998). Visual pigments, oil droplets and cone
photoreceptor distribution in the European starling (Sturnus vulgaris). Journal ofExperimental Biology 201, 1433–1446.
Hawryshyn, C. W., Arnold, M. G., Chaisson, D. J. & Martin, P. C. (1989). The ontogenyof ultraviolet photosensitivity in rainbow trout. Visual Neuroscience 2, 247–254.
Heinermann, P. H. (1984). Yellow intraocular filters in fishes. Experimental Biology 43,127–147.
Jacobs, G. H. (1993). The distribution and nature of colour vision among the mammals.Biological Review 68, 413–471.
Jolly, D. W., Mawdesley-Thomas, L. E. & Bucke, D. (1972). Anesthesia of fish.Veterinary Record 91, 424–426
Kirschfield, K. (1982). Carotenoid pigments: their possible role in protecting againstphotooxidation in eyes and receptor cells. Proceedings of the Royal Society ofLondon B 216, 71–85.
2
VISION IN THE PEACOCK BLENNY 21
# 2004TheFisheries Society of theBritish Isles, Journal of FishBiology 2004, 65, 1–24
UNCORRECTEDPROOF
Knowles, A. & Dartnall, H. J. A. (1977). The Photobiology of Vision. New York:Academic Press Inc.
Kondrashev, S. L., Gamburtzeva, A. G., Gnjubkina, V. P., Orlov, O. J. & My, P. T.(1986). Coloration of corneas in fish. A list of species. Vision Research 26, 287–90.
Kosswig, C. (1967). Tethys and its relation to the peri-Mediterranean faunas offreshwater fishes. Aspects of Tethyran Biogeography, Systematics AssociationPublication 7, 313–324.
Krauss, A. & Neumeyer, C. (2003). Wavelength dependence of the optomotor response inzebrafish (Danio rerio). Vision Research 43, 1275–1284.
Levine, J. S. & MacNichol, E. F. (1979). Visual pigments in teleost fishes: effects ofhabitat, microhabitat and behavior on visual system evolution. Sensory Processes3, 95–131.
Levine, J. S. &MacNichol, E. F. (1985).Microspectrophotometry of primate photoreceptors:art, artefact and analysis. In The Visual System (Fein, A. & Levine, J. S., ed.),pp. 715–722. New York: Liss.
Liebman, P. A. & Granda, A. M. (1975). Super dense carotenoid spectra resolved in singlecone oil droplets. Nature 253, 370–372.
Loew, E. R. & Dartnall, H. J. (1976). Vitamin A1/A2-based visual pigment mixtures incones of the rudd. Vision Research 16, 891–896.
Loew, E. R. & Lythgoe, J. N. (1978). The ecology of cone pigments in teleost fishes.Vision Research 18, 715–722.
Loew, E. R. & Sillman, A. J. (1993). Age-related changes in the visual pigments ofthe white sturgeon (Acipenser transmontanus). Canadian Journal of Zoology 71,1552–1557.
Loew, E. R. & Wahl, C. M. (1991) A short-wavelength sensitive mechanism in juvenileyellow perch, Perca flavescens. Vision Research 31, 353–360.
Losey, G. S.,McFarland,W.N., Loew, E. R., Zamzow, J. P., Nelson, P. A. &Marshall, N. J.(2003) Visual biology of Hawaiian coral reef fishes. I. Ocular transmission and visualpigments. Copeia 2003, 433–454.
Lythgoe, J. N. (1972). The adaptation of visual pigments to the photic environment. InHandbook of Sensory Physiology, Vol. VII (Dartnall, H. J. A., ed.), pp. 566–603.New York: Springer-Verlag.
Lythgoe, J. N. (1988). Light and vision in the aquatic environment. In Sensory Biology ofAquatic Animals (Atema, J., ed.), pp. 57–82. Heidelberg: Springer.
Lythgoe, J. N. & Partridge, J. C. (1989). Visual pigments and the acquisition of visualinformation. Journal of Experimental Biology 146, 1–20.
Lythgoe, J. N. & Partridge, J. C. (1991). The modelling of optimal visual pigments ofdichromatic teleosts in green coastal waters. Vision Research 31, 361–371.
MacNichol, E. F. J. (1986). A unifying presentation of photopigment spectra. VisionResearch 26, 1543–1556.
McDonald, C. G. & Hawryshyn, C. W. (1995). Intraspecific variation of spectralsensitivity in threespine stickleback (Gasterosteus aculeatus) from differentphotic regimes. Journal of Comparative Physiology A 176, 255–260.
McFall-Ngai, M., Crescitelli, F., Childress, J. & Horowitz, J. (1986). Patterns ofpigmentation in the eye lens of the deep-sea hatchetfish, Argyropelecus affinisGarman. Journal of Comparative Physiology A 159, 791–800.
McFarland, W. N. & Munz, F. W. (1975). Part III: The evolution of photopic visualpigments in fishes. Vision Research 15, 1071–1080.
Moreland, J. D. & Lythgoe, J. N. (1968). Yellow corneas in fish. Vision Research 8,1377–1380.
Muntz, W. R. A. (1973). Yellow filters and the absorption of light by the visual pigmentsof some Amazonian fishes. Vision Research 13, 2235–2254.
Muntz, W. R. & Mouat, G. S. V. (1984). Annual variations in the visual pigments ofbrown trout inhabiting lochs providing different light environments. VisionResearch 11, 1575–1580.
Munz, F. W. & McFarland, W. N. (1977). Evolutionary adaptations of fishes to thephotic environment. In Handbook of Sensory Physiology, Vol. VII the Visual
22 E . M. WHITE ET AL .
# 2004TheFisheries Society of theBritish Isles, Journal of Fish Biology 2004, 65, 1–24
UNCORRECTEDPROOF
System in Vertebrates (Crescitelli, F., ed.), pp. 193–274. Berlin, Heidelberg, NewYork: Springer.
Papaconstantinou, C. A. (1979). Secondary sex characters of Blennioid fishes (Pisces:Blenniidae). Thalassografica 1, 57–75.
Parry, J. W. L. & Bowmaker, J. K. (2000). Visual pigment reconstitution in intact goldfishretina using synthetic retinaldehyde isomers. Vision Research 40, 2242–2247.
Partridge, J. C. (1990). The colour sensitivity and vision in fishes. In Light and Life in theSea (Herring, P., ed.), pp. 167–184. Cambridge: Cambridge University Press.
Partridge, J. C. & Cummings, M. E. (1999). Adaptation of visual pigments to the aquaticenvironment. In Adaptive Mechanisms in the Ecology of Vision (Archer, S. N.,Djamoz, M. B. A., Loew, E. R., Partridge, J. C. & Vallerga, S., eds), pp. 251–284.Dordrecht: Kluwer Academic Publishers.
Partridge, J. C., Shand, J., Archer, S. N., Lythgoe, J.N.& vanGroningen-Luyben,W.A.H.M.(1989). Interspecific variation in the visual pigments of deep-sea fishes. Journal ofComparative Physiology A 164, 513–529.
Patzner, R. A., Seiwald, M., Adlgasser, M. & Kaurin, G. (1986.). The reproductionof Blennius pavo. V. Reproductive behaviour in the natural environment.Zoologisches Anzeiger 216, 338–350.
Perdices, A., Doadrio, I., Cote, M., Machordom, A., Economidis, P. & Reynolds, J. D.(2000). Genetic divergence and origin of Mediterranean populations of the riverblenny Salaria fluviatilis (Teleostei: Blenniidae). Copeia 2000, 723–731.
Plaut, I. & Afik, D. (2001). Effect of salinity acclimation on routine activity rate in twoclosely related species of blennies from different habitats. Israel Journal of Zoology47, 79–86.
Rapp, L. M., Maple, S. S. & Choi, J. H. (2000). Lutein and zeaxanthin concentrations inrod outer segment membranes from perifoveal and peripheral human retina.Investigative Ophthalmology and Visual Science 41, 1200–1209.
Roll, B. (2000). Carotenoid and retinoid - two pigments in a gecko eye lens. ComparativeBiochemistry and Physiology A 125, 105–112.
Schalch,W. (1992). Carotenoids in the retina - a review of their possible role in preventing orlimiting damage caused by light and oxygen. In Free Radicals and Aging (Emerit, I. &Chance, B., ed.), pp. 280–289. Basel: Birkhauser Verlag.
Schaerer, S. & Neumeyer, C. (1996). Motion detection in goldfish investigated with theoptomotor response is ‘‘colour blind’’. Vision Research 36, 4025–4034.
Shand, J. (1993). Changes in spectral absorption of cone visual pigments during thesettlement of the goatfish Upeneus tragula: the loss of red sensitivity as a benthicexistence begins. Journal of Comparative Physiology A 173, 115–121.
Shand, J., Partridge, J. C., Archer, S. N., Potts, G. W. & Lythgoe, J. N. (1988). Spectralabsorbance changes in the violet/blue sensitive cones of the juvenile pollack,Pollachius pollachius. Journal of Comparative Physiology A 163, 699–703.
Shand, J., Hart, N. S., Thomas, N. & Partridge, J. C. (2001). Developmental changes inthe visual pigments of black bream, Acanthopagrus butcheri. Investigative Ophthal-mology and Visual Science 42, 362–362.
Siebeck, U. E. & Marshall, N. J. (2000). Transmission of ocular media in labrid fishes.Philosophical Transactions of the Royal Society B 355, 1257–1261.
Snodderly, D. M., Brown, P. K., Delori, F. C. & Auran, J. D. (1983). The macularpigment. I. Absorbance spectra, localization, and discrimination from other yellowpigments in primate retinas. Investigative Ophthalmology and Visual Science 25,660–673.
Sommerberg, O., Siems,W.G., Hurst, J. S., Lewis, J.W.,Kliger,D. S. & vanKuijk, F. J. G.M.(1999). Lutein and zeaxanthin are associated with the photoreceptors in the humanretina. Current Eye Research 19, 491–495.
Somiya, H. (1982). ‘Yellow lens’ eyes of the stomiatoid deep sea fish Malacosteus niger.Proceedings of the Royal Society of London B 215, 481–489
Thorpe, A., Douglas, R. H. & Truscott, R. J. W. (1993). Spectral transmission and short-wave absorbing pigments in the fish lens - I. Phylogenetic distribution and identity.Vision Research 33, 289–300.
3
VISION IN THE PEACOCK BLENNY 23
# 2004TheFisheries Society of theBritish Isles, Journal of FishBiology 2004, 65, 1–24
UNCORRECTEDPROOF
Walls, G. L. & Judd, H. D. (1933). The intra-ocular colour filters of vertebrates. BritishJournal of Ophthalmology 14, 641–675, 705–725.
Whitmore, A. & Bowmaker, J. K. (1989). Seasonal variation in the cone sensitivity andshort-wave absorbing visual pigments in the rudd Scardinius erythrophthalmus.Journal of Comparative Physiology A 166, 103–115.
Zander, C. D. (1973). Evolution of Blennioidei in the Mediterranean Sea. Revue desTravaux de l’Institut scientifique des Peches maritimes 37, 215–221.
Zander, C. D. (1986). Blenniidae. In Fishes of the North-Eastern Atlantic and theMediterranean, Vol. 3 (Whithead, P. J. P., Bauchot, M. L., Hureau, J. C., Nielsen, J.& Tortonese, E., eds), pp. 1096–1112. Paris: UNESCO.
Zaunreiter, M., Kotrschal, K., Goldschmid, A. & Adam, H. (1985). Ecomorphology ofthe optic system in 5 species of blennies (Teleostei). Fortschritte der Zoologie 30,731–734
Zigman, S. & Gilbert, P. W. (1978). Lens colour in sharks. Experimental Eye Research 26,227–231.
24 E . M. WHITE ET AL .
# 2004TheFisheries Society of theBritish Isles, Journal of Fish Biology 2004, 65, 1–24

Author Query Form
Journal: Journal of Fish Biology
Article : 446
Dear Author,
During the copy-editing of your paper, the following queries arose. Please respond to these by marking up yourproofs with the necessary changes/additions. Please write your answers on the query sheet if there is insufficient spaceon the page proofs. Please write clearly and follow the conventions shown on the attached corrections sheet. Ifreturning the proof by fax do not write too close to the paper’s edge. Please remember that illegible mark-ups maydelay publication.Many thanks for your assistance.
QueryRefs.
Query Remarks
1 PE: Shand et al., 1993 has been changed to Shand, 1993 to matchthe reference list. Please check.
2 PE: Hart, 1998 has not been cited in text. Please check.
3 PE: Please provide the correct page range.
4 PE: The label ‘Wavelength (nm)’ in x axis has been added. Pleasecheck.

Marginal mark
Stet
New matter followed by
New letter or new word
under character
e.g.
over character e.g.
and/or
and/or
MARKED PROOFÐÐÐÐÐÐÐÐÐÐÐÐÐÐÐÐÐÐÐÐÐÐÐÐÐÐÐÐÐÐÐÐÐÐÐÐÐÐÐÐÐÐÐÐÐÐÐÐÐÐÐÐÐÐÐÐÐÐÐÐÐÐÐÐÐÐÐÐÐÐÐÐÐÐÐÐÐÐÐÐ
Please correct and return this setÐÐÐÐÐÐÐÐÐÐÐÐÐÐÐÐÐÐÐÐÐÐÐÐÐÐÐÐÐÐÐÐÐÐÐÐÐÐÐÐÐÐÐÐÐÐÐÐÐÐÐÐÐÐÐÐÐÐÐÐÐÐÐÐÐÐÐÐÐÐÐÐÐÐÐÐÐÐÐÐ
Please use the proof correction marks shown below for all alterations and corrections. If you
wish to return your proof by fax you should ensure that all amendments are written clearly in
dark ink and are made well within the page margins.
Textual mark
under matter to remain
through matter to be deleted
through matter to be deleted
through letter or through
word
under matter to be changed
under matter to be changed
under matter to be changed
under matter to be changed
under matter to be changed
Encircle matter to be changed
(As above)
through character or where
required
(As above)
(As above)
(As above)
(As above)
(As above)
(As above)
linking letters
between letters affected
between words affected
between letters affected
between words affected
Instruction to printer
Leave unchanged
Insert in text the matter
indicated in the margin
Delete
Delete and close up
Substitute character or
substitute part of one or
more word(s)
Change to italics
Change to capitals
Change to small capitals
Change to bold type
Change to bold italic
Change to lower case
Change italic to upright type
Insert `superior' character
Insert `inferior' character
Insert full stop
Insert comma
Insert single quotation marks
Insert double quotation
marks
Insert hyphen
Start new paragraph
No new paragraph
Transpose
Close up
Insert space between letters
Insert space between words
Reduce space between letters
Reduce space between words