Peacock et al. 2008 GLO Notes and Forest Management
23
BioOne sees sustainable scholarly publishing as an inherently collaborative enterprise connecting authors, nonprofit publishers, academic institutions, research libraries, and research funders in the common goal of maximizing access to critical research. Assessing the Pre-modern Tree Cover of the Ackerman Unit, Tombigbee National Forest, North Central Hills, MS, Using GLO Survey Notes and Archaeological Data Author(s) :Evan Peacock, John Rodgers, Kevin Bruce, and Jessica Gray Source: Southeastern Naturalist, 7(2):245-266. 2008. Published By: Humboldt Field Research Institute DOI: URL: http://www.bioone.org/doi/ full/10.1656/1528-7092%282008%297%5B245%3AATPTCO %5D2.0.CO%3B2 BioOne (www.bioone.org ) is a a nonprofit, online aggregation of core research in the biological, ecological, and environmental sciences. BioOne provides a sustainable online platform for over 170 journals and books published by nonprofit societies, associations, museums, institutions, and presses. Your use of this PDF, the BioOne Web site, and all posted and associated content indicates your acceptance of BioOne’s Terms of Use, available at www.bioone.org/page/terms_of_use . Usage of BioOne content is strictly limited to personal, educational, and non- commercial use. Commercial inquiries or rights and permissions requests should be directed to the individual publisher as copyright holder.
Transcript of Peacock et al. 2008 GLO Notes and Forest Management

BioOne sees sustainable scholarly publishing as an inherently collaborative enterprise connecting authors,nonprofit publishers, academic institutions, research libraries, and research funders in the common goal ofmaximizing access to critical research.
Assessing the Pre-modern Tree Cover of the AckermanUnit, Tombigbee National Forest, North Central Hills,MS, Using GLO Survey Notes and Archaeological DataAuthor(s) :Evan Peacock, John Rodgers, Kevin Bruce, and Jessica GraySource: Southeastern Naturalist, 7(2):245-266. 2008.Published By: Humboldt Field Research InstituteDOI:URL: http://www.bioone.org/doi/full/10.1656/1528-7092%282008%297%5B245%3AATPTCO%5D2.0.CO%3B2
BioOne (www.bioone.org) is a a nonprofit, online aggregation of core researchin the biological, ecological, and environmental sciences. BioOne providesa sustainable online platform for over 170 journals and books published bynonprofit societies, associations, museums, institutions, and presses.
Your use of this PDF, the BioOne Web site, and all posted and associatedcontent indicates your acceptance of BioOne’s Terms of Use, available atwww.bioone.org/page/terms_of_use.
Usage of BioOne content is strictly limited to personal, educational, and non-commercial use. Commercial inquiries or rights and permissions requestsshould be directed to the individual publisher as copyright holder.

SOUTHEASTERN NATURALIST2008 7(2):245–266
Assessing the Pre-modern Tree Cover of the Ackerman Unit, Tombigbee National Forest, North Central Hills, MS,
Using GLO Survey Notes and Archaeological Data
Evan Peacock1,*, John Rodgers2, Kevin Bruce3, and Jessica Gray4
Abstract - General Land Offi ce (GLO) survey data from the Ackerman Unit of the Tombigbee National Forest, MS are used to characterize early 19th-century tree cover in a part of the North Central Hills physiographic province. Archaeological settlement-pattern data indicate that the area was abandoned ca. A.D. 1000 and that early Historic-period settlement was minimal by the time the GLO surveys were done. The GLO data therefore represent forest conditions as they developed in the absence or near-absence of human infl uence. Tree cover consisted of oak-dominated hardwoods with a non-clustered pine component. The distributions of some hard-wood species were related to geological controls. Based on previous archaeological work, the argument concerning minimal human impact can be extended to the entire North Central Hills province, with consequent implications for forest management on federal lands.
Introduction
General Land Offi ce (GLO) survey notes have long been a standard data source for scientists interested in landscape conditions as they existed prior to extensive modern impacts. One criticism levied against studies employ-ing GLO data is that researchers were paying insuffi cient attention to the residual effects of American Indian land-management practices on early 19th-century forest cover (Peacock 1998), a practice exemplifi ed by the use of the term “presettlement” (e.g., Anderson and Anderson 1975). This practice continues today (e.g., Bragg 2003, Brewer 2001, Farley et al. 2002, Perkins and Matlack 2002), despite a number of studies that combine GLO data with ethnohistorical and/or archaeological data to clearly demonstrate the infl uence of American Indian populations on the landscape. For example, Foster et al. (2004) recently employed catchment analysis of GLO data to show vegetation differences between early Historic-period Creek Indian town locales and uninhabited control areas in east-central Alabama. GLO data also have been used to document late-prehistoric human environmental impact in Arkansas, where wood was intensively exploited as fuel for boil-ing off salt brine (Williams 1993). Importantly, however, archaeological data also can be used to argue that American Indian land use was not a signifi cant factor in early 19th-century 1Cobb Institute of Archaeology, PO Box AR, Mississippi State University, 39762. 2Department of Geosciences, PO Box 5548, Mississippi State University, 39762. 3Marcell/Deer River Ranger District, Chippewa National Forest, PO Box 308, 1037 Division Street, Deer River, MN 56636. 4109 Old Farm Road,Perry, GA 31069. *Cor-responding author - [email protected].
Southeastern Naturalist Vol.7, No. 2246
forest composition, if those data indicate a lack of human occupation in an area for a substantial period of time prior to the GLO surveys. In this article, we present evidence that land now comprising the Ackerman Unit of the Tombigbee National Forest, north-central Mississippi, was abandoned by American Indians centuries before the GLO surveys were undertaken, and that Historic-period reoccupation of the area was minimal until the mid-19th century. We argue that the GLO data therefore represent unmodifi ed to mini-mally modifi ed forest conditions, the major control for which seems to have been geological.
Study Area
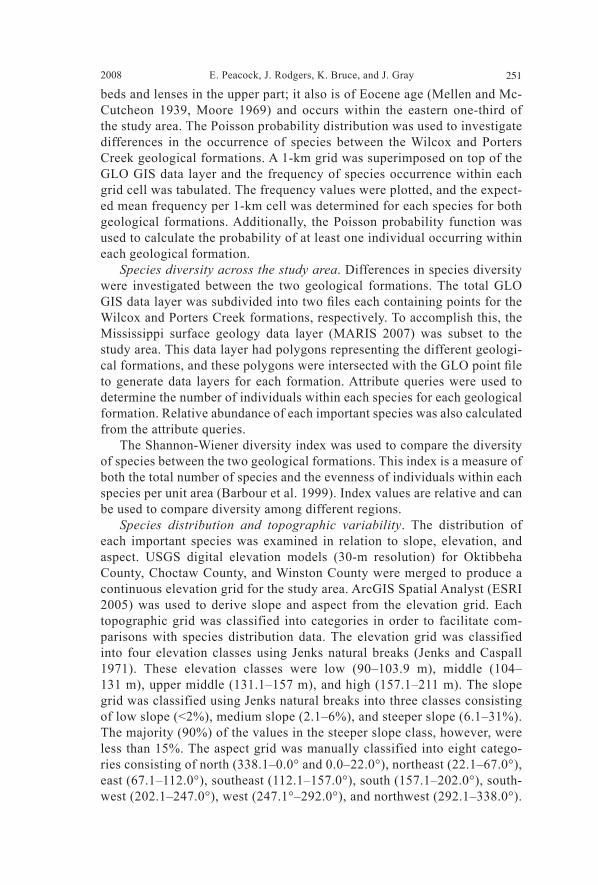
The Ackerman Unit of the Tombigbee National Forest includes ap-proximately 40,000 acres of federally controlled land lying almost entirely within the North Central Hills physiographic province of central Mississip-pi (Fig. 1), with the eastern tip extending into the Flatwoods. The province encompasses a broad, highly dissected belt of uplands, with a dendritic drainage pattern feeding generally small streams. The largest waterway crossing the Ackerman Unit, the Noxubee River, has its headwaters in the northwestern part of the unit and eventually flows into the Tombigbee River at Gainesville, AL. Geologically, the North Central Hills consist of Tertiary sands, sandstones, clays, shales, and silts. The sand members are mostly non-marine in origin and were deposited during the Upper Paleo-cene and Middle Eocene coincident with sea-level trangressions and con-sequent landscape aggradation. A more detailed discussion of area geology can be found in Peacock and Fant (2002; see also Mellen and McCutcheon 1939, Vestal and McCutcheon 1943). The area is home to a rich prehistoric record, although, as discussed in detail below, American Indian settlement varied in intensity through time (Peacock 1997). Historic settlement in the area began in the 19th century, aided in part by the construction in the 1820s of Robinson Road, a post route that ran through the Ackerman Unit area (Phelps 1950, Rafferty 1979). Access to the area was facilitated by the Treaty of Dancing Rabbit Creek in 1830, in which the land was ceded by the Choctaw Indians. Subsequent settlement consisted primarily of small farmsteads around which cotton and corn agriculture was practiced, with pigs being the major livestock (Moore 1988). With the coming of railroads around the beginning of the 20th century, logging increased in importance in the local economy (Adkins 1979, Carroll 1983, Coleman 1973) as Mississippi became a national leader in lumbering (Fickle 2001). Lands acquired by the government in the 1930s and early 1940s were administered by the Soil Conservation Service until control was passed to the US Department of Agriculture in 1959, when the Tombigbee National Forest was created. Since that time, the land has been managed primarily for timber and game, with pine being maintained as the species of primary economic importance.

E. Peacock, J. Rodgers, K. Bruce, and J. Gray2008 247
Methods
Archaeological site ages and distributions Data on the distribution and age of archaeological sites on the Ackerman Unit have been gathered over a number of years via intensive shovel-test and open-ground surveys designed to locate all sites in proposed impact areas. These surveys have largely focused on ridge tops prior to logging, but a number have been undertaken on other landforms, such as fi rst terraces and bottomlands, with one such project being designed for the sole purpose of evaluating the survey methods (Peacock 1995a, 1996). These surveys have resulted in several hundred prehistoric and Historic-period sites being re-corded on the Ackerman Unit. Approximate ages were assigned to individual
Figure 1. Lo-cation of the A c k e r m a n Unit, Tombig-bee National Forest, and Holly Springs National For-est, MS.

Southeastern Naturalist Vol.7, No. 2248
occupations based on the presence of diagnostic artifacts (see Peacock 1995a for details). In the case of prehistoric sites, these included projectile point and pottery types with known temporal spans. In the case of Historic-period (post-1700 A.D.) occupations, artifacts such as decorated ceramics and nails were used, along with bottle glass color and form. Written records, beginning with the GLO notes of 1832–1833 and in-cluding the federal government acquisition records dating to the 1930s and early 1940s (Peacock and Patrick 1997), were accessed as complementary sources for site location and age determinations. Although GLO data have been employed in charting Historic-period landscape use (e.g., Silbernagel et al. 1997), maps and written records alone are insuffi cient for accurate assessments of Historic-period site frequencies. Data from written sources should be combined with archaeological survey data, as we have done here, to insure that the full range and a more accurate number of sites are repre-sented (e.g., Peacock and Patrick 1997). All site locations were entered into a Geographic Information System (GIS) for display at a scale appropriate for the purposes of this paper, but which does not compromise site security. Information on all sites on the Tombigbee Na-tional Forest is available to qualifi ed researchers through the US Forest Service.
GLO notes Copies of the original GLO notes on fi le at the Tombigbee Ranger Dis-trict offi ce, Ackerman, MS were used to compile witness-tree data. The notes date from 1832–1833. All data from within the legal boundaries of the Ackerman Unit were used except in cases where the notes could not be read with certainty. One to four witness trees were recorded by the surveyors at each Township, section, and quarter-section corner, with two being usual. Although most of the data represent trees thus recorded “near” (generally within 50 feet of) points on a half-mile grid, following the instructions of Fisk (1832), surveyors corrected for errors by adjusting the size of sections along the standard parallels. In the case of the study area, this led to a tier of sections of unusually small size along the eastern boundary of Range 12E. A description of the GLO surveys in Mississippi, including the debates and decisions concerning resolution of errors, is provided by Burt (1992). Bias in GLO notes can occur from a number of idiosyncratic sources, such as a desire by surveyors to avoid conifers with sticky sap (Bourdo 1956, Whitney and DeCant 2001). This factor was assessed by comparing distances to witness trees (Bourdo 1956; cf. Delcourt 1975) for all species for which n > 50 (Quercus rubra [red oak], Pinus sp. [pine], Quercus stellata [post oak], Carya sp. [hickory], Quercus velutina [black oak], and Quer-cus alba [white oak]). Distances to each species were calculated from the notes and the results compared. Because sample sizes are generally small (Table 1), t-tests were used in which unequal variance was assumed, with a 0.95 confi dence interval. Differences between the mean distances to the target species were not signifi cant; hence, intentional surveyor bias does not appear to be a problem with this data set.

E. Peacock, J. Rodgers, K. Bruce, and J. Gray2008 249
Species pattern analysis. The fi rst step in analyzing spatial patterns of individual species was to determine if species distributions were clustered or random within the GLO sampling frame. In order to carry this out, the origi-nal GLO data were imported into a GIS. The X- and Y- coordinates (UTM Zone 16N; NAD 1927) of each survey point in the original GLO database were determined from USGS Toposheets. The survey points were then plot-ted within the GIS, and the attribute table of this GLO data layer had fi elds consisting of an individual point ID, the corresponding X- and Y- coordinate values, and the number of observed individuals within each species. Next, an attribute query was used to identify only those points that contained a particular species, e.g., red oak. The selected points were then extracted to a new GIS data layer. This step was repeated for each of the most abundant species (red oak, black oak, hickory, pine, white oak, and post oak).
Table 1. Witness trees recorded for the Ackerman Unit area in 1832–1833.
Species Number Percent
Quercus rubra L. (red oak) 161 18.59Pinus sp. (pine) 150 17.32Quercus stellata Wangenh. (post oak) 107 12.36Carya sp. (hickory) 98 11.32Quercus velutina Lam. (black oak) 79 9.12Quercus alba L. (white oak) 79 9.12Nyssa sylvatica Marsh. (black gum) 30 3.46Quercus marilandica Muencch. (blackjack oak) 17 1.96Castanea dentate Marsh. (chestnut) 16 1.85Quercus sp. (spanish oak) 16 1.85Liriodendron tulipifera L. (poplar) 16 1.85Ilex sp. (holly) 13 1.50Liquidambar styracifl ua L. (sweetgum) 11 1.27Cornus fl orida L. (dogwood) 11 1.27Fagus grandifolia Ehrh. (beech) 11 1.27Acer sp. (maple) 9 1.04Sassafras sp. (sassafras) 6 0.69Carpinus caroliniana Walt. (hornbeam) 6 0.69Fraxinus sp. (ash) 4 0.46Ostrya virginiana K.Koch (Ironwood) 4 0.46Ulmus sp. (elm) 2 0.23Quercus bicolor (swamp oak) 2 0.23Oxydendrum arboretum (L.) DC. (sourwood) 2 0.23Platanus occidentalis L. (sycamore) 2 0.23Quercus phellos L. (willow oak) 2 0.23Nyssa sp. (gum) 2 0.23Persea sp. (bay) 2 0.23Ulmus rubra Muhl. (slippery elm) 2 0.23Prunus persica (L.) Batsch. (peach) 1 0.12Magnolia acuminate L. (cucumber tree) 1 0.12Chrysopsis lanuginosa Small (lynn) 1 0.12Magnolia sp. (magnolia) 1 0.12Morus rubra L. (mulberry) 1 0.12Salix nigra Marsh. (willow) 1 0.12Total 866 100.00

Southeastern Naturalist Vol.7, No. 2250
Nearest neighbor analysis was used to test for significant clustering of important GLO species. The assumption of this analysis is that a clustered point pattern will have a smaller average (Euclidian) distance among same-species observations than a point pattern that is random. The ratio of the average distance among observed points to an average distance of a hypo-thetical random point pattern should be less than 1 if the pattern is clustered and nearly equal to one if the pattern is random. The average nearest neigh-bor function within ArcGIS (ESRI 2005) Spatial Statistics Tools was used to calculate the nearest neighbor ratio of observed and expected average distances. This function also reports a standardized normal score (Z-value) that can be used to determine if the degree of clustering is significantly different than a hypothetical random pattern. A Z value less than -1.65 is significant at alpha = 0.10 and a Z value less than -1.96 is significant at the alpha = 0.05. Nearest neighbor calculations were performed on each of the individual species data layers, and the area used for the calculations was the extent of the Tombigbee National Forest Ackerman Unit procla-mation (legal) boundary (311 square km). For ease in calculation, distance between individual species as used in nearest neighbor calculations refers to the distance between section corners where those species were noted to occur (i.e., as presence/absence data), rather than to the XY coordinates of individual trees. The average distance between witness trees of the ten most abundant taxa was 1.47 km; Table 2 shows the observed mean dis-tances between members of each of these species. One potential structural control on vegetation is geological, as the Ackerman Unit is underlain by two geological formations, the Wilcox and the Porters Creek. The Wilcox formation is described as irregularly-bed-ded fine to coarse sands, ferruginous sandstone, lignitic clays, and limited beds of kaolinitic and bauxitic clays of Eocene age (Moore 1969); it oc-curs within the western two-thirds of the study area. The Porters Creek, in contrast, is described as primarily dark-gray silty clays with abundant sand
Table 2. Nearest neighbor analysis of important species. For signifi cance (sign.): * indicates signifi cant at alpha = 0.10, ** indicates signifi cant at alpha = 0.05, and ns indicates not sig-nifi cant.
Expected Observed mean Ratio of mean distance if observed to Pattern Species distance (m) random (m) expected Z-value Sign. type
Red oak 942.9 1039.84 0.90 -1.910 * ClusteredBlack oak 1124.4 1350.41 0.83 -2.410 ** ClusteredHickory 1129.8 1233.49 0.91 -1.140 Ns RandomPine 1014.0 1008.40 1.01 0.116 Ns RandomWhite oak 1262.7 1336.28 0.94 -0.870 Ns RandomPost oak 1145.0 1223.80 0.93 -1.135 Ns RandomBlack gum 1861.1 1753.50 1.06 0.630 Ns RandomChestnut 2122.9 2126.90 0.998 -0.014 Ns RandomSpanish oak 1717.8 1921.00 0.89 -0.810 Ns RandomBlackjack oak 2439.9 2040.80 1.19 1.449 Ns Random
E. Peacock, J. Rodgers, K. Bruce, and J. Gray2008 251
beds and lenses in the upper part; it also is of Eocene age (Mellen and Mc-Cutcheon 1939, Moore 1969) and occurs within the eastern one-third of the study area. The Poisson probability distribution was used to investigate differences in the occurrence of species between the Wilcox and Porters Creek geological formations. A 1-km grid was superimposed on top of the GLO GIS data layer and the frequency of species occurrence within each grid cell was tabulated. The frequency values were plotted, and the expect-ed mean frequency per 1-km cell was determined for each species for both geological formations. Additionally, the Poisson probability function was used to calculate the probability of at least one individual occurring within each geological formation. Species diversity across the study area. Differences in species diversity were investigated between the two geological formations. The total GLO GIS data layer was subdivided into two fi les each containing points for the Wilcox and Porters Creek formations, respectively. To accomplish this, the Mississippi surface geology data layer (MARIS 2007) was subset to the study area. This data layer had polygons representing the different geologi-cal formations, and these polygons were intersected with the GLO point fi le to generate data layers for each formation. Attribute queries were used to determine the number of individuals within each species for each geological formation. Relative abundance of each important species was also calculated from the attribute queries. The Shannon-Wiener diversity index was used to compare the diversity of species between the two geological formations. This index is a measure of both the total number of species and the evenness of individuals within each species per unit area (Barbour et al. 1999). Index values are relative and can be used to compare diversity among different regions. Species distribution and topographic variability. The distribution of each important species was examined in relation to slope, elevation, and aspect. USGS digital elevation models (30-m resolution) for Oktibbeha County, Choctaw County, and Winston County were merged to produce a continuous elevation grid for the study area. ArcGIS Spatial Analyst (ESRI 2005) was used to derive slope and aspect from the elevation grid. Each topographic grid was classified into categories in order to facilitate com-parisons with species distribution data. The elevation grid was classified into four elevation classes using Jenks natural breaks (Jenks and Caspall 1971). These elevation classes were low (90–103.9 m), middle (104–131 m), upper middle (131.1–157 m), and high (157.1–211 m). The slope grid was classified using Jenks natural breaks into three classes consisting of low slope (<2%), medium slope (2.1–6%), and steeper slope (6.1–31%). The majority (90%) of the values in the steeper slope class, however, were less than 15%. The aspect grid was manually classified into eight catego-ries consisting of north (338.1–0.0° and 0.0–22.0°), northeast (22.1–67.0°), east (67.1–112.0°), southeast (112.1–157.0°), south (157.1–202.0°), south-west (202.1–247.0°), west (247.1°–292.0°), and northwest (292.1–338.0°).

Southeastern Naturalist Vol.7, No. 2252
Hawth’s analysis tools for ArcGIS (Beyer 2004) was used to intersect the species point files with the classified topographic grids. The attribute table from this intersection was imported into a statistical software pack-age (SPSS), and a non-parametric chi-square analysis was used to test for independence of species abundance and the topographic variable classes. Lastly, cross-tabulation of the topographic variable classes and geologi-cal formation was used to investigate further the relationship of these two variables. A chi-square contingency table was not possible due to the low frequency of values within each category.
Results
Prehistoric and historic settlement patterns The archaeological site distribution data show clear temporal patterns (Fig. 2). Few pre-Woodland-period occupations (those with artifacts diag-nostic of any part of the time span between ca. 12,000 and 800 B.C.) have been identifi ed on the Ackerman Unit; those that have been recorded are mostly located along the major streams. In contrast, Woodland-period oc-cupations (including sites with Gulf Formational period diagnostics—see Peacock 1997) dating from ca. 800 B.C. to A.D. 1050 are abundant and are found on all landforms (Blitz 1984, Parrish 2006, Peacock 1997). Un-like some other areas of the Eastern Woodlands (Scarry 1993), there is no
Figure 2. Archaeological site distributions on the Ackerman Unit of the Tombigbee National Forest. Most Mississippian-period sites likely date no later than ca. A.D. 1000–1100.

E. Peacock, J. Rodgers, K. Bruce, and J. Gray2008 253
evidence of Woodland-period plant domestication in the study area (Johan-nessen 1993); rather, a general hunting-gathering lifestyle was followed. The high numbers of Woodland-period sites may be related to the advent of sedentariness (permanent settlement) and consequent population growth, as sedentariness seems to have begun in the area during the fi rst millennium B.C. (Rafferty 1980, 2002). There is a dramatic decrease in site numbers at about the beginning of the second millennium A.D., with the advent of what archaeologists call the Mississippian period. During this time, maize-based agriculture was widely adopted across much of eastern North America, including the study area (Peacock 2003). Although the entire span of the Mississippian period is used in Figure 2, artifactual and chronometric (radiocarbon) evidence gathered from surveys and excavations suggests that the area was abandoned early in the period, around A.D. 1000–1100 (Blitz 1984; Peacock 1997, 2003), and was not reoccupied until the early 19th century. Reasons for this early Mis-sissippian abandonment of the hills are unknown at this time. There does not seem to have been a general depopulation event, as areas to the west (the Bluff Hills, the Mississippi Alluvial Valley) and to the east (the Black Prai-rie, the Tombigbee River Valley) show no signs of abandonment (Lipo and Dunnell, in press; Rafferty 2003, in press). Indeed, a recent compilation of radiocarbon and thermoluminescence dates shows a marked increase in oc-cupation of the Black Prairie by ca. A.D. 1200 (cf. Johnson and Sparks 1986, Johnson et al. 1991, Rafferty and Peacock 2007). Work currently underway on the Ackerman Unit indicates that Mississippian period occupations are quite small and relatively ephemeral, with only a few artifacts diagnostic of the period being recovered from intensive shovel testing on close-inter-val grids across entire sites (Andrew Triplett, Tombigbee National Forest, Ackerman, MS, 2007; pers. comm.). This fi nding supports our contention that abandonment took place early in the period, before suffi cient time had elapsed for substantial archaeological remains to accumulate. Early 19th-century sites (including a very few that show evidence of His-toric-period aboriginal occupation, possibly Choctaw Indian homesteads) also are relatively rare, while many mid-19th- to early 20th-century sites have been recorded on the unit (Peacock and Patrick 1997). This archaeological assessment is borne out by records research, with very few improvements (the Robinson Road and a few fi elds) being shown on the early 19th-century GLO maps for the Ackerman Unit. Taken together, these settlement-pattern data present a very interesting picture where the reconstruction of forest cover is concerned. By the time of the GLO surveys in the early 1830s, the Ackerman Unit area had been essentially devoid of American Indian settlement for approximately seven to eight hundred years, and Historic-period resettlement of the area was still quite limited. The witness-tree data therefore should provide a good repre-sentation of what forest conditions in the North Central Hills were like in the absence of intensive human occupation.

Southeastern Naturalist Vol.7, No. 2254
Witness tree data Data were compiled for 866 witness trees on the Ackerman Unit. Com-mon names, numbers, and proportions of the 37 species represented are given in Table 1. Common names are used, as different surveyors were involved and precise identifi cation of some species from the notes is not al-ways possible. Despite this limiting factor, a good characterization of forest cover is obtained. In general, the area supported oak-dominated hardwoods, with pine being common at slightly more than 17% of the total. Spatial pattern analysis. Red oak and black oak witness trees were sig-nifi cantly clustered within the Tombigbee National Forest Ackerman Unit study area, but all the other important species had a more-or-less random distribution (Table 2). Red oak was more clustered within the Wilcox geo-logical formation of the Ackerman Unit, while Black oak was more clustered within the Porters Creek formation (Fig. 3). The point-distribution maps of pine and hickory across the Ackerman Unit (Fig. 4) suggest a slight prefer-ence for geological formation (Wilcox), but the nearest neighbor analysis did not show this trend to be signifi cant. Both white oak and post oak had a random distribution across the study area (Fig. 5). The importance of geological formation to species distribution was ex-amined further by calculating the Poisson probability distribution for each important taxon (Fig. 6). Red oak was twice as likely to occur within the Wilcox (45%) than in the Porters Creek (22%) formation. Black oak, on the other hand, was nearly four times more likely to occur in the Porters Creek (33%) than in the Wilcox formation (8.5%). Both results corroborate the results of the nearest neighbor analysis. As noted in the point distributions,
Figure 3. Distri-bution (presence/absence) of red oak and black oak witness trees from the General Land Office survey data on the Ack-erman Unit of the Tombigbee National Forest. Red oak is more clustered in the Wilcox forma-tion (white shad-ing) and black oak is more clustered in the Porters Creek formation (gray shading).

E. Peacock, J. Rodgers, K. Bruce, and J. Gray2008 255
both hickory and pine had higher probabilities of occurring in the Wilcox formation. Both white oak and post oak had similar probabilities of occur-ring on each geological formation. Species diversity across the study area. Because geological formation was determined to be an infl uential factor, comparisons between the Wilcox
Figure 4: Distribution (presence/absence) of pine and hickory witness trees from the General Land Offi ce survey data on the Ackerman Unit of the Tombigbee National Forest. Although both species are slightly more abundant in the Wilcox formation, nearest neighbor analysis indicates that their distribution across the two geo-logical formations is random.
Figure 5. Distribution (presence/absence) of white oak and post oak witness trees from the General Land Of-fi ce survey data on the Ackerman Unit of the Tombigbee National Forest. Although white oaks are slightly more abundant on the Wilcox formation and the post oak are slight-ly more prevalent on the Porters Creek for-mation, nearest neigh-bor analysis indicates a random distribution of these species across the two geological formations.

Southeastern Naturalist Vol.7, No. 2256
Table 3. Species diversity on the Ackerman Unit of the Tombigbee National Forest compared between the Wilcox and Porters Creek geological formations.
Diversity measure Porters Creek Wilcox
Number of species 28 30Total number of individuals (all spp.) 324 341Shannon-Wiener diversity index -2.53 -2.42Number GLO points 141 255
Figure 6. The Poisson probability of at least one witness tree from the General Land Office survey data occurring within the Wilcox and Porters Creek geologi-cal formations.
Table 4. Absolute abundance of taxa of n > 5 divided between the Wilcox and Porters Creek formations.
Species Porters Creek (# of individuals) Wilcox (# of individuals)
Red oak 38 123Black oak 60 19Hickory 22 76Pine 59 91White oak 29 50Post oak 43 64Black gum 5 25Chestnut 6 10Holly 7 6Spanish oak 5 11Sweet gum 5 6Poplar 7 9Dogwood 2 9Blackjack oak 4 13Beech 6 5Maple 6 2Hornbeam 4 2

E. Peacock, J. Rodgers, K. Bruce, and J. Gray2008 257
and Porters Creek formation were investigated in more detail (Tables 3–4, Fig. 7). It should be pointed out that the Wilcox represents a larger portion of the study area (64%) than the Porter Creek formation (46%). Both geo-logical formations had similar number of taxa: 28 species occurred within the Porters Creek formation, and 30 species occurred within the Wilcox forma-tion (Table 3). The Porters Creek formation had fewer numbers of individuals, but this was most likely related to the smaller area unit. Moreover, the Porters Creek had a slightly higher Shannon-Wiener index value. Because this diver-sity index is heavily weighted by evenness of individuals, the large number of red oaks in the Wilcox formation (123 individuals; Table 4) may have created an uneven situation that defl ated the index value for this area. Regarding the abundance of important taxa (those for which n > 5), 76% of all red oaks occurred within the Wilcox formation (Table 4). The Wilcox also had higher numbers of hickory, Quercus marilandica Muencch. (blackjack oak), Nyssa sylvatica Marsh. (black gum), Cornus fl orida L. (dogwood), and Quercus falcata Michaux. (Spanish oak; Fig. 7). In contrast, 76% percent of all black oaks occurred within the Porters Creek formation. The Porters Creek formation also had slightly higher numbers of pine and
Figure 7. Relative abundance of the most frequent witness tree species represented in the General Land Offi ce survey data from the Ackerman Unit of the Tombigbee National Forest. Relative abundance data are plotted for both the Wilcox and Porters Creek geological formations.

Southeastern Naturalist Vol.7, No. 2258
post oak. The remaining species were either evenly distributed across the two formations or had such low occurrence values that meaningful compari-sons could not be made (Table 4, Fig. 7). Several species were found only in the Wilcox formation, and these included Prunus persica (L.) Batsch. (peach), Magnolia acuminata L. (cu-cumber tree), Oxydendrum arboreum (L.) DC (sourwood), Chrysopsis lanu-ginosa Small (lynn), Persea sp. (bay), Ulmus rubra Muhl. (slippery elm), and Magnolia sp. (magnolia). The species that were found only in the Porters Creek formation included Quercus bicolor Willd. (swamp oak), Platanus occidentalis L. (sycamore), Morus rubra L. (mulberry), Quercus phellos L. (willow oak), Nyssa sp. (gum), and Salix nigra Marsh. (willow). Swamp oak, willow oak, gum, and willow are more hydric species (USFS 2007a, 2007b), and their presence only within the clay-rich and more acidic soils of the Porter Creek formation further illustrates the geological infl uence on the vegetation. Species distribution and topographic variability. Slope, elevation, and aspect showed a complex relationship to species distribution (Tables 5–7). It should be pointed out that there was not much topographic variability within the study area. Slope value ranges from 0% to 31%; however, the vast major-ity of values (over 90%) had a slope less than 15%. Similarly, elevation only ranged from 90 m to 211 m. Black oak and pine showed a significant preference for the middle slope (Table 5). Post oaks, however, showed a preference for low and middle slope values. This result was somewhat counterintuitive because post oaks are described as being more prevalent on dry ridges (Chester et al. 1987). Red oak, hickory, and white oak showed no significant preference for slope
Table 5. Results of chi square analysis for slope classes among the six most abundant witness tree species. Note: results are for observed frequency of witness-tree species; * = signifi cant at p < 0.05; ns = not signifi cant.
Species
Slope class Red oak Black oak Hickory Pine Post oak White oak
1 (<2%) 42 13 28 29 34 232 (2.1–6%) 32 36 22 57 34 223 (7.1–31%) 41 8 28 31 17 23Signifi cance 0.45 ns 0.00* 0.02* 0.63 ns 0.03* 0.48 ns
Table 6. Results of chi-square analysis for elevation classes among each of the six most com-mon witness-tree species. Note: results are for observed frequency of witness-tree species; * = signifi cant at p < 0.05; ns = not signifi cant.
Species
Elevation class Red oak Black oak Hickory Pine Post oak White oak
Low (90–104 m) 11 5 6 11 11 11Middle (104.1–131 m) 41 24 28 29 27 25Upper middle (131.1–157 m) 39 20 23 51 23 25High (157.1–211 m) 24 8 21 26 24 7Signifi cance 0.00* 0.00* 0.00* 0.003* 0.07 ns 0.01*

E. Peacock, J. Rodgers, K. Bruce, and J. Gray2008 259
class. The results of the cross-tabulation of slope and geological formation indicate that red oaks were more abundant on higher slope classes within the Wilcox formation and were more abundant on lower slope classes with-in the Porters Creek formation (Table 8). The interaction between slope and geological formation was not as clear for the other important taxa. With the exception of post oak, all important taxa showed a signifi cant preference for elevation class (Table 6). Red oak, black oak, hickory, and white oak were more abundant in the middle elevation class while pine was more abundant in the upper middle elevation class. The cross-tabulation of elevation class and geological formation indicated that none of the important taxa occurred within the lowest elevations of the Wilcox formation (Table 9).
Table 7. Results of chi-square analysis for aspect classes among each of the six most common witness-tree species. Note * = signifi cant at P < 0.05; ns = not signifi cant.
Aspect Red oak Black oak Hickory Pine White oak Post oak
North 16 8 10 13 9 13Northeast 14 7 11 14 11 9East 23 3 13 21 13 20Southeast 9 7 4 11 7 10South 15 7 6 15 7 5Southwest 18 6 10 20 5 9West 6 6 12 10 8 6Northwest 14 13 12 13 8 13Signifi cance 0.07 ns 0.36 ns 0.42 ns 0.378 ns 0.64 ns 0.04*
Table 8. Cross-tabulation of slope class with geological formation. W = Wilcox and PC = Porters Creek.
Steeper Low slope (<2%) Medium slope (2.1%–6%) slope (6.1%–31%)
W PC W PC W PC
Red oak 26 16 27 5 36 5Black oak 4 9 9 27 1 7Hickory 19 9 18 4 25 5Pine 13 16 29 28 26 5White oak 11 12 12 10 20 3Post oak 20 14 18 16 13 4
Table 9. Cross-tabulation of elevation class with geological formation. W = Wilcox and PC = Porters Creek.
Low elevation Middle elevation Upper Middle elevation High elevation (90–104 m) (104.1–131 m) (131.1–157 m) (157.1–211 m)
W PC W PC W PC W PC
Red oak 0 11 27 14 38 1 24 0Black oak 0 5 5 19 4 16 5 3Hickory 0 6 18 10 21 2 21 0Pine 0 11 11 18 35 16 22 4White oak 0 11 13 12 23 2 7 0Post oak 0 11 12 15 16 7 23 1

Southeastern Naturalist Vol.7, No. 2260
In contrast, only a few individuals were present within the upper elevation of the Porters Creek. It is not clear at this time if the absence of species within the lower Wilcox or upper Porters Creek is an artifact of the GLO sampling frame. Aspect was the least important topographic variable, and only post oak had a signifi cant result (Table 7). Post oak appears to prefer the eastern and northern aspects within the study area.
Discussion
Accounts of 18th- and 19th-century landscape conditions in north-cen-tral Mississippi range from traveler’s accounts and other historical records (e.g., Nutt 1805) to broad-scale, scientifi c descriptions (Hilgard 1860). In-terpreting the former is something of an art form, but previous studies have indicated that such historic descriptions are, in fact, reasonably accurate (e.g., Brewer 2001, Peacock 1992a, Peacock and Miller 1990). Hilgard’s (1860:301) description of the hill country of northern Winston County as “characterized by a growth of White, Black and Red Oak, stout Post Oak, a good deal of Hickory, and sometimes Short-leaf Pine” is in general accord with the GLO data from the Ackerman Unit. Historical records, including GLO notes, may be interpreted in differ-ent ways, however (e.g., Johnson 1990, Peacock 1992a, Peacock and Miller 1990). For example, Johnson (1988:59) suggested that “the acidic sands of the North Central Hills were covered primarily in pine.” This statement con-trasts with the fi ndings of the current study and with an earlier study of GLO notes and a botanical survey of old growth forests in the North Central Hills by Brewer (2001). Brewer compiled witness-tree data from two townships in Lafayette County and found a hardwood-dominated early 19th-century for-est, with blackjack oak, black oak, and post oak being especially common; red oak also was common, although it varied in abundance spatially (Brewer 2001). His results differ from ours mainly in the higher proportion of black-jack oak reported; such variability within the province (see also Hilgard 1860:300–301) is worthy of further study. The results of the nearest neighbor analysis, the point-distribution maps, and the Poisson probability distributions clearly show that red oak and black oak distribution patterns within the Ackerman Unit of the Tombigbee National Forest correspond with geological formation. Black oaks prefer rich, moist, acidic, and well-drained soils. The Porters Creek formation may be more suited to black oak because it is very clay-rich and acidic, especially where the North Central Hills transition to the Flat-woods along the eastern margin of the Unit. Red oaks, in contrast, tolerate a wide range of soil types, but generally prefer loam, silt, sandy loam, and sandy soil textures. The preference of red oak for the coarser soil textures may explain its higher abundance on the Wilcox formation. The distinc-tion between the Wilcox and Porters Creek formations were also apparent within the pine and hickory data; however, this separation was not nearly

E. Peacock, J. Rodgers, K. Bruce, and J. Gray2008 261
as sharp as with the red and black oaks. The other taxa did not show a clear preference for a particular geological formation. Topographic variables appear to have had some infl uence on vegeta-tion patterns. Several species showed preference for slope and/or elevation type, yet it is diffi cult to draw clear interpretations of this data. The multiple signifi cances with elevation, for example, are somewhat counterintuitive as the slight elevation differences on the Unit should not pose any limitation to species distributions. Similarly, slope class in relation to species distribu-tion was somewhat opaque. The preference of red oak for lower slopes in the Porters Creek and steeper slopes in the Wilcox formations was the only meaningful result. However the ecological signifi cance of this is diffi cult to determine because the lower slope and steeper slope classes only differed by 10 individuals. Thus, the topographic infl uence does not seem to be as instru-mental in shaping the distribution patterns of the important taxa within the study area. The main conclusion borne out of the GLO data is that geological formation had primary infl uence on vegetation patterns.
Conclusions
Based on the GLO notes, the Ackerman Unit area in the early 19th century can be characterized as one of mixed hardwoods with a generally distributed pine component. Based on archaeological data, this represents a picture of conditions as they existed in the near-absence of human settlement over a period of many centuries (cf. Brewer 2001). This is not to say that human ac-tions did not alter the forest; in particular, the role of burning by Indians in this sparsely settled region following the Woodland period is not known at present, and provides an interesting avenue for future research (cf. Vale 2002). Brewer (2001), for example, has argued that the “presettlement” forests of the North Central Hills in Lafayette County, north Mississippi, were more open than the few remaining old-growth forests of today, something he attributes to modern fi re suppression. He points out that his study area was located some 70 km west of the major area of Chickasaw Indian settlement in the Black Prairie physio-graphic province (Johnson 2000), and that there are records of the Chickasaw burning the landscape (Nairne 1988). A similar concentration of Protohistoric to early Historic-period aboriginal sites exists in the vicinity of Starkville, ap-proximately 24 km northeast of the Ackerman Unit (Atkinson 1979, Rafferty 2003). Thus, while there is little evidence for actual occupation of the study area between ca. A.D. 1000 and the early 19th century, the landscape may have been manipulated in ways that bear further investigation. At this point, how-ever, it can be argued that the GLO data for the Ackerman Unit represent as accurate a picture of undisturbed woodland as is obtainable in the region. The witness-tree data therefore represent one set of historically defensible baseline conditions for forest restoration. An equivalent amount of archaeological survey has been carried out by the senior author on other lands in north-central Mississippi, including the Trace Unit of the Tombigbee National Forest and the Holly Springs
Southeastern Naturalist Vol.7, No. 2262
and Yalobusha Units of the Holly Springs National Forest (e.g., Peacock 1992b, 1992c, 1993a, 1993b, 1993c, 1993d, 1995b). The archaeological settlement patterns in those areas are similar to what has been described for the Ackerman Unit, with a relative lack of settlement prior to the Wood-land period, intensive settlement during the Woodland, and a dramatic de-crease in sites at the beginning of the Mississippian period (Peacock 1997). These findings are mirrored in other studies (Ford 1980, 1981, 1989, 1990; Johnson 1984, 1988). For example, Johnson (1988) compiled data from a number of surveys and excavation projects in north Mississippi. Although only limited data from the North Central Hills were available at that time, no Mississippian sites are represented from that province in his study. Morgan (1996) compiled data on diagnostic artifacts using site files at the Mississippi Department of Archives and History. His research universe was composed of 40 counties making up approximately one-third of the state, from north- and east-central Mississippi west to the Mississippi River and essentially encompassing the North Central Hills. One class of site he looked for was “all sites falling within a twelfth- through seventeenth-cen-tury [A.D.] timeframe, including Mississippi, Plaquemine, and Protohistor-ic cultural manifestations” (Morgan 1996:2). His findings led him to state that, “at least one fact is obvious: that occupation in the central portion of the state [i.e., the North Central Hills] is virtually nonexistent throughout the period,” and that “present evidence is probably ample for documenting that this was an area of meager aboriginal occupation” (Morgan 1996:5). Also similar to the Ackerman Unit, Historic-period settlement in the up-lands of north-central Mississippi was limited before the mid-19th century (e.g., Peacock 1992a, 1992b, 1993a, 1993b, 1993c, 1993d, 1995b). Based on this information, we would argue that GLO data can provide an accurate baseline for minimally disturbed forest conditions throughout the hill belts of interior Mississippi. It is questionable whether forest management practices can be structured so as to reconstruct those baseline conditions, as there has been enormous soil loss in the North Central Hills and other upland provinces in Mississippi since the mid-19th century (Grissenger et al. 1982). It could be argued that a range of target ecological conditions should be the goal of a balanced resource manage-ment program, if maintaining biodiversity is the key goal (Minnis and Elisens 2000, Peacock 1998). Whatever path is chosen, the archaeological settlement pattern and GLO data combine to provide an accurate picture of what mature tree cover in the hills of Mississippi was like in the absence of signifi cant hu-man settlement. This work adds to a growing number of studies that explore the implications of historic forest conditions for resource management in the state (e.g., Aquilani 2006, Brewer et al. 2000).
Acknowledgments
We would like to thank John Baswell, District Ranger on the Tombigbee National Forest, and Joe Seger, Director of the Cobb Institute of Archaeology, Mississippi State University, for their support for this project. We also would like to thank the Mississippi Museum of Natural Science for providing copies of reports.

E. Peacock, J. Rodgers, K. Bruce, and J. Gray2008 263
Literature Cited
Adkins, H.G. 1979. The historical geography of extinct towns in Mississippi. Pp. 123–152, In P.W. Prenshaw and J.O. McKee (Eds.). Sense of Place: Mississippi. University Press of Mississippi, Jackson, MS.
Anderson, R.C., and M.R. Anderson. 1975. The presettlement vegetation of William-son County, Illinois. Castanea 40:345–363.
Aquilani, S.M. 2006. Bird communities in silvicultural fragments of Holly Springs National Forest, Mississippi. Southeastern Naturalist 5:135–148.
Atkinson, J.R. 1979. A historic contact Indian settlement in Oktibbeha County, Mis-sissippi. Journal of Alabama Archaeology 25(1):61–82.
Barbour, M.G., J.H. Burk, W.D. Pitts, F.S. Gilliam, and M.W. Schwartz. 1999. Terres-trial Plant Ecology, Third Edition. Addison Wesley Longman, Inc., Menlo Park, CA.
Beyer H.L. 2004. Hawth’s analysis tools for ArcGIS. Available online at http://www.spatialecology.com. Accessed November 1, 2007.
Blitz, J.H. 1984. A cultural resources survey in the Tombigbee National Forest, Mis-sissippi. USDA Forest Service, Jackson, MS.
Bourdo, E.A. 1956. A review of the General Land Offi ce survey and its use in quan-titative studies of former forests. Ecology 37:754–768.
Bragg, D.C. 2003. Natural presettlement features of the Ashley County, Arkansas area. American Midland Naturalist 149:1–120.
Brewer, J.S. 2001. Current and presettlement tree species composition on some upland forests in northern Mississippi. Journal of the Torrey Botanical Society 128:332–349.
Brewer, J.S., S.M. Aquilani, and M.L. Warren. 2000. A review of research on upland oak-pine communities in the Little Tallahatchie Experimental Forest and adja-cent Holly Springs National Forest. Report submitted to the Forest Hydrology Laboratory, Southern Forest Experiment Station and the Holly Springs National Forest, Oxford, MS.
Burt, R. 1992. The survey of Mississippi’s state, Indian, and township Boundaries. Mississippi Association of Professional Surveyors, Mississippi State University, Starkville, MS.
Carroll, T.B. 1983. Historical Sketches of Oktibbeha County (Mississippi). Sulli-van’s Printing, West Point, MS. Originally printed in 1931 by the Dixie Press, Gulfport, MS.
Chester, E.W, R.J. Jensen, L.J. Schibig, and S. Simoni. 1987. The Nut Trees of Land Between the Lakes. The Center for Field Biology of LBL, Austin Peay State University, Clarksville, TN.
Coleman, J.P. 1973. Choctaw County Chronicles: A History of Choctaw County, Mississippi. Privately published, Ackerman, MS.
Delcourt, H.R. 1975. Reconstructing the forest primeval, West Feliciana Parish. Lou-siana State Univesity Museum of Geosiences. Mélanges Series No. 10. 13 pp.
Environmental Systems Resource Institute, Inc (ESRI). 2005. ArcGIS Version 9.1, Redlands, CA.
Farley, S.C., R.E. Masters, and D.M. Engle. 2002. Riparian landscape change in central Oklahoma 1872–1991. Proceedings of the Oklahoma Academy of Sci-ence 82:57–71.
Fickle, J.E. 2001. Mississippi Forests and Forestry. University Press of Mississippi, Jackson, MS.
Fisk, G. 1832. Instructions for Surveying in the State of Mississippi. Natchez: R. Semple. Reprinted in 1992 by the Mississippi Association of Professional Sur-veyors, Mississippi State University, Starkville, MS.
Ford, J.L. 1980. Alas, poor Womack! Mississippi Archaeology 25(2):26–31.
Southeastern Naturalist Vol.7, No. 2264
Ford, J.L. 1981. Time and temper in the North Central Hills of Mississippi. Journal of Alabama Archaeology 27(1):57–71.
Ford, J.L. 1989. Time and temper meets trend and tradition. Mississippi Archaeology 24(1):1–16.
Ford, J.L. 1990. The Tchula connection: Early woodland culture and burial mounds in north Mississippi. Southeastern Archaeology 9:103–115.
Foster III, H.T., B. Black, and M.D. Abrams. 2004. A witness-tree analysis of the ef-fects of Native American Indians on the pre-European settlement forests in east-central Alabama. Human Ecology 32:27–47.
Grissenger, E.H., J.B. Murphy, and W.C. Little. 1982. Late-Quaternary valley fi ll de-posits in north-central Mississippi. Southeastern Geology 23:147–162.
Hilgard, E. 1860. Report on the geology and agriculture of the state of Mississippi. E. Banksdale, State Printer, Jackson, MS.
Jenks, G.F., and F. C. Caspall. 1971. Error in choroplethic maps: Defi nition, measure-ment, reduction. Annals of the Association of American Geographers 61:217–244.
Johannessen, S. 1993 Farmers of the Late Woodland. Pp. 57–77, In C.M. Scarry (Ed.). Foraging and Farming in the Eastern Woodlands. University Press of Florida, Gainesville, FL.
Johnson, J.K. 1984. Prehistoric settlement in the upper Yocona drainage. Mississippi Archaeology 19(2):13–23.
Johnson, J.K. 1988. Woodland settlement in northeastern Mississippi: The Miller tradition. Pp. 49–59, In R.C. Mainfort, Jr. (Ed.). Middle Woodland Settlement and Ceremonialism in the Mid-South and Lower Mississippi Valley. Mississippi De-partment of Archives and History, Jackson, MS. Archaeological Report 22.
Johnson, J.K. 1990. Cedar glades and Protohistoric settlement: A reply to Peacock and Miller. Mississippi Archaeology 25(2):58–62.
Johnson, J.K. 2000. The Chickasaws. Pp. 85–121, In B.G. McEwan (Ed.). Indians of the Greater Southeast: Historical Archaeology and Ethnohistory. University Press of Florida, Gainesville, FL.
Johnson, J.K., and J.T. Sparks. 1986. Protohistoric settlement patterns in northeastern Mississippi. Pp. 64–87, In D.H. Dye and R.C. Brister (Eds.). The Protohistoric Pe-riod in the Mid-South. Mississippi Department of Archives and History. Archaeo-logical Report 18. Jackson, MS.
Johnson, J.K., G.R. Lehmann, J.R. Atkinson, and A.B. Shea. 1991. Protohistoric Chickasaw settlement patterns and the De Soto route in northeast Mississippi. Report submitted to the National Endowment for the Humanities by the Center for Archaeological Research, University of Mississippi. Oxford, MS.
Lipo, C.P., and R.C. Dunnell. In Press. Prehistoric settlement in the Lower Missis-sippi Valley: A critical review. In J. Rafferty and E. Peacock (Eds.). Time’s River: Archaeological Syntheses from the Lower Mississippi River Valley. University of Alabama Press, Tuscaloosa, AL.
Mellen, F.F., and T.E. McCutcheon. 1939. Winston County mineral resources. Missis-sippi State Geological Survey, Bulletin 38. University, MS.
Minnis, P.E., and W.J. Elisens. 2000. Biodiversity and Native America. University of Oklahoma Press, Norman, OK.
Mississippi Automated Resource Information Systems (MARIS). 2007. MARIS technical center website. Available online at www.maris.state.ms.us. Accessed November 1, 2007.
Moore, J.H. 1988. The Emergence of the Cotton Kingdom in the Old Southwest: Mis-sissippi 1770–1860. Louisiana State University Press, Baton Rouge, LA.
Moore, W.H. 1969. Geological map of Mississippi. Mercury Maps Inc., Jackson, MS.Morgan, D. 1996. The Mississippi De Soto trail mapping project. Mississippi Depart-
ment of Archives and History, Jackson, MS.

E. Peacock, J. Rodgers, K. Bruce, and J. Gray2008 265
Nairne, T. 1988. Nairne’s Muskhogean Journals: The 1708 Expedition to the Missis-sippi River. (A. Moore [Ed.].) University Press of Mississippi, Jackson, MS.
Nutt, R. 1805. Diary of a tour through the western and southern parts of the United States in America. (J.D. Jennings [Ed.].) Journal of Mississippi History 9:34–61.
Parrish, J.L. 2006. An archaeological investigation of four Woodland-period sites in the North Central Hills Physiographic region of Mississippi: 22CH653, 22WI536, 22WI588, and 22WI670. M.A. Thesis. Mississippi State University, Starkville, MS.
Peacock, E. 1992a. Some additional notes on forest reconstruction in the Black Belt. Mississippi Archaeology 27(1):1–18.
Peacock, E. 1992b. A cultural resources survey of selected timber tracts in the Holly Springs National Forest, Marshall County, Mississippi. USDA Forest Service report on fi le, Mississippi Department of Archives and History, Jackson, MS.
Peacock, E. 1992c. A cultural resources survey of selected timber stands in Compart-ment 33, Holly Springs National Forest, Marshall County, Mississippi. USDA Forest Service report on fi le, Mississippi Department of Archives and History, Jackson, MS.
Peacock, E. 1993a. A cultural resources survey of selected timber stands in Compart-ment 130, Holly Springs National Forest, Yalobusha County, Mississippi. USDA Forest Service report on fi le, Mississippi Department of Archives and History, Jackson, MS.
Peacock, E. 1993b. A cultural resources survey of selected timber stands in Compart-ment 37, Holly Springs National Forest, Benton and Marshall Counties, Missis-sippi. USDA Forest Service report on fi le, Mississippi Department of Archives and History, Jackson, MS.
Peacock, E. 1993c. A cultural resources survey of a proposed land exchange in Com-partment 24, Holly Springs National Forest, Benton County, Mississippi. USDA Forest Service report on fi le, Mississippi Department of Archives and History, Jackson, MS.
Peacock, E. 1993d. A cultural resources survey of selected timber stands in Compart-ment 43, Holly Springs National Forest, Benton and Marshall Counties, Missis-sippi. USDA Forest Service report on fi le, Mississippi Department of Archives and History, Jackson, MS.
Peacock, E. 1995a. Shovel-test screening and survey methodology: A fi eld study from the Tombigbee National Forest, North Mississippi. USDA Forest Service, Jackson, MS.
Peacock, E. 1995b. A fi nal report on heritage resource surveys of ice-damaged tim-ber tracts on the Holly Springs and Tombigbee National Forests, Yalobusha and Chickasaw counties, Mississippi. USDA Forest Service report on fi le, Missis-sippi Department of Archives and History, Jackson, MS.
Peacock, E. 1996. Archaeological site survey in wooded environments: A fi eld study from the Tombigbee National Forest, north-central Mississippi. North American Archaeologist 17:61–79.
Peacock, E. 1997. Woodland ceramic affi liations and settlement pattern change in the North Central Hills of Mississippi. Midcontinental Journal of Archaeology 22:237–261.
Peacock, E. 1998. Historical and applied perspectives on prehistoric land use in eastern North America. Environment and History 4:1–29.
Peacock, E. 2003. Excavations at Stinking Water (22WI515/516), a prehistoric habitation site in the North Central Hills physiographic province of Mississippi. Mississippi Archaeology 38(1):3–91.

Southeastern Naturalist Vol.7, No. 2266
Peacock, E., and D. Fant. 2002. Biomantle formation and artifact translocation in upland sandy soils: An example from the Holly Springs National Forest, north-central Mississippi. Geoarchaeology: An International Journal 17:91–114.
Peacock, E., and W.F. Miller. 1990. Protohistoric settlement patterns in northeast Mis-sissippi and the cedar-glade hypothesis. Mississippi Archaeology 25(2):45–57.
Peacock, E., and A.J. Patrick. 1997. Site survey and land-records research: A com-parison of two methods for locating and characterizing Historic-period sites on the Tombigbee National Forest, Mississippi. Mississippi Archaeology 32:1–26.
Perkins, T.E., and G.R. Matlack. 2002. Human-generated pattern in commercial forests of southern Mississippi and consequences for the spread of pests and pathogens. Forest Ecology and Management 157:143–154.
Phelps, D.A. 1950. The Robinson Road. Journal of Mississippi History 3:155–226.Rafferty, J.E. 1979. Cultural resource reconnaissance and project-oriented survey,
Noxubee National Wildlife Refuge, Mississippi. Mississippi State University, Department of Anthropology. Report submitted to the National Park Service, Interagency Archeological Services, Atlanta, GA.
Rafferty, J.E. 1980. Surface collections and settlement patterns in the Central Tom-bigbee Valley. Southeastern Archaeological Conference Bulletin 22:90–94.
Rafferty, J.E. 2002. Woodland period settlement patterning in the northern Gulf Coastal Plain of Alabama, Mississippi, and Tennessee. Pp. 204–227, In D.G. Anderson and R.C. Mainfort, Jr. (Eds.). The Woodland Southeast. University of Alabama Press, Tuscaloosa, AL.
Rafferty, J.E. 2003. Prehistoric settlement patterning on the Mississippi Black Prai-rie. Pp. 167–193, In E. Peacock and T. Schauwecker (Eds.). Blackland Prairies of the Gulf Coastal Plain: Nature, Culture, and Sustainability. University of Ala-bama Press, Tuscaloosa, AL.
Rafferty, J.E. In Press. Settlement patterns, occupations, and fi eld methods. In J. Rafferty and E. Peacock (Eds.). Time’s River: Archaeological Syntheses from the Lower Mississippi River Valley. University of Alabama Press, Tuacaloosa, AL.
Rafferty, J.E., and E. Peacock. 2007. The spread of shell tempering in the Missis-sippi Black Prairie. Paper presented at the 72nd Annual Meeting of the Society for American Archaeology, Austin, TX.
Scarry, C.M. (Ed.). 1993. Foraging and Farming in the Eastern Woodlands. Univer-sity Press of Florida, Gainesville, FL.
Silbernagel, J., S.R. Martin, M.R. Gale, and J. Chen. 1997. Prehistoric, historic, and present settlement patterns related to ecological hierarchy in the eastern Upper Peninsula of Michigan, USA. Landscape Ecology 12:233–240.
US Forest Service (USFS). 2007a. Silvics of North America, volume 2: Hardwoods. Available online at http://www.na.fs.fed.us/spfo/pubs/silvics_manual/table_of_contents.htm). Accessed November 1, 2007.
US Forest Service (USFS). 2007b. UCONN Plant Data base. Available online at http://www.hort.uconn. edu/plants/. Accessed November 1, 2007.
Vale, T.R. (Ed.). 2002. Fire, Native Peoples, and the Natural Landscape. Island Press, Washington, DC.
Vestal, F.E., and T.E. McCutcheon. 1943. Choctaw county mineral resources. Mis-sissippi State Geological Survey. University, MS. Bulletin 52.
Whitney, G.G., and J.P. DeCant. 2001. Government Land Offi ce surveys and other early land surveys. Pp. 147–172, In D. Egan and E.A. Howell (Eds.). The Histori-cal Ecology Handbook. Island Press, Washington, DC.
Williams, G.I., Jr. 1993. Environmental setting. Pp. 15–28, In A.M. Early (Ed.). Caddoan Saltmakers in the Ouachita Valley: The Hardaman Site. Arkansas Ar-cheological Research Series No. 43. Fayetteville, AR.