The efficiency of endoreversible heat engines with heat leak
Upload
khangminh22Category
view
0download
0
VILNIUS COMBINED HEAT AND POWER PLANT
ENVIRONMENTAL IMPACT ASSESSMENT REPORT
BOOK 1
2015
COMPOSITION OF THE ENVIRONMENTAL IMPACT ASSESSMENT REPORT
BOOK 1 EIA REPORT TEXT
BOOK 2 ANNEXES TO THE EIA REPORT
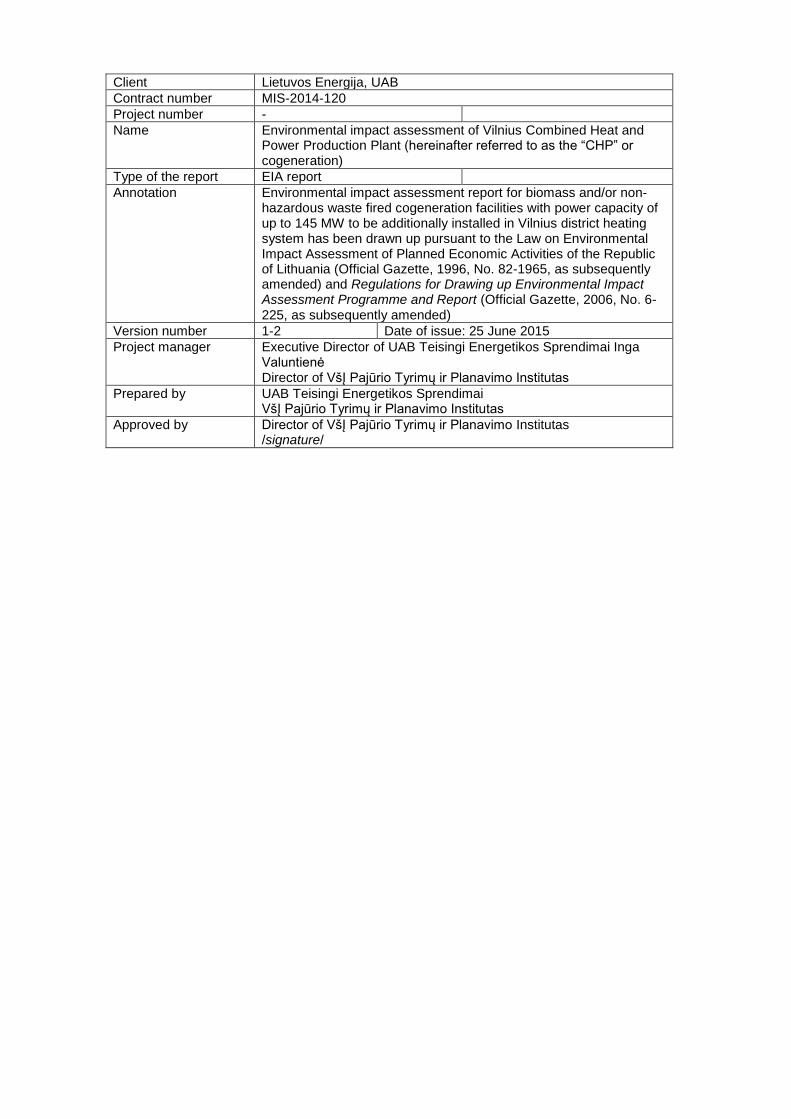
Client Lietuvos Energija, UAB
Contract number MIS-2014-120
Project number -
Name Environmental impact assessment of Vilnius Combined Heat and Power Production Plant (hereinafter referred to as the “CHP” or cogeneration)
Type of the report EIA report
Annotation Environmental impact assessment report for biomass and/or non-hazardous waste fired cogeneration facilities with power capacity of up to 145 MW to be additionally installed in Vilnius district heating system has been drawn up pursuant to the Law on Environmental Impact Assessment of Planned Economic Activities of the Republic of Lithuania (Official Gazette, 1996, No. 82-1965, as subsequently amended) and Regulations for Drawing up Environmental Impact Assessment Programme and Report (Official Gazette, 2006, No. 6-225, as subsequently amended)
Version number 1-2 Date of issue: 25 June 2015
Project manager Executive Director of UAB Teisingi Energetikos Sprendimai Inga Valuntienė Director of VšĮ Pajūrio Tyrimų ir Planavimo Institutas
Prepared by UAB Teisingi Energetikos Sprendimai VšĮ Pajūrio Tyrimų ir Planavimo Institutas
Approved by Director of VšĮ Pajūrio Tyrimų ir Planavimo Institutas /signature/
THE ENVIRONMENTAL IMPACT ASSESSMENT REPORT PREPARED BY:
Prepared by Contact details Prepared chapters
Signature
Feliksas Anusauskas VšĮ PTPI Tel: 8 46 398835 E-mail: [email protected]
6 All
/signature/
Rosita Milerienė VšĮ PTPI Tel: 8 46 398848 E-mail: [email protected]
All /signature/
Inga Valuntienė UAB Teisingi Energetikos Sprendimai Tel: 8 655 70743 E-mail: [email protected]
1.4.1, 2, 4.7 /signature/
Robertas Puodžius UAB Teisingi Energetikos Sprendimai Ttel: 8 612 99992 E-mail: [email protected]
2 /signature/
Goa Zobėlaitė - Noreikienė
VšĮ PTPI Tel: 8 46 398835 E-mail: [email protected]
2.2, 4.2, 6 /signature/
Eleonora Mataitienė VšĮ PTPI Tel: 8 46 398842 E-mail: eleonora@[email protected]
3, 4.1, 4.3, 4.8 /signature/
Rimantė Guobytė VšĮ PTPI Tel: 8 52 335323 E-mail: [email protected]
4.4 /signature/
Aušra Kungienė VšĮ PTPI Tel: 8 46 398835 E-mail: [email protected]
4.7, 4.9 /signature/
Darius Pavolis VšĮ PTPI Tel: 8 46 398835 E-mail: [email protected]
4.2, 4.9 /signature/
Arūnas Balčiūnas VšĮ PTPI Tel: 8 46 398848 E-mail: [email protected]
4.6 /signature/
Raimonda Kybrancienė VšĮ PTPI Tel: 8 46 398842 E-mail: [email protected]
4.5 /signature/
Dominykas Preibys VšĮ PTPI Tel: 8 46 398842 E-mail: [email protected]
Graphic information
/signature/
Copies of qualification documents of compilers of the EIA Report are presented in Annex No 21.
CONTENTS
Introduction........................................................................................................................ 16
1. General data .................................................................................................................. 18
1.1. Organizer (client) of the planned economic activity ................................................ 18
1.2. Compiler of documents of the environmental impact assessment of the planned economic activity ........................................................................................................... 18
1.3 Information on the planned economic activity .......................................................... 19
1.3.1. Significance of the Vilnius Combined Heat and Power Plant project ................ 19
1.3.2. Alternatives of the planned economic activity ................................................... 21
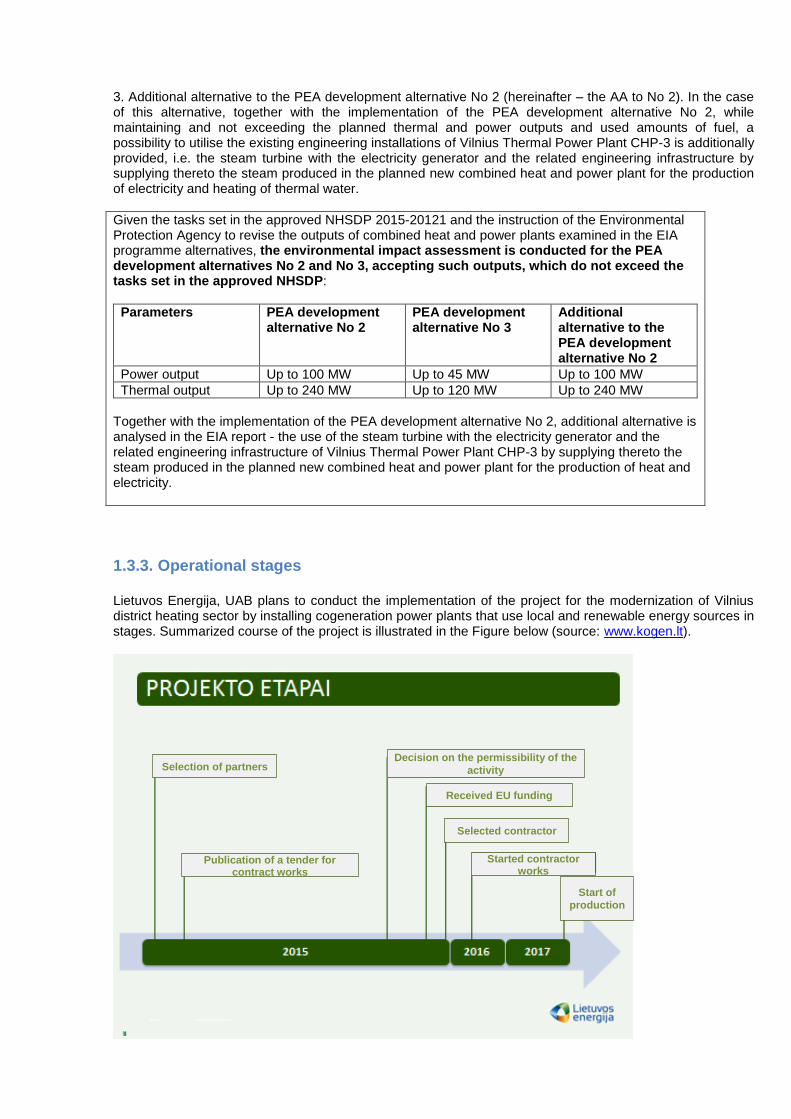
1.3.3. Operational stages ........................................................................................... 23
1.3.4. Connection of the environmental impact assessment programme and report preparation to the planning and design stages ........................................................... 24
1.3.5. Data on the produce: heat and electricity production ....................................... 24
1.4. Fuel and energy consumption ................................................................................. 25
1.4.1. Information on waste burnt in the Vilnius Combined Heat and Power Plant ..... 25
1.4.2. Information on biomass planned to be used in the Vilnius Combined Heat and Power Plant ................................................................................................................ 31
1.4.3. Information on the planned combustion of wastewater sludge in the Vilnius Combined Heat and Power Plant ............................................................................... 33
1.4.4. Information on natural gas planned to be used in the Vilnius Combined Heat and Power Plant ......................................................................................................... 33
1.4.5. Quantities of waste and other fuel planned to be burnt in the Vilnius Combined Heat and Power Plant ................................................................................................ 34
1.4.6 Energy consumption .......................................................................................... 34
1.5. Data on used chemical substances and preparations ............................................ 35
1.6 Information on the location of the planned economic activity ................................... 37
1.6.1. Geographic and administrative situation of the examined location ................... 37
1.6.2. Examined alternative locations and main reasons for the selection ................. 38
1.6.3. Existing land use, environmental protection and use mode ............................. 41
1.6.4. Applicable territory planning documents and their solutions ............................. 41
1.6.5. Natural, historic and cultural valuables present in the territory ......................... 42
1.6.6. Existing infrastructure and access roads .......................................................... 44
1.6.7. Planned connection to the existing engineering infrastructure networks .......... 45
2 Technological processes ................................................................................................ 45
2.1 Description of technological processes to be used in Vilnius Combined Heat and Power Plant ................................................................................................................... 46
2.1.1 PEA Development Alternative No 2................................................................... 48
2.1.2 PEA Development Alternative No 3................................................................... 55
2.1.3 Additional Alternative to PEA Development Alternative No 2 ............................ 55
2.2 Comparison of the proposed techniques and equipment with the best available techniques ..................................................................................................................... 56
3 Waste ............................................................................................................................. 70
3.1 Waste incineration ................................................................................................... 70
3.2 Waste generated during activity ............................................................................... 71
3.3 Management of waste generated and the possibility of reuse of waste ................... 74
4 The potential impact on various components of the environment and measures to reduce environmental impact ........................................................................................................ 76
4.1 Water ....................................................................................................................... 76
4.1.1 Surface water bodies ......................................................................................... 76
4.1.2 Groundwater and interlayer water ..................................................................... 78
4.1.3 The existing water supply and wastewater management .................................. 80
4.1.4 Groundwater monitoring .................................................................................... 82
4.1.5 Use of Water ..................................................................................................... 84
4.1.6 Waste water treatment ...................................................................................... 86
4.1.7 Potential impact on water bodies ...................................................................... 90
4.1.8 Measures of impact reduction and protection of water bodies .......................... 90
4.2 Ambient air ............................................................................................................... 91
4.2.1 Information about the location ........................................................................... 91
4.2.2 Pollutants emitted into the ambient air .............................................................. 92
4.2.3 Ambient air pollution sources ............................................................................ 93
4.2.4 Environmental air pollution forecast ................................................................ 110
4.2.5 Impact mitigation measures ............................................................................ 114
4.3. Soil ............................................................................................................................ 4
4.3.1. ........................................................................................................................... 4
General characteristics of soil types ............................................................................. 4
4.3.2. Characteristics and chemical status of the PEA area ......................................... 5
4.3.3. Potential effects .................................................................................................. 8
4.3.4. Mitigation measures ........................................................................................... 8
4.4. The underground ...................................................................................................... 9
4.4.1. Characteristics of the underground structure ..................................................... 9
4.4.2. Potential effects on geological components, subsoil water and groundwater ... 18
4.4.3. Applicable underground and groundwater protection measures ...................... 18
4.5. Biological Diversity .................................................................................................. 19
4.5.1. Current Situation .............................................................................................. 19
4.5.2. Potential (Anticipated) Impact on the Biological Diversity and Protected Areas 23
4.5.3. Planned Mitigation Measures to Reduce Impact on Biodiversity ...................... 23
4.6. Landscape .............................................................................................................. 23
4.6.1. Current Situation .............................................................................................. 23
4.6.2. Potential (Estimated) Impact on the Landscape ............................................... 27
4.6.3. Mitigation Measures to Reduce Potential Impact on Landscape ...................... 29
4.7. Social – Economic Environment ............................................................................. 31
4.7.1. Current Social-Economic Environment ............................................................. 31
4.7.2. Potential Impact of PEA on Economic Conditions, Labour Market, Investments, and Trends of Changing Heat Prices ......................................................................... 35
4.7.3. Possible Direct and Indirect Effect on Other Industries .................................... 46
4.7.4. Possible Conflicts between the Planned Economic Activity and the Public ...... 48
4.7.5. Mitigation Measures to Reduce the Impact on Social and Economic Environment ............................................................................................................... 48
4.8. Cultural Values ....................................................................................................... 49
4.8.1. Information on Cultural Heritage Values and Objects in the Neighbouring Territories ................................................................................................................... 49
4.8.2. Potential Impact and Mitigation Measures ........................................................ 51
4.9. Public Health ........................................................................................................... 52
4.9.1. The Nearest Residential Environment and Public Purpose Objects ................. 52
4.9.2. Recreation Territories ....................................................................................... 55
4.9.3. Current State of Public Health .......................................................................... 55
4.9.4. Analysis of Factors Having Effect on Health .................................................... 64
4.9.5. Description of the Methods Used for the Health Impact Assessment. Possible Inaccuracies. .............................................................................................................. 83
4.9.6. Sanitary Protection Zone .................................................................................. 83
4.9.7. Conclusions ...................................................................................................... 87
5 Analysis of Alternatives .................................................................................................. 89
5.1 Alternatives for Development of the Planned Activity of Vilnius Combined Heat and Power Plant in Question ................................................................................................ 90
5.2 Alternatives for Location .......................................................................................... 91
5.3. Comparison of the Alternatives According to the Impact on Different Environmental Components .................................................................................................................. 91
5.4 Conclusions of the Analysis of Alternatives ............................................................. 95
6 Monitoring ....................................................................................................................... 97
6.1 Regulation of Conducting the Environmental Monitoring by the Law ....................... 97
6.2. Monitoring of Technological Processes .................................................................. 97
6.3 Monitoring of Pollution Emissions/Discharges from Sources of Pollution ................ 99
6.3.1 Monitoring of Ambient Air Pollution ................................................................... 99
6.3.2 Monitoring of Effluent ...................................................................................... 111
6.4 Monitoring of the Impact on the Quality of the Environment (Impact on the Environment) ............................................................................................................... 112
6.4.1. Monitoring of the Impact on the Surface Water and Groundwater ................. 112
6.4.2. Monitoring of the Impact on the Quality of the Ambient Air ............................ 112
7 Risk Analysis and Assessment ..................................................................................... 115
7.1 Purpose of the Risk Analysis and Risk Assessment Methodology ........................ 115
7.2 Possibilities and Reasons for Risks of Emergency Situations ............................... 115
7.2.1 Reasons for Accidents in Technological Facilities ........................................... 116
7.2.2 Used Raw Materials, Chemical Substances, Hazard Characteristics Thereof 117
7.2.3 Identification of Possible Hazards and Risk Factors ........................................ 117
7.3 Significant Risk Factors ......................................................................................... 123
7.4 Risk Assessment ................................................................................................... 129
7.5 Implementation of the ALARP Principle ................................................................. 129
7.6. Other Risk Reduction Measures ........................................................................... 130
7.6.1 Measures Recommended in the Course of Drawing up of the Design ............ 130
7.6.2 Measures Recommended in the Course of Operation of the Subject ............. 132
7.7 Risk Assessment Conclusions ............................................................................... 134
8. Other information ......................................................................................................... 136
8.1. Information on the Environmental Impact Assessment forecasting and measurement methods ................................................................................................ 136
8.2. Information on potential significant adverse effects of the Planned Economic Activity on the environment of other countries ......................................................................... 137
8.3. Public information and assessment of public opinion............................................ 137
9. Summary ..................................................................................................................... 139
Literature ......................................................................................................................... 151
LIST OF ANNEXES TO THE EIA REPORT. BOOK II Annex 1. EIA Programme and approval letters of entities Annex 2. Letter No (17-0)-D8-1310 of the Ministry of Environment of 20 February 2015 On the Approval of Quantities of Waste for the Incineration Annex 3. Letter No (17-1)-D8-1477 of the Ministry of Environment of the Republic of Lithuania On the Provision of Information Annex 4. Letter No (17-2)D8-2506 of the Ministry of Environment of the Republic of Lithuania of 2 April 2015 On the Quantities of Dried Sludge Annex 5. Safety data sheets of chemical substances Annex 6. Excerpt of the land plot cadastral No 0101/0067:21 from the central databank of SE Enterprise Centre of Registers Real Property Register and land plot plan Annex 7. Layout schemes of technological equipment of PEA development alternatives. Annex 8. Principle technological schemes of PEA development alternatives.
Annex 9. Certificate on hydrometeorological conditions Annex 10. Background ambient air pollution data Annex 11. Layout plans of stationary air pollution sources Annex 12. Maps of the dispersion of ambient air pollution Annex 13. Information on the current traffic flows Annex 14. Noise dispersion maps of the PEA development alternatives Annex 15. Maps on the forecasted noise levels caused by traffic movement Annex 16. Maps on the planned odour dispersion of PEA Annex 17. Letter No A121-5897/15(2.1.19-MP) of 19 March 2015 of the Urban Development Department of Vilnius City Municipality Administration Annex 18. Copies of public information notices on the presentation of the EIA report Annex 19. A protocol on the presentation of the EIA report to the public and list of participants Annex 20. Public proposals, evaluation of public proposals and responses to public representatives having submitted proposals Annex 21. Copies of qualification documents of compilers of the EIA report Annex 22. Conclusions of entities of the EIA report
LIST OF TABLES Table 1: 1.3.1. Data on heat and electricity amounts planned to be supplied to the system .......................................................................................................................................... 24
Table 2: Table 1.4.1 Municipal waste generation and management in Lithuania in 2004-2013 .................................................................................................................................. 26
Table 3: Table 1.4.2 Municipal waste generation forecast for 2015-2030 ......................... 27
Table 4: Table 1.4.3. Efficiency of the planned MBT and waste treatment methods applied therein (drawn up based on the information of the Association of Regional Waste Management Centres of Lithuania) ................................................................................... 28
Table 5: Table 1.4.4. Forecasted potential of municipal waste, which is unfit for recycling but contains energy value, and of SRF in 2016-2030 ........................................................ 29
Table 6: Table 1.4.5 Parameters of waste burnt in the Vilnius waste incineration power plant .................................................................................................................................. 31
Table 7: Table 1.4.6. Forecasted potential of types of biomass in 2025 ............................ 31
Table 8: Table 1.4.7. Approximate composition and calorific values of wood chips (according to KTU, 2015) .................................................................................................. 32
Table 9: Table 1.4.8. Parameters of dried sludge incinerated in the Vilnius waste incineration power plant .................................................................................................... 33
Table 12: Table 1.4.11 Consumers of natural gas in Lithuania in 2004-2013 ................... 33
Table 13: Table 1.4.12. Parameters of natural gas used in the Vilnius Combined Heat and Power Plant (according to the values of fixed natural gas quality parameters for Vilnius zone presented by AB Amber Grid) ................................................................................... 34
Table 14: Table 1.4.13. Fuel quantities ............................................................................. 34
Table 15: Table 1.4.14. Consumption of energy resources in the activities of the company, except for resources used as fuel in energy production .................................................... 35
Table 16: Table 1.5.1. Data on the used chemical substances or preparations ................ 36
Table 17: Table 1.5.2. Storage of raw materials and additional chemical substances or preparations ...................................................................................................................... 36
Table 18: Table 2.1.1: Waste Incineration BAT ................................................................. 49
Table 19: Table 2.2.1: Comparison of technological process with the horizontal BAT Reference Document ........................................................................................................ 57
Table 20: Table 3.1.1 Preliminary amounts of waste ......................................................... 70
Table 21: Table 3.1.2: Preliminary list of non-hazardous municipal waste unfit for recycling .......................................................................................................................................... 70
Table 22: Table 3.2.1. Waste, waste management ........................................................... 72
Table 23: Table 4.1.1: Information on the part of the municipal area falling within the boundaries of the Neris small tributaries sub-basin ........................................................... 76
Table 24: Table 4.1.2. Key data of monitoring stations of 2010-201 (Source: The results of the Vilnius City Municipality groundwater monitoring 2010-2012. UAB DGE Baltic Soil and Environment, Vilnius, 2012)............................................................................................... 83
Table 25: Table 4.1.3. Chemical composition of water of spring No2 6 (Bukčiai) (mg/l) for 2010-2012. (Source: Results of Vilnius City Municipality groundwater monitoring 2010-2012.UAB DGE Baltic Soil and Environment, Vilnius, 2012) ............................................. 83
Table 26: Table 4.1.4: The results of monitoring of water chemical composition of bore-wells No 37316 and 37317 of 2014 (Source: The results of the Vilnius City Municipality groundwater monitoring in 2010 - 2012. UAB DGE Baltic Soil and Environment, Vilnius, 2012) ................................................................................................................................. 84
Table 27: Table 4.1.5: Estimated water intake and consumption ..................................... 86
Table 28: Table 4.1.6: General requirements of the Regulation on Waste Water Treatment for industrial waste water ................................................................................................... 87
Table 29: Table 4.1.7: Data on waste water sources and/or dischargers .......................... 89
Table 30: Table 4.1.8: Contamination of the planned release of wastewater / estimated environmental pollution* .................................................................................................... 89
Table 31: Table 4.2.1. Estimated pollution of waste incinerator ........................................ 93
Table 32: Table 4.2.2: Estimated emissions from a biomass incinerator ........................... 94
Table 33: Table 4.2.3. Estimated emissions of the CHP plant (PEA Development Alternative No 3) ................................................................................................................ 97
Table 34: Table 4.2.4. Physical data of stationary sources of pollution ............................. 99
Table 35: Table 4.2.5. Emissions to air ........................................................................... 101
Table 36: Table 4.2.6: Quantities of fuel used by vehicles .............................................. 108
Table 37: Table 4.2.7: Quantities of pollutants emitted by vehicles ................................. 109
Table 38: Table 4.2.8. Concentration limits of emissions ................................................ 110
Table 39: Table 4.2.9: Estimated maximum concentrations of ambient air pollutants ..... 112
Table 40: Table 4.2.10. Ambient air pollution treatment plants and other pollution prevention measures ....................................................................................................... 115
Table 41: Table 4.2.11. Proposals on setting norms for allowable emissions to the atmosphere ......................................................................................................................... 1
Table 42: Table 4.6.1. Assessment of Objective Indicators of Landscape Components in the Vicinity of PEA ............................................................................................................. 24
Table 43: Table 4.6.2. Nature framework in Vilnius city municipality (source: General plan of the territory of Vilnius city municipality until 2015) ......................................................... 25
Table 44: Table 4.6.3.Determination of the extent of visual impact of the highest PEA buildings according to its vertical visual angle (Ministry of Environment of the Republic of Lithuania, 2015) ................................................................................................................. 27
Table 45: Table 4.6.4. Land holdings of the planned economic activity with explication ... 27
Table 46: Table 4.7.1. Population ...................................................................................... 31
Table 47: Table 4.7.2.Socially vulnerable population in Vilnius city municipality, 2014 ..... 32
Table 48: Table 4.7.3. Internal and international migration according to municipalities from 2010 to 2014 ..................................................................................................................... 32
Table 49: Table 4.7.4. Employed inhabitants/thousand ..................................................... 33
Table 50: Table 4.7.5. Number of unemployed persons, thousand ................................... 33
Table 51: Table 4.7.6. Foreign direct investment at the end of the year ............................ 34
Table 52: Table 4.7.7.Economic entities operating in Vilnius city municipality .................. 35
Table 53: Table 4.7.8. Relative investments used for the preliminary assessment of the amount of alternative investments ..................................................................................... 36
Table 54: 4.7.9. Preliminary investment amounts for the PEA development alternatives .. 36
Table 55: Table 4.7.10. Heat generation sources of the Integrated System of Vilnius city 36
Table 56: Table 4.7.11. Constituents of heat price ............................................................ 43
Table 57: Table 4.8.1. Details on the nearest registered nationally protected cultural (heritage) values (according to the information provided in the Register of Cultural Values; http://kvr/kpd/lt/heritage) .................................................................................................... 49
Table 58: Table 4.9.1. The nearest analyzed residential environment .............................. 52
Table 59: Table 4.9.2. Birth rate per 1000 inhabitants ....................................................... 56
Table 60: Table 4.9.3. Mortality rate per 1000 inhabitants ................................................ 57
Table 61: Table 4.9.4. Natural increase per 1000 inhabitants ........................................... 58
Table 62: Table 4.9.5. Mortality according to death reasons in 2013 ................................ 58
Table 63: Table 4.9.6. General prevalence (per 1000) of neurological disorders .............. 59
Table 64: Table 4.9.7. The number of people ill with nervous system diseases (G00-G99) per 1000 inhabitants .......................................................................................................... 60
Table 65: Table 4.9.8. General prevalence (per 1000) of circulatory disorders ................. 60
Table 66: Table 4.9.9.The number of persons ill with circulatory system diseases (100-199) per 1000 inhabitants .................................................................................................. 61
Table 67: Table 4.9.10. General prevalence (per 1000) of respiratory diseases ............... 61
Table 68: Table 4.9.11. The number of people ill with respiratory system diseases (K00-J99) per 1000 inhabitants .................................................................................................. 62
Table 69: Table 4.9.12. General prevalence (per 1000) of digestive disorders ................. 63
Table 70: Table 4.9.13. The number of people ill with digestive diseases excluding dental diseases (K09-K 93) per 1000 inhabitants ........................................................................ 63
Table 71: Table 4.9.14.Maximum allowable threshold limit values (TLV) in residential and public buildings and their environment .............................................................................. 64
Table 72: Table 4.9.15. Preliminary list of equipment planned to be used for the construction activity ........................................................................................................... 69
Table 73: Table 4.9.16 Stationary noise sources of PEA .................................................. 70
Table 74: Table 4.9.17. PEA transport flows ..................................................................... 75
Table 75: Table 4.9.18. Calculated PEA noise levels ........................................................ 77
Table 76: Table 4.9.19. Calculated levels of noise caused by transport Ldaytime in the residential environment using the PEA access road ......................................................... 78
Table 77: Table 4.9.20. Odour Emissions Produced by the PEA Stationary Sources of Ambient Air Pollution ......................................................................................................... 81
Table 78: Table 4.9.21. PEA odour dispersion modelling results ...................................... 82
Table 79: Table 5.1.1. Key indicators of the PEA development alternatives analysed in the EIA report .......................................................................................................................... 90
Table 80: Table 5.3.1. Analysis of the impact of the components of the environment in question ............................................................................................................................. 91
Table 81: Table 6.2.1. Plan for monitoring of technological processes of Vilnius Combined Heat and Power Plant ....................................................................................................... 98
Table 82: Table 6.3.1. Hazard indexes of Vilnius Combined Heat and Power Plant ......... 99
Table 83: Table 6.3.2. Results of estimations according to the categories of the sources of ambient air pollution ........................................................................................................ 103
Table 84: Table 6.3.3. Plan for monitoring of stationary sources of ambient air pollution 108
Table 85: Table 6.4.1. Results of modelling of pollution dispersion ................................. 112
Table 86: Table 7.1.1. Recommended risk assessment structure (Information Notices (Informaciniai pranešimai), 2002 No 61-297) .................................................................. 115
Table 87: Table 7.2.1. Recommended risk factors .......................................................... 117
Table 88: Table 7.2.2. Recommended assessment criteria for risk factors ..................... 118
Table 89: Table 7.2.3. Risk Assessment Matrix significant risk factors ........................... 120
Table 90: Table 7.3.2. Significant risk factors and assessment thereof ........................... 125
LIST OF FIGURES Figure 1: Figure.1.3.1. Project development stages (according to www.kogen.lt) ........................................... 24 Figure 2: Figure 1.4.1. Planned transportation of municipal waste, which is unfit for recycling but contains energy value, and of SRF ................................................................................................................................. 30 Figure 3: Figure 1.6.1. Layout scheme of the location of the analyzed planned economic activity ................. 38 Figure 4: Figure 1.6.2. Layout of alternative locations considered in the EIA programme stage .................... 39 Figure 5: Figure 1.6.3. Excerpt from the Special Plan of the heat sector of Vilnius city municipality: territorial development scheme of the energy sector unit of Vilnius city located at Jočionių g. 13. ................................ 40 Figure 6: Figure 1.6.4. Layout of the analyzed land plot in respect of the main drawing solutions of the Master Plan of the territory of Vilnius City Municipality till 2015 (the basis: main drawing of the Master Plan of Vilnius City Municipality till 2015, available online at: http://www.vilnius.lt/lit/Pagrindinis_brezinys_/1581996). .......................................................................................................................................................................... 42 Figure 7: Figure 1.6.5. The nearest protected and NATURA 2000 territories ................................................. 43 Figure 8: Figure 1.6.6. The nearest cultural heritage valuables ....................................................................... 44 Figure 9: Figure 1.6.7. Existing access roads to the analyzed territory of the part of the land plot planned to be used in the activity ....................................................................................................................................... 45 Figure 10: Figure 2.1.1: Process flow scheme of operation of CHP power plant ........................................... 47
Figure 11: Figure 2.1.2: Example of the diagram of the grate furnace ............................................................ 50 Figure 12: Figure 2.1.3: Process flow scheme of a stationary (A) and circulating (B) fluidized bed furnace... 51 Figure 13: Fig 2.1.4: Process flow scheme of ESF operation .......................................................................... 54 Figure 14: Figure 4.1.1: The Neris small tributaries sub-basin and boundaries of municipalities (Source: The Management Plan of the Nemunas river basin district. Resolution No 1098 of the Government of the Republic of Lithuania of 21 July 2010) ............................................................................................................. 77 Figure 15: Figure 4.1.2: Surface water protection zones on the site in question provided in the register of rivers, lakes and ponds (Source: Register of rivers, lakes and ponds) ............................................................ 78 Figure 16: Figure 4.1.3: Excerpt from the drawing of the special plan solutions for the development of water supply and waste water treatment infrastructure of the territory of Vilnius City Municipality ........................... 81 Figure 17: Figure 4.1.4: Excerpt from the drawing of the concept of the special plan for the development of surface water management infrastructure and basin management regulations .............................................. 82 Figure 18: Figure 4.1.5: Excerpt from groundwater stations under the Vilnius City Municipality groundwater monitoring in 2010-2012 ................................................................................................................................... 83 Figure 19: Figure 4.1.6: Change in hydro-chemical composition of water of bore-wells 37316 (left) and 37317 (right) in 2005-2012 (Source: The results of the Vilnius City Municipality groundwater monitoring in 2010 - 2012. UAB DGE Baltic Soil and Environment, Vilnius, 2012) .......................................................................... 84 Figure 20: Figure 4.2.1: Wind rose of Vilnius city (according to the data of Vilnius Hydrometeorological Station for the period 2010-2014)..................................................................................................................... 91 Figure 21: Fig. 4.3.1. Pedological regionalisation (Source: www.geoportal.lt) .................................................. 4 Figure 22: Fig. 4.3.2. Prevailing surface cover in the analysed land plot territory planned to be used ............. 5 Figure 23: Figure 4.3.3. Aggregate soil pollution index (Zd) according to the HN 60:2004 (Source: Vilnius Environmental Information Website: http://www.aplinka.vilnius.lt/lt). ................................................................. 6 Figure 24: Figure 4.3.4. Soil pollution coefficient (Ko) according to the HN 60:2004 (Source: Vilnius Environmental Information Website: http://www.aplinka.vilnius.lt/lt). ................................................................. 7 Figure 25: Fig. 4.3.5. Extract from the results of 2007-2012 Soil Pollution Monitoring of Vilnius City (Source: Vilnius Environmental Information Website: http://www.aplinka.vilnius.lt/lt). ..................................................... 7 Figure 26: Fig. 4.4.1. Geological – geomorphological regions of Vilnius City (Guobytė, 2012) ........................ 9 Figure 27: Fig. 4.4.2. Condition of the analyzed location in the spatial background view of the relief developed by the Lithuanian Geological Survey specialists according to the LIDAR data (National Land Service) ............................................................................................................................................................ 10 Figure 28: Figure 4.4.3. Fragment of Vilnius City Quaternary Geological Map (M 1: 10 000) (Guobytė, 2012), See legend in Fig. 4.4.3a ................................................................................................................................. 11 Figure 29: Figure 4.4.3a. Stratigraphical – Genetic Legend for Quaternary Geological Map and Geological Cross-Sections ................................................................................................................................................. 11 Figure 30: Figure 4.4.3b. Lithology Symbols for Quaternary Geological Map and Geological Cross-Sections .......................................................................................................................................................................... 12 Figure 31: Figure 4.4.4. Fragment of Vilnius City Quaternary Geomorphological Map (M 1: 10 000) (Guobytė, 2012) ................................................................................................................................................................ 13 Figure 32: Figure 4.4.4a. Legend for Geomorphological Map ......................................................................... 13 Figure 33: Figure 4.4.5. Geological cross-section I–Iʹ characterising the Quaternary cover (Source: Jusienė, 2007). The cross-section is shown in Fig. 4.4.3, see Legend in Fig. 4.4.3a and 4.4.3b .................................. 14 Figure 34: Figure 4.4.6. Geological cross-section A–Aʹ of the upper part of the Quaternary cover (Guobytė, 2012). The cross-section is shown in Fig. 44.4.3, see Legend in Fig. 4.4.3a and 4.4.3b ................................ 15 Figure 35: Figure 4.4.7. Fragment of the Engineering-Geological Map of Vilnius City (M 1: 10 000). Authors: S. Stankevičiūtė, G. Vaičiūnas (Stankevičiūtė et al, 2012). See legend in Fig. 4.4.7a .................................... 16 Figure 36: Figure 4.4.7a. Legend for the Engineering-Geological Map and Cross-Section (Stankevičiūtė et al, 2012) ................................................................................................................................................................ 16 Figure 37: Figure 4.4.8. Engineering-Geological Cross-Section A–Aʹ of the upper part of the Quaternary cover. The cross-section is shown in Figure 4.4.7, see Legend in Figure ....................................................... 17 Figure 38: Figure 4.4.9. Fragment of Vilnius City Tectonic Map (M 1: 25 000). Authors: J. Bitinas, J. Čyžienė (Stankevičiūtė et al, 2012) ................................................................................................................................ 18 Figure 39: Fig. 4.5.1. Localization of protected, Natura 2000 and biologically valuable territories .................. 22 Figure 40: Figure 4.6.1. Cross-sections of the relief in the vicinity of PEA to different directions (S- south, N-north, E-east, W-west). ..................................................................................................................................... 25 Figure 41: Figure 4.6.2. Territories of nature framework found in the vicinity of the territory of the Land Plot planned to be used. Extract from the general plan of the territory of Vilnius city municipality until 2015 (accessed over the Internet: http://www.vilnius.lt/lit/Vilniaus_miesto_bendrasis_planas/783). ....................... 26 Figure 42: Figure 4.6.3. Levels of the extent of visual impact according to the visual angle with regard to PEA development alternative No 2........................................................................................................................... 28 Figure 43: Figure 4.6.4. Levels of the extent of visual impact according to the visual angle with regard to PEA development alternative No 3............................................................................ Error! Bookmark not defined. Figure 44: Fig. 4.6.5. Visibility of the highest buildings of the planned economic activity................................ 30
Figure 45: Fig. 4.7.1. Unemployment rate in Lithuania, Vilnius city and EU28 in 2005-2013 .......................... 33 Figure 46: Figure 4.7.2. Wage-related trends in Vilnius city municipality ........................................................ 34 Figure 47: Fig. 4.7.3. Schedule of heat demand by the Integrated System of Vilnius city with available and planned biomass capabilities ........................................................................................................................... 38 Figure 48: Fig. 4.7.4. Dependence of heat energy price of the Integrated System of Vilnius on the capacity of installed heat generating facilities using biomass ............................................................................................ 38 Figure 49: Fig. 4.7.5. Variation of one-component constituent of heat price from January 2013 to November 2014 in Vilnius DHS ......................................................................................................................................... 39 Figure 50: Figure 4.7.6. Variation of the constituents of two-component heat price in 2013-2014. ................ 40 Figure 51: Figure 4.7.7. Hot water price for residents, where the supplier is Vilniaus Energija, UAB ............. 40 Figure 52: Figure 4.7.8. Hot water price for business consumers, where the supplier is Vilniaus Energija, UAB. ................................................................................................................................................................. 41 Figure 53: Figure 4.7.9. The constituent for the production of heat energy in the final price for heat applied to the consumers of the DHS of Vilnius city ......................................................................................................... 42 Figure 54: Figure 4.7.10. The potential of reducing heat production price subject to the installed thermal capacity of alternative sources. ........................................................................................................................ 46 Figure 55: ......................................................................................................................................................... 47 Figure 56: Fig. 4.7.11. Companies in the vicinity of PAE ................................................................................. 47 Figure 57: Fig. 4.8.1. Distance to the nearest registered cultural values. ........................................................ 51 Figure 58: Figure 4.9.1.a. The nearest residential environment with regard to PEA development alternative No 2. ................................................................................................................................................................. 53 Figure 59: Figure 4.9.1.b. The nearest residential environment with regard to PEA development alternative No 3. ................................................................................................................................................................. 54 Figure 60: Figure 4.9.3. Nearest public purpose environment ......................................................................... 55 Figure 61: Figure 4.9.4. Birth rate per 1000 inhabitants. ................................................................................. 57 Figure 62: Figure 4.9.5 Mortality rate per 1000 inhabitants ............................................................................. 58 Figure 63: Figure 4.9.6. General prevalence (per 1000) of neurological disorders ......................................... 59 Figure 64: Fig. 4.9.7. General prevalence (per 1000) of circulatory disorders ................................................ 61 Figure 65: Figure 4.9.8.General prevalence (per 1000) of respiratory disorders ............................................. 62 Figure 66: Figure 4.9.9.General prevalence (per 1000) of digestive disorders ............................................... 63 Figure 67: Figure 4.9.10. Excerpt from the strategic noise map of Vilnius city, noise generated by industrial sources, Lday ................................................................................................................................................... 66 Figure 68: Figure 4.9.11. Excerpt from the strategic noise map of Vilnius city, noise generated by industrial sources, Levening. ........................................................................................................................................... 66 Figure 69: Fig. 4.9.12. Excerpt from the strategic noise map of Vilnius city, noise generated by industrial sources Lnight .................................................................................................................................................. 67 Figure 70: Figure 4.9.12. Excerpt from the strategic noise map of Vilnius city, noise caused by vehicles Ldaytime in the residential section of Jočionių street. ...................................................................................... 68 Figure 71: Figure 4.9.13. Excerpt from the strategic noise map of Vilnius city, noise caused by vehicles Ldaytime in the residential section of Dubliškių street. .................................................................................... 68 Figure 72: Fig. 4.9.14. Excerpt from the strategic noise map of Vilnius city, noise caused by vehicles Ldaytime in the residential section of Titnago street. ....................................................................................... 69 Figure 73: Figure 4.9.15 a. Scheme of stationary noise sources of PEA development alternative No 2 ........ 73 Figure 74: Figure 4.9.15 b. Scheme of stationary noise sources of PEA development alternative No 3 ........ 73 Figure 75: Figure 4.9.16 a. Scheme of transport organization in the territory of the part of the Land Plot planned to be used for the PEA development alternative No 2 ....................................................................... 74 Figure 76: Figure 4.9.16 b. Scheme of transport organization in the territory of the part of the Land Plot planned to be used for the PEA development alternative No 3 ....................................................................... 74 Figure 77: Figure 4.9.17. Scheme of PEA access roads ................................................................................. 75 Figure 78: Fig. 4.9.18. Spatial model for noise calculation .............................................................................. 77 Figure 79: Figure 4.9.19. Boundaries of SPZ of Adjacent Companies ............................................................ 85 Figure 80: Figure 4.9.20. Excerpt from the special plan on the development of the infrastructure of water supply and waste water treatment.................................................................................................................... 87 Figure 81: Figure 4.9.21. Suggested boundaries of the SPZ for the PEA development alternative No 2. ...... 89 Figure 82: Figure 4.9.22. Suggested boundaries of the SPZ for the PEA development alternative No 3. ...... 89 Figure 83: Figure 7.5.1. Risk reduction principle (ALARP principle) (UK Health and Safety, 2010) ............. 130
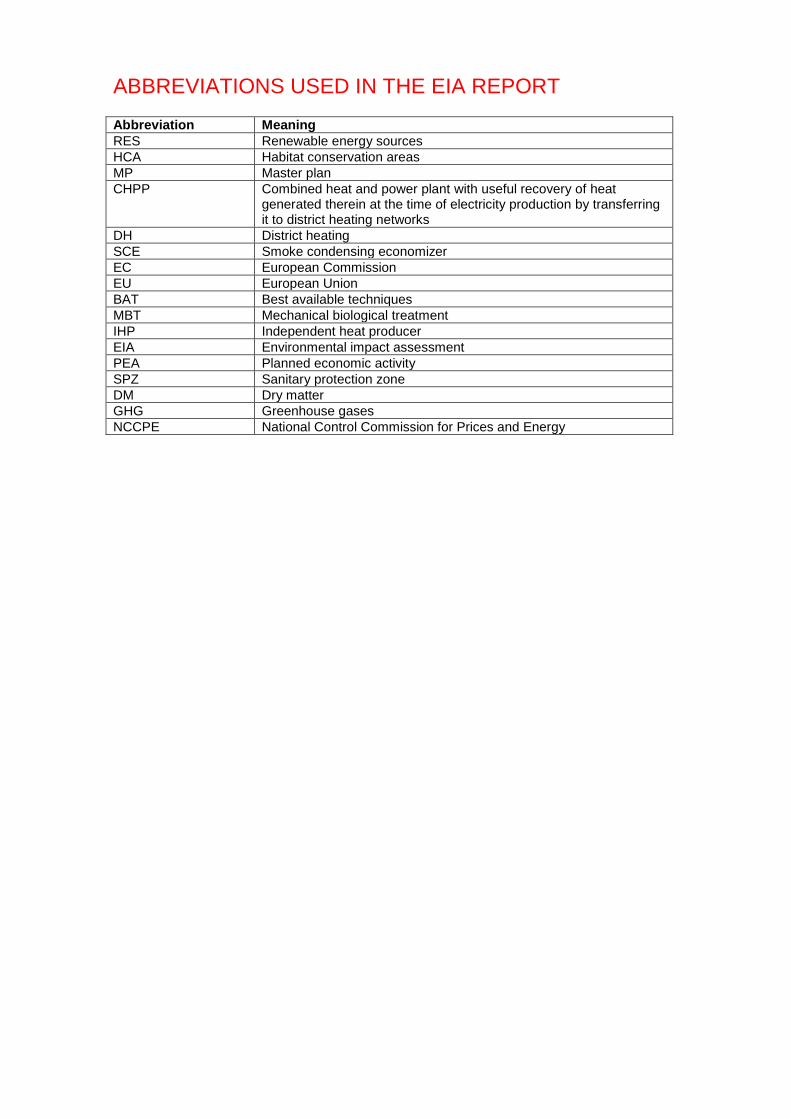
ABBREVIATIONS USED IN THE EIA REPORT Abbreviation Meaning
RES Renewable energy sources
HCA Habitat conservation areas
MP Master plan
CHPP Combined heat and power plant with useful recovery of heat generated therein at the time of electricity production by transferring it to district heating networks
DH District heating
SCE Smoke condensing economizer
EC European Commission
EU European Union
BAT Best available techniques
MBT Mechanical biological treatment
IHP Independent heat producer
EIA Environmental impact assessment
PEA Planned economic activity
SPZ Sanitary protection zone
DM Dry matter
GHG Greenhouse gases
NCCPE National Control Commission for Prices and Energy
Introduction Relation between the Lithuanian heat and electricity needs and district heating infrastructure creates favourable conditions for the development of combined heat and power plants. Heat demand potential is not yet fully exploited in the major cities of Vilnius and Kaunas for heat and power cogeneration from renewable energy sources and other local fuel (the National Heat Sector Development Programme for 2015-2021 approved by Resolution No 284 of the Government of the Republic of Lithuania of 18 March 2015 (Official Gazette, 2015, No. 2015-04339)). The National Heat Sector Development Programme for 2015-2021 (hereinafter - NHSDP) provides for an additional installation of cogeneration facilities (reconstructed or new) producing energy from renewable and (or) local (municipal waste) energy sources with power output of combined heat and power facilities up to 145 MW and thermal output of up to 240 MW. On 28 May 2014, the Government of the Republic of Lithuania recognized the projects of the modernization of Vilnius and Kaunas district heating sector by installing combined heat and power plants that use local and renewable energy sources as economic projects of national significance by its Resolution No 486 On the Recognition of Projects of the Modernisation of District Heating Sectors of Vilnius and Kaunas as Economic Projects of National Significance and consented to the implementation thereof by UAB Lietuvos Energija. Pursuant to the Environmental Requirements (hereinafter referred as “Requirements”) for Waste Incineration approved by Order No 699 of the Minister of Environment of the Republic of Lithuania of 31 December 2002 (Official Gazette, 2003, No 31-1290, as subsequently amended) it is planned to build new waste incineration unit in the combined heat and power plant. Pursuant to paragraph 6.3 of the Requirements waste incineration unit is a stationary technical unit, including the entire equipment thereof, intended for the thermal treatment of waste remaining after the treatment in MBT facilities, which is unfit for recycling, but contains energy value. After thermal treatment of waste produced heat is planned to supply to Vilnius DH system. Paragraph 40 of the Directive 2010/75/EU of the European Parliament and of the Council of 24 November 2010 on industrial emissions (integrated pollution prevention and control) also defines a waste incineration plant as any stationary or mobile technical unit and equipment dedicated to the thermal treatment of waste with or without recovery of the combustion heat generated, through the incineration by oxidation of waste as well as other thermal treatment processes, such as pyrolysis, gasification or plasma process, if the substances resulting from the treatment are subsequently incinerated. The planned Vilnius Combined Heat and Power Plant, which is planned to burn waste, meets the concepts and definitions of a waste incineration plant laid down in documents of the Republic of Lithuania and the European Parliament, and is considered a waste incineration plant. The planned economic activity means the operations conducted by a waste treatment object of national significance as it is defined by Resolution No 113 of the Government of the Republic of Lithuania On the approval of the Description of the Procedure of the Establishment of Waste Management Objects of National Significance and their Recognition of 2 February 2000. The process of the environmental impact assessment was started for the planned economic activity - Vilnius cogeneration power plant. The EIA report was drawn up pursuant to the Environmental Impact Assessment Programme approved by the Letter No (15.9)-A4-4691 of the Environmental Protection Agency of 28 April 2015 (Annex No. 1), Law on Environmental Impact Assessment of the Planned Economic Activity of the Republic of Lithuania (Official Gazette, 1996, No. 82-1965, as subsequently amended) and Regulations for the Preparation of the Environmental Impact Assessment Programme and Report approved by Order No D1-636 of the Minister of Environment of 23 December 2006 (Official Gazette, 2006, No. 6-225, as subsequently amended). According to Article 5 of the Law on Environmental Impact Assessment of the Planned Economic Activity of the Republic of Lithuania, subjects of the environmental impact assessment of the Vilnius Combined Heat and Power Plant include:
- Vilnius city municipality administration, - Vilnius Public Health Centre, - Vilnius territorial branch of the Department of Cultural Heritage under the Ministry of Culture, - Vilnius county Fire and Rescue Service.

Environmental Protection Agency is the responsible authority, which will make a decision on the potential of the economic activity. The public is informed about the EIA process pursuant to the Description of the Procedure for Informing the Public and Public Participation in the Environmental Impact Assessment Process of the Planned Economic Activity (Official Gazette, 2005, No 93-3472, as subsequently amended).
1. General data
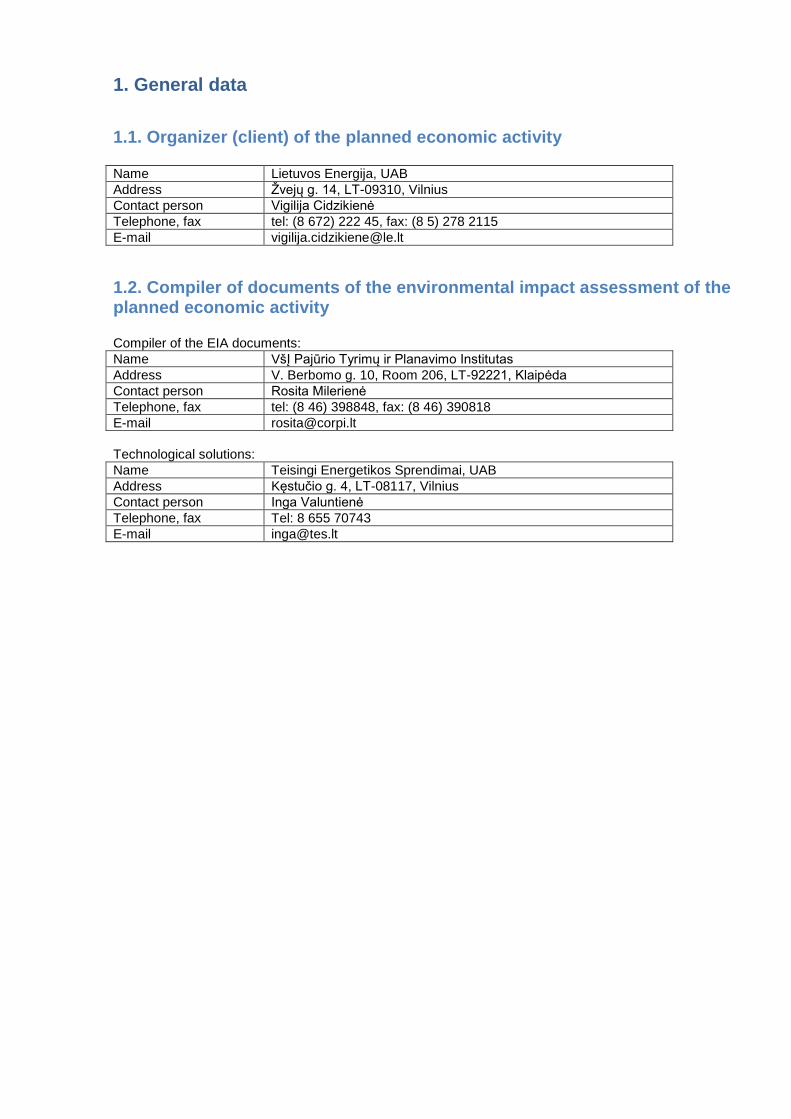
1.1. Organizer (client) of the planned economic activity Name Lietuvos Energija, UAB
Address Žvejų g. 14, LT-09310, Vilnius
Contact person Vigilija Cidzikienė
Telephone, fax tel: (8 672) 222 45, fax: (8 5) 278 2115
E-mail [email protected]
1.2. Compiler of documents of the environmental impact assessment of the planned economic activity Compiler of the EIA documents:
Name VšĮ Pajūrio Tyrimų ir Planavimo Institutas
Address V. Berbomo g. 10, Room 206, LT-92221, Klaipėda
Contact person Rosita Milerienė
Telephone, fax tel: (8 46) 398848, fax: (8 46) 390818
E-mail [email protected]
Technological solutions:
Name Teisingi Energetikos Sprendimai, UAB
Address Kęstučio g. 4, LT-08117, Vilnius
Contact person Inga Valuntienė
Telephone, fax Tel: 8 655 70743
E-mail [email protected]
1.3 Information on the planned economic activity The plan is to install a high efficiency cogeneration power plant fired on non-hazardous waste and biomass in Vilnius district heating system. According to paragraph 6.3 of Environmental Requirements for Waste Incineration approved by Order No. 699 of the Minister of Environment of the Republic of Lithuania of 31 December 2002 (Official Gazette, 2003, No. 31-1290, as subsequently amended), a stationary technical unit, including the entire equipment thereof, intended for the thermal treatment of waste with (or without) recovery of the generated heat is called a waste incineration plant. The planned economic activity means the operations conducted by a waste treatment object of national significance as it is defined by Resolution No 113 of the Government of the Republic of Lithuania On the Approval of the Description of the Procedure on the Establishment of Waste Management Objects of National Significance and their Recognition of 2 February 2000. Thermal waste treatment includes incineration by oxidation and other thermal processes, including pyrolysis, gasification or plasma process, if the substances resulting from the treatment are subsequently incinerated. The concept of a waste incineration plant also includes the entire plant and its territory, including all incineration lines, as waste reception, storage facilities, on-site pre-treatment facilities, waste, fuel and air supply systems, boilers, flue gas cleaning systems, on-site facilities for treatment or storage of residues and wastewater, stacks, loading tools, systems and devices for controlling incineration operations, recording and monitoring incineration conditions. Paragraph 40 of the Directive 2010/75/EU of the European Parliament and of the Council of 24 November 2010 on industrial emissions (integrated pollution prevention and control) also defines a waste incineration plant as any stationary or mobile technical unit and equipment dedicated to the thermal treatment of waste with or without recovery of the combustion heat generated, through the incineration by oxidation of waste as well as other thermal treatment processes, such as pyrolysis, gasification or plasma process, if the substances resulting from the treatment are subsequently incinerated. The proposed Vilnius Combined Heat and Power Plant, which is planned to burn waste, meets the concepts and definitions of a waste incineration plant laid down in documents of the Republic of Lithuania and the European Parliament, and is considered a waste incineration plant.
1.3.1. Significance of the Vilnius Combined Heat and Power Plant project The Communication from the European Commission Energy 2020: a Strategy for Competitive, Sustainable and Secure Energy (COM(2010)639) provides for the reduction of GHG emissions by 20%, increase of the share of renewable energy to 20% and 20% improvement in energy efficiency by 2020. Promoting high efficiency cogeneration for district heating and cooling is one of the measures provided for in the EC Communication contributing to the increase of energy efficiency. The subsequent Communication from the European Commission Energy Roadmap 2050 (COM(2011)0885) identifies tasks to be solved and examines methods in order to implement the set goals with one of them being the necessary reorganization of energy system by increasing the use of RES and local energy sources in district heating systems. In 2013, about 546 000 tne of natural gas, 42 000 tne of fuel oil and 310 000 tne of renewable energy sources (wood biomass and other) and about 13 000 tne of other fuel (NHSDP 2015-2021) were used for district heating in the Lithuania’s heat sector. There are about 260 small district heating systems operating in Lithuania, the data whereof are not itemized in the official statistics, and the amount of fuel used whereby totals about 40 000 tne. A total of about 860 000 - 900 000 tne of fuel was used for the production of district heat, and the share of renewable energy sources accounted for about 34 percent. About 165 000 tne of fuel was burnt in cogeneration facilities for the production of electricity, of which more than 82 percent were fossil (conventional) energy sources. Directive 2012/27/EU distinguishes high efficiency CHP and district heating as measures for saving primary energy, which is largely untapped in the union. Each Member State was obligated to carry out a comprehensive assessment of the potential thereof. When carrying out such an assessment in Lithuania in 2014 proposals of the Ministry of Energy were formed, which were integrated into the draft National Heat Sector Development Programme for 2014 - 2020 (hereinafter - the NHSDP). The NHSD for 2015-2021 was approved by Resolution No 284 of the Government of the Republic of Lithuania of 18 March 2015 On the Approval of the National Heat Sector Development Programme for 2015-2021.
The first goal of the NHSD Programme is to reduce heat energy prices and environmental pollution, giving priority in the balance of fuel used for the production of heat energy to renewable and/or local energy sources. Paragraph 1.1 of Annex 1 to the NHSDP provides for the increase in volume of local competitive electricity production and promoting high efficiency cogeneration in Vilnius district heating system by additionally installing cogeneration facilities (reconstructed or new) producing energy from renewable and/or local (municipal waste) energy sources. Energy production facilities may have the total installed power output of up to 145 MW and thermal output of up to 240 MW. Task 2 of the 1
st goal of the NHSD Programme provides for the reduction of pollution of heat production
facilities and ensurance of the development of technologies that use renewable energy sources. Installation of new facilities or adaptation of capacities of the existing facilities so that they meet requirements laid down in the Directive 2010/75/EU is planned for this purpose.
Acting as the designated executor under the Resolution No 486 of the Government of 2014 On the Recognition of Projects of the Modernisation of District Heating Sectors of Vilnius and Kaunas as Economic Projects of National Significance (hereinafter - the Resolution), Lietuvos Energija, UAB is implementing the projects of the modernization of Vilnius and Kaunas district heating networks by installing combined heat and power plants that use local and renewable energy sources. In the implementation of the Resolution, Lietuvos Energija, UAB analyses the possibility to build a high efficiency combined heat and power plant burning local and renewable energy sources in Vilnius. The planned economic activity contributes to the priority area “Energy” of the European Union Strategy for the Baltic Sea Region in order to promote RES consumption, improve the accessibility, efficiency and security of energy markets. The planned economic activity contributes to the “Strategy for Competitive, Sustainable and Secure Energy 2020” (COM(2010)639), “Energy Roadmap 2050” (COM(2011)0885) and their goals in order to increase energy efficiency, reduce GHG emissions and increase the share of used RES. The measure also contributes to the implementation of Directive 2009/28/EU of the European Parliament and of the Council of 23 April 2009 on the promotion of the use of energy from renewable sources and amending and subsequently repealing Directives 2001/77/EC and 2003/30/EC (OJ 2009 L 140), since increased use of RES is promoted with the aim to reduce GHG emissions and implement Kyoto Protocol to the United Nations Framework Convention on Climate Change as well as other Community and international obligations to reduce GHG emissions. The planned economic activity will also contribute to the implementation of Directive 2012/27/EU of the European Parliament and of the Council of 25 October 2012 on energy efficiency, amending Directives 2009/125/EC and 2010/30/EU and repealing Directives 2004/8/EC and 2006/32/EC (OJ 2012 L 315) in the creation of efficient district heating system. The planned economic activity will contribute to the implementation of Directive 2009/29/EC of the European Parliament and of the Council of 23 April 2009 partially amending Directive 2003/87/EC so as to improve and extend greenhouse gas emission allowance trading scheme of the Community (OJ 2009 L 140). The planned economic activity will directly help to implement the following: 1. Goals established in the Lithuania’s Progress Strategy “Lithuania 2030” approved by Resolution No XI-2015 of the Seimas - to achieve energy independence and consistently develop the use of environmentally friendly resources (paragraphs 6.3, 6.9.2). 2. Axis 3.2.3.2 “To Ensure Sufficient and Competitive Local Electricity Production Capacities” of the task 3.2.3 “To Develop Energy Infrastructure” of the target 3.2 “Creating Sustainable and Efficient Economic Infrastructure” of the priority 3 “Environment Favourable for Economic Growth”, also axis 3.3.2.1 “To Promote RES Production and Use”, axis 3.3.2.3 “To Create and Implement Modern Energy and Other Natural Resource-Friendly Technologies and Process Management Systems” and axis 3.3.2.4 “Increasing Efficiency of the Use of Energy Sources in the Areas of Energy Production and Use of the target 3.3 “Promoting Sustainable Use of Resources, Ensuring Stability of Ecosystems, axis 3.3.3.3 “Promoting Waste Generation Prevention and Increasing the Reuse, Recycling and Recovery of Waste for Energy Production (Recovery of Energy and Materials, Broader Installation of Waste, Recycling Facilities especially of Biodegradable Waste, Promoting the Installation of Modern Technologies and Production Methods Reducing the Use of Natural Resources and/or Ensuring Waste Generation Prevention)” of the National Progress Programme 2014-
2020 approved by Resolution No 1482 of the Government of the Republic of Lithuania of 28 November 2012. 3. Tasks and key solutions in the areas of increasing electricity, heat, RES and energy efficiency as well as environmental protection, gas, fuel oil, mitigation of greenhouse gas emissions (p. 5-13, 60, 61, 69, 72.1-2, 94) provided for in the National Energy Independence Strategy approved by Resolution No XI-2133 of the Seimas of the Republic of Lithuania of 26 June 2012 (hereinafter - NEIS). The measure will contribute to the ensurance of sufficient competitive local electricity production capacities increasing the scope of electricity production from RES in the electric energy sector and increase of heat production efficiency by replacing natural gas used in heat production with biomass in the heat sector. The measure will implement the NEIS task to increase energy consumption efficiency by promoting the use of waste in energy production and use of biomass in heat production. The measure will increase the use of RES in electricity and heat production. When it comes to the natural gas and fuel oil sectors, the measure will contribute to the goal of decreasing the consumption of natural gas and replacing oil products with RES. In the area of energy efficiency, the aim will be to increase energy consumption efficiency. The implementation of the measure will contribute to positive environmental impact - reduce greenhouse gas emissions. Also, the measure will contribute to the NEIS target for the Lithuanian energy sector to become independent from energy supply from the sole source by 2020. 4. Priorities and tasks of internal security policy to ensure energy security by upgrading energy infrastructure, implementing measures for saving energy resources and promoting the use of local and RES enshrined in paragraphs 16.6.2-16.6.3 of the National Security Strategy approved by Resolution No IX-907 of the Seimas of the Republic of Lithuania of 28 May 2002. 5. The vision provided for in paragraph 118 of the National Strategy for Climate Change Management Policy approved by Resolution No. XI-2375 of the Seimas of the Republic of Lithuania of 6 November 2012 to ensure the adaptation of the Lithuanian sectors of economy to environmental changes determined by climate change and mitigation of climate change effects (reducing greenhouse gas emissions), development of competitive economy of low carbon dioxide content, to install eco-innovative technologies, achieve increased energy production and consumption efficiency and the use of RES in all sectors of the national economy (including energy). 6. Strategic objective of Lithuania in the heat sector - to increase heat production, transmission and use efficiency at the same time (where economically reasonable) replacing natural gas with various local and renewable energy sources, thus seeking for the reduction of heat prices provided for in the National Heat Sector Development Programme for 2014-2020 approved by Resolution No 284 of the Government of the Republic of Lithuania of 18 March 2015 (hereinafter - the National Heat Sector Development Programme for 2014-2020). The measure will contribute to the implementation of the target 1 of the National Heat Sector Development Programme for 2014-2020 - to reduce heat energy prices and environmental pollution by giving priority to renewable and/or local energy sources in the balance of fuel used to produce heat energy. The measure will ensure the additional installation high efficiency cogeneration facilities that use renewable and/or local energy sources (municipal waste) in the Vilnius and Kaunas district heating system. 7. Strategic objective of the National Strategy for the Development of Renewable Energy Sources approved by Resolution No 789 of the Government of the Republic of Lithuania of 21 June 2010 to best meet the energy demand by the use of local resources in electricity and heat energy as well as transport sectors by increasing the share of renewable energy sources in the national energy balance, also, to give up imported polluting fossil fuel, thus increasing energy supply security, energy independence and contributing to international efforts to reduce greenhouse gas emissions. 8. Tasks laid down in the National Strategy for Sustainable Development approved by Resolution No 1160 of the Government of the Republic of Lithuania of 11 September 2003 to efficiently use waste energy sources (p. 134.5), upgrade the existing and build new high efficiency combined heat and power plants depending on the need for useful heat energy (p. 150.1).
1.3.2. Alternatives of the planned economic activity Do nothing alternative - the planned economic activity is not implemented. This is the alternative, which reflects the current situation, when heat necessary for the city of Vilnius is produced in natural gas or other fossil fuel fired facilities, and describes environmental conditions and natural changes occurring in the environment in case of the non-implementation of the activity.
Considered alternatives of the development of the planned economic activity Three technologic alternatives prepared according to the draft NHSD Programme for 2014-2020 were defined in the preparation stage of the EIA Programme: 1. Alternative No 1. A waste fired combined heat and power plant with power output of up to 25 MWe and thermal output of up to 74 MWt would be additionally installed in the Vilnius district heating system. Also, a biomass fired combined heat and power plant with power output up to 120 MWe and thermal output of up to 260 MWt would be additionally installed. A total of up to 250 000 t of waste and up to 750 000 t of biomass per year would be used in case of the Alternative No 1. 2. Alternative No 2. A combined heat and power plant installation which consists of a waste-fired unit and biomass-fired unit with power output of up to 20 MWe and thermal output of up to 65 MWt would be additionally installed in the Vilnius district heating system. Also, a biomass fired combined heat and power plant with power output up to 80 MWe and thermal output of up to 210 MWt would be additionally installed. A total of up to 160 000 t of waste and up to 620 000 t of biomass per year would be used in case of the Alternative No 2. 3. Alternative No 3. A mixed fuel (biomass and waste) fired combined heat and power plant with power output of up to 45 MWe and thermal output of up to 120 MWt would be additionally installed in the Vilnius district heating system. A total of up to 160 000 t of waste and up to 350 000 t of biomass per year would be used in case of the Alternative No 3. The NHSDP was approved by Resolution No 284 of the Government of the Republic of Lithuania of 18 March 2015 On the Approval of the National Heat Sector Development Programme for 2015-2021, in accordance wherewith the Alternative No 1 provided for in the EIA Programme significantly exceeds thermal outputs of cogeneration facilities provided for in the NHSDP, while the Alternative No 2 partially exceeds thermal outputs of combined heat and power plants provided for in the approved NHSDP. When approving the drawn up environmental impact assessment programme by its letter No (15.9)-A4-4691 of 28 April 2015 (Annex No 1), the Environmental Protection Agency indicated that outputs of combined heat and power plants examined in the alternatives had to be revised given the tasks of the National Heat Sector Development Programme for 2015-2021 approved by Resolution No 284 of the Government of the Republic of Lithuania of 18 March 2015. The approved National Heat Sector Development Programme for 2015-2021 provides for an additional installation of combined heat and power plants generating energy from renewable and/or local (municipal waste) energy sources with power output up to 145 MW and thermal output up to 240 MW in the Vilnius DH system. In light of these motives, the environmental impact assessment is conducted for the PEA development alternatives No 2 and No 3, by setting such outputs, which would not exceed the tasks established in the approved NHSDP: 1. The PEA development alternative No 2. A combined heat and power plant installation which consists of a waste-fired unit and biomass-fired unit would be additionally installed in the Vilnius district heating system. The power output of waste fired combined heat and power plant would be up to 20 MWe and thermal output - up to 65 MWt. The power output of the biomass fired cogeneration unit would be up to 80 MW and thermal output - up to 175 MWe. A total of up to 160 000 t of waste and up to 620 000 t of biomass per year would be used for energy production in case of the Alternative No 2. In case of the PEA development alternative No 2, in addition to the planned combined heat and power plant, the installation of a biomass preparation and storage unit, which would allow ensuring an ongoing supply of the combined heat and power plant with biomass and a biomass reserve of at least 10 days, as required by normative legislation of the Republic of Lithuania (Law on Energy of the Republic of Lithuania approved by Resolution No IX-884 of the Seimas of the Republic of Lithuania of 16 May 2002 (Official Gazette, 2002, No 56-2224, as subsequently amended) is planned. 2. The PEA development alternative No 3. A mixed fuel (biomass and waste) fired combined heat and power plant with power output of up to 45 MWe and thermal output of up to 120 MWt would be additionally installed in the Vilnius district heating system. A total of up to 160 000 t of waste and up to 350 000 t of biomass per year would be used in case of the Alternative No 3.
3. Additional alternative to the PEA development alternative No 2 (hereinafter – the AA to No 2). In the case of this alternative, together with the implementation of the PEA development alternative No 2, while maintaining and not exceeding the planned thermal and power outputs and used amounts of fuel, a possibility to utilise the existing engineering installations of Vilnius Thermal Power Plant CHP-3 is additionally provided, i.e. the steam turbine with the electricity generator and the related engineering infrastructure by supplying thereto the steam produced in the planned new combined heat and power plant for the production of electricity and heating of thermal water.
Given the tasks set in the approved NHSDP 2015-20121 and the instruction of the Environmental Protection Agency to revise the outputs of combined heat and power plants examined in the EIA programme alternatives, the environmental impact assessment is conducted for the PEA development alternatives No 2 and No 3, accepting such outputs, which do not exceed the tasks set in the approved NHSDP:
Parameters PEA development alternative No 2
PEA development alternative No 3
Additional alternative to the PEA development alternative No 2
Power output Up to 100 MW Up to 45 MW Up to 100 MW
Thermal output Up to 240 MW Up to 120 MW Up to 240 MW
Together with the implementation of the PEA development alternative No 2, additional alternative is analysed in the EIA report - the use of the steam turbine with the electricity generator and the related engineering infrastructure of Vilnius Thermal Power Plant CHP-3 by supplying thereto the steam produced in the planned new combined heat and power plant for the production of heat and electricity.
1.3.3. Operational stages Lietuvos Energija, UAB plans to conduct the implementation of the project for the modernization of Vilnius district heating sector by installing cogeneration power plants that use local and renewable energy sources in stages. Summarized course of the project is illustrated in the Figure below (source: www.kogen.lt).
Selection of partners
Publication of a tender for contract works
Selected contractor
Received EU funding
Decision on the permissibility of the
activity
Started contractor works
Start of
production
Figure 1: Figure.1.3.1. Project development stages (according to www.kogen.lt)
A special purpose company UAB Vilniaus Kogeneracinė Jėgainė, which will implement the project, was established in February of 2015. Lietuvos Energija, UAB owns 100 per cent of shares of the established company. Partner selection was conducted at the end of 2014 - beginning of 2015. As one of possibilities, the selected partners were offered to acquire a part (below 49 percent) of shares of UAB Vilniaus Kogeneracinė Jėgainė. In March of 2015, Lietuvos Energija, UAB finished the evaluation of tender offers received from potential partners. Since no partner tender offers which meet project goals were received, the selection procedure was terminated providing for a possibility to attract partners in later project implementation stages. At this stage, Lietuvos Energija, UAB is continuing the project independently.
1.3.4. Connection of the environmental impact assessment programme and report preparation to the planning and design stages The environmental impact assessment report of the planned economic activity - Vilnius Combined Heat and Power Plant - is prepared in an early planning stage, within the scope of the project for the modernization of Vilnius district heating sector by installing combined heat and power plants that uses local and renewable energy sources. Paragraph 5.4 of the Description of the Procedure for Preparing and Approving Projects for the Development of Energy Objects of National Significance approved by Order No 1-23 of the Minister of Energy of the Republic of Lithuania of 29 January 2015 (hereinafter - the Description) establishes that the Description shall not apply when planning the development of objects, which have been recognized by a decision of the Seimas or Government of the Republic of Lithuania as projects of particular national significance or economic projects of national importance. Thus the Description does not apply to the PEA, and a development plan is not prepared.
1.3.5. Data on the produce: heat and electricity production The plan is to have heat and electricity produced in the Vilnius Combined Heat and Power Plant. Heat will be supplied to the Vilnius district heating system, and electricity - to the national electricity supply network.
Table 1: 1.3.1. Data on heat and electricity amounts planned to be supplied to the system
Name Unit of measure Annual amount for each PEA development alternative
No 2 No 2 AA to No 2**
Electricity* GWh per year 500 304 500
Heat energy GWh per year 1 598 1 068 1 598
* minus electricity produced and used for own needs ** equivalent to the PEA development alternative No 2. It should be noted that due to the fact that the existing CHP-3 turbine will be reconstructed and adapted for working with lower quantities of steam and lower steam parameters, also due to thermal losses in the steam line to the CHP -3 turbine, which may lead to changing steam parameters, the amount of produced heat and/or electricity can decrease by 0-5 percent, in presence of the same fuel incineration volumes as in case of the PEA development alternative No 2. Main assumptions used in the calculation of the planned heat and electricity amounts are laid down below. The Vilnius Combined Heat and Power Plant installation planned in the PEA development alternative No 2 consists of 2 units: waste fired-unit and biomass-fired unit. Assumptions used for evaluating production in these facilities are laid down below. Assumptions used in calculations of the amount of energy produced in waste fired cogeneration plant in case of the PEA development alternative No 2 and in waste and biomass fired cogeneration plant in case of the PEA development alternative No 3:
- Biomass calorific value - about 9 MJ/kg , waste calorific value - 12 MJ/kg; - Electricity efficiency coefficient of the Vilnius Combined Heat and Power Plant - 25.20%
29;
29
Assumption made by the author
- Total efficiency coefficient of the power plant (excluding SCE effects) - 86.90%30
; - Total efficiency coefficient of the power plant (including SCE effects) - 101.00%
31;
- Electricity consumption for own needs - 14.30%32
.
Assumptions used in calculations of the amount of energy produced in biomass fired cogeneration plant in case of the PEA development alternative No 2:
- Electricity efficiency coefficient of the power plant - 29.00%33
; - Heat efficiency coefficient of the power plant (excluding SCE effects) - 64.00%
34;
- Heat efficiency coefficient of the power plant (including SCE effects) - 77.00%35
; - Electricity consumption for own needs - 14.30%
36.
1.4. Fuel and energy consumption The waste incineration unit of Vilnius Combined Heat and Power Plant will burn the following:
- waste, i.e. non-hazardous municipal waste remaining after the treatment in MBT facilities, which is unfit for recycling, but contains energy value, including solid recovered fuel (SRF) (also known as refuse-derived fuel (RDF) or Specified Recovered Fuel (SRF)) and commercial, industrial, institutional waste, which is similar to municipal waste in its nature and composition (Environmental Requirements for Waste Incineration, 31-12-2002 No 699 31-03-2003, No 31-1290, as subsequently amended);
Waste incineration plant is designed, built, equipped and operated as in the process the flue gas temperature near the inner wall of the combustion chamber or in the other typical measurement spots appointed by competent authority after the last air supply even in the most adverse conditions have to be raised up to 850°C for the period of no less than 2 s. For temperature regulation in the waste incineration boiler at least one additional burner will be established. This burner automatically operates if after the last air supply flue gas temperature falls below 850°C. It is also used every time at the beginning or ending of burning operation, due to guarantee of remaining 850°C at all times of operation. It is planned to use natural gas for additional burners. The possibility of using biomass (wood or dried sludge) as reserve fuel for launching and stopping is also planned. In this case biomass will be used at the launching till 60 % of boiler capacity will be reached and for the stopping while furnace has no more waste left. Biomass also could be used for maintaining the temperature because of decreased colorific value of waste and for reducing the amount of natural gas used and CO2. The biomass fired unit of Vilnius Combined Heat and Power Plant will burn the following types of fuel:
- biomass, i.e. solid products produced from raw materials, waste and residues of forestry and related industries used for energy production: woodchips, wood waste, logging waste, sawdust, pellets and straw (straw pellets).
1.4.1. Information on waste burnt in the Vilnius Combined Heat and Power Plant
30
Assumption made by the author 31
Technology data for energy plants 2012, Waste to energy CHP plant, Total efficiency (%) gross 32
Technology data for energy plants 2012, Waste to energy CHP plant, Electricity efficiency (%) gross/net (derivative
figure) 33
Technology data for energy plants 2012, Medium steam turbine, woodchips, Electricity efficiency (%) net 34
Technology data for energy plants 2012, Medium steam turbine, woodchips, Heat efficiency (%) net; without flue gas
condensation 35
Technology data for energy plants 2012, Medium steam turbine, woodchips, Heat efficiency (%) net; with flue gas
condensation 36
Same as in case of the municipal waste TPP, according to Technology data for energy plants 2012, Waste to energy
CHP plant, Electricity efficiency (%) gross/net (derivative figure)

Vilnius Combined Heat and Power Plant will burn municipal waste remaining after the treatment in MBT facilities, i.e. sorted municipal waste, which is unfit for recycling, including solid recovered fuel (hereinafter - SRF) and commercial, industrial, institutional waste, which is similar to municipal waste in its nature and composition. According to the definition presented in the Law on Waste Management of the Republic of Lithuania (16-06-1991, No VIII-787, Official Gazette, 1998, No 61-1726, as subsequently amended) municipal waste means household waste (waste generated in households) and other waste, which is similar to municipal waste in the nature or composition thereof. Pursuant to the list of waste presented in the Waste Management Rules (17-07-1999, No 217, Official Gazette, 1999, No 63-2065, as subsequently amended) similar commercial, industrial and organizational waste, including individually collected fractions, is attributable to the municipal waste group (20 000). A definition of mixed municipal waste was introduced by Environmental Requirements for Waste Incineration approved by Order No 699 of the Minister of Environment of the Republic of Lithuania of 31 December 2002 (as subsequently amended). Mixed municipal waste means waste generated in households and commercial, industrial and institutional waste, which is similar to municipal waste in its nature and composition, except for waste coded 20 01 in the list of waste (Official Gazette, 1999, No. 63-2065), which is collected individually at source, and waste coded 20 02. Based on the clarification of the Ministry of Environment of the Republic of Lithuania presented in its letter No (17-1)-D8-1477 On the Provision of Information (Annex No 3), waste remaining after the treatment in MBT facilities, which is unfit for recycling, but contains energy value, or solid recovered fuel is obtained by treating mixed municipal waste, and they are attributed to treated and sorted municipal waste.
Energy potential of municipal waste Municipal waste accounts for about 25 percent of the total waste generated in Lithuania
37. According to the
national waste accounting data, about 1.28 million tonnes of municipal waste was collected in Lithuania in 2013 (see table below)
38 or ~435 kg per capita, compared to ~487 kg of municipal waste per capita in EU28
in 2012 (which was ~9% more than in Lithuania in that same year).
Table 2: Table 1.4.1 Municipal waste generation and management in Lithuania in 2004-2013
Municipal waste, thousand tonnes
2004 2005 2006 2007 2008 2009 2010 2011 2012 2013
Generated municipal waste
1260 (100%)
1287 (100%)
1326 (100%)
1354 (100%)
1369 (100%)
1206 (100%)
1253 (100%)
1339 (100%)
1330 (100%)
1280 (100%)
Generated municipal waste per capita
373 387 405 419 428 381 404 442 44839
435
Landfilled 1153 (92%)
1174 (91%)
1211 (91%)
1245 (92%)
1237 (90%)
1093 (91%)
1079 (86%)
1034 (77%)
970.6 (73%)
798.3 (62%)
Recycled (including export for recycling)
14 (1%) 14 (1%) 14 (1%)
80 (6%)
101 (7%)
87 (7%)
140 (11%)
244.1 (18%)
261.2 (20%)
261.3 (20%)
Transformed in boiler houses and power plants by extracting energy
0 (0%) 0 (0%) 0 (0%) 0 (0%) 0 (0%) 0 (0%) 1 (0%) 5,6 (0.4%)
0,2 (0%)
91,3 (7%)
Mixed municipal waste comprises the major share of collected municipal waste. In 2011, it accounted for ~72% in the total municipal waste flow
40.
37
National Waste Management Plan for 2014-2020. Internet access:
http://www3.lrs.lt/pls/inter3/dokpaieska.showdoc_I?p_id=470278
38
Environmental Protection Agency: http://atliekos.gamta.lt/ 39
Indicator calculated in 2012, 2013 using data from the Statistics Lithuania: http://osp.stat.gov.lt/statistiniu-rodikliu-
analize>Gyventojai ir socialinė statistika>Gyventojai>Mėnesiniai demografiniai rodikliai
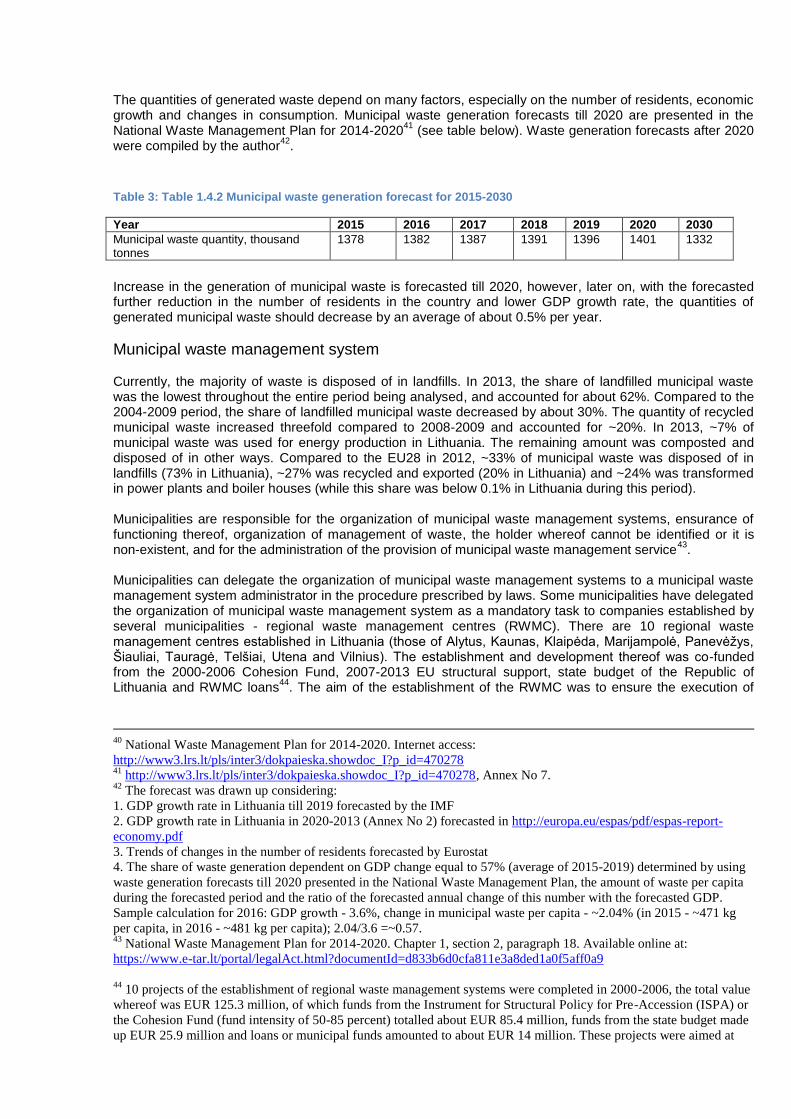
The quantities of generated waste depend on many factors, especially on the number of residents, economic growth and changes in consumption. Municipal waste generation forecasts till 2020 are presented in the National Waste Management Plan for 2014-2020
41 (see table below). Waste generation forecasts after 2020
were compiled by the author42
.
Table 3: Table 1.4.2 Municipal waste generation forecast for 2015-2030
Year 2015 2016 2017 2018 2019 2020 2030
Municipal waste quantity, thousand tonnes
1378 1382 1387 1391 1396 1401 1332
Increase in the generation of municipal waste is forecasted till 2020, however, later on, with the forecasted further reduction in the number of residents in the country and lower GDP growth rate, the quantities of generated municipal waste should decrease by an average of about 0.5% per year.
Municipal waste management system Currently, the majority of waste is disposed of in landfills. In 2013, the share of landfilled municipal waste was the lowest throughout the entire period being analysed, and accounted for about 62%. Compared to the 2004-2009 period, the share of landfilled municipal waste decreased by about 30%. The quantity of recycled municipal waste increased threefold compared to 2008-2009 and accounted for ~20%. In 2013, ~7% of municipal waste was used for energy production in Lithuania. The remaining amount was composted and disposed of in other ways. Compared to the EU28 in 2012, ~33% of municipal waste was disposed of in landfills (73% in Lithuania), ~27% was recycled and exported (20% in Lithuania) and ~24% was transformed in power plants and boiler houses (while this share was below 0.1% in Lithuania during this period). Municipalities are responsible for the organization of municipal waste management systems, ensurance of functioning thereof, organization of management of waste, the holder whereof cannot be identified or it is non-existent, and for the administration of the provision of municipal waste management service
43.
Municipalities can delegate the organization of municipal waste management systems to a municipal waste management system administrator in the procedure prescribed by laws. Some municipalities have delegated the organization of municipal waste management system as a mandatory task to companies established by several municipalities - regional waste management centres (RWMC). There are 10 regional waste management centres established in Lithuania (those of Alytus, Kaunas, Klaipėda, Marijampolė, Panevėžys, Šiauliai, Tauragė, Telšiai, Utena and Vilnius). The establishment and development thereof was co-funded from the 2000-2006 Cohesion Fund, 2007-2013 EU structural support, state budget of the Republic of Lithuania and RWMC loans
44. The aim of the establishment of the RWMC was to ensure the execution of
40
National Waste Management Plan for 2014-2020. Internet access:
http://www3.lrs.lt/pls/inter3/dokpaieska.showdoc_I?p_id=470278 41
http://www3.lrs.lt/pls/inter3/dokpaieska.showdoc_I?p_id=470278, Annex No 7. 42
The forecast was drawn up considering:
1. GDP growth rate in Lithuania till 2019 forecasted by the IMF
2. GDP growth rate in Lithuania in 2020-2013 (Annex No 2) forecasted in http://europa.eu/espas/pdf/espas-report-
economy.pdf
3. Trends of changes in the number of residents forecasted by Eurostat
4. The share of waste generation dependent on GDP change equal to 57% (average of 2015-2019) determined by using
waste generation forecasts till 2020 presented in the National Waste Management Plan, the amount of waste per capita
during the forecasted period and the ratio of the forecasted annual change of this number with the forecasted GDP.
Sample calculation for 2016: GDP growth - 3.6%, change in municipal waste per capita - ~2.04% (in 2015 - ~471 kg
per capita, in 2016 - ~481 kg per capita); 2.04/3.6 =~0.57. 43
National Waste Management Plan for 2014-2020. Chapter 1, section 2, paragraph 18. Available online at:
https://www.e-tar.lt/portal/legalAct.html?documentId=d833b6d0cfa811e3a8ded1a0f5aff0a9
44
10 projects of the establishment of regional waste management systems were completed in 2000-2006, the total value
whereof was EUR 125.3 million, of which funds from the Instrument for Structural Policy for Pre-Accession (ISPA) or
the Cohesion Fund (fund intensity of 50-85 percent) totalled about EUR 85.4 million, funds from the state budget made
up EUR 25.9 million and loans or municipal funds amounted to about EUR 14 million. These projects were aimed at
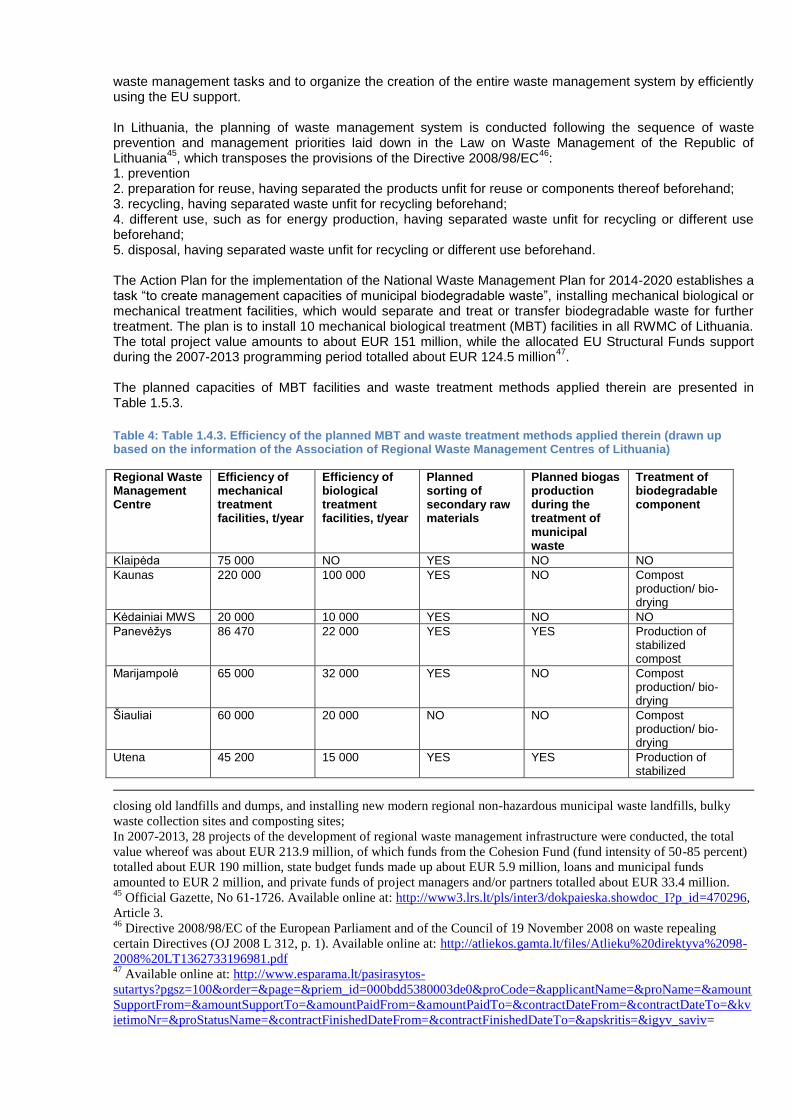
waste management tasks and to organize the creation of the entire waste management system by efficiently using the EU support. In Lithuania, the planning of waste management system is conducted following the sequence of waste prevention and management priorities laid down in the Law on Waste Management of the Republic of Lithuania
45, which transposes the provisions of the Directive 2008/98/EC
46:
1. prevention 2. preparation for reuse, having separated the products unfit for reuse or components thereof beforehand; 3. recycling, having separated waste unfit for recycling beforehand; 4. different use, such as for energy production, having separated waste unfit for recycling or different use beforehand; 5. disposal, having separated waste unfit for recycling or different use beforehand. The Action Plan for the implementation of the National Waste Management Plan for 2014-2020 establishes a task “to create management capacities of municipal biodegradable waste”, installing mechanical biological or mechanical treatment facilities, which would separate and treat or transfer biodegradable waste for further treatment. The plan is to install 10 mechanical biological treatment (MBT) facilities in all RWMC of Lithuania. The total project value amounts to about EUR 151 million, while the allocated EU Structural Funds support during the 2007-2013 programming period totalled about EUR 124.5 million
47.
The planned capacities of MBT facilities and waste treatment methods applied therein are presented in Table 1.5.3.
Table 4: Table 1.4.3. Efficiency of the planned MBT and waste treatment methods applied therein (drawn up based on the information of the Association of Regional Waste Management Centres of Lithuania)
Regional Waste Management Centre
Efficiency of mechanical treatment facilities, t/year
Efficiency of biological treatment facilities, t/year
Planned sorting of secondary raw materials
Planned biogas production during the treatment of municipal waste
Treatment of biodegradable component
Klaipėda 75 000 NO YES NO NO
Kaunas 220 000 100 000 YES NO Compost production/ bio-drying
Kėdainiai MWS 20 000 10 000 YES NO NO
Panevėžys 86 470 22 000 YES YES Production of stabilized compost
Marijampolė 65 000 32 000 YES NO Compost production/ bio-drying
Šiauliai 60 000 20 000 NO NO Compost production/ bio-drying
Utena 45 200 15 000 YES YES Production of stabilized
closing old landfills and dumps, and installing new modern regional non-hazardous municipal waste landfills, bulky
waste collection sites and composting sites;
In 2007-2013, 28 projects of the development of regional waste management infrastructure were conducted, the total
value whereof was about EUR 213.9 million, of which funds from the Cohesion Fund (fund intensity of 50-85 percent)
totalled about EUR 190 million, state budget funds made up about EUR 5.9 million, loans and municipal funds
amounted to EUR 2 million, and private funds of project managers and/or partners totalled about EUR 33.4 million. 45
Official Gazette, No 61-1726. Available online at: http://www3.lrs.lt/pls/inter3/dokpaieska.showdoc_I?p_id=470296,
Article 3. 46
Directive 2008/98/EC of the European Parliament and of the Council of 19 November 2008 on waste repealing
certain Directives (OJ 2008 L 312, p. 1). Available online at: http://atliekos.gamta.lt/files/Atlieku%20direktyva%2098-
2008%20LT1362733196981.pdf 47
Available online at: http://www.esparama.lt/pasirasytos-
sutartys?pgsz=100&order=&page=&priem_id=000bdd5380003de0&proCode=&applicantName=&proName=&amount
SupportFrom=&amountSupportTo=&amountPaidFrom=&amountPaidTo=&contractDateFrom=&contractDateTo=&kv
ietimoNr=&proStatusName=&contractFinishedDateFrom=&contractFinishedDateTo=&apskritis=&igyv_saviv=
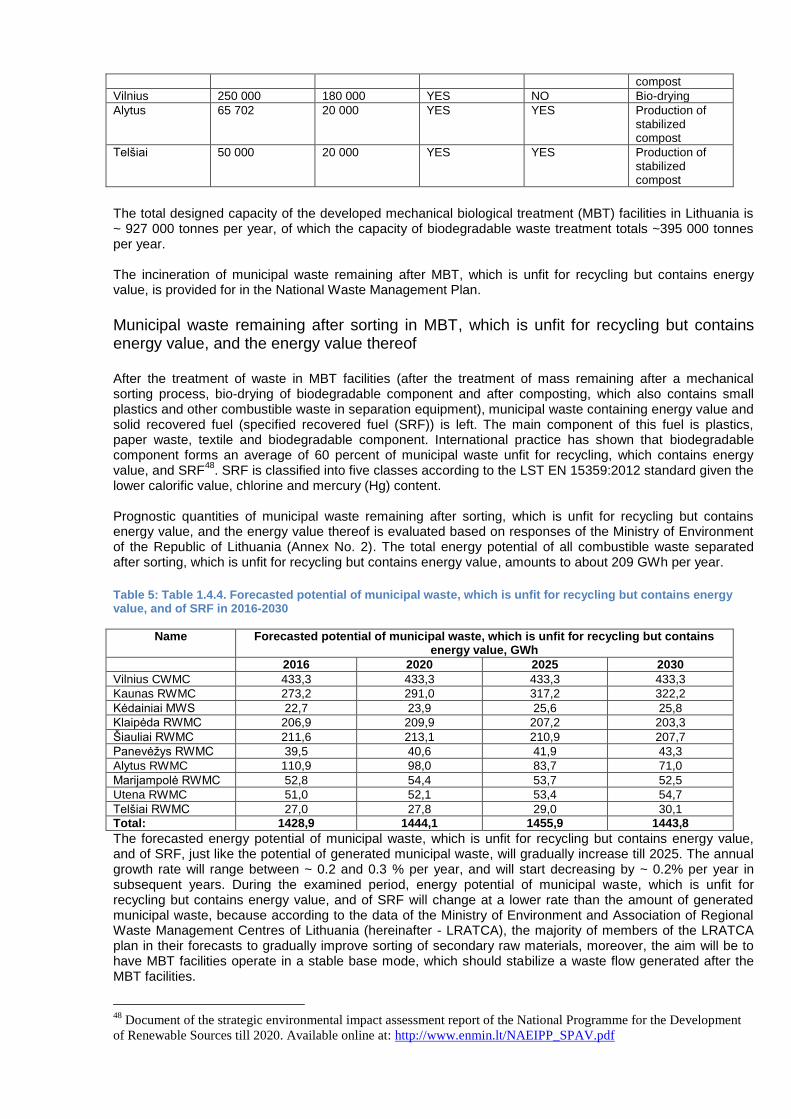
compost
Vilnius 250 000 180 000 YES NO Bio-drying
Alytus 65 702 20 000 YES YES Production of stabilized compost
Telšiai 50 000 20 000 YES YES Production of stabilized compost
The total designed capacity of the developed mechanical biological treatment (MBT) facilities in Lithuania is ~ 927 000 tonnes per year, of which the capacity of biodegradable waste treatment totals ~395 000 tonnes per year. The incineration of municipal waste remaining after MBT, which is unfit for recycling but contains energy value, is provided for in the National Waste Management Plan.
Municipal waste remaining after sorting in MBT, which is unfit for recycling but contains energy value, and the energy value thereof After the treatment of waste in MBT facilities (after the treatment of mass remaining after a mechanical sorting process, bio-drying of biodegradable component and after composting, which also contains small plastics and other combustible waste in separation equipment), municipal waste containing energy value and solid recovered fuel (specified recovered fuel (SRF)) is left. The main component of this fuel is plastics, paper waste, textile and biodegradable component. International practice has shown that biodegradable component forms an average of 60 percent of municipal waste unfit for recycling, which contains energy value, and SRF
48. SRF is classified into five classes according to the LST EN 15359:2012 standard given the
lower calorific value, chlorine and mercury (Hg) content. Prognostic quantities of municipal waste remaining after sorting, which is unfit for recycling but contains energy value, and the energy value thereof is evaluated based on responses of the Ministry of Environment of the Republic of Lithuania (Annex No. 2). The total energy potential of all combustible waste separated after sorting, which is unfit for recycling but contains energy value, amounts to about 209 GWh per year.
Table 5: Table 1.4.4. Forecasted potential of municipal waste, which is unfit for recycling but contains energy value, and of SRF in 2016-2030
Name Forecasted potential of municipal waste, which is unfit for recycling but contains energy value, GWh
2016 2020 2025 2030
Vilnius CWMC 433,3 433,3 433,3 433,3
Kaunas RWMC 273,2 291,0 317,2 322,2
Kėdainiai MWS 22,7 23,9 25,6 25,8
Klaipėda RWMC 206,9 209,9 207,2 203,3
Šiauliai RWMC 211,6 213,1 210,9 207,7
Panevėžys RWMC 39,5 40,6 41,9 43,3
Alytus RWMC 110,9 98,0 83,7 71,0
Marijampolė RWMC 52,8 54,4 53,7 52,5
Utena RWMC 51,0 52,1 53,4 54,7
Telšiai RWMC 27,0 27,8 29,0 30,1
Total: 1428,9 1444,1 1455,9 1443,8
The forecasted energy potential of municipal waste, which is unfit for recycling but contains energy value, and of SRF, just like the potential of generated municipal waste, will gradually increase till 2025. The annual growth rate will range between ~ 0.2 and 0.3 % per year, and will start decreasing by ~ 0.2% per year in subsequent years. During the examined period, energy potential of municipal waste, which is unfit for recycling but contains energy value, and of SRF will change at a lower rate than the amount of generated municipal waste, because according to the data of the Ministry of Environment and Association of Regional Waste Management Centres of Lithuania (hereinafter - LRATCA), the majority of members of the LRATCA plan in their forecasts to gradually improve sorting of secondary raw materials, moreover, the aim will be to have MBT facilities operate in a stable base mode, which should stabilize a waste flow generated after the MBT facilities.
48
Document of the strategic environmental impact assessment report of the National Programme for the Development
of Renewable Sources till 2020. Available online at: http://www.enmin.lt/NAEIPP_SPAV.pdf
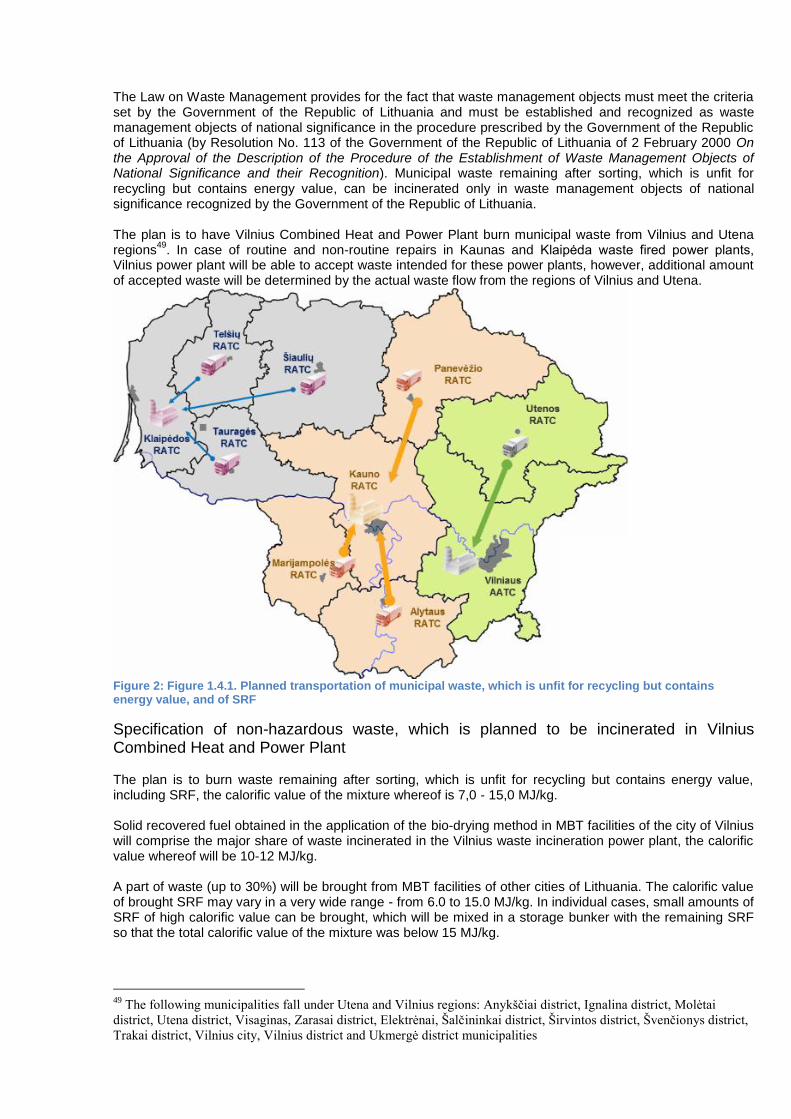
The Law on Waste Management provides for the fact that waste management objects must meet the criteria set by the Government of the Republic of Lithuania and must be established and recognized as waste management objects of national significance in the procedure prescribed by the Government of the Republic of Lithuania (by Resolution No. 113 of the Government of the Republic of Lithuania of 2 February 2000 On the Approval of the Description of the Procedure of the Establishment of Waste Management Objects of National Significance and their Recognition). Municipal waste remaining after sorting, which is unfit for recycling but contains energy value, can be incinerated only in waste management objects of national significance recognized by the Government of the Republic of Lithuania. The plan is to have Vilnius Combined Heat and Power Plant burn municipal waste from Vilnius and Utena regions
49. In case of routine and non-routine repairs in Kaunas and Klaipėda waste fired power plants,
Vilnius power plant will be able to accept waste intended for these power plants, however, additional amount of accepted waste will be determined by the actual waste flow from the regions of Vilnius and Utena.
Figure 2: Figure 1.4.1. Planned transportation of municipal waste, which is unfit for recycling but contains energy value, and of SRF
Specification of non-hazardous waste, which is planned to be incinerated in Vilnius Combined Heat and Power Plant The plan is to burn waste remaining after sorting, which is unfit for recycling but contains energy value, including SRF, the calorific value of the mixture whereof is 7,0 - 15,0 MJ/kg. Solid recovered fuel obtained in the application of the bio-drying method in MBT facilities of the city of Vilnius will comprise the major share of waste incinerated in the Vilnius waste incineration power plant, the calorific value whereof will be 10-12 MJ/kg. A part of waste (up to 30%) will be brought from MBT facilities of other cities of Lithuania. The calorific value of brought SRF may vary in a very wide range - from 6.0 to 15.0 MJ/kg. In individual cases, small amounts of SRF of high calorific value can be brought, which will be mixed in a storage bunker with the remaining SRF so that the total calorific value of the mixture was below 15 MJ/kg.
49
The following municipalities fall under Utena and Vilnius regions: Anykščiai district, Ignalina district, Molėtai
district, Utena district, Visaginas, Zarasai district, Elektrėnai, Šalčininkai district, Širvintos district, Švenčionys district,
Trakai district, Vilnius city, Vilnius district and Ukmergė district municipalities
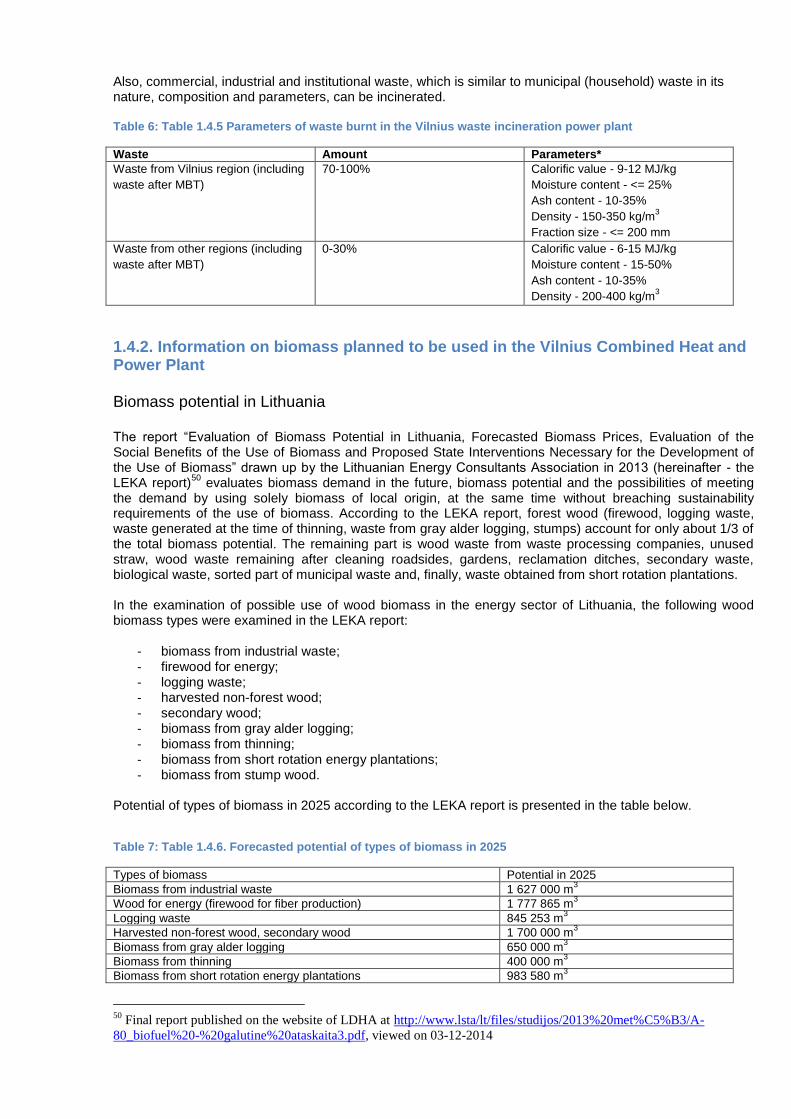
Also, commercial, industrial and institutional waste, which is similar to municipal (household) waste in its nature, composition and parameters, can be incinerated. Table 6: Table 1.4.5 Parameters of waste burnt in the Vilnius waste incineration power plant
Waste Amount Parameters*
Waste from Vilnius region (including
waste after MBT)
70-100% Calorific value - 9-12 MJ/kg
Moisture content - <= 25%
Ash content - 10-35%
Density - 150-350 kg/m3
Fraction size - <= 200 mm
Waste from other regions (including
waste after MBT)
0-30% Calorific value - 6-15 MJ/kg
Moisture content - 15-50%
Ash content - 10-35%
Density - 200-400 kg/m3
1.4.2. Information on biomass planned to be used in the Vilnius Combined Heat and Power Plant Biomass potential in Lithuania The report “Evaluation of Biomass Potential in Lithuania, Forecasted Biomass Prices, Evaluation of the Social Benefits of the Use of Biomass and Proposed State Interventions Necessary for the Development of the Use of Biomass” drawn up by the Lithuanian Energy Consultants Association in 2013 (hereinafter - the LEKA report)
50 evaluates biomass demand in the future, biomass potential and the possibilities of meeting
the demand by using solely biomass of local origin, at the same time without breaching sustainability requirements of the use of biomass. According to the LEKA report, forest wood (firewood, logging waste, waste generated at the time of thinning, waste from gray alder logging, stumps) account for only about 1/3 of the total biomass potential. The remaining part is wood waste from waste processing companies, unused straw, wood waste remaining after cleaning roadsides, gardens, reclamation ditches, secondary waste, biological waste, sorted part of municipal waste and, finally, waste obtained from short rotation plantations. In the examination of possible use of wood biomass in the energy sector of Lithuania, the following wood biomass types were examined in the LEKA report:
- biomass from industrial waste; - firewood for energy; - logging waste; - harvested non-forest wood; - secondary wood; - biomass from gray alder logging; - biomass from thinning; - biomass from short rotation energy plantations; - biomass from stump wood.
Potential of types of biomass in 2025 according to the LEKA report is presented in the table below.
Table 7: Table 1.4.6. Forecasted potential of types of biomass in 2025
Types of biomass Potential in 2025
Biomass from industrial waste 1 627 000 m3
Wood for energy (firewood for fiber production) 1 777 865 m3
Logging waste 845 253 m3
Harvested non-forest wood, secondary wood 1 700 000 m3
Biomass from gray alder logging 650 000 m3
Biomass from thinning 400 000 m3
Biomass from short rotation energy plantations 983 580 m3
50
Final report published on the website of LDHA at http://www.lsta/lt/files/studijos/2013%20met%C5%B3/A-
80_biofuel%20-%20galutine%20ataskaita3.pdf, viewed on 03-12-2014

Biomass from stump wood 644 601 m3
TOTAL: 8 628 299 m3
(1 482 526 tne)
The forecasted potential of wood biomass in 2025 is ~8-9 million m3 per year or about 17 TWh per year.
According to LEKA, the forecasted growth in biomass demand is ensured maintaining all environmental and sustainability requirements, considering that logging will account for less than 50% of the annual wood growth rate in Lithuanian forests, also ensuring the maintenance of quality of soil and using straw for energy production. Solid wood biomass is traded in Lithuania by concluding direct transactions and through the energy exchange. The Law on the Energy Resources Market of the Republic of Lithuania establishes an obligation for heat suppliers, HIS and producers generating heat and electricity in the general technological cycle to purchase 10 percent of the amount of biomass necessary for energy production in 2014, at least 30 percent in 2015 and at least 50 percent of the amount of biomass necessary for energy production in 2016 and subsequent years. The need for biomass in Lithuania has continuously increased, and ~12 TWh thereof was used in Lithuania in 2013. Largest quantities of biomass are used in households (boilers and furnaces) (~58 %) and about 27% - for transforming energy in boiler houses and power plants. Annual wood biomass potential forecasted in the LEKA report is about 17 TWh, and that of straw - ~5.1 TWh. Having assessed the current demand for wood biomass, free potential of wood biomass, without considering the energy potential of straws, would total ~5 TWh per year, which corresponds to about 600 MW of installed capacities of energy production facilities. The energy exchange operating in Lithuania ensures favorable conditions for the supply with biomass, and this is treated as a favorable circumstance for the implementation of energy projects, which would increase the use of fuel from renewable sources.
Specifics of biomass burnt in the Vilnius Combined Heat and Power Plant The plan is to use class P63 or P100 biomass (wood chips) in the Vilnius Combined Heat and Power Plant according to the CEN/TS 14961:2005 (D) classification. Other biomass, such as tree bark, wood waste, logging waste, sawdust, pellets, straw (straw pellets) could also be burnt. Table 8: Table 1.4.7. Approximate composition and calorific values of wood chips (according to KTU, 2015)
Parameter Unit of measure
Value
Wood chips* Logging waste (bark, branches and others)
Straw
Moisture content % 30-55 (average 45) 35-60 (average 50) 10-30 (average 20)
Volatile matter weight % DM 80-84 (average 82) 80-84 (average 82) 74-77 (average 75)
Lower calorific value (LCV) of dry matter
MJ/kg 18.4-19.8 (average 19.1) 18.3-20.5 (18.7) 15.8-19.1 (average 17.6)
Lower calorific value (LCV) of wet matter
MJ/kg 11.3-7.1 (average 9.25) 11.6-6.2 (8.37) 15.6-11.6 (average 13.6)
Ash content weight % DM 0.1-1.0 (average 0.6) <1-10 (average 3-5) 2-10 (average 5)
Hydrogen, H % 5.6-7.0 5.7-6.2 5.4-6.5
Carbon, C % 47-54 48-52 41-50
Oxygen, O % 40-45 38-44 36-45
Sulphur, S % < 0.02 <0.02-0.08 <0.05-0.2
Nitrogen, N % 0.1-0.5 0.3-0.8 0.2-1.5
Chlorine, Cl % <0.01-0.03 <0.01-0.04 <0.1-1.2
Sodium, Na mg/kg DM average 20-50 average 100-200 average 500
Potassium, K mg/kg DM average 400-800 average 1 500-2 000 average 10 000
Note: *all percentage expressions are indicated based on the percentage of dry solid state matter.
A possibility for mixing up to 30% of so-called intermediate fuel, tree bark and industrial chips (dry wood chips) will be provided in the biomass fired cogeneration unit of the Vilnius Combined Heat and Power Plant (PEA development alternative No 2). Moisture content of biomass burnt in biomass fired cogeneration unit of
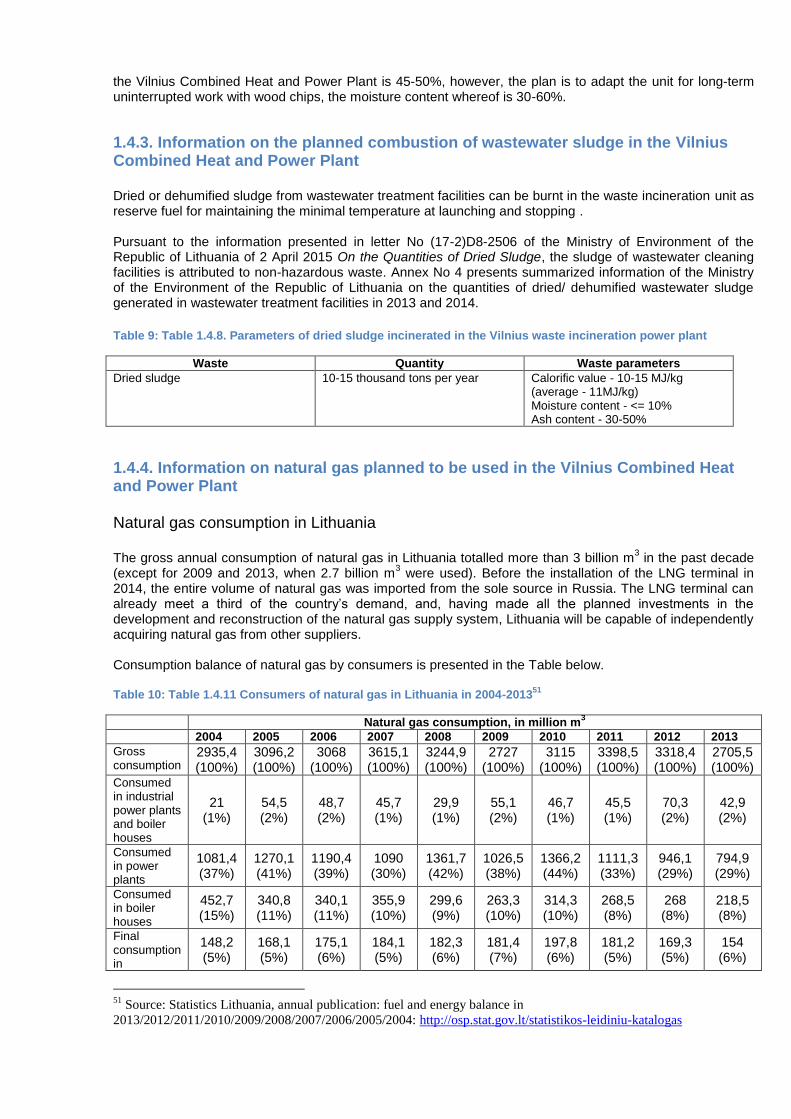
the Vilnius Combined Heat and Power Plant is 45-50%, however, the plan is to adapt the unit for long-term uninterrupted work with wood chips, the moisture content whereof is 30-60%.
1.4.3. Information on the planned combustion of wastewater sludge in the Vilnius Combined Heat and Power Plant Dried or dehumified sludge from wastewater treatment facilities can be burnt in the waste incineration unit as reserve fuel for maintaining the minimal temperature at launching and stopping . Pursuant to the information presented in letter No (17-2)D8-2506 of the Ministry of Environment of the Republic of Lithuania of 2 April 2015 On the Quantities of Dried Sludge, the sludge of wastewater cleaning facilities is attributed to non-hazardous waste. Annex No 4 presents summarized information of the Ministry of the Environment of the Republic of Lithuania on the quantities of dried/ dehumified wastewater sludge generated in wastewater treatment facilities in 2013 and 2014.
Table 9: Table 1.4.8. Parameters of dried sludge incinerated in the Vilnius waste incineration power plant
Waste Quantity Waste parameters
Dried sludge 10-15 thousand tons per year Calorific value - 10-15 MJ/kg (average - 11MJ/kg) Moisture content - <= 10% Ash content - 30-50%
1.4.4. Information on natural gas planned to be used in the Vilnius Combined Heat and Power Plant Natural gas consumption in Lithuania The gross annual consumption of natural gas in Lithuania totalled more than 3 billion m
3 in the past decade
(except for 2009 and 2013, when 2.7 billion m3 were used). Before the installation of the LNG terminal in
2014, the entire volume of natural gas was imported from the sole source in Russia. The LNG terminal can already meet a third of the country’s demand, and, having made all the planned investments in the development and reconstruction of the natural gas supply system, Lithuania will be capable of independently acquiring natural gas from other suppliers. Consumption balance of natural gas by consumers is presented in the Table below. Table 10: Table 1.4.11 Consumers of natural gas in Lithuania in 2004-2013
51
Natural gas consumption, in million m3
2004 2005 2006 2007 2008 2009 2010 2011 2012 2013
Gross consumption
2935,4 (100%)
3096,2 (100%)
3068 (100%)
3615,1 (100%)
3244,9 (100%)
2727 (100%)
3115 (100%)
3398,5 (100%)
3318,4 (100%)
2705,5 (100%)
Consumed in industrial power plants and boiler houses
21 (1%)
54,5 (2%)
48,7 (2%)
45,7 (1%)
29,9 (1%)
55,1 (2%)
46,7 (1%)
45,5 (1%)
70,3 (2%)
42,9 (2%)
Consumed in power plants
1081,4 (37%)
1270,1 (41%)
1190,4 (39%)
1090 (30%)
1361,7 (42%)
1026,5 (38%)
1366,2 (44%)
1111,3 (33%)
946,1 (29%)
794,9 (29%)
Consumed in boiler houses
452,7 (15%)
340,8 (11%)
340,1 (11%)
355,9 (10%)
299,6 (9%)
263,3 (10%)
314,3 (10%)
268,5 (8%)
268 (8%)
218,5 (8%)
Final consumption in
148,2 (5%)
168,1 (5%)
175,1 (6%)
184,1 (5%)
182,3 (6%)
181,4 (7%)
197,8 (6%)
181,2 (5%)
169,3 (5%)
154 (6%)
51
Source: Statistics Lithuania, annual publication: fuel and energy balance in
2013/2012/2011/2010/2009/2008/2007/2006/2005/2004: http://osp.stat.gov.lt/statistikos-leidiniu-katalogas
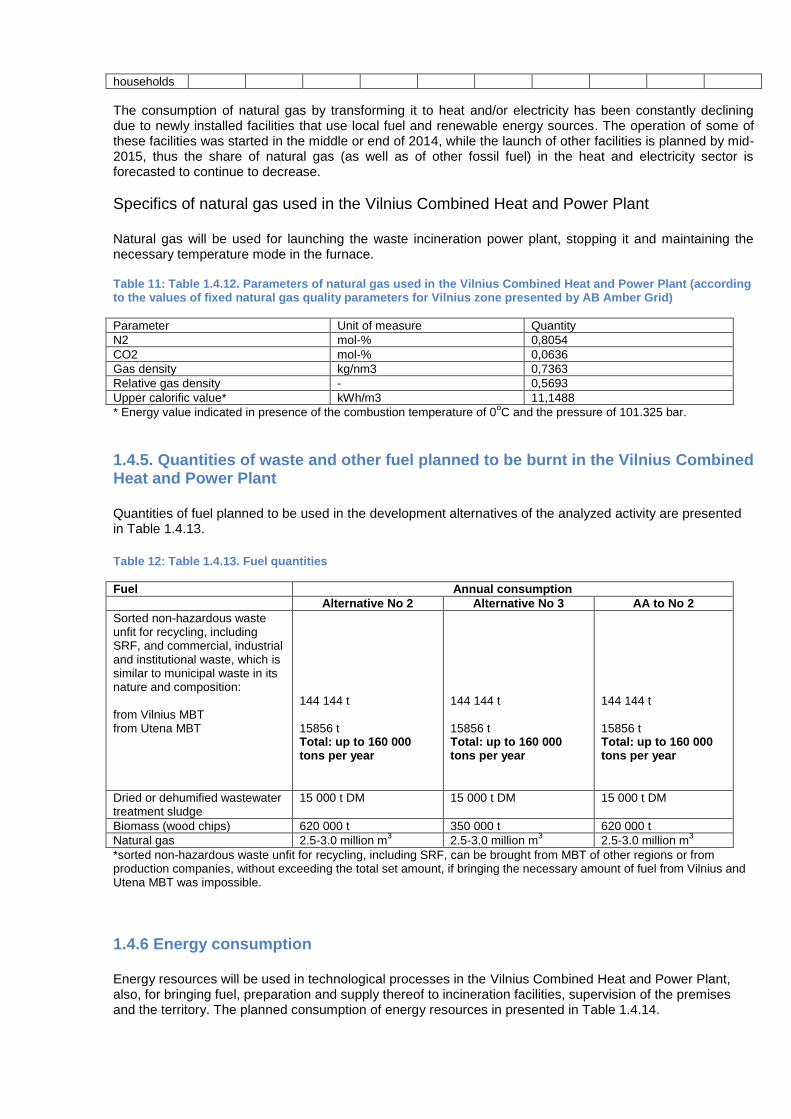
households
The consumption of natural gas by transforming it to heat and/or electricity has been constantly declining due to newly installed facilities that use local fuel and renewable energy sources. The operation of some of these facilities was started in the middle or end of 2014, while the launch of other facilities is planned by mid-2015, thus the share of natural gas (as well as of other fossil fuel) in the heat and electricity sector is forecasted to continue to decrease.
Specifics of natural gas used in the Vilnius Combined Heat and Power Plant Natural gas will be used for launching the waste incineration power plant, stopping it and maintaining the necessary temperature mode in the furnace. Table 11: Table 1.4.12. Parameters of natural gas used in the Vilnius Combined Heat and Power Plant (according to the values of fixed natural gas quality parameters for Vilnius zone presented by AB Amber Grid)
Parameter Unit of measure Quantity
N2 mol-% 0,8054
CO2 mol-% 0,0636
Gas density kg/nm3 0,7363
Relative gas density - 0,5693
Upper calorific value* kWh/m3 11,1488
* Energy value indicated in presence of the combustion temperature of 0oC and the pressure of 101.325 bar.
1.4.5. Quantities of waste and other fuel planned to be burnt in the Vilnius Combined Heat and Power Plant Quantities of fuel planned to be used in the development alternatives of the analyzed activity are presented in Table 1.4.13.
Table 12: Table 1.4.13. Fuel quantities
Fuel Annual consumption
Alternative No 2 Alternative No 3 AA to No 2
Sorted non-hazardous waste unfit for recycling, including SRF, and commercial, industrial and institutional waste, which is similar to municipal waste in its nature and composition: from Vilnius MBT from Utena MBT
144 144 t 15856 t Total: up to 160 000 tons per year
144 144 t 15856 t Total: up to 160 000 tons per year
144 144 t 15856 t Total: up to 160 000 tons per year
Dried or dehumified wastewater treatment sludge
15 000 t DM 15 000 t DM 15 000 t DM
Biomass (wood chips) 620 000 t 350 000 t 620 000 t
Natural gas 2.5-3.0 million m3 2.5-3.0 million m
3 2.5-3.0 million m
3
*sorted non-hazardous waste unfit for recycling, including SRF, can be brought from MBT of other regions or from production companies, without exceeding the total set amount, if bringing the necessary amount of fuel from Vilnius and Utena MBT was impossible.
1.4.6 Energy consumption Energy resources will be used in technological processes in the Vilnius Combined Heat and Power Plant, also, for bringing fuel, preparation and supply thereof to incineration facilities, supervision of the premises and the territory. The planned consumption of energy resources in presented in Table 1.4.14.
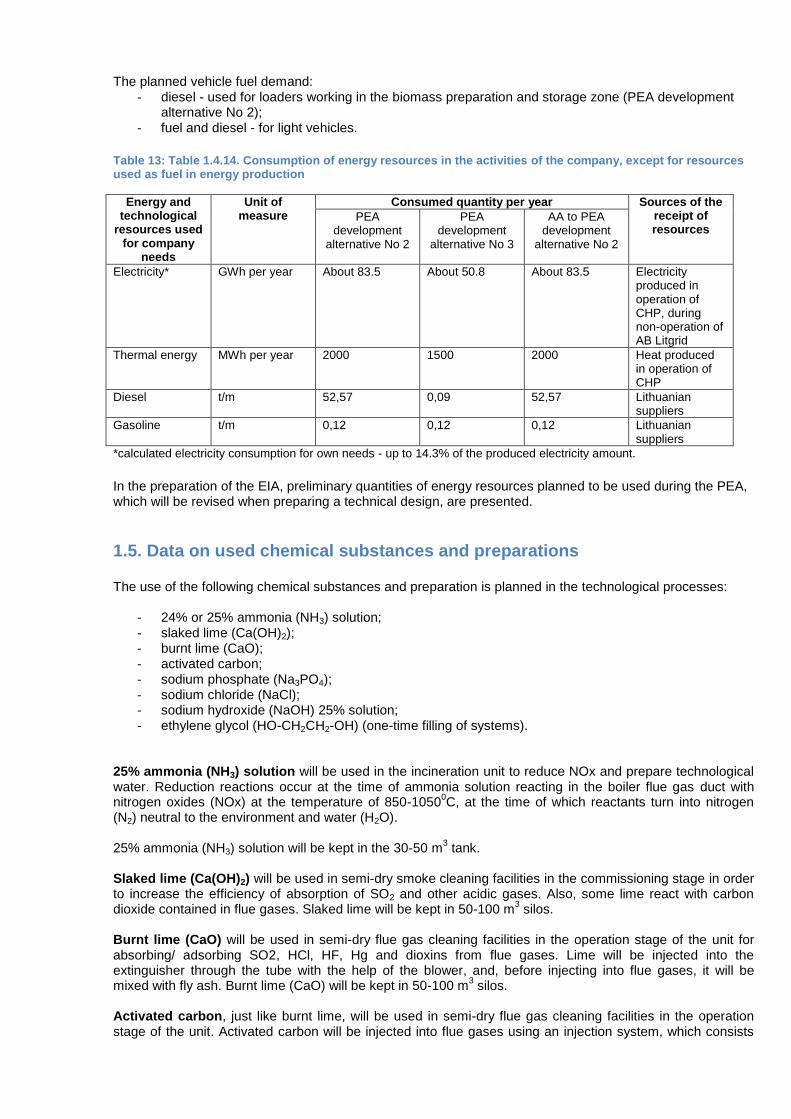
The planned vehicle fuel demand: - diesel - used for loaders working in the biomass preparation and storage zone (PEA development
alternative No 2); - fuel and diesel - for light vehicles.
Table 13: Table 1.4.14. Consumption of energy resources in the activities of the company, except for resources used as fuel in energy production
Energy and technological
resources used for company
needs
Unit of measure
Consumed quantity per year Sources of the receipt of resources
PEA development
alternative No 2
PEA development
alternative No 3
AA to PEA development
alternative No 2
Electricity* GWh per year About 83.5 About 50.8 About 83.5 Electricity produced in operation of CHP, during non-operation of AB Litgrid
Thermal energy MWh per year 2000 1500 2000 Heat produced in operation of CHP
Diesel t/m 52,57 0,09 52,57 Lithuanian suppliers
Gasoline t/m 0,12 0,12 0,12 Lithuanian suppliers
*calculated electricity consumption for own needs - up to 14.3% of the produced electricity amount.
In the preparation of the EIA, preliminary quantities of energy resources planned to be used during the PEA, which will be revised when preparing a technical design, are presented.
1.5. Data on used chemical substances and preparations The use of the following chemical substances and preparation is planned in the technological processes:
- 24% or 25% ammonia (NH3) solution; - slaked lime (Ca(OH)2); - burnt lime (CaO); - activated carbon; - sodium phosphate (Na3PO4); - sodium chloride (NaCl); - sodium hydroxide (NaOH) 25% solution; - ethylene glycol (HO-CH2CH2-OH) (one-time filling of systems).
25% ammonia (NH3) solution will be used in the incineration unit to reduce NOx and prepare technological water. Reduction reactions occur at the time of ammonia solution reacting in the boiler flue gas duct with nitrogen oxides (NOx) at the temperature of 850-1050
0C, at the time of which reactants turn into nitrogen
(N2) neutral to the environment and water (H2O). 25% ammonia (NH3) solution will be kept in the 30-50 m
3 tank.
Slaked lime (Ca(OH)2) will be used in semi-dry smoke cleaning facilities in the commissioning stage in order to increase the efficiency of absorption of SO2 and other acidic gases. Also, some lime react with carbon dioxide contained in flue gases. Slaked lime will be kept in 50-100 m
3 silos.
Burnt lime (CaO) will be used in semi-dry flue gas cleaning facilities in the operation stage of the unit for absorbing/ adsorbing SO2, HCl, HF, Hg and dioxins from flue gases. Lime will be injected into the extinguisher through the tube with the help of the blower, and, before injecting into flue gases, it will be mixed with fly ash. Burnt lime (CaO) will be kept in 50-100 m
3 silos.
Activated carbon, just like burnt lime, will be used in semi-dry flue gas cleaning facilities in the operation stage of the unit. Activated carbon will be injected into flue gases using an injection system, which consists
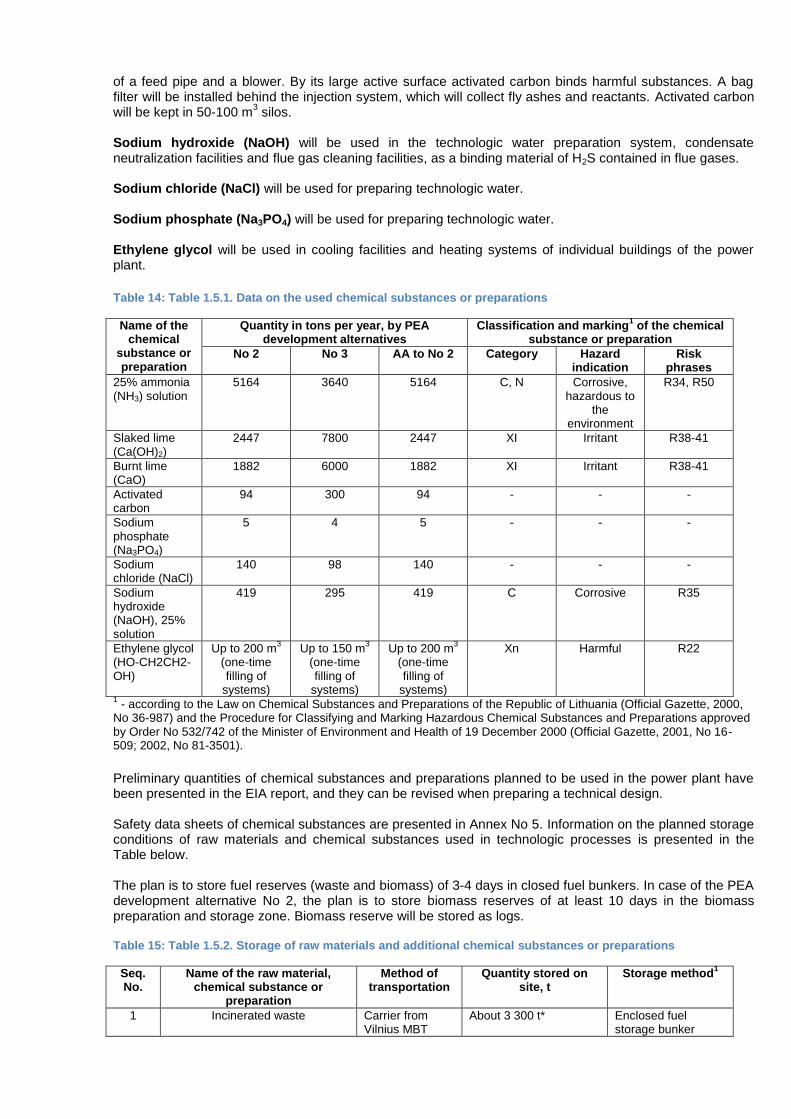
of a feed pipe and a blower. By its large active surface activated carbon binds harmful substances. A bag filter will be installed behind the injection system, which will collect fly ashes and reactants. Activated carbon will be kept in 50-100 m
3 silos.
Sodium hydroxide (NaOH) will be used in the technologic water preparation system, condensate neutralization facilities and flue gas cleaning facilities, as a binding material of H2S contained in flue gases. Sodium chloride (NaCl) will be used for preparing technologic water. Sodium phosphate (Na3PO4) will be used for preparing technologic water. Ethylene glycol will be used in cooling facilities and heating systems of individual buildings of the power plant.
Table 14: Table 1.5.1. Data on the used chemical substances or preparations
Name of the chemical
substance or preparation
Quantity in tons per year, by PEA development alternatives
Classification and marking1 of the chemical
substance or preparation
No 2 No 3 AA to No 2 Category Hazard indication
Risk phrases
25% ammonia (NH3) solution
5164 3640 5164 C, N Corrosive, hazardous to
the environment
R34, R50
Slaked lime (Ca(OH)2)
2447 7800 2447 XI Irritant R38-41
Burnt lime (CaO)
1882 6000 1882 XI Irritant R38-41
Activated carbon
94 300 94 - - -
Sodium phosphate (Na3PO4)
5 4 5 - - -
Sodium chloride (NaCl)
140 98 140 - - -
Sodium hydroxide (NaOH), 25% solution
419 295 419 C Corrosive R35
Ethylene glycol (HO-CH2CH2-OH)
Up to 200 m3
(one-time filling of
systems)
Up to 150 m3
(one-time filling of
systems)
Up to 200 m3
(one-time filling of
systems)
Xn Harmful R22
1 - according to the Law on Chemical Substances and Preparations of the Republic of Lithuania (Official Gazette, 2000,
No 36-987) and the Procedure for Classifying and Marking Hazardous Chemical Substances and Preparations approved by Order No 532/742 of the Minister of Environment and Health of 19 December 2000 (Official Gazette, 2001, No 16-509; 2002, No 81-3501).
Preliminary quantities of chemical substances and preparations planned to be used in the power plant have been presented in the EIA report, and they can be revised when preparing a technical design. Safety data sheets of chemical substances are presented in Annex No 5. Information on the planned storage conditions of raw materials and chemical substances used in technologic processes is presented in the Table below. The plan is to store fuel reserves (waste and biomass) of 3-4 days in closed fuel bunkers. In case of the PEA development alternative No 2, the plan is to store biomass reserves of at least 10 days in the biomass preparation and storage zone. Biomass reserve will be stored as logs. Table 15: Table 1.5.2. Storage of raw materials and additional chemical substances or preparations
Seq. No.
Name of the raw material, chemical substance or
preparation
Method of transportation
Quantity stored on site, t
Storage method1
1 Incinerated waste Carrier from Vilnius MBT
About 3 300 t* Enclosed fuel storage bunker
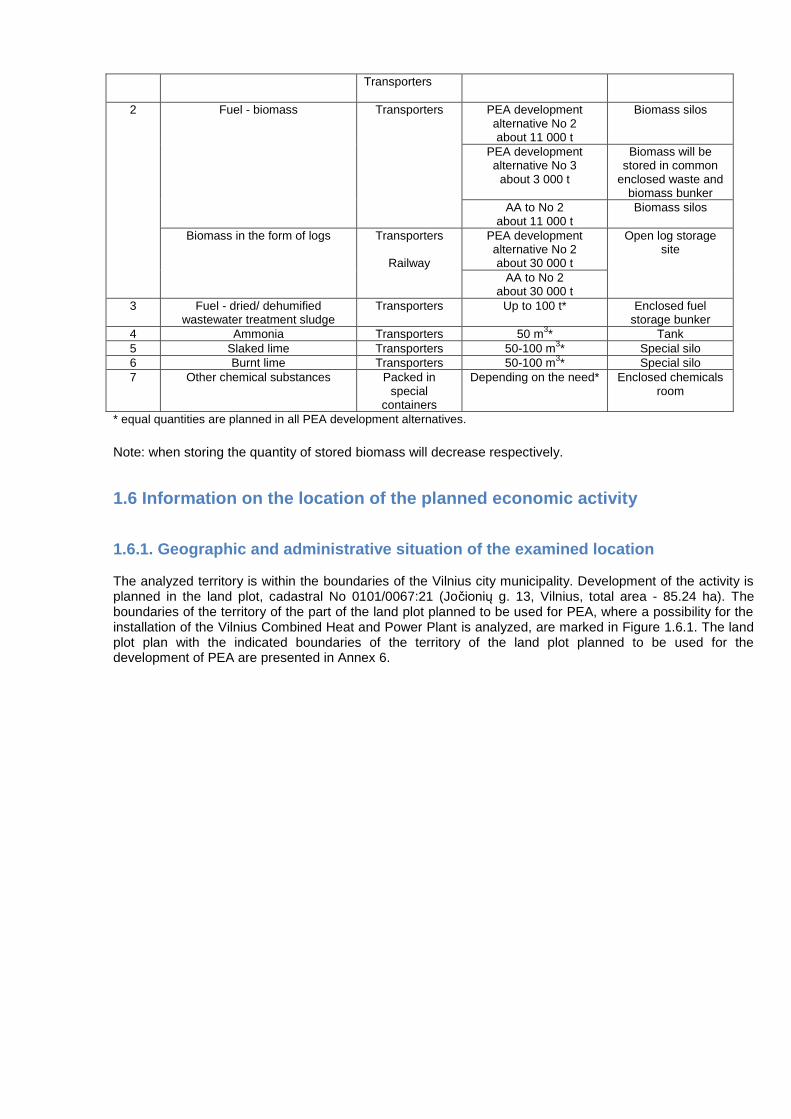
Transporters
2 Fuel - biomass Transporters PEA development alternative No 2 about 11 000 t
Biomass silos
PEA development alternative No 3
about 3 000 t
Biomass will be stored in common
enclosed waste and biomass bunker
AA to No 2 about 11 000 t
Biomass silos
Biomass in the form of logs Transporters
Railway
PEA development alternative No 2 about 30 000 t
Open log storage site
AA to No 2 about 30 000 t
3 Fuel - dried/ dehumified wastewater treatment sludge
Transporters Up to 100 t* Enclosed fuel storage bunker
4 Ammonia Transporters 50 m3* Tank
5 Slaked lime Transporters 50-100 m3* Special silo
6 Burnt lime Transporters 50-100 m3* Special silo
7 Other chemical substances Packed in special
containers
Depending on the need* Enclosed chemicals room
* equal quantities are planned in all PEA development alternatives.
Note: when storing the quantity of stored biomass will decrease respectively.
1.6 Information on the location of the planned economic activity
1.6.1. Geographic and administrative situation of the examined location The analyzed territory is within the boundaries of the Vilnius city municipality. Development of the activity is planned in the land plot, cadastral No 0101/0067:21 (Jočionių g. 13, Vilnius, total area - 85.24 ha). The boundaries of the territory of the part of the land plot planned to be used for PEA, where a possibility for the installation of the Vilnius Combined Heat and Power Plant is analyzed, are marked in Figure 1.6.1. The land plot plan with the indicated boundaries of the territory of the land plot planned to be used for the development of PEA are presented in Annex 6.
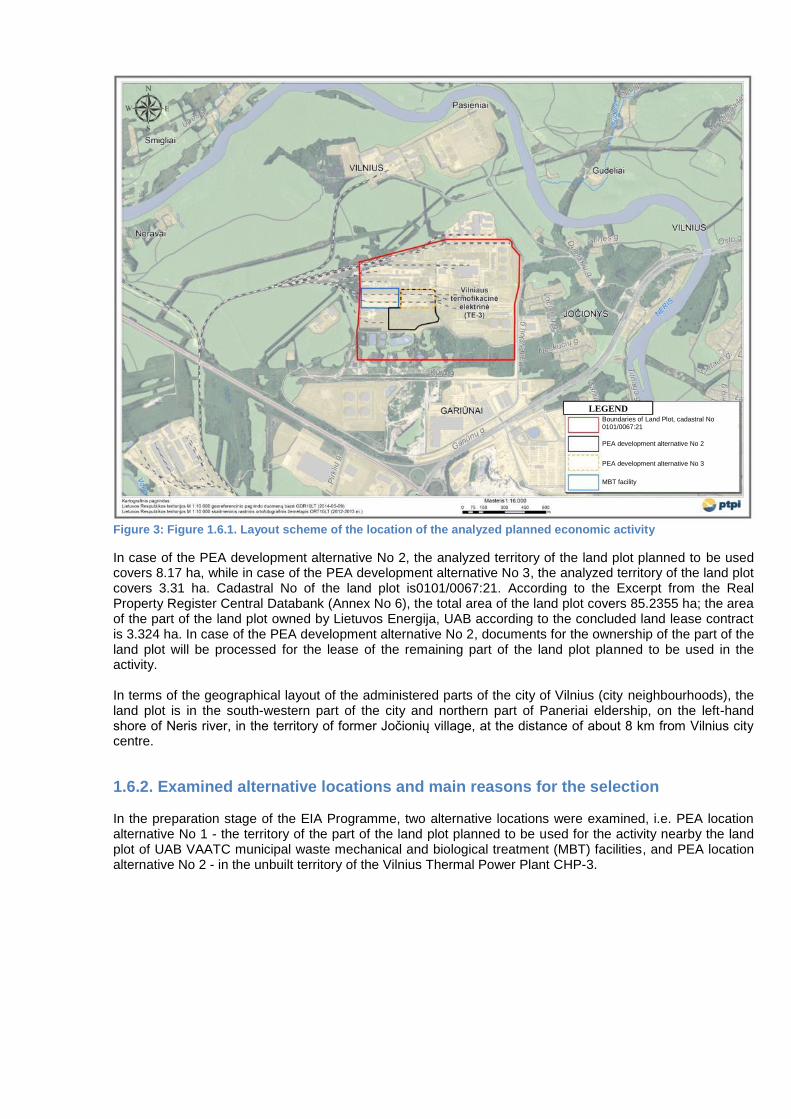
Figure 3: Figure 1.6.1. Layout scheme of the location of the analyzed planned economic activity
In case of the PEA development alternative No 2, the analyzed territory of the land plot planned to be used covers 8.17 ha, while in case of the PEA development alternative No 3, the analyzed territory of the land plot covers 3.31 ha. Cadastral No of the land plot is0101/0067:21. According to the Excerpt from the Real Property Register Central Databank (Annex No 6), the total area of the land plot covers 85.2355 ha; the area of the part of the land plot owned by Lietuvos Energija, UAB according to the concluded land lease contract is 3.324 ha. In case of the PEA development alternative No 2, documents for the ownership of the part of the land plot will be processed for the lease of the remaining part of the land plot planned to be used in the activity. In terms of the geographical layout of the administered parts of the city of Vilnius (city neighbourhoods), the land plot is in the south-western part of the city and northern part of Paneriai eldership, on the left-hand shore of Neris river, in the territory of former Jočionių village, at the distance of about 8 km from Vilnius city centre.
1.6.2. Examined alternative locations and main reasons for the selection In the preparation stage of the EIA Programme, two alternative locations were examined, i.e. PEA location alternative No 1 - the territory of the part of the land plot planned to be used for the activity nearby the land plot of UAB VAATC municipal waste mechanical and biological treatment (MBT) facilities, and PEA location alternative No 2 - in the unbuilt territory of the Vilnius Thermal Power Plant CHP-3.
Boundaries of Land Plot, cadastral No 0101/0067:21
PEA development alternative No 2
PEA development alternative No 3
MBT facility
LEGEND
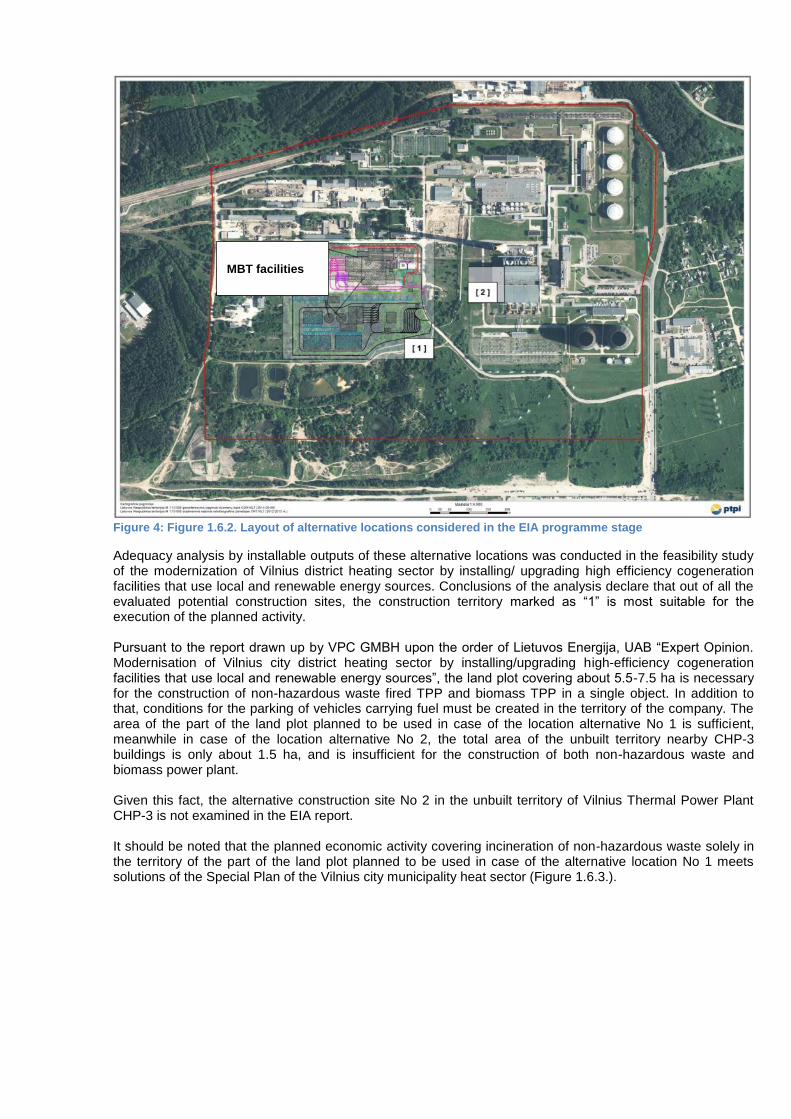
Figure 4: Figure 1.6.2. Layout of alternative locations considered in the EIA programme stage
Adequacy analysis by installable outputs of these alternative locations was conducted in the feasibility study of the modernization of Vilnius district heating sector by installing/ upgrading high efficiency cogeneration facilities that use local and renewable energy sources. Conclusions of the analysis declare that out of all the evaluated potential construction sites, the construction territory marked as “1” is most suitable for the execution of the planned activity. Pursuant to the report drawn up by VPC GMBH upon the order of Lietuvos Energija, UAB “Expert Opinion. Modernisation of Vilnius city district heating sector by installing/upgrading high-efficiency cogeneration facilities that use local and renewable energy sources”, the land plot covering about 5.5-7.5 ha is necessary for the construction of non-hazardous waste fired TPP and biomass TPP in a single object. In addition to that, conditions for the parking of vehicles carrying fuel must be created in the territory of the company. The area of the part of the land plot planned to be used in case of the location alternative No 1 is sufficient, meanwhile in case of the location alternative No 2, the total area of the unbuilt territory nearby CHP-3 buildings is only about 1.5 ha, and is insufficient for the construction of both non-hazardous waste and biomass power plant. Given this fact, the alternative construction site No 2 in the unbuilt territory of Vilnius Thermal Power Plant CHP-3 is not examined in the EIA report. It should be noted that the planned economic activity covering incineration of non-hazardous waste solely in the territory of the part of the land plot planned to be used in case of the alternative location No 1 meets solutions of the Special Plan of the Vilnius city municipality heat sector (Figure 1.6.3.).
MBT facilities
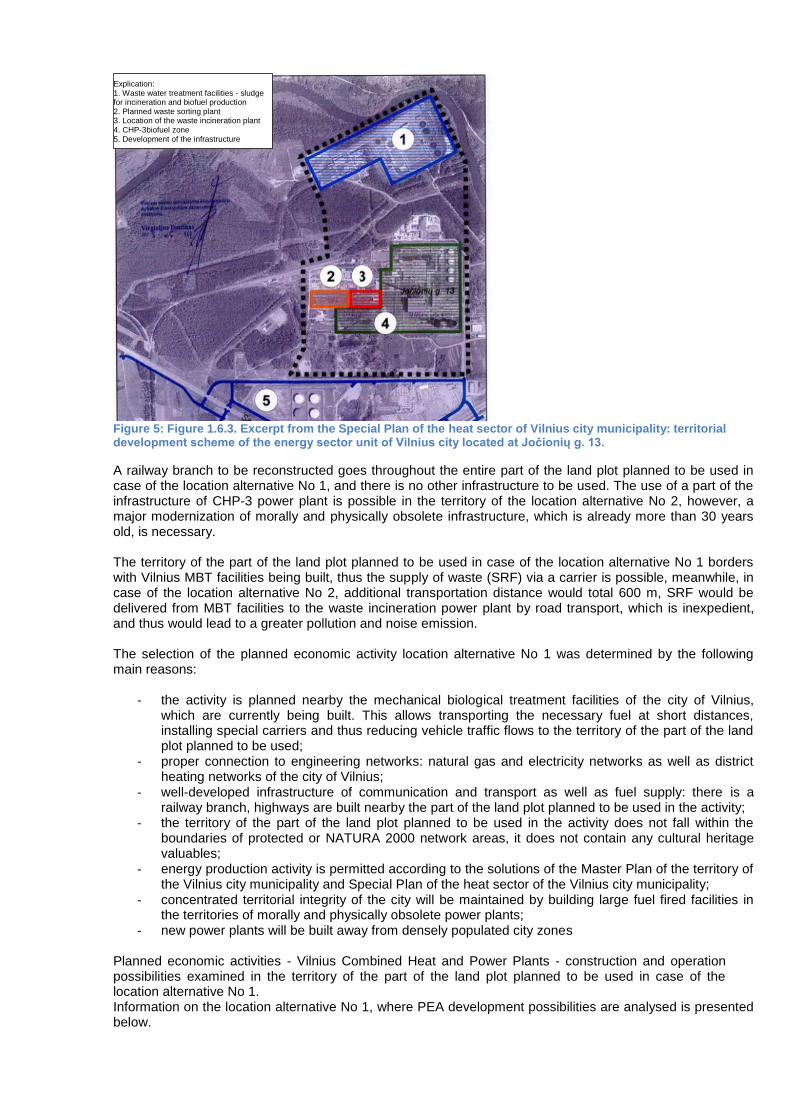
Figure 5: Figure 1.6.3. Excerpt from the Special Plan of the heat sector of Vilnius city municipality: territorial development scheme of the energy sector unit of Vilnius city located at Jočionių g. 13.
A railway branch to be reconstructed goes throughout the entire part of the land plot planned to be used in case of the location alternative No 1, and there is no other infrastructure to be used. The use of a part of the infrastructure of CHP-3 power plant is possible in the territory of the location alternative No 2, however, a major modernization of morally and physically obsolete infrastructure, which is already more than 30 years old, is necessary. The territory of the part of the land plot planned to be used in case of the location alternative No 1 borders with Vilnius MBT facilities being built, thus the supply of waste (SRF) via a carrier is possible, meanwhile, in case of the location alternative No 2, additional transportation distance would total 600 m, SRF would be delivered from MBT facilities to the waste incineration power plant by road transport, which is inexpedient, and thus would lead to a greater pollution and noise emission. The selection of the planned economic activity location alternative No 1 was determined by the following main reasons:
- the activity is planned nearby the mechanical biological treatment facilities of the city of Vilnius, which are currently being built. This allows transporting the necessary fuel at short distances, installing special carriers and thus reducing vehicle traffic flows to the territory of the part of the land plot planned to be used;
- proper connection to engineering networks: natural gas and electricity networks as well as district heating networks of the city of Vilnius;
- well-developed infrastructure of communication and transport as well as fuel supply: there is a railway branch, highways are built nearby the part of the land plot planned to be used in the activity;
- the territory of the part of the land plot planned to be used in the activity does not fall within the boundaries of protected or NATURA 2000 network areas, it does not contain any cultural heritage valuables;
- energy production activity is permitted according to the solutions of the Master Plan of the territory of the Vilnius city municipality and Special Plan of the heat sector of the Vilnius city municipality;
- concentrated territorial integrity of the city will be maintained by building large fuel fired facilities in the territories of morally and physically obsolete power plants;
- new power plants will be built away from densely populated city zones Planned economic activities - Vilnius Combined Heat and Power Plants - construction and operation possibilities examined in the territory of the part of the land plot planned to be used in case of the location alternative No 1. Information on the location alternative No 1, where PEA development possibilities are analysed is presented below.
Explication: 1. Waste water treatment facilities - sludge for incineration and biofuel production 2. Planned waste sorting plant 3. Location of the waste incineration plant 4. CHP-3biofuel zone 5. Development of the infrastructure
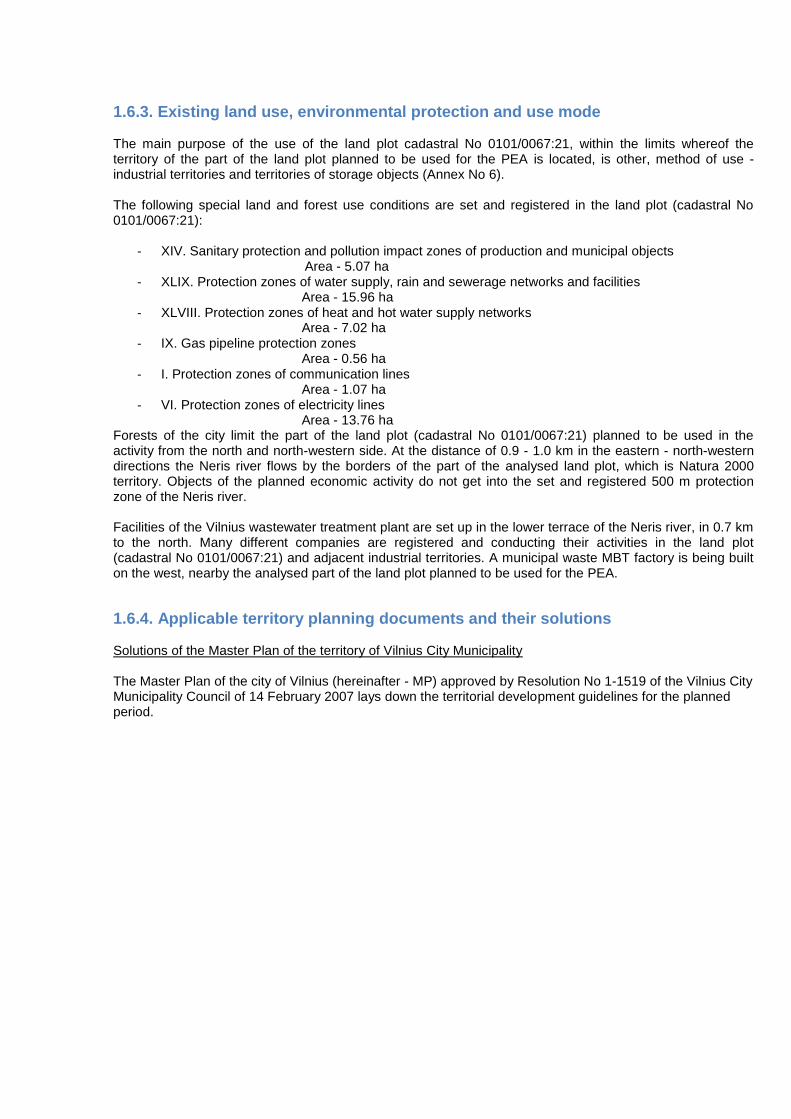
1.6.3. Existing land use, environmental protection and use mode The main purpose of the use of the land plot cadastral No 0101/0067:21, within the limits whereof the territory of the part of the land plot planned to be used for the PEA is located, is other, method of use - industrial territories and territories of storage objects (Annex No 6). The following special land and forest use conditions are set and registered in the land plot (cadastral No 0101/0067:21):
- XIV. Sanitary protection and pollution impact zones of production and municipal objects Area - 5.07 ha
- XLIX. Protection zones of water supply, rain and sewerage networks and facilities Area - 15.96 ha
- XLVIII. Protection zones of heat and hot water supply networks Area - 7.02 ha
- IX. Gas pipeline protection zones Area - 0.56 ha
- I. Protection zones of communication lines Area - 1.07 ha
- VI. Protection zones of electricity lines Area - 13.76 ha Forests of the city limit the part of the land plot (cadastral No 0101/0067:21) planned to be used in the activity from the north and north-western side. At the distance of 0.9 - 1.0 km in the eastern - north-western directions the Neris river flows by the borders of the part of the analysed land plot, which is Natura 2000 territory. Objects of the planned economic activity do not get into the set and registered 500 m protection zone of the Neris river. Facilities of the Vilnius wastewater treatment plant are set up in the lower terrace of the Neris river, in 0.7 km to the north. Many different companies are registered and conducting their activities in the land plot (cadastral No 0101/0067:21) and adjacent industrial territories. A municipal waste MBT factory is being built on the west, nearby the analysed part of the land plot planned to be used for the PEA.
1.6.4. Applicable territory planning documents and their solutions Solutions of the Master Plan of the territory of Vilnius City Municipality The Master Plan of the city of Vilnius (hereinafter - MP) approved by Resolution No 1-1519 of the Vilnius City Municipality Council of 14 February 2007 lays down the territorial development guidelines for the planned period.

Figure 6: Figure 1.6.4. Layout of the analyzed land plot in respect of the main drawing solutions of the Master Plan of the territory of Vilnius City Municipality till 2015 (the basis: main drawing of the Master Plan of Vilnius City Municipality till 2015, available online at: http://www.vilnius.lt/lit/Pagrindinis_brezinys_/1581996).
According to the MP of the city of Vilnius, the analysed location falls under the business, production and industrial territory. The planned activity in the analysed location is in line with the Master Plan solutions. The summary paragraph 8.3.1 of the Vilnius Master Plan Monitoring Report approved by Resolution No 1-2143 of the Municipality Council of 3 December 2014 (http://www.vilnius.lt/index.php?1635831436) establishes that “pursuant to Article 14(2) of the Law on Territorial Planning (which took effect on 1 January 2014), the Master Plan of the territory of Vilnius City Municipality till 2015 shall be valid indefinitely”.
1.6.5. Natural, historic and cultural valuables present in the territory
The nearest protected areas
Boundaries of Land Plot, cadastral No 0101/0067:21
PEA development alternative No 2 PEA development alternative No 3
LEGEND
Old Town
City Centre, key local centers
District centers and other mixed high build-up intensity territories
Intense built-up residential territories
Medium built-up intensity residential territories
Low built-up intensity residential territories
Territories of gardeners’ communities converted to low built-up intensity residential territories
Territories of gardeners’ communities
Territories for public needs, specialized territories and territories of complexes
Territories for public needs, specialized territories and territories of complexes containing large amounts of greenery
Infrastructure territory
Business, production and industrial territories
Greenery set up for intensive use
Greenery set up for extensive use
Forests and wooded areas
Agricultural and other territories unbuilt for a fixed term till 2015
Waters
Wellfields
2nd lane of sanitary protection zones of wellfields of the city of Vilnius
The territory of the State Cultural Reserve of Vilnius Castles
Minerals (explored mineral deposits and prognostic resource areas of minerals)
District under examination and the boundaries thereof
Boundaries of Vilnius city municipality
Boundaries of Vilnius Old Town
Proposed strict regulation zone of Vilnius
Old Town protection
Protected areas
Current noise zone
Prospective noise zone
Current height restriction zone (absolute height, m)
Prospective height restriction zone (absolute height,
m)
Cemetery
Prospective cemetery
A, B, C category streets and public
transport streets
Alternative street routes
Exurbia roads
Prospective routes of exurbia roads
Railways
Planned railway line
Airport
Railway station
Bus station
Planned main river port with servicing
infrastructure
Planned piers

The analysed territory of the part of the land plot planned to be used for the PEA does not fall under the boundaries of protected or NATURA 2000 territories, and does not border with them. The nearest protected territories and NATURA 2000 territories of the European significance include:
- NATURA 2000 BAST Neris river; - Geomorphological Reserve of Ditches; - Landscape Reserve of Paneriai Erosive Hills; - Vokė Hydrographical Reserve
Figure 7: Figure 1.6.5. The nearest protected and NATURA 2000 territories
The nearest cultural valuables The analysed land plot does not fall within the territories of registered cultural heritage valuables and their protection zones, and does not border with them. The nearest registered cultural heritage valuable is Naravai mound (17206) and Gudeliai (Lenkiškės) barrow cemetery, so-called Švedkapiai (5644).
Boundaries of Land Plot, cadastral No 0101/0067:21
PEA development alternative No 2 PEA development alternative No 3 NATURA 2000 BAST
Protected are (reserve)
LEGEND
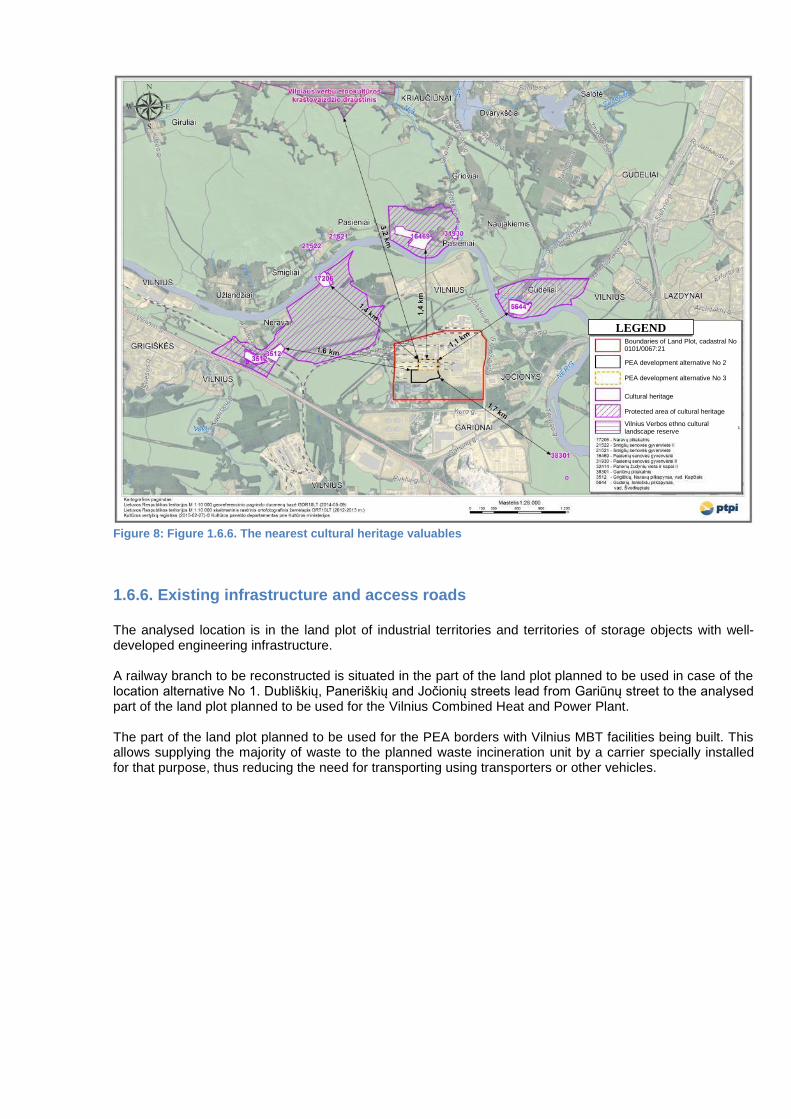
Figure 8: Figure 1.6.6. The nearest cultural heritage valuables
1.6.6. Existing infrastructure and access roads The analysed location is in the land plot of industrial territories and territories of storage objects with well-developed engineering infrastructure. A railway branch to be reconstructed is situated in the part of the land plot planned to be used in case of the location alternative No 1. Dubliškių, Paneriškių and Jočionių streets lead from Gariūnų street to the analysed part of the land plot planned to be used for the Vilnius Combined Heat and Power Plant. The part of the land plot planned to be used for the PEA borders with Vilnius MBT facilities being built. This allows supplying the majority of waste to the planned waste incineration unit by a carrier specially installed for that purpose, thus reducing the need for transporting using transporters or other vehicles.
Boundaries of Land Plot, cadastral No 0101/0067:21
PEA development alternative No 2 PEA development alternative No 3
Cultural heritage Protected area of cultural heritage
Vilnius Verbos ethno cultural landscape reserve
LEGEND

Figure 9: Figure 1.6.7. Existing access roads to the analyzed territory of the part of the land plot planned to be used in the activity
1.6.7. Planned connection to the existing engineering infrastructure networks The analysed territory has suitable conditions for connecting the PEA to engineering networks: natural gas, electricity networks, district heating of the city of Vilnius, drinking water, sewerage and rainwater drainage networks. The plan is to connect the planned Vilnius Combined Heat and Power Plant to the existing engineering infrastructure networks. Water necessary for company needs will be supplied from water supply networks of UAB Vilniaus Vandenys, while generated household and production wastewater will be discharged to wastewater networks of UAB Vilniaus Vandenys. After the initial treatment, rainwater collected from the part of the land plot planned to be used in the activity will kuras be discharged into the rainwater drainage networks of UAB Grinda. Heat produced in the Vilnius Combined Heat and Power Plant will be directed to the Vilnius city DH network nearby the CHP-3 territory. Exact connection point and scope of the reconstruction will clear up upon the receipt of Vilniaus Energija connection conditions. AB Lietuvos Dujos will build a 3 bar gas pipeline to the boundary of the land plot, which is necessary for the supply of natural gas to the planned power plant. The voltage of electricity generated in generators of the cogeneration power plants will be increased to 110 kV by transformers located in the part of the land plot planned to be used in the activity, and will be directed to the existing 110 kV CHP-3 substation by overhead lines or an underground cable. CHP-3 substation will be reconstructed by installing two 110 kV circuit breakers and meters of sold/purchased electricity.
2 Technological processes
Boundaries of Land Plot, cadastral No 0101/0067:21
PEA development alternative No 2
PEA development alternative No 3
Closest urbanized territories Directions of existing access roads
LEGEND
2.1 Description of technological processes to be used in Vilnius Combined Heat and Power Plant
In accordance with the definition of Directive 2012/27/EU of the European Parliament and of the Council of 25 October 2012 on energy efficiency, amending Directives 2009/125/EC and 2010/30/EU and repealing Directives 2004/8/EC and 2006/32/EC, cogeneration means the simultaneous generation in one process of thermal energy and electrical or mechanical energy.
During the cogeneration process, usually from 7% to 50% of energy contained in the fuel is used to generate electricity, from 8% to 20% of energy contained in the fuel is lost, and the remaining energy in the form of steam or hot water is used to heat buildings, to prepare hot water, and to meet technological needs. Producing the same amount of heat and electricity in the usual way, more fuel is consumed, and losses can comprise up to 50%
52. Therefore, the production of electricity and heat in the cogeneration process is
regarded as energy-efficient technology. The use of such technology is in line with the direction of EU policy. High-efficiency cogeneration and district heating and cooling are regarded in Directive 2012/27/EU as measures having significant potential for saving primary energy. Indication to the Member States to take into account the potential of using efficient heating and cooling systems is established in the Directive.
In general, the basic elements of the combined heat and power plant are the following:
1. Fuel reception, preparation, storage and supply system.
2. Steam boiler.
3. Steam turbine and generator.
4. Water treatment system.
5. Advanced exhaust flue gas cleaning system with a condensing economizer.
6. Collection system of ash, slag and flue gas cleaning products.
7. Power plant management system.
Process flow scheme of the CHP power plant is shown below.
52
Feasibility studies for the installation of various cogeneration technologies and costs, and preparation of
recommendations for the installation of these technologies, the Ministry of Economy of the Republic of Lithuania,
2007. Internet access: http://www.ena.lt/Ataskaitos/Kogener.pdf, visited on 04/05/2015
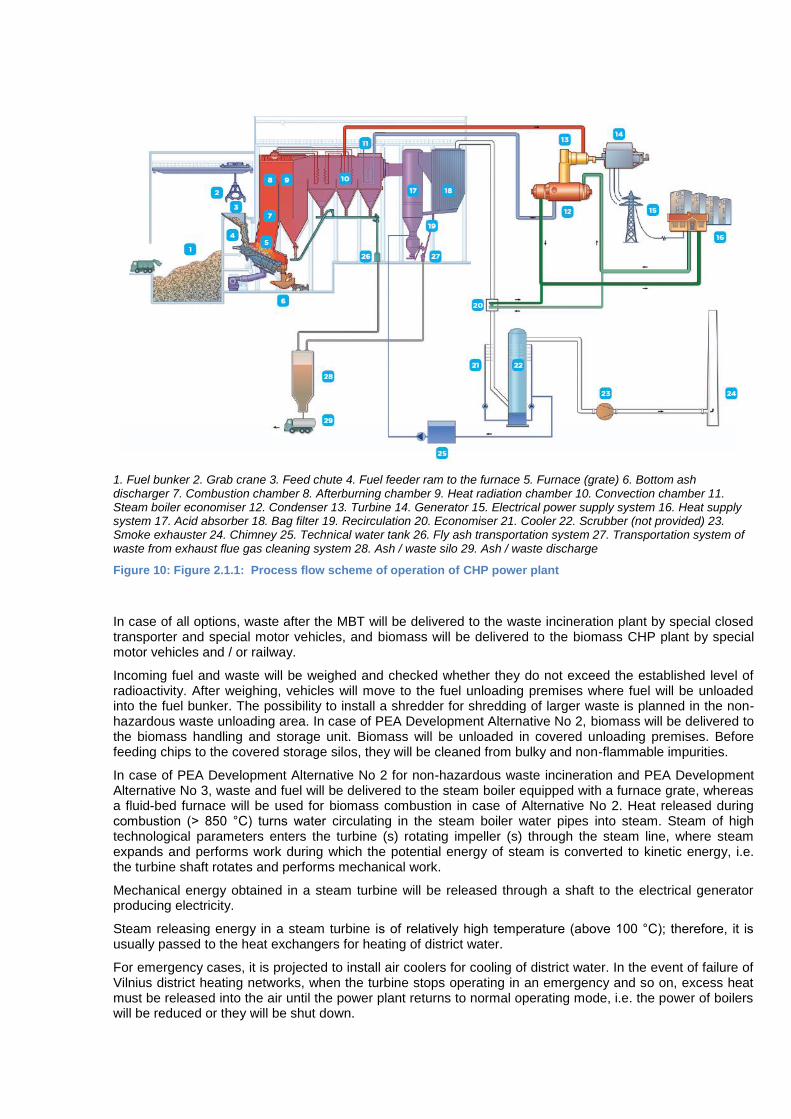
1. Fuel bunker 2. Grab crane 3. Feed chute 4. Fuel feeder ram to the furnace 5. Furnace (grate) 6. Bottom ash discharger 7. Combustion chamber 8. Afterburning chamber 9. Heat radiation chamber 10. Convection chamber 11. Steam boiler economiser 12. Condenser 13. Turbine 14. Generator 15. Electrical power supply system 16. Heat supply system 17. Acid absorber 18. Bag filter 19. Recirculation 20. Economiser 21. Cooler 22. Scrubber (not provided) 23. Smoke exhauster 24. Chimney 25. Technical water tank 26. Fly ash transportation system 27. Transportation system of waste from exhaust flue gas cleaning system 28. Ash / waste silo 29. Ash / waste discharge
Figure 10: Figure 2.1.1: Process flow scheme of operation of CHP power plant
In case of all options, waste after the MBT will be delivered to the waste incineration plant by special closed transporter and special motor vehicles, and biomass will be delivered to the biomass CHP plant by special motor vehicles and / or railway.
Incoming fuel and waste will be weighed and checked whether they do not exceed the established level of radioactivity. After weighing, vehicles will move to the fuel unloading premises where fuel will be unloaded into the fuel bunker. The possibility to install a shredder for shredding of larger waste is planned in the non-hazardous waste unloading area. In case of PEA Development Alternative No 2, biomass will be delivered to the biomass handling and storage unit. Biomass will be unloaded in covered unloading premises. Before feeding chips to the covered storage silos, they will be cleaned from bulky and non-flammable impurities.
In case of PEA Development Alternative No 2 for non-hazardous waste incineration and PEA Development Alternative No 3, waste and fuel will be delivered to the steam boiler equipped with a furnace grate, whereas a fluid-bed furnace will be used for biomass combustion in case of Alternative No 2. Heat released during combustion (> 850 °C) turns water circulating in the steam boiler water pipes into steam. Steam of high technological parameters enters the turbine (s) rotating impeller (s) through the steam line, where steam expands and performs work during which the potential energy of steam is converted to kinetic energy, i.e. the turbine shaft rotates and performs mechanical work.
Mechanical energy obtained in a steam turbine will be released through a shaft to the electrical generator producing electricity.
Steam releasing energy in a steam turbine is of relatively high temperature (above 100 °C); therefore, it is usually passed to the heat exchangers for heating of district water.
For emergency cases, it is projected to install air coolers for cooling of district water. In the event of failure of Vilnius district heating networks, when the turbine stops operating in an emergency and so on, excess heat must be released into the air until the power plant returns to normal operating mode, i.e. the power of boilers will be reduced or they will be shut down.
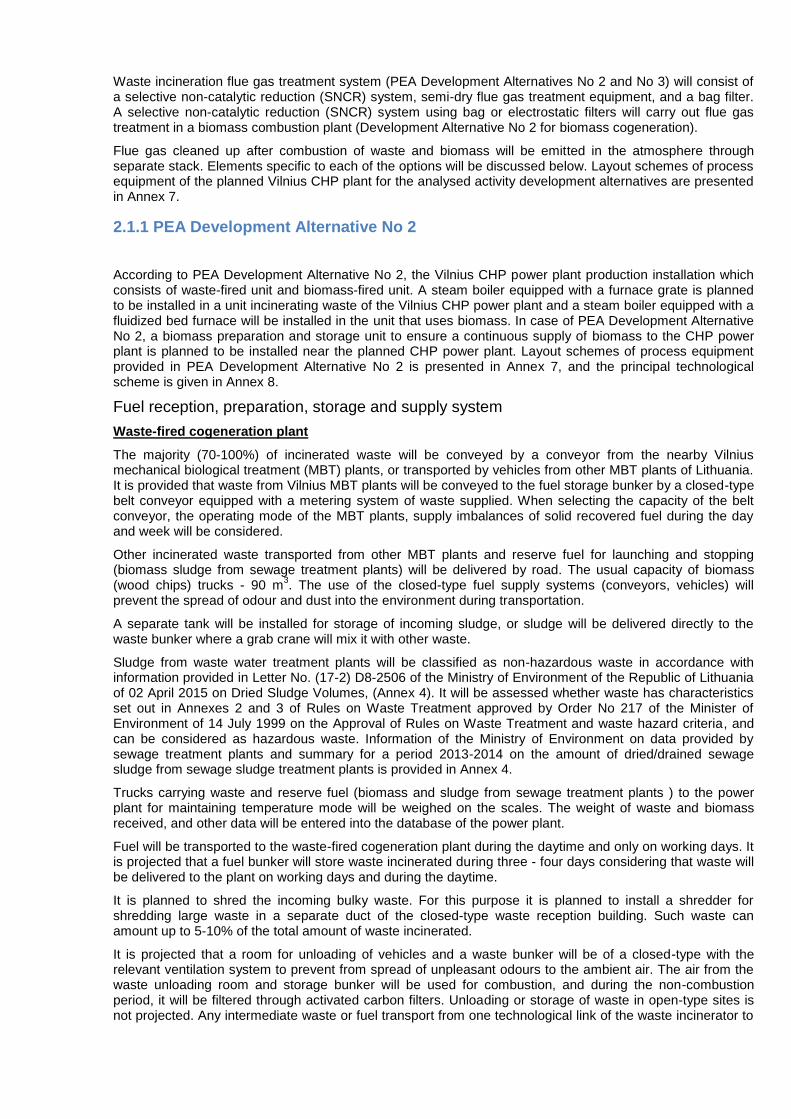
Waste incineration flue gas treatment system (PEA Development Alternatives No 2 and No 3) will consist of a selective non-catalytic reduction (SNCR) system, semi-dry flue gas treatment equipment, and a bag filter. A selective non-catalytic reduction (SNCR) system using bag or electrostatic filters will carry out flue gas treatment in a biomass combustion plant (Development Alternative No 2 for biomass cogeneration).
Flue gas cleaned up after combustion of waste and biomass will be emitted in the atmosphere through separate stack. Elements specific to each of the options will be discussed below. Layout schemes of process equipment of the planned Vilnius CHP plant for the analysed activity development alternatives are presented in Annex 7.
2.1.1 PEA Development Alternative No 2
According to PEA Development Alternative No 2, the Vilnius CHP power plant production installation which consists of waste-fired unit and biomass-fired unit. A steam boiler equipped with a furnace grate is planned to be installed in a unit incinerating waste of the Vilnius CHP power plant and a steam boiler equipped with a fluidized bed furnace will be installed in the unit that uses biomass. In case of PEA Development Alternative No 2, a biomass preparation and storage unit to ensure a continuous supply of biomass to the CHP power plant is planned to be installed near the planned CHP power plant. Layout schemes of process equipment provided in PEA Development Alternative No 2 is presented in Annex 7, and the principal technological scheme is given in Annex 8.
Fuel reception, preparation, storage and supply system
Waste-fired cogeneration plant
The majority (70-100%) of incinerated waste will be conveyed by a conveyor from the nearby Vilnius mechanical biological treatment (MBT) plants, or transported by vehicles from other MBT plants of Lithuania. It is provided that waste from Vilnius MBT plants will be conveyed to the fuel storage bunker by a closed-type belt conveyor equipped with a metering system of waste supplied. When selecting the capacity of the belt conveyor, the operating mode of the MBT plants, supply imbalances of solid recovered fuel during the day and week will be considered.
Other incinerated waste transported from other MBT plants and reserve fuel for launching and stopping (biomass sludge from sewage treatment plants) will be delivered by road. The usual capacity of biomass (wood chips) trucks - 90 m
3. The use of the closed-type fuel supply systems (conveyors, vehicles) will
prevent the spread of odour and dust into the environment during transportation.
A separate tank will be installed for storage of incoming sludge, or sludge will be delivered directly to the waste bunker where a grab crane will mix it with other waste.
Sludge from waste water treatment plants will be classified as non-hazardous waste in accordance with information provided in Letter No. (17-2) D8-2506 of the Ministry of Environment of the Republic of Lithuania of 02 April 2015 on Dried Sludge Volumes, (Annex 4). It will be assessed whether waste has characteristics set out in Annexes 2 and 3 of Rules on Waste Treatment approved by Order No 217 of the Minister of Environment of 14 July 1999 on the Approval of Rules on Waste Treatment and waste hazard criteria, and can be considered as hazardous waste. Information of the Ministry of Environment on data provided by sewage treatment plants and summary for a period 2013-2014 on the amount of dried/drained sewage sludge from sewage sludge treatment plants is provided in Annex 4.
Trucks carrying waste and reserve fuel (biomass and sludge from sewage treatment plants ) to the power plant for maintaining temperature mode will be weighed on the scales. The weight of waste and biomass received, and other data will be entered into the database of the power plant.
Fuel will be transported to the waste-fired cogeneration plant during the daytime and only on working days. It is projected that a fuel bunker will store waste incinerated during three - four days considering that waste will be delivered to the plant on working days and during the daytime.
It is planned to shred the incoming bulky waste. For this purpose it is planned to install a shredder for shredding large waste in a separate duct of the closed-type waste reception building. Such waste can amount up to 5-10% of the total amount of waste incinerated.
It is projected that a room for unloading of vehicles and a waste bunker will be of a closed-type with the relevant ventilation system to prevent from spread of unpleasant odours to the ambient air. The air from the waste unloading room and storage bunker will be used for combustion, and during the non-combustion period, it will be filtered through activated carbon filters. Unloading or storage of waste in open-type sites is not projected. Any intermediate waste or fuel transport from one technological link of the waste incinerator to
another by means of motor vehicle or trucks is not projected, i.e. fuel (waste) will not be transported manually.
The biomass-fired cogeneration plant
The biomass supply and storage area, which will be equipped with biomass scales, fuel unloading room with fuel separation equipment, fuel conveyors, storage silos, timber crushing equipment, timber storage site, wagon unloading equipment are planned for servicing of the biomass-fired CHP power plant. Fuel will be delivered to the cogeneration plant burning biomass by road vehicles and railway. It is expected that 50-
100% of biomass will be delivered by road vehicles, and up to 50% biomass by railway. The usual capacity of wood chip biomass trucks is 90 m
3.
All fuel delivered to the cogeneration installation fired on biomass will be weighed, i.e. scales both for transport and rail freight wagons will be installed. Biomass will be transported on working days and during the daytime. The company plans to install a transportation management system to ensure that the planned use of the power plant in the territory of the plot of land will not lead to traffic congestion. It is planned to build a parking space for motor vehicles if the instantaneous flow of cars to the plant will be greater than can be served in the biomass unloading site.
It is projected that prepared wood chips and wood (waste from preparation of industrial roundwood and firewood) will be transported to the cogeneration unit burning biomass by truck and railway. Wood chips delivered by trucks will be unloaded in a closed-type fuel unloading building from which they will be transported to at least two fuel storage silos. It is intended to remove bulky wood, stone, concrete blocks, icy wood blocks, metal from wood chips before they are placed into storage silos.
Wood chips will be unloaded from railway freight wagons using trucks. The unloading system of wood chips imported by rail freight wagons will be partially of a closed-type to protect against entry of dust into the air.
Storage of wood chips in an open-type planned area of the part of land is not provided. It will not be allowed to transfer wood chips from one fuel supply unit to the next by means of transport, except for fuel unloading.
Wood brought by trucks and (or) railway will be stored in the biomass unloading area. It is projected to store logs, as biomass stocks for at least 10 days. There are plans to install wood log shredding (chip production) equipment. It is planned to install two separate wood log-shredding lines. Shredding line capacity will be such as to be sufficient to ensure fuel supply to the power plant to operate at maximum capacity in the event of failure to deliver wood chips. Fuel will be crushed indoors to prevent the risk of the spread of dust and noise in the environment. Wood log crushing process will be fully automated without additional manual reloading of wood logs or wood chips between the crushing units.
Wood chips after crushing will be directed to the fuel storage silos.
It is planned to use lift trucks and / or cranes for unloading and transportation of logs from a storage site to a shredding unit.
It is planned to install at least two fuel storage silos in the biomass-fired unit. Fuel supplies for 3-4 days will be stored there taking into account the fact that the fuel will be delivered to the power plant on working days and during the daytime.
Separate units of the fuel supply system of the biomass burning unit will be optimally duplicated to ensure reliable and uninterrupted operation.
Biomass Testing Laboratory will be installed in the biomass unloading area. It is expected to construct the laboratory so that the direct fuel pick up from the truck is possible. Samples of fuel and waste delivered to the waste burning unit will be also tested in the laboratory.
Steam boiler
Waste to energy CHP power plant
Moving grate, fluidised bed boilers or rotary furnace is the most commonly used techniques for waste incineration. Summarized data from the European Commission Reference Document on the Best Available Techniques for Waste Incineration (BAT) is presented in the table below.
Table 16: Table 2.1.1: Waste Incineration BAT
Technology Untreated municipal Pre-treated municipal waste
Hazardous waste
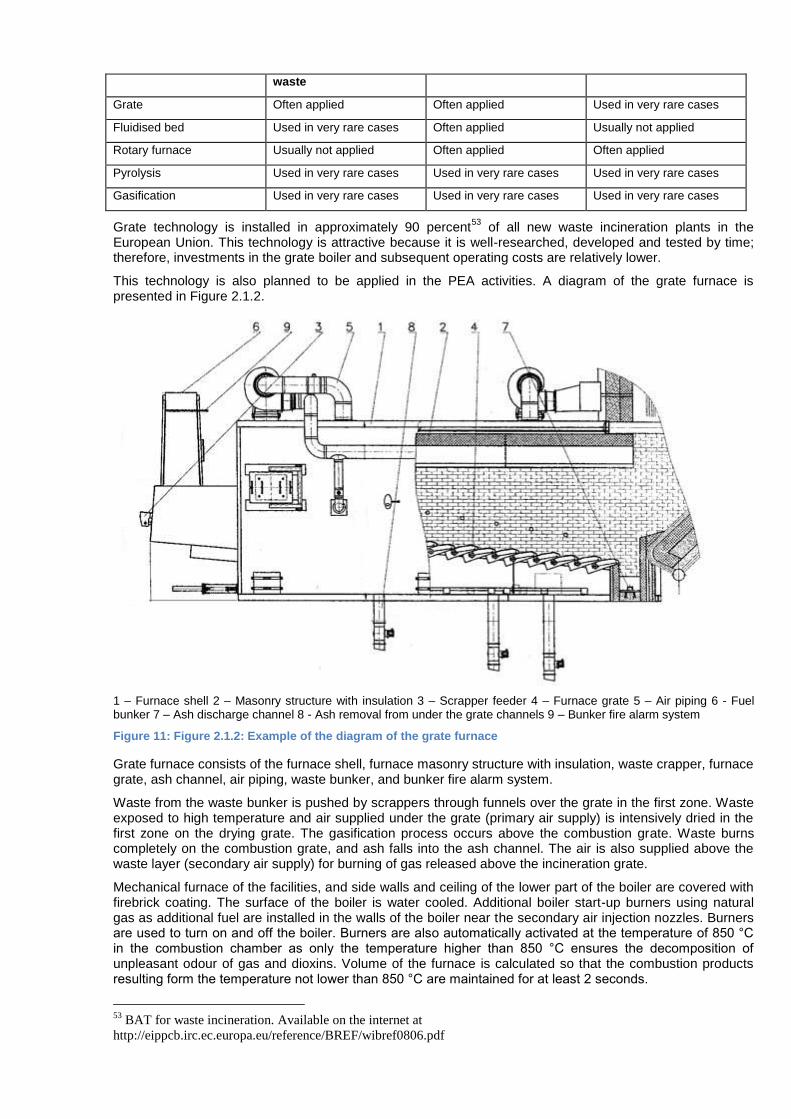
waste
Grate Often applied Often applied Used in very rare cases
Fluidised bed Used in very rare cases Often applied Usually not applied
Rotary furnace Usually not applied Often applied Often applied
Pyrolysis Used in very rare cases Used in very rare cases Used in very rare cases
Gasification Used in very rare cases Used in very rare cases Used in very rare cases
Grate technology is installed in approximately 90 percent53
of all new waste incineration plants in the European Union. This technology is attractive because it is well-researched, developed and tested by time; therefore, investments in the grate boiler and subsequent operating costs are relatively lower.
This technology is also planned to be applied in the PEA activities. A diagram of the grate furnace is presented in Figure 2.1.2.
1 – Furnace shell 2 – Masonry structure with insulation 3 – Scrapper feeder 4 – Furnace grate 5 – Air piping 6 - Fuel bunker 7 – Ash discharge channel 8 - Ash removal from under the grate channels 9 – Bunker fire alarm system
Figure 11: Figure 2.1.2: Example of the diagram of the grate furnace
Grate furnace consists of the furnace shell, furnace masonry structure with insulation, waste crapper, furnace grate, ash channel, air piping, waste bunker, and bunker fire alarm system.
Waste from the waste bunker is pushed by scrappers through funnels over the grate in the first zone. Waste exposed to high temperature and air supplied under the grate (primary air supply) is intensively dried in the first zone on the drying grate. The gasification process occurs above the combustion grate. Waste burns completely on the combustion grate, and ash falls into the ash channel. The air is also supplied above the waste layer (secondary air supply) for burning of gas released above the incineration grate.
Mechanical furnace of the facilities, and side walls and ceiling of the lower part of the boiler are covered with firebrick coating. The surface of the boiler is water cooled. Additional boiler start-up burners using natural gas as additional fuel are installed in the walls of the boiler near the secondary air injection nozzles. Burners are used to turn on and off the boiler. Burners are also automatically activated at the temperature of 850 °C in the combustion chamber as only the temperature higher than 850 °C ensures the decomposition of unpleasant odour of gas and dioxins. Volume of the furnace is calculated so that the combustion products resulting form the temperature not lower than 850 °C are maintained for at least 2 seconds.
53
BAT for waste incineration. Available on the internet at
http://eippcb.irc.ec.europa.eu/reference/BREF/wibref0806.pdf
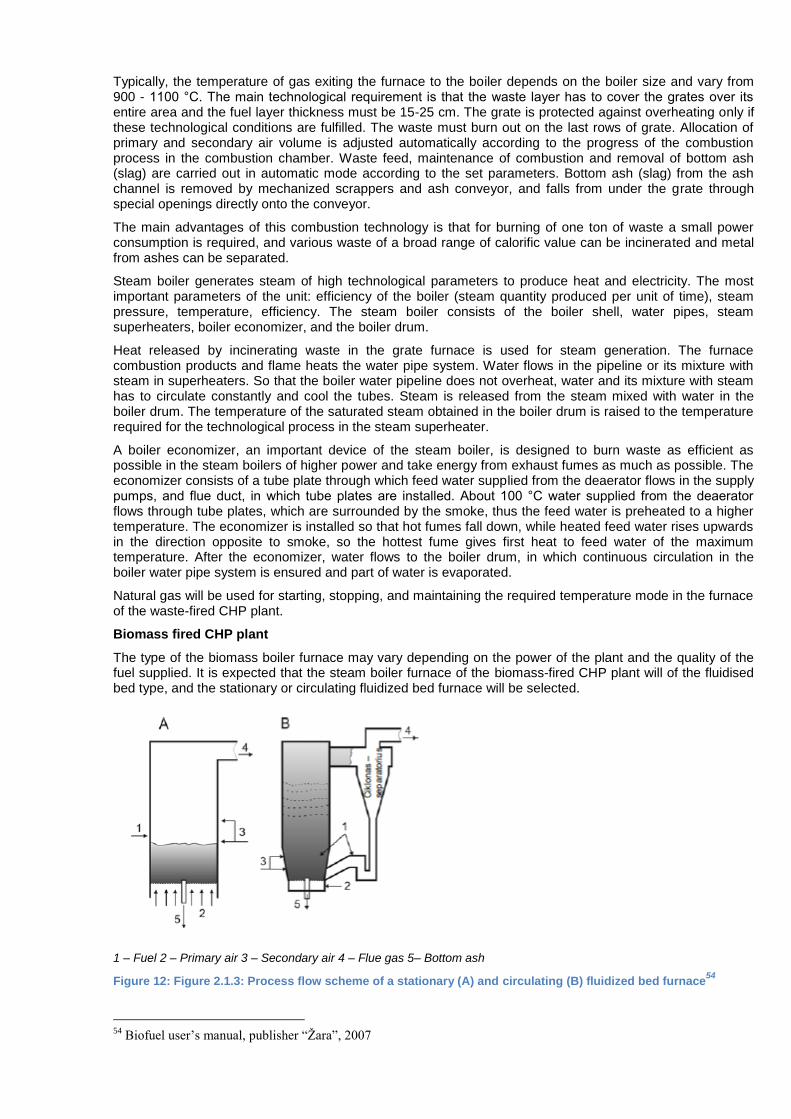
Typically, the temperature of gas exiting the furnace to the boiler depends on the boiler size and vary from 900 - 1100 °C. The main technological requirement is that the waste layer has to cover the grates over its entire area and the fuel layer thickness must be 15-25 cm. The grate is protected against overheating only if these technological conditions are fulfilled. The waste must burn out on the last rows of grate. Allocation of primary and secondary air volume is adjusted automatically according to the progress of the combustion process in the combustion chamber. Waste feed, maintenance of combustion and removal of bottom ash (slag) are carried out in automatic mode according to the set parameters. Bottom ash (slag) from the ash channel is removed by mechanized scrappers and ash conveyor, and falls from under the grate through special openings directly onto the conveyor.
The main advantages of this combustion technology is that for burning of one ton of waste a small power consumption is required, and various waste of a broad range of calorific value can be incinerated and metal from ashes can be separated.
Steam boiler generates steam of high technological parameters to produce heat and electricity. The most important parameters of the unit: efficiency of the boiler (steam quantity produced per unit of time), steam pressure, temperature, efficiency. The steam boiler consists of the boiler shell, water pipes, steam superheaters, boiler economizer, and the boiler drum.
Heat released by incinerating waste in the grate furnace is used for steam generation. The furnace combustion products and flame heats the water pipe system. Water flows in the pipeline or its mixture with steam in superheaters. So that the boiler water pipeline does not overheat, water and its mixture with steam has to circulate constantly and cool the tubes. Steam is released from the steam mixed with water in the boiler drum. The temperature of the saturated steam obtained in the boiler drum is raised to the temperature required for the technological process in the steam superheater.
A boiler economizer, an important device of the steam boiler, is designed to burn waste as efficient as possible in the steam boilers of higher power and take energy from exhaust fumes as much as possible. The economizer consists of a tube plate through which feed water supplied from the deaerator flows in the supply pumps, and flue duct, in which tube plates are installed. About 100 °C water supplied from the deaerator flows through tube plates, which are surrounded by the smoke, thus the feed water is preheated to a higher temperature. The economizer is installed so that hot fumes fall down, while heated feed water rises upwards in the direction opposite to smoke, so the hottest fume gives first heat to feed water of the maximum temperature. After the economizer, water flows to the boiler drum, in which continuous circulation in the boiler water pipe system is ensured and part of water is evaporated.
Natural gas will be used for starting, stopping, and maintaining the required temperature mode in the furnace of the waste-fired CHP plant.
Biomass fired CHP plant
The type of the biomass boiler furnace may vary depending on the power of the plant and the quality of the fuel supplied. It is expected that the steam boiler furnace of the biomass-fired CHP plant will of the fluidised bed type, and the stationary or circulating fluidized bed furnace will be selected.
1 – Fuel 2 – Primary air 3 – Secondary air 4 – Flue gas 5– Bottom ash
Figure 12: Figure 2.1.3: Process flow scheme of a stationary (A) and circulating (B) fluidized bed furnace54
54
Biofuel user’s manual, publisher “Žara”, 2007

The increasing speed of air flow supplied for combustion, the state when the air upwards the fuel layer and fuel particles are suspended in the airflow can be achieved. It appears as if the fuel bed begins to boil, hence the term 'fluidised bed’. The above described fluidized bed is called a stationary or fluidized bed. Moisture, released volatiles, ash and fine fuel particles are removed from the fuel bed. The fine fuel particles or volatile substances burn in the combustion chamber above the fluidized bed.
When the speed of the air flow increases more than is necessary to form the stationary fluidised bed, the burning fuel particles are removed with the air flow. Solid particles are separated from the air and gas flow in the cyclone - separator and are brought back to the furnace. Since burning fuel circulates between the furnace and the separator, the term ‘circulating fluidised bed’ is used to define this combustion technology.
Water treatment system
Water for the needs of the plant technological processes will be taken from the Vilnius district water supply network. Water taken from the water supply will first be mechanically filtered through sand filters, and after will flow into the water softener. Water demineralisation (desalting) will be carried out by reverse osmosis (RO) and electrodeionisation apparatus.
The main element of the reverse osmosis (or RO) device is a semi-permeable membrane through which water is pressed out during its demineralisation. A semi-permeable membrane keeps 98-99 % of salts and 70 - 99 % of natural organic materials in water.
The final quality of water intended for high-tech processes is further achieved by filtering the prepared water through the electrodeionisation unit (EDI). Water partially treated in this unit is purified by passing it through a mixed bed containing a mixture of cation-exchange and anion-exchange resins. Water by passing through the ion exchange, alternately interacts with the cation exchanger and the anion exchanger, and gradually loses its cations and anions. Not only inorganic salts are removed from the water, but also the amount of organic materials in water is reduced.
Electrodeionisation has a number of advantages: it needs no aggressive regeneration chemicals; EDI equipment takes up less space than conventional equipment; they require only minimal maintenance; it ensures optimal water quality, the amount of bacteria is reduced by more than 99 percent, etc.
Purified water continues to be fed into the feed water system which consists of a feed water tank and deaerator, at least two water pumps and chemical dosing stations. The feed water tank provides water reserves for at least 0.5 hours of steam production at the maximum boiler evaporation in the event of water supply interruption. Water is stored in the tank at the highest possible temperature so that upon its supply to the removal device – deaerator of aggressive gases such as oxygen (CO2) and carbon dioxide (CO2) the maximum reduction of the quantity of dissolved oxygen and other gases is ensured.
The oxygen concentration in water after the deaeration process must meet the requirements for boiler feed water, and carbon dioxide must be removed. The most commonly used are atmospheric deaerators. A two-step scheme of degasification is installed in the deaerator: Step 1 - preheating of chemically treated water from 5-10 °C to 102 °C in the mixing heat exchanger, Step 2 - distribution of the gas and steam mixture and water of the cyclone separator.
Further, the steam from the deaerator is condensed in the steam condenser. The water-steam cycle losses are covered by the addition of water from the water supply system. This water is heated in the purge cooler and steam condenser of the feed water tank. Feed water is supplied by two water pumps powered by electrical motors. In case of power failure, the pumps are connected to the emergency power supply to ensure sufficient quantity of water to cool the boilers. In order to protect the water pipes in the steam-water cycle, ammonia water is automatically dosed into the feed water tank. The solution is dosed into the feed water tank. Dosage rate depends on the pH value, which is measured continuously in the feed water pumps. The solution is prepared and dosing in the system is performed in the chemicals dosing station.
Advanced exhaust flue gas treatment system with the condensing economizer
Treatment systems to treat the pollutants emitted into the ambient air to the limit values set out in the legislation will be selected to treat flue gas in Vilnius CHP plant.
The following systems will be used for flue gas treatment in:
• Waste to energy CHP plant: selective non-catalytic reduction (SNCR), semi-dry flue gas treament and bag filter system;
• Biomass-fired CHP plant: selective non-catalytic reduction (SNCR), and a bag or electrostatic filter system.
Smoke condensing economizers will be selected separately for each plant.
Below is provided a description of flue gas treatment technology planned for use.
Description of selective non-catalytic reduction (SNCR) technology (applicable to waste and biomass boilers)
In Europe, a selective non-catalytic reduction (SNCR) system is often used for cleaning of the exhaust flue gas from nitrogen oxides in the incinerators. If compared with the selective catalytic reduction (SCR) system, this system requires less investment because additional heating of flue gas is not required.
The 25% ammonia (NH3) solution used as reducing agent in the SNCR system is injected into the combustion chamber to mix with the resulting gases. It should be noted that greenhouse gas N2O is not formed when using the ammonia solution. The optimum temperature from 900 °C to 950°C must be maintained in the combustion section to ensure the cleaning as the NOx reduction reaction can only take place at this temperature. At higher temperatures than 1000 °C, unwanted secondary reactions may take place. In the event of lower temperature than 800 °C, the NOx reduction efficiency drops significantly and large amounts of the unused injected reducing agent is directed to the flue gas treatment facilities. The ammonia solution injection system consists of spray nozzles arranged on two levels, and a reducing agent supply system. Nozzles arranged on two levels ensure effective mixing of materials with smoke.
The principal characteristics of the semi-dry flue gas treatment facilities applied to a waste incineration plant (PEA Development Alternatives No. 2 and No. 3). During the incineration of waste the materials they contain oxidize and thus a variety of acid and acidic compounds are being forming. Semi-dry flue gas cleaning technology can be used in the CHP plant for cleaning of acid gas (HCI, HP, SO2, etc.). This technology allows to achieve high cleaning efficiency, requires less investment, as well as its high technology advantage is that by using this method waste is not formed. Activated carbon collects mercury, dioxins, furans and other heavy organic molecules.
Acid gas absorption, collection of dioxins and heavy metals takes place in the semi-dry type reactor. Activated carbon, slaked lime (Ca (OH2) or quicklime (CaO) are used as reagents to a semi-dry process. Selection of the reagent substance depends on the equipment supplier. According to the practical benefits of operation of such facilities it is more likely, that quicklime (CaO) will be selected as a reagent substance.
A controlled amount of lime, water and circulating filter ash is mixed in the extinguisher and fed into the reactor where is mixed with hot untreated flue gas from the boiler. Typically, the amount of acid gases depends on the composition of fuel burned. In general, the hydrated lime reacts with all acid components and at the end of the reaction, dry particles are obtained. Secondary particles, generated during chemical bonding and unreacted lime, are caught in a bag filter. Part of the unreacted materials collected in the filter is returned back to a semi-dry type reactor.
After a semi-dry type reactor, smoke enters the bag filter, where solids are collected in the bags of the filter. A dust layer deposited on the surface of the bags of the filter also protects against acidic components and smaller particles. Part of the collected particles is directed back into the reactor through the fire extinguisher. A level control system controls the amount of the final product, which is directed to the final product bunker. Dust collected in the filter bunker and the reactor is directed to the final product bunker by pneumatic lines.
The description of principle of operation of a bag filter may be applied to the waste incineration plant (PEA Development Alternatives No. 2 and No 3) and can be used for biomass plant
Particles of a different size - from millimetre to tenths of a micron are formed by burning waste and biomass. They are made up of unburned fuel, sulphur compounds, carbon, smoke, and airborne dust. During a proper control of the combustion process, ash consisting of non-combustible material and fine solid particles mostly remains in smoke. Bag filters should be used in the power plant to clean the flue gas from solid particles. This is one of the most commonly used technologies for waste incineration plants. Flue gas gets in the bag filter from semi-dry flue gas treatment plants. Smoke will be filtered in the bag filter through bags made of special fibrous material, which keeps the solid particles and waste products generated during semi-dry flue gas treatment. A layer of dust formed on the filter surface further suppresses acidic components and small particles.
Regular filter cleaning is mandatory for effective operation of a bag filter. Only 1-2 filters are cleaned at the same time thus ensuring a continuous uniform cleaning efficiency during operation. Usually a filter consists of two or more sections, so even if one section is removed for repairs, the filter continues to operate effectively. Ash accumulated in the bags falls down into a collection bunker below. The level control system controls the amount of the final product in the filter bunker, which is directed by the pneumatic line to the final product bunker. Usually the bag filter is replaced every 36 months.

The description of principle of operation of the electrostatic filter (may be applied to a biomass-fired plant)
The electrostatic filter (ESF) is designed to clean the combustion products formed during biomass combustion in the combustion chamber and releasing most of heat energy in the boiler from the solid particles they contain. Depending on the number of particles present in the flue gas, and the required level of treatment, electrostatic filters may have one or two fields, and in exceptional cases, the three-field filter may be needed. Structure of the filter and at the same the number of fields will be determined during the stage of selection of technical solutions. Particles moving in the electrostatic filter are charged and under exposure to an electric field are deposited on the plates. Deposited dust is removed by mechanical means. Cleaning efficiency of 10 μm and smaller solid particles by the electrostatic filter is from 99 to 99.9%.
Figure 13: Fig 2.1.4: Process flow scheme of ESF operation
Flue gas condensing economiser (SCE)
Exhaust flue gas resulting from the incineration of waste and fuel gas has high-energy content in the form of water, vapour, latent heat and flue gas heat.
Flue gas of about 130-160 °C passes from the furnace to the flue gas condensing economiser, in which upon release of its heat, it is cooled, and after reaching the dew point, water vapour in flue gas condenses by releasing its heat. Given that biomass smoke contains much water vapour, contact condensing economisers are mainly used for their heat recovery.
The condensing economiser consists of the structural part of the condensing economizer (heat and mass transfer surfaces), condensate sprayers and condensate treatment equipment. Fuel gas condensing economiser is usually installed after the installation of the flue gas treatment facility from particles.
Flue gas resulting from the flue gas treatment facilities (before the flue gas condensing economiser) gets into the duct where the sprayers of flue gas condensate are installed. Water is sprayed into the flue gas (and later, after the sufficient quantity of condensate is produced from flue gas, the condensate is sprayed) that cools the flue gas to a temperature not higher than ~ 3 °C compared with the temperature of the heat transfer material returning from a heating network. Condensate sprayed with sprayers absorbs large solid particles contained in flue gases and precipitates them into the sediment tank, from which the contaminated water is drained to the condensate treatment equipment. Condensate flows into tanks installed at the bottom of the economiser. Using the pumps condensate is fed from tanks to heat exchangers and is used to heat district heating return water.
System for collecting ash, slag and flue gas treatment products
The bottom ash (slag) management system comprises incineration waste bunkers with chutes, incineration waste conveyors, slag chutes, slag extractors, vibrating and belt conveyors. The purpose of the system is to ensure the proper collection of waste and ash resulting from the incineration process in a slag storage facility.
Ash to ash bunker
Bottom ash and incineration waste (non-volatile incineration waste) usually comprises about 80 - 90 percent of all incineration waste. Incineration waste (residues) falls into the chutes from a 3-track moving grate through the bunkers installed under each grate section. Conveyors are installed at the end of each chute of the track. Chutes are of the submerged type so that the combustion air could not leak from the primary air system. A level control valve maintains a constant water level in the chutes. Every conveyor transports incineration waste to the slag chutes. The bottom ash from the end of the grate over the slag chutes falls directly into the two slag extractors. Combustion air is isolated by the sufficient water level in the slag extractors. Water is removed from ash in the inclined outlet of the extractor, and then ash passes to another conveyor. Vapour formed during the soak process moves up to the furnace over the slag chute. A constant water level in the slag extractor is maintained by level control.
Bottom ash falls from the slag extractor on one of the vibrating conveyer which passes ash onto the conveyor. Ash is transported by a conveyor to the slag storage unit. The bottom ash handling system is managed and monitored by the automated management system from the operator’s workplace.
In case of PEA Development Alternative No 2, bottom ash formed in the waste incineration plant and biomass incineration plant will be stored in separate bunkers.
2.1.2 PEA Development Alternative No 3
In case of PEA Development Alternative No 3, one cogeneration facility firing mixed fuel (waste and biomass) will be constructed whose main elements are:
- steam boiler,
- steam turbine and generator,
- water treatment system,
- advanced exhaust flue gas treatment system with the condensing economizer,
- system for collecting ash, slag and flue gas treatment products
- power plant management system.
All technological elements are identical to elements of the waste-fired CHP plant according to Vilnius CHP power plant in case of Development Alternative No 2.
Waste delivery, acceptance, storage and supply in the fuel acceptance, preparation, storage and supply system is analogous to the system of the waste-fired unit in accordance with PEA Development Alternative No 2.
In case of PEA Development Alternative No 3, the additional biomass preparation unit is not planned due to the lower amount of burned biomass compared to Alternative No 2; biomass will only be delivered in the form of chips.
The layout scheme of technological equipment of PEA Development Alternative No 3 is provided in Annex 7, and the process flow scheme is given in Annex 8.
2.1.3 Additional Alternative to PEA Development Alternative No 2
In case of use of the CHP-3 plant according to PEA Development Alternative No 2, steam will be fed via the planned steam line to one steam turbine of the CHP-3 plant (T-180/210-130-1, a steam extraction condensing turbine). Heat generated in the turbine condensers will be transferred via the existing heat transfer system to the Vilnius district heating system (DHS). Electricity produced will be transferred via the existing cables to a 110 kV substation of the CHP-3 plant. The resulting steam condensate will be returned via a pipeline to facilities under construction.
In case of use of this alternative, the existing installations of the CHP-3 plant should be reconstructed, namely: a turbine must be reconstructed and adapted to operate with a small amount of steam and low steam parameters; a steam turbine control system must be substantially upgraded, and the turbine generator reconstructed as well. In addition, in the event of selection of this option, it would be necessary to use non-traditional technological / engineering solutions to ensure reliable and uninterrupted operation of the power plant, such as during installation of the high-pressure steam line the solutions eliminating the possibility of a hydraulic impact in the steam pipeline (Heat tracing) should be applied. Issues on adaptation of auxiliary equipment to different modes of operation than projected (e.g. adaptation /replacement of the deaerator and so on) should be addressed. The start-up time will prolong due to a steam line heating the plant.
In this case, the efficiency of existing equipment (CHP-3 power plant units were put into operation in 1984-1986, i.e. they have operated for 30 years), operational flexibility (nominal turbine electric power - 100 MW, minimum electric power - 70 MW) and effective operating range would be less as opposed to new installations. This would result in a lower annual average energy efficiency of production facilities, and therefore more fuel would be consumed to produce the same amount of energy leading to more environmental pollution. Less flexible operation of the unit (partially unloaded, minimum power, heat and power ratio operating under minimal load, etc.) will also lead to an annual reduction in plant output what would reduce operating income. As a result, considering the lower efficiency of facilities and the potential larger amount of heat discharged into the environment through cooling towers
55, the cost of the heat output
of the facility will be higher.
The process flow scheme of the AA to PEA Development Alternative N 2 is provided in Annex 8.
2.2 Comparison of the proposed techniques and equipment with the best available techniques
The best available techniques (BAT) is the most effective and advanced stage in the development of activities and their methods of operation, which indicates the practical suitability of particular techniques for providing the basis for emission limit values and other permit conditions designed to prevent and, where that is not practicable, to reduce emissions and the impact on the environment as a whole.
The comparative parameters (e.g. air emissions, water consumption, energy consumption per unit of production, etc.) are set according to the EU BAT reference document, their summaries, and annotations. Where the industrial device activity rates do not meet the BAT level, an operator must prepare an environmental action plan anticipating the changes to ensure a higher level of environmental protection.
Analysis of the application of BAT in Vilnius CHP plant is carried out by analysing the general BAT for waste and fuel combustion (waste and biomass power plant), monitoring and the application of environmental management measures. The application of BAT technological measures for waste and biomass power plants is analysed separately.
55
providing potentially longer operating time of the plant
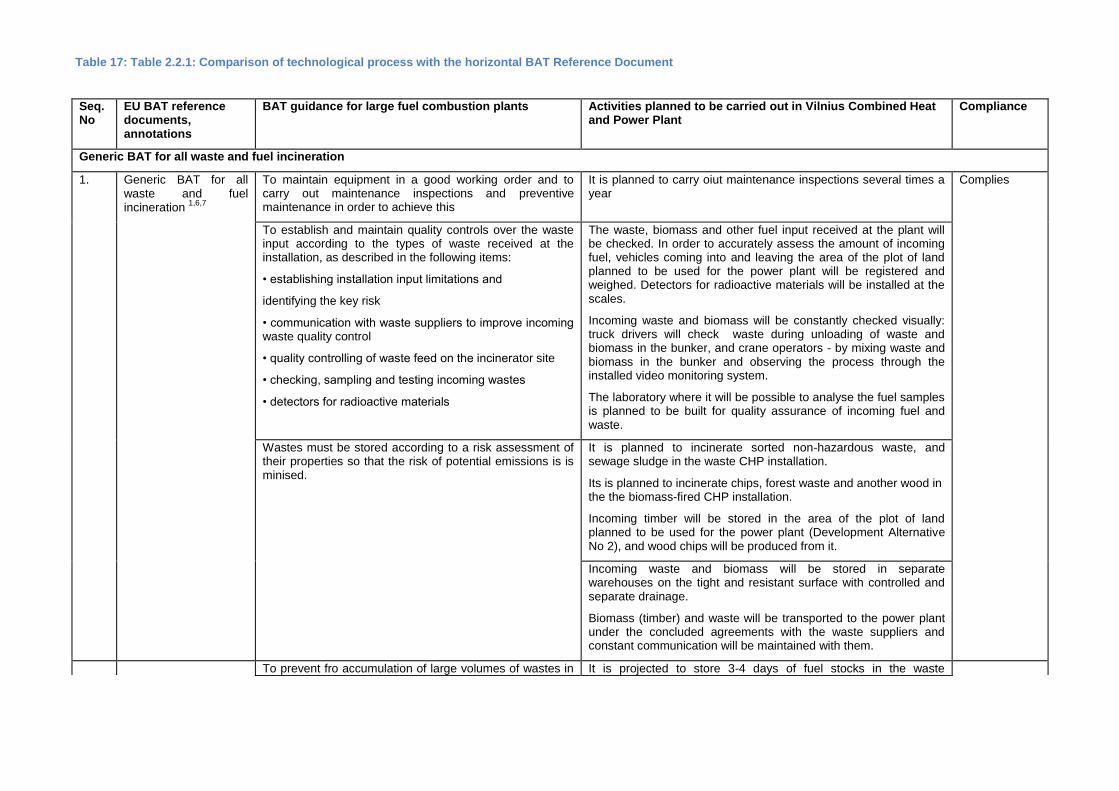
Table 17: Table 2.2.1: Comparison of technological process with the horizontal BAT Reference Document
Seq. No
EU BAT reference documents, annotations
BAT guidance for large fuel combustion plants Activities planned to be carried out in Vilnius Combined Heat and Power Plant
Compliance
Generic BAT for all waste and fuel incineration
1. Generic BAT for all waste and fuel incineration
1,6,7
To maintain equipment in a good working order and to carry out maintenance inspections and preventive maintenance in order to achieve this
It is planned to carry oiut maintenance inspections several times a year
Complies
To establish and maintain quality controls over the waste input according to the types of waste received at the installation, as described in the following items:
• establishing installation input limitations and
identifying the key risk
• communication with waste suppliers to improve incoming waste quality control
• quality controlling of waste feed on the incinerator site
• checking, sampling and testing incoming wastes
• detectors for radioactive materials
The waste, biomass and other fuel input received at the plant will be checked. In order to accurately assess the amount of incoming fuel, vehicles coming into and leaving the area of the plot of land planned to be used for the power plant will be registered and weighed. Detectors for radioactive materials will be installed at the scales.
Incoming waste and biomass will be constantly checked visually: truck drivers will check waste during unloading of waste and biomass in the bunker, and crane operators - by mixing waste and biomass in the bunker and observing the process through the installed video monitoring system.
The laboratory where it will be possible to analyse the fuel samples is planned to be built for quality assurance of incoming fuel and waste.
Wastes must be stored according to a risk assessment of their properties so that the risk of potential emissions is is minised.
It is planned to incinerate sorted non-hazardous waste, and sewage sludge in the waste CHP installation.
Its is planned to incinerate chips, forest waste and another wood in the the biomass-fired CHP installation.
Incoming timber will be stored in the area of the plot of land planned to be used for the power plant (Development Alternative No 2), and wood chips will be produced from it.
Incoming waste and biomass will be stored in separate warehouses on the tight and resistant surface with controlled and separate drainage.
Biomass (timber) and waste will be transported to the power plant under the concluded agreements with the waste suppliers and constant communication will be maintained with them.
To prevent fro accumulation of large volumes of wastes in It is projected to store 3-4 days of fuel stocks in the waste
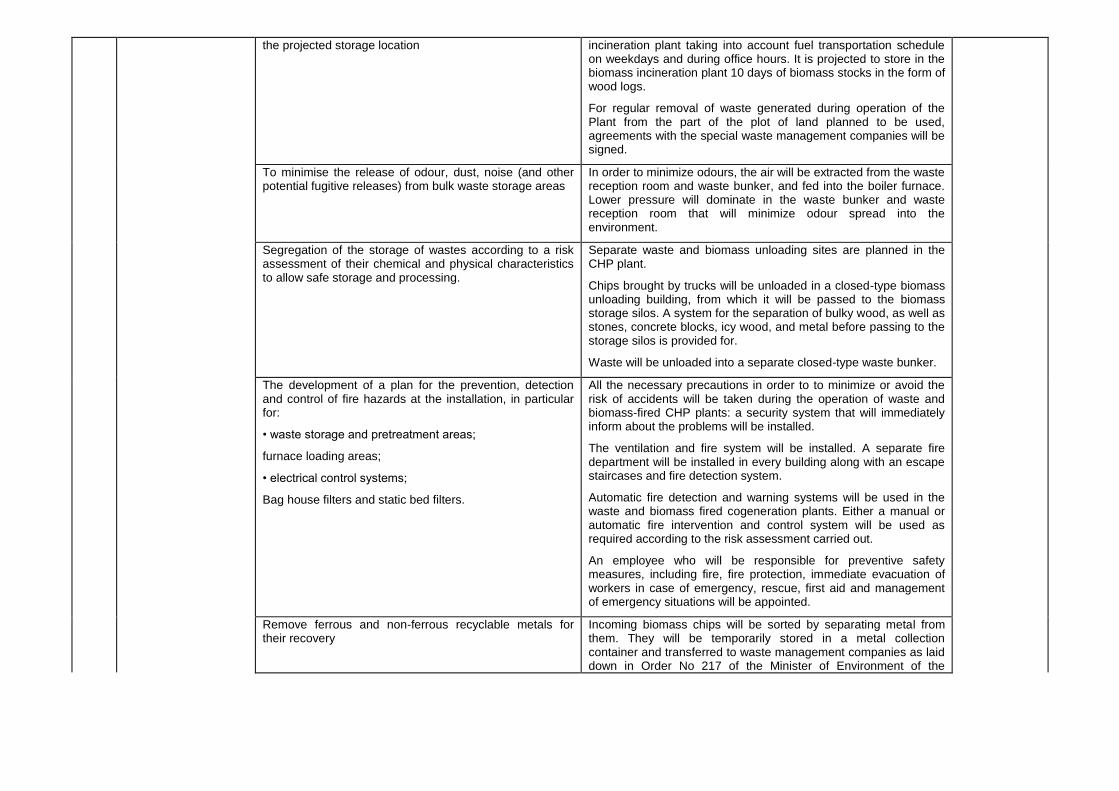
the projected storage location incineration plant taking into account fuel transportation schedule on weekdays and during office hours. It is projected to store in the biomass incineration plant 10 days of biomass stocks in the form of wood logs.
For regular removal of waste generated during operation of the Plant from the part of the plot of land planned to be used, agreements with the special waste management companies will be signed.
To minimise the release of odour, dust, noise (and other potential fugitive releases) from bulk waste storage areas
In order to minimize odours, the air will be extracted from the waste reception room and waste bunker, and fed into the boiler furnace. Lower pressure will dominate in the waste bunker and waste reception room that will minimize odour spread into the environment.
Segregation of the storage of wastes according to a risk assessment of their chemical and physical characteristics to allow safe storage and processing.
Separate waste and biomass unloading sites are planned in the CHP plant.
Chips brought by trucks will be unloaded in a closed-type biomass unloading building, from which it will be passed to the biomass storage silos. A system for the separation of bulky wood, as well as stones, concrete blocks, icy wood, and metal before passing to the storage silos is provided for.
Waste will be unloaded into a separate closed-type waste bunker.
The development of a plan for the prevention, detection and control of fire hazards at the installation, in particular for:
• waste storage and pretreatment areas;
furnace loading areas;
• electrical control systems;
Bag house filters and static bed filters.
All the necessary precautions in order to to minimize or avoid the risk of accidents will be taken during the operation of waste and biomass-fired CHP plants: a security system that will immediately inform about the problems will be installed.
The ventilation and fire system will be installed. A separate fire department will be installed in every building along with an escape staircases and fire detection system.
Automatic fire detection and warning systems will be used in the waste and biomass fired cogeneration plants. Either a manual or automatic fire intervention and control system will be used as required according to the risk assessment carried out.
An employee who will be responsible for preventive safety measures, including fire, fire protection, immediate evacuation of workers in case of emergency, rescue, first aid and management of emergency situations will be appointed.
Remove ferrous and non-ferrous recyclable metals for their recovery
Incoming biomass chips will be sorted by separating metal from them. They will be temporarily stored in a metal collection container and transferred to waste management companies as laid down in Order No 217 of the Minister of Environment of the
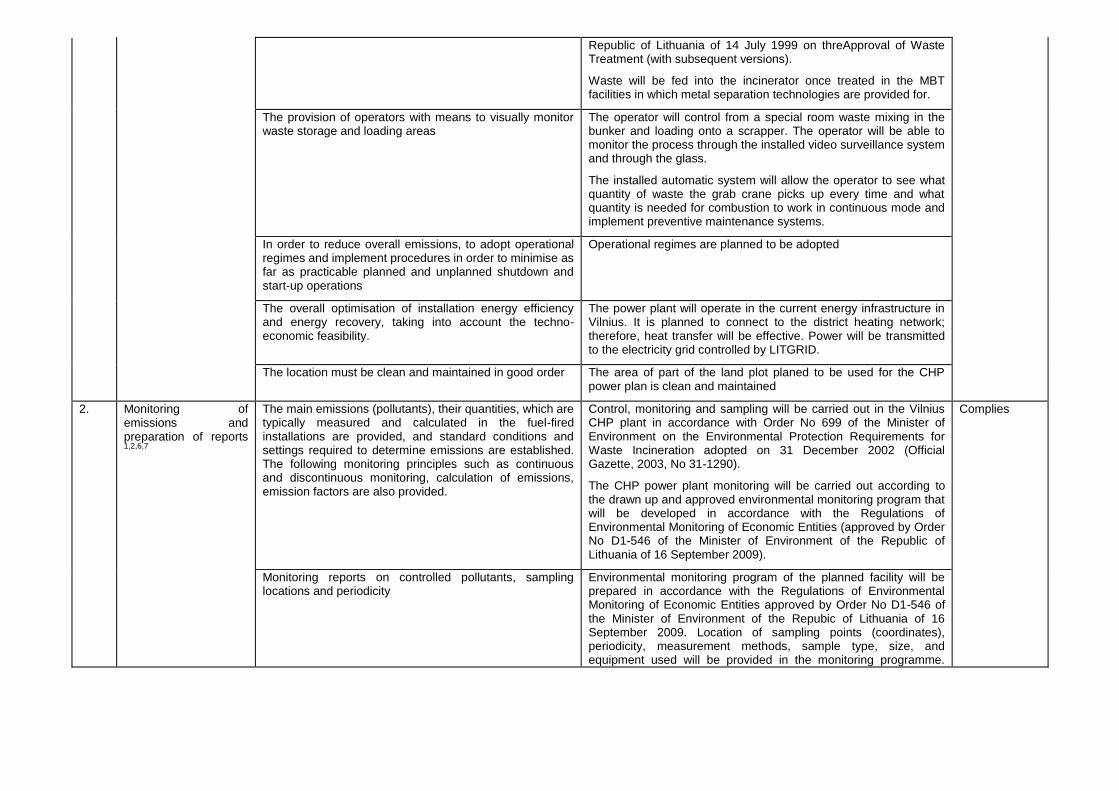
Republic of Lithuania of 14 July 1999 on threApproval of Waste Treatment (with subsequent versions).
Waste will be fed into the incinerator once treated in the MBT facilities in which metal separation technologies are provided for.
The provision of operators with means to visually monitor waste storage and loading areas
The operator will control from a special room waste mixing in the bunker and loading onto a scrapper. The operator will be able to monitor the process through the installed video surveillance system and through the glass.
The installed automatic system will allow the operator to see what quantity of waste the grab crane picks up every time and what quantity is needed for combustion to work in continuous mode and implement preventive maintenance systems.
In order to reduce overall emissions, to adopt operational regimes and implement procedures in order to minimise as far as practicable planned and unplanned shutdown and start-up operations
Operational regimes are planned to be adopted
The overall optimisation of installation energy efficiency and energy recovery, taking into account the techno-economic feasibility.
The power plant will operate in the current energy infrastructure in Vilnius. It is planned to connect to the district heating network; therefore, heat transfer will be effective. Power will be transmitted to the electricity grid controlled by LITGRID.
The location must be clean and maintained in good order The area of part of the land plot planed to be used for the CHP power plan is clean and maintained
2. Monitoring of emissions and preparation of reports 1,2,6,7
The main emissions (pollutants), their quantities, which are typically measured and calculated in the fuel-fired installations are provided, and standard conditions and settings required to determine emissions are established. The following monitoring principles such as continuous and discontinuous monitoring, calculation of emissions, emission factors are also provided.
Control, monitoring and sampling will be carried out in the Vilnius CHP plant in accordance with Order No 699 of the Minister of Environment on the Environmental Protection Requirements for Waste Incineration adopted on 31 December 2002 (Official Gazette, 2003, No 31-1290).
The CHP power plant monitoring will be carried out according to the drawn up and approved environmental monitoring program that will be developed in accordance with the Regulations of Environmental Monitoring of Economic Entities (approved by Order No D1-546 of the Minister of Environment of the Republic of Lithuania of 16 September 2009).
Complies
Monitoring reports on controlled pollutants, sampling locations and periodicity
Environmental monitoring program of the planned facility will be prepared in accordance with the Regulations of Environmental Monitoring of Economic Entities approved by Order No D1-546 of the Minister of Environment of the Repubic of Lithuania of 16 September 2009. Location of sampling points (coordinates), periodicity, measurement methods, sample type, size, and equipment used will be provided in the monitoring programme.
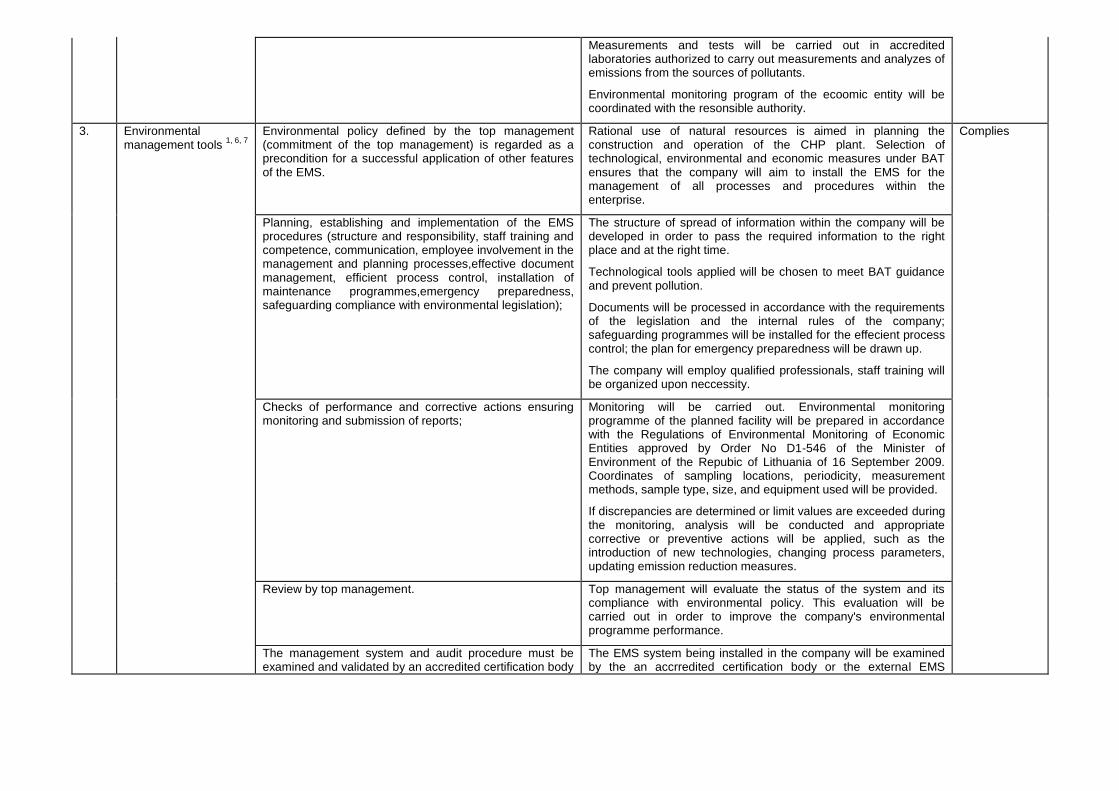
Measurements and tests will be carried out in accredited laboratories authorized to carry out measurements and analyzes of emissions from the sources of pollutants.
Environmental monitoring program of the ecoomic entity will be coordinated with the resonsible authority.
3. Environmental management tools
1, 6, 7
Environmental policy defined by the top management (commitment of the top management) is regarded as a precondition for a successful application of other features of the EMS.
Rational use of natural resources is aimed in planning the construction and operation of the CHP plant. Selection of technological, environmental and economic measures under BAT ensures that the company will aim to install the EMS for the management of all processes and procedures within the enterprise.
Complies
Planning, establishing and implementation of the EMS procedures (structure and responsibility, staff training and competence, communication, employee involvement in the management and planning processes,effective document management, efficient process control, installation of maintenance programmes,emergency preparedness, safeguarding compliance with environmental legislation);
The structure of spread of information within the company will be developed in order to pass the required information to the right place and at the right time.
Technological tools applied will be chosen to meet BAT guidance and prevent pollution.
Documents will be processed in accordance with the requirements of the legislation and the internal rules of the company; safeguarding programmes will be installed for the effecient process control; the plan for emergency preparedness will be drawn up.
The company will employ qualified professionals, staff training will be organized upon neccessity.
Checks of performance and corrective actions ensuring monitoring and submission of reports;
Monitoring will be carried out. Environmental monitoring programme of the planned facility will be prepared in accordance with the Regulations of Environmental Monitoring of Economic Entities approved by Order No D1-546 of the Minister of Environment of the Repubic of Lithuania of 16 September 2009. Coordinates of sampling locations, periodicity, measurement methods, sample type, size, and equipment used will be provided.
If discrepancies are determined or limit values are exceeded during the monitoring, analysis will be conducted and appropriate corrective or preventive actions will be applied, such as the introduction of new technologies, changing process parameters, updating emission reduction measures.
Review by top management. Top management will evaluate the status of the system and its compliance with environmental policy. This evaluation will be carried out in order to improve the company's environmental programme performance.
The management system and audit procedure must be examined and validated by an accredited certification body
The EMS system being installed in the company will be examined by the an accrredited certification body or the external EMS
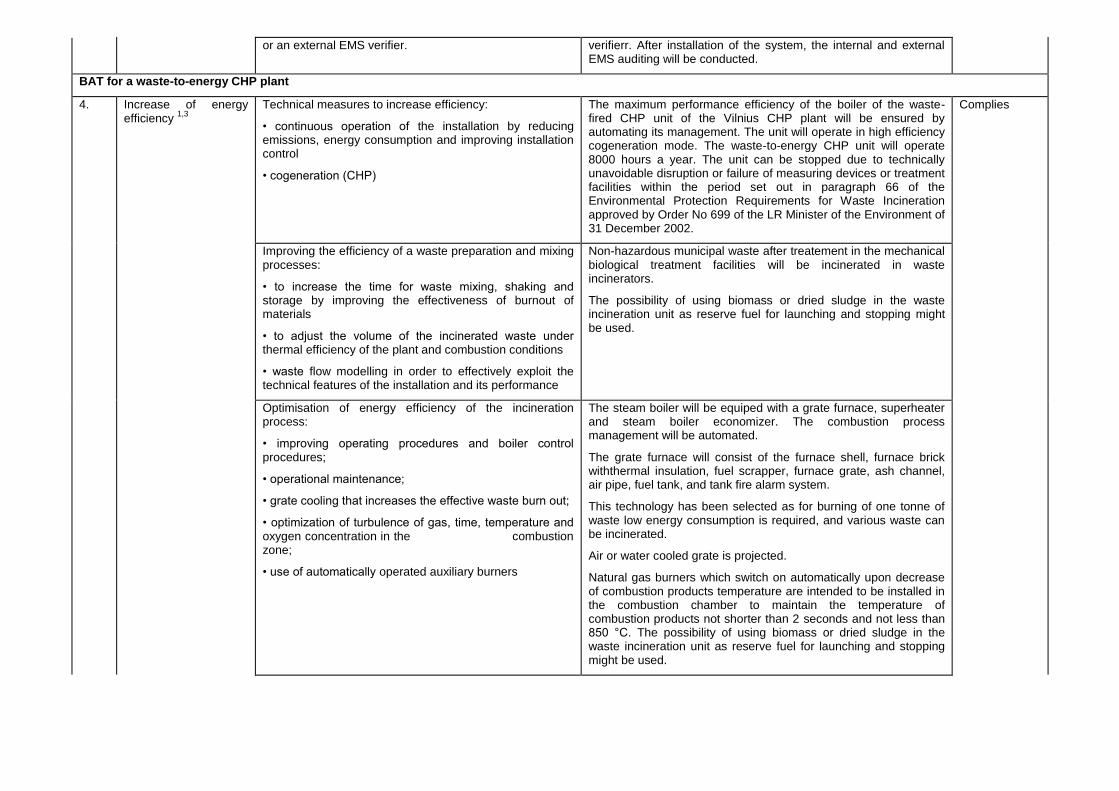
or an external EMS verifier. verifierr. After installation of the system, the internal and external EMS auditing will be conducted.
BAT for a waste-to-energy CHP plant
4. Increase of energy efficiency
1,3
Technical measures to increase efficiency:
• continuous operation of the installation by reducing emissions, energy consumption and improving installation control
• cogeneration (CHP)
The maximum performance efficiency of the boiler of the waste-fired CHP unit of the Vilnius CHP plant will be ensured by automating its management. The unit will operate in high efficiency cogeneration mode. The waste-to-energy CHP unit will operate 8000 hours a year. The unit can be stopped due to technically unavoidable disruption or failure of measuring devices or treatment facilities within the period set out in paragraph 66 of the Environmental Protection Requirements for Waste Incineration approved by Order No 699 of the LR Minister of the Environment of 31 December 2002.
Complies
Improving the efficiency of a waste preparation and mixing processes:
• to increase the time for waste mixing, shaking and storage by improving the effectiveness of burnout of materials
• to adjust the volume of the incinerated waste under thermal efficiency of the plant and combustion conditions
• waste flow modelling in order to effectively exploit the technical features of the installation and its performance
Non-hazardous municipal waste after treatement in the mechanical biological treatment facilities will be incinerated in waste incinerators.
The possibility of using biomass or dried sludge in the waste incineration unit as reserve fuel for launching and stopping might be used.
Optimisation of energy efficiency of the incineration process:
• improving operating procedures and boiler control procedures;
• operational maintenance;
• grate cooling that increases the effective waste burn out;
• optimization of turbulence of gas, time, temperature and oxygen concentration in the combustion zone;
• use of automatically operated auxiliary burners
The steam boiler will be equiped with a grate furnace, superheater and steam boiler economizer. The combustion process management will be automated.
The grate furnace will consist of the furnace shell, furnace brick withthermal insulation, fuel scrapper, furnace grate, ash channel, air pipe, fuel tank, and tank fire alarm system.
This technology has been selected as for burning of one tonne of waste low energy consumption is required, and various waste can be incinerated.
Air or water cooled grate is projected.
Natural gas burners which switch on automatically upon decrease of combustion products temperature are intended to be installed in the combustion chamber to maintain the temperature of combustion products not shorter than 2 seconds and not less than 850 °C. The possibility of using biomass or dried sludge in the waste incineration unit as reserve fuel for launching and stopping might be used.

Optimization techniques in energy efficiency of steam systems :
• install energy recovery equipment
• improve water treatment
Water taken from the water supply network of Vilnius city will be treated to improve certain physical and chemical parameters:
- iron will be removed
- it will be softene
- treated with reverse osmosis filters
- demineralized by electrodeionization
High quality treated water / steam may circulate in a closed circuit and thereby reduce the consumption of "green" water .
It is provided to install the boiler blowdown, and deaerator steam heat recovery systems.
5 Production techniques for waste incineration
1,
4
Milling, crushing, grinding and blending of mixed municipal waste by increasing their homogeneity, uniformity of combustion, reducing and stabilizing release of pollutants
Non-hazardous municipal waste and biomass (wood chips, logs, etc.) shall be supplied to the power plant after the MBT. Waste will be mixed, if necessary, crushed to increase their homogenity.
Complies
Separation of incidental items inappropriate for incineration before burning and installation of an area for storage of objects removed from waste prior to incineration
Only waste received from sorting facilities will be used for burning, so the possibility to incinerate inappropriate waste is minimal. Accidental objects not suitable for burning will be selected and stored in a separate storage area. Other inert materials will be transferred to waste management plants.
Fuel unloading, storage, and crushing will take place in the closed areas to avoid release of pollutants into the environment.
Most of waste will be conveyed by a closed conveyor without contact with ambient air from Vilnius MBT plants. The rest of waste will be transported by special transport ensuring the lowest possible odour and dust emissions into the environment.
In order to reduce the spread of odors in the environment from a fuel reception room and fuel bunker, the air will be extracted and fed into the boiler furnace. In this way, lower pressure will dominate in the fuel bunker and fuel receiving room due to which the smell does not emit into the environment.
Sufficient storage capacity. It is estimated to store fuel in power plants for a period of 3-4 days taking into account the fuel transportation schedule on weekdays and during office hours.
6 Waste treatment and storage
1
Fuel drying and crushing to increase efficiency It is planned to provide for a possibility to crush incoming waste greater than 200 mm in size. For this purpose, it is planned to install shredder on a separate chute in a closed fuel (waste) reception building for crushing of large waste. Such waste will comprise no more than 5-10% of the total amount of waste incinerated.
Complies
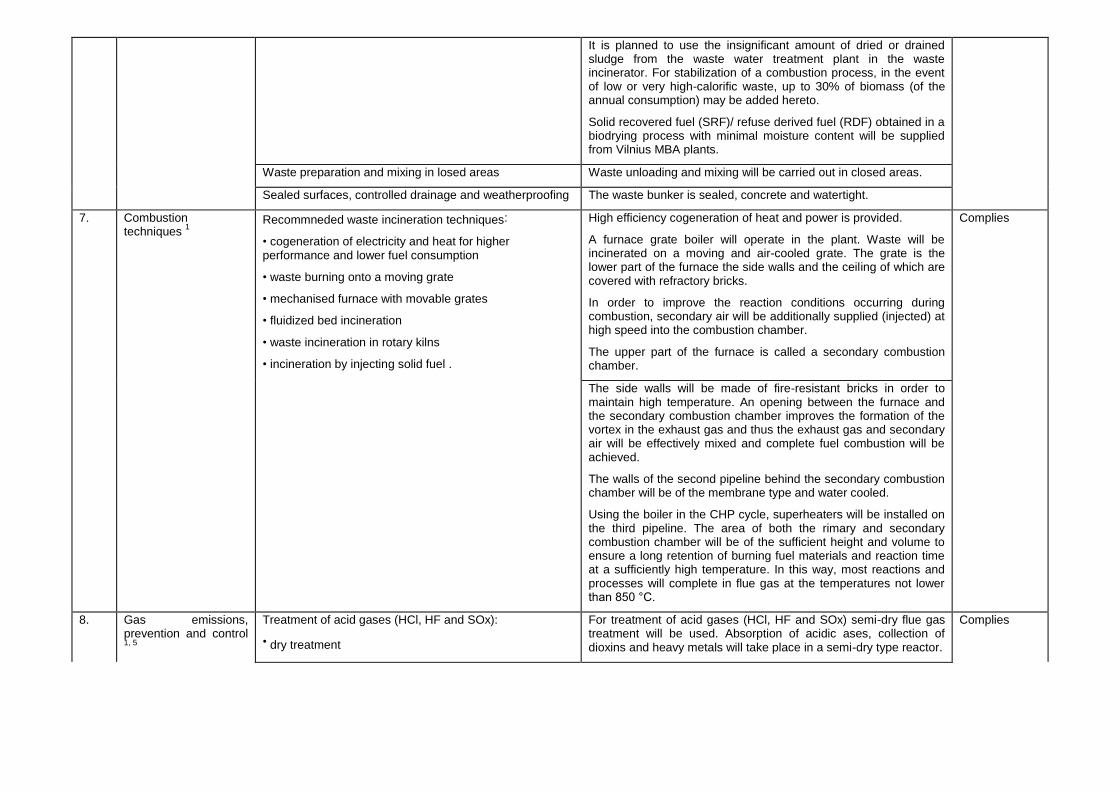
It is planned to use the insignificant amount of dried or drained sludge from the waste water treatment plant in the waste incinerator. For stabilization of a combustion process, in the event of low or very high-calorific waste, up to 30% of biomass (of the annual consumption) may be added hereto.
Solid recovered fuel (SRF)/ refuse derived fuel (RDF) obtained in a biodrying process with minimal moisture content will be supplied from Vilnius MBA plants.
Waste preparation and mixing in losed areas Waste unloading and mixing will be carried out in closed areas.
Sealed surfaces, controlled drainage and weatherproofing The waste bunker is sealed, concrete and watertight.
7. Combustion techniques
1
Recommneded waste incineration techniques:
• cogeneration of electricity and heat for higher performance and lower fuel consumption
• waste burning onto a moving grate
• mechanised furnace with movable grates
• fluidized bed incineration
• waste incineration in rotary kilns
• incineration by injecting solid fuel .
High efficiency cogeneration of heat and power is provided.
A furnace grate boiler will operate in the plant. Waste will be incinerated on a moving and air-cooled grate. The grate is the lower part of the furnace the side walls and the ceiling of which are covered with refractory bricks.
In order to improve the reaction conditions occurring during combustion, secondary air will be additionally supplied (injected) at high speed into the combustion chamber.
The upper part of the furnace is called a secondary combustion chamber.
Complies
The side walls will be made of fire-resistant bricks in order to maintain high temperature. An opening between the furnace and the secondary combustion chamber improves the formation of the vortex in the exhaust gas and thus the exhaust gas and secondary air will be effectively mixed and complete fuel combustion will be achieved.
The walls of the second pipeline behind the secondary combustion chamber will be of the membrane type and water cooled.
Using the boiler in the CHP cycle, superheaters will be installed on the third pipeline. The area of both the rimary and secondary combustion chamber will be of the sufficient height and volume to ensure a long retention of burning fuel materials and reaction time at a sufficiently high temperature. In this way, most reactions and processes will complete in flue gas at the temperatures not lower than 850 °C.
8. Gas emissions, prevention and control 1, 5
Treatment of acid gases (HCl, HF and SOx):
• dry treatment
For treatment of acid gases (HCl, HF and SOx) semi-dry flue gas treatment will be used. Absorption of acidic ases, collection of dioxins and heavy metals will take place in a semi-dry type reactor.
Complies
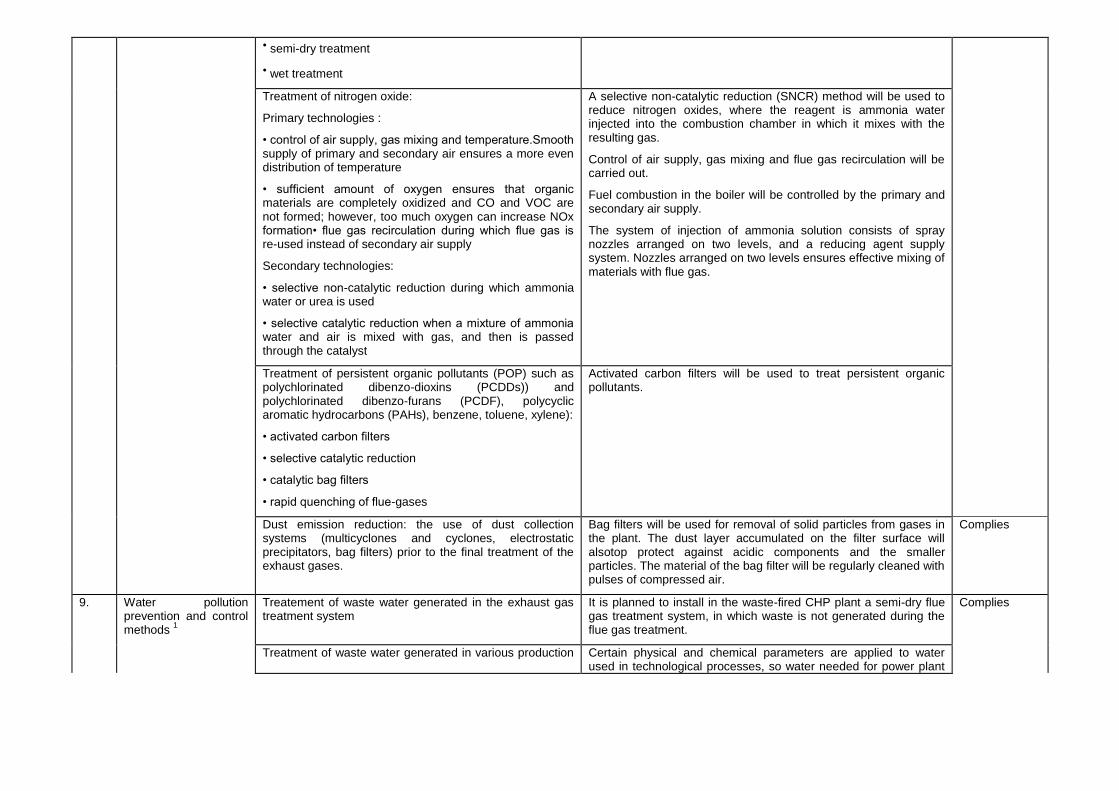
• semi-dry treatment
• wet treatment
Treatment of nitrogen oxide:
Primary technologies :
• control of air supply, gas mixing and temperature.Smooth supply of primary and secondary air ensures a more even distribution of temperature
• sufficient amount of oxygen ensures that organic materials are completely oxidized and CO and VOC are not formed; however, too much oxygen can increase NOx formation• flue gas recirculation during which flue gas is re-used instead of secondary air supply
Secondary technologies:
• selective non-catalytic reduction during which ammonia water or urea is used
• selective catalytic reduction when a mixture of ammonia water and air is mixed with gas, and then is passed through the catalyst
A selective non-catalytic reduction (SNCR) method will be used to reduce nitrogen oxides, where the reagent is ammonia water injected into the combustion chamber in which it mixes with the resulting gas.
Control of air supply, gas mixing and flue gas recirculation will be carried out.
Fuel combustion in the boiler will be controlled by the primary and secondary air supply.
The system of injection of ammonia solution consists of spray nozzles arranged on two levels, and a reducing agent supply system. Nozzles arranged on two levels ensures effective mixing of materials with flue gas.
Treatment of persistent organic pollutants (POP) such as polychlorinated dibenzo-dioxins (PCDDs)) and polychlorinated dibenzo-furans (PCDF), polycyclic aromatic hydrocarbons (PAHs), benzene, toluene, xylene):
• activated carbon filters
• selective catalytic reduction
• catalytic bag filters
• rapid quenching of flue-gases
Activated carbon filters will be used to treat persistent organic pollutants.
Dust emission reduction: the use of dust collection systems (multicyclones and cyclones, electrostatic precipitators, bag filters) prior to the final treatment of the exhaust gases.
Bag filters will be used for removal of solid particles from gases in the plant. The dust layer accumulated on the filter surface will alsotop protect against acidic components and the smaller particles. The material of the bag filter will be regularly cleaned with pulses of compressed air.
Complies
9. Water pollution prevention and control methods
1
Treatement of waste water generated in the exhaust gas treatment system
It is planned to install in the waste-fired CHP plant a semi-dry flue gas treatment system, in which waste is not generated during the flue gas treatment.
Complies
Treatment of waste water generated in various production Certain physical and chemical parameters are applied to water used in technological processes, so water needed for power plant
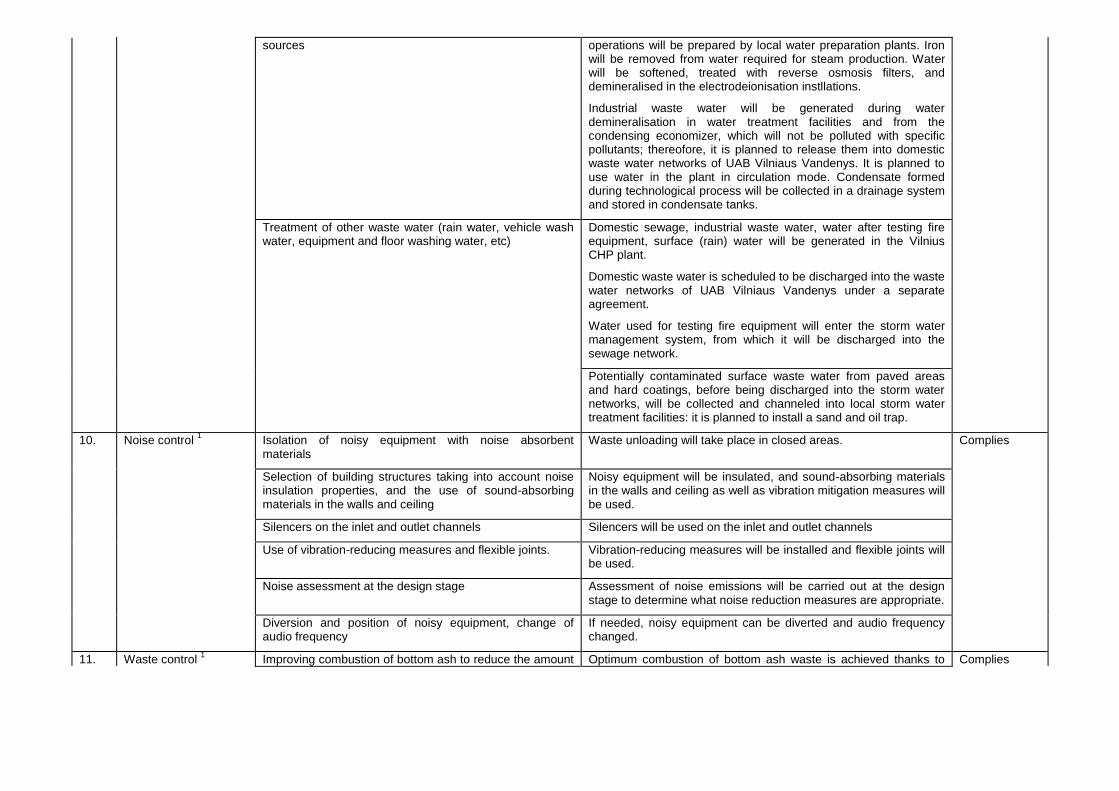
sources operations will be prepared by local water preparation plants. Iron will be removed from water required for steam production. Water will be softened, treated with reverse osmosis filters, and demineralised in the electrodeionisation instllations.
Industrial waste water will be generated during water demineralisation in water treatment facilities and from the condensing economizer, which will not be polluted with specific pollutants; thereofore, it is planned to release them into domestic waste water networks of UAB Vilniaus Vandenys. It is planned to use water in the plant in circulation mode. Condensate formed during technological process will be collected in a drainage system and stored in condensate tanks.
Treatment of other waste water (rain water, vehicle wash water, equipment and floor washing water, etc)
Domestic sewage, industrial waste water, water after testing fire equipment, surface (rain) water will be generated in the Vilnius CHP plant.
Domestic waste water is scheduled to be discharged into the waste water networks of UAB Vilniaus Vandenys under a separate agreement.
Water used for testing fire equipment will enter the storm water management system, from which it will be discharged into the sewage network.
Potentially contaminated surface waste water from paved areas and hard coatings, before being discharged into the storm water networks, will be collected and channeled into local storm water treatment facilities: it is planned to install a sand and oil trap.
10. Noise control 1 Isolation of noisy equipment with noise absorbent
materials Waste unloading will take place in closed areas. Complies
Selection of building structures taking into account noise insulation properties, and the use of sound-absorbing materials in the walls and ceiling
Noisy equipment will be insulated, and sound-absorbing materials in the walls and ceiling as well as vibration mitigation measures will be used.
Silencers on the inlet and outlet channels Silencers will be used on the inlet and outlet channels
Use of vibration-reducing measures and flexible joints. Vibration-reducing measures will be installed and flexible joints will be used.
Noise assessment at the design stage Assessment of noise emissions will be carried out at the design stage to determine what noise reduction measures are appropriate.
Diversion and position of noisy equipment, change of audio frequency
If needed, noisy equipment can be diverted and audio frequency changed.
11. Waste control 1 Improving combustion of bottom ash to reduce the amount Optimum combustion of bottom ash waste is achieved thanks to Complies
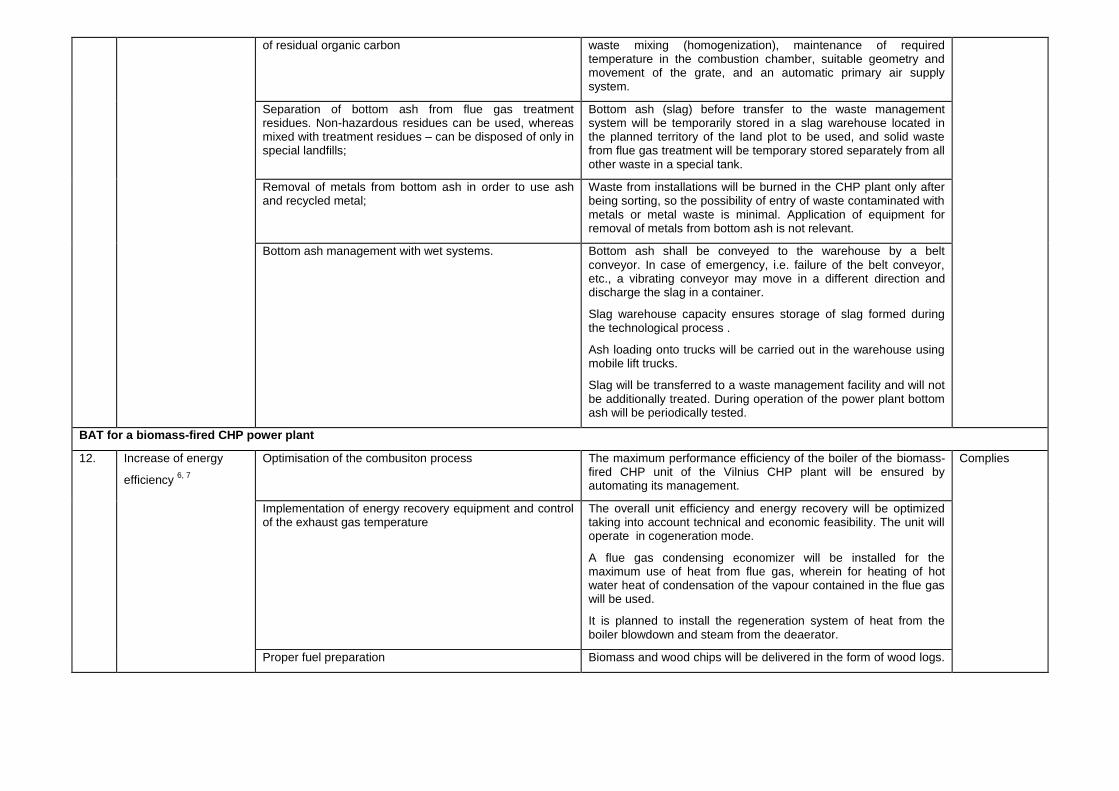
of residual organic carbon waste mixing (homogenization), maintenance of required temperature in the combustion chamber, suitable geometry and movement of the grate, and an automatic primary air supply system.
Separation of bottom ash from flue gas treatment residues. Non-hazardous residues can be used, whereas mixed with treatment residues – can be disposed of only in special landfills;
Bottom ash (slag) before transfer to the waste management system will be temporarily stored in a slag warehouse located in the planned territory of the land plot to be used, and solid waste from flue gas treatment will be temporary stored separately from all other waste in a special tank.
Removal of metals from bottom ash in order to use ash and recycled metal;
Waste from installations will be burned in the CHP plant only after being sorting, so the possibility of entry of waste contaminated with metals or metal waste is minimal. Application of equipment for removal of metals from bottom ash is not relevant.
Bottom ash management with wet systems. Bottom ash shall be conveyed to the warehouse by a belt conveyor. In case of emergency, i.e. failure of the belt conveyor, etc., a vibrating conveyor may move in a different direction and discharge the slag in a container.
Slag warehouse capacity ensures storage of slag formed during the technological process .
Ash loading onto trucks will be carried out in the warehouse using mobile lift trucks.
Slag will be transferred to a waste management facility and will not be additionally treated. During operation of the power plant bottom ash will be periodically tested.
BAT for a biomass-fired CHP power plant
12. Increase of energy
efficiency 6, 7
Optimisation of the combusiton process The maximum performance efficiency of the boiler of the biomass-fired CHP unit of the Vilnius CHP plant will be ensured by automating its management.
Complies
Implementation of energy recovery equipment and control of the exhaust gas temperature
The overall unit efficiency and energy recovery will be optimized taking into account technical and economic feasibility. The unit will operate in cogeneration mode.
A flue gas condensing economizer will be installed for the maximum use of heat from flue gas, wherein for heating of hot water heat of condensation of the vapour contained in the flue gas will be used.
It is planned to install the regeneration system of heat from the boiler blowdown and steam from the deaerator.
Proper fuel preparation Biomass and wood chips will be delivered in the form of wood logs.
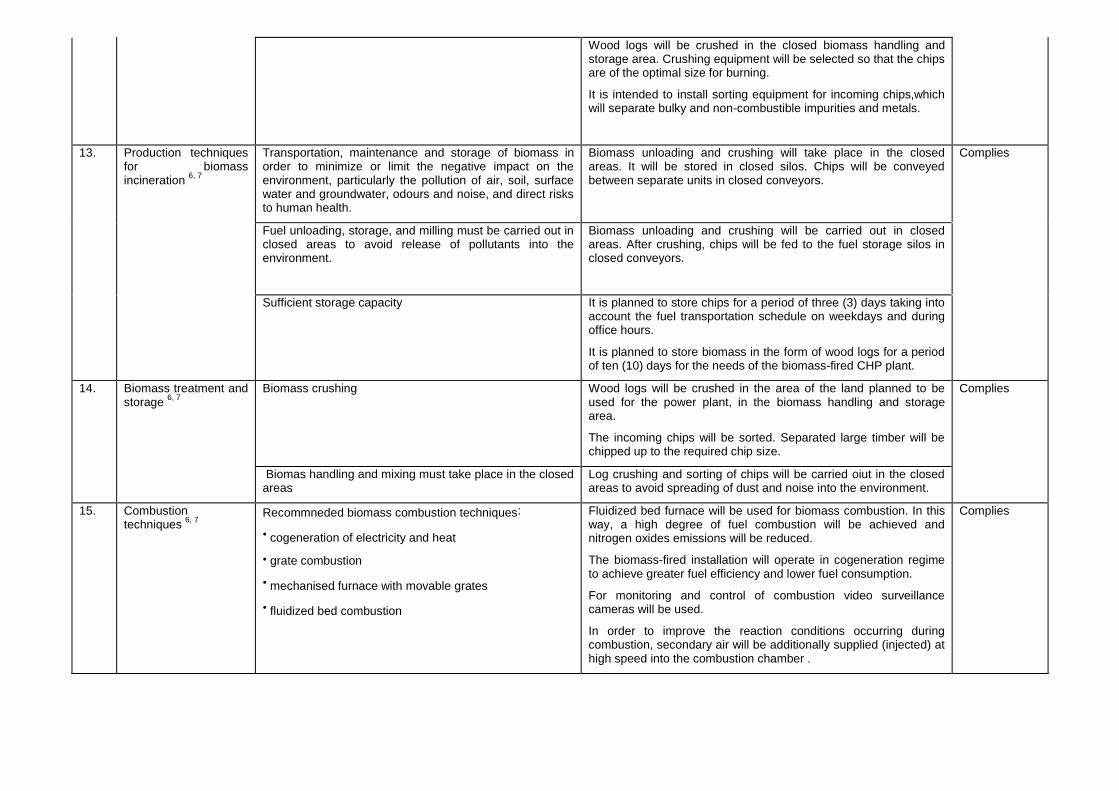
Wood logs will be crushed in the closed biomass handling and storage area. Crushing equipment will be selected so that the chips are of the optimal size for burning.
It is intended to install sorting equipment for incoming chips,which will separate bulky and non-combustible impurities and metals.
13. Production techniques for biomass incineration
6, 7
Transportation, maintenance and storage of biomass in order to minimize or limit the negative impact on the environment, particularly the pollution of air, soil, surface water and groundwater, odours and noise, and direct risks to human health.
Biomass unloading and crushing will take place in the closed areas. It will be stored in closed silos. Chips will be conveyed between separate units in closed conveyors.
Complies
Fuel unloading, storage, and milling must be carried out in closed areas to avoid release of pollutants into the environment.
Biomass unloading and crushing will be carried out in closed areas. After crushing, chips will be fed to the fuel storage silos in closed conveyors.
Sufficient storage capacity It is planned to store chips for a period of three (3) days taking into account the fuel transportation schedule on weekdays and during office hours.
It is planned to store biomass in the form of wood logs for a period of ten (10) days for the needs of the biomass-fired CHP plant.
14. Biomass treatment and storage
6, 7
Biomass crushing Wood logs will be crushed in the area of the land planned to be used for the power plant, in the biomass handling and storage area.
The incoming chips will be sorted. Separated large timber will be chipped up to the required chip size.
Complies
Biomas handling and mixing must take place in the closed areas
Log crushing and sorting of chips will be carried oiut in the closed areas to avoid spreading of dust and noise into the environment.
15. Combustion techniques
6, 7
Recommneded biomass combustion techniques:
• cogeneration of electricity and heat
• grate combustion
• mechanised furnace with movable grates
• fluidized bed combustion
Fluidized bed furnace will be used for biomass combustion. In this way, a high degree of fuel combustion will be achieved and nitrogen oxides emissions will be reduced.
The biomass-fired installation will operate in cogeneration regime to achieve greater fuel efficiency and lower fuel consumption.
For monitoring and control of combustion video surveillance cameras will be used.
In order to improve the reaction conditions occurring during combustion, secondary air will be additionally supplied (injected) at high speed into the combustion chamber .
Complies
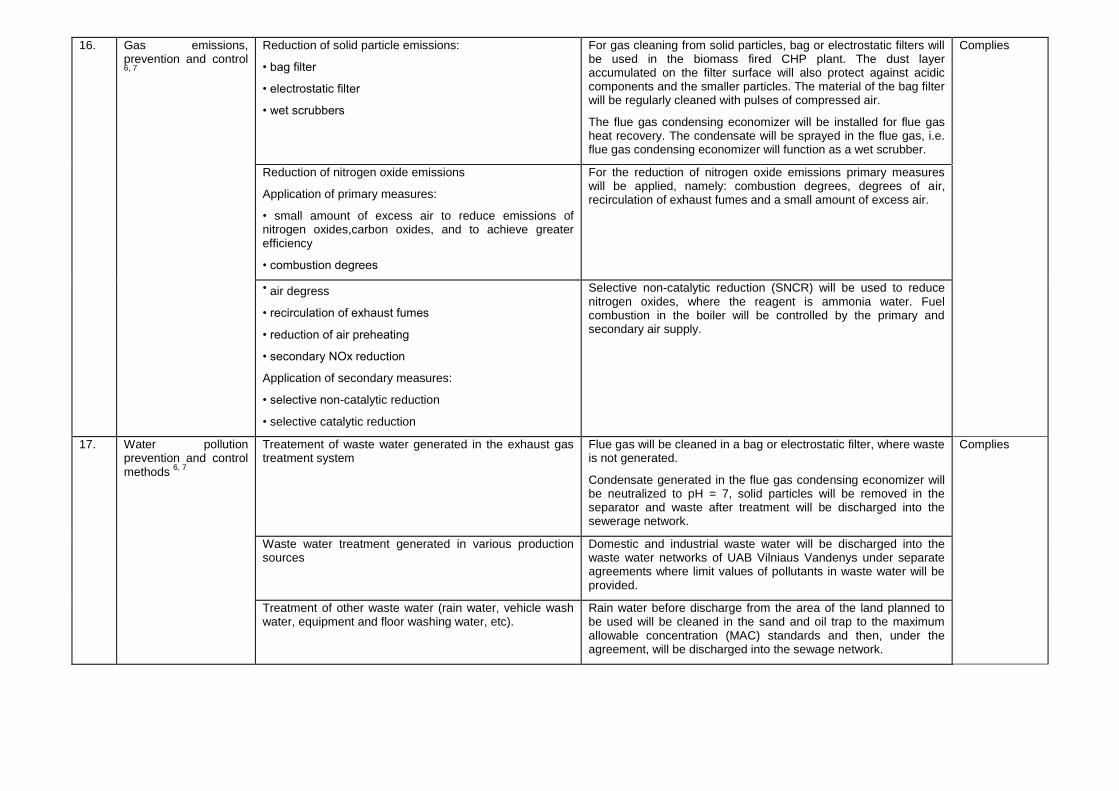
16. Gas emissions, prevention and control 6, 7
Reduction of solid particle emissions:
• bag filter
• electrostatic filter
• wet scrubbers
For gas cleaning from solid particles, bag or electrostatic filters will be used in the biomass fired CHP plant. The dust layer accumulated on the filter surface will also protect against acidic components and the smaller particles. The material of the bag filter will be regularly cleaned with pulses of compressed air.
The flue gas condensing economizer will be installed for flue gas heat recovery. The condensate will be sprayed in the flue gas, i.e. flue gas condensing economizer will function as a wet scrubber.
Complies
Reduction of nitrogen oxide emissions
Application of primary measures:
• small amount of excess air to reduce emissions of nitrogen oxides,carbon oxides, and to achieve greater efficiency
• combustion degrees
For the reduction of nitrogen oxide emissions primary measures will be applied, namely: combustion degrees, degrees of air, recirculation of exhaust fumes and a small amount of excess air.
• air degress
• recirculation of exhaust fumes
• reduction of air preheating
• secondary NOx reduction
Application of secondary measures:
• selective non-catalytic reduction
• selective catalytic reduction
Selective non-catalytic reduction (SNCR) will be used to reduce nitrogen oxides, where the reagent is ammonia water. Fuel combustion in the boiler will be controlled by the primary and secondary air supply.
17. Water pollution prevention and control methods
6, 7
Treatement of waste water generated in the exhaust gas treatment system
Flue gas will be cleaned in a bag or electrostatic filter, where waste is not generated.
Condensate generated in the flue gas condensing economizer will be neutralized to pH = 7, solid particles will be removed in the separator and waste after treatment will be discharged into the sewerage network.
Complies
Waste water treatment generated in various production sources
Domestic and industrial waste water will be discharged into the waste water networks of UAB Vilniaus Vandenys under separate agreements where limit values of pollutants in waste water will be provided.
Treatment of other waste water (rain water, vehicle wash water, equipment and floor washing water, etc).
Rain water before discharge from the area of the land planned to be used will be cleaned in the sand and oil trap to the maximum allowable concentration (MAC) standards and then, under the agreement, will be discharged into the sewage network.
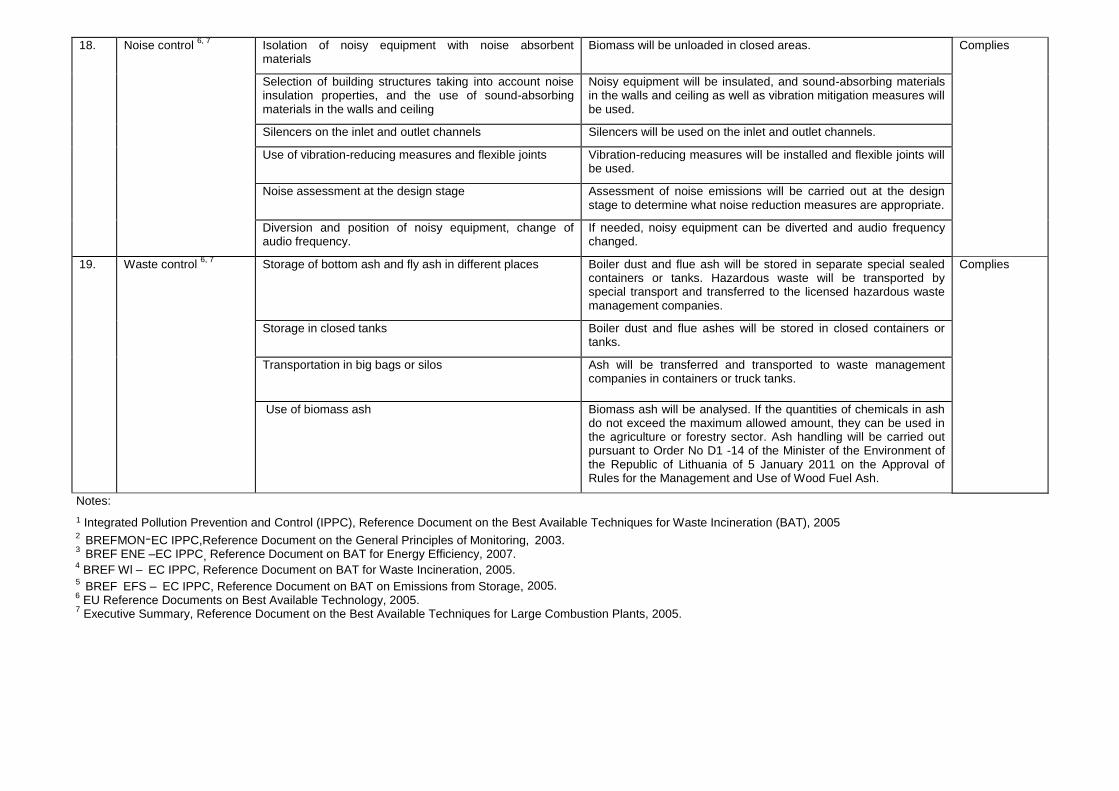
18. Noise control 6, 7
Isolation of noisy equipment with noise absorbent materials
Biomass will be unloaded in closed areas. Complies
Selection of building structures taking into account noise insulation properties, and the use of sound-absorbing materials in the walls and ceiling
Noisy equipment will be insulated, and sound-absorbing materials in the walls and ceiling as well as vibration mitigation measures will be used.
Silencers on the inlet and outlet channels Silencers will be used on the inlet and outlet channels.
Use of vibration-reducing measures and flexible joints Vibration-reducing measures will be installed and flexible joints will be used.
Noise assessment at the design stage Assessment of noise emissions will be carried out at the design stage to determine what noise reduction measures are appropriate.
Diversion and position of noisy equipment, change of audio frequency.
If needed, noisy equipment can be diverted and audio frequency changed.
19. Waste control 6, 7
Storage of bottom ash and fly ash in different places Boiler dust and flue ash will be stored in separate special sealed containers or tanks. Hazardous waste will be transported by special transport and transferred to the licensed hazardous waste management companies.
Complies
Storage in closed tanks Boiler dust and flue ashes will be stored in closed containers or tanks.
Transportation in big bags or silos
Ash will be transferred and transported to waste management companies in containers or truck tanks.
Use of biomass ash
Biomass ash will be analysed. If the quantities of chemicals in ash do not exceed the maximum allowed amount, they can be used in the agriculture or forestry sector. Ash handling will be carried out pursuant to Order No D1 -14 of the Minister of the Environment of the Republic of Lithuania of 5 January 2011 on the Approval of Rules for the Management and Use of Wood Fuel Ash.
Notes:
1 Integrated Pollution Prevention and Control (IPPC), Reference Document on the Best Available Techniques for Waste Incineration (BAT), 2005
2 BREFMON-EC IPPC,Reference Document on the General Principles of Monitoring, 2003.
3 BREF ENE –EC IPPC, Reference Document on BAT for Energy Efficiency, 2007.
4 BREF Wl – EC IPPC, Reference Document on BAT for Waste Incineration, 2005.
5 BREF EFS – EC IPPC, Reference Document on BAT on Emissions from Storage, 2005.
6 EU Reference Documents on Best Available Technology, 2005.
7 Executive Summary, Reference Document on the Best Available Techniques for Large Combustion Plants, 2005.
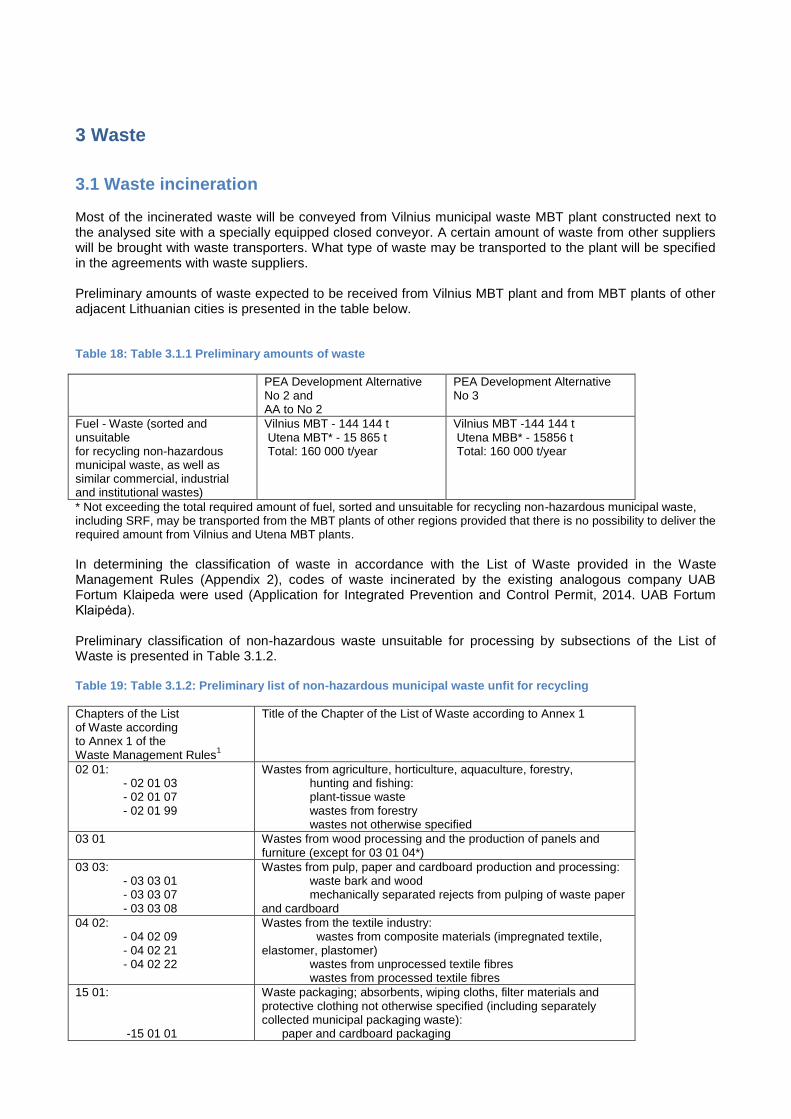
3 Waste
3.1 Waste incineration Most of the incinerated waste will be conveyed from Vilnius municipal waste MBT plant constructed next to the analysed site with a specially equipped closed conveyor. A certain amount of waste from other suppliers will be brought with waste transporters. What type of waste may be transported to the plant will be specified in the agreements with waste suppliers. Preliminary amounts of waste expected to be received from Vilnius MBT plant and from MBT plants of other adjacent Lithuanian cities is presented in the table below. Table 18: Table 3.1.1 Preliminary amounts of waste
PEA Development Alternative No 2 and AA to No 2
PEA Development Alternative No 3
Fuel - Waste (sorted and unsuitable for recycling non-hazardous municipal waste, as well as similar commercial, industrial and institutional wastes)
Vilnius MBT - 144 144 t Utena MBT* - 15 865 t Total: 160 000 t/year
Vilnius MBT -144 144 t Utena MBB* - 15856 t Total: 160 000 t/year
* Not exceeding the total required amount of fuel, sorted and unsuitable for recycling non-hazardous municipal waste, including SRF, may be transported from the MBT plants of other regions provided that there is no possibility to deliver the required amount from Vilnius and Utena MBT plants.
In determining the classification of waste in accordance with the List of Waste provided in the Waste Management Rules (Appendix 2), codes of waste incinerated by the existing analogous company UAB Fortum Klaipeda were used (Application for Integrated Prevention and Control Permit, 2014. UAB Fortum Klaipėda). Preliminary classification of non-hazardous waste unsuitable for processing by subsections of the List of Waste is presented in Table 3.1.2. Table 19: Table 3.1.2: Preliminary list of non-hazardous municipal waste unfit for recycling
Chapters of the List of Waste according to Annex 1 of the Waste Management Rules
1
Title of the Chapter of the List of Waste according to Annex 1
02 01: - 02 01 03 - 02 01 07 - 02 01 99
Wastes from agriculture, horticulture, aquaculture, forestry, hunting and fishing: plant-tissue waste wastes from forestry wastes not otherwise specified
03 01 Wastes from wood processing and the production of panels and furniture (except for 03 01 04*)
03 03: - 03 03 01 - 03 03 07 - 03 03 08
Wastes from pulp, paper and cardboard production and processing: waste bark and wood mechanically separated rejects from pulping of waste paper and cardboard
04 02: - 04 02 09 - 04 02 21 - 04 02 22
Wastes from the textile industry: wastes from composite materials (impregnated textile, elastomer, plastomer) wastes from unprocessed textile fibres wastes from processed textile fibres
15 01: -15 01 01
Waste packaging; absorbents, wiping cloths, filter materials and protective clothing not otherwise specified (including separately collected municipal packaging waste): paper and cardboard packaging
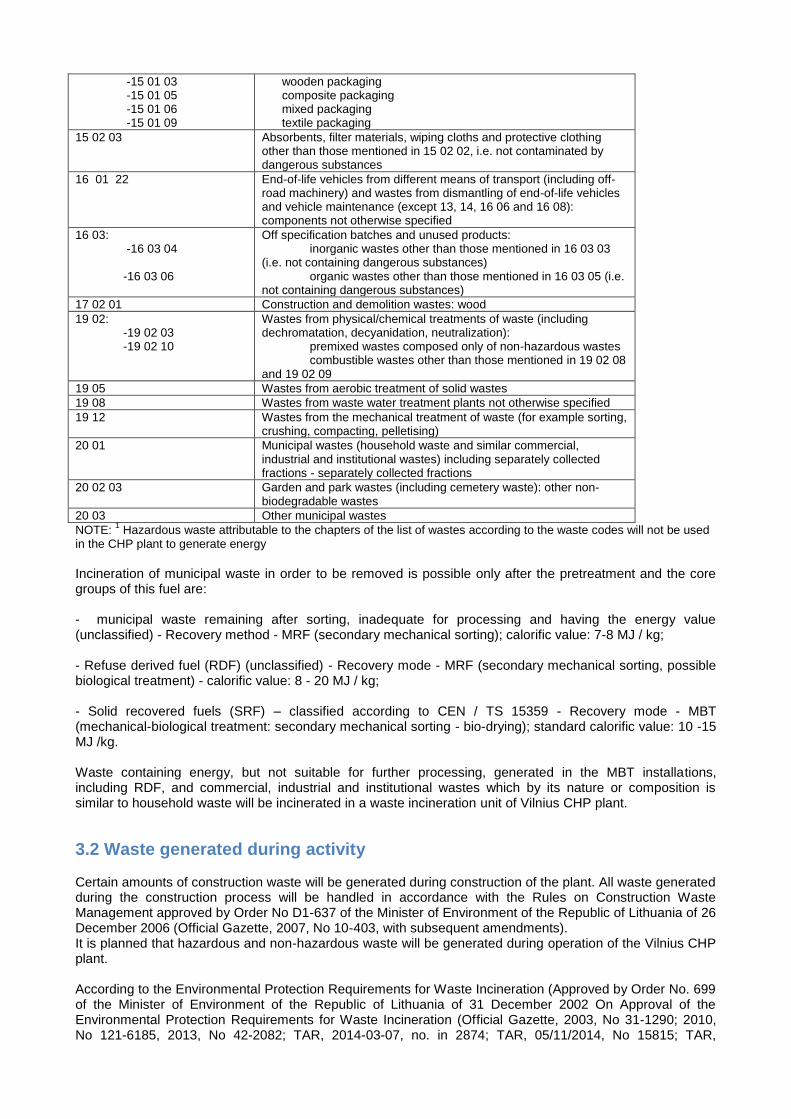
-15 01 03 -15 01 05 -15 01 06 -15 01 09
wooden packaging composite packaging mixed packaging textile packaging
15 02 03 Absorbents, filter materials, wiping cloths and protective clothing other than those mentioned in 15 02 02, i.e. not contaminated by dangerous substances
16 01 22 End-of-life vehicles from different means of transport (including off-road machinery) and wastes from dismantling of end-of-life vehicles and vehicle maintenance (except 13, 14, 16 06 and 16 08): components not otherwise specified
16 03: -16 03 04 -16 03 06
Off specification batches and unused products: inorganic wastes other than those mentioned in 16 03 03 (i.e. not containing dangerous substances) organic wastes other than those mentioned in 16 03 05 (i.e. not containing dangerous substances)
17 02 01 Construction and demolition wastes: wood
19 02: -19 02 03 -19 02 10
Wastes from physical/chemical treatments of waste (including dechromatation, decyanidation, neutralization): premixed wastes composed only of non-hazardous wastes combustible wastes other than those mentioned in 19 02 08 and 19 02 09
19 05 Wastes from aerobic treatment of solid wastes
19 08 Wastes from waste water treatment plants not otherwise specified
19 12 Wastes from the mechanical treatment of waste (for example sorting, crushing, compacting, pelletising)
20 01 Municipal wastes (household waste and similar commercial, industrial and institutional wastes) including separately collected fractions - separately collected fractions
20 02 03 Garden and park wastes (including cemetery waste): other non-biodegradable wastes
20 03 Other municipal wastes
NOTE: 1 Hazardous waste attributable to the chapters of the list of wastes according to the waste codes will not be used
in the CHP plant to generate energy
Incineration of municipal waste in order to be removed is possible only after the pretreatment and the core groups of this fuel are: - municipal waste remaining after sorting, inadequate for processing and having the energy value (unclassified) - Recovery method - MRF (secondary mechanical sorting); calorific value: 7-8 MJ / kg; - Refuse derived fuel (RDF) (unclassified) - Recovery mode - MRF (secondary mechanical sorting, possible biological treatment) - calorific value: 8 - 20 MJ / kg; - Solid recovered fuels (SRF) – classified according to CEN / TS 15359 - Recovery mode - MBT (mechanical-biological treatment: secondary mechanical sorting - bio-drying); standard calorific value: 10 -15 MJ /kg. Waste containing energy, but not suitable for further processing, generated in the MBT installations, including RDF, and commercial, industrial and institutional wastes which by its nature or composition is similar to household waste will be incinerated in a waste incineration unit of Vilnius CHP plant.
3.2 Waste generated during activity Certain amounts of construction waste will be generated during construction of the plant. All waste generated during the construction process will be handled in accordance with the Rules on Construction Waste Management approved by Order No D1-637 of the Minister of Environment of the Republic of Lithuania of 26 December 2006 (Official Gazette, 2007, No 10-403, with subsequent amendments). It is planned that hazardous and non-hazardous waste will be generated during operation of the Vilnius CHP plant. According to the Environmental Protection Requirements for Waste Incineration (Approved by Order No. 699 of the Minister of Environment of the Republic of Lithuania of 31 December 2002 On Approval of the Environmental Protection Requirements for Waste Incineration (Official Gazette, 2003, No 31-1290; 2010, No 121-6185, 2013, No 42-2082; TAR, 2014-03-07, no. in 2874; TAR, 05/11/2014, No 15815; TAR,
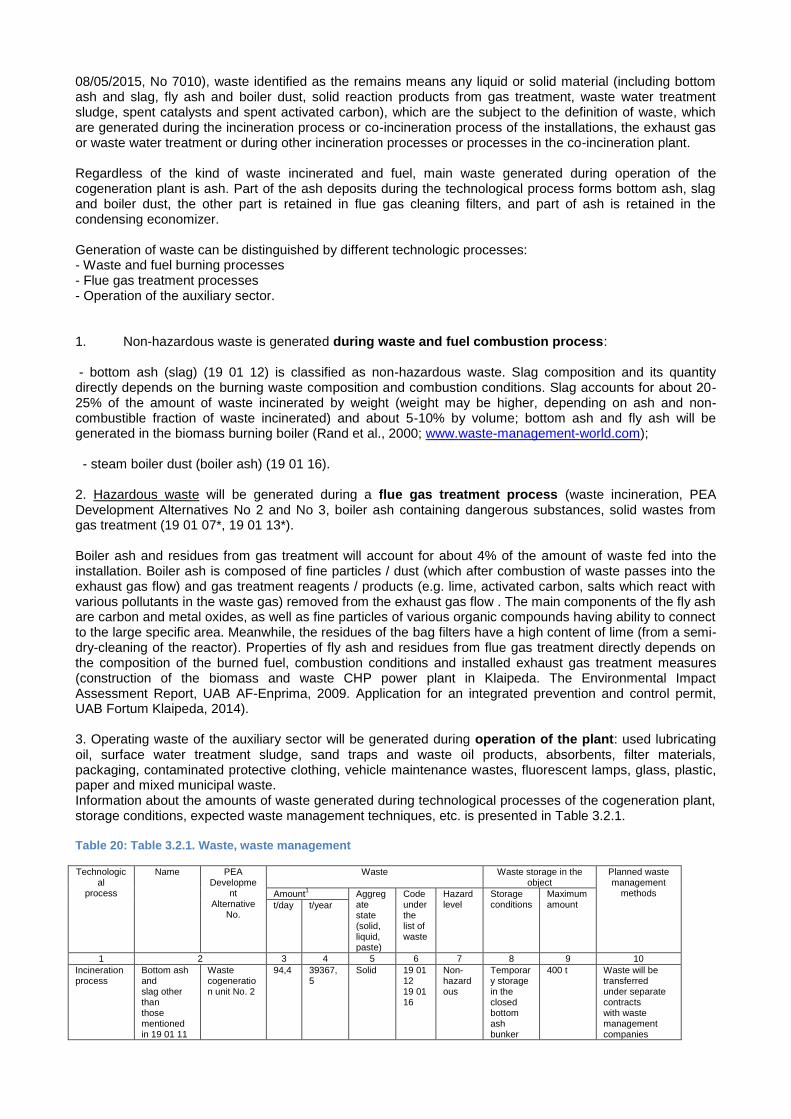
08/05/2015, No 7010), waste identified as the remains means any liquid or solid material (including bottom ash and slag, fly ash and boiler dust, solid reaction products from gas treatment, waste water treatment sludge, spent catalysts and spent activated carbon), which are the subject to the definition of waste, which are generated during the incineration process or co-incineration process of the installations, the exhaust gas or waste water treatment or during other incineration processes or processes in the co-incineration plant. Regardless of the kind of waste incinerated and fuel, main waste generated during operation of the cogeneration plant is ash. Part of the ash deposits during the technological process forms bottom ash, slag and boiler dust, the other part is retained in flue gas cleaning filters, and part of ash is retained in the condensing economizer. Generation of waste can be distinguished by different technologic processes: - Waste and fuel burning processes - Flue gas treatment processes - Operation of the auxiliary sector. 1. Non-hazardous waste is generated during waste and fuel combustion process: - bottom ash (slag) (19 01 12) is classified as non-hazardous waste. Slag composition and its quantity directly depends on the burning waste composition and combustion conditions. Slag accounts for about 20-25% of the amount of waste incinerated by weight (weight may be higher, depending on ash and non-combustible fraction of waste incinerated) and about 5-10% by volume; bottom ash and fly ash will be generated in the biomass burning boiler (Rand et al., 2000; www.waste-management-world.com); - steam boiler dust (boiler ash) (19 01 16). 2. Hazardous waste will be generated during a flue gas treatment process (waste incineration, PEA Development Alternatives No 2 and No 3, boiler ash containing dangerous substances, solid wastes from gas treatment (19 01 07*, 19 01 13*). Boiler ash and residues from gas treatment will account for about 4% of the amount of waste fed into the installation. Boiler ash is composed of fine particles / dust (which after combustion of waste passes into the exhaust gas flow) and gas treatment reagents / products (e.g. lime, activated carbon, salts which react with various pollutants in the waste gas) removed from the exhaust gas flow . The main components of the fly ash are carbon and metal oxides, as well as fine particles of various organic compounds having ability to connect to the large specific area. Meanwhile, the residues of the bag filters have a high content of lime (from a semi-dry-cleaning of the reactor). Properties of fly ash and residues from flue gas treatment directly depends on the composition of the burned fuel, combustion conditions and installed exhaust gas treatment measures (construction of the biomass and waste CHP power plant in Klaipeda. The Environmental Impact Assessment Report, UAB AF-Enprima, 2009. Application for an integrated prevention and control permit, UAB Fortum Klaipeda, 2014). 3. Operating waste of the auxiliary sector will be generated during operation of the plant: used lubricating oil, surface water treatment sludge, sand traps and waste oil products, absorbents, filter materials, packaging, contaminated protective clothing, vehicle maintenance wastes, fluorescent lamps, glass, plastic, paper and mixed municipal waste. Information about the amounts of waste generated during technological processes of the cogeneration plant, storage conditions, expected waste management techniques, etc. is presented in Table 3.2.1. Table 20: Table 3.2.1. Waste, waste management
Technological
process
Name PEA Developme
nt Alternative
No.
Waste Waste storage in the object
Planned waste management
methods Amount1 Aggreg
ate state (solid, liquid, paste)
Code under the list of waste
Hazard level
Storage conditions
Maximum amount t/day t/year
1 2 3 4 5 6 7 8 9 10
Incineration process
Bottom ash and slag other than those mentioned in 19 01 11
Waste cogeneration unit No. 2
94,4 39367,5
Solid 19 01 12 19 01 16
Non-hazardous
Temporary storage in the closed bottom ash bunker
400 t Waste will be transferred under separate contracts with waste management companies
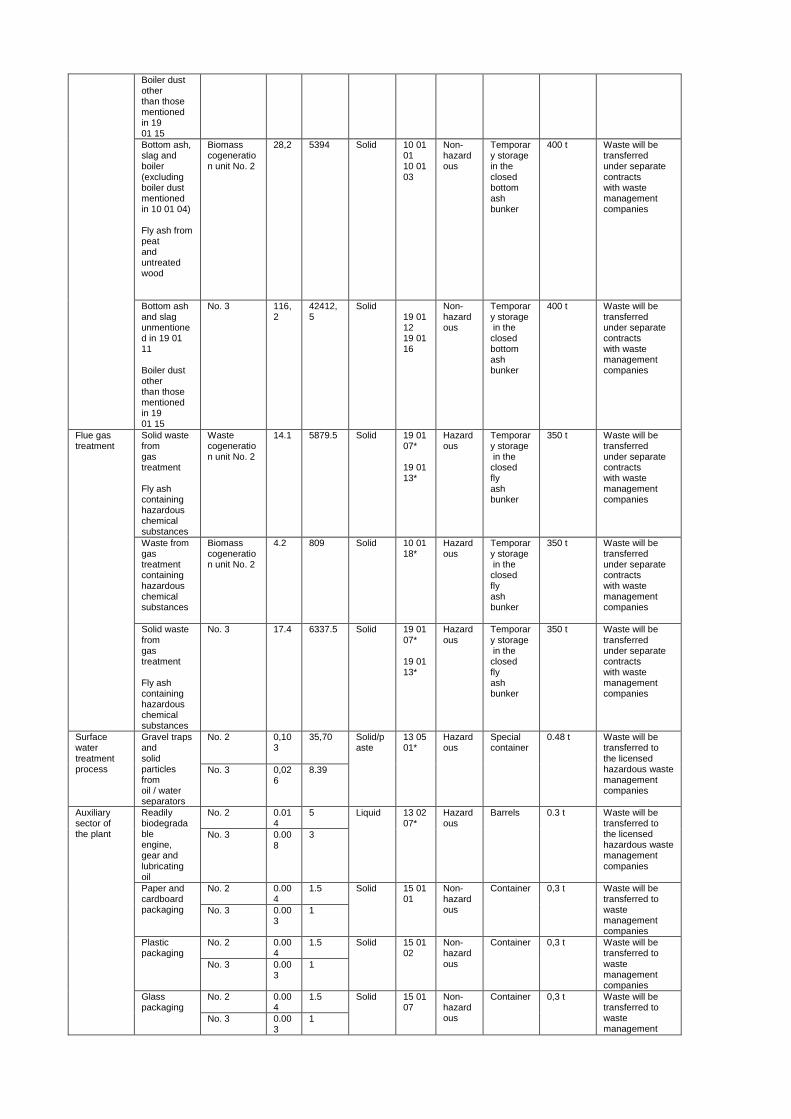
Boiler dust other than those mentioned in 19 01 15
Bottom ash, slag and boiler (excluding boiler dust mentioned in 10 01 04) Fly ash from peat and untreated wood
Biomass cogeneration unit No. 2
28,2 5394 Solid 10 01 01 10 01 03
Non-hazardous
Temporary storage in the closed bottom ash bunker
400 t Waste will be transferred under separate contracts with waste management companies
Bottom ash and slag unmentioned in 19 01 11 Boiler dust other than those mentioned in 19 01 15
No. 3 116,2
42412,5
Solid 19 01 12 19 01 16
Non-hazardous
Temporary storage in the closed bottom ash bunker
400 t Waste will be transferred under separate contracts with waste management companies
Flue gas treatment
Solid waste from gas treatment Fly ash containing hazardous chemical substances
Waste cogeneration unit No. 2
14.1 5879.5 Solid 19 01 07* 19 01 13*
Hazardous
Temporary storage in the closed fly ash bunker
350 t Waste will be transferred under separate contracts with waste management companies
Waste from gas treatment containing hazardous chemical substances
Biomass cogeneration unit No. 2
4.2 809 Solid 10 01 18*
Hazardous
Temporary storage in the closed fly ash bunker
350 t Waste will be transferred under separate contracts with waste management companies
Solid waste from gas treatment Fly ash containing hazardous chemical substances
No. 3 17.4 6337.5 Solid 19 01 07* 19 01 13*
Hazardous
Temporary storage in the closed fly ash bunker
350 t Waste will be transferred under separate contracts with waste management companies
Surface water treatment process
Gravel traps and solid particles from oil / water separators
No. 2 0,103
35,70 Solid/paste
13 05 01*
Hazardous
Special container
0.48 t Waste will be transferred to the licensed hazardous waste management companies
No. 3 0,026
8.39
Auxiliary sector of the plant
Readily biodegradable engine, gear and lubricating oil
No. 2 0.014
5 Liquid 13 02 07*
Hazardous
Barrels 0.3 t Waste will be transferred to the licensed hazardous waste management companies
No. 3 0.008
3
Paper and cardboard packaging
No. 2 0.004
1.5 Solid 15 01 01
Non-hazardous
Container 0,3 t Waste will be transferred to waste management companies
No. 3 0.003
1
Plastic packaging
No. 2 0.004
1.5 Solid 15 01 02
Non-hazardous
Container 0,3 t Waste will be transferred to waste management companies
No. 3 0.003
1
Glass packaging
No. 2 0.004
1.5 Solid 15 01 07
Non-hazardous
Container 0,3 t Waste will be transferred to waste management
No. 3 0.003
1
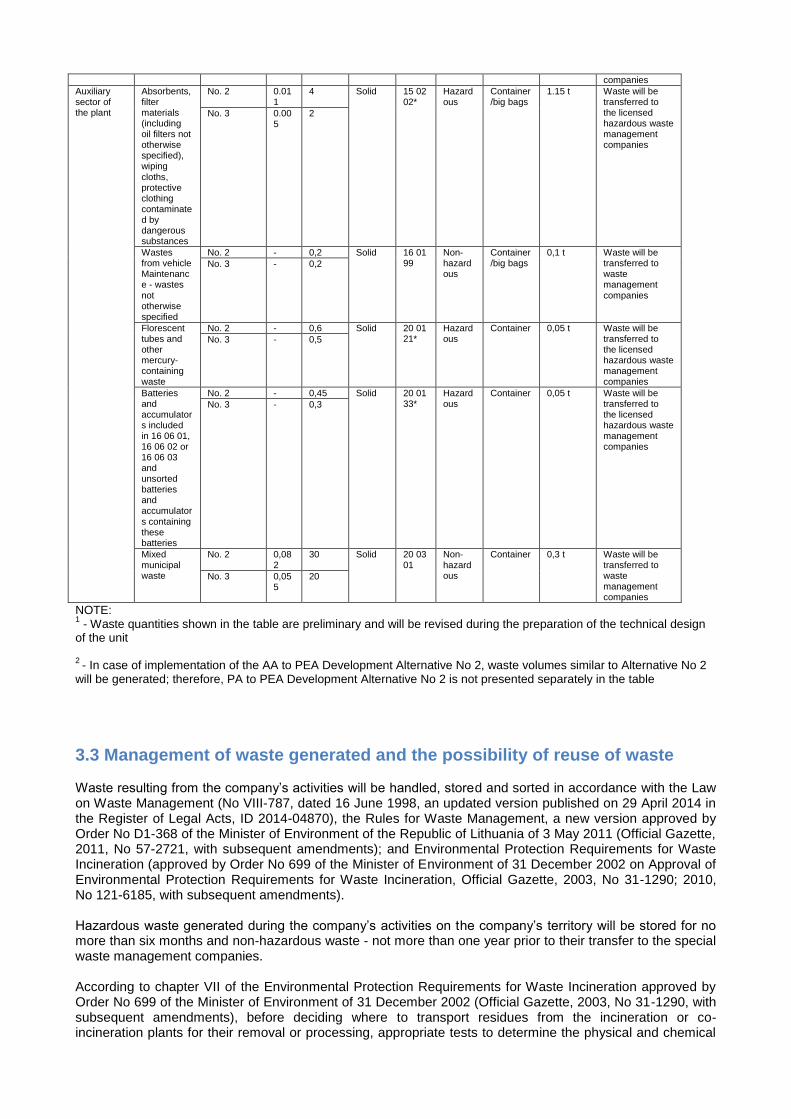
companies
Auxiliary sector of the plant
Absorbents, filter materials (including oil filters not otherwise specified), wiping cloths, protective clothing contaminated by dangerous substances
No. 2 0.011
4 Solid 15 02 02*
Hazardous
Container/big bags
1.15 t Waste will be transferred to the licensed hazardous waste management companies
No. 3 0.005
2
Wastes from vehicle Maintenance - wastes not otherwise specified
No. 2 - 0,2 Solid 16 01 99
Non-hazardous
Container/big bags
0,1 t Waste will be transferred to waste management companies
No. 3 - 0,2
Florescent tubes and other mercury-containing waste
No. 2 - 0,6 Solid 20 01 21*
Hazardous
Container 0,05 t Waste will be transferred to the licensed hazardous waste management companies
No. 3 - 0,5
Batteries and accumulators included in 16 06 01, 16 06 02 or 16 06 03 and unsorted batteries and accumulators containing these batteries
No. 2 - 0,45 Solid 20 01 33*
Hazardous
Container 0,05 t Waste will be transferred to the licensed hazardous waste management companies
No. 3 - 0,3
Mixed municipal waste
No. 2 0,082
30 Solid 20 03 01
Non-hazardous
Container 0,3 t Waste will be transferred to waste management companies
No. 3 0,055
20
NOTE: 1 - Waste quantities shown in the table are preliminary and will be revised during the preparation of the technical design
of the unit 2
- In case of implementation of the AA to PEA Development Alternative No 2, waste volumes similar to Alternative No 2 will be generated; therefore, PA to PEA Development Alternative No 2 is not presented separately in the table
3.3 Management of waste generated and the possibility of reuse of waste Waste resulting from the company’s activities will be handled, stored and sorted in accordance with the Law on Waste Management (No VIII-787, dated 16 June 1998, an updated version published on 29 April 2014 in the Register of Legal Acts, ID 2014-04870), the Rules for Waste Management, a new version approved by Order No D1-368 of the Minister of Environment of the Republic of Lithuania of 3 May 2011 (Official Gazette, 2011, No 57-2721, with subsequent amendments); and Environmental Protection Requirements for Waste Incineration (approved by Order No 699 of the Minister of Environment of 31 December 2002 on Approval of Environmental Protection Requirements for Waste Incineration, Official Gazette, 2003, No 31-1290; 2010, No 121-6185, with subsequent amendments). Hazardous waste generated during the company’s activities on the company’s territory will be stored for no more than six months and non-hazardous waste - not more than one year prior to their transfer to the special waste management companies. According to chapter VII of the Environmental Protection Requirements for Waste Incineration approved by Order No 699 of the Minister of Environment of 31 December 2002 (Official Gazette, 2003, No 31-1290, with subsequent amendments), before deciding where to transport residues from the incineration or co-incineration plants for their removal or processing, appropriate tests to determine the physical and chemical
properties of the different incineration residues and pollution potential must be carried out. Total soluble fraction of residues and soluble fraction of heavy metals must be analyzed. Residues recycling is recommended, if practicable. Bottom ash (sag) generated during a combustion process will be temporarily stored in a closed bottom ash warehousing building and bunkers before transfer to the waste management companies. In case of PEA Development Alternative No 2, bottom ash (slag) generated in the waste-fired CHP unit and biomass-fired CHP unit will be stored in separate buildings/areas. Bottom ash will be loaded onto the trucks in the bottom ash loading buildings/areas. Slag will not be additionally treated upon transfer to the waste management companies. Reuse of ash is regulated by the Rules of Management and Use of Wood Ash (hereinafter - the Rules) approved by Order No D1-14 of the Minister of Environment of the Republic of Lithuania of 5 January 2011 (Official Gazette, 2011, No 5-168, with subsequent amendments). These Rules establish the procedure for the use of wood ash for soil fertilization in agriculture, including the cultivation of energy plantations, forestry, mixing with sewage sludge, and for the rehabilitation of affected areas (quarries, escaping peatlands, closed landfill, roadbed, etc.), and Civil engineering. One of the possibilities for use of biomass ash is to transfer biomass raw ash for composting to specialized companies engaged in this activity. In case of PEA Development Alternative No 2, bottom ash (slag) generated in the waste-fired CHP unit and biomass-fired CHP unit, before its transportation from the territory of the land planned to be used by the plant, will be stored in separate ash bunkers. Boiler ash (boiler dust) will be temporarily stored in special containers separately from other waste. Boiler ash will be unloaded from the container into a special transport over the unloading spout, which will be controlled with a control panel. Boiler ash will be unloaded into a special motor transport and exported to the landfill. Fly ash and solid wastes from flue gas treatment process will pass into a separate closed final product bunker. Hazardous waste will be temporarily stored before transfer to the licensed hazardous waste management companies. These hazardous wastes will be unloaded into a special transport / or be packaged so that do not pose a risk to public health and the environment. Hazardous waste will be transported in accordance with the requirements for the transport of hazardous waste set in Waste Management Rules (amended by Order No D1-368 of the Minister of Environment of 3 May 2011 (Official Gazette, 2011, No 57-2721). Waste resulting from the economic activities of the company will be transferred to the waste collection and management companies under concluded agreements.
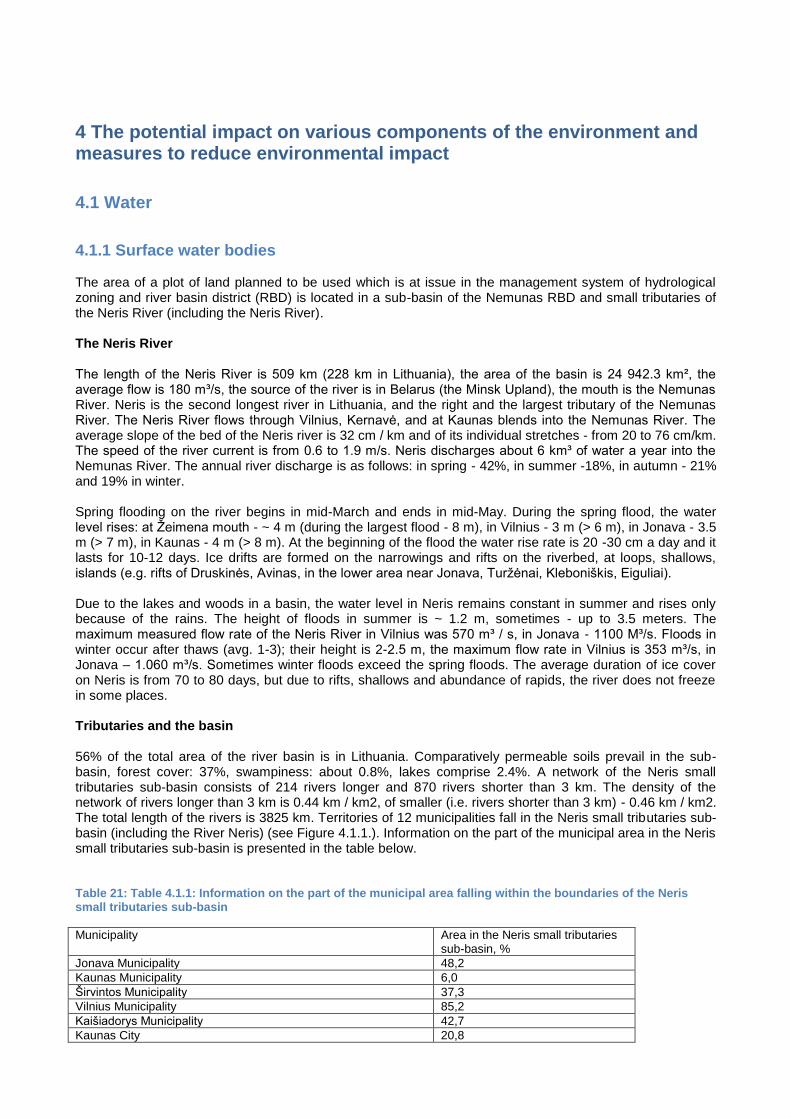
4 The potential impact on various components of the environment and measures to reduce environmental impact
4.1 Water
4.1.1 Surface water bodies The area of a plot of land planned to be used which is at issue in the management system of hydrological zoning and river basin district (RBD) is located in a sub-basin of the Nemunas RBD and small tributaries of the Neris River (including the Neris River). The Neris River The length of the Neris River is 509 km (228 km in Lithuania), the area of the basin is 24 942.3 km², the average flow is 180 m³/s, the source of the river is in Belarus (the Minsk Upland), the mouth is the Nemunas River. Neris is the second longest river in Lithuania, and the right and the largest tributary of the Nemunas River. The Neris River flows through Vilnius, Kernavė, and at Kaunas blends into the Nemunas River. The average slope of the bed of the Neris river is 32 cm / km and of its individual stretches - from 20 to 76 cm/km. The speed of the river current is from 0.6 to 1.9 m/s. Neris discharges about 6 km³ of water a year into the Nemunas River. The annual river discharge is as follows: in spring - 42%, in summer -18%, in autumn - 21% and 19% in winter. Spring flooding on the river begins in mid-March and ends in mid-May. During the spring flood, the water level rises: at Žeimena mouth - ~ 4 m (during the largest flood - 8 m), in Vilnius - 3 m (> 6 m), in Jonava - 3.5 m (> 7 m), in Kaunas - 4 m (> 8 m). At the beginning of the flood the water rise rate is 20 -30 cm a day and it lasts for 10-12 days. Ice drifts are formed on the narrowings and rifts on the riverbed, at loops, shallows, islands (e.g. rifts of Druskinės, Avinas, in the lower area near Jonava, Turžėnai, Kleboniškis, Eiguliai). Due to the lakes and woods in a basin, the water level in Neris remains constant in summer and rises only because of the rains. The height of floods in summer is ~ 1.2 m, sometimes - up to 3.5 meters. The maximum measured flow rate of the Neris River in Vilnius was 570 m³ / s, in Jonava - 1100 M³/s. Floods in winter occur after thaws (avg. 1-3); their height is 2-2.5 m, the maximum flow rate in Vilnius is 353 m³/s, in Jonava – 1.060 m³/s. Sometimes winter floods exceed the spring floods. The average duration of ice cover on Neris is from 70 to 80 days, but due to rifts, shallows and abundance of rapids, the river does not freeze in some places. Tributaries and the basin 56% of the total area of the river basin is in Lithuania. Comparatively permeable soils prevail in the sub-basin, forest cover: 37%, swampiness: about 0.8%, lakes comprise 2.4%. A network of the Neris small tributaries sub-basin consists of 214 rivers longer and 870 rivers shorter than 3 km. The density of the network of rivers longer than 3 km is 0.44 km / km2, of smaller (i.e. rivers shorter than 3 km) - 0.46 km / km2. The total length of the rivers is 3825 km. Territories of 12 municipalities fall in the Neris small tributaries sub-basin (including the River Neris) (see Figure 4.1.1.). Information on the part of the municipal area in the Neris small tributaries sub-basin is presented in the table below. Table 21: Table 4.1.1: Information on the part of the municipal area falling within the boundaries of the Neris small tributaries sub-basin
Municipality Area in the Neris small tributaries sub-basin, %
Jonava Municipality 48,2
Kaunas Municipality 6,0
Širvintos Municipality 37,3
Vilnius Municipality 85,2
Kaišiadorys Municipality 42,7
Kaunas City 20,8
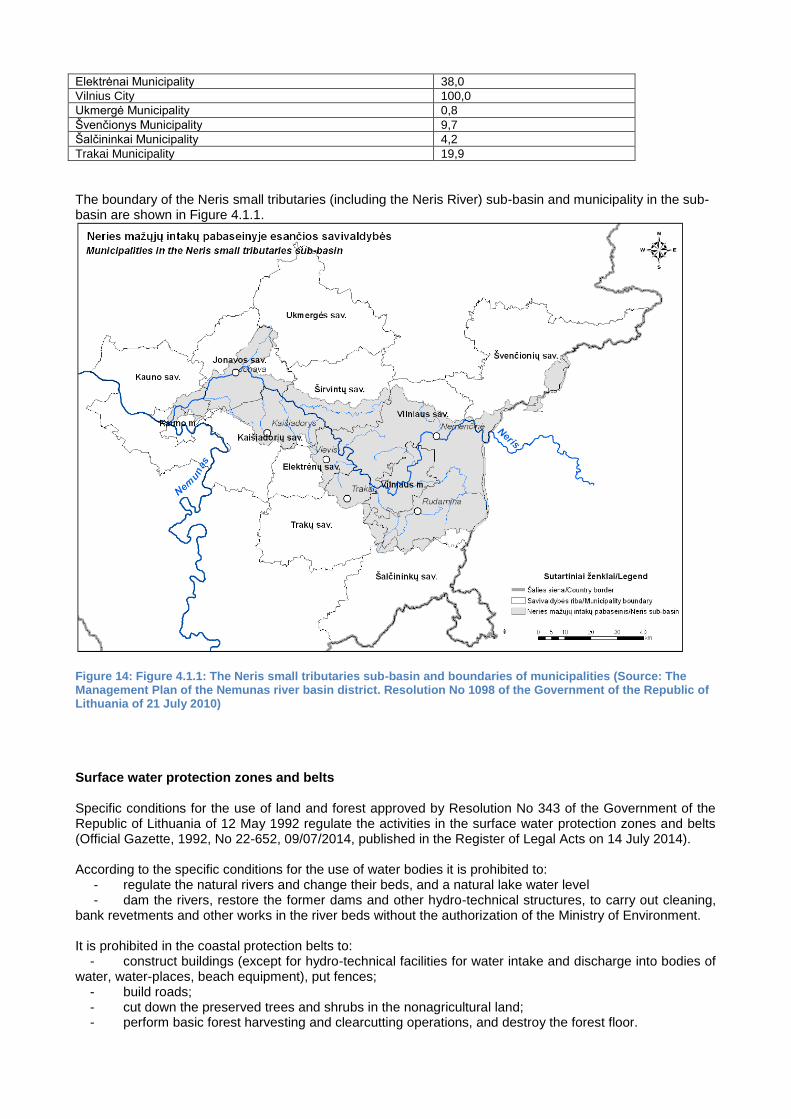
Elektrėnai Municipality 38,0
Vilnius City 100,0
Ukmergė Municipality 0,8
Švenčionys Municipality 9,7
Šalčininkai Municipality 4,2
Trakai Municipality 19,9
The boundary of the Neris small tributaries (including the Neris River) sub-basin and municipality in the sub-basin are shown in Figure 4.1.1.
Figure 14: Figure 4.1.1: The Neris small tributaries sub-basin and boundaries of municipalities (Source: The Management Plan of the Nemunas river basin district. Resolution No 1098 of the Government of the Republic of Lithuania of 21 July 2010)
Surface water protection zones and belts Specific conditions for the use of land and forest approved by Resolution No 343 of the Government of the Republic of Lithuania of 12 May 1992 regulate the activities in the surface water protection zones and belts (Official Gazette, 1992, No 22-652, 09/07/2014, published in the Register of Legal Acts on 14 July 2014). According to the specific conditions for the use of water bodies it is prohibited to: - regulate the natural rivers and change their beds, and a natural lake water level - dam the rivers, restore the former dams and other hydro-technical structures, to carry out cleaning, bank revetments and other works in the river beds without the authorization of the Ministry of Environment. It is prohibited in the coastal protection belts to: - construct buildings (except for hydro-technical facilities for water intake and discharge into bodies of water, water-places, beach equipment), put fences; - build roads; - cut down the preserved trees and shrubs in the nonagricultural land; - perform basic forest harvesting and clearcutting operations, and destroy the forest floor.
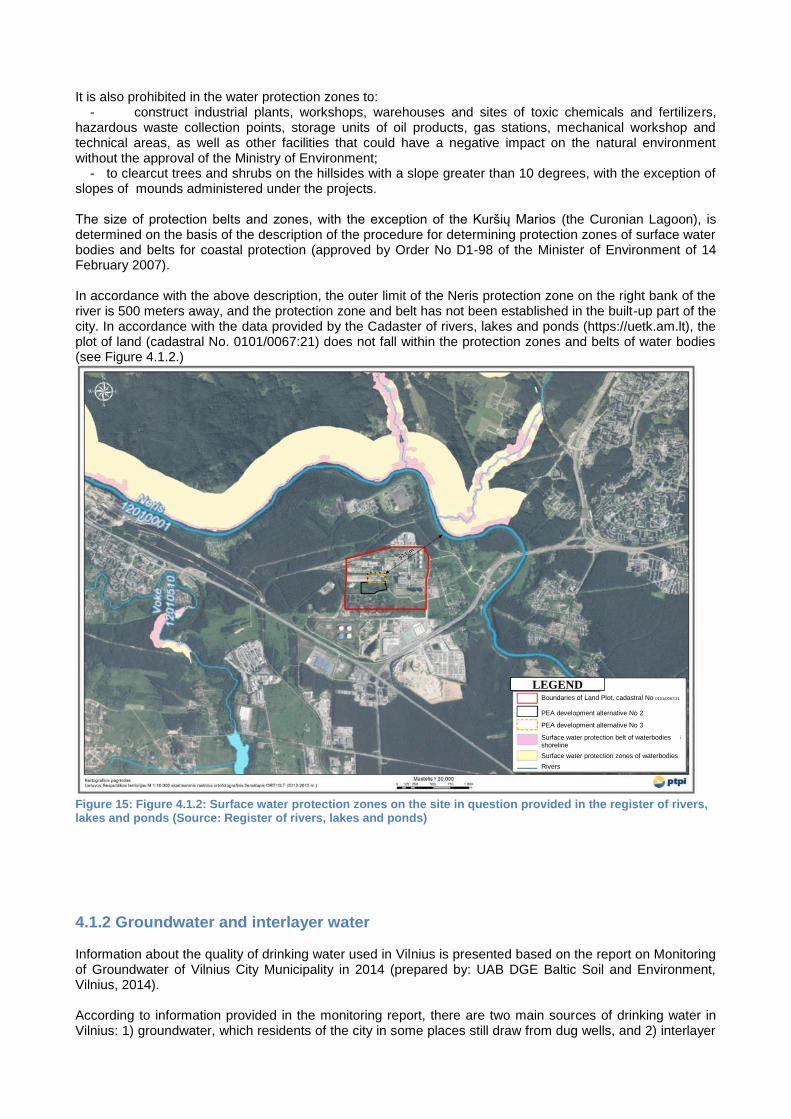
It is also prohibited in the water protection zones to: - construct industrial plants, workshops, warehouses and sites of toxic chemicals and fertilizers, hazardous waste collection points, storage units of oil products, gas stations, mechanical workshop and technical areas, as well as other facilities that could have a negative impact on the natural environment without the approval of the Ministry of Environment; - to clearcut trees and shrubs on the hillsides with a slope greater than 10 degrees, with the exception of slopes of mounds administered under the projects. The size of protection belts and zones, with the exception of the Kuršių Marios (the Curonian Lagoon), is determined on the basis of the description of the procedure for determining protection zones of surface water bodies and belts for coastal protection (approved by Order No D1-98 of the Minister of Environment of 14 February 2007). In accordance with the above description, the outer limit of the Neris protection zone on the right bank of the river is 500 meters away, and the protection zone and belt has not been established in the built-up part of the city. In accordance with the data provided by the Cadaster of rivers, lakes and ponds (https://uetk.am.lt), the plot of land (cadastral No. 0101/0067:21) does not fall within the protection zones and belts of water bodies (see Figure 4.1.2.)
Figure 15: Figure 4.1.2: Surface water protection zones on the site in question provided in the register of rivers, lakes and ponds (Source: Register of rivers, lakes and ponds)
4.1.2 Groundwater and interlayer water Information about the quality of drinking water used in Vilnius is presented based on the report on Monitoring of Groundwater of Vilnius City Municipality in 2014 (prepared by: UAB DGE Baltic Soil and Environment, Vilnius, 2014). According to information provided in the monitoring report, there are two main sources of drinking water in Vilnius: 1) groundwater, which residents of the city in some places still draw from dug wells, and 2) interlayer
Boundaries of Land Plot, cadastral No 0101/0067:21
PEA development alternative No 2
PEA development alternative No 3
Surface water protection belt of waterbodies shoreline
Surface water protection zones of waterbodies
Rivers
LEGEND
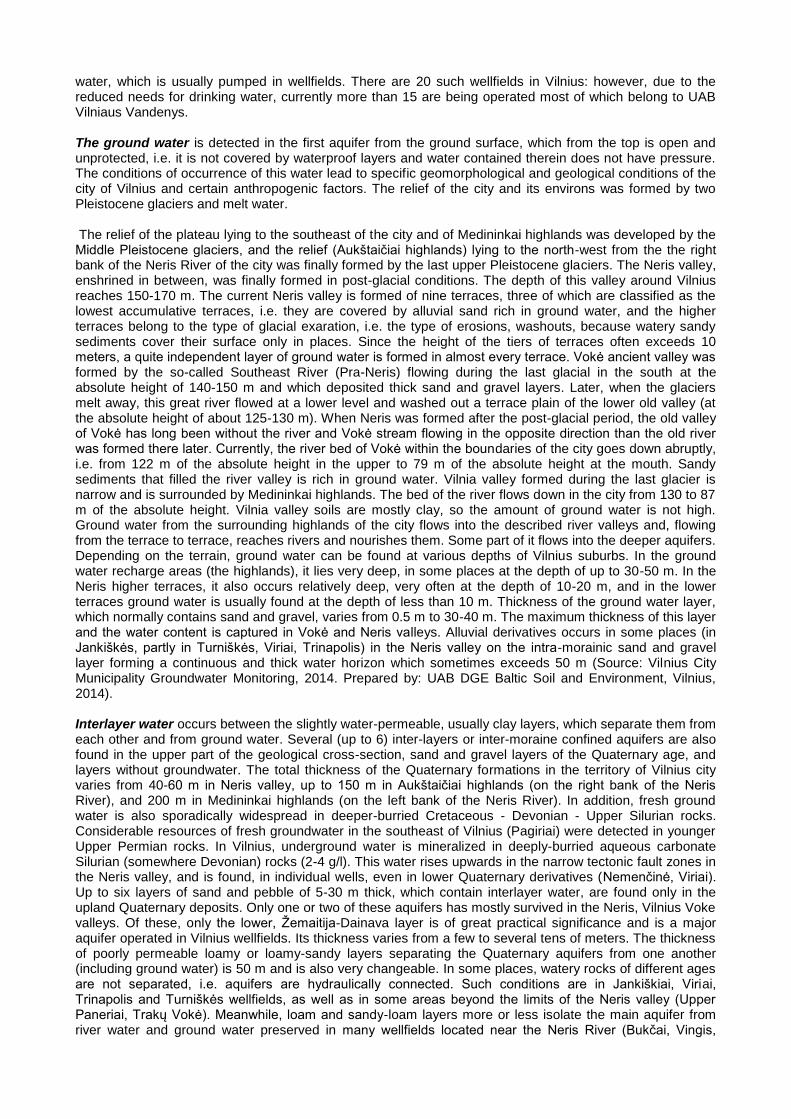
water, which is usually pumped in wellfields. There are 20 such wellfields in Vilnius: however, due to the reduced needs for drinking water, currently more than 15 are being operated most of which belong to UAB Vilniaus Vandenys. The ground water is detected in the first aquifer from the ground surface, which from the top is open and unprotected, i.e. it is not covered by waterproof layers and water contained therein does not have pressure. The conditions of occurrence of this water lead to specific geomorphological and geological conditions of the city of Vilnius and certain anthropogenic factors. The relief of the city and its environs was formed by two Pleistocene glaciers and melt water. The relief of the plateau lying to the southeast of the city and of Medininkai highlands was developed by the Middle Pleistocene glaciers, and the relief (Aukštaičiai highlands) lying to the north-west from the the right bank of the Neris River of the city was finally formed by the last upper Pleistocene glaciers. The Neris valley, enshrined in between, was finally formed in post-glacial conditions. The depth of this valley around Vilnius reaches 150-170 m. The current Neris valley is formed of nine terraces, three of which are classified as the lowest accumulative terraces, i.e. they are covered by alluvial sand rich in ground water, and the higher terraces belong to the type of glacial exaration, i.e. the type of erosions, washouts, because watery sandy sediments cover their surface only in places. Since the height of the tiers of terraces often exceeds 10 meters, a quite independent layer of ground water is formed in almost every terrace. Vokė ancient valley was formed by the so-called Southeast River (Pra-Neris) flowing during the last glacial in the south at the absolute height of 140-150 m and which deposited thick sand and gravel layers. Later, when the glaciers melt away, this great river flowed at a lower level and washed out a terrace plain of the lower old valley (at the absolute height of about 125-130 m). When Neris was formed after the post-glacial period, the old valley of Vokė has long been without the river and Vokė stream flowing in the opposite direction than the old river was formed there later. Currently, the river bed of Vokė within the boundaries of the city goes down abruptly, i.e. from 122 m of the absolute height in the upper to 79 m of the absolute height at the mouth. Sandy sediments that filled the river valley is rich in ground water. Vilnia valley formed during the last glacier is narrow and is surrounded by Medininkai highlands. The bed of the river flows down in the city from 130 to 87 m of the absolute height. Vilnia valley soils are mostly clay, so the amount of ground water is not high. Ground water from the surrounding highlands of the city flows into the described river valleys and, flowing from the terrace to terrace, reaches rivers and nourishes them. Some part of it flows into the deeper aquifers. Depending on the terrain, ground water can be found at various depths of Vilnius suburbs. In the ground water recharge areas (the highlands), it lies very deep, in some places at the depth of up to 30-50 m. In the Neris higher terraces, it also occurs relatively deep, very often at the depth of 10-20 m, and in the lower terraces ground water is usually found at the depth of less than 10 m. Thickness of the ground water layer, which normally contains sand and gravel, varies from 0.5 m to 30-40 m. The maximum thickness of this layer and the water content is captured in Vokė and Neris valleys. Alluvial derivatives occurs in some places (in Jankiškės, partly in Turniškės, Viriai, Trinapolis) in the Neris valley on the intra-morainic sand and gravel layer forming a continuous and thick water horizon which sometimes exceeds 50 m (Source: Vilnius City Municipality Groundwater Monitoring, 2014. Prepared by: UAB DGE Baltic Soil and Environment, Vilnius, 2014). Interlayer water occurs between the slightly water-permeable, usually clay layers, which separate them from each other and from ground water. Several (up to 6) inter-layers or inter-moraine confined aquifers are also found in the upper part of the geological cross-section, sand and gravel layers of the Quaternary age, and layers without groundwater. The total thickness of the Quaternary formations in the territory of Vilnius city varies from 40-60 m in Neris valley, up to 150 m in Aukštaičiai highlands (on the right bank of the Neris River), and 200 m in Medininkai highlands (on the left bank of the Neris River). In addition, fresh ground water is also sporadically widespread in deeper-burried Cretaceous - Devonian - Upper Silurian rocks. Considerable resources of fresh groundwater in the southeast of Vilnius (Pagiriai) were detected in younger Upper Permian rocks. In Vilnius, underground water is mineralized in deeply-burried aqueous carbonate Silurian (somewhere Devonian) rocks (2-4 g/l). This water rises upwards in the narrow tectonic fault zones in the Neris valley, and is found, in individual wells, even in lower Quaternary derivatives (Nemenčinė, Viriai). Up to six layers of sand and pebble of 5-30 m thick, which contain interlayer water, are found only in the upland Quaternary deposits. Only one or two of these aquifers has mostly survived in the Neris, Vilnius Voke valleys. Of these, only the lower, Žemaitija-Dainava layer is of great practical significance and is a major aquifer operated in Vilnius wellfields. Its thickness varies from a few to several tens of meters. The thickness of poorly permeable loamy or loamy-sandy layers separating the Quaternary aquifers from one another (including ground water) is 50 m and is also very changeable. In some places, watery rocks of different ages are not separated, i.e. aquifers are hydraulically connected. Such conditions are in Jankiškiai, Viriai, Trinapolis and Turniškės wellfields, as well as in some areas beyond the limits of the Neris valley (Upper Paneriai, Trakų Vokė). Meanwhile, loam and sandy-loam layers more or less isolate the main aquifer from river water and ground water preserved in many wellfields located near the Neris River (Bukčai, Vingis,
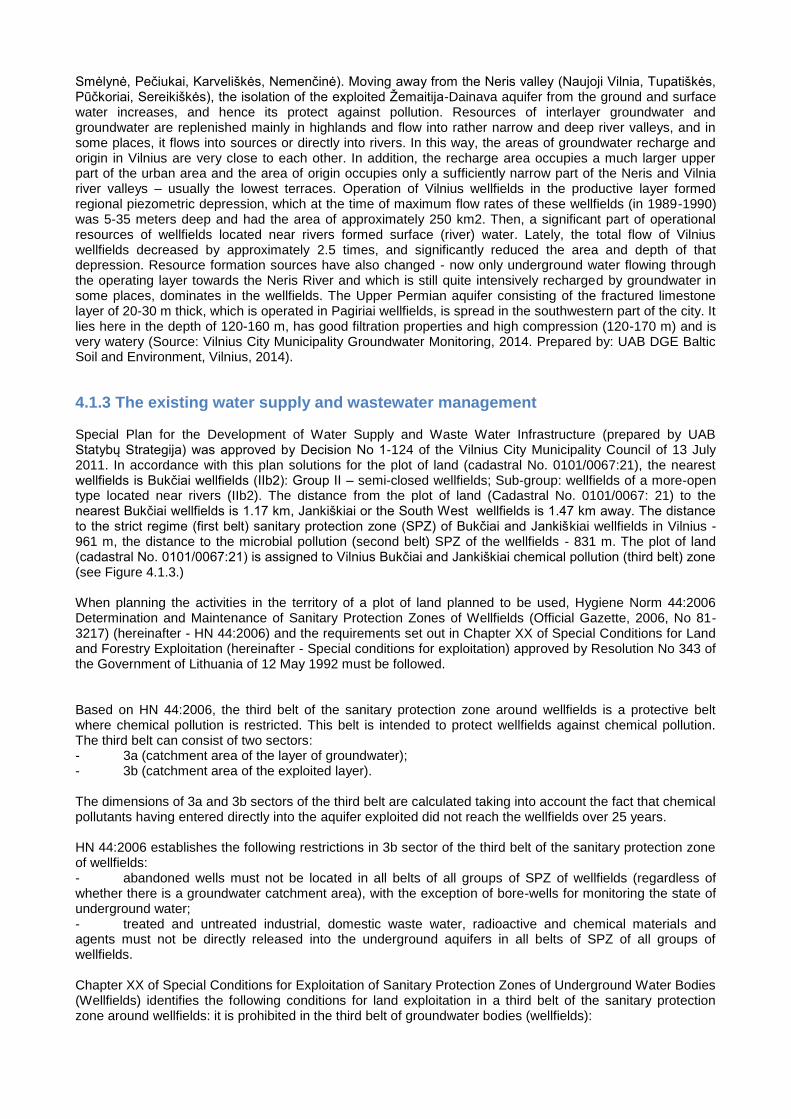
Smėlynė, Pečiukai, Karveliškės, Nemenčinė). Moving away from the Neris valley (Naujoji Vilnia, Tupatiškės, Pūčkoriai, Sereikiškės), the isolation of the exploited Žemaitija-Dainava aquifer from the ground and surface water increases, and hence its protect against pollution. Resources of interlayer groundwater and groundwater are replenished mainly in highlands and flow into rather narrow and deep river valleys, and in some places, it flows into sources or directly into rivers. In this way, the areas of groundwater recharge and origin in Vilnius are very close to each other. In addition, the recharge area occupies a much larger upper part of the urban area and the area of origin occupies only a sufficiently narrow part of the Neris and Vilnia river valleys – usually the lowest terraces. Operation of Vilnius wellfields in the productive layer formed regional piezometric depression, which at the time of maximum flow rates of these wellfields (in 1989-1990) was 5-35 meters deep and had the area of approximately 250 km2. Then, a significant part of operational resources of wellfields located near rivers formed surface (river) water. Lately, the total flow of Vilnius wellfields decreased by approximately 2.5 times, and significantly reduced the area and depth of that depression. Resource formation sources have also changed - now only underground water flowing through the operating layer towards the Neris River and which is still quite intensively recharged by groundwater in some places, dominates in the wellfields. The Upper Permian aquifer consisting of the fractured limestone layer of 20-30 m thick, which is operated in Pagiriai wellfields, is spread in the southwestern part of the city. It lies here in the depth of 120-160 m, has good filtration properties and high compression (120-170 m) and is very watery (Source: Vilnius City Municipality Groundwater Monitoring, 2014. Prepared by: UAB DGE Baltic Soil and Environment, Vilnius, 2014).
4.1.3 The existing water supply and wastewater management Special Plan for the Development of Water Supply and Waste Water Infrastructure (prepared by UAB Statybų Strategija) was approved by Decision No 1-124 of the Vilnius City Municipality Council of 13 July 2011. In accordance with this plan solutions for the plot of land (cadastral No. 0101/0067:21), the nearest wellfields is Bukčiai wellfields (IIb2): Group II – semi-closed wellfields; Sub-group: wellfields of a more-open type located near rivers (IIb2). The distance from the plot of land (Cadastral No. 0101/0067: 21) to the nearest Bukčiai wellfields is 1.17 km, Jankiškiai or the South West wellfields is 1.47 km away. The distance to the strict regime (first belt) sanitary protection zone (SPZ) of Bukčiai and Jankiškiai wellfields in Vilnius - 961 m, the distance to the microbial pollution (second belt) SPZ of the wellfields - 831 m. The plot of land (cadastral No. 0101/0067:21) is assigned to Vilnius Bukčiai and Jankiškiai chemical pollution (third belt) zone (see Figure 4.1.3.) When planning the activities in the territory of a plot of land planned to be used, Hygiene Norm 44:2006 Determination and Maintenance of Sanitary Protection Zones of Wellfields (Official Gazette, 2006, No 81-3217) (hereinafter - HN 44:2006) and the requirements set out in Chapter XX of Special Conditions for Land and Forestry Exploitation (hereinafter - Special conditions for exploitation) approved by Resolution No 343 of the Government of Lithuania of 12 May 1992 must be followed. Based on HN 44:2006, the third belt of the sanitary protection zone around wellfields is a protective belt where chemical pollution is restricted. This belt is intended to protect wellfields against chemical pollution. The third belt can consist of two sectors: - 3a (catchment area of the layer of groundwater); - 3b (catchment area of the exploited layer). The dimensions of 3a and 3b sectors of the third belt are calculated taking into account the fact that chemical pollutants having entered directly into the aquifer exploited did not reach the wellfields over 25 years. HN 44:2006 establishes the following restrictions in 3b sector of the third belt of the sanitary protection zone of wellfields: - abandoned wells must not be located in all belts of all groups of SPZ of wellfields (regardless of whether there is a groundwater catchment area), with the exception of bore-wells for monitoring the state of underground water; - treated and untreated industrial, domestic waste water, radioactive and chemical materials and agents must not be directly released into the underground aquifers in all belts of SPZ of all groups of wellfields. Chapter XX of Special Conditions for Exploitation of Sanitary Protection Zones of Underground Water Bodies (Wellfields) identifies the following conditions for land exploitation in a third belt of the sanitary protection zone around wellfields: it is prohibited in the third belt of groundwater bodies (wellfields):
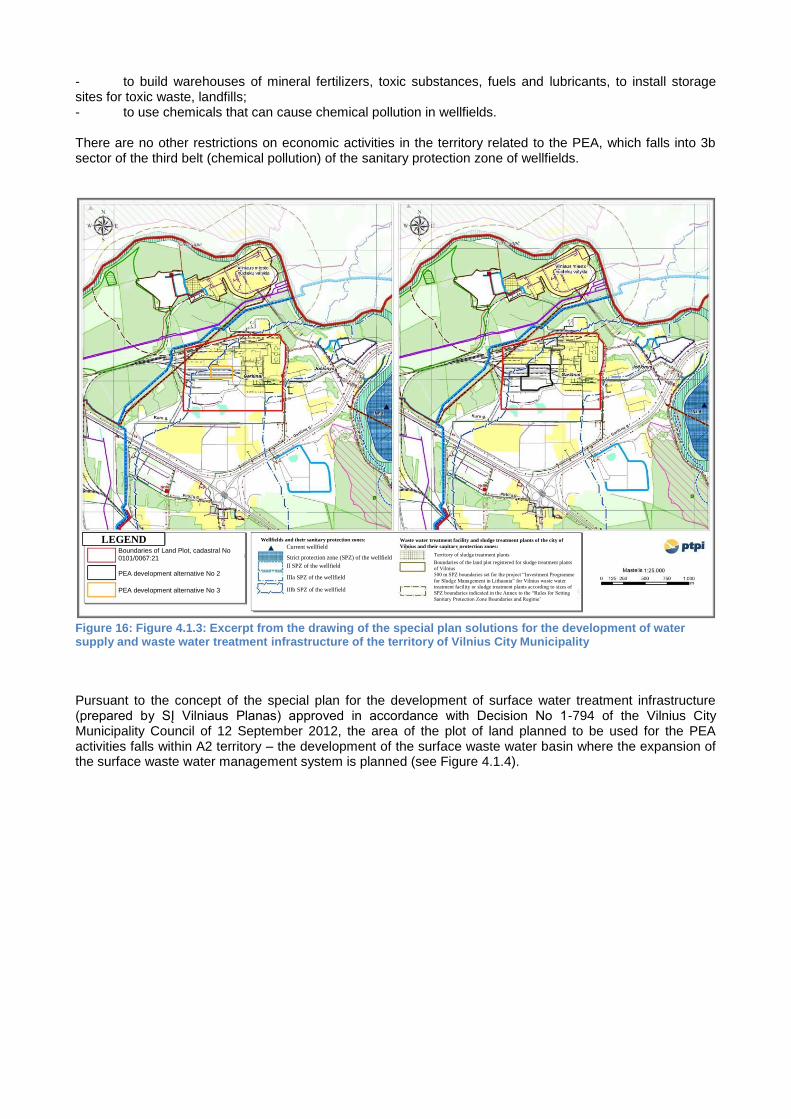
- to build warehouses of mineral fertilizers, toxic substances, fuels and lubricants, to install storage sites for toxic waste, landfills; - to use chemicals that can cause chemical pollution in wellfields. There are no other restrictions on economic activities in the territory related to the PEA, which falls into 3b sector of the third belt (chemical pollution) of the sanitary protection zone of wellfields.
Figure 16: Figure 4.1.3: Excerpt from the drawing of the special plan solutions for the development of water supply and waste water treatment infrastructure of the territory of Vilnius City Municipality
Pursuant to the concept of the special plan for the development of surface water treatment infrastructure (prepared by SĮ Vilniaus Planas) approved in accordance with Decision No 1-794 of the Vilnius City Municipality Council of 12 September 2012, the area of the plot of land planned to be used for the PEA activities falls within A2 territory – the development of the surface waste water basin where the expansion of the surface waste water management system is planned (see Figure 4.1.4).
Boundaries of Land Plot, cadastral No 0101/0067:21
PEA development alternative No 2
PEA development alternative No 3
LEGEND Wellfields and their sanitary protection zones:
Current wellfield
Strict protection zone (SPZ) of the wellfield
II SPZ of the wellfield
IIIa SPZ of the wellfield
IIIb SPZ of the wellfield
Waste water treatment facility and sludge treatment plants of the city of
Vilnius and their sanitary protection zones:
Territory of sludge treatment plants
Boundaries of the land plot registered for sludge treatment plants
of Vilnius
500 m SPZ boundaries set for the project “Investment Programme
for Sludge Management in Lithuania” for Vilnius waste water
treatment facility or sludge treatment plants according to sizes of
SPZ boundaries indicated in the Annex to the “Rules for Setting
Sanitary Protection Zone Boundaries and Regime’
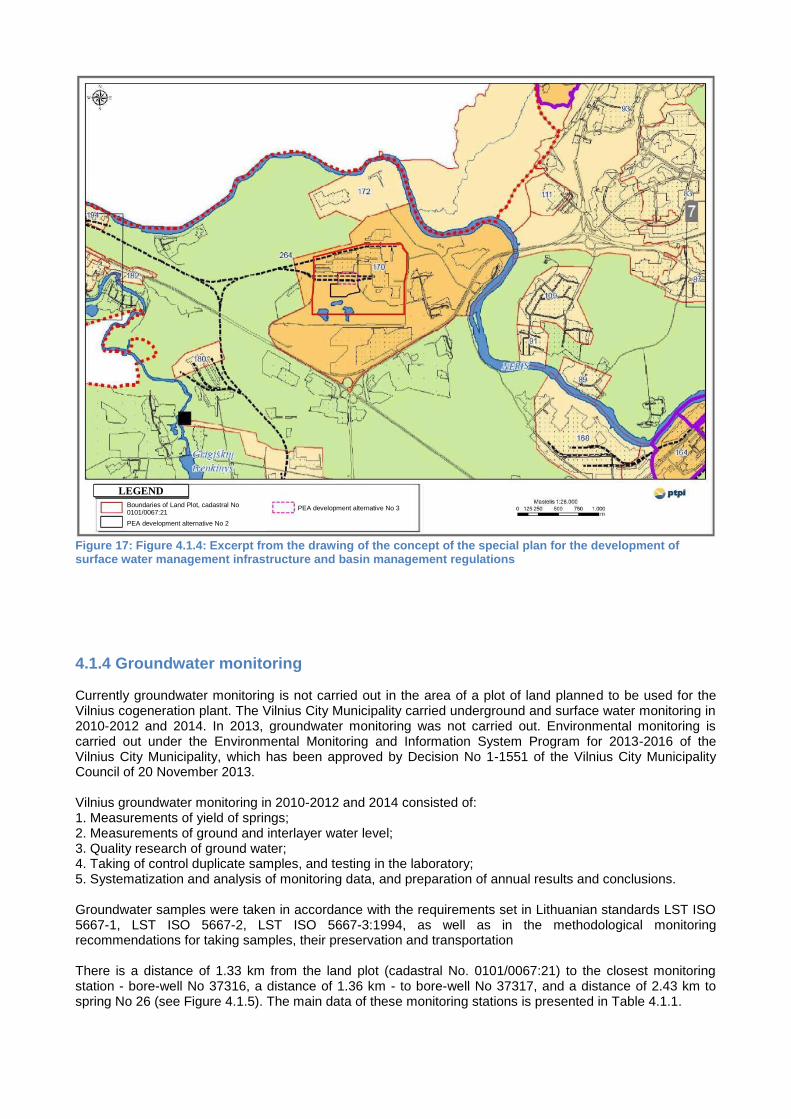
Figure 17: Figure 4.1.4: Excerpt from the drawing of the concept of the special plan for the development of surface water management infrastructure and basin management regulations
4.1.4 Groundwater monitoring Currently groundwater monitoring is not carried out in the area of a plot of land planned to be used for the Vilnius cogeneration plant. The Vilnius City Municipality carried underground and surface water monitoring in 2010-2012 and 2014. In 2013, groundwater monitoring was not carried out. Environmental monitoring is carried out under the Environmental Monitoring and Information System Program for 2013-2016 of the Vilnius City Municipality, which has been approved by Decision No 1-1551 of the Vilnius City Municipality Council of 20 November 2013. Vilnius groundwater monitoring in 2010-2012 and 2014 consisted of: 1. Measurements of yield of springs; 2. Measurements of ground and interlayer water level; 3. Quality research of ground water; 4. Taking of control duplicate samples, and testing in the laboratory; 5. Systematization and analysis of monitoring data, and preparation of annual results and conclusions. Groundwater samples were taken in accordance with the requirements set in Lithuanian standards LST ISO 5667-1, LST ISO 5667-2, LST ISO 5667-3:1994, as well as in the methodological monitoring recommendations for taking samples, their preservation and transportation There is a distance of 1.33 km from the land plot (cadastral No. 0101/0067:21) to the closest monitoring station - bore-well No 37316, a distance of 1.36 km - to bore-well No 37317, and a distance of 2.43 km to spring No 26 (see Figure 4.1.5). The main data of these monitoring stations is presented in Table 4.1.1.
Boundaries of Land Plot, cadastral No 0101/0067:21
PEA development alternative No 2
PEA development alternative No 3
LEGEND
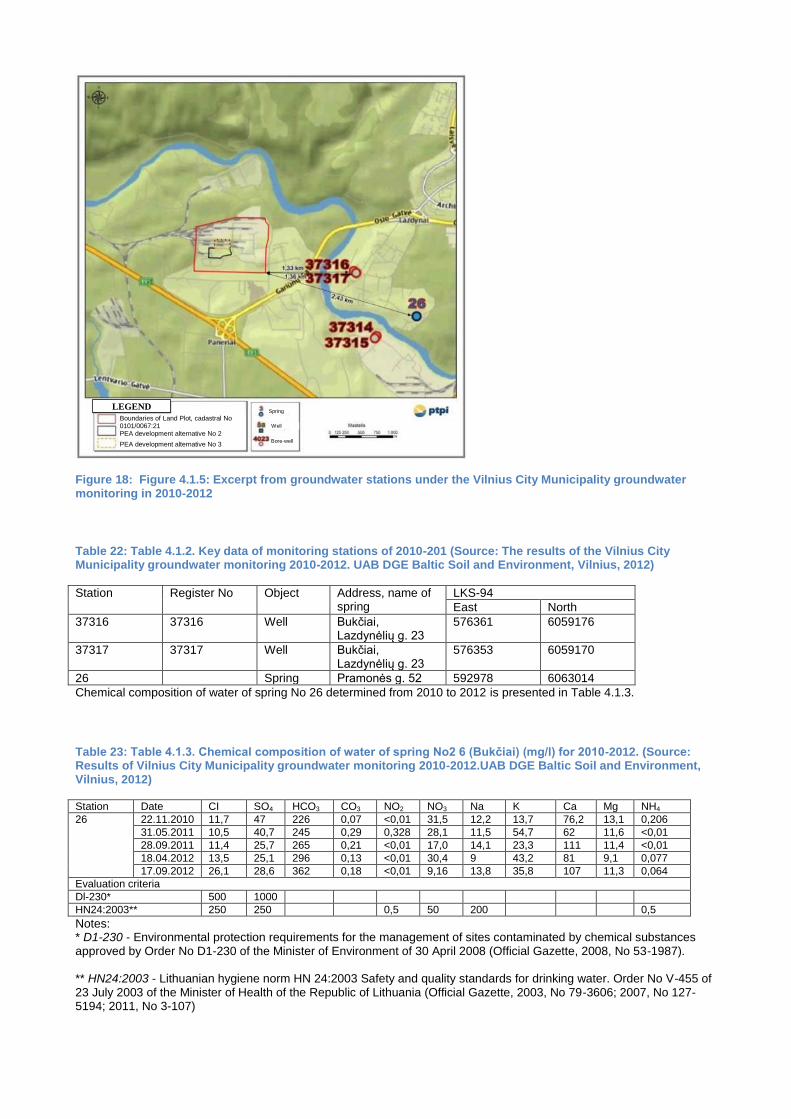
Figure 18: Figure 4.1.5: Excerpt from groundwater stations under the Vilnius City Municipality groundwater monitoring in 2010-2012
Table 22: Table 4.1.2. Key data of monitoring stations of 2010-201 (Source: The results of the Vilnius City Municipality groundwater monitoring 2010-2012. UAB DGE Baltic Soil and Environment, Vilnius, 2012)
Station Register No Object Address, name of spring
LKS-94
East North
37316 37316 Well Bukčiai, Lazdynėlių g. 23
576361 6059176
37317 37317 Well Bukčiai, Lazdynėlių g. 23
576353 6059170
26 Spring Pramonės g. 52 592978 6063014
Chemical composition of water of spring No 26 determined from 2010 to 2012 is presented in Table 4.1.3.
Table 23: Table 4.1.3. Chemical composition of water of spring No2 6 (Bukčiai) (mg/l) for 2010-2012. (Source: Results of Vilnius City Municipality groundwater monitoring 2010-2012.UAB DGE Baltic Soil and Environment, Vilnius, 2012)
Station Date CI SO4 HCO3 CO3 NO2 NO3 Na K Ca Mg NH4
26 22.11.2010 11,7 47 226 0,07 <0,01 31,5 12,2 13,7 76,2 13,1 0,206
31.05.2011 10,5 40,7 245 0,29 0,328 28,1 11,5 54,7 62 11,6 <0,01
28.09.2011 11,4 25,7 265 0,21 <0,01 17,0 14,1 23,3 111 11,4 <0,01
18.04.2012 13,5 25,1 296 0,13 <0,01 30,4 9 43,2 81 9,1 0,077
17.09.2012 26,1 28,6 362 0,18 <0,01 9,16 13,8 35,8 107 11,3 0,064
Evaluation criteria
Dl-230* 500 1000
HN24:2003** 250 250 0,5 50 200 0,5
Notes: * D1-230 - Environmental protection requirements for the management of sites contaminated by chemical substances approved by Order No D1-230 of the Minister of Environment of 30 April 2008 (Official Gazette, 2008, No 53-1987). ** HN24:2003 - Lithuanian hygiene norm HN 24:2003 Safety and quality standards for drinking water. Order No V-455 of 23 July 2003 of the Minister of Health of the Republic of Lithuania (Official Gazette, 2003, No 79-3606; 2007, No 127-5194; 2011, No 3-107)
Boundaries of Land Plot, cadastral No 0101/0067:21
PEA development alternative No 2
PEA development alternative No 3
LEGEND Spring
Well
Bore-well
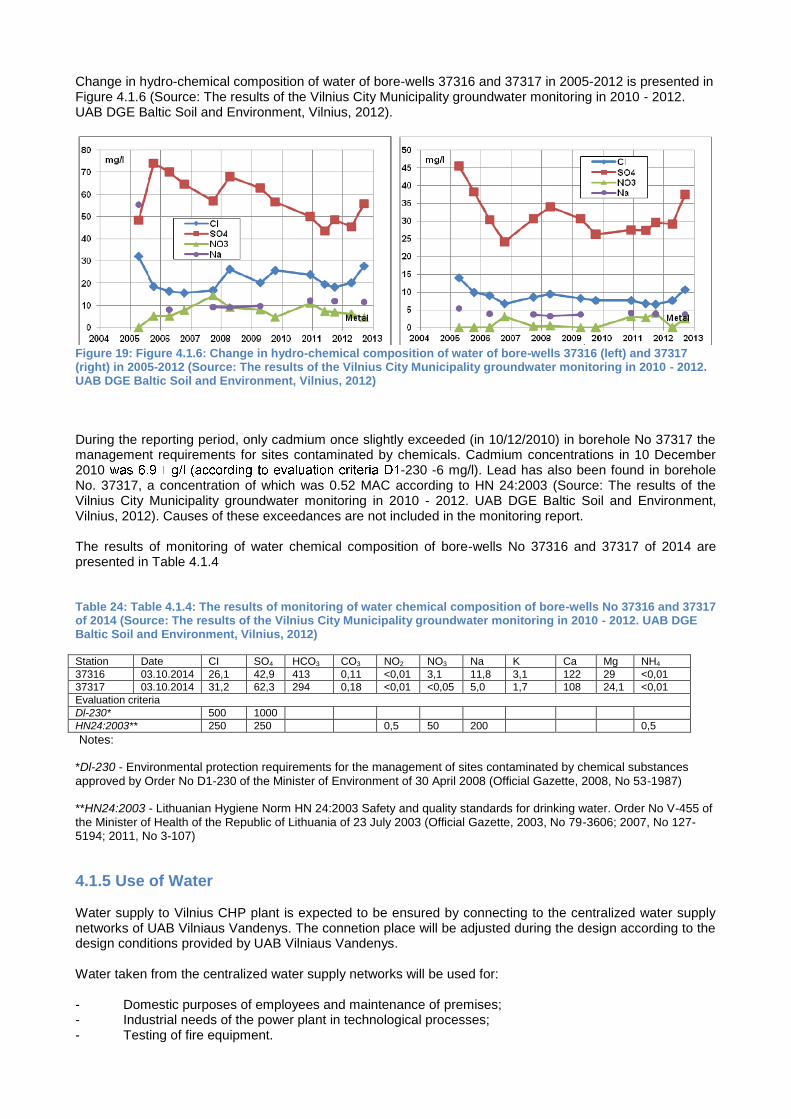
Change in hydro-chemical composition of water of bore-wells 37316 and 37317 in 2005-2012 is presented in Figure 4.1.6 (Source: The results of the Vilnius City Municipality groundwater monitoring in 2010 - 2012. UAB DGE Baltic Soil and Environment, Vilnius, 2012).
Figure 19: Figure 4.1.6: Change in hydro-chemical composition of water of bore-wells 37316 (left) and 37317 (right) in 2005-2012 (Source: The results of the Vilnius City Municipality groundwater monitoring in 2010 - 2012. UAB DGE Baltic Soil and Environment, Vilnius, 2012)
During the reporting period, only cadmium once slightly exceeded (in 10/12/2010) in borehole No 37317 the management requirements for sites contaminated by chemicals. Cadmium concentrations in 10 December 2010 -230 -6 mg/l). Lead has also been found in borehole No. 37317, a concentration of which was 0.52 MAC according to HN 24:2003 (Source: The results of the Vilnius City Municipality groundwater monitoring in 2010 - 2012. UAB DGE Baltic Soil and Environment, Vilnius, 2012). Causes of these exceedances are not included in the monitoring report. The results of monitoring of water chemical composition of bore-wells No 37316 and 37317 of 2014 are presented in Table 4.1.4 Table 24: Table 4.1.4: The results of monitoring of water chemical composition of bore-wells No 37316 and 37317 of 2014 (Source: The results of the Vilnius City Municipality groundwater monitoring in 2010 - 2012. UAB DGE Baltic Soil and Environment, Vilnius, 2012)
Station Date CI SO4 HCO3 CO3 NO2 NO3 Na K Ca Mg NH4
37316 03.10.2014 26,1 42,9 413 0,11 <0,01 3,1 11,8 3,1 122 29 <0,01
37317 03.10.2014 31,2 62,3 294 0,18 <0,01 <0,05 5,0 1,7 108 24,1 <0,01
Evaluation criteria
Dl-230* 500 1000
HN24:2003** 250 250 0,5 50 200 0,5
Notes: *Dl-230 - Environmental protection requirements for the management of sites contaminated by chemical substances
approved by Order No D1-230 of the Minister of Environment of 30 April 2008 (Official Gazette, 2008, No 53-1987) **HN24:2003 - Lithuanian Hygiene Norm HN 24:2003 Safety and quality standards for drinking water. Order No V-455 of the Minister of Health of the Republic of Lithuania of 23 July 2003 (Official Gazette, 2003, No 79-3606; 2007, No 127-5194; 2011, No 3-107)
4.1.5 Use of Water Water supply to Vilnius CHP plant is expected to be ensured by connecting to the centralized water supply networks of UAB Vilniaus Vandenys. The connetion place will be adjusted during the design according to the design conditions provided by UAB Vilniaus Vandenys. Water taken from the centralized water supply networks will be used for: - Domestic purposes of employees and maintenance of premises; - Industrial needs of the power plant in technological processes; - Testing of fire equipment.
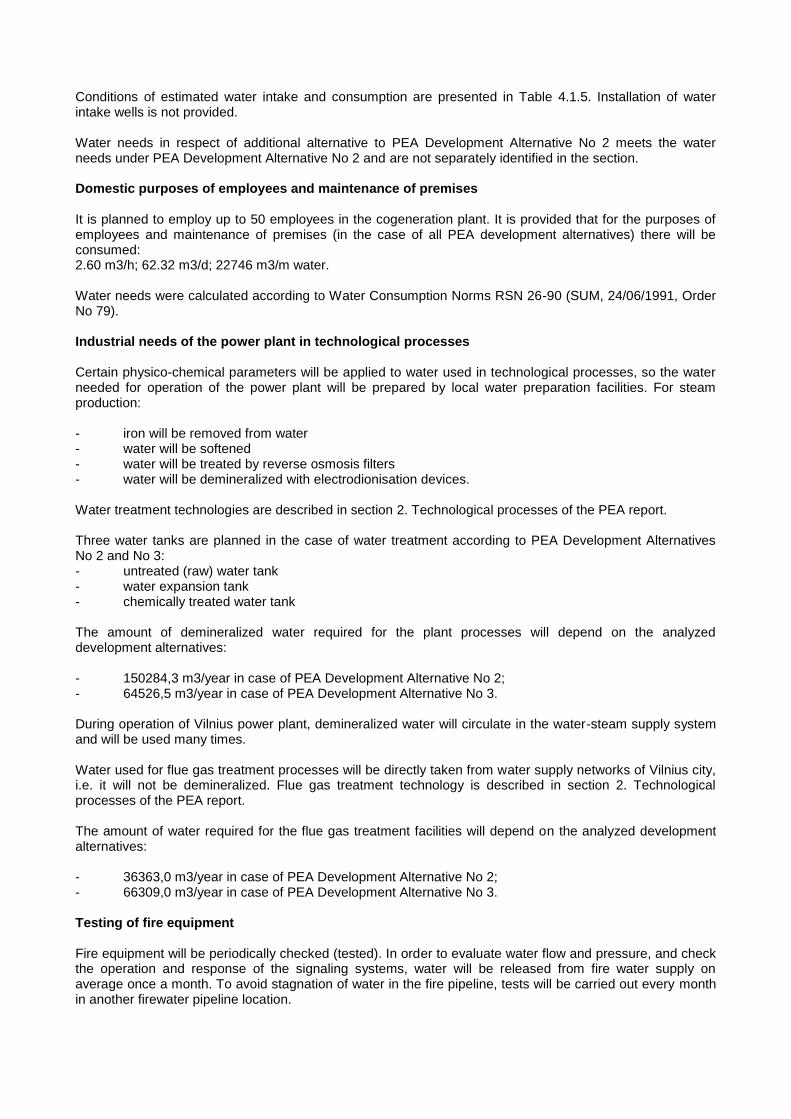
Conditions of estimated water intake and consumption are presented in Table 4.1.5. Installation of water intake wells is not provided. Water needs in respect of additional alternative to PEA Development Alternative No 2 meets the water needs under PEA Development Alternative No 2 and are not separately identified in the section. Domestic purposes of employees and maintenance of premises It is planned to employ up to 50 employees in the cogeneration plant. It is provided that for the purposes of employees and maintenance of premises (in the case of all PEA development alternatives) there will be consumed: 2.60 m3/h; 62.32 m3/d; 22746 m3/m water. Water needs were calculated according to Water Consumption Norms RSN 26-90 (SUM, 24/06/1991, Order No 79). Industrial needs of the power plant in technological processes Certain physico-chemical parameters will be applied to water used in technological processes, so the water needed for operation of the power plant will be prepared by local water preparation facilities. For steam production: - iron will be removed from water - water will be softened - water will be treated by reverse osmosis filters - water will be demineralized with electrodionisation devices. Water treatment technologies are described in section 2. Technological processes of the PEA report. Three water tanks are planned in the case of water treatment according to PEA Development Alternatives No 2 and No 3: - untreated (raw) water tank - water expansion tank - chemically treated water tank The amount of demineralized water required for the plant processes will depend on the analyzed development alternatives: - 150284,3 m3/year in case of PEA Development Alternative No 2; - 64526,5 m3/year in case of PEA Development Alternative No 3. During operation of Vilnius power plant, demineralized water will circulate in the water-steam supply system and will be used many times. Water used for flue gas treatment processes will be directly taken from water supply networks of Vilnius city, i.e. it will not be demineralized. Flue gas treatment technology is described in section 2. Technological processes of the PEA report. The amount of water required for the flue gas treatment facilities will depend on the analyzed development alternatives: - 36363,0 m3/year in case of PEA Development Alternative No 2; - 66309,0 m3/year in case of PEA Development Alternative No 3. Testing of fire equipment Fire equipment will be periodically checked (tested). In order to evaluate water flow and pressure, and check the operation and response of the signaling systems, water will be released from fire water supply on average once a month. To avoid stagnation of water in the fire pipeline, tests will be carried out every month in another firewater pipeline location.
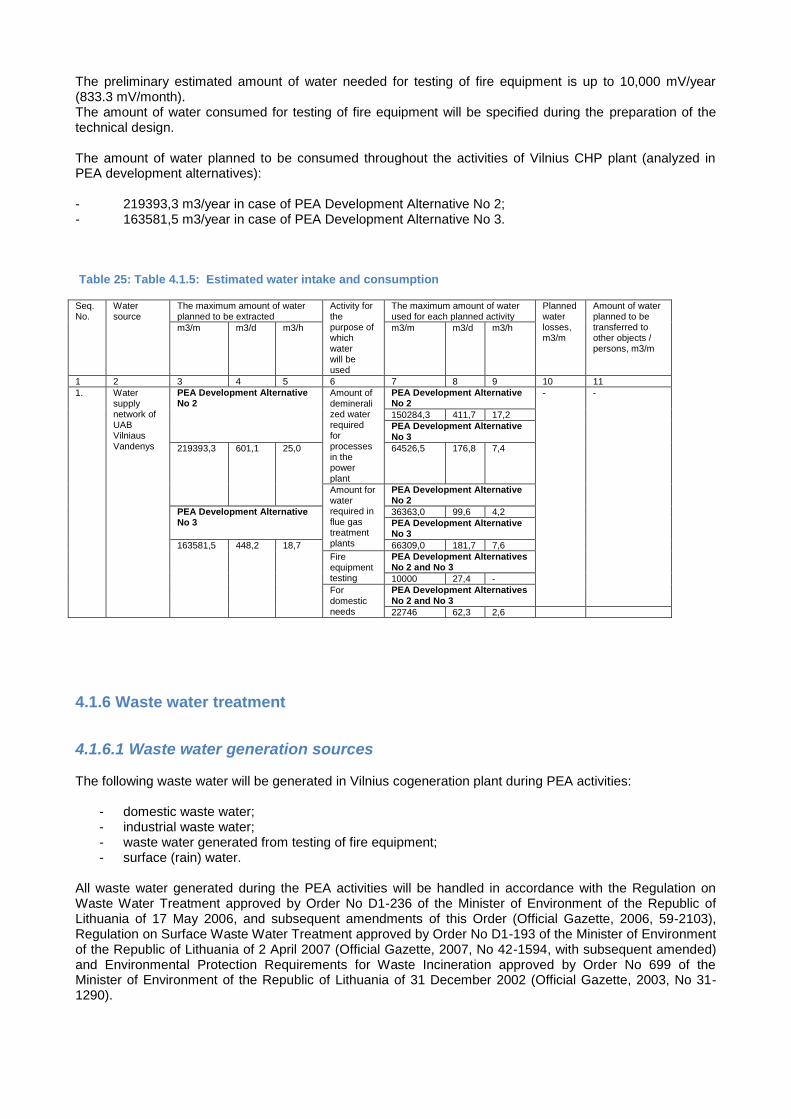
The preliminary estimated amount of water needed for testing of fire equipment is up to 10,000 mV/year (833.3 mV/month). The amount of water consumed for testing of fire equipment will be specified during the preparation of the technical design. The amount of water planned to be consumed throughout the activities of Vilnius CHP plant (analyzed in PEA development alternatives): - 219393,3 m3/year in case of PEA Development Alternative No 2; - 163581,5 m3/year in case of PEA Development Alternative No 3. Table 25: Table 4.1.5: Estimated water intake and consumption
Seq. No.
Water source
The maximum amount of water planned to be extracted
Activity for the purpose of which water will be used
The maximum amount of water used for each planned activity
Planned water losses, m3/m
Amount of water planned to be transferred to other objects / persons, m3/m
m3/m m3/d m3/h m3/m m3/d m3/h
1 2 3 4 5 6 7 8 9 10 11
1. Water supply network of UAB Vilniaus Vandenys
PEA Development Alternative No 2
Amount of demineralized water required for processes in the power plant
PEA Development Alternative No 2
- -
150284,3 411,7 17,2
PEA Development Alternative No 3
219393,3 601,1 25,0 64526,5 176,8 7,4
Amount for water required in flue gas treatment plants
PEA Development Alternative No 2
PEA Development Alternative No 3
36363,0 99,6 4,2
PEA Development Alternative No 3
163581,5 448,2
18,7 66309,0 181,7 7,6
Fire equipment testing
PEA Development Alternatives No 2 and No 3
10000 27,4 -
For domestic needs
PEA Development Alternatives No 2 and No 3
22746 62,3 2,6
4.1.6 Waste water treatment
4.1.6.1 Waste water generation sources The following waste water will be generated in Vilnius cogeneration plant during PEA activities:
- domestic waste water; - industrial waste water; - waste water generated from testing of fire equipment; - surface (rain) water.
All waste water generated during the PEA activities will be handled in accordance with the Regulation on Waste Water Treatment approved by Order No D1-236 of the Minister of Environment of the Republic of Lithuania of 17 May 2006, and subsequent amendments of this Order (Official Gazette, 2006, 59-2103), Regulation on Surface Waste Water Treatment approved by Order No D1-193 of the Minister of Environment of the Republic of Lithuania of 2 April 2007 (Official Gazette, 2007, No 42-1594, with subsequent amended) and Environmental Protection Requirements for Waste Incineration approved by Order No 699 of the Minister of Environment of the Republic of Lithuania of 31 December 2002 (Official Gazette, 2003, No 31-1290).
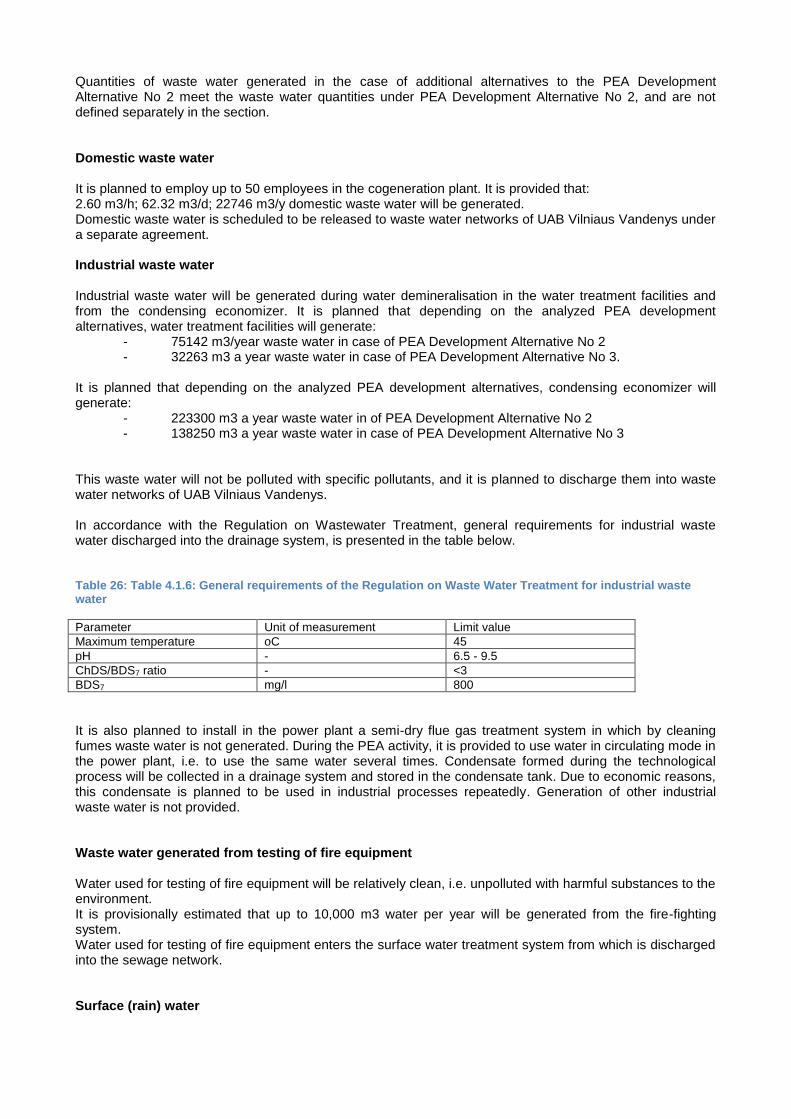
Quantities of waste water generated in the case of additional alternatives to the PEA Development Alternative No 2 meet the waste water quantities under PEA Development Alternative No 2, and are not defined separately in the section. Domestic waste water It is planned to employ up to 50 employees in the cogeneration plant. It is provided that: 2.60 m3/h; 62.32 m3/d; 22746 m3/y domestic waste water will be generated. Domestic waste water is scheduled to be released to waste water networks of UAB Vilniaus Vandenys under a separate agreement. Industrial waste water Industrial waste water will be generated during water demineralisation in the water treatment facilities and from the condensing economizer. It is planned that depending on the analyzed PEA development alternatives, water treatment facilities will generate: - 75142 m3/year waste water in case of PEA Development Alternative No 2 - 32263 m3 a year waste water in case of PEA Development Alternative No 3. It is planned that depending on the analyzed PEA development alternatives, condensing economizer will generate: - 223300 m3 a year waste water in of PEA Development Alternative No 2 - 138250 m3 a year waste water in case of PEA Development Alternative No 3 This waste water will not be polluted with specific pollutants, and it is planned to discharge them into waste water networks of UAB Vilniaus Vandenys. In accordance with the Regulation on Wastewater Treatment, general requirements for industrial waste water discharged into the drainage system, is presented in the table below. Table 26: Table 4.1.6: General requirements of the Regulation on Waste Water Treatment for industrial waste water
Parameter Unit of measurement Limit value
Maximum temperature oC 45
pH - 6.5 - 9.5
ChDS/BDS7 ratio - <3
BDS7 mg/l 800
It is also planned to install in the power plant a semi-dry flue gas treatment system in which by cleaning fumes waste water is not generated. During the PEA activity, it is provided to use water in circulating mode in the power plant, i.e. to use the same water several times. Condensate formed during the technological process will be collected in a drainage system and stored in the condensate tank. Due to economic reasons, this condensate is planned to be used in industrial processes repeatedly. Generation of other industrial waste water is not provided. Waste water generated from testing of fire equipment Water used for testing of fire equipment will be relatively clean, i.e. unpolluted with harmful substances to the environment. It is provisionally estimated that up to 10,000 m3 water per year will be generated from the fire-fighting system. Water used for testing of fire equipment enters the surface water treatment system from which is discharged into the sewage network. Surface (rain) water

In accordance with the amended Regulation on Surface Waste Water Treatment approved by Order No D1- 859 of the Minister of Environment of 2 October 2014 in designing surface water management systems, calculating surface waste design flow and others, Construction Technical Regulation STR 2:07:01:2003 Water Supply and Waste Water Disposal. Building Engineering Systems. Outside Engineering Networks must be followed. The actual amount of surface water (Wf) generated during the month or other period on the territory and (or) released into drainage systems owned by other persons will be measured with metering devices, in the absence thereof, calculated according to the formula:
Wf = 10 X Hf X ps X F X K, m3/month or other period, where: Hf - the actual amount of rainfall of the month or other period in mm (according to the data of Lithuanian Hydrometeorological Service); ps - surface water coefficient (the average value of the surface area at issue (e.g. asphalt, concrete, paving stones, etc.) or rate ps = 0.4 will be applicable); F – the area covered, ha; K - surface runoff coefficient, which depends on whether the snow is removed from the area. If the snow is removed K = 0.85, if not removed - K = 1. Potentially contaminated surface water will be collected and channeled into local surface waste water treatment facilities before discharge into rain water networks from paved areas and hard coatings: it is provided to install a sand and oil trap. It is planned that surface water will be cleaned in typical surface water treatment facilities, which will be designed in accordance with the requirements provided in the Regulation on Surface Waste Water Treatment and STR 2:07:01:2003. Surface (rain) water must be accounted for and their pollution control must be carried out. Surface water from paved areas and hard coatings in case of PEA Development Alternative No 2: Wf = 10 X 750 X 0.8 X 5.79 x 1 =34740 m3/year. Surface water from paved areas and hard coatings in case of PEA Development Alternative No 3:: Wf = 10 X 750 X 0.8 X 2.01 x 1 =12060 m3/year. It is assumed that an indicative amount of surface (rain) water collected from paved areas and hard coatings will account for 95.18 m3/day in case of PEA Development Alternative No 2, and 33.04 m3/day – in case of PEA Development Alternative No 3. Surface (rain) water from the roofs of buildings are relatively clean and without treatment will be discharged to storm water networks of UAB Grinda. Surface water from the roofs of buildings in case of PEA Development Alternative No 2: Wf= 10 X 750 X 0.8 X 1.53 X 1 =9180 m3/year. Surface water from the roofs of buildings in case of PEA Development Alternative No 3: Wf= 10 X 750 X 0.8 X 0.90 x 1 =5400 m3/year. In accordance with the requirements provided in the Regulation on Surface Waste Water Treatment, the pollution of surface waste water discharged into the common surface water drainage systems, waste water discharged from which is or must be treated, may not exceed: 1. The average annual concentration of suspended solids - 150 mg/l, the maximum instantaneous concentration - 300 mg/l. 2. The average annual concentration of BDS5-50 mg O2/l, the maximum instantaneous concentration -100 mg O2/l.
3. The average annual concentration of oil products - 10 mg/l, the maximum instantaneous concentration - 30 mg/l. 4. The concentration of other substances harmful to the aquatic environment may not exceed the substances specified in the Regulation on Waste Water Treatment, Annex I, approved by Order No D1-236 of the Minister of Environment of the Republic of Lithuania of 17 May 2006 on the Approval of Waste Water Regulation (Official Gazette, 2006, No 59-2103), MAA of substances into the natural environment referred to in lists A and B1 of Annex II, and MAA of substances into waste water collection systems provided in B2 list of Annex II. 5. The operator of the surface water collection system, taking into account the system's capabilities, may set less stringent requirements for subscribers (for discharge of waste water into the networks) than those referred to in paragraphs 1-3. Data on waste water sources and / or dischargers are presented in Table 4.1.7. Contamination / estimated environmental pollution of waste water planned to be discharged is presented in Table 4.1.8. Table 27: Table 4.1.7: Data on waste water sources and/or dischargers
No. Receiving
body number
Description of waste water to be discharged and w/water sources
Type of discharger & technical characteristics
Description of location of discharger
Maximum waste water quantity to be discharged
m3/s m3/h m3/d m3/m
1 2 3 4 5 6 7 8 9
1. Domestic w/water networks of UAB Vilniaus Vandenys
Domestic waste water
Discharge to domestic waste water networks of UAB Vilniaus Vandenys
Connection to the network will be provided in technical conditions and the sale - purchase agreements on waste water management services with UAB Vilniaus Vandenys and UAB Grinda
- 2,60 62,32 22746
2. Domestic w/water networks of UAB Vilniaus Vandenys
Industrial w/water (effluent from the water treatment sector)
PEA Development Alternative No. 2
- 8,58 205,87 75142
PEA Development Alternative No. 3
- 3,68 88,39 32263
3. Domestic w/water networks of UAB Vilniaus Vandenys
Industrial w/water (effluent from the water treatment sector)
PEA Development Alternative No. 2
- 25,49 611,78 223300
PEA Development Alternative No. 3
- 15,78 378,77 138250
4. Surface water networks of UAB Grinda
Surface water from paved areas and hard coatings
Discharger to rain water networks of UAB Grinda
PEA Development Alternative No. 2
- 3,97 95,18 34740
PEA Development Alternative No. 3
- 1,38 33,04 12060
5. Surface water networks of UAB Grinda
Surface water from roofs
PEA Development Alternative No. 2
- 1,05 25,15 9180
PEA Development Alternative No. 3
- 0,62 14,79 5400
6. Waste water network
Waste water after testing of fire equipment
- - 27,40 10000
Table 28: Table 4.1.8: Contamination of the planned release of wastewater / estimated environmental pollution*
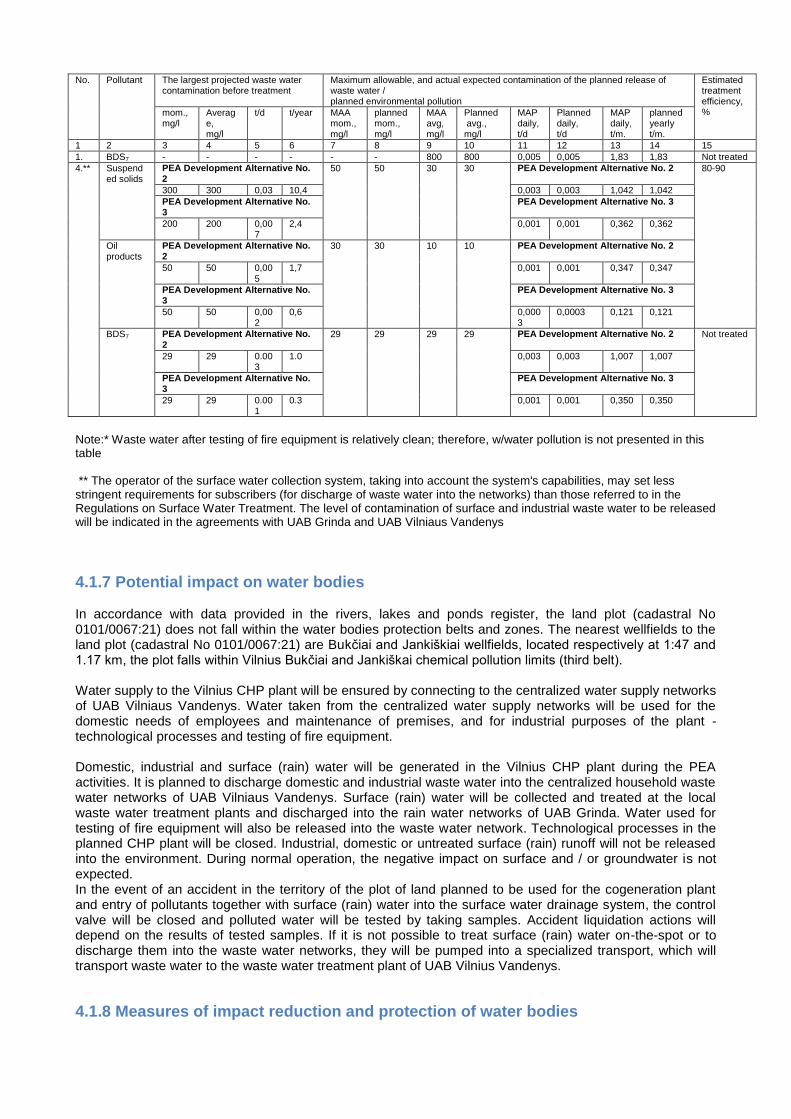
No. Pollutant The largest projected waste water contamination before treatment
Maximum allowable, and actual expected contamination of the planned release of waste water / planned environmental pollution
Estimated treatment efficiency, % mom.,
mg/l Average, mg/l
t/d t/year MAA mom., mg/l
planned mom., mg/l
MAA avg, mg/l
Planned avg., mg/l
MAP daily, t/d
Planned daily, t/d
MAP daily, t/m.
planned yearly t/m.
1 2 3 4 5 6 7 8 9 10 11 12 13 14 15
1. BDS7 - - - - - - 800 800 0,005 0,005 1,83 1,83 Not treated
4.** Suspended solids
PEA Development Alternative No. 2
50 50 30 30 PEA Development Alternative No. 2 80-90
300 300 0,03 10,4 0,003 0,003 1,042 1,042
PEA Development Alternative No. 3
PEA Development Alternative No. 3
200 200 0,007
2,4 0,001 0,001 0,362 0,362
Oil products
PEA Development Alternative No. 2
30 30 10 10 PEA Development Alternative No. 2
50 50 0,005
1,7 0,001 0,001 0,347 0,347
PEA Development Alternative No. 3
PEA Development Alternative No. 3
50 50 0,002
0,6 0,0003
0,0003 0,121 0,121
BDS7 PEA Development Alternative No. 2
29 29 29 29 PEA Development Alternative No. 2 Not treated
29 29 0.003
1.0 0,003 0,003 1,007 1,007
PEA Development Alternative No. 3
PEA Development Alternative No. 3
29 29 0.001
0.3 0,001 0,001 0,350 0,350
Note:* Waste water after testing of fire equipment is relatively clean; therefore, w/water pollution is not presented in this table ** The operator of the surface water collection system, taking into account the system's capabilities, may set less stringent requirements for subscribers (for discharge of waste water into the networks) than those referred to in the Regulations on Surface Water Treatment. The level of contamination of surface and industrial waste water to be released will be indicated in the agreements with UAB Grinda and UAB Vilniaus Vandenys
4.1.7 Potential impact on water bodies In accordance with data provided in the rivers, lakes and ponds register, the land plot (cadastral No 0101/0067:21) does not fall within the water bodies protection belts and zones. The nearest wellfields to the land plot (cadastral No 0101/0067:21) are Bukčiai and Jankiškiai wellfields, located respectively at 1:47 and 1.17 km, the plot falls within Vilnius Bukčiai and Jankiškai chemical pollution limits (third belt). Water supply to the Vilnius CHP plant will be ensured by connecting to the centralized water supply networks of UAB Vilniaus Vandenys. Water taken from the centralized water supply networks will be used for the domestic needs of employees and maintenance of premises, and for industrial purposes of the plant - technological processes and testing of fire equipment. Domestic, industrial and surface (rain) water will be generated in the Vilnius CHP plant during the PEA activities. It is planned to discharge domestic and industrial waste water into the centralized household waste water networks of UAB Vilniaus Vandenys. Surface (rain) water will be collected and treated at the local waste water treatment plants and discharged into the rain water networks of UAB Grinda. Water used for testing of fire equipment will also be released into the waste water network. Technological processes in the planned CHP plant will be closed. Industrial, domestic or untreated surface (rain) runoff will not be released into the environment. During normal operation, the negative impact on surface and / or groundwater is not expected. In the event of an accident in the territory of the plot of land planned to be used for the cogeneration plant and entry of pollutants together with surface (rain) water into the surface water drainage system, the control valve will be closed and polluted water will be tested by taking samples. Accident liquidation actions will depend on the results of tested samples. If it is not possible to treat surface (rain) water on-the-spot or to discharge them into the waste water networks, they will be pumped into a specialized transport, which will transport waste water to the waste water treatment plant of UAB Vilnius Vandenys.
4.1.8 Measures of impact reduction and protection of water bodies
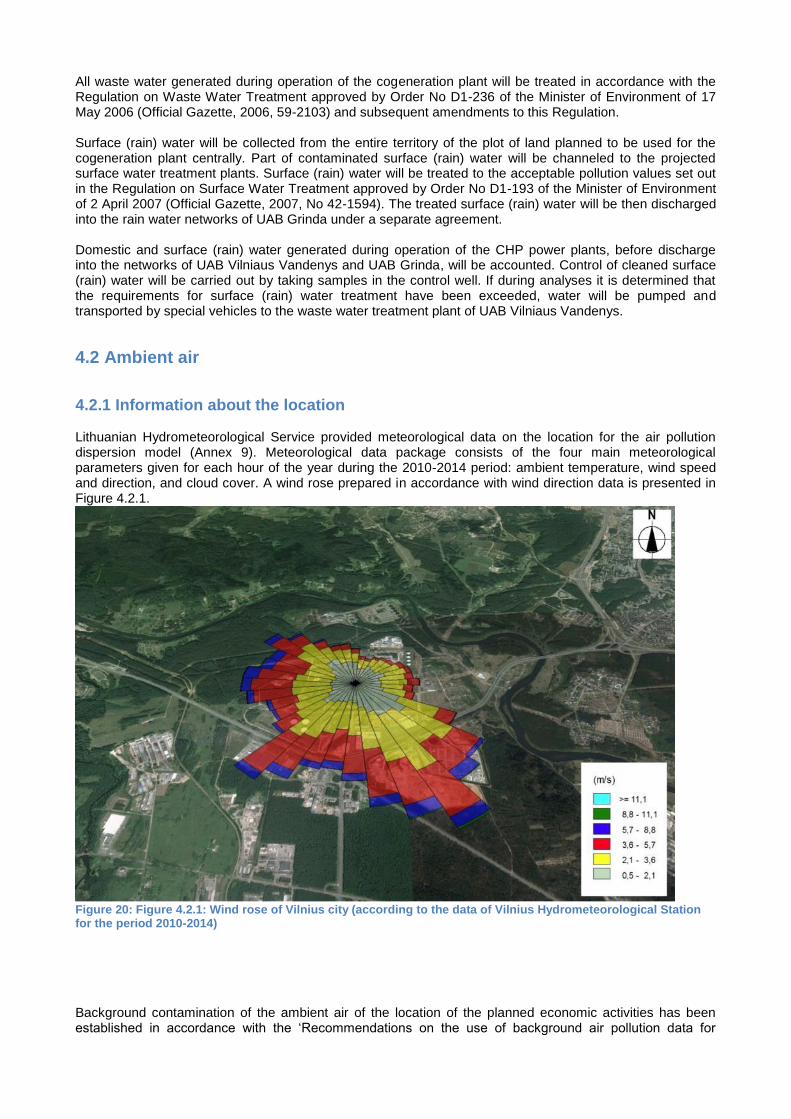
All waste water generated during operation of the cogeneration plant will be treated in accordance with the Regulation on Waste Water Treatment approved by Order No D1-236 of the Minister of Environment of 17 May 2006 (Official Gazette, 2006, 59-2103) and subsequent amendments to this Regulation. Surface (rain) water will be collected from the entire territory of the plot of land planned to be used for the cogeneration plant centrally. Part of contaminated surface (rain) water will be channeled to the projected surface water treatment plants. Surface (rain) water will be treated to the acceptable pollution values set out in the Regulation on Surface Water Treatment approved by Order No D1-193 of the Minister of Environment of 2 April 2007 (Official Gazette, 2007, No 42-1594). The treated surface (rain) water will be then discharged into the rain water networks of UAB Grinda under a separate agreement. Domestic and surface (rain) water generated during operation of the CHP power plants, before discharge into the networks of UAB Vilniaus Vandenys and UAB Grinda, will be accounted. Control of cleaned surface (rain) water will be carried out by taking samples in the control well. If during analyses it is determined that the requirements for surface (rain) water treatment have been exceeded, water will be pumped and transported by special vehicles to the waste water treatment plant of UAB Vilniaus Vandenys.
4.2 Ambient air
4.2.1 Information about the location Lithuanian Hydrometeorological Service provided meteorological data on the location for the air pollution dispersion model (Annex 9). Meteorological data package consists of the four main meteorological parameters given for each hour of the year during the 2010-2014 period: ambient temperature, wind speed and direction, and cloud cover. A wind rose prepared in accordance with wind direction data is presented in Figure 4.2.1.
Figure 20: Figure 4.2.1: Wind rose of Vilnius city (according to the data of Vilnius Hydrometeorological Station for the period 2010-2014)
Background contamination of the ambient air of the location of the planned economic activities has been established in accordance with the ‘Recommendations on the use of background air pollution data for

prediction of air pollution caused by planned activities’ approved by Order No AV-112 of the Director of the Environmental Protection Agency of 10 July 2008. There are no ambient air quality research stations within a radius of 2 km from the location of the planned economic activity, so the background contamination is determined according to other data submitted. In accordance with the indicative results of the ambient air quality monitoring provided on the website of the Environmental Protection Agency, the average annual concentration of nitrogen dioxide in 2010-2011 was about 30.1 μg/m3 and the annual average concentration of sulfur dioxide near the location of the planned economic activity was about 1.1 μg/m3 (Gariūnų g., code of research area -VILNIUS33). According to data of the Environmental Protection Agency, background ambient air pollution of the location of the planned activities determined by modelling in 2013 was in: • carbon monoxide: 293-309 μg/m3 (Avg. 302.5 μg/m3); • solid particles (SP10): 29-40 μg/m3 (Avg. 34.55 μg/m3). By performing mathematic modeling of pollutants dispersion to air, background air pollution data were evaluated in the following sequence: • data of indicative assessments of ambient air quality • ambient air pollution data resulting from modeling • data submitted by the Environmental Protection Agency on pollution resulting from all existing and planned economic activities at a distance of up to 2 kilometers for which a positive decision on the planned economic activities is adopted in a procedure laid down in the legislation (Annex 9. Background ambient air pollution data).
4.2.2 Pollutants emitted into the ambient air During the PEA activity, the ambient air will be polluted with combustion products from the production of heat and electricity by incinerating:
− waste, i.e. non-hazardous municipal waste that have the energy value but are unsuitable for
processing;
− biomass, i.e. solid products made from raw materials of forestry and related industries, waste and
residues, which are used to obtain energy, namely: wood chips, wood waste, forest logging
residues, sawdust, pellets, straw (straw pellets).
The structure and amount of fuel to be used in the CHP plant is presented in section 1.5.6 ‘Quantities of fuels intended for use in Vilnius CHP plant’. Effects on the ambient air is analyzed in respect of two PEA development alternatives:
PEA Development Alternative No 2: Installation of the waste-fired unit with electric power of about 20
MWe and thermal power of about 65 MWth, and a biomass-fired unit with an electric power of about
80 MWe and thermal power of about 175 MWth;
PEA Development Alternative No 3: Installation of the waste-biomass fired combined heat and
power plant with electric power of about 45 MWe and thermal power of about 120 MWth.
During fuel combustion in the CHP plant, in case of both PEA development alternatives, these air pollutants can be generated: nitrogen dioxide, particulate matter, carbon monoxide, sulfur dioxide, hydrogen chloride, hydrogen fluoride, total organic carbon, cadmium, thallium and its compounds, mercury and its compounds, antimony, arsenic, lead, chromium, cobalt, copper, manganese, nickel, vanadium and its compounds, dioxins and furans, and ammonia. Ancillary activities that may have an impact on the ambient air quality will be carried out in addition to the fuel burning in the cogeneration plant, i.e. transportation of waste and raw materials, handling and storage of raw materials (charcoal, lime) and waste (fly ash), battery loading and diesel generator operation. In case of PEA Development Alternative No 2, a biomass preparation and storage unit is provided close to the planned cogeneration plant, where biomass will be loaded, crushed and stored. Carbon monoxide, nitrogen dioxide, particulate matter, sulfur dioxide, sodium hydroxide and sulfuric acid may result from an ancillary activity. In case of ancillary activities to the PEA Development Alternative No 2, emissions will be similar to the emissions of PEA Development Alternative No. 2, so will not be separately assessed.
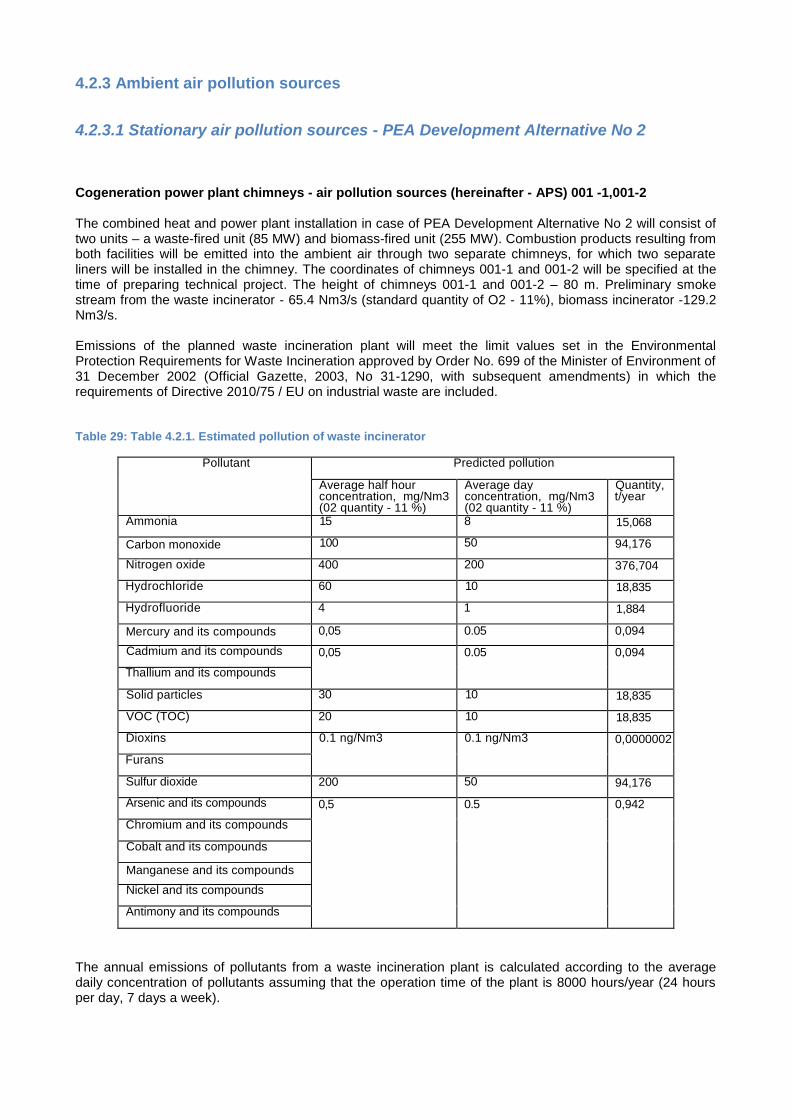
4.2.3 Ambient air pollution sources
4.2.3.1 Stationary air pollution sources - PEA Development Alternative No 2 Cogeneration power plant chimneys - air pollution sources (hereinafter - APS) 001 -1,001-2 The combined heat and power plant installation in case of PEA Development Alternative No 2 will consist of two units – a waste-fired unit (85 MW) and biomass-fired unit (255 MW). Combustion products resulting from both facilities will be emitted into the ambient air through two separate chimneys, for which two separate liners will be installed in the chimney. The coordinates of chimneys 001-1 and 001-2 will be specified at the time of preparing technical project. The height of chimneys 001-1 and 001-2 – 80 m. Preliminary smoke stream from the waste incinerator - 65.4 Nm3/s (standard quantity of O2 - 11%), biomass incinerator -129.2 Nm3/s. Emissions of the planned waste incineration plant will meet the limit values set in the Environmental Protection Requirements for Waste Incineration approved by Order No. 699 of the Minister of Environment of 31 December 2002 (Official Gazette, 2003, No 31-1290, with subsequent amendments) in which the requirements of Directive 2010/75 / EU on industrial waste are included. Table 29: Table 4.2.1. Estimated pollution of waste incinerator
Pollutant Predicted pollution
Average half hour concentration, mg/Nm3 (02 quantity - 11 %)
Average day concentration, mg/Nm3 (02 quantity - 11 %)
Quantity, t/year
Ammonia 15 8 15,068
Carbon monoxide 100 50 94,176
Nitrogen oxide 400 200 376,704
Hydrochloride 60 10 18,835
Hydrofluoride 4 1 1,884
Mercury and its compounds 0,05 0.05 0,094
Cadmium and its compounds 0,05 0.05 0,094
Thallium and its compounds
Solid particles 30 10 18,835
VOC (TOC) 20 10 18,835
Dioxins 0.1 ng/Nm3 0.1 ng/Nm3 0,0000002
Furans
Sulfur dioxide 200 50 94,176
Arsenic and its compounds 0,5 0.5 0,942
Chromium and its compounds
Cobalt and its compounds
Manganese and its compounds
Nickel and its compounds
Antimony and its compounds
The annual emissions of pollutants from a waste incineration plant is calculated according to the average daily concentration of pollutants assuming that the operation time of the plant is 8000 hours/year (24 hours per day, 7 days a week).
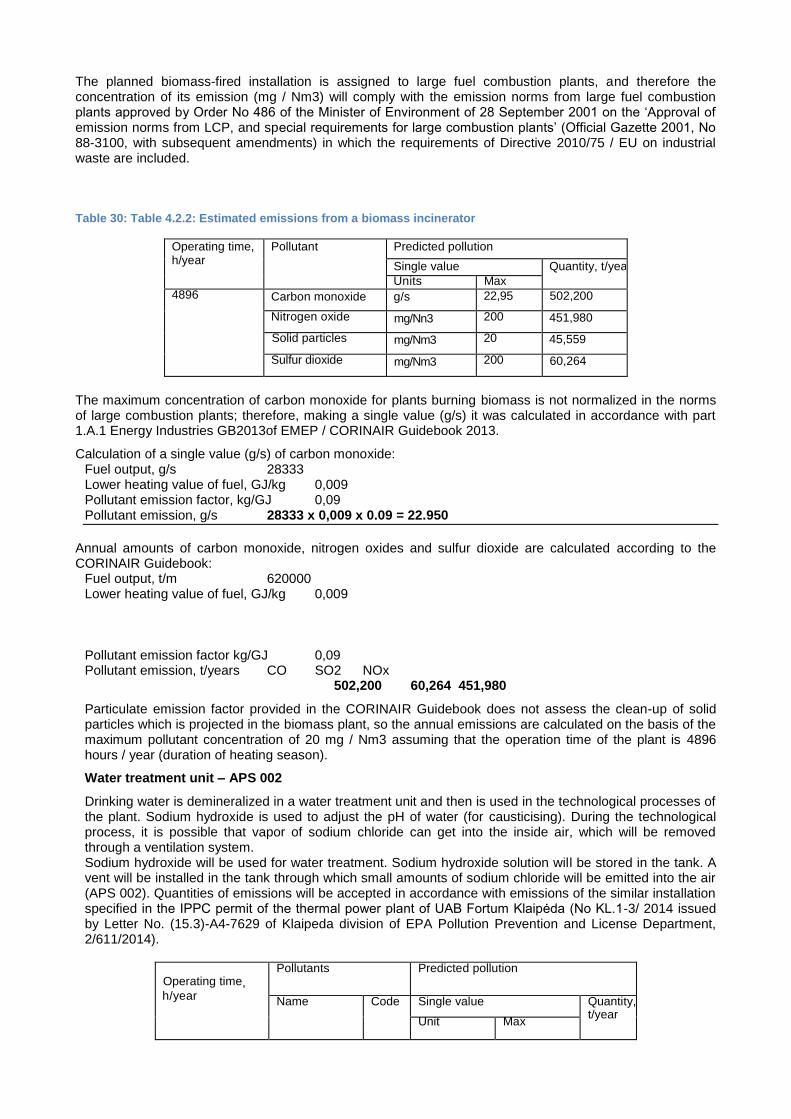
The planned biomass-fired installation is assigned to large fuel combustion plants, and therefore the concentration of its emission (mg / Nm3) will comply with the emission norms from large fuel combustion plants approved by Order No 486 of the Minister of Environment of 28 September 2001 on the ‘Approval of emission norms from LCP, and special requirements for large combustion plants’ (Official Gazette 2001, No 88-3100, with subsequent amendments) in which the requirements of Directive 2010/75 / EU on industrial waste are included. Table 30: Table 4.2.2: Estimated emissions from a biomass incinerator
Operating time, h/year
Pollutant Predicted pollution
Single value Quantity, t/year
Units Max 4896 Carbon monoxide g/s 22,95 502,200
Nitrogen oxide mg/Nn3 200 451,980
Solid particles mg/Nm3 20 45,559
Sulfur dioxide mg/Nm3 200 60,264
The maximum concentration of carbon monoxide for plants burning biomass is not normalized in the norms of large combustion plants; therefore, making a single value (g/s) it was calculated in accordance with part 1.A.1 Energy Industries GB2013of EMEP / CORINAIR Guidebook 2013.
Calculation of a single value (g/s) of carbon monoxide: Fuel output, g/s 28333 Lower heating value of fuel, GJ/kg 0,009 Pollutant emission factor, kg/GJ 0,09 Pollutant emission, g/s 28333 x 0,009 x 0.09 = 22.950
Annual amounts of carbon monoxide, nitrogen oxides and sulfur dioxide are calculated according to the CORINAIR Guidebook:
Fuel output, t/m 620000 Lower heating value of fuel, GJ/kg 0,009
Pollutant emission factor kg/GJ 0,09 Pollutant emission, t/years CO SO2 NOx
502,200 60,264 451,980
Particulate emission factor provided in the CORINAIR Guidebook does not assess the clean-up of solid particles which is projected in the biomass plant, so the annual emissions are calculated on the basis of the maximum pollutant concentration of 20 mg / Nm3 assuming that the operation time of the plant is 4896 hours / year (duration of heating season).
Water treatment unit – APS 002
Drinking water is demineralized in a water treatment unit and then is used in the technological processes of the plant. Sodium hydroxide is used to adjust the pH of water (for causticising). During the technological process, it is possible that vapor of sodium chloride can get into the inside air, which will be removed through a ventilation system. Sodium hydroxide will be used for water treatment. Sodium hydroxide solution will be stored in the tank. A vent will be installed in the tank through which small amounts of sodium chloride will be emitted into the air (APS 002). Quantities of emissions will be accepted in accordance with emissions of the similar installation specified in the IPPC permit of the thermal power plant of UAB Fortum Klaipėda (No KL.1-3/ 2014 issued by Letter No. (15.3)-A4-7629 of Klaipeda division of EPA Pollution Prevention and License Department, 2/611/2014).
Operating time, h/year
Pollutants Predicted pollution
Name Code Single value Quantity, t/year
Unit Max
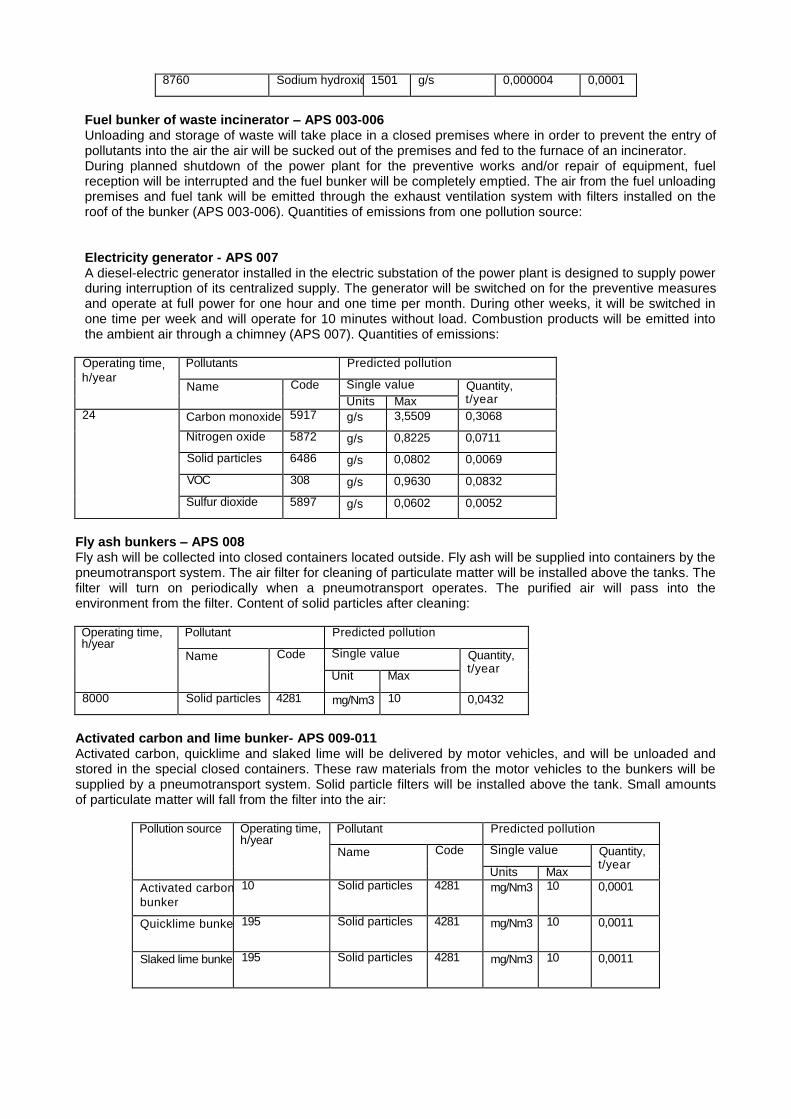
8760 Sodium hydroxide 1501 g/s 0,000004 0,0001
Fuel bunker of waste incinerator – APS 003-006 Unloading and storage of waste will take place in a closed premises where in order to prevent the entry of pollutants into the air the air will be sucked out of the premises and fed to the furnace of an incinerator. During planned shutdown of the power plant for the preventive works and/or repair of equipment, fuel reception will be interrupted and the fuel bunker will be completely emptied. The air from the fuel unloading premises and fuel tank will be emitted through the exhaust ventilation system with filters installed on the roof of the bunker (APS 003-006). Quantities of emissions from one pollution source:
Electricity generator - APS 007 A diesel-electric generator installed in the electric substation of the power plant is designed to supply power during interruption of its centralized supply. The generator will be switched on for the preventive measures and operate at full power for one hour and one time per month. During other weeks, it will be switched in one time per week and will operate for 10 minutes without load. Combustion products will be emitted into the ambient air through a chimney (APS 007). Quantities of emissions: Operating time, h/year
Pollutants Predicted pollution
Name Code Single value Quantity, t/year
Units Max 24 Carbon monoxide 5917 g/s 3,5509 0,3068
Nitrogen oxide 5872 g/s 0,8225 0,0711
Solid particles 6486 g/s 0,0802 0,0069
VOC 308 g/s 0,9630 0,0832
Sulfur dioxide 5897 g/s 0,0602 0,0052
Fly ash bunkers – APS 008 Fly ash will be collected into closed containers located outside. Fly ash will be supplied into containers by the pneumotransport system. The air filter for cleaning of particulate matter will be installed above the tanks. The filter will turn on periodically when a pneumotransport operates. The purified air will pass into the environment from the filter. Content of solid particles after cleaning: Operating time, h/year
Pollutant Predicted pollution
Name Code Single value Quantity, t/year
Unit Max
8000 Solid particles 4281 mg/Nm3 10 0,0432
Activated carbon and lime bunker- APS 009-011 Activated carbon, quicklime and slaked lime will be delivered by motor vehicles, and will be unloaded and stored in the special closed containers. These raw materials from the motor vehicles to the bunkers will be supplied by a pneumotransport system. Solid particle filters will be installed above the tank. Small amounts of particulate matter will fall from the filter into the air:
Pollution source Operating time, h/year
Pollutant Predicted pollution
Name Code Single value Quantity, t/year
Units Max
Activated carbon
bunker
10 Solid particles 4281 mg/Nm3 10 0,0001
Quicklime bunker 195 Solid particles 4281 mg/Nm3 10 0,0011
Slaked lime bunker 195 Solid particles 4281 mg/Nm3 10 0,0011

Bottom ash room - APS 012 Bottom ash will be collected into special containers in the closed room. The air filter for cleaning of particulate matter from the air removed from the room will be installed. The purified air will pass into the environment. The amount of solid particles after cleaning: Operating time, h/year
Pollutant Predicted pollution
Name Code Single value Quantity, t/year
Units Max 8000 Solid particles 4281 mg/Nm3 10 1,5264
Accumulator charging – APS 013 Acid accumulators (batteries) with a total capacity of up to 1,200
Ah will be used in the planned cogeneration plant. For the assessment of the ambient air contamination during the accumulator charging process, it is assumed that the accumulator will be charged on a regular basis – 24 h/day. Small quantities of sulfuric acid will be released during the time of charging of the accumulator. Biomass preparation unit – APS 014-017 Fuel will be transported into the biomass-fired cogeneration plant by motor vehicles and railway. It is provided that both prepared wood chips and firewood will be transported by railways and trucks to the biomass-fired CHP power plant. Wood chips transported by trucks will be unloaded in a closed fuel unloading building, from which will be conveyed in a closed-type conveyors to the fuel storage silos. Firewood crushing will take place indoors to prevent the dust from entering the environment. Wood chips will be conveyed from crushing equipment by closed-type conveyors to the fuel storage silos. The air from the biomass unloading and crushing premises and biomass silos will enter into the atmosphere through the exhaust ventilation system with filters (APS 014-017013). Small amounts of particulate matter will be released from the filters after cleaning:
Pollution source Operating time, h/year
Pollutants Predicted pollution
Name Code Single value Quantity, t/year Unit max
Biomass crushing building
3024 Solid particles 4281 mg/Nm3 10 0,3264
Biomass receipt building
Solid particles 4281 mg/Nm3 10 0,6529
Biomass silo Solid particles 4281 mg/Nm3 10 0,2176
The unloading system of incoming wood chips will be of a closed type to protect dust from entering into the air. Storage of wood chips in the open manner in the territory of the plot of land planned to be used is not projected. Transfer of wood chips from one fuel supply chain to the other by means of vehicles, except fuel unloading, will be also prohibited. Physical data and pollution from stationary pollution sources are presented in Tables 4.2.4 and 4.2.5, the layout plan of pollution sources is provided in Annex 11 (layout plans of stationary sources of air pollution).
Operating time, h/year
Pollutant Predicted pollution
Name Code Single value Quantity, t/year
Units Max
8760 Sulfuric acid 1761 g/s 0.0003 0,011
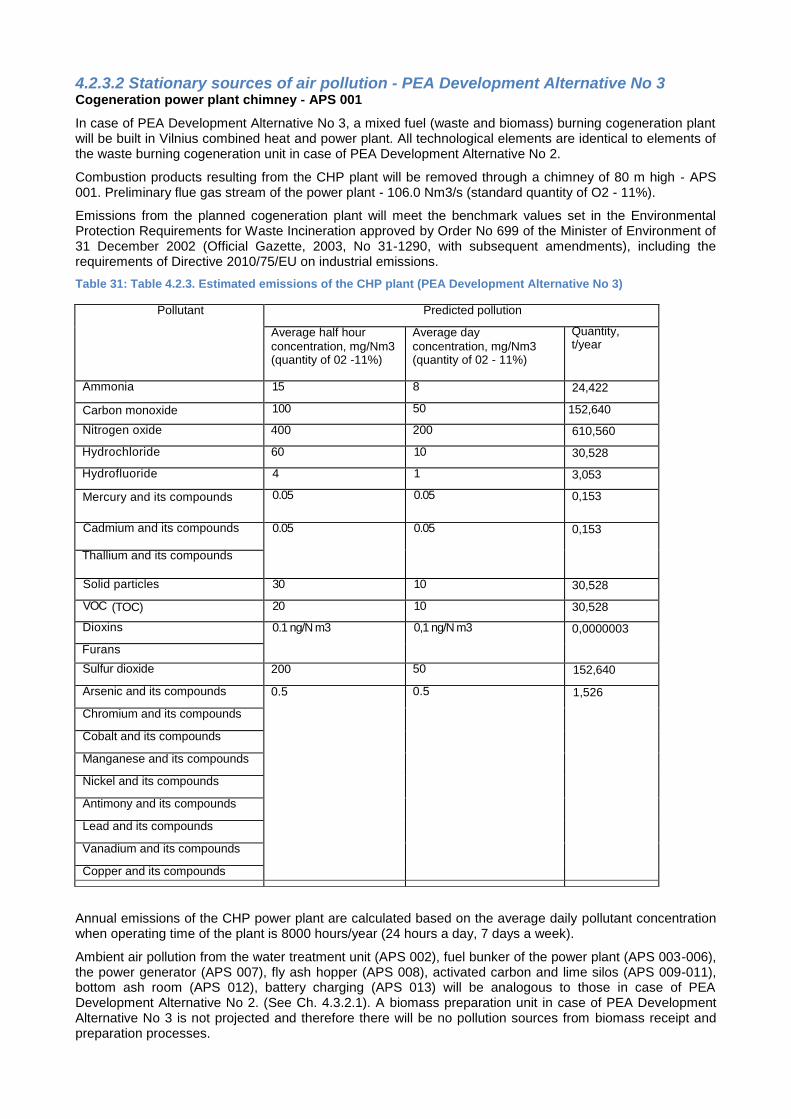
4.2.3.2 Stationary sources of air pollution - PEA Development Alternative No 3 Cogeneration power plant chimney - APS 001
In case of PEA Development Alternative No 3, a mixed fuel (waste and biomass) burning cogeneration plant will be built in Vilnius combined heat and power plant. All technological elements are identical to elements of the waste burning cogeneration unit in case of PEA Development Alternative No 2.
Combustion products resulting from the CHP plant will be removed through a chimney of 80 m high - APS 001. Preliminary flue gas stream of the power plant - 106.0 Nm3/s (standard quantity of O2 - 11%).
Emissions from the planned cogeneration plant will meet the benchmark values set in the Environmental Protection Requirements for Waste Incineration approved by Order No 699 of the Minister of Environment of 31 December 2002 (Official Gazette, 2003, No 31-1290, with subsequent amendments), including the requirements of Directive 2010/75/EU on industrial emissions.
Table 31: Table 4.2.3. Estimated emissions of the CHP plant (PEA Development Alternative No 3)
Annual emissions of the CHP power plant are calculated based on the average daily pollutant concentration when operating time of the plant is 8000 hours/year (24 hours a day, 7 days a week).
Ambient air pollution from the water treatment unit (APS 002), fuel bunker of the power plant (APS 003-006), the power generator (APS 007), fly ash hopper (APS 008), activated carbon and lime silos (APS 009-011), bottom ash room (APS 012), battery charging (APS 013) will be analogous to those in case of PEA Development Alternative No 2. (See Ch. 4.3.2.1). A biomass preparation unit in case of PEA Development Alternative No 3 is not projected and therefore there will be no pollution sources from biomass receipt and preparation processes.
Pollutant Predicted pollution
Average half hour
concentration, mg/Nm3 (quantity of 02 -11%)
Average day
concentration, mg/Nm3 (quantity of 02 - 11%)
Quantity, t/year
Ammonia 15 8 24,422
Carbon monoxide 100 50 152,640
Nitrogen oxide 400 200 610,560
Hydrochloride 60 10 30,528
Hydrofluoride 4 1 3,053
Mercury and its compounds 0.05 0.05 0,153
Cadmium and its compounds 0.05 0.05 0,153
Thallium and its compounds
Solid particles 30 10 30,528
VOC (TOC) 20 10 30,528
Dioxins 0.1 ng/N m3 0,1 ng/N m3 0,0000003
Furans
Sulfur dioxide 200 50 152,640
Arsenic and its compounds 0.5 0.5 1,526
Chromium and its compounds
Cobalt and its compounds
Manganese and its compounds
Nickel and its compounds
Antimony and its compounds
Lead and its compounds
Vanadium and its compounds
Copper and its compounds

Physical data and pollution from stationary sources of pollution are provided in the tables below, the layout plan of pollution sources is provided in Annex 11.
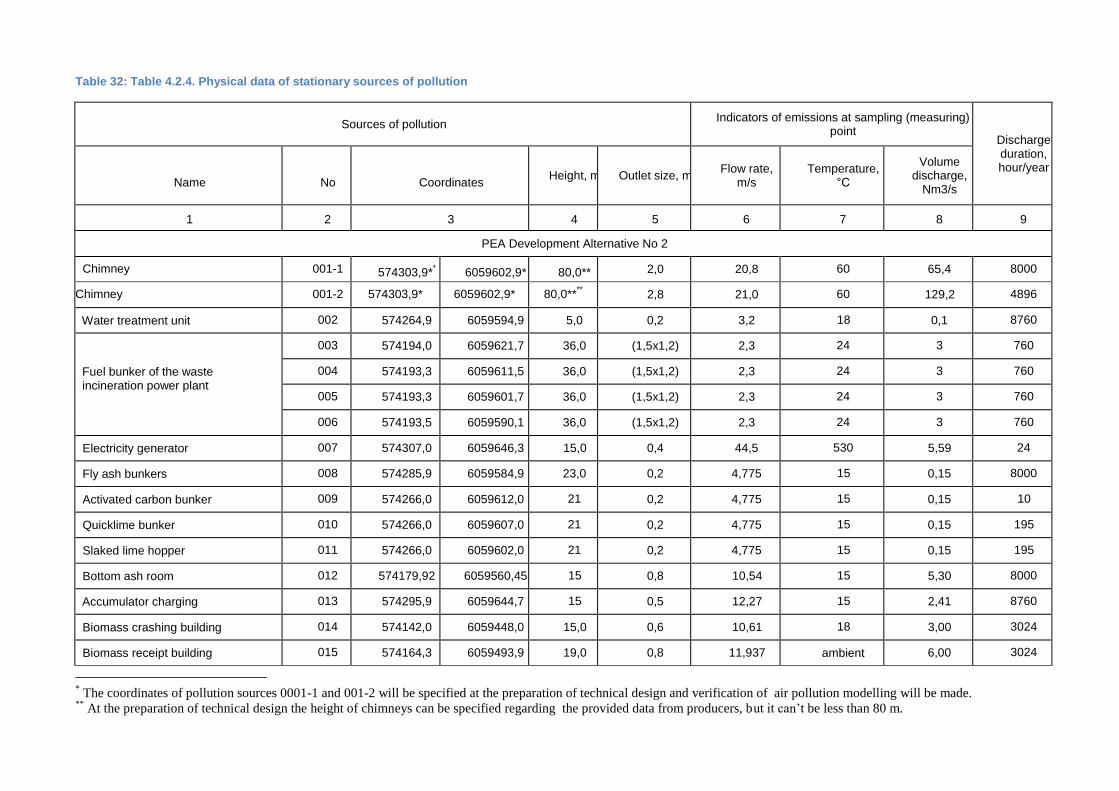
Table 32: Table 4.2.4. Physical data of stationary sources of pollution
Sources of pollution Indicators of emissions at sampling (measuring)
point Discharge duration, hour/year
Name
No
Coordinates Height, m Outlet size, m
Flow rate, m/s
Temperature, °C
Volume discharge,
Nm3/s
1 2 3 4 5 6 7 8 9
PEA Development Alternative No 2
Chimney 001-1 574303,9** 6059602,9* 80,0** 2,0 20,8 60 65,4 8000
Chimney 001-2 574303,9* 6059602,9* 80,0**** 2,8 21,0 60 129,2 4896
Water treatment unit 002 574264,9 6059594,9 5,0 0,2 3,2 18 0,1 8760
Fuel bunker of the waste incineration power plant
003 574194,0 6059621,7 36,0 (1,5x1,2) 2,3 24 3 760
004 574193,3 6059611,5 36,0 (1,5x1,2) 2,3 24 3 760
005 574193,3 6059601,7 36,0 (1,5x1,2) 2,3 24 3 760
006 574193,5 6059590,1 36,0 (1,5x1,2) 2,3 24 3 760
Electricity generator 007 574307,0 6059646,3 15,0 0,4 44,5 530 5,59 24
Fly ash bunkers 008 574285,9 6059584,9 23,0 0,2 4,775 15 0,15 8000
Activated carbon bunker 009 574266,0 6059612,0 21 0,2 4,775 15 0,15 10
Quicklime bunker 010 574266,0 6059607,0 21 0,2 4,775 15 0,15 195
Slaked lime hopper 011 574266,0 6059602,0 21 0,2 4,775 15 0,15 195
Bottom ash room 012 574179,92 6059560,45 15 0,8 10,54 15 5,30 8000
Accumulator charging 013 574295,9 6059644,7 15 0,5 12,27 15 2,41 8760
Biomass crashing building 014 574142,0 6059448,0 15,0 0,6 10,61 18 3,00 3024
Biomass receipt building 015 574164,3 6059493,9 19,0 0,8 11,937 ambient 6,00 3024
* The coordinates of pollution sources 0001-1 and 001-2 will be specified at the preparation of technical design and verification of air pollution modelling will be made.
** At the preparation of technical design the height of chimneys can be specified regarding the provided data from producers, but it can’t be less than 80 m.
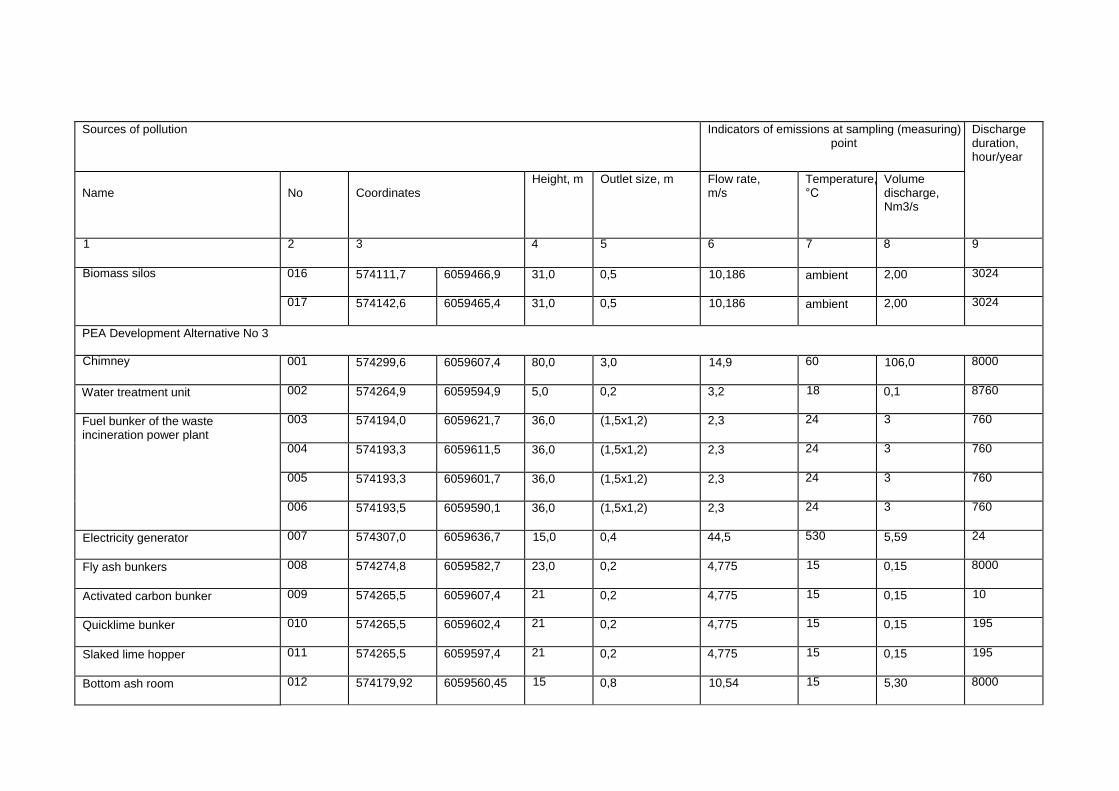
Sources of pollution Indicators of emissions at sampling (measuring) point
Discharge duration, hour/year
Name
No
Coordinates
Height, m Outlet size, m Flow rate, m/s
Temperature, °C
Volume discharge, Nm3/s
1 2 3 4 5 6 7 8 9
Biomass silos 016 574111,7 6059466,9 31,0 0,5 10,186 ambient 2,00 3024
017 574142,6 6059465,4 31,0 0,5 10,186 ambient 2,00 3024
PEA Development Alternative No 3
Chimney 001 574299,6 6059607,4 80,0 3,0 14,9 60 106,0 8000
Water treatment unit 002 574264,9 6059594,9 5,0 0,2 3,2 18 0,1 8760
Fuel bunker of the waste incineration power plant
003 574194,0 6059621,7 36,0 (1,5x1,2) 2,3 24 3 760
004 574193,3 6059611,5 36,0 (1,5x1,2) 2,3 24 3 760
005 574193,3 6059601,7 36,0 (1,5x1,2) 2,3 24 3 760
006 574193,5 6059590,1 36,0 (1,5x1,2) 2,3 24 3 760
Electricity generator 007 574307,0 6059636,7 15,0 0,4 44,5 530 5,59 24
Fly ash bunkers 008 574274,8 6059582,7 23,0 0,2 4,775 15 0,15 8000
Activated carbon bunker 009 574265,5 6059607,4 21 0,2 4,775 15 0,15 10
Quicklime bunker 010 574265,5 6059602,4 21 0,2 4,775 15 0,15 195
Slaked lime hopper 011 574265,5 6059597,4 21 0,2 4,775 15 0,15 195
Bottom ash room 012 574179,92 6059560,45 15 0,8 10,54 15 5,30 8000
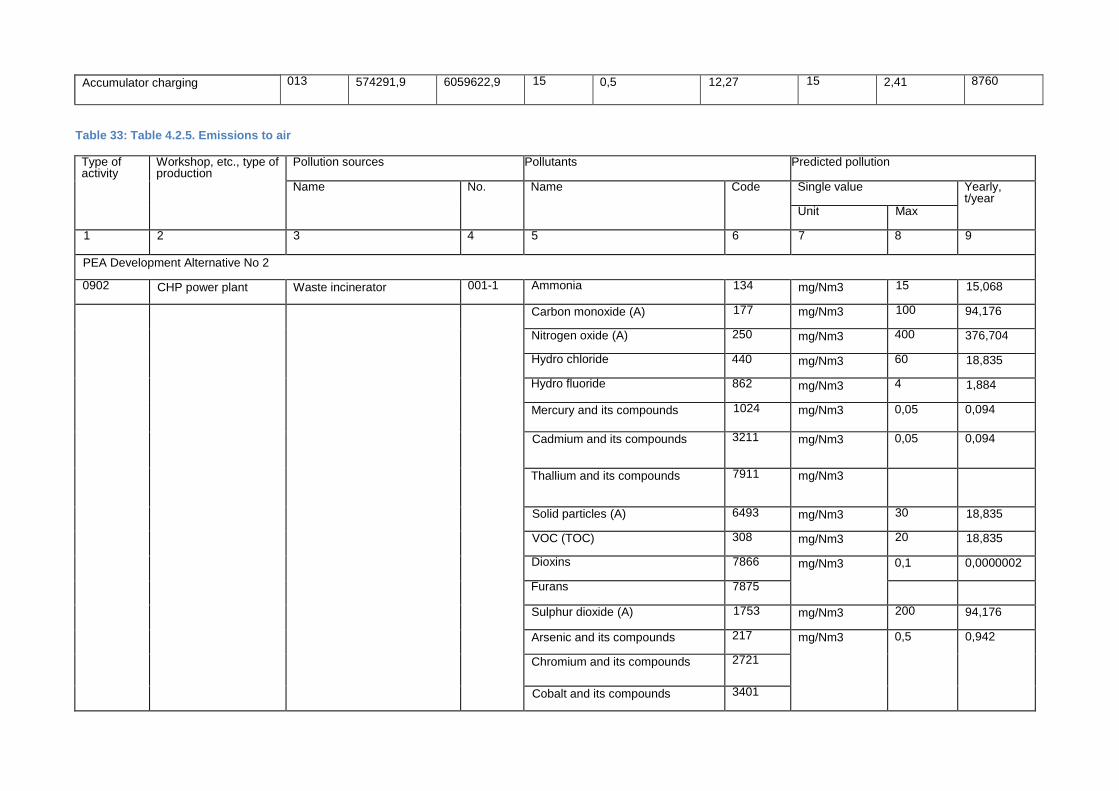
Accumulator charging 013 574291,9 6059622,9 15 0,5 12,27 15 2,41 8760
Table 33: Table 4.2.5. Emissions to air
Type of activity
Workshop, etc., type of production
Pollution sources Pollutants Predicted pollution
Name
No. Name Code Single value Yearly, t/year
Unit Max
1 2 3 4 5 6 7 8 9
PEA Development Alternative No 2
0902 CHP power plant Waste incinerator 001-1 Ammonia 134 mg/Nm3 15 15,068
Carbon monoxide (A) 177 mg/Nm3 100 94,176
Nitrogen oxide (A) 250 mg/Nm3 400 376,704
Hydro chloride 440 mg/Nm3 60 18,835
Hydro fluoride 862 mg/Nm3 4 1,884
Mercury and its compounds 1024 mg/Nm3 0,05 0,094
Cadmium and its compounds 3211 mg/Nm3 0,05 0,094
Thallium and its compounds 7911 mg/Nm3
Solid particles (A) 6493 mg/Nm3 30 18,835
VOC (TOC) 308 mg/Nm3 20 18,835
Dioxins 7866 mg/Nm3 0,1 0,0000002
Furans 7875
Sulphur dioxide (A) 1753 mg/Nm3 200 94,176
Arsenic and its compounds 217 mg/Nm3 0,5 0,942
Chromium and its compounds 2721
Cobalt and its compounds 3401
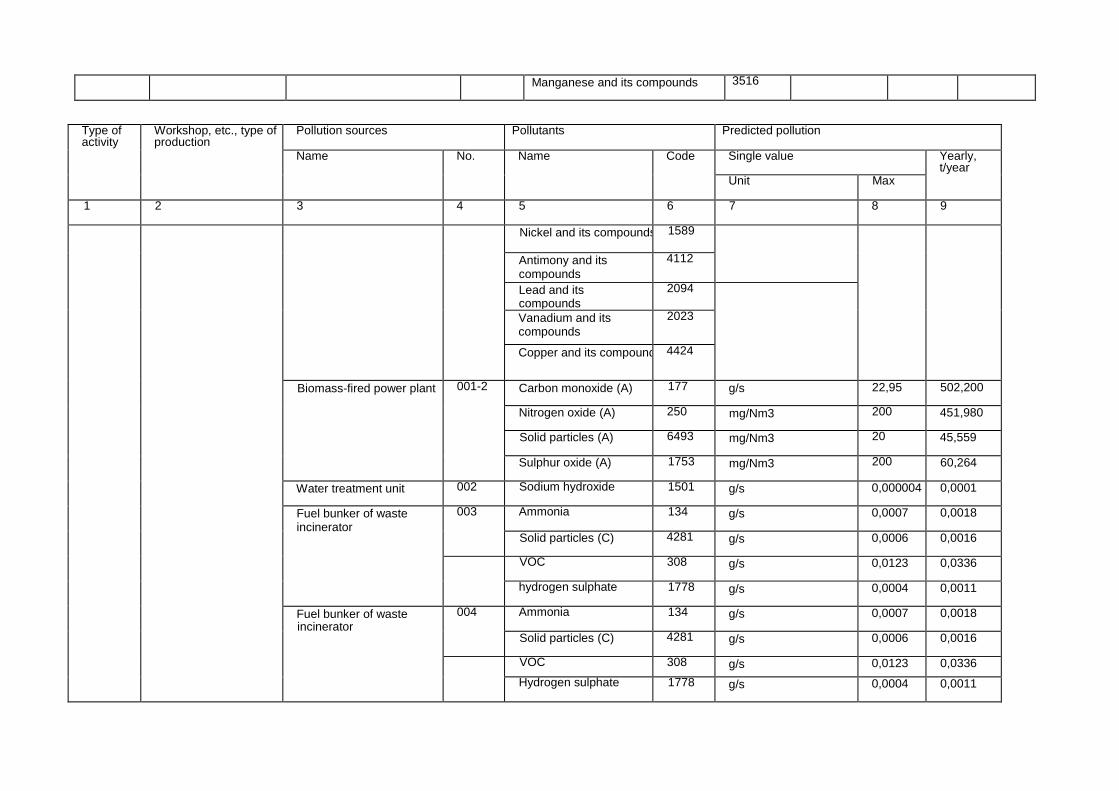
Manganese and its compounds 3516
Type of activity
Workshop, etc., type of production
Pollution sources Pollutants Predicted pollution
Name
No. Name Code Single value Yearly, t/year
Unit Max
1 2 3 4 5 6 7 8 9
Nickel and its compounds 1589
Antimony and its compounds
4112
Lead and its compounds
2094
Vanadium and its compounds
2023
Copper and its compounds 4424
Biomass-fired power plant 001-2 Carbon monoxide (A) 177 g/s 22,95 502,200
Nitrogen oxide (A) 250 mg/Nm3 200 451,980
Solid particles (A) 6493 mg/Nm3 20 45,559
Sulphur oxide (A) 1753 mg/Nm3 200 60,264
Water treatment unit 002 Sodium hydroxide 1501 g/s 0,000004 0,0001
Fuel bunker of waste incinerator
003 Ammonia 134 g/s 0,0007 0,0018
Solid particles (C) 4281 g/s 0,0006 0,0016
VOC 308 g/s 0,0123 0,0336
hydrogen sulphate 1778 g/s 0,0004 0,0011
Fuel bunker of waste incinerator
004 Ammonia 134 g/s 0,0007 0,0018
Solid particles (C) 4281 g/s 0,0006 0,0016
VOC 308 g/s 0,0123 0,0336
Hydrogen sulphate 1778 g/s 0,0004 0,0011
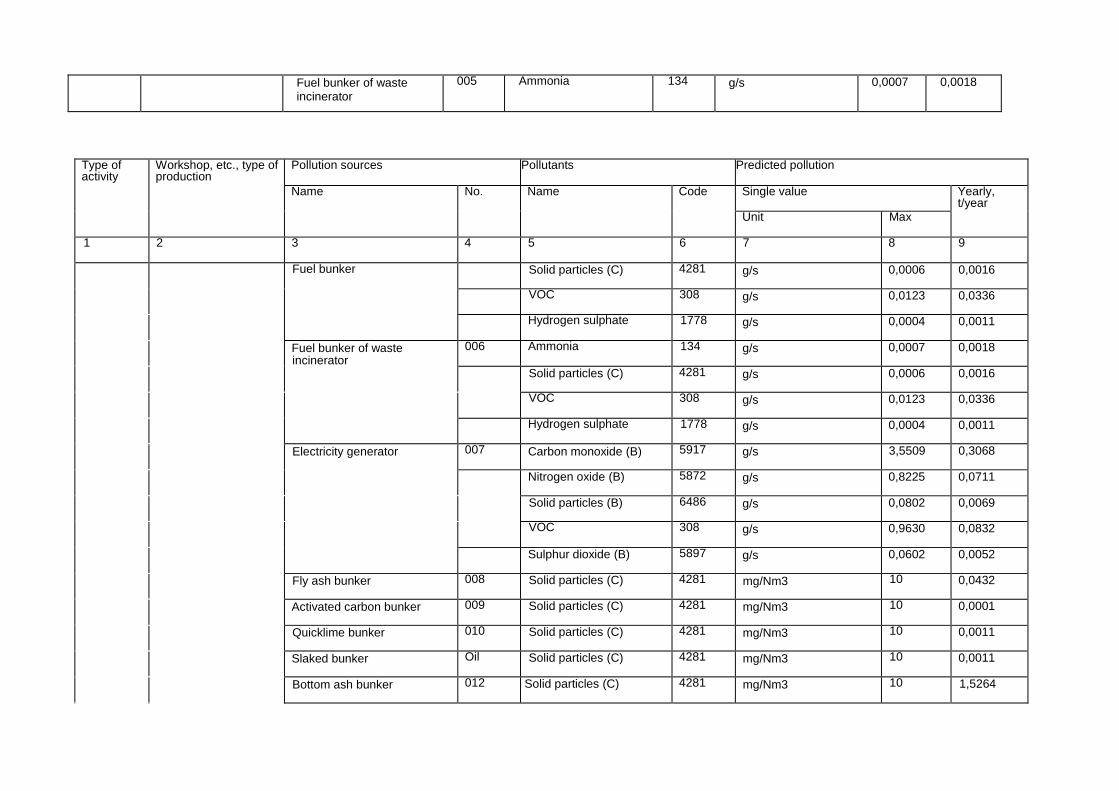
Fuel bunker of waste incinerator
005 Ammonia 134 g/s 0,0007 0,0018
Type of activity
Workshop, etc., type of production
Pollution sources Pollutants Predicted pollution
Name
No. Name Code Single value Yearly, t/year
Unit Max
1 2 3 4 5 6 7 8 9
Fuel bunker Solid particles (C) 4281 g/s 0,0006 0,0016
VOC 308 g/s 0,0123 0,0336
Hydrogen sulphate 1778 g/s 0,0004 0,0011
Fuel bunker of waste incinerator
006 Ammonia 134 g/s 0,0007 0,0018
Solid particles (C) 4281 g/s 0,0006 0,0016
VOC 308 g/s 0,0123 0,0336
Hydrogen sulphate 1778 g/s 0,0004 0,0011
Electricity generator 007 Carbon monoxide (B) 5917 g/s 3,5509 0,3068
Nitrogen oxide (B) 5872 g/s 0,8225 0,0711
Solid particles (B) 6486 g/s 0,0802 0,0069
VOC 308 g/s 0,9630 0,0832
Sulphur dioxide (B) 5897 g/s 0,0602 0,0052
Fly ash bunker 008 Solid particles (C) 4281 mg/Nm3 10 0,0432
Activated carbon bunker 009 Solid particles (C) 4281 mg/Nm3 10 0,0001
Quicklime bunker 010 Solid particles (C) 4281 mg/Nm3 10 0,0011
Slaked bunker Oil Solid particles (C) 4281 mg/Nm3 10 0,0011
Bottom ash bunker 012 Solid particles (C) 4281 mg/Nm3 10 1,5264
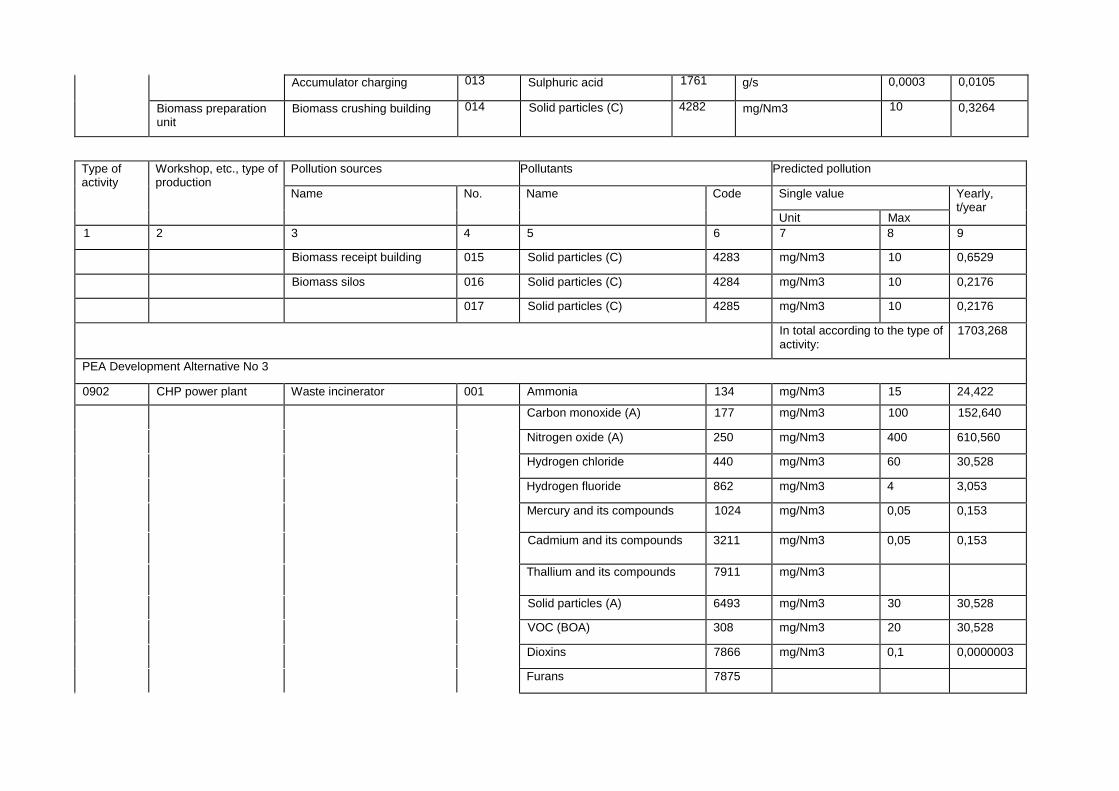
Accumulator charging 013 Sulphuric acid 1761 g/s 0,0003 0,0105
Biomass preparation unit
Biomass crushing building 014 Solid particles (C) 4282 mg/Nm3 10 0,3264
Type of activity
Workshop, etc., type of production
Pollution sources Pollutants Predicted pollution
Name
No. Name Code Single value Yearly, t/year
Unit Max
1 2 3 4 5 6 7 8 9
Biomass receipt building 015 Solid particles (C) 4283 mg/Nm3 10 0,6529
Biomass silos 016 Solid particles (C) 4284 mg/Nm3 10 0,2176
017 Solid particles (C) 4285 mg/Nm3 10 0,2176
In total according to the type of activity:
1703,268
PEA Development Alternative No 3
0902 CHP power plant Waste incinerator 001 Ammonia 134 mg/Nm3 15 24,422
Carbon monoxide (A) 177 mg/Nm3 100 152,640
Nitrogen oxide (A) 250 mg/Nm3 400 610,560
Hydrogen chloride 440 mg/Nm3 60 30,528
Hydrogen fluoride 862 mg/Nm3 4 3,053
Mercury and its compounds 1024 mg/Nm3 0,05 0,153
Cadmium and its compounds 3211 mg/Nm3 0,05 0,153
Thallium and its compounds 7911 mg/Nm3
Solid particles (A) 6493 mg/Nm3 30 30,528
VOC (BOA) 308 mg/Nm3 20 30,528
Dioxins 7866 mg/Nm3 0,1 0,0000003
Furans 7875
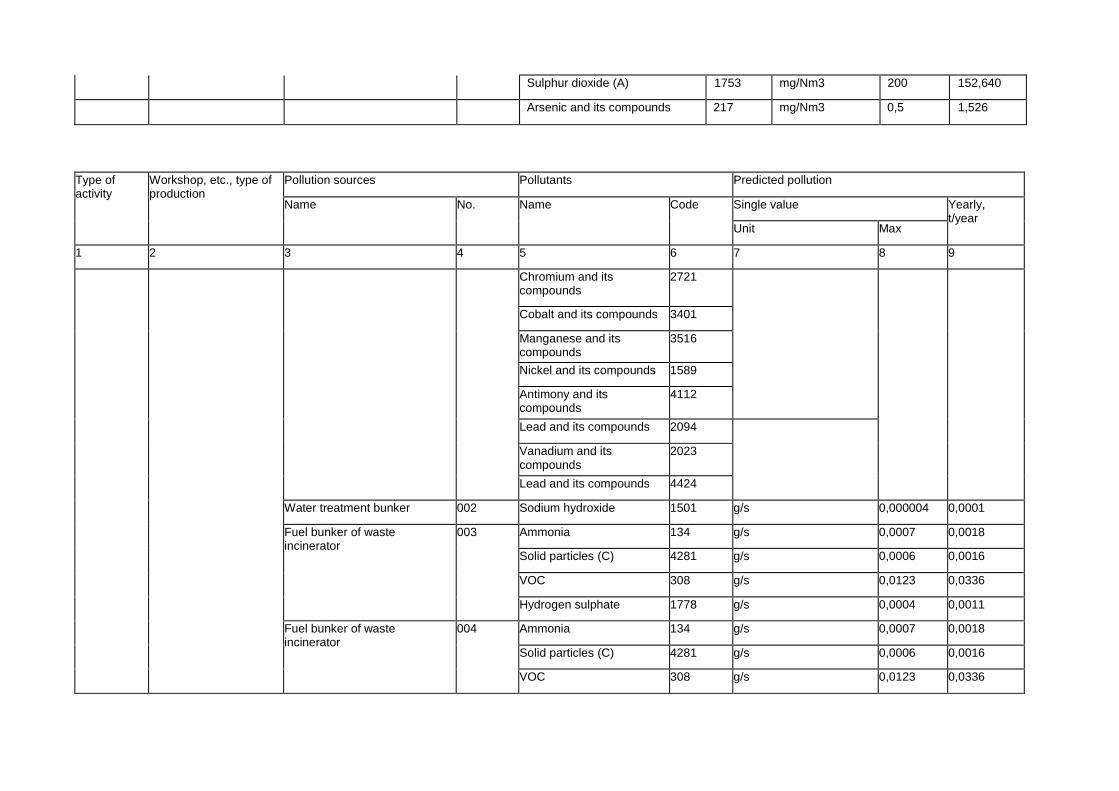
Sulphur dioxide (A) 1753 mg/Nm3 200 152,640
Arsenic and its compounds 217 mg/Nm3 0,5 1,526
Type of activity
Workshop, etc., type of production
Pollution sources Pollutants Predicted pollution
Name
No. Name Code Single value Yearly, t/year
Unit Max
1 2 3 4 5 6 7 8 9
Chromium and its compounds
2721
Cobalt and its compounds 3401
Manganese and its compounds
3516
Nickel and its compounds 1589
Antimony and its compounds
4112
Lead and its compounds 2094
Vanadium and its compounds
2023
Lead and its compounds 4424
Water treatment bunker 002 Sodium hydroxide 1501 g/s 0,000004 0,0001
Fuel bunker of waste incinerator
003 Ammonia 134 g/s 0,0007 0,0018
Solid particles (C) 4281 g/s 0,0006 0,0016
VOC 308 g/s 0,0123 0,0336
Hydrogen sulphate 1778 g/s 0,0004 0,0011
Fuel bunker of waste incinerator
004 Ammonia 134 g/s 0,0007 0,0018
Solid particles (C) 4281 g/s 0,0006 0,0016
VOC 308 g/s 0,0123 0,0336
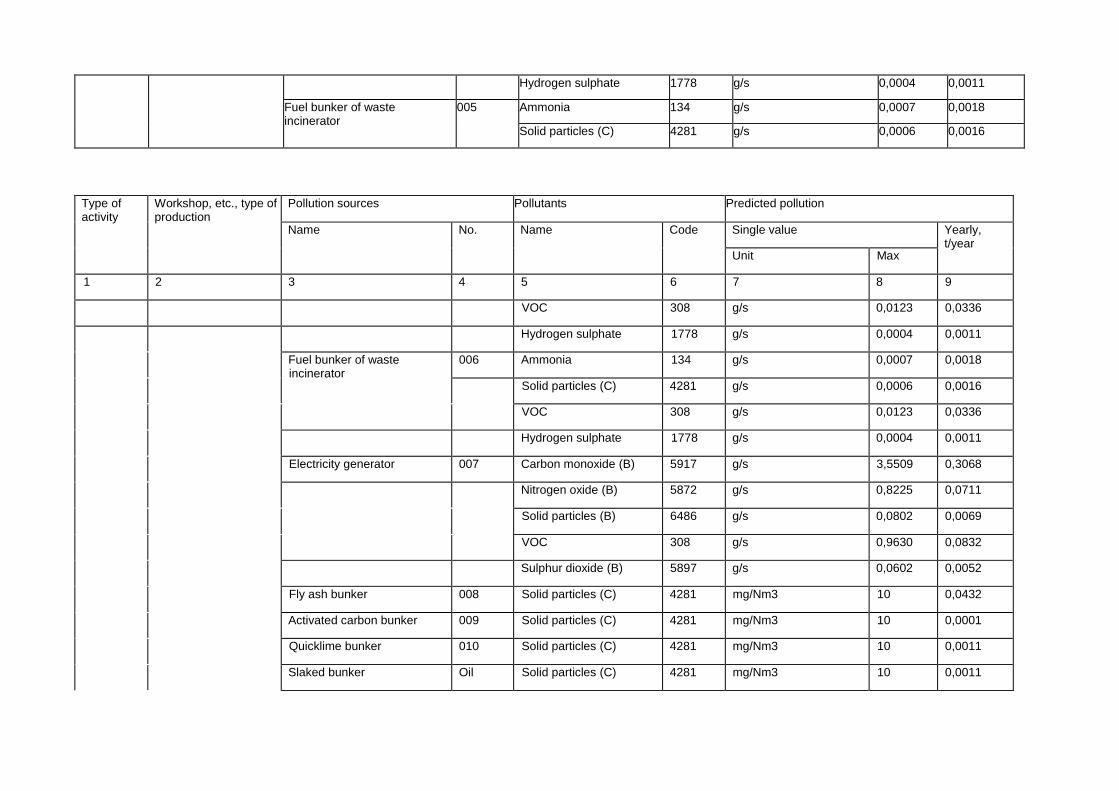
Hydrogen sulphate 1778 g/s 0,0004 0,0011
Fuel bunker of waste incinerator
005 Ammonia 134 g/s 0,0007 0,0018
Solid particles (C) 4281 g/s 0,0006 0,0016
Type of activity
Workshop, etc., type of production
Pollution sources Pollutants Predicted pollution
Name
No. Name Code Single value Yearly, t/year
Unit Max
1 2 3 4 5 6 7 8 9
VOC 308 g/s 0,0123 0,0336
Hydrogen sulphate 1778 g/s 0,0004 0,0011
Fuel bunker of waste incinerator
006 Ammonia 134 g/s 0,0007 0,0018
Solid particles (C) 4281 g/s 0,0006 0,0016
VOC 308 g/s 0,0123 0,0336
Hydrogen sulphate 1778 g/s 0,0004 0,0011
Electricity generator 007 Carbon monoxide (B) 5917 g/s 3,5509 0,3068
Nitrogen oxide (B) 5872 g/s 0,8225 0,0711
Solid particles (B) 6486 g/s 0,0802 0,0069
VOC 308 g/s 0,9630 0,0832
Sulphur dioxide (B) 5897 g/s 0,0602 0,0052
Fly ash bunker 008 Solid particles (C) 4281 mg/Nm3 10 0,0432
Activated carbon bunker 009 Solid particles (C) 4281 mg/Nm3 10 0,0001
Quicklime bunker 010 Solid particles (C) 4281 mg/Nm3 10 0,0011
Slaked bunker Oil Solid particles (C) 4281 mg/Nm3 10 0,0011
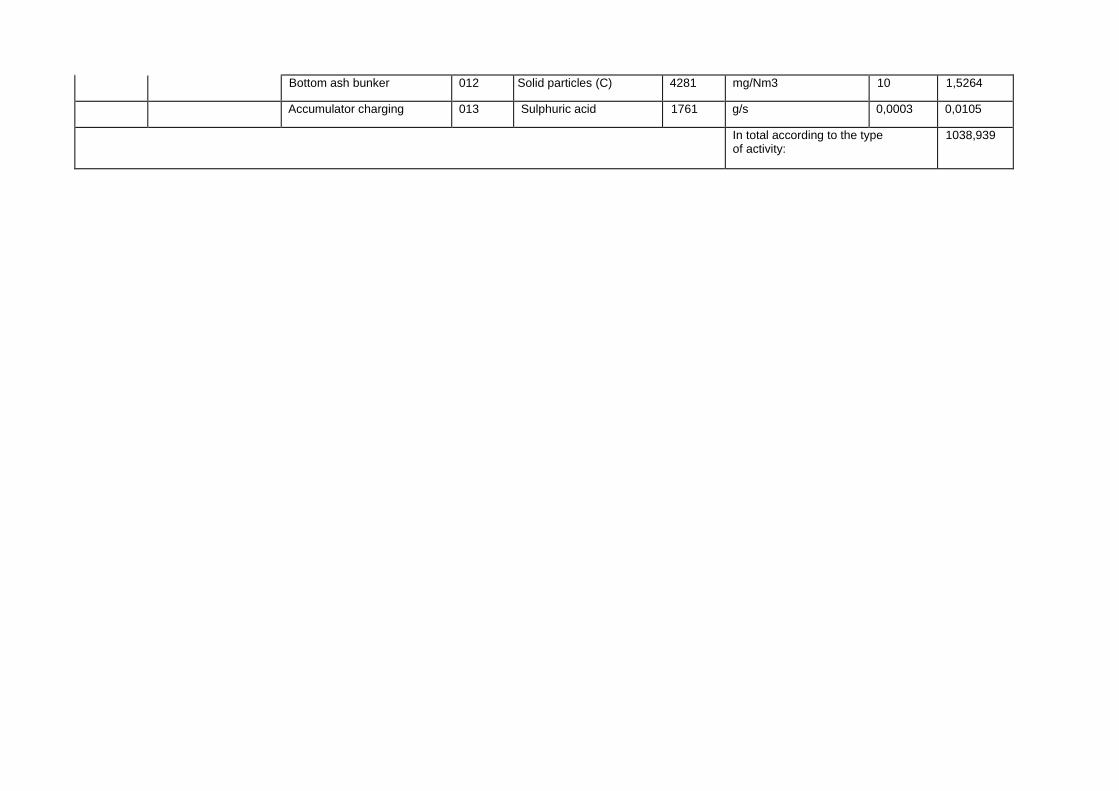
Bottom ash bunker 012 Solid particles (C) 4281 mg/Nm3 10 1,5264
Accumulator charging 013 Sulphuric acid 1761 g/s 0,0003 0,0105
In total according to the type of activity:
1038,939
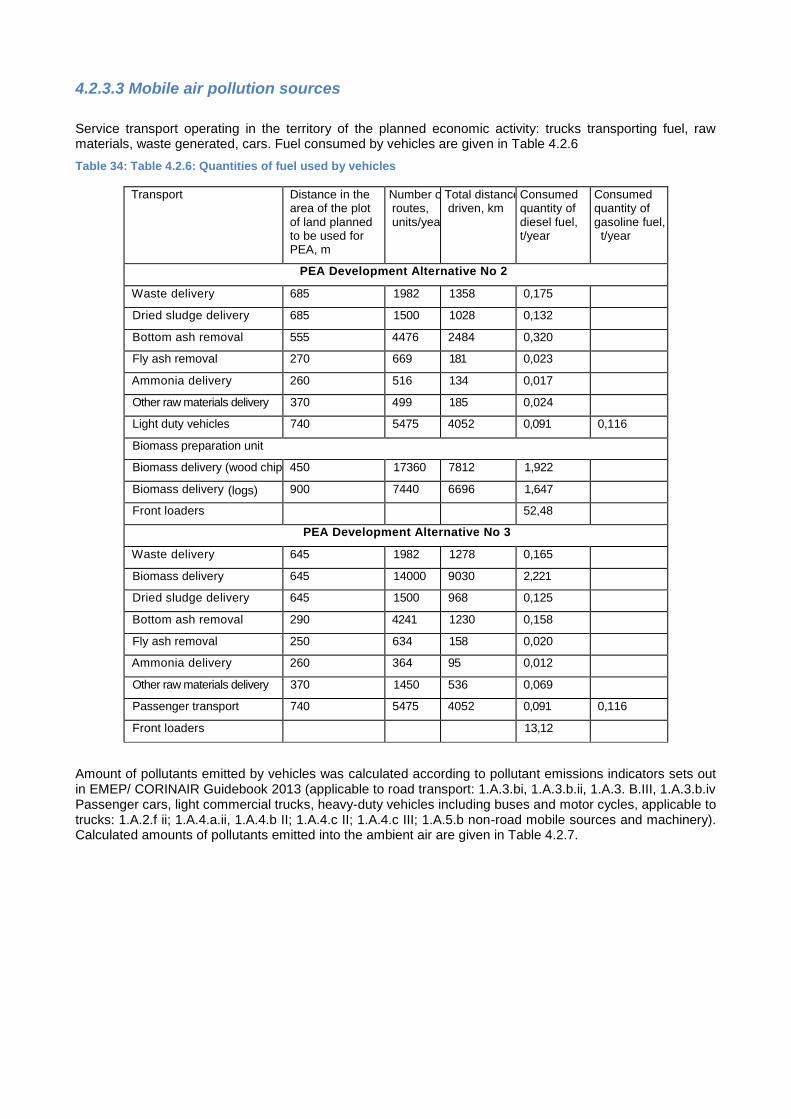
4.2.3.3 Mobile air pollution sources
Service transport operating in the territory of the planned economic activity: trucks transporting fuel, raw materials, waste generated, cars. Fuel consumed by vehicles are given in Table 4.2.6
Table 34: Table 4.2.6: Quantities of fuel used by vehicles
Transport Distance in the area of the plot of land planned to be used for PEA, m
Number of routes, units/year
Total distance driven, km
Consumed quantity of diesel fuel, t/year
Consumed quantity of gasoline fuel, t/year
PEA Development Alternative No 2
Waste delivery 685 1982 1358 0,175
Dried sludge delivery 685 1500 1028 0,132
Bottom ash removal 555 4476 2484 0,320
Fly ash removal 270 669 181 0,023
Ammonia delivery 260 516 134 0,017
Other raw materials delivery 370 499 185 0,024
Light duty vehicles 740 5475 4052 0,091 0,116
Biomass preparation unit
Biomass delivery (wood chips) 450 17360 7812 1,922
Biomass delivery (logs) 900 7440 6696 1,647
Front loaders 52,48
PEA Development Alternative No 3
Waste delivery 645 1982 1278 0,165
Biomass delivery 645 14000 9030 2,221
Dried sludge delivery 645 1500 968 0,125
Bottom ash removal 290 4241 1230 0,158
Fly ash removal 250 634 158 0,020
Ammonia delivery 260 364 95 0,012
Other raw materials delivery 370 1450 536 0,069
Passenger transport 740 5475 4052 0,091 0,116
Front loaders 13,12
Amount of pollutants emitted by vehicles was calculated according to pollutant emissions indicators sets out in EMEP/ CORINAIR Guidebook 2013 (applicable to road transport: 1.A.3.bi, 1.A.3.b.ii, 1.A.3. B.III, 1.A.3.b.iv Passenger cars, light commercial trucks, heavy-duty vehicles including buses and motor cycles, applicable to trucks: 1.A.2.f ii; 1.A.4.a.ii, 1.A.4.b II; 1.A.4.c II; 1.A.4.c III; 1.A.5.b non-road mobile sources and machinery). Calculated amounts of pollutants emitted into the ambient air are given in Table 4.2.7.
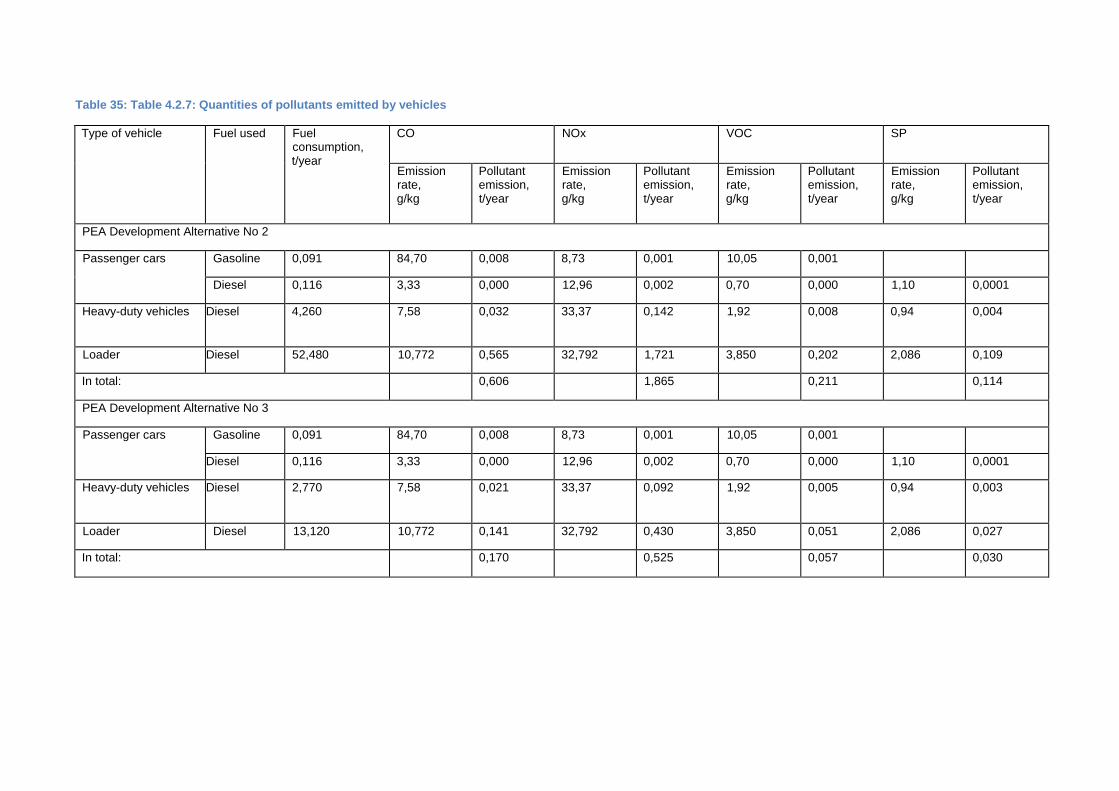
Table 35: Table 4.2.7: Quantities of pollutants emitted by vehicles
Type of vehicle
Fuel used Fuel consumption, t/year
CO NOx VOC SP
Emission rate, g/kg
Pollutant emission, t/year
Emission rate, g/kg
Pollutant emission, t/year
Emission rate, g/kg
Pollutant emission, t/year
Emission rate, g/kg
Pollutant emission, t/year
PEA Development Alternative No 2
Passenger cars Gasoline 0,091 84,70 0,008 8,73 0,001 10,05 0,001
Diesel 0,116 3,33 0,000 12,96 0,002 0,70 0,000 1,10 0,0001
Heavy-duty vehicles Diesel 4,260 7,58 0,032 33,37 0,142 1,92 0,008 0,94 0,004
Loader Diesel 52,480 10,772 0,565 32,792 1,721 3,850 0,202 2,086 0,109
In total: 0,606 1,865 0,211 0,114
PEA Development Alternative No 3
Passenger cars Gasoline 0,091 84,70 0,008 8,73 0,001 10,05 0,001
Diesel 0,116 3,33 0,000 12,96 0,002 0,70 0,000 1,10 0,0001
Heavy-duty vehicles Diesel 2,770 7,58 0,021 33,37 0,092 1,92 0,005 0,94 0,003
Loader Diesel 13,120 10,772 0,141 32,792 0,430 3,850 0,051 2,086 0,027
In total: 0,170 0,525 0,057 0,030
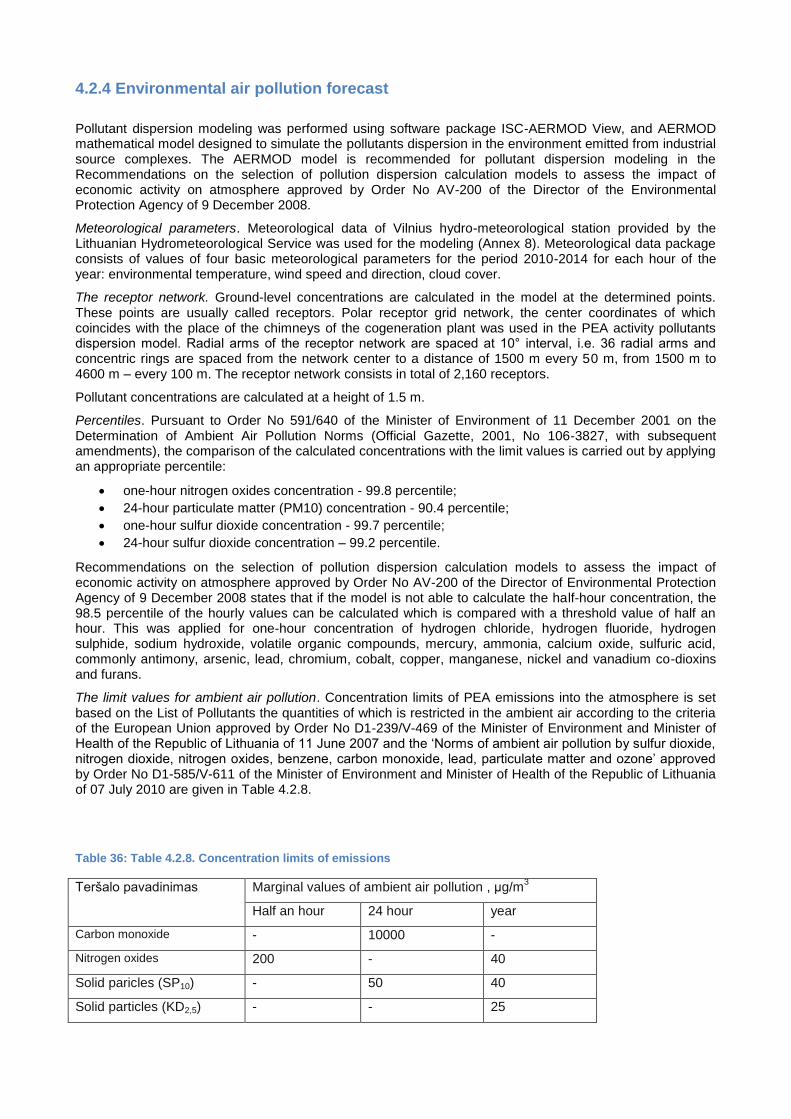
4.2.4 Environmental air pollution forecast
Pollutant dispersion modeling was performed using software package ISC-AERMOD View, and AERMOD mathematical model designed to simulate the pollutants dispersion in the environment emitted from industrial source complexes. The AERMOD model is recommended for pollutant dispersion modeling in the Recommendations on the selection of pollution dispersion calculation models to assess the impact of economic activity on atmosphere approved by Order No AV-200 of the Director of the Environmental Protection Agency of 9 December 2008.
Meteorological parameters. Meteorological data of Vilnius hydro-meteorological station provided by the Lithuanian Hydrometeorological Service was used for the modeling (Annex 8). Meteorological data package consists of values of four basic meteorological parameters for the period 2010-2014 for each hour of the year: environmental temperature, wind speed and direction, cloud cover.
The receptor network. Ground-level concentrations are calculated in the model at the determined points. These points are usually called receptors. Polar receptor grid network, the center coordinates of which coincides with the place of the chimneys of the cogeneration plant was used in the PEA activity pollutants dispersion model. Radial arms of the receptor network are spaced at 10° interval, i.e. 36 radial arms and concentric rings are spaced from the network center to a distance of 1500 m every 50 m, from 1500 m to 4600 m – every 100 m. The receptor network consists in total of 2,160 receptors.
Pollutant concentrations are calculated at a height of 1.5 m.
Percentiles. Pursuant to Order No 591/640 of the Minister of Environment of 11 December 2001 on the Determination of Ambient Air Pollution Norms (Official Gazette, 2001, No 106-3827, with subsequent amendments), the comparison of the calculated concentrations with the limit values is carried out by applying an appropriate percentile:
one-hour nitrogen oxides concentration - 99.8 percentile;
24-hour particulate matter (PM10) concentration - 90.4 percentile;
one-hour sulfur dioxide concentration - 99.7 percentile;
24-hour sulfur dioxide concentration – 99.2 percentile.
Recommendations on the selection of pollution dispersion calculation models to assess the impact of economic activity on atmosphere approved by Order No AV-200 of the Director of Environmental Protection Agency of 9 December 2008 states that if the model is not able to calculate the half-hour concentration, the 98.5 percentile of the hourly values can be calculated which is compared with a threshold value of half an hour. This was applied for one-hour concentration of hydrogen chloride, hydrogen fluoride, hydrogen sulphide, sodium hydroxide, volatile organic compounds, mercury, ammonia, calcium oxide, sulfuric acid, commonly antimony, arsenic, lead, chromium, cobalt, copper, manganese, nickel and vanadium co-dioxins and furans.
The limit values for ambient air pollution. Concentration limits of PEA emissions into the atmosphere is set based on the List of Pollutants the quantities of which is restricted in the ambient air according to the criteria of the European Union approved by Order No D1-239/V-469 of the Minister of Environment and Minister of Health of the Republic of Lithuania of 11 June 2007 and the ‘Norms of ambient air pollution by sulfur dioxide, nitrogen dioxide, nitrogen oxides, benzene, carbon monoxide, lead, particulate matter and ozone’ approved by Order No D1-585/V-611 of the Minister of Environment and Minister of Health of the Republic of Lithuania of 07 July 2010 are given in Table 4.2.8.
Table 36: Table 4.2.8. Concentration limits of emissions
Teršalo pavadinimas Marginal values of ambient air pollution , µg/m3
Half an hour 24 hour year
Carbon monoxide - 10000
-
Nitrogen oxides 200
- 40
Solid paricles (SP10) - 50
40
Solid particles (KD2,5) - - 25
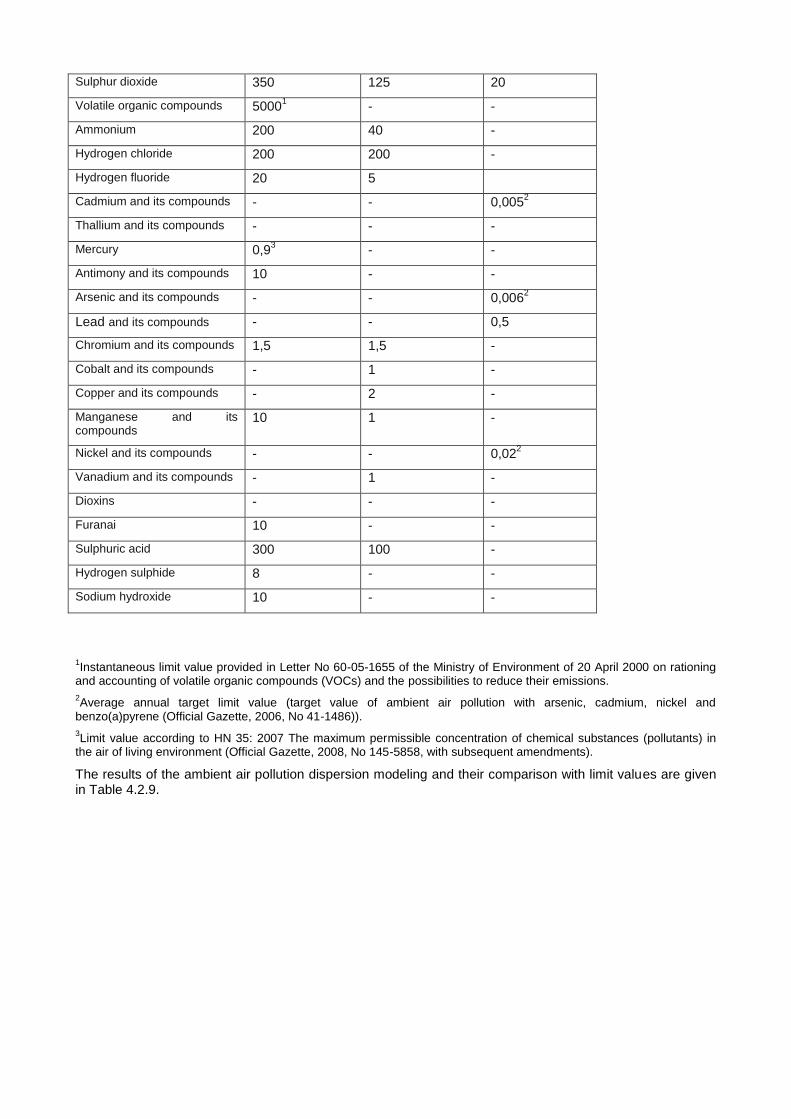
Sulphur dioxide 350
125
20
Volatile organic compounds 50001
- -
Ammonium 200 40 -
Hydrogen chloride 200 200 -
Hydrogen fluoride 20 5
Cadmium and its compounds - - 0,0052
Thallium and its compounds - - -
Mercury 0,93
- -
Antimony and its compounds 10 - -
Arsenic and its compounds - - 0,0062
Lead and its compounds - - 0,5
Chromium and its compounds 1,5 1,5 -
Cobalt and its compounds - 1 -
Copper and its compounds - 2 -
Manganese and its compounds
10 1 -
Nickel and its compounds - - 0,022
Vanadium and its compounds - 1 -
Dioxins - - -
Furanai 10 - -
Sulphuric acid 300 100 -
Hydrogen sulphide 8 - -
Sodium hydroxide 10 - -
1Instantaneous limit value provided in Letter No 60-05-1655 of the Ministry of Environment of 20 April 2000 on rationing
and accounting of volatile organic compounds (VOCs) and the possibilities to reduce their emissions.
2Average annual target limit value (target value of ambient air pollution with arsenic, cadmium, nickel and
benzo(a)pyrene (Official Gazette, 2006, No 41-1486)).
3Limit value according to HN 35: 2007 The maximum permissible concentration of chemical substances (pollutants) in
the air of living environment (Official Gazette, 2008, No 145-5858, with subsequent amendments).
The results of the ambient air pollution dispersion modeling and their comparison with limit values are given in Table 4.2.9.
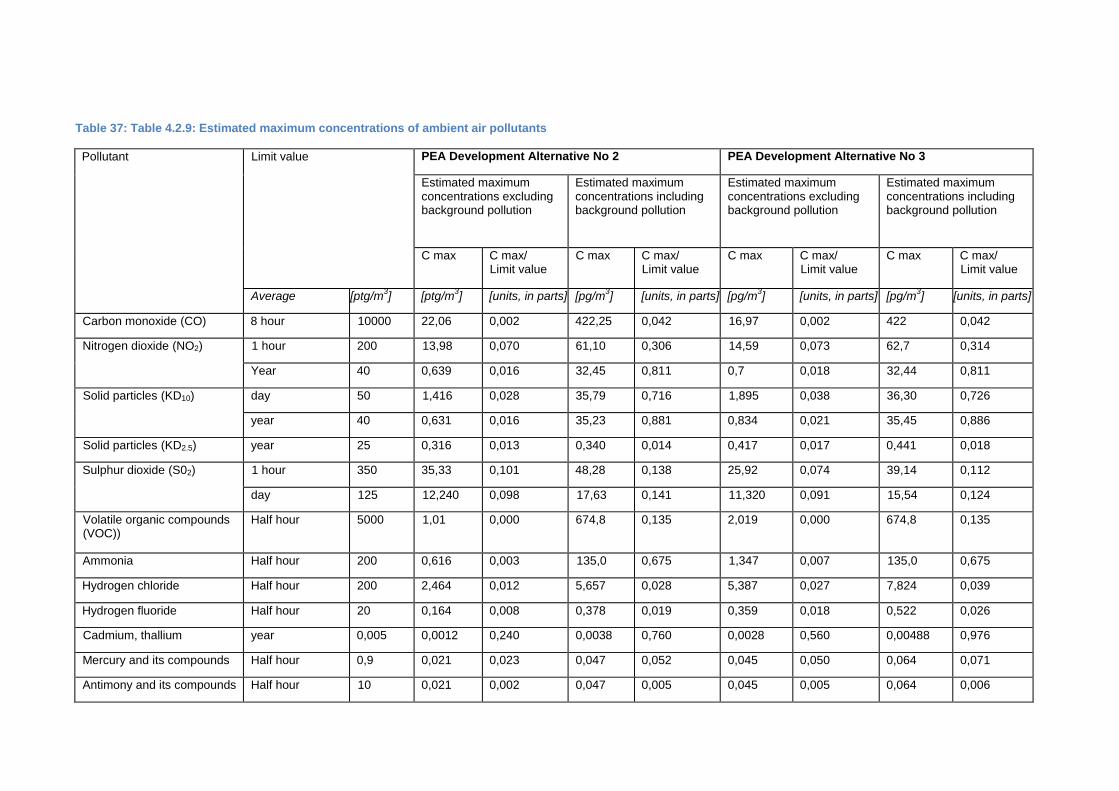
Table 37: Table 4.2.9: Estimated maximum concentrations of ambient air pollutants
Pollutant
Limit value PEA Development Alternative No 2 PEA Development Alternative No 3
Estimated maximum concentrations excluding background pollution
Estimated maximum concentrations including background pollution
Estimated maximum concentrations excluding background pollution
Estimated maximum concentrations including background pollution
C max C max/ Limit value
C max C max/ Limit value
C max C max/ Limit value
C max C max/ Limit value
Average [ptg/m3] [ptg/m
3] [units, in parts] [pg/m
3] [units, in parts] [pg/m
3] [units, in parts] [pg/m
3] [units, in parts]
Carbon monoxide (CO) 8 hour 10000 22,06 0,002 422,25 0,042 16,97 0,002 422 0,042
Nitrogen dioxide (NO2) 1 hour 200 13,98 0,070 61,10 0,306 14,59 0,073 62,7 0,314
Year 40 0,639 0,016 32,45 0,811 0,7 0,018 32,44 0,811
Solid particles (KD10) day 50 1,416 0,028 35,79 0,716 1,895 0,038 36,30 0,726
year 40 0,631 0,016 35,23 0,881 0,834 0,021 35,45 0,886
Solid particles (KD2.5) year 25 0,316 0,013 0,340 0,014 0,417 0,017 0,441 0,018
Sulphur dioxide (S02) 1 hour 350 35,33 0,101 48,28 0,138 25,92 0,074 39,14 0,112
day 125 12,240 0,098 17,63 0,141 11,320 0,091 15,54 0,124
Volatile organic compounds (VOC))
Half hour 5000 1,01 0,000 674,8 0,135 2,019 0,000 674,8 0,135
Ammonia Half hour 200 0,616 0,003 135,0 0,675 1,347 0,007 135,0 0,675
Hydrogen chloride Half hour 200 2,464 0,012 5,657 0,028 5,387 0,027 7,824 0,039
Hydrogen fluoride Half hour 20 0,164 0,008 0,378 0,019 0,359 0,018 0,522 0,026
Cadmium, thallium year 0,005 0,0012 0,240 0,0038 0,760 0,0028 0,560 0,00488 0,976
Mercury and its compounds Half hour 0,9 0,021 0,023 0,047 0,052 0,045 0,050 0,064 0,071
Antimony and its compounds Half hour 10 0,021 0,002 0,047 0,005 0,045 0,005 0,064 0,006
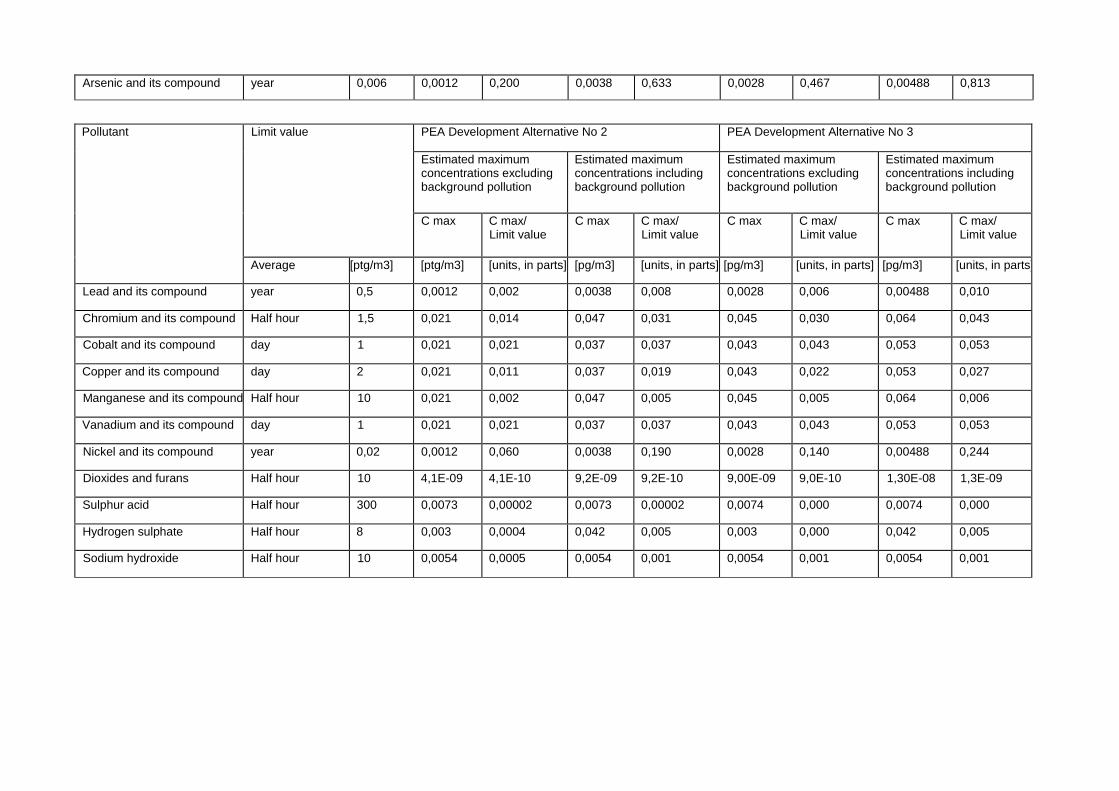
Arsenic and its compound year 0,006 0,0012 0,200 0,0038 0,633 0,0028 0,467 0,00488 0,813
Pollutant
Limit value PEA Development Alternative No 2 PEA Development Alternative No 3
Estimated maximum concentrations excluding background pollution
Estimated maximum concentrations including background pollution
Estimated maximum concentrations excluding background pollution
Estimated maximum concentrations including background pollution
C max C max/ Limit value
C max C max/ Limit value
C max C max/ Limit value
C max C max/ Limit value
Average [ptg/m3] [ptg/m3] [units, in parts] [pg/m3] [units, in parts] [pg/m3] [units, in parts] [pg/m3] [units, in parts]
Lead and its compound year 0,5 0,0012 0,002 0,0038 0,008 0,0028 0,006 0,00488 0,010
Chromium and its compound Half hour 1,5 0,021 0,014 0,047 0,031 0,045 0,030 0,064 0,043
Cobalt and its compound day 1 0,021 0,021 0,037 0,037 0,043 0,043 0,053 0,053
Copper and its compound day 2 0,021 0,011 0,037 0,019 0,043 0,022 0,053 0,027
Manganese and its compound Half hour 10 0,021 0,002 0,047 0,005 0,045 0,005 0,064 0,006
Vanadium and its compound day 1 0,021 0,021 0,037 0,037 0,043 0,043 0,053 0,053
Nickel and its compound year 0,02 0,0012 0,060 0,0038 0,190 0,0028 0,140 0,00488 0,244
Dioxides and furans Half hour 10 4,1E-09 4,1E-10 9,2E-09 9,2E-10 9,00E-09 9,0E-10 1,30E-08 1,3E-09
Sulphur acid Half hour 300 0,0073 0,00002 0,0073 0,00002 0,0074 0,000 0,0074 0,000
Hydrogen sulphate Half hour 8 0,003 0,0004 0,042 0,005 0,003 0,000 0,042 0,005
Sodium hydroxide Half hour 10 0,0054 0,0005 0,0054 0,001 0,0054 0,001 0,0054 0,001
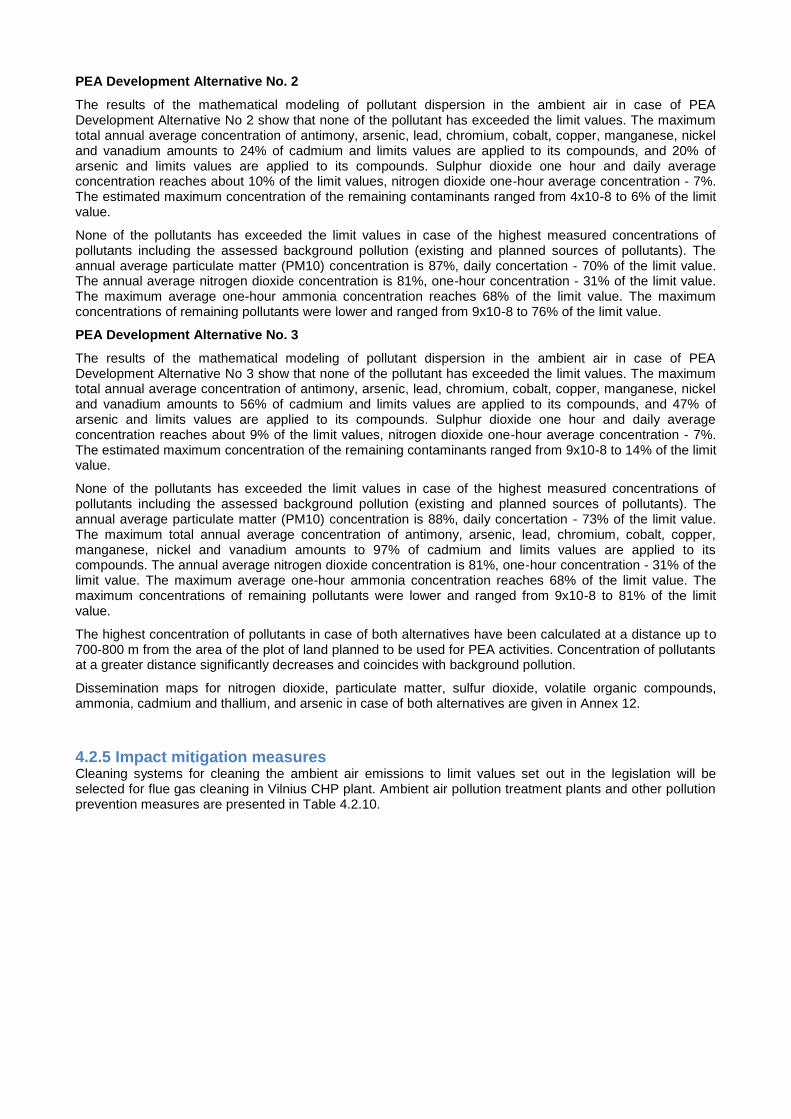
PEA Development Alternative No. 2
The results of the mathematical modeling of pollutant dispersion in the ambient air in case of PEA Development Alternative No 2 show that none of the pollutant has exceeded the limit values. The maximum total annual average concentration of antimony, arsenic, lead, chromium, cobalt, copper, manganese, nickel and vanadium amounts to 24% of cadmium and limits values are applied to its compounds, and 20% of arsenic and limits values are applied to its compounds. Sulphur dioxide one hour and daily average concentration reaches about 10% of the limit values, nitrogen dioxide one-hour average concentration - 7%. The estimated maximum concentration of the remaining contaminants ranged from 4x10⁻⁸ to 6% of the limit value.
None of the pollutants has exceeded the limit values in case of the highest measured concentrations of pollutants including the assessed background pollution (existing and planned sources of pollutants). The annual average particulate matter (PM10) concentration is 87%, daily concertation - 70% of the limit value. The annual average nitrogen dioxide concentration is 81%, one-hour concentration - 31% of the limit value. The maximum average one-hour ammonia concentration reaches 68% of the limit value. The maximum concentrations of remaining pollutants were lower and ranged from 9x10⁻⁸ to 76% of the limit value.
PEA Development Alternative No. 3
The results of the mathematical modeling of pollutant dispersion in the ambient air in case of PEA Development Alternative No 3 show that none of the pollutant has exceeded the limit values. The maximum total annual average concentration of antimony, arsenic, lead, chromium, cobalt, copper, manganese, nickel and vanadium amounts to 56% of cadmium and limits values are applied to its compounds, and 47% of arsenic and limits values are applied to its compounds. Sulphur dioxide one hour and daily average concentration reaches about 9% of the limit values, nitrogen dioxide one-hour average concentration - 7%. The estimated maximum concentration of the remaining contaminants ranged from 9x10⁻⁸ to 14% of the limit value.
None of the pollutants has exceeded the limit values in case of the highest measured concentrations of pollutants including the assessed background pollution (existing and planned sources of pollutants). The annual average particulate matter (PM10) concentration is 88%, daily concertation - 73% of the limit value. The maximum total annual average concentration of antimony, arsenic, lead, chromium, cobalt, copper, manganese, nickel and vanadium amounts to 97% of cadmium and limits values are applied to its compounds. The annual average nitrogen dioxide concentration is 81%, one-hour concentration - 31% of the limit value. The maximum average one-hour ammonia concentration reaches 68% of the limit value. The maximum concentrations of remaining pollutants were lower and ranged from 9x10⁻⁸ to 81% of the limit value.
The highest concentration of pollutants in case of both alternatives have been calculated at a distance up to 700-800 m from the area of the plot of land planned to be used for PEA activities. Concentration of pollutants at a greater distance significantly decreases and coincides with background pollution.
Dissemination maps for nitrogen dioxide, particulate matter, sulfur dioxide, volatile organic compounds, ammonia, cadmium and thallium, and arsenic in case of both alternatives are given in Annex 12.
4.2.5 Impact mitigation measures Cleaning systems for cleaning the ambient air emissions to limit values set out in the legislation will be selected for flue gas cleaning in Vilnius CHP plant. Ambient air pollution treatment plants and other pollution prevention measures are presented in Table 4.2.10.
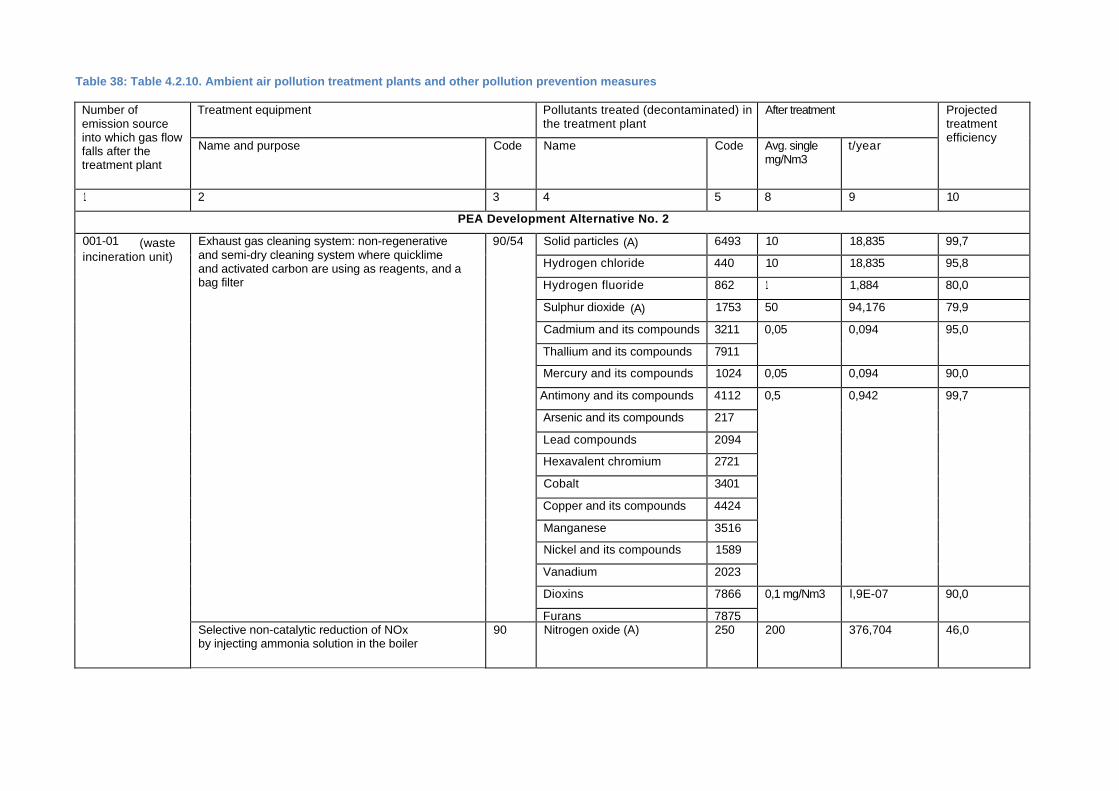
Table 38: Table 4.2.10. Ambient air pollution treatment plants and other pollution prevention measures
Number of emission source into which gas flow falls after the treatment plant
Treatment equipment Pollutants treated (decontaminated) in the treatment plant
After treatment Projected treatment efficiency
Name and purpose Code Name Code Avg. single mg/Nm3
t/year
1 2 3 4 5 8 9 10
PEA Development Alternative No. 2
001-01 (waste incineration unit)
Exhaust gas cleaning system: non-regenerative and semi-dry cleaning system where quicklime and activated carbon are using as reagents, and a bag filter
90/54 Solid particles (A) 6493 10 18,835 99,7
Hydrogen chloride 440 10 18,835 95,8
Hydrogen fluoride 862 1 1,884 80,0
Sulphur dioxide (A) 1753 50 94,176 79,9
Cadmium and its compounds 3211 0,05 0,094 95,0
Thallium and its compounds 7911
Mercury and its compounds 1024 0,05 0,094 90,0
Antimony and its compounds 4112 0,5 0,942 99,7
Arsenic and its compounds 217
Lead compounds 2094
Hexavalent chromium 2721
Cobalt 3401
Copper and its compounds 4424
Manganese 3516
Nickel and its compounds 1589
Vanadium 2023
Dioxins 7866 0,1 mg/Nm3 l,9E-07 90,0
Furans 7875 Selective non-catalytic reduction of NOx by injecting ammonia solution in the boiler
90 Nitrogen oxide (A) 250 200 376,704 46,0

Number of emission source into which gas flow falls after the treatment plant
Treatment equipment Pollutants treated (decontaminated) in the treatment plant
After treatment Projected treatment efficiency Name and purpose Code Name Code Avg. single
mg/Nm3 t/year
1 2 3 4 5 8 9 10
001-02 (biomass- fired unit)
Electrostat ic f i l ter or dry c leaning equipment
56 solid particles (A) 6493 20 81,514 99,0
003 Double cleaning equipment (synthetic filter + activated carbon)
56 ammonia 134 0,00066 g/s 0,002 99
solid particles (C) 4281 0,0006 g/s 0,002
VOC 308 0,01227 g/s 0,034
hydrogen sulphate 1778 0,00039 g/s 0,001
004 Double cleaning equipment (synthetic filter + activated carbon)
56 ammonia 134 0,00066 g/s 0,002 99
solid particles (C) 4281 0,0006 g/s 0,002
VOC 308 0,01227 g/s 0,034
hydrogen sulphate 1778 0,00039 g/s 0,001
005 Double cleaning equipment (synthetic filter + activated carbon)
56 ammonia 134 0,00066 g/s 0,002 99
solid particles (C) 4281 0,0006 g/s 0,002
VOC 308 0,01227 g/s 0,034
hydrogen sulphate 1778 0,00039 g/s 0,001
006 Double cleaning equipment (synthetic filter + activated carbon)
56 ammonia 134 0,00066 g/s 0,002 99
solid particles (C) 4281 0,0006 g/s 0,002
VOC 308 0,01227 g/s 0,034
hydrogen sulphate 1778 0,00039 g/s 0,001
008 filter 56 solid particles (C) 4281 10 0,043 99
009 filter 56 solid particles (C) 4281 10 0,0001 99
010 filter 56 solid particles (C) 4281 10 0,001 99
Oil filter 56 solid particles (C) 4281 10 0,001 99
012 filter 56 solid particles (C) 4281 10 1,526 99
Number of emission source
into which gas flow
falls after the
treatment plant
Treatment equipment Pollutants treated (decontaminated) in the treatment plant
After treatment Projected treatment
efficiency Name and purpose Code Name Code Avg. single mg/Nm3
t/year
1 2 3 4 5 8 9 10
013 filter 60 solid particles (C) 4281 10 0,326 99
014 filter 61 solid particles (C) 4281 10 0,653 99
015 filter 62 solid particles (C) 4281 10 0,218 99
016 filter 63 solid particles (C) 4281 10 0,218 99
PEA Development Alternative No 3
001 Exhaust gas cleaning device: non-regenerative half dry cleaning device, using quicklime and activated carbon as reagents and bag filter
90/54 solid particles (A) 6493 10 30,528 99,7
hydrogen chloride 440 10 30,528 95,8
hydrogen fluoride 862 1 3,0528 80,0
Sulphur dioxide (A) 1753 50 152,64 79,9
cadmium and its compounds 3211 0,05 0,153 95,0
thallium and its compounds 7911
mercury and its compounds 1024 0,05 0,153 90,0
antimony and its compounds 4112 0,5 1,526 99,7
arsenic and its compounds 217
Lead compounds 2094
hexavalent chromium 2721
cobalt 3401
copper and its compounds 4424
manganese 3516
Nickel and its compounds 1589
vanadium 2023
dioxins 7866 0,1 mg/Nm3 3,05-07 90,0
furans 7875
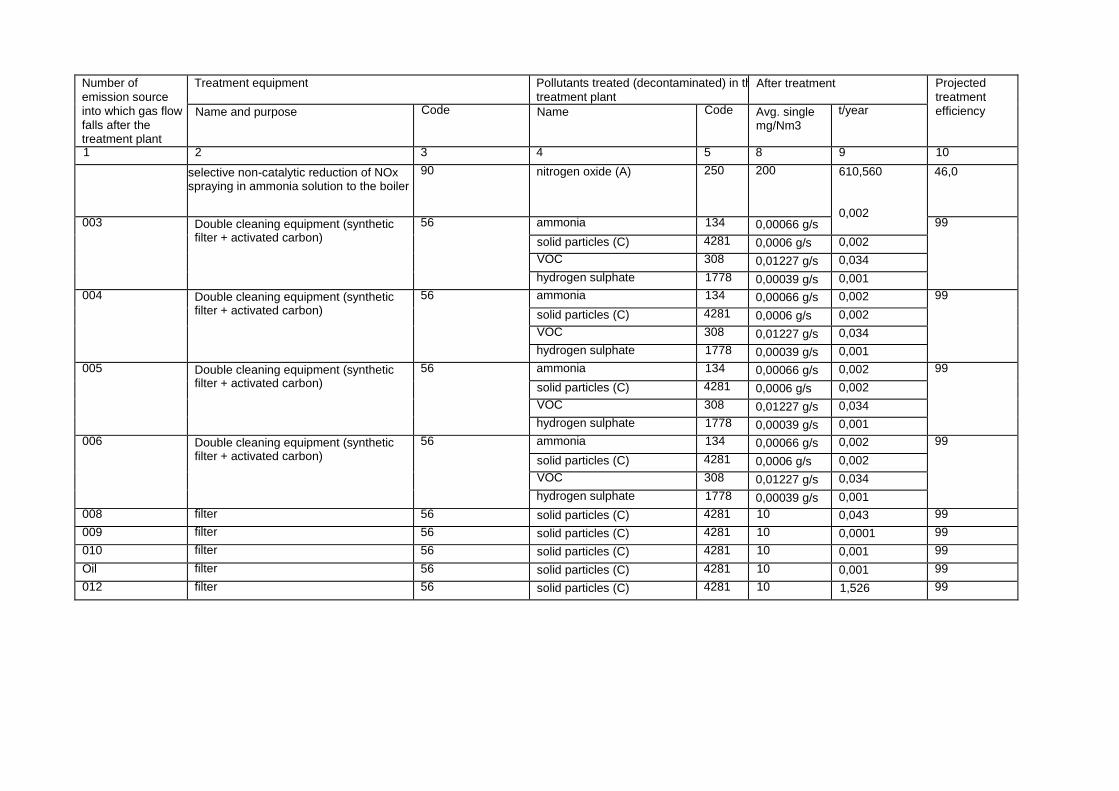
Number of
emission source
into which gas flow
falls after the treatment plant
Treatment equipment Pollutants treated (decontaminated) in the
treatment plant After treatment Projected
treatment
efficiency Name and purpose Code Name Code Avg. single mg/Nm3
t/year
1 2 3 4 5 8 9 10
selective non-catalytic reduction of NOx spraying in ammonia solution to the boiler
90 nitrogen oxide (A) 250 200 610,560
0,002
46,0
003 Double cleaning equipment (synthetic filter + activated carbon)
56 ammonia 134 0,00066 g/s 99
solid particles (C) 4281 0,0006 g/s 0,002
VOC 308 0,01227 g/s 0,034
hydrogen sulphate 1778 0,00039 g/s 0,001
004 Double cleaning equipment (synthetic filter + activated carbon)
56 ammonia 134 0,00066 g/s 0,002 99
solid particles (C) 4281 0,0006 g/s 0,002
VOC 308 0,01227 g/s 0,034
hydrogen sulphate 1778 0,00039 g/s 0,001
005 Double cleaning equipment (synthetic filter + activated carbon)
56 ammonia 134 0,00066 g/s 0,002 99
solid particles (C) 4281 0,0006 g/s 0,002
VOC 308 0,01227 g/s 0,034
hydrogen sulphate 1778 0,00039 g/s 0,001
006 Double cleaning equipment (synthetic filter + activated carbon)
56 ammonia 134 0,00066 g/s 0,002 99
solid particles (C) 4281 0,0006 g/s 0,002
VOC 308 0,01227 g/s 0,034
hydrogen sulphate 1778 0,00039 g/s 0,001
008 filter 56 solid particles (C) 4281 10 0,043 99
009 filter 56 solid particles (C) 4281 10 0,0001 99
010 filter 56 solid particles (C) 4281 10 0,001 99
Oil filter 56 solid particles (C) 4281 10 0,001 99
012 filter 56 solid particles (C) 4281 10 1,526 99
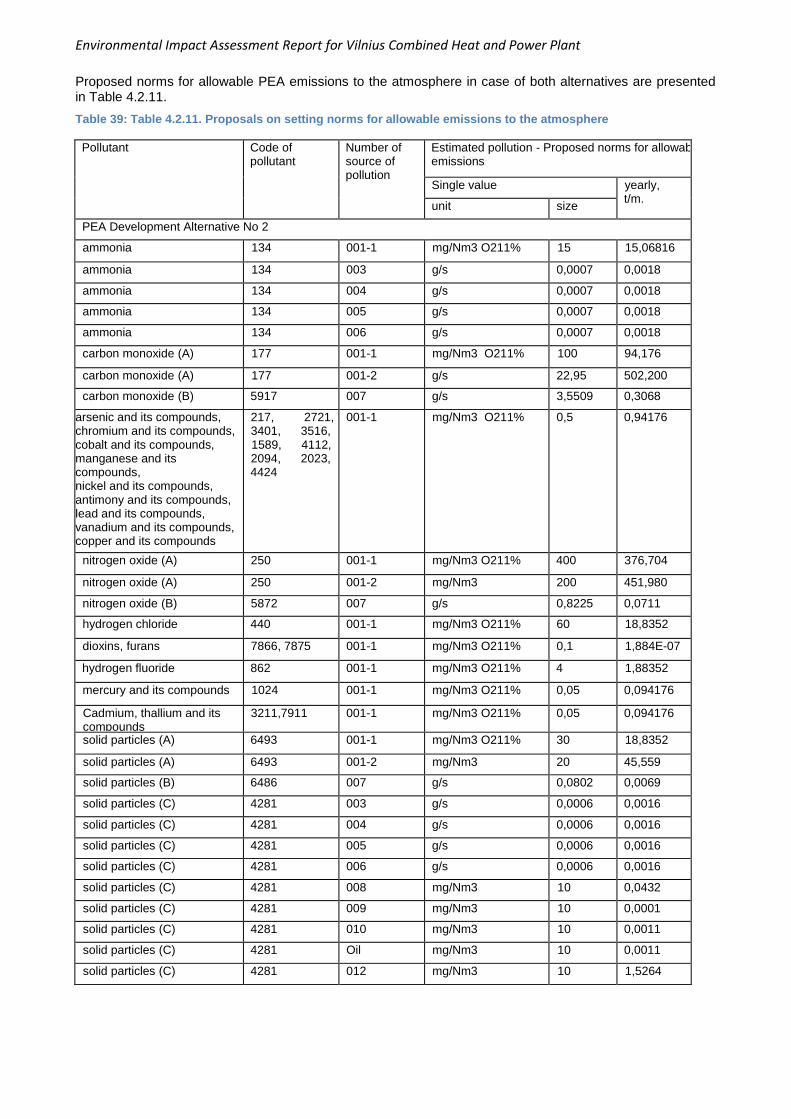
Environmental Impact Assessment Report for Vilnius Combined Heat and Power Plant
Proposed norms for allowable PEA emissions to the atmosphere in case of both alternatives are presented in Table 4.2.11.
Table 39: Table 4.2.11. Proposals on setting norms for allowable emissions to the atmosphere
Pollutant Code of pollutant
Number of source of pollution
Estimated pollution - Proposed norms for allowable emissions
Single value yearly, t/m.
unit size
PEA Development Alternative No 2
ammonia 134 001-1 mg/Nm3 O211% 15 15,06816
ammonia 134 003 g/s 0,0007 0,0018
ammonia 134 004 g/s 0,0007 0,0018
ammonia 134 005 g/s 0,0007 0,0018
ammonia 134 006 g/s 0,0007 0,0018
carbon monoxide (A) 177 001-1 mg/Nm3 O211% 100 94,176
carbon monoxide (A) 177 001-2 g/s 22,95 502,200
carbon monoxide (B) 5917 007 g/s 3,5509 0,3068
arsenic and its compounds, chromium and its compounds, cobalt and its compounds, manganese and its compounds, nickel and its compounds, antimony and its compounds, lead and its compounds, vanadium and its compounds, copper and its compounds
217, 2721, 3401, 3516, 1589, 4112, 2094, 2023, 4424
001-1 mg/Nm3 O211% 0,5 0,94176
nitrogen oxide (A) 250 001-1 mg/Nm3 O211% 400 376,704
nitrogen oxide (A) 250 001-2 mg/Nm3 200 451,980
nitrogen oxide (B) 5872 007 g/s 0,8225 0,0711
hydrogen chloride 440 001-1 mg/Nm3 O211% 60 18,8352
dioxins, furans 7866, 7875 001-1 mg/Nm3 O211% 0,1 1,884E-07
hydrogen fluoride 862 001-1 mg/Nm3 O211% 4 1,88352
mercury and its compounds 1024 001-1 mg/Nm3 O211% 0,05 0,094176
Cadmium, thallium and its compounds
3211,7911 001-1 mg/Nm3 O211% 0,05 0,094176
solid particles (A) 6493 001-1 mg/Nm3 O211% 30 18,8352
solid particles (A) 6493 001-2 mg/Nm3 20 45,559
solid particles (B) 6486 007 g/s 0,0802 0,0069
solid particles (C) 4281 003 g/s 0,0006 0,0016
solid particles (C) 4281 004 g/s 0,0006 0,0016
solid particles (C) 4281 005 g/s 0,0006 0,0016
solid particles (C) 4281 006 g/s 0,0006 0,0016
solid particles (C) 4281 008 mg/Nm3 10 0,0432
solid particles (C) 4281 009 mg/Nm3 10 0,0001
solid particles (C) 4281 010 mg/Nm3 10 0,0011
solid particles (C) 4281 Oil mg/Nm3 10 0,0011
solid particles (C) 4281 012 mg/Nm3 10 1,5264
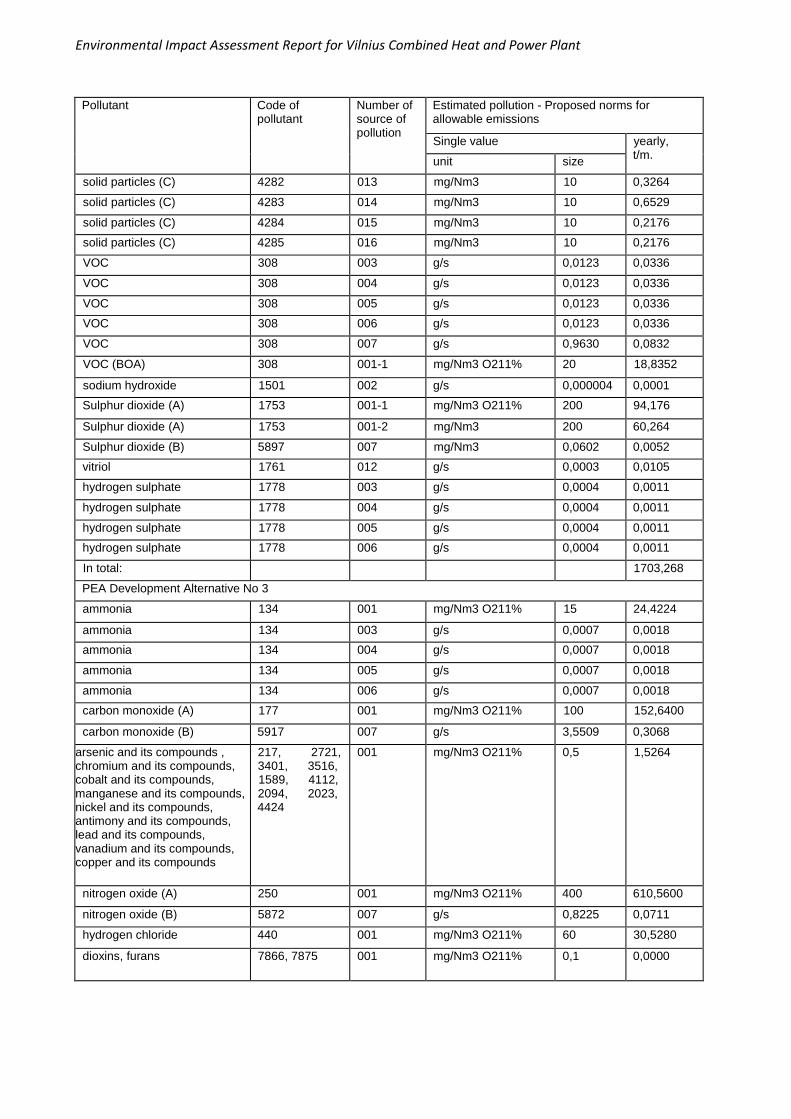
Environmental Impact Assessment Report for Vilnius Combined Heat and Power Plant
Pollutant Code of pollutant
Number of source of pollution
Estimated pollution - Proposed norms for allowable emissions
Single value yearly, t/m.
unit size
solid particles (C) 4282 013 mg/Nm3 10 0,3264
solid particles (C) 4283 014 mg/Nm3 10 0,6529
solid particles (C) 4284 015 mg/Nm3 10 0,2176
solid particles (C) 4285 016 mg/Nm3 10 0,2176
VOC 308 003 g/s 0,0123 0,0336
VOC 308 004 g/s 0,0123 0,0336
VOC 308 005 g/s 0,0123 0,0336
VOC 308 006 g/s 0,0123 0,0336
VOC 308 007 g/s 0,9630 0,0832
VOC (BOA) 308 001-1 mg/Nm3 O211% 20 18,8352
sodium hydroxide 1501 002 g/s 0,000004 0,0001
Sulphur dioxide (A) 1753 001-1 mg/Nm3 O211% 200 94,176
Sulphur dioxide (A) 1753 001-2 mg/Nm3 200 60,264
Sulphur dioxide (B) 5897 007 mg/Nm3 0,0602 0,0052
vitriol 1761 012 g/s 0,0003 0,0105
hydrogen sulphate 1778 003 g/s 0,0004 0,0011
hydrogen sulphate 1778 004 g/s 0,0004 0,0011
hydrogen sulphate 1778 005 g/s 0,0004 0,0011
hydrogen sulphate 1778 006 g/s 0,0004 0,0011
In total: 1703,268
PEA Development Alternative No 3
ammonia 134 001 mg/Nm3 O211% 15 24,4224
ammonia 134 003 g/s 0,0007 0,0018
ammonia 134 004 g/s 0,0007 0,0018
ammonia 134 005 g/s 0,0007 0,0018
ammonia 134 006 g/s 0,0007 0,0018
carbon monoxide (A) 177 001 mg/Nm3 O211% 100 152,6400
carbon monoxide (B) 5917 007 g/s 3,5509 0,3068
arsenic and its compounds , chromium and its compounds, cobalt and its compounds, manganese and its compounds, nickel and its compounds, antimony and its compounds, lead and its compounds, vanadium and its compounds, copper and its compounds
217, 2721, 3401, 3516, 1589, 4112, 2094, 2023, 4424
001 mg/Nm3 O211% 0,5 1,5264
nitrogen oxide (A) 250 001 mg/Nm3 O211% 400 610,5600
nitrogen oxide (B) 5872 007 g/s 0,8225 0,0711
hydrogen chloride 440 001 mg/Nm3 O211% 60 30,5280
dioxins, furans 7866, 7875 001 mg/Nm3 O211% 0,1 0,0000
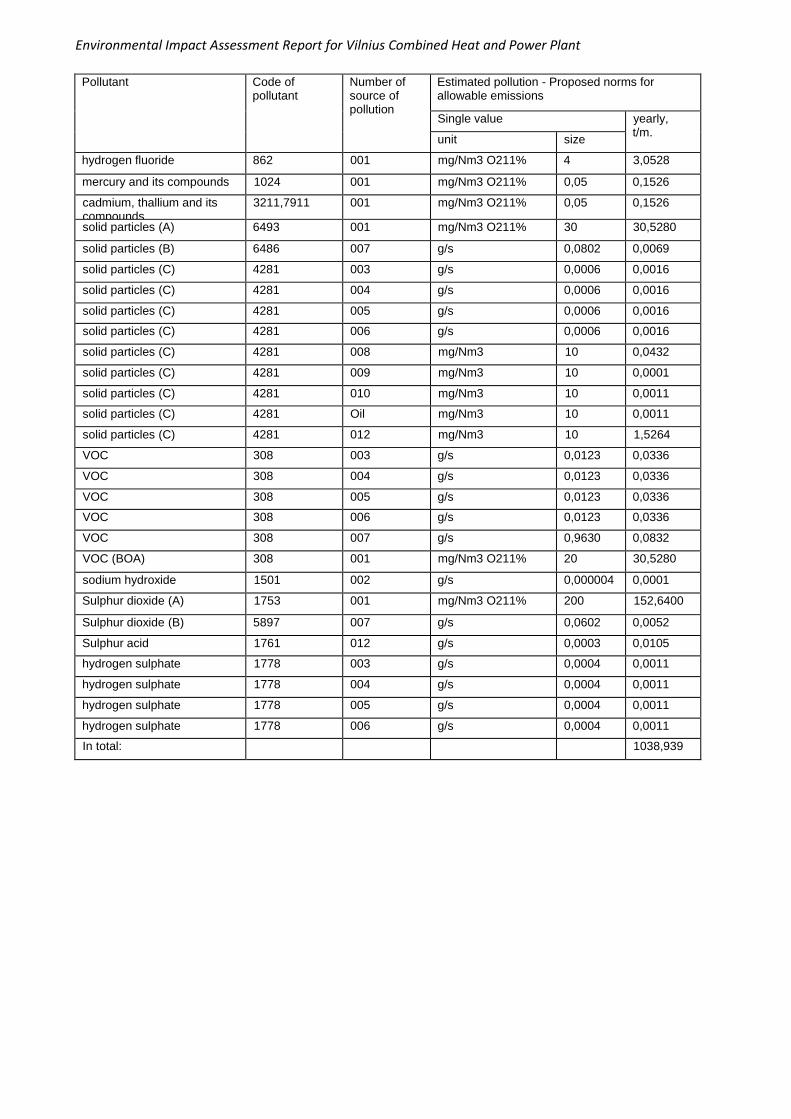
Environmental Impact Assessment Report for Vilnius Combined Heat and Power Plant
Pollutant Code of pollutant
Number of source of pollution
Estimated pollution - Proposed norms for allowable emissions
Single value yearly, t/m.
unit size
hydrogen fluoride 862 001 mg/Nm3 O211% 4 3,0528
mercury and its compounds 1024 001 mg/Nm3 O211% 0,05 0,1526
cadmium, thallium and its compounds
3211,7911 001 mg/Nm3 O211% 0,05 0,1526
solid particles (A) 6493 001 mg/Nm3 O211% 30 30,5280
solid particles (B) 6486 007 g/s 0,0802 0,0069
solid particles (C) 4281 003 g/s 0,0006 0,0016
solid particles (C) 4281 004 g/s 0,0006 0,0016
solid particles (C) 4281 005 g/s 0,0006 0,0016
solid particles (C) 4281 006 g/s 0,0006 0,0016
solid particles (C) 4281 008 mg/Nm3 10 0,0432
solid particles (C) 4281 009 mg/Nm3 10 0,0001
solid particles (C) 4281 010 mg/Nm3 10 0,0011
solid particles (C) 4281 Oil mg/Nm3 10 0,0011
solid particles (C) 4281 012 mg/Nm3 10 1,5264
VOC 308 003 g/s 0,0123 0,0336
VOC 308 004 g/s 0,0123 0,0336
VOC 308 005 g/s 0,0123 0,0336
VOC 308 006 g/s 0,0123 0,0336
VOC 308 007 g/s 0,9630 0,0832
VOC (BOA) 308 001 mg/Nm3 O211% 20 30,5280
sodium hydroxide 1501 002 g/s 0,000004 0,0001
Sulphur dioxide (A) 1753 001 mg/Nm3 O211% 200 152,6400
Sulphur dioxide (B) 5897 007 g/s 0,0602 0,0052
Sulphur acid 1761 012 g/s 0,0003 0,0105
hydrogen sulphate 1778 003 g/s 0,0004 0,0011
hydrogen sulphate 1778 004 g/s 0,0004 0,0011
hydrogen sulphate 1778 005 g/s 0,0004 0,0011
hydrogen sulphate 1778 006 g/s 0,0004 0,0011
In total: 1038,939
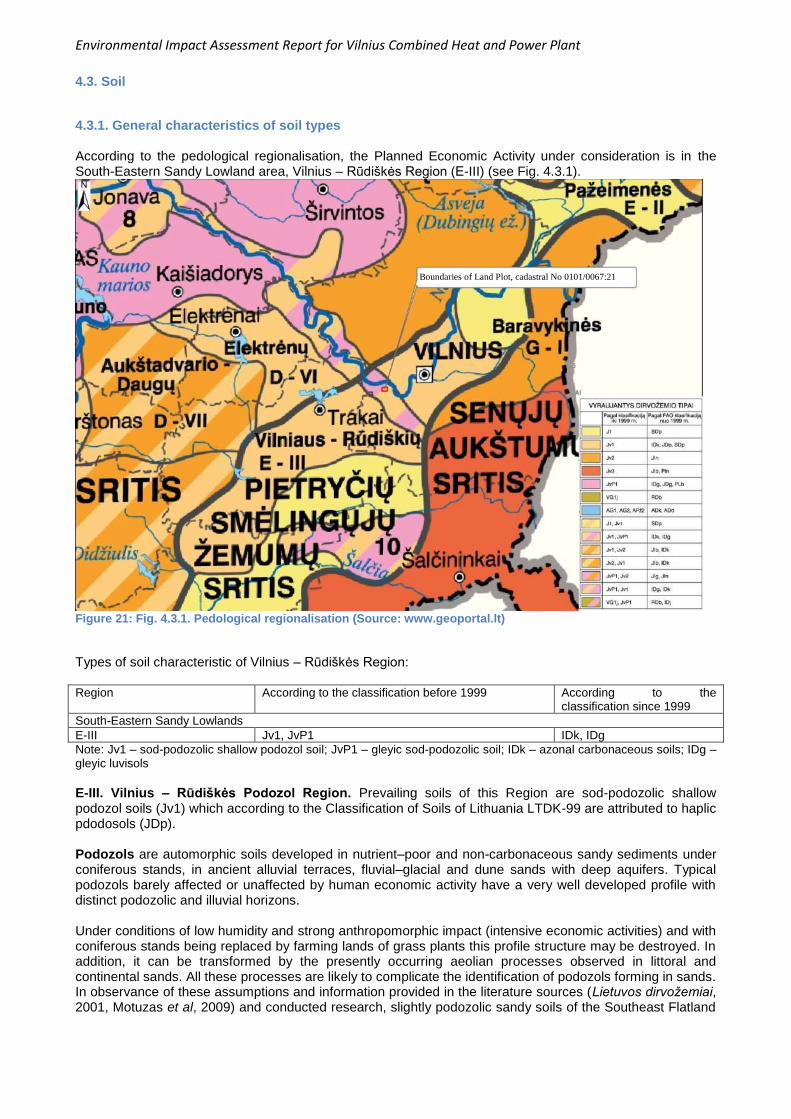
Environmental Impact Assessment Report for Vilnius Combined Heat and Power Plant
4.3. Soil
4.3.1. General characteristics of soil types According to the pedological regionalisation, the Planned Economic Activity under consideration is in the South-Eastern Sandy Lowland area, Vilnius – Rūdiškės Region (E-III) (see Fig. 4.3.1).
Figure 21: Fig. 4.3.1. Pedological regionalisation (Source: www.geoportal.lt)
Types of soil characteristic of Vilnius – Rūdiškės Region: Region According to the classification before 1999 According to the
classification since 1999
South-Eastern Sandy Lowlands
E-III Jv1, JvP1 IDk, IDg
Note: Jv1 – sod-podozolic shallow podozol soil; JvP1 – gleyic sod-podozolic soil; IDk – azonal carbonaceous soils; IDg – gleyic luvisols
E-III. Vilnius – Rūdiškės Podozol Region. Prevailing soils of this Region are sod-podozolic shallow podozol soils (Jv1) which according to the Classification of Soils of Lithuania LTDK-99 are attributed to haplic pdodosols (JDp). Podozols are automorphic soils developed in nutrient–poor and non-carbonaceous sandy sediments under coniferous stands, in ancient alluvial terraces, fluvial–glacial and dune sands with deep aquifers. Typical podozols barely affected or unaffected by human economic activity have a very well developed profile with distinct podozolic and illuvial horizons. Under conditions of low humidity and strong anthropomorphic impact (intensive economic activities) and with coniferous stands being replaced by farming lands of grass plants this profile structure may be destroyed. In addition, it can be transformed by the presently occurring aeolian processes observed in littoral and continental sands. All these processes are likely to complicate the identification of podozols forming in sands. In observance of these assumptions and information provided in the literature sources (Lietuvos dirvožemiai, 2001, Motuzas et al, 2009) and conducted research, slightly podozolic sandy soils of the Southeast Flatland
Boundaries of Land Plot, cadastral No 0101/0067:21
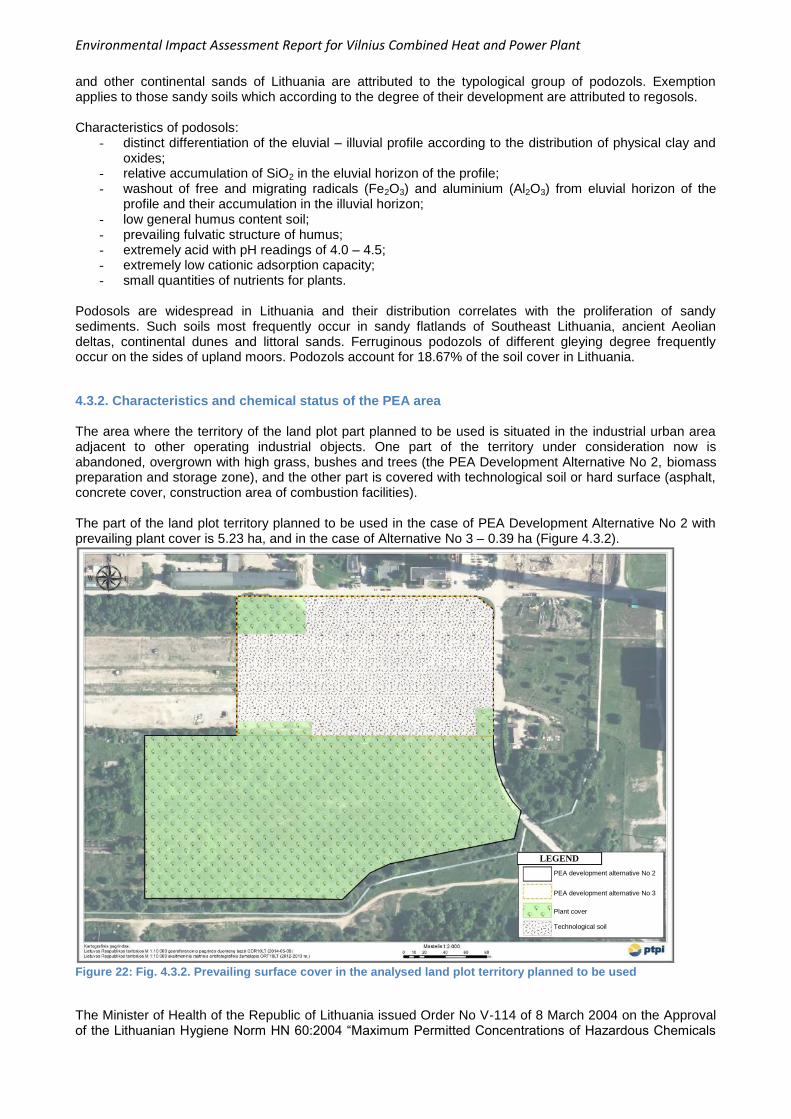
Environmental Impact Assessment Report for Vilnius Combined Heat and Power Plant
and other continental sands of Lithuania are attributed to the typological group of podozols. Exemption applies to those sandy soils which according to the degree of their development are attributed to regosols. Characteristics of podosols:
- distinct differentiation of the eluvial – illuvial profile according to the distribution of physical clay and oxides;
- relative accumulation of SiO2 in the eluvial horizon of the profile; - washout of free and migrating radicals (Fe2O3) and aluminium (Al2O3) from eluvial horizon of the
profile and their accumulation in the illuvial horizon; - low general humus content soil; - prevailing fulvatic structure of humus; - extremely acid with pH readings of 4.0 – 4.5; - extremely low cationic adsorption capacity; - small quantities of nutrients for plants.
Podosols are widespread in Lithuania and their distribution correlates with the proliferation of sandy sediments. Such soils most frequently occur in sandy flatlands of Southeast Lithuania, ancient Aeolian deltas, continental dunes and littoral sands. Ferruginous podozols of different gleying degree frequently occur on the sides of upland moors. Podozols account for 18.67% of the soil cover in Lithuania.
4.3.2. Characteristics and chemical status of the PEA area The area where the territory of the land plot part planned to be used is situated in the industrial urban area adjacent to other operating industrial objects. One part of the territory under consideration now is abandoned, overgrown with high grass, bushes and trees (the PEA Development Alternative No 2, biomass preparation and storage zone), and the other part is covered with technological soil or hard surface (asphalt, concrete cover, construction area of combustion facilities). The part of the land plot territory planned to be used in the case of PEA Development Alternative No 2 with prevailing plant cover is 5.23 ha, and in the case of Alternative No 3 – 0.39 ha (Figure 4.3.2).
Figure 22: Fig. 4.3.2. Prevailing surface cover in the analysed land plot territory planned to be used
The Minister of Health of the Republic of Lithuania issued Order No V-114 of 8 March 2004 on the Approval of the Lithuanian Hygiene Norm HN 60:2004 “Maximum Permitted Concentrations of Hazardous Chemicals
PEA development alternative No 2
PEA development alternative No 3
Plant cover Technological soil
LEGEND
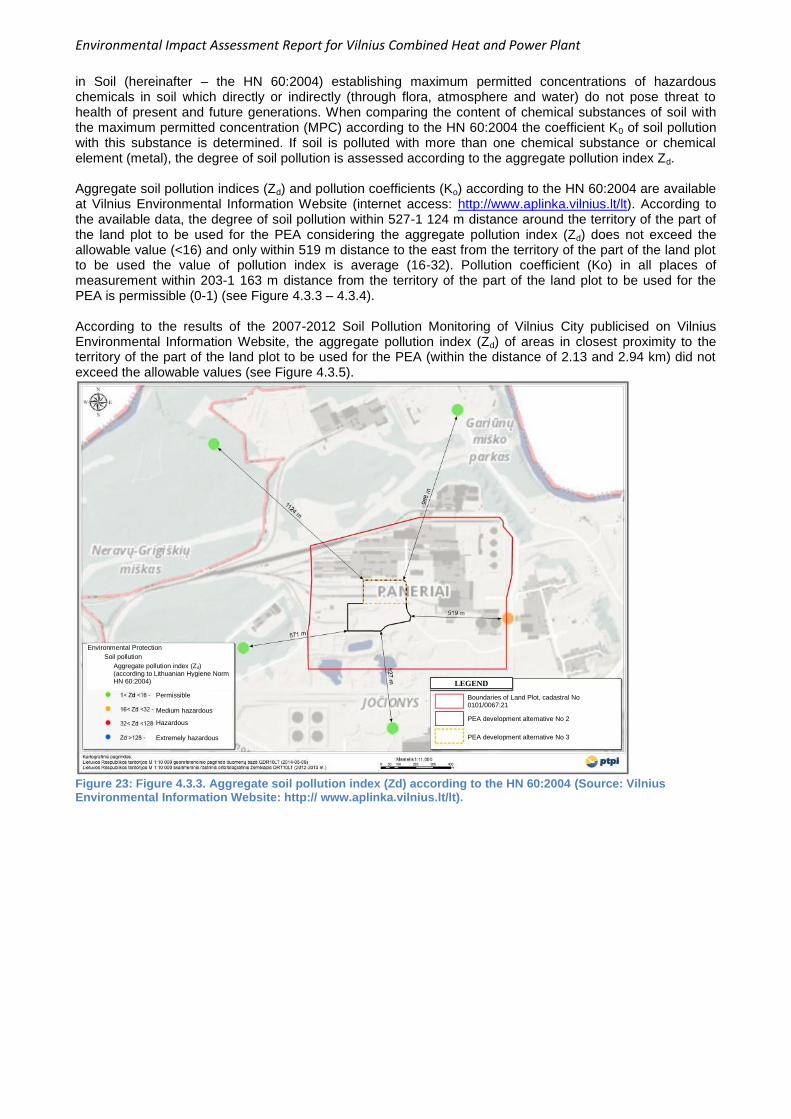
Environmental Impact Assessment Report for Vilnius Combined Heat and Power Plant
in Soil (hereinafter – the HN 60:2004) establishing maximum permitted concentrations of hazardous chemicals in soil which directly or indirectly (through flora, atmosphere and water) do not pose threat to health of present and future generations. When comparing the content of chemical substances of soil with the maximum permitted concentration (MPC) according to the HN 60:2004 the coefficient K0 of soil pollution with this substance is determined. If soil is polluted with more than one chemical substance or chemical element (metal), the degree of soil pollution is assessed according to the aggregate pollution index Zd. Aggregate soil pollution indices (Zd) and pollution coefficients (Ko) according to the HN 60:2004 are available at Vilnius Environmental Information Website (internet access: http://www.aplinka.vilnius.lt/lt). According to the available data, the degree of soil pollution within 527-1 124 m distance around the territory of the part of the land plot to be used for the PEA considering the aggregate pollution index (Zd) does not exceed the allowable value (<16) and only within 519 m distance to the east from the territory of the part of the land plot to be used the value of pollution index is average (16-32). Pollution coefficient (Ko) in all places of measurement within 203-1 163 m distance from the territory of the part of the land plot to be used for the PEA is permissible (0-1) (see Figure 4.3.3 – 4.3.4). According to the results of the 2007-2012 Soil Pollution Monitoring of Vilnius City publicised on Vilnius Environmental Information Website, the aggregate pollution index (Zd) of areas in closest proximity to the territory of the part of the land plot to be used for the PEA (within the distance of 2.13 and 2.94 km) did not exceed the allowable values (see Figure 4.3.5).
Figure 23: Figure 4.3.3. Aggregate soil pollution index (Zd) according to the HN 60:2004 (Source: Vilnius Environmental Information Website: http:// www.aplinka.vilnius.lt/lt).
Boundaries of Land Plot, cadastral No 0101/0067:21
PEA development alternative No 2
PEA development alternative No 3
LEGEND
Environmental Protection
Soil pollution
Aggregate pollution index (Zd) (according to Lithuanian Hygiene Norm HN 60:2004)
Permissible Medium hazardous
Hazardous Extremely hazardous
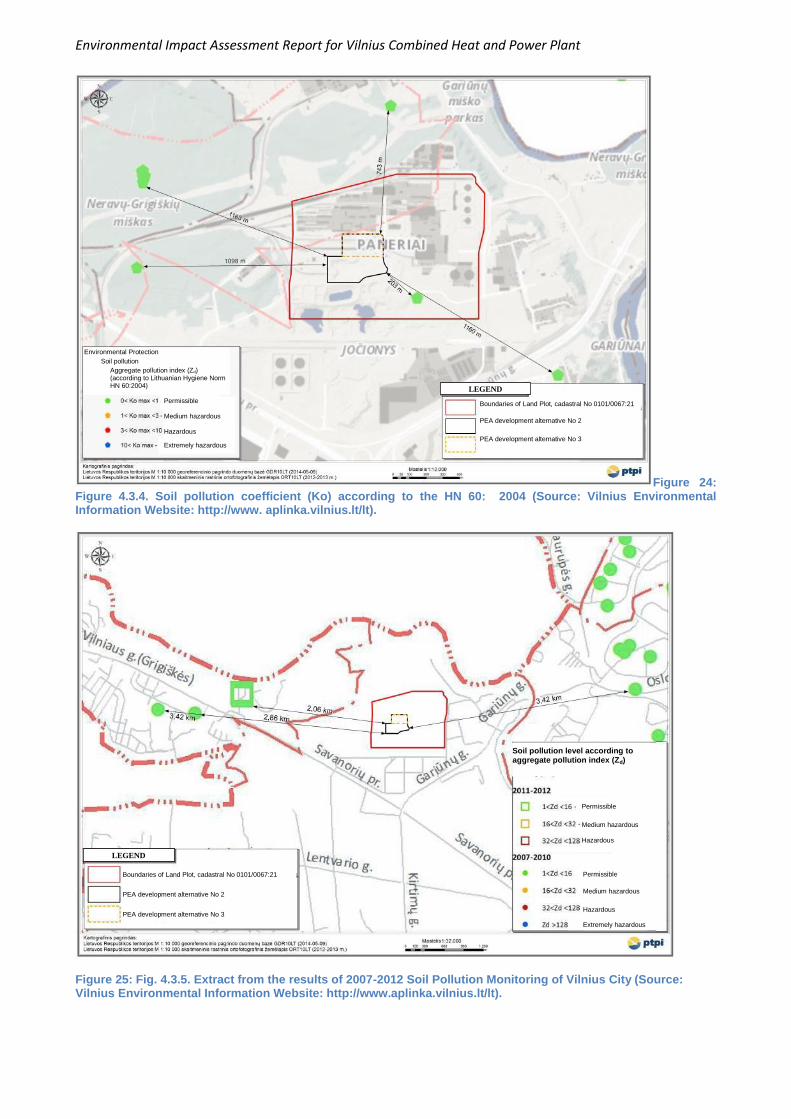
Environmental Impact Assessment Report for Vilnius Combined Heat and Power Plant
Figure 24: Figure 4.3.4. Soil pollution coefficient (Ko) according to the HN 60: 2004 (Source: Vilnius Environmental Information Website: http://www. aplinka.vilnius.lt/lt).
Figure 25: Fig. 4.3.5. Extract from the results of 2007-2012 Soil Pollution Monitoring of Vilnius City (Source: Vilnius Environmental Information Website: http://www.aplinka.vilnius.lt/lt).
Boundaries of Land Plot, cadastral No 0101/0067:21
PEA development alternative No 2
PEA development alternative No 3
LEGEND
LEGEND
Boundaries of Land Plot, cadastral No 0101/0067:21
PEA development alternative No 2
PEA development alternative No 3
Environmental Protection
Soil pollution
Aggregate pollution index (Zd) (according to Lithuanian Hygiene Norm HN 60:2004)
Permissible Medium hazardous Hazardous
Extremely hazardous
Permissible
Medium hazardous Hazardous
Permissible
Medium hazardous
Hazardous Extremely hazardous
Soil pollution level according to aggregate pollution index (Zd)
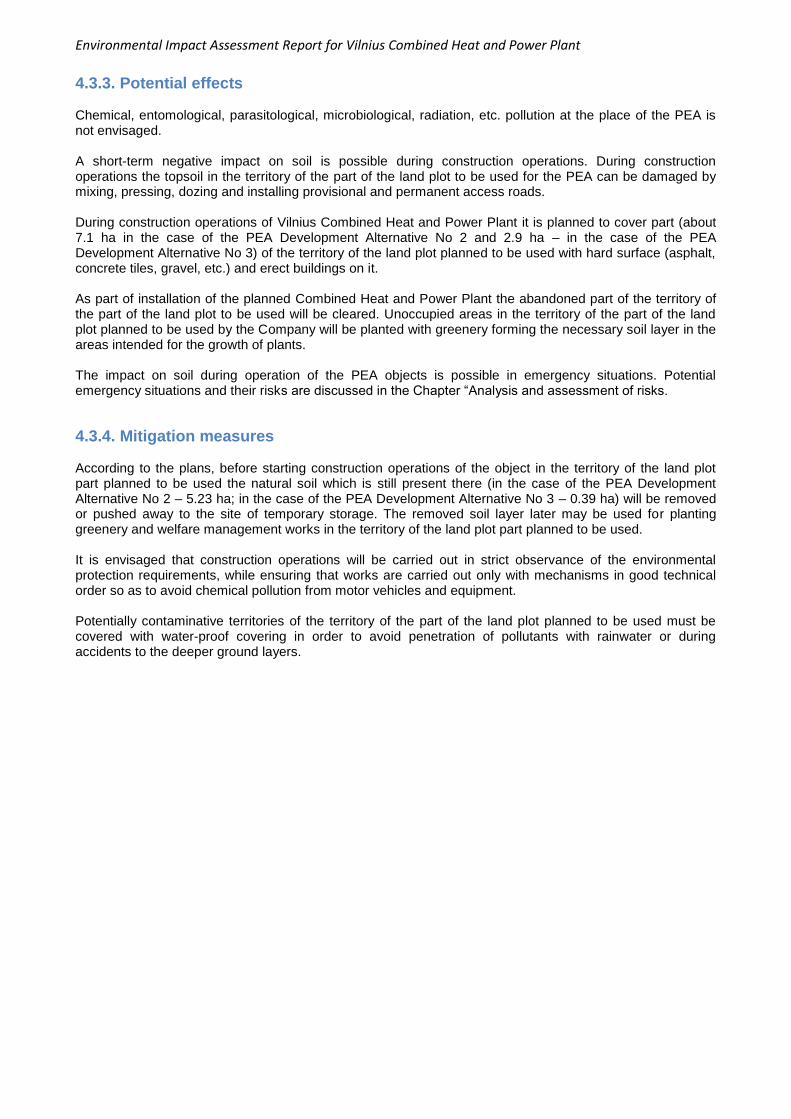
Environmental Impact Assessment Report for Vilnius Combined Heat and Power Plant
4.3.3. Potential effects Chemical, entomological, parasitological, microbiological, radiation, etc. pollution at the place of the PEA is not envisaged. A short-term negative impact on soil is possible during construction operations. During construction operations the topsoil in the territory of the part of the land plot to be used for the PEA can be damaged by mixing, pressing, dozing and installing provisional and permanent access roads. During construction operations of Vilnius Combined Heat and Power Plant it is planned to cover part (about 7.1 ha in the case of the PEA Development Alternative No 2 and 2.9 ha – in the case of the PEA Development Alternative No 3) of the territory of the land plot planned to be used with hard surface (asphalt, concrete tiles, gravel, etc.) and erect buildings on it. As part of installation of the planned Combined Heat and Power Plant the abandoned part of the territory of the part of the land plot to be used will be cleared. Unoccupied areas in the territory of the part of the land plot planned to be used by the Company will be planted with greenery forming the necessary soil layer in the areas intended for the growth of plants. The impact on soil during operation of the PEA objects is possible in emergency situations. Potential emergency situations and their risks are discussed in the Chapter “Analysis and assessment of risks.
4.3.4. Mitigation measures According to the plans, before starting construction operations of the object in the territory of the land plot part planned to be used the natural soil which is still present there (in the case of the PEA Development Alternative No 2 – 5.23 ha; in the case of the PEA Development Alternative No 3 – 0.39 ha) will be removed or pushed away to the site of temporary storage. The removed soil layer later may be used for planting greenery and welfare management works in the territory of the land plot part planned to be used. It is envisaged that construction operations will be carried out in strict observance of the environmental protection requirements, while ensuring that works are carried out only with mechanisms in good technical order so as to avoid chemical pollution from motor vehicles and equipment. Potentially contaminative territories of the territory of the part of the land plot planned to be used must be covered with water-proof covering in order to avoid penetration of pollutants with rainwater or during accidents to the deeper ground layers.
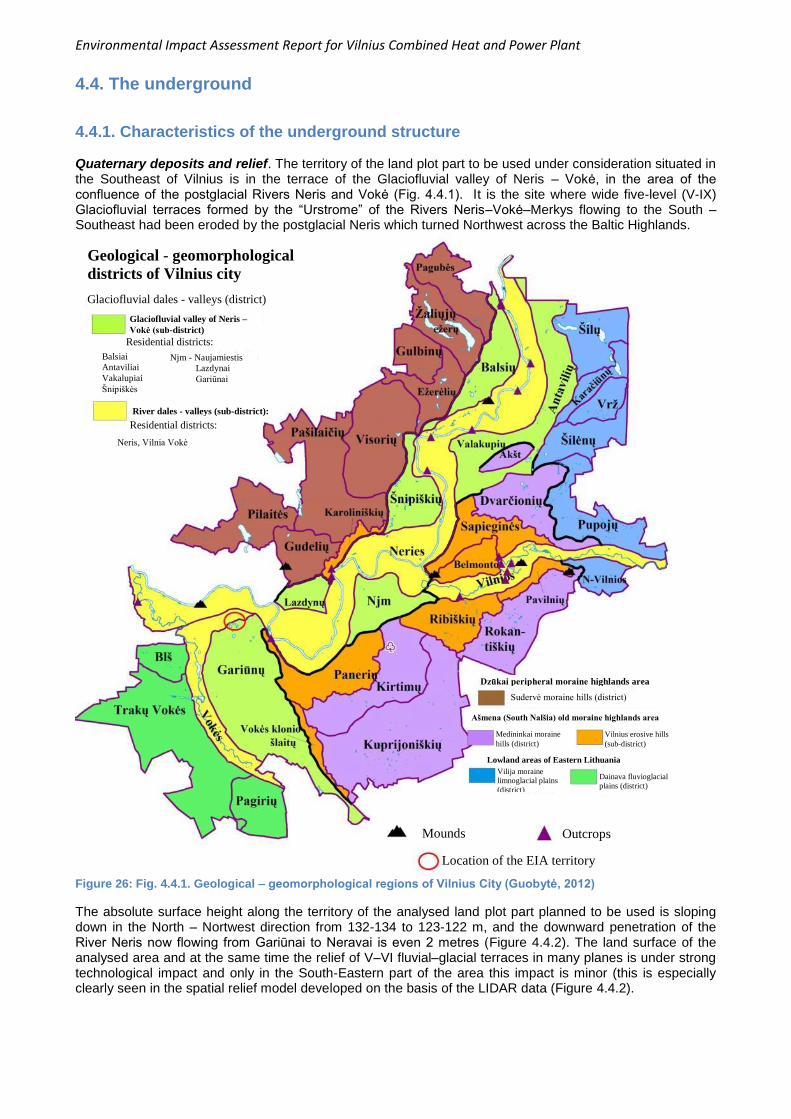
Environmental Impact Assessment Report for Vilnius Combined Heat and Power Plant
4.4. The underground
4.4.1. Characteristics of the underground structure Quaternary deposits and relief. The territory of the land plot part to be used under consideration situated in the Southeast of Vilnius is in the terrace of the Glaciofluvial valley of Neris – Vokė, in the area of the confluence of the postglacial Rivers Neris and Vokė (Fig. 4.4.1). It is the site where wide five-level (V-IX) Glaciofluvial terraces formed by the “Urstrome” of the Rivers Neris–Vokė–Merkys flowing to the South – Southeast had been eroded by the postglacial Neris which turned Northwest across the Baltic Highlands.
Figure 26: Fig. 4.4.1. Geological – geomorphological regions of Vilnius City (Guobytė, 2012)
The absolute surface height along the territory of the analysed land plot part planned to be used is sloping down in the North – Nortwest direction from 132-134 to 123-122 m, and the downward penetration of the River Neris now flowing from Gariūnai to Neravai is even 2 metres (Figure 4.4.2). The land surface of the analysed area and at the same time the relief of V–VI fluvial–glacial terraces in many planes is under strong technological impact and only in the South-Eastern part of the area this impact is minor (this is especially clearly seen in the spatial relief model developed on the basis of the LIDAR data (Figure 4.4.2).
Geological - geomorphological
districts of Vilnius city
Glaciofluvial dales - valleys (district)
Glaciofluvial valley of Neris –
Vokė (sub-district)
Residential districts:
Residential districts:
River dales - valleys (sub-district):
Dzūkai peripheral moraine highlands area
Sudervė moraine hills (district)
Ašmena (South Nalšia) old moraine highlands area
Medininkai moraine
hills (district)
Vilnius erosive hills
(sub-district)
Dainava fluvioglacial
plains (district)
Vilija moraine
limnoglacial plains
(district)
Lowland areas of Eastern Lithuania
Mounds Outcrops
Location of the EIA territory
Balsiai
Antaviliai
Vakalupiai
Šnipiškės
Njm - Naujamiestis
Lazdynai
Gariūnai
Neris, Vilnia Vokė
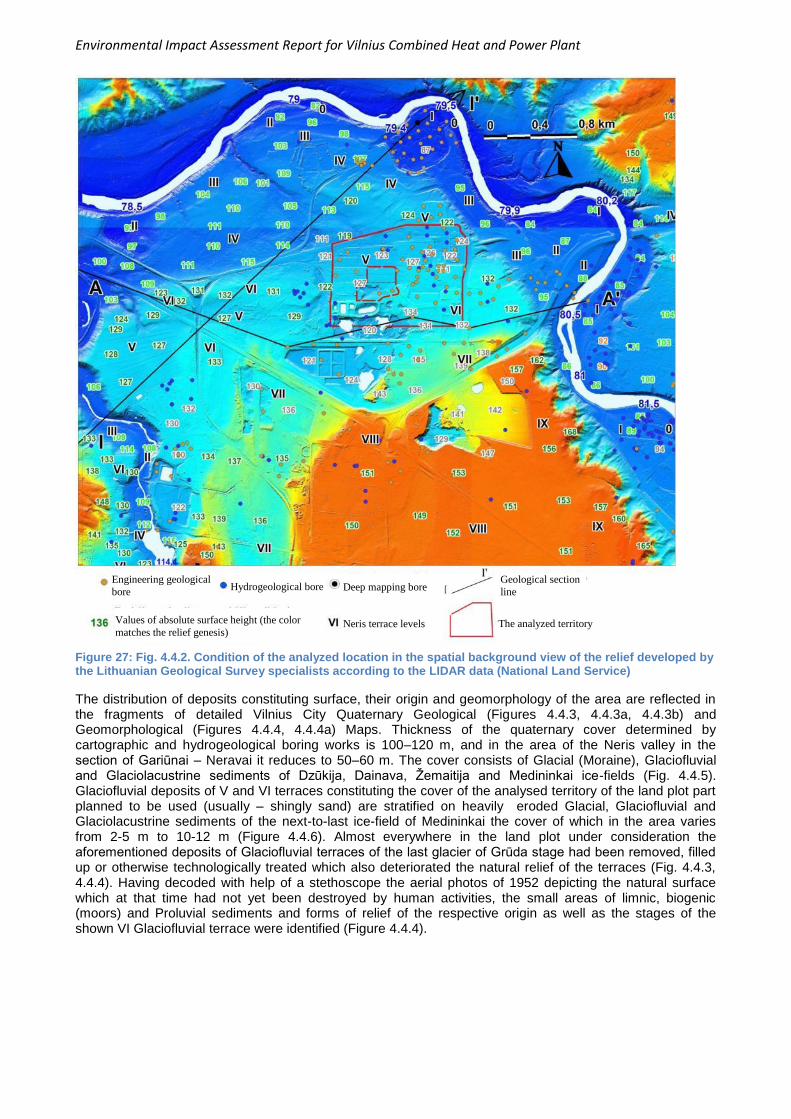
Environmental Impact Assessment Report for Vilnius Combined Heat and Power Plant
Figure 27: Fig. 4.4.2. Condition of the analyzed location in the spatial background view of the relief developed by the Lithuanian Geological Survey specialists according to the LIDAR data (National Land Service)
The distribution of deposits constituting surface, their origin and geomorphology of the area are reflected in the fragments of detailed Vilnius City Quaternary Geological (Figures 4.4.3, 4.4.3a, 4.4.3b) and Geomorphological (Figures 4.4.4, 4.4.4a) Maps. Thickness of the quaternary cover determined by cartographic and hydrogeological boring works is 100–120 m, and in the area of the Neris valley in the section of Gariūnai – Neravai it reduces to 50–60 m. The cover consists of Glacial (Moraine), Glaciofluvial and Glaciolacustrine sediments of Dzūkija, Dainava, Žemaitija and Medininkai ice-fields (Fig. 4.4.5). Glaciofluvial deposits of V and VI terraces constituting the cover of the analysed territory of the land plot part planned to be used (usually – shingly sand) are stratified on heavily eroded Glacial, Glaciofluvial and Glaciolacustrine sediments of the next-to-last ice-field of Medininkai the cover of which in the area varies from 2-5 m to 10-12 m (Figure 4.4.6). Almost everywhere in the land plot under consideration the aforementioned deposits of Glaciofluvial terraces of the last glacier of Grūda stage had been removed, filled up or otherwise technologically treated which also deteriorated the natural relief of the terraces (Fig. 4.4.3, 4.4.4). Having decoded with help of a stethoscope the aerial photos of 1952 depicting the natural surface which at that time had not yet been destroyed by human activities, the small areas of limnic, biogenic (moors) and Proluvial sediments and forms of relief of the respective origin as well as the stages of the shown VI Glaciofluvial terrace were identified (Figure 4.4.4).
Engineering geological
bore Hydrogeological bore Deep mapping bore
Geological section
line
Values of absolute surface height (the color
matches the relief genesis) Neris terrace levels The analyzed territory
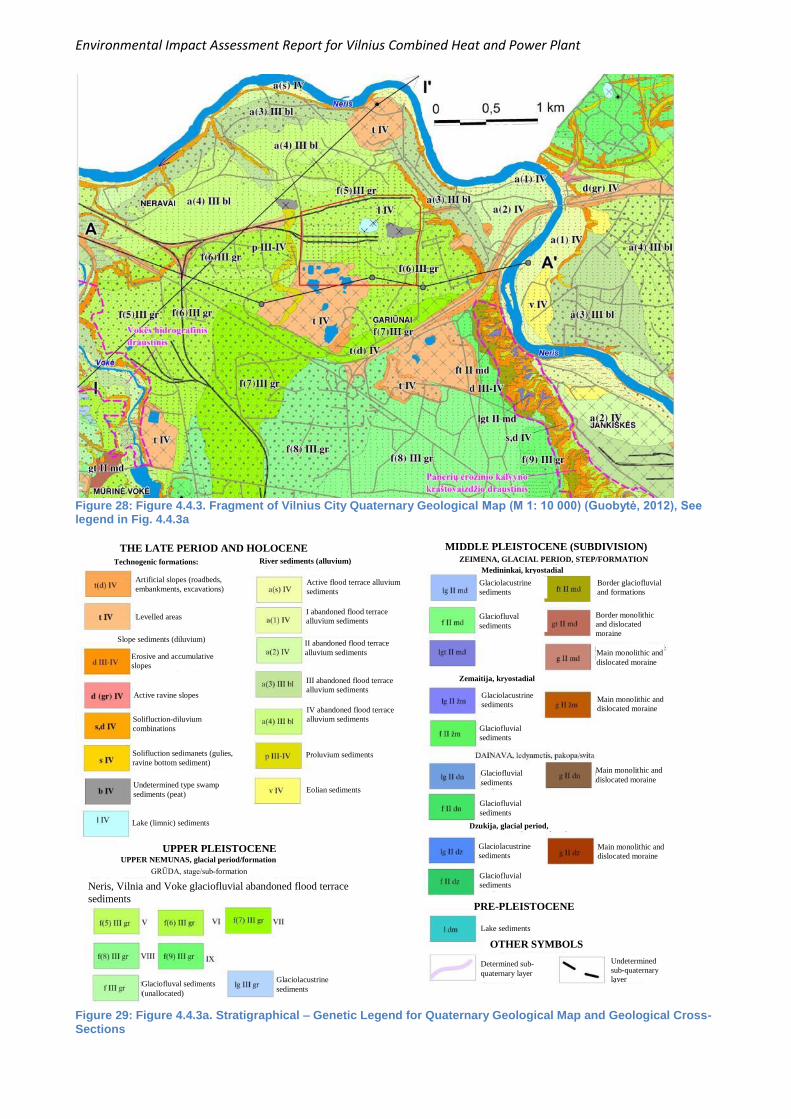
Environmental Impact Assessment Report for Vilnius Combined Heat and Power Plant
Figure 28: Figure 4.4.3. Fragment of Vilnius City Quaternary Geological Map (M 1: 10 000) (Guobytė, 2012), See legend in Fig. 4.4.3a
Figure 29: Figure 4.4.3a. Stratigraphical – Genetic Legend for Quaternary Geological Map and Geological Cross-Sections
THE LATE PERIOD AND HOLOCENE MIDDLE PLEISTOCENE (SUBDIVISION)
Artificial slopes (roadbeds,
embankments, excavations)
Levelled areas
Slope sediments (diluvium)
Erosive and accumulative
slopes
Active ravine slopes
Solifluction-diluvium
combinations
Solifluction sedimanets (gulies,
ravine bottom sediment)
Undetermined type swamp
sediments (peat)
Lake (limnic) sediments
Active flood terrace alluvium
sediments
I abandoned flood terrace
alluvium sediments
II abandoned flood terrace
alluvium sediments
III abandoned flood terrace
alluvium sediments
IV abandoned flood terrace
alluvium sediments
Proluvium sediments
Eolian sediments
Technogenic formations: River sediments (alluvium)
UPPER PLEISTOCENE UPPER NEMUNAS, glacial period/formation
GRŪDA, stage/sub-formation
Neris, Vilnia and Voke glaciofluvial abandoned flood terrace
sediments
Glaciofluval sediments
(unallocated)
Glaciolacustrine
sediments
Glaciolacustrine
sediments
Glaciofluval
sediments
Border glaciofluvial
and formations
Border monolithic
and dislocated
moraine
Main monolithic and
dislocated moraine
ZEIMENA, GLACIAL PERIOD, STEP/FORMATION
Medininkai, kryostadial
Zemaitija, kryostadial
Glaciolacustrine
sediments Main monolithic and
dislocated moraine
Glaciofluvial
sediments
Glaciofluvial
sediments
Glaciofluvial
sediments
Main monolithic and
dislocated moraine
Dzukija, glacial period,
step/formation
Glaciolacustrine
sediments
Glaciofluvial
sediments
Main monolithic and
dislocated moraine
PRE-PLEISTOCENE
Lake sediments
OTHER SYMBOLS
Determined sub-
quaternary layer
Undetermined
sub-quaternary
layer
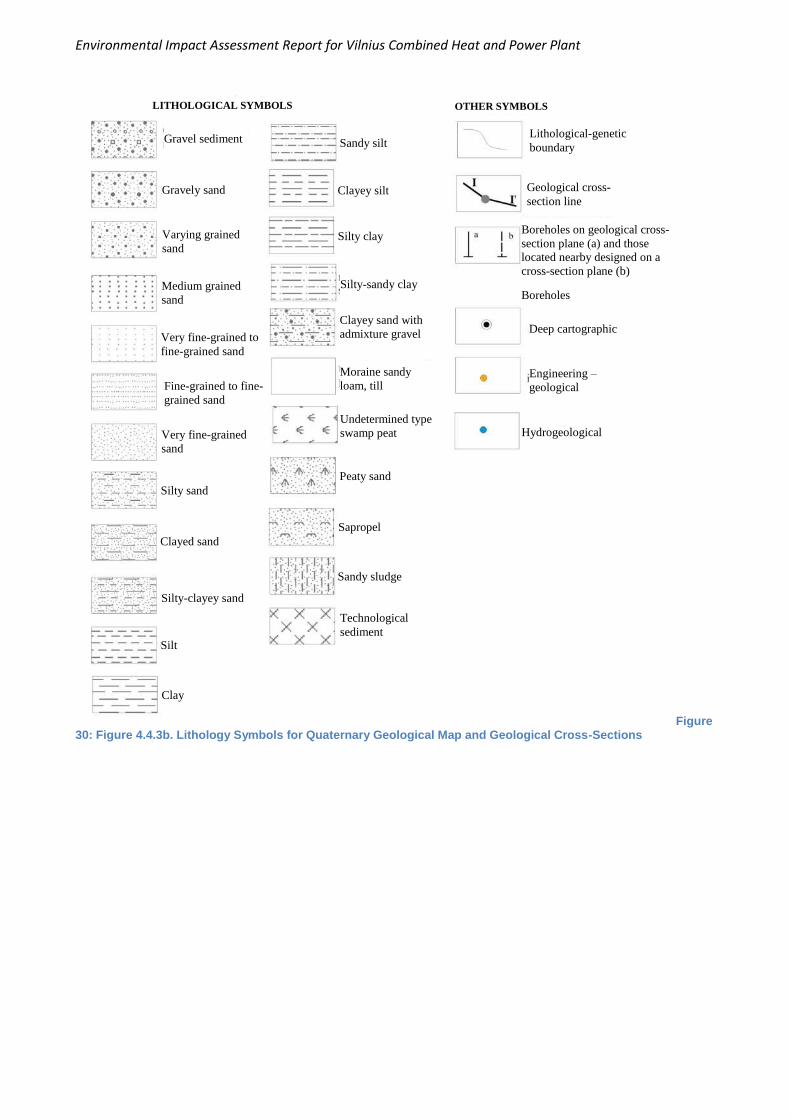
Environmental Impact Assessment Report for Vilnius Combined Heat and Power Plant
Figure 30: Figure 4.4.3b. Lithology Symbols for Quaternary Geological Map and Geological Cross-Sections
Gravel sediment
LITHOLOGICAL SYMBOLS OTHER SYMBOLS
Gravely sand
Varying grained
sand
Medium grained
sand
Very fine-grained to
fine-grained sand
Fine-grained to fine-
grained sand
Very fine-grained
sand
Silty sand
Clayed sand
Silty-clayey sand
Silt
Clay
Sandy silt
Clayey silt
Silty clay
Silty-sandy clay
Clayey sand with
admixture gravel
Moraine sandy
loam, till
Undetermined type
swamp peat
Peaty sand
Sapropel
Sandy sludge
Technological
sediment
Lithological-genetic
boundary
Geological cross-
section line
Boreholes on geological cross-
section plane (a) and those
located nearby designed on a
cross-section plane (b)
Boreholes
Deep cartographic
Engineering –
geological
Hydrogeological
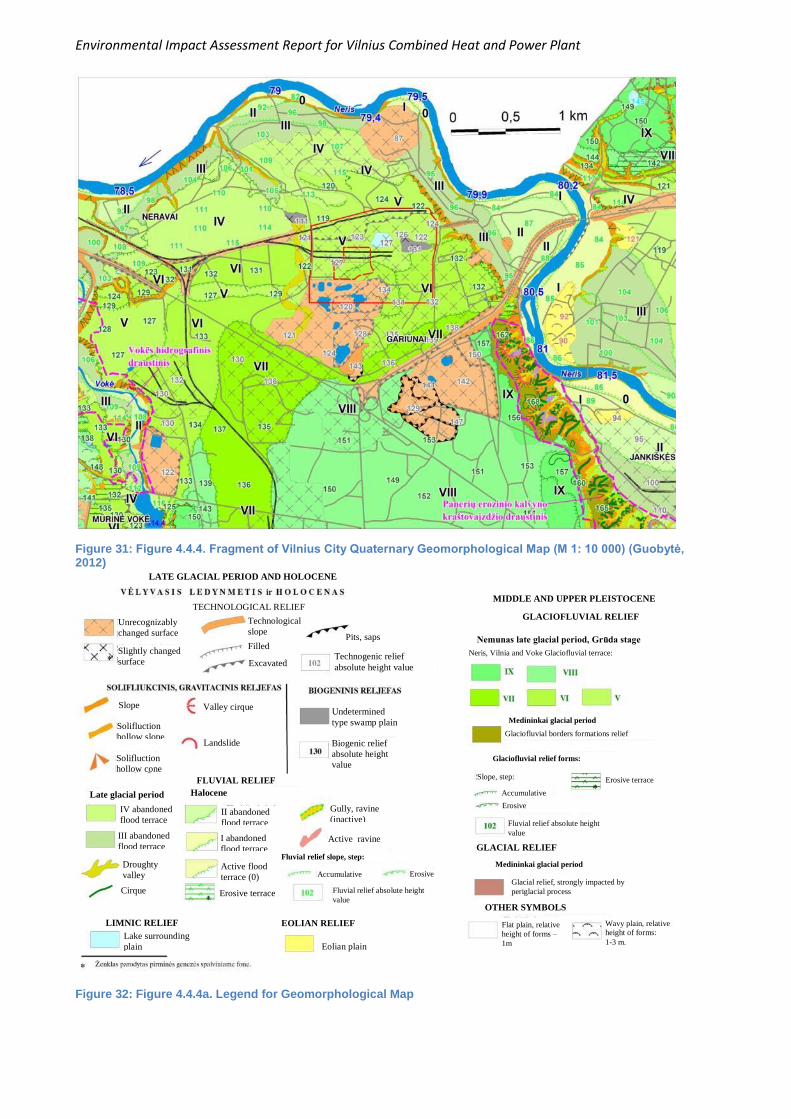
Environmental Impact Assessment Report for Vilnius Combined Heat and Power Plant
Figure 31: Figure 4.4.4. Fragment of Vilnius City Quaternary Geomorphological Map (M 1: 10 000) (Guobytė, 2012)
Figure 32: Figure 4.4.4a. Legend for Geomorphological Map
Valley cirque
Landslide
Slope
Solifluction
hollow slope
Solifluction
hollow cone
IV abandoned
flood terrace
III abandoned
flood terrace
II abandoned
flood terrace
I abandoned
flood terrace
Active flood
terrace (0)
Erosive terrace
Droughty
valley
Cirque
Gully, ravine
(inactive)
Active ravine
Lake surrounding
plain Eolian plain
EOLIAN RELIEF LIMNIC RELIEF
FLUVIAL RELIEF
Late glacial period Halocene
GLACIAL RELIEF
MIDDLE AND UPPER PLEISTOCENE
GLACIOFLUVIAL RELIEF
Biogenic relief
absolute height
value
Undetermined
type swamp plain
Unrecognizably
changed surface
Slightly changed
surface
Technological
slope
Filled
Excavated
Pits, saps
Technogenic relief
absolute height value
LATE GLACIAL PERIOD AND HOLOCENE
TECHNOLOGICAL RELIEF
Fluvial relief slope, step:
Accumulative Erosive
Fluvial relief absolute height
value
Accumulative
Erosive
Fluvial relief absolute height
value
Slope, step:
Glaciofluvial relief forms:
Erosive terrace
Medininkai glacial period
Glaciofluvial borders formations relief
Neris, Vilnia and Voke Glaciofluvial terrace:
Nemunas late glacial period, Grūda stage
Medininkai glacial period
Glacial relief, strongly impacted by
periglacial process
OTHER SYMBOLS
Flat plain, relative
height of forms –
1m
Wavy plain, relative
height of forms:
1-3 m.
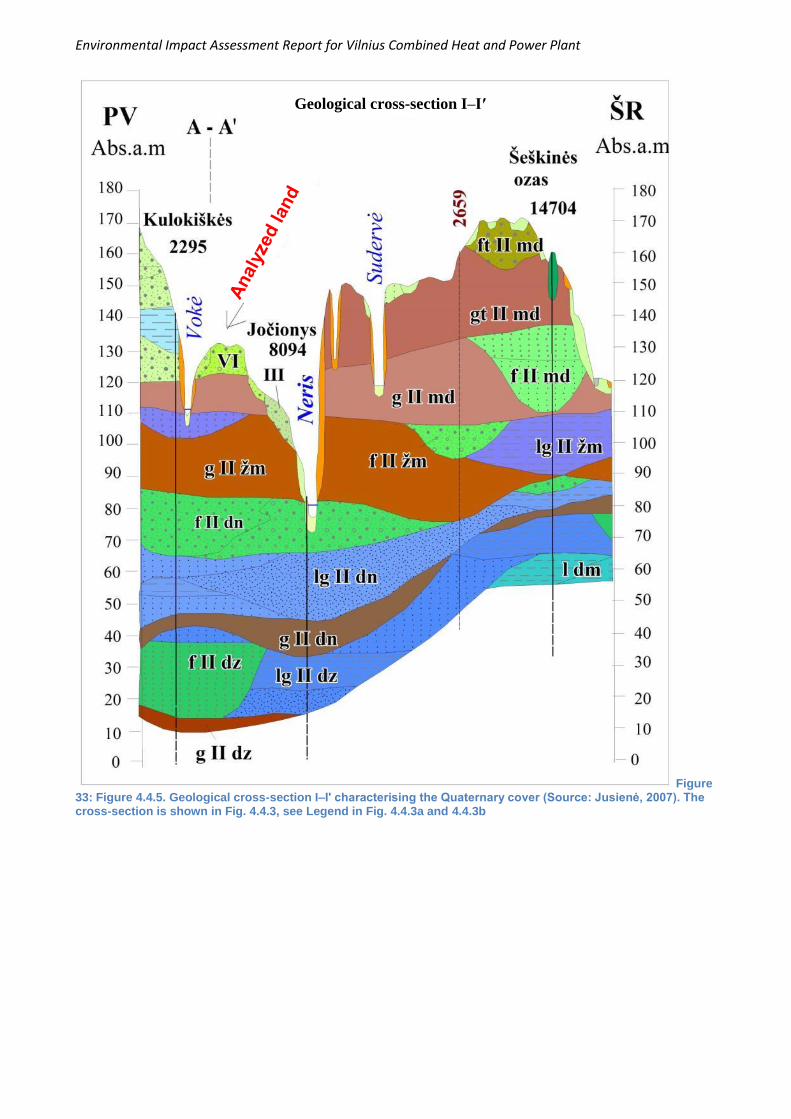
Environmental Impact Assessment Report for Vilnius Combined Heat and Power Plant
Figure 33: Figure 4.4.5. Geological cross-section I–Iʹ characterising the Quaternary cover (Source: Jusienė, 2007). The cross-section is shown in Fig. 4.4.3, see Legend in Fig. 4.4.3a and 4.4.3b
Geological cross-section I–Iʹ
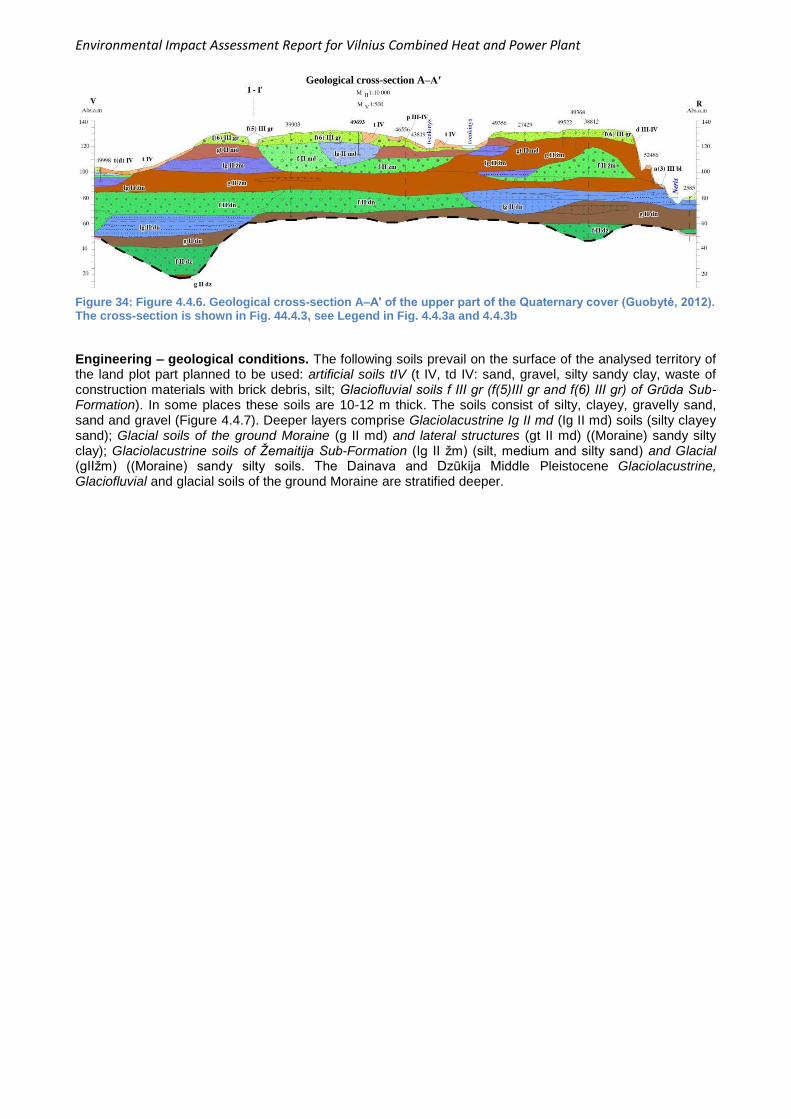
Environmental Impact Assessment Report for Vilnius Combined Heat and Power Plant
Figure 34: Figure 4.4.6. Geological cross-section A–Aʹ of the upper part of the Quaternary cover (Guobytė, 2012). The cross-section is shown in Fig. 44.4.3, see Legend in Fig. 4.4.3a and 4.4.3b
Engineering – geological conditions. The following soils prevail on the surface of the analysed territory of the land plot part planned to be used: artificial soils tIV (t IV, td IV: sand, gravel, silty sandy clay, waste of construction materials with brick debris, silt; Glaciofluvial soils f III gr (f(5)III gr and f(6) III gr) of Grūda Sub-Formation). In some places these soils are 10-12 m thick. The soils consist of silty, clayey, gravelly sand, sand and gravel (Figure 4.4.7). Deeper layers comprise Glaciolacustrine Ig II md (Ig II md) soils (silty clayey sand); Glacial soils of the ground Moraine (g II md) and lateral structures (gt II md) ((Moraine) sandy silty clay); Glaciolacustrine soils of Žemaitija Sub-Formation (Ig II žm) (silt, medium and silty sand) and Glacial (gIIžm) ((Moraine) sandy silty soils. The Dainava and Dzūkija Middle Pleistocene Glaciolacustrine, Glaciofluvial and glacial soils of the ground Moraine are stratified deeper.
Geological cross-section A–Aʹ
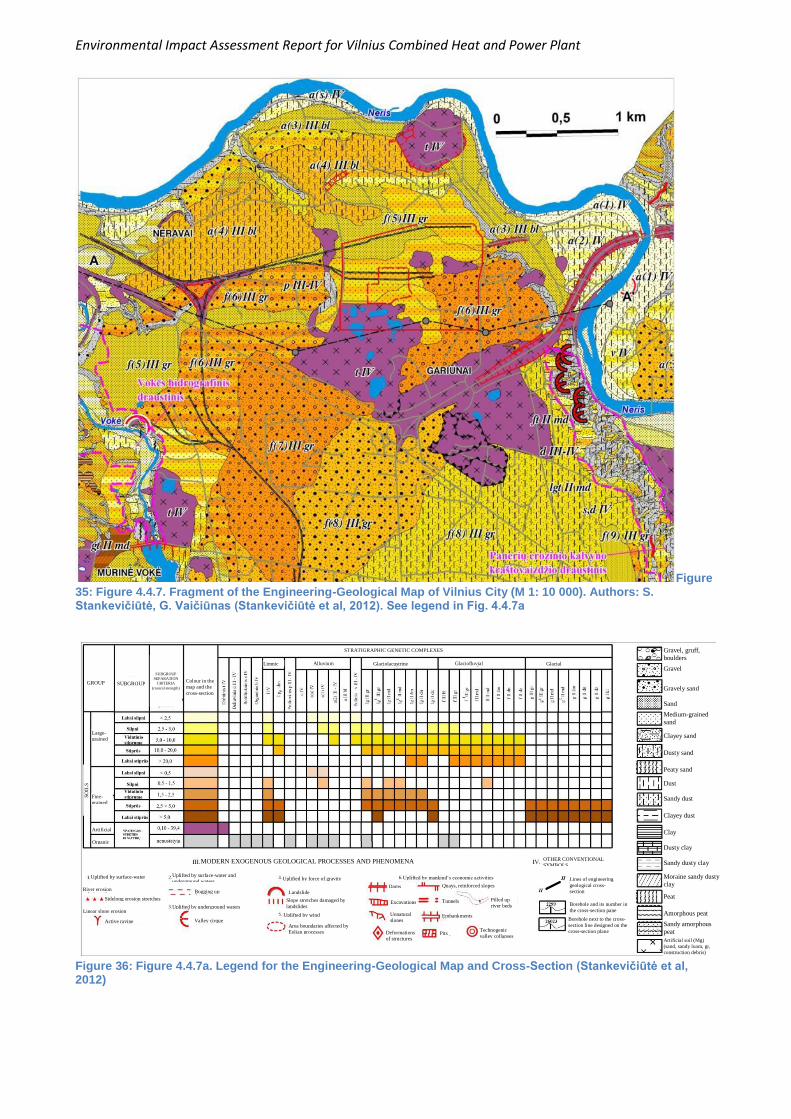
Environmental Impact Assessment Report for Vilnius Combined Heat and Power Plant
Figure 35: Figure 4.4.7. Fragment of the Engineering-Geological Map of Vilnius City (M 1: 10 000). Authors: S. Stankevičiūtė, G. Vaičiūnas (Stankevičiūtė et al, 2012). See legend in Fig. 4.4.7a
Figure 36: Figure 4.4.7a. Legend for the Engineering-Geological Map and Cross-Section (Stankevičiūtė et al, 2012)
STRATIGRAPHIC GENETIC COMPLEXES
Uplifted by surface-water
River erosion
Sidelong erosion stretches
Linear slope erosion
Active ravine
Uplifted by surface-water and
underground waters
Bogging up
Uplifted by underground waters
Valley cirque
Uplifted by force of gravity
Landslide
Slope stretches damaged by
landslides
Uplifted by wind
Area boundaries affected by
Eolian processes
Uplifted by mankind‘s economic activities
Dams
Excavations
Unnatural
slopes
Deformations
of structures
Quays, reinforced slopes
Tunnels
Embankments
Pits
Pilled up
river beds
Technogenic
valley collapses
Lines of engineering
geological cross-
section
Borehole and its number in
the cross-section pane
Borehole next to the cross-
section line designed on the
cross-section plane
OTHER CONVENTIONAL
SYMBOLS MODERN EXOGENOUS GEOLOGICAL PROCESSES AND PHENOMENA
GROUP SUBGROUP
SUBGROUP
SEPARATION
CRITERIA
(conical strength)
Colour in the
map and the
cross-section
Organic
Artificial
Fine-
grained
Large-
grained
SO
ILS
Limnic Alluvium Glaciolacustrine Glaciofluvial Glacial
Gravel, gruff,
boulders
Gravel
Gravely sand
Sand
Medium-grained
sand
Clayey sand
Dusty sand
Peaty sand
Dust
Sandy dust
Clayey dust
Clay
Dusty clay
Sandy dusty clay
Moraine sandy dusty
clay
Peat
Amorphous peat
Sandy amorphous
peat
Artificial soil (Mg)
(sand, sandy loam, gr,
construction debris)
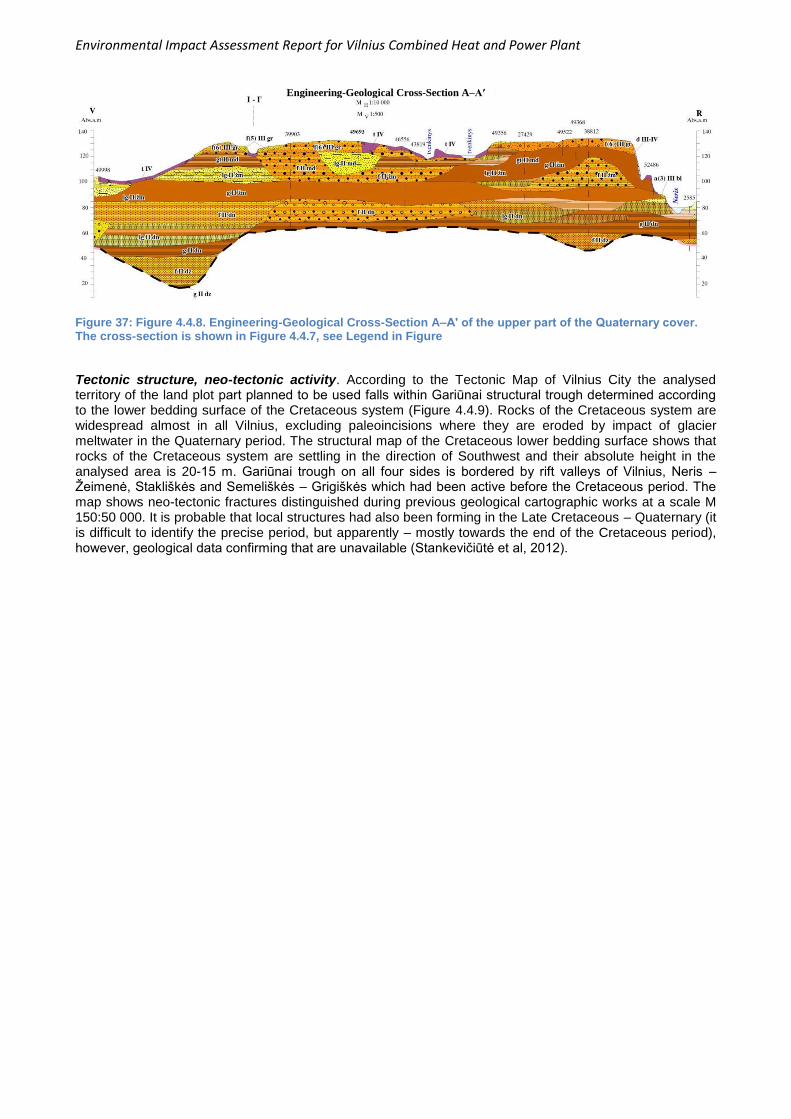
Environmental Impact Assessment Report for Vilnius Combined Heat and Power Plant
Figure 37: Figure 4.4.8. Engineering-Geological Cross-Section A–Aʹ of the upper part of the Quaternary cover. The cross-section is shown in Figure 4.4.7, see Legend in Figure
Tectonic structure, neo-tectonic activity. According to the Tectonic Map of Vilnius City the analysed territory of the land plot part planned to be used falls within Gariūnai structural trough determined according to the lower bedding surface of the Cretaceous system (Figure 4.4.9). Rocks of the Cretaceous system are widespread almost in all Vilnius, excluding paleoincisions where they are eroded by impact of glacier meltwater in the Quaternary period. The structural map of the Cretaceous lower bedding surface shows that rocks of the Cretaceous system are settling in the direction of Southwest and their absolute height in the analysed area is 20-15 m. Gariūnai trough on all four sides is bordered by rift valleys of Vilnius, Neris – Žeimenė, Stakliškės and Semeliškės – Grigiškės which had been active before the Cretaceous period. The map shows neo-tectonic fractures distinguished during previous geological cartographic works at a scale M 150:50 000. It is probable that local structures had also been forming in the Late Cretaceous – Quaternary (it is difficult to identify the precise period, but apparently – mostly towards the end of the Cretaceous period), however, geological data confirming that are unavailable (Stankevičiūtė et al, 2012).
Engineering-Geological Cross-Section A–Aʹ

Environmental Impact Assessment Report for Vilnius Combined Heat and Power Plant
Figure 38: Figure 4.4.9. Fragment of Vilnius City Tectonic Map (M 1: 25 000). Authors: J. Bitinas, J. Čyžienė (Stankevičiūtė et al, 2012)
4.4.2. Potential effects on geological components, subsoil water and groundwater The underground resources have not been explored in the area under consideration. Having regard to the engineering – geological conditions, construction operations being carried out will not cause any adverse effects on the surface of the analysed territory of the land plot part planned to be used, because this surface has already been technologically affected. The subsoil water in the area under review may be polluted if the environmental requirements are disregarded during construction operations or due to penetration of pollutants (fuel, petroleum products) into the soil in the cases of accidents.
4.4.3. Applicable underground and groundwater protection measures With a view to protecting the aquifer horizons existing in the analysed territory of the land plot part planned to be used and guaranteeing the natural protection of groundwater during construction operations, works must
LEGEND
Absolute height of cretaceous formation sole OTHER SYMBOLS
Cretaceous sole izostrata and its
value (abs h., m)
The current cretaceous system rock
spread limit (cogs directed towards
the spread area of rocks)
Name of the tectonic structure
distinguished in cretaceous sole
structural map
Middle Devonian ice formation sole
izostrata (abs h., m)
Middle Devonian ice formation sole
spread limit
Tectonic fracture
Neotectonically active
fracture
Mapping borehole, absolute
value of cretaceous
formation sole, m
Borehole of a different
purpose, absolute value of
cretaceous formation sole, m
Vilnius city boundary
Rivers
Lakes, ponds
Environmental Impact Assessment Report for Vilnius Combined Heat and Power Plant
be carried out only with mechanisms in good technical order so as to prevent the release chemicals being used to the environment.
4.5. Biological Diversity No natural or protected habitats have been identified within the territory of the Land Plot planned to be used for the PEA and in the surrounding vicinity. The locality is predominated by the objects of industrial purpose. Details about biological diversity (biotype, flora and fauna) are provided for that part of territories of the Land Plot planned to be used which include all alternative cases of the PEA site (hereinafter referred to as the ‘Territory’) as well as for the close vicinity the boundaries of which correspond to the borders of the Land Plot, cadastral No 0101/0067:21 (hereinafter referred to as the ‘Land Plot”). Information on flora and fauna is provided in accordance with the corresponding literature (namely, the geographical portal Natural Habitats of EU Importance – http://www. Geoportal.lt/map/; the Lithuanian Red Book of Threatened Species, 2007, Rašomavičius, V. (chief editor) et al., Vilnius, Lututė; Raudonikis L., Species Protected by the EC “Habitats Directive”, Kaunas, 2006), data collected during the exploratory field survey and with the analysis of biotypes.
4.5.1. Current Situation
Information on the biotypes found in the locality The diversity of biotypes is determined by economic activities, physical geographical factors, the type of soil and the relief. The analysed territory where economic activity is planned to be carried out falls within the Land Plot situated in the zone of marked anthropogenic effect. The Land Plot is mostly occupied by various buildings of economic purpose and other structures and facilities (about 70 % of the total area). Natural structures (unbuilt areas covered with herbaceous plants, bushes and overgrowth as well as artificial water bodies) have taken around 30% of the Land Plot area. The northern part of the Land Plot is under a strong anthropogenic effect where many objects of industrial purpose are located with some areas covered with plants typical to unused soil and wasteland. The southern part of the Land Plot has a more diverse natural environment, biotypes are formed by a mosaic of shrubbery and mesophytic meadows.
Information about vegetation In the northern part of the considered Territory volatile communities of ruderal plants can be found. The composition of plants in terms of species depends on the intensity of economic activity (soil disturbance). Species typical to the aforementioned type of communities can be found in the site as follows: couch grass (Elytrigia repens), field brome (Bromus arvensis), scentless false mayweed (Tripleurospermum perforatum), mugwort (Artemisia vulgaris), field pansy (Viola arvensis), common chickweed (Stellaria media), field horsetail (Equisetum arvense), corn spurrey (Spergula arvensis), horseweed (Conyza Canadensis), Canada thistle (Cirsium arvense), blueweed (Echium vulgare), common dandelion (Taraxacum officinale), etc. In the rest undeveloped part of the Territory no economic activity is carried out. The vegetative coverage is composed of shrubs and mesophytic meadows. Overgrowth of woody plants are composed of shrubberies of willows (Salix), bird cherries (Prunus padus). There are also some trees of black alder (Alnus glutinosa), common aspen (Populus tremula), and Norway maple (Acer platanoides). In more open areas some Chinese hawthorns (Crataegus) and common Scots pines (Pinus sylvestris) can be found. Herbaceous plants are more diverse in terms of species. In grass-plots of meadows the true grasses (Graminae) prevail such as: the meadow fescue (Festuca pratensis), Timothy-grass (Phleum pratense), Kentucky bluegrass (Poa Pratensis), common velvetgrass (Holcus lanatus), etc. There are also some Ladys’ mantles (Alchemilla vulgaris), bedstraws (Galium mollugo), red clovers (Trifoliu pretense), common dandelions (Taraxacum officinale), etc. Natural structures of the Land Plot (areas of land not built on which contain meadows, trees, bushes and small artificial water bodies) are fragmentary, there are also urbanised-technogenic territories, access roads,
Environmental Impact Assessment Report for Vilnius Combined Heat and Power Plant
railways. The degree of naturalness of the natural environment differs subject to the intensity of activities carried out. There are cultivated lawns with prevailing true grasses around the buildings within the territory of Vilnius thermal power plant. Woody plants cover small areas only. In the northern and north-western part of the Land Plot warehouses of different companies are established and structures for mechanical and biological processing of municipal waste are being built by VAATC, UAB. The components of natural environment in these territories are constituted by herbaceous communities and shrubberies of willows (Salix), bird cherries (Prunus padus) and hawthorns (Crataegus) as well as by the outgrowth of black alder (Alnus glutinosa), common aspen (Populus tremula) which have developed in open unbuilt areas. Species of herbaceous vegetation vary subject to the moisture level and edaphic conditions. In dry soils and by the roadsides ruderal plants and vegetation typical to waste grounds prevail. In the south-west part of the Land Plot biotypes affected by artificial water bodies determine a wider variety of vegetation. On the coasts of water bodies macrophytes flourish.
Information on fauna No animal species included in the List of Protected Animals, Plants and Fungi Species of the Republic of Lithuania (hereinafter referred to as the ‘List of Protected Species’) and Annexes II and IV to the EC Habitats Directive (hereinafter referred to as the ‘Habitats Directive’) have been identified in the territory. In those parts of the Land Plot where intense economic activities are carried out the following synanthropic species of birds have been noticed: the house sparrow (Passer domesticus), the rock dove (Columbia livia), the carrion crow (Corvus corone). In the part of the Land Plot not built on (where the mosaic of meadows and trees and shruberries have developed) such birds as the common blackbird (Turdus merula) and the song thrush (Turdus philomelos), the great tit (Parus major), marsh tit (Parus palustris), the common chiffchaff (Phylloscopus collybita), the wood warbler (Phyloscopus sibilatric), the Eurasian blackcap (Sylvia atricapilla) have been noticed. As the Land Plot is situated in an urbanised territory and the natural environment is affected by the anthropogenic activity carried out, only the species of small mammals are found. Small rodents prevail, sometimes the European hare (Lepus eurapaeus) can be noticed.
Protected Areas The Land Plot in which the analysed Territory where economic activity is planned is situated is not included in the list of protected or NATURA 2000 territories and has no boundaries with such territories. In the vicinity, at the distance from 0.95 to 2 km three protected areas and one territory of NATURA 2000 network can be found. HCA of Neris River Habitat conservation area (territories important for the habitat protection) (hereinafter referred to as the ‘HCA’) of Neris River was established by Order No D1-210 of the Minister of Environment of the Republic of Lithuania of 22 April 2009 with the aim to preserve natural habitats of European importance, namely, the rapids of 3,620 rivers with water crowfoot communities and fluvial species: the Baltic salmon, the European bitterling, the spined loach, the bullhead, the green club-tailed dragonfly, the Aral asp, the otter, the river lamprey. The Territory in which economic activity is planned is situated at the distance of 0.95 km from the HCA boundaries. Paneriai landscape reserve of erosive hill creep (municipal) The reserve was established by Decision No 1-2023 of the Municipal Council of Vilnius City of 24 September 2014 with the aim to preserve the erosive hill creep within the zone of areas surrounding the valley on the riverside of Neris as well as the growth places of rare plants (the dark red helleborine, the long-bracted green orchid, the wild garlic); also cultural and historical objects (the Vilnius – Kaunas railway tunnel and a section of the old Vilnius-Kaunas road).
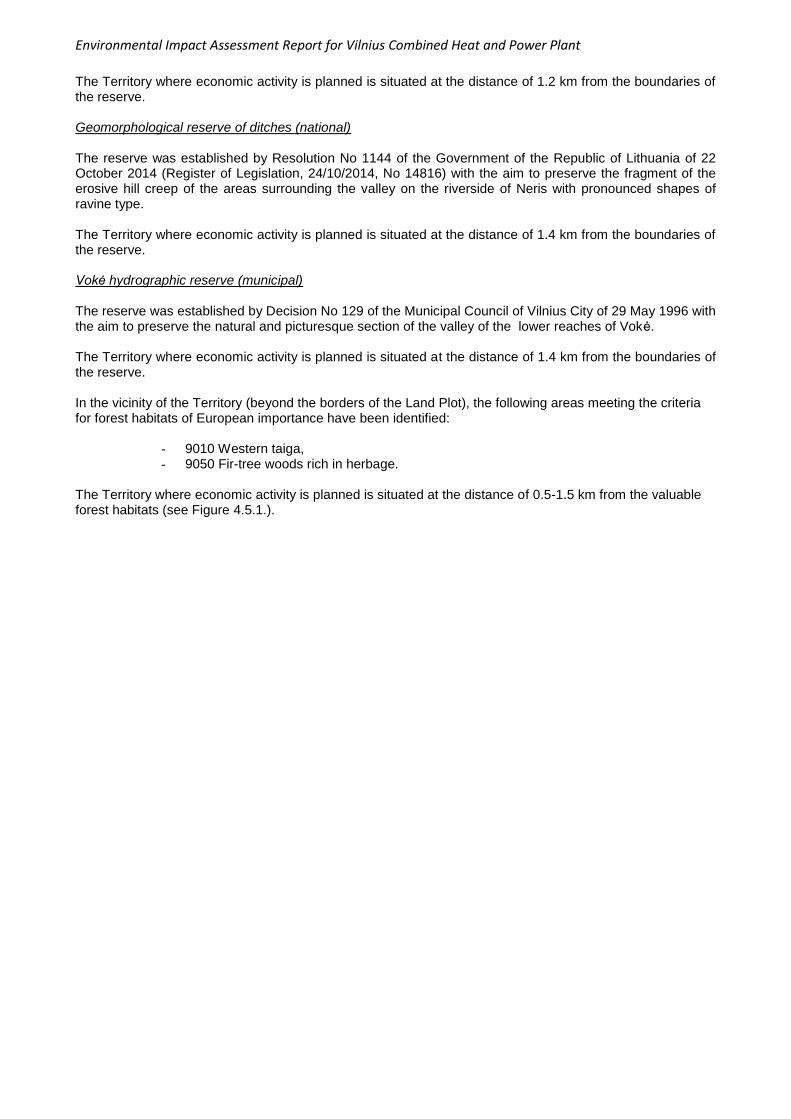
Environmental Impact Assessment Report for Vilnius Combined Heat and Power Plant
The Territory where economic activity is planned is situated at the distance of 1.2 km from the boundaries of the reserve. Geomorphological reserve of ditches (national) The reserve was established by Resolution No 1144 of the Government of the Republic of Lithuania of 22 October 2014 (Register of Legislation, 24/10/2014, No 14816) with the aim to preserve the fragment of the erosive hill creep of the areas surrounding the valley on the riverside of Neris with pronounced shapes of ravine type. The Territory where economic activity is planned is situated at the distance of 1.4 km from the boundaries of the reserve. Vokė hydrographic reserve (municipal) The reserve was established by Decision No 129 of the Municipal Council of Vilnius City of 29 May 1996 with the aim to preserve the natural and picturesque section of the valley of the lower reaches of Vokė. The Territory where economic activity is planned is situated at the distance of 1.4 km from the boundaries of the reserve. In the vicinity of the Territory (beyond the borders of the Land Plot), the following areas meeting the criteria for forest habitats of European importance have been identified:
- 9010 Western taiga, - 9050 Fir-tree woods rich in herbage.
The Territory where economic activity is planned is situated at the distance of 0.5-1.5 km from the valuable forest habitats (see Figure 4.5.1.).
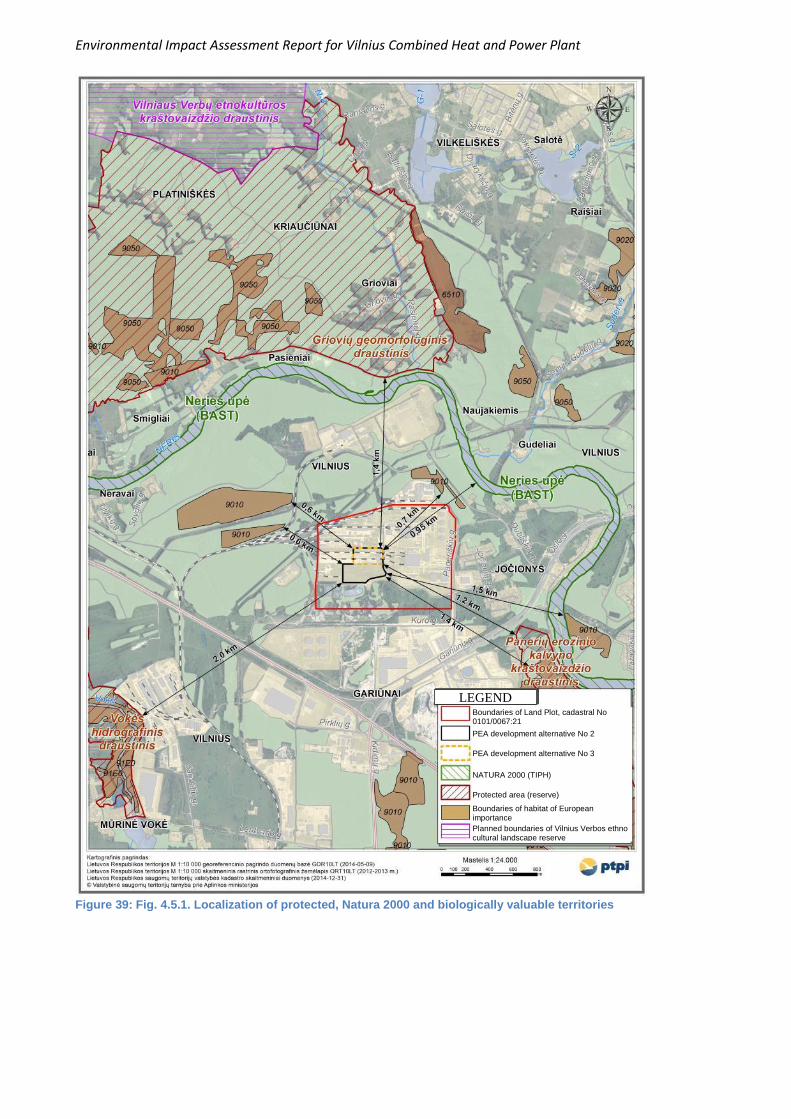
Environmental Impact Assessment Report for Vilnius Combined Heat and Power Plant
Figure 39: Fig. 4.5.1. Localization of protected, Natura 2000 and biologically valuable territories
LEGEND Boundaries of Land Plot, cadastral No 0101/0067:21
PEA development alternative No 2
PEA development alternative No 3
NATURA 2000 (TIPH)
Protected area (reserve)
Boundaries of habitat of European importance
Planned boundaries of Vilnius Verbos ethno cultural landscape reserve
Environmental Impact Assessment Report for Vilnius Combined Heat and Power Plant
4.5.2. Potential (Anticipated) Impact on the Biological Diversity and Protected Areas All protected, Natura 2000 and biologically significant territories in the close vicinity of the Territory are at an adequate distance, therefore, the planned economic activity will have no negative effect on the valuables of the protected areas. The Land Plot in which the planned economic activity is to be carried out is located in the urbanised territory intended for industrial activities. There are no valuable planting in the Land Plot and the PEA territory, no animal and plant species included in the List of Protected Species have been detected. The planned economic activity will have no significant impact on the natural environment, namely, on flora, fauna and protected areas.
4.5.3. Planned Mitigation Measures to Reduce Impact on Biodiversity The planned economic activity will have no significant impact on biodiversity, namely, flora, fauna and protected areas, therefore, no impact mitigating measures are planned.
4.6. Landscape
4.6.1. Current Situation
In general terms, landscape is understood as a mosaic-like territorial and spatial combination of the locality the development of which is affected by natural factors and human economic activity. The basis of material landscape in Lithuania was mostly affected by the processes which took place during the last ice-age and in some areas – by geomorphological processes which have been taking place until the present time. The areas of the surface shaped by corresponding geomorphological processes which differ in their constituents of the landscape, namely, land, relief, internal waters, underground air, soil, vegetation, animals, etc. are called terrain views. Of nine types of terrain views identified in the territory of Lithuania, the analysed territory of the Land Plot planned to be used for economic activities is attributed to terraced river valleys (Lithuania’s national atlas, accessed over the Internet: www.geoportal.lt). In terms of morphological categorisation of landscape, the considered territory of the part of the Land Plot planned to be used falls within the zone of the wooded urbanised territories situated along the valleys spread out in the middle of the Neris river (35) in the lowland part of the middle of the Neris river (XV) of the Southern Baltic Lowlands section (F) (Lithuania’s national atlas, accessed over the Internet: www.geoportal.lt). The surroundings of the analysed territory of the Land Plot area planned to be used is dominated by cultured, agrarian urbanised and typical to valleys landscape which is complemented by the height of urban complexes. As it is located in the territory intended for business, manufacturing, and industrial activities, the visual environment of the concerned territory of the Land Plot area planned to be used is poor from the aesthetical point of view.
Boundaries of habitats of European importance
Boundaries of the planned Vilnius Verbos
(palms)
ethno cultural landscape reserve

Environmental Impact Assessment Report for Vilnius Combined Heat and Power Plant
The objective indicators of the landscape components existing in the vicinity of the planned economic activity (Table 4.6.1.) determine the characteristics of the landscape concerned and its visual character. The indicators were defined using the ‘Methodology for the Determination of Visual Pollution in Natural Landscape Complexes and Objects’ (Ministry of Environment of the Republic of Lithuania, 2015). Table 40: Table 4.6.1. Assessment of Objective Indicators of Landscape Components in the Vicinity of PEA
Landscape component
Objective indicators
Relief Scale and character: forms of meso-relief – terraced forms of the relief of the Neris river which are surrounded by erosive hill creeps of areas new valleys as well as terraced sandy plains
Height: varies from 77.7 to 203.2 m of absolute height
The prevailing angle of inclination: 0°-30°
-
Water bodies Scale and character: In the surrounding area the Neris, Vokė, Sudervė, V-1, N-8, G-1 and S-2 rivers flow as well as the lakes of Gelūžė, Salotė and Baltieša can be found
Size: The largest river Neris which is 509 km long, the area of the basin amounts to 24.942,3 km
2.
The largest lake – Gelūžė, the area of which amounts to 25.7 ha
Number of formations: In the concerned zone of visual impact three lakes and seven rivers can be found
-
Flora Height: 20-40 m
Composition in terms of species: pines and fir trees dominate
Spatial structure: Slopes and terraces of the river Neris covered with forests and plantings
Number of formations: The zone of visual impact contains around 3,000 ha of forests
Structures/buildings Size: The height of buildings varies from one-floor structures with the attic up to 326 m (the tower of Lietuvos Radijas ir Televizija, UAB)
Spatial structure, types of structures: Residential blocks of apartments prevail but some objects of industrial purpose can be also found
Number of formations: In the zone of visual impact, there are around 7,500 buildings
Materials used: Stone, bricks, wood, RC, asbestos-cement panels, tiling
Referring to the categorisation of visual structure of the Lithuanian landscape, the visual structure in the vicinity of the PEA can be described as having especially pronounced vertical fragmentation with semi-closed and partially viewable space with pronounced complexes of vertical and horizontal dominants (V3H1-a). More picturesque territories can be found at the whereabouts of Geomorphological reserve of ditches to the north from the PEA and to the south-east from PEA at the whereabouts of Paneriai landscape reserve of erosive hill creep.
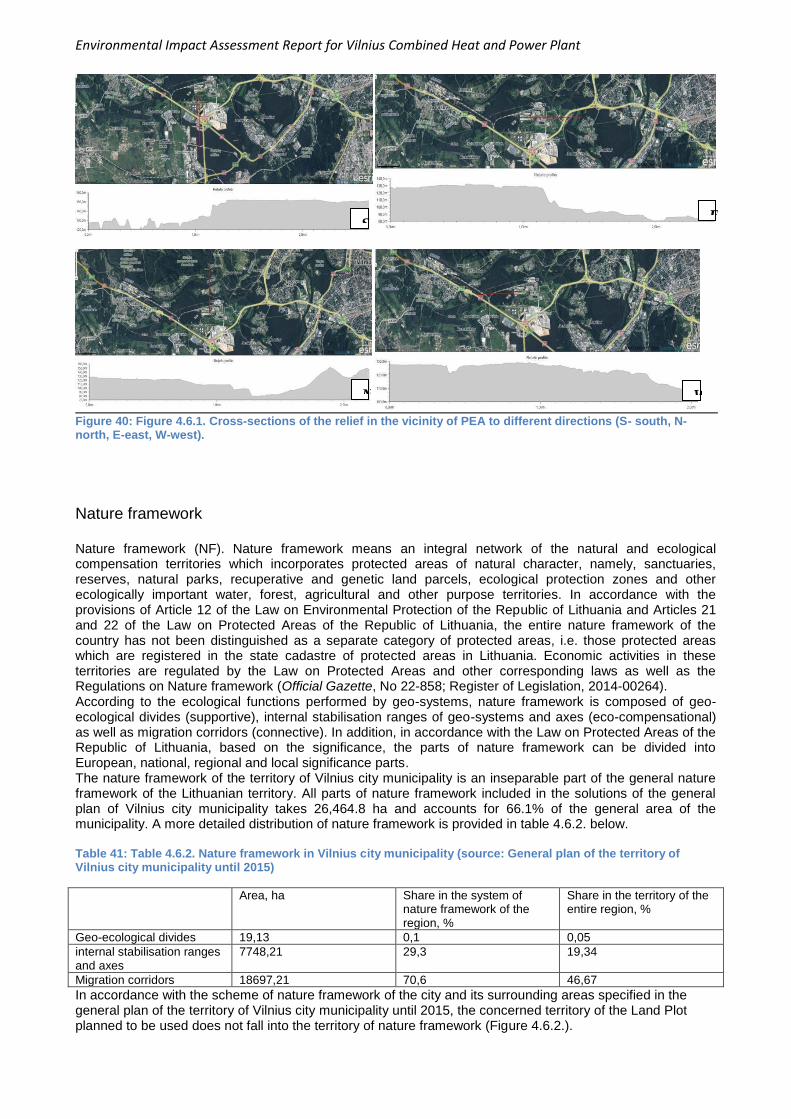
Environmental Impact Assessment Report for Vilnius Combined Heat and Power Plant
Figure 40: Figure 4.6.1. Cross-sections of the relief in the vicinity of PEA to different directions (S- south, N-north, E-east, W-west).
Nature framework Nature framework (NF). Nature framework means an integral network of the natural and ecological compensation territories which incorporates protected areas of natural character, namely, sanctuaries, reserves, natural parks, recuperative and genetic land parcels, ecological protection zones and other ecologically important water, forest, agricultural and other purpose territories. In accordance with the provisions of Article 12 of the Law on Environmental Protection of the Republic of Lithuania and Articles 21 and 22 of the Law on Protected Areas of the Republic of Lithuania, the entire nature framework of the country has not been distinguished as a separate category of protected areas, i.e. those protected areas which are registered in the state cadastre of protected areas in Lithuania. Economic activities in these territories are regulated by the Law on Protected Areas and other corresponding laws as well as the Regulations on Nature framework (Official Gazette, No 22-858; Register of Legislation, 2014-00264). According to the ecological functions performed by geo-systems, nature framework is composed of geo- ecological divides (supportive), internal stabilisation ranges of geo-systems and axes (eco-compensational) as well as migration corridors (connective). In addition, in accordance with the Law on Protected Areas of the Republic of Lithuania, based on the significance, the parts of nature framework can be divided into European, national, regional and local significance parts. The nature framework of the territory of Vilnius city municipality is an inseparable part of the general nature framework of the Lithuanian territory. All parts of nature framework included in the solutions of the general plan of Vilnius city municipality takes 26,464.8 ha and accounts for 66.1% of the general area of the municipality. A more detailed distribution of nature framework is provided in table 4.6.2. below. Table 41: Table 4.6.2. Nature framework in Vilnius city municipality (source: General plan of the territory of Vilnius city municipality until 2015)
Area, ha Share in the system of nature framework of the region, %
Share in the territory of the entire region, %
Geo-ecological divides 19,13 0,1 0,05
internal stabilisation ranges and axes
7748,21 29,3 19,34
Migration corridors 18697,21 70,6 46,67
In accordance with the scheme of nature framework of the city and its surrounding areas specified in the general plan of the territory of Vilnius city municipality until 2015, the concerned territory of the Land Plot planned to be used does not fall into the territory of nature framework (Figure 4.6.2.).
S
N
E
W
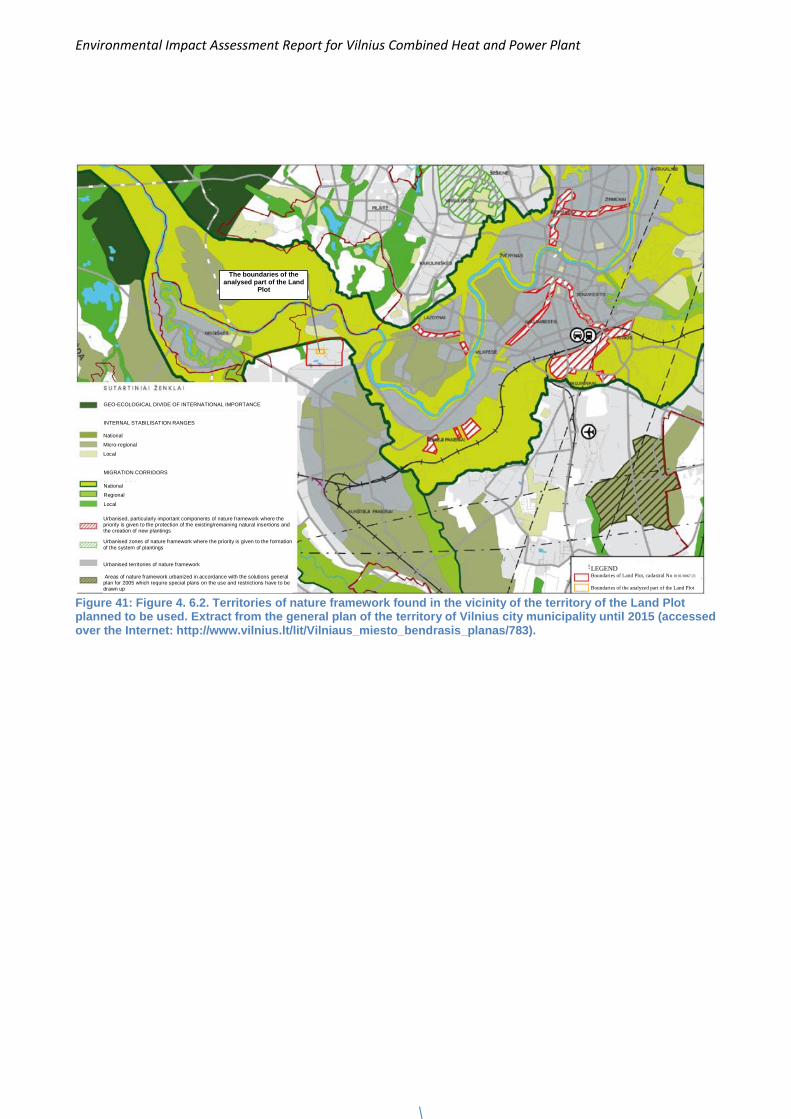
Environmental Impact Assessment Report for Vilnius Combined Heat and Power Plant
Figure 41: Figure 4. 6.2. Territories of nature framework found in the vicinity of the territory of the Land Plot planned to be used. Extract from the general plan of the territory of Vilnius city municipality until 2015 (accessed over the Internet: http://www.vilnius.lt/lit/Vilniaus_miesto_bendrasis_planas/783).
LEGEND Boundaries of Land Plot, cadastral No 0101/0067:21
Boundaries of the analyzed part of the Land Plot
National
Micro-regional
Local
INTERNAL STABILISATION RANGES
GEO-ECOLOGICAL DIVIDE OF INTERNATIONAL IMPORTANCE
MIGRATION CORRIDORS
National
Regional
Local
National
Regional
Local
Urbanised, particularly important components of nature framework where the priority is given to the protection of the existing/remaining natural insertions and the creation of new plantings
Urbanised zones of nature framework where the priority is given to the formation
of the system of plantings
Urbanised territories of nature framework
Areas of nature framework urbanized in accordance with the solutions general plan for 2005 which require special plans on the use and restrictions have to be drawn up
The boundaries of the analysed part of the Land
Plot
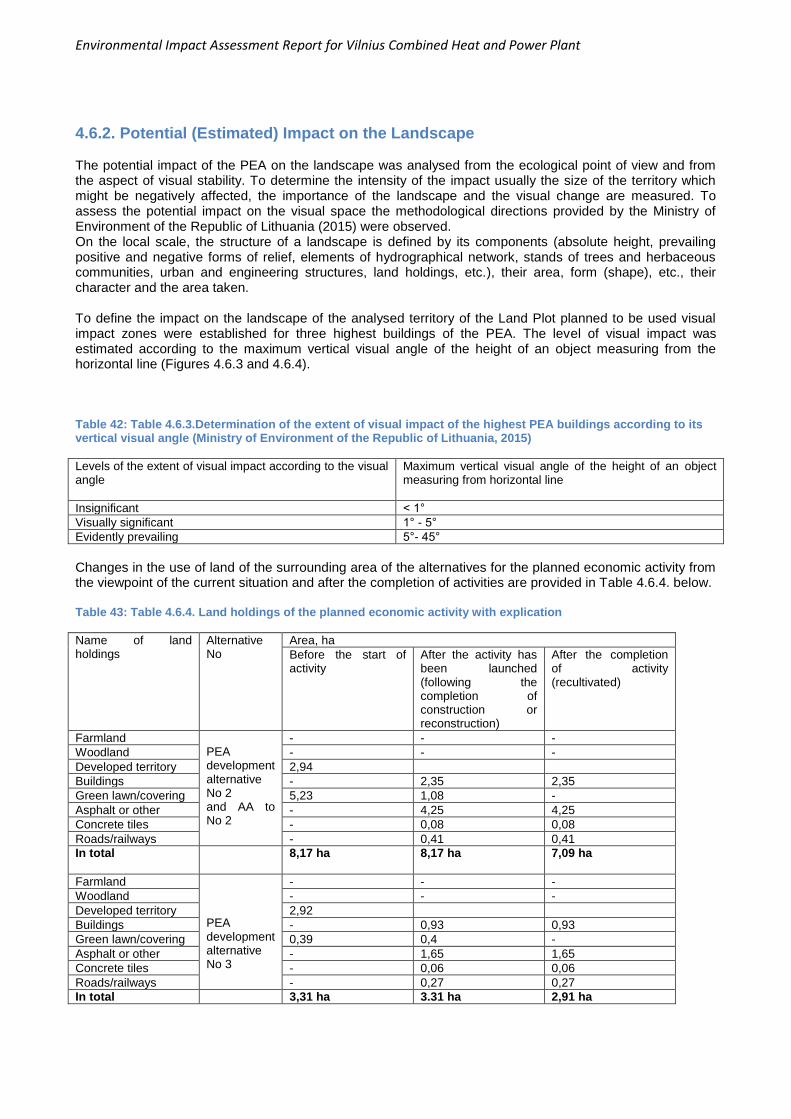
Environmental Impact Assessment Report for Vilnius Combined Heat and Power Plant
4.6.2. Potential (Estimated) Impact on the Landscape The potential impact of the PEA on the landscape was analysed from the ecological point of view and from the aspect of visual stability. To determine the intensity of the impact usually the size of the territory which might be negatively affected, the importance of the landscape and the visual change are measured. To assess the potential impact on the visual space the methodological directions provided by the Ministry of Environment of the Republic of Lithuania (2015) were observed. On the local scale, the structure of a landscape is defined by its components (absolute height, prevailing positive and negative forms of relief, elements of hydrographical network, stands of trees and herbaceous communities, urban and engineering structures, land holdings, etc.), their area, form (shape), etc., their character and the area taken. To define the impact on the landscape of the analysed territory of the Land Plot planned to be used visual impact zones were established for three highest buildings of the PEA. The level of visual impact was estimated according to the maximum vertical visual angle of the height of an object measuring from the horizontal line (Figures 4.6.3 and 4.6.4). Table 42: Table 4.6.3.Determination of the extent of visual impact of the highest PEA buildings according to its vertical visual angle (Ministry of Environment of the Republic of Lithuania, 2015)
Levels of the extent of visual impact according to the visual angle
Maximum vertical visual angle of the height of an object measuring from horizontal line
Insignificant < 1°
Visually significant 1° - 5°
Evidently prevailing 5°- 45°
Changes in the use of land of the surrounding area of the alternatives for the planned economic activity from the viewpoint of the current situation and after the completion of activities are provided in Table 4.6.4. below. Table 43: Table 4.6.4. Land holdings of the planned economic activity with explication
Name of land holdings
Alternative No
Area, ha
Before the start of activity
After the activity has been launched (following the completion of construction or reconstruction)
After the completion of activity (recultivated)
Farmland PEA development alternative No 2 and AA to No 2
- - -
Woodland - - -
Developed territory 2,94
Buildings - 2,35 2,35
Green lawn/covering 5,23 1,08 -
Asphalt or other - 4,25 4,25
Concrete tiles - 0,08 0,08
Roads/railways - 0,41 0,41
In total 8,17 ha
8,17 ha 7,09 ha
Farmland PEA development alternative No 3
- - -
Woodland - - -
Developed territory 2,92
Buildings - 0,93 0,93
Green lawn/covering 0,39 0,4 -
Asphalt or other - 1,65 1,65
Concrete tiles - 0,06 0,06
Roads/railways - 0,27 0,27
In total 3,31 ha 3.31 ha 2,91 ha
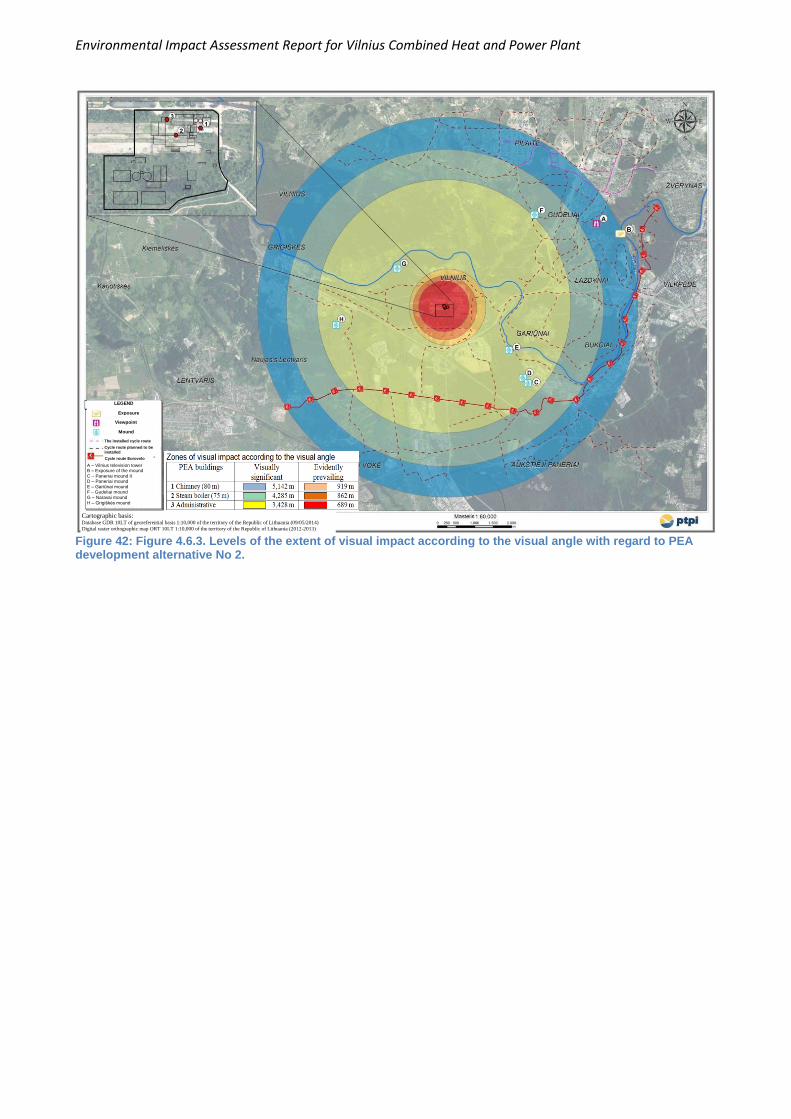
Environmental Impact Assessment Report for Vilnius Combined Heat and Power Plant
Figure 42: Figure 4.6.3. Levels of the extent of visual impact according to the visual angle with regard to PEA development alternative No 2.
Cartographic basis: Database GDR 10LT of georeferential basis 1:10,000 of the territory of the Republic of Lithuania (09/05/2014)
Digital raster orthographic map ORT 10LT 1:10,000 of the territory of the Republic of Lithuania (2012-2013)
A – Vilnius television tower B – Exposure of the mound C – Paneriai mound II D – Paneriai mound E – Gariūnai mound F – Gudeliai mound
G – Naravai mound H – Grigiškės mound
LEGEND
Exposure
Viewpoint
Mound
The installed cycle route
Cycle route planned to be
installed
Cycle route Eurovelo
Environmental Impact Assessment Report for Vilnius Combined Heat and Power Plant
Figure 43: Figure 4.6.4. Levels of the extent of visual impact according to the visual angle with regard to PEA development alternative No 3.
Impact on the visual quality of landscape To assess the impact on visual quality of the landscape of the surrounding areas of the planned economic activity ArcGIS software was used. In accordance with the methodological directions of the Ministry of Environment of the Republic of Lithuania (2015) visibility of the highest PEA buildings were calculated. Visibility was determined using Viewshed tool of ArcGIS software. The results of the visibility analysis of the highest buildings of the planned economic activity (namely, the structures of chimney, administrative and control buildings, steam boiler) are depicted in Figure 4.6.5. Given the relief in the vicinity of PEA, the height of the manufacturing buildings (chimneys are up to 250 m high) and the forests, a statement could be drawn that no changes will be caused to the visual quality of the landscape. Taking into consideration the visibility analysis, we can see that the highest buildings of the planned economic activity, except for the cycle route Eurovelo, will not be seen from the nearby territories of cultural heritage objects.
4.6.3. Mitigation Measures to Reduce Potential Impact on Landscape Having assessed the existing composition of territorial and spatial dominants of the locality, it would be possible to forecast that the PEA will have no impact on the general structure of the landscape of the locality but will have visual and aesthetical effect which will be determined by the massiveness of the main buildings of the power plant (administrative and control building, the building of steam boiler) and great height of some buildings (chimney). Measures intended for the reduction of visual and aesthetical impact are technologically inapplicable due to considerable height of the object. Aesthetical impact will have to be mitigated at other stages of the territory planning and technical construction project by choosing those architectural and design solutions which are more appropriate and by specifying the regulation on the development of the Land Plot.
Scale 1:60.000
LEGEND
Eurovelo
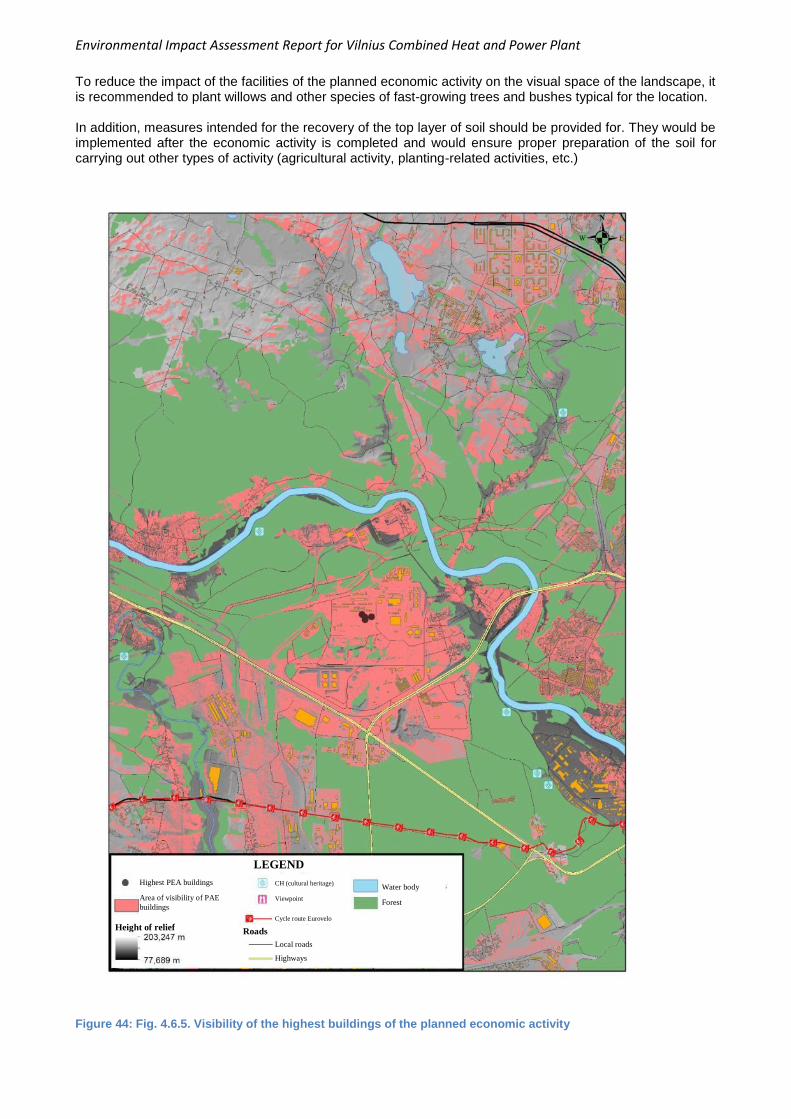
Environmental Impact Assessment Report for Vilnius Combined Heat and Power Plant
To reduce the impact of the facilities of the planned economic activity on the visual space of the landscape, it is recommended to plant willows and other species of fast-growing trees and bushes typical for the location. In addition, measures intended for the recovery of the top layer of soil should be provided for. They would be implemented after the economic activity is completed and would ensure proper preparation of the soil for carrying out other types of activity (agricultural activity, planting-related activities, etc.)
Figure 44: Fig. 4.6.5. Visibility of the highest buildings of the planned economic activity
Highest PEA buildings
Area of visibility of PAE
buildings
Height of relief Roads
LEGEND
Water body
Forest
Local roads
Highways
CH (cultural heritage)
Viewpoint
Cycle route Eurovelo

Environmental Impact Assessment Report for Vilnius Combined Heat and Power Plant
4.7. Social – Economic Environment The project of Vilnius co-generation power plant complies with the provisions of the EU directives on the use of renewable energy sources (Directive 2009/28/EC), on industrial emissions and integrated pollution prevention and control (Directive 2010/75/EU), on the use of cogeneration and increase of efficiency in energy consumption (Directive 2012/27/EU), on the use of waste (Directive 2008/98/EC), etc. The planned economic activity corresponds to the future vision of the Lithuanian energy sector, strategic goals and objectives set forth in the strategy approved by Resolution No X-2133 of the Seimas of the Republic of Lithuania of 26 June 2012 ‘On the Approval of the National Energy Independence Strategy’. The national energy independence strategy distinguishes energy independence as the most important priority in the energy industry until 2020. The development of high-efficiency cogeneration using biomass and (or) municipal waste contributes to the national goals related to the increase of energy independence, increase of the share of RES in the energy production, reduction of GHG emissions. It should be noted that the form of implementation and the capacities of Vilnius Combined Heat and Power Plant are established in the National Heat Sector Development Programme for 2015-2021 which was approved by Resolution No 284 of the Government of the Republic of Lithuania of 18 March 2015. Waste management by sorting it and using as a secondary raw material or fuel is promoted with regard to the sustainable development [principle] and this corresponds to the goals of the National Waste Management Plan for 2014-2020
28. When waste is used for energy generation, raw materials are saved, the
area taken by dumps is reduced, besides, new jobs are created which corresponds to the goals of strategy EUROPE 2020.
4.7.1. Current Social-Economic Environment Vilnius city municipality includes Vilnius, the capital city of the Republic of Lithuania and the biggest city of Lithuania, the centres of Vilnius county, district and city municipality. The territory of Vilnius city municipality is divided into 21 elderships. The area of the city amounts to around 401 square kilometres. Forests take as much as 35.6% of the entire territory of Vilnius municipality, developed area accounts for 34.8%, roads – for 4.8 %, water bodies – for 1.5%, land holdings – for 20.7%, other land – for 2.6%
29.
Inhabitants Unlike the indicators of the rest of the country, the population of Vilnius has increased in recent years. In the last five years the number of Vilnius city dwellers has changed by only 3,500 (~0.65%). In 2014, the population of Vilnius city municipality was 539 700. According to forecasts, in 2020 the population of Vilnius will reach 576 000 (↑7%), and the number of people using the infrastructure of the city including those who arrive to work here will amount to as many as 716 000
30.
Table 44: Table 4.7.1. Population
Administrative territory
2010 2011 2012 2013 2014
Lithuania 3 141 976 3 052 588 3 003 641 2 971 905 2 943 472
Vilnius city municipality
543 191 536 127 533 279 537 152 539 707
Source: Lithuanian Department of Statistics
28
Official Gazette, 2002, No 40-1499, with all amendments. Access over the Internet:
http://www3.lrs.lt/pls/inter3/dokpaieska.showdoc_l?p_id=470278 [viewed on 28/04/2015] 29
Access over the Internet: http://regional.stat.gov.lt/lt/vilniaus_apskritis/vilniaus_miesto_savivaldybe.html [viewed on
28/04/2015] 30
Vilnius City Sustainable Energy Action Plan. September, 2013. Access over the Internet:
http://www.vilnius/lt/pvstest/subsystems/web/doc.php?itemID=4648
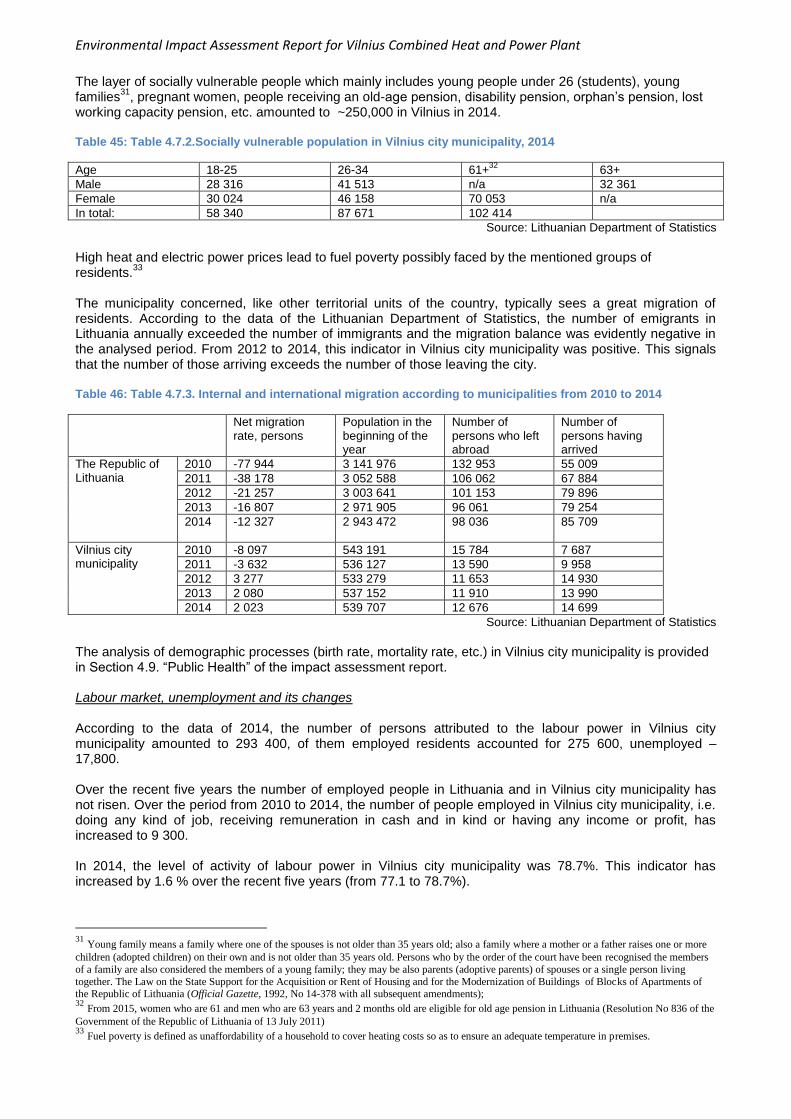
Environmental Impact Assessment Report for Vilnius Combined Heat and Power Plant
The layer of socially vulnerable people which mainly includes young people under 26 (students), young families
31, pregnant women, people receiving an old-age pension, disability pension, orphan’s pension, lost
working capacity pension, etc. amounted to ~250,000 in Vilnius in 2014. Table 45: Table 4.7.2.Socially vulnerable population in Vilnius city municipality, 2014
Age 18-25 26-34 61+32
63+
Male 28 316 41 513 n/a 32 361
Female 30 024 46 158 70 053 n/a
In total: 58 340 87 671 102 414
Source: Lithuanian Department of Statistics
High heat and electric power prices lead to fuel poverty possibly faced by the mentioned groups of residents.
33
The municipality concerned, like other territorial units of the country, typically sees a great migration of residents. According to the data of the Lithuanian Department of Statistics, the number of emigrants in Lithuania annually exceeded the number of immigrants and the migration balance was evidently negative in the analysed period. From 2012 to 2014, this indicator in Vilnius city municipality was positive. This signals that the number of those arriving exceeds the number of those leaving the city. Table 46: Table 4.7.3. Internal and international migration according to municipalities from 2010 to 2014
Net migration rate, persons
Population in the beginning of the year
Number of persons who left abroad
Number of persons having arrived
The Republic of Lithuania
2010 -77 944 3 141 976 132 953 55 009
2011 -38 178 3 052 588 106 062 67 884
2012 -21 257 3 003 641 101 153 79 896
2013 -16 807 2 971 905 96 061 79 254
2014 -12 327 2 943 472 98 036 85 709
Vilnius city municipality
2010 -8 097 543 191 15 784 7 687
2011 -3 632 536 127 13 590 9 958
2012 3 277 533 279 11 653 14 930
2013 2 080 537 152 11 910 13 990
2014 2 023 539 707 12 676 14 699
Source: Lithuanian Department of Statistics
The analysis of demographic processes (birth rate, mortality rate, etc.) in Vilnius city municipality is provided in Section 4.9. “Public Health” of the impact assessment report. Labour market, unemployment and its changes According to the data of 2014, the number of persons attributed to the labour power in Vilnius city municipality amounted to 293 400, of them employed residents accounted for 275 600, unemployed – 17,800. Over the recent five years the number of employed people in Lithuania and in Vilnius city municipality has not risen. Over the period from 2010 to 2014, the number of people employed in Vilnius city municipality, i.e. doing any kind of job, receiving remuneration in cash and in kind or having any income or profit, has increased to 9 300. In 2014, the level of activity of labour power in Vilnius city municipality was 78.7%. This indicator has increased by 1.6 % over the recent five years (from 77.1 to 78.7%).
31
Young family means a family where one of the spouses is not older than 35 years old; also a family where a mother or a father raises one or more
children (adopted children) on their own and is not older than 35 years old. Persons who by the order of the court have been recognised the members
of a family are also considered the members of a young family; they may be also parents (adoptive parents) of spouses or a single person living
together. The Law on the State Support for the Acquisition or Rent of Housing and for the Modernization of Buildings of Blocks of Apartments of the Republic of Lithuania (Official Gazette, 1992, No 14-378 with all subsequent amendments); 32
From 2015, women who are 61 and men who are 63 years and 2 months old are eligible for old age pension in Lithuania (Resolution No 836 of the
Government of the Republic of Lithuania of 13 July 2011) 33
Fuel poverty is defined as unaffordability of a household to cover heating costs so as to ensure an adequate temperature in premises.
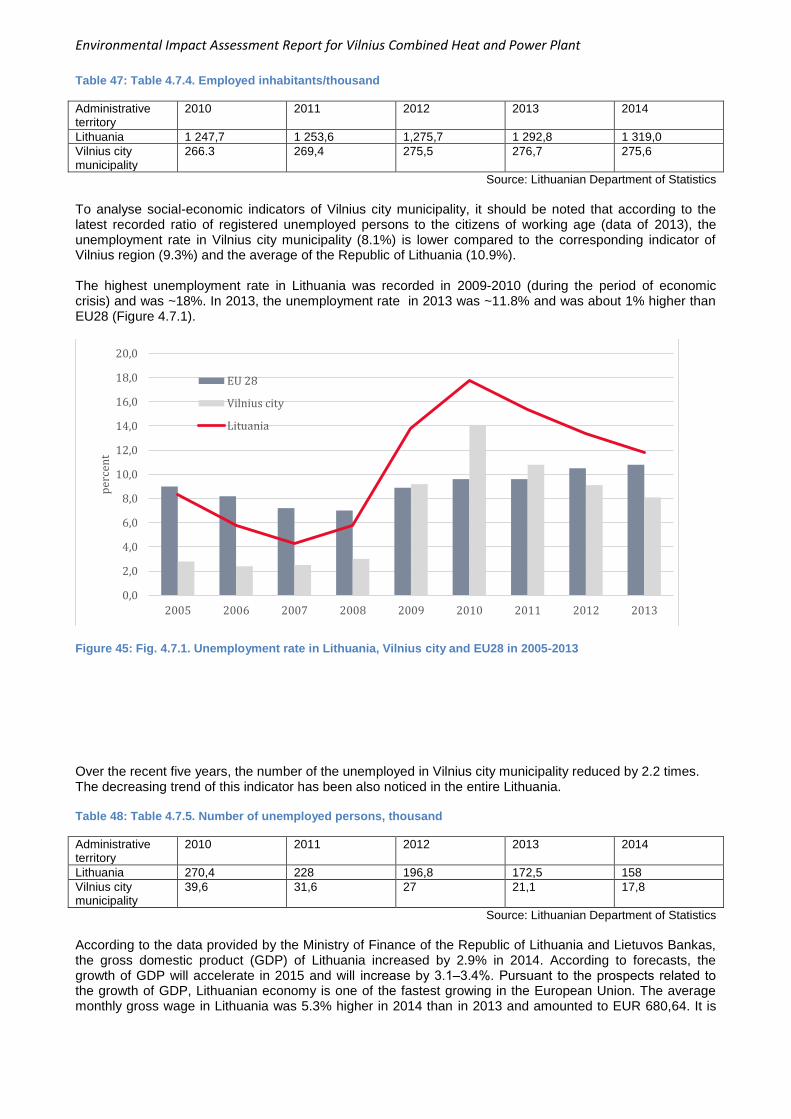
Environmental Impact Assessment Report for Vilnius Combined Heat and Power Plant
Table 47: Table 4.7.4. Employed inhabitants/thousand
Administrative territory
2010 2011 2012 2013 2014
Lithuania 1 247,7 1 253,6 1,275,7 1 292,8 1 319,0
Vilnius city municipality
266.3 269,4 275,5 276,7 275,6
Source: Lithuanian Department of Statistics
To analyse social-economic indicators of Vilnius city municipality, it should be noted that according to the latest recorded ratio of registered unemployed persons to the citizens of working age (data of 2013), the unemployment rate in Vilnius city municipality (8.1%) is lower compared to the corresponding indicator of Vilnius region (9.3%) and the average of the Republic of Lithuania (10.9%). The highest unemployment rate in Lithuania was recorded in 2009-2010 (during the period of economic crisis) and was ~18%. In 2013, the unemployment rate in 2013 was ~11.8% and was about 1% higher than EU28 (Figure 4.7.1).
Figure 45: Fig. 4.7.1. Unemployment rate in Lithuania, Vilnius city and EU28 in 2005-2013
Over the recent five years, the number of the unemployed in Vilnius city municipality reduced by 2.2 times. The decreasing trend of this indicator has been also noticed in the entire Lithuania. Table 48: Table 4.7.5. Number of unemployed persons, thousand
Administrative territory
2010 2011 2012 2013 2014
Lithuania 270,4 228 196,8 172,5 158
Vilnius city municipality
39,6 31,6 27 21,1 17,8
Source: Lithuanian Department of Statistics
According to the data provided by the Ministry of Finance of the Republic of Lithuania and Lietuvos Bankas, the gross domestic product (GDP) of Lithuania increased by 2.9% in 2014. According to forecasts, the growth of GDP will accelerate in 2015 and will increase by 3.1‒3.4%. Pursuant to the prospects related to the growth of GDP, Lithuanian economy is one of the fastest growing in the European Union. The average monthly gross wage in Lithuania was 5.3% higher in 2014 than in 2013 and amounted to EUR 680,64. It is
0,0
2,0
4,0
6,0
8,0
10,0
12,0
14,0
16,0
18,0
20,0
2005 2006 2007 2008 2009 2010 2011 2012 2013
per
cen
t
EU 28
Vilnius city
Lituania
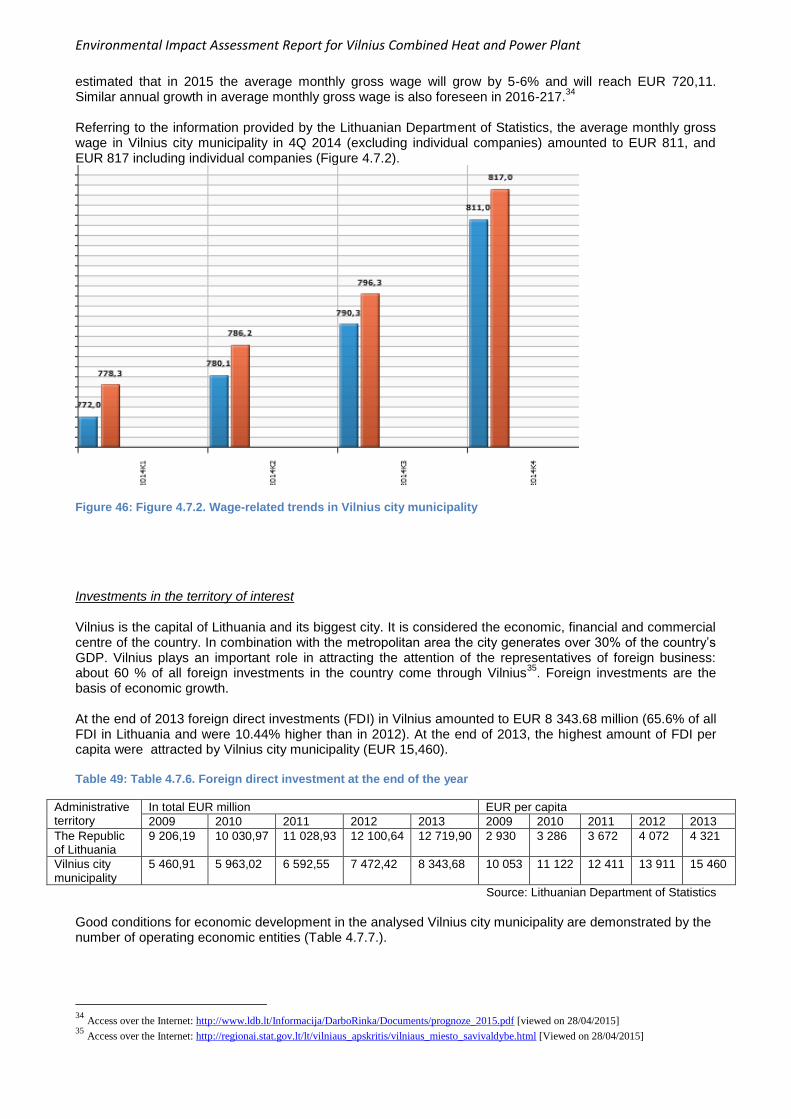
Environmental Impact Assessment Report for Vilnius Combined Heat and Power Plant
estimated that in 2015 the average monthly gross wage will grow by 5-6% and will reach EUR 720,11. Similar annual growth in average monthly gross wage is also foreseen in 2016-217.
34
Referring to the information provided by the Lithuanian Department of Statistics, the average monthly gross wage in Vilnius city municipality in 4Q 2014 (excluding individual companies) amounted to EUR 811, and EUR 817 including individual companies (Figure 4.7.2).
Figure 46: Figure 4.7.2. Wage-related trends in Vilnius city municipality
Investments in the territory of interest
Vilnius is the capital of Lithuania and its biggest city. It is considered the economic, financial and commercial centre of the country. In combination with the metropolitan area the city generates over 30% of the country’s GDP. Vilnius plays an important role in attracting the attention of the representatives of foreign business: about 60 % of all foreign investments in the country come through Vilnius
35. Foreign investments are the
basis of economic growth. At the end of 2013 foreign direct investments (FDI) in Vilnius amounted to EUR 8 343.68 million (65.6% of all FDI in Lithuania and were 10.44% higher than in 2012). At the end of 2013, the highest amount of FDI per capita were attracted by Vilnius city municipality (EUR 15,460). Table 49: Table 4.7.6. Foreign direct investment at the end of the year
Administrative territory
In total EUR million EUR per capita
2009 2010 2011 2012 2013 2009 2010 2011 2012 2013
The Republic of Lithuania
9 206,19 10 030,97 11 028,93 12 100,64 12 719,90 2 930 3 286 3 672 4 072 4 321
Vilnius city municipality
5 460,91 5 963,02 6 592,55 7 472,42 8 343,68 10 053 11 122 12 411 13 911 15 460
Source: Lithuanian Department of Statistics
Good conditions for economic development in the analysed Vilnius city municipality are demonstrated by the number of operating economic entities (Table 4.7.7.).
34
Access over the Internet: http://www.ldb.lt/Informacija/DarboRinka/Documents/prognoze_2015.pdf [viewed on 28/04/2015] 35
Access over the Internet: http://regionai.stat.gov.lt/lt/vilniaus_apskritis/vilniaus_miesto_savivaldybe.html [Viewed on 28/04/2015]
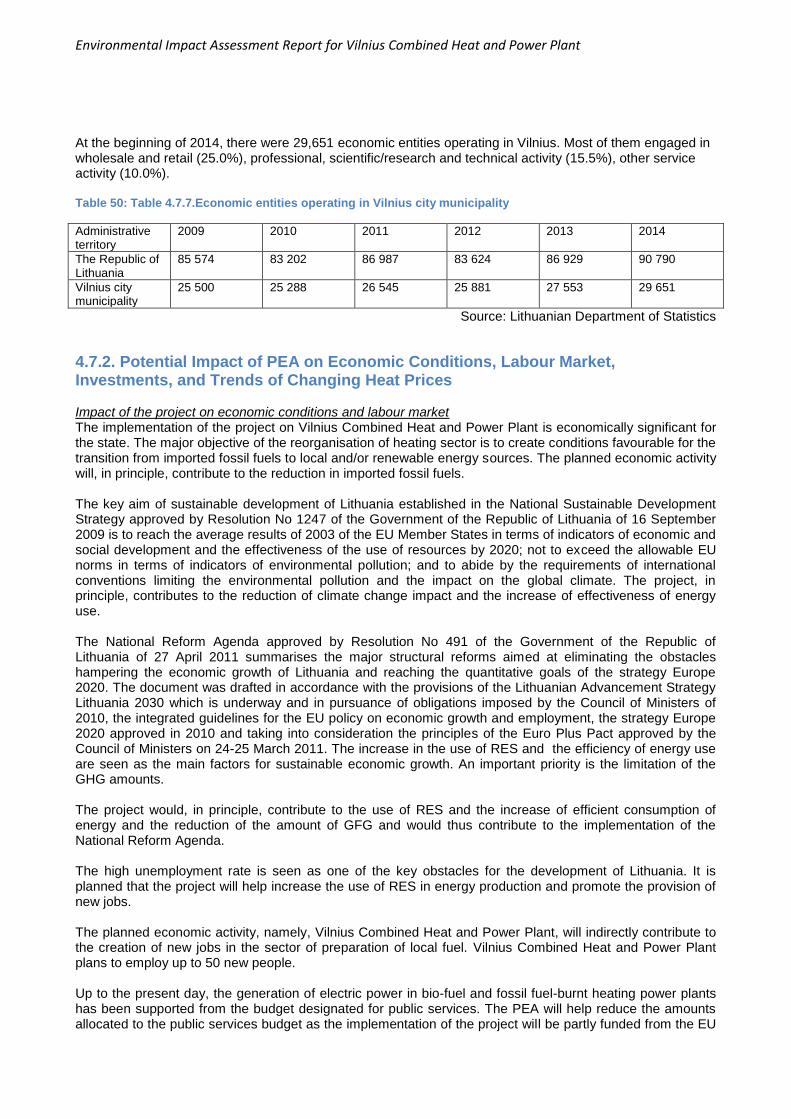
Environmental Impact Assessment Report for Vilnius Combined Heat and Power Plant
At the beginning of 2014, there were 29,651 economic entities operating in Vilnius. Most of them engaged in wholesale and retail (25.0%), professional, scientific/research and technical activity (15.5%), other service activity (10.0%). Table 50: Table 4.7.7.Economic entities operating in Vilnius city municipality
Administrative territory
2009 2010 2011 2012 2013 2014
The Republic of Lithuania
85 574 83 202 86 987 83 624 86 929 90 790
Vilnius city municipality
25 500 25 288 26 545 25 881 27 553 29 651
Source: Lithuanian Department of Statistics
4.7.2. Potential Impact of PEA on Economic Conditions, Labour Market, Investments, and Trends of Changing Heat Prices Impact of the project on economic conditions and labour market The implementation of the project on Vilnius Combined Heat and Power Plant is economically significant for the state. The major objective of the reorganisation of heating sector is to create conditions favourable for the transition from imported fossil fuels to local and/or renewable energy sources. The planned economic activity will, in principle, contribute to the reduction in imported fossil fuels. The key aim of sustainable development of Lithuania established in the National Sustainable Development Strategy approved by Resolution No 1247 of the Government of the Republic of Lithuania of 16 September 2009 is to reach the average results of 2003 of the EU Member States in terms of indicators of economic and social development and the effectiveness of the use of resources by 2020; not to exceed the allowable EU norms in terms of indicators of environmental pollution; and to abide by the requirements of international conventions limiting the environmental pollution and the impact on the global climate. The project, in principle, contributes to the reduction of climate change impact and the increase of effectiveness of energy use. The National Reform Agenda approved by Resolution No 491 of the Government of the Republic of Lithuania of 27 April 2011 summarises the major structural reforms aimed at eliminating the obstacles hampering the economic growth of Lithuania and reaching the quantitative goals of the strategy Europe 2020. The document was drafted in accordance with the provisions of the Lithuanian Advancement Strategy Lithuania 2030 which is underway and in pursuance of obligations imposed by the Council of Ministers of 2010, the integrated guidelines for the EU policy on economic growth and employment, the strategy Europe 2020 approved in 2010 and taking into consideration the principles of the Euro Plus Pact approved by the Council of Ministers on 24-25 March 2011. The increase in the use of RES and the efficiency of energy use are seen as the main factors for sustainable economic growth. An important priority is the limitation of the GHG amounts. The project would, in principle, contribute to the use of RES and the increase of efficient consumption of energy and the reduction of the amount of GFG and would thus contribute to the implementation of the National Reform Agenda. The high unemployment rate is seen as one of the key obstacles for the development of Lithuania. It is planned that the project will help increase the use of RES in energy production and promote the provision of new jobs. The planned economic activity, namely, Vilnius Combined Heat and Power Plant, will indirectly contribute to the creation of new jobs in the sector of preparation of local fuel. Vilnius Combined Heat and Power Plant plans to employ up to 50 new people. Up to the present day, the generation of electric power in bio-fuel and fossil fuel-burnt heating power plants has been supported from the budget designated for public services. The PEA will help reduce the amounts allocated to the public services budget as the implementation of the project will be partly funded from the EU
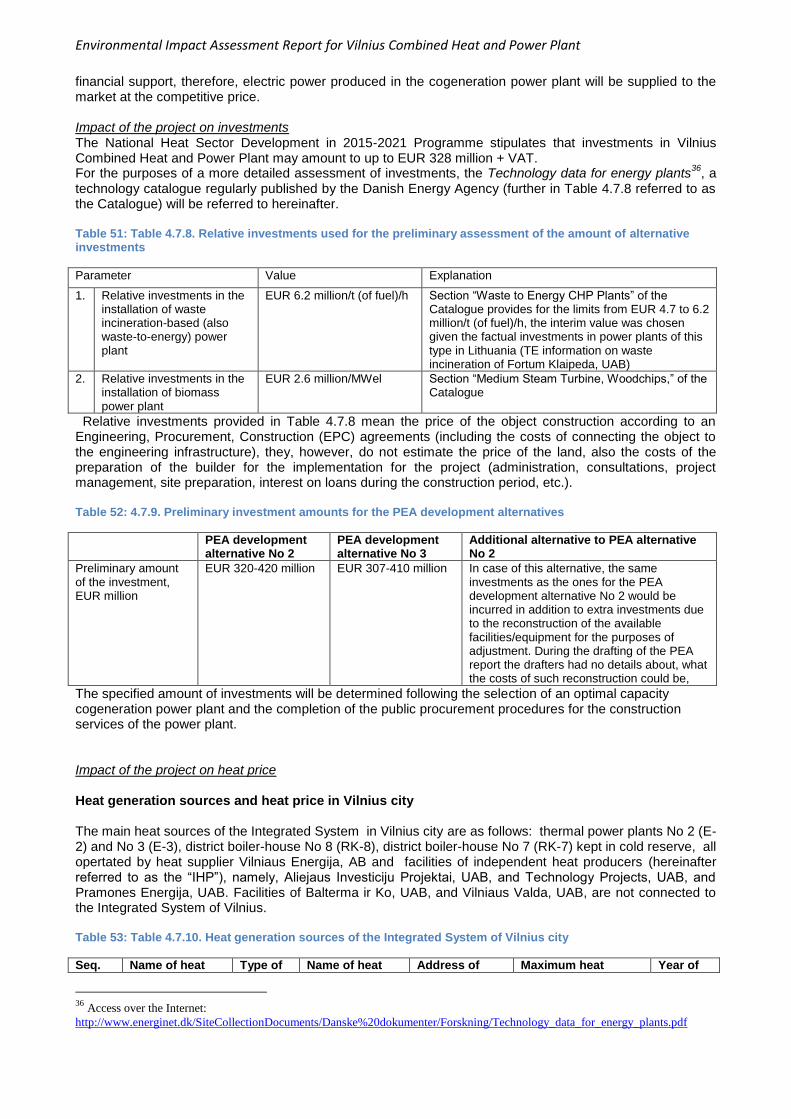
Environmental Impact Assessment Report for Vilnius Combined Heat and Power Plant
financial support, therefore, electric power produced in the cogeneration power plant will be supplied to the market at the competitive price. Impact of the project on investments The National Heat Sector Development in 2015-2021 Programme stipulates that investments in Vilnius Combined Heat and Power Plant may amount to up to EUR 328 million + VAT. For the purposes of a more detailed assessment of investments, the Technology data for energy plants
36, a
technology catalogue regularly published by the Danish Energy Agency (further in Table 4.7.8 referred to as the Catalogue) will be referred to hereinafter. Table 51: Table 4.7.8. Relative investments used for the preliminary assessment of the amount of alternative investments
Parameter Value Explanation
1. Relative investments in the installation of waste incineration-based (also waste-to-energy) power plant
EUR 6.2 million/t (of fuel)/h Section “Waste to Energy CHP Plants” of the Catalogue provides for the limits from EUR 4.7 to 6.2 million/t (of fuel)/h, the interim value was chosen given the factual investments in power plants of this type in Lithuania (TE information on waste incineration of Fortum Klaipeda, UAB)
2. Relative investments in the installation of biomass power plant
EUR 2.6 million/MWel Section “Medium Steam Turbine, Woodchips,” of the Catalogue
Relative investments provided in Table 4.7.8 mean the price of the object construction according to an Engineering, Procurement, Construction (EPC) agreements (including the costs of connecting the object to the engineering infrastructure), they, however, do not estimate the price of the land, also the costs of the preparation of the builder for the implementation for the project (administration, consultations, project management, site preparation, interest on loans during the construction period, etc.). Table 52: 4.7.9. Preliminary investment amounts for the PEA development alternatives
PEA development alternative No 2
PEA development alternative No 3
Additional alternative to PEA alternative No 2
Preliminary amount of the investment, EUR million
EUR 320-420 million EUR 307-410 million In case of this alternative, the same investments as the ones for the PEA development alternative No 2 would be incurred in addition to extra investments due to the reconstruction of the available facilities/equipment for the purposes of adjustment. During the drafting of the PEA report the drafters had no details about, what the costs of such reconstruction could be,
The specified amount of investments will be determined following the selection of an optimal capacity cogeneration power plant and the completion of the public procurement procedures for the construction services of the power plant. Impact of the project on heat price Heat generation sources and heat price in Vilnius city The main heat sources of the Integrated System in Vilnius city are as follows: thermal power plants No 2 (E-2) and No 3 (E-3), district boiler-house No 8 (RK-8), district boiler-house No 7 (RK-7) kept in cold reserve, all opertated by heat supplier Vilniaus Energija, AB and facilities of independent heat producers (hereinafter referred to as the “IHP”), namely, Aliejaus Investiciju Projektai, UAB, and Technology Projects, UAB, and Pramones Energija, UAB. Facilities of Balterma ir Ko, UAB, and Vilniaus Valda, UAB, are not connected to the Integrated System of Vilnius. Table 53: Table 4.7.10. Heat generation sources of the Integrated System of Vilnius city
Seq. Name of heat Type of Name of heat Address of Maximum heat Year of
36
Access over the Internet:
http://www.energinet.dk/SiteCollectionDocuments/Danske%20dokumenter/Forskning/Technology_data_for_energy_plants.pdf
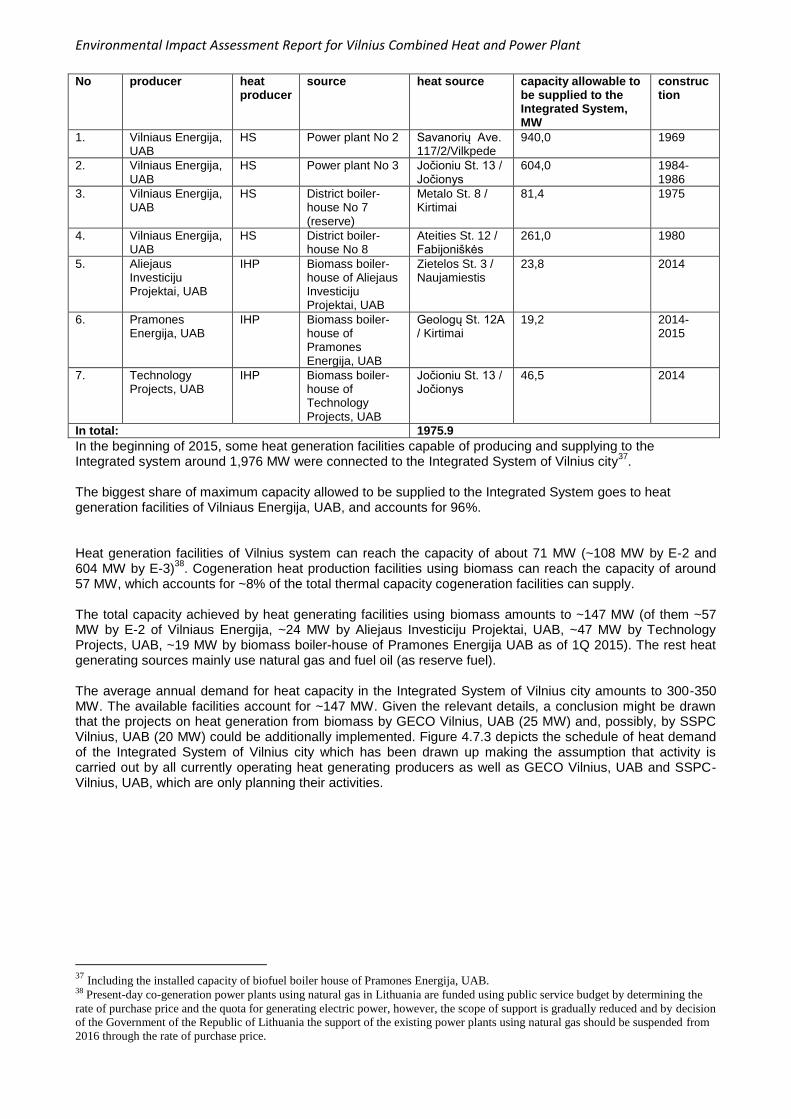
Environmental Impact Assessment Report for Vilnius Combined Heat and Power Plant
No producer heat producer
source heat source capacity allowable to be supplied to the Integrated System, MW
construction
1. Vilniaus Energija, UAB
HS Power plant No 2 Savanorių Ave. 117/2/Vilkpede
940,0 1969
2. Vilniaus Energija, UAB
HS Power plant No 3 Jočioniu St. 13 / Jočionys
604,0 1984-1986
3. Vilniaus Energija, UAB
HS District boiler-house No 7 (reserve)
Metalo St. 8 / Kirtimai
81,4 1975
4. Vilniaus Energija, UAB
HS District boiler-house No 8
Ateities St. 12 / Fabijoniškės
261,0 1980
5. Aliejaus Investiciju Projektai, UAB
IHP Biomass boiler-house of Aliejaus Investiciju Projektai, UAB
Zietelos St. 3 / Naujamiestis
23,8 2014
6. Pramones Energija, UAB
IHP Biomass boiler-house of Pramones Energija, UAB
Geologų St. 12A / Kirtimai
19,2 2014-2015
7. Technology Projects, UAB
IHP Biomass boiler-house of Technology Projects, UAB
Jočioniu St. 13 / Jočionys
46,5 2014
In total: 1975.9
In the beginning of 2015, some heat generation facilities capable of producing and supplying to the Integrated system around 1,976 MW were connected to the Integrated System of Vilnius city
37.
The biggest share of maximum capacity allowed to be supplied to the Integrated System goes to heat generation facilities of Vilniaus Energija, UAB, and accounts for 96%. Heat generation facilities of Vilnius system can reach the capacity of about 71 MW (~108 MW by E-2 and 604 MW by E-3)
38. Cogeneration heat production facilities using biomass can reach the capacity of around
57 MW, which accounts for ~8% of the total thermal capacity cogeneration facilities can supply. The total capacity achieved by heat generating facilities using biomass amounts to ~147 MW (of them ~57 MW by E-2 of Vilniaus Energija, ~24 MW by Aliejaus Investiciju Projektai, UAB, ~47 MW by Technology Projects, UAB, ~19 MW by biomass boiler-house of Pramones Energija UAB as of 1Q 2015). The rest heat generating sources mainly use natural gas and fuel oil (as reserve fuel). The average annual demand for heat capacity in the Integrated System of Vilnius city amounts to 300-350 MW. The available facilities account for ~147 MW. Given the relevant details, a conclusion might be drawn that the projects on heat generation from biomass by GECO Vilnius, UAB (25 MW) and, possibly, by SSPC Vilnius, UAB (20 MW) could be additionally implemented. Figure 4.7.3 depicts the schedule of heat demand of the Integrated System of Vilnius city which has been drawn up making the assumption that activity is carried out by all currently operating heat generating producers as well as GECO Vilnius, UAB and SSPC-Vilnius, UAB, which are only planning their activities.
37
Including the installed capacity of biofuel boiler house of Pramones Energija, UAB. 38 Present-day co-generation power plants using natural gas in Lithuania are funded using public service budget by determining the
rate of purchase price and the quota for generating electric power, however, the scope of support is gradually reduced and by decision
of the Government of the Republic of Lithuania the support of the existing power plants using natural gas should be suspended from
2016 through the rate of purchase price.
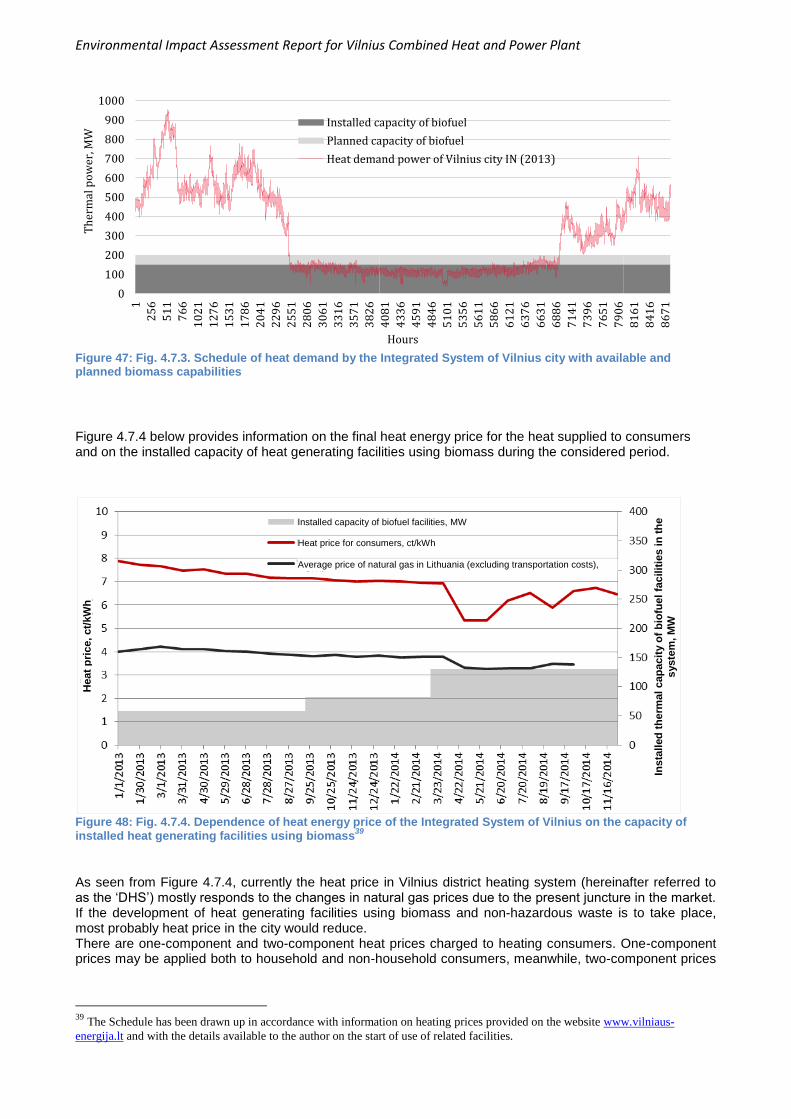
Environmental Impact Assessment Report for Vilnius Combined Heat and Power Plant
Figure 47: Fig. 4.7.3. Schedule of heat demand by the Integrated System of Vilnius city with available and planned biomass capabilities
Figure 4.7.4 below provides information on the final heat energy price for the heat supplied to consumers and on the installed capacity of heat generating facilities using biomass during the considered period.
Figure 48: Fig. 4.7.4. Dependence of heat energy price of the Integrated System of Vilnius on the capacity of installed heat generating facilities using biomass
39
As seen from Figure 4.7.4, currently the heat price in Vilnius district heating system (hereinafter referred to as the ‘DHS’) mostly responds to the changes in natural gas prices due to the present juncture in the market. If the development of heat generating facilities using biomass and non-hazardous waste is to take place, most probably heat price in the city would reduce. There are one-component and two-component heat prices charged to heating consumers. One-component prices may be applied both to household and non-household consumers, meanwhile, two-component prices
39
The Schedule has been drawn up in accordance with information on heating prices provided on the website www.vilniaus-
energija.lt and with the details available to the author on the start of use of related facilities.
0
100
200
300
400
500
600
700
800
900
1000
1
25
6
51
1
76
6
10
21
12
76
15
31
17
86
20
41
22
96
25
51
28
06
30
61
33
16
35
71
38
26
40
81
43
36
45
91
48
46
51
01
53
56
56
11
58
66
61
21
63
76
66
31
68
86
71
41
73
96
76
51
79
06
81
61
84
16
86
71
Th
erm
al p
ow
er, M
W
Hours
Installed capacity of biofuel
Planned capacity of biofuel
Heat demand power of Vilnius city IN (2013)
Installed capacity of biofuel facilities, MW
Heat price for consumers, ct/kWh
Average price of natural gas in Lithuania (excluding transportation costs), ct/kWh
Heat
pri
ce, ct/
kW
h
Ins
tall
ed
th
erm
al
cap
acit
y o
f b
iofu
el
facilit
ies i
n t
he
syste
m, M
W
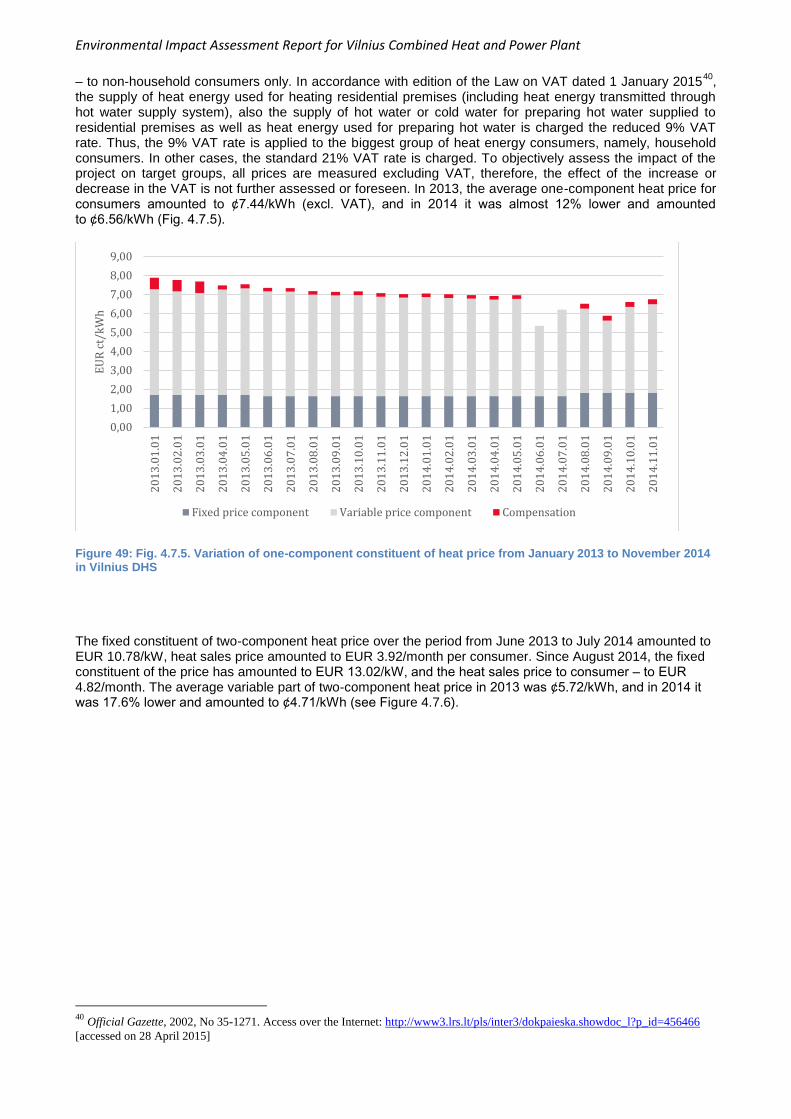
Environmental Impact Assessment Report for Vilnius Combined Heat and Power Plant
– to non-household consumers only. In accordance with edition of the Law on VAT dated 1 January 201540
, the supply of heat energy used for heating residential premises (including heat energy transmitted through hot water supply system), also the supply of hot water or cold water for preparing hot water supplied to residential premises as well as heat energy used for preparing hot water is charged the reduced 9% VAT rate. Thus, the 9% VAT rate is applied to the biggest group of heat energy consumers, namely, household consumers. In other cases, the standard 21% VAT rate is charged. To objectively assess the impact of the project on target groups, all prices are measured excluding VAT, therefore, the effect of the increase or decrease in the VAT is not further assessed or foreseen. In 2013, the average one-component heat price for consumers amounted to ¢7.44/kWh (excl. VAT), and in 2014 it was almost 12% lower and amounted to ¢6.56/kWh (Fig. 4.7.5).
Figure 49: Fig. 4.7.5. Variation of one-component constituent of heat price from January 2013 to November 2014 in Vilnius DHS
The fixed constituent of two-component heat price over the period from June 2013 to July 2014 amounted to EUR 10.78/kW, heat sales price amounted to EUR 3.92/month per consumer. Since August 2014, the fixed constituent of the price has amounted to EUR 13.02/kW, and the heat sales price to consumer ‒ to EUR 4.82/month. The average variable part of two-component heat price in 2013 was ¢5.72/kWh, and in 2014 it was 17.6% lower and amounted to ¢4.71/kWh (see Figure 4.7.6).
40
Official Gazette, 2002, No 35-1271. Access over the Internet: http://www3.lrs.lt/pls/inter3/dokpaieska.showdoc_l?p_id=456466
[accessed on 28 April 2015]
0,00
1,00
2,00
3,00
4,00
5,00
6,00
7,00
8,00
9,00
20
13
.01
.01
20
13
.02
.01
20
13
.03
.01
20
13
.04
.01
20
13
.05
.01
20
13
.06
.01
20
13
.07
.01
20
13
.08
.01
20
13
.09
.01
20
13
.10
.01
20
13
.11
.01
20
13
.12
.01
20
14
.01
.01
20
14
.02
.01
20
14
.03
.01
20
14
.04
.01
20
14
.05
.01
20
14
.06
.01
20
14
.07
.01
20
14
.08
.01
20
14
.09
.01
20
14
.10
.01
20
14
.11
.01
EU
R c
t/k
Wh
Fixed price component Variable price component Compensation
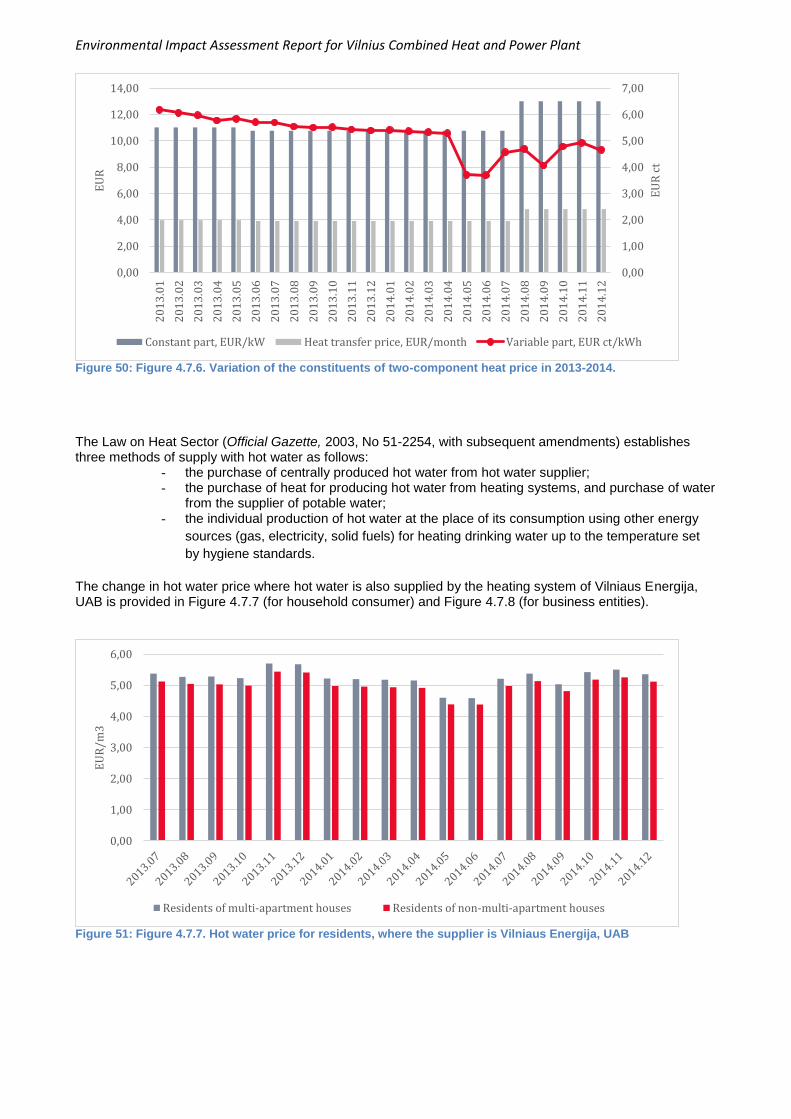
Environmental Impact Assessment Report for Vilnius Combined Heat and Power Plant
Figure 50: Figure 4.7.6. Variation of the constituents of two-component heat price in 2013-2014.
The Law on Heat Sector (Official Gazette, 2003, No 51-2254, with subsequent amendments) establishes three methods of supply with hot water as follows:
- the purchase of centrally produced hot water from hot water supplier; - the purchase of heat for producing hot water from heating systems, and purchase of water
from the supplier of potable water; - the individual production of hot water at the place of its consumption using other energy
sources (gas, electricity, solid fuels) for heating drinking water up to the temperature set
by hygiene standards.
The change in hot water price where hot water is also supplied by the heating system of Vilniaus Energija, UAB is provided in Figure 4.7.7 (for household consumer) and Figure 4.7.8 (for business entities).
Figure 51: Figure 4.7.7. Hot water price for residents, where the supplier is Vilniaus Energija, UAB
0,00
1,00
2,00
3,00
4,00
5,00
6,00
7,00
0,00
2,00
4,00
6,00
8,00
10,00
12,00
14,00
20
13
.01
20
13
.02
20
13
.03
20
13
.04
20
13
.05
20
13
.06
20
13
.07
20
13
.08
20
13
.09
20
13
.10
20
13
.11
20
13
.12
20
14
.01
20
14
.02
20
14
.03
20
14
.04
20
14
.05
20
14
.06
20
14
.07
20
14
.08
20
14
.09
20
14
.10
20
14
.11
20
14
.12
EU
R c
t
EU
R
Constant part, EUR/kW Heat transfer price, EUR/month Variable part, EUR ct/kWh
0,00
1,00
2,00
3,00
4,00
5,00
6,00
EU
R/m
3
Residents of multi-apartment houses Residents of non-multi-apartment houses
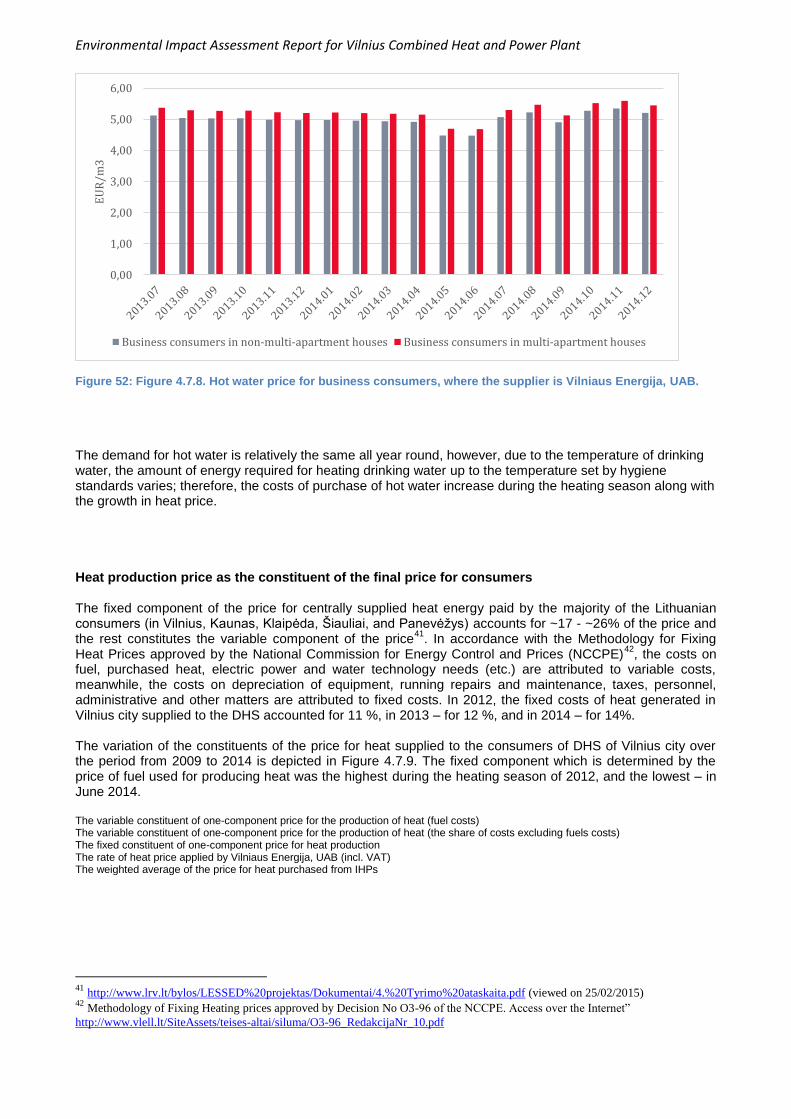
Environmental Impact Assessment Report for Vilnius Combined Heat and Power Plant
Figure 52: Figure 4.7.8. Hot water price for business consumers, where the supplier is Vilniaus Energija, UAB.
The demand for hot water is relatively the same all year round, however, due to the temperature of drinking water, the amount of energy required for heating drinking water up to the temperature set by hygiene standards varies; therefore, the costs of purchase of hot water increase during the heating season along with the growth in heat price. Heat production price as the constituent of the final price for consumers The fixed component of the price for centrally supplied heat energy paid by the majority of the Lithuanian consumers (in Vilnius, Kaunas, Klaipėda, Šiauliai, and Panevėžys) accounts for ~17 - ~26% of the price and the rest constitutes the variable component of the price
41. In accordance with the Methodology for Fixing
Heat Prices approved by the National Commission for Energy Control and Prices (NCCPE)42
, the costs on fuel, purchased heat, electric power and water technology needs (etc.) are attributed to variable costs, meanwhile, the costs on depreciation of equipment, running repairs and maintenance, taxes, personnel, administrative and other matters are attributed to fixed costs. In 2012, the fixed costs of heat generated in Vilnius city supplied to the DHS accounted for 11 %, in 2013 – for 12 %, and in 2014 – for 14%. The variation of the constituents of the price for heat supplied to the consumers of DHS of Vilnius city over the period from 2009 to 2014 is depicted in Figure 4.7.9. The fixed component which is determined by the price of fuel used for producing heat was the highest during the heating season of 2012, and the lowest – in June 2014. The variable constituent of one-component price for the production of heat (fuel costs) The variable constituent of one-component price for the production of heat (the share of costs excluding fuels costs) The fixed constituent of one-component price for heat production The rate of heat price applied by Vilniaus Energija, UAB (incl. VAT) The weighted average of the price for heat purchased from IHPs
41
http://www.lrv.lt/bylos/LESSED%20projektas/Dokumentai/4.%20Tyrimo%20ataskaita.pdf (viewed on 25/02/2015) 42
Methodology of Fixing Heating prices approved by Decision No O3-96 of the NCCPE. Access over the Internet”
http://www.vlell.lt/SiteAssets/teises-altai/siluma/O3-96_RedakcijaNr_10.pdf
0,00
1,00
2,00
3,00
4,00
5,00
6,00E
UR
/m3
Business consumers in non-multi-apartment houses Business consumers in multi-apartment houses
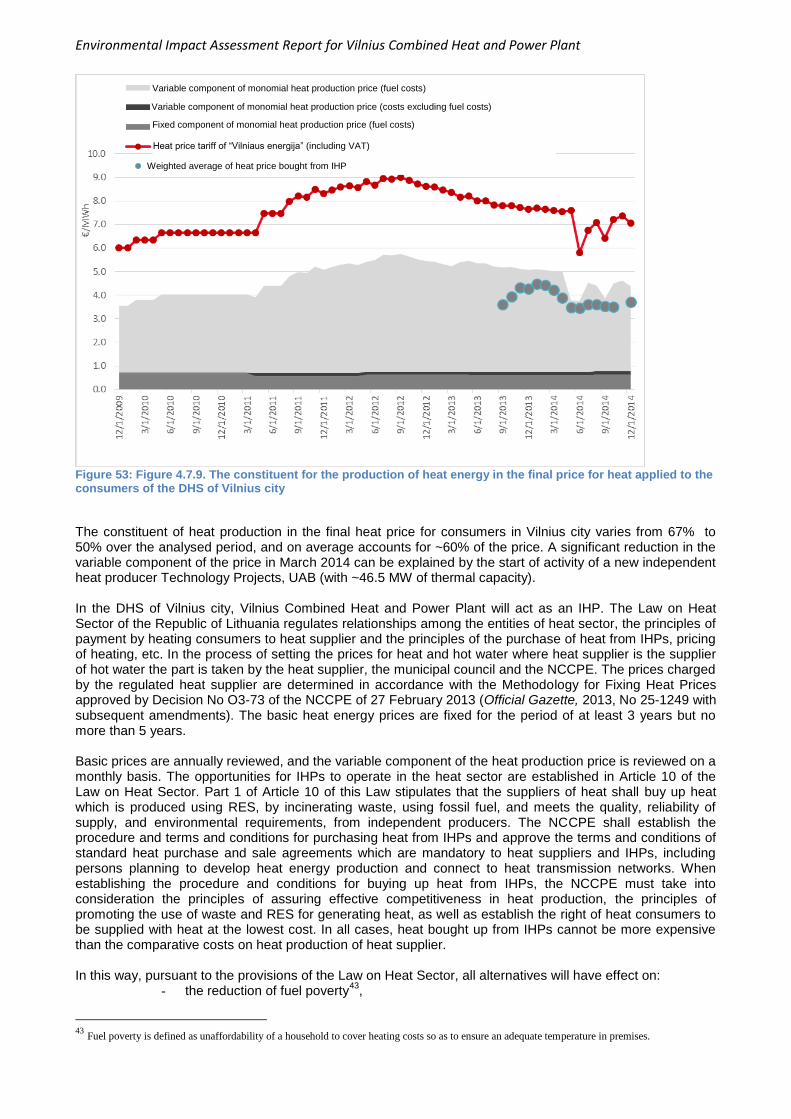
Environmental Impact Assessment Report for Vilnius Combined Heat and Power Plant
Figure 53: Figure 4.7.9. The constituent for the production of heat energy in the final price for heat applied to the consumers of the DHS of Vilnius city
The constituent of heat production in the final heat price for consumers in Vilnius city varies from 67% to 50% over the analysed period, and on average accounts for ~60% of the price. A significant reduction in the variable component of the price in March 2014 can be explained by the start of activity of a new independent heat producer Technology Projects, UAB (with ~46.5 MW of thermal capacity). In the DHS of Vilnius city, Vilnius Combined Heat and Power Plant will act as an IHP. The Law on Heat Sector of the Republic of Lithuania regulates relationships among the entities of heat sector, the principles of payment by heating consumers to heat supplier and the principles of the purchase of heat from IHPs, pricing of heating, etc. In the process of setting the prices for heat and hot water where heat supplier is the supplier of hot water the part is taken by the heat supplier, the municipal council and the NCCPE. The prices charged by the regulated heat supplier are determined in accordance with the Methodology for Fixing Heat Prices approved by Decision No O3-73 of the NCCPE of 27 February 2013 (Official Gazette, 2013, No 25-1249 with subsequent amendments). The basic heat energy prices are fixed for the period of at least 3 years but no more than 5 years. Basic prices are annually reviewed, and the variable component of the heat production price is reviewed on a monthly basis. The opportunities for IHPs to operate in the heat sector are established in Article 10 of the Law on Heat Sector. Part 1 of Article 10 of this Law stipulates that the suppliers of heat shall buy up heat which is produced using RES, by incinerating waste, using fossil fuel, and meets the quality, reliability of supply, and environmental requirements, from independent producers. The NCCPE shall establish the procedure and terms and conditions for purchasing heat from IHPs and approve the terms and conditions of standard heat purchase and sale agreements which are mandatory to heat suppliers and IHPs, including persons planning to develop heat energy production and connect to heat transmission networks. When establishing the procedure and conditions for buying up heat from IHPs, the NCCPE must take into consideration the principles of assuring effective competitiveness in heat production, the principles of promoting the use of waste and RES for generating heat, as well as establish the right of heat consumers to be supplied with heat at the lowest cost. In all cases, heat bought up from IHPs cannot be more expensive than the comparative costs on heat production of heat supplier. In this way, pursuant to the provisions of the Law on Heat Sector, all alternatives will have effect on:
- the reduction of fuel poverty43
,
43
Fuel poverty is defined as unaffordability of a household to cover heating costs so as to ensure an adequate temperature in premises.
Variable component of monomial heat production price (fuel costs)
Variable component of monomial heat production price (costs excluding fuel costs)
Fixed component of monomial heat production price (fuel costs)
Heat price tariff of “Vilniaus energija” (including VAT)
Weighted average of heat price bought from IHP
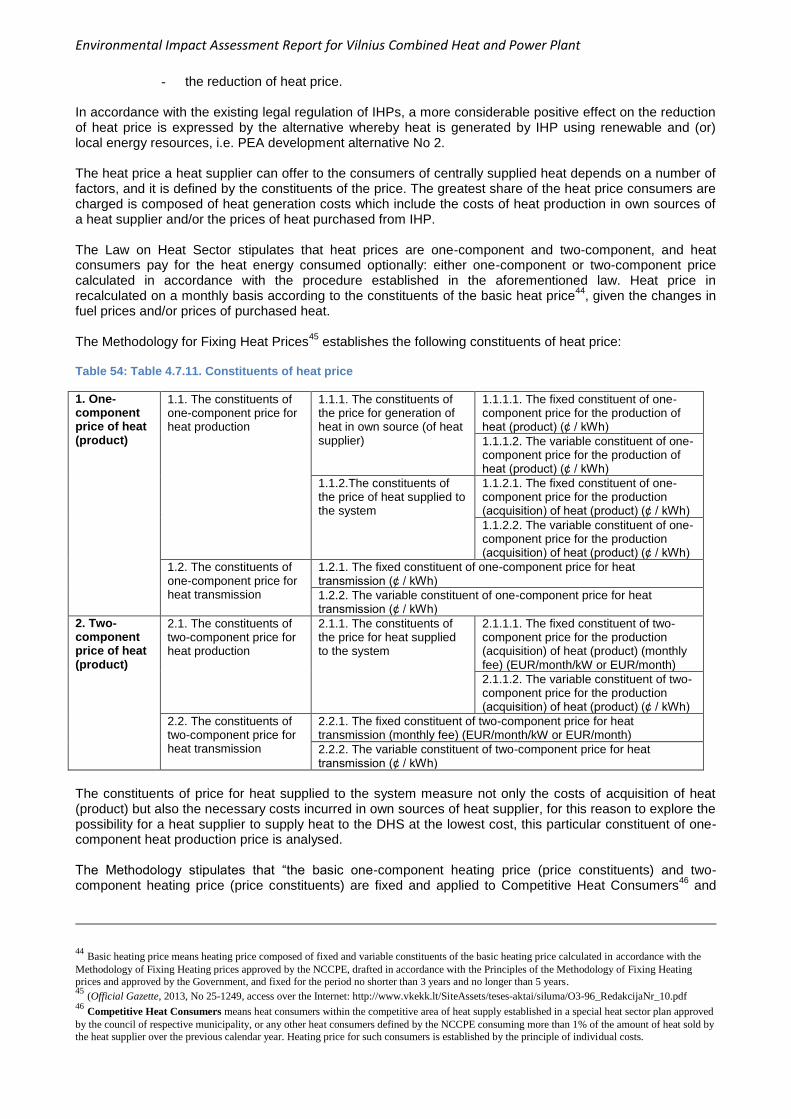
Environmental Impact Assessment Report for Vilnius Combined Heat and Power Plant
- the reduction of heat price.
In accordance with the existing legal regulation of IHPs, a more considerable positive effect on the reduction of heat price is expressed by the alternative whereby heat is generated by IHP using renewable and (or) local energy resources, i.e. PEA development alternative No 2. The heat price a heat supplier can offer to the consumers of centrally supplied heat depends on a number of factors, and it is defined by the constituents of the price. The greatest share of the heat price consumers are charged is composed of heat generation costs which include the costs of heat production in own sources of a heat supplier and/or the prices of heat purchased from IHP. The Law on Heat Sector stipulates that heat prices are one-component and two-component, and heat consumers pay for the heat energy consumed optionally: either one-component or two-component price calculated in accordance with the procedure established in the aforementioned law. Heat price in recalculated on a monthly basis according to the constituents of the basic heat price
44, given the changes in
fuel prices and/or prices of purchased heat. The Methodology for Fixing Heat Prices
45 establishes the following constituents of heat price:
Table 54: Table 4.7.11. Constituents of heat price
1. One-component price of heat (product)
1.1. The constituents of one-component price for heat production
1.1.1. The constituents of the price for generation of heat in own source (of heat supplier)
1.1.1.1. The fixed constituent of one-component price for the production of heat (product) (¢ / kWh)
1.1.1.2. The variable constituent of one-component price for the production of heat (product) (¢ / kWh)
1.1.2.The constituents of the price of heat supplied to the system
1.1.2.1. The fixed constituent of one-component price for the production (acquisition) of heat (product) (¢ / kWh)
1.1.2.2. The variable constituent of one-component price for the production (acquisition) of heat (product) (¢ / kWh)
1.2. The constituents of one-component price for heat transmission
1.2.1. The fixed constituent of one-component price for heat transmission (¢ / kWh)
1.2.2. The variable constituent of one-component price for heat transmission (¢ / kWh)
2. Two-component price of heat (product)
2.1. The constituents of two-component price for heat production
2.1.1. The constituents of the price for heat supplied to the system
2.1.1.1. The fixed constituent of two-component price for the production (acquisition) of heat (product) (monthly fee) (EUR/month/kW or EUR/month)
2.1.1.2. The variable constituent of two-component price for the production (acquisition) of heat (product) (¢ / kWh)
2.2. The constituents of two-component price for heat transmission
2.2.1. The fixed constituent of two-component price for heat transmission (monthly fee) (EUR/month/kW or EUR/month)
2.2.2. The variable constituent of two-component price for heat transmission (¢ / kWh)
The constituents of price for heat supplied to the system measure not only the costs of acquisition of heat (product) but also the necessary costs incurred in own sources of heat supplier, for this reason to explore the possibility for a heat supplier to supply heat to the DHS at the lowest cost, this particular constituent of one-component heat production price is analysed. The Methodology stipulates that “the basic one-component heating price (price constituents) and two-component heating price (price constituents) are fixed and applied to Competitive Heat Consumers
46 and
44
Basic heating price means heating price composed of fixed and variable constituents of the basic heating price calculated in accordance with the
Methodology of Fixing Heating prices approved by the NCCPE, drafted in accordance with the Principles of the Methodology of Fixing Heating
prices and approved by the Government, and fixed for the period no shorter than 3 years and no longer than 5 years. 45
(Official Gazette, 2013, No 25-1249, access over the Internet: http://www.vkekk.lt/SiteAssets/teses-aktai/siluma/O3-96_RedakcijaNr_10.pdf 46
Competitive Heat Consumers means heat consumers within the competitive area of heat supply established in a special heat sector plan approved
by the council of respective municipality, or any other heat consumers defined by the NCCPE consuming more than 1% of the amount of heat sold by
the heat supplier over the previous calendar year. Heating price for such consumers is established by the principle of individual costs.
Environmental Impact Assessment Report for Vilnius Combined Heat and Power Plant
Consumers of DHS. Where the Consumers of Uninterruptible Supply with Heat47
and the Consumers of Independent Supply with Heat
48 are concerned, the two-component price (price constituents) is set and
applied”. One-component and two-component prices differ in the principles of calculation of the fixed constituent and the price charged: with regard to one-component heating price the fixed constituent is calculated and paid according to the amount of heat supplied (¢ /kWh), and in terms of two-component heating price – according to the capacity (input) of heat energy supplied (EUR/month/kW or EUR/month). Lithuanian citizens (consumers of centrally supplied heating system) pay for heating according to the model of one-component price
49, and there is no good practice of application of two-component price among
consumers available. Given the aforementioned, in this section, where applicable, the impact of the constituents of one-component price for the production (acquisition) of heating (product) on the final heating price, which is paid by consumers for the heating energy supplied to them, will be further discussed. Since this constituent is the main part of the final heating price paid by a heating consumer, the further analysis will focus on the possible effect of PEA on this constituent only. The fixed component of the price for centrally supplied heat energy paid by the majority of the Lithuanian consumers (in Vilnius, Kaunas, Klaipėda, Šiauliai, and Panevėžys) accounts for ~17 - ~26% of the price and the rest constitutes the variable component of the price
50. In
accordance with the Methodology for Fixing Heat Prices approved by the NCCPE51
, the costs on fuel, purchased heat, electric power and water technology needs (etc.) are attributed to variable costs, meanwhile, the costs on depreciation of equipment, running repairs and maintenance, taxes, personnel, administrative and other matters are attributed to fixed costs. In 2012, the fixed costs of heat generated in Vilnius city supplied to the DHS accounted for 11 %, in 2013 – for 12 %, and in 2014 – for 14%. The possibilities to reduce the price of heat production are measured with the aim to determine the amount of heat energy which could be produced by every additionally installed megawatt in heat energy generating facilities where heat energy produced would be transmitted to the DHS for the constituent of biomass price. The assessment of the potentials to reduce heat production price was carried out taking into account the following assumptions:
1. Calculations were made according to the curve of changes in heat demand in Vilnius city within one year
52;
2. Thermal energy demand was determined according to the demand anticipated for 201853
; 3. Possibilities of reducing heat price were estimated at the 2013 price level
54;
4. The average natural gas price considered was the 2013 price including transmission and distribution and amounted to EUR 43.55/MWh
55;
47
Consumers of Uninterruptible Supply with Heat means institutions or organisations which necessarily require uninterruptible supply with heat.
The list of such institutions/organisations is approved by the Government or its authorised institution and councils of municipalities. 48
Consumers of Independent Supply with Heat means persons having changed the method of supply with heat of the entire building, supplying
heat independently and usually not consuming heat supplied through the DHS lawfully managed by the Economic entity, however, having retained technical means for getting heat from DHS, if required, and in case these persons need it, the Economic entity shall, for the benefit of such persons,
ensure corresponding measures for supplying heat using the DHS. 49
Access over the Internet:
http://www.leka.lt/sites/default/files/dokumentai/greitai_ideigiamos_priemones_centralizuoto_sildymo_preinamumui_lietuvoje_gerinti_vl_2011.pdf,
p.32 50
Lithuanian Energy Institute. Energy Complex Research Laboratory. The Analysis of Prospective Development of the Lithuanian Energy Sector
Given the EU Strategic Initiatives in the Field of Energy. Final report. 5 April 2014. Viewed on 25/02/2015. 51
The Methodology for Fixing Heat Prices approved by Decision No O3-96 of the NCCPE. Access over the Internet:
http://www.vkekk.lt/SiteAssets/teises-aktai/siluma/O3-96_Redakcija Nr_10.pdf 52
The diagram on the changes in the demand of thermal energy capacity of the DHS is used so as to objectively assess the impact of the fluctuations
in the demand of the DHS on the operation of Vilnius co-generation power plant. Yet, to assess specific year, the trends of change/fluctuation of 2013 are proportionally adjusted to the actual/anticipated demand of the DHS (MWh) of respective year; 53
The year 2018 was chosen for the estimation as probable starting date of PEA. It should be noted that the choice of the year for the assessment has
no major effect on the results. The demand of the DHS has to reduce dramatically for it to have a significant effect on PEA. Most probable reduction in heat demand may be caused by the renovation of multi-storey apartment buildings, however, renovation would mostly affect the demand of heating
season. Meanwhile, in terms of the second and the third alternative, the planned heat capacity hardly amounts to half of the maximum demand of
heating season. 54
Given the criterion of assessment of the goals ( Annex 1, R-1-1 “Reduction of Heat Prices Compared to 2013 (Percentage)”) of the National Heat
Sector Development Programme for 2015-2021 (Official Gazette, 2015, No 2015-04339) 55
http://www.vkekk.lt/siluma/Puslapiai/kuro-ir-perkamos-sillumos-kainos/vidutine-salis-kuro-kaina-2013.aspx. Average price of raw natural gas is
considered to be EUR ~39.86/MWh.
Environmental Impact Assessment Report for Vilnius Combined Heat and Power Plant
5. The considered average price of biomass in 2013 was EUR 16.51/MWh56
, including transportation costs;
6. It was considered that the highest potential for reducing thermal energy price was seen in the installation of energy generating facilities which use biomass and/or non-hazardous waste, meanwhile, other measures (reconstruction of the DHS route, etc.) had trivial effect on the final price
57;
7. To identify the potentials of reducing heating price, it was considered that thermal energy produced
in the installed facilities should be sold for the fuel constituent of the price additionally measuring only the constituent in the amount of the investment by including the deductions for depreciation in the tariff
58. This price allows the market participants to cover the main costs related to the production
of thermal energy, namely, fuels costs and costs of amortisation of the main equipment used in activities;
8. In accordance with the Methodology for Separating Heat and Electrical Power Costs of Combined Heat and Power Plants approved by Decision No O3-107 of the NCCPE of 22 July 2009, acting edition, new biomass and /or waste incineration facilities were seen as alternative sources of thermal energy production using biomass (water heaters);
9. The amount of investments in alternative heat production facilities was considered to be EUR 300,000/MW thermal capacity
59. It was considered that to ensure the sale of thermal energy to
municipal waste-fuelled power plant, the same investment in alternative energy production facilities should be measured with regard to municipal waste-fuelled power plant as the main rivals of municipal waste-fuelled thermal power plants would be IHPs using biomass;
10. Assessing the potential impact on the final thermal energy production price, the impact of IHP was eliminated, i.e. it was estimated that new facilities would be built seeking to maximally reduce heat price, therefore, facilities used by other producers would continue operating as usual but “on the top” (in addition to) of the new facilities. Such assessment shows the situation which would result if newly installed facilities operated in basic (maximum thermal energy) production mode and other facilities (other IHP among them) would operate taking advantage of the opportunity to sell thermal energy under the market conditions without prejudice to restrictions/limits established in legislation;
11. The assessment results are valid for the energy objects of the same thermal capacity and using non-hazardous waste or solid recovered fuel considering that the price of thermal energy produced in such objects and supplied to the system will not exceed heat price in an alternative heat production source (water heater) using biomass from wood.
In the Figure below the potentials of reducing heat production price in the district heating system of Vilnius city subject to the installed thermal capacity of alternative sources is shown.
56
The average price of biofuel feedstock is considered to be EUR 14.6/MWh 57
In practice, other investments in heat sector are most often related to the increase of reliability, increase of efficiency of consumption, reduction of
losses in heating supply system, etc. Economic effect of such measures is usually minimal and every effort is put so as to avoid increasing the price for consumer as a result of such investment. 58
It is considered that the amortisation period of facilities is 16 years: the Methodology for Fixing Heat Prices approved by Decision No O3-96 of the
National Commission for Energy Control and Prices of 8 July 2009, Annex 6. 59
Technology Data for Energy Plants, June 2010.
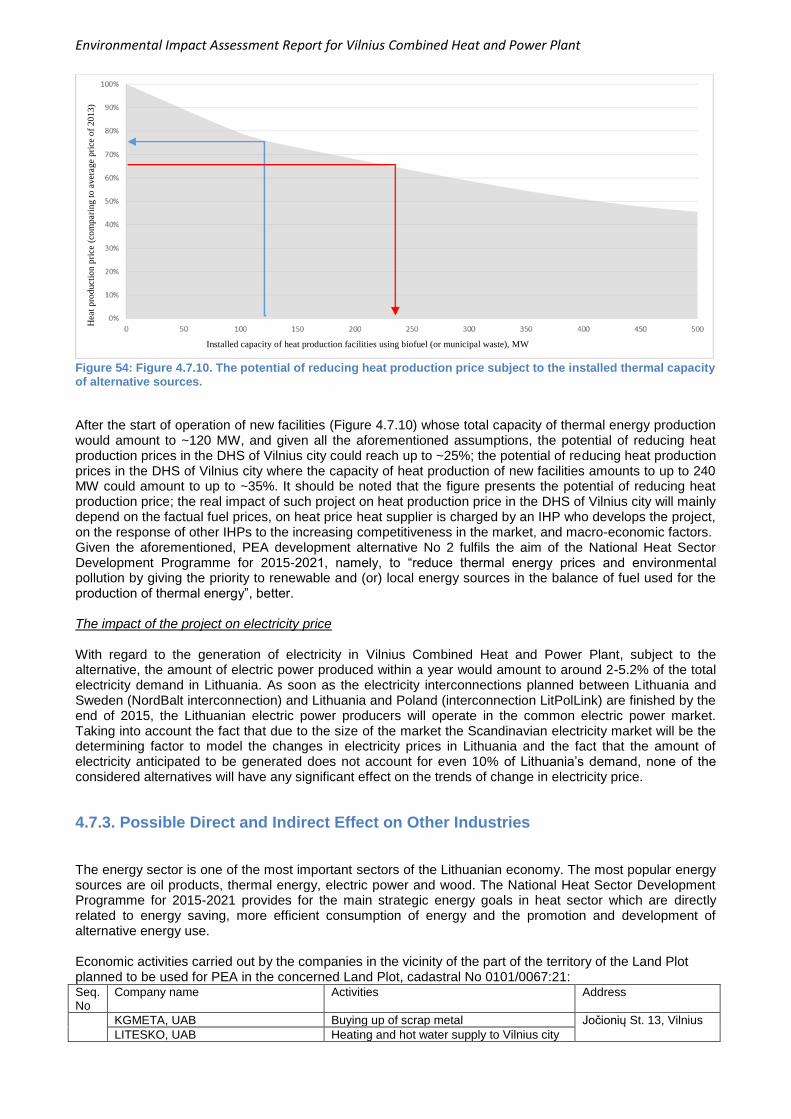
Environmental Impact Assessment Report for Vilnius Combined Heat and Power Plant
Figure 54: Figure 4.7.10. The potential of reducing heat production price subject to the installed thermal capacity of alternative sources.
After the start of operation of new facilities (Figure 4.7.10) whose total capacity of thermal energy production would amount to ~120 MW, and given all the aforementioned assumptions, the potential of reducing heat production prices in the DHS of Vilnius city could reach up to ~25%; the potential of reducing heat production prices in the DHS of Vilnius city where the capacity of heat production of new facilities amounts to up to 240 MW could amount to up to ~35%. It should be noted that the figure presents the potential of reducing heat production price; the real impact of such project on heat production price in the DHS of Vilnius city will mainly depend on the factual fuel prices, on heat price heat supplier is charged by an IHP who develops the project, on the response of other IHPs to the increasing competitiveness in the market, and macro-economic factors. Given the aforementioned, PEA development alternative No 2 fulfils the aim of the National Heat Sector Development Programme for 2015-2021, namely, to “reduce thermal energy prices and environmental pollution by giving the priority to renewable and (or) local energy sources in the balance of fuel used for the production of thermal energy”, better. The impact of the project on electricity price With regard to the generation of electricity in Vilnius Combined Heat and Power Plant, subject to the alternative, the amount of electric power produced within a year would amount to around 2-5.2% of the total electricity demand in Lithuania. As soon as the electricity interconnections planned between Lithuania and Sweden (NordBalt interconnection) and Lithuania and Poland (interconnection LitPolLink) are finished by the end of 2015, the Lithuanian electric power producers will operate in the common electric power market. Taking into account the fact that due to the size of the market the Scandinavian electricity market will be the determining factor to model the changes in electricity prices in Lithuania and the fact that the amount of electricity anticipated to be generated does not account for even 10% of Lithuania’s demand, none of the considered alternatives will have any significant effect on the trends of change in electricity price.
4.7.3. Possible Direct and Indirect Effect on Other Industries The energy sector is one of the most important sectors of the Lithuanian economy. The most popular energy sources are oil products, thermal energy, electric power and wood. The National Heat Sector Development Programme for 2015-2021 provides for the main strategic energy goals in heat sector which are directly related to energy saving, more efficient consumption of energy and the promotion and development of alternative energy use. Economic activities carried out by the companies in the vicinity of the part of the territory of the Land Plot planned to be used for PEA in the concerned Land Plot, cadastral No 0101/0067:21: Seq. No
Company name Activities Address
KGMETA, UAB Buying up of scrap metal Jočionių St. 13, Vilnius
LITESKO, UAB Heating and hot water supply to Vilnius city
Hea
t pro
duct
ion p
rice
(co
mpari
ng t
o a
ver
age
pri
ce o
f 201
3)
Installed capacity of heat production facilities using biofuel (or municipal waste), MW
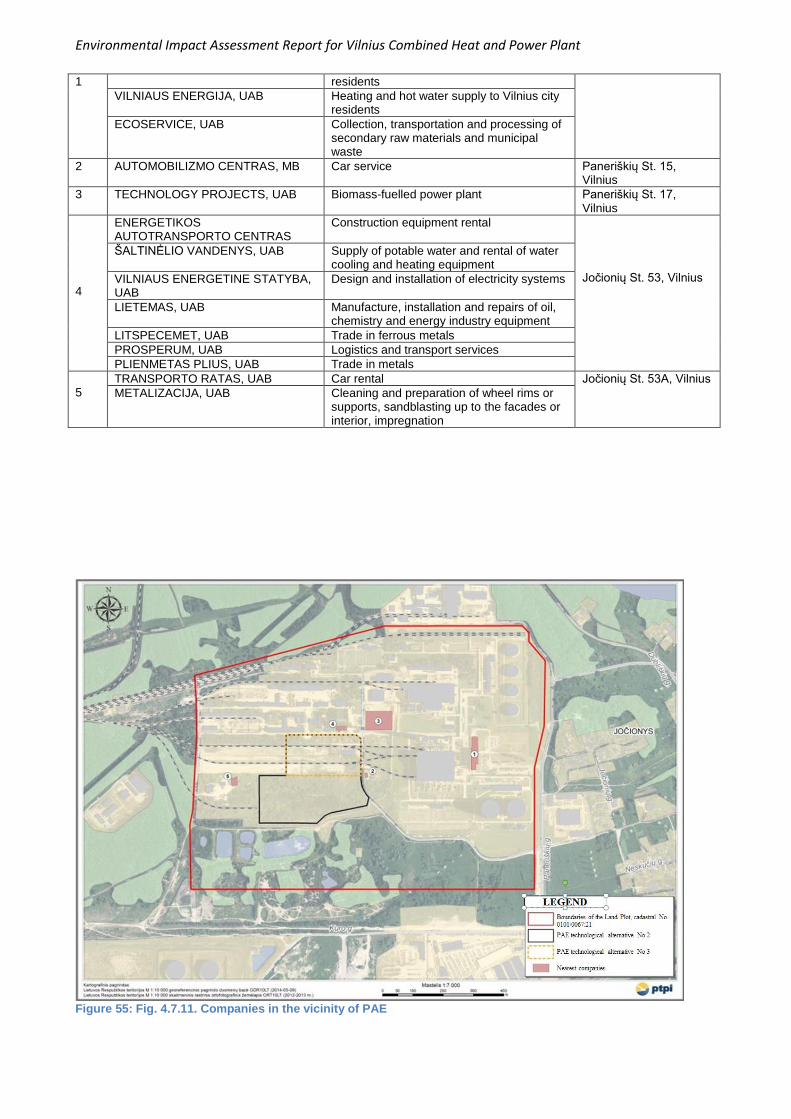
Environmental Impact Assessment Report for Vilnius Combined Heat and Power Plant
1 residents
VILNIAUS ENERGIJA, UAB Heating and hot water supply to Vilnius city residents
ECOSERVICE, UAB Collection, transportation and processing of secondary raw materials and municipal waste
2 AUTOMOBILIZMO CENTRAS, MB Car service Paneriškių St. 15, Vilnius
3 TECHNOLOGY PROJECTS, UAB Biomass-fuelled power plant Paneriškių St. 17, Vilnius
4
ENERGETIKOS AUTOTRANSPORTO CENTRAS
Construction equipment rental Jočionių St. 53, Vilnius
ŠALTINĖLIO VANDENYS, UAB Supply of potable water and rental of water cooling and heating equipment
VILNIAUS ENERGETINE STATYBA, UAB
Design and installation of electricity systems
LIETEMAS, UAB Manufacture, installation and repairs of oil, chemistry and energy industry equipment
LITSPECEMET, UAB Trade in ferrous metals
PROSPERUM, UAB Logistics and transport services
PLIENMETAS PLIUS, UAB Trade in metals
5
TRANSPORTO RATAS, UAB Car rental Jočionių St. 53A, Vilnius
METALIZACIJA, UAB Cleaning and preparation of wheel rims or supports, sandblasting up to the facades or interior, impregnation
Figure 55: Fig. 4.7.11. Companies in the vicinity of PAE
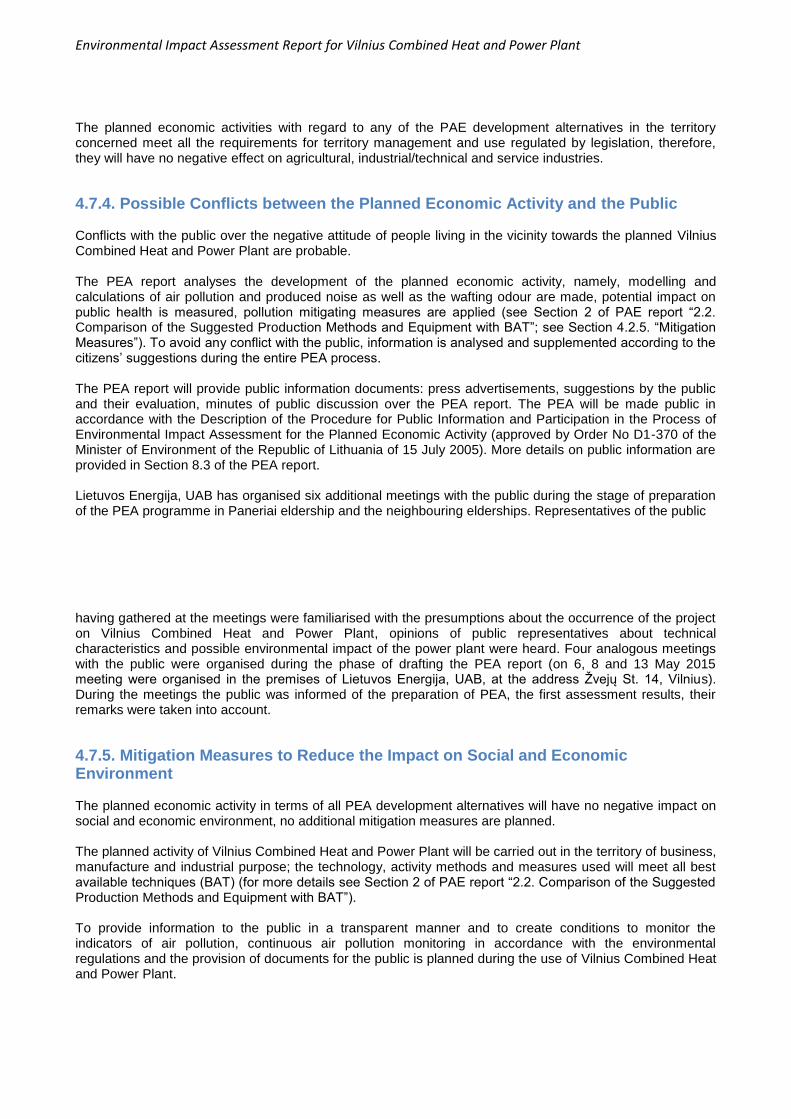
Environmental Impact Assessment Report for Vilnius Combined Heat and Power Plant
The planned economic activities with regard to any of the PAE development alternatives in the territory concerned meet all the requirements for territory management and use regulated by legislation, therefore, they will have no negative effect on agricultural, industrial/technical and service industries.
4.7.4. Possible Conflicts between the Planned Economic Activity and the Public Conflicts with the public over the negative attitude of people living in the vicinity towards the planned Vilnius Combined Heat and Power Plant are probable. The PEA report analyses the development of the planned economic activity, namely, modelling and calculations of air pollution and produced noise as well as the wafting odour are made, potential impact on public health is measured, pollution mitigating measures are applied (see Section 2 of PAE report “2.2. Comparison of the Suggested Production Methods and Equipment with BAT”; see Section 4.2.5. “Mitigation Measures”). To avoid any conflict with the public, information is analysed and supplemented according to the citizens’ suggestions during the entire PEA process. The PEA report will provide public information documents: press advertisements, suggestions by the public and their evaluation, minutes of public discussion over the PEA report. The PEA will be made public in accordance with the Description of the Procedure for Public Information and Participation in the Process of Environmental Impact Assessment for the Planned Economic Activity (approved by Order No D1-370 of the Minister of Environment of the Republic of Lithuania of 15 July 2005). More details on public information are provided in Section 8.3 of the PEA report. Lietuvos Energija, UAB has organised six additional meetings with the public during the stage of preparation of the PEA programme in Paneriai eldership and the neighbouring elderships. Representatives of the public having gathered at the meetings were familiarised with the presumptions about the occurrence of the project on Vilnius Combined Heat and Power Plant, opinions of public representatives about technical characteristics and possible environmental impact of the power plant were heard. Four analogous meetings with the public were organised during the phase of drafting the PEA report (on 6, 8 and 13 May 2015 meeting were organised in the premises of Lietuvos Energija, UAB, at the address Žvejų St. 14, Vilnius). During the meetings the public was informed of the preparation of PEA, the first assessment results, their remarks were taken into account.
4.7.5. Mitigation Measures to Reduce the Impact on Social and Economic Environment The planned economic activity in terms of all PEA development alternatives will have no negative impact on social and economic environment, no additional mitigation measures are planned. The planned activity of Vilnius Combined Heat and Power Plant will be carried out in the territory of business, manufacture and industrial purpose; the technology, activity methods and measures used will meet all best available techniques (BAT) (for more details see Section 2 of PAE report “2.2. Comparison of the Suggested Production Methods and Equipment with BAT”). To provide information to the public in a transparent manner and to create conditions to monitor the indicators of air pollution, continuous air pollution monitoring in accordance with the environmental regulations and the provision of documents for the public is planned during the use of Vilnius Combined Heat and Power Plant.
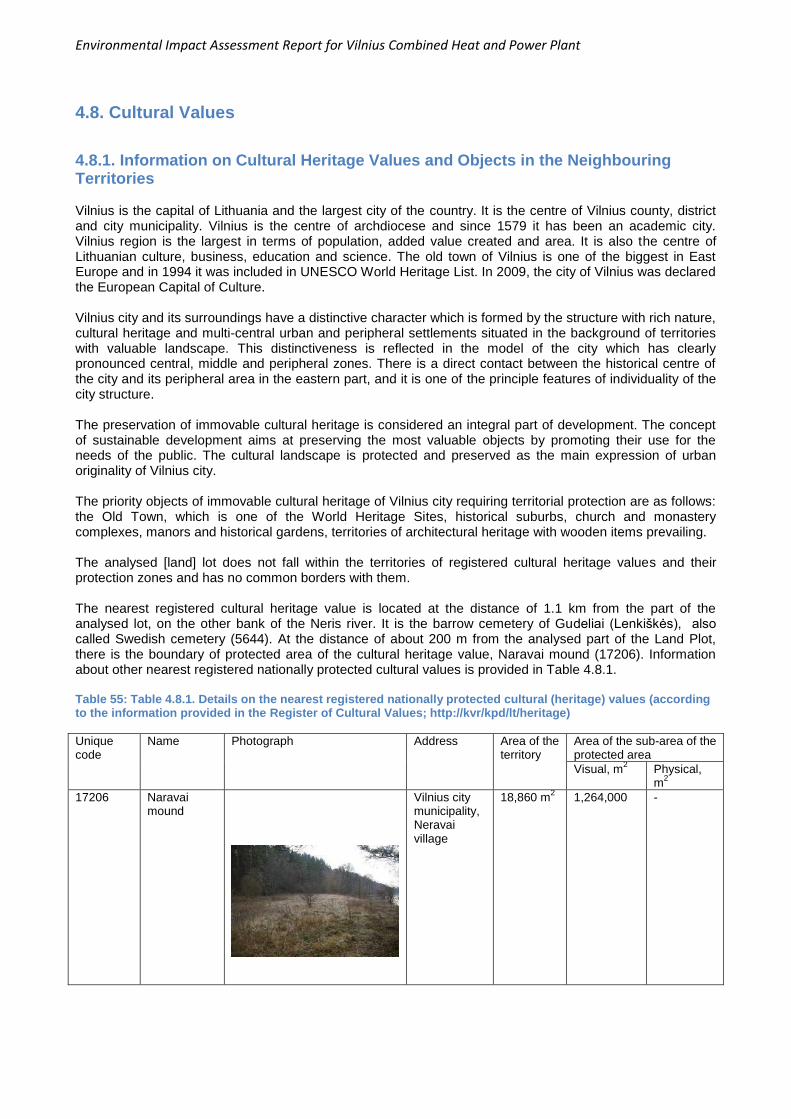
Environmental Impact Assessment Report for Vilnius Combined Heat and Power Plant
4.8. Cultural Values
4.8.1. Information on Cultural Heritage Values and Objects in the Neighbouring Territories Vilnius is the capital of Lithuania and the largest city of the country. It is the centre of Vilnius county, district and city municipality. Vilnius is the centre of archdiocese and since 1579 it has been an academic city. Vilnius region is the largest in terms of population, added value created and area. It is also the centre of Lithuanian culture, business, education and science. The old town of Vilnius is one of the biggest in East Europe and in 1994 it was included in UNESCO World Heritage List. In 2009, the city of Vilnius was declared the European Capital of Culture. Vilnius city and its surroundings have a distinctive character which is formed by the structure with rich nature, cultural heritage and multi-central urban and peripheral settlements situated in the background of territories with valuable landscape. This distinctiveness is reflected in the model of the city which has clearly pronounced central, middle and peripheral zones. There is a direct contact between the historical centre of the city and its peripheral area in the eastern part, and it is one of the principle features of individuality of the city structure. The preservation of immovable cultural heritage is considered an integral part of development. The concept of sustainable development aims at preserving the most valuable objects by promoting their use for the needs of the public. The cultural landscape is protected and preserved as the main expression of urban originality of Vilnius city. The priority objects of immovable cultural heritage of Vilnius city requiring territorial protection are as follows: the Old Town, which is one of the World Heritage Sites, historical suburbs, church and monastery complexes, manors and historical gardens, territories of architectural heritage with wooden items prevailing. The analysed [land] lot does not fall within the territories of registered cultural heritage values and their protection zones and has no common borders with them. The nearest registered cultural heritage value is located at the distance of 1.1 km from the part of the analysed lot, on the other bank of the Neris river. It is the barrow cemetery of Gudeliai (Lenkiškės), also called Swedish cemetery (5644). At the distance of about 200 m from the analysed part of the Land Plot, there is the boundary of protected area of the cultural heritage value, Naravai mound (17206). Information about other nearest registered nationally protected cultural values is provided in Table 4.8.1. Table 55: Table 4.8.1. Details on the nearest registered nationally protected cultural (heritage) values (according to the information provided in the Register of Cultural Values; http://kvr/kpd/lt/heritage)
Unique code
Name Photograph Address Area of the territory
Area of the sub-area of the protected area
Visual, m2 Physical,
m2
17206 Naravai mound
Vilnius city municipality, Neravai village
18,860 m2 1,264,000 -
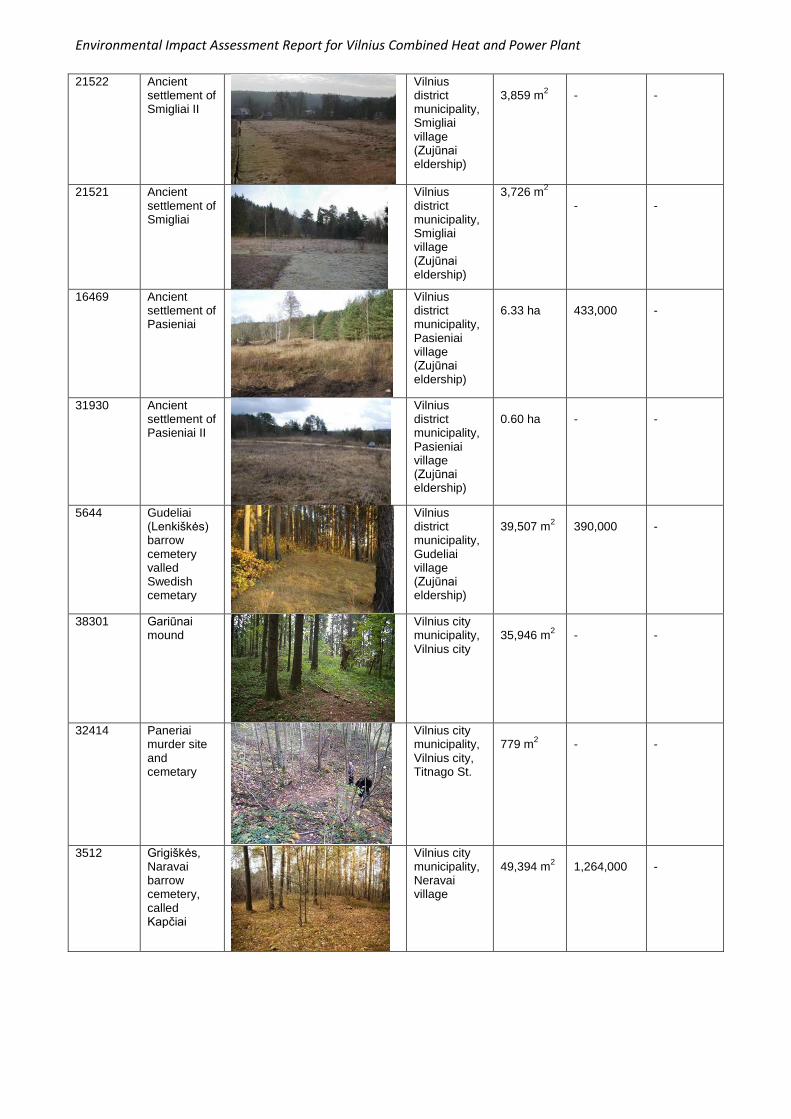
Environmental Impact Assessment Report for Vilnius Combined Heat and Power Plant
21522 Ancient settlement of Smigliai II
Vilnius district municipality, Smigliai village (Zujūnai eldership)
3,859 m
2
-
-
21521 Ancient settlement of Smigliai
Vilnius district municipality, Smigliai village (Zujūnai eldership)
3,726 m2
- -
16469 Ancient settlement of Pasieniai
Vilnius district municipality, Pasieniai village (Zujūnai eldership)
6.33 ha
433,000
-
31930 Ancient settlement of Pasieniai II
Vilnius district municipality, Pasieniai village (Zujūnai eldership)
0.60 ha
-
-
5644 Gudeliai (Lenkiškės) barrow cemetery valled Swedish cemetary
Vilnius district municipality, Gudeliai village (Zujūnai eldership)
39,507 m
2
390,000
-
38301 Gariūnai mound
Vilnius city municipality, Vilnius city
35,946 m
2
-
-
32414 Paneriai murder site and cemetary
Vilnius city municipality, Vilnius city, Titnago St.
779 m
2
-
-
3512 Grigiškės, Naravai barrow cemetery, called Kapčiai
Vilnius city municipality, Neravai village
49,394 m
2
1,264,000
-
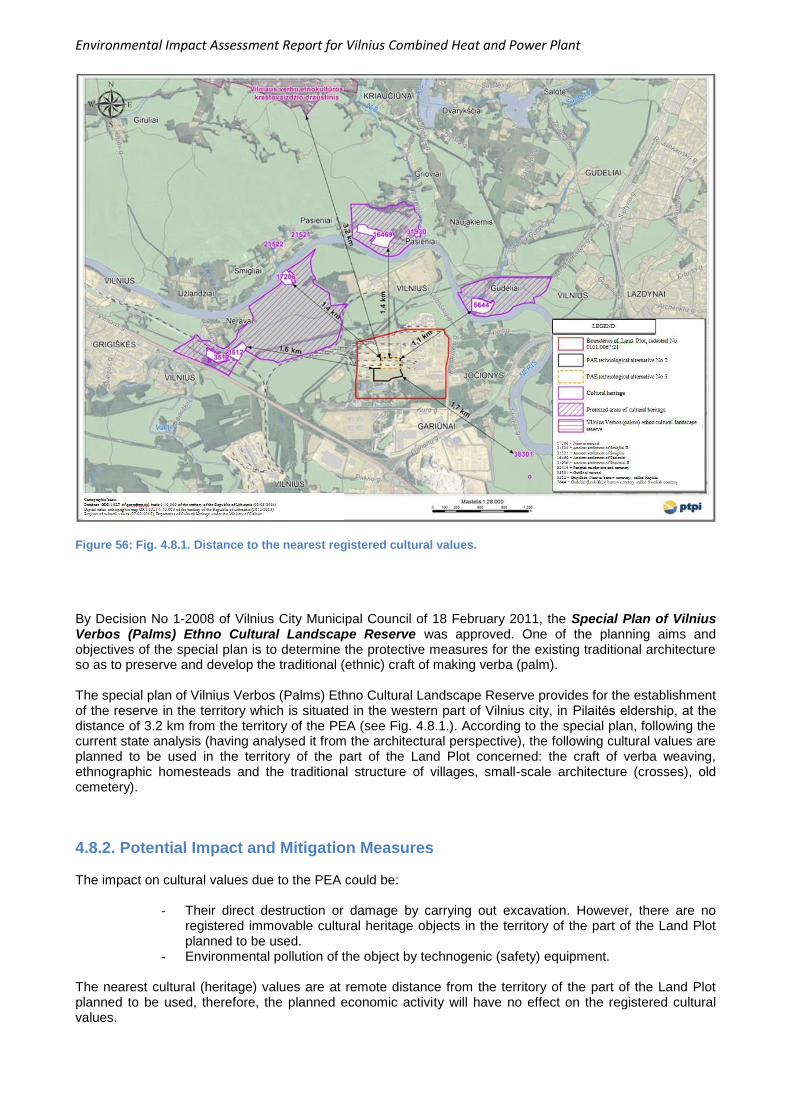
Environmental Impact Assessment Report for Vilnius Combined Heat and Power Plant
Figure 56: Fig. 4.8.1. Distance to the nearest registered cultural values.
By Decision No 1-2008 of Vilnius City Municipal Council of 18 February 2011, the Special Plan of Vilnius Verbos (Palms) Ethno Cultural Landscape Reserve was approved. One of the planning aims and objectives of the special plan is to determine the protective measures for the existing traditional architecture so as to preserve and develop the traditional (ethnic) craft of making verba (palm). The special plan of Vilnius Verbos (Palms) Ethno Cultural Landscape Reserve provides for the establishment of the reserve in the territory which is situated in the western part of Vilnius city, in Pilaitės eldership, at the distance of 3.2 km from the territory of the PEA (see Fig. 4.8.1.). According to the special plan, following the current state analysis (having analysed it from the architectural perspective), the following cultural values are planned to be used in the territory of the part of the Land Plot concerned: the craft of verba weaving, ethnographic homesteads and the traditional structure of villages, small-scale architecture (crosses), old cemetery).
4.8.2. Potential Impact and Mitigation Measures The impact on cultural values due to the PEA could be:
- Their direct destruction or damage by carrying out excavation. However, there are no registered immovable cultural heritage objects in the territory of the part of the Land Plot planned to be used.
- Environmental pollution of the object by technogenic (safety) equipment.
The nearest cultural (heritage) values are at remote distance from the territory of the part of the Land Plot planned to be used, therefore, the planned economic activity will have no effect on the registered cultural values.
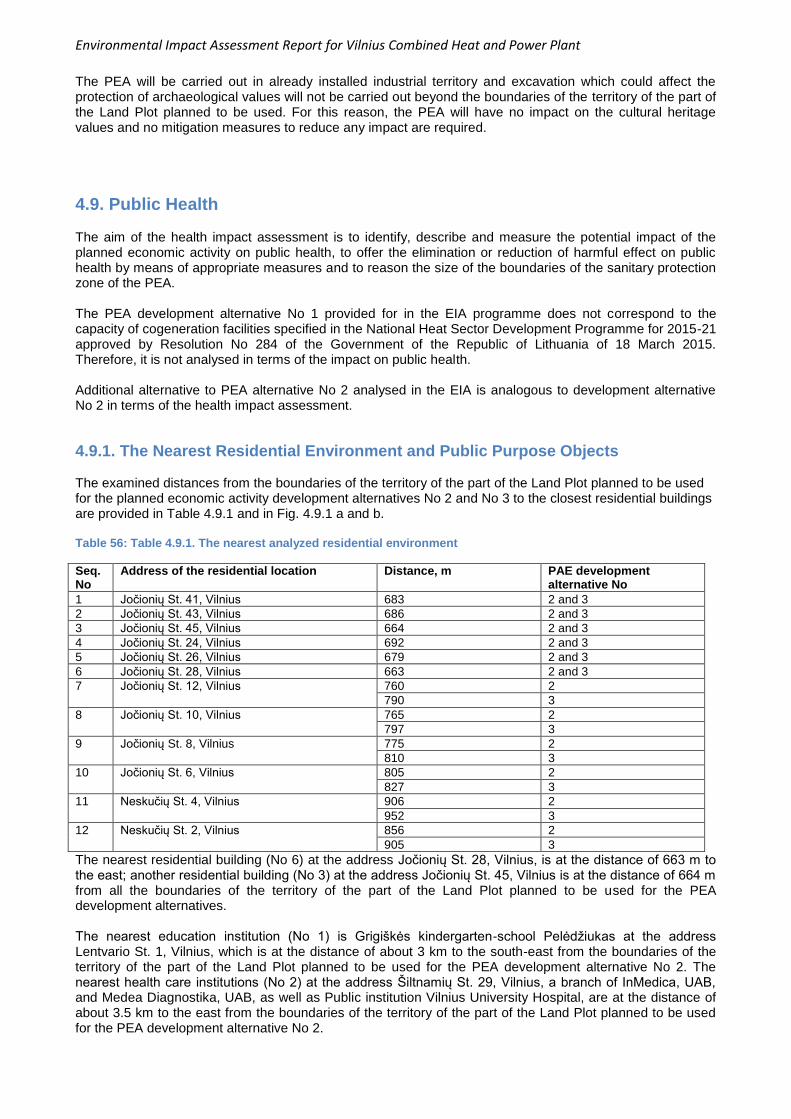
Environmental Impact Assessment Report for Vilnius Combined Heat and Power Plant
The PEA will be carried out in already installed industrial territory and excavation which could affect the protection of archaeological values will not be carried out beyond the boundaries of the territory of the part of the Land Plot planned to be used. For this reason, the PEA will have no impact on the cultural heritage values and no mitigation measures to reduce any impact are required.
4.9. Public Health The aim of the health impact assessment is to identify, describe and measure the potential impact of the planned economic activity on public health, to offer the elimination or reduction of harmful effect on public health by means of appropriate measures and to reason the size of the boundaries of the sanitary protection zone of the PEA. The PEA development alternative No 1 provided for in the EIA programme does not correspond to the capacity of cogeneration facilities specified in the National Heat Sector Development Programme for 2015-21 approved by Resolution No 284 of the Government of the Republic of Lithuania of 18 March 2015. Therefore, it is not analysed in terms of the impact on public health. Additional alternative to PEA alternative No 2 analysed in the EIA is analogous to development alternative No 2 in terms of the health impact assessment.
4.9.1. The Nearest Residential Environment and Public Purpose Objects The examined distances from the boundaries of the territory of the part of the Land Plot planned to be used for the planned economic activity development alternatives No 2 and No 3 to the closest residential buildings are provided in Table 4.9.1 and in Fig. 4.9.1 a and b. Table 56: Table 4.9.1. The nearest analyzed residential environment
Seq. No
Address of the residential location Distance, m PAE development alternative No
1 Jočionių St. 41, Vilnius 683 2 and 3
2 Jočionių St. 43, Vilnius 686 2 and 3
3 Jočionių St. 45, Vilnius 664 2 and 3
4 Jočionių St. 24, Vilnius 692 2 and 3
5 Jočionių St. 26, Vilnius 679 2 and 3
6 Jočionių St. 28, Vilnius 663 2 and 3
7 Jočionių St. 12, Vilnius 760 2
790 3
8 Jočionių St. 10, Vilnius 765 2
797 3
9 Jočionių St. 8, Vilnius 775 2
810 3
10 Jočionių St. 6, Vilnius 805 2
827 3
11 Neskučių St. 4, Vilnius 906 2
952 3
12 Neskučių St. 2, Vilnius 856 2
905 3
The nearest residential building (No 6) at the address Jočionių St. 28, Vilnius, is at the distance of 663 m to the east; another residential building (No 3) at the address Jočionių St. 45, Vilnius is at the distance of 664 m from all the boundaries of the territory of the part of the Land Plot planned to be used for the PEA development alternatives. The nearest education institution (No 1) is Grigiškės kindergarten-school Pelėdžiukas at the address Lentvario St. 1, Vilnius, which is at the distance of about 3 km to the south-east from the boundaries of the territory of the part of the Land Plot planned to be used for the PEA development alternative No 2. The nearest health care institutions (No 2) at the address Šiltnamių St. 29, Vilnius, a branch of InMedica, UAB, and Medea Diagnostika, UAB, as well as Public institution Vilnius University Hospital, are at the distance of about 3.5 km to the east from the boundaries of the territory of the part of the Land Plot planned to be used for the PEA development alternative No 2.
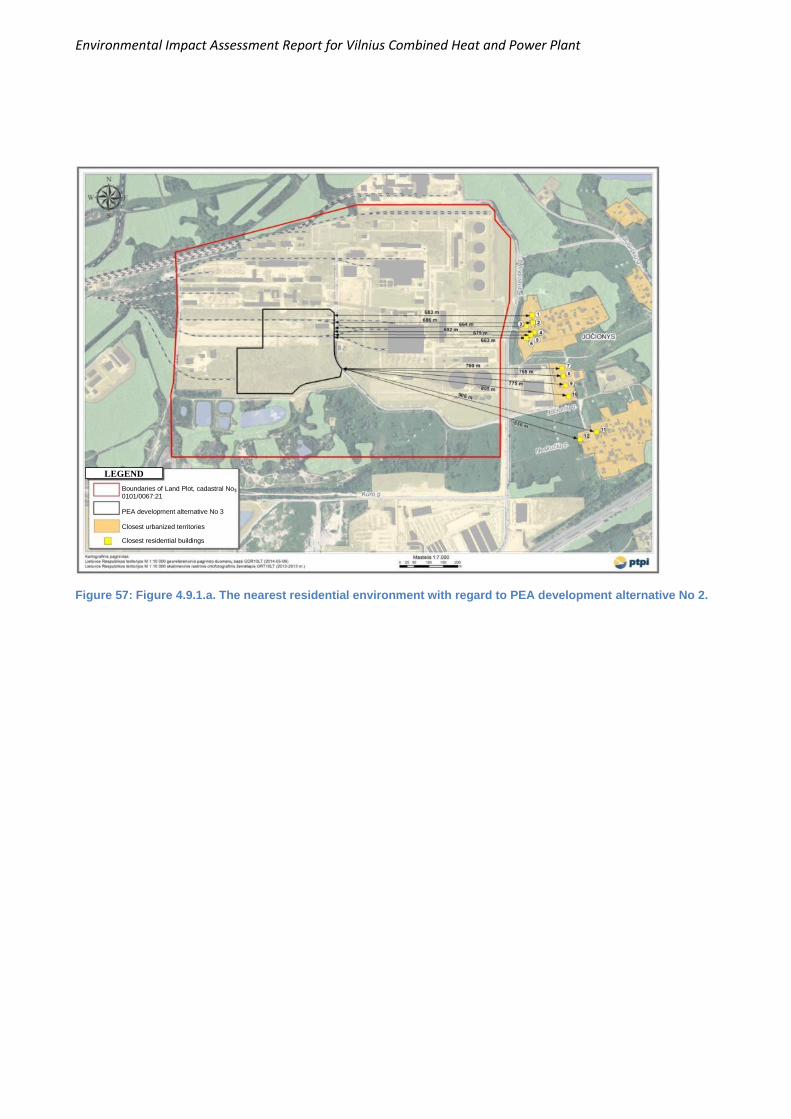
Environmental Impact Assessment Report for Vilnius Combined Heat and Power Plant
Figure 57: Figure 4.9.1.a. The nearest residential environment with regard to PEA development alternative No 2.
LEGEND
Boundaries of Land Plot, cadastral No 0101/0067:21 PEA development alternative No 3 Closest urbanized territories
Closest residential buildings

Environmental Impact Assessment Report for Vilnius Combined Heat and Power Plant
Figure 58: Figure 4.9.1.b. The nearest residential environment with regard to PEA development alternative No 3.
Boundaries of Land Plot, cadastral No
0101/0067:21
PEA development alternative No 3
Closest urbanized territories
Closest residential buildings
LEGEND
Environmental Impact Assessment Report for Vilnius Combined Heat and Power Plant
Figure 59: Figure 4.9.3. Nearest public purpose environment
4.9.2. Recreation Territories Recreation territories and areas important for the development of tourism are analysed where the solutions of the general plan of the territory of Vilnius city municipality are examined. The territory of the part of the Land Plot planned to be used for the planned economic activity development alternatives No 2 and No 3 does not fall into the category of territories meant for recreational activities and territories important for the development of tourism. For this reason planning of the PEA in the specified location does not conflict with the solutions of the general plan of the territory of Vilnius city municipality.
4.9.3. Current State of Public Health The territory of the part of the Land Plot planned to be used for the planned economic activity is situated in the Land Plot at the address Jočioniu St. 13, Vilnius city, Vilnius city municipality. In terms of the impact of the PEA on health, noise, ambient air pollution and odour pollution should be taken into consideration (see Section 4.9.4. “Analysis of Factors Having Impact on Health”) which, subject to the scale of action and duration of effect (exposure), may be potential etiological factors determining various central nervous system diseases, circulatory disturbances, respiratory system and digestive system diseases. The analysis of public health indicators has been performed focusing on the aforementioned diseases which are relevant for the examined activity.
LEGEND
Boundaries of Land Plot, cadastral No 0101/0067:21
PEA development alternative No 2
PEA development alternative No 3
Education institutions Health care institutions
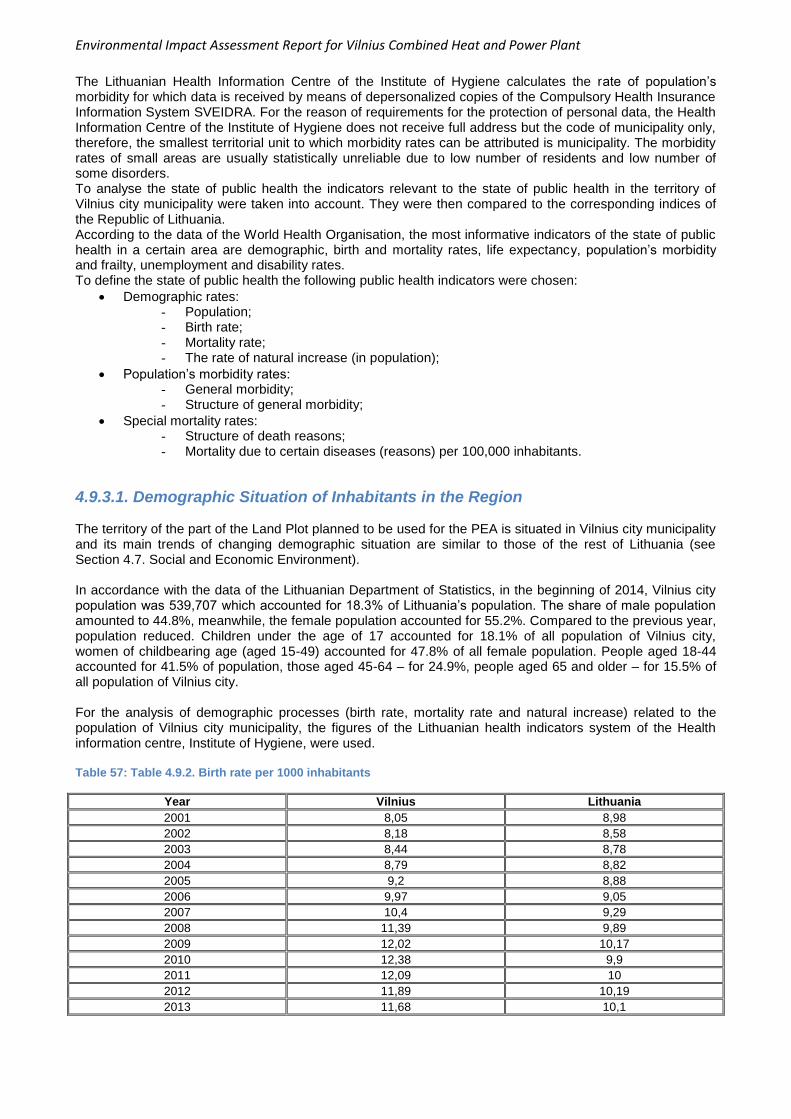
Environmental Impact Assessment Report for Vilnius Combined Heat and Power Plant
The Lithuanian Health Information Centre of the Institute of Hygiene calculates the rate of population’s morbidity for which data is received by means of depersonalized copies of the Compulsory Health Insurance Information System SVEIDRA. For the reason of requirements for the protection of personal data, the Health Information Centre of the Institute of Hygiene does not receive full address but the code of municipality only, therefore, the smallest territorial unit to which morbidity rates can be attributed is municipality. The morbidity rates of small areas are usually statistically unreliable due to low number of residents and low number of some disorders. To analyse the state of public health the indicators relevant to the state of public health in the territory of Vilnius city municipality were taken into account. They were then compared to the corresponding indices of the Republic of Lithuania. According to the data of the World Health Organisation, the most informative indicators of the state of public health in a certain area are demographic, birth and mortality rates, life expectancy, population’s morbidity and frailty, unemployment and disability rates. To define the state of public health the following public health indicators were chosen:
Demographic rates: - Population; - Birth rate; - Mortality rate; - The rate of natural increase (in population);
Population’s morbidity rates: - General morbidity; - Structure of general morbidity;
Special mortality rates: - Structure of death reasons; - Mortality due to certain diseases (reasons) per 100,000 inhabitants.
4.9.3.1. Demographic Situation of Inhabitants in the Region The territory of the part of the Land Plot planned to be used for the PEA is situated in Vilnius city municipality and its main trends of changing demographic situation are similar to those of the rest of Lithuania (see Section 4.7. Social and Economic Environment). In accordance with the data of the Lithuanian Department of Statistics, in the beginning of 2014, Vilnius city population was 539,707 which accounted for 18.3% of Lithuania’s population. The share of male population amounted to 44.8%, meanwhile, the female population accounted for 55.2%. Compared to the previous year, population reduced. Children under the age of 17 accounted for 18.1% of all population of Vilnius city, women of childbearing age (aged 15-49) accounted for 47.8% of all female population. People aged 18-44 accounted for 41.5% of population, those aged 45-64 – for 24.9%, people aged 65 and older – for 15.5% of all population of Vilnius city. For the analysis of demographic processes (birth rate, mortality rate and natural increase) related to the population of Vilnius city municipality, the figures of the Lithuanian health indicators system of the Health information centre, Institute of Hygiene, were used. Table 57: Table 4.9.2. Birth rate per 1000 inhabitants
Year Vilnius Lithuania
2001 8,05 8,98
2002 8,18 8,58
2003 8,44 8,78
2004 8,79 8,82
2005 9,2 8,88
2006 9,97 9,05
2007 10,4 9,29
2008 11,39 9,89
2009 12,02 10,17
2010 12,38 9,9
2011 12,09 10
2012 11,89 10,19
2013 11,68 10,1
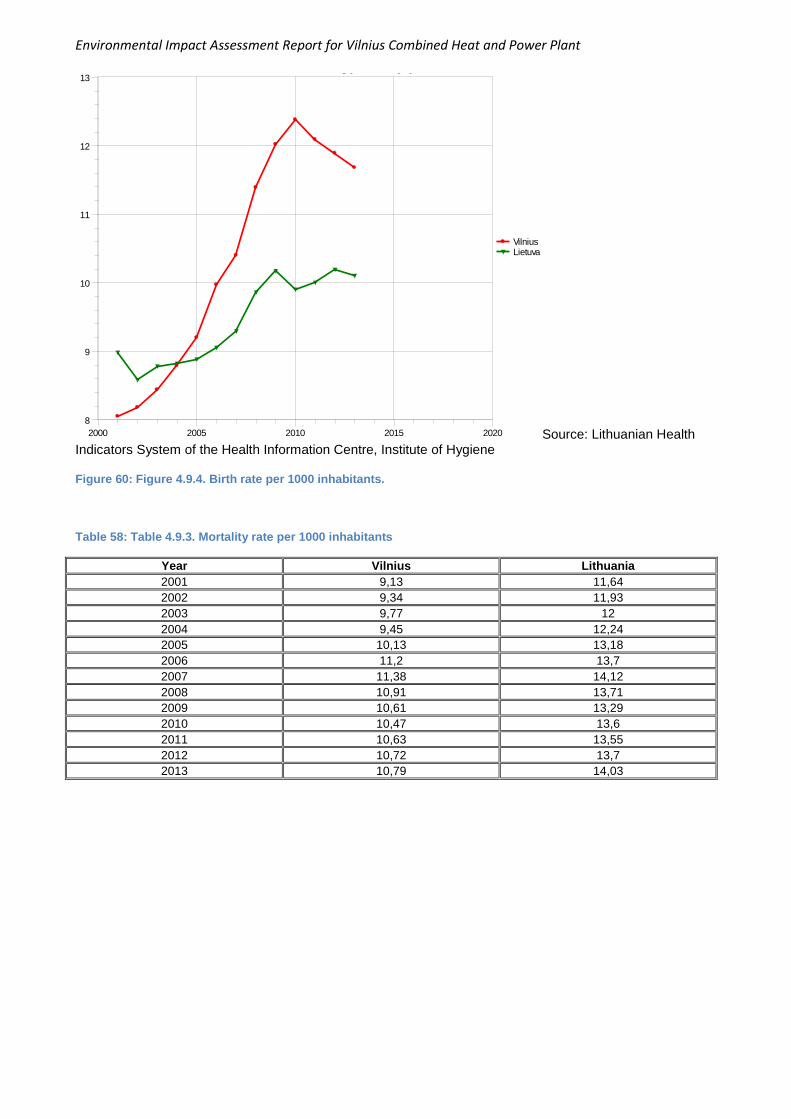
Environmental Impact Assessment Report for Vilnius Combined Heat and Power Plant
Source: Lithuanian Health Indicators System of the Health Information Centre, Institute of Hygiene Figure 60: Figure 4.9.4. Birth rate per 1000 inhabitants.
Table 58: Table 4.9.3. Mortality rate per 1000 inhabitants
Year Vilnius Lithuania
2001 9,13 11,64
2002 9,34 11,93
2003 9,77 12
2004 9,45 12,24
2005 10,13 13,18
2006 11,2 13,7
2007 11,38 14,12
2008 10,91 13,71
2009 10,61 13,29
2010 10,47 13,6
2011 10,63 13,55
2012 10,72 13,7
2013 10,79 14,03
8
9
10
11
12
13
2000 2005 2010 2015 2020
VilniusLietuva
Gimstamumas 1000 gyventojų
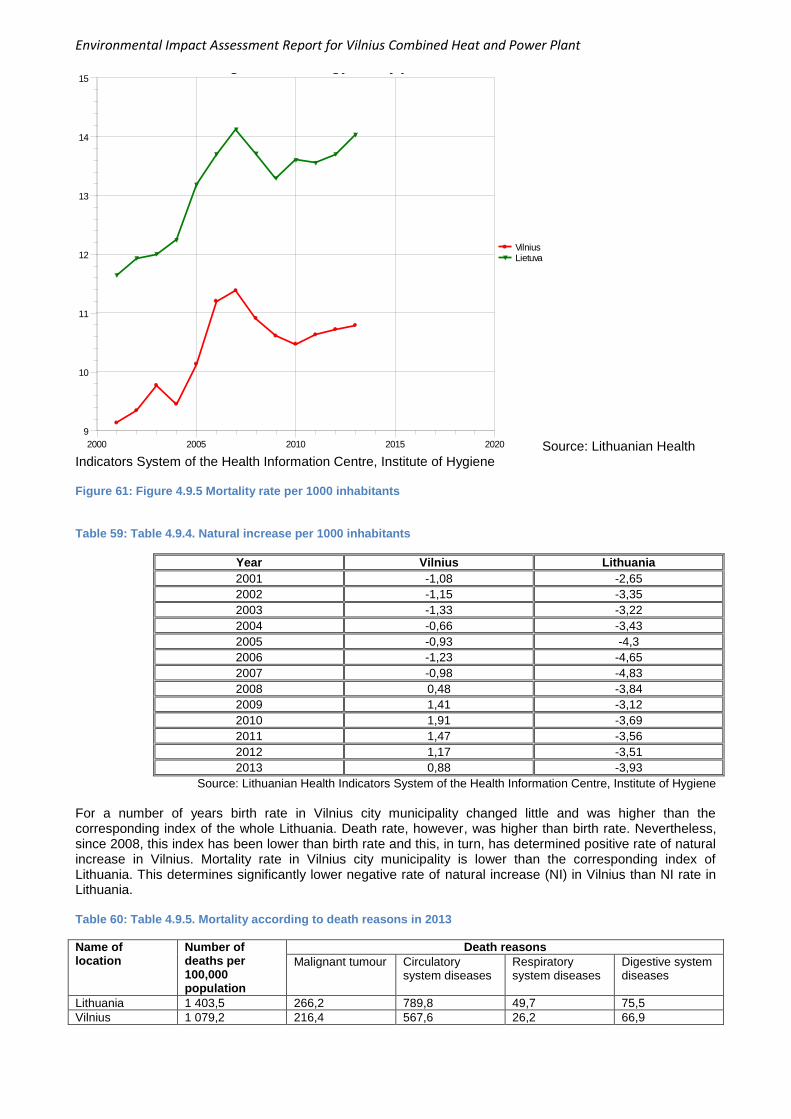
Environmental Impact Assessment Report for Vilnius Combined Heat and Power Plant
Source: Lithuanian Health Indicators System of the Health Information Centre, Institute of Hygiene Figure 61: Figure 4.9.5 Mortality rate per 1000 inhabitants
Table 59: Table 4.9.4. Natural increase per 1000 inhabitants
Year Vilnius Lithuania
2001 -1,08 -2,65
2002 -1,15 -3,35
2003 -1,33 -3,22
2004 -0,66 -3,43
2005 -0,93 -4,3
2006 -1,23 -4,65
2007 -0,98 -4,83
2008 0,48 -3,84
2009 1,41 -3,12
2010 1,91 -3,69
2011 1,47 -3,56
2012 1,17 -3,51
2013 0,88 -3,93
Source: Lithuanian Health Indicators System of the Health Information Centre, Institute of Hygiene
For a number of years birth rate in Vilnius city municipality changed little and was higher than the corresponding index of the whole Lithuania. Death rate, however, was higher than birth rate. Nevertheless, since 2008, this index has been lower than birth rate and this, in turn, has determined positive rate of natural increase in Vilnius. Mortality rate in Vilnius city municipality is lower than the corresponding index of Lithuania. This determines significantly lower negative rate of natural increase (NI) in Vilnius than NI rate in Lithuania. Table 60: Table 4.9.5. Mortality according to death reasons in 2013
Name of location
Number of deaths per 100,000 population
Death reasons
Malignant tumour Circulatory system diseases
Respiratory system diseases
Digestive system diseases
Lithuania 1 403,5 266,2 789,8 49,7 75,5
Vilnius 1 079,2 216,4 567,6 26,2 66,9
9
10
11
12
13
14
15
2000 2005 2010 2015 2020
VilniusLietuva
Mirtingumas 1000 gyventojų
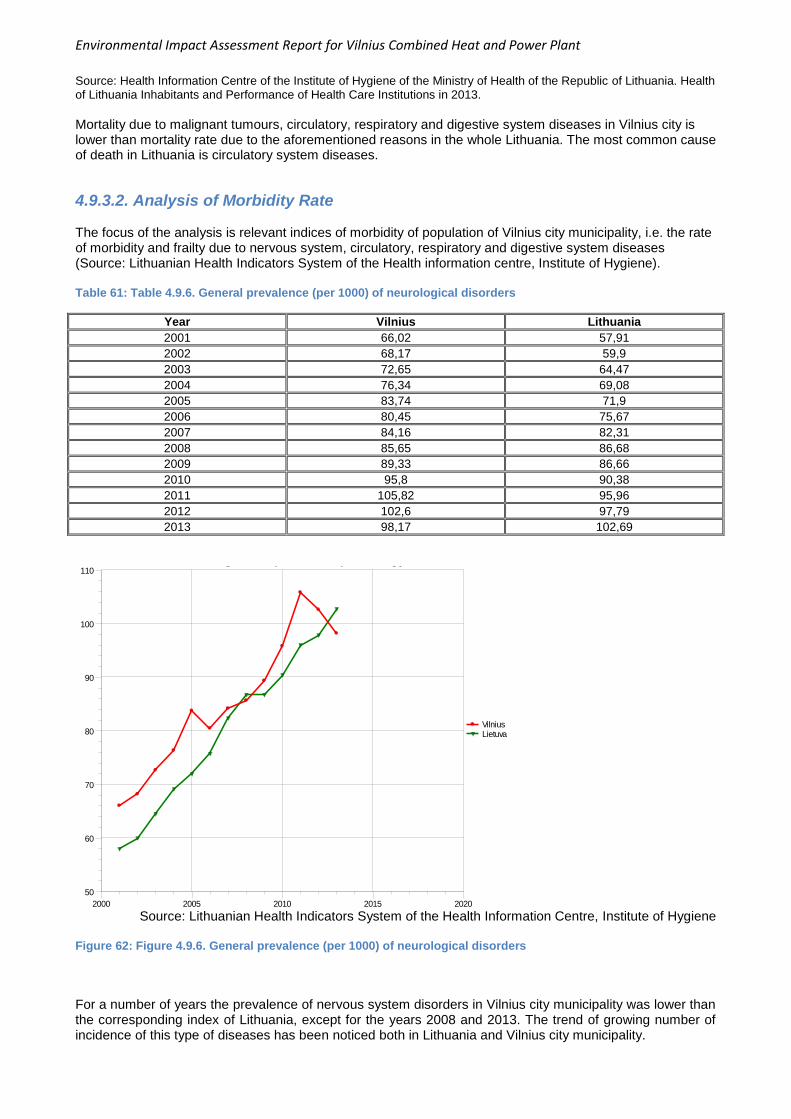
Environmental Impact Assessment Report for Vilnius Combined Heat and Power Plant
Source: Health Information Centre of the Institute of Hygiene of the Ministry of Health of the Republic of Lithuania. Health of Lithuania Inhabitants and Performance of Health Care Institutions in 2013.
Mortality due to malignant tumours, circulatory, respiratory and digestive system diseases in Vilnius city is lower than mortality rate due to the aforementioned reasons in the whole Lithuania. The most common cause of death in Lithuania is circulatory system diseases.
4.9.3.2. Analysis of Morbidity Rate The focus of the analysis is relevant indices of morbidity of population of Vilnius city municipality, i.e. the rate of morbidity and frailty due to nervous system, circulatory, respiratory and digestive system diseases (Source: Lithuanian Health Indicators System of the Health information centre, Institute of Hygiene). Table 61: Table 4.9.6. General prevalence (per 1000) of neurological disorders
Year Vilnius Lithuania
2001 66,02 57,91
2002 68,17 59,9
2003 72,65 64,47
2004 76,34 69,08
2005 83,74 71,9
2006 80,45 75,67
2007 84,16 82,31
2008 85,65 86,68
2009 89,33 86,66
2010 95,8 90,38
2011 105,82 95,96
2012 102,6 97,79
2013 98,17 102,69
Source: Lithuanian Health Indicators System of the Health Information Centre, Institute of Hygiene
Figure 62: Figure 4.9.6. General prevalence (per 1000) of neurological disorders
For a number of years the prevalence of nervous system disorders in Vilnius city municipality was lower than the corresponding index of Lithuania, except for the years 2008 and 2013. The trend of growing number of incidence of this type of diseases has been noticed both in Lithuania and Vilnius city municipality.
50
60
70
80
90
100
110
2000 2005 2010 2015 2020
VilniusLietuva
Iš viso užregistruota susirgimų nervų sistemos ligomis (G00-G99) 1000 gyv.

Environmental Impact Assessment Report for Vilnius Combined Heat and Power Plant
Table 62: Table 4.9.7. The number of people ill with nervous system diseases (G00-G99) per 1000 inhabitants
Year Vilnius Lithuania
2001 63,51 56,8
2002 64,26 58,67
2003 67,95 62,56
2004 70,79 66,42
2005 76,49 69,02
2006 74,31 72,08
2007 77,28 78,07
2008 78,28 81,46
2009 80,78 81,16
2010 85,39 83,8
2011 100,60 90,99
2012 103,11 95,95
2013 100,31 98,66
Source: Lithuanian Health Indicators System of the Health Information Centre, Institute of Hygiene
The number of persons ill with nervous system diseases and the prevalence rate has been growing for the last decade in Lithuania and Vilnius city municipality. The incidence rate of neurological morbidity in Vilnius city municipality is higher than the corresponding index of Lithuania, except for the period from 2007 to 2009. Table 63: Table 4.9.8. General prevalence (per 1000) of circulatory disorders
Year Vilnius Lithuania
2001 174,5 182,06
2002 176,23 192,58
2003 192,35 205,75
2004 198,96 223,01
2005 209,63 234,89
2006 211,27 249,62
2007 208,75 259,66
2008 218,24 278,22
2009 232,58 290,39
2010 249,95 310,66
2011 259,64 323,46
2012 266,69 336,42
2013 271,34 354,98
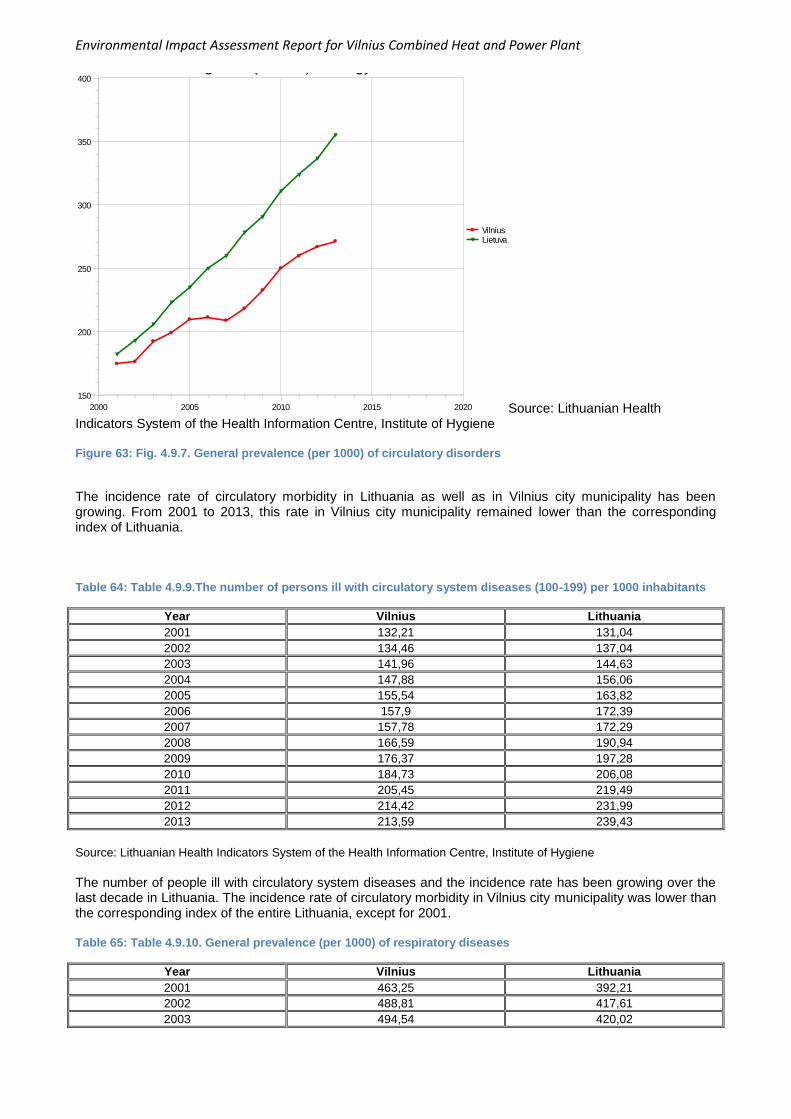
Environmental Impact Assessment Report for Vilnius Combined Heat and Power Plant
Source: Lithuanian Health Indicators System of the Health Information Centre, Institute of Hygiene Figure 63: Fig. 4.9.7. General prevalence (per 1000) of circulatory disorders
The incidence rate of circulatory morbidity in Lithuania as well as in Vilnius city municipality has been growing. From 2001 to 2013, this rate in Vilnius city municipality remained lower than the corresponding index of Lithuania. Table 64: Table 4.9.9.The number of persons ill with circulatory system diseases (100-199) per 1000 inhabitants
Year Vilnius Lithuania
2001 132,21 131,04
2002 134,46 137,04
2003 141,96 144,63
2004 147,88 156,06
2005 155,54 163,82
2006 157,9 172,39
2007 157,78 172,29
2008 166,59 190,94
2009 176,37 197,28
2010 184,73 206,08
2011 205,45 219,49
2012 214,42 231,99
2013 213,59 239,43
Source: Lithuanian Health Indicators System of the Health Information Centre, Institute of Hygiene
The number of people ill with circulatory system diseases and the incidence rate has been growing over the last decade in Lithuania. The incidence rate of circulatory morbidity in Vilnius city municipality was lower than the corresponding index of the entire Lithuania, except for 2001. Table 65: Table 4.9.10. General prevalence (per 1000) of respiratory diseases
Year Vilnius Lithuania
2001 463,25 392,21
2002 488,81 417,61
2003 494,54 420,02
150
200
250
300
350
400
2000 2005 2010 2015 2020
VilniusLietuva
Iš viso užregistruota susirgimų kraujotakos sistemos ligomis (I00-I99) 1000 gyv.
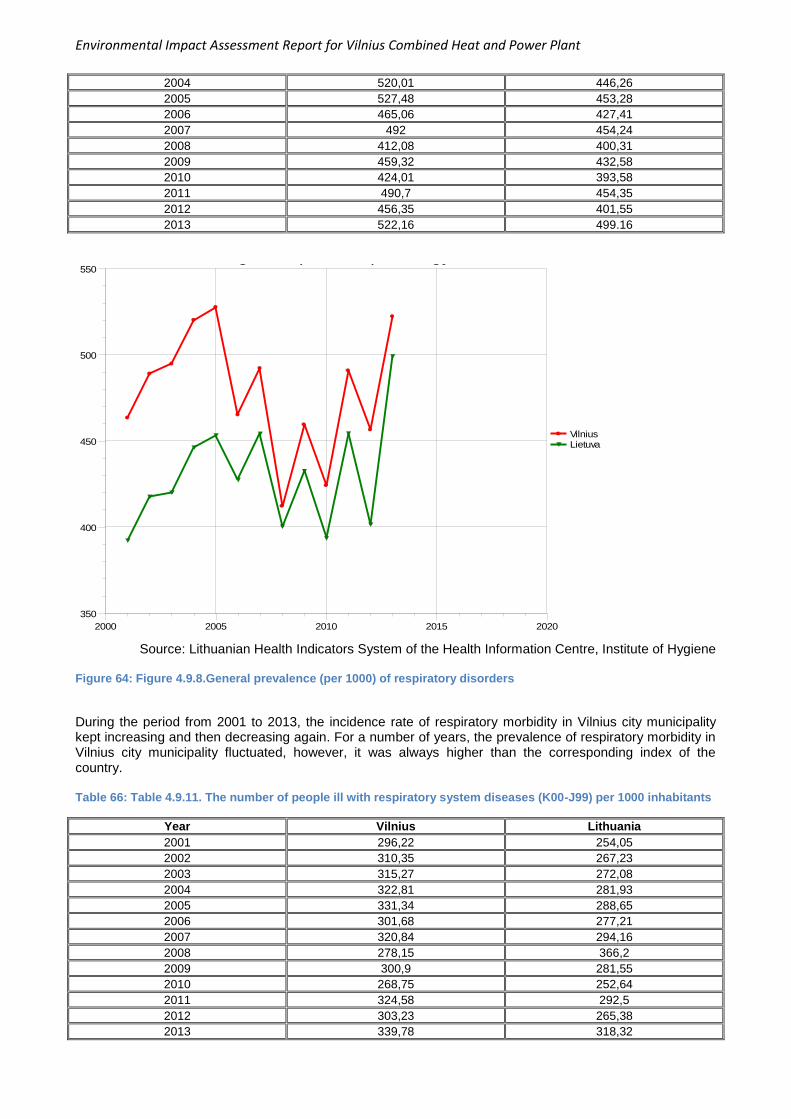
Environmental Impact Assessment Report for Vilnius Combined Heat and Power Plant
2004 520,01 446,26
2005 527,48 453,28
2006 465,06 427,41
2007 492 454,24
2008 412,08 400,31
2009 459,32 432,58
2010 424,01 393,58
2011 490,7 454,35
2012 456,35 401,55
2013 522,16 499.16
Source: Lithuanian Health Indicators System of the Health Information Centre, Institute of Hygiene
Figure 64: Figure 4.9.8.General prevalence (per 1000) of respiratory disorders
During the period from 2001 to 2013, the incidence rate of respiratory morbidity in Vilnius city municipality kept increasing and then decreasing again. For a number of years, the prevalence of respiratory morbidity in Vilnius city municipality fluctuated, however, it was always higher than the corresponding index of the country. Table 66: Table 4.9.11. The number of people ill with respiratory system diseases (K00-J99) per 1000 inhabitants
Year Vilnius Lithuania
2001 296,22 254,05
2002 310,35 267,23
2003 315,27 272,08
2004 322,81 281,93
2005 331,34 288,65
2006 301,68 277,21
2007 320,84 294,16
2008 278,15 366,2
2009 300,9 281,55
2010 268,75 252,64
2011 324,58 292,5
2012 303,23 265,38
2013 339,78 318,32
350
400
450
500
550
2000 2005 2010 2015 2020
VilniusLietuva
Iš viso užregistruota susirgimų kvėpavimo sistemos ligomis (J00-J99) 1000 gyv.

Environmental Impact Assessment Report for Vilnius Combined Heat and Power Plant
Source: Lithuanian Health Indicators System of the Health Information Centre, Institute of Hygiene
For the last decade the number of people ill with respiratory system diseases and the incidence rate in Vilnius city municipality has fluctuated. For a number of years the number of people with respiratory disorders has been slightly higher in Vilnius city municipality than the prevalence rate in Lithuania. Table 67: Table 4.9.12. General prevalence (per 1000) of digestive disorders
Year Vilnius Lithuania
2001 83,6 78,45
2002 81,98 81,06
2003 84,29 79,73
2004 84,74 76,18
2005 90,21 90,62
2006 85,69 88,69
2007 85,01 88,39
2008 90,4 97,13
2009 91,9 95,28
2010 98,93 98,04
2011 108,77 101,88
2012 109,4 102,18
2013 122,45 117,76
Source: Lithuanian Health Indicators System of the Health Information Centre, Institute of Hygiene
Figure 65: Figure 4.9.9.General prevalence (per 1000) of digestive disorders
The incidence rate of digestive morbidity in Lithuania as well as in Vilnius city municipality has been growing. For a number of years, the prevalence of digestive disorders in Vilnius city municipality has been higher than the corresponding index in Lithuania. Table 68: Table 4.9.13. The number of people ill with digestive diseases excluding dental diseases (K09-K 93) per 1000 inhabitants
70
80
90
100
110
120
130
2000 2005 2010 2015 2020
VilniusLietuva
Iš viso užregistruota susirgimų virškinimo sistemos ligomis (K09-K93) 1000 gyv.
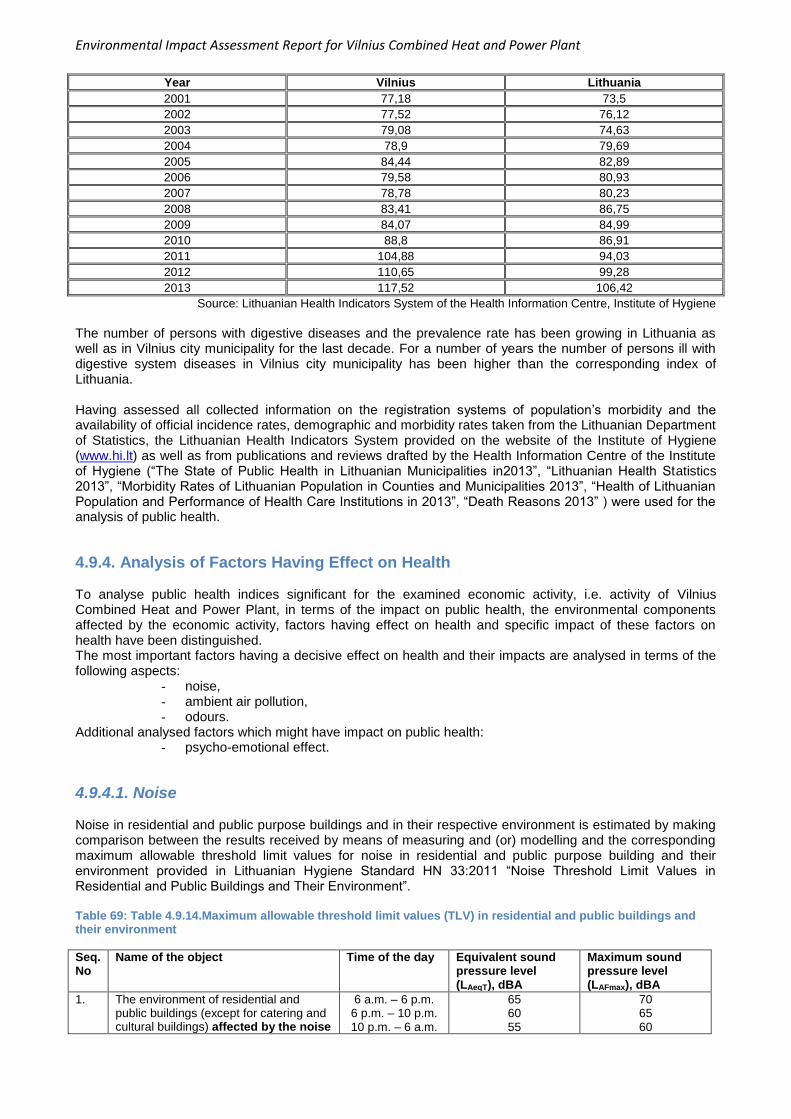
Environmental Impact Assessment Report for Vilnius Combined Heat and Power Plant
Year Vilnius Lithuania
2001 77,18 73,5
2002 77,52 76,12
2003 79,08 74,63
2004 78,9 79,69
2005 84,44 82,89
2006 79,58 80,93
2007 78,78 80,23
2008 83,41 86,75
2009 84,07 84,99
2010 88,8 86,91
2011 104,88 94,03
2012 110,65 99,28
2013 117,52 106,42
Source: Lithuanian Health Indicators System of the Health Information Centre, Institute of Hygiene
The number of persons with digestive diseases and the prevalence rate has been growing in Lithuania as well as in Vilnius city municipality for the last decade. For a number of years the number of persons ill with digestive system diseases in Vilnius city municipality has been higher than the corresponding index of Lithuania. Having assessed all collected information on the registration systems of population’s morbidity and the availability of official incidence rates, demographic and morbidity rates taken from the Lithuanian Department of Statistics, the Lithuanian Health Indicators System provided on the website of the Institute of Hygiene (www.hi.lt) as well as from publications and reviews drafted by the Health Information Centre of the Institute of Hygiene (“The State of Public Health in Lithuanian Municipalities in2013”, “Lithuanian Health Statistics 2013”, “Morbidity Rates of Lithuanian Population in Counties and Municipalities 2013”, “Health of Lithuanian Population and Performance of Health Care Institutions in 2013”, “Death Reasons 2013” ) were used for the analysis of public health.
4.9.4. Analysis of Factors Having Effect on Health To analyse public health indices significant for the examined economic activity, i.e. activity of Vilnius Combined Heat and Power Plant, in terms of the impact on public health, the environmental components affected by the economic activity, factors having effect on health and specific impact of these factors on health have been distinguished. The most important factors having a decisive effect on health and their impacts are analysed in terms of the following aspects:
- noise, - ambient air pollution, - odours.
Additional analysed factors which might have impact on public health: - psycho-emotional effect.
4.9.4.1. Noise Noise in residential and public purpose buildings and in their respective environment is estimated by making comparison between the results received by means of measuring and (or) modelling and the corresponding maximum allowable threshold limit values for noise in residential and public purpose building and their environment provided in Lithuanian Hygiene Standard HN 33:2011 “Noise Threshold Limit Values in Residential and Public Buildings and Their Environment”. Table 69: Table 4.9.14.Maximum allowable threshold limit values (TLV) in residential and public buildings and their environment
Seq. No
Name of the object Time of the day Equivalent sound pressure level (LAeqT), dBA
Maximum sound pressure level (LAFmax), dBA
1. The environment of residential and public buildings (except for catering and cultural buildings) affected by the noise
6 a.m. – 6 p.m. 6 p.m. – 10 p.m. 10 p.m. – 6 a.m.
65 60 55
70 65 60
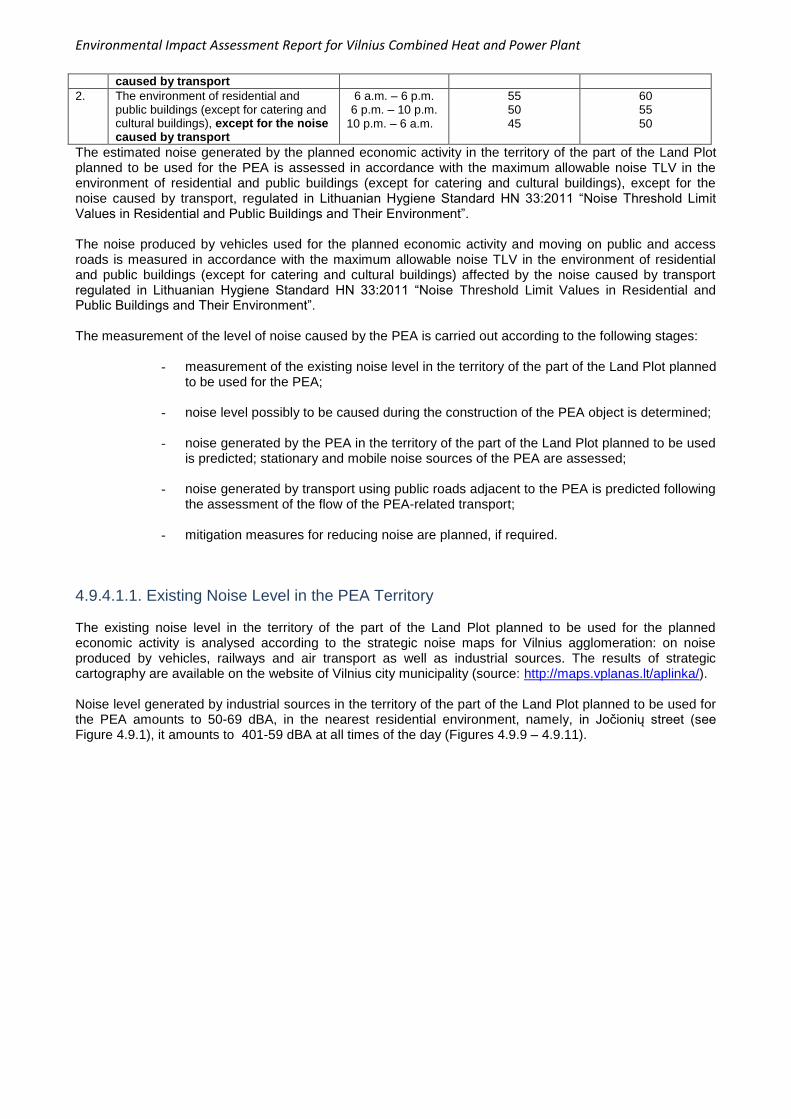
Environmental Impact Assessment Report for Vilnius Combined Heat and Power Plant
caused by transport
2. The environment of residential and public buildings (except for catering and cultural buildings), except for the noise caused by transport
6 a.m. – 6 p.m. 6 p.m. – 10 p.m.
10 p.m. – 6 a.m.
55 50 45
60 55 50
The estimated noise generated by the planned economic activity in the territory of the part of the Land Plot planned to be used for the PEA is assessed in accordance with the maximum allowable noise TLV in the environment of residential and public buildings (except for catering and cultural buildings), except for the noise caused by transport, regulated in Lithuanian Hygiene Standard HN 33:2011 “Noise Threshold Limit Values in Residential and Public Buildings and Their Environment”. The noise produced by vehicles used for the planned economic activity and moving on public and access roads is measured in accordance with the maximum allowable noise TLV in the environment of residential and public buildings (except for catering and cultural buildings) affected by the noise caused by transport regulated in Lithuanian Hygiene Standard HN 33:2011 “Noise Threshold Limit Values in Residential and Public Buildings and Their Environment”. The measurement of the level of noise caused by the PEA is carried out according to the following stages:
- measurement of the existing noise level in the territory of the part of the Land Plot planned to be used for the PEA;
- noise level possibly to be caused during the construction of the PEA object is determined;
- noise generated by the PEA in the territory of the part of the Land Plot planned to be used is predicted; stationary and mobile noise sources of the PEA are assessed;
- noise generated by transport using public roads adjacent to the PEA is predicted following
the assessment of the flow of the PEA-related transport;
- mitigation measures for reducing noise are planned, if required.
4.9.4.1.1. Existing Noise Level in the PEA Territory The existing noise level in the territory of the part of the Land Plot planned to be used for the planned economic activity is analysed according to the strategic noise maps for Vilnius agglomeration: on noise produced by vehicles, railways and air transport as well as industrial sources. The results of strategic cartography are available on the website of Vilnius city municipality (source: http://maps.vplanas.lt/aplinka/). Noise level generated by industrial sources in the territory of the part of the Land Plot planned to be used for the PEA amounts to 50-69 dBA, in the nearest residential environment, namely, in Jočionių street (see Figure 4.9.1), it amounts to 401-59 dBA at all times of the day (Figures 4.9.9 – 4.9.11).
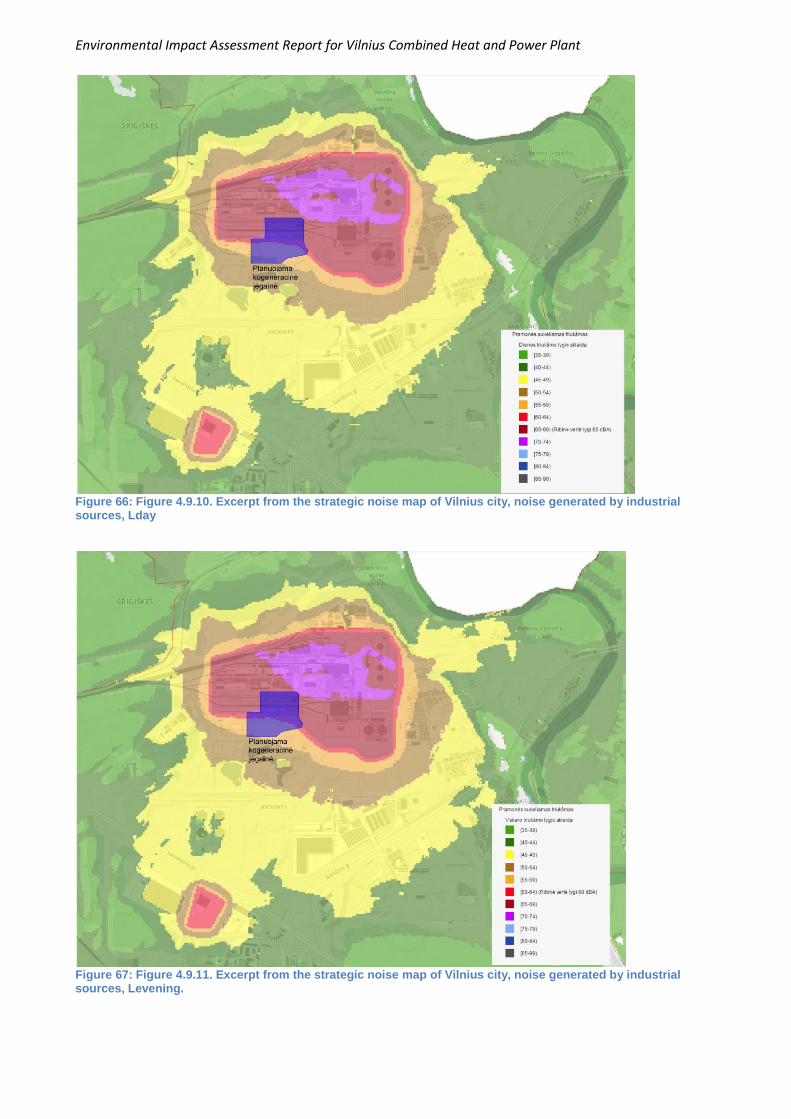
Environmental Impact Assessment Report for Vilnius Combined Heat and Power Plant
Figure 66: Figure 4.9.10. Excerpt from the strategic noise map of Vilnius city, noise generated by industrial sources, Lday
Figure 67: Figure 4.9.11. Excerpt from the strategic noise map of Vilnius city, noise generated by industrial sources, Levening.
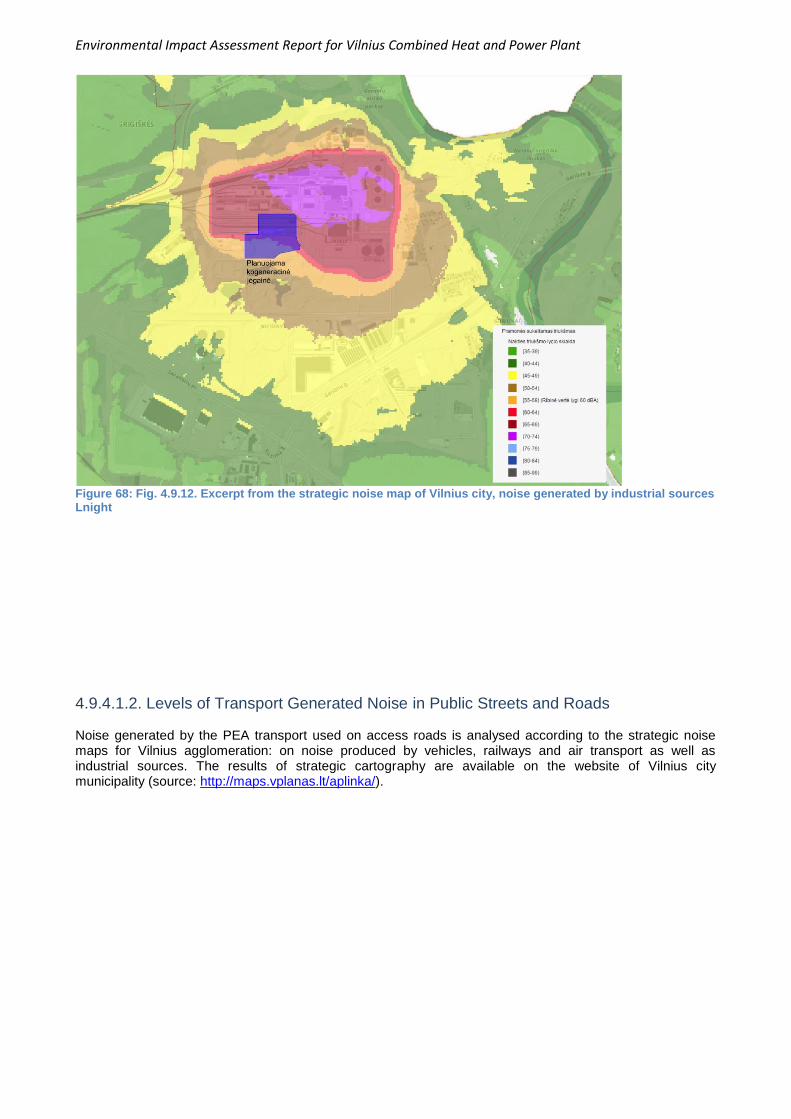
Environmental Impact Assessment Report for Vilnius Combined Heat and Power Plant
Figure 68: Fig. 4.9.12. Excerpt from the strategic noise map of Vilnius city, noise generated by industrial sources Lnight
4.9.4.1.2. Levels of Transport Generated Noise in Public Streets and Roads Noise generated by the PEA transport used on access roads is analysed according to the strategic noise maps for Vilnius agglomeration: on noise produced by vehicles, railways and air transport as well as industrial sources. The results of strategic cartography are available on the website of Vilnius city municipality (source: http://maps.vplanas.lt/aplinka/).
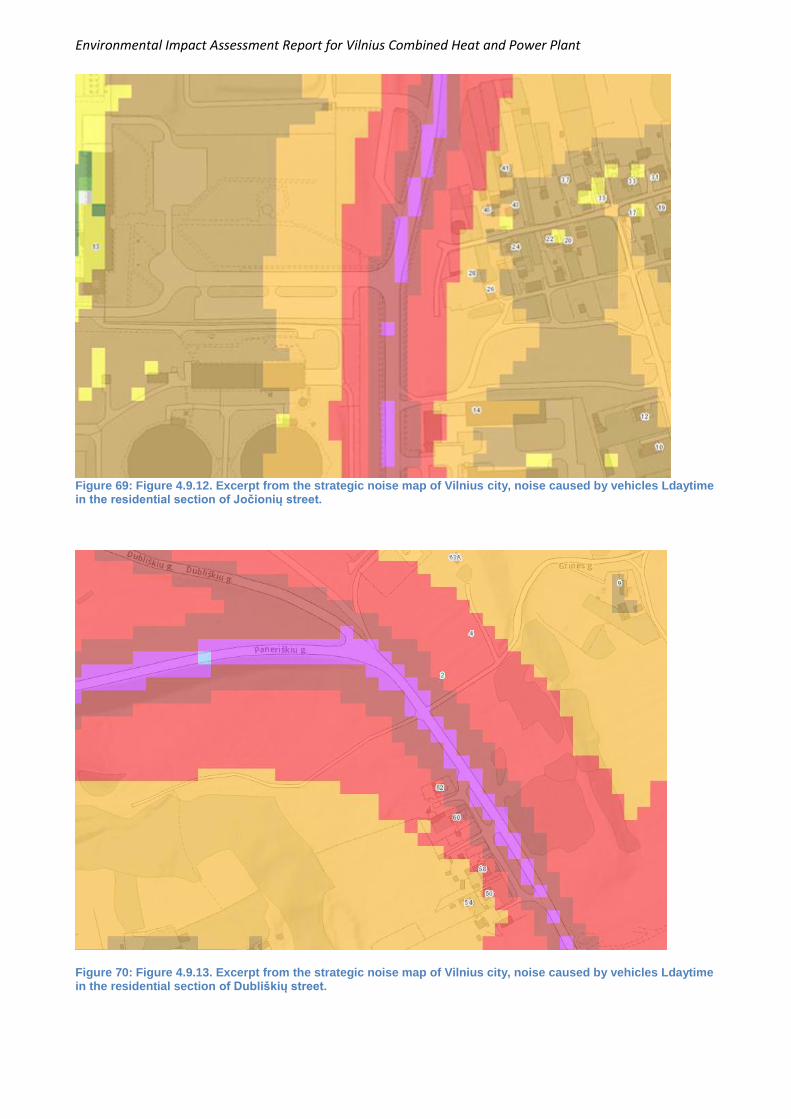
Environmental Impact Assessment Report for Vilnius Combined Heat and Power Plant
Figure 69: Figure 4.9.12. Excerpt from the strategic noise map of Vilnius city, noise caused by vehicles Ldaytime in the residential section of Jočionių street.
Figure 70: Figure 4.9.13. Excerpt from the strategic noise map of Vilnius city, noise caused by vehicles Ldaytime in the residential section of Dubliškių street.
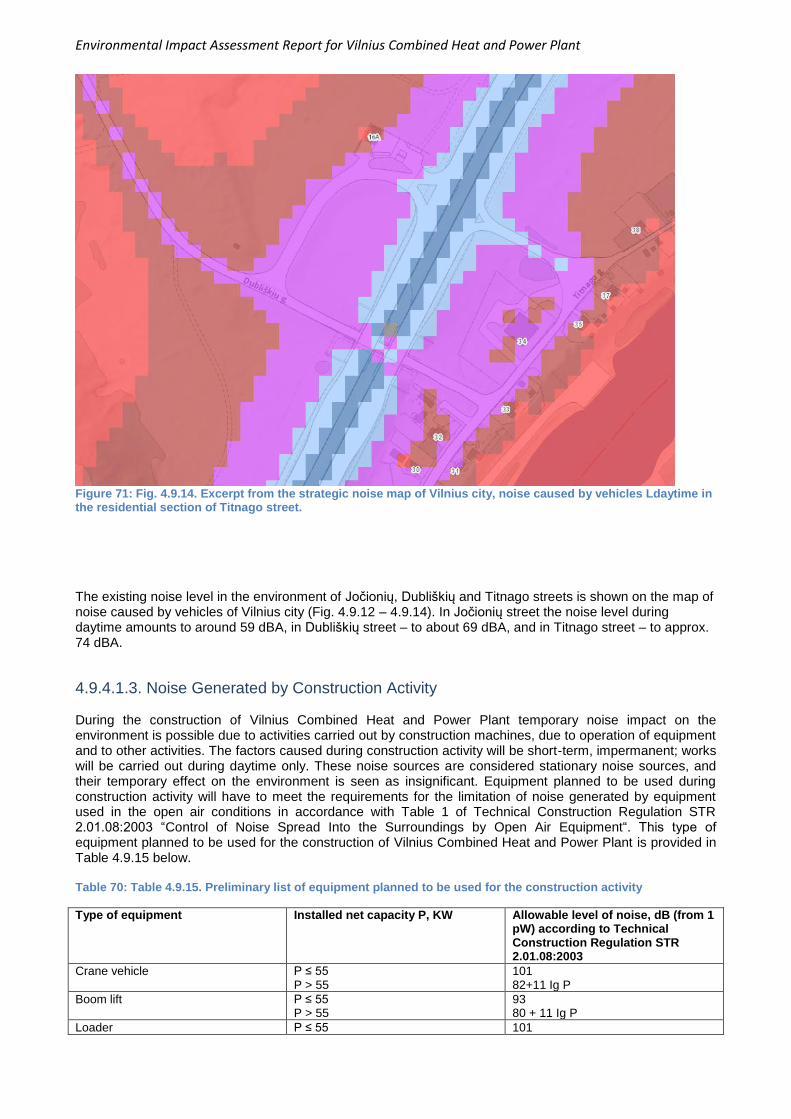
Environmental Impact Assessment Report for Vilnius Combined Heat and Power Plant
Figure 71: Fig. 4.9.14. Excerpt from the strategic noise map of Vilnius city, noise caused by vehicles Ldaytime in the residential section of Titnago street.
The existing noise level in the environment of Jočionių, Dubliškių and Titnago streets is shown on the map of noise caused by vehicles of Vilnius city (Fig. 4.9.12 – 4.9.14). In Jočionių street the noise level during daytime amounts to around 59 dBA, in Dubliškių street – to about 69 dBA, and in Titnago street – to approx. 74 dBA.
4.9.4.1.3. Noise Generated by Construction Activity During the construction of Vilnius Combined Heat and Power Plant temporary noise impact on the environment is possible due to activities carried out by construction machines, due to operation of equipment and to other activities. The factors caused during construction activity will be short-term, impermanent; works will be carried out during daytime only. These noise sources are considered stationary noise sources, and their temporary effect on the environment is seen as insignificant. Equipment planned to be used during construction activity will have to meet the requirements for the limitation of noise generated by equipment used in the open air conditions in accordance with Table 1 of Technical Construction Regulation STR 2.01.08:2003 “Control of Noise Spread Into the Surroundings by Open Air Equipment“. This type of equipment planned to be used for the construction of Vilnius Combined Heat and Power Plant is provided in Table 4.9.15 below. Table 70: Table 4.9.15. Preliminary list of equipment planned to be used for the construction activity
Type of equipment Installed net capacity P, KW Allowable level of noise, dB (from 1 pW) according to Technical Construction Regulation STR 2.01.08:2003
Crane vehicle P ≤ 55 P > 55
101 82+11 Ig P
Boom lift P ≤ 55 P > 55
93 80 + 11 Ig P
Loader P ≤ 55 101
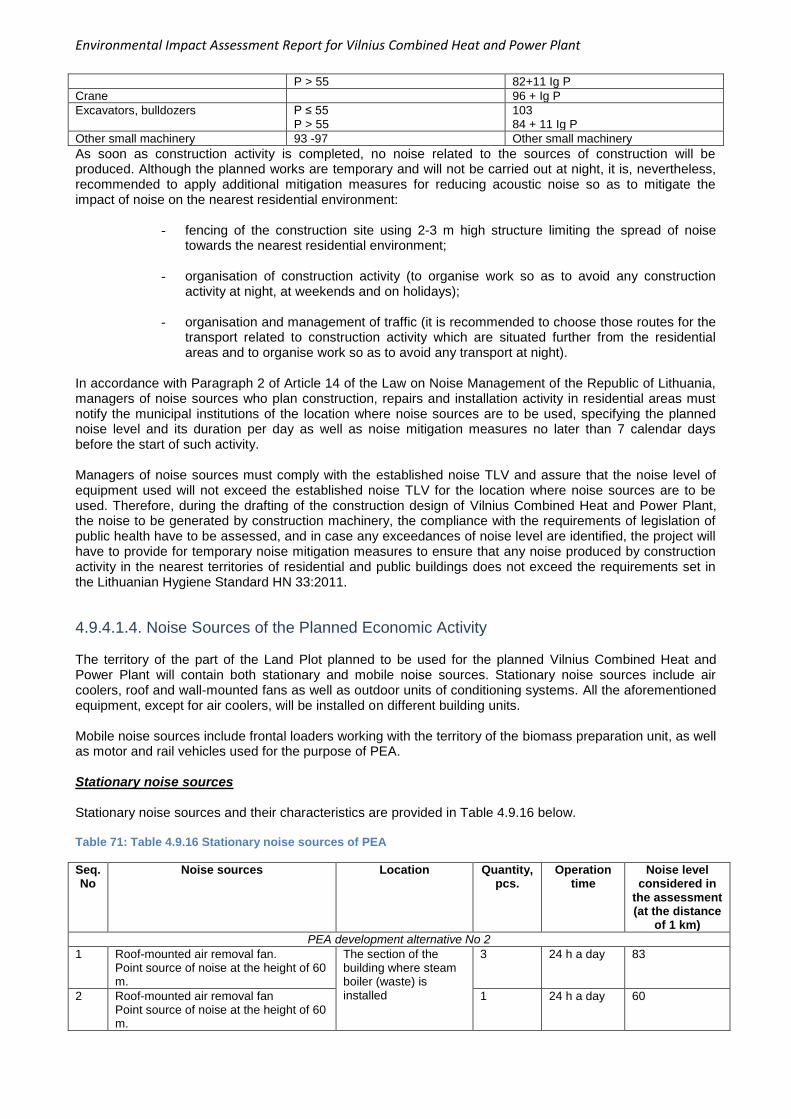
Environmental Impact Assessment Report for Vilnius Combined Heat and Power Plant
P > 55 82+11 Ig P
Crane 96 + Ig P
Excavators, bulldozers P ≤ 55 P > 55
103 84 + 11 Ig P
Other small machinery 93 -97 Other small machinery
As soon as construction activity is completed, no noise related to the sources of construction will be produced. Although the planned works are temporary and will not be carried out at night, it is, nevertheless, recommended to apply additional mitigation measures for reducing acoustic noise so as to mitigate the impact of noise on the nearest residential environment:
- fencing of the construction site using 2-3 m high structure limiting the spread of noise towards the nearest residential environment;
- organisation of construction activity (to organise work so as to avoid any construction
activity at night, at weekends and on holidays);
- organisation and management of traffic (it is recommended to choose those routes for the transport related to construction activity which are situated further from the residential areas and to organise work so as to avoid any transport at night).
In accordance with Paragraph 2 of Article 14 of the Law on Noise Management of the Republic of Lithuania, managers of noise sources who plan construction, repairs and installation activity in residential areas must notify the municipal institutions of the location where noise sources are to be used, specifying the planned noise level and its duration per day as well as noise mitigation measures no later than 7 calendar days before the start of such activity. Managers of noise sources must comply with the established noise TLV and assure that the noise level of equipment used will not exceed the established noise TLV for the location where noise sources are to be used. Therefore, during the drafting of the construction design of Vilnius Combined Heat and Power Plant, the noise to be generated by construction machinery, the compliance with the requirements of legislation of public health have to be assessed, and in case any exceedances of noise level are identified, the project will have to provide for temporary noise mitigation measures to ensure that any noise produced by construction activity in the nearest territories of residential and public buildings does not exceed the requirements set in the Lithuanian Hygiene Standard HN 33:2011.
4.9.4.1.4. Noise Sources of the Planned Economic Activity The territory of the part of the Land Plot planned to be used for the planned Vilnius Combined Heat and Power Plant will contain both stationary and mobile noise sources. Stationary noise sources include air coolers, roof and wall-mounted fans as well as outdoor units of conditioning systems. All the aforementioned equipment, except for air coolers, will be installed on different building units. Mobile noise sources include frontal loaders working with the territory of the biomass preparation unit, as well as motor and rail vehicles used for the purpose of PEA. Stationary noise sources Stationary noise sources and their characteristics are provided in Table 4.9.16 below. Table 71: Table 4.9.16 Stationary noise sources of PEA
Seq. No
Noise sources Location Quantity, pcs.
Operation time
Noise level considered in
the assessment (at the distance
of 1 km)
PEA development alternative No 2
1 Roof-mounted air removal fan. Point source of noise at the height of 60 m.
The section of the building where steam boiler (waste) is installed
3 24 h a day 83
2 Roof-mounted air removal fan Point source of noise at the height of 60 m.
1 24 h a day 60
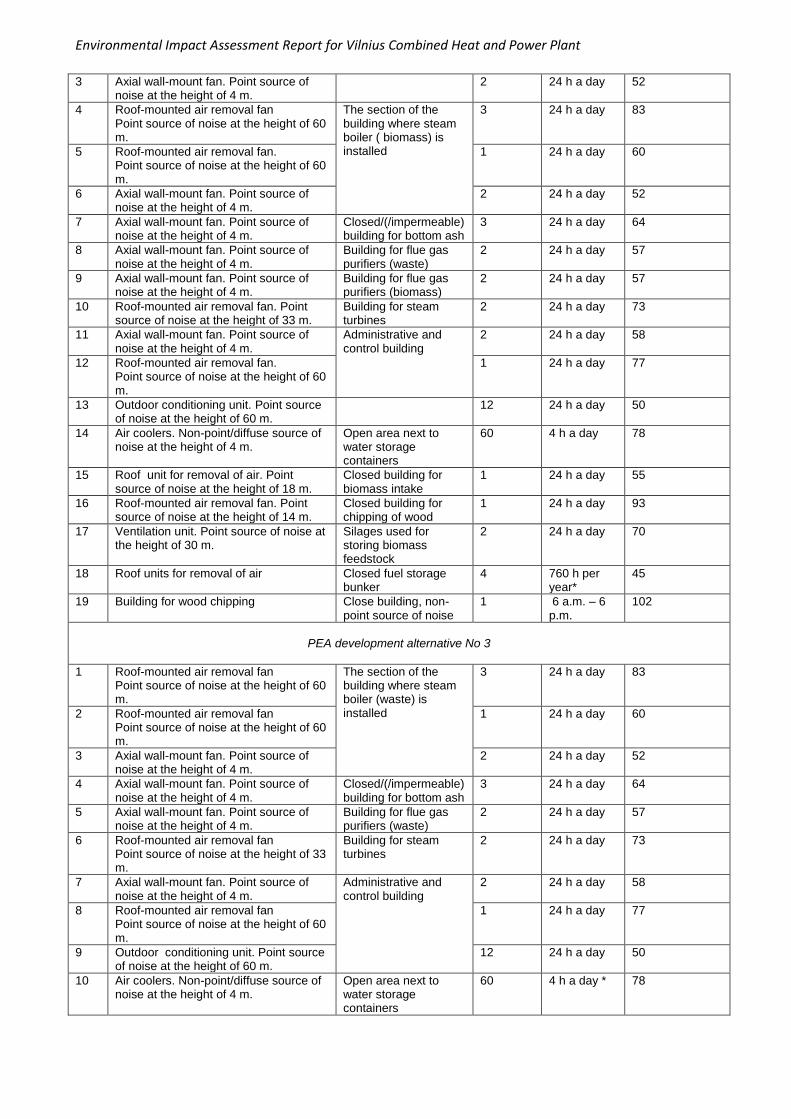
Environmental Impact Assessment Report for Vilnius Combined Heat and Power Plant
3 Axial wall-mount fan. Point source of noise at the height of 4 m.
2 24 h a day 52
4 Roof-mounted air removal fan Point source of noise at the height of 60 m.
The section of the building where steam boiler ( biomass) is installed
3 24 h a day 83
5 Roof-mounted air removal fan. Point source of noise at the height of 60 m.
1 24 h a day 60
6 Axial wall-mount fan. Point source of noise at the height of 4 m.
2 24 h a day 52
7 Axial wall-mount fan. Point source of noise at the height of 4 m.
Closed/(/impermeable) building for bottom ash
3 24 h a day 64
8 Axial wall-mount fan. Point source of noise at the height of 4 m.
Building for flue gas purifiers (waste)
2 24 h a day 57
9 Axial wall-mount fan. Point source of noise at the height of 4 m.
Building for flue gas purifiers (biomass)
2 24 h a day 57
10 Roof-mounted air removal fan. Point source of noise at the height of 33 m.
Building for steam turbines
2 24 h a day 73
11 Axial wall-mount fan. Point source of noise at the height of 4 m.
Administrative and control building
2 24 h a day 58
12 Roof-mounted air removal fan. Point source of noise at the height of 60 m.
1 24 h a day 77
13 Outdoor conditioning unit. Point source of noise at the height of 60 m.
12 24 h a day 50
14 Air coolers. Non-point/diffuse source of noise at the height of 4 m.
Open area next to water storage containers
60 4 h a day 78
15 Roof unit for removal of air. Point source of noise at the height of 18 m.
Closed building for biomass intake
1 24 h a day 55
16 Roof-mounted air removal fan. Point source of noise at the height of 14 m.
Closed building for chipping of wood
1 24 h a day 93
17 Ventilation unit. Point source of noise at the height of 30 m.
Silages used for storing biomass feedstock
2 24 h a day 70
18 Roof units for removal of air Closed fuel storage bunker
4 760 h per year*
45
19 Building for wood chipping Close building, non-point source of noise
1 6 a.m. – 6 p.m.
102
PEA development alternative No 3
1 Roof-mounted air removal fan Point source of noise at the height of 60 m.
The section of the building where steam boiler (waste) is installed
3 24 h a day 83
2 Roof-mounted air removal fan Point source of noise at the height of 60 m.
1 24 h a day 60
3 Axial wall-mount fan. Point source of noise at the height of 4 m.
2 24 h a day 52
4 Axial wall-mount fan. Point source of noise at the height of 4 m.
Closed/(/impermeable) building for bottom ash
3 24 h a day 64
5 Axial wall-mount fan. Point source of noise at the height of 4 m.
Building for flue gas purifiers (waste)
2 24 h a day 57
6 Roof-mounted air removal fan Point source of noise at the height of 33 m.
Building for steam turbines
2 24 h a day 73
7 Axial wall-mount fan. Point source of noise at the height of 4 m.
Administrative and control building
2 24 h a day 58
8 Roof-mounted air removal fan Point source of noise at the height of 60 m.
1 24 h a day 77
9 Outdoor conditioning unit. Point source of noise at the height of 60 m.
12 24 h a day 50
10 Air coolers. Non-point/diffuse source of noise at the height of 4 m.
Open area next to water storage containers
60 4 h a day * 78
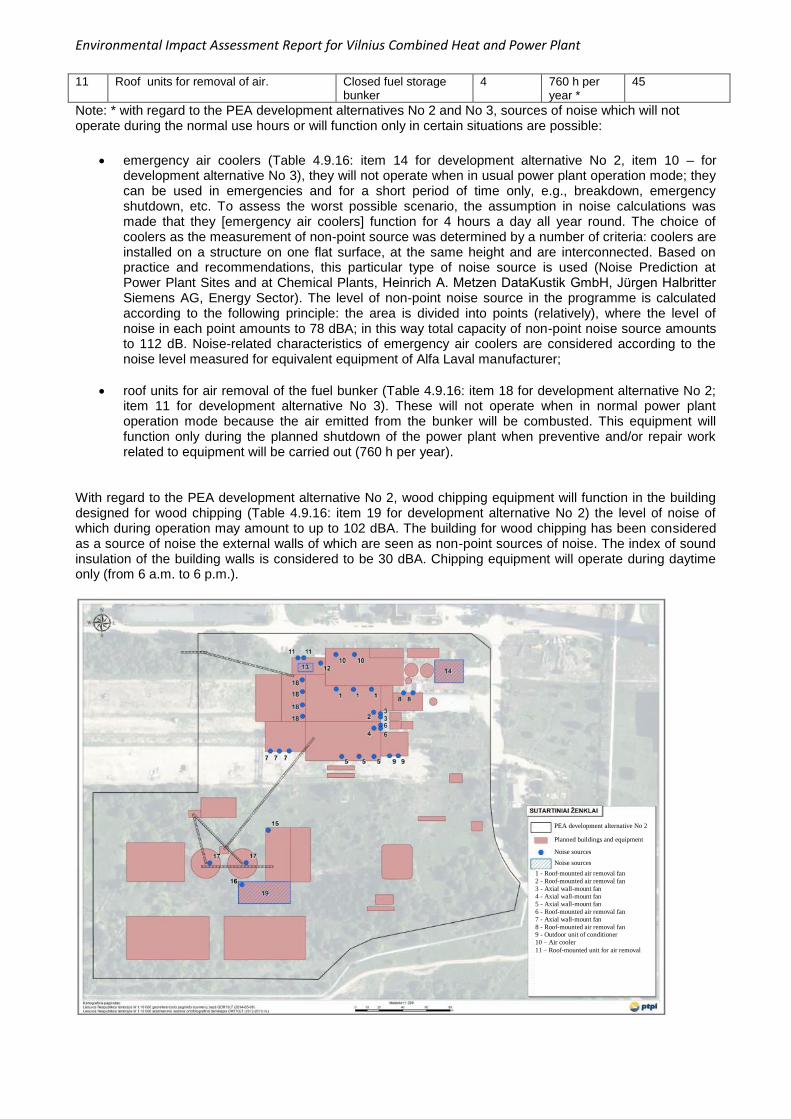
Environmental Impact Assessment Report for Vilnius Combined Heat and Power Plant
11 Roof units for removal of air. Closed fuel storage bunker
4 760 h per year *
45
Note: * with regard to the PEA development alternatives No 2 and No 3, sources of noise which will not operate during the normal use hours or will function only in certain situations are possible:
emergency air coolers (Table 4.9.16: item 14 for development alternative No 2, item 10 – for
development alternative No 3), they will not operate when in usual power plant operation mode; they can be used in emergencies and for a short period of time only, e.g., breakdown, emergency shutdown, etc. To assess the worst possible scenario, the assumption in noise calculations was made that they [emergency air coolers] function for 4 hours a day all year round. The choice of coolers as the measurement of non-point source was determined by a number of criteria: coolers are installed on a structure on one flat surface, at the same height and are interconnected. Based on practice and recommendations, this particular type of noise source is used (Noise Prediction at Power Plant Sites and at Chemical Plants, Heinrich A. Metzen DataKustik GmbH, Jürgen Halbritter Siemens AG, Energy Sector). The level of non-point noise source in the programme is calculated according to the following principle: the area is divided into points (relatively), where the level of noise in each point amounts to 78 dBA; in this way total capacity of non-point noise source amounts to 112 dB. Noise-related characteristics of emergency air coolers are considered according to the noise level measured for equivalent equipment of Alfa Laval manufacturer;
roof units for air removal of the fuel bunker (Table 4.9.16: item 18 for development alternative No 2; item 11 for development alternative No 3). These will not operate when in normal power plant operation mode because the air emitted from the bunker will be combusted. This equipment will function only during the planned shutdown of the power plant when preventive and/or repair work related to equipment will be carried out (760 h per year).
With regard to the PEA development alternative No 2, wood chipping equipment will function in the building designed for wood chipping (Table 4.9.16: item 19 for development alternative No 2) the level of noise of which during operation may amount to up to 102 dBA. The building for wood chipping has been considered as a source of noise the external walls of which are seen as non-point sources of noise. The index of sound insulation of the building walls is considered to be 30 dBA. Chipping equipment will operate during daytime only (from 6 a.m. to 6 p.m.).
PEA development alternative No 2
Planned buildings and equipment
Noise sources
Noise sources
1 - Roof-mounted air removal fan
2 - Roof-mounted air removal fan
3 - Axial wall-mount fan
4 - Axial wall-mount fan
5 - Axial wall-mount fan
6 - Roof-mounted air removal fan
7 - Axial wall-mount fan
8 - Roof-mounted air removal fan 9 - Outdoor unit of conditioner
10 – Air cooler
11 – Roof-mounted unit for air removal
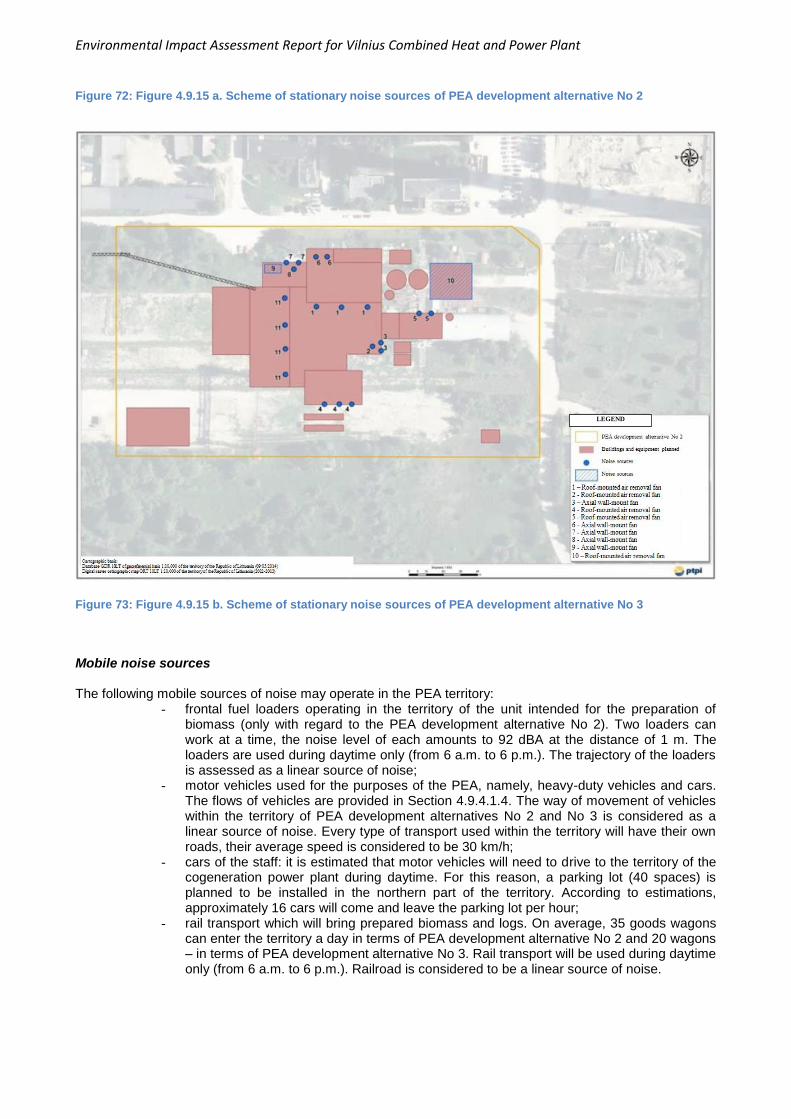
Environmental Impact Assessment Report for Vilnius Combined Heat and Power Plant
Figure 72: Figure 4.9.15 a. Scheme of stationary noise sources of PEA development alternative No 2
Figure 73: Figure 4.9.15 b. Scheme of stationary noise sources of PEA development alternative No 3
Mobile noise sources The following mobile sources of noise may operate in the PEA territory:
- frontal fuel loaders operating in the territory of the unit intended for the preparation of biomass (only with regard to the PEA development alternative No 2). Two loaders can work at a time, the noise level of each amounts to 92 dBA at the distance of 1 m. The loaders are used during daytime only (from 6 a.m. to 6 p.m.). The trajectory of the loaders is assessed as a linear source of noise;
- motor vehicles used for the purposes of the PEA, namely, heavy-duty vehicles and cars. The flows of vehicles are provided in Section 4.9.4.1.4. The way of movement of vehicles within the territory of PEA development alternatives No 2 and No 3 is considered as a linear source of noise. Every type of transport used within the territory will have their own roads, their average speed is considered to be 30 km/h;
- cars of the staff: it is estimated that motor vehicles will need to drive to the territory of the cogeneration power plant during daytime. For this reason, a parking lot (40 spaces) is planned to be installed in the northern part of the territory. According to estimations, approximately 16 cars will come and leave the parking lot per hour;
- rail transport which will bring prepared biomass and logs. On average, 35 goods wagons can enter the territory a day in terms of PEA development alternative No 2 and 20 wagons – in terms of PEA development alternative No 3. Rail transport will be used during daytime only (from 6 a.m. to 6 p.m.). Railroad is considered to be a linear source of noise.
LEGEND
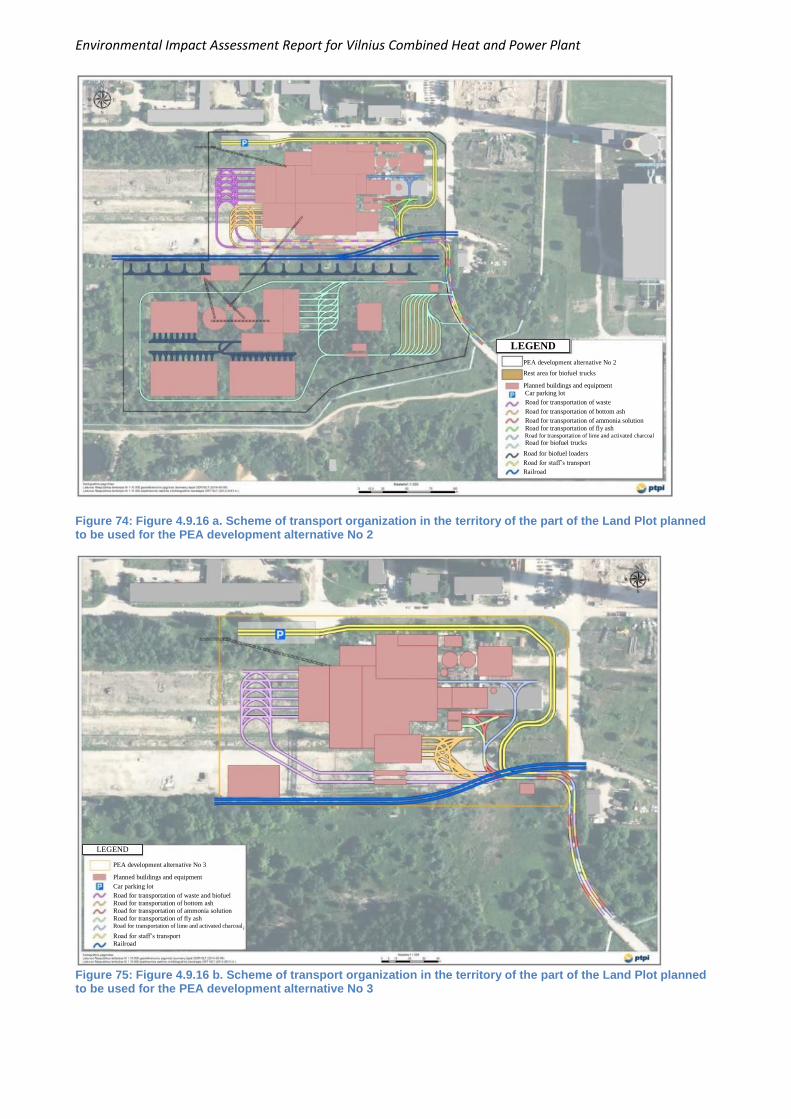
Environmental Impact Assessment Report for Vilnius Combined Heat and Power Plant
Figure 74: Figure 4.9.16 a. Scheme of transport organization in the territory of the part of the Land Plot planned to be used for the PEA development alternative No 2
Figure 75: Figure 4.9.16 b. Scheme of transport organization in the territory of the part of the Land Plot planned to be used for the PEA development alternative No 3
LEGEND
PEA development alternative No 2
Rest area for biofuel trucks
Planned buildings and equipment
Car parking lot
Road for transportation of waste
Road for transportation of bottom ash
Road for transportation of ammonia solution
Road for transportation of fly ash Road for transportation of lime and activated charcoal
Road for biofuel trucks
Road for biofuel loaders
Road for staff’s transport
Railroad
PEA development alternative No 3
Planned buildings and equipment
Car parking lot
Road for transportation of waste and biofuel
Road for transportation of bottom ash
Road for transportation of ammonia solution
Road for transportation of fly ash Road for transportation of lime and activated charcoal
Road for staff’s transport
Railroad
LEGEND

Environmental Impact Assessment Report for Vilnius Combined Heat and Power Plant
4.9.4.1.5. Flows of Transport of the Planned Economic Activity in Public Streets and Roads Noise generated by transport with regard to PEA development alternatives No 2 and No 3 is assessed not only in terms of the boundaries of the territories of the part of the Land Plot planned to be used for PEA development alternatives No 2 and No 3 but also taking into account public roads in the vicinity. Service vehicles will be able to access the territories of the part of the Land Plot planned to be used for PEA development alternatives No 2 and No 3 using the road from Gariūnų/Oslo Street leading towards PEA development alternatives No 2 and No 3, namely, Dubeliškių, Paneriškių and Jočionių Streets (Fig. 4.9.17). Calculations of transport generated noise in public streets and roads were made for both PEA development alternatives, namely, No 2 and No 3. It is planned that during the use of cogeneration power plant staff’s cars will enter and leave the territory of the part of the Land Plot planned to be used (during daytime). A parking lot with 40 spaces for cars and 7 different type heavy duty vehicles (daytime) will be built. Waste will be transported by trucks or waste collection vehicles, biomass will be transported by trailers, and ash – by special vehicles. This type of vehicles will also bring reagents and other preparations. The main entrance to the territories of the part of the Land Plot planned to be used for PEA development alternatives No 2 and No 3 is planned to be installed in the eastern part of the territories from Jočionių Street.
Figure 76: Figure 4.9.17. Scheme of PEA access roads
The PEA vehicles are allowed to drive at the speed of 50 km/h speed in Jočionių, Paneriškių and Dubliškių streets. The flows of PEA service transport are shown in Table 4.9.17. Table 72: Table 4.9.17. PEA transport flows
Type of transport Average flow for development alternative No 2, pcs./day
Average flow for development alternative No 3, pcs./day
Boundaries of Land Plot, cadastral No 0101/0067:21
PEA development alternative No 2
PEA development alternative No 3
Closest urbanized territories Directions of existing access roads
LEGEND
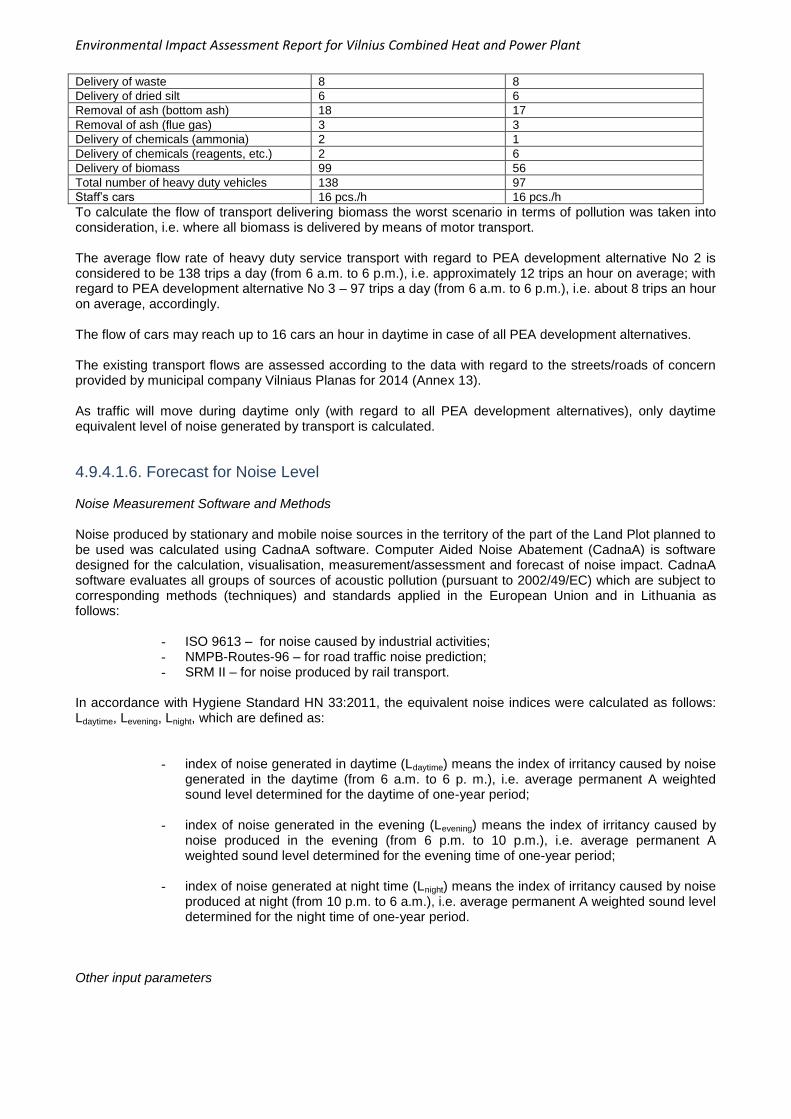
Environmental Impact Assessment Report for Vilnius Combined Heat and Power Plant
Delivery of waste 8 8
Delivery of dried silt 6 6
Removal of ash (bottom ash) 18 17
Removal of ash (flue gas) 3 3
Delivery of chemicals (ammonia) 2 1
Delivery of chemicals (reagents, etc.) 2 6
Delivery of biomass 99 56
Total number of heavy duty vehicles 138 97
Staff’s cars 16 pcs./h 16 pcs./h
To calculate the flow of transport delivering biomass the worst scenario in terms of pollution was taken into consideration, i.e. where all biomass is delivered by means of motor transport. The average flow rate of heavy duty service transport with regard to PEA development alternative No 2 is considered to be 138 trips a day (from 6 a.m. to 6 p.m.), i.e. approximately 12 trips an hour on average; with regard to PEA development alternative No 3 – 97 trips a day (from 6 a.m. to 6 p.m.), i.e. about 8 trips an hour on average, accordingly. The flow of cars may reach up to 16 cars an hour in daytime in case of all PEA development alternatives. The existing transport flows are assessed according to the data with regard to the streets/roads of concern provided by municipal company Vilniaus Planas for 2014 (Annex 13). As traffic will move during daytime only (with regard to all PEA development alternatives), only daytime equivalent level of noise generated by transport is calculated.
4.9.4.1.6. Forecast for Noise Level Noise Measurement Software and Methods Noise produced by stationary and mobile noise sources in the territory of the part of the Land Plot planned to be used was calculated using CadnaA software. Computer Aided Noise Abatement (CadnaA) is software designed for the calculation, visualisation, measurement/assessment and forecast of noise impact. CadnaA software evaluates all groups of sources of acoustic pollution (pursuant to 2002/49/EC) which are subject to corresponding methods (techniques) and standards applied in the European Union and in Lithuania as follows:
- ISO 9613 – for noise caused by industrial activities; - NMPB-Routes-96 – for road traffic noise prediction; - SRM II – for noise produced by rail transport.
In accordance with Hygiene Standard HN 33:2011, the equivalent noise indices were calculated as follows: Ldaytime, Levening, Lnight, which are defined as:
- index of noise generated in daytime (Ldaytime) means the index of irritancy caused by noise generated in the daytime (from 6 a.m. to 6 p. m.), i.e. average permanent A weighted sound level determined for the daytime of one-year period;
- index of noise generated in the evening (Levening) means the index of irritancy caused by noise produced in the evening (from 6 p.m. to 10 p.m.), i.e. average permanent A weighted sound level determined for the evening time of one-year period;
- index of noise generated at night time (Lnight) means the index of irritancy caused by noise
produced at night (from 10 p.m. to 6 a.m.), i.e. average permanent A weighted sound level determined for the night time of one-year period.
Other input parameters
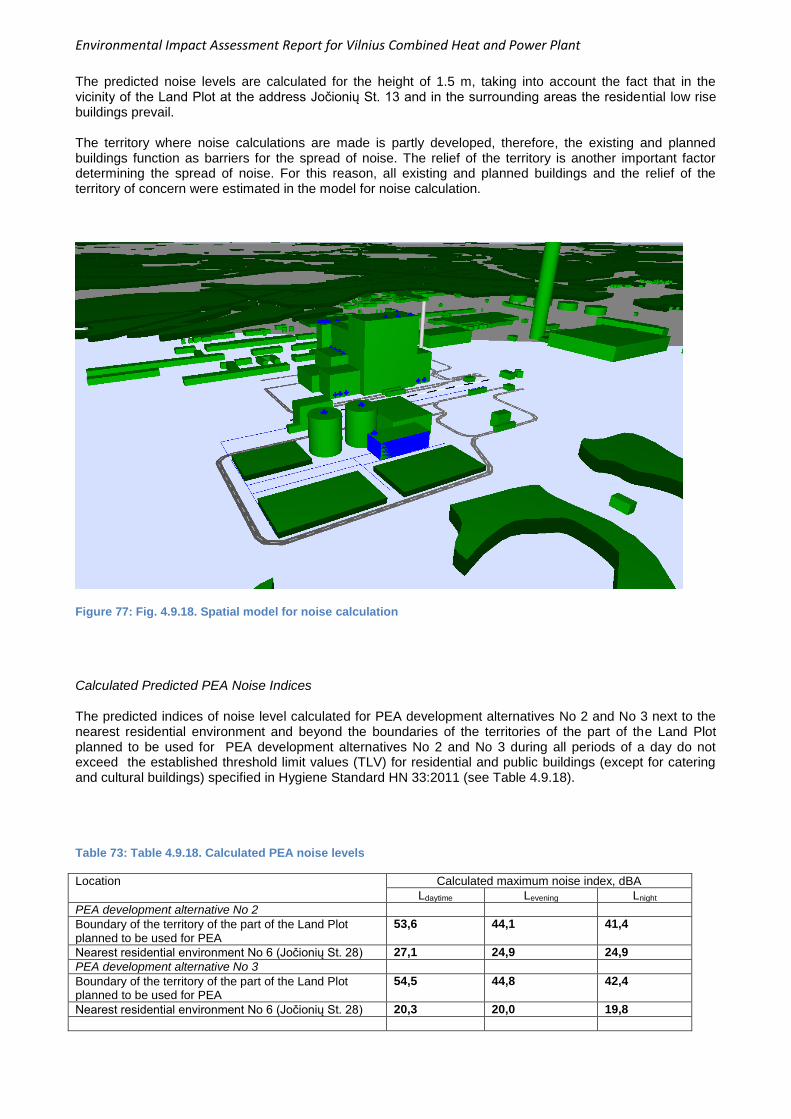
Environmental Impact Assessment Report for Vilnius Combined Heat and Power Plant
The predicted noise levels are calculated for the height of 1.5 m, taking into account the fact that in the vicinity of the Land Plot at the address Jočionių St. 13 and in the surrounding areas the residential low rise buildings prevail. The territory where noise calculations are made is partly developed, therefore, the existing and planned buildings function as barriers for the spread of noise. The relief of the territory is another important factor determining the spread of noise. For this reason, all existing and planned buildings and the relief of the territory of concern were estimated in the model for noise calculation.
Figure 77: Fig. 4.9.18. Spatial model for noise calculation
Calculated Predicted PEA Noise Indices The predicted indices of noise level calculated for PEA development alternatives No 2 and No 3 next to the nearest residential environment and beyond the boundaries of the territories of the part of the Land Plot planned to be used for PEA development alternatives No 2 and No 3 during all periods of a day do not exceed the established threshold limit values (TLV) for residential and public buildings (except for catering and cultural buildings) specified in Hygiene Standard HN 33:2011 (see Table 4.9.18). Table 73: Table 4.9.18. Calculated PEA noise levels
Location Calculated maximum noise index, dBA
Ldaytime Levening Lnight
PEA development alternative No 2
Boundary of the territory of the part of the Land Plot planned to be used for PEA
53,6 44,1 41,4
Nearest residential environment No 6 (Jočionių St. 28) 27,1 24,9 24,9
PEA development alternative No 3
Boundary of the territory of the part of the Land Plot planned to be used for PEA
54,5 44,8 42,4
Nearest residential environment No 6 (Jočionių St. 28) 20,3 20,0 19,8
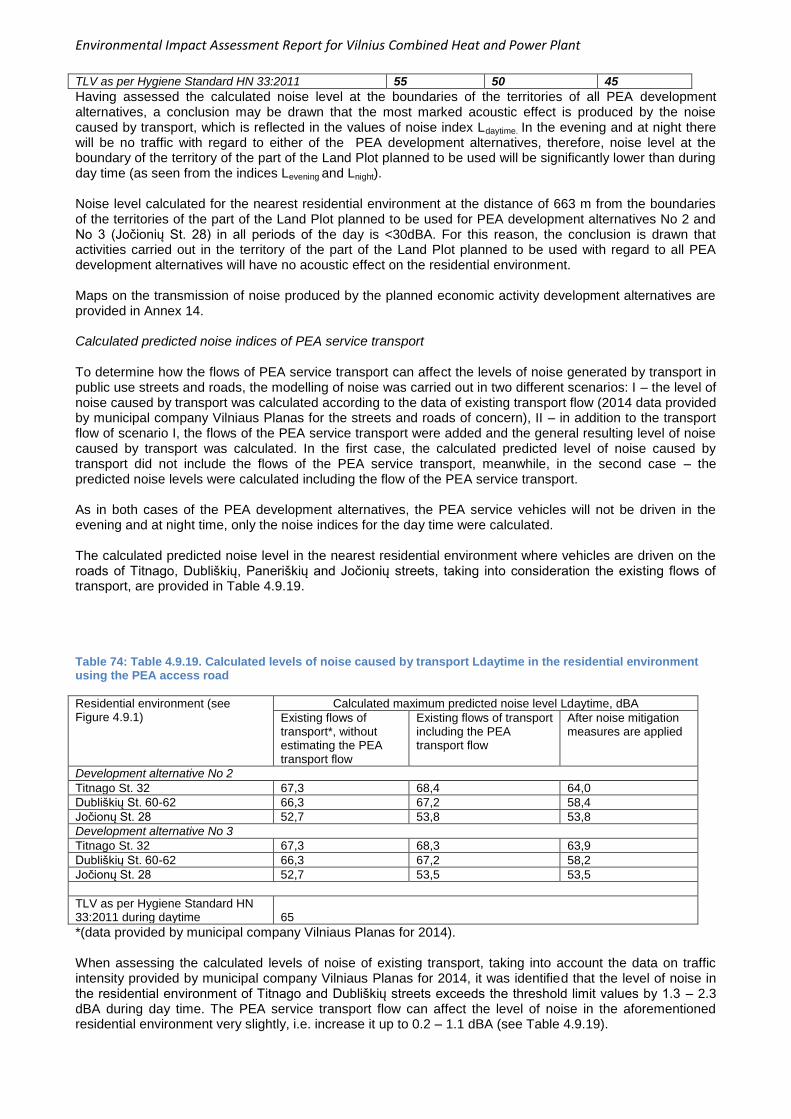
Environmental Impact Assessment Report for Vilnius Combined Heat and Power Plant
TLV as per Hygiene Standard HN 33:2011 55 50 45
Having assessed the calculated noise level at the boundaries of the territories of all PEA development alternatives, a conclusion may be drawn that the most marked acoustic effect is produced by the noise caused by transport, which is reflected in the values of noise index Ldaytime. In the evening and at night there will be no traffic with regard to either of the PEA development alternatives, therefore, noise level at the boundary of the territory of the part of the Land Plot planned to be used will be significantly lower than during day time (as seen from the indices Levening and Lnight). Noise level calculated for the nearest residential environment at the distance of 663 m from the boundaries of the territories of the part of the Land Plot planned to be used for PEA development alternatives No 2 and No 3 (Jočionių St. 28) in all periods of the day is <30dBA. For this reason, the conclusion is drawn that activities carried out in the territory of the part of the Land Plot planned to be used with regard to all PEA development alternatives will have no acoustic effect on the residential environment. Maps on the transmission of noise produced by the planned economic activity development alternatives are provided in Annex 14. Calculated predicted noise indices of PEA service transport
To determine how the flows of PEA service transport can affect the levels of noise generated by transport in public use streets and roads, the modelling of noise was carried out in two different scenarios: I – the level of noise caused by transport was calculated according to the data of existing transport flow (2014 data provided by municipal company Vilniaus Planas for the streets and roads of concern), II – in addition to the transport flow of scenario I, the flows of the PEA service transport were added and the general resulting level of noise caused by transport was calculated. In the first case, the calculated predicted level of noise caused by transport did not include the flows of the PEA service transport, meanwhile, in the second case – the predicted noise levels were calculated including the flow of the PEA service transport. As in both cases of the PEA development alternatives, the PEA service vehicles will not be driven in the evening and at night time, only the noise indices for the day time were calculated. The calculated predicted noise level in the nearest residential environment where vehicles are driven on the roads of Titnago, Dubliškių, Paneriškių and Jočionių streets, taking into consideration the existing flows of transport, are provided in Table 4.9.19. Table 74: Table 4.9.19. Calculated levels of noise caused by transport Ldaytime in the residential environment using the PEA access road
Residential environment (see Figure 4.9.1)
Calculated maximum predicted noise level Ldaytime, dBA
Existing flows of transport*, without estimating the PEA transport flow
Existing flows of transport including the PEA transport flow
After noise mitigation measures are applied
Development alternative No 2
Titnago St. 32 67,3 68,4 64,0
Dubliškių St. 60-62 66,3 67,2 58,4
Jočionų St. 28 52,7 53,8 53,8
Development alternative No 3
Titnago St. 32 67,3 68,3 63,9
Dubliškių St. 60-62 66,3 67,2 58,2
Jočionų St. 28 52,7 53,5 53,5
TLV as per Hygiene Standard HN 33:2011 during daytime
65
*(data provided by municipal company Vilniaus Planas for 2014). When assessing the calculated levels of noise of existing transport, taking into account the data on traffic intensity provided by municipal company Vilniaus Planas for 2014, it was identified that the level of noise in the residential environment of Titnago and Dubliškių streets exceeds the threshold limit values by 1.3 – 2.3 dBA during day time. The PEA service transport flow can affect the level of noise in the aforementioned residential environment very slightly, i.e. increase it up to 0.2 – 1.1 dBA (see Table 4.9.19).
Environmental Impact Assessment Report for Vilnius Combined Heat and Power Plant
For this reason, to organize the traffic of the PEA service transport on the roads of Titnago, Dubliškių, Paneriškių and Jočionių streets, it is recommended to plan noise mitigation measures: to install soundproofing walls (noise barriers) in the vicinity of Dubliškių St. 60-62 and Titnago St. 32, the acoustic efficiency of which would be ≥ 2 dBA. The application of these measures would reduce the general level of noise caused by transport, namely, by the existing transport and the PEA service transport, and the general level of noise caused by transport would then not exceed the TLV established in Hygiene Standard HN 33:2011. Noise mitigation measures (soundproofing walls in the areas nearest to residential buildings in Dubliškių and Titnago streets) at the access road to Jočionių St. 13 are provided for in the drafted and approved documents “EIA Report on the Regional Municipal Waste Incineration Plant 2010” and “Specification of the Report on the Assessment of Impact on Public Health Made by the Regional Municipal Waste Incineration Plant at Jočionių St. 13, Vilnius, 2014“. The implemented noise mitigation measures will reduce the level of noise to the threshold limit values in the nearest residential environment. Maps on the spread of noise with the assessed noise mitigation measures are provided in Annex 15. When organising the traffic of the PEA service transport on the roads of Dubliškių, Paneriškių and Jočionių streets for both PEA development alternatives, the predicted level of noise caused by the PEA transport in the nearest residential environment following the assessment of the existing transport flows and the installation of noise mitigation measures will not exceed the threshold limit values established by the legal act on public health protection. Besides, to reduce the noise caused by the flows of transport, noise management preventive measures can be applied, i.e. traffic diversion, so as to ensure that the level of noise caused by transport does not exceed TLV established in Hygiene Standard HN 33:2011. The general plan of the territory of Vilnius city municipality indicates that the two-level crossing of Gariūnų and Jočionių streets and access roads leading to it are situated in-between the recommended objects of Vilnius communication infrastructure development. The amendment of the special plan on the use of the type of energy for heating approved by Decision No 1-1200 of Vilnius City Municipal Council of 8 May 2013 specifies the development of the territory of Vilnius city Energy Sector Hub at Jočionių St. 13. There are plans to connect the streets of Paneriškių-Jočionių and Kuro with Gariūnų St. and Savanorių Ave. Following the implementation of the project on the Communication Infrastructure of Vilnius City Energy Hub (connections between Savanorių Ave. – Gariūnų St. and different level crossings), the flow of the PEA service transport to the territories of the part of the Land Plot planned to be used for PEA development alternative No 2 and No 3 could/should be organised by avoiding (bypassing) the residential territories in Titnago and Dubliškių streets. Maps on the spread of noise caused by the predicted transport are provided in Annex 15.
4.9.4.2. Ambient Air Pollution The assessment of the surface or ground-level ambient air pollution is provided in Section 4.2. „Ambient Air“of the PEA report. The Health Effects of Dioxins and Furans In accordance with the details provided in “Identifying and Handling Polychlorinated Biphenyls and Controlling Dioxin/Furan Emissions“ (http://www.am.lt/VI/files/0.680935001151750056.pdf), polychlorinated dibenzodioxins (PCDDs) and dibenzofurans (PCDFs) belong to one of the groups of persistent organic pollutants (POPs), namely, to unintentionally formed compounds. These are by-products of thermal industrial or combustion processes which are most often called “dioxins”. They form as a by-product as a result of many thermal processes. The term “dioxin” includes 75 PCDD and 135 PCDF isomers. Unlike any other POPs, PCDD/PCDF have never been produced with the intention to use them as they have no useful characteristics. They are,
Environmental Impact Assessment Report for Vilnius Combined Heat and Power Plant
however, found in almost all objects of ecosystem in measurable amounts. Favourable conditions for the formation of PCDD/PCDF include the presence of free radicals of chlorine and organic carbon, the temperature of 200-450°, incomplete combustion, alkaline environment, UV rays. Globally, most PCDD/PCDFs get into the air due to industrial pollution. Large amounts of these hazardous pollutants are emitted as a result of combustion of inappropriate waste, maintenance of inappropriately installed storage facilities of hazardous materials where fires are frequent. Volcano eruptions and forest fires are also attributed to potential sources of pollution with PCDD/PCDF. Disposal of polluted waste in the ground, dumps, disposal of silt resulting from sewage of industrial processes or disposal of hazardous waste remains in the ground are all also attributed to the potential pollution sources. Dioxins are absorbed into the human body both through the respiratory system and skin contact, and through food and water. Around 90% of PCDD/PCDFs enter the body by eating meat, fish and dairy products. PCDD/PCDFs form during the process of smoking and get into body of a smoker as well as into the surrounding organisms. Like other POPs, PCDD/PCDFs have bioaccumulation characteristics and long-lasting negative effect. Where these materials are present in the soil for half a century, in human body their effect can last for 7-20 years. These are poorly water-soluble but highly soluble in fats. Due to poor water-solubility and high solubility in organic solvents, these substances accumulate in body, especially in fatty tissues and pose a threat to human health and environment. PCDD/PCDFs are harmful to human skin, liver, nervous and immune systems, reproduction, are characteristic of teratogenic (appearance of anomalies) and cancerogenic effect. For this reason, to protect human health and environment from persistent organic pollutants, a number of legal acts regulating POP emissions are applicable in Lithuania. The environmental requirements for waste combustion applicable to facilities where waste is co-incinerated regulate the threshold limit value (TLV) of 0.1 ng/Nm
3 for PCDD/PCDF emissions.
TLVs for concentrations of pollutants in the ambient air established in the “List of Pollutants Whose Amount in the Ambient Air is Limited According to the EU Criteria” approved by the Ministry of Environment and the Ministry of Health of the Republic of Lithuania of 11 June 2007 (Order of the Ministers No D1-239/V-469) and in the “Standards for Sulphur Dioxide, Nitrogen Dioxide, Nitrogen Oxides, Benzene, Carbon Monoxide, Lead, Solid Particles and Ozone in the Ambient Air Pollution” approved by Order No D1-585/V-611 of the Ministry of Environment and the Ministry of Health of the Republic of Lithuania of 7 July 2010 are provided in Table 4.2.8 of Section 4.2. The Lithuanian Hygiene Standard HN 35:2007 “Maximum Permissible Concentration of Chemicals (Contaminants) in the Air of Living Environment” establishes the maximum allowable concentration of chemicals (contaminants) in the air of living environment. The maximum permissible concentration of chemicals (contaminants) established in this hygiene standard is applied to the air of residential premises, also premises of public buildings related to accommodation (hotels, dormitories, prisons, barracks, police custody premises, monasteries, etc.), secondary education, vocational training, junior colleges, higher education, non-formal education schools, where education and training is provided, premises of institutions of human health care where patients are treated. The maximum allowable concentration of chemical substances was determined by scientific research on the concentration of chemicals (pollutants) present in the air of living environment and having no adverse effect on human health. Therefore, to avoid any adverse effect on human health by any economic activity, it is necessary to plan, organize and carry out economic activity in such a manner that ambient air pollution resulting from it does not exceed the maximum allowable concentration regulated by legislation. The information was used from the publication on the implementation of the requirements of the Stockholm Convention “Identifying and Handling Polychlorinated Biphenyls and Controlling Dioxin/Furan Emissions“ (http://www.am.lt/VI/files/0.680935001151750056.pdf). Having assessed the calculated predicted ambient air pollution produced by the planned economic activity, it is considered that with regard to both PEA development alternatives, the maximum concentrations of ground-level ambient air pollutants will not exceed the threshold limit values established by legislation at the boundaries of the territories of the part of the Land Plot planned to be used for the PEA. For this reason, when choosing between one of the two PEA development alternatives, the boundaries of the sanitary protection areas can be determined, in accordance with the anticipated indices of ambient air pollution for
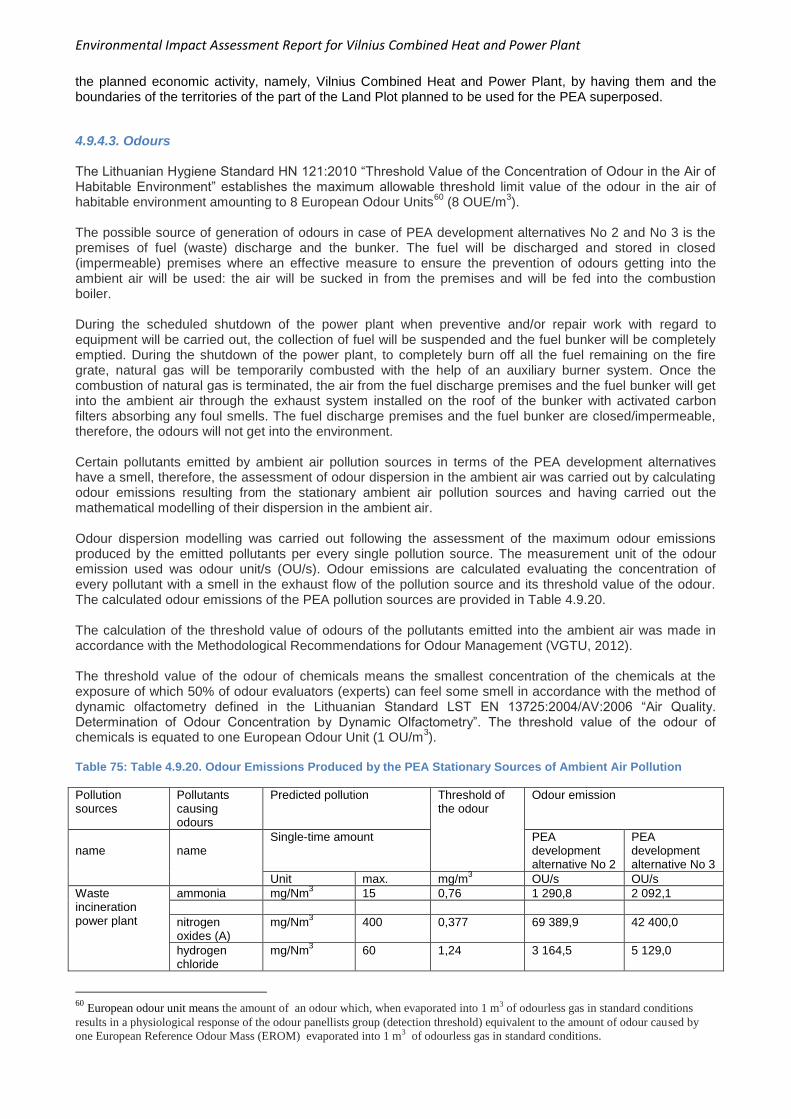
Environmental Impact Assessment Report for Vilnius Combined Heat and Power Plant
the planned economic activity, namely, Vilnius Combined Heat and Power Plant, by having them and the boundaries of the territories of the part of the Land Plot planned to be used for the PEA superposed.
4.9.4.3. Odours The Lithuanian Hygiene Standard HN 121:2010 “Threshold Value of the Concentration of Odour in the Air of Habitable Environment” establishes the maximum allowable threshold limit value of the odour in the air of habitable environment amounting to 8 European Odour Units
60 (8 OUE/m
3).
The possible source of generation of odours in case of PEA development alternatives No 2 and No 3 is the premises of fuel (waste) discharge and the bunker. The fuel will be discharged and stored in closed (impermeable) premises where an effective measure to ensure the prevention of odours getting into the ambient air will be used: the air will be sucked in from the premises and will be fed into the combustion boiler. During the scheduled shutdown of the power plant when preventive and/or repair work with regard to equipment will be carried out, the collection of fuel will be suspended and the fuel bunker will be completely emptied. During the shutdown of the power plant, to completely burn off all the fuel remaining on the fire grate, natural gas will be temporarily combusted with the help of an auxiliary burner system. Once the combustion of natural gas is terminated, the air from the fuel discharge premises and the fuel bunker will get into the ambient air through the exhaust system installed on the roof of the bunker with activated carbon filters absorbing any foul smells. The fuel discharge premises and the fuel bunker are closed/impermeable, therefore, the odours will not get into the environment. Certain pollutants emitted by ambient air pollution sources in terms of the PEA development alternatives have a smell, therefore, the assessment of odour dispersion in the ambient air was carried out by calculating odour emissions resulting from the stationary ambient air pollution sources and having carried out the mathematical modelling of their dispersion in the ambient air. Odour dispersion modelling was carried out following the assessment of the maximum odour emissions produced by the emitted pollutants per every single pollution source. The measurement unit of the odour emission used was odour unit/s (OU/s). Odour emissions are calculated evaluating the concentration of every pollutant with a smell in the exhaust flow of the pollution source and its threshold value of the odour. The calculated odour emissions of the PEA pollution sources are provided in Table 4.9.20. The calculation of the threshold value of odours of the pollutants emitted into the ambient air was made in accordance with the Methodological Recommendations for Odour Management (VGTU, 2012). The threshold value of the odour of chemicals means the smallest concentration of the chemicals at the exposure of which 50% of odour evaluators (experts) can feel some smell in accordance with the method of dynamic olfactometry defined in the Lithuanian Standard LST EN 13725:2004/AV:2006 “Air Quality. Determination of Odour Concentration by Dynamic Olfactometry”. The threshold value of the odour of chemicals is equated to one European Odour Unit (1 OU/m
3).
Table 75: Table 4.9.20. Odour Emissions Produced by the PEA Stationary Sources of Ambient Air Pollution
Pollution sources
Pollutants causing odours
Predicted pollution Threshold of the odour
Odour emission
name
name
Single-time amount PEA development alternative No 2
PEA development alternative No 3
Unit max. mg/m3 OU/s OU/s
Waste incineration power plant
ammonia mg/Nm3 15 0,76 1 290,8 2 092,1
nitrogen oxides (A)
mg/Nm3 400 0,377 69 389,9 42 400,0
hydrogen chloride
mg/Nm3 60 1,24 3 164,5 5 129,0
60
European odour unit means the amount of an odour which, when evaporated into 1 m3 of odourless gas in standard conditions
results in a physiological response of the odour panellists group (detection threshold) equivalent to the amount of odour caused by
one European Reference Odour Mass (EROM) evaporated into 1 m3 of odourless gas in standard conditions.
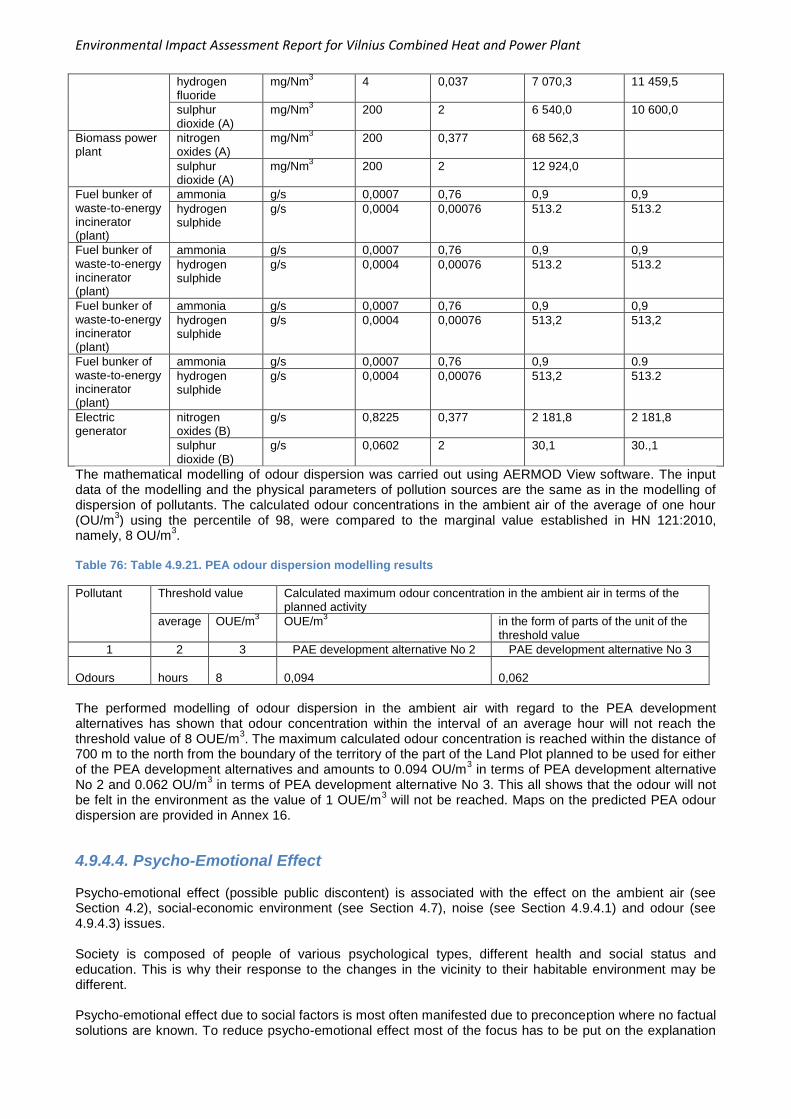
Environmental Impact Assessment Report for Vilnius Combined Heat and Power Plant
hydrogen fluoride
mg/Nm3 4 0,037 7 070,3 11 459,5
sulphur dioxide (A)
mg/Nm3 200 2 6 540,0 10 600,0
Biomass power plant
nitrogen oxides (A)
mg/Nm3 200 0,377 68 562,3
sulphur dioxide (A)
mg/Nm3 200 2 12 924,0
Fuel bunker of waste-to-energy incinerator (plant)
ammonia g/s 0,0007 0,76 0,9 0,9
hydrogen sulphide
g/s 0,0004 0,00076 513.2 513.2
Fuel bunker of waste-to-energy incinerator (plant)
ammonia g/s 0,0007 0,76 0,9 0,9
hydrogen sulphide
g/s 0,0004 0,00076 513.2 513.2
Fuel bunker of waste-to-energy incinerator (plant)
ammonia g/s 0,0007 0,76 0,9 0,9
hydrogen sulphide
g/s 0,0004 0,00076 513,2 513,2
Fuel bunker of waste-to-energy incinerator (plant)
ammonia g/s 0,0007 0,76 0,9 0.9
hydrogen sulphide
g/s 0,0004 0,00076 513,2 513.2
Electric generator
nitrogen oxides (B)
g/s 0,8225 0,377 2 181,8 2 181,8
sulphur dioxide (B)
g/s 0,0602 2 30,1 30.,1
The mathematical modelling of odour dispersion was carried out using AERMOD View software. The input data of the modelling and the physical parameters of pollution sources are the same as in the modelling of dispersion of pollutants. The calculated odour concentrations in the ambient air of the average of one hour (OU/m
3) using the percentile of 98, were compared to the marginal value established in HN 121:2010,
namely, 8 OU/m3.
Table 76: Table 4.9.21. PEA odour dispersion modelling results
Pollutant Threshold value Calculated maximum odour concentration in the ambient air in terms of the planned activity
average OUE/m3 OUE/m
3 in the form of parts of the unit of the
threshold value
1 2 3 PAE development alternative No 2 PAE development alternative No 3
Odours
hours
8
0,094
0,062
The performed modelling of odour dispersion in the ambient air with regard to the PEA development alternatives has shown that odour concentration within the interval of an average hour will not reach the threshold value of 8 OUE/m
3. The maximum calculated odour concentration is reached within the distance of
700 m to the north from the boundary of the territory of the part of the Land Plot planned to be used for either of the PEA development alternatives and amounts to 0.094 OU/m
3 in terms of PEA development alternative
No 2 and 0.062 OU/m3 in terms of PEA development alternative No 3. This all shows that the odour will not
be felt in the environment as the value of 1 OUE/m3 will not be reached. Maps on the predicted PEA odour
dispersion are provided in Annex 16.
4.9.4.4. Psycho-Emotional Effect Psycho-emotional effect (possible public discontent) is associated with the effect on the ambient air (see Section 4.2), social-economic environment (see Section 4.7), noise (see Section 4.9.4.1) and odour (see 4.9.4.3) issues. Society is composed of people of various psychological types, different health and social status and education. This is why their response to the changes in the vicinity to their habitable environment may be different. Psycho-emotional effect due to social factors is most often manifested due to preconception where no factual solutions are known. To reduce psycho-emotional effect most of the focus has to be put on the explanation
Environmental Impact Assessment Report for Vilnius Combined Heat and Power Plant
and clarification of project solutions, on regular provision of information on the planning, and on the discussions with the inhabitants. To avoid any possible conflicts with the public, information has to be analysed and supplemented according to people’s suggestions during the entire PEA process. There are no methodologies developed and approved in Lithuania for the assessment of psycho-emotional effect.
4.9.5. Description of the Methods Used for the Health Impact Assessment. Possible Inaccuracies. The assessment on the impact of public health was carried out in accordance with Order No D1-636 of the Minister of Environment of the Republic of Lithuania of 23 December 2005 “On the Approval of the Environmental Impact Assessment Programme and the Regulations for Report Drafting” and in pursuance of the “Manual for the Environmental Impact Assessment of the Planned Economic Activity” drafted by the Ministry of the Environment of the Republic of Lithuania on 1 June 2009. For the assessment of demographical and health indices the statistical details provided by the Lithuanian Department of Statistics, the Information Health Centre of the Institute of Hygiene were used. In accordance with the aforementioned data, the analysis of the state of the public health was carried out. Noise produced by stationary and mobile sources in the territory of the part of the Land Plot planned to be used was calculated using CadnaA software. Computer Aided Noise Abatement (CadnaA) is software specially designed for the calculation, visualisation, assessment and prediction of the impact of noise. CadnaA software measures all groups of sources of noise pollution (according to 2002/49/EC) which are subject to corresponding methods (techniques) and standards applied in the European Union and in Lithuania as follows:
- ISO 9613 – for noise caused by industrial activities; - NMPB-Routes-96 – for road traffic noise prediction; - SRM II – for noise produced by rail transport.
Noise modelling was carried out using CadnaA 4.2 software. This software is intended for the calculation, visualisation, measurement and forecast of noise effects. CadnaA software evaluates four major groups of sources of noise pollution (pursuant to 2002/49/EC) which are subject to the application of the methodologies and standards of the EU and Lithuania. In this case, stationary sources of noise were measured the noise levels of which were calculated according to the standard ISO 9613. The modelling of pollution and odour dispersion was carried out using the package of computer programmes AERMOD View. The mathematical model AERMOD is designed for the modelling of the dispersion of pollutants emitted by the complexes of industrial sources. AERMOD View dispersion modelling package unites the dispersion models of the US EPA (USA Environmental Protection Agency), namely, AERMOD, ISCST3 and ISC-PRIME, into one integrated interface. AERMOD is a new generation dispersion model based on the theory of the surface layer of the atmosphere. AERMOD incorporates integrated building downwash algorithms, pollutant deposition parameters, calculations of the parameters of the relief of the locality and meteorological parameters. Inaccuracies and mistakes in the assessment of the impact on health may occur in cases where the organiser of the economic activity provides the evaluator of the impact on public health with incomplete or false information on the economic activity of concern and the determining factors of the physical environment of the activity which can affect human health.
4.9.6. Sanitary Protection Zone Sanitary protection zone means the territory surrounding the stationary source of pollution or several sources where due to potential negative effect of the economic activity on public health is subject to the application of special terms and conditions on the use of land determined by laws and governmental resolutions. Part 1 of Article 24 “Sanitary Protection Zones” of the Law on Public Health Care of the Republic of Lithuania (hereinafter referred to as the “Law”) stipulates that persons designing, building, reconstructing (wishing to change the economic activity or increase its intensity), managing or owning structures where economic activity carried out (planned to be carried out) involves pollution of the environment habitable by human-
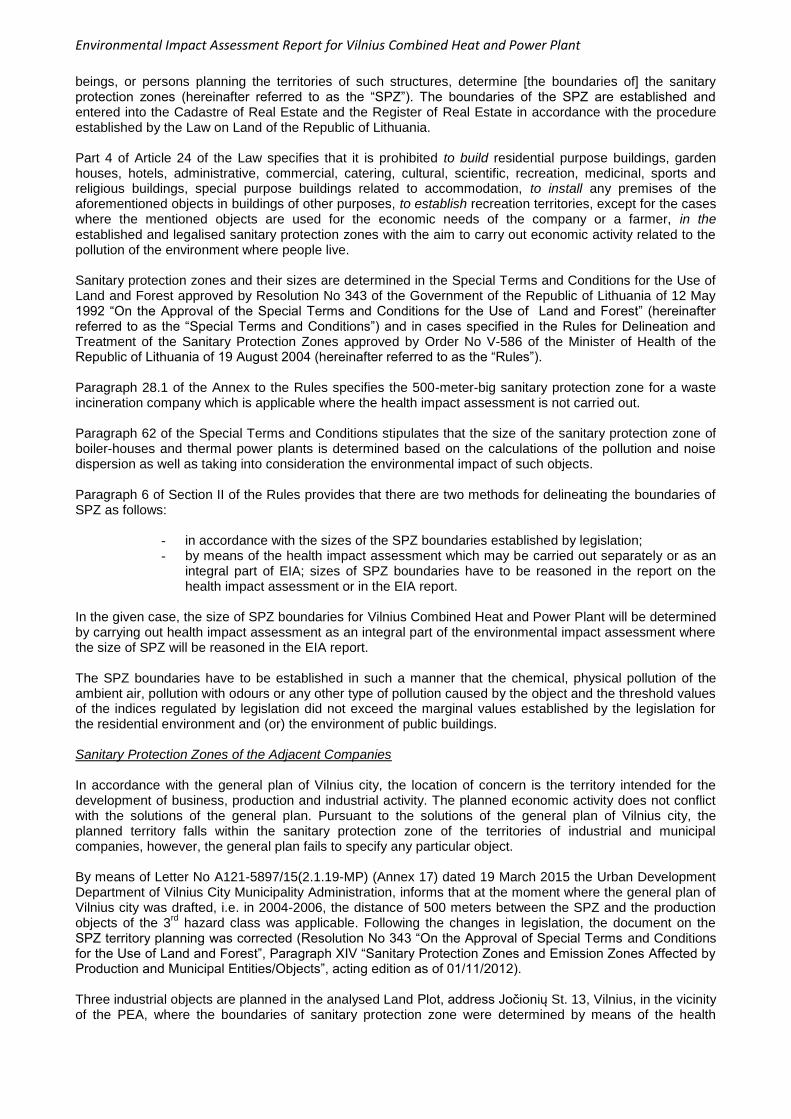
Environmental Impact Assessment Report for Vilnius Combined Heat and Power Plant
beings, or persons planning the territories of such structures, determine [the boundaries of] the sanitary protection zones (hereinafter referred to as the “SPZ”). The boundaries of the SPZ are established and entered into the Cadastre of Real Estate and the Register of Real Estate in accordance with the procedure established by the Law on Land of the Republic of Lithuania. Part 4 of Article 24 of the Law specifies that it is prohibited to build residential purpose buildings, garden houses, hotels, administrative, commercial, catering, cultural, scientific, recreation, medicinal, sports and religious buildings, special purpose buildings related to accommodation, to install any premises of the aforementioned objects in buildings of other purposes, to establish recreation territories, except for the cases where the mentioned objects are used for the economic needs of the company or a farmer, in the established and legalised sanitary protection zones with the aim to carry out economic activity related to the pollution of the environment where people live. Sanitary protection zones and their sizes are determined in the Special Terms and Conditions for the Use of Land and Forest approved by Resolution No 343 of the Government of the Republic of Lithuania of 12 May 1992 “On the Approval of the Special Terms and Conditions for the Use of Land and Forest” (hereinafter referred to as the “Special Terms and Conditions”) and in cases specified in the Rules for Delineation and Treatment of the Sanitary Protection Zones approved by Order No V-586 of the Minister of Health of the Republic of Lithuania of 19 August 2004 (hereinafter referred to as the “Rules”). Paragraph 28.1 of the Annex to the Rules specifies the 500-meter-big sanitary protection zone for a waste incineration company which is applicable where the health impact assessment is not carried out. Paragraph 62 of the Special Terms and Conditions stipulates that the size of the sanitary protection zone of boiler-houses and thermal power plants is determined based on the calculations of the pollution and noise dispersion as well as taking into consideration the environmental impact of such objects. Paragraph 6 of Section II of the Rules provides that there are two methods for delineating the boundaries of SPZ as follows:
- in accordance with the sizes of the SPZ boundaries established by legislation; - by means of the health impact assessment which may be carried out separately or as an
integral part of EIA; sizes of SPZ boundaries have to be reasoned in the report on the health impact assessment or in the EIA report.
In the given case, the size of SPZ boundaries for Vilnius Combined Heat and Power Plant will be determined by carrying out health impact assessment as an integral part of the environmental impact assessment where the size of SPZ will be reasoned in the EIA report. The SPZ boundaries have to be established in such a manner that the chemical, physical pollution of the ambient air, pollution with odours or any other type of pollution caused by the object and the threshold values of the indices regulated by legislation did not exceed the marginal values established by the legislation for the residential environment and (or) the environment of public buildings. Sanitary Protection Zones of the Adjacent Companies In accordance with the general plan of Vilnius city, the location of concern is the territory intended for the development of business, production and industrial activity. The planned economic activity does not conflict with the solutions of the general plan. Pursuant to the solutions of the general plan of Vilnius city, the planned territory falls within the sanitary protection zone of the territories of industrial and municipal companies, however, the general plan fails to specify any particular object. By means of Letter No A121-5897/15(2.1.19-MP) (Annex 17) dated 19 March 2015 the Urban Development Department of Vilnius City Municipality Administration, informs that at the moment where the general plan of Vilnius city was drafted, i.e. in 2004-2006, the distance of 500 meters between the SPZ and the production objects of the 3
rd hazard class was applicable. Following the changes in legislation, the document on the
SPZ territory planning was corrected (Resolution No 343 “On the Approval of Special Terms and Conditions for the Use of Land and Forest”, Paragraph XIV “Sanitary Protection Zones and Emission Zones Affected by Production and Municipal Entities/Objects”, acting edition as of 01/11/2012). Three industrial objects are planned in the analysed Land Plot, address Jočionių St. 13, Vilnius, in the vicinity of the PEA, where the boundaries of sanitary protection zone were determined by means of the health
Environmental Impact Assessment Report for Vilnius Combined Heat and Power Plant
impact assessment (Fig. 4.9.16). The following decisions were upheld by Vilnius Public Health Centre with regard to the potentials of the planned economic activity in the chosen location:
- Decision No (12.32)12.32-4 dated 21 February 2013: the boundaries of the sanitary protection zone determined for the construction and use of facilities of VATTC, UAB, intended for the mechanical biological treatment of municipal waste of Vilnius region coincide with the boundaries of the Land Plot leased by the company. Area of the SPZ amounts to 7.7292 ha.
- Decision No (12.32) 12.32-19 dated 17 September 2013: the boundaries of the sanitary protection zone determined for the use of biomass-fuelled power plant of Bionovus, UAB, coincide with the boundaries of the Land Plot of the company. The area of the SPZ amounts to 1.7661 ha.
- Decision No 12(12.32)-13-501 dated 7 November 2014: the boundaries of the sanitary protection zone determined for the municipal waste incineration power plant of the region of Reenergy, UAB, coincide with the boundaries of the Land Plot of the company. The area of the SPZ amounts to 2.285 ha.
Should it be discovered that the planned economic activity does not fall within the boundaries of the sanitary protection zone determined for some other economic activity, and that no other economic activities fall within the boundaries of the SPZ determined for the planned economic activity, the assessment on whether the pollution caused by it will do no damage to the health of staff of the existing companies, to materials, equipment and products, will not be carried out.
Figure 78: Figure 4.9.19. Boundaries of SPZ of Adjacent Companies
Sanitary protection zones of watering place
Boundaries of Land Plot, cadastral No 0101/0067:21
PEA development alternative No 2
PEA development alternative No 3
Boundaries of the territories of the adjacent companies Suggested boundaries of the SPZ
SPZ according to the General Plan
LEGEND
Environmental Impact Assessment Report for Vilnius Combined Heat and Power Plant
In accordance with the “Special Plan on the Development of Infrastructure of Water Supply and Wastewater Treatment SS-09-105-SPL” of the Vilnius City Municipality Administration approved by Decision No 1-124 of Vilnius city [Municipal] Council of 13 July 2011, the waterworks of Vilnius city nearest to the territory of the part of the Land Plot planned to be used for the planned economic activity are as follows: Bukčių IIb2 – semi-closed, situated next to the river/tributary, and Jankiškių IIIb3 – open, infiltration waterworks. Bukčiai waterworks is situated at the distance of about 1.5 km and Jankiškių waterworks – 2.1-2.2 km to the south-east from the boundaries of the territory of the part of the Land Plot planned to be used for the planned activity development alternatives. The territory of the part of the Land Plot planned to be used for the planned economic activity falls within the boundaries of the sanitary protected zone of Vilnius Bukčių and Jankiškių waterworks 3b (Fig. 4.9.17). When planning any activity in the territory of the part of the Land Plot planned to be used, the requirements of the Lithuanian Hygiene Standard HN 44:2006 “Establishment and Supervision of Sanitary. Protection Zones of Waterworks“ approved by Order No V-613 of the Minister of Health of the Republic of Lithuania of 17 July 2006 (hereinafter referred to as „HN 44:2006“) and the terms and conditions established in Section XX of the Special Terms and Conditions for the Use of Land and Forest (hereinafter referred to as the „Special Terms and Conditions“) approved by Resolution No 343 of the Government of the Republic of Lithuania of 12 May 1992, have to be observed. In accordance with HN 44:2006, the 3rd strip of the sanitary protection zone of waterworks is called the chemical pollution restriction zone where chemical pollutants are prohibited. This strip is intended for the protection of waterworks from chemical pollution. The 3rd strip may be composed of two sectors: 3a (catchment area in the layer of groundwater) and 3b (catchment area in the used layer). Dimensions of sectors 3a and 3b of the 3
rd strip are calculated making an assumption that chemical pollutants which get
into directly used watery layer will not reach the waterworks in 25 years. Hygiene Standard HN 44:2006 imposes the following restrictions to 3b sector of the 3
rd strip of the sanitary
protection zone of waterworks as follows:
- No unused wells, except for the wells intended for the observation of the underground water condition, shall be found in any of the strips of all groups of SPZ waterworks (regardless of, whether the catchment area is in the watery section of groundwater layer);
- It is prohibited to directly release treated and untreated (cleaned and not cleaned) industrial, municipal waste water, radioactive and chemical substances and preparations into underground watery layers in all strips of all groups of SPZ waterworks.
Section XX “Sanitary Protection Zones of Underground Water Bodies (Waterworks)” of the Special Terms and Conditions set the following terms and conditions for the use of land in the third strip of sanitary protection zone of waterworks: the following activities are prohibited in the third strip of underground water bodies (waterworks):
- Construction of warehouses of mineral fertilisers, poisonous substances, petrol, fuels and lubricants, installation of storage lots and dumps for toxic waste;
- Use of chemicals which may cause chemical pollution of waterworks; - Territory of the part of the Land Plot planned to be used and falling within the sectors 3b of
the third strip (chemical pollution strip) of the sanitary protection zone of waterworks and [economic activity carried out within it] is subject to no other restrictions.
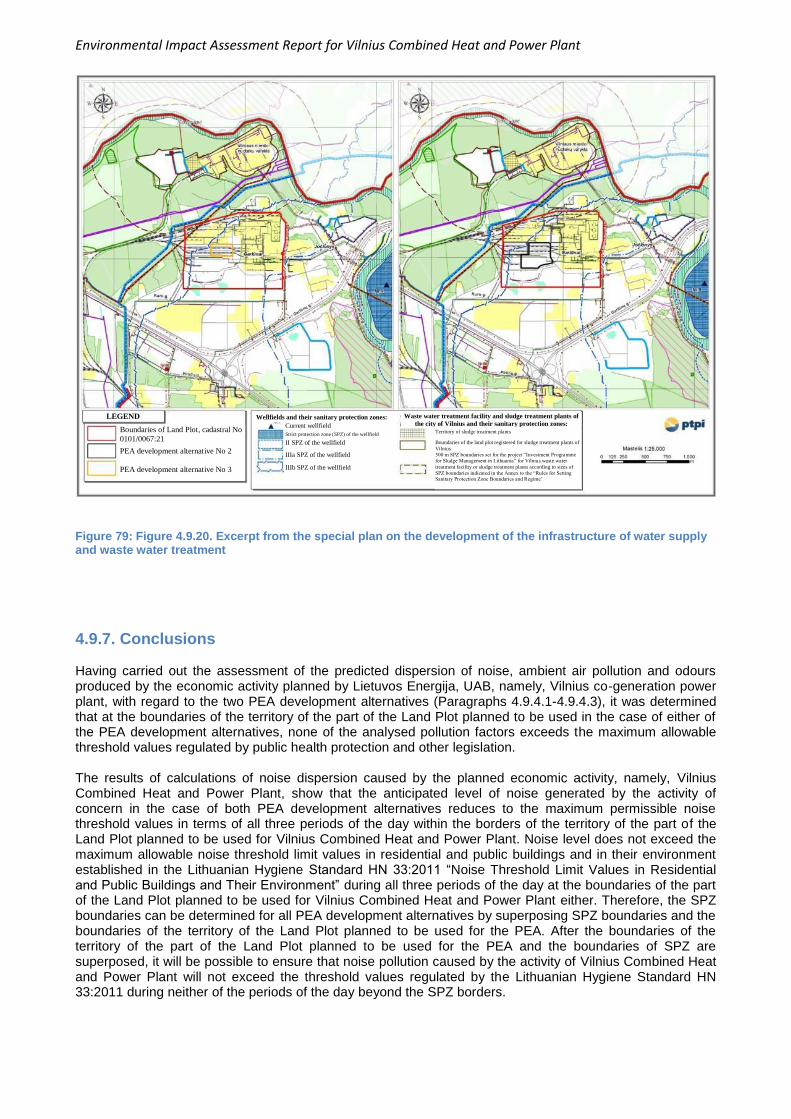
Environmental Impact Assessment Report for Vilnius Combined Heat and Power Plant
Figure 79: Figure 4.9.20. Excerpt from the special plan on the development of the infrastructure of water supply and waste water treatment
4.9.7. Conclusions Having carried out the assessment of the predicted dispersion of noise, ambient air pollution and odours produced by the economic activity planned by Lietuvos Energija, UAB, namely, Vilnius co-generation power plant, with regard to the two PEA development alternatives (Paragraphs 4.9.4.1-4.9.4.3), it was determined that at the boundaries of the territory of the part of the Land Plot planned to be used in the case of either of the PEA development alternatives, none of the analysed pollution factors exceeds the maximum allowable threshold values regulated by public health protection and other legislation. The results of calculations of noise dispersion caused by the planned economic activity, namely, Vilnius Combined Heat and Power Plant, show that the anticipated level of noise generated by the activity of concern in the case of both PEA development alternatives reduces to the maximum permissible noise threshold values in terms of all three periods of the day within the borders of the territory of the part of the Land Plot planned to be used for Vilnius Combined Heat and Power Plant. Noise level does not exceed the maximum allowable noise threshold limit values in residential and public buildings and in their environment established in the Lithuanian Hygiene Standard HN 33:2011 “Noise Threshold Limit Values in Residential and Public Buildings and Their Environment” during all three periods of the day at the boundaries of the part of the Land Plot planned to be used for Vilnius Combined Heat and Power Plant either. Therefore, the SPZ boundaries can be determined for all PEA development alternatives by superposing SPZ boundaries and the boundaries of the territory of the Land Plot planned to be used for the PEA. After the boundaries of the territory of the part of the Land Plot planned to be used for the PEA and the boundaries of SPZ are superposed, it will be possible to ensure that noise pollution caused by the activity of Vilnius Combined Heat and Power Plant will not exceed the threshold values regulated by the Lithuanian Hygiene Standard HN 33:2011 during neither of the periods of the day beyond the SPZ borders.
Boundaries of Land Plot, cadastral No
0101/0067:21
PEA development alternative No 2
PEA development alternative No 3
LEGEND
Current wellfield
Strict protection zone (SPZ) of the wellfield
II SPZ of the wellfield
IIIa SPZ of the wellfield
IIIb SPZ of the wellfield
Wellfields and their sanitary protection zones: Waste water treatment facility and sludge treatment plants of
the city of Vilnius and their sanitary protection zones:
Territory of sludge treatment plants
Boundaries of the land plot registered for sludge treatment plants of
Vilnius
500 m SPZ boundaries set for the project “Investment Programme
for Sludge Management in Lithuania” for Vilnius waste water
treatment facility or sludge treatment plants according to sizes of
SPZ boundaries indicated in the Annex to the “Rules for Setting Sanitary Protection Zone Boundaries and Regime’

Environmental Impact Assessment Report for Vilnius Combined Heat and Power Plant
The results of calculations of predicted dispersion of ambient air pollution caused by the planned economic activity, namely, Vilnius Combined Heat and Power Plant, show that the maximum concentrations of ground surface-level pollutants of ambient air produced by the activity of concern do not reach the threshold limit values in terms of the both PEA development alternatives neither within the borders of the territory of the part of the Land Plot planned to be used for the PEA, nor beyond its boundaries taking into consideration both the inclusion of the background pollution and its exclusion. For this reason, the predicted ambient air pollution has no effect on the size of the SPZ determined for the activity of Vilnius Combined Heat and Power Plant. After the boundaries of the territory of the part of the Land Plot planned to be used for the PEA and the boundaries of SPZ are superposed, it will be possible to ensure that ambient air pollution caused by the activity of Vilnius Combined Heat and Power Plant will not exceed the threshold values regulated by corresponding legislation. The estimated concentrations of the odour caused by the planned economic activity, namely, Vilnius Combined Heat and Power Plant, do not reach the maximum allowable marginal value of odour concentration regulated by the Lithuanian Hygiene Standard HN 121:2010 “Threshold Value of the Concentration of Odour in the Air of Habitable Environment” either within the territory of the part of the Land Plot planned to be used for the PEA, or at the boundaries of the territory with regard to either of the PEA development alternatives. Therefore, odour pollution has no effect on the size of the SPZ to be determined for the activity of Vilnius Combined Heat and Power Plant. Having assessed the details of calculations of the predicted pollution dispersion with regard to the economic activity planned by Lietuvos Energija, UAB, namely, Vilnius Combined Heat and Power Plant, address Jočionių St. 13, Vilnius, the conclusion may be drawn that in the cases of both PEA development alternatives, the SPZ boundaries can be determined by superposing the SPZ boundaries and the boundaries of the territory of the part of the Land Plot planned to be used for the PEA (Fig. 4.9.21 and 4.9.22). In this way, the provision of the Rules for the Delineation and Treatment of the Sanitary Protection Zones approved by Order No V-586 of the Minister of Health of the Republic of Lithuania of 19 August 2004 stipulating that chemical, physical pollution of the ambient air, odour pollution or any other type of pollution caused by the pollution object and the threshold limit values of the indicators of which are legally regulated will not exceed the threshold pollution values established for the environment of residential and (or) public buildings beyond the boundaries of the SPZ will be secured and the planned economic activity carried out in the analysed locality will have no negative impact on public health.
Boundaries of Land Plot, cadastral No 0101/0067:21 PEA development alternative No 3
Suggested boundaries of the SPZ
Closest urbanized territories
Closest residential buildings
LEGEND
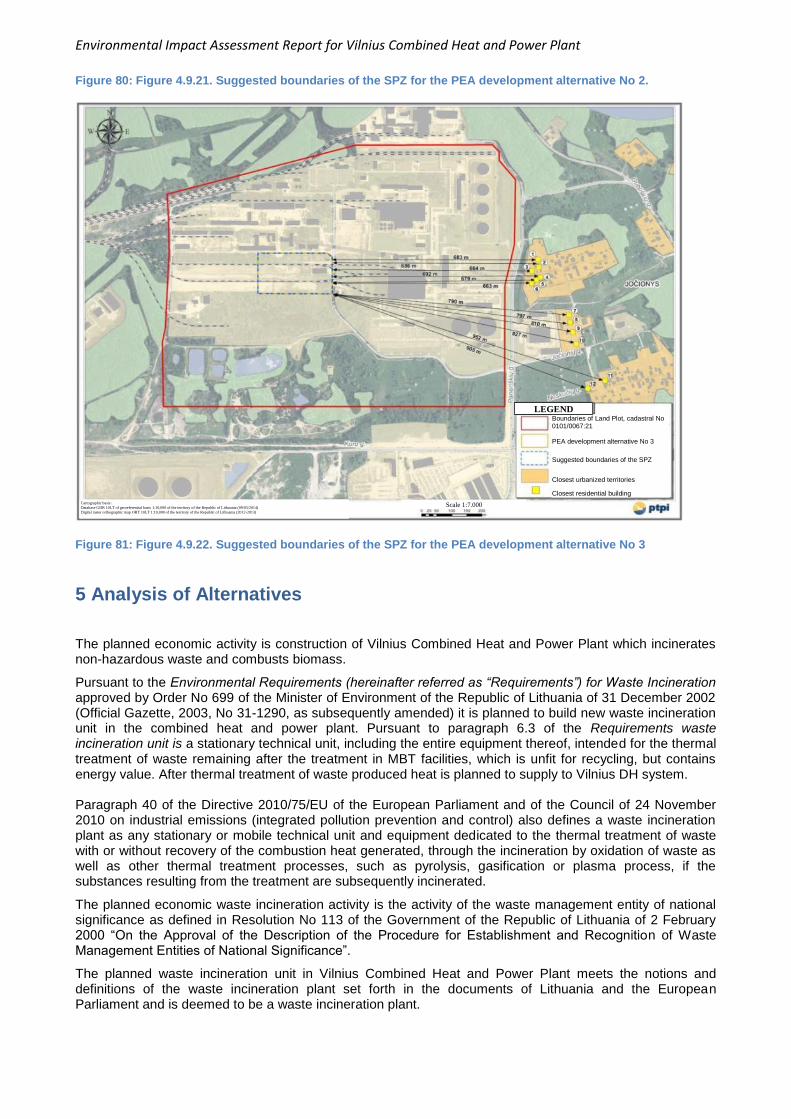
Environmental Impact Assessment Report for Vilnius Combined Heat and Power Plant
Figure 80: Figure 4.9.21. Suggested boundaries of the SPZ for the PEA development alternative No 2.
Figure 81: Figure 4.9.22. Suggested boundaries of the SPZ for the PEA development alternative No 3
5 Analysis of Alternatives
The planned economic activity is construction of Vilnius Combined Heat and Power Plant which incinerates non-hazardous waste and combusts biomass.
Pursuant to the Environmental Requirements (hereinafter referred as “Requirements”) for Waste Incineration approved by Order No 699 of the Minister of Environment of the Republic of Lithuania of 31 December 2002 (Official Gazette, 2003, No 31-1290, as subsequently amended) it is planned to build new waste incineration unit in the combined heat and power plant. Pursuant to paragraph 6.3 of the Requirements waste incineration unit is a stationary technical unit, including the entire equipment thereof, intended for the thermal treatment of waste remaining after the treatment in MBT facilities, which is unfit for recycling, but contains energy value. After thermal treatment of waste produced heat is planned to supply to Vilnius DH system. Paragraph 40 of the Directive 2010/75/EU of the European Parliament and of the Council of 24 November 2010 on industrial emissions (integrated pollution prevention and control) also defines a waste incineration plant as any stationary or mobile technical unit and equipment dedicated to the thermal treatment of waste with or without recovery of the combustion heat generated, through the incineration by oxidation of waste as well as other thermal treatment processes, such as pyrolysis, gasification or plasma process, if the substances resulting from the treatment are subsequently incinerated.
The planned economic waste incineration activity is the activity of the waste management entity of national significance as defined in Resolution No 113 of the Government of the Republic of Lithuania of 2 February 2000 “On the Approval of the Description of the Procedure for Establishment and Recognition of Waste Management Entities of National Significance”.
The planned waste incineration unit in Vilnius Combined Heat and Power Plant meets the notions and definitions of the waste incineration plant set forth in the documents of Lithuania and the European Parliament and is deemed to be a waste incineration plant.
Cartographic basis:
Database GDR 10LT of georeferential basis 1:10,000 of the territory of the Republic of Lithuania (09/05/2014)
Digital raster orthographic map ORT 10LT 1:10,000 of the territory of the Republic of Lithuania (2012-2013)
Scale 1:7.000
Boundaries of Land Plot, cadastral No 0101/0067:21 PEA development alternative No 3
Suggested boundaries of the SPZ
Closest urbanized territories
Closest residential building
LEGEND
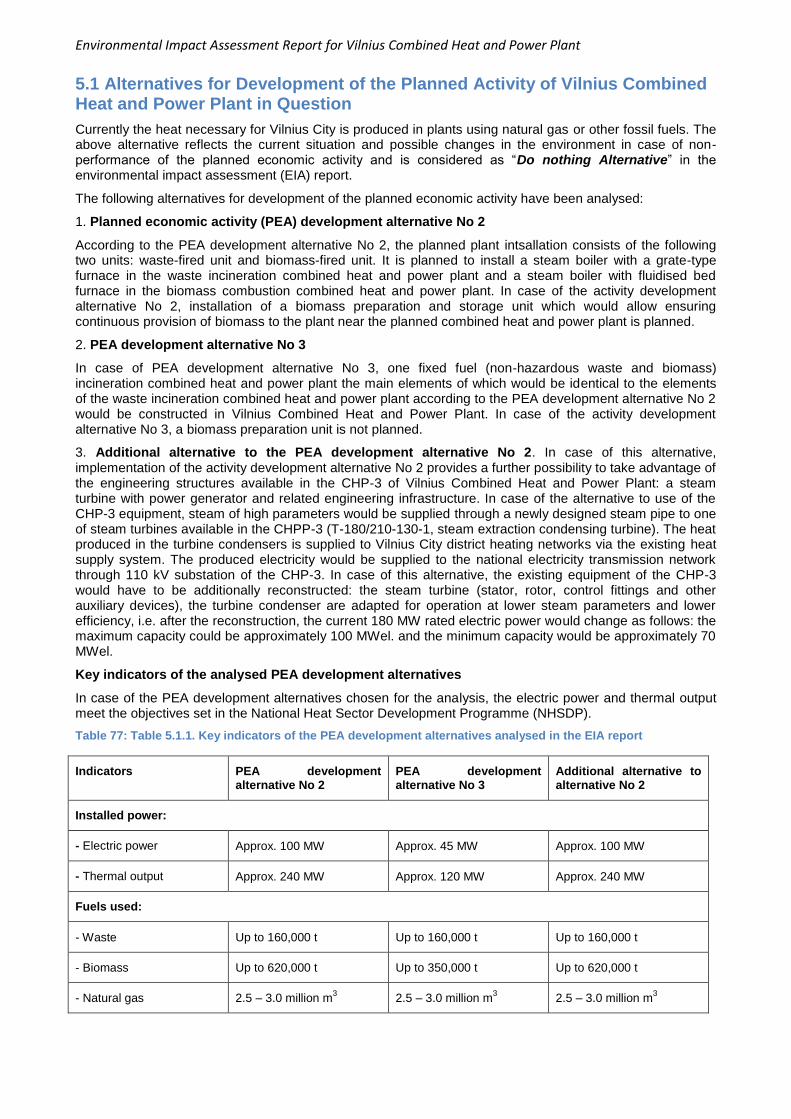
Environmental Impact Assessment Report for Vilnius Combined Heat and Power Plant
5.1 Alternatives for Development of the Planned Activity of Vilnius Combined Heat and Power Plant in Question
Currently the heat necessary for Vilnius City is produced in plants using natural gas or other fossil fuels. The above alternative reflects the current situation and possible changes in the environment in case of non-performance of the planned economic activity and is considered as “Do nothing Alternative” in the environmental impact assessment (EIA) report.
The following alternatives for development of the planned economic activity have been analysed:
1. Planned economic activity (PEA) development alternative No 2
According to the PEA development alternative No 2, the planned plant intsallation consists of the following two units: waste-fired unit and biomass-fired unit. It is planned to install a steam boiler with a grate-type furnace in the waste incineration combined heat and power plant and a steam boiler with fluidised bed furnace in the biomass combustion combined heat and power plant. In case of the activity development alternative No 2, installation of a biomass preparation and storage unit which would allow ensuring continuous provision of biomass to the plant near the planned combined heat and power plant is planned.
2. PEA development alternative No 3
In case of PEA development alternative No 3, one fixed fuel (non-hazardous waste and biomass) incineration combined heat and power plant the main elements of which would be identical to the elements of the waste incineration combined heat and power plant according to the PEA development alternative No 2 would be constructed in Vilnius Combined Heat and Power Plant. In case of the activity development alternative No 3, a biomass preparation unit is not planned.
3. Additional alternative to the PEA development alternative No 2. In case of this alternative, implementation of the activity development alternative No 2 provides a further possibility to take advantage of the engineering structures available in the CHP-3 of Vilnius Combined Heat and Power Plant: a steam turbine with power generator and related engineering infrastructure. In case of the alternative to use of the CHP-3 equipment, steam of high parameters would be supplied through a newly designed steam pipe to one of steam turbines available in the CHPP-3 (T-180/210-130-1, steam extraction condensing turbine). The heat produced in the turbine condensers is supplied to Vilnius City district heating networks via the existing heat supply system. The produced electricity would be supplied to the national electricity transmission network through 110 kV substation of the CHP-3. In case of this alternative, the existing equipment of the CHP-3 would have to be additionally reconstructed: the steam turbine (stator, rotor, control fittings and other auxiliary devices), the turbine condenser are adapted for operation at lower steam parameters and lower efficiency, i.e. after the reconstruction, the current 180 MW rated electric power would change as follows: the maximum capacity could be approximately 100 MWel. and the minimum capacity would be approximately 70 MWel.
Key indicators of the analysed PEA development alternatives
In case of the PEA development alternatives chosen for the analysis, the electric power and thermal output meet the objectives set in the National Heat Sector Development Programme (NHSDP).
Table 77: Table 5.1.1. Key indicators of the PEA development alternatives analysed in the EIA report
Indicators PEA development alternative No 2
PEA development alternative No 3
Additional alternative to alternative No 2
Installed power:
- Electric power Approx. 100 MW Approx. 45 MW Approx. 100 MW
- Thermal output Approx. 240 MW Approx. 120 MW Approx. 240 MW
Fuels used:
- Waste Up to 160,000 t Up to 160,000 t Up to 160,000 t
- Biomass Up to 620,000 t Up to 350,000 t Up to 620,000 t
- Natural gas 2.5 – 3.0 million m3 2.5 – 3.0 million m
3 2.5 – 3.0 million m
3
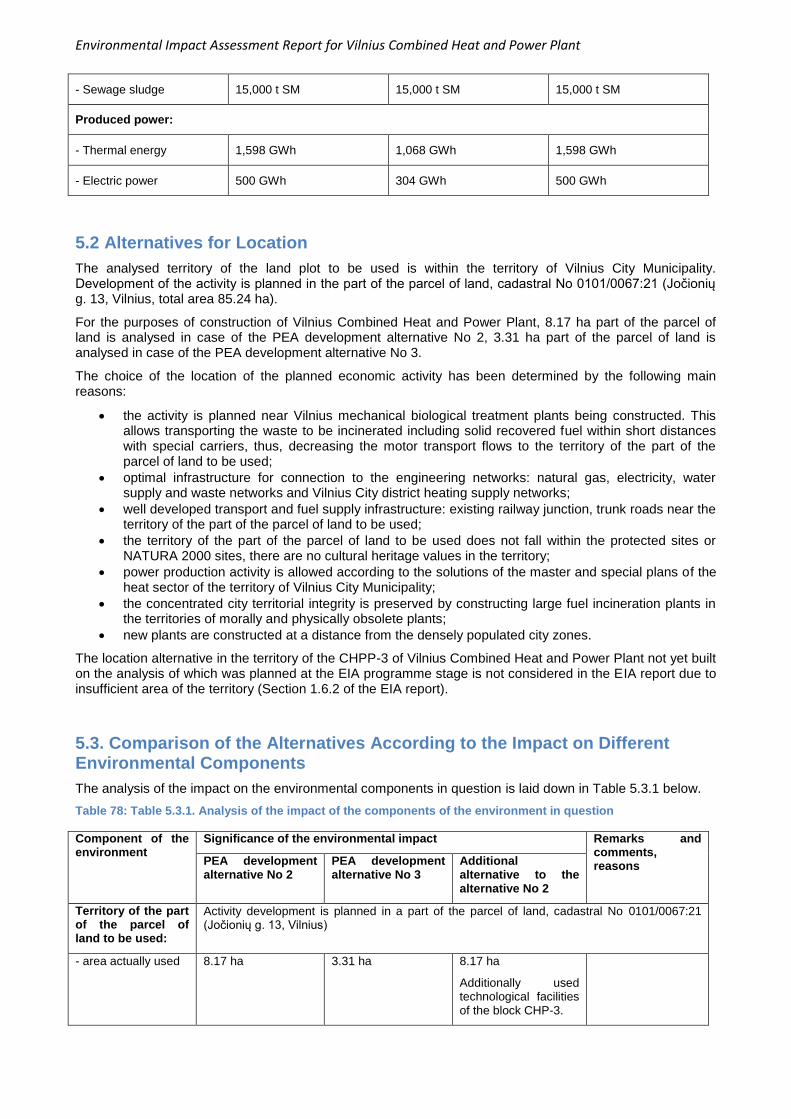
Environmental Impact Assessment Report for Vilnius Combined Heat and Power Plant
- Sewage sludge 15,000 t SM 15,000 t SM 15,000 t SM
Produced power:
- Thermal energy 1,598 GWh 1,068 GWh 1,598 GWh
- Electric power 500 GWh 304 GWh 500 GWh
5.2 Alternatives for Location
The analysed territory of the land plot to be used is within the territory of Vilnius City Municipality. Development of the activity is planned in the part of the parcel of land, cadastral No 0101/0067:21 (Jočionių g. 13, Vilnius, total area 85.24 ha).
For the purposes of construction of Vilnius Combined Heat and Power Plant, 8.17 ha part of the parcel of land is analysed in case of the PEA development alternative No 2, 3.31 ha part of the parcel of land is analysed in case of the PEA development alternative No 3.
The choice of the location of the planned economic activity has been determined by the following main reasons:
the activity is planned near Vilnius mechanical biological treatment plants being constructed. This allows transporting the waste to be incinerated including solid recovered fuel within short distances with special carriers, thus, decreasing the motor transport flows to the territory of the part of the parcel of land to be used;
optimal infrastructure for connection to the engineering networks: natural gas, electricity, water supply and waste networks and Vilnius City district heating supply networks;
well developed transport and fuel supply infrastructure: existing railway junction, trunk roads near the territory of the part of the parcel of land to be used;
the territory of the part of the parcel of land to be used does not fall within the protected sites or NATURA 2000 sites, there are no cultural heritage values in the territory;
power production activity is allowed according to the solutions of the master and special plans of the heat sector of the territory of Vilnius City Municipality;
the concentrated city territorial integrity is preserved by constructing large fuel incineration plants in the territories of morally and physically obsolete plants;
new plants are constructed at a distance from the densely populated city zones.
The location alternative in the territory of the CHPP-3 of Vilnius Combined Heat and Power Plant not yet built on the analysis of which was planned at the EIA programme stage is not considered in the EIA report due to insufficient area of the territory (Section 1.6.2 of the EIA report).
5.3. Comparison of the Alternatives According to the Impact on Different Environmental Components
The analysis of the impact on the environmental components in question is laid down in Table 5.3.1 below.
Table 78: Table 5.3.1. Analysis of the impact of the components of the environment in question
Component of the environment
Significance of the environmental impact Remarks and comments, reasons PEA development
alternative No 2 PEA development alternative No 3
Additional alternative to the alternative No 2
Territory of the part of the parcel of land to be used:
Activity development is planned in a part of the parcel of land, cadastral No 0101/0067:21 (Jočionių g. 13, Vilnius)
- area actually used 8.17 ha 3.31 ha 8.17 ha
Additionally used technological facilities of the block CHP-3.
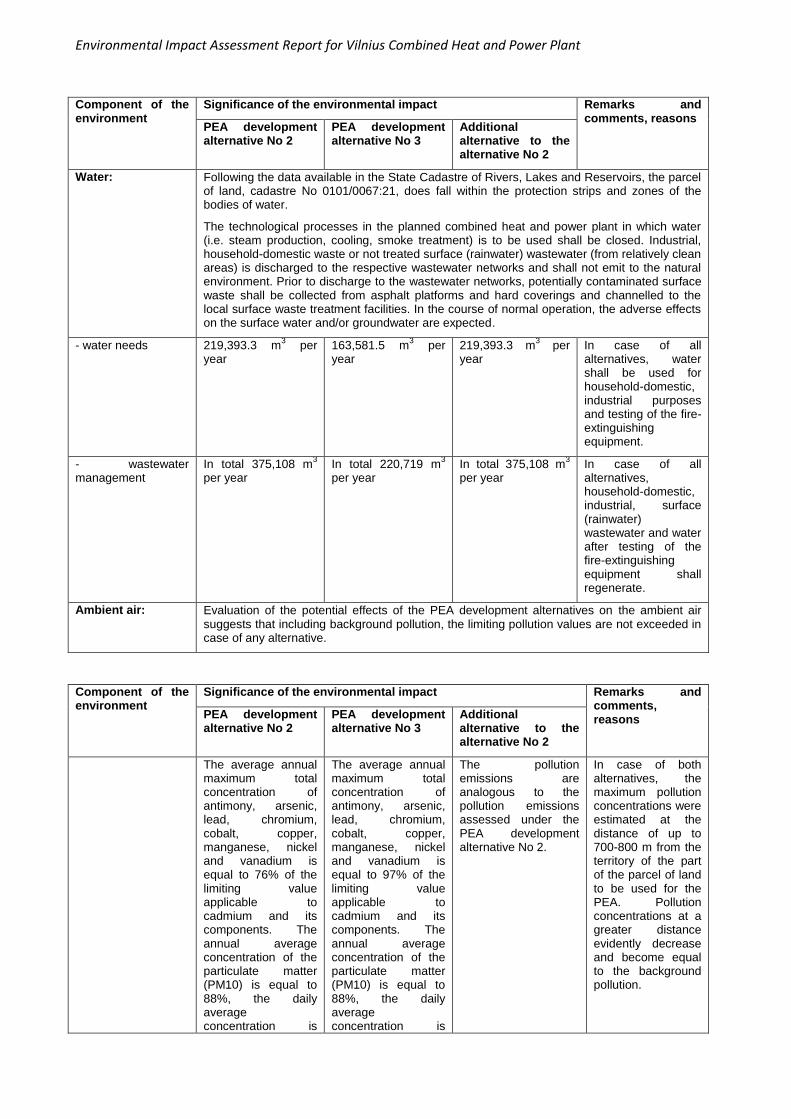
Environmental Impact Assessment Report for Vilnius Combined Heat and Power Plant
Component of the environment
Significance of the environmental impact Remarks and comments, reasons
PEA development alternative No 2
PEA development alternative No 3
Additional alternative to the alternative No 2
Water: Following the data available in the State Cadastre of Rivers, Lakes and Reservoirs, the parcel of land, cadastre No 0101/0067:21, does fall within the protection strips and zones of the bodies of water.
The technological processes in the planned combined heat and power plant in which water (i.e. steam production, cooling, smoke treatment) is to be used shall be closed. Industrial, household-domestic waste or not treated surface (rainwater) wastewater (from relatively clean areas) is discharged to the respective wastewater networks and shall not emit to the natural environment. Prior to discharge to the wastewater networks, potentially contaminated surface waste shall be collected from asphalt platforms and hard coverings and channelled to the local surface waste treatment facilities. In the course of normal operation, the adverse effects on the surface water and/or groundwater are expected.
- water needs 219,393.3 m3 per
year 163,581.5 m
3 per
year 219,393.3 m
3 per
year In case of all alternatives, water shall be used for household-domestic, industrial purposes and testing of the fire-extinguishing equipment.
- wastewater management
In total 375,108 m3
per year In total 220,719 m
3
per year In total 375,108 m
3
per year In case of all alternatives, household-domestic, industrial, surface (rainwater) wastewater and water after testing of the fire-extinguishing equipment shall regenerate.
Ambient air: Evaluation of the potential effects of the PEA development alternatives on the ambient air suggests that including background pollution, the limiting pollution values are not exceeded in case of any alternative.
Component of the environment
Significance of the environmental impact Remarks and comments, reasons PEA development
alternative No 2 PEA development alternative No 3
Additional alternative to the alternative No 2
The average annual maximum total concentration of antimony, arsenic, lead, chromium, cobalt, copper, manganese, nickel and vanadium is equal to 76% of the limiting value applicable to cadmium and its components. The annual average concentration of the particulate matter (PM10) is equal to 88%, the daily average concentration is
The average annual maximum total concentration of antimony, arsenic, lead, chromium, cobalt, copper, manganese, nickel and vanadium is equal to 97% of the limiting value applicable to cadmium and its components. The annual average concentration of the particulate matter (PM10) is equal to 88%, the daily average concentration is
The pollution emissions are analogous to the pollution emissions assessed under the PEA development alternative No 2.
In case of both alternatives, the maximum pollution concentrations were estimated at the distance of up to 700-800 m from the territory of the part of the parcel of land to be used for the PEA. Pollution concentrations at a greater distance evidently decrease and become equal to the background pollution.

Environmental Impact Assessment Report for Vilnius Combined Heat and Power Plant
equal to 72% of the limiting value. The annual average concentration of nitrogen dioxide is equal to 81%, hourly average concentration is equal to 31% of the limiting value. The maximum hourly average concentration of ammonia is equal to 68% of the limiting value.
equal to 73% of the limiting value. The annual average concentration of nitrogen dioxide is equal to 81%, hourly average concentration is equal to 31% of the limiting value. The maximum hourly average concentration of ammonia is equal to 68% of the limiting value.
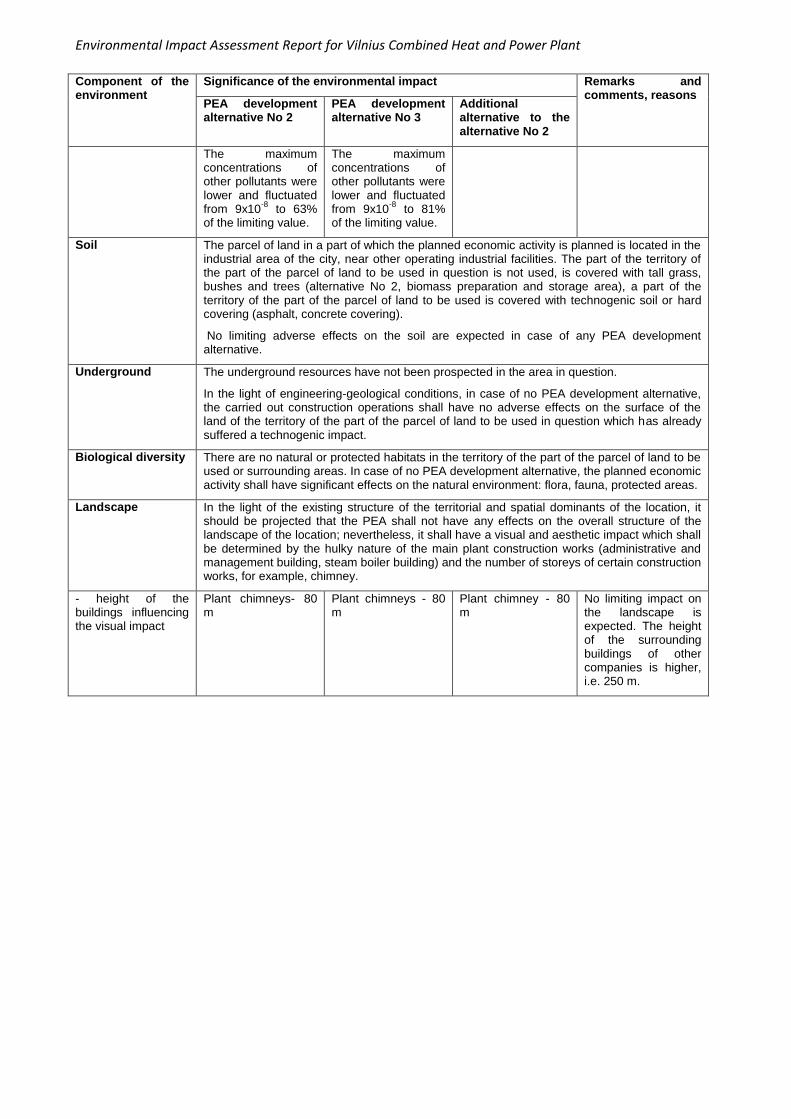
Environmental Impact Assessment Report for Vilnius Combined Heat and Power Plant
Component of the environment
Significance of the environmental impact Remarks and comments, reasons
PEA development alternative No 2
PEA development alternative No 3
Additional alternative to the alternative No 2
The maximum concentrations of other pollutants were lower and fluctuated from 9x10
-8 to 63%
of the limiting value.
The maximum concentrations of other pollutants were lower and fluctuated from 9x10
-8 to 81%
of the limiting value.
Soil The parcel of land in a part of which the planned economic activity is planned is located in the industrial area of the city, near other operating industrial facilities. The part of the territory of the part of the parcel of land to be used in question is not used, is covered with tall grass, bushes and trees (alternative No 2, biomass preparation and storage area), a part of the territory of the part of the parcel of land to be used is covered with technogenic soil or hard covering (asphalt, concrete covering).
No limiting adverse effects on the soil are expected in case of any PEA development alternative.
Underground The underground resources have not been prospected in the area in question.
In the light of engineering-geological conditions, in case of no PEA development alternative, the carried out construction operations shall have no adverse effects on the surface of the land of the territory of the part of the parcel of land to be used in question which has already suffered a technogenic impact.
Biological diversity There are no natural or protected habitats in the territory of the part of the parcel of land to be used or surrounding areas. In case of no PEA development alternative, the planned economic activity shall have significant effects on the natural environment: flora, fauna, protected areas.
Landscape In the light of the existing structure of the territorial and spatial dominants of the location, it should be projected that the PEA shall not have any effects on the overall structure of the landscape of the location; nevertheless, it shall have a visual and aesthetic impact which shall be determined by the hulky nature of the main plant construction works (administrative and management building, steam boiler building) and the number of storeys of certain construction works, for example, chimney.
- height of the buildings influencing the visual impact
Plant chimneys- 80 m
Plant chimneys - 80 m
Plant chimney - 80 m
No limiting impact on the landscape is expected. The height of the surrounding buildings of other companies is higher, i.e. 250 m.
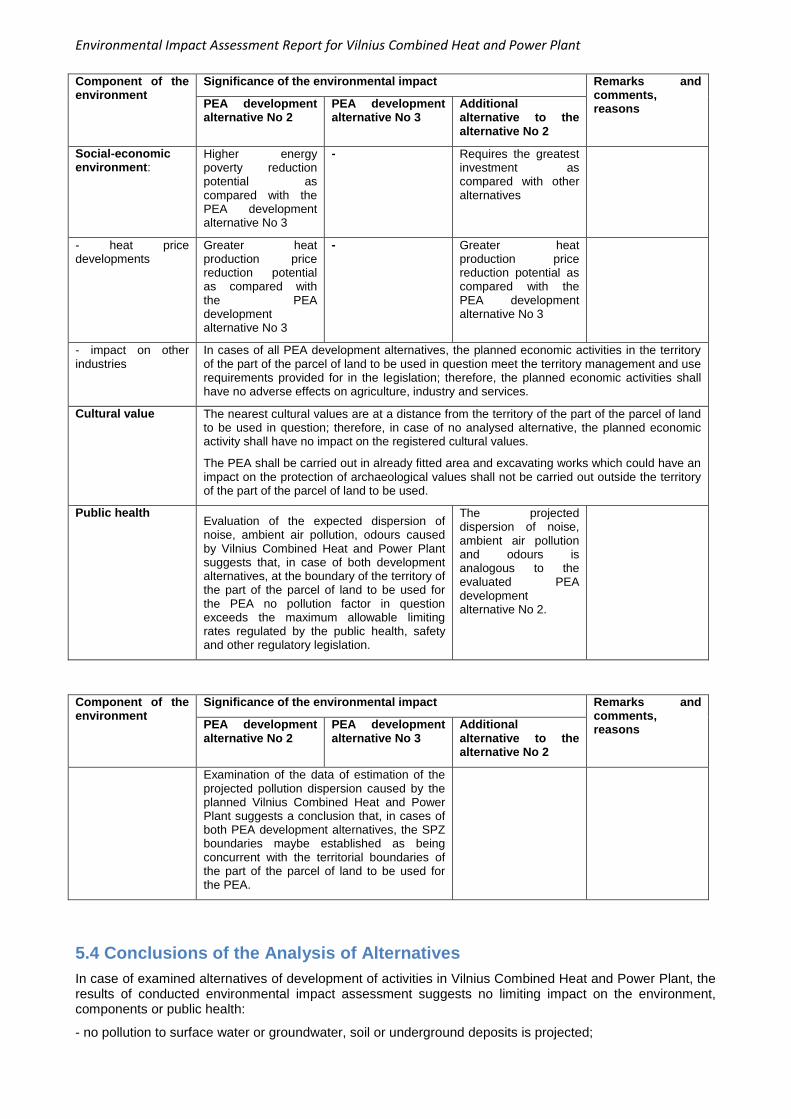
Environmental Impact Assessment Report for Vilnius Combined Heat and Power Plant
Component of the environment
Significance of the environmental impact Remarks and comments, reasons PEA development
alternative No 2 PEA development alternative No 3
Additional alternative to the alternative No 2
Social-economic environment:
Higher energy poverty reduction potential as compared with the PEA development alternative No 3
- Requires the greatest investment as compared with other alternatives
- heat price developments
Greater heat production price reduction potential as compared with the PEA development alternative No 3
- Greater heat production price reduction potential as compared with the PEA development alternative No 3
- impact on other industries
In cases of all PEA development alternatives, the planned economic activities in the territory of the part of the parcel of land to be used in question meet the territory management and use requirements provided for in the legislation; therefore, the planned economic activities shall have no adverse effects on agriculture, industry and services.
Cultural value The nearest cultural values are at a distance from the territory of the part of the parcel of land to be used in question; therefore, in case of no analysed alternative, the planned economic activity shall have no impact on the registered cultural values.
The PEA shall be carried out in already fitted area and excavating works which could have an impact on the protection of archaeological values shall not be carried out outside the territory of the part of the parcel of land to be used.
Public health Evaluation of the expected dispersion of noise, ambient air pollution, odours caused by Vilnius Combined Heat and Power Plant suggests that, in case of both development alternatives, at the boundary of the territory of the part of the parcel of land to be used for the PEA no pollution factor in question exceeds the maximum allowable limiting rates regulated by the public health, safety and other regulatory legislation.
The projected dispersion of noise, ambient air pollution and odours is analogous to the evaluated PEA development alternative No 2.
Component of the environment
Significance of the environmental impact Remarks and comments, reasons PEA development
alternative No 2 PEA development alternative No 3
Additional alternative to the alternative No 2
Examination of the data of estimation of the projected pollution dispersion caused by the planned Vilnius Combined Heat and Power Plant suggests a conclusion that, in cases of both PEA development alternatives, the SPZ boundaries maybe established as being concurrent with the territorial boundaries of the part of the parcel of land to be used for the PEA.
5.4 Conclusions of the Analysis of Alternatives
In case of examined alternatives of development of activities in Vilnius Combined Heat and Power Plant, the results of conducted environmental impact assessment suggests no limiting impact on the environment, components or public health:
- no pollution to surface water or groundwater, soil or underground deposits is projected;

Environmental Impact Assessment Report for Vilnius Combined Heat and Power Plant
- the estimated ambient air pollution emission does not exceed the established limiting values at the territorial boundary of the part of the parcel of land to be used for the activity development in question;
- the estimated projected noise levels at the nearest residential environment and the territorial boundary of the part of the parcel of land to be used in cases of the PEA development alternatives Nos. 2 and 3 do not exceed the limiting values established in the environment of residential buildings (houses) and public buildings (except for catering and cultural buildings) (HN 33:2011) at any time of the day;
- in cases of both PEA development alternatives, if traffic of the serving transport is organised in Dubliškių, Paneriškių and Jočionių streets and the noise reduction measures are introduced, having regard to the current flows of transport, the estimated projected level of noise caused by the transport serving the PEA in the nearest residential area shall not exceed the limiting values set forth in the public health protection;
- the odour concentrations in the ambient air within the average hourly range shall not reach the limiting value of 8 OUE/m
3;
- all examined alternatives offer a potential for the heat production price reduction, the PEA development alternative No 2 and the additional alternative to the PEA development alternative offer a greater potential for the heat production price reduction as compared with the PEA development alternative No 3; nevertheless, the additional alternative to the PEA development alternative No 2 requires greater investment;
- the territory of the part of the parcel of land to be used in which Vilnius Combined Heat and Power Plant is planned does not fall within the territory of protected areas or cultural heritage areas and is in compliance with the solutions of the master plan of Vilnius City Municipality and the special plan of the heat sector.
In the light of the results of the conducted environmental impact assessment, the planned economic activity development in terms of environmental impact is possible choosing any of the analysed planned economic activity alternatives.
Environmental Impact Assessment Report for Vilnius Combined Heat and Power Plant
6 Monitoring
6.1 Regulation of Conducting the Environmental Monitoring by the Law
The environmental monitoring of economic entities is regulated by the Republic of Lithuania Law on Environmental Protection (No I-2223; Official Gazette Valstybės žinios, 1992, No 5-75; including recasts thereof), the Republic of Lithuania Law on Environmental Monitoring (No VIII-529; Official Gazette Valstybės žinios, 1997, No 112 – 2824, including further amendments and supplements thereto), the Republic of Lithuania Law on Water (No VIII-474; Official Gazette Valstybės žinios, 1997, No 104-2615; including further recasts thereof), the Republic of Lithuania Law on the Underground (No IX-243; Official Gazette Valstybės žinios, 2001, No 35-1164; including further recasts thereof) and the Regulations of the State Laboratory Control of the Environment approved by Order No 652 of the Minister of Environment of the Republic of Lithuania of 17 December 2003 (Official Gazette Valstybės žinios, 2004, No 4-76).
Republic of Lithuania Law on Environmental Protection. Article 9 of the Law on Environment Protection provides for that “Environmental monitoring of economic entities shall be conducted with a view to establishing the quantity of pollutants discharged by sources of pollution of economic entities and the impact of economic activities on the natural environment and ensuring reduction of the pollution caused thereby or another adverse impact.” Environmental monitoring of economic entities shall be carried out according to the programme for environmental monitoring of economic entities drawn up by the economic entities themselves. The content of programmes for environmental monitoring of economic entities and the procedure for drafting, co-ordinating, implementing them, ensuring control and providing information shall be established by the Regulations of Environmental Monitoring of Economic Entities. The regulations shall be drafted and approved by the Ministry of Environment approved by Order No D1-546 of the Minister of Environment of the Republic of Lithuania of 16 September 2009 (Official Gazette Valstybės žinios, 2009, No 11-4831, including further recasts thereof) (hereinafter referred to as the “Regulations of Environmental Monitoring”). The programme for environmental monitoring of economic entities shall be coordinated and approved in accordance with the procedure prescribed in the Regulations of Environmental Monitoring of Economic Entities.
Republic of Lithuania Law on Environmental Monitoring. The law provides for the rights and duties of public institutions and economic entities and liability thereof for violations of the Law on Environmental Monitoring. Paragraph 6 of Article 6 of Chapter One of the Law provides for that “Environmental monitoring of economic entities shall mean the environmental monitoring conducted in accordance with the procedure laid down by legal acts by economic entities at the local level”.
The programme for environmental monitoring of the planned subject, i.e. Vilnius Combined Heat and Power Plant, shall be drawn up in accordance with the Regulations of Environmental Monitoring of Economic Entities. Following the requirements of the Regulations of Environmental Monitoring, the following monitoring shall be conducted in Vilnius Combined Heat and Power Plant:
Monitoring of technological processes;
Monitoring of pollution emissions/discharges from sources of pollution;
Monitoring of the impact on the quality of the environment (impact on the environment).
6.2. Monitoring of Technological Processes
Order No D1-546 of the Minister of Environment of the Republic of Lithuania of 16 September 2009 “On the Approval of the Regulations of Environmental Monitoring of Economic Entities” (including further recasts thereof) provides for that monitoring of technological processes of economic entities must be conducted by economic entities operating waste incineration plants or waste co-incineration plants referred to in the Environmental Requirements for Waste Incineration approved by Order No 699 of the Minister of Environment of the Republic of Lithuania of 31 December 2002 (Official Gazette Valstybės žinios, 2003, No 31-1290).
The monitoring of technological processes of economic entities is aimed at monitoring and evaluating if the economic entity does not deviate from the technological regime, thus, causing environment pollution that is higher than the allowable environment pollution by means of measuring the parameters of the technological processes in the plants related to pollution emissions/discharges, energy consumption and waste generation.
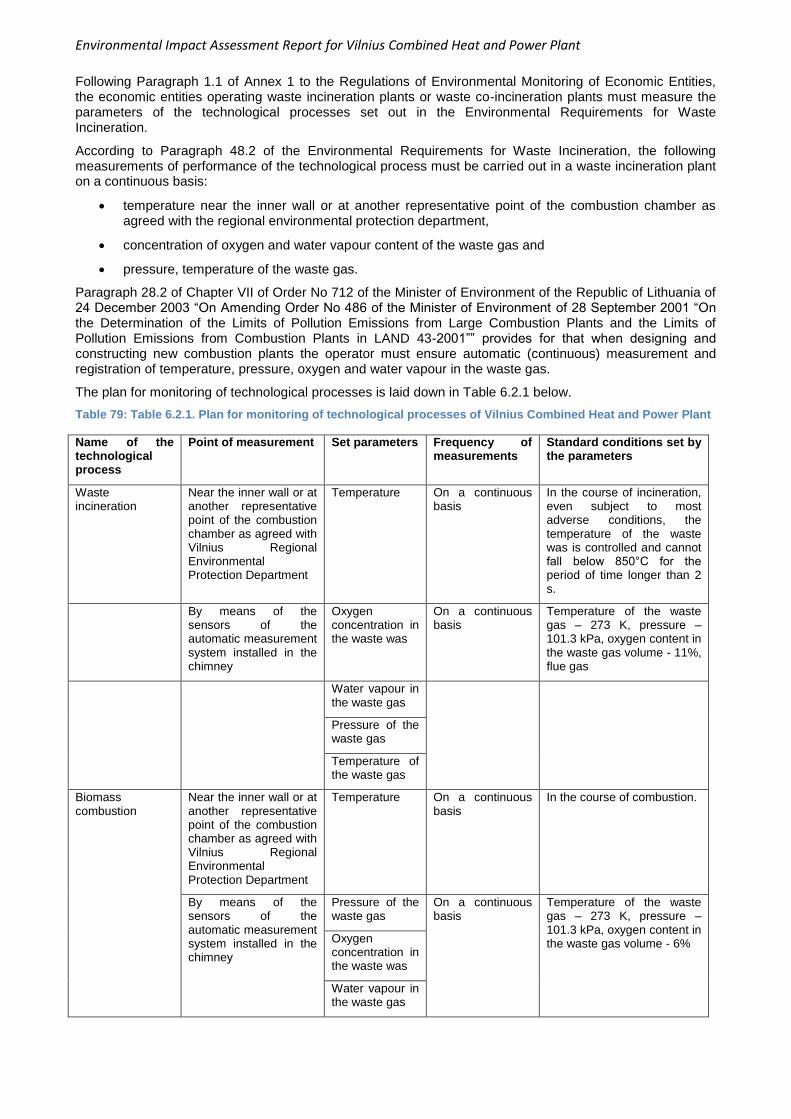
Environmental Impact Assessment Report for Vilnius Combined Heat and Power Plant
Following Paragraph 1.1 of Annex 1 to the Regulations of Environmental Monitoring of Economic Entities, the economic entities operating waste incineration plants or waste co-incineration plants must measure the parameters of the technological processes set out in the Environmental Requirements for Waste Incineration.
According to Paragraph 48.2 of the Environmental Requirements for Waste Incineration, the following measurements of performance of the technological process must be carried out in a waste incineration plant on a continuous basis:
temperature near the inner wall or at another representative point of the combustion chamber as agreed with the regional environmental protection department,
concentration of oxygen and water vapour content of the waste gas and
pressure, temperature of the waste gas.
Paragraph 28.2 of Chapter VII of Order No 712 of the Minister of Environment of the Republic of Lithuania of 24 December 2003 “On Amending Order No 486 of the Minister of Environment of 28 September 2001 “On the Determination of the Limits of Pollution Emissions from Large Combustion Plants and the Limits of Pollution Emissions from Combustion Plants in LAND 43-2001”” provides for that when designing and constructing new combustion plants the operator must ensure automatic (continuous) measurement and registration of temperature, pressure, oxygen and water vapour in the waste gas.
The plan for monitoring of technological processes is laid down in Table 6.2.1 below.
Table 79: Table 6.2.1. Plan for monitoring of technological processes of Vilnius Combined Heat and Power Plant
Name of the technological process
Point of measurement Set parameters Frequency of measurements
Standard conditions set by the parameters
Waste incineration
Near the inner wall or at another representative point of the combustion chamber as agreed with Vilnius Regional Environmental Protection Department
Temperature On a continuous basis
In the course of incineration, even subject to most adverse conditions, the temperature of the waste was is controlled and cannot fall below 850°C for the period of time longer than 2 s.
By means of the sensors of the automatic measurement system installed in the chimney
Oxygen concentration in the waste was
On a continuous basis
Temperature of the waste gas – 273 K, pressure – 101.3 kPa, oxygen content in the waste gas volume - 11%, flue gas
Water vapour in the waste gas
Pressure of the waste gas
Temperature of the waste gas
Biomass combustion
Near the inner wall or at another representative point of the combustion chamber as agreed with Vilnius Regional Environmental Protection Department
Temperature On a continuous basis
In the course of combustion.
By means of the sensors of the automatic measurement system installed in the chimney
Pressure of the waste gas
On a continuous basis
Temperature of the waste gas – 273 K, pressure – 101.3 kPa, oxygen content in the waste gas volume - 6% Oxygen
concentration in the waste was
Water vapour in the waste gas
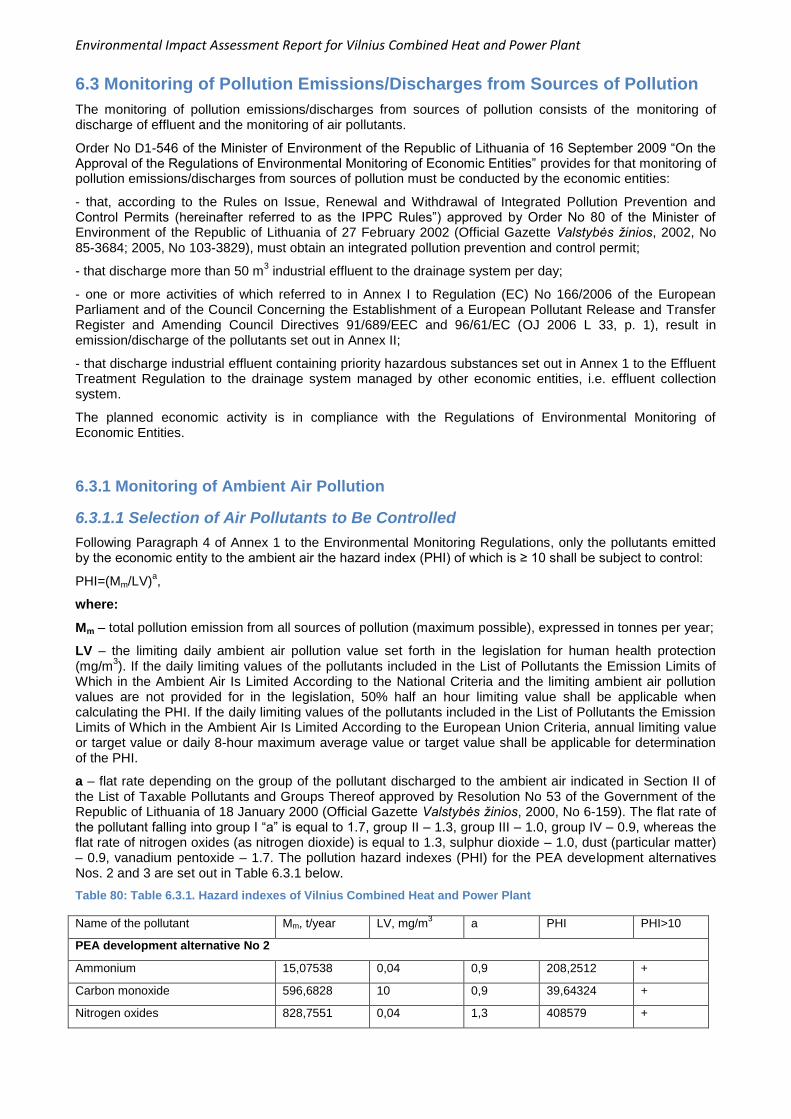
Environmental Impact Assessment Report for Vilnius Combined Heat and Power Plant
6.3 Monitoring of Pollution Emissions/Discharges from Sources of Pollution
The monitoring of pollution emissions/discharges from sources of pollution consists of the monitoring of discharge of effluent and the monitoring of air pollutants.
Order No D1-546 of the Minister of Environment of the Republic of Lithuania of 16 September 2009 “On the Approval of the Regulations of Environmental Monitoring of Economic Entities” provides for that monitoring of pollution emissions/discharges from sources of pollution must be conducted by the economic entities:
- that, according to the Rules on Issue, Renewal and Withdrawal of Integrated Pollution Prevention and Control Permits (hereinafter referred to as the IPPC Rules”) approved by Order No 80 of the Minister of Environment of the Republic of Lithuania of 27 February 2002 (Official Gazette Valstybės žinios, 2002, No 85-3684; 2005, No 103-3829), must obtain an integrated pollution prevention and control permit;
- that discharge more than 50 m3 industrial effluent to the drainage system per day;
- one or more activities of which referred to in Annex I to Regulation (EC) No 166/2006 of the European Parliament and of the Council Concerning the Establishment of a European Pollutant Release and Transfer Register and Amending Council Directives 91/689/EEC and 96/61/EC (OJ 2006 L 33, p. 1), result in emission/discharge of the pollutants set out in Annex II;
- that discharge industrial effluent containing priority hazardous substances set out in Annex 1 to the Effluent Treatment Regulation to the drainage system managed by other economic entities, i.e. effluent collection system.
The planned economic activity is in compliance with the Regulations of Environmental Monitoring of Economic Entities.
6.3.1 Monitoring of Ambient Air Pollution
6.3.1.1 Selection of Air Pollutants to Be Controlled
Following Paragraph 4 of Annex 1 to the Environmental Monitoring Regulations, only the pollutants emitted by the economic entity to the ambient air the hazard index (PHI) of which is ≥ 10 shall be subject to control:
PHI=(Mm/LV)a,
where:
Mm – total pollution emission from all sources of pollution (maximum possible), expressed in tonnes per year;
LV – the limiting daily ambient air pollution value set forth in the legislation for human health protection (mg/m
3). If the daily limiting values of the pollutants included in the List of Pollutants the Emission Limits of
Which in the Ambient Air Is Limited According to the National Criteria and the limiting ambient air pollution values are not provided for in the legislation, 50% half an hour limiting value shall be applicable when calculating the PHI. If the daily limiting values of the pollutants included in the List of Pollutants the Emission Limits of Which in the Ambient Air Is Limited According to the European Union Criteria, annual limiting value or target value or daily 8-hour maximum average value or target value shall be applicable for determination of the PHI.
a – flat rate depending on the group of the pollutant discharged to the ambient air indicated in Section II of the List of Taxable Pollutants and Groups Thereof approved by Resolution No 53 of the Government of the Republic of Lithuania of 18 January 2000 (Official Gazette Valstybės žinios, 2000, No 6-159). The flat rate of the pollutant falling into group I “a” is equal to 1.7, group II – 1.3, group III – 1.0, group IV – 0.9, whereas the flat rate of nitrogen oxides (as nitrogen dioxide) is equal to 1.3, sulphur dioxide – 1.0, dust (particular matter) – 0.9, vanadium pentoxide – 1.7. The pollution hazard indexes (PHI) for the PEA development alternatives Nos. 2 and 3 are set out in Table 6.3.1 below.
Table 80: Table 6.3.1. Hazard indexes of Vilnius Combined Heat and Power Plant
Name of the pollutant Mm, t/year LV, mg/m3 a PHI PHI>10
PEA development alternative No 2
Ammonium 15,07538 0,04 0,9 208,2512 +
Carbon monoxide 596,6828 10 0,9 39,64324 +
Nitrogen oxides 828,7551 0,04 1,3 408579 +
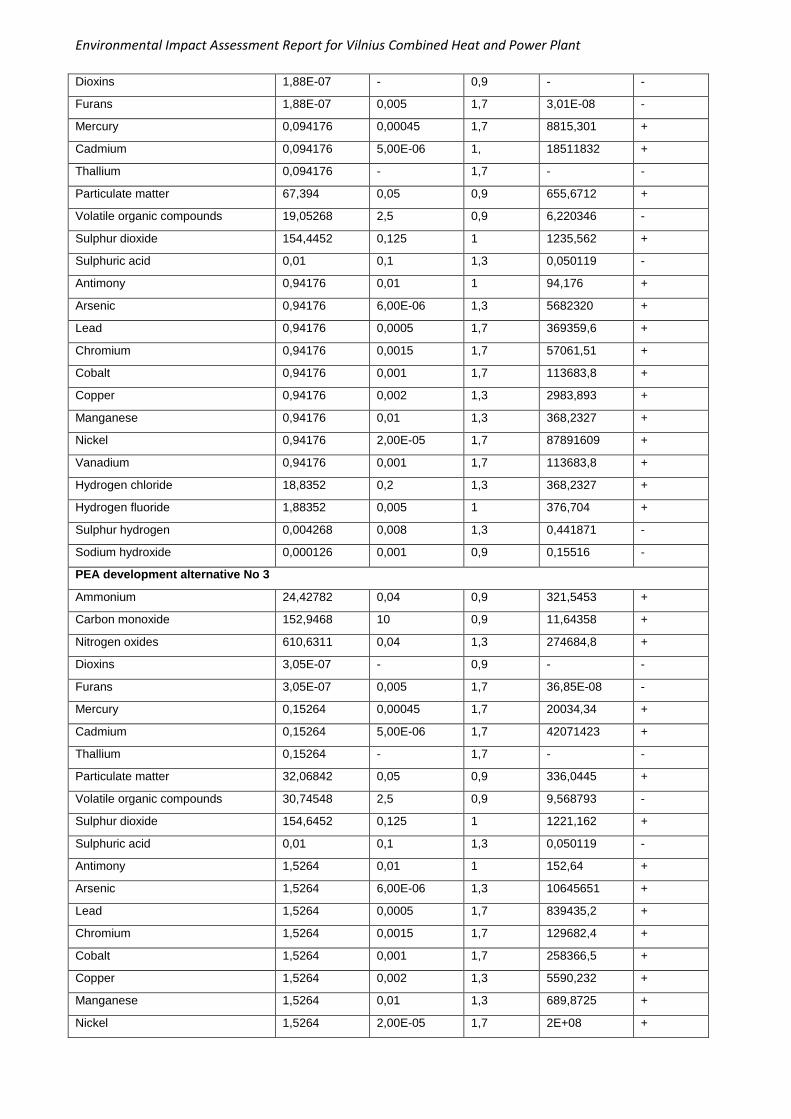
Environmental Impact Assessment Report for Vilnius Combined Heat and Power Plant
Dioxins 1,88E-07 - 0,9 - -
Furans 1,88E-07 0,005 1,7 3,01E-08 -
Mercury 0,094176 0,00045 1,7 8815,301 +
Cadmium 0,094176 5,00E-06 1, 18511832 +
Thallium 0,094176 - 1,7 - -
Particulate matter 67,394 0,05 0,9 655,6712 +
Volatile organic compounds 19,05268 2,5 0,9 6,220346 -
Sulphur dioxide 154,4452 0,125 1 1235,562 +
Sulphuric acid 0,01 0,1 1,3 0,050119 -
Antimony 0,94176 0,01 1 94,176 +
Arsenic 0,94176 6,00E-06 1,3 5682320 +
Lead 0,94176 0,0005 1,7 369359,6 +
Chromium 0,94176 0,0015 1,7 57061,51 +
Cobalt 0,94176 0,001 1,7 113683,8 +
Copper 0,94176 0,002 1,3 2983,893 +
Manganese 0,94176 0,01 1,3 368,2327 +
Nickel 0,94176 2,00E-05 1,7 87891609 +
Vanadium 0,94176 0,001 1,7 113683,8 +
Hydrogen chloride 18,8352 0,2 1,3 368,2327 +
Hydrogen fluoride 1,88352 0,005 1 376,704 +
Sulphur hydrogen 0,004268 0,008 1,3 0,441871 -
Sodium hydroxide 0,000126 0,001 0,9 0,15516 -
PEA development alternative No 3
Ammonium 24,42782 0,04 0,9 321,5453 +
Carbon monoxide 152,9468 10 0,9 11,64358 +
Nitrogen oxides 610,6311 0,04 1,3 274684,8 +
Dioxins 3,05E-07 - 0,9 - -
Furans 3,05E-07 0,005 1,7 36,85E-08 -
Mercury 0,15264 0,00045 1,7 20034,34 +
Cadmium 0,15264 5,00E-06 1,7 42071423 +
Thallium 0,15264 - 1,7 - -
Particulate matter 32,06842 0,05 0,9 336,0445 +
Volatile organic compounds 30,74548 2,5 0,9 9,568793 -
Sulphur dioxide 154,6452 0,125 1 1221,162 +
Sulphuric acid 0,01 0,1 1,3 0,050119 -
Antimony 1,5264 0,01 1 152,64 +
Arsenic 1,5264 6,00E-06 1,3 10645651 +
Lead 1,5264 0,0005 1,7 839435,2 +
Chromium 1,5264 0,0015 1,7 129682,4 +
Cobalt 1,5264 0,001 1,7 258366,5 +
Copper 1,5264 0,002 1,3 5590,232 +
Manganese 1,5264 0,01 1,3 689,8725 +
Nickel 1,5264 2,00E-05 1,7 2E+08 +

Environmental Impact Assessment Report for Vilnius Combined Heat and Power Plant
Vanadium 1,5264 0,001 1,7 258366,5 +
Hydrogen chloride 30,528 0,2 1,3 689,8725 +
Hydrogen fluoride 3,0528 0,005 1 610,56 +
Sulphur hydrogen 0,004268 0,008 1,3 0,441871 -
Sodium hydroxide 0,000126 0,001 0,9 0,15516 -
According to the PHI estimation, the pollutants to be controlled are as follows: ammonia, carbon monoxide, nitrogen oxides, mercury, cadmium, particulate matter, sulphur dioxide, antimony, arsenic, lead, chromium, cobalt, copper, manganese, nickel, vanadium, hydrogen chloride, hydrogen fluoride.
6.3.1.2. Categorisation of the Sources of Pollution
Monitoring of stationary sources of ambient air pollution is conducted according to the schedule of control of stationary sources of ambient air pollution the drawing up of which requires categorisation of the sources of pollution according to the emission capacity of the pollutant to be controlled and the potential impact of pollution emissions from the source on the quality of the ambient air.
According to Section 5 of Annex 1 to the Environmental Monitoring Regulations, all sources of pollution of economic entities shall fall into the first category and second category according to each pollutant emitted from the respective source of pollution:
5.1. Pollutants the emission limits of which in the ambient air is limited according to the national criteria:
5.1. falling within the first category: sources of pollution,
if Cm/LV >0.5,
where M/(LV*H) >0.01,
and sources of pollution with treatment facilities the average treatment efficiency of which is higher than 85%,
if Cm/LV)>0.1,
where M/( LV*H) >0.002,
here:
Cm – maximum concentration of the pollutant in the ambient air (mg/m3) in unfavourable meteorological
conditions according to the pollution dispersion estimations;
LV – daily limiting ambient air pollution value established in the legislation (mg/m3). If half an hour limiting
ambient air pollution value is not set forth in the legislation, the daily ambient air pollution value shall be applicable;
M – maximum possible pollution emission from the source of pollution, g/s;
H – height of the source of pollution in relation to the ground, m. If H<10 m, it shall be calculated as H=10 m.
5.1.2. The sources of pollution not meeting the criteria for the sources of pollution referred to in Paragraph 5.1.1 herein above falling into the first category and the sources of pollution of the economic entities for which the rates in the integrated pollution prevention and control permit are established according to the actual pollution emission level shall fall into the second category.
5.2. Sources of pollution the emission limits of which in the ambient air is limited according to the European Union criteria:
5.2.1. the first category covers:
sources of pollution,
if Cm/LV>0.5,
where M/(LV * H) >0.01,
and the sources of pollution with treatment facilities the average treatment efficiency of which is higher than 85%,
if Cm/ LV ) >0.1,
where M/( LV * H) >0.002,
Environmental Impact Assessment Report for Vilnius Combined Heat and Power Plant
here:
Cm – maximum concentration of the pollutant in the ambient air (mg/m3) in unfavourable meteorological
conditions according to the pollution dispersion estimations;
LV – daily limiting ambient air pollution value established in the legislation (mg/m3). If half an hourly limiting
ambient air pollution value is not set forth in the legislation, the limiting value or target value set for the minimum averaging period shall be applicable;
M – maximum possible pollution emission from the source of pollution, g/s;
H – height of the source of pollution in relation to the ground, m. If H<10 m, it shall be calculated as H=10 m.
5.2.2. The sources of pollution not meeting the criteria for the sources of pollution falling into the first category referred to in Paragraph 5.2.1 herein above shall fall into the second category. The results of estimations according to the sources of ambient air pollution are laid down in Table 6.3.2 below.
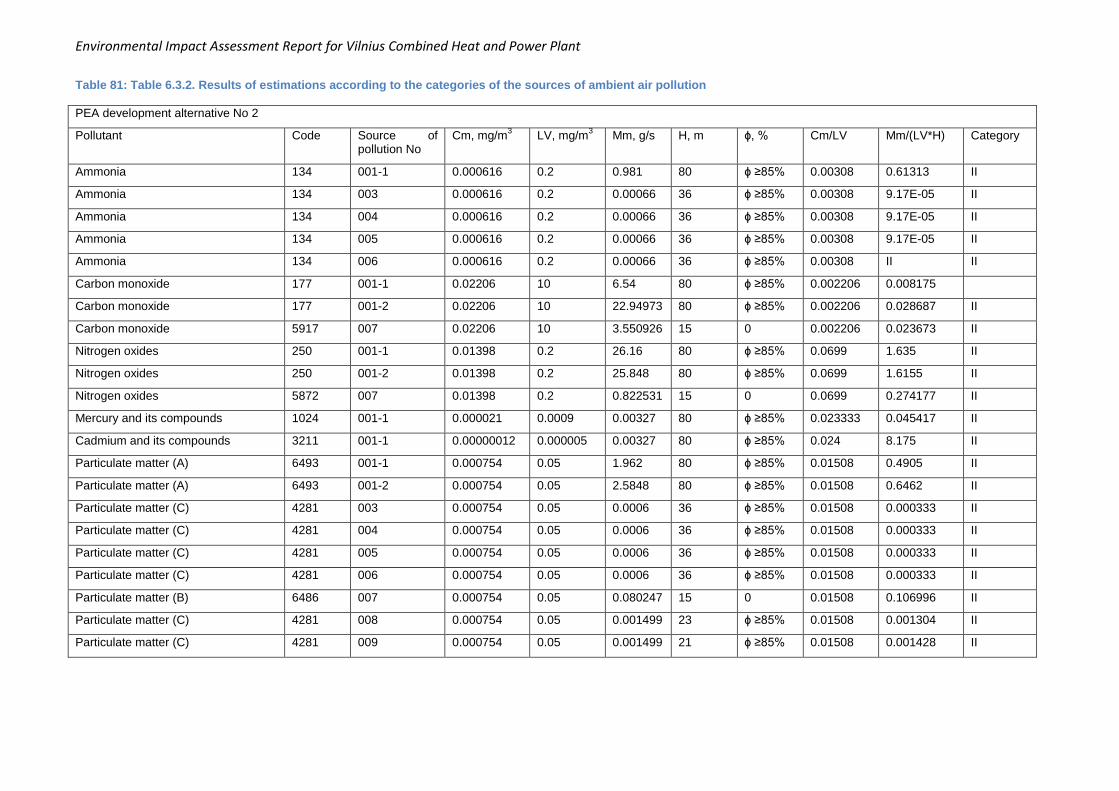
Environmental Impact Assessment Report for Vilnius Combined Heat and Power Plant
Table 81: Table 6.3.2. Results of estimations according to the categories of the sources of ambient air pollution
PEA development alternative No 2
Pollutant Code Source of pollution No
Cm, mg/m3 LV, mg/m
3 Mm, g/s H, m ɸ, % Cm/LV Mm/(LV*H) Category
Ammonia 134 001-1 0.000616 0.2 0.981 80 ɸ ≥85% 0.00308 0.61313 II
Ammonia 134 003 0.000616 0.2 0.00066 36 ɸ ≥85% 0.00308 9.17E-05 II
Ammonia 134 004 0.000616 0.2 0.00066 36 ɸ ≥85% 0.00308 9.17E-05 II
Ammonia 134 005 0.000616 0.2 0.00066 36 ɸ ≥85% 0.00308 9.17E-05 II
Ammonia 134 006 0.000616 0.2 0.00066 36 ɸ ≥85% 0.00308 II II
Carbon monoxide 177 001-1 0.02206 10 6.54 80 ɸ ≥85% 0.002206 0.008175
Carbon monoxide 177 001-2 0.02206 10 22.94973 80 ɸ ≥85% 0.002206 0.028687 II
Carbon monoxide 5917 007 0.02206 10 3.550926 15 0 0.002206 0.023673 II
Nitrogen oxides 250 001-1 0.01398 0.2 26.16 80 ɸ ≥85% 0.0699 1.635 II
Nitrogen oxides 250 001-2 0.01398 0.2 25.848 80 ɸ ≥85% 0.0699 1.6155 II
Nitrogen oxides 5872 007 0.01398 0.2 0.822531 15 0 0.0699 0.274177 II
Mercury and its compounds 1024 001-1 0.000021 0.0009 0.00327 80 ɸ ≥85% 0.023333 0.045417 II
Cadmium and its compounds 3211 001-1 0.00000012 0.000005 0.00327 80 ɸ ≥85% 0.024 8.175 II
Particulate matter (A) 6493 001-1 0.000754 0.05 1.962 80 ɸ ≥85% 0.01508 0.4905 II
Particulate matter (A) 6493 001-2 0.000754 0.05 2.5848 80 ɸ ≥85% 0.01508 0.6462 II
Particulate matter (C) 4281 003 0.000754 0.05 0.0006 36 ɸ ≥85% 0.01508 0.000333 II
Particulate matter (C) 4281 004 0.000754 0.05 0.0006 36 ɸ ≥85% 0.01508 0.000333 II
Particulate matter (C) 4281 005 0.000754 0.05 0.0006 36 ɸ ≥85% 0.01508 0.000333 II
Particulate matter (C) 4281 006 0.000754 0.05 0.0006 36 ɸ ≥85% 0.01508 0.000333 II
Particulate matter (B) 6486 007 0.000754 0.05 0.080247 15 0 0.01508 0.106996 II
Particulate matter (C) 4281 008 0.000754 0.05 0.001499 23 ɸ ≥85% 0.01508 0.001304 II
Particulate matter (C) 4281 009 0.000754 0.05 0.001499 21 ɸ ≥85% 0.01508 0.001428 II
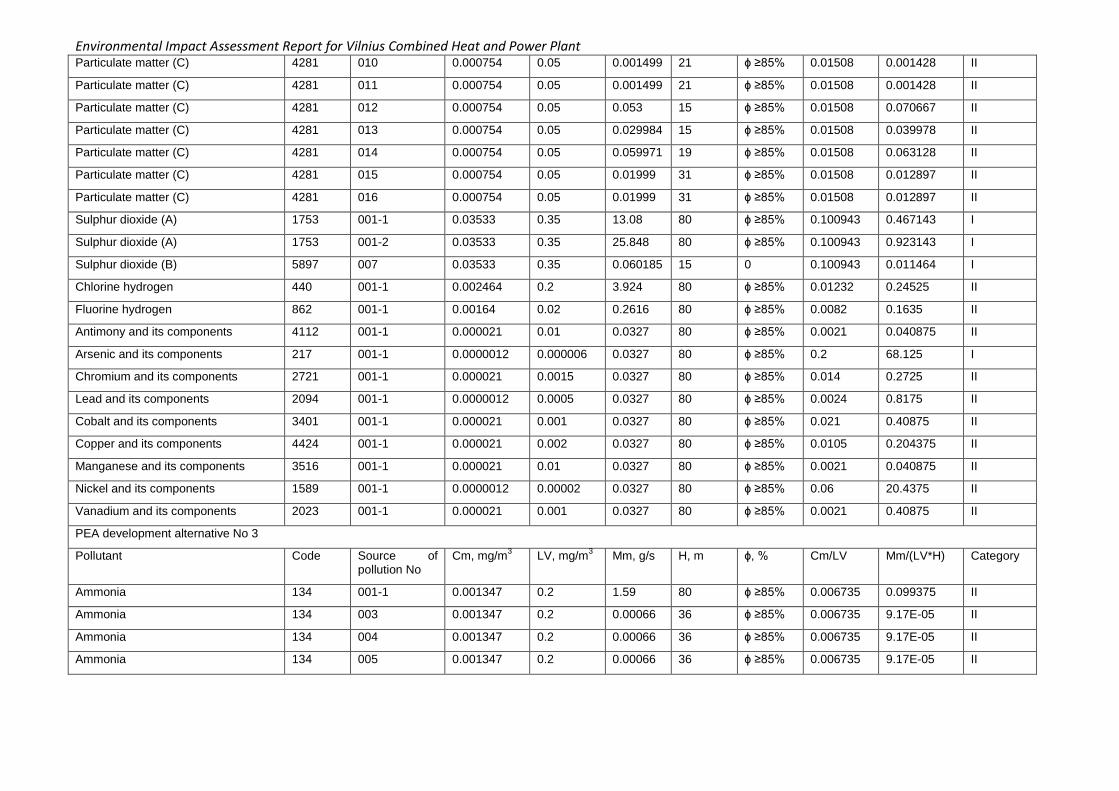
Environmental Impact Assessment Report for Vilnius Combined Heat and Power Plant Particulate matter (C) 4281 010 0.000754 0.05 0.001499 21 ɸ ≥85% 0.01508 0.001428 II
Particulate matter (C) 4281 011 0.000754 0.05 0.001499 21 ɸ ≥85% 0.01508 0.001428 II
Particulate matter (C) 4281 012 0.000754 0.05 0.053 15 ɸ ≥85% 0.01508 0.070667 II
Particulate matter (C) 4281 013 0.000754 0.05 0.029984 15 ɸ ≥85% 0.01508 0.039978 II
Particulate matter (C) 4281 014 0.000754 0.05 0.059971 19 ɸ ≥85% 0.01508 0.063128 II
Particulate matter (C) 4281 015 0.000754 0.05 0.01999 31 ɸ ≥85% 0.01508 0.012897 II
Particulate matter (C) 4281 016 0.000754 0.05 0.01999 31 ɸ ≥85% 0.01508 0.012897 II
Sulphur dioxide (A) 1753 001-1 0.03533 0.35 13.08 80 ɸ ≥85% 0.100943 0.467143 I
Sulphur dioxide (A) 1753 001-2 0.03533 0.35 25.848 80 ɸ ≥85% 0.100943 0.923143 I
Sulphur dioxide (B) 5897 007 0.03533 0.35 0.060185 15 0 0.100943 0.011464 I
Chlorine hydrogen 440 001-1 0.002464 0.2 3.924 80 ɸ ≥85% 0.01232 0.24525 II
Fluorine hydrogen 862 001-1 0.00164 0.02 0.2616 80 ɸ ≥85% 0.0082 0.1635 II
Antimony and its components 4112 001-1 0.000021 0.01 0.0327 80 ɸ ≥85% 0.0021 0.040875 II
Arsenic and its components 217 001-1 0.0000012 0.000006 0.0327 80 ɸ ≥85% 0.2 68.125 I
Chromium and its components 2721 001-1 0.000021 0.0015 0.0327 80 ɸ ≥85% 0.014 0.2725 II
Lead and its components 2094 001-1 0.0000012 0.0005 0.0327 80 ɸ ≥85% 0.0024 0.8175 II
Cobalt and its components 3401 001-1 0.000021 0.001 0.0327 80 ɸ ≥85% 0.021 0.40875 II
Copper and its components 4424 001-1 0.000021 0.002 0.0327 80 ɸ ≥85% 0.0105 0.204375 II
Manganese and its components 3516 001-1 0.000021 0.01 0.0327 80 ɸ ≥85% 0.0021 0.040875 II
Nickel and its components 1589 001-1 0.0000012 0.00002 0.0327 80 ɸ ≥85% 0.06 20.4375 II
Vanadium and its components 2023 001-1 0.000021 0.001 0.0327 80 ɸ ≥85% 0.0021 0.40875 II
PEA development alternative No 3
Pollutant Code Source of pollution No
Cm, mg/m3 LV, mg/m
3 Mm, g/s H, m ɸ, % Cm/LV Mm/(LV*H) Category
Ammonia 134 001-1 0.001347 0.2 1.59 80 ɸ ≥85% 0.006735 0.099375 II
Ammonia 134 003 0.001347 0.2 0.00066 36 ɸ ≥85% 0.006735 9.17E-05 II
Ammonia 134 004 0.001347 0.2 0.00066 36 ɸ ≥85% 0.006735 9.17E-05 II
Ammonia 134 005 0.001347 0.2 0.00066 36 ɸ ≥85% 0.006735 9.17E-05 II
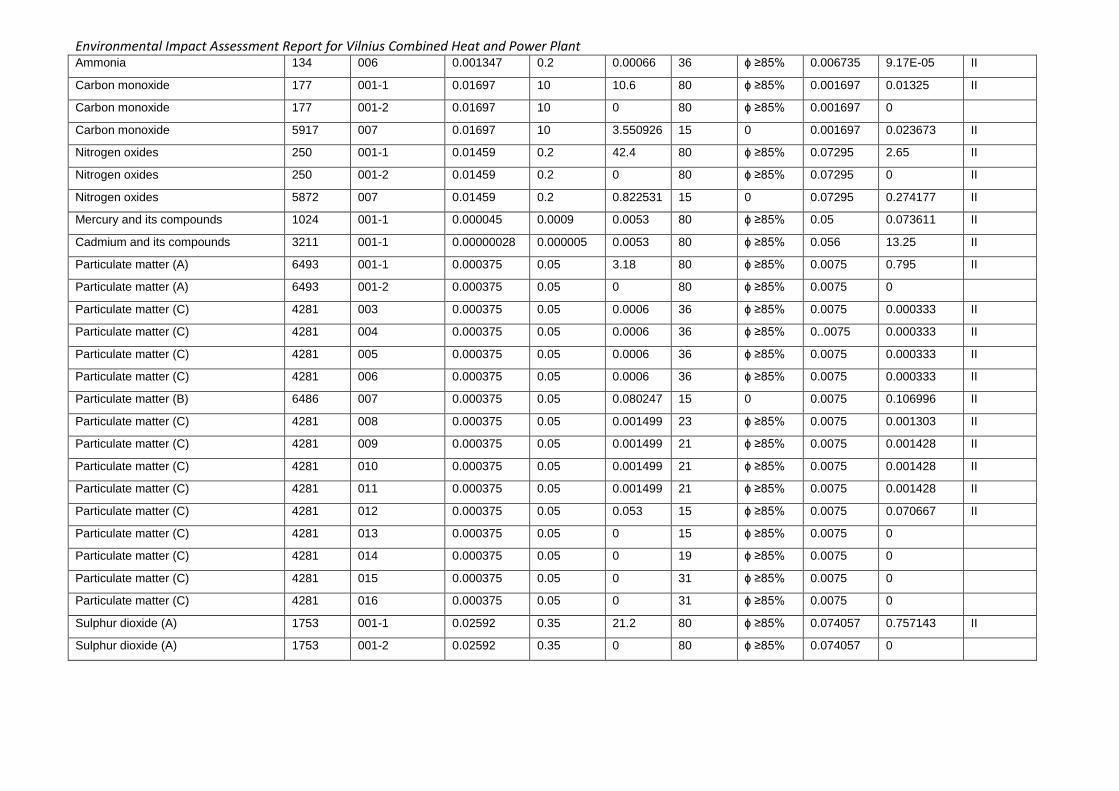
Environmental Impact Assessment Report for Vilnius Combined Heat and Power Plant Ammonia 134 006 0.001347 0.2 0.00066 36 ɸ ≥85% 0.006735 9.17E-05 II
Carbon monoxide 177 001-1 0.01697 10 10.6 80 ɸ ≥85% 0.001697 0.01325 II
Carbon monoxide 177 001-2 0.01697 10 0 80 ɸ ≥85% 0.001697 0
Carbon monoxide 5917 007 0.01697 10 3.550926 15 0 0.001697 0.023673 II
Nitrogen oxides 250 001-1 0.01459 0.2 42.4 80 ɸ ≥85% 0.07295 2.65 II
Nitrogen oxides 250 001-2 0.01459 0.2 0 80 ɸ ≥85% 0.07295 0 II
Nitrogen oxides 5872 007 0.01459 0.2 0.822531 15 0 0.07295 0.274177 II
Mercury and its compounds 1024 001-1 0.000045 0.0009 0.0053 80 ɸ ≥85% 0.05 0.073611 II
Cadmium and its compounds 3211 001-1 0.00000028 0.000005 0.0053 80 ɸ ≥85% 0.056 13.25 II
Particulate matter (A) 6493 001-1 0.000375 0.05 3.18 80 ɸ ≥85% 0.0075 0.795 II
Particulate matter (A) 6493 001-2 0.000375 0.05 0 80 ɸ ≥85% 0.0075 0
Particulate matter (C) 4281 003 0.000375 0.05 0.0006 36 ɸ ≥85% 0.0075 0.000333 II
Particulate matter (C) 4281 004 0.000375 0.05 0.0006 36 ɸ ≥85% 0..0075 0.000333 II
Particulate matter (C) 4281 005 0.000375 0.05 0.0006 36 ɸ ≥85% 0.0075 0.000333 II
Particulate matter (C) 4281 006 0.000375 0.05 0.0006 36 ɸ ≥85% 0.0075 0.000333 II
Particulate matter (B) 6486 007 0.000375 0.05 0.080247 15 0 0.0075 0.106996 II
Particulate matter (C) 4281 008 0.000375 0.05 0.001499 23 ɸ ≥85% 0.0075 0.001303 II
Particulate matter (C) 4281 009 0.000375 0.05 0.001499 21 ɸ ≥85% 0.0075 0.001428 II
Particulate matter (C) 4281 010 0.000375 0.05 0.001499 21 ɸ ≥85% 0.0075 0.001428 II
Particulate matter (C) 4281 011 0.000375 0.05 0.001499 21 ɸ ≥85% 0.0075 0.001428 II
Particulate matter (C) 4281 012 0.000375 0.05 0.053 15 ɸ ≥85% 0.0075 0.070667 II
Particulate matter (C) 4281 013 0.000375 0.05 0 15 ɸ ≥85% 0.0075 0
Particulate matter (C) 4281 014 0.000375 0.05 0 19 ɸ ≥85% 0.0075 0
Particulate matter (C) 4281 015 0.000375 0.05 0 31 ɸ ≥85% 0.0075 0
Particulate matter (C) 4281 016 0.000375 0.05 0 31 ɸ ≥85% 0.0075 0
Sulphur dioxide (A) 1753 001-1 0.02592 0.35 21.2 80 ɸ ≥85% 0.074057 0.757143 II
Sulphur dioxide (A) 1753 001-2 0.02592 0.35 0 80 ɸ ≥85% 0.074057 0
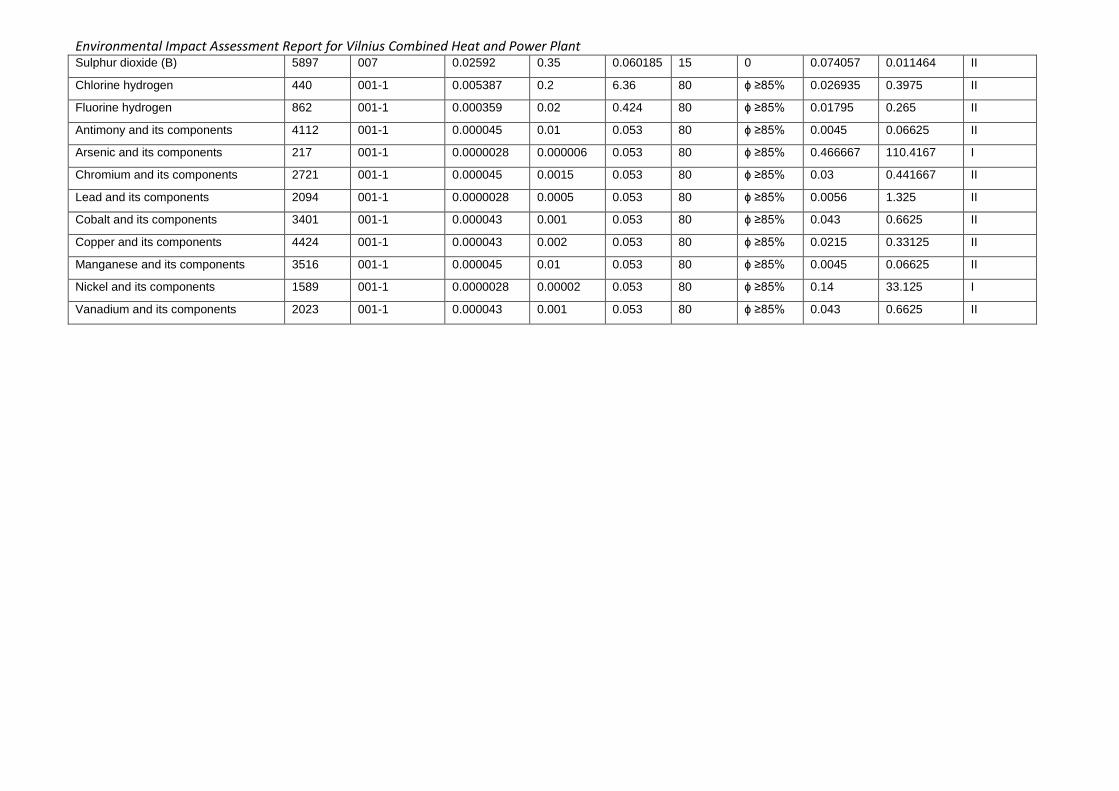
Environmental Impact Assessment Report for Vilnius Combined Heat and Power Plant Sulphur dioxide (B) 5897 007 0.02592 0.35 0.060185 15 0 0.074057 0.011464 II
Chlorine hydrogen 440 001-1 0.005387 0.2 6.36 80 ɸ ≥85% 0.026935 0.3975 II
Fluorine hydrogen 862 001-1 0.000359 0.02 0.424 80 ɸ ≥85% 0.01795 0.265 II
Antimony and its components 4112 001-1 0.000045 0.01 0.053 80 ɸ ≥85% 0.0045 0.06625 II
Arsenic and its components 217 001-1 0.0000028 0.000006 0.053 80 ɸ ≥85% 0.466667 110.4167 I
Chromium and its components 2721 001-1 0.000045 0.0015 0.053 80 ɸ ≥85% 0.03 0.441667 II
Lead and its components 2094 001-1 0.0000028 0.0005 0.053 80 ɸ ≥85% 0.0056 1.325 II
Cobalt and its components 3401 001-1 0.000043 0.001 0.053 80 ɸ ≥85% 0.043 0.6625 II
Copper and its components 4424 001-1 0.000043 0.002 0.053 80 ɸ ≥85% 0.0215 0.33125 II
Manganese and its components 3516 001-1 0.000045 0.01 0.053 80 ɸ ≥85% 0.0045 0.06625 II
Nickel and its components 1589 001-1 0.0000028 0.00002 0.053 80 ɸ ≥85% 0.14 33.125 I
Vanadium and its components 2023 001-1 0.000043 0.001 0.053 80 ɸ ≥85% 0.043 0.6625 II
Environmental Impact Assessment Report for Vilnius Combined Heat and Power Plant
6.3.1.3. Frequency of Monitoring Measurements
Following Paragraph 6 of Annex 1 to the Environmental Monitoring Regulations, monitoring of pollution emissions from the source of pollution which, according to the pollutant, fall within the first category, is conducted 4 times a year, evenly distributed over the year, with sufficient number of measurements and/or sampling.
Pursuant to Paragraph 7 of Annex 1 to the Environmental Monitoring Regulations, monitoring of pollution emissions from the source of pollution which, according to the pollutant, fall within the second category, is conducted at least once a year.
According to Paragraph 48 of the Environmental Requirements for Waste Incineration, measurements of NOx, CO, total dust, total organic carbon (hereinafter referred to as the “TOC”), HCI, HF, SO2 must be carried out on a continuous basis; measurements of heavy metals, dioxins and furans must be carried out at least two times a year. During the first 12 months of operation of incineration or co-incineration plant, measurements of heavy metals, dioxins and furans must be carried out at least once in 3 months. The plan for monitoring of stationary sources of ambient air pollution is laid down in Table 6.3.3 below.
Following Annex 3 to Order No D1-240 of the Minister of Environment of the Republic of Lithuania of 10 April 2013 “On Amending Order No 486 of the Minister of Environment of 28 September 2001 “On the Determination of the Limits of Pollution Emissions from Large Combustion Plants and the Limits of Pollution Emissions from Combustion Plants in LAND 43-2001””, the concentration of sulphur dioxide (hereinafter referred to as the “SO2”), nitrogen oxides (hereinafter referred to as the “NOx) and particular matter in the waste gas emitted from each combustion plant the rated thermal output of which is 100 MW or higher and carbon monoxide (hereinafter referred to as the “CO”) from the gaseous fuel combustion plants is measured on a continuous basis.
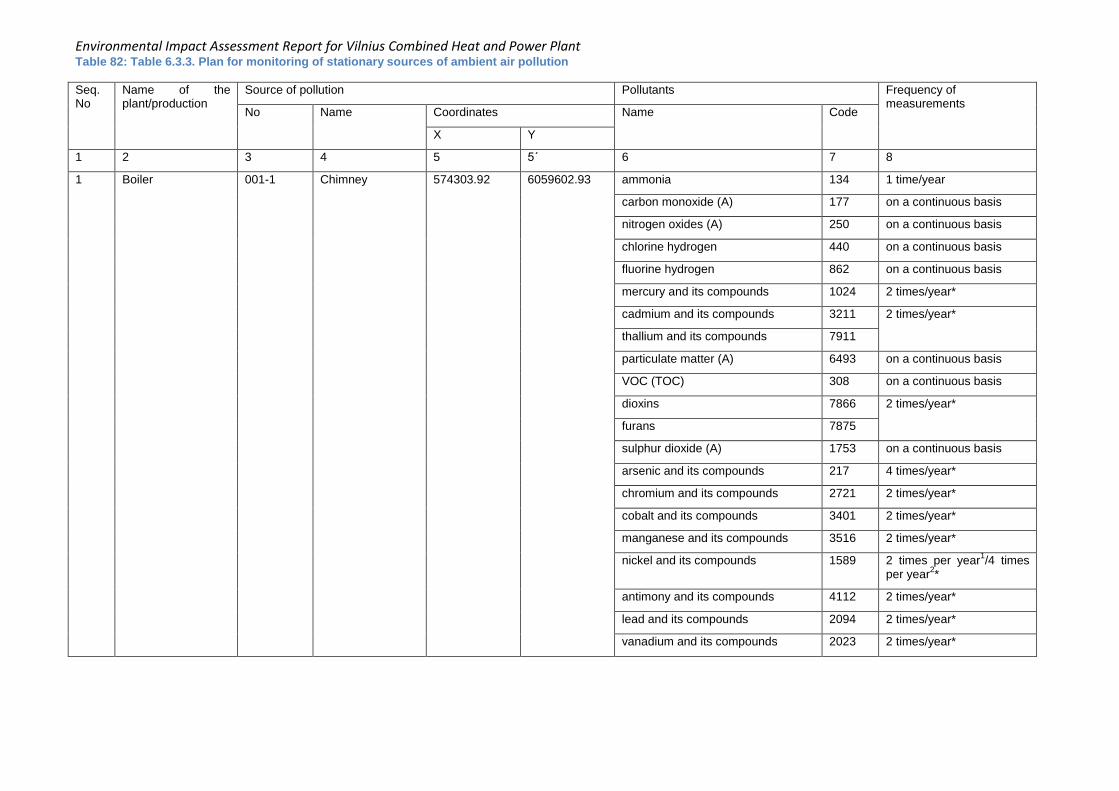
Environmental Impact Assessment Report for Vilnius Combined Heat and Power Plant Table 82: Table 6.3.3. Plan for monitoring of stationary sources of ambient air pollution
Seq. No
Name of the plant/production
Source of pollution Pollutants Frequency of measurements
No Name Coordinates Name Code
X Y
1 2 3 4 5 5´ 6 7 8
1 Boiler 001-1 Chimney 574303.92 6059602.93 ammonia 134 1 time/year
carbon monoxide (A) 177 on a continuous basis
nitrogen oxides (A) 250 on a continuous basis
chlorine hydrogen 440 on a continuous basis
fluorine hydrogen 862 on a continuous basis
mercury and its compounds 1024 2 times/year*
cadmium and its compounds 3211 2 times/year*
thallium and its compounds 7911
particulate matter (A) 6493 on a continuous basis
VOC (TOC) 308 on a continuous basis
dioxins 7866 2 times/year*
furans 7875
sulphur dioxide (A) 1753 on a continuous basis
arsenic and its compounds 217 4 times/year*
chromium and its compounds 2721 2 times/year*
cobalt and its compounds 3401 2 times/year*
manganese and its compounds 3516 2 times/year*
nickel and its compounds 1589 2 times per year1/4 times
per year2*
antimony and its compounds 4112 2 times/year*
lead and its compounds 2094 2 times/year*
vanadium and its compounds 2023 2 times/year*

Environmental Impact Assessment Report for Vilnius Combined Heat and Power Plant copper and its compounds 4424 2 times/year*
2. Boiler 001-2 Chimney 574303.92 6059602.93 carbon monoxide (A) 177 once per year
nitrogen oxides (A) 250 on a continuous basis
particulate matter (A) 6493 on a continuous basis
Sulphur dioxide (A) 1753 on a continuous basis
3. Combined heat and power plant
003 Fuel bunker of the waste incineration plant
574193.95 6059621.68 ammonia 134 once per year
particulate matter (C) 4281 once per year
004 Fuel bunker of the waste incineration plant
57419.29 6059611.46 ammonia 134 once per year
particulate matter (C) 4281 once per year
005 Fuel bunker of the waste incineration plant
574193.29 6059601.69 ammonia 134 once per year
particulate matter (C) 4281 once per year
006 Fuel bunker of the waste incineration plant
574193.51 6059590.14 ammonia 134 once per year
particulate matter (C) 4281 once per year
007 Power generator 574307.03 6059646.34 carbon monoxide (B) 5917 1 time/year
nitrogen oxides (B) 5872 1 time/year
particulate matter (B) 6486 1 time/year
sulphur dioxide (B) 5897 4 times per year1/1 time
per year2
008 Activated carbon bunker
574285.92 6059584.89 particulate matter (C) 4281 1 time/year
009 Activated carbon bunker
574285.92 6059584.89 particulate matter (C) 4281 1 time/year
010 Quick lime bunker 574285.92 6059584.89 particulate matter (C) 4281 1 time/year
011 Slaked lime bunker
574285.92 6059584.89 particulate matter (C) 4281 1 time/year
012 Bottom ash facility 574179.92 6059560.45 particulate matter (C) 4281 1 time/year
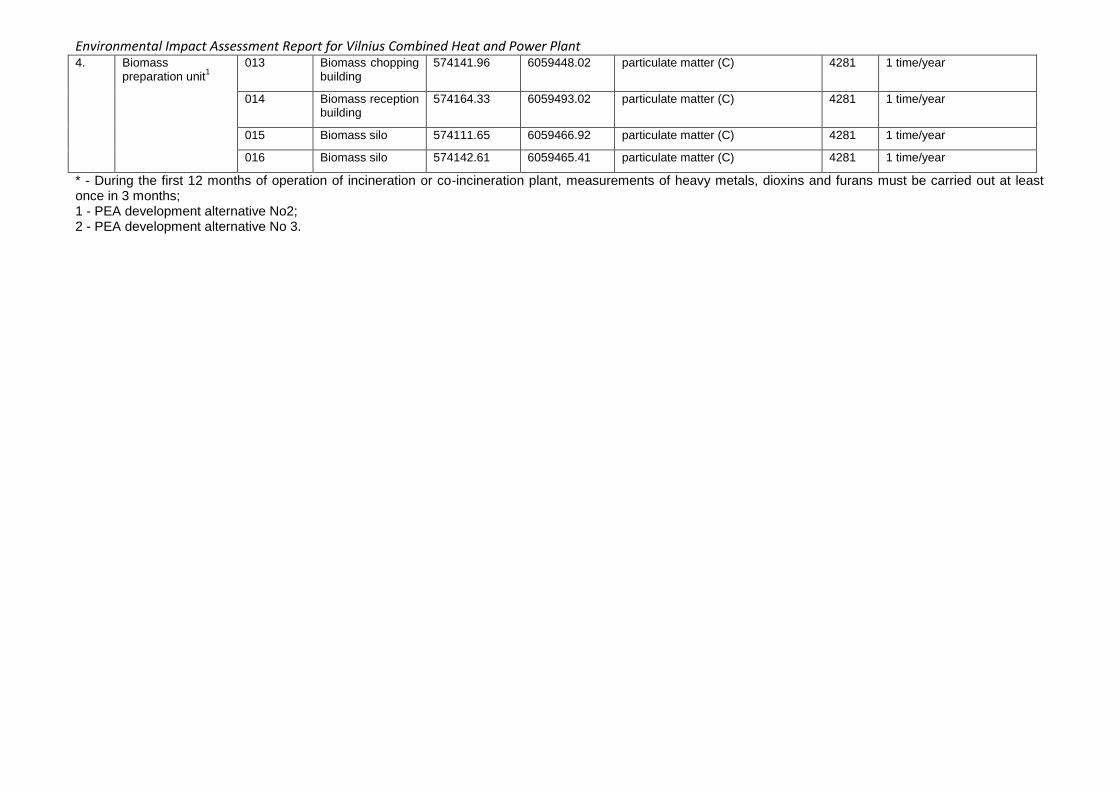
Environmental Impact Assessment Report for Vilnius Combined Heat and Power Plant 4. Biomass
preparation unit1
013 Biomass chopping building
574141.96 6059448.02 particulate matter (C) 4281 1 time/year
014 Biomass reception building
574164.33 6059493.02 particulate matter (C) 4281 1 time/year
015 Biomass silo 574111.65 6059466.92 particulate matter (C) 4281 1 time/year
016 Biomass silo 574142.61 6059465.41 particulate matter (C) 4281 1 time/year
* - During the first 12 months of operation of incineration or co-incineration plant, measurements of heavy metals, dioxins and furans must be carried out at least once in 3 months; 1 - PEA development alternative No2; 2 - PEA development alternative No 3.
Environmental Impact Assessment Report for Vilnius Combined Heat and Power Plant
6.3.2 Monitoring of Effluent
6.3.2.1. Monitoring of Industrial Effluent Industrial effluent from Vilnius Combined Heat and Power Plant shall generate through demineralisation of water in the water preparation unit and from the condensing economiser. It is planned that the following content of effluent shall generate from the water preparation unit depending on the activity alternatives in question:
- 205.87 m3/d effluent in case of the PEA development alternative No 2;
- 88.39 m3/d effluent in case of the PEA development alternative No 3.
It is projected that the following content of effluent shall generate from the condensing economiser depending on the activity alternatives in question:
- 1611.78 m3/d effluent in case of the PEA development alternative No 2;
- 378.77 m3/d effluent in case of the PEA development alternative No 3.
Vilnius Combined Heat and Power Plant shall discharge more than 50 m3 industrial effluent to the drainage
system per day; therefore, according to the Environmental Monitoring Regulations, the operator shall be obliged to conduct monitoring of the discharged industrial effluent.
In case of the PEA development alternative No 2, more than 500 m3/d effluent shall generate, thus,
according to the Regulations of Environmental Monitoring of Economic Entities, the minimum annual frequency of taking samples in the discharged effluent must be once per month.
In case of the PEA development alternative No 3, up to 500 m3/d effluent shall generate, thus, according to
the Regulations of Environmental Monitoring of Economic Entities, the minimum annual frequency of taking samples in the discharged effluent must be once per quarter.
The following pollutants are to be monitored in the effluent: BOD7, petroleum products and materials in suspension.
6.3.2.2. Monitoring of Surface Wastewater The preliminary amount of surface (rainwater) wastewater in Vilnius Combined Heat and Power Plant collected from asphalt sites and hard coverings shall be approximately 95.18 m
3/day in case of the PEA
development alternative No 2 and 33.04 m3/day in case of the PEA development alternative No 3. The
preliminary amount of surface wastewater from roofs shall be approximately 25.15 m3/day in case of the PEA
development alternative No 2 and 17.79 m3/day in case of the PEA development alternative No 3.
According to the Regulations of Environmental Monitoring, the operator shall be obliged to conduct monitoring of discharged surface wastewater, since the generated amount of surface wastewater exceeds 50 m
3/d.
The minimum annual frequency of wastewater sampling is once per quarter, i.e. 4 times per year. Sampling before and after wastewater treatment is planned.
Monitoring of the following pollutants has been projected: BOD7, petroleum products and materials in suspension.
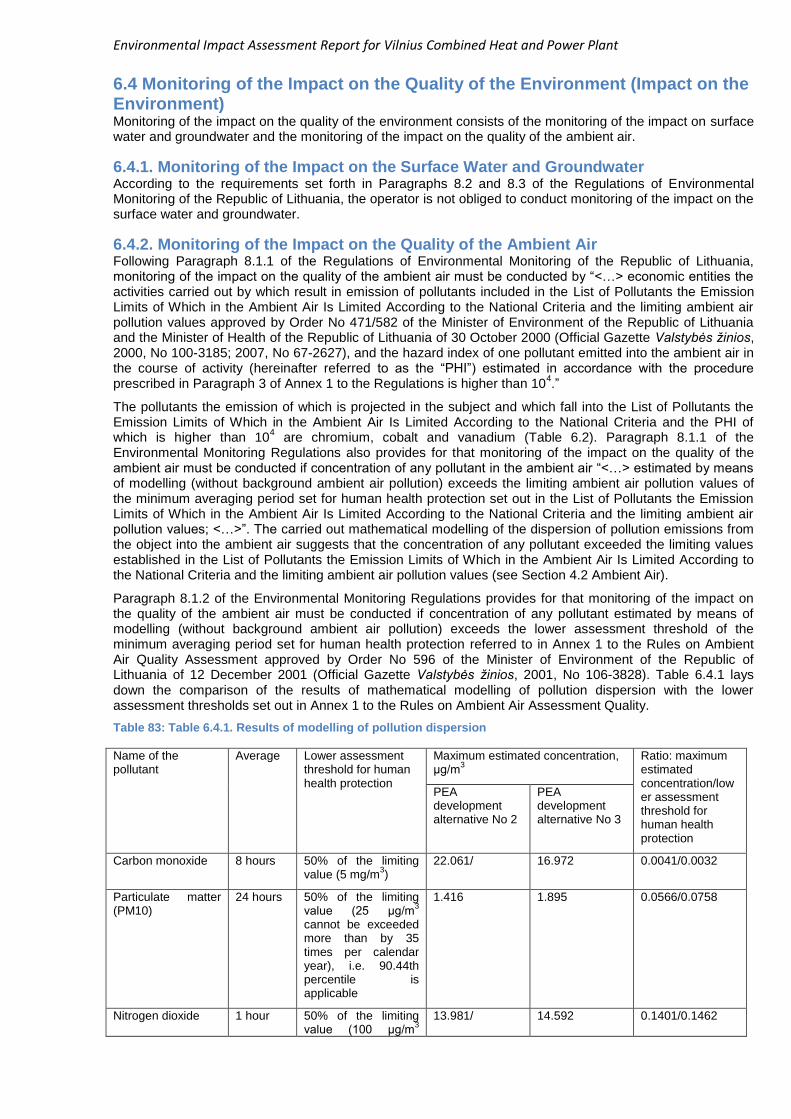
Environmental Impact Assessment Report for Vilnius Combined Heat and Power Plant
6.4 Monitoring of the Impact on the Quality of the Environment (Impact on the Environment) Monitoring of the impact on the quality of the environment consists of the monitoring of the impact on surface water and groundwater and the monitoring of the impact on the quality of the ambient air.
6.4.1. Monitoring of the Impact on the Surface Water and Groundwater According to the requirements set forth in Paragraphs 8.2 and 8.3 of the Regulations of Environmental Monitoring of the Republic of Lithuania, the operator is not obliged to conduct monitoring of the impact on the surface water and groundwater.
6.4.2. Monitoring of the Impact on the Quality of the Ambient Air Following Paragraph 8.1.1 of the Regulations of Environmental Monitoring of the Republic of Lithuania, monitoring of the impact on the quality of the ambient air must be conducted by “<…> economic entities the activities carried out by which result in emission of pollutants included in the List of Pollutants the Emission Limits of Which in the Ambient Air Is Limited According to the National Criteria and the limiting ambient air pollution values approved by Order No 471/582 of the Minister of Environment of the Republic of Lithuania and the Minister of Health of the Republic of Lithuania of 30 October 2000 (Official Gazette Valstybės žinios, 2000, No 100-3185; 2007, No 67-2627), and the hazard index of one pollutant emitted into the ambient air in the course of activity (hereinafter referred to as the “PHI”) estimated in accordance with the procedure prescribed in Paragraph 3 of Annex 1 to the Regulations is higher than 10
4.”
The pollutants the emission of which is projected in the subject and which fall into the List of Pollutants the Emission Limits of Which in the Ambient Air Is Limited According to the National Criteria and the PHI of which is higher than 10
4 are chromium, cobalt and vanadium (Table 6.2). Paragraph 8.1.1 of the
Environmental Monitoring Regulations also provides for that monitoring of the impact on the quality of the ambient air must be conducted if concentration of any pollutant in the ambient air “<…> estimated by means of modelling (without background ambient air pollution) exceeds the limiting ambient air pollution values of the minimum averaging period set for human health protection set out in the List of Pollutants the Emission Limits of Which in the Ambient Air Is Limited According to the National Criteria and the limiting ambient air pollution values; <…>”. The carried out mathematical modelling of the dispersion of pollution emissions from the object into the ambient air suggests that the concentration of any pollutant exceeded the limiting values established in the List of Pollutants the Emission Limits of Which in the Ambient Air Is Limited According to the National Criteria and the limiting ambient air pollution values (see Section 4.2 Ambient Air).
Paragraph 8.1.2 of the Environmental Monitoring Regulations provides for that monitoring of the impact on the quality of the ambient air must be conducted if concentration of any pollutant estimated by means of modelling (without background ambient air pollution) exceeds the lower assessment threshold of the minimum averaging period set for human health protection referred to in Annex 1 to the Rules on Ambient Air Quality Assessment approved by Order No 596 of the Minister of Environment of the Republic of Lithuania of 12 December 2001 (Official Gazette Valstybės žinios, 2001, No 106-3828). Table 6.4.1 lays down the comparison of the results of mathematical modelling of pollution dispersion with the lower assessment thresholds set out in Annex 1 to the Rules on Ambient Air Assessment Quality.
Table 83: Table 6.4.1. Results of modelling of pollution dispersion
Name of the pollutant
Average Lower assessment threshold for human health protection
Maximum estimated concentration, µg/m
3
Ratio: maximum estimated concentration/lower assessment threshold for human health protection
PEA development alternative No 2
PEA development alternative No 3
Carbon monoxide 8 hours 50% of the limiting value (5 mg/m
3)
22.061/ 16.972 0.0041/0.0032
Particulate matter (PM10)
24 hours 50% of the limiting value (25 µg/m
3
cannot be exceeded more than by 35 times per calendar year), i.e. 90.44th percentile is applicable
1.416 1.895 0.0566/0.0758
Nitrogen dioxide 1 hour 50% of the limiting value (100 µg/m
3
13.981/ 14.592 0.1401/0.1462
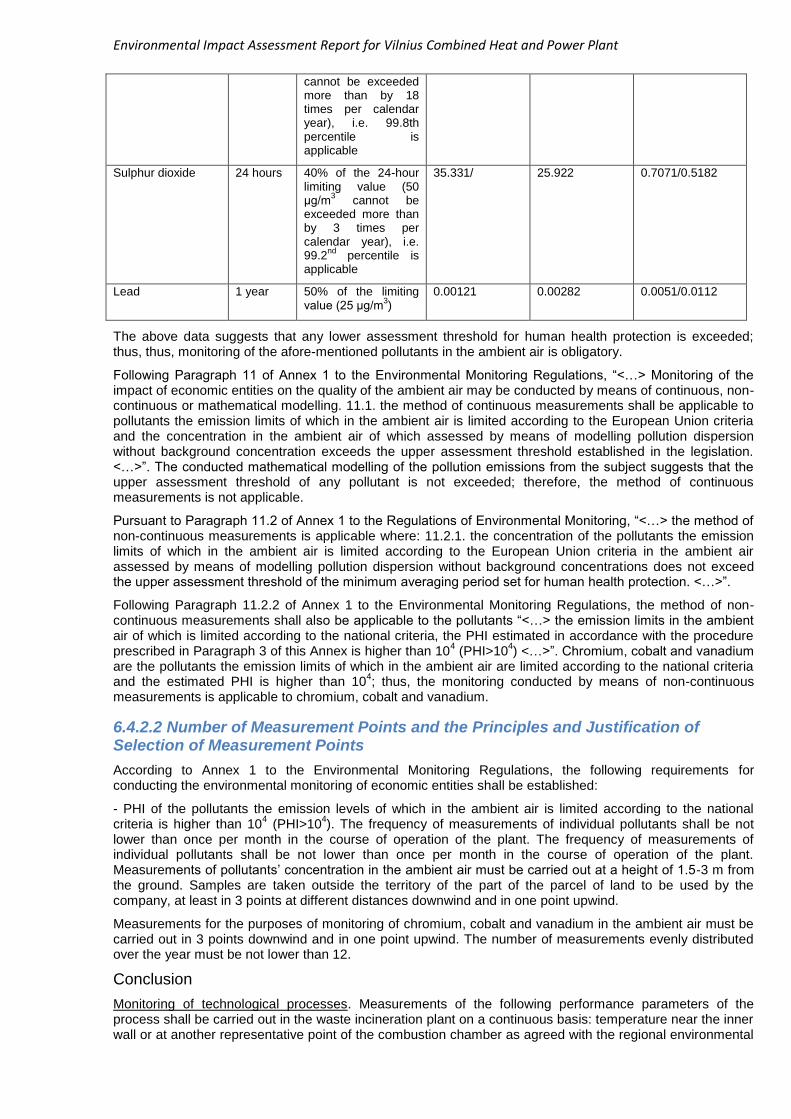
Environmental Impact Assessment Report for Vilnius Combined Heat and Power Plant
cannot be exceeded more than by 18 times per calendar year), i.e. 99.8th percentile is applicable
Sulphur dioxide 24 hours 40% of the 24-hour limiting value (50 µg/m
3 cannot be
exceeded more than by 3 times per calendar year), i.e. 99.2
nd percentile is
applicable
35.331/ 25.922 0.7071/0.5182
Lead 1 year 50% of the limiting value (25 µg/m
3)
0.00121 0.00282 0.0051/0.0112
The above data suggests that any lower assessment threshold for human health protection is exceeded; thus, thus, monitoring of the afore-mentioned pollutants in the ambient air is obligatory.
Following Paragraph 11 of Annex 1 to the Environmental Monitoring Regulations, “<…> Monitoring of the impact of economic entities on the quality of the ambient air may be conducted by means of continuous, non-continuous or mathematical modelling. 11.1. the method of continuous measurements shall be applicable to pollutants the emission limits of which in the ambient air is limited according to the European Union criteria and the concentration in the ambient air of which assessed by means of modelling pollution dispersion without background concentration exceeds the upper assessment threshold established in the legislation. <…>”. The conducted mathematical modelling of the pollution emissions from the subject suggests that the upper assessment threshold of any pollutant is not exceeded; therefore, the method of continuous measurements is not applicable.
Pursuant to Paragraph 11.2 of Annex 1 to the Regulations of Environmental Monitoring, “<…> the method of non-continuous measurements is applicable where: 11.2.1. the concentration of the pollutants the emission limits of which in the ambient air is limited according to the European Union criteria in the ambient air assessed by means of modelling pollution dispersion without background concentrations does not exceed the upper assessment threshold of the minimum averaging period set for human health protection. <…>”.
Following Paragraph 11.2.2 of Annex 1 to the Environmental Monitoring Regulations, the method of non-continuous measurements shall also be applicable to the pollutants “<…> the emission limits in the ambient air of which is limited according to the national criteria, the PHI estimated in accordance with the procedure prescribed in Paragraph 3 of this Annex is higher than 10
4 (PHI>10
4) <…>”. Chromium, cobalt and vanadium
are the pollutants the emission limits of which in the ambient air are limited according to the national criteria and the estimated PHI is higher than 10
4; thus, the monitoring conducted by means of non-continuous
measurements is applicable to chromium, cobalt and vanadium.
6.4.2.2 Number of Measurement Points and the Principles and Justification of Selection of Measurement Points
According to Annex 1 to the Environmental Monitoring Regulations, the following requirements for conducting the environmental monitoring of economic entities shall be established:
- PHI of the pollutants the emission levels of which in the ambient air is limited according to the national criteria is higher than 10
4 (PHI>10
4). The frequency of measurements of individual pollutants shall be not
lower than once per month in the course of operation of the plant. The frequency of measurements of individual pollutants shall be not lower than once per month in the course of operation of the plant. Measurements of pollutants’ concentration in the ambient air must be carried out at a height of 1.5-3 m from the ground. Samples are taken outside the territory of the part of the parcel of land to be used by the company, at least in 3 points at different distances downwind and in one point upwind.
Measurements for the purposes of monitoring of chromium, cobalt and vanadium in the ambient air must be carried out in 3 points downwind and in one point upwind. The number of measurements evenly distributed over the year must be not lower than 12.
Conclusion
Monitoring of technological processes. Measurements of the following performance parameters of the process shall be carried out in the waste incineration plant on a continuous basis: temperature near the inner wall or at another representative point of the combustion chamber as agreed with the regional environmental
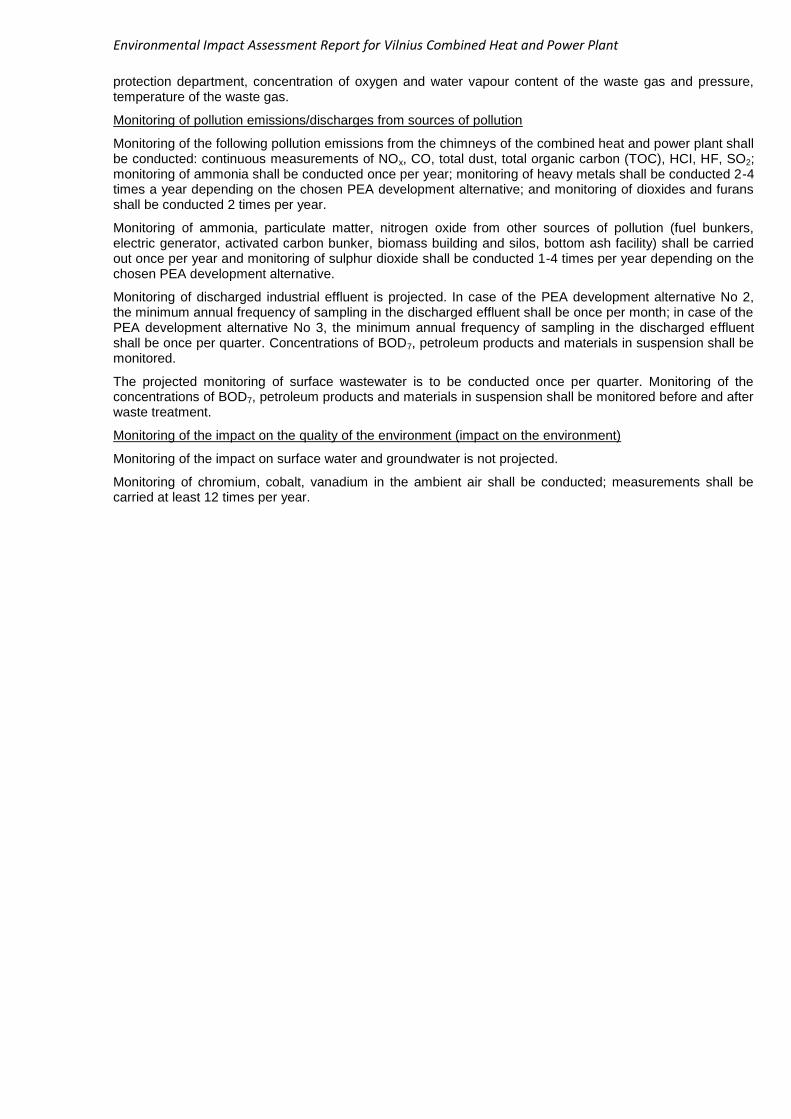
Environmental Impact Assessment Report for Vilnius Combined Heat and Power Plant
protection department, concentration of oxygen and water vapour content of the waste gas and pressure, temperature of the waste gas.
Monitoring of pollution emissions/discharges from sources of pollution
Monitoring of the following pollution emissions from the chimneys of the combined heat and power plant shall be conducted: continuous measurements of NOx, CO, total dust, total organic carbon (TOC), HCI, HF, SO2; monitoring of ammonia shall be conducted once per year; monitoring of heavy metals shall be conducted 2-4 times a year depending on the chosen PEA development alternative; and monitoring of dioxides and furans shall be conducted 2 times per year.
Monitoring of ammonia, particulate matter, nitrogen oxide from other sources of pollution (fuel bunkers, electric generator, activated carbon bunker, biomass building and silos, bottom ash facility) shall be carried out once per year and monitoring of sulphur dioxide shall be conducted 1-4 times per year depending on the chosen PEA development alternative.
Monitoring of discharged industrial effluent is projected. In case of the PEA development alternative No 2, the minimum annual frequency of sampling in the discharged effluent shall be once per month; in case of the PEA development alternative No 3, the minimum annual frequency of sampling in the discharged effluent shall be once per quarter. Concentrations of BOD7, petroleum products and materials in suspension shall be monitored.
The projected monitoring of surface wastewater is to be conducted once per quarter. Monitoring of the concentrations of BOD7, petroleum products and materials in suspension shall be monitored before and after waste treatment.
Monitoring of the impact on the quality of the environment (impact on the environment)
Monitoring of the impact on surface water and groundwater is not projected.
Monitoring of chromium, cobalt, vanadium in the ambient air shall be conducted; measurements shall be carried at least 12 times per year.
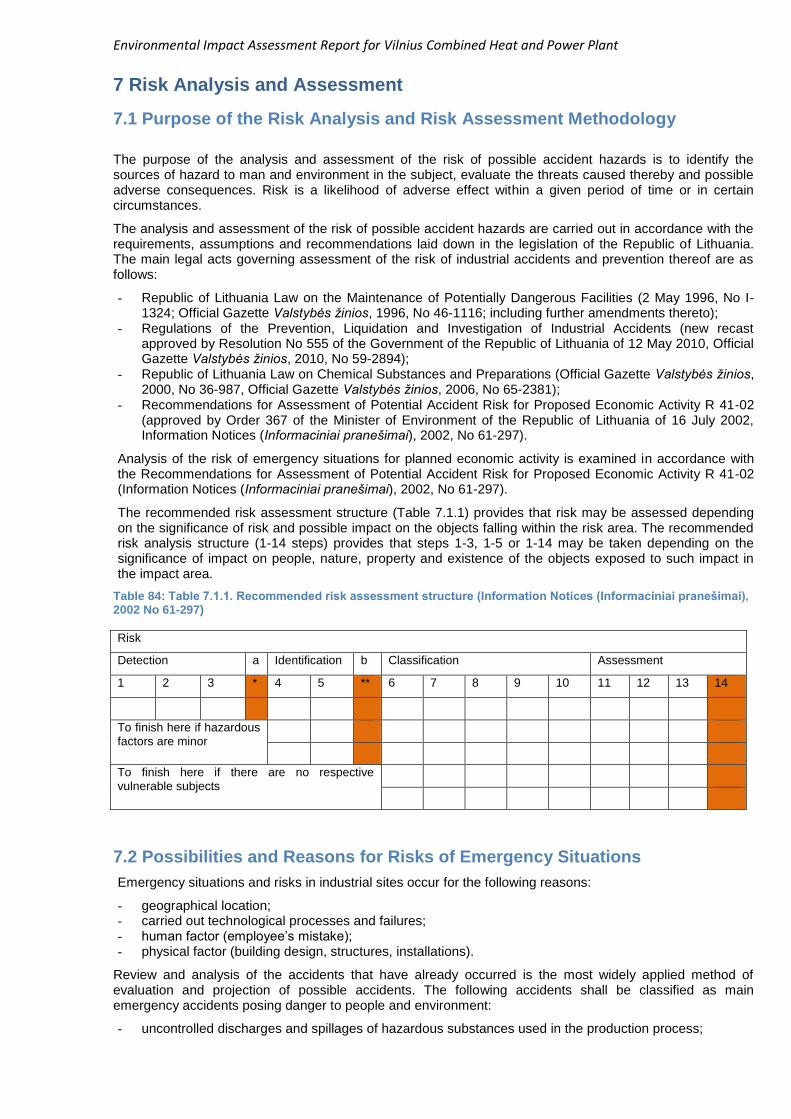
Environmental Impact Assessment Report for Vilnius Combined Heat and Power Plant
7 Risk Analysis and Assessment
7.1 Purpose of the Risk Analysis and Risk Assessment Methodology
The purpose of the analysis and assessment of the risk of possible accident hazards is to identify the sources of hazard to man and environment in the subject, evaluate the threats caused thereby and possible adverse consequences. Risk is a likelihood of adverse effect within a given period of time or in certain circumstances.
The analysis and assessment of the risk of possible accident hazards are carried out in accordance with the requirements, assumptions and recommendations laid down in the legislation of the Republic of Lithuania. The main legal acts governing assessment of the risk of industrial accidents and prevention thereof are as follows:
- Republic of Lithuania Law on the Maintenance of Potentially Dangerous Facilities (2 May 1996, No I-1324; Official Gazette Valstybės žinios, 1996, No 46-1116; including further amendments thereto);
- Regulations of the Prevention, Liquidation and Investigation of Industrial Accidents (new recast approved by Resolution No 555 of the Government of the Republic of Lithuania of 12 May 2010, Official Gazette Valstybės žinios, 2010, No 59-2894);
- Republic of Lithuania Law on Chemical Substances and Preparations (Official Gazette Valstybės žinios, 2000, No 36-987, Official Gazette Valstybės žinios, 2006, No 65-2381);
- Recommendations for Assessment of Potential Accident Risk for Proposed Economic Activity R 41-02 (approved by Order 367 of the Minister of Environment of the Republic of Lithuania of 16 July 2002, Information Notices (Informaciniai pranešimai), 2002, No 61-297).
Analysis of the risk of emergency situations for planned economic activity is examined in accordance with the Recommendations for Assessment of Potential Accident Risk for Proposed Economic Activity R 41-02 (Information Notices (Informaciniai pranešimai), 2002, No 61-297).
The recommended risk assessment structure (Table 7.1.1) provides that risk may be assessed depending on the significance of risk and possible impact on the objects falling within the risk area. The recommended risk analysis structure (1-14 steps) provides that steps 1-3, 1-5 or 1-14 may be taken depending on the significance of impact on people, nature, property and existence of the objects exposed to such impact in the impact area.
Table 84: Table 7.1.1. Recommended risk assessment structure (Information Notices (Informaciniai pranešimai), 2002 No 61-297)
Risk
Detection a Identification b Classification Assessment
1 2 3 * 4 5 ** 6 7 8 9 10 11 12 13 14
To finish here if hazardous factors are minor
To finish here if there are no respective vulnerable subjects
7.2 Possibilities and Reasons for Risks of Emergency Situations
Emergency situations and risks in industrial sites occur for the following reasons:
- geographical location; - carried out technological processes and failures; - human factor (employee’s mistake); - physical factor (building design, structures, installations).
Review and analysis of the accidents that have already occurred is the most widely applied method of evaluation and projection of possible accidents. The following accidents shall be classified as main emergency accidents posing danger to people and environment:
- uncontrolled discharges and spillages of hazardous substances used in the production process;
Environmental Impact Assessment Report for Vilnius Combined Heat and Power Plant
- fires and explosions.
Emergency situations may occur in the technological facilities of the PEA and facilities of storage of raw materials and hazardous substances.
The technological facilities of Vilnius Combined Heat and Power Plant (steam and water heating boilers, pressure vessels; pressure steam and hot water pipelines etc.) fall into the scope of the Republic of Lithuania Law on the Maintenance of Potentially Dangerous Facilities (2 May 1996, No I-1324; Official Gazette Valstybės žinios, 1996, No 46-1116; including further amendments thereto).
At this stage the technological facilities of the subject of the PEA are assessed on a preliminary basis identifying the main planned activities and not detailing the technological process, since the technological process is detailed when drawing up the construction technical design of the subject.
The substances and preparations used in the technological process include 24-25% ammonia NH3 solution, slaked lime (Ca(OH)2), quick lime (CaO), activated carbon, sodium chloride (NaCI), sodium phosphate (Na3PO4) and sodium hydroxide or caustic soda (NaOH), ethylene glycol (HO-CH2CH2-OH).
At this stage the materials used in the subject of the PEA and preliminary quantities thereof are known, but the places and conditions of storage thereof (numbers and capacities of storage containers) are established when drawing up the technical design; thus, the risk analysis covers only hazardous characteristics of hazardous chemical substances specifying the planned activities in which they are to be used and the preliminary quantities thereof.
7.2.1 Reasons for Accidents in Technological Facilities
Steam and water heating boilers and equipment thereof (fired or otherwise heated pressure equipment for production of steam and superheated water), pressure vessels and equipment thereof as well as pressure pipelines and equipment thereof are classified as potentially dangerous facilities.
Emergency situations in the technological facilities may occur for the following reasons:
- disruptions of supply of electricity, water vapour, circulating, desalted or fire water, gaseous fuels to the steam boiler;
- violations of the technological regime;
- failure of the safety valves;
- gas concentration in the premises;
- breaches of the rules concerning the occupational safety and safe operation of the facility by the personnel carrying out maintenance works;
- malfunction of the measuring devices or automatic systems.
The combined heat and power plant consists of the following main facilities and systems:
- fuel supply and storage system – weighing-machine, defueling facility, fuel bunker, fuel supply installations (grabbing cranes), fuel feeders, water injection devices, automation equipment;
- steam boiler unit – furnace, steam boiler, steam super-heater and steam boiler economiser;
- steam condensing economiser – consists of condensing economiser, scrubber and condensate treatment equipment, intended for utilisation of steam heat, thus, increasing the useful life factor of the plant;
- steam turbine – thermal engine of continuous operation with a rotary operating cycle converting the potential water vapour power into mechanical operation. The facility consists of a steam chamber, guide rings and operating cycle paddles;
- generator – the device converting mechanical (rotation) power into electric power;
- water preparation system – consists of mechanical sand filters and water softening and reverse osmosis and electrodeionisation equipment, deaerator;
- cooling system – consists of the spent (primary) steam cooling equipment, heating water heating (steam-water heat exchangers) and cooling system;
- steam treatment system – consists of the selective non-catalytic reduction (SNCR) system, semi-dry smoke purifying equipment (reactor), bag or electrostatic filter;
- bottom ash (slag) treatment system – ensures bottom ash and incineration process waste collection;
Environmental Impact Assessment Report for Vilnius Combined Heat and Power Plant
- plant control system – consists of automation of different separate installations and central control panel.
Emergency accidents may occur in any of the above systems. Hazard factors depend on the hazard posed by the facility and the chemical substances used in the technological process.
7.2.2 Used Raw Materials, Chemical Substances, Hazard Characteristics Thereof
7.2.2.1 Main Raw Materials
The main raw materials are the following waste and fuel transported to the PEA location, stored and incinerated in furnaces:
- non-hazardous waste with energy content unsuitable for processing;
- biomass, i.e. solid products produced of raw materials, waste and residues from forestry and related industries used for production of energy: chips, waste wood, felling waste, sawdust, pellets, straw (straw pellets);
- sludge from treatment of wastewater.
7.2.2.2 Used Materials and Preparations
The main chemical substances stored and used in the technological process are as follows:
- 24-25% ammonia NH3 solution, a corrosive chemical substance dangerous for the environment, used for water preparation and reduction of nitrogen oxides in smoke; stored amount – approximately 30-50 m
3, stored in a non-pressure reservoir;
- Slaked lime (Ca(OH)2), a corrosive material used for in semi-dry smoke purifying equipment at the stage of operation of the facility with a view to increasing the efficiency of absorption of SO2 and other acidic gas; stored in an approx. 50-100 m
3 capacity silo;
- Quick lime (CaO), a corrosive material used in semi-dry smoke purifying equipment at the facility operation stage for absorption/desorption of SO2, HCI, HF , Hg and dioxins from smoke gas. Lime is injected into a lime slaking device through a pipe where it is slaked till Ca(OH)2 and before injecting to the smoke gas mixed with ash dust; stored in an approx. 50-100 m
3 capacity silo;
- Activated carbon (C), a material used in semi-dry smoke purifying equipment at the facility operation; stored in an approx. 15-30 m
3 capacity silo;
- Caustic soda (NaOH), a corrosive material used in smoke purifying equipment as a substance binding H2S in smoke and for regulation (alkalinisation) of pH of the water treated in the water preparation unit; stored in an approx. 20 m
3 capacity silo;
- Sodium phosphate (Na3PO4), a substance used for preparation of water;
- Sodium chloride (NaCI), a substance used for preparation of feed water;
- Ethylene glycol (HO-CH2CH2-OH), a hazardous substance used in cooling equipment and the heating systems of separate buildings of the plant; single refilling.
There are no actively vaporising substances that could form explosive mixtures and explode or cause a volume fire. The risk of explosion is possible in the closed premises of the equipment of biomass preparation and supply to furnaces where explosive mixtures may be the result of wood dust and other dust.
7.2.3 Identification of Possible Hazards and Risk Factors
Assessment of the technological facilities and used hazardous substances used and generated in the process allows describing the risk factors according to the Recommendations for Assessment of Potential Accident Risk for Proposed Economic Activity (Information Notices (Informaciniai pranešimai), 2002 No 61-297), identifying vulnerable subjects (people, nature, property) and the hazards posed to them (Table 7.2.1).
Table 85: Table 7.2.1. Recommended risk factors
Vulnerable subjects Consequences
People: personnel, visitors, surrounding population concerned, personnel of rescue services
Any damage from scare and trivial injury to deaths of many people

Environmental Impact Assessment Report for Vilnius Combined Heat and Power Plant
Nature: sea, lakes, rivers, groundwater, recreation and protection areas, agricultural areas, forests etc.
Any release of toxic or hazardous substances, fire etc.
Property: property of the PEA operator, other companies, property of residents etc.
Any damage from minor damage to complete demolition, release of hazardous substances, damage to equipment
Significance of possible hazards to people, nature and property, risk duration, likelihood and significance are established according to the criterial laid down in Table 7.2.2 below and summarised in Table 7.2.2 below.
Table 86: Table 7.2.2. Recommended assessment criteria for risk factors
Effects to human lives and health
Class Indicators
Minor Temporary negligible impairment of well-being
Limited Several injuries, long-lasting impairment of well-being
Serious Several serious injuries, particularly significant impairment of well-being
Very serious Several (more than 5) deaths, dozens / several dozens of seriously injured people, up to 500 evacuated people
Catastrophic Dozens of deaths, several hundred seriously injured people, more than 500 evacuated people
Effects to nature
Class Indicators
Minor No contamination, localised impact
Limited Negligible contamination, localised impact
Serious Negligible contamination, extensive impact
Very serious Serious contamination, localised impact
Catastrophic Particularly serious contamination, extensive impact
Effects to property
Class Indicators
Minor less than 30,000
Limited 30,000 – 60,000
Serious 60,000 – 300,000
Very serious 300,000 – 1,5000,000
Catastrophic More than 1,500,000
Spread rate, duration of the emergency, readiness
Class Indicators
Early and clear warning Localised effects, no damage
Medium Slightly spread, minor damage
No warning (quickly and unexpectedly) Secretly, when the effects become fully evident, the impact is instant
Likelihood
Class Roughly estimated frequency
Impossible Less than once per 1000 years
Nearly impossible Once per 100-1000 years
Highly unlikely Once per 10-100 years
Likely Once per 1-10 years
Very likely More frequently than once per year

Environmental Impact Assessment Report for Vilnius Combined Heat and Power Plant
*- the values in LTL set out in the recommendations (Information Notices (Informaciniai pranešimai), 2000 No 61-297) are roughly converted to EUR rounding the result
If the detected hazards are minor, they are not further examined; if in the course of further examination, no vulnerable subjects are identified, the risk classification and assessment is not carried out. The risk factors exerting a major influence to people, nature, environment or property shall be fully examined.
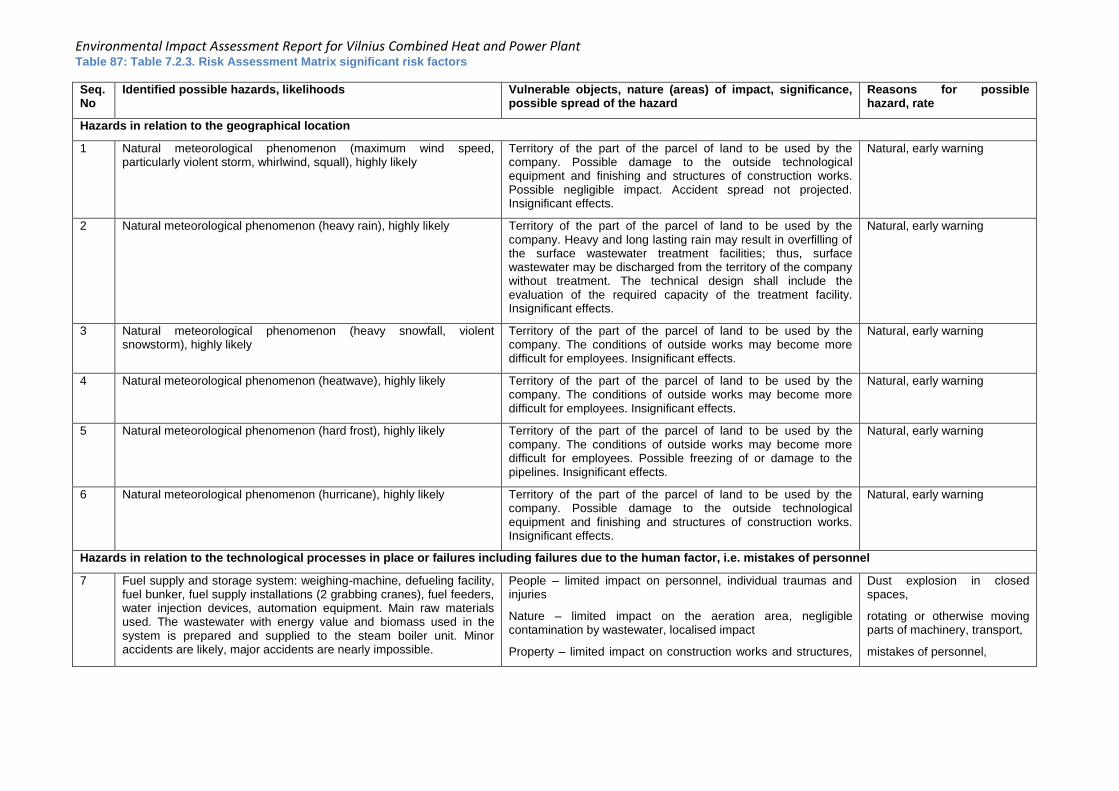
Environmental Impact Assessment Report for Vilnius Combined Heat and Power Plant Table 87: Table 7.2.3. Risk Assessment Matrix significant risk factors
Seq. No
Identified possible hazards, likelihoods Vulnerable objects, nature (areas) of impact, significance, possible spread of the hazard
Reasons for possible hazard, rate
Hazards in relation to the geographical location
1 Natural meteorological phenomenon (maximum wind speed, particularly violent storm, whirlwind, squall), highly likely
Territory of the part of the parcel of land to be used by the company. Possible damage to the outside technological equipment and finishing and structures of construction works. Possible negligible impact. Accident spread not projected. Insignificant effects.
Natural, early warning
2 Natural meteorological phenomenon (heavy rain), highly likely Territory of the part of the parcel of land to be used by the company. Heavy and long lasting rain may result in overfilling of the surface wastewater treatment facilities; thus, surface wastewater may be discharged from the territory of the company without treatment. The technical design shall include the evaluation of the required capacity of the treatment facility. Insignificant effects.
Natural, early warning
3 Natural meteorological phenomenon (heavy snowfall, violent snowstorm), highly likely
Territory of the part of the parcel of land to be used by the company. The conditions of outside works may become more difficult for employees. Insignificant effects.
Natural, early warning
4 Natural meteorological phenomenon (heatwave), highly likely Territory of the part of the parcel of land to be used by the company. The conditions of outside works may become more difficult for employees. Insignificant effects.
Natural, early warning
5 Natural meteorological phenomenon (hard frost), highly likely Territory of the part of the parcel of land to be used by the company. The conditions of outside works may become more difficult for employees. Possible freezing of or damage to the pipelines. Insignificant effects.
Natural, early warning
6 Natural meteorological phenomenon (hurricane), highly likely Territory of the part of the parcel of land to be used by the company. Possible damage to the outside technological equipment and finishing and structures of construction works. Insignificant effects.
Natural, early warning
Hazards in relation to the technological processes in place or failures including failures due to the human factor, i.e. mistakes of personnel
7 Fuel supply and storage system: weighing-machine, defueling facility, fuel bunker, fuel supply installations (2 grabbing cranes), fuel feeders, water injection devices, automation equipment. Main raw materials used. The wastewater with energy value and biomass used in the system is prepared and supplied to the steam boiler unit. Minor accidents are likely, major accidents are nearly impossible.
People – limited impact on personnel, individual traumas and injuries
Nature – limited impact on the aeration area, negligible contamination by wastewater, localised impact
Property – limited impact on construction works and structures,
Dust explosion in closed spaces,
rotating or otherwise moving parts of machinery, transport,
mistakes of personnel,
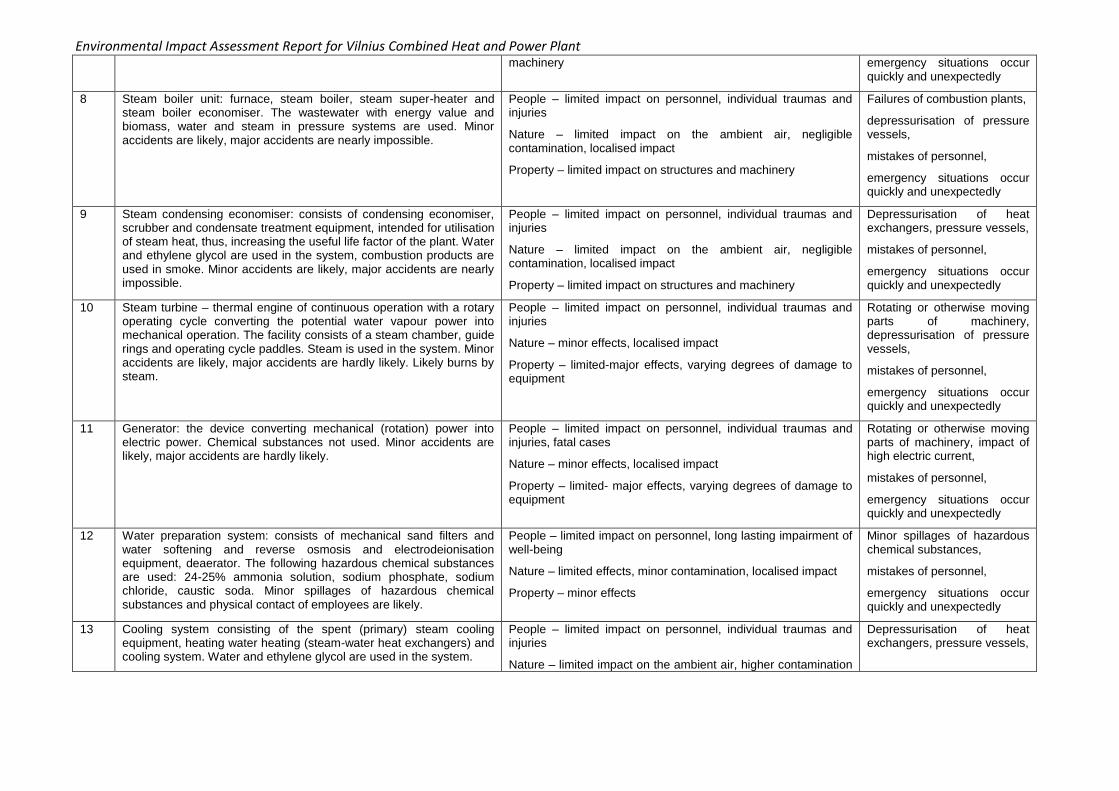
Environmental Impact Assessment Report for Vilnius Combined Heat and Power Plant machinery emergency situations occur
quickly and unexpectedly
8 Steam boiler unit: furnace, steam boiler, steam super-heater and steam boiler economiser. The wastewater with energy value and biomass, water and steam in pressure systems are used. Minor accidents are likely, major accidents are nearly impossible.
People – limited impact on personnel, individual traumas and injuries
Nature – limited impact on the ambient air, negligible contamination, localised impact
Property – limited impact on structures and machinery
Failures of combustion plants,
depressurisation of pressure vessels,
mistakes of personnel,
emergency situations occur quickly and unexpectedly
9 Steam condensing economiser: consists of condensing economiser, scrubber and condensate treatment equipment, intended for utilisation of steam heat, thus, increasing the useful life factor of the plant. Water and ethylene glycol are used in the system, combustion products are used in smoke. Minor accidents are likely, major accidents are nearly impossible.
People – limited impact on personnel, individual traumas and injuries
Nature – limited impact on the ambient air, negligible contamination, localised impact
Property – limited impact on structures and machinery
Depressurisation of heat exchangers, pressure vessels,
mistakes of personnel,
emergency situations occur quickly and unexpectedly
10 Steam turbine – thermal engine of continuous operation with a rotary operating cycle converting the potential water vapour power into mechanical operation. The facility consists of a steam chamber, guide rings and operating cycle paddles. Steam is used in the system. Minor accidents are likely, major accidents are hardly likely. Likely burns by steam.
People – limited impact on personnel, individual traumas and injuries
Nature – minor effects, localised impact
Property – limited-major effects, varying degrees of damage to equipment
Rotating or otherwise moving parts of machinery, depressurisation of pressure vessels,
mistakes of personnel,
emergency situations occur quickly and unexpectedly
11 Generator: the device converting mechanical (rotation) power into electric power. Chemical substances not used. Minor accidents are likely, major accidents are hardly likely.
People – limited impact on personnel, individual traumas and injuries, fatal cases
Nature – minor effects, localised impact
Property – limited- major effects, varying degrees of damage to equipment
Rotating or otherwise moving parts of machinery, impact of high electric current,
mistakes of personnel,
emergency situations occur quickly and unexpectedly
12 Water preparation system: consists of mechanical sand filters and water softening and reverse osmosis and electrodeionisation equipment, deaerator. The following hazardous chemical substances are used: 24-25% ammonia solution, sodium phosphate, sodium chloride, caustic soda. Minor spillages of hazardous chemical substances and physical contact of employees are likely.
People – limited impact on personnel, long lasting impairment of well-being
Nature – limited effects, minor contamination, localised impact
Property – minor effects
Minor spillages of hazardous chemical substances,
mistakes of personnel,
emergency situations occur quickly and unexpectedly
13 Cooling system consisting of the spent (primary) steam cooling equipment, heating water heating (steam-water heat exchangers) and cooling system. Water and ethylene glycol are used in the system.
People – limited impact on personnel, individual traumas and injuries
Nature – limited impact on the ambient air, higher contamination
Depressurisation of heat exchangers, pressure vessels,
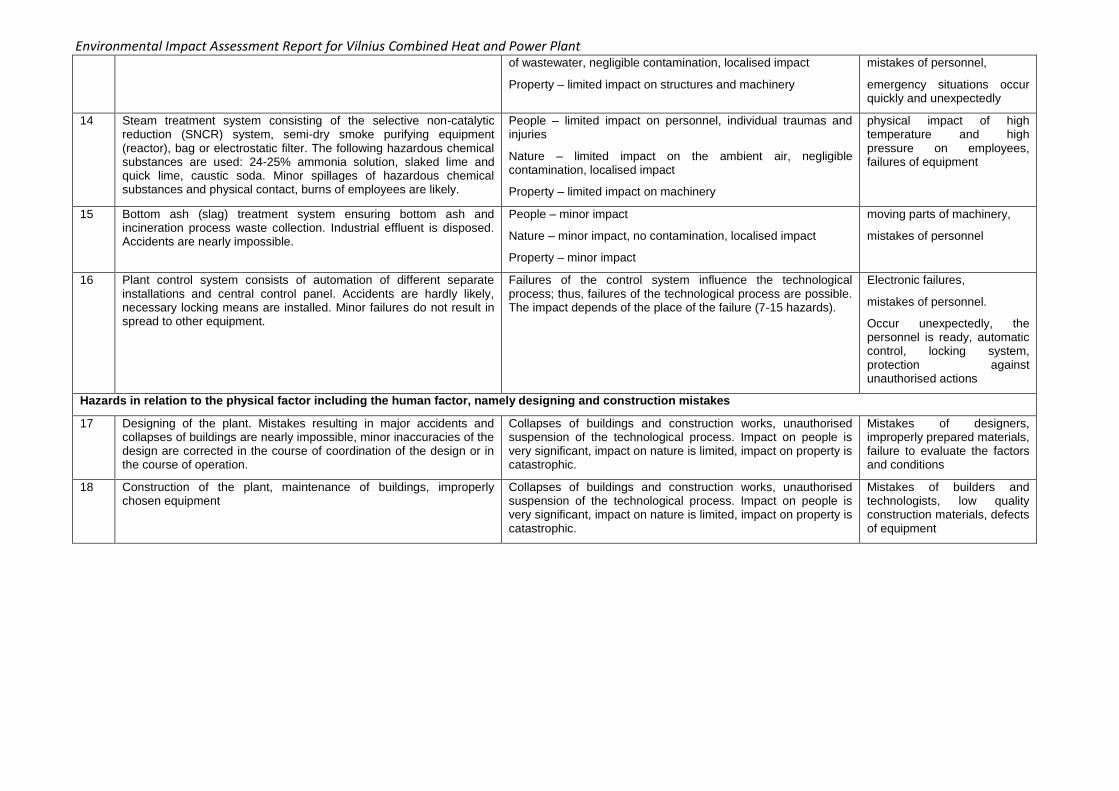
Environmental Impact Assessment Report for Vilnius Combined Heat and Power Plant of wastewater, negligible contamination, localised impact
Property – limited impact on structures and machinery
mistakes of personnel,
emergency situations occur quickly and unexpectedly
14 Steam treatment system consisting of the selective non-catalytic reduction (SNCR) system, semi-dry smoke purifying equipment (reactor), bag or electrostatic filter. The following hazardous chemical substances are used: 24-25% ammonia solution, slaked lime and quick lime, caustic soda. Minor spillages of hazardous chemical substances and physical contact, burns of employees are likely.
People – limited impact on personnel, individual traumas and injuries
Nature – limited impact on the ambient air, negligible contamination, localised impact
Property – limited impact on machinery
physical impact of high temperature and high pressure on employees, failures of equipment
15 Bottom ash (slag) treatment system ensuring bottom ash and incineration process waste collection. Industrial effluent is disposed. Accidents are nearly impossible.
People – minor impact
Nature – minor impact, no contamination, localised impact
Property – minor impact
moving parts of machinery,
mistakes of personnel
16 Plant control system consists of automation of different separate installations and central control panel. Accidents are hardly likely, necessary locking means are installed. Minor failures do not result in spread to other equipment.
Failures of the control system influence the technological process; thus, failures of the technological process are possible. The impact depends of the place of the failure (7-15 hazards).
Electronic failures,
mistakes of personnel.
Occur unexpectedly, the personnel is ready, automatic control, locking system, protection against unauthorised actions
Hazards in relation to the physical factor including the human factor, namely designing and construction mistakes
17 Designing of the plant. Mistakes resulting in major accidents and collapses of buildings are nearly impossible, minor inaccuracies of the design are corrected in the course of coordination of the design or in the course of operation.
Collapses of buildings and construction works, unauthorised suspension of the technological process. Impact on people is very significant, impact on nature is limited, impact on property is catastrophic.
Mistakes of designers, improperly prepared materials, failure to evaluate the factors and conditions
18 Construction of the plant, maintenance of buildings, improperly chosen equipment
Collapses of buildings and construction works, unauthorised suspension of the technological process. Impact on people is very significant, impact on nature is limited, impact on property is catastrophic.
Mistakes of builders and technologists, low quality construction materials, defects of equipment
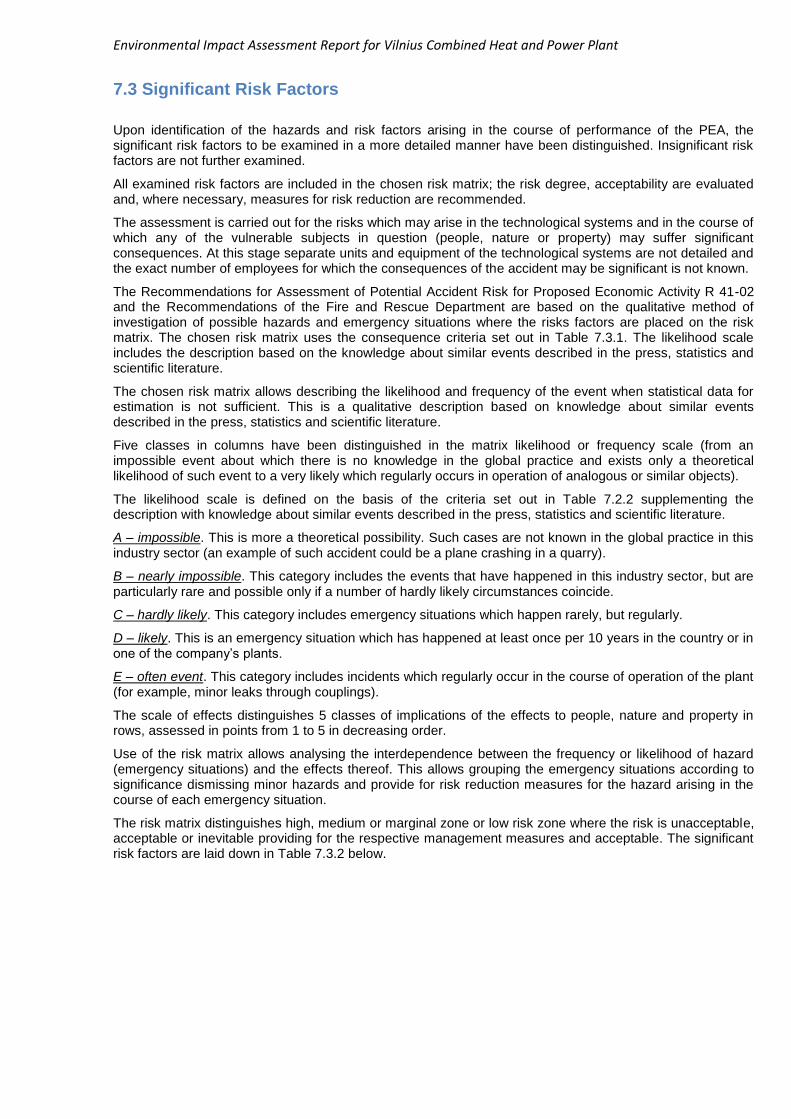
Environmental Impact Assessment Report for Vilnius Combined Heat and Power Plant
7.3 Significant Risk Factors
Upon identification of the hazards and risk factors arising in the course of performance of the PEA, the significant risk factors to be examined in a more detailed manner have been distinguished. Insignificant risk factors are not further examined.
All examined risk factors are included in the chosen risk matrix; the risk degree, acceptability are evaluated and, where necessary, measures for risk reduction are recommended.
The assessment is carried out for the risks which may arise in the technological systems and in the course of which any of the vulnerable subjects in question (people, nature or property) may suffer significant consequences. At this stage separate units and equipment of the technological systems are not detailed and the exact number of employees for which the consequences of the accident may be significant is not known.
The Recommendations for Assessment of Potential Accident Risk for Proposed Economic Activity R 41-02 and the Recommendations of the Fire and Rescue Department are based on the qualitative method of investigation of possible hazards and emergency situations where the risks factors are placed on the risk matrix. The chosen risk matrix uses the consequence criteria set out in Table 7.3.1. The likelihood scale includes the description based on the knowledge about similar events described in the press, statistics and scientific literature.
The chosen risk matrix allows describing the likelihood and frequency of the event when statistical data for estimation is not sufficient. This is a qualitative description based on knowledge about similar events described in the press, statistics and scientific literature.
Five classes in columns have been distinguished in the matrix likelihood or frequency scale (from an impossible event about which there is no knowledge in the global practice and exists only a theoretical likelihood of such event to a very likely which regularly occurs in operation of analogous or similar objects).
The likelihood scale is defined on the basis of the criteria set out in Table 7.2.2 supplementing the description with knowledge about similar events described in the press, statistics and scientific literature.
A – impossible. This is more a theoretical possibility. Such cases are not known in the global practice in this industry sector (an example of such accident could be a plane crashing in a quarry).
B – nearly impossible. This category includes the events that have happened in this industry sector, but are particularly rare and possible only if a number of hardly likely circumstances coincide.
C – hardly likely. This category includes emergency situations which happen rarely, but regularly.
D – likely. This is an emergency situation which has happened at least once per 10 years in the country or in one of the company’s plants.
E – often event. This category includes incidents which regularly occur in the course of operation of the plant (for example, minor leaks through couplings).
The scale of effects distinguishes 5 classes of implications of the effects to people, nature and property in rows, assessed in points from 1 to 5 in decreasing order.
Use of the risk matrix allows analysing the interdependence between the frequency or likelihood of hazard (emergency situations) and the effects thereof. This allows grouping the emergency situations according to significance dismissing minor hazards and provide for risk reduction measures for the hazard arising in the course of each emergency situation.
The risk matrix distinguishes high, medium or marginal zone or low risk zone where the risk is unacceptable, acceptable or inevitable providing for the respective management measures and acceptable. The significant risk factors are laid down in Table 7.3.2 below.
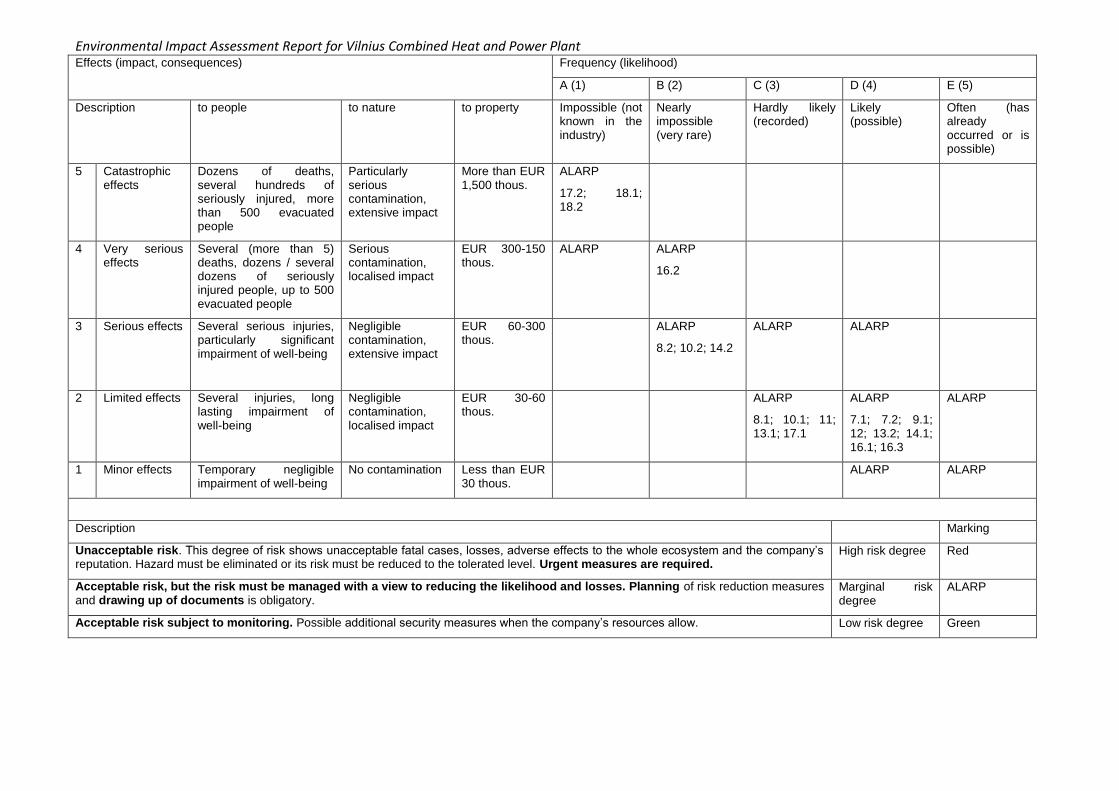
Environmental Impact Assessment Report for Vilnius Combined Heat and Power Plant Effects (impact, consequences) Frequency (likelihood)
A (1) B (2) C (3) D (4) E (5)
Description to people to nature to property Impossible (not known in the industry)
Nearly impossible (very rare)
Hardly likely (recorded)
Likely (possible)
Often (has already occurred or is possible)
5 Catastrophic effects
Dozens of deaths, several hundreds of seriously injured, more than 500 evacuated people
Particularly serious contamination, extensive impact
More than EUR 1,500 thous.
ALARP
17.2; 18.1; 18.2
4 Very serious effects
Several (more than 5) deaths, dozens / several dozens of seriously injured people, up to 500 evacuated people
Serious contamination, localised impact
EUR 300-150 thous.
ALARP ALARP
16.2
3 Serious effects Several serious injuries, particularly significant impairment of well-being
Negligible contamination, extensive impact
EUR 60-300 thous.
ALARP
8.2; 10.2; 14.2
ALARP ALARP
2 Limited effects Several injuries, long lasting impairment of well-being
Negligible contamination, localised impact
EUR 30-60 thous.
ALARP
8.1; 10.1; 11; 13.1; 17.1
ALARP
7.1; 7.2; 9.1; 12; 13.2; 14.1; 16.1; 16.3
ALARP
1 Minor effects Temporary negligible impairment of well-being
No contamination Less than EUR 30 thous.
ALARP ALARP
Description Marking
Unacceptable risk. This degree of risk shows unacceptable fatal cases, losses, adverse effects to the whole ecosystem and the company’s reputation. Hazard must be eliminated or its risk must be reduced to the tolerated level. Urgent measures are required.
High risk degree Red
Acceptable risk, but the risk must be managed with a view to reducing the likelihood and losses. Planning of risk reduction measures and drawing up of documents is obligatory.
Marginal risk degree
ALARP
Acceptable risk subject to monitoring. Possible additional security measures when the company’s resources allow. Low risk degree Green
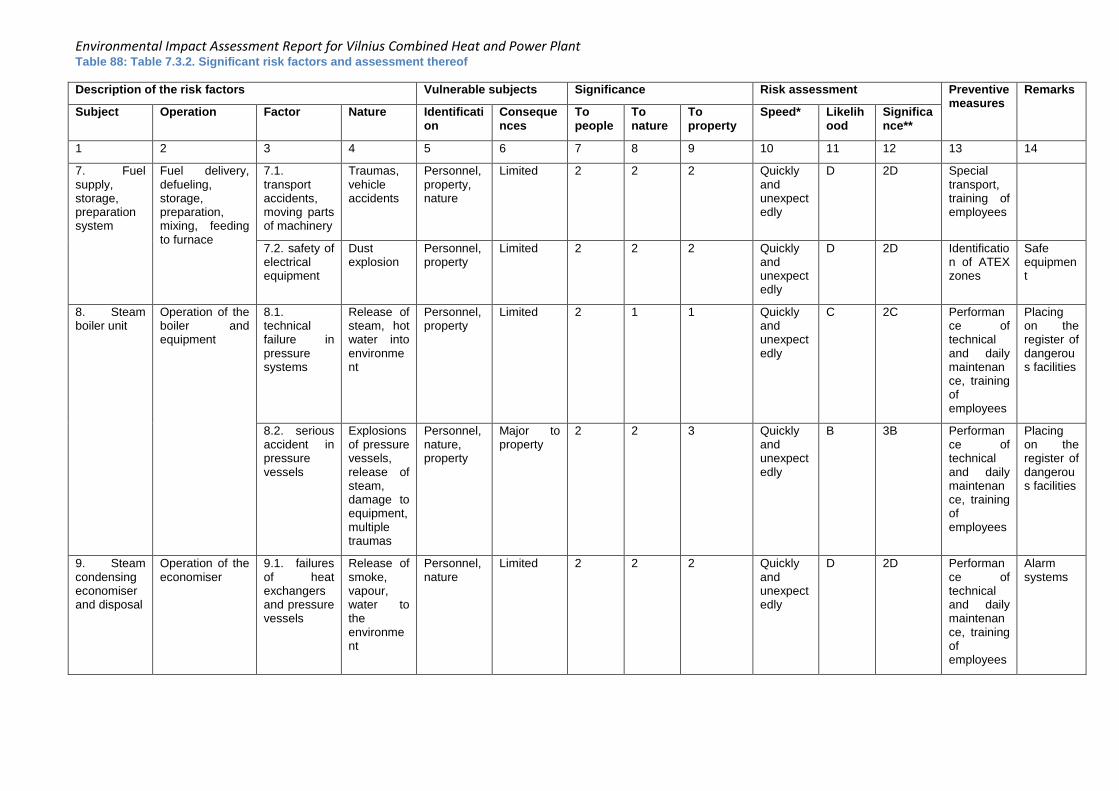
Environmental Impact Assessment Report for Vilnius Combined Heat and Power Plant Table 88: Table 7.3.2. Significant risk factors and assessment thereof
Description of the risk factors Vulnerable subjects Significance Risk assessment Preventive measures
Remarks
Subject Operation Factor Nature Identification
Consequences
To people
To nature
To property
Speed* Likelihood
Significance**
1 2 3 4 5 6 7 8 9 10 11 12 13 14
7. Fuel supply, storage, preparation system
Fuel delivery, defueling, storage, preparation, mixing, feeding to furnace
7.1. transport accidents, moving parts of machinery
Traumas, vehicle accidents
Personnel, property, nature
Limited 2 2 2 Quickly and unexpectedly
D 2D Special transport, training of employees
7.2. safety of electrical equipment
Dust explosion
Personnel, property
Limited 2 2 2 Quickly and unexpectedly
D 2D Identification of ATEX zones
Safe equipment
8. Steam boiler unit
Operation of the boiler and equipment
8.1. technical failure in pressure systems
Release of steam, hot water into environment
Personnel, property
Limited 2 1 1 Quickly and unexpectedly
C 2C Performance of technical and daily maintenance, training of employees
Placing on the register of dangerous facilities
8.2. serious accident in pressure vessels
Explosions of pressure vessels, release of steam, damage to equipment, multiple traumas
Personnel, nature, property
Major to property
2 2 3 Quickly and unexpectedly
B 3B Performance of technical and daily maintenance, training of employees
Placing on the register of dangerous facilities
9. Steam condensing economiser and disposal
Operation of the economiser
9.1. failures of heat exchangers and pressure vessels
Release of smoke, vapour, water to the environment
Personnel, nature
Limited 2 2 2 Quickly and unexpectedly
D 2D Performance of technical and daily maintenance, training of employees
Alarm systems
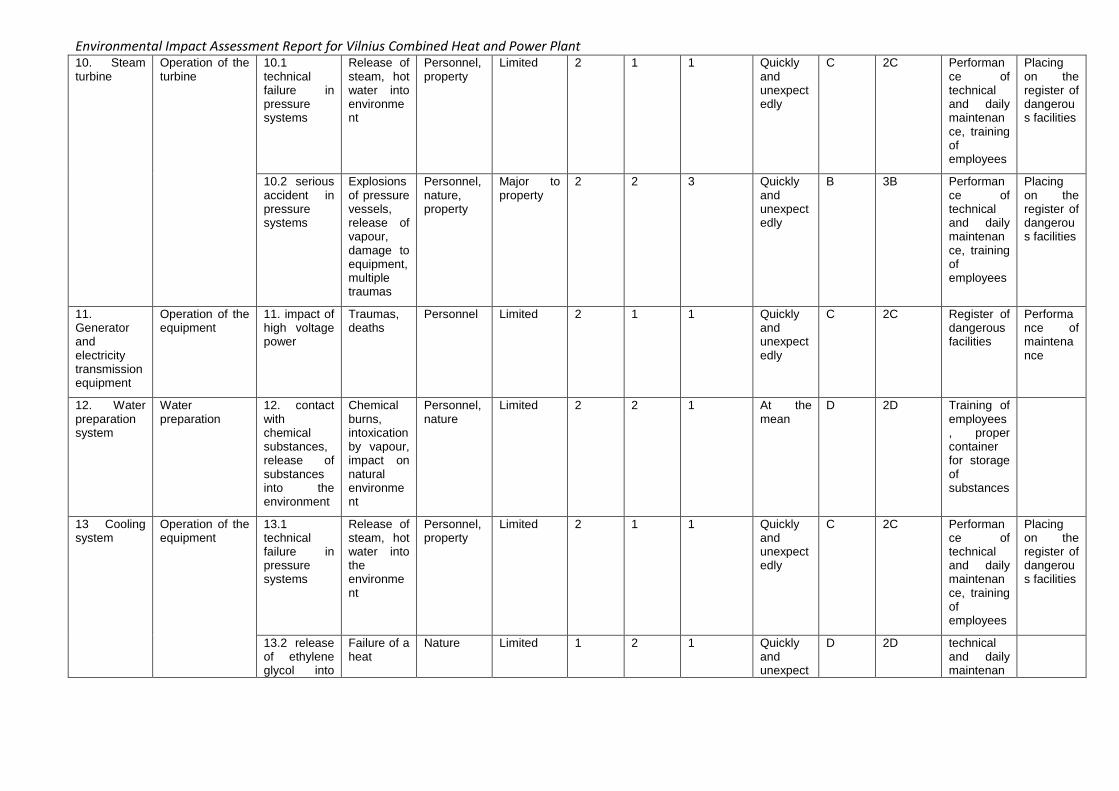
Environmental Impact Assessment Report for Vilnius Combined Heat and Power Plant 10. Steam turbine
Operation of the turbine
10.1 technical failure in pressure systems
Release of steam, hot water into environment
Personnel, property
Limited 2 1 1 Quickly and unexpectedly
C 2C Performance of technical and daily maintenance, training of employees
Placing on the register of dangerous facilities
10.2 serious accident in pressure systems
Explosions of pressure vessels, release of vapour, damage to equipment, multiple traumas
Personnel, nature, property
Major to property
2 2 3 Quickly and unexpectedly
B 3B Performance of technical and daily maintenance, training of employees
Placing on the register of dangerous facilities
11. Generator and electricity transmission equipment
Operation of the equipment
11. impact of high voltage power
Traumas, deaths
Personnel Limited 2 1 1 Quickly and unexpectedly
C 2C Register of dangerous facilities
Performance of maintenance
12. Water preparation system
Water preparation
12. contact with chemical substances, release of substances into the environment
Chemical burns, intoxication by vapour, impact on natural environment
Personnel, nature
Limited 2 2 1 At the mean
D 2D Training of employees, proper container for storage of substances
13 Cooling system
Operation of the equipment
13.1 technical failure in pressure systems
Release of steam, hot water into the environment
Personnel, property
Limited 2 1 1 Quickly and unexpectedly
C 2C Performance of technical and daily maintenance, training of employees
Placing on the register of dangerous facilities
13.2 release of ethylene glycol into
Failure of a heat
Nature Limited 1 2 1 Quickly and unexpect
D 2D technical and daily maintenan
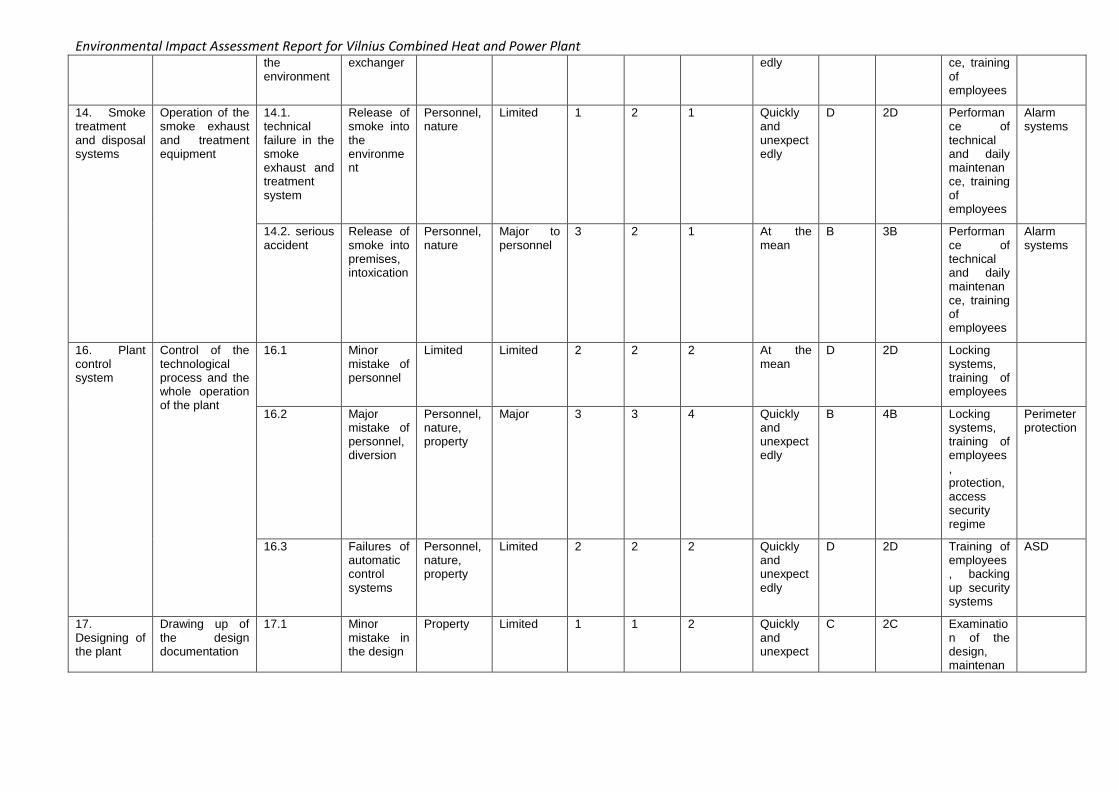
Environmental Impact Assessment Report for Vilnius Combined Heat and Power Plant the environment
exchanger edly ce, training of employees
14. Smoke treatment and disposal systems
Operation of the smoke exhaust and treatment equipment
14.1. technical failure in the smoke exhaust and treatment system
Release of smoke into the environment
Personnel, nature
Limited 1 2 1 Quickly and unexpectedly
D 2D Performance of technical and daily maintenance, training of employees
Alarm systems
14.2. serious accident
Release of smoke into premises, intoxication
Personnel, nature
Major to personnel
3 2 1 At the mean
B 3B Performance of technical and daily maintenance, training of employees
Alarm systems
16. Plant control system
Control of the technological process and the whole operation of the plant
16.1 Minor mistake of personnel
Limited Limited 2 2 2 At the mean
D 2D Locking systems, training of employees
16.2 Major mistake of personnel, diversion
Personnel, nature, property
Major 3 3 4 Quickly and unexpectedly
B 4B Locking systems, training of employees, protection, access security regime
Perimeter protection
16.3 Failures of automatic control systems
Personnel, nature, property
Limited 2 2 2 Quickly and unexpectedly
D 2D Training of employees, backing up security systems
ASD
17. Designing of the plant
Drawing up of the design documentation
17.1 Minor mistake in the design
Property Limited 1 1 2 Quickly and unexpect
C 2C Examination of the design, maintenan
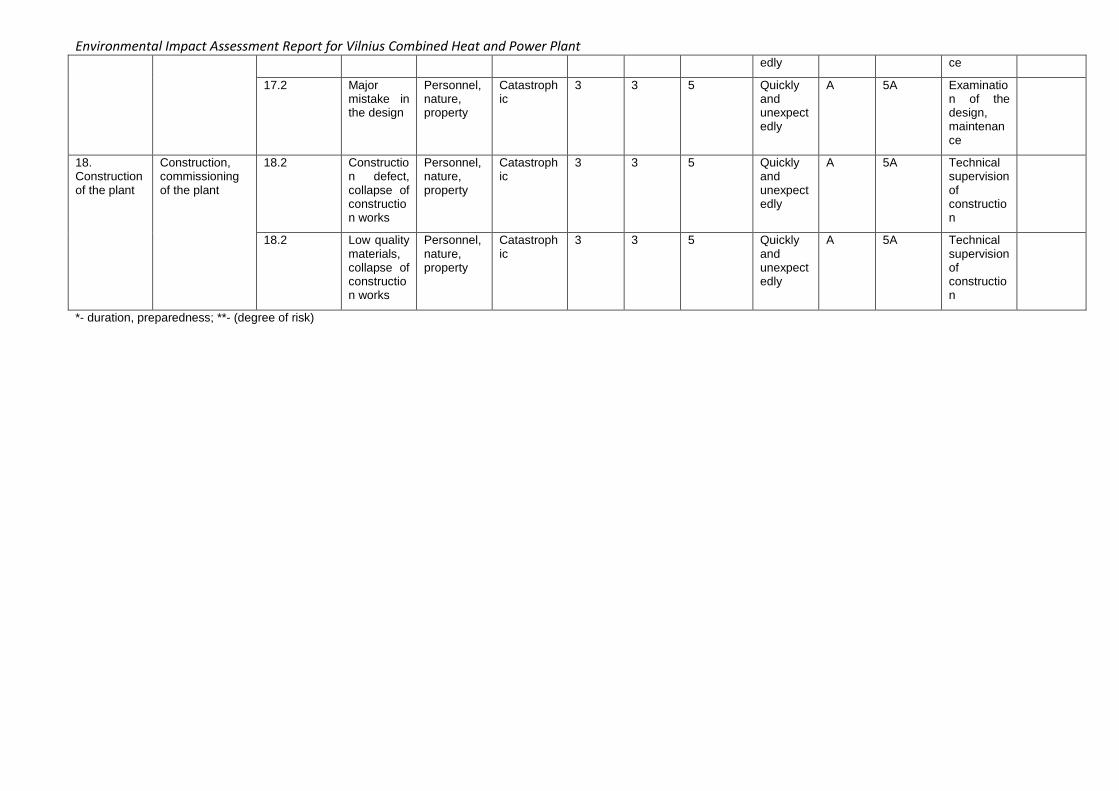
Environmental Impact Assessment Report for Vilnius Combined Heat and Power Plant edly ce
17.2 Major mistake in the design
Personnel, nature, property
Catastrophic
3 3 5 Quickly and unexpectedly
A 5A Examination of the design, maintenance
18. Construction of the plant
Construction, commissioning of the plant
18.2 Construction defect, collapse of construction works
Personnel, nature, property
Catastrophic
3 3 5 Quickly and unexpectedly
A 5A Technical supervision of construction
18.2 Low quality materials, collapse of construction works
Personnel, nature, property
Catastrophic
3 3 5 Quickly and unexpectedly
A 5A Technical supervision of construction
*- duration, preparedness; **- (degree of risk)
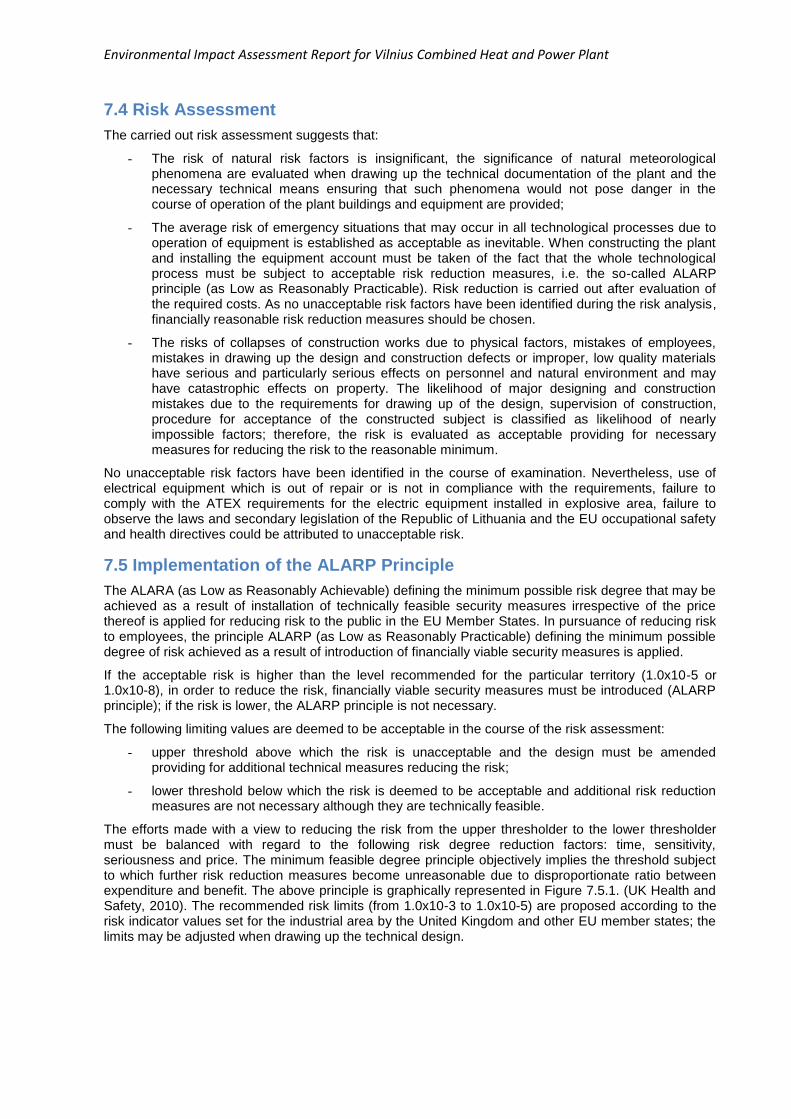
Environmental Impact Assessment Report for Vilnius Combined Heat and Power Plant
7.4 Risk Assessment
The carried out risk assessment suggests that:
- The risk of natural risk factors is insignificant, the significance of natural meteorological phenomena are evaluated when drawing up the technical documentation of the plant and the necessary technical means ensuring that such phenomena would not pose danger in the course of operation of the plant buildings and equipment are provided;
- The average risk of emergency situations that may occur in all technological processes due to operation of equipment is established as acceptable as inevitable. When constructing the plant and installing the equipment account must be taken of the fact that the whole technological process must be subject to acceptable risk reduction measures, i.e. the so-called ALARP principle (as Low as Reasonably Practicable). Risk reduction is carried out after evaluation of the required costs. As no unacceptable risk factors have been identified during the risk analysis, financially reasonable risk reduction measures should be chosen.
- The risks of collapses of construction works due to physical factors, mistakes of employees, mistakes in drawing up the design and construction defects or improper, low quality materials have serious and particularly serious effects on personnel and natural environment and may have catastrophic effects on property. The likelihood of major designing and construction mistakes due to the requirements for drawing up of the design, supervision of construction, procedure for acceptance of the constructed subject is classified as likelihood of nearly impossible factors; therefore, the risk is evaluated as acceptable providing for necessary measures for reducing the risk to the reasonable minimum.
No unacceptable risk factors have been identified in the course of examination. Nevertheless, use of electrical equipment which is out of repair or is not in compliance with the requirements, failure to comply with the ATEX requirements for the electric equipment installed in explosive area, failure to observe the laws and secondary legislation of the Republic of Lithuania and the EU occupational safety and health directives could be attributed to unacceptable risk.
7.5 Implementation of the ALARP Principle
The ALARA (as Low as Reasonably Achievable) defining the minimum possible risk degree that may be achieved as a result of installation of technically feasible security measures irrespective of the price thereof is applied for reducing risk to the public in the EU Member States. In pursuance of reducing risk to employees, the principle ALARP (as Low as Reasonably Practicable) defining the minimum possible degree of risk achieved as a result of introduction of financially viable security measures is applied.
If the acceptable risk is higher than the level recommended for the particular territory (1.0x10⁻⁵ or 1.0x10⁻⁸), in order to reduce the risk, financially viable security measures must be introduced (ALARP principle); if the risk is lower, the ALARP principle is not necessary.
The following limiting values are deemed to be acceptable in the course of the risk assessment:
- upper threshold above which the risk is unacceptable and the design must be amended providing for additional technical measures reducing the risk;
- lower threshold below which the risk is deemed to be acceptable and additional risk reduction measures are not necessary although they are technically feasible.
The efforts made with a view to reducing the risk from the upper thresholder to the lower thresholder must be balanced with regard to the following risk degree reduction factors: time, sensitivity, seriousness and price. The minimum feasible degree principle objectively implies the threshold subject to which further risk reduction measures become unreasonable due to disproportionate ratio between expenditure and benefit. The above principle is graphically represented in Figure 7.5.1. (UK Health and Safety, 2010). The recommended risk limits (from 1.0x10⁻³ to 1.0x10⁻⁵) are proposed according to the risk indicator values set for the industrial area by the United Kingdom and other EU member states; the limits may be adjusted when drawing up the technical design.

Environmental Impact Assessment Report for Vilnius Combined Heat and Power Plant
Figure 82: Figure 7.5.1. Risk reduction principle (ALARP principle) (UK Health and Safety, 2010)
As at the stage of drawing up the EIA report only qualitative risk assessment may be carried out, the quantitative risk indicators are replaced with the risk significance and acceptance criterion defined in the risk matrix (column 12, Table 8.6).
The main ALARP method applicable when designing large combustion plant is the use of the best available techniques in designing and construction of the plant.
Other documents the implementation of which corresponds to the ALARP principle in designing, construction and operation of Vilnius Combined Heat and Power Plant are guides to good practice. The State Labour Inspectorate under the Minister of Labour and Social Security has drawn up a number of not binding guides to good practice laying down the recommendations and provisions that allow reducing the risks using limited financial resources, i.e. meeting the ALARP principle.
Implementation of the ALARP principle at the stage of drawing up the design includes the following:
- application of the afore-mentioned best available techniques for the planned technologies;
- recommendations set out in not binding guides to good practices providing for equipment for work in possible explosion environments, in increased noise and vibration conditions etc.;
- choosing of new materials in the technical process if use of such materials increases the safety, resistance to fire and explosion of the plant buildings;
- carrying out of the risk analysis when drawing up the mandatory parts of the technical design and determination of the risk reduction measures for the particular technological facilities.
7.6. Other Risk Reduction Measures
7.6.1 Measures Recommended in the Course of Drawing up of the Design
When drawing up the technical design the criteria for resistance of engineering structures of the buildings and construction works the following documents should be observed:
- STR 2.01.01(1):2005. Essential Requirement for Construction Works (ESCW). Mechanical Endurance and Stability;
- STR 2.01.01(2):1999. Essential Requirement for Construction Works (ESCW). Fire Safety;
- STR 2.05.02:2008. Building Structures. Roofs;
Environmental Impact Assessment Report for Vilnius Combined Heat and Power Plant
- STR 2.05.03:2003. Basics of Designing Building Structures;
- STR 2.05.04:2003 Technical Regulation on Construction. Stresses and Loads;
- STR 2.01.06:2009. Protection of Construction Works against Lightning. External Protection of Construction Works against Lightning.
The resistance criteria must meet the requirements of the following main regulatory documents in force:
- LST EN 1990:2004 Eurocode. Bases for Design of Structures;
- LST L ENV 1991-2-2 Eurocode 1 - Basis Design and Actions on Structures - Part 2-2: Actions on Structures - Actions on Structures Exposed to Fire;
- LST EN 13501-1:2002 Fire Classification of Construction Products and Building Elements - Part 1: Classification Using Test Data from Reaction to Fire Tests;
- EN 1993-1-1:2005 Eurocode 3: Design of Steel Structures – Part 1-1: General Rules and Rules for Buildings.
Designing pressure equipment and pipelines requires taking into account the directions and operation conditions of the equipment manufacturer and following the essential safety requirements according to the Technical Regulation on Pressure Equipment.
The fire-fighting measures must be provided for in accordance with the following rules approved by Order No 1-168 of the Director of the Fire and Rescue Department under the Ministry of the Interior of 22 May 2009 “On the Approval of the Regulatory Documents Concerning Safety of Construction Works” (Official Gazette Valstybės žinios, 2009, No 63-2538):
- Rules for Designing and Installation of Fixed Fire Extinguishing Systems;
- Rules for Designing and Installation of Fire Detection and Alarm Systems;
- Rules for Designing and Installation of Internal Fire Water Supply Systems of Construction Works;
- Rules for Designing and Installation of Outdoor Fire Water Supply Networks and Construction Works.
The primary fire extinguishing appliances have been estimated according to the General Fire Safety Rules (Official Gazette Valstybės žinios, 2010, No 99-5167).
When designing facilities for fuel storage and feeding thereof to furnace as well as other facilities where explosive air and combustible dust atmosphere may occur it is recommended to identify explosive zones and apply the requirements of the following standards and regulatory documents and rules (acting edition) to the electric equipment installed therein:
- IEC/EN 60079 Standard for Safety in Explosive Atmosphere;
- ANSI/IEEE C37.13 Standard for Low-Voltage AC Power Circuit Breakers Used in Enclosures
- American Petroleum Institute (API) Recommended Practice (API RP 505) Recommended Practice for Classification of Locations for Electrical Installations at Petroleum Facilities Classified as Class I, Zone 0, and Zone 2;
- General Rules for Installation of Electric Equipment;
- Rules for Installation of Electricity Lines and Electric Wiring;
- Lightning protection is designed and installed according to the standards in force IEC 62305-13:2006, IEC62305-2:2006, IEC 62305-3:2006;
- Rules for Installation of Relay Protection and Automation of Electric Equipment approved by Order No 1-134 of the Ministry of Energy of the Republic of Lithuania of 27 May 2011;
- STR 2.01.06:2009;
- Protection of Construction Works against Lightning. External Protection of Construction Works against Lightning;
- Emergency lightning is designed and installed according to the rules approved by Order No 4-257 of the Minister of Economy of 30 June 2004 “On the Approval of the Rule for Installation of
Environmental Impact Assessment Report for Vilnius Combined Heat and Power Plant
Lighting Electrical Equipment” (Vilnius) and approved by Order No 1-404 of the Director of the Fire and Rescue Department of 23 December 2005;
- LST EN 60079 Electrical Apparatus for Explosive Atmospheres, a series of standards;
- Directive 94/9/EC on Equipment and Protective Systems Intended for Use in Potentially Explosive Atmospheres (ATEX);
- LST EN 1127-1:2008 Explosive Atmospheres - Explosion Prevention and Protection - Part 1: Basic Concepts and Methodology;
- LST EN 60529 Degrees of Protection Provided by Enclosures (IP code).
When drawing up the design STR 2.01.01(4) “Essential Requirements for Construction Works. Safety of Use” and the valid regulatory legislation governing this area in the Republic of Lithuania must be observed, the design should provide for the totality of preventive and other measures with a view to ensuring compliance with the requirements concerning the use of construction works during the whole period of use. The measures must cover the use, maintenance of proper condition, renovation, installation and replacement of separate parts of the construction works. Furthermore, the requirements of the following documents must be applied: requirements of the Directive on Lifting Appliances, the Machinery Directive, the Directive on Workplace Requirements. In the afore-mentioned cases, the requirements of the particular directives are harmonised with the Directive on the Approximation of Laws, Regulations and Administrative Provisions of the Member States Relating to Construction Products (hereinafter referred to as the “CPD requirements”).
7.6.2 Measures Recommended in the Course of Operation of the Subject
The risks arising in the course of operation of Vilnius Combined Heat and Power Plant are related to operation of potentially dangerous facilities and risks occurring in workplaces. The emergency situations and accidents that may occur as a result of such risks require assuming the respective preventive measures and preparedness for liquidation of emergency situations and reduction of consequences.
The main preventive measures used in operation of potentially dangerous facilities and fire safety measures are planned already when drawing up the technical documentation and in the course of construction (more details in Section 7.6.1).
The main preventive measures of emergency situations in operation of the technological equipment of Vilnius Combined Heat and Power Plant are in compliance with the Rules of Operation of Potentially Dangerous Facilities, the Occupational Safety Rules and the Fire Safety Rules. Occupational safety and health, environmental protection and civil protection specialists who shall draw up the respective documents and control compliance with such documents shall be appointed in the company.
The pressure equipment is operated according to the essential requirements set forth in the Pressure Equipment Directive 97/23/EC and the essential safety requirements according to the Technical Regulation of Pressure Equipment.
The pressure equipment of the plant shall be placed on the register of potentially dangerous facilities. The general principles of maintenance, technical inspection and ongoing supervision of potentially dangerous facilities are laid down in the Republic of Lithuania Law on the Maintenance of Potentially Dangerous Facilities (Official Gazette Valstybės žinios, 1996, No 46-1116, 2000, No 89-2742, 2003, No 119-5404, 2007, No 69-2721, 2008, No 87-3459, 2009, No 159-7201, 2011, No 91-4320). Maintenance of pressure equipment shall be carried out in accordance with the provisions of the above law.
Before starting maintenance, the PEA operator shall assess the professional workplace risks and provide for measures for protection of the employees working in such workplaces.
The fire-fighting measures (outdoor and internal fire water networks, number of hydrants, fixed fire extinguishing systems, fire detection and alarm systems, primary fire extinguishing measures) shall be provided when drawing up the technical documentation in accordance with the documents set out in Section 7.6.1. The fire-fighting measures are operated according to the General Fire Safety Rules (Official Gazette Valstybės žinios, 2010, No 99-5167), Rules for Fire Safety of Manufacturing, Industrial and Storage Construction Works (Official Gazette Valstybės žinios, 2012, No 21-990), the respective regulations and other legal acts.
Environmental Impact Assessment Report for Vilnius Combined Heat and Power Plant
Preparedness for emergency situations and accidents in the course of operation of Vilnius Combined Heat and Power Plant shall cover prevention of emergency situations and measures for liquidation of emergency situations.
In pursuance of preventing emergency situations, necessary preventive measures shall be provided for in the object. The preventive measures shall be properly chosen and operated and maintained fire-fighting measures as defined above, compliance with the Rules for Occupational Safety, performance and supervision of technological processes in accordance with the drawn up and approved technological regulations. Furthermore, organisation of the supervision of compliance with the safety rules, training and competence of employees are required.
Prior to starting operation of the plant and following the provisions of the Republic of Lithuania Law on Civil Protection and the secondary legislation thereof, the Regulations of the Prevention, Liquidation and Investigation of Industrial Accidents, the Methodical Recommendations for the Analysis of Risk of Possible Dangerous and Extreme Situations of the Economic Entity, Other Institution approved by 2 June 2011 Order of the Director of the Fire and Rescue Department under the Ministry of the Interior (hereinafter referred to as the “FRD”), the PEA operator shall carry out a risk analysis and draw up the Plan for Management of Emergency Situations.
The Plan for Management of Emergency Situations shall be drawn up in accordance with the Methodological Guidelines for Drawing Up of the Plan for Management of Emergency Situations of Economic Entity, Other Institution (hereinafter referred to as the “Plan”) approved by Order No 1-70 of the Fire and Rescue Department under the Ministry of the Interior of 23 February 2011. The Plan shall be approved by the manager of the economic entity.
The Plan shall set out the actions of management of emergency situations and the procedure for organisation thereof and responsible persons:
procedure for organisation of warning and notification of an emergency event, person responsible for warning, actions in the event of danger or occurrence of such event and provided measures for warning and notification;
procedure for exchange of information on the event providing for receiving of information on an event in the economic entity, other institution and transmission thereof to the county fire and rescue board and/or unit of the Emergency Response Centre, municipality administration and other authorities concerned, the responsible persons, positions thereof;
protection of employees in the event of a danger, the procedure for evacuation and escape routes, responsible persons, personal protective equipment, procedure for provision of such measures, persons responsible for provision of employees with the afore-mentioned measures;
procedure for organisation and coordination of liquidation of emergency situations and accidents and tackling of consequences thereof, rescue works, responsible persons, powers to act and organise rescue works granted by manager to the afore-mentioned persons, material resources, places of storage and concentration thereof, recourse of forces etc.
The personnel of Vilnius Combined Heat and Power Plant shall be instructed and trained in liquidation of emergency situations and accidents. Training in civil protection is carried out in accordance with the Description of the Procedure for Training in Civil Protection approved by Resolution No 718 of the Government of the Republic of Lithuania of 7 June 2010 (Official Gazette Valstybės žinios, 2010, No 69-3443; TAR, May 6, 2014, No 5148).
The afore-mentioned description sets out the aims of training in civil protection the main of which shall be promotion and reinforcement of preparedness to emergency situations and the objectives covering analysis, forecasting, assessment of emergency situations, rescue of people, preparedness of residents for practical actions in cases of emergency situations. Training in civil protection is organised in the Civil Protection Training Centre of the Firefighters Training School of the Fire and Rescue Department under the Ministry of the Interior (full-time civil protection staff members working, managers of companies), the Preparation Division of the Civil Protection and Mobilisation Department of Klaipėda County Governor Administration (civil protection managers and members shall be trained) and directly in the companies (all employees).
The trainings and exercises in civil protection shall be organised according to the plans drawn up by the operator and the municipality administration with a view to verifying operation of the plan in the particular emergency situations, according to the objectives provided for in the approved dangerous object safety management system and the Description of the Procedure for Organisation of Civil
Environmental Impact Assessment Report for Vilnius Combined Heat and Power Plant
Protection Exercises approved by Resolution No 1295 of the Government of the Republic of Lithuania of 8 September 2010 (Official Gazette Valstybės žinios, 2010, No 107-5537).
7.7 Risk Assessment Conclusions
The activities to be carried out in the planned plant in the course of which dangerous facilities, i.e. pressure vessels and pipelines shall be operated, fall into the category of potentially dangerous facilities and be placed on the register of potentially dangerous facilities.
One of possible hazards is related to production of high voltage electric current in the power generator.
The chemical substances stored in the planned plant do not fall within the classes of flammable and highly flammable hazardous chemical substances, do not form explosive mixtures with ambient air; the quantities of stored substances that are noxious or hazardous to the nature and deplete are not great, do not reach the thresholds; thus, the status of dangerous subject shall not be granted and the requirements of SEWESO II Directive and SEWESO III Directive shall not be applied.
Explosive atmospheres may occur in fuel storage facilities and equipment of fuel supply to furnace where dust accumulates; thus, the electrical equipment used in such zones and other places where a possibility for occurrence of explosive atmospheres is established in the course of drawing up of the design must meet the ATEX requirements.
The carried out risk assessment suggests that:
- The risk of natural risk factors is insignificant.
- The identified medium risk of emergency situations that may occur in all technological processes due to operation of the equipment is acceptable as inevitable. It is recommended to apply the ALARP principle in the course of operation of the plant. Use of the best available techniques and good practice in designing and operating the plant is an adequate measure for implementation of the ALARP principle.
- Following the Criteria for Economic Entities and Other Institutions the Managers of Which Must Organise Drawing Up, Coordination and Approval of the Plans for Management of Emergency Situations and the Economic Entities the Managers of Which Must Form the Operations Centre For Emergency Situations approved by Order No 1-134 of the Director of the Fire and Rescue Department under the Ministry of the Interior of the Republic of Lithuania of 19 April 2010, the subject must draw up a plan for management of emergency situations.
- The risks of collapse of construction works that may arise due to physical factors, mistakes of employees, mistakes in drawing up of the design and construction defect and improper, low quality materials may have serious and particularly serious effects on personnel and natural environment; nevertheless, such collapses of buildings due to a designing mistake are not known; thus, the risk of such mistakes is only theoretical. The carried out supervision of the design and construction constitutes sufficient measures for reducing the risk to the acceptable risk.
- No unacceptable risk factors have been identified in the course of the risk analysis. Nevertheless, use of electrical equipment which is out of repair or is not in compliance with the requirements, failure to comply with the ATEX requirements for the electric equipment installed in explosive area, failure to observe the laws and secondary legislation of the Republic of Lithuania and the EU occupational safety and health directives could be attributed to unacceptable risk.
In terms of industrial risk, the planned Vilnius Combined Heat and Power Plant is safe, the risk is acceptable if the provisions set forth in the Law on the Maintenance of Potentially Dangerous Facilities, the regulations of operation of pressure vessels and the rules of operation of electrical equipment are observed in the course of drawing up of the design and operation. Toxic, oxidising or highly flammable substances the release into the environment of which could have major adverse effects on the surrounding residents are not used in the technological processes. In cases of emergency situations, the possible impact shall not affect residential territories or public objects. Accidental pollution emissions are only temporary, the effects on the environment and residents are insignificant or limited. Effects shall be significant only to the maintenance personnel. In pursuance of reducing the risk to the employees in the industrial area, financially feasible measures must be planned (the ALARP principle

Environmental Impact Assessment Report for Vilnius Combined Heat and Power Plant
must be applied) and the risk management documentation (plan for management of emergency situations) must be drawn up.
Environmental Impact Assessment Report for Vilnius Combined Heat and Power Plant
8. Other information
8.1. Information on the Environmental Impact Assessment forecasting and measurement methods This Chapter covers the information on the forecasting and measurement methods used for the Environmental Impact Assessment purposes. In preparing the EIA Report, the available literature information, used scientific research and monitoring data on the environmental components under consideration were summarised, the primary and secondary information data were analysed, the GIS maps were prepared and expert assessment was applied. The EIA Report contains a comparison of technologies planned to be used and the Best Available Techniques. The chemical pollution (air pollution and pollution through odours) and physical pollution (through noise) of the PEA capable of affecting the environment and public health were assessed using the mathematical modelling method using the models from the list of models recommended for the Environmental Impact Assessment of the Ministry of the Environment. The modelling of ambient air pollution and dispersion of odours was carried out using the AERMOD View mathematical model (Lakes Environmental Software, Canada). The AERMOD View model is used for controlling air quality and is intended for modelling point, area, line or volume sources. The AERMOD algorithms are intended for the calculation of the ground layer, wind, turbulence and temperature vertical profiles and hourly average concentrations (1-24 hours, monthly, annual) and for the assessment of locality types. This model has been included in the list of models recommended for the Environmental Impact Assessment of the Ministry of the Environment of the Republic of Lithuania. The obtained results are compared to the requirements of normative documents of both the European Union and the Republic of Lithuania. The assessment of the impact of noise created by the Planned Economic Activity was carried out using the CadnaA (Computer Aided Noise Abatement system) software which is aimed at noise impact calculation, visualisation, assessment and forecasting. The nearest surroundings comprising residential and public buildings ad recreational territories are assessed according to cadastral maps, data of the territorial planning documents (general, detailed and special plans) and by examining the location). Demographic and morbidity ratios are obtained from publications and reviews made public on the Hygiene Institute website (www.hi.lt) of the Lithuanian Health Indicators Information System and prepared by the Health Centre of the Hygiene Institute and Statistics Lithuania (http://www.stat.gov.lt/lt/). The Environmental Impact Assessment Report of the Planned Economic Activity – Vilnius Combined Heat and Power Plant has been prepared using the information presented in the documentation of the analogous operating combined heat and power plant – technical data of UAB Fortum Klaipėda Combined Heat and Power Plant specified in the integrated Pollution Prevention and Control Permit and Application (No KL.1-3/2014, 26 11 2014).
Environmental Impact Assessment Report for Vilnius Combined Heat and Power Plant
8.2. Information on potential significant adverse effects of the Planned Economic Activity on the environment of other countries Given that the location of Vilnius Combined Heat and Power Plant under consideration is far from the state borders, the Planned Economic Activity shall not have any significant adverse effect on the environment of other countries.
8.3. Public information and assessment of public opinion The public information documents will be presented in the EIA Report: advertisements in press, proposals from the public and their assessment, protocols of public debates concerning the EIA Report. The publicising of the EIA Report shall be carried out having regard to the Schedule of Procedures for Public Information and Participation in the Planned Economic Activity Environmental Impact Assessment Process (approved by Order No D1-370 of the Minister of Environment of the Republic of Lithuania of 15 July 2005, as subsequently amended). Information on the prepared EIA Programme was made public (Annex 2 to the EIA Programme): - on the notice board of Vilnius City Municipal Administration on 27 February 2015, - on the notice boards of Žvėrynas, Karoliniškės, Lazdynai, Pilaitė and Šeškinė neighbourhoods on 27 February 2015, - in the national press – the Newspaper Lietuvos žinios on 27 February 2015, - in the local press – in the Supplement Sostinė to the Daily Lietuvos rytas on 28 February 2015, - on the internet website of the customer at: http://www.kogen.lt/vilniaus-projektas. Within 10 working days of making public the information on the prepared EIA Programme, the letter dated 3 March 2015 was received from UAB Reenergy with comments regarding the Environmental Impact Assessment Programme. In observance of the Schedule of Procedures for Public Information and Participation in the Planned Economic Activity Environmental Impact Assessment Process (approved by Order No D1-370 of the Minister of Environment of the Republic of Lithuania of 15 July 2005) the received comments were registered according to the established form and written response was sent to UAB Reenergy regarding the incorporation of their proposals and their assessment in the process of the Environmental Impact Assessment of the Planned economic Activity. The information on received comments and their registration is provided in Annex 4 to the EIA Programme. During the EIA Programme preparation stage Lietuvos energija, UAB arranged six additional meetings with the public: Paneriai Neighbourhood on 19 February 2015; Karoliniškės Neighbourhood on 23 19 February 2015; Lazdynai Neighbourhood on 24 February 2015; Pilaitė Neighbourhood on 25 19 February 2015; Šeškinė Neighbourhood on 26 February 2015 during which the assumptions that have given rise to the Project of Vilnius Combined Heat and Power Plant were introduced, the opinion of representatives of the public was listened regarding technical characteristics of the power plant and its potential impact on the environment. Four analogous meetings with the public were organised at the stage of preparation of the EIA Report (on 6, 8 and 13 May at the premises of Lietuvos energija, UAB at the address: Žvejų g. 14, Vilnius). During these meetings the progress of preparation of the EIA and the first results of the assessment were introduced to the public and observations of the public were heard. The information for the public on the prepared EIA Report and on its publicising was made public: - in the city press – the supplement Sostinė to the daily Lietuvos rytas on 16 May 2015; - in the national press – the newspaper Lietuvos žinios on 16 May 2015;
Environmental Impact Assessment Report for Vilnius Combined Heat and Power Plant
- on the websites of the customer and preparer of the EIA documentation; - on the notice board of Vilnius City Municipal Administration; - on the notice boards of Vilnius City Paneriai Neighbourhood and other neighbourhoods; To the representatives of the public who submitted their written comments – in writing by registered mail. At the stage of public awareness-raising about the EIA programme the comments were received from UAB Reenergy. UAB Reenergy was informed about the publicising of the EIA Report in writing by registered mail. Copies of public information about the introduction of the EIA Report to the public are enclosed in Annex 18. Upon approval of the Programme, on 19 April 2015, public comments and proposals regarding the Environmental Impact Assessment Programme were received from Petras Žiupsnys, the Chairman of the Board Vilnius City Lazdynai Community Club Lazdynų senjorai; Letter dated 29 May 2015 (Letter No (15.9)-A4-5328 of the Environmental Protection Agency of 15 May 2015). On instruction of the EPA the received proposals have been taken into consideration in the EIA Report. The presented comments have been analysed by the drafters of the EIA documentation together with the economic activity organiser. The matter regarding the PEA location and the need for the territory of the land plot part planned to be used was discussed during the meeting regarding the EIA objects held in the Environmental Protection Agency before the approval of the EIA Programme. The alternative locations for the Planned Economic Activity are discussed in Sections 1.6.1 – 1.6.2 of the Environmental Impact Assessment Report of Vilnius Combined Heat and Power Plant. The matters of ownership and use of land will be analysed in detail when preparing the territorial planning documentation, if applicable legal acts of the Republic of Lithuania so require. The letter received of the concerned public and its registration form is enclosed in Annex 20. The prepared Environmental Impact Assessment Report of Vilnius Combined Heat and Power Plant was introduced to the public on 4 May 2015, 17:30, in the Grand Conference Hall on the first floor of Lietuvos energija, UAB, at the address: A. Juozapavičiaus g. 13. The meeting was attended by 45 participants. The minutes of the meeting and the list of participants is enclosed in Annex 19. The minutes have been drawn up and signed by the Chairman and Secretary of the meeting within 5 working days and made available to the public at Paneriai Neighbourhood and on the internet website: www.kogen.lt. No comments from the public have been received within three working days of the presentation of the minutes. Before and during the public presentation eight letters have been received with comments and proposals from the public. Within ten working days after the public presentation no proposals from the public have been received. All proposals and comments of the public have been registered according to the form specified in Annex 3 to the Schedule of Procedures for Public Information and Participation in the Planned Economic Activity Environmental Impact Assessment Process. Also, the substantiated assessments of public proposals have been prepared according to Form No 4 of the aforementioned Schedule of Procedures. Information on the comments received from the public, their registration and prepared assessment are presented in Annex 20. Representatives of the public who have submitted their proposals received written answers on the assessment of their proposals.
Environmental Impact Assessment Report for Vilnius Combined Heat and Power Plant
9. Summary According to the National Heat Sector Development Programme for 2015-2021 (hereinafter – the NHSDP) it is envisaged to additionally install (reconstruct or construct new) in Vilnius City district heat supply system the cogeneration facilities producing energy from renewable and (or) local energy sources. As specified in the NHSDP, the power output of these facilities would be up to 145 MW, and thermal output – up to 240 MW. The aims sought by the construction of the Combined Heat and Power Plant shall be as follows:
to achieve the maximum reduction of the price for production of heat supplied to Vilnius City district heat supply system;
to guarantee maximum and economically justified electrical and thermal energy quantities produced from local and renewable energy sources;
to increase the efficiency of heat production and to reduce the quantities of greenhouse gases;
to address the issue of waste management with the lowest costs for consumers. Planned Economic Activity It is planned to install in Vilnius City district heat supply system a high efficiency cogeneration plant burning non-hazardous waste and biomass. Pursuant to the Environmental Requirements (hereinafter referred as “Requirements”) for Waste Incineration approved by Order No 699 of the Minister of Environment of the Republic of Lithuania of 31 December 2002 (Official Gazette, 2003, No 31-1290, as subsequently amended) it is planned to build new waste incineration unit in the combined heat and power plant. Pursuant to paragraph 6.3 of the Requirements waste incineration unit is a stationary technical unit, including the entire equipment thereof, intended for the thermal treatment of waste remaining after the treatment in MBT facilities, which is unfit for recycling, but contains energy value. After thermal treatment of waste produced heat is planned to supply to Vilnius DH system. Alternatives of Planned Economic Activity Development Heat which is at present necessary for Vilnius City is produced by plants burning natural gas or other fossil fuels. This alternative reflects the current situation and potential changes in the environment if the Planned Economic Activity is not carried out and is analyzed as a “Do nothing alternative” in the PEA Report. The Environmental Impact Assessment is carried out for the PEA development alternatives by defining the PEA conditions so as to ensure the sound implementation of the tasks set in the approved NHSDP: Having regard to the goals set in the NHDSP, the Environmental Impact Assessment is carried out for the PEA Development Alternatives No 2 and No 3 by defining the PEA conditions so as to ensure the sound implementation of the tasks set in the approved NHSDP: 1. The PEA Development Alternative No 2. Additional installation in the district heating system of Vilnius City of a cogeneration power plant burning waste of up to 20 MW power output and up to 65 MW thermal output. Additional installation of a cogeneration power plant burning biomass of up to 80 MW power output and up to 175 MW thermal output. In the case of Alternative No 2, up to 160 000 t of waste and up to 620 000 t of biomass would be used in total per year for the production of energy. In the case of the PEA development Alternative No 2, the installation of a biomass preparation and storage unit is planned near the planned cogeneration power plant, which would enable to ensure the ongoing supply of the power plant with biomass and the necessary fuel reserve of 10 days established in the normative documents of the Republic of Lithuania. 2. The PEA Development Alternative No 3. Additional installation in the district heating system of Vilnius City of a multi-fuel (biomass and waste) firing cogeneration power plant of up to 45 MW power
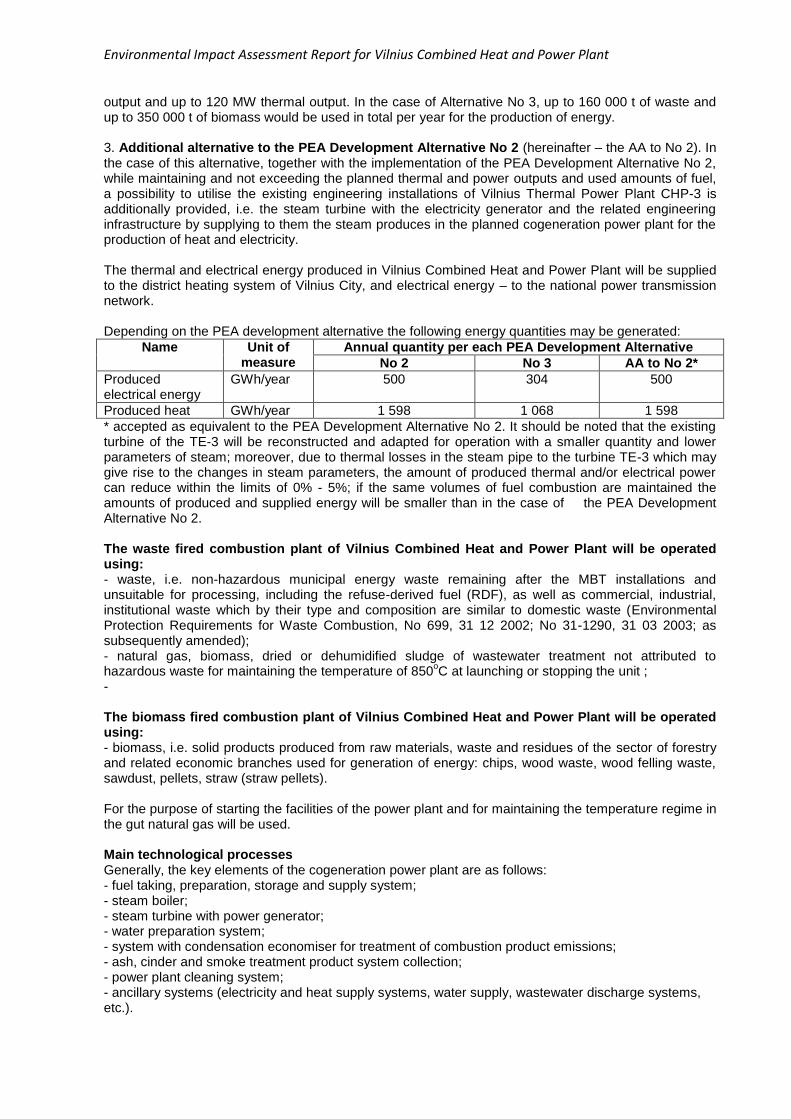
Environmental Impact Assessment Report for Vilnius Combined Heat and Power Plant
output and up to 120 MW thermal output. In the case of Alternative No 3, up to 160 000 t of waste and up to 350 000 t of biomass would be used in total per year for the production of energy. 3. Additional alternative to the PEA Development Alternative No 2 (hereinafter – the AA to No 2). In the case of this alternative, together with the implementation of the PEA Development Alternative No 2, while maintaining and not exceeding the planned thermal and power outputs and used amounts of fuel, a possibility to utilise the existing engineering installations of Vilnius Thermal Power Plant CHP-3 is additionally provided, i.e. the steam turbine with the electricity generator and the related engineering infrastructure by supplying to them the steam produces in the planned cogeneration power plant for the production of heat and electricity. The thermal and electrical energy produced in Vilnius Combined Heat and Power Plant will be supplied to the district heating system of Vilnius City, and electrical energy – to the national power transmission network. Depending on the PEA development alternative the following energy quantities may be generated:
Name Unit of measure
Annual quantity per each PEA Development Alternative
No 2 No 3 AA to No 2*
Produced electrical energy
GWh/year 500 304 500
Produced heat GWh/year 1 598 1 068 1 598
* accepted as equivalent to the PEA Development Alternative No 2. It should be noted that the existing turbine of the TE-3 will be reconstructed and adapted for operation with a smaller quantity and lower parameters of steam; moreover, due to thermal losses in the steam pipe to the turbine TE-3 which may give rise to the changes in steam parameters, the amount of produced thermal and/or electrical power can reduce within the limits of 0% - 5%; if the same volumes of fuel combustion are maintained the amounts of produced and supplied energy will be smaller than in the case of the PEA Development Alternative No 2. The waste fired combustion plant of Vilnius Combined Heat and Power Plant will be operated using: - waste, i.e. non-hazardous municipal energy waste remaining after the MBT installations and unsuitable for processing, including the refuse-derived fuel (RDF), as well as commercial, industrial, institutional waste which by their type and composition are similar to domestic waste (Environmental Protection Requirements for Waste Combustion, No 699, 31 12 2002; No 31-1290, 31 03 2003; as subsequently amended); - natural gas, biomass, dried or dehumidified sludge of wastewater treatment not attributed to hazardous waste for maintaining the temperature of 850
oC at launching or stopping the unit ;
- The biomass fired combustion plant of Vilnius Combined Heat and Power Plant will be operated using: - biomass, i.e. solid products produced from raw materials, waste and residues of the sector of forestry and related economic branches used for generation of energy: chips, wood waste, wood felling waste, sawdust, pellets, straw (straw pellets). For the purpose of starting the facilities of the power plant and for maintaining the temperature regime in the gut natural gas will be used. Main technological processes Generally, the key elements of the cogeneration power plant are as follows: - fuel taking, preparation, storage and supply system; - steam boiler; - steam turbine with power generator; - water preparation system; - system with condensation economiser for treatment of combustion product emissions; - ash, cinder and smoke treatment product system collection; - power plant cleaning system; - ancillary systems (electricity and heat supply systems, water supply, wastewater discharge systems, etc.).
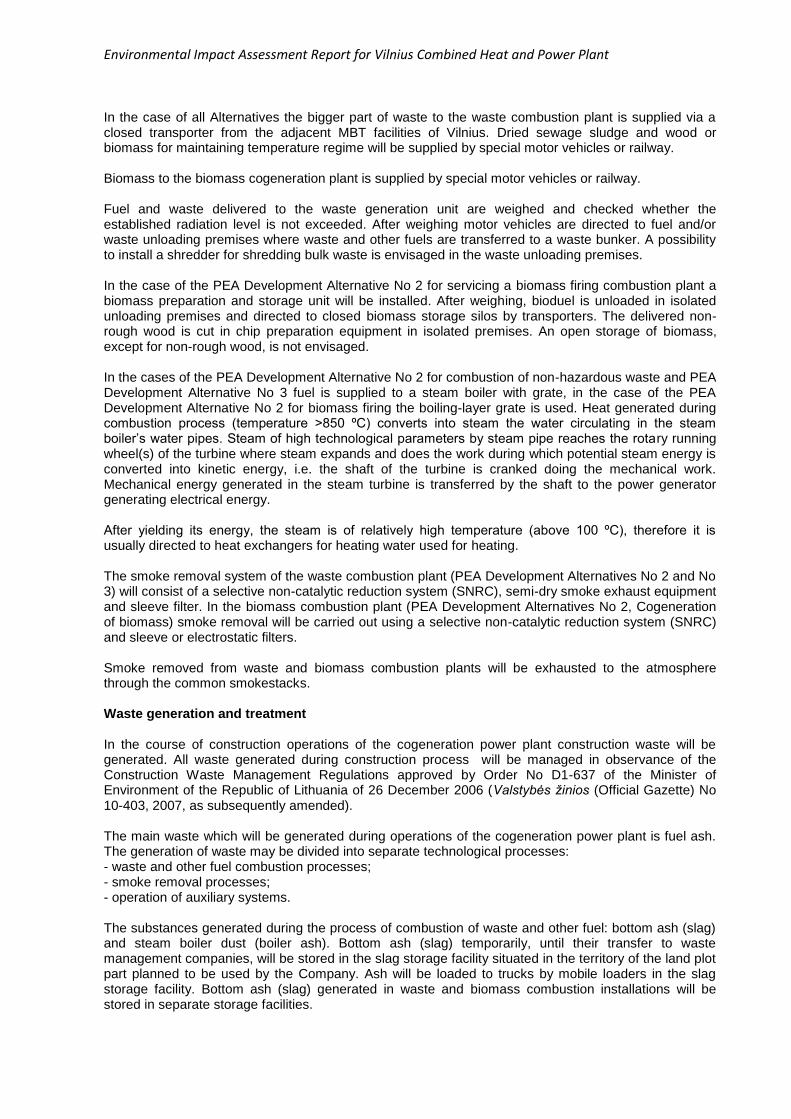
Environmental Impact Assessment Report for Vilnius Combined Heat and Power Plant
In the case of all Alternatives the bigger part of waste to the waste combustion plant is supplied via a closed transporter from the adjacent MBT facilities of Vilnius. Dried sewage sludge and wood or biomass for maintaining temperature regime will be supplied by special motor vehicles or railway. Biomass to the biomass cogeneration plant is supplied by special motor vehicles or railway. Fuel and waste delivered to the waste generation unit are weighed and checked whether the established radiation level is not exceeded. After weighing motor vehicles are directed to fuel and/or waste unloading premises where waste and other fuels are transferred to a waste bunker. A possibility to install a shredder for shredding bulk waste is envisaged in the waste unloading premises. In the case of the PEA Development Alternative No 2 for servicing a biomass firing combustion plant a biomass preparation and storage unit will be installed. After weighing, bioduel is unloaded in isolated unloading premises and directed to closed biomass storage silos by transporters. The delivered non-rough wood is cut in chip preparation equipment in isolated premises. An open storage of biomass, except for non-rough wood, is not envisaged. In the cases of the PEA Development Alternative No 2 for combustion of non-hazardous waste and PEA Development Alternative No 3 fuel is supplied to a steam boiler with grate, in the case of the PEA Development Alternative No 2 for biomass firing the boiling-layer grate is used. Heat generated during combustion process (temperature >850 ºC) converts into steam the water circulating in the steam boiler’s water pipes. Steam of high technological parameters by steam pipe reaches the rotary running wheel(s) of the turbine where steam expands and does the work during which potential steam energy is converted into kinetic energy, i.e. the shaft of the turbine is cranked doing the mechanical work. Mechanical energy generated in the steam turbine is transferred by the shaft to the power generator generating electrical energy. After yielding its energy, the steam is of relatively high temperature (above 100 ºC), therefore it is usually directed to heat exchangers for heating water used for heating. The smoke removal system of the waste combustion plant (PEA Development Alternatives No 2 and No 3) will consist of a selective non-catalytic reduction system (SNRC), semi-dry smoke exhaust equipment and sleeve filter. In the biomass combustion plant (PEA Development Alternatives No 2, Cogeneration of biomass) smoke removal will be carried out using a selective non-catalytic reduction system (SNRC) and sleeve or electrostatic filters. Smoke removed from waste and biomass combustion plants will be exhausted to the atmosphere through the common smokestacks. Waste generation and treatment In the course of construction operations of the cogeneration power plant construction waste will be generated. All waste generated during construction process will be managed in observance of the Construction Waste Management Regulations approved by Order No D1-637 of the Minister of Environment of the Republic of Lithuania of 26 December 2006 (Valstybės žinios (Official Gazette) No 10-403, 2007, as subsequently amended). The main waste which will be generated during operations of the cogeneration power plant is fuel ash. The generation of waste may be divided into separate technological processes: - waste and other fuel combustion processes; - smoke removal processes; - operation of auxiliary systems. The substances generated during the process of combustion of waste and other fuel: bottom ash (slag) and steam boiler dust (boiler ash). Bottom ash (slag) temporarily, until their transfer to waste management companies, will be stored in the slag storage facility situated in the territory of the land plot part planned to be used by the Company. Ash will be loaded to trucks by mobile loaders in the slag storage facility. Bottom ash (slag) generated in waste and biomass combustion installations will be stored in separate storage facilities.

Environmental Impact Assessment Report for Vilnius Combined Heat and Power Plant
Hazardous waste generated in the process of removal of smoke (waste combustion, Alternative No 2 and No 3) – boiler ash containing hazardous chemical substances and solid waste from smoke removal. Boiler ash and exhaust gas removal residues will account for about 4% of the quantity of waste supplied to the plant. Boiler ash consists of fine particles/dust (occurring in the flow of exhaust gas after burning of waste) and gas removal reagents/products (e.g., lime reacting with various pollutants present in exhaust gas, activated carbon, salts), removed from the flow of exhaust gas. The main components of fly ash are carbon and metal oxides and fine particles of various organic compounds which are capable of joining a large specific area. Whereas residue of sleeve filters have high lime content (from semi-dry exhaust reactor). After smoke removal process, fly ash and solid particles will be transferred to the end-product bunker. Hazardous waste will be temporarily stored until transfer to licensed hazardous waste management companies for storage in special premises. Such hazardous waste will be loaded and transported to licensed hazardous waste management companies by special motor transport adapted for this purpose in order to avoid danger for public health and environment. Waste generated from operation of auxiliary systems in the process of Company’s activities: used lubricating oil, run-off rainwater sludge, waste of sand collectors and petroleum products, absorbents, substances of filters, packaging, contaminated protective clothing, motor vehicle maintenance waste, fluorescent lamps, glass, plastic and paper as well as mixed municipal waste. Mixed non-hazardous municipal waste which will be generated in auxiliary systems and other waste to be generated by economic activity will be transferred to licensed waste collection and management companies on contractual basis. Water According to the data of the Cadastre of Rivers, Lakes and Ponds, the land plot, cadastral No 0101/0067:21 does not fall within protective stripes or zones of water bodies. The water bodies in the closest proximity to the land plot, cadastral No 0101/0067:21 are water bodies of Bukčiai and Jankiškiai, situated within 1.17 and 1.47 km distance respectively. The land plot, cadastral No 0101/0067:21, falls within the boundaries (stripe No 3) of chemical pollution of Vilnius, Bukčiai and Jankiškės. Water supply in Vilnius Combined Heat and Power Plant will be ensured by connecting to district water supply system of UAB Vilniaus vandenys. Water taken from district water supply system will be used for economic – household needs of employees, maintenance of premises and for industrial needs of the power plant – in technological processes and for testing of fire-fighting equipment. The total quantity of water envisaged to be used in the operations of Vilnius Combined Heat and Power Plant will be 219 393.3 and 163 581.5 m
3 per year for the PEA Development Alternatives No 2 and No 3, respectively.
Waste generated during the PEA in Vilnius Combined Heat and Power Plant will be economic – household, industrial, run-off rainwater and water after testing of fire-fighting equipment. Wastewater according to separate contracts will be released into sewage networks of UAB Vilniaus vandenys and UAB Grinda. Potentially polluted run-off rainwater from asphalted sites and hard surfaces before release to run-off rainwater systems will be collected and transferred to local run-off rainwater treatment facilities: it is envisaged to install a sand and oil collector. Ambient air The ambient air in the process of the Planned Economic Activity will be polluted with ambient air pollutants generated during the principal and ancillary operations via stationary and mobile ambient air pollution sources. In the process of the principal operations of the Planned Economic Activity the ambient air will be polluted with waste and biomass combustion products generated during production of thermal and electrical energy. The impact on the ambient air is analysed for two PEA Development Alternatives:
the PEA Development Alternative No 2 – installation of a waste fired unit of up to 20 MW power output and up to 20 MW thermal output, and a biomass fired cogeneration plant of up to 80 MW power output and up to 175 MW thermal output.

Environmental Impact Assessment Report for Vilnius Combined Heat and Power Plant
the PEA Development Alternative No 3 – installation of waste and biomass fired cogeneration power plant of up to 45 MW power output and up to 120 MW thermal output.
In the case of both Alternatives, the following pollutants of the ambient air will be released to the environment in the process of waste and biomass combustion: nitrogen dioxide, solid particles, carbon monoxide, sulphur dioxide, hydrochloride, total organic carbon, cadmium, thallium and their compounds, mercury and its compounds, antimony, arsenic, lead, chrome, cobalt, copper, manganese, nickel, vanadium and their compounds, dioxins and furans, ammonia.
Ancillary operations of the PEA will include transportation of waste and raw materials, transhipment and storage of raw materials (activated carbon, lime) and Waste (fly ashes), charging of accumulators and operation of diesel generator. In the case of the PEA Development Alternative No 2 the biomass preparation and storage unit is planned which will be used for keeping, cutting and granulation of biomass. In the process of ancillary operations carbon monoxide, nitrogen dioxide, solid particles, sulphur dioxide, sodium hydroxide and sulphur acid will be released to the environment. Under the PEA Development Alternative No 2 two separate units will be built – a waste fired unit and a biomass-fired unit. During this PEA Development Alternative these air pollution sources will be active: stack (o.t.š. No 001), water preparation unit (o.t.š. No 002), waste bunkers of the waste combustion plant (o.t.š. No 003 – 006), power generator (o.t.š. No 007), fly ash bunker (o.t.š. No 008), activated carbon and lime bunkers (o.t.š. No 009 – 011), bottom ash room (o.t.š. No 012), charging of accumulators (o.t.š. No 013), biomass preparation unit (o.t.š. No 014 – 017). In the case of the PEA Development Alternative No 2 the emission quantities of pollutants during the principal and ancillary activities will amount to 1 703 268 t per year, the major part of which will comprise combustion products from the biomass power plant. Under the PEA Development Alternative No 3 one multi-fuel (waste and biomass) firing cogeneration unit will be installed. The generated combustion products will be discharged via 80 height stack. During this PEA Development Alternative these air pollution sources will be active: stack (o.t.š. No 001), 12 air pollution sources will be active: stack (o.t.š. No 001), water preparation unit (o.t.š. No 002), waste bunkers of the waste combustion plant (o.t.š. No 003 – 006), power generator (o.t.š. No 007), fly ash bunker (o.t.š. No 008), activated carbon and lime bunkers (o.t.š. No 009 – 011), bottom ash room (o.t.š. No 012), charging of accumulators (o.t.š. No 013). In the case of the PEA Development Alternative No 2 the emission quantities of pollutants during the principal and ancillary activities will amount to 1 038 939 t per year. Mathematical modelling of dispersion of pollutants was carried out using the software package “ISC-AERMOD View”, AERMOD mathematical model aimed at simulation of dispersion in the environment of pollutant emissions from complexes of industrial sources. For the purpose modelling the meteorological data of Vilnius Hydrometeorological Station submitted by Vilnius Hydrometeorological Service were used. The meteorological data package covers the values of the main four meteorological parameters of the period 2010-2014 inclusive per each hour of the year: the ambient temperature, wind speed and direction, cloudiness. The results of mathematical simulation of dispersion of emissions in the ambient air in the case of the PEA Development Alternative No 2 show that not a single pollutant exceeds the limit values. The maximum total average annual concentration of antimony, arsenic, lead, chrome, cobalt, copper, manganese, nickel and vanadium is 24 % of the limit value applicable to cadmium and its compounds and is 20 % of the limit value applicable to arsenic and its compounds. Average concentrations of sulphur dioxide of 1 hour and 24 hours account for about 10 % of the limit value and average concentration of nitrogen dioxide of 1 hour – about 7 % of the limit value. Calculated maximum concentrations for the remaining pollutants varied only from 4x10
-8 to 6% of the limit value.
Calculated maximum concentrations of pollutants with estimated background pollution (existing and planned sources of pollution) do not exceed the limit values for any of the pollutants. The average annual average concentration of solid particles (SP10) is 88 % and of 24 hours – 72 % of the limit value. The average annual average concentration of nitrogen is 81 % and hourly concentration – 31 % of the limit value. The average hourly average concentration of ammonia is 68 % of the limit value.
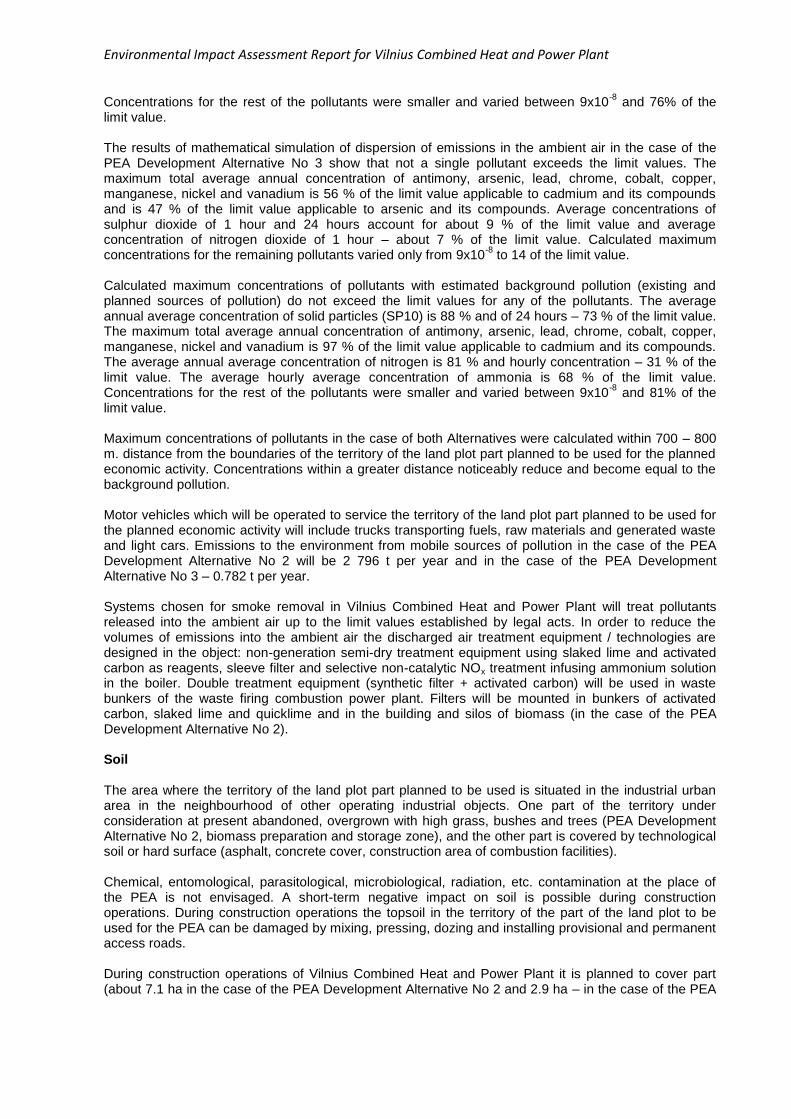
Environmental Impact Assessment Report for Vilnius Combined Heat and Power Plant
Concentrations for the rest of the pollutants were smaller and varied between 9x10⁻⁸
and 76% of the limit value. The results of mathematical simulation of dispersion of emissions in the ambient air in the case of the PEA Development Alternative No 3 show that not a single pollutant exceeds the limit values. The maximum total average annual concentration of antimony, arsenic, lead, chrome, cobalt, copper, manganese, nickel and vanadium is 56 % of the limit value applicable to cadmium and its compounds and is 47 % of the limit value applicable to arsenic and its compounds. Average concentrations of sulphur dioxide of 1 hour and 24 hours account for about 9 % of the limit value and average concentration of nitrogen dioxide of 1 hour – about 7 % of the limit value. Calculated maximum concentrations for the remaining pollutants varied only from 9x10
-8 to 14 of the limit value.
Calculated maximum concentrations of pollutants with estimated background pollution (existing and planned sources of pollution) do not exceed the limit values for any of the pollutants. The average annual average concentration of solid particles (SP10) is 88 % and of 24 hours – 73 % of the limit value. The maximum total average annual concentration of antimony, arsenic, lead, chrome, cobalt, copper, manganese, nickel and vanadium is 97 % of the limit value applicable to cadmium and its compounds. The average annual average concentration of nitrogen is 81 % and hourly concentration – 31 % of the limit value. The average hourly average concentration of ammonia is 68 % of the limit value. Concentrations for the rest of the pollutants were smaller and varied between 9x10
-8 and 81% of the
limit value. Maximum concentrations of pollutants in the case of both Alternatives were calculated within 700 – 800 m. distance from the boundaries of the territory of the land plot part planned to be used for the planned economic activity. Concentrations within a greater distance noticeably reduce and become equal to the background pollution. Motor vehicles which will be operated to service the territory of the land plot part planned to be used for the planned economic activity will include trucks transporting fuels, raw materials and generated waste and light cars. Emissions to the environment from mobile sources of pollution in the case of the PEA Development Alternative No 2 will be 2 796 t per year and in the case of the PEA Development Alternative No 3 – 0.782 t per year. Systems chosen for smoke removal in Vilnius Combined Heat and Power Plant will treat pollutants released into the ambient air up to the limit values established by legal acts. In order to reduce the volumes of emissions into the ambient air the discharged air treatment equipment / technologies are designed in the object: non-generation semi-dry treatment equipment using slaked lime and activated carbon as reagents, sleeve filter and selective non-catalytic NOx treatment infusing ammonium solution in the boiler. Double treatment equipment (synthetic filter + activated carbon) will be used in waste bunkers of the waste firing combustion power plant. Filters will be mounted in bunkers of activated carbon, slaked lime and quicklime and in the building and silos of biomass (in the case of the PEA Development Alternative No 2). Soil The area where the territory of the land plot part planned to be used is situated in the industrial urban area in the neighbourhood of other operating industrial objects. One part of the territory under consideration at present abandoned, overgrown with high grass, bushes and trees (PEA Development Alternative No 2, biomass preparation and storage zone), and the other part is covered by technological soil or hard surface (asphalt, concrete cover, construction area of combustion facilities). Chemical, entomological, parasitological, microbiological, radiation, etc. contamination at the place of the PEA is not envisaged. A short-term negative impact on soil is possible during construction operations. During construction operations the topsoil in the territory of the part of the land plot to be used for the PEA can be damaged by mixing, pressing, dozing and installing provisional and permanent access roads. During construction operations of Vilnius Combined Heat and Power Plant it is planned to cover part (about 7.1 ha in the case of the PEA Development Alternative No 2 and 2.9 ha – in the case of the PEA
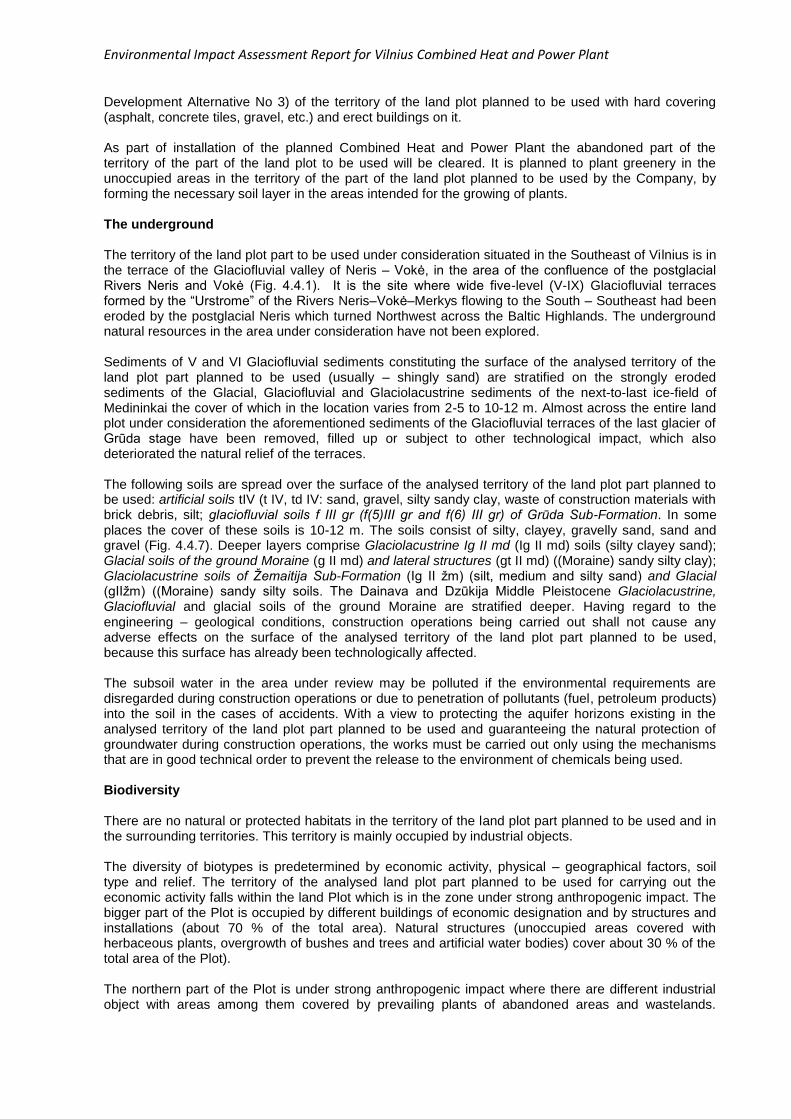
Environmental Impact Assessment Report for Vilnius Combined Heat and Power Plant
Development Alternative No 3) of the territory of the land plot planned to be used with hard covering (asphalt, concrete tiles, gravel, etc.) and erect buildings on it. As part of installation of the planned Combined Heat and Power Plant the abandoned part of the territory of the part of the land plot to be used will be cleared. It is planned to plant greenery in the unoccupied areas in the territory of the part of the land plot planned to be used by the Company, by forming the necessary soil layer in the areas intended for the growing of plants. The underground The territory of the land plot part to be used under consideration situated in the Southeast of Vilnius is in the terrace of the Glaciofluvial valley of Neris – Vokė, in the area of the confluence of the postglacial Rivers Neris and Vokė (Fig. 4.4.1). It is the site where wide five-level (V-IX) Glaciofluvial terraces formed by the “Urstrome” of the Rivers Neris–Vokė–Merkys flowing to the South – Southeast had been eroded by the postglacial Neris which turned Northwest across the Baltic Highlands. The underground natural resources in the area under consideration have not been explored. Sediments of V and VI Glaciofluvial sediments constituting the surface of the analysed territory of the land plot part planned to be used (usually – shingly sand) are stratified on the strongly eroded sediments of the Glacial, Glaciofluvial and Glaciolacustrine sediments of the next-to-last ice-field of Medininkai the cover of which in the location varies from 2-5 to 10-12 m. Almost across the entire land plot under consideration the aforementioned sediments of the Glaciofluvial terraces of the last glacier of Grūda stage have been removed, filled up or subject to other technological impact, which also deteriorated the natural relief of the terraces. The following soils are spread over the surface of the analysed territory of the land plot part planned to be used: artificial soils tIV (t IV, td IV: sand, gravel, silty sandy clay, waste of construction materials with brick debris, silt; glaciofluvial soils f III gr (f(5)III gr and f(6) III gr) of Grūda Sub-Formation. In some places the cover of these soils is 10-12 m. The soils consist of silty, clayey, gravelly sand, sand and gravel (Fig. 4.4.7). Deeper layers comprise Glaciolacustrine Ig II md (Ig II md) soils (silty clayey sand); Glacial soils of the ground Moraine (g II md) and lateral structures (gt II md) ((Moraine) sandy silty clay); Glaciolacustrine soils of Žemaitija Sub-Formation (Ig II žm) (silt, medium and silty sand) and Glacial (gIIžm) ((Moraine) sandy silty soils. The Dainava and Dzūkija Middle Pleistocene Glaciolacustrine, Glaciofluvial and glacial soils of the ground Moraine are stratified deeper. Having regard to the engineering – geological conditions, construction operations being carried out shall not cause any adverse effects on the surface of the analysed territory of the land plot part planned to be used, because this surface has already been technologically affected. The subsoil water in the area under review may be polluted if the environmental requirements are disregarded during construction operations or due to penetration of pollutants (fuel, petroleum products) into the soil in the cases of accidents. With a view to protecting the aquifer horizons existing in the analysed territory of the land plot part planned to be used and guaranteeing the natural protection of groundwater during construction operations, the works must be carried out only using the mechanisms that are in good technical order to prevent the release to the environment of chemicals being used. Biodiversity There are no natural or protected habitats in the territory of the land plot part planned to be used and in the surrounding territories. This territory is mainly occupied by industrial objects. The diversity of biotypes is predetermined by economic activity, physical – geographical factors, soil type and relief. The territory of the analysed land plot part planned to be used for carrying out the economic activity falls within the land Plot which is in the zone under strong anthropogenic impact. The bigger part of the Plot is occupied by different buildings of economic designation and by structures and installations (about 70 % of the total area). Natural structures (unoccupied areas covered with herbaceous plants, overgrowth of bushes and trees and artificial water bodies) cover about 30 % of the total area of the Plot). The northern part of the Plot is under strong anthropogenic impact where there are different industrial object with areas among them covered by prevailing plants of abandoned areas and wastelands.
Environmental Impact Assessment Report for Vilnius Combined Heat and Power Plant
Natural surroundings in the southern part of the Plot are a bit more diversified with biotypes being formed by mosaic of bushes and mesophyte meadows. No animal species inscribed on the List of Protected Species of Animals, Plants and Mushrooms of the Republic of Lithuania (hereinafter – the List of Protected Species) or Annexes II and IV of the European Union Habitats Directive (hereinafter – the Habitats Directive) have been observed in the territory of the land plot part planned to be used. Given that the Plot is situated in the urbanised territory and its natural environment is under the impact of anthropogenic activities, only small mammalian species can be found here. The prevalent species include (Muridae) rodents and rarely occurring European (mountain) hares (Lepus europaeus). The planned economic activity will not have any significant impact on the natural environment: flora and fauna and protected territories, therefore no mitigation measures are envisaged. Landscape According to the morphological regionalisation the analysed territory of the land plot part planned to be used falls within the Southern Baltic Lowland Zone (F), the Neris midstream woody urbanised river sub-valley zone (35) of the midstream Lowland area of the River Neris (XV) (The National Atlas of Lithuania, internet access: www.geoportal.lt). Surroundings of the analysed territory of the land plot part planned to be used. The type of landscape prevailing in the surroundings of the analysed territory of the land plot part planned to be used is acculturated, agrarian urbanised landscape characteristic of valleys, which is supplemented by heights of urban complexes. The visual surroundings of the territory of the land plot part planned to be used due to its dislocation in business, production and industrial territory from the aesthetic point of view is poor. Considering the existing composition of the territorial and spatial dominants of the territory it should be forecasted that the PEA will not have any impact on the general structure of the landscape of this locality, but it will have a visual and aesthetic impact due to massiveness of the main buildings of the power plant (administrative and control building and steam boiler building and also by the height of some structures (stacks). Due to the big height of the object, there is no technologically possibility to apply measures minimising the visual and aesthetic effect. The aesthetic effect will have to be minimised in other stages of the territorial planning and construction technical design by selecting architectural and design solutions most suited to the locality and concretising the land plot development regulation. Socio-economic environment The implementation of the Project of Vilnius Combined Heat and Power Plant is of economic significance for the State. The essential task of the heat sector reform is to facilitate the changeover from the use of fossil fuels to the use of the local and/or renewable fuels. The planned economic Activity will essentially contribute to the fossil fuel import reduction. The National Heat Sector Development Programme for 2015–2021 provides that investments into the Project of Vilnius Combined Heat and Power Plant can amount to EUR 328 million. When new plants the aggregate thermal energy production capacity would reach up to 240 MW per year (Alternative No 2) are put into operation, about 50 % of heat demand of Vilnius City would be satisfied. This would allow reaching the goal set in the National Heat Sector Development Programme – to reduce the heat production price by not less than 20 % compared with 2013. The PEA Development Alternative No 2 corresponds more closely with the goal of the National Heat Sector Development Programme for 2015–2021, i.e. “to reduce thermal energy prices and environmental pollution giving priority to the renewable and/or local energy sources in the fuel balance used for energy generation”. In the case of production of electricity by Vilnius Combined Heat and Power Plant, depending on the alternative, the quantity of electrical energy generated annually would make up about 2 % - 5.2 % of the total electrical energy demand of Lithuania. After construction of the planned electrical energy connections between Lithuania and Sweden (NordBalt connection) as well as Poland (LitPolLink) connection by end-2015, the Lithuania electrical energy producers will actually operate in the common
Environmental Impact Assessment Report for Vilnius Combined Heat and Power Plant
energy market. Given that due to the market size the Scandinavian market will be a decisive factor affecting changes in the price of electrical energy in Lithuania and that the amount of electrical energy planned to be produces does not reach even 10 % of demand in Lithuania, none of the analysed Alternatives will have significant impact on the electricity price development tendencies. However, local competitive production of electrical energy will significantly contribute to the improvement of the country’s balance of payments and of energy security (Alternative No 2). In the cases of all development alternatives the Planned Economic Activity will not have any negative impact on the socio-economic environment and no additional mitigation measures are therefore envisaged. The planned activities of Vilnius Combined Heat and Power Plant will be carried out in the business, production and industrial territory; technologies, business methods and means will comply with the best available techniques (hereinafter – the BAT) (for more detail see Chapter 2.2 of the PEA Report “Comparison of suggested production methods and equipment with the BAT”). To reduce conflicts with the society in the course of operation of Vilnius Combined Heat and Power Plant an ongoing monitoring of air pollution is planned on the basis of the Environmental Protection Regulations and the publication of its data. Vilnius Combined Heat and Power Plant controlled by the state enterprise (holding no less than 51 % of shares) will be open to the public. Cultural objects The Land Plot under consideration does not fall within the territories of registered cultural objects or their protection zones and does not border with them. The nearest registered object of cultural heritage is situated within 1.1 km distance from the analysed part of the Land Plot, on the other bank of the River Neris – Gudeliai and Lenkiškės Borrows, called “Swedborrows” (5644). A boundary of the protective zone of the cultural heritage object – Naravai Mound (17206) lies within about 200 m distance from the boundary of the analysed land plot part. The nearest cultural heritage objects are far from the territory of the land plot part planned to be used, therefore, the Planned Economic activity will not affect the registered cultural objects. The PEA will be carried out within already installed industrial territory and land excavation works which might affect the protection of archaeological objects will not be carried out outside the boundaries of the territory of the land plot part planned to be used. Consequently, the PEA will not affect the cultural heritage objects and thus no mitigation measures are required. Public health The performed assessment of noise, ambient air pollution and odour dispersion from Vilnius Combined Heat and Power Plant – the Planned Economic Activity of Lietuvos energija, UAB for the two cases of the PEA Development Alternatives (points 4.9.4.1 through 4.9.4.3) showsthat in both cases of the PEA Development Alternatives the permissible limit values regulated by health care and other legal normative acts are not exceeded by any the pollution factors near the boundary of the Planned Economic Activity territory of the land plot part planned to be used. The results of calculation of the forecasted spreading of noise created by he Planned Economic Activity – Vilnius Combined Heat and Power Plant show that the forecasted level of noise created by the activities in both cases of the PEA Development Alternatives during all three periods (day, evening and night) reduces to the maximum permissible noise limit values at the very boundaries of territory of the land plot part planned to be used by Vilnius Combined Heat and Power Plant and near the boundaries of the territory of the land plot part planned to be used does not exceed the maximum allowable noise limit values in residential and public buildings and in their environments established by the Lithuanian Hygiene Norm HN 33:2011 “Noise limit values in residential and public buildings and in their environments” during all three time periods (day, evening and night). Therefore, in all cases of the PEA Development Alternatives, the SPZ limits can be superposed with the boundaries of the PEA territory of the land plot part planned to be used. By setting the SPZ limits within the boundaries of the territory of the land plot part planned to be used it will be guaranteed that noise pollution from Vilnius Combined
Environmental Impact Assessment Report for Vilnius Combined Heat and Power Plant
Heat and Power Plant outside the SPZ limits will not exceed the limit values regulated by the Lithuanian Hygiene Norm HN 33:2011 during all three periods (day, evening and night). The results of calculation of the forecasted ambient air pollution from the Planned Economic Activity – Vilnius Combined Heat and Power Plant show that maximum ground surface concentrations of air pollutants resulting from the activities in both cases of the PEA Development Alternatives do not reach the limit values with or without background pollution within and outside the boundaries of the PEA territory of the land plot part planned to be used. Accordingly, the forecasted pollution of the ambient air does not affect the size of the SPZ established for the activities of Vilnius Combined Heat and Power Plant. Having set the SPZ limits within the boundaries of the territory of the land plot part planned to be used it will be guaranteed that ambient air pollution from Vilnius Combined Heat and Power Plant outside the SPZ limits will not exceed the limit values laid down by legal acts. The forecasted concentrations of odours from the Planned Economic Activity – Vilnius Combined Heat and Power Plant show that in both cases of the PEA Development Alternatives they do not reach the maximum permissible limit value of odour concentration regulated by the Lithuanian Hygiene Norm HN 121:2010 “Odour concentration limit value in the air of living environment” neither within the PEA territory of the land plot part planned to be used nor at the boundaries of the territory of the land plot part planned to be used. Therefore, the odour pollution does not affect the SPZ size established for Vilnius Combined Heat and Power Plant. Having assessed the data of calculation of the forecasted emissions of pollutants from Vilnius Combined Heat and Power Plant (Jočionių g. 13, Vilnius) – the Planned Economic Activity of Lietuvos Energija, UAB, it is concluded that in the cases of both PEA Development Alternatives the SPZ limits can be superposed with the boundaries of the territory of the land plot part planned to be used (Fig. 4.9.21 and 4.9.22). Therefore, the provision of the Rules for Determining the Limits and Regime of Sanitary Protective Zones approved by Order No V-586 of the Minister of Health of the Republic of Lithuania of 14 August 2004, which requires that chemical, physical and ambient air pollution, odours or other emissions the limit values of which are regulated by legal normative acts do not exceed the emission limit values established by legal normative acts for residential environment and/or environment of public buildings, and the Planned Economic Activity carried out in the locality under consideration will not have adverse effects on public health. Monitoring The monitoring of technological processes, pollutants discharged/released from pollution sources and impact on the quality of environment (environmental impact) will be carried out in Vilnius Combined Heat and Power Plant. The monitoring of technological processes will cover the measurements of working parameters of the process: temperature near the inner wall of the combustion chamber or other typical measurement spots, oxygen concentration, amount of water vapour in exhaust gases and pressure and temperature of exhaust gases. The monitoring of pollutants discharged/released from pollution sources will cover the ongoing measurements of NOx, CO, dust (total quantity), total organic carbon (TOC), HCI, HF, SO2 from stacks of the Combined Heat and Power Plant. The monitoring of other emissions will be carried out as follows: the monitoring of ammonia will be carried out once a year, the monitoring of heavy metals – 2-4 times per year depending on the selected PEA Development Alternative, and the monitoring of dioxins and furans – twice a year. The monitoring of ammonia, solid particles, nitrogen oxide from fuel bunkers, electricity generator, activated carbon bunker, biomass building and biomass silos as well as bottom ash facility will be carried out once a year and the monitoring of sulphur dioxin – 4 times a year for the PEA Development Alternative No 2, or once a year for the PEA Development Alternative No 3. The envisaged monitoring of industrial wastewater discharges: in the case of the PEA Development Alternative No 2, the minimum annual sampling frequency in the discharged wastewater will be monitored once a month and in the case of the PEA Development Alternative No 3 the minimum annual
Environmental Impact Assessment Report for Vilnius Combined Heat and Power Plant
sampling frequency in the discharged wastewater will be quarterly. Concentrations of BOD7, petroleum products and suspended substances will also be monitored. It is established that the monitoring of run-off rainwater will be carried out once in three months. Concentrations of BOD7, petroleum products and suspended substances will be monitored before and after treatment of the run-off rainwater. In the ambient air, the monitoring of chrome, cobalt and vanadium will be carried out, and the number of measurements will not be less than 12 times per year. Risk analysis The risk analysis of emergency situations in respect of the Planned Economic Activity is analysed in observance of the Risk Assessment Recommendations for Potential Accidents of the Planned Economic Activity. Technological installations of Vilnius Combined Heat and Power Plant (steam heating boilers, pressure vessels, pressure steam pipes and hot water pipes, etc.) fall within the sphere of regulation of the Republic of Lithuania Law on Surveillance of Potentially Dangerous Equipment (2 May 1996, No I-1324; Valstybės žinios (Official Gazette) No 46-1116, 1996, as subsequently amended). Substances and preparations used in the technological process include ammonium NH3 solution of 24%-25%, calcium hydroxide (Ca(OH)2), quicklime, activated carbon, sodium chloride (NaCl), sodium phosphate (Na3PO4) and sodium hydroxide or caustic soda (NaOH), ethylene-glycol (HO-CH2CH2-OH). The hazardous substances do not fall within the category of flammable or highly flammable substances and do not create explosive environments with oxygen present in the atmosphere. Explosive environments may occur because of wood and dried flammable waste dust in closed areas of storage facilities and installations of their supply to guts where it is difficult to control the accumulation and removal of dust. At the stage of the EIA a preliminary assessment of technological installations of the PEA is carried out considering the main planned activities and without elaborating on the technological process, because the latter is detailed when preparing the construction technical design of the object. Without detailing the technological installations, 10 hazards resulting from technological processes being carried out or breakdowns, including the human factor, have been distinguished by risk analysis, i.e. human errors, 6 hazards of the natural origin, including natural disasters and catastrophic meteorological phenomena, the hazards emanating from physical phenomenon, collapses of buildings and structures, including those caused by human factor – construction defects and design mistakes. Out of these potential hazards 20 significant risk factors have been distinguished with limited and substantial effects identified for people, only for staff of the Power Plant and components of the nature. Almost all these factors are probable or of low probability, matrix risk factor 2D-3B (probable with limited effects and low probability with substantial effects). The impact on property is related solely to the PEA operator’s property. The impact resulting from operation of technological facilities and breakdowns, as a rule, is limited, and in few cases – substantial; the breakdowns are probable, risk factor2D-3B, diversions or significant errors in the Power Plant control system 4B (very low probability with extremely substantial effects). The impact resulting from construction defects or design mistakes can have catastrophic consequences for the property, but the probability of such mistakes is practically equal to zero (risk factor 5A). Significant risk factors included in the risk matrix fall within the category of average risk which is acceptable as unavoidable; recommending however to use financially sound measuresto mitigate it (the ALARP approach). The key instrument of application of the ALARP approach is the Best Available Technique and observance of requirements of best practices in preparing the technical design and in operating the Combined Heat and Power Plant.
Environmental Impact Assessment Report for Vilnius Combined Heat and Power Plant
In terms of industrial risk, the planned Vilnius Combined Heat and Power Plant is safe; in emergency its effect on the environment and people does not exceed the threshold, provided that the design is drawn up and operations are carried out in compliance with provisions of the Law on Surveillance of Potentially Dangerous Equipment, Regulations for the Use of Pressure Vessels and Rules for the Operation of Power Installations. Main conclusions of the Environmental Impact Assessment The completed Environmental Impact Assessment has not shown any limiting effects on the environment, its individual components or public health in the cases of all Vilnius Combined Heat and Power Plant Development Alternatives: - no emissions into run-off rainwater, groundwater, soil or the underground are expected; - the calculated ambient air emission values do not exceed the established limit values near the boundary of the PEA territory of the land plot part planned to be used; - the calculated forecasted noise levels in the surroundings of the nearest residential areas and outside the boundaries of the territory of the land plot part planned to be used for the PEA Development Alternatives No 2 and No 3 during all three periods (day, evening and night) in the environments of residential houses and public buildings (excluding buildings of catering and cultural designation) do not exceed the limit values set by the Lithuanian Hygiene Norm HN 33:2011; - in the case of both PEA Development Alternatives, for the purpose of organising the traffic for the servicing transport along Dubiškių, Paneriškių and Jočionių Streets, the calculated forecasted level of noise created by the servicing transport in the nearest residential environment, considering the existing traffic flows and applied noise reduction measures, will not exceed the limit values set by legal acts regulating public health; - the odour concentrations in the ambient air of average hourly interval will not exceed the limit value of 8 OUE/m
3;
- the territory of the land plot part planned to be used for the operation of Vilnius Combined Heat and Power Plant does not fall within the boundaries of the protected or cultural heritage territories and complies with the solutions of the applicable General Plan of Vilnius City Municipality. Results of the performed Environmental Impact Assessment show that in terms of environmental impact, the development of the Planned Economic Activity is possible choosing any of the analysed Planned Economic Activity Development Alternatives.
Environmental Impact Assessment Report for Vilnius Combined Heat and Power Plant
Literature Order No AV-200 of the Director of the Environmental Protection Agency of 14 December 2004 on the Approval of Recommendations for the Selection of the Emission Calculation Models for Assessing the Impact of Economic Activities on the Ambient Air (Valstybės žinios (Official Gazette) No 143-5768, 2008). Construction of the Thermal Biomass and Waste Power Plant in Klaipėda; Environmental Impact Assessment Report, 2009; UAB AF-Enprima EC Reference Document on the Best Available Techniques (BAT) for Waste Incineration, 2005 Directive 91/689/EEC of the European Council of 12 December 1991 on hazardous waste Directive 92/42/EEC of the European Parliament and of the Council of 11 February 2004 on the promotion of cogeneration based on a useful heat demand in the internal energy market and amending Directive 92/42/EEC Directive 2008/98/EC of the European Parliament and of the Council of 19 November 2008 on waste and repealing certain Directives Directive 2009/28/EC of the European Parliament and of the Council of 23 April 2009 on the promotion of the use of energy from renewable sources and amending and subsequently repealing Directives 2001/77/EC and 2003/30/EC Directive 2010/75/EC of the European Parliament and of the Council of 24 November 2010 on industrial emissions (integrated pollution prevention and control (Recast) Directive 2012/37/EU of the European Parliament and of the Council of 25 October 2012 on energy efficiency, amending Directives 2009/125/EC and 2010/30/EU and repealing Directives 2004/8/EC and 2006/32/EC Geoportal. Significant Natural Habitats of the European Community; internet access: https://www.geoportal.lt/map/ Guobytė R. 2012. Quaternary Geological and Geomorphological Maps of Vilnius City, M 1:10 000; Explanatory Letter/S. Stankevičiūtė (responsible executor); Development of the Geological Database of Vilnius City; Report; Lithuanian Geological Survey, Vilnius. – Book II, p. 92; (Geological Fund) Guobytė R. 2014. Quaternary Geology and Geomorphology of Vilnius City; Lithuanian Geological Survey, Vilnius; (http://www.lgt.lt/images/LGT_leidiniai/Vilniaus_Q-geol_ir_geomorfolog_2014.pdf) Integrated Pollution Prevention and Control Reference Document on the Best Available Techniques (BAT) for Waste Incineration, 2006, EC Jusienė A. 2007. Stratigraphical and Genetic Review of Quaternary Cross-Sections / Lithuanian Geological Survey, Vilnius, p.11 (Geological Fund) Kaunas Technology University, 2015; Fuel characteristics survey analysis The Red Book of Lithuania, 2007; V. Rašomavičius (Chief Editor), et al, Vilnius; Lututė Order No 217 of the Minister of Environment of the Republic of Lithuania of 14 July 1999 on the Approval of Waste Management Regulations (Valstybės žinios (Official Gazette) No 63-2065, 1999) Order No 367 of the Minister of Environment of the Republic of Lithuania of 16 July 2002 on the Approval of Risk Assessment Recommendations for Potential Accidents of the Planned Economic Activity (Valstybės žinios (Official Gazette) No 61-297, 2002)
Environmental Impact Assessment Report for Vilnius Combined Heat and Power Plant
Order No D1-636 of the Minister of Environment of the Republic of Lithuania of 23 December 2005 on the Approval of the Regulations for the Preparation of the Environmental Impact Assessment Programme and Report (Valstybės žinios (Official Gazette) No 6-225, 2006; No 79-3138, 2008; No 89-4729, 2010) Order No D1-370 of the Minister of Environment of the Republic of Lithuania of 15 June 2005 on the Approval of the Schedule of Procedures for Public Information and Participation in the Planned Economic Activity Environmental Impact Assessment Process (Valstybės žinios (Official Gazette) No 93-3472, 2005; No 143-5750, 2008; No 2-81, 2010; No 89-4732, 2010; No 108-5122, 2011; No 102-5207, 2012) Draft National Heat Sector Development Programme for 2014-2020 submitted for coordination by the Ministry of Energy of the Republic of Lithuania Internet website http://kvr.kpd.lt/heritage/ of the Register of Cultural Objects of the Department of Cultural Heritage under the Ministry of Culture of the Republic of Lithuania Republic of Lithuania Law on the Environmental Impact Assessment of the Planned Economic Activity Valstybės žinios (Official Gazette) No 84–3105, 2005; applicable version of 16 July 2013) Resolution No X-2133 of the Seimas of the Republic of Lithuania of 26 June 2012 on the Approval of the National Energy Independence Strategy (Valstybės žinios (Official Gazette) No 80-4149, 2012) Communication from the Committee on European Affairs of the Seimas of the Republic of Lithuania “2020. A Strategy for Competitive, Sustainable and Secure Energy” (COM(2010)639) Communication from the Committee on European Affairs of the Seimas of the Republic of Lithuania “Energy Action Plan until 2050” (COM(2011)0885) Order No V-586 of the Minister of Health of the Republic of Lithuania of 19 August 2004 on the Approval of the Rules for Determining the Limits and Regime of Sanitary Protective Zones (Valstybės žinios (Official Gazette) No 134-4878, 2004) Resolution No 486 of the Government of the Republic of Lithuania of 28 May 2014 on the Modernisation of the District Heat Systems of Vilnius and Kaunas Cities and on Recognising Projects of the Combined Heat and Power Plant Using Local and Renewable Energy Sources to be Economic Projects of the State Significance (Valstybės žinios (Official Gazette) No 2014-06041, 2014) Methodology for Determining the Visual Pollution for the Natural Landscape Complexes and Objects; Ministry of Environment of the Republic of Lithuania, 2015; Internet access: http://www.am.lt/VI/files/File/krastovaizdis/Vizualines%20tarsos%20nustatymo%20metodika%202015.pdf Internet website http://kvr.kpd.lt/heritage/ of the Register of Cultural Objects of the Department of Cultural Heritage under the Ministry of Culture of the Republic of Lithuania Application for the Integrated Pollution Prevention and Control Permit, 2014, UAB Fortum Klaipėda Identification and management of polychlorinated biphenyls and control of emissions of dioxins/furans, 2005; Internet access: http://www.am.lt/VI/files/0.680935001151750056.pdf Raudonikis L. Species protected under by the Habitats Directive of the European Union; Kaunas, 2006 Stankevičiūtė S. (responsible for the implementation), Kanopienė R., Mikulėnas V., 2012; Development of the Geological Database of Vilnius City; Report; Lithuanian Geological Survey, Vilnius. – Book I, p. 77; (Geological Fund) General Plan of Vilnius City until 2015 approved by Decision No 1-1519 of Vilnius City Municipal Council of 14 February 2007

Environmental Impact Assessment Report for Vilnius Combined Heat and Power Plant
Groundwater Monitoring of Vilnius City Municipality in 2014, Prepared by UAB DGE Baltic Soil and Environment; Vilnius, 2014 Results of the Groundwater Monitoring of Vilnius City Municipality of 2010–2014; UAB DGE Baltic Soil and Environment; Vilnius, 2012 General Plan of the Territory of Vilnius City Municipality until 2015; Planning organiser – Director of Vilnius City Municipality Administration; Drafter – Municipal Enterprise Vilniaus planas
Copyright © 2022 FDOKUMEN