View PDF - JMIR Public Health and Surveillance
130
JMIR Public Health and Surveillance A multidisciplinary journal that focuses on public health and technology, public health informatics, mass media campaigns, surveillance, participatory epidemiology, and innovation in public health practice and research Volume 6 (2020), Issue 1 ISSN: 2369-2960 Editor in Chief: Travis Sanchez, PhD, MPH Contents Review Perceptions and Sentiments About Electronic Cigarettes on Social Media Platforms: Systematic Review (e13673) Misol Kwon, Eunhee Park. . . . . . . . . . . . . . . . . . . . . . . . . . . . . . . . . . . . . . . . . . . . . . . . . . . . . . . . . . . . . . . . . . . . . . . . . . . . . . . . . . . . . . . . . . . . . . . . . . 3 Original Papers Exploring Substance Use Tweets of Youth in the United States: Mixed Methods Study (e16191) Robin Stevens, Bridgette Brawner, Elissa Kranzler, Salvatore Giorgi, Elizabeth Lazarus, Maramawit Abera, Sarah Huang, Lyle Ungar. . . . . . . . . . . . 17 Correlates of Successful Enrollment of Same-Sex Male Couples Into a Web-Based HIV Prevention Research Study: Cross-Sectional Study (e15078) Rob Stephenson, Tanaka Chavanduka, Stephen Sullivan, Jason Mitchell. . . . . . . . . . . . . . . . . . . . . . . . . . . . . . . . . . . . . . . . . . . . . . . . . . . . . . . . . . . . 27 Medical Conditions Predictive of Self-Reported Poor Health: Retrospective Cohort Study (e13018) M Cepeda, Jenna Reps, David Kern, Paul Stang. . . . . . . . . . . . . . . . . . . . . . . . . . . . . . . . . . . . . . . . . . . . . . . . . . . . . . . . . . . . . . . . . . . . . . . . . . . . . . . 37 A Web-Based Geolocated Directory of Crisis Pregnancy Centers (CPCs) in the United States: Description of CPC Map Methods and Design Features and Analysis of Baseline Data (e16726) Andrea Swartzendruber, Danielle Lambert. . . . . . . . . . . . . . . . . . . . . . . . . . . . . . . . . . . . . . . . . . . . . . . . . . . . . . . . . . . . . . . . . . . . . . . . . . . . . . . . . . . . 45 Predictors of User Engagement With Facebook Posts Generated by a National Sample of Lesbian, Gay, Bisexual, Transgender, and Queer Community Centers in the United States: Content Analysis (e16382) William Goedel, Harry Jin, Cassandra Sutten Coats, Adedotun Ogunbajo, Arjee Restar. . . . . . . . . . . . . . . . . . . . . . . . . . . . . . . . . . . . . . . . . . . . . . . . 55 Stigma and Web-Based Sex Seeking Among Men Who Have Sex With Men and Transgender Women in Tijuana, Mexico: Cross-Sectional Study (e14803) Cristina Espinosa da Silva, Laramie Smith, Thomas Patterson, Shirley Semple, Alicia Harvey-Vera, Stephanie Nunes, Gudelia Rangel, Heather Pines. . . . . . . . . . . . . . . . . . . . . . . . . . . . . . . . . . . . . . . . . . . . . . . . . . . . . . . . . . . . . . . . . . . . . . . . . . . . . . . . . . . . . . . . . . . . . . . . . . . . . . . . . . . . . . . . . 65 Media Reports as a Source for Monitoring Impact of Influenza on Hospital Care: Qualitative Content Analysis (e14627) Daphne Reukers, Sierk Marbus, Hella Smit, Peter Schneeberger, Gé Donker, Wim van der Hoek, Arianne van Gageldonk-Lafeber. . . . . . . . . . . . . . 77 JMIR Public Health and Surveillance 2020 | vol. 6 | iss. 1 | p.1 XSL • FO RenderX
-
Upload
khangminh22 -
Category
Documents
-
view
3 -
download
0
Transcript of View PDF - JMIR Public Health and Surveillance

JMIR Public Health and Surveillance
A multidisciplinary journal that focuses on public health and technology, public health informatics, massmedia campaigns, surveillance, participatory epidemiology, and innovation in public health practice and
researchVolume 6 (2020), Issue 1 ISSN: 2369-2960 Editor in Chief: Travis Sanchez, PhD, MPH
Contents
Review
Perceptions and Sentiments About Electronic Cigarettes on Social Media Platforms: Systematic Review(e13673)Misol Kwon, Eunhee Park. . . . . . . . . . . . . . . . . . . . . . . . . . . . . . . . . . . . . . . . . . . . . . . . . . . . . . . . . . . . . . . . . . . . . . . . . . . . . . . . . . . . . . . . . . . . . . . . . . 3
Original Papers
Exploring Substance Use Tweets of Youth in the United States: Mixed Methods Study (e16191)Robin Stevens, Bridgette Brawner, Elissa Kranzler, Salvatore Giorgi, Elizabeth Lazarus, Maramawit Abera, Sarah Huang, Lyle Ungar. . . . . . . . . . . . 17
Correlates of Successful Enrollment of Same-Sex Male Couples Into a Web-Based HIV Prevention ResearchStudy: Cross-Sectional Study (e15078)Rob Stephenson, Tanaka Chavanduka, Stephen Sullivan, Jason Mitchell. . . . . . . . . . . . . . . . . . . . . . . . . . . . . . . . . . . . . . . . . . . . . . . . . . . . . . . . . . . . 27
Medical Conditions Predictive of Self-Reported Poor Health: Retrospective Cohort Study (e13018)M Cepeda, Jenna Reps, David Kern, Paul Stang. . . . . . . . . . . . . . . . . . . . . . . . . . . . . . . . . . . . . . . . . . . . . . . . . . . . . . . . . . . . . . . . . . . . . . . . . . . . . . . 37
A Web-Based Geolocated Directory of Crisis Pregnancy Centers (CPCs) in the United States: Descriptionof CPC Map Methods and Design Features and Analysis of Baseline Data (e16726)Andrea Swartzendruber, Danielle Lambert. . . . . . . . . . . . . . . . . . . . . . . . . . . . . . . . . . . . . . . . . . . . . . . . . . . . . . . . . . . . . . . . . . . . . . . . . . . . . . . . . . . . 45
Predictors of User Engagement With Facebook Posts Generated by a National Sample of Lesbian, Gay,Bisexual, Transgender, and Queer Community Centers in the United States: Content Analysis (e16382)William Goedel, Harry Jin, Cassandra Sutten Coats, Adedotun Ogunbajo, Arjee Restar. . . . . . . . . . . . . . . . . . . . . . . . . . . . . . . . . . . . . . . . . . . . . . . . 55
Stigma and Web-Based Sex Seeking Among Men Who Have Sex With Men and Transgender Women inTijuana, Mexico: Cross-Sectional Study (e14803)Cristina Espinosa da Silva, Laramie Smith, Thomas Patterson, Shirley Semple, Alicia Harvey-Vera, Stephanie Nunes, Gudelia Rangel, HeatherPines. . . . . . . . . . . . . . . . . . . . . . . . . . . . . . . . . . . . . . . . . . . . . . . . . . . . . . . . . . . . . . . . . . . . . . . . . . . . . . . . . . . . . . . . . . . . . . . . . . . . . . . . . . . . . . . . . 65
Media Reports as a Source for Monitoring Impact of Influenza on Hospital Care: Qualitative Content Analysis(e14627)Daphne Reukers, Sierk Marbus, Hella Smit, Peter Schneeberger, Gé Donker, Wim van der Hoek, Arianne van Gageldonk-Lafeber. . . . . . . . . . . . . . 77
JMIR Public Health and Surveillance 2020 | vol. 6 | iss. 1 | p.1
XSL•FORenderX

Follow-Up Investigation on the Promotional Practices of Electric Scooter Companies: Content Analysis ofPosts on Instagram and Twitter (e16833)Allison Dormanesh, Anuja Majmundar, Jon-Patrick Allem. . . . . . . . . . . . . . . . . . . . . . . . . . . . . . . . . . . . . . . . . . . . . . . . . . . . . . . . . . . . . . . . . . . . . . . . 91
Distracted Driving on YouTube: Categorical and Quantitative Analyses of Messages Portrayed (e14995)Marko Gjorgjievski, Sheila Sprague, Harman Chaudhry, Lydia Ginsberg, Alick Wang, Mohit Bhandari, Bill Ristevski. . . . . . . . . . . . . . . . . . . . . . . . . . . 96
Trend of Cutaneous Leishmaniasis in Jordan From 2010 to 2016: Retrospective Study (e14439)Mohammad Alhawarat, Yousef Khader, Bassam Shadfan, Nasser Kaplan, Ibrahim Iblan. . . . . . . . . . . . . . . . . . . . . . . . . . . . . . . . . . . . . . . . . . . . . . . 106
Occupational Exposure to Needle Stick Injuries and Hepatitis B Vaccination Coverage Among ClinicalLaboratory Staff in Sana’a, Yemen: Cross-Sectional Study (e15812)Nabil Al-Abhar, Ghuzlan Moghram, Eshrak Al-Gunaid, Abdulwahed Al Serouri, Yousef Khader. . . . . . . . . . . . . . . . . . . . . . . . . . . . . . . . . . . . . . . . . . 112
How Motivations for Using Buprenorphine Products Differ From Using Opioid Analgesics: Evidence froman Observational Study of Internet Discussions Among Recreational Users (e16038)Stephen Butler, Natasha Oyedele, Taryn Dailey Govoni, Jody Green. . . . . . . . . . . . . . . . . . . . . . . . . . . . . . . . . . . . . . . . . . . . . . . . . . . . . . . . . . . . . . 118
Editorial
The Role of the Global Health Development/Eastern Mediterranean Public Health Network and the EasternMediterranean Field Epidemiology Training Programs in Preparedness for COVID-19 (e18503)Mohannad Al Nsour, Haitham Bashier, Abulwahed Al Serouri, Elfatih Malik, Yousef Khader, Khwaja Saeed, Aamer Ikram, Abdalla Abdalla,Abdelmounim Belalia, Bouchra Assarag, Mirza Baig, Sami Almudarra, Kamal Arqoub, Shahd Osman, Ilham Abu-Khader, Dana Shalabi, YasirMajeed. . . . . . . . . . . . . . . . . . . . . . . . . . . . . . . . . . . . . . . . . . . . . . . . . . . . . . . . . . . . . . . . . . . . . . . . . . . . . . . . . . . . . . . . . . . . . . . . . . . . . . . . . . . . . . . 86
JMIR Public Health and Surveillance 2020 | vol. 6 | iss. 1 | p.2
XSL•FORenderX

Review
Perceptions and Sentiments About Electronic Cigarettes on SocialMedia Platforms: Systematic Review
Misol Kwon1, BS, RN; Eunhee Park1, PhD, RNSchool of Nursing, University at Buffalo, Buffalo, NY, United States
Corresponding Author:Eunhee Park, PhD, RNSchool of NursingUniversity at Buffalo3435 Main StreetBuffalo, NYUnited StatesPhone: 1 716 829 3701Email: [email protected]
Abstract
Background: Electronic cigarettes (e-cigarettes) have been widely promoted on the internet, and subsequently, social mediahas been used as an important informative platform by e-cigarette users. Beliefs and knowledge expressed on social mediaplatforms have largely influenced e-cigarette uptake, the decision to switch from conventional smoking to e-cigarette smoking,and positive and negative connotations associated with e-cigarettes. Despite this, there is a gap in our knowledge of people’sperceptions and sentiments on e-cigarettes as depicted on social media platforms.
Objective: This study aimed to (1) provide an overview of studies examining the perceptions and sentiments associated withe-cigarettes on social media platforms and online discussion forums, (2) explore people’s perceptions of e-cigarette therein, and(3) examine the methodological limitations and gaps of the included studies.
Methods: Searches in major electronic databases, including PubMed, Cumulative Index of Nursing and Allied Health Literature,EMBASE, Web of Science, and Communication and Mass Media Complete, were conducted using the following search terms:“electronic cigarette,” “electronic vaporizer,” “electronic nicotine,” and “electronic nicotine delivery systems” combined with“internet,” “social media,” and “internet use.” The studies were selected if they examined participants’ perceptions and sentimentsof e-cigarettes on online forums or social media platforms during the 2007-2017 period.
Results: A total of 21 articles were included. A total of 20 different social media platforms and online discussion forums wereidentified. A real-time snapshot and characteristics of sentiments, personal experience, and perceptions toward e-cigarettes onsocial media platforms and online forums were identified. Common topics regarding e-cigarettes included positive and negativehealth effects, testimony by current users, potential risks, benefits, regulations associated with e-cigarettes, and attitude towardthem as smoking cessation aids.
Conclusions: Although perceptions among social media users were mixed, there were more positive sentiments expressed thannegative ones. This study particularly adds to our understanding of current trends in the popularity of and attitude toward e-cigarettesamong social media users. In addition, this study identified conflicting perceptions about e-cigarettes among social media users.This suggests that accurate and up-to-date information on the benefits and risks of e-cigarettes needs to be disseminated to currentand potential e-cigarette users via social media platforms, which can serve as important educational channels. Future researchcan explore the efficacy of social media–based interventions that deliver appropriate information (eg, general facts, benefits, andrisks) about e-cigarettes.
Trial Registration: PROSPERO CRD42019121611; https://tinyurl.com/yfr27uxs
(JMIR Public Health Surveill 2020;6(1):e13673) doi:10.2196/13673
KEYWORDS
electronic cigarettes; electronic nicotine delivery systems; internet; social media; review
JMIR Public Health Surveill 2020 | vol. 6 | iss. 1 | e13673 | p.3http://publichealth.jmir.org/2020/1/e13673/(page number not for citation purposes)
Kwon & ParkJMIR PUBLIC HEALTH AND SURVEILLANCE
XSL•FORenderX

Introduction
Although the prevalence of cigarette smoking has beendecreasing in the last decades, electronic cigarette (e-cigarette)use, on the contrary, has been increasing dramatically [1].E-cigarettes have been portrayed on social media platforms asa means of providing craving relief or reducing cigaretteconsumption for those wanting to quit [2,3]. However, recentfindings state that e-cigarettes’ impact on users’ health andwell-being needs to be studied in depth and with a long-termfollow-up to validate such conclusions [1,4]. Considering thedrastic increase in e-cigarette use and the uncertainty of itsusefulness and consequences, people are turning to social mediaplatforms for up-to-date information.
As internet use and mobile phone ownership have become anearly ubiquitous element of people’s lives in the last decade,the internet has provided platforms where people search forinformation and create communities around a shared interest[5]. Social media platforms can be defined as internet-based ormobile app–based communities that facilitate the creation andexchange of user-generated content through activities that rangefrom photo and video sharing to social networking andcrowdsourcing [6]. They provide a framework for people toconnect, network, build, and thrive on the Web [7]. Twitter, afree social networking service, primarily focuses onmicroblogging [8], where its users can communicate via shortmessages with a maximum of 280 characters called tweets.These tweets can be instantly transmitted to followers of theaccount via the Twitter website or mobile phone app, or email[8]. Facebook, online news sources, photography-basedstorytelling social networking apps (eg, Instagram), andcommunity-style picture posting and organizing apps (eg,Pinterest) are other popular platforms, where people search andshare the information [9]. Common social media platformswhere smokers can share e-cigarette–related information includeTwitter and Facebook.
Discussion-based social media platforms, which are often calledonline forums, host conversations between users who postmessages. It allows asynchronous interactions through whichparticipants can engage or observe discussions at theirconvenience on a topic of their interest. Reddit is an exampleof a collection of forums where users can share interesting links,images, and posts. JuiceDB is another example, which provideswebsite- and app-based online forums that allow people todiscuss their thoughts about e-cigarettes. In view of this, datafrom social media platforms can be used by public healthresearchers to gain insights and understand public opinion oncurrent public health–related phenomena and inform the designof public health surveillance [10].
Social media platforms are a popular way for people to sharepersonal experience and exchange information about health[11]. More than 70% of the population has reported using morethan one social media platform, and the proportion of socialmedia users who state difficulty living without these platformscontinues to increase [12,13]. On social media platforms, peoplecan easily share pictures, information, interests, experiences,
sentiments, and opinions about health and risk-taking behaviors,including the use of e-cigarettes. Hence, the depiction ofe-cigarettes on social media platforms is on the rise [9,14], andit may have contributed to the heightening of curiosity, approval,and experimentation among many routine internet users seekingreviews of the actual experience [15]. Interestingly, tobaccousers are 5 times more likely to share information aboute-cigarettes across social media platforms than nonusers [9].These days, social media platforms have become a medium forboth members of the medical community as well as generalusers in providing opportunities to voice their input about vapingdevices and e-liquid products and obtain information from otherusers [11]. This may be related to the short supply of usage andsafety guidelines on vaping devices and products for currentand potential e-cigarette users and health care providers.
With limited knowledge of the public’s perceptions andsentiments toward e-cigarettes, social media platforms can actas major sources of information for researchers, policy makers,and educators. A recent scoping review provides a review onthe messages presented in e-cigarette–related social mediapromotions and discussions in the studies published in 5developed countries [16]. McCausland et al provided importantinsights on e-cigarette–related messages depending on the socialmedia account type and revealed the most common themes ashealth, safety, and harms [16]. In addition, selected studies wereanalyzed for emotional tone, affective content, or messageattitudes [16]. However, we still have a limited understandingof this phenomenon, and there is a need for a systematic reviewon people’s perceptions and sentiments on e-cigarettes asexpressed on social media platforms and online forums. Thisreview expands on the previous scoping review and contributesto the literature by (1) adding information on online forumsbased on discussions by the public, which have the potential tobetter understand the general population, as well as subgroups;(2) providing an understanding of people’s perceptions andsentiments, including in-depth reasons for using or not usinge-cigarettes based on the synthesis of the findings; (3) addinginsights using different search engines; and (4) evaluating themethodological strengths and gaps in the literature. The aimsof conducting this systematic review were to (1) provide anoverview of studies examining perceptions and sentiments aboute-cigarettes on social media platforms and online forums, (2)explore people’s perceptions and sentiments about e-cigaretteson social media platforms and online forums, and their potentialimpact on public health, and (3) examine methodologicallimitations and gaps of the selected studies.
Methods
OverviewThe authors followed the guidelines of the Preferred ReportingItems for Systematic Reviews and Meta-Analyses [17]. Thisreview is registered on PROSPERO (International ProspectiveRegister of Systematic Reviews, CRD42019121611). Inclusionand exclusion criteria used for studies selected is shown inFigure 1.
JMIR Public Health Surveill 2020 | vol. 6 | iss. 1 | e13673 | p.4http://publichealth.jmir.org/2020/1/e13673/(page number not for citation purposes)
Kwon & ParkJMIR PUBLIC HEALTH AND SURVEILLANCE
XSL•FORenderX

Figure 1. Flowchart of the literature search process. CINAHL: Cumulative Index of Nursing and Allied Health Literature.
Search StrategyStudies were searched from 5 major electronic databases:PubMed, the Cumulative Index of Nursing and Allied HealthLiterature, EMBASE, Web of Science, and Communicationand Mass Media Complete. In addition, we conducted anadditional search using a snowballing approach through GoogleScholar. Search terms included the following keywords:e-cigarette-related terms (“electronic cigarette” OR “electronic
vaporizer” OR “electronic nicotine” OR “electronic nicotinedelivery systems [MeSH]”) AND social media platform-relatedterms (“internet [MeSH],” “social media [MeSH],” OR “internetuse”). To obtain a more comprehensive and accurate searchoutcome, we used controlled vocabulary (ie, MeSH [MedicalSubject Headings] terms). MeSH is a set list of terms thatincludes related search terms and are set to categorize and indexarticles in a systematic way. For instance, the MeSH term“electronic nicotine delivery systems” encompasses
JMIR Public Health Surveill 2020 | vol. 6 | iss. 1 | e13673 | p.5http://publichealth.jmir.org/2020/1/e13673/(page number not for citation purposes)
Kwon & ParkJMIR PUBLIC HEALTH AND SURVEILLANCE
XSL•FORenderX

“e-cigarettes” along with other related narrow terms such as“vaping.” This was applied to the terms for social mediaplatforms and online forums by using the MeSH terms “socialmedia” and “internet.”
Initial search was conducted from May to July 2017, andadditional search was completed in May 2019.
Eligibility CriteriaStudies were included if:
1. They were published in peer-reviewed academic journalsin the past 10 years (2007-2017).
2. They examined participants’ perceptions and sentiments ofe-cigarettes on the internet or social media websites.
3. They were written in English.
Studies were excluded if:
1. They were gray literature, including dissertations,conference proceeding papers, abstracts, or editorials.
2. They were using the internet as a survey tool or forparticipant recruitment.
3. They were focusing specifically on specific intervention,video analysis, retail and marketing or advertisement,e-cigarettes flavors, and e-cigarettes brands.
Data Extraction, Analysis, and SynthesisThe database searches yielded a total of 769 articles. Of these,435 articles were excluded for not meeting the inclusion criteria(articles in English, from peer-reviewed journal articles, andpublished in the past 10 years), leaving 334 articles, which werethen imported into a citation manager for the identification ofduplicates [18]. The citation manager identified and excludedduplicates (n=48); thereafter, all nonduplicate articles (n=286)were compiled into an Excel spreadsheet. The titles and abstractsof all nonduplicate articles were then reviewed by 4 researchers(YB, MF, MK, and EP), including 2 authors (MK and EP) and2 other researchers (YB and MF), who determined whether theymet the predetermined inclusion criteria. Most articles wereexcluded in this first screening process if they did not focus one-cigarettes, were not based on social media platforms or onlineforums, used social media platforms for survey or recruitment,and focused on methodological aspects of conducting socialmedia data research. Disagreements were resolved throughdiscussion when needed. This initial phase of screening furtherled to the exclusion of 242 articles, leaving 44 articles forreview. Thereafter, the first and second authors (MK and EP)carefully read the full text of the articles (n=44) and screenedthem for eligibility. At this stage, 23 articles were excludedbecause they focused on online marketing of e-cigarettes,specific brands or flavor of e-cigarettes, and methodologicalaspects of conducting research using social media platformsinstead of sentiments or perceptions of e-cigarettes. The same2 authors (MK and EP) extracted data for the finally includedarticles (n=21) by coding them in a data display matrix. Theyextracted information pertaining to the following studycharacteristics: author, publication year, study method (studydesign, sampling method, data collection, and analysis), studypurpose and relevant discussion, study navigation process(search queries, number of content or posts analyzed, data
collection period, and social media platform), findings includingthe overall sentiment of discussion on e-cigarette use (categories:pro, anti, natural, mixed, and not applicable), themes ofsummarized message topics, and examples of health-relatedcomments. This coded information was cross-checked by theauthors.
The overall sentiments of discussion on e-cigarette use werecategorized as pro (positive toward e-cigarettes), anti (negative),neutral, mixed, or not applicable for each study, depending onwhich category had the highest percentage or was mostapplicable. This was achieved by first identifying the percentageof each sentiment (pro, neutral, and anti) based on thequantitative findings regarding sentiments or perceptions ofe-cigarettes that the individual study reported. Each studyidentified postings on social media platforms (ie, each tweet onTwitter) or online forums as a unit of analysis. When the datain the study revealed a higher percentage of positive sentimentsabout e-cigarettes (ie, portraying e-cigarettes as cool, beneficial,better, etc), they were coded as pro. Similarly, sentiments werecoded as anti when the individual study reported a higherpercentage of negative sentiments (ie, e-cigarette use isunhealthy, disgusting, uncool, etc). The studies reporting ahigher percentage of neutral sentiments (ie, stating a generalcomment and asking questions about e-cigarette) were codedas neutral, whereas those with mixed results were categorizedas mixed (ie, when 2 countries had different results, differentresults were reported at 2 time points). The studies that did notquantify any sentiments (positive, neutral, or negative) aboute-cigarette use were coded as not applicable (N/A).
Results
Description of the Included StudiesA total of 21 articles were included in the systematic review(search strategy illustrated in Figure 1). A total of 20 socialmedia platforms and websites were used: Twitter (n=12), Reddit(n=5), 14 online forums (Electronic cigarette forum, Hookahforum, Vapor Talk, Vapors forum, UK Vapors, All AboutE-Cigarette, Aussie Vapors, Baby Gaga, Vaping Underground,What to Expect, Momtastic [pregnancy forum], Totally WickedE-Liquid, Baby Centre [United Kingdom], and Baby Center[United States]), and other social media platforms, such asInstagram (n=1), Pinterest (n=1), JuiceDB (n=1), andGLOBALink (n=1). The studies that used Twitter [9,19-29]yielded 801,574 cumulative tweets. A detailed overview of thestudies is presented in Multimedia Appendices 1 and 2.
Study DesignThe studies utilized various data collection methods (MultimediaAppendix 1). Most studies (n=9) utilized the social mediaapplication programming interface (API) aggregation companysuch as GNIP, Inc [19,25,28], Twitter API [20,21,23,29], andJuiceDB API [22], and Instagram API [30,31] for datacollection, whereas others (n=4) used analytics software suchas NodeXL [26] and databases such as MDigitalLife HealthEcosystem [9], MySQL [30,32], and Sysomos HeartBeat [24].Data were collected manually for 4 studies [33-36], whereas 1study made use of a Web crawler to retrieve data from Webservers directly [37].
JMIR Public Health Surveill 2020 | vol. 6 | iss. 1 | e13673 | p.6http://publichealth.jmir.org/2020/1/e13673/(page number not for citation purposes)
Kwon & ParkJMIR PUBLIC HEALTH AND SURVEILLANCE
XSL•FORenderX

The most frequently used search queries included “electroniccigarettes,” “e-cigarettes,” “ecigs,” “vaping,” and “vape.” Somearticles used specific key terms, such as “e-cigarette ban,”“e-cigarette FDA,” “e-cigarette regulation,” “vapelife,”“e-juice,” “flavor,” “e-liquid,” “cloud-chasing,” “second handvape,” and “vaping during pregnancy,” or the names of publichealth campaign using words such as stillblowingsmoke ornotblowingsmoke, depending on the specific purpose of thestudy [19,26].
Although the most commonly used sampling strategy waspurposive sampling (16/21, 76%) [9,20-22,24,26-29,33-37], afew studies (5/21, 24%) used stratified and random samplingmethods [19,23,25,30,38]. When studies did not clearly indicatethe type of sampling methods used (7/21, 33%) [21,23,25,27,37],we categorized study sampling based on the description thatthe study provided, and most were categorized as purposivesampling because they had specific purpose of sampling meetingtheir aims [39].
All studies were descriptive in design. In all, 9 of the includedarticles (43%) used both quantitative and qualitative approach[9,20,21,24-26,28-30]. Although some studies did notspecifically mention whether they used qualitative orquantitative study design, the authors categorized each studybased on the description of the study design and analysis [40].For example, if the study used a qualitative approach, such asthe thematic analysis when coding, the authors categorized itas qualitative (7/21, 33%) [19,22,27,31,33-35]. If the resultswere reported numerically, they were categorized as quantitative(5/21, 24%) [23,32,36-38]. Data analysis techniques includedtext mining and modeling [9,21,23,27,37], thematic analysis[23,33], content analysis [19-21,25,26,29,32,35,38], valenceanalysis [28], and image analysis [30], whereas quantitativeapproach included descriptive statistics (eg, to report thefrequencies of data based on themes), f statistics, chi-square
statistics, Kruskal-Wallis tests, and Dunn tests[19,20,23-26,28-32,35,38].
Major Themes About Electronic Cigarettes on SocialMedia PlatformsThe main themes regarding e-cigarette use on social mediaplatforms were motivation for using e-cigarettes and concernsabout the health outcomes associated with their use. There weredebates about their harmfulness and safety, for example, theireffectiveness in promoting smoking cessation compared withconventional cigarettes, or harmfulness because of nicotinecontent, presence of chemicals, and the possibility of gatewayeffect to conventional smoking [9,19,21,22,24,26,32,34]. Inaddition, other major issues related to e-cigarettes wereidentified, which included policy, advertisement and marketing,flavor, feelings of e-cigarette use, and use among young people.These findings indicate the wide range of information availableabout e-cigarettes that people share on social media platform,in addition to the topics related to e-cigarettes that people areinterested in and curious about (Multimedia Appendix 2).
Overall Perceptions About Electronic CigarettesThe perceptions about e-cigarette use were depicted on varioussocial media platform sources and online forum postings(Multimedia Appendix 2 and Table 1). Overall, 47.6% (n=10)of the studies were categorized as pro because they indicatedpositive perceptions about e-cigarettes[19,20,22-24,26,27,30,32,38], 19.0% (n=4) as neutral[21,28,31], 4.8% (n=1) as anti [36], and 9.5% (n=2) as mixed[9,25], and the studies with no data on perceptions aboute-cigarette use were coded as N/A (19.0%, n=4) [33,37]. Thesedetails are presented in Table 1. In addition, the examples ofhealth-related quotations are provided in Multimedia Appendix2.
JMIR Public Health Surveill 2020 | vol. 6 | iss. 1 | e13673 | p.7http://publichealth.jmir.org/2020/1/e13673/(page number not for citation purposes)
Kwon & ParkJMIR PUBLIC HEALTH AND SURVEILLANCE
XSL•FORenderX

Table 1. Overall sentiment of discussion on electronic cigarette (e-cigarette) use (coded as pro, anti, neutral, mixed, and not applicable).
DetailsOverall sentiment and studies (first author, year)
Pro
Provaping=92%, neutral=6%, anti=2%Allem, 2017 [19]
Pro=68%, neutral=32%, anti=0%Lazard, 2016 [27]
Reasons for using e-cigarette: quitting combustibles (43%), social image (21%), can vape indoors(17%), flavor choices (14%), safe to use (9%), low cost (3%), and favorable order (2%)
Ayers, 2017 [20]
Reddit: pro=60.7% opponents on e-cigarette bans, neutral=29.9%, anti=9.4% proponents on e-cigarette bans
Zhan, 2017 [22]
Proponents versus others: mean positive scores (0.92 and 0.79), mean negative scores (0.01 and0.03)
Kavuluru, 2016 [23]
Attitude: complete sample versus industry-free sample (pro=79% versus 62%, anti=12% versus17%, neutral=8% versus 21%); Affective content: complete sample versus industry-free sample(pro=46% versus 27%, anti=7% versus 15%)
van der Tempel, 2016 [24]
Pro=61.9%, anti=47.7%, neutral=8.6%Chu, 2015 [32]
Pro=89.2% opponents of e-cigarette regulation (antipolicy), anti=7.5% proponents of e-cigaretteregulation (propolicy), neutral=3.4% unable to tell
Harris, 2014 [26]
—aLee, 2017 [38]
—Chu, 2016 [30]
Anti
Anti=80.5% (negative symptoms), pro=19.3% (positive symptoms), neutral=0.02% (neutral)Hua, 2013 [36]
Neutral
Neutral=88%-90%, pro=6%, anti=4%-5%Burke-Garcia, 2017 [28]
Neutral=19.4%, anti=17.7%, pro=10.8%Dai, 2016 [21]
Neutral: presence of social identity or vaping community (81.2%), depiction of e-cigarette=up to62.4%; pro=48.3%
Laestadius, 2016 [31]
Neutral=39.24%, pro=34.96%, anti=25.81%Unger, 2016 [29]
Mixed
United States: anti=54%, pro=28%, neutral=18%; United Kingdom: pro=43%, anti=37%, neu-tral=19%
Glowacki, 2017 [9]
Initially, pro=71.11%, neutral=16.78%, anti=12.11%, but showed steady decline in positive senti-ment from December 2013
Cole-Lewis, 2015 [25]
Not applicable
—Sharma, 2017 [34]
—Wigginton, 2017 [33]
—Li, 2016 [35]
—Chen, 2015 [37]
aCumulative percentage not provided.
Reasons and Motivations for Using Electronic CigarettesThe main reasons for the popularity of e-cigarettes wereidentified as the benefits associated with their use, withe-cigarettes not only being used as smoking cessation devicesbut also being the cheaper and healthier alternatives toconventional cigarettes because of their content andenvironment-friendly nature [31]. The proponents viewedc-cigarettes as a harm reduction and smoking cessation aid withfavorable features, such as the smoke-free vaping source withflavors [23]. In addition, e-cigarettes were depicted as more
economical and efficient nicotine delivery systems thanconventional smoking [24].
Interestingly, the major reasons for e-cigarette use in tweetschanged from 2012 to 2015 [20]. In the past (2012), the mostprevalent reasons for using e-cigarettes were quittingcombustibles (43%), caring for social image (21%), and beingable to use them indoors (17%). Minor reasons included choicesof flavor (14%), safety relative to combustibles (9%), low cost(3%), and favorable odors (2%) [20]. However, 3 years later,in 2015, a significant decrease was seen for the reasons quittingcombustibles and being able to use indoors, and the most
JMIR Public Health Surveill 2020 | vol. 6 | iss. 1 | e13673 | p.8http://publichealth.jmir.org/2020/1/e13673/(page number not for citation purposes)
Kwon & ParkJMIR PUBLIC HEALTH AND SURVEILLANCE
XSL•FORenderX

prevalent reasons for using e-cigarettes changed to social image(37%, 95% CI 32-43), quitting combustibles (29%), andcapability to smoke indoors (12%) on Twitter [20].
For people with mental illness, the motivation for usinge-cigarettes was quitting smoking [34]. Particularly, withsmoking cessation from other nicotine replacements withconcurrent use of psychiatric medicine being unsuccessful,e-cigarettes began to be viewed as a healthier alternative. Inaddition, the switch to e-cigarette was made with the intentionto relieve symptoms as either a self-medication or replacementof psychiatric drugs and to gain a sense of freedom, control,and social connectedness [34].
On the discussion regarding safety concerns of e-cigarette useduring pregnancy, posts emphasized the dangers of abruptlystopping nicotine use (eg, physical and psychological harm ofnicotine withdrawal for the mother and baby) [33]. Overall,e-cigarette use during pregnancy was viewed as a harm reductionapproach, and vaping was seen as a safer alternative rather thanfocusing on the harmful effects of nicotine [33]. Nevertheless,some mentioned the unknown risks associated with vaping orthat there was limited current scientific evidence to supportvaping during pregnancy [33].
Smoking Aid, Cessation Method, and Harm ReductionDiscussion about e-cigarette use mainly centered on their useas a cessation aid and as a healthier alternative to combustors[9,20,26,29,31,33,37]. The proponents of e-cigarette use weremore likely to tweet on the aspects of harm reduction ofe-cigarettes [33], smoke-free aspects, and smoking cessationeffect than other users [23], and this was also indicated in thetweets related to secondhand vaping [29]. Notably, only 6.3%of e-cigarette–related tweets were about e-cigarette use forsmoking cessation [25].
Data from Vapor Talk and Reddit demonstrated extensivediscussion on e-cigarette use for quitting conventional smoking[37]. E-cigarette users experienced less psychological difficultiesin quitting smoking compared with combustible cigarette users[37]. The corporate users (vendors, brands, and representativesof tobacco companies or retailors) and the general e-cigaretteusers had positive views regarding the cessation effect onInstagram as shown in the 23.5% of the total posts [31]. Inparticular, Instagram posts (16.5%) depicted e-cigarettes to behealthier than tobacco products and more environment-friendly(1.2%) [31]. Similarly, the UK physicians’ tweets placedemphasis on promotion of e-cigarettes (18%) because thesecould serve as an effective aid for smoking cessation, followedby the discussion on general practitioner to encourage patientswho smoke conventional cigarettes to switch to e-cigarettes(13%) [9].
Limitations and Barriers to Using Electronic CigaretteOne of the major barriers identified was a concern regardingthe possibilities of e-cigarettes serving as a gateway toconventional cigarette smoking among nonusers, especiallywith respect to the young population, and its effect on short-and long-term health outcomes [9,19,21,36,37]. People withmental illness uniquely reported limitations to use e-cigarettessuch as health concerns for replacing psychiatric medicines,
drug interactions, practical difficulties, and costs, whereas thegeneral population indicated concerns involving nicotineaddiction, health effects, and e-cigarettes being an unsatisfactorysubstitute for tobacco products [34].
Health Effects and SafetyThe effects on health outcomes was one of the major themesamong the users of the online discussion forums and Twitter[9,19,29,31,33,36,37]. In all, 13% of tweets were related tohealth effects and safety issues [25]. Of the reported physicalhealth symptoms across 10 organ systems (eg, respiratory andneurological) and 2 anatomical regions (chest and mouth/throat)among the e-cigarette users, more negative symptoms (82.2%)such as insomnia and dry lips and tongue were reportedcompared with the positive symptoms (17.8%) such ascontrolled appetite and eliminated snoring on the ElectronicCigarettes Forum [36]. Subsequently, among the groups of USand UK physicians, about 15% of tweets were regarding theeffects on health outcomes such as the effect of flavoringchemicals on the lungs [9]. The effects of e-cigarettes oncomplications for breast reconstruction surgery were alsodiscussed among the UK physicians [9].
Although health effects were a major concern for e-cigaretteuse and were seen as a barrier, mixed opinions and discussionsabout the ingredients of e-cigarettes were displayed. On Twitter,opponents claimed that some ingredients in e-cigarettes werecarcinogenic, focusing especially with the increased use amongteens (propolicy, 2.8%). However, the proponents argued thatresearch had shown that e-cigarettes only contain nicotine andwater and, hence, presented no danger with the secondhandvapor (antipolicy, 31.9%) [26]. The proponents’ main claimwas that e-cigarettes may not be more harmful than conventionalcigarettes [26]. Health-related tweets related to secondhandvaping were mostly anti–e-cigarettes (70%) with mentions ofshort- and long-term health effects of exposure to e-cigaretteaerosol, such as headache, eye irritation, nausea, and lungdisease [29]. Moreover, women who smoke during pregnancydescribed quitting nicotine as more harmful to their body andbaby than cutting down the dose or frequency of smoking,indicating that vaping can be used to not only reduce harm butalso replace smoking as a safer and healthier alternative duringpregnancy [33].
The pros and cons of e-cigarettes compared with those ofconventional cigarettes were a major discussion theme amongthe UK physicians with 19% of tweets [9], whereas 12% oftweets were regarding Public Health England’s recommendationthat e-cigarettes were safer than the traditional forms of tobaccouse [9]. Interestingly, there were no negative posts on Instagramand their posts (16.5%) that presented e-cigarettes as healthieralternative to conventional tobacco products and asenvironment-friendly (1.2%) [31].
Other Issues About Electronic Cigarettes on SocialMediaIn addition to the major discussions on the effects of e-cigaretteson smoking cessation and their potential health concerns, therewere extended discussions on the policy and regulation, flavorand techniques, feelings, symptoms, features, marketing, and
JMIR Public Health Surveill 2020 | vol. 6 | iss. 1 | e13673 | p.9http://publichealth.jmir.org/2020/1/e13673/(page number not for citation purposes)
Kwon & ParkJMIR PUBLIC HEALTH AND SURVEILLANCE
XSL•FORenderX

youth e-cigarette use [9,19,22-26,35-37] (Multimedia Appendix2).
Policy and RegulationThe debate on e-cigarette ban regulations was a commonlydiscussed topic [19,22,25-27]. One of the main platforms forthe policy and regulation discussion was Twitter with 20.2%of tweets associated with policy and government-related issues[25]; the major proportion of those on antipolicy side discussedabout the safety (52.4%) and lies/propaganda (32.8%), whereasthose on the propolicy side focused more on regulation (6.4),science (2.8%), and safety (2%) [26]. In an attempt to understandthe public’s initial reactions to the Food and DrugAdministration’s new rule that extends their regulatory authorityto include all tobacco products, including e-cigarettes, cigars,pipe tobacco, and hookah in May 2016, the study revealed manyexpressed comments, opinions, words, and phrases commonlyassociated with advocating for vaping and support for the useof e-cigarettes [27].
The frequent themes on Twitter campaigns using hashtags toexpress policy-related opinions included tax, individual freedomand rights, simple opposition, and call to action [22]. Mosttweets generated for the California campaign were found to bemostly from outside of California [19]. Another study analyzedthe responses to the campaign by the Chicago Department ofPublic Health [26] and presented with a considerably highernumber of antipolicy tweets than propolicy tweets, which wascontrary to the intention of the campaign. Higher percentage ofpropolicy tweets were from the Chicago residents, whereasantipolicy tweets were from outside residents. In addition,people wanted to use safer products compared with conventionaltobacco products and expressed concerns about propaganda/liesspread by the health department or other government agencies(antipolicy, 32.8%) [26]. This trend was similar on Reddit,which showed 60.7% as opponents of e-cigarette bans and only9.4% being the proponents [22].
Flavor and TechniqueFlavor was identified as one of the main reasons why peopleused e-cigarettes and also as the common interest amonge-cigarette users [22,26]. Specifically, Reddit and JuiceDBshowed rich discussions about flavors [22,23], and 9.7% among1800 Instagram and Pinterest images conveyed informationabout popular and new juice or flavors, including ideas forcreating novel flavors [38]. According to Cole-Lewis et al, about4.5% of tweets were about flavors [25]. Interestingly, proponentswere 15% more likely to tweet about flavors than other usersin 2013 and 20 times more likely to tweet in 2015 [23].
Zhan et al identified flavors that were most favored among thee-cigarette users, such as fruits, cream, tobacco, menthol,beverages, sweet, seasonings, nuts, rich, spiced, cool, nutty, andcoffee discussed on Reddit and JuiceDB [22]. In addition, therewere topics in the Vapor Forum regarding the techniquesinvolved in using vapor products (ie, how to get a good taste,knowing different characteristics of the juices) [37]. There weremixed opinions about flavors on Twitter [26]. Although 0.3%tweets supported the idea that sweet flavors were for kids(propolicy, 0.3%), many opposed the notion of advocating
smoking to children and that adults also enjoy flavors(antipolicy, 3.7%) [26].
Overall, half of the social tweets on secondhand vaping werepro–e-cigarettes (57%), which included video links of vapeperformance and smoke tricks [29]. Among Instagram andPinterest, 7.8% of images were those of performing vape tricks[38].
Feelings and SymptomsSymptoms and feelings related to e-cigarette use were identified[22,35-37]. In total, 405 different symptoms related toe-cigarettes were reported and discussed, of which 318 werenegative and 69 were positive [36]. Symptoms related to throatand mouth were most commonly reported [22,37]. There weredifferent views about these symptoms, as many users enjoyedthe feeling of slight throat hit, which is similar to thatexperienced with conventional cigarette smoking [22]; however,these symptoms were viewed as problematic experiences amongusers [37]. Negative symptoms were perceived as persistent,worsened, or increasing, whereas positive symptoms weredecreased, improved, or eliminated (p. 4) [36]. Anti–e-cigarettetweets among the secondhand vape posts mentioned symptomsof headache, eye irritation, nausea, and lung disease [29].
Marketing and PromotionCurrent e-cigarette marketing strategies and different kinds ofpromotion were identified [19,22,24,37]. Twitter was identifiedas the major source of advertisement and promotion amongpeople because 26.3% of tweets were identified as beingassociated with marketing, advertisement, and promotion-relatedcontent, which was the single largest category [25]. Peopleshared messages on specific products, coupons, vape shops fore-cigarettes, sale information, and small business on Twitter[19]. There were postings about production promotion andrecommendations in the form of user review on JuiceDB andindividual trades and vendor promotions on Reddit [22].Furthermore, existing patterns of a large secondhand e-cigarettetrading market, including sales from vendors to users and tradesamong site users was revealed [22]. In addition, vendors andend users were actively posting about specific products and saleinformation on e-cigarettes on the Vapor Talk and HookahForum [37] as well as Instagram and Pinterest [30,38].
Electronic Cigarette Use Among YouthThe likelihood of e-cigarette use among teenagers was anotherimportant theme [9,19,25]. The most common topic tweeted bythe US physicians involved concerns about e-cigarette useamong teens and the potential of tobacco addiction with thecontinual use of e-cigarettes among youth (21%) [9]. Similarly,organic-against tweets (17.7%) also prompted e-cigaretteprevention for the general public and youth with educationalinformation about harms associated with e-cigarettes [21].
However, although the most common topic among tweets bythe US physicians was related to the dangerous rise in the useof e-cigarette among teens that displayed negative sentimenttoward e-cigarette, tweets by the UK physicians had no mentionof danger among youth [9]. The US physicians were alsoconcerned that advertisement effort was aimed at teenagers and
JMIR Public Health Surveill 2020 | vol. 6 | iss. 1 | e13673 | p.10http://publichealth.jmir.org/2020/1/e13673/(page number not for citation purposes)
Kwon & ParkJMIR PUBLIC HEALTH AND SURVEILLANCE
XSL•FORenderX

supported the notion of raising the required age for purchasinge-cigarettes [9]. Youth e-cigarette use was also a concern inanother study, particularly regarding the tobacco companies’marketing strategies among the anti–e-cigarette tweets [19],which is consistent with the fact that 4.2% of tweets were onissues regarding e-cigarette use by underage users [25].
Methodological EvaluationOverall, most studies included in our review were satisfactoryfor methodological evaluation criteria suggested by the Agencyfor Healthcare Research and Quality (Table 2). However, a fewmethodological issues have been identified (Table 2). A fewstudies needed to provide clearer research questions, althoughtheir studies were exploratory in nature [31,33,38]. Most studiesprovided thorough descriptions of methodology, such as searchtools, selection methods, search terms used, and capture period,along with the rationale for data collection procedures and
analysis. Most studies used purposive sampling, whereas a fewstudies used random sampling. Most studies did not haveproblems with data analysis and results reported, although moredetailed descriptions about the analytic methods may have beenhelpful. It is because some of the analytic techniques andsoftware used for data analysis on social media platforms wererelatively new to the readers, given that social media–basedresearch is relatively an emerging area. In addition, proceduresto ensure reliability of coding (eg, double-checking by multiplecoders) may need to be included in the methods [36]. Moreover,some studies lacked the clear explanation of limitations of theirstudies, which would be critical for the readers to consider whileinterpreting the findings [26,33], and more in-depth discussionscould have been provided on their findings [23]. Furthermore,it may be an issue related to the journal requirement, but a fewstudies did not provide information on funding source of theirstudies [21,26,31].
JMIR Public Health Surveill 2020 | vol. 6 | iss. 1 | e13673 | p.11http://publichealth.jmir.org/2020/1/e13673/(page number not for citation purposes)
Kwon & ParkJMIR PUBLIC HEALTH AND SURVEILLANCE
XSL•FORenderX
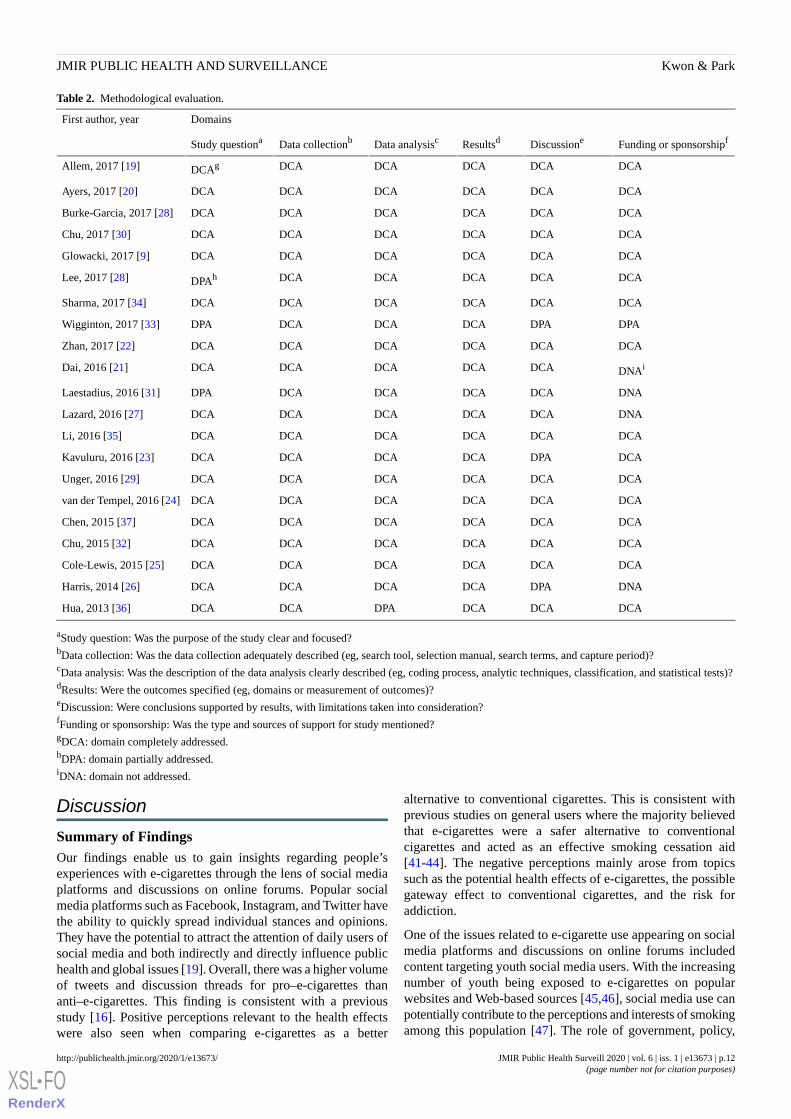
Table 2. Methodological evaluation.
DomainsFirst author, year
Funding or sponsorshipfDiscussioneResultsdData analysiscData collectionbStudy questiona
DCADCADCADCADCADCAgAllem, 2017 [19]
DCADCADCADCADCADCAAyers, 2017 [20]
DCADCADCADCADCADCABurke-Garcia, 2017 [28]
DCADCADCADCADCADCAChu, 2017 [30]
DCADCADCADCADCADCAGlowacki, 2017 [9]
DCADCADCADCADCADPAhLee, 2017 [28]
DCADCADCADCADCADCASharma, 2017 [34]
DPADPADCADCADCADPAWigginton, 2017 [33]
DCADCADCADCADCADCAZhan, 2017 [22]
DNAiDCADCADCADCADCADai, 2016 [21]
DNADCADCADCADCADPALaestadius, 2016 [31]
DNADCADCADCADCADCALazard, 2016 [27]
DCADCADCADCADCADCALi, 2016 [35]
DCADPADCADCADCADCAKavuluru, 2016 [23]
DCADCADCADCADCADCAUnger, 2016 [29]
DCADCADCADCADCADCAvan der Tempel, 2016 [24]
DCADCADCADCADCADCAChen, 2015 [37]
DCADCADCADCADCADCAChu, 2015 [32]
DCADCADCADCADCADCACole-Lewis, 2015 [25]
DNADPADCADCADCADCAHarris, 2014 [26]
DCADCADCADPADCADCAHua, 2013 [36]
aStudy question: Was the purpose of the study clear and focused?bData collection: Was the data collection adequately described (eg, search tool, selection manual, search terms, and capture period)?cData analysis: Was the description of the data analysis clearly described (eg, coding process, analytic techniques, classification, and statistical tests)?dResults: Were the outcomes specified (eg, domains or measurement of outcomes)?eDiscussion: Were conclusions supported by results, with limitations taken into consideration?fFunding or sponsorship: Was the type and sources of support for study mentioned?gDCA: domain completely addressed.hDPA: domain partially addressed.iDNA: domain not addressed.
Discussion
Summary of FindingsOur findings enable us to gain insights regarding people’sexperiences with e-cigarettes through the lens of social mediaplatforms and discussions on online forums. Popular socialmedia platforms such as Facebook, Instagram, and Twitter havethe ability to quickly spread individual stances and opinions.They have the potential to attract the attention of daily users ofsocial media and both indirectly and directly influence publichealth and global issues [19]. Overall, there was a higher volumeof tweets and discussion threads for pro–e-cigarettes thananti–e-cigarettes. This finding is consistent with a previousstudy [16]. Positive perceptions relevant to the health effectswere also seen when comparing e-cigarettes as a better
alternative to conventional cigarettes. This is consistent withprevious studies on general users where the majority believedthat e-cigarettes were a safer alternative to conventionalcigarettes and acted as an effective smoking cessation aid[41-44]. The negative perceptions mainly arose from topicssuch as the potential health effects of e-cigarettes, the possiblegateway effect to conventional cigarettes, and the risk foraddiction.
One of the issues related to e-cigarette use appearing on socialmedia platforms and discussions on online forums includedcontent targeting youth social media users. With the increasingnumber of youth being exposed to e-cigarettes on popularwebsites and Web-based sources [45,46], social media use canpotentially contribute to the perceptions and interests of smokingamong this population [47]. The role of government, policy,
JMIR Public Health Surveill 2020 | vol. 6 | iss. 1 | e13673 | p.12http://publichealth.jmir.org/2020/1/e13673/(page number not for citation purposes)
Kwon & ParkJMIR PUBLIC HEALTH AND SURVEILLANCE
XSL•FORenderX

and propaganda appeared as another major theme. One studyillustrated the power and reach of social media by suggestinghow information can be easily disseminated in a short periodand how even a state campaign can influence people all aroundthe nation [19]. Furthermore, social media platforms, particularlyTwitter, can be used by e-cigarette proponents, includingtobacco companies and related business owners, for defendingtheir positions [26].
The differences in perceptions on social media platforms acrosscountries were also noted. For example, there was a differencebetween the UK and US physicians’ attitudes towarde-cigarettes, in that the US tweets emphasized more on thedangers of its use among youth, whereas the UK tweets focusedon the potentiality of e-cigarettes to be used as the smokingcessation aid [9]. When tweets among several countries wereanalyzed, the United Kingdom showed the highest rate ofpro–e-cigarette tweets, whereas Hungary showed the highestrate of anti–e-cigarette tweets [21]. With discussion threads,Switzerland and Canada showed more positive sentiment scoresfor e-cigarette topics than thread posts by the users of the UnitedStates, Australia, the United Kingdom, Ireland, Colombia, Japan,Malaysia, and Pakistan [32].
Furthermore, social media platforms reflected upon theperspectives of some of the population subsets through theire-community such as the physician groups and people withmental health issues [9,24,34]. Motivation for people withmental illness to vape included self-medication and quittingsmoking, feeling of self-control, and role for hobby and socialconnectedness, whereas barriers to vaping included e-cigarettesbeing considered a low-grade substitute for cigarettes andmedicine, risk of addiction, difficulties in using, and cost [34].This finding is inconsistent with a study on a national sampleof US adults where reasons for the use of e-cigarettes amongthose with mental health conditions were just because, quittingsmoking, safer mode compared with conventional cigarettes,ease of use, and cost [48].
Contradictory findings were noted with respect to the users ofsocial media platforms, although only a few studies reportedon characteristics and proportions of industrial users. One studyidentified the proportion of users from industry on social mediaplatforms [19]. This study used social media platforms for apublic health campaign, and almost half of the total users wereindustrial users [19]. Another study found strategies of tobaccocompanies, such as using popular hashtags to increase retweetsand using specific hashtags such as #quitsmoking topurposefully reach tobacco users interested in quitting [24].Most Twitter users were identified as everyday users, withtobacco companies and retailors representing only 7.77% and1.97%, respectively, in another study [25]. In many cases,e-cigarette companies were targeting young people whilepromoting their events and popular venues largely via socialmedia platforms, and policy may need to be put in place toreduce advertisements on popular social media sites [49].
LimitationsThere are certain limitations to this review. Although we usedsearch strategies and techniques to systematically find thearticles from multiple search engines, there remains a possibility
of some articles being missed. There can be potential errors interms of incorrect categorization or elimination of relevantfindings that may have contributed to the perceptions andsentiments of e-cigarettes on social media platforms despitemultiple coders independently coding articles and analyzingthe themes. In addition, we did not specifically include termssuch as perceptions or sentiments, as we did not want to missarticles that had not used these terms in the title, abstract, orkeywords by narrowing the search results with those searchterms; for example, some articles explored e-cigarette sentimentsor perceptions on social media platforms, but they did not usethe term sentiments or perceptions in their titles, abstracts, orkeywords [19-24,26-29,33,36-38]. With this search strategy,we had to screen more articles in the initial screening phase,but it yielded a broader pool of articles and lowered the chancesof missing relevant articles.
Recommendations for Future StudiesOverall, social media platforms offer benefits in research byserving as data sources for researchers and health careprofessionals, making it possible to collect and access valuableinformation regarding perceptions and sentiments of people onsocial media platforms and online forums. However, owing tothe anonymous nature of social media users, only a few studiesrevealed demographic information about the users [19,23-25].As a result, we have limited knowledge on how perceptions andsentiments vary depending on subgroups of population. Thus,future studies may need to explore how perceptions andsentiments differ based on the user characteristics, such as age,gender, race/ethnicity, and socioeconomic status. In addition,future studies can benefit by including detailed descriptions ofprocedures used to ensure reliability of their coding and analyticmethods for the readers that may be relatively new to the conceptof social media data and research.
ConclusionsThis study identifies overall trends of research regardingpeople’s perceptions on e-cigarettes on social media platformsand online forums. People’s perceptions and sentiments aboute-cigarette use on social media platforms and online forumswere more positive than negative. Positive sentiments aboute-cigarettes dramatically increased on social media platforms[25], which contradicted the results of the Tobacco Productsand Risk Perceptions survey in the same period where therewas an increase in negative perceptions among the generalpublic [50]. This may be related to the fact that social mediaplatforms and online forums are being more frequently used bye-cigarette users and those who are interested in potential useor marketing. With the increasing popularity of social mediause, it is possible that individuals who regard e-cigarette use asa salient social norm and helpful cessation device may post andcomment and build e-communities about e-cigarettes. Inaddition, the positive views on social media platforms may berelated to the steep increase in the use of e-cigarette amongadolescents and young adults, who are more frequent socialmedia users. Given the findings of this study, social mediaplatforms can be important channels for intervention delivery.Web or app-based health interventions that deliver appropriateinformation about the harms and benefits of e-cigarette and
JMIR Public Health Surveill 2020 | vol. 6 | iss. 1 | e13673 | p.13http://publichealth.jmir.org/2020/1/e13673/(page number not for citation purposes)
Kwon & ParkJMIR PUBLIC HEALTH AND SURVEILLANCE
XSL•FORenderX

latest research updates on new vaping devices can prove to be beneficial.
AcknowledgmentsThe authors would like to acknowledge student assistants Marissa Fontanez and Yashoda Bhandari for their help in extractingdata in the initial phase of this review.
Conflicts of InterestNone declared.
Multimedia Appendix 1Overview of included articles.[DOCX File , 29 KB - publichealth_v6i1e13673_app1.docx ]
Multimedia Appendix 2Sentiments and themes identified.[DOCX File , 36 KB - publichealth_v6i1e13673_app2.docx ]
References1. Jamal A, Phillips E, Gentzke AS, Homa DM, Babb SD, King BA, et al. Current cigarette smoking among adults - United
States, 2016. MMWR Morb Mortal Wkly Rep 2018 Jan 19;67(2):53-59 [FREE Full text] [doi: 10.15585/mmwr.mm6702a1][Medline: 29346338]
2. Cahn Z, Siegel M. Electronic cigarettes as a harm reduction strategy for tobacco control: a step forward or a repeat of pastmistakes? J Public Health Policy 2011 Feb;32(1):16-31. [doi: 10.1057/jphp.2010.41] [Medline: 21150942]
3. Farsalinos KE, Romagna G, Tsiapras D, Kyrzopoulos S, Voudris V. Characteristics, perceived side effects and benefits ofelectronic cigarette use: a worldwide survey of more than 19,000 consumers. Int J Environ Res Public Health 2014 Apr22;11(4):4356-4373 [FREE Full text] [doi: 10.3390/ijerph110404356] [Medline: 24758891]
4. E-cigarettes.SurgeonGeneral. 2016. E-Cigarette Use Among Youth and Young Adults: A Report of the Surgeon General.URL: https://e-cigarettes.surgeongeneral.gov/documents/2016_sgr_full_report_non-508.pdf [accessed 2019-10-21]
5. Park E, Kwon M. Health-related internet use by children and adolescents: systematic review. J Med Internet Res 2018 Apr3;20(4):e120 [FREE Full text] [doi: 10.2196/jmir.7731] [Medline: 29615385]
6. Kaplan AM, Haenlein M. Users of the world, unite! The challenges and opportunities of social media. Bus Horiz 2010Jan;53(1):59-68. [doi: 10.1016/j.bushor.2009.09.003]
7. Helmond A. The platformization of the web: making web data platform ready. Soc Media Soc 2015;1(2):205630511560308.[doi: 10.1177/2056305115603080]
8. Prochaska JJ, Pechmann C, Kim R, Leonhardt JM. Twitter=quitter? An analysis of Twitter quit smoking social networks.Tob Control 2012 Jul;21(4):447-449 [FREE Full text] [doi: 10.1136/tc.2010.042507] [Medline: 21730101]
9. Emery SL, Vera L, Huang J, Szczypka G. Wanna know about vaping? Patterns of message exposure, seeking and sharinginformation about e-cigarettes across media platforms. Tob Control 2014 Jul;23(Suppl 3):iii17-iii25 [FREE Full text] [doi:10.1136/tobaccocontrol-2014-051648] [Medline: 24935893]
10. Allem J, Ferrara E, Uppu SP, Cruz TB, Unger JB. E-cigarette surveillance with social media data: social bots, emergingtopics, and trends. JMIR Public Health Surveill 2017 Dec 20;3(4):e98 [FREE Full text] [doi: 10.2196/publichealth.8641][Medline: 29263018]
11. Glowacki EM, Lazard AJ, Wilcox GB. E-cigarette topics shared by medical professionals: a comparison of tweets fromthe United States and United Kingdom. Cyberpsychol Behav Soc Netw 2017 Feb;20(2):133-137. [doi:10.1089/cyber.2016.0409] [Medline: 28118024]
12. Anderson M, Jiang J. Pew Research Center. Teens, Social Media & Technology 2018. URL: http://www.pewinternet.org/wp-content/uploads/sites/9/2018/05/PI_2018.05.31_TeensTech_FINAL.pdf [accessed 2019-10-21]
13. Anderson M, Smith A. Pew Research Center. 2018. Social Media Use in 2018. URL: http://www.pewinternet.org/wp-content/uploads/sites/9/2018/02/PI_2018.03.01_Social-Media_FINAL.pdf [accessed 2019-10-21]
14. Pearson JL, Richardson A, Niaura RS, Vallone DM, Abrams DB. e-Cigarette awareness, use, and harm perceptions in USadults. Am J Public Health 2012 Sep;102(9):1758-1766 [FREE Full text] [doi: 10.2105/AJPH.2011.300526] [Medline:22813087]
15. Duke JC, Allen JA, Eggers ME, Nonnemaker J, Farrelly MC. Exploring differences in youth perceptions of the effectivenessof electronic cigarette television advertisements. Nicotine Tob Res 2016 May;18(5):1382-1386. [doi: 10.1093/ntr/ntv264][Medline: 26706908]
JMIR Public Health Surveill 2020 | vol. 6 | iss. 1 | e13673 | p.14http://publichealth.jmir.org/2020/1/e13673/(page number not for citation purposes)
Kwon & ParkJMIR PUBLIC HEALTH AND SURVEILLANCE
XSL•FORenderX

16. McCausland K, Maycock B, Leaver T, Jancey J. The messages presented in electronic cigarette-related social mediapromotions and discussion: scoping review. J Med Internet Res 2019 Feb 5;21(2):e11953 [FREE Full text] [doi:10.2196/11953] [Medline: 30720440]
17. Moher D, Liberati A, Tetzlaff J, Altman DG, PRISMA Group. Preferred reporting items for systematic reviews andmeta-analyses: the PRISMA statement. PLoS Med 2009 Jul 21;6(7):e1000097 [FREE Full text] [doi:10.1371/journal.pmed.1000097] [Medline: 19621072]
18. EndNote. URL: http://endnote.com/product-details/X7 [accessed 2019-10-21]19. Allem J, Escobedo P, Chu K, Soto DW, Cruz TB, Unger JB. Campaigns and counter campaigns: reactions on Twitter to
e-cigarette education. Tob Control 2017 Mar;26(2):226-229 [FREE Full text] [doi: 10.1136/tobaccocontrol-2015-052757][Medline: 26956467]
20. Ayers JW, Leas EC, Allem J, Benton A, Dredze M, Althouse BM, et al. Why do people use electronic nicotine deliverysystems (electronic cigarettes)? A content analysis of Twitter, 2012-2015. PLoS One 2017;12(3):e0170702 [FREE Fulltext] [doi: 10.1371/journal.pone.0170702] [Medline: 28248987]
21. Dai H, Hao J. Mining social media data for opinion polarities about electronic cigarettes. Tob Control 2017Mar;26(2):175-180. [doi: 10.1136/tobaccocontrol-2015-052818] [Medline: 26980151]
22. Zhan Y, Liu R, Li Q, Leischow SJ, Zeng DD. Identifying topics for e-cigarette user-generated contents: a case study frommultiple social media platforms. J Med Internet Res 2017 Jan 20;19(1):e24 [FREE Full text] [doi: 10.2196/jmir.5780][Medline: 28108428]
23. Kavuluru R, Sabbir AK. Toward automated e-cigarette surveillance: spotting e-cigarette proponents on Twitter. J BiomedInform 2016 Jun;61:19-26 [FREE Full text] [doi: 10.1016/j.jbi.2016.03.006] [Medline: 26975599]
24. van der Tempel J, Noormohamed A, Schwartz R, Norman C, Malas M, Zawertailo L. Vape, quit, tweet? Electronic cigarettesand smoking cessation on Twitter. Int J Public Health 2016 Mar;61(2):249-256. [doi: 10.1007/s00038-016-0791-2] [Medline:26841895]
25. Cole-Lewis H, Pugatch J, Sanders A, Varghese A, Posada S, Yun C, et al. Social listening: a content analysis of e-cigarettediscussions on twitter. J Med Internet Res 2015 Oct 27;17(10):e243 [FREE Full text] [doi: 10.2196/jmir.4969] [Medline:26508089]
26. Harris JK, Moreland-Russell S, Choucair B, Mansour R, Staub M, Simmons K. Tweeting for and against public healthpolicy: response to the Chicago Department of Public Health's electronic cigarette Twitter campaign. J Med Internet Res2014 Oct 16;16(10):e238 [FREE Full text] [doi: 10.2196/jmir.3622] [Medline: 25320863]
27. Lazard AJ, Wilcox GB, Tuttle HM, Glowacki EM, Pikowski J. Public reactions to e-cigarette regulations on Twitter: a textmining analysis. Tob Control 2017 Dec;26(e2):e112-e116. [doi: 10.1136/tobaccocontrol-2016-053295] [Medline: 28341768]
28. Burke-Garcia A, Stanton CA. A tale of two tools: Reliability and feasibility of social media measurement tools examininge-cigarette twitter mentions. Inform Med Unlock 2017 May;8(5):8-12. [doi: 10.1016/j.imu.2017.04.001]
29. Unger JB, Escobedo P, Allem J, Soto DW, Chu K, Cruz T. Perceptions of secondhand e-cigarette aerosol among Twitterusers. Tob Regul Sci 2016 Apr;2(2):146-152 [FREE Full text] [doi: 10.18001/TRS.2.2.5] [Medline: 28090560]
30. Chu K, Allem J, Cruz TB, Unger JB. Vaping on Instagram: cloud chasing, hand checks and product placement. Tob Control2016 Sep;26(5):575-578 [FREE Full text] [doi: 10.1136/tobaccocontrol-2016-053052] [Medline: 27660111]
31. Laestadius LI, Wahl MM, Cho YI. #Vapelife: An exploratory study of electronic cigarette use and promotion on Instagram.Subst Use Misuse 2016 Oct 14;51(12):1669-1673. [doi: 10.1080/10826084.2016.1188958] [Medline: 27484191]
32. Chu K, Valente TW. How different countries addressed the sudden growth of e-cigarettes in an online tobacco controlcommunity. BMJ Open 2015 May 21;5(5):e007654 [FREE Full text] [doi: 10.1136/bmjopen-2015-007654] [Medline:25998038]
33. Wigginton B, Gartner C, Rowlands IJ. Is it safe to vape? Analyzing online forums discussing e-cigarette use duringpregnancy. Womens Health Issues 2017;27(1):93-99. [doi: 10.1016/j.whi.2016.09.008] [Medline: 27773530]
34. Sharma R, Wigginton B, Meurk C, Ford P, Gartner CE. Motivations and limitations associated with vaping among peoplewith mental illness: a qualitative analysis of Reddit discussions. Int J Environ Res Public Health 2016 Dec 22;14(1) [FREEFull text] [doi: 10.3390/ijerph14010007] [Medline: 28025516]
35. Li Q, Zhan Y, Wang L, Leischow SJ, Zeng DD. Analysis of symptoms and their potential associations with e-liquids'components: a social media study. BMC Public Health 2016 Jul 30;16:674 [FREE Full text] [doi: 10.1186/s12889-016-3326-0][Medline: 27475060]
36. Hua M, Alfi M, Talbot P. Health-related effects reported by electronic cigarette users in online forums. J Med Internet Res2013 Apr 8;15(4):e59 [FREE Full text] [doi: 10.2196/jmir.2324] [Medline: 23567935]
37. Chen AT, Zhu S, Conway M. What online communities can tell us about electronic cigarettes and hookah use: a studyusing text mining and visualization techniques. J Med Internet Res 2015 Sep 29;17(9):e220 [FREE Full text] [doi:10.2196/jmir.4517] [Medline: 26420469]
38. Lee AS, Hart JL, Sears CG, Walker KL, Siu A, Smith C. A picture is worth a thousand words: electronic cigarette contenton Instagram and Pinterest. Tob Prev Cessat 2017 Jul;3:pii: 119 [FREE Full text] [doi: 10.18332/tpc/74709] [Medline:28815224]
JMIR Public Health Surveill 2020 | vol. 6 | iss. 1 | e13673 | p.15http://publichealth.jmir.org/2020/1/e13673/(page number not for citation purposes)
Kwon & ParkJMIR PUBLIC HEALTH AND SURVEILLANCE
XSL•FORenderX
39. Collins KM, Onwuegbuzie AJ, Jiao QG. A mixed methods investigation of mixed methods sampling designs in social andhealth science research. J Mix Methods Res 2007;1(3):267-294. [doi: 10.1177/1558689807299526]
40. Thompson KS, Davis G, Frankfort-Nachmias C. Study Guide to Accompany Research Methods in the Social Sciences,Chava Frankfort-Nachmias, David Nachmias. Seventh Edition. New York, NY: Worth Publishers; 2007.
41. Adkison SE, O'Connor RJ, Bansal-Travers M, Hyland A, Borland R, Yong H, et al. Electronic nicotine delivery systems:international tobacco control four-country survey. Am J Prev Med 2013 Mar;44(3):207-215 [FREE Full text] [doi:10.1016/j.amepre.2012.10.018] [Medline: 23415116]
42. Dockrell M, Morrison R, Bauld L, McNeill A. E-cigarettes: prevalence and attitudes in Great Britain. Nicotine Tob Res2013 Oct;15(10):1737-1744 [FREE Full text] [doi: 10.1093/ntr/ntt057] [Medline: 23703732]
43. Etter J, Bullen C. Electronic cigarette: users profile, utilization, satisfaction and perceived efficacy. Addiction 2011Nov;106(11):2017-2028. [doi: 10.1111/j.1360-0443.2011.03505.x] [Medline: 21592253]
44. Pepper JK, Brewer NT. Electronic nicotine delivery system (electronic cigarette) awareness, use, reactions and beliefs: asystematic review. Tob Control 2014 Sep;23(5):375-384 [FREE Full text] [doi: 10.1136/tobaccocontrol-2013-051122][Medline: 24259045]
45. Duke JC, Lee YO, Kim AE, Watson KA, Arnold KY, Nonnemaker JM, et al. Exposure to electronic cigarette televisionadvertisements among youth and young adults. Pediatrics 2014 Jul;134(1):e29-e36. [doi: 10.1542/peds.2014-0269] [Medline:24918224]
46. Krishnan-Sarin S, Morean ME, Camenga DR, Cavallo DA, Kong G. E-cigarette use among high school and middle schooladolescents in Connecticut. Nicotine Tob Res 2015 Jul;17(7):810-818 [FREE Full text] [doi: 10.1093/ntr/ntu243] [Medline:25385873]
47. Kim M, Popova L, Halpern-Felsher B, Ling PM. Effects of e-cigarette advertisements on adolescents' perceptions ofcigarettes. Health Commun 2019 Mar;34(3):290-297. [doi: 10.1080/10410236.2017.1407230] [Medline: 29236550]
48. Cummins SE, Zhu S, Tedeschi GJ, Gamst AC, Myers MG. Use of e-cigarettes by individuals with mental health conditions.Tob Control 2014 Jul;23(Suppl 3):iii48-iii53 [FREE Full text] [doi: 10.1136/tobaccocontrol-2013-051511] [Medline:24824516]
49. de Andrade M, Hastings G, Angus K, Dixon D, Purves R. Cancer Research UK. 2013. The Marketing of Electronic Cigarettesin the UK. URL: http://www.cancerresearchuk.org/sites/default/files/cruk_marketing_of_electronic_cigs_nov_2013.pdf[accessed 2019-10-21]
50. Majeed BA, Weaver SR, Gregory KR, Whitney CF, Slovic P, Pechacek TF, et al. Changing perceptions of harm ofe-cigarettes among US adults, 2012-2015. Am J Prev Med 2017 Mar;52(3):331-338 [FREE Full text] [doi:10.1016/j.amepre.2016.08.039] [Medline: 28341303]
AbbreviationsAPI: application programming interfacee-cigarette: electronic cigaretteMeSH: Medical Subject Headings
Edited by G Eysenbach; submitted 14.02.19; peer-reviewed by JP Allem, K McCausland; comments to author 28.04.19; revised versionreceived 23.09.19; accepted 27.09.19; published 15.01.20.
Please cite as:Kwon M, Park EPerceptions and Sentiments About Electronic Cigarettes on Social Media Platforms: Systematic ReviewJMIR Public Health Surveill 2020;6(1):e13673URL: http://publichealth.jmir.org/2020/1/e13673/ doi:10.2196/13673PMID:31939747
©Misol Kwon, Eunhee Park. Originally published in JMIR Public Health and Surveillance (http://publichealth.jmir.org), 15.01.2020.This is an open-access article distributed under the terms of the Creative Commons Attribution License(https://creativecommons.org/licenses/by/4.0/), which permits unrestricted use, distribution, and reproduction in any medium,provided the original work, first published in JMIR Public Health and Surveillance, is properly cited. The complete bibliographicinformation, a link to the original publication on http://publichealth.jmir.org, as well as this copyright and license informationmust be included.
JMIR Public Health Surveill 2020 | vol. 6 | iss. 1 | e13673 | p.16http://publichealth.jmir.org/2020/1/e13673/(page number not for citation purposes)
Kwon & ParkJMIR PUBLIC HEALTH AND SURVEILLANCE
XSL•FORenderX

Original Paper
Exploring Substance Use Tweets of Youth in the United States:Mixed Methods Study
Robin C Stevens1, MPH, PhD; Bridgette M Brawner2, PhD, MDiv; Elissa Kranzler3, PhD; Salvatore Giorgi4, MA,
MS; Elizabeth Lazarus5; Maramawit Abera5, BA; Sarah Huang5, BSN; Lyle Ungar5, PhD1Department of Family and Community Health, University of Pennsylvania School of Nursing, Philadelphia, PA, United States2University of Pennsylvania School of Nursing, Philadelphia, PA, United States3Wharton Risk Management and Decision Processes Center, Philadelphia, PA, United States4Department of Computer and Information Science, Philadelphia, PA, United States5Crescenz Veterans Affairs Medical Center, Philadelphia, PA, United States
Corresponding Author:Robin C Stevens, MPH, PhDDepartment of Family and Community HealthUniversity of Pennsylvania School of Nursing418 Fagin HallPhiladelphia, PAUnited StatesPhone: 1 2158984063Email: [email protected]
Abstract
Background: Substance use by youth remains a significant public health concern. Social media provides the opportunity todiscuss and display substance use–related beliefs and behaviors, suggesting that the act of posting drug-related content, or viewingposted content, may influence substance use in youth. This aligns with empirically supported theories, which posit that behavioris influenced by perceptions of normative behavior. Nevertheless, few studies have explored the content of posts by youth relatedto substance use.
Objective: This study aimed to identify the beliefs and behaviors of youth related to substance use by characterizing the contentof youths’ drug-related tweets. Using a sequential explanatory mixed methods approach, we sampled drug-relevant tweets andqualitatively examined their content.
Methods: We used natural language processing to determine the frequency of drug-related words in public tweets (from 2011to 2015) among youth Twitter users geolocated to Pennsylvania. We limited our sample by age (13-24 years), yielding approximately23 million tweets from 20,112 users. We developed a list of drug-related keywords and phrases and selected a random sampleof tweets with the most commonly used keywords to identify themes (n=249).
Results: We identified two broad classes of emergent themes: functional themes and relational themes. Functional themesincluded posts that explicated a function of drugs in one’s life, with subthemes indicative of pride, longing, coping, and reminiscingas they relate to drug use and effects. Relational themes emphasized a relational nature of substance use, capturing substance useas a part of social relationships, with subthemes indicative of drug-related identity and companionship. We also identified topicalareas in tweets related to drug use, including reference to polysubstance use, pop culture, and antidrug content. Across the tweets,the themes of pride (63/249, 25.3%) and longing (39/249, 15.7%) were the most popular. Most tweets that expressed pride (46/63,73%) were explicitly related to marijuana. Nearly half of the tweets on coping (17/36, 47%) were related to prescription drugs.Very few of the tweets contained antidrug content (9/249, 3.6%).
Conclusions: Data integration indicates that drugs are typically discussed in a positive manner, with content largely reflectiveof functional and relational patterns of use. The dissemination of this information, coupled with the relative absence of antidrugcontent, may influence youth such that they perceive drug use as normative and justified. Strategies to address the underlyingcauses of drug use (eg, coping with stressors) and engage antidrug messaging on social media may reduce normative perceptionsand associated behaviors among youth. The findings of this study warrant research to further examine the effects of this contenton beliefs and behaviors and to identify ways to leverage social media to decrease substance use in this population.
JMIR Public Health Surveill 2020 | vol. 6 | iss. 1 | e16191 | p.17http://publichealth.jmir.org/2020/1/e16191/(page number not for citation purposes)
Stevens et alJMIR PUBLIC HEALTH AND SURVEILLANCE
XSL•FORenderX

(JMIR Public Health Surveill 2020;6(1):e16191) doi:10.2196/16191
KEYWORDS
social media; illicit drug; youth; adolescent
Introduction
BackgroundDespite previous decline in alcohol and drug use among youth,the rates of substance use have generally plateaued in recentyears [1]. Estimates indicate that 62.5% of underage alcoholusers are binge alcohol users, 1.6 million youth aged between12 and 17 years used marijuana in the past month, and 7.3% ofyouth aged between 18 and 25 years misused opioids (eg,hydrocodone and oxycodone) in the past year [2]. This is asignificant public health concern given that substance use,particularly early in life, is associated with a host of negativeoutcomes such as increased sexual risk behavior [3], negativeacademic outcomes, and increased risk of substance abuse laterin life [4,5].
Social media use has increased dramatically over the pastdecade, with near-ubiquitous use among adolescents and youngadults [6,7]. At least 85% of adolescents use one or more of theseveral popular social media platforms (eg, YouTube, Instagram,and Snapchat) [6], and 88% of young adults (aged 18-29 years)report using any form of social media [7]. Compared with otherage groups, youth report the highest rates of use within andacross social media platforms, noting that they use social mediato connect with friends and family, to obtain news andinformation, for entertainment purposes, and as a space forself-expression [6,7]. With such high levels of Web engagementand diverse usage patterns, social media has drastically changedhow information, both in general and specifically aboutrisk-related behaviors (eg, alcohol and other substance use), isreceived by and exchanged among youth [8,9].
Youth use social media to discuss and display substance usebehaviors [10-15], which have been linked to their behaviorsoffline [16]. Substantial research has demonstrated associationsbetween substance-related social media engagement andsubstance use behaviors in real life [12,15,17,18], suggestingthat the act of posting substance-related content, or viewingsuch content posted by others, may influence substance use inyouth. This potential model of effects aligns with empiricallysupported theories of behavior change, which posit that riskbehavior adoption is influenced by behavioral modeling andperceived norms (eg, perceptions of what one’s peers are doing)[19,20]. Through social media platforms, youth are connectedto and are able to witness the beliefs and behaviors of a largergroup of peers [21], where normative drug use may be featuredand cultivated on the Web [22]. From a developmentalperspective, adolescence is characterized by heightened attentionto social norms and an increased desire for social approval[23,24]. Online discussions about drugs may be particularlyimpactful for this population as public posts can conveynormative beliefs to other youth, particularly when posts supportor promote drug use. Thus, the broadcasting of beliefs andbehaviors related to drug use may influence youths’perceptions
of normative behavior, thereby influencing decisions on druguse among youth who are exposed to such conversations.
Although previous research has examined social media usageby youth as it relates to health-related outcomes [17,25], fewstudies have explored how youth discuss content related tosubstance use on Twitter. In one study, researchers examinedthe relationship between young adults’ alcohol-related tweetsand self-reported cognitions and behaviors related to alcoholuse; findings demonstrated that the proportion of one’s overalltweets related to alcohol was significantly associated with thewillingness to drink and use alcohol [26]. In a separate study,researchers surveyed young adults about their exposure toalcohol- and marijuana-related content on Twitter and their useof these substances [21]. Analyses demonstrated significantassociations between current heavy episodic drinking and higherlevels of exposure to proalcohol content and between currentmarijuana use and higher levels of exposure to promarijuanacontent. However, no previous research has specificallyexamined the content of youths’ tweets about substance use, apotential predictor of beliefs and behaviors about substance use.
ObjectivesThe primary goal of this study was to identify youths’ beliefsand behaviors related to drug use by characterizing the contentof drug-related tweets by youth. Using a mixed methodsapproach, we investigated the relationships between the typeof drug, language of the tweet, and reasons for drug use. Thisstudy provides insight into publicly stated beliefs about drugsand drug use on social media. Given the increased salience ofsocial considerations (eg, social norms and external validation)during adolescence, youths’ tweets about substance use maycontribute to the perception of what is normal, leading youthto espouse distorted perceptions of normative behavior and tomodel that behavior in real life. Through this systematicexamination of youths’ beliefs about substance use, we canbetter understand the potential mechanisms driving substanceuse behavior.
Methods
OverviewThis study employed a sequential explanatory mixed methodsdesign to examine how popular drugs are discussed by youthon Twitter [27]. A mixed methods research approach was mostappropriate given that quantitative or qualitative data, bythemselves, would be insufficient to capture the nuances ofyouths’ tweets about substances. The use of mixed methods insocial media research has grown in popularity as researchersseek to capitalize on the strengths of each data source [28],gaining a better understanding of their phenomena of interest.We chose the sequential explanatory design, placing priorityon the qualitative data, to obtain a general understanding of thetweets and to contextualize the results.
JMIR Public Health Surveill 2020 | vol. 6 | iss. 1 | e16191 | p.18http://publichealth.jmir.org/2020/1/e16191/(page number not for citation purposes)
Stevens et alJMIR PUBLIC HEALTH AND SURVEILLANCE
XSL•FORenderX

Following this approach, we first conducted quantitative datacollection and analysis to identify an appropriate sample ofyouths’ tweets, and then, we conducted qualitative data analysisto examine the content of these tweets. We used natural languageprocessing (NLP) techniques to determine the frequency of useof drug-related words in public English-language tweets amongthe youth and emerging adult users of Twitter in Pennsylvania.We subsequently conducted a qualitative content analysis of arandom sample of tweets for in-depth exploration of the contextin which the words were used. This methodology provides amore nuanced view of substance use–related messages postedpublicly by youth online, offering insights that may not be
apparent through the analysis of quantitative or qualitative datain isolation. A key step in the mixed methods research is theintegration of quantitative and qualitative data. We integrateddata in two ways: (1) connecting, wherein the data were linkedthrough the sampling frame such that we had quantitative andqualitative data for each participant, and (2) merging, whereinthe two datasets were brought together for analyses [29]. Forinterpretation and reporting, we used a weaving approachwhereby the NLP and content analysis results are presentedtogether on a theme‐by‐theme basis [29]. See Figure 1 forthe data flow diagram. This study was deemed exempt by theinstitutional review board of the University of Pennsylvania.
Figure 1. Data flow diagram. API: application programming interface; NLP: natural language processing.
Twitter DatasetData analysis was conducted with a sample of drug-relatedtweets posted on Twitter over a 4-year period. Using Twitter’sapplication programming interface, which provides broad accessto public Twitter data, we drew a random sample of 1% ofpublicly available tweets posted between 2011 and 2015. Tweetswere geolocated to US counties using tweet-specific latitudeand longitude coordinates and self-reported location informationin Twitter’s user profiles [30]. Using the open source Pythonpackage TwitterMySQL [31], we pulled the most recent 3200tweets for each user geolocated to Pennsylvania, resulting in adataset of over 440 million tweets. After removing bothnon-English tweets and duplicate tweets [32,33], often frombots and advertisers, we produced age and racial affiliationestimates for each user based on our tested algorithms [34,35].We limited our sample by predicted age (13-17 years) andpredicted race (black or non-Hispanic white), yielding 10,056distinct adolescent users. We then randomly sampled acomparable number of emerging adult users with a predictedage of 18 to 24 years to match the adolescent sample. Thisapproach yielded approximately 23 million tweets from 20,112adolescents and young adults in Pennsylvania.
Quantitative Retrieval of Drug-Related TweetsTo identify drug-relevant Twitter posts, we built lists ofdrug-related words and phrases, drawing from previous research[21], music lyrics, and slang dictionaries. We used these wordsand phrases to develop our classifier, which we iterativelyimproved using manual coders to assess the yields on a trainingdataset. Once we finalized the keyword list, comprising 63drug-related words, we retrieved a random sample of tweetscontaining those keywords, yielding approximately 872 tweetsfor manual coding. The research team then identified which ofthe 63 keywords led to the retrieval of the largest number ofrelevant tweets. The 12 keywords that yielded the greatestproportion of drug-relevant tweets are listed in Table 1. Weseparated hashtagged versions of these words as well as wordextensions (eg, “high” vs “highlife”), expanding our list to 18keywords to capture potentially nuanced differences in usage.
We then selected a random sample of approximately 20 tweetscontaining each of the 18 frequently used drug-related keywords,totaling 353 tweets, for qualitative coding. As some keywordsdid not yield 20 relevant tweets, we coded the total number oftweets that were retrieved. Each tweet was coded independentlyby 3 coders to ensure it was drug-related (n=249). When coderscould not reach agreement based on independent coding, theyworked together to make a final determination. Nonrelevanttweets (n=104) were excluded from further analyses.
JMIR Public Health Surveill 2020 | vol. 6 | iss. 1 | e16191 | p.19http://publichealth.jmir.org/2020/1/e16191/(page number not for citation purposes)
Stevens et alJMIR PUBLIC HEALTH AND SURVEILLANCE
XSL•FORenderX

Table 1. Drug-related keywords, number of tweets sampled by keywords, relevant tweets, and keyword sensitivity.
Keyword sensitivitya, n (%)Relevant tweets (n=249), nTweets sampled by keyword (n=353), nDrug-related keywords
13 (68)1319#blunt(s)
12 (60)1220Blunt
13 (65)1320#high
12 (60)1220#highlife
6 (30)620High
7 (50)714#marijuana
12 (60)1220Marijuana
9 (56)916#wakenbake
17 (85)1720Ganja
10 (50)1020Pot
17 (85)1720Pothead
18 (90)1820Smoke
17 (85)1720Stoned
13 (65)1320Stoner
9 (75)912#stoner
19 (95)1920Weed
16 (80)1620Adderall
11 (91)1112Valium
18 (90)1820Xanax
aKeyword sensitivity is the percentage of tweets from the total sample that were deemed relevant during manual coding.
Qualitative Coding of Tweets Using Content AnalysisIn the second stage of our mixed methods approach, we analyzedthe sample of 249 drug-related tweets using establishedprocedures for qualitative content analysis [36,37], a techniquefor making replicable and valid inferences from texts to thecontexts of their use [22]. A total of 3 undergraduate studentswere extensively trained to code tweets for emergent themes.The relevant tweets were qualitatively analyzed in a multistageprocess that began with the identification of initial codesgenerated from prior literature and emerging themes. The teamthen coded the tweets until they reached consensus on thematiccoding. Themes are not mutually exclusive; thus, tweets couldbe categorized under multiple themes. Inter-rater reliability wasachieved at kappa=0.80 across key themes and topics,demonstrating acceptable reliability. We also calculatedfrequencies to describe the proportion of the sample categorizedunder each theme. In addition to emerging themes, we identifiedfrequently occurring topics in tweets related to drug use anddetermined the proportion of tweets with antidrug content. Allexample tweets cited in the Results section were modified toretain their meaning, although they were rendered unsearchableon the internet [38]. The example tweets are accompanied byexplanatory text, where appropriate, in brackets.
Results
Quantitative FindingsTable 1 lists the drug-related keywords used to retrieve therandom sample of tweets and the number of tweets from eachkeyword included in the analysis. In total, we coded 249 tweets.As most of our keywords were specific to marijuana (12 out of18), the majority of tweets in our analysis were alsomarijuana-related. Of the 6 keywords not explicitly related tomarijuana, 3 were related to the prescription drugs Xanax,Percocet, and Adderall, and 3 keywords were nondrug-specificwords related to substance use (“high,” “#high,” and “highlife”).We assessed the sensitivity of each keyword in retrievingrelevant tweets. “Weed” was the most sensitive keyword, withthe highest rate of retrieving drug-related tweets. “High” wasthe least sensitive keyword, retrieving relevant tweets 30.0%of the time.
We identified two broad classes of themes in our sample oftweets: functional themes and relational themes. Functionalthemes included posts that explicated a function of drugs in theuser’s life. Within this broader classification, we identifiedfunctional subthemes indicative of pride, longing, coping, andreminiscing as they relate to drug use or effects. The secondclass of themes emphasized a relational nature of substance use.Specifically, this theme captured substance use as a part of socialrelationships. The subthemes identified in this category wereidentity and companionship as they relate to drug use. In addition
JMIR Public Health Surveill 2020 | vol. 6 | iss. 1 | e16191 | p.20http://publichealth.jmir.org/2020/1/e16191/(page number not for citation purposes)
Stevens et alJMIR PUBLIC HEALTH AND SURVEILLANCE
XSL•FORenderX

to emergent themes, we also identified several topical areas intweets related to drug use, which included reference topolysubstance use, pop culture, and antidrug content.
Across the sampled tweets, subthemes of pride (63/249, 25.3%)and longing (39/249, 15.7%) were the most popular. Thematicdifferences emerged between tweets about prescription drugsversus nonprescription drugs.
Functional Themes
PrideAs the most popular theme, approximately one-quarter of alltweets in the sample (63/249, 25.3%) expressed pride in druguse. Tweets such as “This was the #first #blunt I rolled that themans didn’t have to fix :) #wassoproud #smokeditsonice” and“Happy 420 !(: I just rolled my first blunt !! #RolledBlunt#Happy420” exemplify users’ pride in their skills related todrug use. Most tweets that expressed pride (46/63, 73%) wereexplicitly related to marijuana.
LongingIn tweets related to longing, users expressed yearning, desire,or craving for either a drug or the effects of a drug. Tweets suchas “I would rather be high right now” and “could really use mea #blunt #like #now” explicitly portray the user’s desire for asubstance or for the associated feeling. Although these tweetsdo not specify the actual intention or use of drugs in the future,the users communicated a desire to get high given their currentcircumstance.
CopingTweets related to coping described drug use as a coping strategy,often as a means to manage stressors and emotions, for example,“marijuana is useful for treating _____ INSERT whatev er thefuck your problem is here” and “Who ever said can’t buyhappiness obviously didn’t kno w any pot dealers.” In addition,many coping-related tweets were about prescription drugs: “Ifit was not for adderall idk [I don’t know] how would deal withall of this college work rs [real shit].” Coping-related tweets aredistinguished from longing-related tweets (eg, “I could use someAdderall right now...”) to the extent that the users specificallystated that they were trying to manage a condition (eg, a stressoror emotion) with drugs. Nearly half of the tweets on coping(17/36, 47%) were related to prescription drugs. Very few ofthe tweets contained antidrug content (9/249, 3.6%).
ReminiscingReminiscing described tweets that expressed nostalgia orwistfulness or depicted a user looking back at a drug-relatedexperience. The tweet “That night I was soo drunk...soohigh...Can’t even remember...#trippinBalls #MissThoseNights#HighLife” exemplifies how the user was fondly thinking backto a time when they used drugs. In the tweet “@[another user]yo go to the gram and look at that ganja i had last night lil,” theuser is remembering and referring to their past drug use postedon Instagram, another social media platform.
Relational Themes
IdentityTweets were categorized under the identity category if the userclassified himself/herself or another person with a drug-relatedlabel or name. For example, “She called me a potheadtho...Naaaah, I prefer stoner” labels the user as a pothead or astoner. In the tweet “You know your boyfriends a pothead whenhe wakes up out of a dead sleep to smoke,” the user hascategorized another drug user as a pothead. In this class oftweets, these names do not necessarily carry a negativeconnotation; rather, they convey the user’s pride in beingthought of as a stoner.
CompanionshipTweets were categorized under the companionship theme ifthey expressed a feeling of fellowship or friendship, particularlywhen the tweet suggested that the user was looking for acompanion to join in drug use. “Someone find me a #blunt anda cuddlebuddy” illustrates a Twitter user who indirectly askedthe public for a companion to smoke with. “Burn riiiide withnew friends???????? #bong #blunt #lovelife” portrays a differentform of companionship where the user is not directly searchingfor a companion but describes the feeling of using drugs infellowship with friends. The tweets in this category refer to thesocial connectedness component of substance use.
Associated Topics
Polysubstance UseTweets within this category contained content that implied theuse of multiple substances. “Got that percaset, promenthasenwith codeine, Xanax!” suggests that the user intends to take orsell the 3 drugs mentioned with codeine. Another tweet, “I liketo chase a few xanax bars with A crown royal” more clearlymodels polysubstance use, with the user explaining the orderin which they prefer to use alcohol and another substance.
Pop CultureTweets containing content that referred to song lyrics,celebrities, or trending topics were categorized under popculture. For example, “Ain’t a fucking sing along unless youbrought the weed along” and “One by one, load up de van, allof a ganja it ram” are music lyrics. Although the tweets may ormay not refer to the user’s actual drug-related behavior, theseexamples demonstrate how references to drug use in song lyricsare disseminated on social media.
AntidrugOf the 249 tweets in our sample, only 9 (3.6%) included antidrugmessaging. Antidrug tweets contained only 4 drug-relatedkeywords: “marijuana,” “smoke,” “weed,” and “valium.” Onesuch tweet conveys a strong antidrug perspective: “I see somany people of our generation glorifying xanax and valium andperks. It’s so fucking disgusting.” In another tweet, “No amountof weed is worth a fucking life,” the user links marijuana usewith unspecified, though serious, repercussions.
JMIR Public Health Surveill 2020 | vol. 6 | iss. 1 | e16191 | p.21http://publichealth.jmir.org/2020/1/e16191/(page number not for citation purposes)
Stevens et alJMIR PUBLIC HEALTH AND SURVEILLANCE
XSL•FORenderX

Themes and Drug-Related KeywordsFigure 2 is a visual representation of the presence of themes foreach drug-related keyword. Except for Adderall, Valium, andXanax, all drug-related keywords were most frequently
associated with pride, identity, and companionship. Tweetsabout prescription drugs (Adderall, Valium, and Xanax),however, were more frequently categorized under the themesof coping and polysubstance use.
Figure 2. Frequency of themes from tweets having drug-related keywords.
Discussion
Principal FindingsYouths’ discourse about drug use on Twitter offers valuableinsights into the normative beliefs and behaviors, as expressedonline. Our systematic mixed methods approach to examine theuse of Twitter by youth to discuss drugs furthers ourunderstanding of the potential mechanisms driving substanceuse behavior, from an expression of pride to a means for copingwith life stressors. In the tweets studied, we found that the mostpopular drug-related keywords were related to marijuana,followed in popularity by prescription drugs. The relativepopularity of drug-related keywords related to these substancesmirrors broader substance use patterns as marijuana is the illicitsubstance that is most commonly used among youth [1].Thematic analyses indicate that drugs were typically discussedin a positive manner, including positive messages about previousexperiences with drugs or one’s desire to use drugs again. Ourfindings also suggest that users are comfortable posting publicendorsements of drug use.
Youth expressed pride, confidence, or boastfulness online abouttheir drug-related behaviors. Youth who boasted about theirdrug use on Twitter often linked drug use to their identities. Inaddition, online discussions of drug use were regularlyassociated with social contexts, mirroring the correlation ofyouths’ substance use in offline settings. In many tweets, youthindicated a craving or desire for a drug or the effects of druguse. This is particularly notable as there was little discussion
about the addictive nature of substances. Without this, the risksand negative outcomes associated with drug use are largelyabsent from peer online discussion.
We found that prescription drugs were used for coping,specifically as a tool to cope with challenges, grief, or stress.These tweets may help explain, in part, the rise in misuse ofprescription drugs, with approximately 2200 youth misusingpain medications each day [2]. Youth online view Xanax,Percocet, and Valium as tools to cope with the challenges theyface rather than as a part of peer social drug use (as was seenwith marijuana). When youth opt to use these drugs foremotional regulation and to help deal with life stressors, theycan increase their risk of future addiction [39]. The tweets alsoreveal that prescription drug–related tweets are mentioned alongwith other drugs and alcohol use. This echoes previous research,which found that almost 1 in 10 Adderall-related tweetscontained reference to another substance [40].
Substance use among youth is a highly social behavior to theextent that the usage patterns are influenced heavily by perceivedpeer norms and behaviors [23]. Substance use messages postedon social media are related to youths’ substance use behaviorsoffline and may also influence the normative beliefs of youthwho are exposed to those messages [41-44]. When youthdescribe the frequency of their marijuana or prescription druguse online, these messages endorse substance use as normativebehavior among youth. This holds true despite the potentiallegal implications of underage drinking or illegal substance use.For example, in Pennsylvania, recreational marijuana use is
JMIR Public Health Surveill 2020 | vol. 6 | iss. 1 | e16191 | p.22http://publichealth.jmir.org/2020/1/e16191/(page number not for citation purposes)
Stevens et alJMIR PUBLIC HEALTH AND SURVEILLANCE
XSL•FORenderX

illegal and medical marijuana use is highly regulated. However,on social media, youth discuss and disclose their drug usebehavior, although these behaviors are illegal in the state. Thus,the perceived norm of substance use acceptability may outweighthe perceived consequences of such use.
Although our analysis uncovered posts about the negativeconsequences or effects of substance use, as demonstrated inprevious research [16,45-48], these posts represented less than3.6% (9/249) of our sample. In the absence of such antidrugmessages, social media platforms may convey a meta-messageto youth that the usage of drugs, specifically marijuana, is notassociated with adverse consequences. It is notable thatprescription drugs were not discussed with the same level ofpride as marijuana. However, prescription drug–related postsoften included reference to other substances, suggesting thatthe discussions of prescription drug use on social media are anindicator of polysubstance use. Strategies that address theunderlying causes of drug use (eg, coping with stressors) andengage the positive drug messaging on social media are neededto help reduce the elevated prevalence of early polysubstanceuse behavior among adolescents [22].
LimitationsThere are several limitations to this study. The subset of tweetswe examined may not represent the entire population of youths’tweets containing drug-related content; thus, our results maynot generalize beyond the study sample. It is possible thatadditional drug-related keywords were missed in the culling of
the data and are thus missing from analyses. Social desirabilitymay bias results, leading youth to post specific prodrug contentsuch that they appear to endorse substance use beliefs andbehaviors online that they may not actually hold. Moreover, thecross-sectional study design limits our ability to link the tweetsto actual offline substance use behavior. Future longitudinalstudies are needed to examine youths’ social media postsovertime, correlating these posts with substance use–relatedbehaviors and identifying predictors of future drug use basedon social media use behavior.
ConclusionsWith its great popularity among youth, social media is a fruitfulplatform for examining youth cognitions and behavior relatedto specific drug use. Through a mixed methods approach, weestablished the frequency with which drugs are discussed bymembers of this population on Twitter, generated a list of wordsand hashtags to contribute to analytical lexicons for othersinterested in similar research, and identified themes indicativeof the ways in which youth discuss their support for (oropposition to) substance use on social media. Together, thesefindings contribute to the literature by indicating a critical needto leverage social media to challenge myths and unhealthy onlinesubstance use norms. Further inquiry is needed to betterunderstand how exposure to drug-related content on social mediainfluences youths’ behavior and to identify ways to leveragepositive aspects of social media (eg, group connectedness andsharing of health-related information) to decrease substance useand improve health outcomes.
AcknowledgmentsThis research was generously supported by the Office of Nursing Research, University of Pennsylvania. The authors are thankfulto the Center for Undergraduate Research and Fellowship, University of Pennsylvania, and the Summer Undergraduate MinorityResearch Program, Leonard Davis Institute of Health Economics, for supporting undergraduate students’ contributions to thisresearch.
Conflicts of InterestNone declared.
References1. Johnston LD, Miech RA, O'Malley PM, Bachman JG, Schulenberg JE, Patrick ME. Deep Blue - University of Michigan.
2018. Monitoring the Future National Survey Results on Drug Use, 1975-2017: Overview, Key Findings on AdolescentDrug Use URL: https://deepblue.lib.umich.edu/bitstream/handle/2027.42/148123/Overview%202018%20FINAL%20print%201-30.pdf?sequence=1&isAllowed=y [accessed 2020-01-16]
2. Bose J, Hedden SL, Lipari RN, Park-Lee E. Substance Abuse Mental Health Services Administration. 2018 Sep. KeySubstance Use and Mental Health Indicators in the United States: Results from the 2017 National Survey on Drug Use andHealth URL: https://www.samhsa.gov/data/sites/default/files/cbhsq-reports/NSDUHFFR2017/NSDUHFFR2017.htm[accessed 2018-10-19]
3. Office of the Surgeon General, US Department of Health and Human Services. The Surgeon General's Call to Action toPrevent and Reduce Underage Drinking. Rockville, MD: US Department of Health and Human Services; 2007.
4. Volkow ND, Baler RD, Compton WM, Weiss SR. Adverse health effects of marijuana use. N Engl J Med 2014 Jun5;370(23):2219-2227 [FREE Full text] [doi: 10.1056/NEJMra1402309] [Medline: 24897085]
5. Henry KL, Knight KE, Thornberry TP. School disengagement as a predictor of dropout, delinquency, and problem substanceuse during adolescence and early adulthood. J Youth Adolesc 2012 Feb;41(2):156-166 [FREE Full text] [doi:10.1007/s10964-011-9665-3] [Medline: 21523389]
6. Anderson M, Jiang J. Pew Research Center. 2018 May 31. Teens, Social Media & Technology 2018 URL: https://www.pewinternet.org/2018/05/31/teens-social-media-technology-2018/ [accessed 2020-01-16]
JMIR Public Health Surveill 2020 | vol. 6 | iss. 1 | e16191 | p.23http://publichealth.jmir.org/2020/1/e16191/(page number not for citation purposes)
Stevens et alJMIR PUBLIC HEALTH AND SURVEILLANCE
XSL•FORenderX

7. Smith A, Anderson M. Pew Research Center. 2018 Mar 1. Social Media Use in 2018 URL: https://www.pewinternet.org/2018/03/01/social-media-use-in-2018/ [accessed 2020-01-16]
8. Yonker LM, Zan S, Scirica CV, Jethwani K, Kinane TB. 'Friending' teens: systematic review of social media in adolescentand young adult health care. J Med Internet Res 2015 Jan 5;17(1):e4 [FREE Full text] [doi: 10.2196/jmir.3692] [Medline:25560751]
9. Mackey TK, Liang BA, Strathdee SA. Digital social media, youth, and nonmedical use of prescription drugs: the need forreform. J Med Internet Res 2013 Jul 26;15(7):e143 [FREE Full text] [doi: 10.2196/jmir.2464] [Medline: 23892156]
10. Boyd D. It's Complicated: The Social Lives of Networked Teens. New Haven, Connecticut: Yale University Press; 2014.11. Livingstone S. Taking risky opportunities in youthful content creation: teenagers' use of social networking sites for intimacy,
privacy and self-expression. New Media Soc 2008;10(3):393-411 [FREE Full text] [doi: 10.1177/1461444808089415]12. Moreno MA, Parks M, Richardson LP. What are adolescents showing the world about their health risk behaviors on
MySpace? MedGenMed 2007 Oct 11;9(4):9. [Medline: 18311359]13. Moreno MA, Briner LR, Williams A, Brockman L, Walker L, Christakis DA. A content analysis of displayed alcohol
references on a social networking web site. J Adolesc Health 2010 Aug;47(2):168-175 [FREE Full text] [doi:10.1016/j.jadohealth.2010.01.001] [Medline: 20638009]
14. Moreno MA, Vanderstoep A, Parks MR, Zimmerman FJ, Kurth A, Christakis DA. Reducing at-risk adolescents' displayof risk behavior on a social networking web site: a randomized controlled pilot intervention trial. Arch Pediatr AdolescMed 2009 Jan;163(1):35-41. [doi: 10.1001/archpediatrics.2008.502] [Medline: 19124701]
15. Moreno MA, Parks MR, Zimmerman FJ, Brito TE, Christakis DA. Display of health risk behaviors on MySpace byadolescents: prevalence and associations. Arch Pediatr Adolesc Med 2009 Jan;163(1):27-34. [doi:10.1001/archpediatrics.2008.528] [Medline: 19124700]
16. Moreno MA, Christakis DA, Egan KG, Brockman LN, Becker T. Associations between displayed alcohol references onFacebook and problem drinking among college students. Arch Pediatr Adolesc Med 2012 Feb;166(2):157-163 [FREE Fulltext] [doi: 10.1001/archpediatrics.2011.180] [Medline: 21969360]
17. Curtis BL, Lookatch SJ, Ramo DE, McKay JR, Feinn RS, Kranzler HR. Meta-analysis of The Association of Alcohol-RelatedSocial Media Use with alcohol consumption and alcohol-related problems in adolescents and young adults. Alcohol ClinExp Res 2018 Jun;42(6):978-986 [FREE Full text] [doi: 10.1111/acer.13642] [Medline: 29786874]
18. Cavazos-Rehg PA, Krauss M, Fisher SL, Salyer P, Grucza RA, Bierut LJ. Twitter chatter about marijuana. J Adolesc Health2015 Feb;56(2):139-145 [FREE Full text] [doi: 10.1016/j.jadohealth.2014.10.270] [Medline: 25620299]
19. Bandura A. Social Foundations of Thought and Action: A Social Cognitive Theory. Englewood Cliffs: NJ: Prentice Hall;1986.
20. Fishbein M, Ajzen I. Predicting and Changing Behavior: The Reasoned Action Approach. New York: Psychology Press;2011.
21. Cabrera-Nguyen EP, Cavazos-Rehg P, Krauss M, Bierut LJ, Moreno MA. Young adults' exposure to alcohol- andmarijuana-related content on Twitter. J Stud Alcohol Drugs 2016 Mar;77(2):349-353 [FREE Full text] [doi:10.15288/jsad.2016.77.349] [Medline: 26997194]
22. Stoddard SA, Bauermeister JA, Gordon-Messer D, Johns M, Zimmerman MA. Permissive norms and young adults' alcoholand marijuana use: the role of online communities. J Stud Alcohol Drugs 2012 Nov;73(6):968-975 [FREE Full text] [doi:10.15288/jsad.2012.73.968] [Medline: 23036215]
23. Gardner M, Steinberg L. Peer influence on risk taking, risk preference, and risky decision making in adolescence andadulthood: an experimental study. Dev Psychol 2005 Jul;41(4):625-635. [doi: 10.1037/0012-1649.41.4.625] [Medline:16060809]
24. van Hoorn J, Crone EA, van Leijenhorst L. Hanging out with the right crowd: peer influence on risk-taking behavior inadolescence. J Res Adolesc 2017 Mar;27(1):189-200. [doi: 10.1111/jora.12265] [Medline: 28498538]
25. Jones K, Eathington P, Baldwin K, Sipsma H. The impact of health education transmitted via social media or text messagingon adolescent and young adult risky sexual behavior: a systematic review of the literature. Sex Transm Dis 2014Jul;41(7):413-419. [doi: 10.1097/OLQ.0000000000000146] [Medline: 24922099]
26. Litt DM, Lewis MA, Spiro ES, Aulck L, Waldron KA, Head-Corliss MK, et al. #drunktwitter: examining the relationsbetween alcohol-related Twitter content and alcohol willingness and use among underage young adults. Drug AlcoholDepend 2018 Dec 1;193:75-82 [FREE Full text] [doi: 10.1016/j.drugalcdep.2018.08.021] [Medline: 30343237]
27. Creswell JW, Clark VL. Designing and Conducting Mixed Methods Research. Third Edition. Los Angeles, CA: SAGEPublications; 2017.
28. Snelson CL. Qualitative and mixed methods social media research: a review of the literature. Int J Qual Method2016;15(1):160940691562457 [FREE Full text] [doi: 10.1177/1609406915624574]
29. Fetters MD, Curry LA, Creswell JW. Achieving integration in mixed methods designs-principles and practices. HealthServ Res 2013 Dec;48(6 Pt 2):2134-2156 [FREE Full text] [doi: 10.1111/1475-6773.12117] [Medline: 24279835]
30. Schwartz HA, Eichstaedt JC, Kern ML, Dziurzynski L, Agrawal M, Park GJ, et al. Characterizing Geographic Variationin Well-Being Using Tweets. In: Proceedings of the Seventh International AAAI Conference on Weblogs and Social Media.
JMIR Public Health Surveill 2020 | vol. 6 | iss. 1 | e16191 | p.24http://publichealth.jmir.org/2020/1/e16191/(page number not for citation purposes)
Stevens et alJMIR PUBLIC HEALTH AND SURVEILLANCE
XSL•FORenderX

2013 Presented at: ICWSM'13; July 8–11, 2013; Cambridge, Massachusetts, USA URL: https://www.aaai.org/ocs/index.php/ICWSM/ICWSM13/paper/viewFile/6138Hansen/6398
31. Hurd NM, Zimmerman MA, Xue Y. Negative adult influences and the protective effects of role models: a study with urbanadolescents. J Youth Adolesc 2009 Jul;38(6):777-789 [FREE Full text] [doi: 10.1007/s10964-008-9296-5] [Medline:19636780]
32. Schwartz HA, Giorgi S, Sap M, Crutchley P, Ungar L, Eichstaedt J. DLATK: Differential Language Analysis ToolKit. In:Proceedings of the 2017 Conference on Empirical Methods in Natural Language Processing: System Demonstrations. 2017Presented at: EMNLP'17; September 7–11, 2017; Copenhagen, Denmark. [doi: 10.18653/v1/d17-2010]
33. Lui M, Baldwin T. langid.py: An Off-the-shelf Language Identification Tool. In: Proceedings of the ACL 2012 SystemDemonstrations. 2012 Presented at: ACL'12; July 8-14, 2012; Jeju Island, Korea p. 25-30.
34. Sap M, Park G, Eichstaedt JC, Kern ML, Stillwell DJ, Kosinski M, et al. Developing Age and Gender Predictive Lexicaover Social Media. In: Proceedings of the 2014 Conference on Empirical Methods in Natural Language Processing. 2014Presented at: EMNLP'14; October 25–29, 2014; Dohar, Qatar p. 1146-1151. [doi: 10.3115/v1/d14-1121]
35. Preoiuc-Pietro D, Ungar L. User-Level Race and Ethnicity Predictors from Twitter Text. In: Proceedings of the 27thInternational Conference on Computational Linguistics. 2018 Presented at: COLING'18; August 20-26, 2018; Santa Fe,New Mexico p. 1534-1545.
36. Krippendorff K. Content Analysis: An Introduction to Its Methodology. Thousand Oaks: Sage Publications; 2004.37. Corbin JM, Strauss A. Grounded theory research: procedures, canons, and evaluative criteria. Qual Sociol 1990;13(1):3-21.
[doi: 10.1007/BF00988593]38. Blandfort P, Patton D, Frey WR, Karaman S, Bhargava S, Lee FT, et al. Multimodal Social Media Analysis for Gang
Violence Prevention. In: Proceedings of the Thirteenth International AAAI Conference on Web and Social Media. 2019Presented at: ICWSM'2019; June 11-14, 2019; Munich, Germany p. 114-124.
39. Prosek EA, Giordano AL, Woehler ES, Price E, McCullough R. Differences in emotion dysregulation and symptoms ofdepression and anxiety among illicit substance users and nonusers. Subst Use Misuse 2018 Sep 19;53(11):1915-1918. [doi:10.1080/10826084.2018.1436563] [Medline: 29465278]
40. Hanson MJ. The theory of planned behavior applied to cigarette smoking in African-American, Puerto Rican, andnon-Hispanic white teenage females. Nurs Res 1997;46(3):155-162. [doi: 10.1097/00006199-199705000-00006] [Medline:9176505]
41. Bleakley A, Hennessy M, Fishbein M, Jordan A. It works both ways: the relationship between exposure to sexual contentin the media and adolescent sexual behavior. Media Psychol 2008 Oct 1;11(4):443-461 [FREE Full text] [doi:10.1080/15213260802491986] [Medline: 20376301]
42. Huang GC, Unger JB, Soto D, Fujimoto K, Pentz MA, Jordan-Marsh M, et al. Peer influences: the impact of online andoffline friendship networks on adolescent smoking and alcohol use. J Adolesc Health 2014 May;54(5):508-514 [FREE Fulltext] [doi: 10.1016/j.jadohealth.2013.07.001] [Medline: 24012065]
43. Yanovitzky I, Stryker J. Mass media, social norms, and health promotion efforts: a longitudinal study of media effects onyouth binge drinking. Commun Res 2001;28(2):208-239 [FREE Full text] [doi: 10.1177/009365001028002004]
44. Miller J, Prichard I, Hutchinson A, Wilson C. The relationship between exposure to alcohol-related content on Facebookand predictors of alcohol consumption among female emerging adults. Cyberpsychol Behav Soc Netw 2014Dec;17(12):735-741. [doi: 10.1089/cyber.2014.0337] [Medline: 25489875]
45. Moreno MA, Whitehill JM. Influence of social media on alcohol use in adolescents and young adults. Alcohol Res2014;36(1):91-100 [FREE Full text] [Medline: 26259003]
46. Morgan E, Snelson C, Elison-Bowers P. Image and video disclosure of substance use on social media websites. ComputHuman Behav 2010;26(6):1405-1411 [FREE Full text] [doi: 10.1016/j.chb.2010.04.017]
47. Egan KG, Moreno MA. Alcohol references on undergraduate males' Facebook profiles. Am J Mens Health 2011Sep;5(5):413-420 [FREE Full text] [doi: 10.1177/1557988310394341] [Medline: 21406490]
48. Glassman T. Implications for college students posting pictures of themselves drinking alcohol on Facebook. J AlcoholDrug Educ 2012;56(1):38-58 [FREE Full text]
AbbreviationsNLP: natural language processing
JMIR Public Health Surveill 2020 | vol. 6 | iss. 1 | e16191 | p.25http://publichealth.jmir.org/2020/1/e16191/(page number not for citation purposes)
Stevens et alJMIR PUBLIC HEALTH AND SURVEILLANCE
XSL•FORenderX

Edited by T Sanchez; submitted 10.09.19; peer-reviewed by K Reuter, K Jones, M DeJonckheere; comments to author 29.10.19;revised version received 18.12.19; accepted 20.12.19; published 26.03.20.
Please cite as:Stevens RC, Brawner BM, Kranzler E, Giorgi S, Lazarus E, Abera M, Huang S, Ungar LExploring Substance Use Tweets of Youth in the United States: Mixed Methods StudyJMIR Public Health Surveill 2020;6(1):e16191URL: http://publichealth.jmir.org/2020/1/e16191/ doi:10.2196/16191PMID:32213472
©Robin C Stevens, Bridgette M Brawner, Elissa Kranzler, Salvatore Giorgi, Elizabeth Lazarus, Maramawit Abera, Sarah Huang,Lyle Ungar. Originally published in JMIR Public Health and Surveillance (http://publichealth.jmir.org), 26.03.2020. This is anopen-access article distributed under the terms of the Creative Commons Attribution License(https://creativecommons.org/licenses/by/4.0/), which permits unrestricted use, distribution, and reproduction in any medium,provided the original work, first published in JMIR Public Health and Surveillance, is properly cited. The complete bibliographicinformation, a link to the original publication on http://publichealth.jmir.org, as well as this copyright and license informationmust be included.
JMIR Public Health Surveill 2020 | vol. 6 | iss. 1 | e16191 | p.26http://publichealth.jmir.org/2020/1/e16191/(page number not for citation purposes)
Stevens et alJMIR PUBLIC HEALTH AND SURVEILLANCE
XSL•FORenderX

Original Paper
Correlates of Successful Enrollment of Same-Sex Male CouplesInto a Web-Based HIV Prevention Research Study:Cross-Sectional Study
Rob Stephenson1,2, PhD; Tanaka MD Chavanduka1, MPH; Stephen Sullivan1, MPH; Jason W Mitchell3, MPH, PhD1The Center for Sexuality and Health Disparities, School of Nursing, University of Michigan, Ann Arbor, MI, United States2Department of Systems, Population and Leadership, School of Nursing, University of Michigan, Ann Arbor, MI, United States3Office of Public Health Studies, Myron B Thompson School of Social Work, University of Hawai’i at Manoa, Honolulu, HI, United States
Corresponding Author:Rob Stephenson, PhDThe Center for Sexuality and Health DisparitiesSchool of NursingUniversity of Michigan400 North IngallsAnn Arbor, MI, 48109United StatesPhone: 1 7346150149Email: [email protected]
Abstract
Background: The recognition of the role of primary partners in HIV transmission has led to a growth in dyadic-focused HIVprevention efforts. The increasing focus on male couples in HIV research has been paralleled by an increase in the developmentof interventions aimed at reducing HIV risk behaviors among male couples. The ability to accurately assess the efficacy of theseinterventions rests on the ability to successfully enroll couples into HIV prevention research.
Objective: This study aimed to explore factors associated with successful dyadic engagement in Web-based HIV preventionresearch using recruitment and enrollment data from a large sample of same-sex male couples recruited online from the UnitedStates.
Methods: Data came from a large convenience sample of same-sex male couples in the United States, who were recruitedthrough social media venues for a Web-based, mixed method HIV prevention research study. The analysis examined thedemographic factors associated with successful dyadic engagement in research, measured as both members of the dyad meetingeligibility criteria, consenting for the study, and completing all study processes.
Results: Advertisements generated 221,258 impressions, resulting in 4589 clicks. Of the 4589 clicks, 3826 individuals wereassessed for eligibility, of which 1076 individuals (538/1913, 28.12% couples) met eligibility criteria and were included in thestudy. Of the remaining 2740 ineligible participants, 1293/3826 (33.80%) were unlinked because their partner did not screen foreligibility, 48/2740 (1.75%) had incomplete partner data because at least one partner did not finish the survey, 22/2740 (0.80%)were ineligible because of 1 partner not meeting the eligibility criteria. Furthermore, 492/3826 (12.86%) individuals werefraudulent. The likelihood of being in a matched couple varied significantly by race and ethnicity, region, and relationship type.Men from the Midwest were less likely to have a partner who did not complete the survey. Men with college education and thosewho labeled their relationships as husband or other (vs boyfriend) were more likely to have a partner who did not complete thesurvey.
Conclusions: The processes used allowed couples to independently progress through the stages necessary to enroll in the researchstudy, while limiting opportunities for coercion, and resulted in a large sample with relative diversity in demographic characteristics.The results underscore the need for additional considerations when recruiting and enrolling, relative to improving the methodsassociated with these research processes.
(JMIR Public Health Surveill 2020;6(1):e15078) doi:10.2196/15078
JMIR Public Health Surveill 2020 | vol. 6 | iss. 1 | e15078 | p.27https://publichealth.jmir.org/2020/1/e15078(page number not for citation purposes)
Stephenson et alJMIR PUBLIC HEALTH AND SURVEILLANCE
XSL•FORenderX

KEYWORDS
online research; dyadic; couples; recruitment
Introduction
BackgroundThere is now substantial evidence for the role of male dyads inthe US HIV epidemic, with primary partners identified as thesource of approximately one-third [1] to two-thirds [2] of newHIV infections. Given these estimates, a significant paradigmshift in HIV prevention is needed. Programmatic efforts havetraditionally focused on men who have sex with men (MSM),in particular, gay-identifying men as individuals rather thandyads, with a focus on casual sex as a risk for HIV acquisition.As a result of this individualistic approach, HIV preventionefforts have largely ignored the risk of HIV transmission thatoccurs within primary partnerships. Within the context ofsame-sex male couples’ relationships, various research findingshave illustrated high rates of sexual risk behavior for HIV (withprimary and casual partners), low rates of disclosure ofpotentially risky episodes with casual partners to primarypartners, and reduced frequency of HIV testing [3-9].Historically, HIV prevention efforts have focused on reducingthe number of casual sex partners [10], indirectly messaging afalse sense of protection associated with primary partners[11,12].
There have been recent attempts to address this disproportionatefocus on individualistic approaches to HIV prevention byfocusing on the dyads and their relationship. Couples HIVtesting and counseling (CHTC), originally developed forheterosexual couples in sub-Saharan Africa [13], has beenadapted for same-sex male couples [14], as a Centers for DiseaseControl and Prevention Public Health Strategy [15]. There areseveral examples of dyadic interventions that aim to addressHIV risk among same-sex male couples. Connect with Pridewas an intervention for methamphetamine-using, black/AfricanAmerican male dyads that involved 7 in-person sessions toaddress issues, such as communication, joint problem solving,and condom negotiation [16]. 2GETHER was an interventionfor young male couples aged 18 to 29 years, which involved 4interactive weekly sessions focusing on enhancingcommunication skills, coping with relationship stress, applyingproblem-solving techniques to relationship issues, andformulating an agreement to reduce their risk for HIV [17].Posttest decreases in sexual risk behaviors, increases in skillsrelated to HIV prevention, and improvements in relationshipinvestment were observed. We Prevent is a novel interventionfor 15- to 19-year-old male dyads, which is currently beingpiloted in the United States [18], involving telehealth-deliveredsessions to increase relationship communication skills aroundHIV prevention. The Male Couples Agreement Project is anelectronic health tool kit intervention for male couples with afoundation in relationship science, including sexual agreements,sexual health education, and HIV prevention [19,20], andStronger Together focuses on improving engagement in HIVcare and antiretroviral treatment adherence amongserodiscordant male couples by combining in-person CHTCwith dyadic adherence counseling [21]. Although these
interventions have the potential to improve relational dynamicsand safeguard male couples against HIV and other sexuallytransmitted infections, the ability to successfully test the efficacyof these interventions rests on the ability to successfully enrollmale couples into HIV prevention research. Representation ofdiverse samples of same-sex male couples—in terms of age,race, ethnicity, and relationship length—in dyadic HIVprevention interventions is critical for measuring the successof these projects and moving forward toward improving them.
Few studies have addressed the challenges encountered inrecruiting same-sex male couples into research. To enroll acouple into research requires both members of the couple tosuccessfully navigate parallel processes: both must screen foreligibility, provide consent, and complete some other datacollection activity (eg, study survey) to enroll into a researchproject. These processes must be conducted separately to addressand prevent coercion among partners to participate in researchprojects, especially when there are financial incentives forparticipation. Successful participation often requires the coupleto share information (ie, partner A must inform partner B thatthey have completed their consent form) or to coordinate (ie,they must jointly schedule a study visit). At a minimum, bothmembers of the couple must agree to participate in the researchstudy, knowing that their partner will also be participating.These processes may result in studies obtaining a potentiallyselective group of couples with more functional communicationstyles or couples with reduced levels of conflict. In their studyof 260 partnered gay/bisexual men recruited in New York City,Starks et al [22] found those who did not refer their partnerswere older, wealthier, and in longer relationships, whereasparticipants who successfully recruited their partners weresignificantly more satisfied in their relationship. This selectivityis important to consider in light of evidence illustratingassociations between poor relationship characteristics and HIVprevention outcomes [3,5,23-27].
ObjectiveMissing from the literature is an understanding of the factorsassociated with successful enrollment of same-sex male couplesin Web-based HIV prevention research studies. Although limitedresearch has identified relationship factors associated withreferring partners into Web-based HIV research, other factorsassociated with successful dyadic engagement in other parts ofthe research process (ie, eligibility and consent) have yet to beinvestigated. In general, Web-based studies may be associatedwith higher degrees of selectivity bias, with recent evidencesuggesting that white MSM are more likely to join a Web-basedstudy than black and Hispanic MSM [28]. The identification ofsuch selectivity biases is equally important for Web-basedresearch with couples. If Web-based HIV prevention researchis to be successful in identifying unique risk factors orprevention opportunities for same-sex male couples, thenresearch must be able to successfully enroll diverse samples ofcouples. This study used recruitment and enrollment data froma large sample of same-sex male couples, recruited online fromthe United States, to explore factors associated with successful
JMIR Public Health Surveill 2020 | vol. 6 | iss. 1 | e15078 | p.28https://publichealth.jmir.org/2020/1/e15078(page number not for citation purposes)
Stephenson et alJMIR PUBLIC HEALTH AND SURVEILLANCE
XSL•FORenderX

dyadic enrollment in Web-based HIV prevention research. Thisnew information has the potential to shape recruitment andresearch designs for enrollment of dyadic HIV research.
Methods
Recruitment and Inclusion CriteriaProject Couples Health and Attitudes toward PreexposureProphylaxis (CHAPS) is a mixed method Web-based studyexamining attitudes toward pre-exposure prophylaxis (PrEP)use and patterns of PrEP use among concordant seronegativeand serodiscordant same-sex male couples in the United States.Participants were recruited through targeted Web-basedadvertisements and postings on commonly used social mediawebsites and dating websites and mobile apps. Social mediawebsites used for recruitment were Facebook and Instagram.Dating websites and mobile apps used for recruitment wereScruff and Grindr. Advertisements included images of a diverse(in age, race, and ethnicity) range of same-sex male couples,with text that promoted a study on the health of same-sex malecouples (ie, Are you and your man on the same page about HIVprevention? We want to know, take our survey!). Theadvertisements did not mention PrEP to avoid recruiting asample biased toward those with particular interests in orattitudes about PrEP. The advertisements included a link thatled interested individuals to a landing page with detailedinformation about the study and a Web-based eligibilityscreener.
First, individual-level eligibility was established for bothpartners of the couple, and this had to have been met by bothfor enrollment. Individual eligibility self-reporting as (1) acisgender male (assigned male at birth and currently identifiesas male), (2) being in a relationship with another cisgender malefor 3 or more months, (3) having an HIV seronegative orunknown status or known HIV seropositive status, and (4)having had condomless anal sex with their primary relationshippartner within the last 3 months. Once eligible, an individualwould then proceed to the consent webpage outlining the contentand process of the study. Once consent was provided, theindividual (partner A) would then be directed to the partnerreferral system, which entailed providing contact information(email and telephone number) and a name or nickname for hispartner (partner B). Partner B would then receive an emailinforming him that his partner (partner A) had signed up for thestudy and had provided his contact information, along with alink to a landing page to access the same screener and consentprocess.
The link provided to partner B was connected to partner A’smetadata, such that they both were assigned the same randomstudy ID number as a hidden data field (as a couple). Oncepartner B had completed the same eligibility screener andconsent process, partner B was then asked to provide contactinformation for his partner (partner A), to enable crossmatchingof partner contact details.
Couple serostatus was also considered. Given the focus on PrEP,only concordant seronegative and serodiscordant couples wereeligible. Once both A and B had completed the screener, their
responses to the question on serostatus were compared. Coupleswho reported concordant seropositive status were deemedineligible for the study.
Following successful completion of the eligibility and consentprocess by both partners A and B, as well as identification ofconcordant seronegative or serodiscordant HIV status, individualemails were sent to each partner of the couple, asking them toindependently and individually complete a Web-based surveyvia a link. The survey Web link contained the same randomstudy ID number they were assigned during eligibility screenerto help link partners A and B’s completed survey responses.Each partner was compensated US $50 for his time to completethe survey; compensation was not dependent on both partnerscompleting the survey. The study protocol was approved by theUniversity of Michigan Institutional Review Board(HUM00125711).
Matching and Verification of ParticipantsUpon completion of their individual surveys, couples’ responseswere compared with verify that they were real couples. First,individual surveys were linked as couples via the identifierincluded in the survey link. Couple status was verified usingthe relationship and contact information provided by eachindividual. A verified couple had to match on at least 4 of thefollowing 6 criteria (identified through questions asked in theeligibility screener): (1) partner’s age (± 1 year), (2) partner’sbirthday month, (3) relationship length, (4) anal sex without acondom within the last 3 months, (5) initials of partner’s firstand last name, and (6) last 4 digits of partner’s cell phonenumber. Matching of couple data was manually reviewed andchecked for matching: each couple was assigned a score from1 to 6, which represented the number of criteria on which theymatched in their surveys.
Detecting Fraudulent ActivityAll participant data were also manually reviewed and checkedfor mismatch, duplication, and fraud. Inconsistent information,such as name, internet protocol address, zip code, email, orphone number, was flagged for further inquiry. Participantswere contacted directly by study staff for confirmation of theiridentity and relationship status. Individuals were classified asfraudulent if their identity could not be verified.
Match Status CategoriesOn the basis of the results of verification and matching,participants were categorized into 4 groups: eligible couple,incomplete, ineligible, and unlinked. Eligible couples comprisedcouples in which both relationship partners were eligible,consented, passed verification, and completed the study survey.Incompletes included couples in which 1 or both partners didnot finish the study survey. Ineligibles were couples in which1 partner met individual-level eligibility criteria and consented,whereas the other partner either did not meet this eligibilitycriteria or did not consent. Unlinked was defined as cases inwhich only 1 partner completed the enrollment process (eligible,consented, and completed the study survey), whereas the otherdid not enter the screening and enrollment process.
JMIR Public Health Surveill 2020 | vol. 6 | iss. 1 | e15078 | p.29https://publichealth.jmir.org/2020/1/e15078(page number not for citation purposes)
Stephenson et alJMIR PUBLIC HEALTH AND SURVEILLANCE
XSL•FORenderX

Study SurveyThe survey was distributed via Qualtrics (Qualtrics InternationalInc) through an anonymous link embedded with a uniqueidentifier that linked couples, and it took partners, on average,35 min to complete. The survey contained a variety of measuresgeared toward understanding the dyadic patterns relative toPrEP. The aim of this study was to examine the factorsassociated with achieving a successfully matched and verifiedcouple recruited online. The analysis models a 4-categoryoutcome variable, representing the 4 possibilities encounteredfrom enrollment: eligible couples (the reference category),ineligible, incomplete, and unlinked. Data analysis comprisedindividual-level data in which every line of data is an individual,to facilitate the inclusion of participants for whom no partnerdata were received (eg, unlinked). A multinomial model is fitfor the 4-category matching status outcome. Key covariatesincluded the sociodemographic characteristics of individuals:education, employment, housing status, race and ethnicity, age,relationship length, and relationship type. Relationship typewas categorized to compare more informal relationship types(boyfriend or other) with more formal relationship types(husband or partner). The analysis was conducted in STATAv.15 [29].
Results
CHAPS advertisements generated 221,258 impressions (numberof times it was shown on a social medial page), resulting in4589 clicks (number of times the advertisement was clicked on:these may not be unique to individuals). Of the 4589 clicks,3826 individuals were assessed for eligibility, of which 1076individuals (538/1913, 28.12% couples) were matched eligibleand included in the study. Of the remaining 2740 participants,1293/3826 (33.80%) were unlinked because of their partner notenrolling into the screening, 48/2740 (1.75%) had incompletepartner data because at least 1 partner did not finish the survey,22/2740 (0.80%) were ineligible because of 1 partner notmeeting the eligibility criteria. Furthermore, 492/3826 (12.86%)individuals were fraudulent, and 885/3826 (23.13%) started the
screening but did provide any responses; therefore, they weredeemed invalid. Fraudulent and invalid participants wereremoved from the sample, resulting in a sample of 2449individuals, which includes 538 eligible and verified couples.Those who had missing data (n=911) from key covariates,including region, education, housing, and relationship length,were dropped from dataset, resulting in a final analysis sampleof 1538 individuals.
Characteristics of the analysis sample (N=1538) are describedin Table 1.
The sample was largely white (1140/1538, 74.12%) and betweenthe ages of 25 and 34 years (875/1538, 56.89%). A majority ofparticipants were from the South (495/1538, 32.18%) and theMidwest (457/1538, 29.71%) regions. A majority of individualswere college graduates (521/1538, 33.86%) or had graduatedegrees (392/1538, 25.48%), worked full time (1215/1538,79.00%), and lived in their own housing (1237/1538, 80.42%).Finally, 35.89% (552/1538) of the sample identified asboyfriends and 34.39% (529/1538) identified as husbands, withthe largest portion of relationship lengths being between 1 and3 years (494/1538, 32.12%) and more than 5 years (524/1538,34.07%).
White-Hispanic participants were significantly more likely tohave a partner who was ineligible for the study (relative riskratio [RRR]=4.94; 95% CI 1.15-21.26) or to be in the incompletepartner status (RRR=2.55; 95% CI 1.02-6.42) compared withbeing in the eligible couple category. Those who reported beingfrom the Midwest (RRR=0.25; 95% CI 0.08-0.72) were lesslikely to be in the incomplete category than have an eligiblepartner. Men with a college education or above (RRR=2.82;95% CI 1.02-7.80) and having a husband/partner for arelationship type (RRR=2.35; 95% CI 1.06-5.25) were morelikely to be in the incomplete category than have an eligiblepartner. There were no significant associations with theremaining covariates across the match status outcomes.
Results of the multinomial model are shown in Table 2.
JMIR Public Health Surveill 2020 | vol. 6 | iss. 1 | e15078 | p.30https://publichealth.jmir.org/2020/1/e15078(page number not for citation purposes)
Stephenson et alJMIR PUBLIC HEALTH AND SURVEILLANCE
XSL•FORenderX

Table 1. Descriptive statistics for participants and demographic variables (N=1538).
Unlinked participantd
(N=415), n (%)Incomplete partnerc
(n=35), n (%)Ineligible partnersb
(n=12), n (%)Eligible individualsa
(n=1076), n (%)
Characteristics
Race/ethnicity
303 (73.0)25 (71)7 (58)804 (74.72)Non-Hispanic white
73 (17.6)3 (9)2 (17)197 (18.31)Othere
39 (9.4)7 (20)3 (25)75 (6.97)White Hispanic
Age (years)
83 (20.0)7 (20)5 (42)160 (14.87)18-24
222 (53.5)19 (54)4 (33)630 (58.55)25-34
91 (21.9)7 (20)2 (17)215 (19.98)35-44
19 (4.6)2 (6)1 (8)71 (6.60)45+
Region
70 (16.9)12 (34)1 (8)186 (17.29)Northeast
148 (35.7)10 (29)4 (33)333 (30.95)South
88 (21.2)8 (23)2 (17)220 (20.45)West
109 (26.3)5 (14)5 (42)337 (31.32)Midwest
Education
152 (36.6)5 (14)6 (50)321 (29.83)Up to high school/some college
263 (63.4)30 (86)6 (50)755 (70.17)College/some graduate school
Employment
326 (78.6)24 (69)8 (67)857 (79.65)Work full time
89 (21.5)11 (31)4 (33)219 (20.35)Work part time/retired
Housing
322 (77.6)30 (86)8 (67)877 (81.51)My own house or apartment
93 (22.4)5 (14)4 (33)199 (18.49)Otherf
Relationship type
244 (58.8)15 (43)8 (67)645 (59.94)Boyfriend/otherg
171 (41.2)20 (57)4 (33)431 (40.06)Husband/partner
Relationship length
60 (14.5)4 (11)3 (25)132 (12.27)More than 3 months but less than1 year
134 (32.3)7 (20)5 (42)347 (32.25)More than 1 year but less than 3years
81 (19.5)12 (34)1 (8)228 (21.19)More than 3 years but less than5 years
140 (33.7)12 (34)3 (25)369 (34.29)More than 5 years
aEligible couples: couples in which both relationship partners were eligible, consented, passed verification, and completed the study survey.bIneligibles: couples in which 1 partner met individual-level eligibility criteria and consented, whereas the other partner either did not meet the eligibilitycriteria or did not consent.cIncompletes: included couples in which 1 or both partners did not finish the study survey.dUnlinked was defined as cases in which only 1 partner completed the enrollment process (eligible, consented, and completed the study survey), whereasthe other did not enter the screening and enrollment process.eIncludes 72 black and African American, 72 mixed, 64 Hispanic and Latino, 47 Asian, 7 Native American and Alaskan Native, 5 Middle Eastern, 5Native Hawaiian and Other, Pacific Islander, 1 Caribbean, 1 Southern European, and 1 Indian.fIncludes college dorm, employee housing, and sharing with significant other.gIncludes friends with benefits, mates, best friend, bae, and better half.
JMIR Public Health Surveill 2020 | vol. 6 | iss. 1 | e15078 | p.31https://publichealth.jmir.org/2020/1/e15078(page number not for citation purposes)
Stephenson et alJMIR PUBLIC HEALTH AND SURVEILLANCE
XSL•FORenderX

Table 2. Multinomial logistic regression results for couple match status (N=1538).
Unlinked participant vs eligiblecouples, RRR (95% CI)
Incomplete partner vs eligible cou-ples, RRR (95% CI)
Ineligible partners vs eligible couples,
RRRa (95% CI)
Characteristics
Race
RefRefRefbNon-Hispanic white
0.93 (0.68-1.26)0.51 (0.14-1.73)1.08 (0.21-5.52)Other
1.27 (0.84-1.94)2.55 (1.02-6.42)c4.94 (1.15-21.26)cWhite Hispanic
Age (years)
RefRefRef18-24
0.74 (0.53-1.04)0.51 (0.19-1.40)0.34 (0.07-1.58)25-34
0.88 (0.59-1.33)0.58 (0.16-2.02)0.54 (0.08-3.91)35-44
0.55 (0.30-1.02)0.51 (0.09-2.94)0.85 (0.07-10.58)45+
Region
RefRefRefNortheast
1.16 (0.83-1.64)0.50 (0.21-1.21)2.25 (0.24-21.10)South
0.99 (0.68-1.44)0.55 (0.21-1.42)1.39 (0.12-16.29)West
0.83 (0.59-1.19)0.25 (0.08-0.72)c2.87 (0.32-25.58)Midwest
Education
RefRefRefUp to high school/some college
0.80 (0.62-1.03)2.82 (1.02-7.80)c0.71 (0.20-2.53)College/some graduate school
Employment
RefRefRefWork full time
0.97 (0.72-1.30)2.05 (0.94-4.45)1.30 (0.36-4.71)Work part time/retired
Housing
RefRefRefMy own house or apartment
1.17 (0.87-1.58)0.78 (0.28-2.16)1.37 (0.35-5.28)Other
Relationship type
RefRefRefBoyfriend/other
1.10 (0.85-1.44)2.35 (1.06-5.25)c1.07 (0.26-4.39)Husband/partner
Relationship length
RefRefRefMore than 3 months but lessthan 1 year
0.90 (0.62-1.32)0.64 (0.18-2.33)0.75 (0.16-3.58)More than 1 year but less than3 years
0.85 (0.56-1.30)1.28 (0.37-4.47)0.28 (0.02-3.18)More than 3 years but less than5 years
0.92 (0.60-1.41)0.70 (0.18-2.75)0.54 (0.06-4.56)More than 5 years
aRRR: relative risk ratio.bReference category.cP<.05.
Discussion
Principal FindingsThe results illustrate several important facets of the recruitmentof same-sex male couples into Web-based HIV prevention
research. First, advertising through social media to recruitcouples generated 3826 individuals who completed the eligibilityscreener. Of these, only 538 couples (1076 individuals) weresuccessfully engaged in research (eligible, consented, completeda survey, and were matched with their partner). Therefore, 72%of responses failed to generate successfully matched couples.
JMIR Public Health Surveill 2020 | vol. 6 | iss. 1 | e15078 | p.32https://publichealth.jmir.org/2020/1/e15078(page number not for citation purposes)
Stephenson et alJMIR PUBLIC HEALTH AND SURVEILLANCE
XSL•FORenderX

This has significant resource implications given that the majorityof social media recruitment involves paid advertising. ProjectCHAPS intentionally used images of same-sex male couples,which included representation of diverse ages, races, andethnicities. These advertisements were based on those usedpreviously to successfully enroll online samples of over 400same-sex male couples in the United States [30]. However,further work is warranted to explore same-sex male couples’perceptions and desired content for online recruitmentadvertising, to help facilitate the creation of advertisements withoptimal appeal to help with enrollment into Web-based researchstudies.
Of importance, almost 34.00% (523/1538) of participants hadpartners who did not initiate the screening and enrollmentprocess, whereas failure of having a partner not complete thesurvey only accounted for 2% (35/1538) of unmatched couplesand a partner being ineligible accounted for less than 1%(12/1538) of the unmatched couples. Therefore, once bothpartners made it through the eligibility screener, there was avery high likelihood that they would become a successfullymatched couple who would both complete the study survey.This suggests a need to strengthen partner referral methods earlyon in the study engagement process. Providing individuals withdetailed information on the study that they can share with theirpartner, which clearly outlines the steps that their partner needsto take, is a fundamental step in increasing dyadic recruitment.Of course, this process must be careful not to cross over intocoercion: systems need to be maintained, which allow bothpartners to independently screen and consent for studies.
The ability to identify and match couples was enhanced by theuse of a series of fraud detection techniques, based on thestandards recommended by Bauermeister et al [31]. Anadditional fraud technique was implemented, which is specificto the enrollment of dyads. Once surveys were completed,responses to 6 key questions regarding relationship and partnercharacteristics were compared: those who matched on fewerthan 4 responses were deemed not to be a real couple. This formof couple verification has been recommended as a mechanismfor reducing the degree of fraud in dyadic Web-based research[32]. However, further work is required to inform the contentof couple verification surveys. Questions must represent a rangeof partner and relationship characteristics that partners may beexpected to know, but these must also be sensitive enough toidentify fraudulent couples.
Few factors were significantly associated with the successfulengagement of male dyads, contrary to the work of Starks et al[22], which showed significant differences in partner referralinto a research study be age, wealth, and relationship length.The likelihood of being an eligible couple versus having anineligible partner, incomplete partner, or an unlinked partnerdid not vary by relationship length, suggesting our recruitmentand enrollment methods were successful at engaging couplesat range of relationship stages. Men who reported themselvesas being in a more formal union (ie, husbands) were more likelyto have a partner who did not complete the screening andenrollment process. This seems counter intuitive as it may beexpected that those in more formal unions may have developedstronger, or at least more familiar, communication styles that
may lend themselves to successful enrollment in HIV research.However, it is possible that engagement in research aboutrelationships and/or HIV prevention may not be one of thoseshared interests and values among partners. Although furtherresearch is required to understand this result, ideally qualitativework that examines perceptions of enrolling in HIV preventionresearch from a range of couple types, it is possible that moreformal and established couples do not see themselves as at riskfor HIV and therefore do not see the research as being suitablefor them. Previous research has identified that coupled MSMperceive lower levels of HIV risk [5], and this may shape howcouples view their eligibility or desire to enroll in an HIVprevention study.
White-Hispanic men were more likely to have an ineligiblepartner or a partner who did not complete the screening process.This result may reflect the myriad of interpersonal and structuralbarriers that men of color experience in enrolling in research.The sample for this study is overwhelmingly non-Hispanicwhite, limiting the ability to understand whether the ability toenroll in a survey for male couples varies for racial and ethnicminority couples. It seems plausible that couples with AfricanAmerican men may also be more likely to face difficulties inenrolling as couples in HIV prevention research, but the verysmall number of African American men in this study precludessuch analysis. The advertisements used for CHAPS included adiverse range of races and ethnicities; however, this still resultedin a predominantly non-Hispanic white sample. Furtherqualitative work—with diverse racial and ethnic samples ofsame-sex male couples—would be needed to fully understandthe perceptions of Web-based dyadic HIV prevention research,as well as their needs and desires that would lead them toparticipate in future studies.
It is important to note that Project CHAPS was a cross-sectionalsurvey and did not require the participants to take part in anintervention or to take follow-up surveys over a period of time.Although this study has identified factors associated withsuccessful enrollment into a 1-time survey, it is likely thatfactors shaping the ability of couples to actively participate inintervention research may differ. This may be particularly truefor interventions that require members of the dyad to take theintervention together (ie, couples’ counseling–focusedinterventions). There may also be differential follow-up overtime among couples, with only 1 member of the couplecompleting follow-up surveys, leading to limitations to dyadicdata analysis. Although this paper identifies processes forenrolling couples into surveys, further work is required tounderstand whether the process required for successfulparticipation of couples in intervention-focused research differs.
ConclusionsThis study is not without limitations. Using cross-sectional datafrom a convenience sample precludes us from making causalinferences or generalizing our results to other same-sex malecouples in the United States, who may or may not use socialmedia platforms or geospatial mobile apps. The collection ofpersonal identifying information may have prompted socialdesirability to inaccurately report data on their partners orrelationship characteristics. Although participants were
JMIR Public Health Surveill 2020 | vol. 6 | iss. 1 | e15078 | p.33https://publichealth.jmir.org/2020/1/e15078(page number not for citation purposes)
Stephenson et alJMIR PUBLIC HEALTH AND SURVEILLANCE
XSL•FORenderX

instructed to complete the survey separately from their partners,it is possible that couples answered questions together,potentially influencing each other’s responses andoverestimating the degree to which couples truly matched theirknowledge of each other and their relationship. The sample wasoverwhelmingly non-Hispanic white, limiting the ability tomake inferences about specific strategies for enrolling racialand ethnic minority couples into HIV prevention research. Giventhe higher incidence of HIV among MSM of color, work isclearly needed to understand the barriers that racial-ethnicminority male couples may experience in enrolling andparticipating in HIV prevention research.
Despite these limitations, the results presented here provideimportant new information on the processes required tosuccessfully enroll same-sex male couples into Web-based HIVprevention research. The steps used in CHAPS allowed couplesto independently progress through the stages necessary to enrollin the research study while limiting opportunities for coercionand resulted in a large, diverse sample (>500 couples). Theresults underscore the need for additional considerations whenrecruiting and enrolling, relative to improving the methodsassociated with these research processes. Further research isneeded and is beneficial to fully understand the perceptions ofsame-sex male couples toward Web-based research. Thisinformation is vital for the continued refinement of dyadicrecruitment and engagement methods.
AcknowledgmentsThis work was supported by the National Institute of Mental Health under Grant R21 MH111445 (Co-PIs RS and JM).
Conflicts of InterestNone declared.
References1. Goodreau SM, Carnegie NB, Vittinghoff E, Lama JR, Sanchez J, Grinsztejn B, et al. What drives the US and Peruvian HIV
epidemics in men who have sex with men (MSM)? PLoS One 2012;7(11):e50522 [FREE Full text] [doi:10.1371/journal.pone.0050522] [Medline: 23209768]
2. Sullivan PS, Salazar L, Buchbinder S, Sanchez TH. Estimating the proportion of HIV transmissions from main sex partnersamong men who have sex with men in five US cities. AIDS 2009 Jun 1;23(9):1153-1162. [doi:10.1097/QAD.0b013e32832baa34] [Medline: 19417579]
3. Gomez AM, Beougher SC, Chakravarty D, Neilands TB, Mandic CG, Darbes LA, et al. Relationship dynamics as predictorsof broken agreements about outside sexual partners: implications for HIV prevention among gay couples. AIDS Behav2012 Aug;16(6):1584-1588. [doi: 10.1007/s10461-011-0074-0] [Medline: 22020757]
4. Hoff CC, Beougher SC, Chakravarty D, Darbes LA, Neilands TB. Relationship characteristics and motivations behindagreements among gay male couples: differences by agreement type and couple serostatus. AIDS Care 2010 Jul;22(7):827-835[FREE Full text] [doi: 10.1080/09540120903443384] [Medline: 20635246]
5. Stephenson R, White D, Darbes L, Hoff C, Sullivan P. HIV testing behaviors and perceptions of risk of HIV infectionamong MSM with main partners. AIDS Behav 2015 Mar;19(3):553-560 [FREE Full text] [doi: 10.1007/s10461-014-0862-4][Medline: 25081599]
6. Stall R, Mills TC, Williamson J, Hart T, Greenwood G, Paul J, et al. Association of co-occurring psychosocial healthproblems and increased vulnerability to HIV/AIDS among urban men who have sex with men. Am J Public Health 2003Jun;93(6):939-942. [doi: 10.2105/ajph.93.6.939] [Medline: 12773359]
7. Chakravarty D, Hoff CC, Neilands TB, Darbes LA. Rates of testing for HIV in the presence of serodiscordant UAI amongHIV-negative gay men in committed relationships. AIDS Behav 2012 Oct;16(7):1944-1948 [FREE Full text] [doi:10.1007/s10461-012-0181-6] [Medline: 22460227]
8. Mitchell JW, Petroll AE. Patterns of HIV and sexually transmitted infection testing among men who have sex with mencouples in the United States. Sex Transm Dis 2012 Nov;39(11):871-876 [FREE Full text] [doi:10.1097/OLQ.0b013e3182649135] [Medline: 23060078]
9. Phillips G, Hightow-Weidman LB, Arya M, Fields SD, Halpern-Felsher B, Outlaw AY, et al. HIV testing behaviors of acohort of HIV-positive racial/ethnic minority YMSM. AIDS Behav 2012 Oct;16(7):1917-1925. [doi:10.1007/s10461-012-0193-2] [Medline: 22555382]
10. Kelly JA, St Lawrence JS, Diaz YE, Stevenson LY, Hauth AC, Brasfield TL, et al. HIV risk behavior reduction followingintervention with key opinion leaders of population: an experimental analysis. Am J Public Health 1991 Feb;81(2):168-171.[doi: 10.2105/ajph.81.2.168] [Medline: 1990853]
11. Pruitt KL, White D, Mitchell JW, Stephenson R. Sexual agreements and intimate-partner violence among male couples.International Journal of Sexual Health 2015;27(4):429-441. [doi: 10.1080/19317611.2015.1037037]
12. Goldenberg T, Clarke D, Stephenson R. 'Working together to reach a goal': MSM's perceptions of dyadic HIV care forsame-sex male couples. J Acquir Immune Defic Syndr 2013 Nov 1;64(Suppl 1):S52-S61 [FREE Full text] [doi:10.1097/QAI.0b013e3182a9014a] [Medline: 24126448]
JMIR Public Health Surveill 2020 | vol. 6 | iss. 1 | e15078 | p.34https://publichealth.jmir.org/2020/1/e15078(page number not for citation purposes)
Stephenson et alJMIR PUBLIC HEALTH AND SURVEILLANCE
XSL•FORenderX

13. Chomba E, Allen S, Kanweka W, Tichacek A, Cox G, Shutes E, Rwanda Zambia HIV Research Group. Evolution ofcouples' voluntary counseling and testing for HIV in Lusaka, Zambia. J Acquir Immune Defic Syndr 2008 Jan1;47(1):108-115. [doi: 10.1097/QAI.0b013e31815b2d67] [Medline: 17984761]
14. Sullivan PS, Stephenson R, Grazter B, Wingood G, Diclemente R, Allen S, et al. Adaptation of the African couples HIVtesting and counseling model for men who have sex with men in the United States: an application of the ADAPT-ITTframework. Springerplus 2014;3:249 [FREE Full text] [doi: 10.1186/2193-1801-3-249] [Medline: 24877036]
15. Stephenson R, Grabbe KL, Sidibe T, McWilliams A, Sullivan PS. Technical Assistance Needs for Successful Implementationof Couples HIV Testing and Counseling (CHTC) Intervention for Male Couples at US HIV Testing Sites. AIDS Behav2016 Apr;20(4):841-847. [doi: 10.1007/s10461-015-1150-7] [Medline: 26253221]
16. Wu E, El-Bassel N, McVinney LD, Hess L, Remien RH, Charania M, et al. Feasibility and promise of a couple-basedHIV/STI preventive intervention for methamphetamine-using, black men who have sex with men. AIDS Behav 2011Nov;15(8):1745-1754 [FREE Full text] [doi: 10.1007/s10461-011-9997-8] [Medline: 21766193]
17. Newcomb ME, Macapagal KR, Feinstein BA, Bettin E, Swann G, Whitton SW. Integrating HIV Prevention and RelationshipEducation for Young Same-Sex Male Couples: A Pilot Trial of the 2GETHER Intervention. AIDS Behav 2017Aug;21(8):2464-2478 [FREE Full text] [doi: 10.1007/s10461-017-1674-0] [Medline: 28083833]
18. Gamarel KE, Darbes LA, Hightow-Weidman L, Sullivan P, Stephenson R. The development and testing of a relationshipskills intervention to improve HIV prevention uptake among young gay, bisexual, and other men who have sex with menand their primary partners (we prevent): Protocol for a randomized controlled trial. JMIR Res Protoc 2019 Jan 2;8(1):e10370[FREE Full text] [doi: 10.2196/10370] [Medline: 30602433]
19. Mitchell J, Lee J, Traynor S, Feaster D, Sullivan P, Stephenson R. Findings from a web-based, randomized controlled trialof an eHealth prevention toolkit to encourage at-risk, HIV-negative male couples to establish and adhere to a sexualagreement. 2017 Nov 13 Presented at: 13th International AIDS Impact Conference; 2017; Cape Town, South Africa.
20. Mitchell JW, Lee J, Godoy F, Asmar L, Perez G. HIV-discordant and concordant HIV-positive male couples'recommendations for how an eHealth HIV prevention toolkit for concordant HIV-negative male couples could be improvedto meet their specific needs. AIDS Care 2018 Jun;30(sup2):54-60 [FREE Full text] [doi: 10.1080/09540121.2018.1465527][Medline: 29848043]
21. Stephenson R, Suarez NA, Garofalo R, Hidalgo MA, Hoehnle S, Thai J, et al. Project Stronger Together: Protocol to Testa Dyadic Intervention to Improve Engagement in HIV Care Among Sero-Discordant Male Couples in Three US Cities.JMIR Res Protoc 2017 Aug 31;6(8):e170 [FREE Full text] [doi: 10.2196/resprot.7884] [Medline: 28860107]
22. Starks TJ, Millar BM, Parsons JT. Correlates of Individual Versus Joint Participation in Online Survey Research withSame-Sex Male Couples. AIDS Behav 2015 Jun;19(6):963-969 [FREE Full text] [doi: 10.1007/s10461-014-0962-1][Medline: 25432879]
23. Marsack J, Kahle E, Suarez NA, Mimiaga MJ, Garofalo R, Brown E, et al. Relationship Characteristics and DyadicApproaches to HIV Health-Enhancing Behaviours Among a Sample of Same-Sex Male Couples From Three US Cities. JRelatsh Res 2018 May 23;9:e10. [doi: 10.1017/jrr.2018.9]
24. Mimiaga MJ, Suarez N, Garofalo R, Frank J, Ogunbajo A, Brown E, et al. Relationship Dynamics in the Context of BingeDrinking and Polydrug Use Among Same-Sex Male Couples in Atlanta, Boston, and Chicago. Arch Sex Behav 2019May;48(4):1171-1184. [doi: 10.1007/s10508-018-1324-2] [Medline: 30806868]
25. Parsons JT, Starks TJ. Drug use and sexual arrangements among gay couples: frequency, interdependence, and associationswith sexual risk. Arch Sex Behav 2014 Jan;43(1):89-98. [doi: 10.1007/s10508-013-0237-3] [Medline: 24322670]
26. Mitchell JW, Harvey SM, Champeau D, Seal DW. Relationship factors associated with HIV risk among a sample of gaymale couples. AIDS Behav 2012 Feb;16(2):404-411 [FREE Full text] [doi: 10.1007/s10461-011-9976-0] [Medline:21614560]
27. Mitchell JW, Stephenson R. HIV-Negative Partnered Men's Willingness to Use Pre-Exposure Prophylaxis and AssociatedFactors Among an Internet Sample of US HIV-Negative and HIV-Discordant Male Couples. LGBT Health 2015Mar;2(1):35-40 [FREE Full text] [doi: 10.1089/lgbt.2014.0092] [Medline: 26790016]
28. Sullivan PS, Khosropour CM, Luisi N, Amsden M, Coggia T, Wingood GM, et al. Bias in online recruitment and retentionof racial and ethnic minority men who have sex with men. J Med Internet Res 2011 May 13;13(2):e38 [FREE Full text][doi: 10.2196/jmir.1797] [Medline: 21571632]
29. StataCorp. Stata Statistical Software: Release 15. College Station, TX: StataCorp LLC 2017.30. Stephenson R, Freeland R, Sullivan SP, Riley E, Johnson BA, Mitchell J, et al. Home-Based HIV Testing and Counseling
for Male Couples (Project Nexus): A Protocol for a Randomized Controlled Trial. JMIR Res Protoc 2017 May 30;6(5):e101[FREE Full text] [doi: 10.2196/resprot.7341] [Medline: 28559225]
31. Bauermeister JA, Pingel E, Zimmerman M, Couper M, Carballo-Diéguez A, Strecher VJ. Data Quality in web-basedHIV/AIDS research: Handling Invalid and Suspicious Data. Field methods 2012 Aug 1;24(3):272-291 [FREE Full text][doi: 10.1177/1525822X12443097] [Medline: 23180978]
32. Mitchell J, Lee J, Stephenson R. Metadata Correction of: How Best to Obtain Valid, Verifiable Data Online From MaleCouples? Lessons Learned From an eHealth HIV Prevention Intervention for HIV-Negative Male Couples. JMIR PublicHealth Surveill 2016 Sep 26;2(2):e155 [FREE Full text] [doi: 10.2196/publichealth.6689] [Medline: 27694099]
JMIR Public Health Surveill 2020 | vol. 6 | iss. 1 | e15078 | p.35https://publichealth.jmir.org/2020/1/e15078(page number not for citation purposes)
Stephenson et alJMIR PUBLIC HEALTH AND SURVEILLANCE
XSL•FORenderX

AbbreviationsCHAPS: Couples Health and Attitudes toward Preexposure ProphylaxisCHTC: Couples HIV testing and counselingMSM: men who have sex with menPrEP: pre-exposure prophylaxisRRR: relative risk ratio
Edited by H Bradley; submitted 17.06.19; peer-reviewed by E Op de Coul, M Newcomb, S Lang; comments to author 08.10.19; revisedversion received 28.10.19; accepted 11.11.19; published 09.01.20.
Please cite as:Stephenson R, Chavanduka TMD, Sullivan S, Mitchell JWCorrelates of Successful Enrollment of Same-Sex Male Couples Into a Web-Based HIV Prevention Research Study: Cross-SectionalStudyJMIR Public Health Surveill 2020;6(1):e15078URL: https://publichealth.jmir.org/2020/1/e15078 doi:10.2196/15078PMID:31917373
©Rob Stephenson, Tanaka MD Chavanduka, Stephen Sullivan, Jason W Mitchell. Originally published in JMIR Public Healthand Surveillance (http://publichealth.jmir.org), 09.01.2020. This is an open-access article distributed under the terms of theCreative Commons Attribution License (https://creativecommons.org/licenses/by/4.0/), which permits unrestricted use, distribution,and reproduction in any medium, provided the original work, first published in JMIR Public Health and Surveillance, is properlycited. The complete bibliographic information, a link to the original publication on http://publichealth.jmir.org, as well as thiscopyright and license information must be included.
JMIR Public Health Surveill 2020 | vol. 6 | iss. 1 | e15078 | p.36https://publichealth.jmir.org/2020/1/e15078(page number not for citation purposes)
Stephenson et alJMIR PUBLIC HEALTH AND SURVEILLANCE
XSL•FORenderX

Original Paper
Medical Conditions Predictive of Self-Reported Poor Health:Retrospective Cohort Study
M Soledad Cepeda1, MD, PhD; Jenna Reps1, PhD; David M Kern1, PhD; Paul Stang1, PhDJanssen Research & Development, Titusville, NJ, United States
Corresponding Author:M Soledad Cepeda, MD, PhDJanssen Research & Development1125 Trenton Harbourton RdTitusville, NJ, 08560United StatesPhone: 1 6097302413Email: [email protected]
Abstract
Background: Identifying the medical conditions that are associated with poor health is crucial to prioritize decisions for futureresearch and organizing care. However, assessing the burden of disease in the general population is complex, lengthy, andexpensive. Claims databases that include self-reported health status can be used to assess the impact of medical conditions onthe health in a population.
Objective: This study aimed to identify medical conditions that are highly predictive of poor health status using claims databases.
Methods: To determine the medical conditions most highly predictive of poor health status, we used a retrospective cohortstudy using 2 US claims databases. Subjects were commercially insured patients. Health status was measured using a self-reporthealth status response. All medical conditions were included in a least absolute shrinkage and selection operator regression modelto assess which conditions were associated with poor versus excellent health.
Results: A total of 1,186,871 subjects were included; 61.64% (731,587/1,186,871) reported having excellent or very goodhealth. The leading medical conditions associated with poor health were cancer-related conditions, demyelinating disorders,diabetes, diabetic complications, psychiatric illnesses (mood disorders and schizophrenia), sleep disorders, seizures, malereproductive tract infections, chronic obstructive pulmonary disease, cardiomyopathy, dementia, and headaches.
Conclusions: Understanding the impact of disease in a commercially insured population is critical to identify subjects who maybe at risk for reduced productivity and job loss. Claims database studies can measure the impact of medical conditions on thehealth status in a population and to assess changes overtime and could limit the need to collect prospective collection of information,which is slow and expensive, to assess disease burden. Leading medical conditions associated with poor health in a commerciallyinsured population were the ones associated with high burden of disease such as cancer-related conditions, demyelinating disorders,diabetes, diabetic complications, psychiatric illnesses (mood disorders and schizophrenia), infections, chronic obstructive pulmonarydisease, cardiomyopathy, and dementia. However, sleep disorders, seizures, male reproductive tract infections, and headacheswere also part of the leading medical conditions associated with poor health that had not been identified before as being associatedwith poor health and deserve more attention.
(JMIR Public Health Surveill 2020;6(1):e13018) doi:10.2196/13018
KEYWORDS
burden of illness; claims database studies; poor health
Introduction
Knowing which medical conditions are associated withperceived poor health is crucial to identify unmet needs andprioritize decisions for future research and interventions.However, assessing burden of disease in the general population
is complex, lengthy, and expensive [1,2]. The Global Burdenof Disease Study (GBD) created a framework for integratingand analyzing information on mortality and population healthto compare the importance of diseases as measured by theirimpact on premature death and disability in different populations[3]. It requires assessing both the prevalence of each conditionof interest and the impact of such conditions on a person’s
JMIR Public Health Surveill 2020 | vol. 6 | iss. 1 | e13018 | p.37https://publichealth.jmir.org/2020/1/e13018(page number not for citation purposes)
Cepeda et alJMIR PUBLIC HEALTH AND SURVEILLANCE
XSL•FORenderX

overall health status, which often depends on collection ofinformation that is not otherwise systematically collected in thelarger population databases.
Claims databases contain data on millions of subjects that allowresearchers to estimate the prevalence of a large number ofmedical conditions, including rare conditions that come tomedical attention. Claims databases, however, usually lackinformation on self-reported outcomes needed to understandthe impact of the medical conditions on overall health. Thislimitation can be overcome by linking a claims database withsurveys that have information on health status and, unlike manyelectronic health record sources, are systematically collected ina defined population. The IBM MarketScan Health RiskAssessment (HRA) Database has self-reported health statusinformation and can be linked to another IBMdatabase—MarketScan Commercial Claims and Encounters(CCAE)—which contains data on health insurance claims ofcommercially insured individuals. This linkage allowsresearchers to efficiently study the burden of disease in areal-world setting in the employed population. Understandingthe impact of disease in this population is critical to identifysubjects who may be at risk of reduced productivity and jobloss, a phenomenon that has been described extensively in theliterature [4].
The impact of disease can be measured by self-reported healthstatus, which in the HRA is captured in a single question: “Howwould you describe your overall health?” This single questionhas long been used to measure health status and health-relatedquality of life in national surveys or as part of multidimensionalhealth status measures as it has been shown to be stronglyassociated with productivity [5], health care utilization, andmortality [6-10].
We sought to determine, in a commercially insured population,the medical conditions most highly predictive of poor healthstatus.
Methods
Data SourcesTo determine the medical conditions that are associated withself-rated poor health in a commercially insured population, weconducted a retrospective cohort study using 2 linked databases:CCAE and HRA.
The CCAE database represents data from individuals enrolledin US employer-sponsored insurance health plans. The datainclude adjudicated health insurance claims (ie, inpatient,outpatient, and outpatient pharmacy) as well as enrollment datafrom large employers and health plans who provide privatehealth care coverage to employees, their spouses, anddependents. The database has inpatient and outpatient medicalclaims and medical diagnoses that are coded using theInternational Classification of Diseases (ICD) system ICD-9 orICD-10.
The HRA database contains self-reported health-relatedbehavioral data from surveys of employees of large UScorporations and health plans. These questionnaires are
administered as part of corporate health and wellness programsand are designed to help employees understand their own healthrisks and how they may be able to mitigate the risks.Participation is voluntary, although employers often provideincentives such as a credit toward the employee’s share ofmedical premiums for completion of the survey.
Health StatusTo determine the health status of the responder, we used theanswer to the single question: “Over the past 6 months, howwould you describe your overall health?” The 5 potentialresponses were excellent, very good, good, fair, and poor.
This single question is simple, easy to understand, [11] reliable[12], and, as mentioned above, has been shown to be stronglyassociated with productivity [5], health care utilization, andmortality [6-9].
We included survey responses from 2008 to 2016. Whensubjects responded to the survey in more than 1 year, weselected the most recent response. The date of the survey wasconsidered the index date.
Medical ConditionsDiagnosis codes from medical claims occurring within the 6months preceding the patients’ survey date were included ascandidate predictors of self-reported health. To group medicalconditions, we used the Medical Dictionary for RegulatoryActivities vocabulary (MedDRA). MedDRA is a rich and highlyspecific standardized medical terminology created to facilitatesharing of regulatory information internationally for medicalproducts. It was developed in the late 1990s by the InternationalCouncil for Harmonization of Technical Requirements forPharmaceuticals for Human Use. The advantage of thisvocabulary is that the terminology is hierarchically arrangedfrom very specific to very general. We used the High-LevelGroup level to group the conditions. We used existing mappingsof ICD-9 or ICD-10 codes to obtain MedDRA groups [13]. Forexample, the atrial fibrillation ICD-10 code (I48) is mapped toatrial fibrillation, which then rolls up to the High-Level Groupcardiac arrhythmias.
AnalysisWe built a least absolute shrinkage and selection operator(LASSO) logistic regression model [14] to assess whichconditions were associated with poor versus excellent health atthe time the subject responded to the survey. LASSO regressionis similar to standard logistic regression except it adds a modelcomplexity penalty to “shrink” the coefficients toward 0. Someof the coefficients are completely shrunk to 0, and therefore,LASSO reduces the number of variables used in the final model.The advantages are that it effectively does variable selectionduring model training, which reduces that occurrence of modeloverfitting and often results in a more parsimonious model. Itis able to find the strongest predictors of having poor versusexcellent health. We used the LASSO results to rank the medicalconditions associated with poor outcomes.
We also performed a traditional logistic regression to includeonly MedDRA groups that were not highly correlated with one
JMIR Public Health Surveill 2020 | vol. 6 | iss. 1 | e13018 | p.38https://publichealth.jmir.org/2020/1/e13018(page number not for citation purposes)
Cepeda et alJMIR PUBLIC HEALTH AND SURVEILLANCE
XSL•FORenderX

another (r<0.70), and the results were consistent with theLASSO regression and thus, are not reported.
The regression model included medical conditions recorded inthe claims data during the 6 months preceding the index dateto reflect the same 6-month timeframe that is incorporated intothe health status question. We included 260 medical conditions(MedDRA High Level Groups; Multimedia Appendix 1), andthe outcome of interest was self-reported poor health status.The reference group included individuals self-reporting excellenthealth.
Odds ratios and 95% CIs were calculated using the betacoefficients and SEs of the logistic regression model andrepresent the independent association of each condition adjustedfor the presence of all other conditions included in the model.We report the odds ratios from the logistic regression becausethe coefficients from the LASSO regression are shrunk andshould not be interpreted as odd ratios. In addition, we presentthe prevalence of the conditions in subjects with and withoutthe outcome of interest.
ValidationTo validate the study findings, the model was trained using3-fold cross validation on 75% of the data (training sample),and the study findings were validated on the remaining 25% ofthe data (test sample).
To assess the performance of the LASSO regression model, wecalculated area under the curve (AUC) using the test sample.The AUC is a measure that quantifies the ability of the modelto discriminate between subjects with and without the outcome[15]. The higher the AUC, the better the model discriminatesbetween the subject with and without poor health.
GeneralizabilityTo assess whether the results of the study generalize to a broaderpopulation, we compared the survey responders with the generalcommercially insured population.
We took a random sample of primary beneficiaries in the CCAEdatabase of the same size as the survey responders stratified byyear, and we required that the subjects be in the CCAE databaseat least 6 months before the index date. The index date forsubjects who did not respond to the survey was a randomlyselected date within the same calendar year.
We calculated age, number of distinct medical conditions, andnumber of visits to the health care system 6 months before theindex date and the Charlson comorbidity index score [16] tofurther characterize the population for comparison. Ascomorbidities are major determinants of patient health status,we included the Charlson Index, which is a weighted sum ofthe presence of 19 medical conditions; each condition is assigneda weight from 1 to 6, with higher weights indicating greaterseverity and higher risk of mortality.
Results
Study PopulationA total of 1,415,789 subjects answered the health statusquestion, of whom 1,186,871 met the requirements of being inthe CCAE database for at least 6 months before the day theyresponded to the survey. A total of 61.64% (731,587/1,186,871)of the responders reported having excellent or very good health;see Table 1.
The survey responders did not differ substantially from thesubjects in the CCAE database with regard to age and gender.However, survey responders had more visits to the health caresystem (5.0 vs 3.3) and more medical conditions (3.8 vs 3.1)than the remaining subjects in the CCAE database; see Table2.
Table 1. Health status of survey responders (N=1,186,871).
Survey responders, n (%)Self-reported health status
239,734 (20.20)Excellent health
491,845 (41.44)Very good
365,083 (30.76)Good health
77,997 (6.57)Fair health
12,212 (1.03)Poor health
JMIR Public Health Surveill 2020 | vol. 6 | iss. 1 | e13018 | p.39https://publichealth.jmir.org/2020/1/e13018(page number not for citation purposes)
Cepeda et alJMIR PUBLIC HEALTH AND SURVEILLANCE
XSL•FORenderX

Table 2. Characteristic of the survey responders and the source population.
Subjects reporting poorhealth (N=12,212)
Subjects reporting excellenthealth (N=239,734)
All survey responders(N=1,186,871)
Random sample of
employees in CCAEa
(N=1,186,871)
Characteristic
Sex, n (%)
5758 (47.15)128,748 (53.70)623,668 (52.54)616,901 (51.97)Male
6454 (52.84)110,986 (46.29)563,203 (47.45)569,970 (48.02)Female
43.6 (11.56)44.4 (11.64)44.3 (11.43)42.5 (12.35)Age (years), mean (SD)
1.3 (2.51)0.49 (1.32)0.69 (1.1)0.39 (1.63)Charlson Index, mean (SD)
7.1 (9.41)2.9 (4.12)3.8 (5.28)3.1 (5.72)Distinct number of conditions 6 monthspreindex, mean (SD)
9.5 (15.12)4.0 (6.34)5.0 (8.02)3.3 (7.23)Number of visits 6 months preindex,mean (SD)
aCCAE: Commercial Claims and Encounters.
The outcome was initially defined as having a self-reported fairor poor health status, and these subjects were compared withsubjects who reported having good, very good, or excellenthealth. The AUC model that used this delineation was 0.66. Toimprove the discrimination of the model, we implemented adifferent threshold where subjects who reported poor healthwere compared with subjects who reported excellent health.The performance of model improved with an AUC of 0.73.
A total of 251,892 subjects were included in the regressionmodel that compared subjects who reported poor health(n=12,212) with subjects who reported excellent health(n=239,734). Subjects with poor health had more diagnosedconditions, more prior visits, and a higher Charlson index scorethan subjects with excellent health; see Table 2.
Leading Medical ConditionsThe leading medical conditions that were associated with poorhealth were cancer-related conditions, demyelinating disorders,diabetes/diabetic complications, psychiatric illnesses (mooddisorders and schizophrenia), sleep disorders, seizures, malereproductive tract infections, chronic obstructive pulmonarydisease, cardiomyopathy, dementia, and headaches (Table 3).Substance use disorders, diabetes, mood disorders, sleepdisorders, and obstructive pulmonary disease were the mostprevalent among subjects with poor health. The association ofall medical conditions assessed and their prevalence in subjectswith poor and excellent health are listed in Multimedia Appendix1.
JMIR Public Health Surveill 2020 | vol. 6 | iss. 1 | e13018 | p.40https://publichealth.jmir.org/2020/1/e13018(page number not for citation purposes)
Cepeda et alJMIR PUBLIC HEALTH AND SURVEILLANCE
XSL•FORenderX

Table 3. Leading medical conditions associated with poor health and their prevalence in subjects with poor or excellent health.
Adjusted odds ratio (OR)from logistic regression
modela (95% CI)
Prevalence in subjectswith excellent health, %
Prevalence in subjectswith poor health, %
Medical condition
7.15 (4.92-10.39)0.051.56Metastases
3.16 (2.32-4.29)0.080.66Demyelinating disorders
2.24 (1.37-3.68)0.060.74Skeletal neoplasms malignant and unspecified
2.55 (1.98-3.29)2.8215.03Glucose metabolism disorders
2.11 (1.79-2.48)0.334.26Diabetic complications
1.98 (1.62-2.43)0.241.55Manic and bipolar mood disorders and disturbances
2.03 (1.28-3.22)0.050.40Neoplasm-related morbidities
1.93 (1.79-2.09)2.5310.79Sleep disturbances
1.99 (1.14-3.46)0.020.55Hepatobiliary neoplasms
1.73 (1.27-2.38)0.360.49Male reproductive tract infections and inflammations
1.81 (1.41-2.32)0.211.03Seizures
2.09 (1.14-3.84)0.020.17Increased intracranial pressure and hydrocephalus
1.69 (1.43-2.00)0.513.49Heart failures
1.65 (1.33-2.05)0.933.77Hematopoietic neoplasms (excluding leukemias and lymphomas)
2.43 (1.17-5.04)0.030.18Lymphomas non-Hodgkin T-cell
1.47 (1.19-1.81)0.631.62Gastrointestinal hemorrhages
1.71 (1.45-2.01)2.3810.97Depressed mood disorders and disturbances
1.60 (1.47-1.74)3.5810.63Bronchial disorders (excluding neoplasms)
1.61 (1.17-2.21)0.110.74Dementia and amnestic conditions
2.20 (1.37-3.54)0.050.45Lymphatic vessel disorders
1.93 (1.16-3.20)0.040.29Plasma cell neoplasms
1.43 (1.10-1.85)0.170.87Schizophrenia and other psychotic disorders
1.52 (1.38-1.66)8.2422.58Substance-related disorders
1.62 (1.31-1.98)0.312.00Myocardial disorders
1.26 (1.15-1.38)2.737.75Headaches
aThe odds ratios come from the logistic regression model that had all medical conditions with correlations <0.7.
Discussion
Principal FindingsCancer-related conditions, demyelinating disorders,diabetes/diabetic complications, psychiatric illnesses (mooddisorders and schizophrenia), sleep disorders, seizures, malereproductive tract infections, chronic obstructive pulmonarydisease, cardiomyopathy, dementia, and headaches were theleading medical conditions associated with poor health.
Many of the medical conditions that had a strong associationwith poor health in our commercially insured population aresimilar to the conditions identified as the ones that affect thehealth of the general population using the GBD framework[1,2]. For example, cancer, diabetes, and mood disorders arethe leading medical conditions associated with disability andmortality in the GBD study, and in our study, they were alsosome among the most predictive of having self-reported poorhealth status. This was of particular interest as the GBD made
extensive use of studies using screening questionnaires (eg, formood, which would identify sufferers regardless of whetherthey sought medical attention), whereas our analysis was basedon interactions with the health care system. Using claims datafor these analyses comes with the conceptual acceptance thatfor many conditions such as diabetes and cancer, it is unlikelythat there are undetected “cases” in the population, whereas fordisorders such as mood or anxiety, only a portion of thoseaffected seek care and are adequately identified. Nesting ouranalysis in an employed population with access to insurancealso tempers the potential impact of access to care that isassociated with health care–seeking behavior differences byreimbursement coverage.
Of interest, there are some notable differences between ourfindings and the GBD rankings. For example, stroke was notone of our top 25 conditions associated with poor health, butstroke has been identified as one the top 10 conditions withsubstantial impact on health measured by mortality or
JMIR Public Health Surveill 2020 | vol. 6 | iss. 1 | e13018 | p.41https://publichealth.jmir.org/2020/1/e13018(page number not for citation purposes)
Cepeda et alJMIR PUBLIC HEALTH AND SURVEILLANCE
XSL•FORenderX

disability-adjusted life-years [1,2]. One reason for thesedifferences may be because of the populations being studied.Our study included employed individuals with commercialinsurance who completed a survey, and thus, conditions thatare acute and highly fatal or debilitating—such as stroke—orthose that are more likely in an older population may not bewell represented in a comparatively healthy workforcepopulation (often referred to as the Health Worker effect). Thisis further reflected when comparing results with those from thegeneral US population, as approximately 10% of the populationself-report poor health status [17], but in our population, only1% did, which may also reflect a relatively younger population.A second reason may be differences in how burden of diseasewas measured. For example, stroke drops from the 2nd positionin the ranking for mortality to the 17th position when yearslived with disability is used to assess the burden of disease. Inthis study, we used the magnitude of the association of thecondition with poor health.
We also found some conditions at the top of our list for theirassociation with poor health that are not in the top 25 conditionswhen the GBD framework is used. Focusing on a commerciallyinsured population allowed us to identify conditions that arespecifically relevant for that population and may otherwise beoverlooked. This is important given a major health policyobjective is to maintain a healthy workforce by reducing theimpact of disease on disablement and productivity. One of theimportant predictors of poor health that have not been previouslyidentified is sleep disorders. Sleep disorders are not among the25 leading diseases that affect life expectancy or disability inthe United States or globally [1,2]. Our finding adds to the bodyof evidence on the negative impact of sleep loss on healthoutcomes. Subjects who sleep less than or equal to 6 hours andsubjects with insomnia not only have higher BMI but also havemore cardiovascular problems [18] and increased rates of death[19]. Another condition predictive of poor health wasreproductive tract infections, which includes chronic prostatitis.Chronic prostatitis affects men of all ages and demographics,and this study also confirms the substantial impact it has onquality of life [20].
This study also confirms the disease burden of infrequentconditions such as multiple sclerosis, which too was not on thetop 25 conditions in the GBD study. Multiple sclerosis is a rareprogressive chronic progressive autoimmune neurologicaldisease [21]. Despite the availability of treatments, it is a leadingpredictor of poor health.
In this study, we are reporting the results of a comparisonbetween subjects who reported poor health with subjects whoreported excellent health because this model performed better
than the model in which we grouped subjects who had poor andfair health and compared them with subjects who reportedhaving good, very good, or excellent health. Studies that haveassessed the reliability of the single self-reported health statushave found that a large number of subjects inconsistently reporttheir ratings when self-assessing health [22]. Most subjects whochange ratings do it by only 1 category. So, the comparisonbetween subjects who report poor health versus subjects whoreport excellent status, a comparison of the extreme responses,is likely to have less misclassification, and therefore, the modelcan better discriminate between the 2 groups.
Study LimitationsAs mentioned above, this study used administrative medicalclaims to find the leading medical conditions associated withself-report of poor health. These medical conditions wereidentified through medical claims data, which are generated foradministrative and reimbursement, not for research purposes,so the presence of a claim with a specific diagnosis does notnecessarily indicate the presence of that condition. Thismisclassification, although it will not affect the ranking, wouldlead to underestimation of the association with poor health. Inaddition, the population studied is a commercially insuredpopulation that is healthy enough to work, so the prevalence ofconditions that occur mainly in a nonworking or elderlypopulation are likely to be underestimated.
ConclusionsUnderstanding the impact of disease in commercially insuredsubjects is critical to identify subjects who may be at risk ofreduced productivity and job loss. Claims databases that haveself-reported health status provide a very efficient and validway to provide an overview of the impact of medical conditionson the health in a population and to assess changes overtime.Prospective collection of information is slow and expensive;however, this expensive approach could be tailored and focusedto supplement the information that can be obtained from claimsor similar databases. We found that leading medical conditionsassociated with poor health in a commercially insured populationwere the ones associated with high burden of disease in theWorld Health Organization GBD study such as cancer-relatedconditions, demyelinating disorders, diabetes/diabeticcomplications, psychiatric illnesses (mood disorders andschizophrenia), infections, chronic obstructive pulmonarydisease, cardiomyopathy, and dementia. However, sleepdisorders, seizures, male reproductive tract infections, andheadaches were also part of the leading medical conditionsassociated with poor health that had not been identified beforeas being associated with poor health and deserve more attention.
Conflicts of InterestAll authors are employees of Janssen Research & Development, LCC; however, there is no assessment or mention of any productsin this study.
Multimedia Appendix 1
JMIR Public Health Surveill 2020 | vol. 6 | iss. 1 | e13018 | p.42https://publichealth.jmir.org/2020/1/e13018(page number not for citation purposes)
Cepeda et alJMIR PUBLIC HEALTH AND SURVEILLANCE
XSL•FORenderX

Prevalence of each of the 260 medical conditions considered in the logistic regression model and their association with poorversus excellent health.[DOCX File , 51 KB - publichealth_v6i1e13018_app1.docx ]
References1. Murray CJ, Lopez AD. Measuring the global burden of disease. N Engl J Med 2013 Aug 1;369(5):448-457. [doi:
10.1056/NEJMra1201534] [Medline: 23902484]2. Murray CJ, Atkinson C, Bhalla K, Birbeck G, Burstein R, Chou D, Foreman, Lopez, Murray, Dahodwala, Jarlais, Fahami,
Murray, Jarlais, Foreman, Lopez, Murray, US Burden of Disease Collaborators. The state of US health, 1990-2010: burdenof diseases, injuries, and risk factors. J Am Med Assoc 2013 Aug 14;310(6):591-608 [FREE Full text] [doi:10.1001/jama.2013.13805] [Medline: 23842577]
3. Murray CJ, Lopez AD. Mortality by cause for eight regions of the world: Global Burden of Disease Study. Lancet 1997May 3;349(9061):1269-1276. [doi: 10.1016/S0140-6736(96)07493-4] [Medline: 9142060]
4. Bertram MY, Sweeny K, Lauer JA, Chisholm D, Sheehan P, Rasmussen B, et al. Investing in non-communicable diseases:an estimation of the return on investment for prevention and treatment services. Lancet 2018 May 19;391(10134):2071-2078.[doi: 10.1016/S0140-6736(18)30665-2] [Medline: 29627159]
5. Parker KM, Wilson MG, Vandenberg RJ, DeJoy DM, Orpinas P. Association of comorbid mental health symptoms andphysical health conditions with employee productivity. J Occup Environ Med 2009 Oct;51(10):1137-1144. [doi:10.1097/JOM.0b013e3181b8c155] [Medline: 19786901]
6. Idler EL, Benyamini Y. Self-rated health and mortality: a review of twenty-seven community studies. J Health Soc Behav1997 Mar;38(1):21-37. [Medline: 9097506]
7. Burström B, Fredlund P. Self rated health: is it as good a predictor of subsequent mortality among adults in lower as wellas in higher social classes? J Epidemiol Community Health 2001 Nov;55(11):836-840 [FREE Full text] [doi:10.1136/jech.55.11.836] [Medline: 11604441]
8. Bierman AS, Bubolz TA, Fisher ES, Wasson JH. How well does a single question about health predict the financial healthof Medicare managed care plans? Eff Clin Pract 1999;2(2):56-62. [Medline: 10538477]
9. DeSalvo KB, Bloser N, Reynolds K, He J, Muntner P. Mortality prediction with a single general self-rated health question.A meta-analysis. J Gen Intern Med 2006 Mar;21(3):267-275 [FREE Full text] [doi: 10.1111/j.1525-1497.2005.00291.x][Medline: 16336622]
10. Abrutyn E, Mossey J, Berlin JA, Boscia J, Levison M, Pitsakis P, et al. Does asymptomatic bacteriuria predict mortalityand does antimicrobial treatment reduce mortality in elderly ambulatory women? Ann Intern Med 1994 May15;120(10):827-833. [doi: 10.7326/0003-4819-120-10-199405150-00003] [Medline: 7818631]
11. Bowling A. Just one question: if one question works, why ask several? J Epidemiol Community Health 2005May;59(5):342-345 [FREE Full text] [doi: 10.1136/jech.2004.021204] [Medline: 15831678]
12. Lundberg O, Manderbacka K. Assessing reliability of a measure of self-rated health. Scand J Soc Med 1996Sep;24(3):218-224. [doi: 10.1177/140349489602400314] [Medline: 8878376]
13. Reich C, Ryan PB, Stang PE, Rocca M. Evaluation of alternative standardized terminologies for medical conditions withina network of observational healthcare databases. J Biomed Inform 2012 Aug;45(4):689-696 [FREE Full text] [doi:10.1016/j.jbi.2012.05.002] [Medline: 22683994]
14. Tian Y, Schuemie MJ, Suchard MA. Evaluating large-scale propensity score performance through real-world and syntheticdata experiments. Int J Epidemiol 2018 Dec 1;47(6):2005-2014 [FREE Full text] [doi: 10.1093/ije/dyy120] [Medline:29939268]
15. Hajian-Tilaki K. Receiver Operating Characteristic (ROC) curve analysis for medical diagnostic test evaluation. CaspianJ Intern Med 2013;4(2):627-635 [FREE Full text] [Medline: 24009950]
16. Charlson ME, Pompei P, Ales KL, MacKenzie CR. A new method of classifying prognostic comorbidity in longitudinalstudies: development and validation. J Chronic Dis 1987;40(5):373-383. [doi: 10.1016/0021-9681(87)90171-8] [Medline:3558716]
17. National Center for Health Statistics. Centers for Disease Control and Prevention (CDC). 2017. Health, United States, 2016:With Chartbook on Long-term Trends in Health. URL: https://www.cdc.gov/nchs/data/hus/hus16.pdf [accessed 2019-12-05]
18. Cepeda MS, Stang P, Blacketer C, Kent JM, Wittenberg GM. Clinical relevance of sleep duration: results from across-sectional analysis using NHANES. J Clin Sleep Med 2016 Jun 15;12(6):813-819 [FREE Full text] [doi:10.5664/jcsm.5876] [Medline: 26951419]
19. Sofi F, Cesari F, Casini A, Macchi C, Abbate R, Gensini GF. Insomnia and risk of cardiovascular disease: a meta-analysis.Eur J Prev Cardiol 2014 Jan;21(1):57-64. [doi: 10.1177/2047487312460020] [Medline: 22942213]
20. Schaeffer AJ, Landis JR, Knauss JS, Propert KJ, Alexander RB, Litwin MS, Chronic Prostatitis Collaborative ResearchNetwork Group. Demographic and clinical characteristics of men with chronic prostatitis: the national institutes of healthchronic prostatitis cohort study. J Urol 2002 Aug;168(2):593-598. [Medline: 12131316]
21. Goldenberg MM. Multiple sclerosis review. Phys Ther 2012 Mar;37(3):175-184 [FREE Full text] [Medline: 22605909]
JMIR Public Health Surveill 2020 | vol. 6 | iss. 1 | e13018 | p.43https://publichealth.jmir.org/2020/1/e13018(page number not for citation purposes)
Cepeda et alJMIR PUBLIC HEALTH AND SURVEILLANCE
XSL•FORenderX
http://www.ncbi.nlm.nih.gov/entrez/query.fcgi?cmd=Retrieve&db=PubMed&list_uids=9142060&dopt=Abstract
http://www.ncbi.nlm.nih.gov/entrez/query.fcgi?cmd=Retrieve&db=PubMed&list_uids=9097506&dopt=Abstract
http://www.ncbi.nlm.nih.gov/entrez/query.fcgi?cmd=Retrieve&db=PubMed&list_uids=7818631&dopt=Abstract
http://www.ncbi.nlm.nih.gov/entrez/query.fcgi?cmd=Retrieve&db=PubMed&list_uids=8878376&dopt=Abstract

22. Zajacova A, Dowd JB. Reliability of self-rated health in US adults. Am J Epidemiol 2011 Oct 15;174(8):977-983 [FREEFull text] [doi: 10.1093/aje/kwr204] [Medline: 21890836]
AbbreviationsAUC: area under the curveCCAE: Commercial Claims and EncountersGBD: Global Burden of Disease StudyHRA: Health Risk AssessmentICD: International Classification of DiseasesLASSO: least absolute shrinkage and selection operatorMedDRA: Medical Dictionary for Regulatory Activities
Edited by G Eysenbach; submitted 03.12.18; peer-reviewed by MY Kang, M Anderson, I Brooks, B Ghose; comments to author01.10.19; revised version received 09.10.19; accepted 22.10.19; published 08.01.20.
Please cite as:Cepeda MS, Reps J, Kern DM, Stang PMedical Conditions Predictive of Self-Reported Poor Health: Retrospective Cohort StudyJMIR Public Health Surveill 2020;6(1):e13018URL: https://publichealth.jmir.org/2020/1/e13018 doi:10.2196/13018PMID:31913130
©M Soledad Cepeda, Jenna Reps, David M Kern, Paul Stang. Originally published in JMIR Public Health and Surveillance(http://publichealth.jmir.org), 08.01.2020. This is an open-access article distributed under the terms of the Creative CommonsAttribution License (https://creativecommons.org/licenses/by/4.0/), which permits unrestricted use, distribution, and reproductionin any medium, provided the original work, first published in JMIR Public Health and Surveillance, is properly cited. The completebibliographic information, a link to the original publication on http://publichealth.jmir.org, as well as this copyright and licenseinformation must be included.
JMIR Public Health Surveill 2020 | vol. 6 | iss. 1 | e13018 | p.44https://publichealth.jmir.org/2020/1/e13018(page number not for citation purposes)
Cepeda et alJMIR PUBLIC HEALTH AND SURVEILLANCE
XSL•FORenderX

Original Paper
A Web-Based Geolocated Directory of Crisis Pregnancy Centers(CPCs) in the United States: Description of CPC Map Methodsand Design Features and Analysis of Baseline Data
Andrea Swartzendruber1, MPH, PhD; Danielle N Lambert1, MPH, PhDEpidemiology and Biostatistics Department, College of Public Health, University of Georgia, Athens, GA, United States
Corresponding Author:Andrea Swartzendruber, MPH, PhDEpidemiology and Biostatistics DepartmentCollege of Public HealthUniversity of Georgia101 Buck RoadAthens, GA, 30602United StatesPhone: 1 7065838149Email: [email protected]
Abstract
Background: Crisis pregnancy centers (CPCs) are nonprofit organizations that aim to dissuade people considering abortion.The centers frequently advertise in misleading ways and provide inaccurate health information. CPCs in the United States arebecoming more medicalized and gaining government funding and support. We created a CPC Map, a Web-based geolocateddatabase of all CPCs currently operating in the United States, to help individuals seeking health services know which centers areCPCs and to facilitate academic research.
Objective: This study aimed to describe the methods used to develop and maintain the CPC Map and baseline findings regardingthe number and distribution of CPCs in the United States. We also examined associations between direct state funding and thenumber of CPCs and relationships between the number of CPCs and state legislation proposed in 2018-2019 to ban all or mostabortions.
Methods: In 2018, we used standard protocols to identify and verify the locations of and services offered by CPCs operatingin the United States. The CPC Map was designed to be a publicly accessible, user-friendly searchable database that can be easilyupdated. We examined the number of CPCs and, using existing data, the ratios of women of reproductive age to CPCs and CPCsto abortion facilities nationally and by region, subregion, and state. We used unadjusted and adjusted negative binomial regressionmodels to examine associations between direct state funding and the number of CPCs. We used unadjusted and adjusted logisticregression models to examine associations between the number of CPCs by state and legislation introduced in 2018-2019 to banall or most abortions. Adjusted models controlled for the numbers of women of reproductive age and abortion facilities per state.
Results: We identified 2527 operating CPCs. Of these, 66.17% (1672/2527) offered limited medical services. Nationally, theratio of women of reproductive age to CPCs was 29,304:1. The number of CPCs per abortion facility was 3.2. The South andMidwest had the greatest numbers of CPCs. The number of CPCs per state ranged from three (Rhode Island) to 203 (Texas).Direct funding was associated with a greater number of CPCs in unadjusted (coefficient: 0.87, 95% CI 0.51-1.22) and adjusted(coefficient: 0.45, 95% CI 0.33-0.57) analyses. The number of CPCs was associated with the state legislation introduced in2018-2019 to ban all or most abortions in unadjusted (odds ratio [OR] 1.04, 95% CI 1.01-1.06) and adjusted analyses (OR 1.11,95% CI 1.04-1.19).
Conclusions: CPCs are located in every state and particularly prevalent in the South and Midwest. Distribution of CPCs in theUnited States is associated with state funding and extreme proposals to restrict abortion. Researchers should track CPCs overtime and examine factors that influence their operations and impact on public health and policy.
(JMIR Public Health Surveill 2020;6(1):e16726) doi:10.2196/16726
KEYWORDS
directory; crisis pregnancy center; abortion, induced; reproductive health; policy; access to information
JMIR Public Health Surveill 2020 | vol. 6 | iss. 1 | e16726 | p.45http://publichealth.jmir.org/2020/1/e16726/(page number not for citation purposes)
Swartzendruber & LambertJMIR PUBLIC HEALTH AND SURVEILLANCE
XSL•FORenderX

Introduction
BackgroundCrisis pregnancy centers (CPCs, also known as pregnancyresource centers and fake women’s health clinics) are nonprofitorganizations that primarily aim to dissuade people from seekingabortions [1,2]. Other aims include Christian evangelism andpromoting sexual abstinence before marriage and marriage [2,3].Most CPCs in the United States are affiliated with nationalorganizations, such as Care Net and Heartbeat International,that have policies against promoting contraception [4]. CPCshave been operating in the United States since the 1960s andhave traditionally provided pregnancy testing and counselingto influence individuals’ pregnancy decisions and discouragepeople from seeking abortion [5]. CPCs in the United Statesare increasingly becoming medicalized, offering limited medicalservices, such as limited obstetric ultrasounds to confirmpregnancy and testing for some sexually transmitted infections[6]. However, CPC services do not align with national qualityfamily planning service recommendations that define a core setof services to prevent missed opportunities for comprehensiveprevention and treatment [7]. CPCs also often fail to adhere tostandard ethical principles [5], such as respect and responsibility.For example, to attract individuals who may not otherwise seektheir services, CPCs frequently advertise themselves inmisleading ways [5-8]. For example, the centers often give theappearance that they offer services that they do not provide,such as abortion [5-8]. CPCs also frequently provide biased,misleading, and inaccurate health information in support of theirobjectives [1,4,6-11]. In particular, CPCs frequently providemisleading and inaccurate information about the risks ofabortion and misinformation about contraceptives and condomeffectiveness [1,4,6-11].
CPCs in the United States have increasingly gained governmentfunding and political clout [6,12]. CPCs have received federalgrants to support abstinence-only education in public schoolsfor decades [13,14]. An increasing number of states supportCPCs through the sale of Choose Life license plates and directlyfund the centers through dedicated grant programs [6,14]. TheTrump Administration appointed multiple CPC proponents toleadership positions. For example, the current Deputy AssistantSecretary for Population Affairs (DASPA) within theDepartment of Health and Human Services was formerlyPresident and Chief Executive Officer of a network of CPCs[12]. In 2018, the DASPA was provided final decision-makingauthority over which organizations receive Title X grantsintended to provide family planning and related preventiveservices to low-income or uninsured individuals [15]. In 2019,the Trump Administration announced changes to the Title Xprogram that made CPCs eligible for the federal grants, despitethe fact that CPCs do not provide contraception, and awardedfunding to a California-based CPC network [16]. CPCs werealso awarded federal grant funding through the Teen PregnancyPrevention Program in 2019.
In addition to government support and funding, CPCs in theUnited States have also won important legal protections. CPCsare not subject to the same regulatory requirements as health
facilities and are largely unregulated [5,14]. California was thefirst state to pass state-level legislation aimed at regulatingCPCs. The 2015 California Reproduction Freedom,Accountability, Comprehensive Care, and Transparency Actmandated that unlicensed CPCs disclose that the centers are nothealth facilities and licensed CPCs provide information aboutstate programs that provide abortion, prenatal, and familyplanning services at little or no cost to eligible individuals. In2018, although, in a 5-4 decision in the National Institute ofFamily and Life Advocates (NIFLA) versus Bacerra, the USSupreme Court ruled in favor of CPCs’First Amendment rightsand struck down the law [12].
To date, reported estimates of the total number of CPCs in theUnited States have widely varied. Antichoice groups’ estimateof 2500-4000 CPCs [6] has commonly been cited in scientificarticles published since the early 2000s. A 2017 study thatcompiled publicly accessible directories maintained by nationalumbrella organizations such as Care Net, BirthrightInternational, and NIFLA reported >4500 CPCs nationally [17].However, the investigators did not assess data quality or verifyinformation reported by the organizations. Other maps anddirectories of CPCs have also suffered from key limitations.For example, state-level directories, by definition, are limitedin scope. Furthermore, methods for producing these directoriesare not readily accessible leading to questions about rigor andcomparability. As previously mentioned, umbrella organizationsthat support CPCs maintain directories of affiliated centers, butnone is comprehensive of all CPCs currently operating in thecountry. Other national maps and directories of CPCs have beenproduced but are limited because they are known to beincomplete, their methods have not been reported, it is unclearif the data have been verified, they are not searchable, or theyare difficult to navigate. Despite increasing medicalization ofCPCs, to date, no comprehensive database has categorized orestimated the number of CPCs that provide information onlyor limited medical services in addition to information.
Given that CPCs often employ misleading and deceptiveadvertising tactics, some people may visit CPCs withmisconceptions about the centers’ mission and services [5].Evidence suggests that CPC services may pose risk to individualand public health by impacting decision making about healthbehaviors and health care seeking and through delayed care[18]; however, evidence about CPCs’ impact is limited.Furthermore, CPCs’ role in the landscape of sexual andreproductive health services and abortion policy is not wellunderstood. The number of facilities that provide abortion hasdeclined over the past decade [19]. To date, no studies havecompared the number of CPCs and facilities that provideabortion by state. Despite a rapidly changing policyenvironment, studies have not examined how governmentsponsorship influences the proliferation of CPCs or how CPCsmight influence abortion policies. In 2018 and the first half of2019, a record number of states introduced extreme legislationto ban all or most abortions [20-22]. As an active, grassrootspart of the pro-life movement, a greater number of CPCs maysignal a galvanized base of support for and potential legislativesuccess in limiting abortion access.
JMIR Public Health Surveill 2020 | vol. 6 | iss. 1 | e16726 | p.46http://publichealth.jmir.org/2020/1/e16726/(page number not for citation purposes)
Swartzendruber & LambertJMIR PUBLIC HEALTH AND SURVEILLANCE
XSL•FORenderX

ObjectivesWe created a CPC Map, a Web-based geolocated database ofall CPCs currently operating in the United States, with thefollowing goals: (1) helping individuals seeking health servicesknow which centers are CPCs and (2) facilitating academicresearch related to CPCs. Here, we describe the methods usedto create and maintain the database, key design features of thetool and related operating procedures, and baseline findingsregarding the number and distribution of CPCs in the UnitedStates. Specifically, we examined the number of CPCs nationallyand by state, subregion, and region and in relation to the numberof women of reproductive age and abortion facilities. We alsoinvestigated associations between direct state funding for CPCsand the number of CPCs per state and relationships betweenthe number of CPCs and legislation proposed in 2018 and fromJanuary through July 2019 to ban all or most abortions.
Methods
Data SourcesPotential CPCs were identified through multiple internetsearches conducted in March-May 2018, by trained researchassistants following a standard protocol. All searches wereconducted using Google search engine in incognito mode. First,we accessed five Web-based directories of CPCs to create anunduplicated list of CPCs by state: Care Net, HeartbeatInternational, NIFLA, Birthright International, and RamahInternational [23-27]. For each entry, we recorded the center’sname, address, county, telephone number, and proprietaryclient-facing (ie, targeted to potential clients) website. If nowebsite was provided, we searched for the site using thefollowing keywords: [name of center], [city], and [state]. Next,we conducted keyword searches by separately entering [state]with “pregnancy resource center,” “crisis pregnancy center,”“pregnancy care center,” and “pregnancy center.” We reviewedthe first five pages of results for each search (approximately 50links per keyword search) and added unique entries to the masterlist. Next, we identified and reviewed existing maps by state toidentify additional unique entries that were then added to themaster list. We entered [state], “crisis pregnancy centers,” and“map” and reviewed the first two pages of entries(approximately 20 links). We also reviewed an existingcrowd-sourced Web-based directory of CPCs by state and addedunique entries to the master list [28]. Finally, we searchedwebsites of listed entries for additional potential CPC addressesand added unique entries to the master list. Each search andentry were independently verified. For all entries, we recordedthe method(s) by which the center was identified.
EligibilityFrom May to August 2018, trained research assistants evaluatedeach entry for eligibility and confirmed the name of the centerand the center’s address. Centers were eligible for inclusion ifthey were determined to be (1) currently in business and (2) aCPC. Mobile clinics and maternity homes were excluded.
First, we examined if the recorded name of the center was theexact same as the name listed on the center’s website. If thecenter’s name was not exactly as it appeared on its website, we
corrected the center’s name on the master list to match the namethat appeared on the website. For centers with websites that didnot clearly list the centers’ names and for which no proprietarywebsite was identified, we called the centers to confirm theirnames using a standard script and protocol.
A center was categorized as currently in business if (1) itsaddress was listed on a live propriety domain or (2) a respondentconfirmed the center’s address during a telephone call to thecenter. Using a standard script and protocol, trained researchassistants called all centers with addresses not listed on aproprietary domain. Centers with disconnected or out of servicetelephone numbers and those that could not be reached withinfive call attempts were categorized as not currently in business.
A center was categorized as a CPC if it (1) was identifiedthrough one of the search strategies, (2) advertised freepregnancy tests or testing and counseling on a live proprietarydomain site or the center confirmed the availability of freepregnancy tests or testing during a telephone call to the center,(3) did not perform abortions or have obstetrics/gynecology inthe site name, and (4) was not a family planning clinic or aninformational directory that included local CPCs. Using astandard script and protocol, trained research assistants calledall centers with websites that did not explicitly advertise freepregnancy tests or testing and centers with no identifiedclient-facing proprietary website. Callers did not identifythemselves as research assistants or explain the nature of thecall.
Types of ServicesWe also identified whether each eligible CPC providedinformation or counseling only or limited medical services inaddition to information or counseling. CPCs that advertised freelimited ultrasound services (excluding referrals) on a proprietarydomain or confirmed the availability of free limited ultrasoundservices for any type or group of clients during a telephone callto the center were categorized as providing limited medicalservices. All other CPCs were categorized as providinginformation only.
Design Features and Operating ProtocolsThe CPC Map’s design features reflect our goals to aid peoplein determining which centers are CPCs and facilitate research.Intended users included individuals seeking health services,public health and medical professionals, social serviceorganizations, researchers, and decision makers. Key featuresinclude (1) accessibility and an open-source widget that allowsdistribution of the CPC Map on existing websites and apps, (2)faceted search, (3) geo-tracking to facilitate localized searchresults, (4) Google map and data visualization, (5) categorizationof CPCs that provide information only vs limited medicalservices, (6) enumeration of CPCs, (7) marker clustering, (8) awebform to provide updates about included CPCs, (9) awebform to suggest a CPC not already included, and (10) awebform to request access to the CPC Map data set. Below, wedescribe these features and related protocols in greater detail.
The CPC Map is a national directory of CPCs that is publiclyavailable [29]. The website, which is both desktop and mobileresponsive, was publicly released on September 10, 2018. In
JMIR Public Health Surveill 2020 | vol. 6 | iss. 1 | e16726 | p.47http://publichealth.jmir.org/2020/1/e16726/(page number not for citation purposes)
Swartzendruber & LambertJMIR PUBLIC HEALTH AND SURVEILLANCE
XSL•FORenderX

addition, an open-source iFrame available on the site allowsdistribution of and access to the directory through existingwebsites and mobile apps. The directory, whether accessedthrough the main CPC Map website or widget display, issearchable by state, city, and zip code. Users who search by cityor zip code are able to select radii of 5, 10, 25, 50, and 200miles. CPC results can be presented in both map and list views.The homepage displays the map view with markers indicatinglocations of CPCs and includes a scroll panel that lists CPCnames and addresses. Given the broadly recognized desire forand value of localized search results, the site includesgeo-tracking, which, if allowed by the user, presents CPCs onthe homepage at a resolution below city but above streets basedon the user’s internet protocol address. A separate, searchablelist view can be accessed via an icon on the homepage. Boththe list and map views allow users to select presentation of CPCsthat offer information only or limited medical services inaddition to information, or all CPCs. CPCs that offer informationonly are indicated via blue markers, and centers that offer limitedmedical services in addition to information are indicated viagreen markers. All search results include the total number ofcenters in the geographic area selected. To aid visualrepresentation of a large number of markers on the homepagemap, which presents all CPCs currently operating in the UnitedStates, the CPC Map utilizes marker clustering, a grid-basedclustering technique that groups CPCs within close proximityand displays the number of CPCs within each cluster. As theuser zooms out, the groups consolidate. As the user zooms in,individual centers are marked.
We intend to review and update the site annually. The CPCMap website also includes several webforms to facilitatemaintenance and accuracy of the directory over time. Throughwebforms, users may suggest centers that should be includedin the directory and submit changes to information (eg, nameand address changes and types of services offered) about listedcenters. Information provided via the webforms is sent to anemail address maintained by the research team. Upon receiptof information about additional centers that should be included,the research team verifies the suggested information anddetermines whether the center is eligible for inclusion using theprocess described above. Centers that meet existing eligibilitycriteria are then added to the directory by research teammembers who have rights-based permission to make changes.Similarly, upon receipt of suggested information changes forcenters already included in the directory, research team membersverify the submitted information and update the directory, asnecessary.
One of the goals underlying development of the CPC Map isto facilitate high-quality academic research related to CPCs.Users can request access to the database via a webform availableon the CPC Map website. Individuals requesting access to thedatabase are asked to provide their first and last name,organization, reason requesting access as specifically as possible,email address, and phone number. Requests are considered ona case-by-case basis. Access to the database is intended to beused for research and program planning purposes only. Forexample, researchers may use CPC Map data as a sampling
frame or use CPC Map data in analyses. Program planners mayuse the data to geographically target or inform their efforts.
Usability TestingBefore finalizing the website, five individuals including sexualand reproductive health researchers, a sexual and reproductivehealth policy expert, an organizer at a nonprofit women’sorganization, a public health student, and sexual andreproductive health care consumers conducted user testing.Testers were asked to attempt to complete six user tasks andreport back on their experiences and any problems in completingthe tasks. Feedback from the testers confirmed that the websiteand its functions were user-friendly and potential users wereenthusiastic about the usefulness of the directory. Feedback wasalso used to finalize the site. For example, based on testers’feedback, we added a link to the webform to suggest a centerto the Contact Us page and added tooltips that hover above themap and list view icons to explain their functions.
Data AnalysisWe conducted analyses to describe the number of centersidentified during data collection and final enumeration ofeligible CPCs and distribution of CPCs in the United States.We also conducted analyses to examine policy factors relatedto CPCs, website user data, and search engine visibility. First,we used summary statistics to enumerate centers identifiedduring collection and the number of CPCs currently operatingin the United States, in total and by types of services offered.We also used descriptive statistics to assess the distribution ofCPCs by region, subregion, and state. Next, we calculated theratio of women of reproductive age (ages 15-49 years) to CPCsand the ratio of CPCs to abortion facilities nationally and byregion, subregion, and state. Estimates of mid-year 2017populations were obtained from the US Census Bureau [30].The number of abortion facilities was obtained from a 2018study that conducted a systematic Web-based search of abortionfacilities in the United States [19].
Next, we examined policy factors related to the number of CPCsin each state and the District of Columbia. We examined theassociation between direct state funding for CPCs (yes/no) andthe number of CPCs, a count variable, using unadjusted andadjusted mixed effect negative binomial regression models witha random intercept for region and robust standard errors. Weused negative binomial regression models because analysesshowed that Poisson models were not a good fit. Adjustedmodels controlled for the number of women of reproductiveage and number of abortion facilities per state. Informationabout states that directly fund CPCs was obtained from a 2019report released by a national advocacy organization [31]. Statesthat directly funded CPCs (Florida, Georgia, Indiana, Kansas,Louisiana, Michigan, Minnesota, Missouri, New Mexico, NorthCarolina, North Dakota, Ohio, Oklahoma, Pennsylvania, Texas,and Wisconsin) were coded 1, and all others were coded 0.
We used unadjusted and adjusted logistic regression models toexamine associations between the number of CPCs and statelegislation to ban all or most abortions introduced in 2018 andfrom January through July 2019. Adjusted models controlledfor the number of women of reproductive age and number of
JMIR Public Health Surveill 2020 | vol. 6 | iss. 1 | e16726 | p.48http://publichealth.jmir.org/2020/1/e16726/(page number not for citation purposes)
Swartzendruber & LambertJMIR PUBLIC HEALTH AND SURVEILLANCE
XSL•FORenderX

abortion facilities per state. We separately assessed associationsbetween the number of CPCs and legislation to ban all or mostabortions introduced in 2018, 2019, and in either year(2018-2019). Information about states that introduced legislationto ban all or most abortions was obtained from the GuttmacherInstitute [20]. The following states introduced legislation to banall or most abortions in 2018: Colorado, Illinois, Iowa, Indiana,Kentucky, Minnesota, Mississippi, Missouri, New Hampshire,New York, Ohio, Oklahoma, Pennsylvania, South Carolina,and Tennessee. States that introduced legislation to ban all ormost abortions in 2019 included: Alabama, Arkansas, Georgia,Florida, Illinois, Indiana, Iowa, Kentucky, Louisiana, Maryland,Michigan, Minnesota, Mississippi, Missouri, New York, Ohio,Oklahoma, South Carolina, Tennessee, Texas, Washington, andWest Virginia. States that introduced legislation were coded as1; all others were coded as 0.
Finally, we used Google Analytics to describe the total numberof views and unique views of the CPC Map within the first 10months following release of the website. We also examined thenumber of domains that contained links to the CPC Map andthe number that embedded the CPC Map widget. In addition,we used SEMRush to analyze search engine results and catalogrelevant queries (keywords) with notable volume that droveorganic traffic to the site. We then identified and quantified thenumber of queries that ranked on Google’s first page.
Results
Enumerating Crisis Pregnancy CentersUsing the multiple data sources described above, 4379 CPCswere initially identified through the search procedures. Thecompiled list was then reviewed for duplicate entries. A totalof 14.20% (622/4379) of duplicate listings were identified,resulting in 3754 unique entries. These entries were then furtherreviewed for eligibility to determine if they were currently inbusiness, offered free pregnancy tests or testing, and were aCPC. Of the unique sites found through the search procedures,67.3% (2527/3754) were identified as eligible and operatingCPCs. Of these, 66.17% (1672/2527) offered limited medical
services in addition to pregnancy testing and counseling.Nationally, the ratio of women of reproductive age to CPCswas 29,304:1 per center. The number of CPCs per abortionfacility was 3.2 nationally.
Distribution of Crisis Pregnancy Centers in the UnitedStatesThe distribution of CPCs varied across region (Table 1). TheSouth had the greatest number of CPCs and the highestproportion of centers that offered limited medical services. TheNortheast had the fewest CPCs and lowest proportion thatoffered limited medical services. The Midwest had the lowestratio of women of reproductive age to centers, and the Westhad the highest. The Midwest had the highest ratio of CPCs toabortion facilities, and the Northeast had the lowest.
The distribution of CPCs also varied by state: Rhode Island,Delaware, and Hawaii were among the states with the fewestCPCs along with the District of Columbia. None of these wascategorized as directly funding CPCs. The five states with thegreatest number of CPCs included Texas, Florida, California,Pennsylvania, and Ohio. Of these, only California wascategorized as not directly funding CPCs.
States with the highest proportion of centers that providedlimited medical services included Rhode Island, Louisiana,Nevada, North Dakota, and Delaware. States with the lowestproportion included District of Columbia, Connecticut, NewYork, Vermont, and Maine. Wyoming, Montana, Iowa, SouthDakota, and Kansas had the lowest ratio of women ofreproductive age to CPCs, whereas New Mexico, District ofColumbia, Nevada, Rhode Island, and California had the highest.
In only two states, Massachusetts and New Jersey, and theDistrict of Columbia, the ratio of CPCs to abortion facilitieswas less than 1. There were approximately equal numbers ofCPCs and abortion facilities in California and Rhode Island. Inall other states, CPCs outnumbered abortion facilities. The ratiowas highest in Missouri, Kentucky, and Mississippi, each ofwhich had only a single abortion facility.
JMIR Public Health Surveill 2020 | vol. 6 | iss. 1 | e16726 | p.49http://publichealth.jmir.org/2020/1/e16726/(page number not for citation purposes)
Swartzendruber & LambertJMIR PUBLIC HEALTH AND SURVEILLANCE
XSL•FORenderX

Table 1. Number of crisis pregnancy centers in the United States, by region and state, in 2018.
Ratio of CPCs to abor-tion facilities
Population of women of reproductive age(ages 15-49 years) per CPC, n
CPCs that offer limitedmedical services, n (%)
CPCsa, nRegion and state
3.229,3041672 (66.17)2527United States
1.536,820168 (47.7)352Northeast
1.140,70640 (48)83New England
1.138,6137 (33)21Connecticut
0.625,4455 (46)11Maine
1.364,61111 (44)25Massachusetts
2.519,36011 (73)15New Hampshire
1.082,0943 (100)3Rhode Island
1.316,9853 (37)8Vermont
1.735,621128 (47.6)269Middle Atlantic
0.755,33022 (59)37New Jersey
1.244,02837 (34.6)107New York
7.422,59169 (55.2)125Pennsylvania
7.921,073474 (65.5)724Midwest
6.723,234321 (70.6)455East North Central
16.015,68873 (76)96Indiana
3.434,85959 (68)86Illinois
4.322,33964 (64)99Michigan
10.821,72485 (71.4)119Ohio
18.323,11040 (72)55Wisconsin
11.217,417153 (56.9)269West North Central
5.413,91128 (57)49Iowa
9.017,88017 (47)36Kansas
15.415,96939 (51)77Minnesota
69.019,76947 (68)69Missouri
6.721,03712 (60)20Nebraska
7.023,4466 (86)7North Dakota
11.016,4844 (36)11South Dakota
5.228,031745 (74.28)1003South
3.329,906361 (74.3)486South Atlantic
2.035,2985 (83)6Delaware
0.799,6430 (0)2District of Columbia
2.727,590132 (82.5)160Florida
5.327,54070 (78)90Georgia
1.929,46438 (79)48Maryland
5.528,25360 (72)83North Carolina
10.734,76318 (56)32South Carolina
3.438,60031 (60)51Virginia
14.027,8507 (50)14West Virginia
13.321,642142 (71.0)200East South Central
10.421,45239 (75)52Alabama
JMIR Public Health Surveill 2020 | vol. 6 | iss. 1 | e16726 | p.50http://publichealth.jmir.org/2020/1/e16726/(page number not for citation purposes)
Swartzendruber & LambertJMIR PUBLIC HEALTH AND SURVEILLANCE
XSL•FORenderX

Ratio of CPCs to abor-tion facilities
Population of women of reproductive age(ages 15-49 years) per CPC, n
CPCs that offer limitedmedical services, n (%)
CPCsa, nRegion and state
54.018,47734 (63)54Kentucky
29.023,92918 (62)29Mississippi
8.123,40351 (78)65Tennessee
10.229,188242 (76.3)317West South Central
12.318,09527 (73)37Arkansas
9.737,45225 (86)29Louisiana
12.018,32437 (77)48Oklahoma
9.732,597153 (75.4)203Texas
1.739,656285 (63.6)448West
3.627,370128 (65.3)196Mountain
6.628,78635 (66)53Arizona
2.822,00938 (66)58Colorado
4.819,27011 (58)19Idaho
3.612,01711 (61)18Montana
0.995,3756 (86)7Nevada
4.420,84913 (59)22New Mexico
3.5104,0294 (57)7Utah
6.010,44110 (83)12Wyoming
1.249,212157 (62.3)252Pacific
1.518,7905 (56)9Alaska
1.063,66593 (63.3)147California
2.051,8114 (67)6Hawaii
3.621,21426 (60)43Oregon
1.435,11729 (62)47Washington
aCPC: crisis pregnancy center.
Policy AnalysesWe found significant positive associations between directstate-level funding for CPCs and the number of centers in statesin both unadjusted (coefficient: 0.87, 95% CI 0.51-1.22; P<.001)and adjusted models (coefficient: 0.45, 95% CI 0.33-0.57;
P<.001). Table 2 presents associations between the number ofCPCs in each state and the District of Columbia and legislationto ban all or most abortions proposed in 2018 and through July2019. A greater number of CPCs was positively associated withlegislation to ban all or most abortions introduced in 2018, 2019,and 2018-2019 in both unadjusted and adjusted analyses.
Table 2. Associations between the number of crisis pregnancy centers in each state and the District of Columbia and legislation proposed in 2018 andJanuary-July 2019 to ban all or most abortions.
Adjusteda analysisUnadjusted analysisThe year in which legislation to ban all or most abortions was introduced
P valueOR (95% CI)P valueORb (95% CI)
.0051.08 (1.02-1.14).091.01 (1.00-1.03)2018
.011.06 (1.01-1.12).0041.03 (1.01-1.05)2019
.0021.11 (1.04-1.19).0021.04 (1.01-1.06)2018 or 2019
aAdjusted for the number of abortion facilities and women aged 15 to 49 years per state.bOR: odds ratio.
JMIR Public Health Surveill 2020 | vol. 6 | iss. 1 | e16726 | p.51http://publichealth.jmir.org/2020/1/e16726/(page number not for citation purposes)
Swartzendruber & LambertJMIR PUBLIC HEALTH AND SURVEILLANCE
XSL•FORenderX

Website AnalyticsWith no paid advertising, the CPC Map website received 9516unique views and 11,872 total views in the initial 10 monthsafter release, and views steadily increased over time. Duringthe same period, 177 domains contained links to the CPC Map,including major and regional news outlets. In July 2019, theCPC Map ranked for more than 3100 keywords, indicating avery high degree of relevant and valuable content. The CPCMap ranked for 13 terms with significant search volume onGoogle’s first search engine results page. For example, the siteranked sixth for crisis pregnancy center near me and crisispregnancy locations, seventh for what are CPCs, and eighthfor teen pregnancy center near me. Searches that include nearme indicate strong signals of user intent and suggest that theCPC Map is successfully reaching people seeking to identifylocal CPCs.
Discussion
Principal FindingsIndividuals facing or at risk for unintended pregnancy requirequality sexual and reproductive health information and services.CPCs frequently provide inaccurate health information and donot adhere to medical or ethical practice standards, which couldpose risk to individual and public health [18]. CPCs arebecoming more medicalized and increasingly gaininggovernment support. The purpose of the CPC Map is to identifythe number and locations of CPCs currently operating in theUnited States. We identified over 2500 CPCs currently operatingin the United States, about two-thirds of which offered limitedmedical services. However, the distribution of centers was notuniform by region or state.
The South and Midwest had the highest numbers of CPCs andlowest ratios of reproductive-aged women to CPCs. We foundthat state funding was positively associated with a greaternumber of CPCs per state. In total, 88% (14/16) of the statesthat directly fund CPCs were located in the South and Midwest.As this study is cross-sectional, temporality cannot beestablished. It is currently unknown whether state fundingattracts more centers or whether states with more centers aremore successful in attracting state funding. Over time, the CPCMap may be useful for longitudinally tracking how the numberof CPCs changes and the potential impact of state governmentsupport. That approximately one-third of states directly fundthe centers despite lack of evidence of public health benefit andpotential risks point to additional factors that may also influencethe numbers and locations of CPCs. Political climate andreligious context likely underlie whether states directly fundCPCs, the number of CPCs, and the ratio of CPCs to abortionfacilities in a state. Future studies that more fully explorestate-level factors related to the number of CPCs per state andchanges over time would be helpful to better understand contextsthat limit and facilitate CPC operations.
Nationally, there are over three times as many CPCs as abortionfacilities. In only four states and the District of Columbia, theratio of CPCs to abortion facilities was approximately 1 or less,suggesting that in most of the United States, people have betteraccess to CPCs than abortion care. Access to abortion is a
function of residence. The Midwest and South have the fewestabortion facilities [19] and greatest number of CPCs resultingin nearly eight times as many CPCs in the Midwest and overfive times as many in the South.
We also found that a greater number of CPCs was associatedwith state abortion bans introduced in 2018 and 2019. Anunprecedented wave of legislation restricting access to abortionhas been enacted since 2011 [21]. Following Supreme Courtchanges, 2019 marked a new level of proposed legislation toban abortion [22]. The current findings show that a greaternumber of CPCs predicted the most extreme legislationintroduced in 2019 that aimed to ban all or most abortions,including legislation to ban abortion completely and to banabortion after 6 to 8 weeks of gestation. CPCs are one facet ofa movement eager to make abortion unlawful nationally.Although this study was not able to thoroughly explore factorsassociated with where and what types of abortion bans wereintroduced, CPCs may represent a significant base of supportand mobilization for this type of legislation. What impact suchbans and other abortion restrictions, if enacted and implemented,would have on the number of CPCs in each state is unknown.If abortion was completely banned in only some states, CPCsmay strategically focus their efforts in states where abortionremained legal. Alternatively, CPCs may see their objectivesof promoting sexual abstinence before marriage and childbearingas unchanged or perhaps perceive an even greater need for theirpregnancy support services if abortion became illegal in somestates or nationally. The CPC Map is well suited to track thesepotential changes over time and to facilitate analyses related tohow state policy environments are influenced by and influenceCPCs.
Strengths and LimitationsThe CPC Map is subject to several limitations. Although ourteam followed standard protocols to create the tool, the CPCMap is dependent on the accuracy of publicly availableinformation about centers and their locations. Rigorous datacollection occurred in April-June 2018. Although we intend tomaintain the CPC Map over time, the tool is not updatedconstantly, and we cannot guarantee the completeness andaccuracy of the CPC Map, particularly as CPCs do changenames and locations and increasingly offer limited medicalservices. However, the CPC Map’s design facilitates a processfor obtaining and verifying updates submitted by users. Inaddition, the current analysis focused on between-statecomparisons. Investigating locations of CPCs within statesmight also be important for better understanding factors thatinfluence where CPCs operate, groups that might be mostimpacted by CPC services, and access to sexual and reproductivehealth services and information in different areas. For example,examining factors such as proximity to schools, racialcomposition of the population, rural and urban differences, andproximity to hospitals, abortion facilities, and other sources ofhealth care may provide further insights about where CPCslocate, contexts that facilitate and constrain CPC operations,and individuals and groups that might be most impacted by CPCservices. Finally, although our adjusted analyses controlled formultiple potential confounders, the findings may be limited by
JMIR Public Health Surveill 2020 | vol. 6 | iss. 1 | e16726 | p.52http://publichealth.jmir.org/2020/1/e16726/(page number not for citation purposes)
Swartzendruber & LambertJMIR PUBLIC HEALTH AND SURVEILLANCE
XSL•FORenderX

unidentified sources of confounding, which may have led toinflated or underestimated results.
ConclusionsIn an era of volatile policy dynamics and intense change relatedto sexual and reproductive health care access and rights, theCPC Map was designed to help raise awareness about CPCsand track the extent to which CPCs change in number, location,and types of services offered over time. The purpose of the CPCMap was to create an accessible, user-friendly Web-basedgeolocated database of all of the CPCs operating in the UnitedStates to help make sexual and reproductive health careconsumers aware of which centers are CPCs and to facilitateand grow the evidence base related to CPCs, particularly in aperiod when CPCs are benefitting from significant US
government support and funding. Direct, organic, and referraltraffic to the site incrementally increased since the release ofthe CPC Map despite no paid advertising, indicating increasingreach and potentially increased awareness about CPCs and theirlocations. This study revealed that CPCs are located in everystate and are particularly prevalent in the South and Midwest,which also have the fewest abortion facilities. Nationally, CPCsoutnumber abortion facilities by a factor of 3.2. We found thatstate funding for CPCs was positively associated with thenumber of CPCs, and a greater number of CPCs predictedintroduction of extreme state legislation restricting abortion.Given increasing government investment in CPCs, researchersshould continue to track CPCs and examine factors thatinfluence CPCs’ operations, strategies, and impact on publichealth and policy.
Conflicts of InterestNone declared.
References1. Rosen JD. The public health risks of crisis pregnancy centers. Perspect Sex Reprod Health 2012 Sep;44(3):201-205. [doi:
10.1363/4420112] [Medline: 22958665]2. Family Research Council. -. 2009. A Passion to Serve, A Vision for Life: Pregnancy Resource Center Service Report 2009
URL: http://downloads.frc.org/EF/EF09I51.pdf [accessed 2017-08-31]3. Kelly K. In the name of the mother: renegotiating conservative women’s authority in the crisis pregnancy center movement.
Signs 2012;38(1):203-230. [doi: 10.1086/665807]4. Swartzendruber A, Steiner RJ, Newton-Levinson A. Contraceptive information on pregnancy resource center websites: a
statewide content analysis. Contraception 2018 Apr 24. [doi: 10.1016/j.contraception.2018.04.002] [Medline: 29702081]5. Bryant AG, Swartz JJ. Why crisis pregnancy centers are legal but unethical. AMA J Ethics 2018 Mar 1;20(1):269-277
[FREE Full text] [doi: 10.1001/journalofethics.2018.20.3.pfor1-1803] [Medline: 29542437]6. Lin V, Dailard C. Crisis pregnancy centers seek to increase political clout, secure government subsidy. Guttmacher Rep
Public Policy 2002 Nov;5(2):4-6 [FREE Full text]7. Swartzendruber A, Newton-Levinson A, Feuchs AE, Phillips AL, Hickey J, Steiner RJ. Sexual and reproductive health
services and related health information on pregnancy resource center websites: a statewide content analysis. Womens HealthIssues 2018;28(1):14-20. [doi: 10.1016/j.whi.2017.10.007] [Medline: 29158038]
8. Bryant AG, Levi EE. Abortion misinformation from crisis pregnancy centers in North Carolina. Contraception 2012Dec;86(6):752-756. [doi: 10.1016/j.contraception.2012.06.001] [Medline: 22770790]
9. Bryant AG, Narasimhan S, Bryant-Comstock K, Levi EE. Crisis pregnancy center websites: information, misinformationand disinformation. Contraception 2014 Dec;90(6):601-605. [doi: 10.1016/j.contraception.2014.07.003] [Medline: 25091391]
10. Bryant-Comstock K, Bryant AG, Narasimhan S, Levi EE. Information about sexual health on crisis pregnancy center websites: accurate for adolescents? J Pediatr Adolesc Gynecol 2016 Feb;29(1):22-25. [doi: 10.1016/j.jpag.2015.05.008] [Medline:26493590]
11. Kelly K. The spread of 'Post Abortion Syndrome' as social diagnosis. Soc Sci Med 2014 Feb;102:18-25. [doi:10.1016/j.socscimed.2013.11.030] [Medline: 24565137]
12. Rubin R. At 'crisis pregnancy centers,' critics say, ideology trumps evidence. J Am Med Assoc 2018 Aug 7;320(5):425-427.[doi: 10.1001/jama.2018.8661] [Medline: 30027265]
13. Hartshorn MH. Foot Soldiers Armed with Love: Heartbeat International's First Forty Years. Virginia Beach: DonningCompany Publishers; 2011.
14. Ahmed A. Informed decision making and abortion: crisis pregnancy centers, informed consent, and the first amendment.J Law Med Ethics 2015;43(1):51-58. [doi: 10.1111/jlme.12195] [Medline: 25846038]
15. Department of Health and Human Services, Office of Population Affairs. The US Department of Health and Human Services.2018. Announcement of Anticipated Availability of Funds for Family Planning Services Grants URL: https://www.hhs.gov/opa/sites/default/files/FY-17-Title-X-FOA-New-Competitions.pdf [accessed 2019-09-09]
16. Department of Health and Human Services, Office of Population Affairs. The US Department of Health and Human Services.HHS Title X Family Planning Service Grants Award by State Fiscal Year 2019 Grantees URL: https://www.hhs.gov/opa/grants-and-funding/recent-grant-awards/index.html [accessed 2019-09-09]
JMIR Public Health Surveill 2020 | vol. 6 | iss. 1 | e16726 | p.53http://publichealth.jmir.org/2020/1/e16726/(page number not for citation purposes)
Swartzendruber & LambertJMIR PUBLIC HEALTH AND SURVEILLANCE
XSL•FORenderX

17. McVeigh R, Crubaugh B, Estep K. Plausibility structures, status threats, and the establishment of anti-abortion pregnancycenters. Am J Sociol 2017 Mar;122(5):1533-1571. [doi: 10.1086/691127]
18. Swartzendruber A, English A, Greenberg KB, Murray PJ, Freeman M, Upadhya K, et al. Crisis pregnancy centers in theUnited States: lack of adherence to medical and ethical practice standards; a joint position statement of The Society forAdolescent Health and Medicine and The North American Society for Pediatric and Adolescent Gynecology. J PediatrAdolesc Gynecol 2019 Dec;32(6):563-566. [doi: 10.1016/j.jpag.2019.10.008] [Medline: 31679958]
19. Cartwright AF, Karunaratne M, Barr-Walker J, Johns NE, Upadhyay UD. Identifying national availability of abortion careand distance from major US cities: systematic online search. J Med Internet Res 2018 May 14;20(5):e186 [FREE Full text][doi: 10.2196/jmir.9717] [Medline: 29759954]
20. Guttmacher Institute. 2019. State Policy Updates URL: https://www.guttmacher.org/state-policy/ [accessed 2019-07-05]21. Nash E. Guttmacher Institute. 2019. Unprecedented Wave of Abortion Bans is an Urgent Call to Action URL: https://www.
guttmacher.org/article/2019/05/unprecedented-wave-abortion-bans-urgent-call-action [accessed 2019-07-05]22. Nash EC, Campello O, Naide S, Mohammed L, Ansari-Thomas Z. Guttmacher Institute. 2019. Radical Attempts to Ban
Abortion Dominate State Policy Trends in the First Quarter of 2019 URL: https://www.guttmacher.org/article/2019/04/radical-attempts-ban-abortion-dominate-state-policy-trends-first-quarter-2019 [accessed 2019-09-09]
23. Free Resources - Care Net. 2018. Find a Pregnancy Center URL: http://www.care-net.org/find-a-pregnancy-center [accessed2018-03-02]
24. Heartbeat International. 2018. Worldwide Directory URL: https://www.heartbeatinternational.org/worldwide-directory[accessed 2018-03-02]
25. NIFLA | National Institute of Family and Life Advocates. 2018. URL: http://www.nifla.org/ [accessed 2018-03-02]26. Ramah International. Help in your area. 2018. URL: https://ramahinternational.org/help-in-your-area/georgia [accessed
2018-03-02]27. Birthright International. 2018. URL: https://birthright.org/ [accessed 2018-03-02]28. Expose Fake Clinics. 2018. URL: https://www.exposefakeclinics.com/ [accessed 2018-03-02]29. Crisis Pregnancy Center Map & Finder - CPC Map. 2018. URL: https://crisispregnancycentermap.com/ [accessed 2020-01-23]30. United States Census Bureau Population Division. American FactFinder - Census Bureau. 2017. URL: https://factfinder.
census.gov/faces/tableservices/jsf/pages/productview.xhtml?pid=ACS_17_5YR_B01001&prodType=table [accessed2018-12-26]
31. NARAL Pro-Choice America. 2019. Who Decides? The Status of Women's Reproductive Rights in the United States URL:https://www.prochoiceamerica.org/wp-content/uploads/2019/02/WhoDecides2019-DigitalEdition.pdf [accessed 2019-04-21]
AbbreviationsCPC: crisis pregnancy centerDASPA: Deputy Assistant Secretary for Population AffairsNIFLA: National Institute of Family and Life AdvocatesOR: odds ratio
Edited by G Eysenbach; submitted 17.10.19; peer-reviewed by A Smith, U Upadhyay; comments to author 10.12.19; revised versionreceived 20.12.19; accepted 21.12.19; published 27.03.20.
Please cite as:Swartzendruber A, Lambert DNA Web-Based Geolocated Directory of Crisis Pregnancy Centers (CPCs) in the United States: Description of CPC Map Methods andDesign Features and Analysis of Baseline DataJMIR Public Health Surveill 2020;6(1):e16726URL: http://publichealth.jmir.org/2020/1/e16726/ doi:10.2196/16726PMID:32217502
©Andrea Swartzendruber, Danielle N Lambert. Originally published in JMIR Public Health and Surveillance(http://publichealth.jmir.org), 27.03.2020. This is an open-access article distributed under the terms of the Creative CommonsAttribution License (https://creativecommons.org/licenses/by/4.0/), which permits unrestricted use, distribution, and reproductionin any medium, provided the original work, first published in JMIR Public Health and Surveillance, is properly cited. The completebibliographic information, a link to the original publication on http://publichealth.jmir.org, as well as this copyright and licenseinformation must be included.
JMIR Public Health Surveill 2020 | vol. 6 | iss. 1 | e16726 | p.54http://publichealth.jmir.org/2020/1/e16726/(page number not for citation purposes)
Swartzendruber & LambertJMIR PUBLIC HEALTH AND SURVEILLANCE
XSL•FORenderX

Original Paper
Predictors of User Engagement With Facebook Posts Generatedby a National Sample of Lesbian, Gay, Bisexual, Transgender,and Queer Community Centers in the United States: ContentAnalysis
William C Goedel1, BA; Harry Jin1, MPH; Cassandra Sutten Coats2, MSc; Adedotun Ogunbajo2, MPH, MHS; Arjee
J Restar2, MPH1Department of Epidemiology, School of Public Health, Brown University, Providence, RI, United States2Department of Behavioral and Social Sciences, School of Public Health, Brown University, Providence, RI, United States
Corresponding Author:William C Goedel, BADepartment of EpidemiologySchool of Public HealthBrown University121 South Main StreetBox G-S121-3Providence, RI, 02906United StatesPhone: 1 4018633713Email: [email protected]
Abstract
Background: Lesbian, gay, bisexual, transgender, and queer (LGBTQ) community centers remain important venues for reachingand providing crucial health and social services to LGBTQ individuals in the United States. These organizations commonly useFacebook to reach their target audiences, but little is known about factors associated with user engagement with their social mediapresence.
Objective: This study aimed to identify factors associated with engagement with Facebook content generated by LGBTQcommunity centers in the United States.
Methods: Content generated by LGBTQ community centers in 2017 was downloaded using Facebook’s application programminginterface. Posts were classified by their content and sentiment. Correlates of user engagement were identified using negativebinomial regression.
Results: A total of 32,014 posts from 175 community centers were collected. Posts with photos (incidence rate ratio, [IRR]1.07; 95% CI 1.06-1.09) and videos (IRR 1.54; 95% CI 1.52-1.56) that contained a direct invitation for engagement (IRR 1.03;95% CI 1.02-1.04), that expressed a positive sentiment (IRR 1.11; 95% CI 1.10-1.12), and that contained content related to stigma(IRR 1.16; 95% CI 1.14-1.17), mental health (IRR 1.33; 95% CI 1.31-1.35), and politics (IRR 1.28; 95% CI 1.27-1.29) receivedhigher levels of engagement.
Conclusions: The results of this study provide support for the use of Facebook to extend the reach of LGBTQ communitycenters and highlight multiple factors that can be leveraged to optimize engagement.
(JMIR Public Health Surveill 2020;6(1):e16382) doi:10.2196/16382
KEYWORDS
health communication; social media; sexual and gender minorities; community networks
JMIR Public Health Surveill 2020 | vol. 6 | iss. 1 | e16382 | p.55https://publichealth.jmir.org/2020/1/e16382(page number not for citation purposes)
Goedel et alJMIR PUBLIC HEALTH AND SURVEILLANCE
XSL•FORenderX

Introduction
Lesbian, gay, bisexual, transgender, and queer (LGBTQ)individuals in the United States experience significant disparitiesin physical and mental health and in access to health care relativeto their cisgender and heterosexual counterparts [1].Communication plays an important role in eliminating healthdisparities [2], but health promotion messages are only effectiveif they reach and resonate with their target audiences. It hasbeen argued that many communication campaigns createmessages that employ the surface structure approach to reachtheir target audience’s culture by matching messages andchannels to observable social and behavioral characteristics oftheir target audience’s members (eg, through the use of familiarpeople, music, and language) [2]. Effective messaging will alsoresonate with the historical, social, psychological, andenvironmental factors that affect the health and well-being ofan audience (known as its culture’s “deep structure”) [2]. Thisentails knowing the kinds of framings (eg, positive vs negativeframing [3], gain vs loss framing [4], and 1- vs 2-sided framing[5]), the contents (eg, mental health and sexual healthpromotion), format (eg, photo and video), frequency or duration,and the context (eg, social or political issues) of the messagesthat work best to engage individuals with the recommendedhealth behavior [6]. Organizations, particularly those who maynot have the capacity for public health programming, may createhealth communication materials for LGBTQ communities thatmay not be attuned to their health, information, andcommunication needs. As such, these organizations may lackan understanding about which channels, contents, and contextsof communication effectively reach their audiences [7], leadingto ineffective messaging that does little to improve the healthof LGBTQ individuals.
As affirmative and inclusive health services for LGBTQindividuals are lacking in many locations [8], particularly inrural areas [9], LGBTQ community centers remain importantvenues for reaching and providing crucial health and socialservices to LGBTQ individuals [10]. LGBTQ communitycenters are diverse in terms of their mission and structure, andmany are independent nonprofit organizations that aim toprovide educational, social, and health programming for theirclients [10]. Most LGBTQ community centers are physicalvenues, but regardless of their physical presence, theseorganizations rely heavily on social media and other digitalplatforms to reach their clients [10]. Social media represents acommon form of digital networking that LGBTQ individualsengage with frequently. In a national probability sample, lesbian,gay, and bisexual adults in the United States were more likelyto have a profile on Facebook and use Facebook on a daily basiscompared with their heterosexual peers [11]. A significant bodyof research has shown that LGBTQ individuals use social mediasites for many of the same purposes one may access acommunity center in person, including providing spaces toexplore identity, form communities with their peers, accessaffirming health resources, and engage in political causes[12-15].
The effective use of social media has become a key priority inpublic health, particularly in reaching populations (eg, LGBTQ
communities) that have been overlooked by conventionalnon-Web-based public health campaigns [16]. Although the useof social media by community centers and community-basedorganizations (CBOs) is common, the ability of these messagesto reach their intended audience and encourage user engagementis varying [17]. Increasing user engagement has become aprimary objective of many social media campaigns, but fewstudies have sought to identify predictors of user engagement[18,19]. A recent study found that social media profiles focusedon sexual health promotion that posted often, engaged withindividual users, that encouraged interaction and conversationby posing questions, and that shared multimedia content hadhigher levels of engagement [18]. In general, the reach of socialmedia posts depends on the ability of content to engage andresonate with users. However, because the content produced byLGBTQ community centers may address sensitive,identity-specific topics, the ability of this content to reach itsaudience could be further constrained by users’ willingness todisclose their identities by publicly engaging with this content[20-22]. As such, we aimed to understand the predictors of userengagement with Facebook content generated by LGBTQcommunity centers in the United States.
Methods
Data were collected from Facebook pages administered by 175LGBTQ community centers in the United States. Facebookpages were purposively selected based on their inclusion in anational directory of LGBTQ community centers maintainedby CenterLink, a member-based coalition of LGBTQ communitycenters formed with the goal of improving the organizationaland service delivery capacities of these centers [23].
On the basis of methods used in prior studies [19], data (eg,posts and metrics of engagement with these posts) weredownloaded using Facebook’s public application programminginterface (API) accessed through the Netvizz application [24].Posts made in 2017 (January 1 to December 31) were collectedand organized by page and post. At the page level, we identifiedthe number of followers for each page. At the post level, weidentified the number of likes, reactions, comments, and shareson each post. The study was considered not to be human subjectsresearch and was deemed exempt from institutional reviewboard review. As an extra precaution on behalf of the users whomay have interacted with these posts, the names of the Facebookpages included in this study have been omitted. LGBTQcommunity centers included in the sample were located in 45of 50 states as well as the District of Columbia.
The content of each post was then analyzed usinginformatics-based methods [25]. First, usingresearcher-generated search terms, we identified posts basedon 6 topics (with example keywords for each topic inparentheses), related to the missions of LGBTQ communitycenters, including posts related to stigma experienced byLGBTQ communities eg, stigma, discrimination, and banned),mental health concerns and services (eg, anxious, depressed,counseling, and therapy), education and skill-building (eg, learn,training, and information), youth development (eg, youths,children, and kids), social programming (eg, support, friend,
JMIR Public Health Surveill 2020 | vol. 6 | iss. 1 | e16382 | p.56https://publichealth.jmir.org/2020/1/e16382(page number not for citation purposes)
Goedel et alJMIR PUBLIC HEALTH AND SURVEILLANCE
XSL•FORenderX

event, and community), and political engagement (eg, vote,election, government, and law). In addition, we identified postswith LGBTQ identity terms (eg, lesbian, transgender, nonbinary,and nonconforming) and posts with explicit invitations forengagement (eg, comment, like, share, visit, click, and take).Posts were able to be identified as belonging to multiplecategories.
Each sentence of each post was scored using the Bing Liusentiment lexicon [26]. This sentiment lexicon is widely usedin sentiment analysis and opinion mining and was selectedbecause it provides a freely accessible word database that assignspositive and negative values to keywords. After each wordwithin each sentence of a post was scored, an average sentimentscore was assigned to each post indicating whether the post hadan overall negative or positive affect. A score of 0 wouldrepresent a post with neutral affect, whereas a positive scorerepresents a post with a positive affect, and a negative scorerepresents a post with a negative affect.
Hierarchical negative binomial regression was used to identifypost characteristics associated with greater user engagement.In this analysis, the engagement score generated by Facebookwas used as an outcome as this is likely an important variablein their algorithm that determines which posts are made visiblemost frequently. According to the Facebook API, this score isthe combined total number of reactions, shares, and commentson each post. Hierarchical negative binomial regressionmodeling was selected as the statistical approach for this study
because the Facebook engagement count data wereoverdispersed, highly skewed toward 0 and 1, and came from175 separate Facebook pages—each with a varying number ofFacebook “fans” and with differing rates of activity. Incidencerate ratios (IRRs) were calculated based on these analyses.
Results
During the study period, 32,014 posts were shared by 175 pages.Overall, each page contributed a median of 151 unique posts(IQR 78-264) and had a median of 3347 fans (IQR 1886-5746).These posts received a combined total of 546,492 likes and32,353 comments and were shared 108,204 times.
Table 1 provides an overview of the posts analyzed. A varietyof post types were utilized, with the majority of posts beingphotos (48.39%, 15,493/32,014) or links (38.26%,12,250/32,014). Most posts (65.10%, 20,842/32,014) could beclassified as containing content related to one of the 7 searchedtopics (stigma, mental health, education, youth, identity, social,and politics), with identity-related content (42.73%;13,680/32,014) and content related to social events andsocializing (37.01%; 11,850/32,014) being the most common.Example posts from each content area are displayed in Table2. A total of 1 in 10 posts (11.10%; n=3556/32,014) containeda direct invitation for engagement. Among all posts, the mediansentiment score for these posts was 0.2 (IQR 0.1-0.4). Each postreceived a median of 4 likes (IQR 1-11) and 0 comments (IQR0-0) and was shared 0 times (IQR 0-2).
JMIR Public Health Surveill 2020 | vol. 6 | iss. 1 | e16382 | p.57https://publichealth.jmir.org/2020/1/e16382(page number not for citation purposes)
Goedel et alJMIR PUBLIC HEALTH AND SURVEILLANCE
XSL•FORenderX

Table 1. Characteristics of Facebook posts by lesbian, gay, bisexual, transgender, and queer community centers, 2017 (n=32,014).
ValuePost characteristics
Post type, n (%)
12,250 (38.26)Link
15,493 (48.39)Photo
2399 (7.49)Status
1872 (5.84)Video
Post date (day of week), n (%)
26,331 (82.24)Weekday (Monday-Friday)
5683 (17.70)Weekend (Saturday, Sunday)
Post content type, n (%)
700 (2.18)Stigma
857 (2.66)Mental health
3450 (10.77)Education
4237 (13.23)Youth
11,850 (37.01)Social
1445 (4.51)Politics
13,680 (42.73)Mentions an identity term, n (%)
3556 (11.10)Direct invitations for engagement, n (%)
0.2 (0.1-0.4)Sentiment score, median (IQR)
Post engagement, median (IQR)
4.0 (1.0-11.0)Likes
5.0 (2.0-14.0)Reactions
0.0 (0.0-0.0)Comments
0.0 (0.0-2.0)Shares
6.0 (2.0-17.00)Engagement score
JMIR Public Health Surveill 2020 | vol. 6 | iss. 1 | e16382 | p.58https://publichealth.jmir.org/2020/1/e16382(page number not for citation purposes)
Goedel et alJMIR PUBLIC HEALTH AND SURVEILLANCE
XSL•FORenderX

Table 2. Examples of Facebook posts by lesbian, gay, bisexual, transgender, and queer community centers classified by content type.
Example postContent type
“The [blinded local legislature] passed [blinded] earlier this week. This discriminatory legislation seeks to give taxpayer-fundedagencies a license to discriminate against LGBTQ people under the guise of religion, the dangerous anti-LGBTQ proposal will nowmove to the [blinded] senate for consideration.” (A link that received 7 likes, 5 comments, and 391 shares)
Stigma
“Meet our mental health team. With their compassion and expertise, this amazing group is the lifeline to many in our community. Thisteam works tirelessly to assure that each person seeking our services gets the support resources and care they need and, when needed,this team goes above and beyond their daily work providing support and guidance for the staff and volunteers at [blinded]. Our mentalhealth programs include couples and family therapy; suicide prevention; support groups for youth, trans men and women. We couldnot provide this team or our services without the help of our generous donors. Help us maintain our team and services. Help us keepthis essential lifeline open. Click on the link below to give today!” (A photo that received 491 likes, 19 comments, and 8 shares)
Mentalhealth
“Did you see us last night on [blinded]? They visited us to learn more about the expansion of our [blinded] program for trans andgender non-conforming youth that takes place every Tuesday and Thursday!” (A video that received 98 likes, 10 comments, and 44shares)
Education
“[Blinded] is a statewide summit for LGBTQ+ youth! We anticipate over 750+ youth will attend. All LGBTQ+ youth ages 14-18 arewelcome. Affirming friends are also welcome. Pre-register for shorter lines the day of. This is a summit where all of [blinded]’s youthand their affirming friends ages 14-18 can gather together to build community and foster creativity and ignite their excitement for thefuture. Affirming parents, counselors, and school administrators are welcome to attend and will have breakout sessions including aQ&A with executive director [blinded].” (A video that received 183 likes, 18 comments, and 71 shares)
Youth
“[Blinded] Pride Week is just around the corner and we are excited to announce 2017’s official theme: Connect. In times of uncertainty,building connections is as vital as it is difficult. This Pride Week, we encourage you to keep celebrating being LGBTQ and take timeto reflect and plan and connect. Continue following us on social media for event updates. Learn more and register and volunteer.” (Alink that received 274 likes, 31 comments, and 100 shares)
Social
“Click ‘Like’ to thank [blinded] City Council for advancing our proposal to ban conversion therapy! The final vote is next Wednesdayat 7pm.” (A link that received 368 likes, 2 comments, and 51 shares)
Political
Table 3 presents the unadjusted and adjusted associations ofpost type, date, content, and sentiment with the Facebook’s userengagement score. Posts containing photos (IRR 1.07; 95% CI1.06-1.09), links (IRR 1.23; 95% CI 1.21-1.24), and videos(IRR 1.54; 95% CI 1.52-1.56) received higher levels ofengagement compared with posts containing status updatesonly. Posts on weekends also received higher engagement (IRR
1.07; 95% CI 1.06-1.08) compared with posts on weekdays. Atotal of 6 of 7 content classifications and direct invitations forengagement were associated with increased engagement, withonly educational content receiving less engagement (IRR 0.81;95% CI 0.80-0.81). In addition, positive sentiment wasassociated with increased engagement (IRR 1.11; 95% CI1.10-1.12).
JMIR Public Health Surveill 2020 | vol. 6 | iss. 1 | e16382 | p.59https://publichealth.jmir.org/2020/1/e16382(page number not for citation purposes)
Goedel et alJMIR PUBLIC HEALTH AND SURVEILLANCE
XSL•FORenderX

Table 3. Associations of post characteristics with user engagement with Facebook posts by lesbian, gay, bisexual, transgender, and queer communitycenters in the United States, 2017.
Engagement score, IRRa (95% CI)Post characteristics
Post type
ReferenceStatus
1.23 (1.21-1.24)Link
1.07 (1.06-1.09)Photo
1.54 (1.52-1.56)Video
Post date (day of week)
ReferenceWeekday (Monday through Friday)
1.07 (1.06-1.08)Weekend (Saturday and Sunday)
Post content type
1.16 (1.14-1.17)Stigma
1.33 (1.31-1.35)Mental health
0.81 (0.80-0.81)Education
1.13 (1.13-1.14)Youth
1.03 (1.02-1.04)Social
1.28 (1.27-1.29)Politics
1.10 (1.10-1.11)Mentions an identity term
1.03 (1.02-1.04)Direct invitations for engagement
1.11 (1.10-1.12)Sentiment score
aIRR: incidence rate ratio.
In sensitivity analyses (Table 4), we assessed the associationof the post characteristics with specific types of user engagement(likes, comments, and shares). Several differences from themain analyses were found. Posts containing links (IRR 0.59;95% CI 0.56-0.61) and photos (IRR 0.56; 95% CI 0.53-0.58)received fewer comments than posts containing status updatesonly. Posts with content regarding mental health (IRR 0.86;95% CI 0.80-0.92), education (IRR 0.86; 95% CI 0.83-0.89),and posts with more positive sentiment (IRR 0.70; 95% CI
0.67-0.74) also received fewer comments. Third, postscontaining photos (IRR 0.88; 95% CI 0.86-0.91) were sharedfewer times than posts containing status updates only. Posts onweekends (IRR 0.96; 95% CI 0.94-0.97) and posts with morepositive sentiment (IRR 0.65; 95% CI 0.63-0.67) were alsoshared less often. Posts with educational content received fewerlikes and comments but were shared more (IRR 1.13; 95% CI1.11-1.16).
JMIR Public Health Surveill 2020 | vol. 6 | iss. 1 | e16382 | p.60https://publichealth.jmir.org/2020/1/e16382(page number not for citation purposes)
Goedel et alJMIR PUBLIC HEALTH AND SURVEILLANCE
XSL•FORenderX

Table 4. Associations of post characteristics with specific types of user engagement with Facebook posts (likes, comments, and shares) by lesbian,gay, bisexual, transgender, and queer community centers in the United States, 2017.
Shares, IRR (95% CI)Comments, IRR (95% CI)Likes, IRRa (95% CI)Post characteristics
Post type
ReferenceReferenceReferenceStatus
1.16 (1.13-1.20)0.59 (0.56-0.61)1.34 (1.32-1.36)Link
0.88 (0.86-0.91)0.56 (0.53-0.58)1.31 (1.29-1.33)Photo
1.11 (1.07-1.15)1.30 (1.23-1.37)1.65 (1.62-1.68)Video
Post date (day of week)
ReferenceReferenceReferenceWeekday (Monday through Friday)
0.96 (0.94-0.97)1.01 (0.98-1.05)1.10 (1.09-1.11)Weekend (Saturday and Sunday)
Post content type
1.26 (1.22-1.30)1.16 (1.09-1.24)1.13 (1.11-1.16)Stigma
1.73 (1.68-1.79)0.86 (0.80-0.92)1.32 (1.30-1.35)Mental health
1.03 (1.01-1.05)0.86 (0.83-0.89)0.73 (0.73-0.74)Education
1.13 (1.11-1.16)1.18 (1.14-1.22)1.13 (1.12-1.14)Youth
1.15 (1.13-1.17)1.32 (1.29-1.36)0.97 (0.96-0.98)Social
1.41 (1.38-1.44)1.55 (1.48-1.62)1.19 (1.17-1.20)Politics
1.11 (1.09-1.12)1.10 (1.07-1.12)1.10 (1.10-1.11)Mentions an identity term
1.59 (1.56-1.62)1.25 (1.21-1.30)0.92 (0.91-0.93)Direct invitations for engagement
0.65 (0.63-0.67)0.70 (0.67-0.74)1.68 (1.66-1.71)Sentiment score
aIRR: incidence rate ratio.
Discussion
The study collected post data from 175 Facebook pagesassociated with LGBTQ community centers across the UnitedStates. In total, these pages had approximately 1.1 million fansand shared over 30,000 posts in the span of a year, receivingnearly 700,000 engagements.
We identified a number of factors associated with increaseduser engagement, and these findings offer practicalrecommendations as to how LGBTQ community centers caneffectively use Facebook to increase the reach of their messages.First, we found that including multimedia content (eg, photos,videos, and links) was associated with higher user engagementcompared with text-only status updates. This finding isconsistent with a previous study identifying correlates of userengagement with health-related Facebook posts from CBOsserving gay and bisexual men in British Columbia [19] and withthe media richness theory [27], which suggests that media thatis able to handle multiple information cues simultaneously,facilitates rapid feedback, and establishes a personal focus willbe more effective in communicating its message to its audience.Second, in contrast to this previous research in British Columbia[19], we found that direct invitations for engagement (ie, directlyasking users to comment, like, or share a post) were associatedwith increased user engagement.
The content of posts was also significantly associated with userengagement, where posts related to stigma, mental health, andpolitics received higher levels of engagement. In line with
previous research, these topics represent the “deep structure”of the culture of LGBTQ communities and may, therefore, bemost salient to the target audience [2]. We note significanttemporal variation in the frequency at which key themes wereincluded in posts. For example, a spike in the daily number ofstigma-related posts was observed with the announcement ofan executive order banning transgender individuals from militaryservice [28], whereas a spike in the daily number of mentalhealth-related posts was observed with the signing of thisexecutive order [28] (Multimedia Appendix 1). Although weare unable to connect these types of events to increases in userengagement with such posts, the presence of such spikes incontent production highlights the responsiveness of LGBTQcommunity centers in their Web presence to events affectingthe well-being of their clients.
These findings should be considered in light of their limitations.First, Facebook pages were selected based on their inclusion ina nationwide member-based directory of LGBTQ communitycenters in the United States and, therefore, these findings maynot be generalizable to LGBTQ community centers in the UnitedStates who are not part of this directory and LGBTQ communitycenters outside of the United States. Second, the keyword-basedmethod for classifying the content of posts render the resultssubject to measurement error, as the selection of key terms maylimit the accuracy of content classification. Future researchshould use more advanced approaches to classify the contentof posts, including topic modeling, a statistical technique aimedat discovering latent semantic structures within extensive bodiesof text. Third, although we identified correlates of engagement
JMIR Public Health Surveill 2020 | vol. 6 | iss. 1 | e16382 | p.61https://publichealth.jmir.org/2020/1/e16382(page number not for citation purposes)
Goedel et alJMIR PUBLIC HEALTH AND SURVEILLANCE
XSL•FORenderX

(including specific types of engagement), further research isneeded to better understand how each type of engagementpromotes the diffusion of health- and nonhealth-relatedFacebook content within Web-based LGBTQ communities.Fourth, these analyses do not consider user-specific factors thatmay be associated with engagement (eg, number of Facebookfriends who also “like” a page for an LGBTQ community center,whether an individual chooses to disclose their sexual orientationor gender identity in Web-based spaces). Furthermore, researchshould study post engagement at the individual level to betterunderstand what types of digital content resonate better withtheir target audiences. Fifth, because the posts were sampledfrom Facebook, these correlates of user engagement cannot beextended to other social media platforms (eg, Twitter andInstagram) as these platforms have different processes for postcontent and engagement. Finally, Facebook uses an algorithm
to show a user posts that they are likely to interact with. Giventhe proprietary nature of this algorithm, we are unable to controlfor how likely a post was to be seen by a given user and notethat users are only able to engage with posts that are shown tothem. As such, our analyses are restricted to identifyingcorrelates of user engagement conditional on a post being seenby a given set of users.
These results provide support for the use of Facebook byLGBTQ community centers to extend their reach beyond thefalls of physical venues and reach their target audiences andhighlight multiple factors that can be leveraged to optimize userengagement and enhance the diffusion of information generatedby these crucial community institutions. Furthermore, there ispotential for public health as a field to engage with theseorganizations to further build capacity in using evidence-basedcommunication strategies.
AcknowledgmentsThe authors are supported by research education programs funded by the National Institutes of Health, including the NationalInstitute of Mental Health (R25MH08360, awarded to Amy S Nunn, ScD, and Timothy P Flanigan, MD) and the National Instituteof General Medical Sciences (R25GM083270, awarded to Andrew G Campbell, PhD, and Elizabeth O Harrington, PhD).
Conflicts of InterestNone declared.
Multimedia Appendix 1Daily time-series of the number of Facebook posts containing content related to stigma and mental health by LGBTQ communitycenters in the United States.[PNG File , 1453 KB - publichealth_v6i1e16382_app1.png ]
References1. Institute of Medicine, Board on the Health of Select Populations, Committee on Lesbian Gay Bisexual and Transgender
Health Issues and Research Gaps and Opportunities. The Health of Lesbian, Gay, Bisexual, and Transgender People:Building a Foundation for Better Understanding. District of Columbia: National Academies Press; 2011.
2. Freimuth VS, Quinn SC. The contributions of health communication to eliminating health disparities. Am J Public Health2004 Dec;94(12):2053-2055. [doi: 10.2105/ajph.94.12.2053] [Medline: 15569949]
3. Parvanta C, Nelson D, Parvanta S, Harner R. Essentials of Public Health Communication. Burlington, Massachusetts: Jones& Bartlett Learning; 2011.
4. Rothman A, Bartels R, Wlaschin J, Salovey P. The strategic use of gain‐ and loss‐framed messages to promote healthybehavior: how theory can inform practice. J Commun 2006;56(S1):S202-S220 [FREE Full text] [doi:10.1111/j.1460-2466.2006.00290.x]
5. Rucker DD, Petty RE, Briñol P. What's in a frame anyway?: A meta-cognitive analysis of the impact of one versus twosided message framing on attitude certainty. J Consumer Psychol 2008;18(2):137-149. [doi: 10.1016/j.jcps.2008.01.008]
6. Edgar T, Volkman JE. Using communication theory for health promotion: practical guidance on message design andstrategy. Health Promot Pract 2012 Sep;13(5):587-590. [doi: 10.1177/1524839912450879] [Medline: 22923771]
7. Park H, Rodgers S, McElroy JA, Everett K. Sexual and gender minority's social media user characteristics: examiningpreferred health information. Health Mark Q 2018;35(1):1-17. [doi: 10.1080/07359683.2017.1310553] [Medline: 28467288]
8. Bonvicini KA. LGBT healthcare disparities: what progress have we made? Patient Educ Couns 2017 Dec;100(12):2357-2361.[doi: 10.1016/j.pec.2017.06.003] [Medline: 28623053]
9. Whitehead J, Shaver J, Stephenson R. Outness, stigma, and primary health care utilization among rural LGBT populations.PLoS One 2016;11(1):e0146139 [FREE Full text] [doi: 10.1371/journal.pone.0146139] [Medline: 26731405]
10. Movement Advancement Project. Boulder, Colorado: Movement Advancement Project; 2017. 2016 LGBT CommunityCenter Survey Report: Assessing the Capacity and Programs of Lesbian, Gay, Bisexual, and Transgender CommunityCenters. URL: https://www.lgbtmap.org/file/2016-lgbt-community-center-survey-report.pdf [accessed 2019-11-28]
JMIR Public Health Surveill 2020 | vol. 6 | iss. 1 | e16382 | p.62https://publichealth.jmir.org/2020/1/e16382(page number not for citation purposes)
Goedel et alJMIR PUBLIC HEALTH AND SURVEILLANCE
XSL•FORenderX

11. Seidenberg A, Jo C, Ribisl K, Lee J, Buchting F, Kim Y, et al. A national study of social media, television, radio, andinternet usage of adults by sexual orientation and smoking status: implications for campaign design. Int J Environ ResPublic Health 2017 Apr 21;14(4):pii: E450 [FREE Full text] [doi: 10.3390/ijerph14040450] [Medline: 28430161]
12. Ybarra ML, Mitchell KJ, Palmer NA, Reisner SL. Online social support as a buffer against online and offline peer andsexual victimization among US LGBT and non-LGBT youth. Child Abuse Negl 2015 Jan;39:123-136 [FREE Full text][doi: 10.1016/j.chiabu.2014.08.006] [Medline: 25192961]
13. Craig SL, McInroy L. You can form a part of yourself online: the influence of new media on identity development andcoming out for LGBTQ youth. J Gay Lesbian Ment Health 2014;18(1):95-109. [doi: 10.1080/19359705.2013.777007]
14. Fox J, Ralston R. Queer identity online: informal learning and teaching experiences of LGBTQ individuals on social media.Comput Human Behav 2016;65:635-642. [doi: 10.1016/j.chb.2016.06.009]
15. Becker AB, Copeland L. Networked publics: how connective social media use facilitates political consumerism amongLGBT Americans. J Inf Technol Politics 2016;13(1):22-36. [doi: 10.1080/19331681.2015.1131655]
16. Kontos EZ, Emmons KM, Puleo E, Viswanath K. Communication inequalities and public health implications of adult socialnetworking site use in the United States. J Health Commun 2010;15(Suppl 3):216-235 [FREE Full text] [doi:10.1080/10810730.2010.522689] [Medline: 21154095]
17. Korda H, Itani Z. Harnessing social media for health promotion and behavior change. Health Promot Pract 2013Jan;14(1):15-23. [doi: 10.1177/1524839911405850] [Medline: 21558472]
18. Veale HJ, Sacks-Davis R, Weaver ER, Pedrana AE, Stoové MA, Hellard ME. The use of social networking platforms forsexual health promotion: identifying key strategies for successful user engagement. BMC Public Health 2015 Feb 6;15:85[FREE Full text] [doi: 10.1186/s12889-015-1396-z] [Medline: 25884461]
19. Card KG, Lachowsky N, Hawkins BW, Jollimore J, Baharuddin F, Hogg RS. Predictors of Facebook user engagementwith health-related content for gay, bisexual, and other men who have sex with men: content analysis. JMIR Public HealthSurveill 2018 Apr 6;4(2):e38 [FREE Full text] [doi: 10.2196/publichealth.8145] [Medline: 29625953]
20. Rubin JD, McClelland SI. 'Even though it's a small checkbox, it's a big deal': stresses and strains of managing sexualidentity(s) on Facebook. Cult Health Sex 2015;17(4):512-526. [doi: 10.1080/13691058.2014.994229] [Medline: 25587894]
21. Duguay S. 'He has a way gayer Facebook than I do': Investigating sexual identity disclosure and context collapse on a socialnetworking site. New Media Soc 2016;18(6):891-907. [doi: 10.1177/1461444814549930]
22. Fox J, Warber KM. Queer identity management and political self-expression on social networking sites: a co-culturalapproach to the spiral of silence. J Commun 2014;65(1):79-100. [doi: 10.1111/jcom.12137]
23. CenterLink: The Community of LGBT Centers. 2018. URL: https://www.lgbtcenters.org/ [accessed 2019-11-28]24. Rieder B. Studying Facebook via data extraction: the Netvizz application. In: Proceedings of the 5th Annual ACM Web
Science Conference. Paris, France: Association for Computing Machinery; 2013 Presented at: WebSci'13; May 2 - 4, 2013;Paris, France p. 346-355. [doi: 10.1145/2464464.2464475]
25. Bellazzi R, Diomidous M, Sarkar IN, Takabayashi K, Ziegler A, McCray AT. Data analysis and data mining: current issuesin biomedical informatics. Methods Inf Med 2011;50(6):536-544. [doi: 10.3414/me11-06-0002]
26. Liu B. Sentiment Analysis and Opinion Mining. San Rafael, California: Morgan & Claypool Publishers; 2012.27. Kahai SS, Cooper RB. Exploring the core concepts of media richness theory: the impact of cue multiplicity and feedback
immediacy on decision quality. J Manag Inf Syst 2003;20(1):263-299. [doi: 10.1080/07421222.2003.11045754]28. Coon D, Neira PM, Lau BD. Threats to United States fully reviewed and strategic plan for integration of transgender military
members into the armed forces. Am J Public Health 2018 Jul;108(7):892-894. [doi: 10.2105/AJPH.2018.304454] [Medline:29874519]
AbbreviationsAPI: application programming interfaceCBO: community-based organizationIRR: incidence rate ratioLGBTQ: lesbian, gay, bisexual, transgender, and queer
JMIR Public Health Surveill 2020 | vol. 6 | iss. 1 | e16382 | p.63https://publichealth.jmir.org/2020/1/e16382(page number not for citation purposes)
Goedel et alJMIR PUBLIC HEALTH AND SURVEILLANCE
XSL•FORenderX

Edited by T Rashid Soron; submitted 24.09.19; peer-reviewed by S Lee, E Da Silva, S Manca, A Kulanthaivel; comments to author25.10.19; revised version received 28.10.19; accepted 12.11.19; published 28.01.20.
Please cite as:Goedel WC, Jin H, Sutten Coats C, Ogunbajo A, Restar AJPredictors of User Engagement With Facebook Posts Generated by a National Sample of Lesbian, Gay, Bisexual, Transgender, andQueer Community Centers in the United States: Content AnalysisJMIR Public Health Surveill 2020;6(1):e16382URL: https://publichealth.jmir.org/2020/1/e16382 doi:10.2196/16382PMID:32012104
©William C C. Goedel, Harry Jin, Cassandra Sutten Coats, Adedotun Ogunbajo, Arjee J Restar. Originally published in JMIRPublic Health and Surveillance (http://publichealth.jmir.org), 28.01.2020. This is an open-access article distributed under theterms of the Creative Commons Attribution License (https://creativecommons.org/licenses/by/4.0/), which permits unrestricteduse, distribution, and reproduction in any medium, provided the original work, first published in JMIR Public Health andSurveillance, is properly cited. The complete bibliographic information, a link to the original publication onhttp://publichealth.jmir.org, as well as this copyright and license information must be included.
JMIR Public Health Surveill 2020 | vol. 6 | iss. 1 | e16382 | p.64https://publichealth.jmir.org/2020/1/e16382(page number not for citation purposes)
Goedel et alJMIR PUBLIC HEALTH AND SURVEILLANCE
XSL•FORenderX

Original Paper
Stigma and Web-Based Sex Seeking Among Men Who Have SexWith Men and Transgender Women in Tijuana, Mexico:Cross-Sectional Study
Cristina Espinosa da Silva1, MPH; Laramie R Smith1, PhD; Thomas L Patterson2, PhD; Shirley J Semple2, PhD; Alicia
Harvey-Vera3, PhD; Stephanie Nunes1, BSc; Gudelia Rangel4,5, MPH, PhD; Heather A Pines1, MPH, PhD1Department of Medicine, University of California, San Diego, La Jolla, CA, United States2Department of Psychiatry, University of California, San Diego, La Jolla, CA, United States3Universidad Xochicalco, Tijuana, Mexico4United States-Mexico Border Health Commission, Tijuana, Mexico5El Colegio de la Frontera Norte, Tijuana, Mexico
Corresponding Author:Heather A Pines, MPH, PhDDepartment of MedicineUniversity of California, San Diego9500 Gilman Drive, MC-0507La Jolla, CA, 92093-0507United StatesPhone: 1 8588224831Email: [email protected]
Abstract
Background: Stigma toward sexual and gender minorities is an important structural driver of HIV epidemics among men whohave sex with men (MSM) and transgender women (TW) globally. Sex-seeking websites and apps are popular among MSM andTW. Interventions delivered via Web-based sex-seeking platforms may be particularly effective for engaging MSM and TW inHIV prevention and treatment services in settings with widespread stigma toward these vulnerable populations.
Objective: To assess the potential utility of this approach, the objectives of our study were to determine the prevalence ofWeb-based sex seeking and examine the effect of factors that shape or are influenced by stigma toward sexual and gender minoritieson Web-based sex seeking among MSM and TW in Tijuana, Mexico.
Methods: From 2015 to 2018, 529 MSM and 32 TW were recruited through venue-based and respondent-driven sampling.Interviewer-administered surveys collected information on Web-based sex seeking (past 4 months) and factors that shape or areinfluenced by stigma toward sexual and gender minorities (among MSM and TW: traditional machismo, internalized stigmarelated to same-sex sexual behavior or gender identity, and outness related to same-sex sexual behavior or gender identity; amongMSM only: sexual orientation and history of discrimination related to same-sex sexual behavior). A total of 5 separate multivariablelogistic regression models were used to examine the effect of each stigma measure on Web-based sex seeking.
Results: A total of 29.4% (165/561) of our sample reported seeking sex partners on the Web. Web-based sex seeking wasnegatively associated with greater endorsement of traditional machismo values (adjusted odds ratio [AOR] 0.36, 95% CI 0.19 to0.69) and greater levels of internalized stigma (AOR 0.96, 95% CI 0.94 to 0.99). Web-based sex seeking was positively associatedwith identifying as gay (AOR 2.13, 95% CI 1.36 to 3.33), greater outness (AOR 1.17, 95% CI 1.06 to 1.28), and a history ofdiscrimination (AOR 1.83, 95% CI 1.08 to 3.08).
Conclusions: Web-based sex-seeking is relatively common among MSM and TW in Tijuana, suggesting that it may be feasibleto leverage Web-based sex-seeking platforms to engage these vulnerable populations in HIV prevention and treatment services.However, HIV interventions delivered through Web-based sex-seeking platforms may have limited reach among those mostaffected by stigma toward sexual and gender minorities (ie, those who express greater endorsement of traditional machismovalues, greater levels of internalized stigma, lesser outness, and nongay identification), given that within our sample they wereleast likely to seek sex on the Web.
JMIR Public Health Surveill 2020 | vol. 6 | iss. 1 | e14803 | p.65https://publichealth.jmir.org/2020/1/e14803(page number not for citation purposes)
Espinosa da Silva et alJMIR PUBLIC HEALTH AND SURVEILLANCE
XSL•FORenderX

(JMIR Public Health Surveill 2020;6(1):e14803) doi:10.2196/14803
KEYWORDS
social stigma; discrimination; internet; mobile apps; men who have sex with men; transgender persons; sexual and genderminorities; Mexico
Introduction
BackgroundMen who have sex with men (MSM) and transgender women(TW) are at increased risk of HIV infection worldwide,including those in low- and middle-income countries (LMIC)[1,2]. Stigma toward sexual and gender minorities is animportant structural driver of the HIV epidemics among MSMand TW in LMIC, with evidence suggesting that such stigmais linked to increased sexual risk behaviors [3-6] and limits theprovision and uptake of HIV prevention and treatment serviceswithin these socially marginalized populations [7-10]. Use ofsex-seeking websites and mobile apps among MSM and TWhas grown in popularity globally, with prevalence estimatesranging from 36% in Latin America [11], 44% in North America[12], 39% to 62% in Africa [13,14], and 41% to 77% in Asia[15-18]. This has sparked interest in and led to the developmentof interventions that harness these Web-based platforms toengage MSM and TW in safer sex practices [19], HIV testing[20,21], and HIV care [22]. Given that sex-seeking websitesand apps allow MSM and TW to meet new sexual partners withmore anonymity than physical venues where they may riskbeing outed, discriminated against, or harmed because of theirsexual or gender identity [13,14], interventions delivered throughWeb-based sex-seeking platforms may be particularly effectivefor engaging MSM and TW in HIV prevention and treatmentservices in regions with widespread stigma toward thesevulnerable populations [19-21].
Stigma stems from power structures that promote or maintainsocial inequity [23-25] and manifests at the structural,interpersonal, and individual levels [24,25] as prejudice anddiscrimination toward persons with socially devaluedcharacteristics, such as sexual and gender minorities[23,24,26-28]. Sexual and gender minorities often facesignificant stigma in heteronormative societies where culturalvalues enforce traditional gender roles [23,26-29]. In thesesettings, sexual and gender minorities may experiencediscrimination [25,30], internalize or adopt negative feelingsand shame about their own sexuality or gender identity overtime [28], and anticipate future stigmatizing experiences [28,31],which may cause some to conceal their sexual or gender identity[32]. Although several exploratory studies in LMIC haveexamined the relationship between factors that shape or areinfluenced by stigma and Web-based sex seeking [11,13-18],findings are mixed regarding whether these Web-basedplatforms are being used by MSM who are more or less affectedby stigma. Studies in Peru [11] and China [15,17,18] found thatWeb-based sex seekers were more likely to be MSM whoidentified as gay, which is more common among MSM lessaffected by stigma. Studies that measured a history ofdiscrimination and perceived or anticipated stigma among MSMin Nigeria [14] and Vietnam [16], on the other hand, found that
Web-based sex seeking was associated with a history ofdiscrimination in Nigeria and perceived or anticipated stigmain both Nigeria and Vietnam, suggesting that Web-based sexseeking may be more common among MSM more affected bystigma. Furthermore, a study conducted among MSM inSwaziland and Lesotho [13] measured gay identification, historyof discrimination, and perceived or anticipated stigma and foundthat all 3 were associated with Web-based sex seeking. However,few studies have examined how a range of factors that shapeor are influenced by stigma are related to Web-based sexseeking, and less is known about the role of internalized stigmaor social norms that perpetuate stigma toward sexual and genderminorities.
Mexico’s HIV epidemic is concentrated within key populations[33,34], including MSM and TW in the Mexico-United Statesborder region. HIV prevalence among MSM and TW in Tijuana,which lies along Mexico’s northern border with San Diego,California, is estimated to be approximately 20%, with nearly90% of those testing HIV positive reporting no prior knowledgeof their HIV status [35,36]. Stigma toward sexual and genderminorities is common in Mexico [37-40] and may be partiallyattributed to the cultural norm of machismo [41-44], whichdefines rigid gender roles and reflects heteronormativeexpectations of male behavior [41,45]. Findings from a recentcross-sectional study in Tijuana suggest that MSM who are lessout about their same-sex sexual behavior and have higher levelsof internalized stigma are less likely to seek HIV testing, whichmay contribute to the high prevalence of undiagnosed HIVinfection among sexual and gender minorities in this setting[46]. Given that MSM and TW most affected by stigma inTijuana are least likely to undergo HIV testing, Web-basedstrategies may help increase their frequency of HIV testing andsupport their timely linkage to HIV prevention and treatmentservices. Web-based strategies may also represent a feasiblemethod to increase uptake of these services, considering that54% of adults in Mexico reported owning a smartphone or usingthe internet as of 2015 [47].
ObjectivesTo assess the potential utility of this approach and inform thedevelopment of HIV prevention efforts for MSM and TW inTijuana and other comparable low-income settings, we aimedto determine the prevalence of Web-based sex seeking andexamine the effect of stigma on Web-based sex seeking amongMSM and TW in Tijuana. We hypothesized that Web-basedsex seeking would be more common among MSM and TWmost affected by stigma toward sexual and gender minorities(ie, MSM and TW with greater endorsement of traditionalmachismo values, greater levels of internalized stigma relatedto same-sex sexual behavior or gender identity, and lesseroutness about same-sex sexual behavior or gender identity andMSM who do not identify as gay or report a history ofdiscrimination related to their same-sex sexual behavior).
JMIR Public Health Surveill 2020 | vol. 6 | iss. 1 | e14803 | p.66https://publichealth.jmir.org/2020/1/e14803(page number not for citation purposes)
Espinosa da Silva et alJMIR PUBLIC HEALTH AND SURVEILLANCE
XSL•FORenderX

Methods
Study Population and DesignData for this analysis came from 2 studies conducted in Tijuana,Proyecto Enlaces (Links Project) and Proyecto Redes (NetworksProject). Proyecto Enlaces was designed to compare theeffectiveness of 2 recruitment methods—venue-based sampling(VBS) and respondent-driven sampling (RDS)—for theidentification of undiagnosed HIV infection among MSM andTW. Proyecto Redes was embedded in Proyecto Enlaces andwas designed to characterize the sexual networks of MSM andTW. Proyecto Enlaces was conducted between March 2015 andNovember 2018, whereas Proyecto Redes was conductedbetween March 2016 and September 2017.
VBS was performed using time-location sampling across 36venues identified during formative research as locationsfrequented by MSM and TW in Tijuana (eg, nightclubs, bars,public spaces, and motels). Individuals identified via VBS wereeligible for HIV testing if they were aged at least 18 years,cisgender male or transgender female, reported anal sex with acisgender male or transgender female in the past 4 months, anddid not report a previous HIV diagnosis. RDS is a chain-referralsampling technique often used to recruit hard-to-reachpopulations [48,49]. A total of 33 individuals identified throughVBS or referrals from Tijuana’s municipal HIV clinic wereselected to initiate RDS recruitment chains (ie, seeds). Seedswere further selected to be diverse with respect to HIV status,age, socioeconomic status, sexual orientation, gender identity,and recruitment venue. Individuals were eligible to be seeds ifthey were aged at least 18 years, cisgender male or transgenderfemale, reported anal sex with a cisgender male or transgenderfemale in the past 4 months, lived in Tijuana, and reported socialnetworks that included at least 15 MSM or TW who also livedin Tijuana (changed to 5 MSM or TW in April 2017 to boostRDS recruitment). Seeds were given 3 coupons to recruit theirMSM or TW peers (eg, sex partners, acquaintances, friends,and family members) to participate in the study. Peer recruitswere then given 3 coupons to recruit peers themselves if theyprovided their referral coupon, were aged at least 18 years, werecisgender male or transgender female, and reported anal sexwith a cisgender male or transgender female in the past 12months. Those who did not report a previous HIV diagnosiswere also eligible for HIV testing. Beginning in January 2018,seeds and peer recruits were given 6 coupons to boost RDSrecruitment. A Microsoft Access database was used to trackpeer recruitment and store biometric information to preventduplicate enrollment. Seeds and peer recruits were givenMexican pesos (Mxn) $100 (approximately US $5) for everyeligible peer they referred to the study.
As individuals could be identified multiple times via the sameor a different recruitment method, those who were identifiedmore than once and who remained eligible for HIV testing wereretested if it had been at least 3 months since their last test.Eligible individuals identified via VBS underwent rapid HIVtesting (Advanced Quality HIV 1/2 Test Kits, Intec ProductsInc) at recruitment venues or at the study site if they preferred,whereas those identified via RDS underwent rapid HIV testing
at the study site. All rapid HIV test results and appropriateposttest counseling were delivered within a few days (VBS) or20 min (RDS) at the study site. All rapid test–negativeindividuals identified via VBS and rapid test–negativeindividuals identified via RDS who reported anal sex with acisgender male or transgender female in the past 4 months (forcomparability with those identified via VBS) were offeredenrollment in Proyecto Redes. Rapid test–positive individualsprovided an additional blood sample for confirmatory testingvia immunofluorescence assay at the San Diego County PublicHealth Laboratory and were offered enrollment in ProyectoEnlaces. Confirmatory HIV test results were delivered to rapidtest–positive individuals within 2 weeks, and those confirmedHIV positive were referred for free HIV care at Tijuana’smunicipal HIV clinic.
All study procedures occurred at the study site located in anunmarked office building staffed by local Spanish-speakingindividuals with extensive experience working with sexual andgender minorities in Tijuana who were also trained to foster anonjudgmental environment. In our previous research with keypopulations in Tijuana, our study site was recognized as anonstigmatizing setting where participants felt comfortablevisiting without fear of discrimination. All participants providedwritten informed consent, and all study procedures wereapproved by the Human Subjects Protection Committees at theUniversidad de Xochicalco in Tijuana and the University ofCalifornia, San Diego.
Data CollectionSurveys collected sociodemographic, psychosocial, andbehavioral data and were interviewer administered usingcomputer-assisted personal interviewing.
Exposures of InterestA total of 5 variables measured different factors that shape orare influenced by stigma toward sexual and gender minorities,including traditional machismo, internalized stigma related tosame-sex sexual behavior or gender identity, sexual orientation,outness about same-sex sexual behavior or gender identity, andhistory of discrimination related to same-sex sexual behavior(only measured among MSM participants; Multimedia Appendix1). Machismo is a common social norm in Mexico and iscomposed of positive and negative constructs (termedcaballerismo and traditional machismo, respectively) [50].Traditional machismo is relevant to this study because it reflectsa heteronormative version of masculinities that may be at oddswith stereotypes associated with sexual behaviors (eg, receptiveanal sex) and the sexual or gender identity of MSM and TW,and it likely shapes stigma toward sexual and gender minoritiesin Mexico. Traditional machismo was measured using a 10-itemscale [50,51] that captures the negative characteristics typicallyassociated with machismo, including hypermasculinity,aggressivity, and being domineering (eg, “It is necessary for aman to fight when challenged” and “A man should be in controlof his wife”; Cronbach alpha=.90). Participants indicated theirlevel of agreement with these items using 4-point Likert scaleresponses (1=strongly disagree, 2=disagree, 3=agree, and4=strongly agree). A mean score was calculated from itemresponses, with higher scores indicating greater endorsement
JMIR Public Health Surveill 2020 | vol. 6 | iss. 1 | e14803 | p.67https://publichealth.jmir.org/2020/1/e14803(page number not for citation purposes)
Espinosa da Silva et alJMIR PUBLIC HEALTH AND SURVEILLANCE
XSL•FORenderX

of traditional machismo values [51]. Internalized stigma relatedto same-sex sexual behavior or gender identity refers to anindividual’s internalization of society’s negative view of sexualand gender minorities. MSM participants were asked to providetheir level of agreement with 9 items assessing internalizedstigma toward same-sex sexual behaviors (eg, “I have tried tostop being attracted to men in general” and “I would like to getprofessional help in order to change my sexual attraction frommen to women exclusively”) using 5-point Likert scaleresponses (1=strongly disagree, 2=somewhat disagree, 3=neitheragree nor disagree, 4=agree, and 5=strongly agree; Cronbachalpha=.93) [52]. To measure internalized stigma related togender identity, we adapted the 9 items presented to MSM toreflect experiences of TW (eg, “I have tried to stop beingattracted to men in general” was changed to “I have tried to stopidentifying as a woman in general”; Cronbach alpha=.89).Participants’ responses to items measuring internalized stigmawere summed to create a score, where higher scores indicategreater levels of internalized stigma. Sexual orientation wasassessed by asking participants, “What is your sexualorientation?” (1=gay or homosexual, 2=heterosexual,3=bisexual, and 4=not sure). Participants who reported beinggay or homosexual were classified as gay identifying and allothers were considered nongay identifying. We hypothesizedthat participants may have reported being unsure of their sexualorientation because of greater levels of internalized stigma.Owing to the small number of participants who reported beingunsure of their sexual orientation (only 13 MSM participants),we combined this group with other MSM hypothesized to bemore affected by stigma (ie, nongay identifying). Outness wasmeasured by asking MSM and TW to describe how “out” theyare about having sex with men [53] and being a transgenderwoman, respectively. Participants responded on a scale of 1 to7 (1=not out to anyone, 4=out to about half the people I know,and 7=out to everyone). History of discrimination related tosame-sex sexual behavior was assessed among MSMparticipants only by asking “In your day to day life, how oftendoes discrimination related to your sexual orientation/havingsex with men happen to you?” (0=never, 1=less than once ayear, 2=a few times a year, 3=a few times a month, 4=at leastonce a week, and 5=almost every day).
Outcome of InterestWeb-based sex seeking was measured by asking, “In the past4 months, how many different men did you meet online withthe intention of having sex?” Participants who reported meetingat least one man online with the intention of having sex wereclassified as Web-based sex seekers.
Other CovariatesSociodemographic data were collected on participants’ genderidentity (0=transgender female and 1=male), age (in years),highest level of education completed (1=cannot read or write,2=some grade school but no certificate, 3=grade school, 4=somesecondary school but no certificate, 5=secondary school, 6=somehigh school but no certificate, 7=high school, 8=some universitybut no title, 9=university, and 10=advanced degree such asdoctorate or masters), average monthly income in Mxn pesosin the past 4 months (1=no income, 2<Mxn $1000, 3=Mxn
$1000-Mxn $1499, 4=Mxn $1500-Mxn $1999, 5=Mxn$2000-Mxn $2499, 6=Mxn $2500-Mxn $2999, 7=Mxn$3000-Mxn $3500, and 8>Mxn $3500, which was dichotomizedat Mxn $3000 based on the national monthly well-being linesrepresenting federal poverty limits for urban areas during ourstudy period) [54], years of residence in Tijuana, and maritalstatus (1=married to a woman, 2=married to a man, 3=separatedor filing for divorce, 4=divorced but not remarried, 5=widowedbut not remarried, 6=never married, 7=common-law marriagewith female partner, and 8=common-law marriage with malepartner). Social support was measured via 8 items that make upthe Modified Medical Outcome Study Social Support Surveyassessing help and support received from others (eg, “If youneeded it, how often is someone available to turn to forsuggestions about how to deal with a personal problem?” and“If you needed it, how often is someone available to help withdaily chores if you were sick?”; Cronbach alpha=.97) [55].Participants provided their level of agreement using 5-pointLikert scale responses (1=none of the time, 2=a little of thetime, 3=some of the time, 4=most of the time, and 5=all of thetime). A mean score was calculated from item responses andtransformed to a 100-point scale, where higher values indicategreater social support [56]. Participants were asked with howmany people they engaged in sexual (vaginal or anal) intercoursein the past 4 months and whether they had given or receivedmoney, drugs, or other goods in exchange for sex in the past 4months (0=did not give or receive money, drugs, or other goodsfor sex and 1=gave or received money, drugs, or others goodsfor sex), which has been shown to be a reliable period of recallfor self-reported sexual contact and behavior data [57-59]. HIVtesting in the past 12 months was assessed by asking 2 questions:“Have you ever been tested for HIV?” (0=no and 1=yes) and“How long ago was your last HIV test?” Participants werecategorized as undergoing HIV testing in the past 12 months ifthey responded that they had ever been tested for HIV and theirlast HIV test was within 12 months of the interview date.
Statistical AnalysisThis analysis includes all Proyecto Redes participants (n=396;excluding 11 identified via RDS or VBS more than once wholater tested HIV positive and enrolled in Proyecto Enlaces) andnewly diagnosed HIV-positive participants enrolled in ProyectoEnlaces (n=165). Analyses considering 3 of the 5 stigmameasures (ie, traditional machismo, history of discriminationrelated to same-sex sexual behavior, and sexual orientation)were restricted to specific subgroups of our sample because (1)HIV-positive Proyecto Enlaces participants completed baselineand supplemental (approximately 2 weeks post baseline whenthey returned for their confirmatory HIV test results) surveys,whereas HIV-negative Proyecto Redes participants onlycompleted baseline surveys and (2) some survey questions werephrased for both MSM and TW, whereas others were onlyphrased for MSM. Data on traditional machismo and history ofdiscrimination related to same-sex sexual behavior werecollected via the supplemental survey among HIV-positiveProyecto Enlaces participants. As 27.3% (45/165) of ProyectoEnlaces participants did not return to complete the supplementalsurvey, analyses examining traditional machismo and historyof discrimination related to same-sex sexual behavior were
JMIR Public Health Surveill 2020 | vol. 6 | iss. 1 | e14803 | p.68https://publichealth.jmir.org/2020/1/e14803(page number not for citation purposes)
Espinosa da Silva et alJMIR PUBLIC HEALTH AND SURVEILLANCE
XSL•FORenderX

restricted to HIV-negative Proyecto Redes participants to reducethe potential for selection bias that could have been introducedby only including those Proyecto Enlaces participants who hadreturned. Analyses examining history of discrimination werethen further restricted to MSM participants because the phrasingof the question was specific to experiences of MSM and notTW (Multimedia Appendix 1). Finally, analyses examiningsexual orientation were restricted to MSM because wehypothesized that MSM and TW less affected by stigma wouldidentify as gay or homosexual and heterosexual, respectively.Restricting these analyses to MSM allowed us to examine sexualorientation without potentially including participants who weremore or less affected by stigma in the same category.
Descriptive statistics were calculated to characterize the studypopulation by Web-based sex seeking. Next, bivariateassociations between factors that shape or are influenced bystigma toward sexual and gender minorities were examinedusing linear and logistic regression models for continuous andcategorical dependent variables, respectively. Separateunadjusted and adjusted logistic regression models were thenused to examine the total effect of each stigma measure onWeb-based sex seeking. A review of the literature wasconducted to identify covariates that may confound the totaleffects of interest. Directed acyclic graphs (DAGs) [60] werethen generated to depict interrelationships among each exposureof interest, Web-based sex seeking, and the identified covariates.Westreich et al have shown that it is inappropriate to interpreteffect estimates for exposures of interest from a single adjustedmodel (ie, one that includes all exposures of interest) as theirtotal effects on the outcome of interest because adjusting for anexposure of interest that lies on the causal pathway betweenanother exposure of interest and the outcome of interest wouldyield an estimate of the direct effect of that exposure of intereston the outcome of interest [61]. Therefore, given the highlyinterrelated nature of our exposures of interest and thecross-sectional nature of our data (making it difficult todetermine the directionality of the relationships among ourexposures of interest), our DAGs considered 1 exposure of
interest at a time to facilitate the identification of confoundersfor inclusion in adjusted models for the total effect of eachexposure of interest on Web-based sex seeking. On the basis ofthese DAGs, sociodemographics (gender identity, age,education, and monthly income) and social support wereidentified as confounders and selected for inclusion in adjustedmodels. We were unable to stratify models by gender identitybecause of the small number of TW included in our sample(n=32). However, as controlling for gender identity in ouradjusted models could have resulted in sparse data bias (becauseof the small number of TW), we conducted a sensitivity analysisexcluding TW and found qualitatively similar results. In anothersensitivity analysis, we examined the potential impact ofgrouping MSM who reported being unsure of their sexualorientation with those who did not identify as gay by excludingthose who reported being unsure of their sexual orientation frommodels examining the effect of sexual orientation on Web-basedsex seeking, and we found qualitatively similar results. Finally,we examined whether any of the relationships of interest weremodified by HIV status or age by including product termsbetween the potential effect measure modifier and the exposuresof interest in each of their respective models. Unstratified resultsare presented because none of the product terms werestatistically significant. All statistical analyses were conductedusing SAS V.9.3. (SAS Institute, Inc).
Results
Sample CharacteristicsApproximately half of our sample was recruited via VBS(311/561, 55.4%; Table 1). Most participants identified as male(529/561, 94.3%), and participants had a mean age of 37 years(SD 11.2). Nearly half of the participants (239/561, 42.6%)reported at least a high school education, and 69.2% (387/561)of the participants reported an average monthly income of atleast Mxn $3000 (approximately US $150). A total of 29.4%(165/561) of participants reported seeking sex partners on theWeb in the past 4 months.
JMIR Public Health Surveill 2020 | vol. 6 | iss. 1 | e14803 | p.69https://publichealth.jmir.org/2020/1/e14803(page number not for citation purposes)
Espinosa da Silva et alJMIR PUBLIC HEALTH AND SURVEILLANCE
XSL•FORenderX

Table 1. Characteristics of men who have sex with men and transgender women in Tijuana, Mexico, by Web-based sex seeking in the past 4 months(N=561).
P valuebNo Web-based sexseeking (n=396)
Web-based sexseeking (n=165)Total (N=561)Characteristicsa
Stigma measures
<.0012.2 (0.4)1.9 (0.4)2.1 (0.4)Traditional Machismo (range: 1-4)c, mean score (SD)
<.00125.3 (8.3)20.5 (8.4)23.9 (8.7)Internalized stigma related to same-sex sexual behavior or genderidentity (range: 9-45), mean score (SD)
<.001Sexual orientationd, n (%)
106 (28.3)96 (61.9)202 (38.2)Gay or homosexual
268 (71.7)59 (38.1)327 (61.8)Bisexual, heterosexual, or not sure
<.0013.8 (2.5)5.1 (2.1)4.2 (2.5)Outness about same-sex sexual behavior or gender identity (range: 1-7), mean score (SD)
.0595 (35.2)52 (46.0)147 (38.4)History of discrimination related to same-sex sexual behaviore, n (%)
Covariates
Sociodemographics
.61HIV status, n (%)
119 (30.1)46 (27.9)165 (29.4)Newly diagnosed HIV positive (Proyecto Enlaces)
277 (70.0)119 (72.1)396 (70.6)HIV negative (Proyecto Redes)
.81374 (94.4)155 (93.9)529 (94.3)Cisgender male, n (%)
<.00139.6 (11.0)31.0 (9.0)37.0 (11.2)Age (years), mean (SD)
<.001143 (36.1)96 (58.2)239 (42.6)Completed at least a high school education, n (%)
<.001252 (63.8)135 (82.3)387 (69.2)Average monthly income ≥Mxn $3000, n (%)
.00411.7 (13.0)14.9 (11.3)12.7 (12.6)Years of residence in Tijuana, mean (SD)
.01Marital status, n (%)
62 (15.7)21 (12.7)83 (14.8)Married, including common-law marriagef
60 (15.2)12 (7.3)72 (12.9)Separated or divorced
6 (1.5)0 (0.0)6 (1.1)Widowed
267 (67.6)132 (80.0)399 (71.3)Never married
<.00152.3 (36.3)67.1 (27.6)56.6 (34.6)Social support (range: 0-100), mean score (SD)
.7612.1 (34.2)11.3 (29.0)11.9 (32.7)Sex partners (past 4 months), mean (SD)
<.001220 (56.1)51 (30.9)271 (48.7)Exchanged money, drugs, or other goods for sex (past 4 months), n(%)
.05148 (40.7)76 (50.0)224 (43.4)Tested for HIV (past 12 months), n (%)
.30Recruitment method, n (%)
182 (46.0)68 (41.2)250 (44.6)Respondent-driven sampling
214 (54.0)97 (58.8)311 (55.4)Venue-based sampling
aNumbers may not sum to total because of missing data; percentages may not sum to 100 because of rounding.bP value from chi-square test (if categorical) or 2-sided t tests (if continuous).cRestricted to HIV-negative participants (n=396).dRestricted to men who have sex with men participants (n=529).eRestricted to HIV-negative men who have sex with men participants (n=383).fA total of 43 men who have sex with men reported being married to a woman, 34 men who have sex with men reported being married to a man, and6 transgender women reported being married to a man.
JMIR Public Health Surveill 2020 | vol. 6 | iss. 1 | e14803 | p.70https://publichealth.jmir.org/2020/1/e14803(page number not for citation purposes)
Espinosa da Silva et alJMIR PUBLIC HEALTH AND SURVEILLANCE
XSL•FORenderX

Bivariate Associations Between Stigma MeasuresBivariate associations between factors that shape or areinfluenced by stigma toward sexual and gender minorities werein the expected directions (Table 2). Positive associations wereobserved between traditional machismo and internalized stigmarelated to same-sex sexual behavior or gender identity (betacoefficient =.019; 95% CI 0.015 to 0.024). Outness aboutsame-sex sexual behavior or gender identity was positivelyassociated with gay identification (beta coefficient=2.35; 95%CI 1.96 to 2.73) and history of discrimination related to
same-sex sexual behavior (beta coefficient =.93; 95% CI 0.42to 1.43). Traditional machismo was negatively associated withoutness about same-sex sexual behavior or gender identity (betacoefficient=−.04; 95% CI −0.06 to −0.03) and gay identification(beta coefficient=−.25; 95% CI −0.33 to −0.17). Internalizedstigma related to same-sex sexual behavior or gender identitywas inversely associated with outness about same-sex sexualbehavior or gender identity (beta coefficient=−1.84; 95% CI−2.08 to −1.59) and sexual orientation (beta coefficient=−8.94;95% CI −10.25 to −7.63).
Table 2. Associations between factors that shape or are influenced by stigma among men who have sex with men and transgender women in Tijuana,Mexico.
Gay identifyingbOutnessaInternalized stigmaaTraditional machismoaStigma Measures
95% CIβ95% CIβ95% CIβ95% CIβc
——————e0.015 to 0.024.019dInternalized stigma
————−2.08 to −1.59−1.84−0.06 to −0.03−.04dOutness
——1.96 to 2.732.35g−10.25 to −7.63−8.94g−0.33 to −0.17−.25fGay identifying
−0.03 to 0.85.41f.42 to 1.43.93f−1.48 to 2.07.29f−0.10 to 0.07−.01fHistory of discrimination
aUnadjusted linear regression.bUnadjusted logistic regression.cBeta coefficient.dRestricted to HIV-negative participants.eNot Applicable.fRestricted to HIV-negative men who have sex with men participants.gRestricted to men who have sex with men participants.
Stigma Measures and Web-Based Sex SeekingOn average, Web-based sex seekers reported less endorsementof traditional machismo values (mean 1.9 vs mean 2.2, range 1to 4; P<.001; Table 1), less internalized stigma related tosame-sex sexual behavior or gender identity (mean 20.5 vs mean25.3, range 9 to 45; P<.001), and they were more out about theirsame-sex sexual behavior or gender identity (mean 5.1 vs mean3.8, range 1 to 7; P<.001). Compared with MSM participantswho did not seek sex partners on the Web, a greater proportionof Web-based sex seekers identified as gay (61.9% vs 28.3%,P<.001) and reported a history of discrimination related to theirsame-sex sexual behavior (46.0% vs 35.2%; P=.05).
After adjusting for sociodemographics and social support (Table3), the odds of Web-based sex seeking were lower forparticipants who reported greater endorsement of traditionalmachismo values (adjusted odds ratio [AOR] 0.36, 95% CI 0.19to 0.69) and greater levels of internalized stigma related to theirsame-sex sexual behavior or gender identity (AOR 0.96, 95%CI 0.94 to 0.99), whereas the odds of Web-based sex seekingwere higher for those who reported greater outness about theirsame-sex sexual behavior or gender identity (AOR 1.17, 95%CI 1.06 to 1.28). Among MSM participants, the odds ofWeb-based sex seeking were higher for gay-identifyingparticipants (AOR 2.13, 95% CI 1.36 to 3.33) and those whoreported a history of discrimination related to their same-sexsexual behavior (AOR 1.83, 95% CI 1.08 to 3.08).
JMIR Public Health Surveill 2020 | vol. 6 | iss. 1 | e14803 | p.71https://publichealth.jmir.org/2020/1/e14803(page number not for citation purposes)
Espinosa da Silva et alJMIR PUBLIC HEALTH AND SURVEILLANCE
XSL•FORenderX

Table 3. Associations among factors that shape or are influenced by stigma and Web-based sex seeking among men who have sex with men andtransgender women in Tijuana, Mexico.
Adjusteda odds ratio (95% CI)Unadjusted odds ratio (95% CI)Stigma measures
0.36 (0.19 to 0.69)0.20 (0.11 to 0.36)Traditional machismob
0.96 (0.94 to 0.99)0.93 (0.91 to 0.96)Internalized stigma related to same-sex sexual behavior or gender identity
2.13 (1.36 to 3.33)4.11 (2.77 to 6.10)Gay identifyingc
1.17 (1.06 to 1.28)1.25 (1.15 to 1.35)Outness about same-sex sexual behavior or gender identity
1.83 (1.08 to 3.08)1.57 (1.01 to 2.45)History of discrimination related to same-sex sexual behaviord
aAdjusted models for each stigma measure of interest included the following: gender identity (male vs transgender female in models not restricted tomen who have sex with men), age (years), education (less than a high school education vs at least a high school education), monthly income (<Mxn$3000 vs ≥Mxn $3000 ), years of residence in Tijuana (years), and social support (score on the Modified Medical Outcome Study Social Support Survey)[55].bRestricted to HIV-negative participants.cRestricted to men who have sex with men participants.dRestricted to HIV-negative men who have sex with men participants.
Discussion
We examined the relationship between stigma and Web-basedsex seeking using cross-sectional data collected from MSM andTW in Tijuana, Mexico. Nearly one-third of our sample reportedseeking sex partners on the Web in the past 4 months, which isconsistent with estimates from Peru (36%) [11] but is not ashigh as those from the United States (44%) [12], Africa(39%-62%) [13,14], or Asia (41%-77%) [15-18].
Our a priori hypothesis was that Web-based sex seeking wouldbe more common among MSM and TW most affected by stigmatoward sexual and gender minorities. However, for the mostpart, our findings do not support this hypothesis. Morespecifically, participants who met sex partners on the Webreported less agreement with traditional machismo values, lessinternalized stigma related to same-sex sexual behavior orgender identity, were more gay identifying, and were more outabout their same-sex sexual behavior or gender identitycompared with those who did not seek sex on the Web. Priorresearch suggests that MSM and TW most affected by stigmaoften isolate themselves from other sexual and gender minoritiesto conceal their minority status [28,32]. As such, those mostaffected by stigma in our sample may be less connected tocommunities of MSM and TW and, thus, less aware of or lesscomfortable using sex-seeking websites and apps used by MSMand TW. Although MSM participants with a history ofdiscrimination were more likely to seek sex partners on theWeb, as was our a priori hypothesis, it seems plausible, givenour other findings, that this result may have an alternativeexplanation. As reported in other settings [13,14], we initiallyhypothesized that MSM with a history of discrimination wouldbe more likely to seek sex partners on the Web, partly to avoidfuture discrimination that they could face by meeting sexpartners in traditional physical venues. However, given ourother findings, it is possible that having a history ofdiscrimination was associated with Web-based sex seeking inour sample because MSM who identify as gay or are more outabout their same-sex sexual behavior (both of which were
positively associated with Web-based sex seeking and historyof discrimination) may be more susceptible to discrimination.
Overall, our findings suggest that Web-based sex seeking ismore common among MSM and TW in Tijuana who are lessaffected by stigma toward sexual and gender minorities. Ourfindings are similar to those from exploratory studies in Peru[11], China [15,17,18], Lesotho [13], and Swaziland [13], whichfound that MSM who used the Web to meet sex partners weremore gay identifying [11,13,17,18]. Our findings also align withthose from a study in Nigeria [14], which found that MSM whosought sex partners on the Web were more likely to report ahistory of discrimination. We also expanded on previousliterature by examining a wider range of factors that shape orare influenced by stigma, including a social norm that influencessocietal stigma (traditional machismo) and internalized stigmarelated to same-sex sexual behavior or gender identity. Includinga broader scope of factors that shape or are influenced by stigmaprovides a more multidimensional understanding of the role ofstigma with respect to Web-based sex seeking, which may havebeen underappreciated by prior studies that considered only 1or 2 factors [24,25].
Our study has several limitations. First, because of thecross-sectional design of our study, we cannot establish atemporal relationship between the exposures of interest andWeb-based sex seeking. Therefore, we cannot infer that theobserved associations represent causal associations. Second,our use of nonprobability sampling methods may limit thegeneralizability of our findings. These sampling methods,however, were critical to our ability to recruit MSM and TWwho are socially marginalized and often hidden in Tijuana.However, even with the use of these sampling methods, TWwere underrepresented in our sample, which precluded us fromstratifying our analyses by gender identity. As such, our resultsdo not shed light on potential differences in Web-based sexseeking or its relationship with stigma between MSM and TW,which should be examined in future research. Third, ourassessment of Web-based sex seeking was exclusive to meetingmale partners. As a result, we may have underestimated theprevalence of Web-based sex seeking among MSM and TW in
JMIR Public Health Surveill 2020 | vol. 6 | iss. 1 | e14803 | p.72https://publichealth.jmir.org/2020/1/e14803(page number not for citation purposes)
Espinosa da Silva et alJMIR PUBLIC HEALTH AND SURVEILLANCE
XSL•FORenderX

Tijuana because those who only met TW partners on the Webwould not have been classified as Web-based sex seekers.Fourth, we did not collect data on smartphone or computer use,both of which are likely associated with Web-based sex seekingand should be considered in future research. Fifth, althoughsurveys were interviewer administered to alleviate respondentburden, interviewer-administered surveys may have introducedsocial desirability bias if participants underreported sensitiveinformation related to the exposures of interest or Web-basedsex seeking. However, to minimize the potential for socialdesirability bias, all interviewers had extensive experienceworking with sexual and gender minorities in Tijuana and weretrained to create a nonjudgmental environment and build rapportwith participants to enhance their comfort with respect toresponding openly and honestly. Finally, it is possible that poorrecall could have led to the misclassification of history ofdiscrimination related to same-sex sexual behavior andWeb-based sex seeking in the past 4 months. However, suchmisclassification was likely nondifferential with regard to the
outcome or exposure and, thus, may have only biased effectestimates toward the null.
Despite these limitations, our findings suggest that Web-basedsex seeking is relatively common among MSM and TW inTijuana and that it may be feasible to leverage Web-basedsex-seeking platforms to engage these vulnerable populationsin HIV prevention and treatment services. However, suchWeb-based interventions may still poorly engage those mostaffected by stigma toward sexual and gender minorities, giventhat within our sample they were least likely to seek sex on theWeb. Further research is needed to identify effective andacceptable strategies to link MSM and TW most affected bystigma to HIV prevention and treatment services. As trends ofWeb-based sex seeking among nationally representative samplesof MSM in the United States have dramatically increased overtime [12], future research should also monitor changes in theuse of Web-based sex-seeking platforms among MSM and TWin LMIC.
AcknowledgmentsThe authors thank the study participants and staff without whom this study would not have been possible. This work was supportedby grants from the National Institute on Drug Abuse: R01DA037811 (awarded to TLP), K01DA040543 (awarded to HAP),K01DA039767 (awarded to LRS), and T32DA023356 (awarded to CEDS).
Conflicts of InterestNone declared.
Multimedia Appendix 1Scale items and survey questions for the 5 stigma measures used in this analysis.[DOCX File , 18 KB - publichealth_v6i1e14803_app1.docx ]
References1. Baral S, Sifakis F, Cleghorn F, Beyrer C. Elevated risk for HIV infection among men who have sex with men in low- and
middle-income countries 2000-2006: a systematic review. PLoS Med 2007 Dec;4(12):e339 [FREE Full text] [doi:10.1371/journal.pmed.0040339] [Medline: 18052602]
2. Baral SD, Poteat T, Strömdahl S, Wirtz AL, Guadamuz TE, Beyrer C. Worldwide burden of HIV in transgender women:a systematic review and meta-analysis. Lancet Infect Dis 2013 Mar;13(3):214-222. [doi: 10.1016/S1473-3099(12)70315-8][Medline: 23260128]
3. Ha H, Risser JM, Ross MW, Huynh NT, Nguyen HT. Homosexuality-related stigma and sexual risk behaviors among menwho have sex with men in Hanoi, Vietnam. Arch Sex Behav 2015 Feb;44(2):349-356. [doi: 10.1007/s10508-014-0450-8][Medline: 25617010]
4. Magno L, Dourado I, Silva LA, Brignol S, Amorim L, MacCarthy S. Gender-based discrimination and unprotected receptiveanal intercourse among transgender women in Brazil: a mixed methods study. PLoS One 2018;13(4):e0194306 [FREE Fulltext] [doi: 10.1371/journal.pone.0194306] [Medline: 29641528]
5. Melendez RM, Pinto R. 'It's really a hard life': love, gender and HIV risk among male-to-female transgender persons. CultHealth Sex 2007;9(3):233-245 [FREE Full text] [doi: 10.1080/13691050601065909] [Medline: 17457728]
6. Sugano E, Nemoto T, Operario D. The impact of exposure to transphobia on HIV risk behavior in a sample of transgenderedwomen of color in San Francisco. AIDS Behav 2006 Mar;10(2):217-225. [doi: 10.1007/s10461-005-9040-z] [Medline:16362237]
7. Beattie TS, Bhattacharjee P, Suresh M, Isac S, Ramesh B, Moses S. Personal, interpersonal and structural challenges toaccessing HIV testing, treatment and care services among female sex workers, men who have sex with men and transgendersin Karnataka state, South India. J Epidemiol Community Health 2012 Oct;66(Suppl 2):ii42-ii48 [FREE Full text] [doi:10.1136/jech-2011-200475] [Medline: 22495772]
JMIR Public Health Surveill 2020 | vol. 6 | iss. 1 | e14803 | p.73https://publichealth.jmir.org/2020/1/e14803(page number not for citation purposes)
Espinosa da Silva et alJMIR PUBLIC HEALTH AND SURVEILLANCE
XSL•FORenderX

8. Fay H, Baral SD, Trapence G, Motimedi F, Umar E, Iipinge S, et al. Stigma, health care access, and HIV knowledge amongmen who have sex with men in Malawi, Namibia, and Botswana. AIDS Behav 2011 Aug;15(6):1088-1097. [doi:10.1007/s10461-010-9861-2] [Medline: 21153432]
9. Grant JM, Mottet L, Tanis JE, Harrison J, Herman J, Keisling M. National Center for Transgender Equality. Washington:National Center for Transgender Equality and National Gay and Lesbian Task Force; 2011. Injustice at Every Turn: AReport of the National Transgender Discrimination Survey URL: https://www.transequality.org/sites/default/files/docs/resources/NTDS_Report.pdf [accessed 2019-11-28]
10. Lambda Legal. New York: Lambda Legal; 2010. When Health Care Isn’t Caring: Lambda Legal’s Survey of DiscriminationAgainst LGBT People and People With HIV URL: https://www.lambdalegal.org/sites/default/files/publications/downloads/whcic-report_when-health-care-isnt-caring.pdf [accessed 2019-11-28]
11. Chow JY, Konda KA, Calvo GM, Klausner JD, Cáceres CF. Demographics, behaviors, and sexual health characteristicsof high risk men who have sex with men and transgender women who use social media to meet sex partners in Lima, Peru.Sex Transm Dis 2017 Mar;44(3):143-148. [doi: 10.1097/OLQ.0000000000000566] [Medline: 28178111]
12. Paz-Bailey G, Hoots BE, Xia M, Finlayson T, Prejean J, Purcell DW, NHBS Study Group. Trends in internet use amongmen who have sex with men in the United States. J Acquir Immune Defic Syndr 2017 Jul 1;75(Suppl 3):S288-S295 [FREEFull text] [doi: 10.1097/QAI.0000000000001404] [Medline: 28604430]
13. Stahlman S, Grosso A, Ketende S, Mothopeng T, Taruberekera N, Nkonyana J, et al. Characteristics of men who have sexwith men in southern Africa who seek sex online: a cross-sectional study. J Med Internet Res 2015 May 25;17(5):e129[FREE Full text] [doi: 10.2196/jmir.4230] [Medline: 26006788]
14. Stahlman S, Nowak RG, Liu H, Crowell TA, Ketende S, Blattner WA, TRUST/RV368 Study Group. Online sex-seekingamong men who have sex with men in Nigeria: implications for online intervention. AIDS Behav 2017 Nov;21(11):3068-3077[FREE Full text] [doi: 10.1007/s10461-016-1437-3] [Medline: 27233248]
15. Bien CH, Best JM, Muessig KE, Wei C, Han L, Tucker JD. Gay apps for seeking sex partners in China: implications forMSM sexual health. AIDS Behav 2015 Jun;19(6):941-946 [FREE Full text] [doi: 10.1007/s10461-014-0994-6] [Medline:25572834]
16. Krishnan A, Nguyen M, Giang LM, Ha TV, Bhadra M, Nguyen SM, et al. Finding sex partners through social media amongmen who have sex with men in Hanoi, Vietnam. J Community Health 2018 Feb;43(1):146-156. [doi:10.1007/s10900-017-0397-5] [Medline: 28677027]
17. Pan S, Xu JJ, Han XX, Zhang J, Hu QH, Chu ZX, et al. Internet-based sex-seeking behavior promotes HIV infection risk:a 6-year serial cross-sectional survey to MSM in Shenyang, China. Biomed Res Int 2016;2016:2860346 [FREE Full text][doi: 10.1155/2016/2860346] [Medline: 28105415]
18. Tang W, Best J, Zhang Y, Liu F, Tso LS, Huang S, et al. Gay mobile apps and the evolving virtual risk environment: across-sectional online survey among men who have sex with men in China. Sex Transm Infect 2016 Nov;92(7):508-514[FREE Full text] [doi: 10.1136/sextrans-2015-052469] [Medline: 27288414]
19. Muessig KE, Nekkanti M, Bauermeister J, Bull S, Hightow-Weidman LB. A systematic review of recent smartphone,internet and web 2.0 interventions to address the HIV continuum of care. Curr HIV/AIDS Rep 2015 Mar;12(1):173-190[FREE Full text] [doi: 10.1007/s11904-014-0239-3] [Medline: 25626718]
20. Blas MM, Alva IE, Carcamo CP, Cabello R, Goodreau SM, Kimball AM, et al. Effect of an online video-based interventionto increase HIV testing in men who have sex with men in Peru. PLoS One 2010 May 3;5(5):e10448 [FREE Full text] [doi:10.1371/journal.pone.0010448] [Medline: 20454667]
21. Cao B, Gupta S, Wang J, Hightow-Weidman LB, Muessig KE, Tang W, et al. Social media interventions to promote HIVtesting, linkage, adherence, and retention: systematic review and meta-analysis. J Med Internet Res 2017 Nov 24;19(11):e394[FREE Full text] [doi: 10.2196/jmir.7997] [Medline: 29175811]
22. Young SD, Cumberland WG, Nianogo R, Menacho LA, Galea JT, Coates T. The HOPE social media intervention forglobal HIV prevention in Peru: a cluster randomised controlled trial. Lancet HIV 2015 Jan;2(1):e27-e32 [FREE Full text][doi: 10.1016/S2352-3018(14)00006-X] [Medline: 26236767]
23. Altman D, Aggleton P, Williams M, Kong T, Reddy V, Harrad D, et al. Men who have sex with men: stigma anddiscrimination. Lancet 2012 Jul 28;380(9839):439-445. [doi: 10.1016/S0140-6736(12)60920-9] [Medline: 22819652]
24. Hatzenbuehler ML, Phelan JC, Link BG. Stigma as a fundamental cause of population health inequalities. Am J PublicHealth 2013 May;103(5):813-821 [FREE Full text] [doi: 10.2105/AJPH.2012.301069] [Medline: 23488505]
25. Link BG, Phelan JC. Stigma and its public health implications. Lancet 2006 Feb 11;367(9509):528-529. [doi:10.1016/S0140-6736(06)68184-1] [Medline: 16473129]
26. Katz-Wise SL, Hyde JS. Victimization experiences of lesbian, gay, and bisexual individuals: a meta-analysis. J Sex Res2012;49(2-3):142-167. [doi: 10.1080/00224499.2011.637247] [Medline: 22380586]
27. Meyer IH. Minority stress and mental health in gay men. J Health Soc Behav 1995 Mar;36(1):38-56. [doi: 10.2307/2137286][Medline: 7738327]
28. Meyer IH. Prejudice, social stress, and mental health in lesbian, gay, and bisexual populations: conceptual issues andresearch evidence. Psychol Bull 2003 Sep;129(5):674-697 [FREE Full text] [doi: 10.1037/0033-2909.129.5.674] [Medline:12956539]
JMIR Public Health Surveill 2020 | vol. 6 | iss. 1 | e14803 | p.74https://publichealth.jmir.org/2020/1/e14803(page number not for citation purposes)
Espinosa da Silva et alJMIR PUBLIC HEALTH AND SURVEILLANCE
XSL•FORenderX

29. Herek GM. Beyond 'Homophobia': thinking about sexual prejudice and stigma in the twenty-first century. Sex Res SocPolicy 2004;1(2):6-24 [FREE Full text] [doi: 10.1525/srsp.2004.1.2.6]
30. Gamarel KE, Reisner SL, Laurenceau J, Nemoto T, Operario D. Gender minority stress, mental health, and relationshipquality: a dyadic investigation of transgender women and their cisgender male partners. J Fam Psychol 2014Aug;28(4):437-447 [FREE Full text] [doi: 10.1037/a0037171] [Medline: 24932942]
31. Major B, O'Brien LT. The social psychology of stigma. Annu Rev Psychol 2005;56:393-421. [doi:10.1146/annurev.psych.56.091103.070137] [Medline: 15709941]
32. Pachankis JE. The psychological implications of concealing a stigma: a cognitive-affective-behavioral model. Psychol Bull2007 Mar;133(2):328-345. [doi: 10.1037/0033-2909.133.2.328] [Medline: 17338603]
33. Secretaria de Salud Centro Nacional para la Prevención y el Control del VIH y el SIDA (CENSIDA). The unique governmentportal | gob.mx. 2015. Informe Nacional de Avances en la Respuesta al VIH y el SIDA: Mexico 2015 URL: https://www.gob.mx/cms/uploads/attachment/file/199665/GARPR_Mx_2016.pdf
34. UNAIDS. The Joint United Nations Programme on HIV/AIDS (UNAIDS). Country: Mexico URL: http://www.unaids.org/en/regionscountries/countries/mexico [accessed 2019-11-28]
35. Pitpitan EV, Goodman-Meza D, Burgos JL, Abramovitz D, Chavarin CV, Torres K, et al. Prevalence and correlates of HIVamong men who have sex with men in Tijuana, Mexico. J Int AIDS Soc 2015;18:19304 [FREE Full text] [doi:10.7448/IAS.18.1.19304] [Medline: 25669423]
36. Salas-Espinoza KJ, Menchaca-Diaz R, Patterson TL, Urada LA, Smith D, Strathdee SA, et al. HIV prevalence and riskbehaviors in male to female (MTF) transgender persons in Tijuana, Mexico. AIDS Behav 2017 Dec;21(12):3271-3278[FREE Full text] [doi: 10.1007/s10461-017-1931-2] [Medline: 29032411]
37. Cheney MK, Gowin MJ, Taylor EL, Frey M, Dunnington J, Alshuwaiyer G, et al. Living outside the gender box in Mexico:testimony of transgender Mexican asylum seekers. Am J Public Health 2017 Oct;107(10):1646-1652. [doi:10.2105/AJPH.2017.303961] [Medline: 28817317]
38. Cuadra-Hernández SM, Zarco-Mera A, Infante-Xibillé C, Caballero-García M. The organization of key populationsconnected to HIV transmission: an intervention to abate stigma; Mexico, 2005-2009. Salud Colect 2012;8(2):191-204. [doi:10.1590/S1851-82652012000200007] [Medline: 23995546]
39. Diehl A, Vieira DL, Zaneti MM, Fanganiello A, Sharan P, Robles R, et al. Social stigma, legal and public health barriersfaced by the third gender phenomena in Brazil, India and Mexico: Travestis, hijras and muxes. Int J Soc Psychiatry 2017Aug;63(5):389-399. [doi: 10.1177/0020764017706989] [Medline: 28552025]
40. Ortiz-Hernández L, Granados-Cosme JA. Violence against bisexuals, gays and lesbians in Mexico City. J Homosex2006;50(4):113-140. [doi: 10.1300/J082v50n04_06] [Medline: 16723343]
41. Castañeda M. El Machismo Invisible Regresa. Madrid: Taurus; 2007.42. Kendall T, Herrera C, Caballero M, Campero L. HIV prevention and men who have sex with women and men in México:
findings from a qualitative study with HIV-positive men. Cult Health Sex 2007;9(5):459-472. [doi:10.1080/13691050601183629] [Medline: 17687672]
43. Verduzco IL, Sánchez TE. Lozano Verduzco I, Rocha Sánchez TE. La homofobia y su relación con la masculinidadhegemónica en México. Rev Puertorriquena Psicol 2011;22:101-121 [FREE Full text]
44. Steffens MC, Jonas KJ, Denger L. Male role endorsement explains negative attitudes toward lesbians and gay men amongstudents in Mexico more than in Germany. J Sex Res 2015;52(8):898-911. [doi: 10.1080/00224499.2014.966047] [Medline:25369554]
45. Panitz DR, McConchie RD, Sauber SR, Fonseca JA. The role of machismo and the Hispanic family in the etiology andtreatment of alcoholism in Hispanic American males. Am J Fam Ther 1983;11(1):31-44 [FREE Full text] [doi:10.1080/01926188308250109]
46. Pines HA, Goodman-Meza D, Pitpitan EV, Torres K, Semple SJ, Patterson TL. HIV testing among men who have sex withmen in Tijuana, Mexico: a cross-sectional study. BMJ Open 2016 Feb 4;6(2):e010388 [FREE Full text] [doi:10.1136/bmjopen-2015-010388] [Medline: 26846899]
47. Pew Research Center. 2014 Feb 13. Emerging Nations Embrace Internet, Mobile Technology URL: https://www.pewresearch.org/global/2014/02/13/emerging-nations-embrace-internet-mobile-technology/ [accessed 2019-11-28]
48. Heckathorn DD. Respondent-driven sampling: a new approach to the study of hidden populations. Soc Probl1997;44(2):174-199 [FREE Full text] [doi: 10.2307/3096941]
49. Heckathorn DD. Extensions of respondent-driven sampling: analyzing continuous variables and controlling for differentialrecruitment. Sociol Methodol 2007;37(1):151-208 [FREE Full text] [doi: 10.1111/j.1467-9531.2007.00188.x]
50. Arciniega GM, Anderson TC, Tovar-Blank ZG, Tracey TJ. Toward a fuller conception of Machismo: development of atraditional Machismo and Caballerismo Scale. J Couns Psychol 2008;55(1):19-33 [FREE Full text] [doi:10.1037/0022-0167.55.1.19]
51. Estrada F, Rigali-Oiler M, Arciniega GM, Tracey TJG. Machismo and Mexican American men: an empirical understandingusing a gay sample. J Couns Psychol 2011 Jul;58(3):358-367. [doi: 10.1037/a0023122] [Medline: 21534655]
52. Herek GM, Cogan JC, Gillis JR, Glunt EK. Correlates of internalized homophobia in a community sample of lesbians andgay men. J Gay Lesbian Med Assoc 1997;2:17-25 [FREE Full text]
JMIR Public Health Surveill 2020 | vol. 6 | iss. 1 | e14803 | p.75https://publichealth.jmir.org/2020/1/e14803(page number not for citation purposes)
Espinosa da Silva et alJMIR PUBLIC HEALTH AND SURVEILLANCE
XSL•FORenderX

53. Centers for Disease Control and Prevention (CDC). HlV/STD risks in young men who have sex with men who do notdisclose their sexual orientation--six US cities, 1994-2000. MMWR Morb Mortal Wkly Rep 2003 Feb 7;52(5):81-86 [FREEFull text] [Medline: 12588004]
54. Coneval. 2019. Consejo Nacional de Evaluación de la Política de Desarrollo Social. Evolución de las líneas de probrezapor ingresos URL: https://www.coneval.org.mx/Medicion/MP/Paginas/Lineas-de-bienestar-y-canasta-basica.aspx
55. Moser A, Stuck AE, Silliman RA, Ganz PA, Clough-Gorr KM. The eight-item modified Medical Outcomes Study SocialSupport Survey: psychometric evaluation showed excellent performance. J Clin Epidemiol 2012 Oct;65(10):1107-1116[FREE Full text] [doi: 10.1016/j.jclinepi.2012.04.007] [Medline: 22818947]
56. Dean G, Orford A, Staines R, McGee A, Smith KJ. Psychosocial well-being and health-related quality of life in a UKpopulation with Usher syndrome. BMJ Open 2017 Jan 12;7(1):e013261 [FREE Full text] [doi:10.1136/bmjopen-2016-013261] [Medline: 28082366]
57. Carey MP, Carey KB, Maisto SA, Gordon CM, Weinhardt LS. Assessing sexual risk behaviour with the Timeline Followback(TLFB) approach: continued development and psychometric evaluation with psychiatric outpatients. Int J STD AIDS 2001Jun;12(6):365-375 [FREE Full text] [doi: 10.1258/0956462011923309] [Medline: 11368817]
58. Kauth MR, St Lawrence JS, Kelly JA. Reliability of retrospective assessments of sexual HIV risk behavior: a comparisonof biweekly, three-month, and twelve-month self-reports. AIDS Educ Prev 1991;3(3):207-214. [Medline: 1834142]
59. Schroder KE, Carey MP, Vanable PA. Methodological challenges in research on sexual risk behavior: II. Accuracy ofself-reports. Ann Behav Med 2003 Oct;26(2):104-123 [FREE Full text] [doi: 10.1207/S15324796ABM2602_03] [Medline:14534028]
60. Greenland S, Pearl J, Robins JM. Causal diagrams for epidemiologic research. Epidemiology 1999 Jan;10(1):37-48. [doi:10.1097/00001648-199901000-00008] [Medline: 9888278]
61. Westreich D, Greenland S. The table 2 fallacy: presenting and interpreting confounder and modifier coefficients. Am JEpidemiol 2013 Feb 15;177(4):292-298 [FREE Full text] [doi: 10.1093/aje/kws412] [Medline: 23371353]
AbbreviationsAOR: adjusted odds ratioDAGs: directed acyclic graphsLMIC: low- and middle-income countriesMSM: men who have sex with menMXN: Mexican pesosRDS: respondent-driven samplingTW: transgender womenVBS: venue-based sampling
Edited by G Eysenbach; submitted 26.05.19; peer-reviewed by J Chow, Q Yuan; comments to author 28.07.19; revised version received20.09.19; accepted 15.11.19; published 30.01.20.
Please cite as:Espinosa da Silva C, Smith LR, Patterson TL, Semple SJ, Harvey-Vera A, Nunes S, Rangel G, Pines HAStigma and Web-Based Sex Seeking Among Men Who Have Sex With Men and Transgender Women in Tijuana, Mexico: Cross-SectionalStudyJMIR Public Health Surveill 2020;6(1):e14803URL: https://publichealth.jmir.org/2020/1/e14803 doi:10.2196/14803PMID:32031963
©Cristina Alisa Espinosa da Silva, Laramie R Smith, Thomas L Patterson, Shirley J Semple, Alicia Harvey-Vera, StephanieNunes, Gudelia Rangel, Heather A Pines. Originally published in JMIR Public Health and Surveillance (http://publichealth.jmir.org),30.01.2020. This is an open-access article distributed under the terms of the Creative Commons Attribution License(https://creativecommons.org/licenses/by/4.0/), which permits unrestricted use, distribution, and reproduction in any medium,provided the original work, first published in JMIR Public Health and Surveillance, is properly cited. The complete bibliographicinformation, a link to the original publication on http://publichealth.jmir.org, as well as this copyright and license informationmust be included.
JMIR Public Health Surveill 2020 | vol. 6 | iss. 1 | e14803 | p.76https://publichealth.jmir.org/2020/1/e14803(page number not for citation purposes)
Espinosa da Silva et alJMIR PUBLIC HEALTH AND SURVEILLANCE
XSL•FORenderX
http://www.ncbi.nlm.nih.gov/entrez/query.fcgi?cmd=Retrieve&db=PubMed&list_uids=1834142&dopt=Abstract
Original Paper
Media Reports as a Source for Monitoring Impact of Influenza onHospital Care: Qualitative Content Analysis
Daphne F M Reukers1, MSc; Sierk D Marbus1, MD; Hella Smit1, BSc; Peter Schneeberger2, MD, PhD; Gé Donker3,
MD, PhD; Wim van der Hoek1, MD, PhD; Arianne B van Gageldonk-Lafeber1, PhD1Centre for Infectious Disease Control, National Institute for Public Health and the Environment, Bilthoven, Netherlands2Regional Laboratory for Medical Microbiology and Infection Prevention, Jeroen Bosch hospital, 's-Hertogenbosch, Netherlands3Nivel, Netherlands Institute for Health Services Research, Utrecht, Netherlands
Corresponding Author:Daphne F M Reukers, MScCentre for Infectious Disease ControlNational Institute for Public Health and the EnvironmentPostbus 13720 BABilthoven,NetherlandsPhone: 31 302743419Email: [email protected]
Abstract
Background: The Netherlands, like most European countries, has a robust influenza surveillance system in primary care.However, there is a lack of real-time nationally representative data on hospital admissions for complications of influenza. Anecdotalinformation about hospital capacity problems during influenza epidemics can, therefore, not be substantiated.
Objective: The aim of this study was to assess whether media reports could provide relevant information for estimating theimpact of influenza on hospital capacity, in the absence of hospital surveillance data.
Methods: Dutch news articles on influenza in hospitals during the influenza season (week 40 of 2017 until week 20 of 2018)were searched in a Web-based media monitoring program (Coosto). Trends in the number of weekly articles were compared withtrends in 5 different influenza surveillance systems. A content analysis was performed on a selection of news articles, andinformation on the hospital, department, problem, and preventive or response measures was collected.
Results: The trend in weekly news articles correlated significantly with the trends in all 5 surveillance systems, including severeacute respiratory infections (SARI) surveillance. However, the peak in all 5 surveillance systems preceded the peak in newsarticles. Content analysis showed hospitals (N=69) had major capacity problems (46/69, 67%), resulting in admission stops (9/46,20%), postponement of nonurgent surgical procedures (29/46, 63%), or both (8/46, 17%). Only few hospitals reported the use ofpoint-of-care testing (5/69, 7%) or a separate influenza ward (3/69, 4%) to accelerate clinical management, but most resorted toad hoc crisis management (34/69, 49%).
Conclusions: Media reports showed that the 2017/2018 influenza epidemic caused serious problems in hospitals throughoutthe country. However, because of the time lag in media reporting, it is not a suitable alternative for near real-time SARI surveillance.A robust SARI surveillance program is important to inform decision making.
(JMIR Public Health Surveill 2020;6(1):e14627) doi:10.2196/14627
KEYWORDS
influenza; severe acute respiratory infections; SARI; surveillance; media reports; news articles; hospital care
JMIR Public Health Surveill 2020 | vol. 6 | iss. 1 | e14627 | p.77http://publichealth.jmir.org/2020/1/e14627/(page number not for citation purposes)
Reukers et alJMIR PUBLIC HEALTH AND SURVEILLANCE
XSL•FORenderX

Introduction
Surveillance of Severe Acute Respiratory InfectionsThe long and intense influenza epidemic in winter 2017/2018in a number of European countries, including the Netherlands,led to substantial morbidity and increased mortality, especiallybecause of pneumonia as a complication of influenza virusinfection [1]. A sudden increase in the number of patientsrequiring hospitalization for (complications of) acute respiratoryinfections may pose a significant burden for hospitals inmanaging bed and staff capacity. It may also severely limit thepossibilities to isolate patients suspected of influenza [2,3].Surveillance of severe acute respiratory infections (SARI),defined as an acute respiratory infection requiringhospitalization, is considered a priority by the European Centrefor Disease Prevention and Control, the World HealthOrganization, and individual countries. However, establishingsurveillance systems in hospitals has proven difficult in manycountries [4-6].
Ideally, surveillance of complications from influenza virusinfection in sentinel hospitals would mimic the well-organizedsurveillance of influenza-like illness (ILI) or acute respiratoryinfections and influenza infection by sentinel generalpractitioners (GPs) in primary care [1]. However, in theEuropean region, very few countries have established syndromicSARI surveillance in combination with testing for influenzavirus [7]. In the Netherlands, limited real-time data on SARIare available from a pilot project in 2 hospitals [8], but this doesnot yet provide a nationally representative picture. Therefore,with a lack of national hospital surveillance data to guide healthcare measures, individual hospitals had to revert to ad hoc crisismanagement when patient numbers started to increase beyondcapacity.
Alternative Surveillance MethodsIn the absence of nationally representative SARI surveillance,nontraditional Web-based data sources could improve the SARIsurveillance. We could not identify previous reports in whichmedia content was analyzed to assess impact on hospitalcapacity. However, in recent years, several studies have exploredthe use of alternative surveillance methods for influenza basedon internet search terms. An example of internet-basedsurveillance system is Google Flu Trends, which monitorshealth-seeking behavior by using data on influenza-relatedsearches to estimate the incidence of ILI in a specific region[9]. It has shown promising results during regular winter seasons[9]; however, it did not predict the 2009 influenza pandemic[10,11]. Multiple other internet-based surveillance systems havebeen developed over the years; however, it is often complexand cumbersome for epidemiologists to extract the relevantinformation from large amounts of data on social media orsearch engine queries [12]. Furthermore, media reports, incomparison with internet queries, have shown to contain morespecific and official data in relation to influenza and other publichealth problems. In a study based on the 2009 pandemic, mediareports were analyzed in relation to several influenzasurveillance methods [11]. A study by Olayinka et al [13]showed that media reports were useful as a supplemental data
source for the real-time mortality monitoring related toHurricane Sandy. As the capacity problems that hospitals facedwere reported in local, regional, and national media, these couldpotentially be a suitable supplemental data source to specificallyassess the impact of hospitalized SARI patients during aninfluenza epidemic.
ObjectivesThe aim of this study was to assess whether media reports duringthe 2017/2018 influenza epidemic provided relevant informationfor estimating the impact of influenza on hospital care as anindicator of the severity of the epidemic in the absence oftraditional hospital-based epidemiological data.
Methods
Search Strategy for Media ReportsA search was conducted using Coosto (Coosto), which is aWeb-based media monitoring and analytics program. The searchterm in Dutch griep EN ziekenhuis (in English: flu/influenzaAND hospital) was used. There is only 1 word for flu/Influenzain Dutch used in media reporting, that is, griep. Only articlesfrom the Netherlands published on regional or national newswebsites during the influenza season (week 40 of 2017 untilweek 20 of 2018) were selected. Trend in weekly number ofnews articles from the Coosto search was plotted against trendsin the different influenza surveillance systems that wereavailable on a weekly basis. A content analysis was performedon a selection of news articles with data on influenza in hospitalsduring the 2017/2018 influenza season. The relevance of thenews articles and possible duplicates was only assessed for thecontent analysis.
Available Respiratory Surveillance Systems in theNetherlands
Influenza-Like IllnessThe basis for the weekly, near real-time surveillance of influenzain the Netherlands is the incidence of ILI as reported byapproximately 40 GP sentinel practices participating in the NivelPrimary Care Database [14]. The population of these sentinelpractices covers 0.7% of the Dutch population and is nationallyrepresentative for age, sex, regional distribution, and populationdensity [15]. The ILI incidence is calculated as the number ofpatients with a new episode of ILI divided by the total numberof enlisted patients in the participating sentinel GP practices.As all Dutch residents are registered in a general practice, thenumber of enlisted patients represents the general population.An influenza epidemic is declared when the ILI incidence is>5.1 per 10,000 inhabitants for a consecutive 2 weeks and wheninfluenza virus is detected in swabs from ILI patients.
Community-Acquired Pneumonia in Primary CarePneumonia data are also obtained from Nivel Primary CareDatabase but from a larger group of GPs (approximately 400)based on automatic extraction of weekly number of patientsconsulting their GP for pneumonia (International Classificationof Primary Care code R81) divided by the total number ofenlisted patients in the participating GP practices [1].
JMIR Public Health Surveill 2020 | vol. 6 | iss. 1 | e14627 | p.78http://publichealth.jmir.org/2020/1/e14627/(page number not for citation purposes)
Reukers et alJMIR PUBLIC HEALTH AND SURVEILLANCE
XSL•FORenderX
Severe Acute Respiratory InfectionsData on SARI incidence is currently limited to information from3 hospitals participating in a pilot SARI surveillance program.In our study, data from 1 hospital were used, the Jeroen Boschhospital (JBH) in ‘s-Hertogenbosch, as these were the mostrobust data available. The SARI incidence was retrospectivelybased on a selection of financial codes that every Dutch hospitalmust use for reimbursement from health insurance companiesrelated to the clinical syndrome SARI divided by the numberof persons (approximately 323,000) in the catchment area ofJBH [16].
Mortality MonitoringIn the Netherlands, all-cause deaths are notified to municipalitiesand then reported to Statistics Netherlands, which collects andmonitors all Dutch vital statistics [1].
Virological SurveillanceFinally, on a weekly basis, about 19 Dutch virologicallaboratories report the number of positive diagnoses of severalviral pathogens, including influenza. Details on the differentsurveillance systems for the 2017/2018 influenza season canbe found in Reukers et al [1].
Media Content AnalysisAfter the search in Coosto, 2 researchers separately scanned alltitles for relevance. Articles were excluded if the title wasunrelated to influenza in hospitals in the Netherlands or if itwas a duplicate news article. Subsequently, full-text articleswere assessed and excluded if irrelevant or duplicate. Aqualitative content analysis was performed on the remainingarticles. In each news article, the following information wasidentified: whether (1) the article was recently published, (2) itcame from a designated spokesperson, (3) the name and placeof the hospital was mentioned, (4) it was about a specifichospital department, and (5) the specific problems pertainingto influenza and the implemented preventive/response measureswere mentioned. This was guided by the paper from Groeneveldet al who already listed the most common problems andprevention/response measures during the 2017/2018 influenzaepidemic [17]. These were applied into the content analysis bycategorizing and counting the number of problems andprevention/response measures reported by each hospital in thenews articles. The problems reported by hospitals in the newsarticles were categorized as (1) hospital admission stops, (2)postponing nonurgent surgical procedures likely caused by thehigh number of influenza patients, (3) staff capacity problemsbecause of influenza, and/or (4) other influenza epidemic-related
problems [17]. Prevention or response measures werecategorized as (1) ad hoc crisis management, (2) regionalcooperation, (3) point-of-care testing (POCT), (4) cohortisolation for influenza patients, or (5) other prevention andcontrol measures [17].
Statistical AnalysisUsing SAS version 9.4, Pearson correlation coefficients(significant at .05 level) were computed between the weeklynumber of media reports and the weekly ILI incidence, weeklynumber of pneumonia consultations per 10.000 inhabitants,weekly SARI incidence, weekly number of all-cause deaths,and weekly influenza diagnoses reported in the virologicallaboratory surveillance.
EthicsThe Dutch Medical Research Involving Human Subjects Act(WMO) does not apply to this study, and therefore, an officialapproval by a Medical Ethical Research Committee is notrequired under the WMO. Furthermore, all data are publiclyavailable. Surveillance data used in this study are available onthe Nivel website (ILI incidence and pneumonia), the NationalInstitute for Public Health and Environment (RIVM) website(SARI incidence and virological data), and the website ofStatistics Netherlands [18].
Results
Comparisons of Media Reports With SurveillanceSystemsThe large majority of the weekly number of news articles fromthe Coosto search (n=730) during the 2017/2018 influenzaseason in the Netherlands coincided with the influenza epidemicas defined by the ILI incidence (Figure 1). The peak in ILIincidence preceded the peak in the number of articles by 5weeks. The ILI incidence reached a peak in week 4 of 2018 andremained high until week 10 of 2018, while the media coverageincreased later from around week 9 and reached a peak in week11 of 2018. Both trends show a steep decrease after week 10and 11, respectively. On visual inspection, similar trends wereobserved for the number of news articles in relation to weeklypneumonia consultations in primary care, SARI surveillance,all-cause mortality, and influenza laboratory diagnoses (Figure1). The trends in ILI incidence and media reports aresignificantly correlated (Table 1). Correlations were evenstronger for pneumonia in primary care, SARI in the JBH,influenza laboratory diagnoses, and all-cause mortality (Table1).
JMIR Public Health Surveill 2020 | vol. 6 | iss. 1 | e14627 | p.79http://publichealth.jmir.org/2020/1/e14627/(page number not for citation purposes)
Reukers et alJMIR PUBLIC HEALTH AND SURVEILLANCE
XSL•FORenderX

Figure 1. Weekly number of news articles and (A) influenza-like illness incidence per 10,000 inhabitants in general practitioner (GP) practices, (B)of patients consulting their GP for pneumonia per 10,000 inhabitants, (C) severe acute respiratory infections incidence per 10,000 inhabitants in JeroenBosch Hospital, (D) number of deaths, and (E) number of influenza diagnoses reported in the virological laboratory surveillance during the 2017/2018influenza season in the Netherlands. ILI: influenza-like illness; SARI: severe acute respiratory infections.
JMIR Public Health Surveill 2020 | vol. 6 | iss. 1 | e14627 | p.80http://publichealth.jmir.org/2020/1/e14627/(page number not for citation purposes)
Reukers et alJMIR PUBLIC HEALTH AND SURVEILLANCE
XSL•FORenderX

Table 1. Correlation between the weekly number of news articles on influenza in hospitals and the weekly influenza-like illness incidence, pneumoniaconsultations, severe acute respiratory infections incidence, number of deaths, and influenza laboratory diagnoses.
P valueCorrelation coefficientWeekly number of news articles correlated with
<.0010.65Influenza-like illness incidencea
<.0010.67Number of pneumonia consultationsa
<.0010.77Severe acute respiratory infections incidencea
<.0010.72Number of all-cause deaths
<.0010.79Number of influenza laboratory diagnosesb
aPer 10.000 inhabitants.bReported in the virological laboratory surveillance.
Selection of Media ReportsFor the content analysis, 147 of the 730 news articles wereexcluded based on the title (Figure 2). The remaining 583
articles were screened for duplicates, leaving 302 news articlesto be assessed in full text. Ultimately, 165 (165/717, 23.0%)news articles were included in the qualitative content analysis(Figure 2).
Figure 2. Flowchart presenting the inclusion and exclusion of regional or national Dutch news articles related to influenza in hospitals in the Netherlandsduring the 2017/2018 influenza season (week 40 of 2017 and until week 20 of 2018) from the Coosto database search using the term flu AND hospital.
JMIR Public Health Surveill 2020 | vol. 6 | iss. 1 | e14627 | p.81http://publichealth.jmir.org/2020/1/e14627/(page number not for citation purposes)
Reukers et alJMIR PUBLIC HEALTH AND SURVEILLANCE
XSL•FORenderX

Content of Media ReportsThe 165 news articles included 77 articles citing 1 or morespecific hospitals or contained a statement from 1 or morehospitals, often by designated spokespersons. The other 88 newsarticles contained more general information about influenzaand/or hospitals.
Geographical Distribution and Type of ReportedProblemsResults from the content analysis show that 52 different hospitalorganizations were named in the included news articles with69 hospital locations. These included 5 academic teachinghospitals, 1 children’s hospital, 35 top clinical teaching hospitals,and 28 general hospitals. These locations were spread acrossthe Netherlands (Figure 3). Of the 69 hospital locations, 23
(33%) reported a large increase in influenza patients but werestill able to cope with the number of admitted patients. Theremaining 46 (46/69, 67%) hospitals had to take measures atleast once during the influenza season; 29 (29/69, 63%) hospitalshad to postpone nonurgent surgical procedures, 9 (9/69, 20%)instated a temporary admission stop, and 8 (8/69, 17%) had totake both of these measures (postponing surgery and admissionstop). Of these 46 hospital locations, 20 (43%) indicated thatthe epidemic caused the largest problems in the emergencydepartment (ED). A total of 25 of the 46 hospitals also indicatedproblems because of staff shortages towing to sick leave causedby influenza. Furthermore, 13 hospitals mentioned a stagnatingflow of patients from the hospital to nursing homes. Thisconcerned elderly patients for whom ongoing hospitalizationwas not medically indicated but who could not be dischargedbecause of social reasons.
Figure 3. Map of the Netherlands with all hospital locations and type of media reports per hospital location.
JMIR Public Health Surveill 2020 | vol. 6 | iss. 1 | e14627 | p.82http://publichealth.jmir.org/2020/1/e14627/(page number not for citation purposes)
Reukers et alJMIR PUBLIC HEALTH AND SURVEILLANCE
XSL•FORenderX

Media Reports on Response and Preventive MeasuresOf all the 69 hospital locations, 29 (42%) mentioned no specificresponse or preventive measures; 34 (49%) hospitalsimplemented some form of crisis management, such as flexibledeployment of staff (working overtime) and flexible bedoccupancy; and 8 (12%) hospitals mentioned a regionalcooperation between hospitals. Furthermore, 5 (5/69, 7%)hospitals used POCT to accelerate clinical management(Admiraal de Ruyter hospital in Goes and Vlissingen, AlbertSchweitzer hospital in Dordrecht, Amphia hospital in Breda,and JBH in ‘s-Hertogenbosch), and 3 (3/69, 4%) hospitals setup a separate influenza ward to isolate the influenza patients(JBH in ‘s-Hertogenbosch, Sint Antonius hospital in Woerden,and Waterland hospital in Purmerend).
Media Reports on Mortality and VaccinationIn the 88 news articles containing general information aboutinfluenza and hospitals, an important topic (13/88, 15%) wasthe high mortality rates, especially among the elderly, relatedto the influenza epidemic. An influential Dutch seniororganization (KBO-PCOB) called this a silent disaster andstarted lobbying for a “winter mortality plan” to be betterprepared in the future. Furthermore, several articles (7/88, 8%)discussed the effectiveness of the influenza vaccine, the lowvaccine uptake (especially among hospital staff), and thepossibility of mandatory influenza vaccination of hospital andnursing home staff.
The remaining news articles (68/88, 77%) included news onregional cooperation among hospitals to cope with the influenzaepidemic, the pressure on ambulance care, crisis exercise toprepare for a large influenza epidemic, respiratory syncytialvirus in very young children compared with influenza, generalstaff capacity issues causing problems during a major (influenza)epidemic, or only included general information on influenza orthe current influenza epidemic.
Discussion
Principal FindingsEven though this study showed that trends in media reports arenot a suitable timely surveillance measure, they do providerelevant information on the impact of influenza on hospitals.Media reporting clearly showed the severity of the epidemicwith a large number of hospitals having problems with capacityand staff shortages affecting patient care in terms of admissionstops and postponement of nonurgent procedures. Media reportsare suitable for retrospective analysis of the impact of aninfluenza epidemic on hospitals; however, real-time data arestill necessary for preparedness and response.
Implications of Study ResultsOn the basis of media reports, the 2017/2018 influenza seasonclearly had a big impact on Dutch hospitals throughout thecountry. It confirms that real-time data on influenza-relatedhospital admissions are needed at local, regional, and nationallevel to inform decision making for preparedness and publichealth response. Improving SARI surveillance was also one ofthe recommendations of the Outbreak Management Team that
was convened by the Dutch Centre for Infectious DiseaseControl in response to the severe influenza epidemic. In theabsence of a sustainable and robust SARI surveillance program,retrospective analysis of media reports on hospitalized influenzapatients offers useful information about the impact of aninfluenza epidemic. However, using media reports for nearreal-time surveillance of hospitalized influenza cases withrespect to preparedness and emergency control is less suitablebecause of the longer time lag between detection of the eventand published media reports compared with other availablesurveillance systems. This is in line with a study by de Langeet al [11] comparing traditional routine ILI surveillance withother systems of surveillance and trends in pandemic-relatednewspaper and television coverage and showed that the increaseand peak in media coverage did not precede increases in ILIincidence.
Health Care InterventionsIn the Netherlands, there was a lack of real-time nationallyrepresentative data that could have guided hospital managementin preparing and implementing mitigating action. No nationalguidelines were issued, in contrast to the United Kingdom,where hospitals were advised by the National Health Serviceto defer nonurgent operations [19]. Hospitals already participatein training programs on how to deal with emergency situations,such as an influenza pandemic or Ebola outbreak [20]. However,there seems to have been no concerted effort in dealing withthe large influx of patients during the 2017/2018 influenzaepidemic. When there is pressure on hospital capacity, it seemsthat hospitals refer to ad hoc crisis management. It shows thatthere is a need for influenza outbreak response plans for hospitalpreparedness in managing outbreaks of SARI. An importantproblem mentioned in the media reports by 13 hospitals wasthat elderly patients could often not be discharged because ofthe social situation of the patient or because no beds wereavailable in nursing homes. Furthermore, many informalcaregivers of these elderly patients were possibly unavailablebecause of influenza [17]. This is a growing problem with anageing population and the prevailing policy that elderly personsshould be encouraged to live independently at home as long aspossible. Therefore, the pressure on informal caregivers andhospital care will likely continue to increase.
Influenza Point-of-Care TestingMost SARI patients admitted to a hospital are not routinelytested for influenza virus infection. Without national hospitalguidelines on influenza diagnostics, influenza testing occursmainly at the discretion of the treating physician. Even inintensive care units, only about half of such patients are tested[21]. Influenza POCT can be performed by nurses in the EDand are available with a turnaround time of 20 min. It wasdemonstrated that implementation of POCT in combinationwith a designated ward for influenza-positive patients duringthe 2017/2018 epidemic led to a marked reduction in length ofhospital stay [2]. Such a policy may have additional benefitsby a decrease in costs and unnecessary use of antibiotics [22].
JMIR Public Health Surveill 2020 | vol. 6 | iss. 1 | e14627 | p.83http://publichealth.jmir.org/2020/1/e14627/(page number not for citation purposes)
Reukers et alJMIR PUBLIC HEALTH AND SURVEILLANCE
XSL•FORenderX

Limitations of the StudyA limitation of using media reports for surveillance purposesis the potential selectivity of media reporting and thereby, theintroduction of selection bias. Especially, reporting on responsemeasures is of concern because it is unclear whether the reportwas initiated by a specific health event or by the hospitals’ aimfor media attention. Moreover, performing qualitative contentanalysis on media reports is time consuming, and the choice ofitems to be analyzed is still rather arbitrary. Developing anautomated surveillance system would be better to extractinformation.
ConclusionsThis study showed that the 2017/2018 influenza epidemic causedserious problems affecting hospitals throughout the country.Media reports are not suitable for near real-time surveillancebecause of the longer time lag compared with other surveillancesystems. This stresses the importance of a robust SARIsurveillance program to inform decision making, which isespecially important in seasons with high or long-lastinginfluenza activity.
Conflicts of InterestNone declared.
References1. Reukers DF, van Asten L, Brandsema PS, Dijkstra F, Donker G, van Gageldonk-Lafeber AB, et al. National Institute for
Public Health and the Environment (RIVM). Bilthoven; 2018. Surveillance of influenza and other repiratory infections inthe Netherlands: winter 2017/ URL: https://www.rivm.nl/bibliotheek/rapporten/2018-0049.pdf
2. Lankelma JM, Hermans MH, Hazenberg EH, Macken T, Dautzenberg PL, Koeijvoets KC, et al. Implementation ofpoint-of-care testing and a temporary influenza ward in a Dutch hospital. Neth J Med 2019 Apr;77(3):109-115 [FREE Fulltext] [Medline: 31012428]
3. Centers for Disease Control and Prevention (CDC) National Center for Immunization and Respiratory Diseases (NCIRD).Prevention Strategies for Seasonal Influenza in Healthcare Settings 2018 URL: https://www.cdc.gov/flu/professionals/infectioncontrol/healthcaresettings.htm [accessed 2019-05-06] [WebCite Cache ID 78AW8aKdh]
4. van den Wijngaard CC, van Pelt W, Nagelkerke NJ, Kretzschmar M, Koopmans MP. Evaluation of syndromic surveillancein the Netherlands: its added value and recommendations for implementation. Euro Surveill 2011 Mar 03;16(9) [FREEFull text] [Medline: 21392486]
5. World Health Organization. Global epidemiological surveillance standards for influenza. Geneva: World Health Organization;2013.
6. European Center for Disease Prevention and Control (ECDC). Meeting report surveillance and studies in a pandemic. 2009Jul Presented at: Fourth meeting of the SSiaP working group; 2009; Stockholm URL: https://www.ecdc.europa.eu/sites/portal/files/media/en/publications/Publications/0908_MER_Surveillance_and_Studies_in_a_Pandemic_Meeting_Report.pdf
7. Meerhoff TJ, Simaku A, Ulqinaku D, Torosyan L, Gribkova N, Shimanovich V, et al. Surveillance for severe acute respiratoryinfections (SARI) in hospitals in the WHO European region - an exploratory analysis of risk factors for a severe outcomein influenza-positive SARI cases. BMC Infect Dis 2015 Jan 08;15:1 [FREE Full text] [doi: 10.1186/s12879-014-0722-x][Medline: 25567701]
8. Marbus SD, Oost JA, van der Hoek W, Meijer A, Polderman FN, de Jager CPC, et al. Ernstige acute luchtweginfecties: deontbrekende bouwsteen in de surveillancepiramide. [Severe acute respiratory infections: the missing building block in thesurveillance pyramid]. Ned Tijdschr Med Micrbiol 2016;24(1):52-56.
9. Ginsberg J, Mohebbi MH, Patel RS, Brammer L, Smolinski MS, Brilliant L. Detecting influenza epidemics using searchengine query data. Nature 2009 Feb 19;457(7232):1012-1014. [doi: 10.1038/nature07634] [Medline: 19020500]
10. Cook S, Conrad C, Fowlkes AL, Mohebbi MH. Assessing Google flu trends performance in the United States during the2009 influenza virus A (H1N1) pandemic. PLoS One 2011;6(8):e23610 [FREE Full text] [doi: 10.1371/journal.pone.0023610][Medline: 21886802]
11. de Lange MM, Meijer A, Friesema IH, Donker GA, Koppeschaar CE, Hooiveld M, et al. Comparison of five influenzasurveillance systems during the 2009 pandemic and their association with media attention. BMC Public Health 2013 Sep24;13:881 [FREE Full text] [doi: 10.1186/1471-2458-13-881] [Medline: 24063523]
12. Velasco E, Agheneza T, Denecke K, Kirchner G, Eckmanns T. Social media and internet-based data in global systems forpublic health surveillance: a systematic review. Milbank Q 2014 Mar;92(1):7-33 [FREE Full text] [doi:10.1111/1468-0009.12038] [Medline: 24597553]
13. Olayinka OO, Bayleyegn TM, Noe RS, Lewis LS, Arrisi V, Wolkin AF. Evaluation of real-time mortality surveillancebased on media reports. Disaster Med Public Health Prep 2017 Aug;11(4):460-466 [FREE Full text] [doi:10.1017/dmp.2016.170] [Medline: 28031073]
14. Verheij RA, Koppes LLJ. 2016. Nivel Zorgregistraties Eerste Lijn [Nivel Primary Care Database] URL: https://www.nivel.nl/nl/nivel-zorgregistraties-eerste-lijn/nivel-zorgregistraties-eerste-lijn
JMIR Public Health Surveill 2020 | vol. 6 | iss. 1 | e14627 | p.84http://publichealth.jmir.org/2020/1/e14627/(page number not for citation purposes)
Reukers et alJMIR PUBLIC HEALTH AND SURVEILLANCE
XSL•FORenderX

15. Donker GA. NIVEL Primary Care Database. Utrecht: NIVEL; 2016. NIVEL Primary Care Database - Sentinel PracticesURL: https://www.nivel.nl/sites/default/files/bestanden/Peilstations_2014_Engels.pdf
16. Dutch Hospital Data. URL: https://www.dhd.nl/klanten/Paginas/home.aspx17. Groeneveld GH, Spaan WJ, van der Hoek W, van Dissel JT. [The severe flu season of 2017-2018: making a case for the
vaccination of healthcare professionals]. Ned Tijdschr Geneeskd 2018 Sep 06;162. [Medline: 30306764]18. Netherlands Institute for Health Services Research (Nivel), National Institute for Public Health and the Environment
(RIVM), Statistics Netherlands (CBS). URL: http://www.nivel.nl/griep; https://www.rivm.nl/luchtweginfecties/sari; http://www.rivm.nl/virologische-weekstaten; http://opendata.cbs.nl
19. NHS England. 2018 Jan 02. Operational update from the NHS National Emergency Pressures Panel (NEPP) URL: https://www.england.nhs.uk/2018/01/operational-update-from-the-nhs-national-emergency-pressures-panel/ [accessed 2019-05-06][WebCite Cache ID 78AWUe39x]
20. Adeoti AO, Marbus S. The European Respiratory Society course on acute respiratory pandemics: how to plan for andmanage them. ERJ Open Res 2018 Jan;4(1) [FREE Full text] [doi: 10.1183/23120541.00156-2017] [Medline: 29450202]
21. van Someren Gréve F, Ong DS, Cremer OL, Bonten MJ, Bos LD, de Jong MD, MARS consortium. Clinical practice ofrespiratory virus diagnostics in critically ill patients with a suspected pneumonia: a prospective observational study. J ClinVirol 2016 Oct;83:37-42 [FREE Full text] [doi: 10.1016/j.jcv.2016.08.295] [Medline: 27567093]
22. Dautzenberg P, Macken T, van Gageldonk-Lafeber AB, Lutgens S. [Wave of flu under control with hospital-wide approach:Jeroen Bosch Hospital manages capacity problems.]. Medisch Contact 2018 Oct [FREE Full text]
AbbreviationsED: emergency departmentGP: general practitionerILI: influenza-like illnessJBH: Jeroen Bosch hospitalPOCT: point-of-care testingSARI: severe acute respiratory infectionsWMO: Medical Research Involving Human Subjects Act
Edited by T Sanchez; submitted 06.05.19; peer-reviewed by M Rehn, P Penttinen, Q Wang; comments to author 16.07.19; revisedversion received 05.09.19; accepted 16.10.19; published 04.03.20.
Please cite as:Reukers DFM, Marbus SD, Smit H, Schneeberger P, Donker G, van der Hoek W, van Gageldonk-Lafeber ABMedia Reports as a Source for Monitoring Impact of Influenza on Hospital Care: Qualitative Content AnalysisJMIR Public Health Surveill 2020;6(1):e14627URL: http://publichealth.jmir.org/2020/1/e14627/ doi:10.2196/14627PMID:32130197
©Daphne FM Reukers, Sierk D Marbus, Hella Smit, Peter Schneeberger, Gé Donker, Wim van der Hoek, Arianne B vanGageldonk-Lafeber. Originally published in JMIR Public Health and Surveillance (http://publichealth.jmir.org), 04.03.2020. Thisis an open-access article distributed under the terms of the Creative Commons Attribution License(https://creativecommons.org/licenses/by/4.0/), which permits unrestricted use, distribution, and reproduction in any medium,provided the original work, first published in JMIR Public Health and Surveillance, is properly cited. The complete bibliographicinformation, a link to the original publication on http://publichealth.jmir.org, as well as this copyright and license informationmust be included.
JMIR Public Health Surveill 2020 | vol. 6 | iss. 1 | e14627 | p.85http://publichealth.jmir.org/2020/1/e14627/(page number not for citation purposes)
Reukers et alJMIR PUBLIC HEALTH AND SURVEILLANCE
XSL•FORenderX

Editorial
The Role of the Global Health Development/EasternMediterranean Public Health Network and the EasternMediterranean Field Epidemiology Training Programs inPreparedness for COVID-19
Mohannad Al Nsour1, PhD; Haitham Bashier1, PhD; Abulwahed Al Serouri2, PhD; Elfatih Malik3, MBBS; Yousef
Khader4, SCD; Khwaja Saeed5, MSc; Aamer Ikram6, PhD; Abdalla Mohammed Abdalla7, MPH; Abdelmounim
Belalia8, PhD; Bouchra Assarag8, PhD; Mirza Amir Baig9, MPH; Sami Almudarra10, PhD; Kamal Arqoub11, MD;
Shahd Osman12, PhD; Ilham Abu-Khader13, MPH; Dana Shalabi13, MBA; Yasir Majeed14, FETP1Global Health Development/Eastern Mediterranean Public Health Network, Amman, Jordan2Yemen Field Epidemiology Training Program, Sana’a, Yemen3University of Khartoum, Khartoum, Sudan4Jordan University of Science and Technology, Irbid, Jordan5Afghanistan Field Epidemiology Training Program, Kabul, Afghanistan6National Institute of Health, Islamabad, Pakistan7Federal Ministry of Health, Khartoum, Sudan8National School of Public Health, Rabat, Morocco9Pakistan Field Epidemiology and Laboratory Training Program, Islamabad, Pakistan10Saudi Field Epidemiology Training Program, Riyadh, Saudi Arabia11Jordan Field Epidemiology Training Program, Amman, Jordan12Sudan Field Epidemiology Training Program, Khartoum, Sudan13Eastern Mediterranean Public Health Network, Amman, Jordan14Iraq Ministry of Health, Baghdad, Iraq
Corresponding Author:Yousef Khader, SCDJordan University of Science and TechnologyAr Ramtha 3030Irbid, 22110JordanPhone: 962 796802040Email: [email protected]
Abstract
The World Health Organization (WHO) declared the current COVID-19 a public health emergency of international concern onJanuary 30, 2020. Countries in the Eastern Mediterranean Region (EMR) have a high vulnerability and variable capacity torespond to outbreaks. Many of these countries addressed the need for increasing capacity in the areas of surveillance and rapidresponse to public health threats. Moreover, countries addressed the need for communication strategies that direct the public toactions for self- and community protection. This viewpoint article aims to highlight the contribution of the Global HealthDevelopment (GHD)/Eastern Mediterranean Public Health Network (EMPHNET) and the EMR’s Field Epidemiology TrainingProgram (FETPs) to prepare for and respond to the current COVID-19 threat. GHD/EMPHNET has the scientific expertise tocontribute to elevating the level of country alert and preparedness in the EMR and to provide technical support through healthpromotion, training and training materials, guidelines, coordination, and communication. The FETPs are currently activelyparticipating in surveillance and screening at the ports of entry, development of communication materials and guidelines, andsharing information to health professionals and the public. However, some countries remain ill-equipped, have poor diagnosticcapacity, and are in need of further capacity development in response to public health threats. It is essential that GHD/EMPHNET
JMIR Public Health Surveill 2020 | vol. 6 | iss. 1 | e18503 | p.86http://publichealth.jmir.org/2020/1/e18503/(page number not for citation purposes)
Al Nsour et alJMIR PUBLIC HEALTH AND SURVEILLANCE
XSL•FORenderX

and FETPs continue building the capacity to respond to COVID-19 and intensify support for preparedness and response to publichealth emergencies.
(JMIR Public Health Surveill 2020;6(1):e18503) doi:10.2196/18503
KEYWORDS
COVID-19; outbreak; preparedness; response; public health
Introduction
BackgroundThe World Health Organization (WHO) declared the currentCOVID-19 a public health emergency of international concernon January 30, 2020 [1]. As of March 19, 2020, a total of220,351 confirmed cases and 8987 deaths were reported [2].Coronaviruses are a large family of respiratory viruses that cancause diseases such as the Middle East Respiratory Syndrome(MERS) and the Severe Acute Respiratory Syndrome (SARS)[3,4]. The causative agent of the current outbreak, which hasoriginated in Wuhan City in China, was identified as anovel coronavirus on January 7, 2020 [5], and the disease hasbeen named COVID-19.
Many countries worldwide are making every effort to preventthe spread of COVID-19. Several reports of clusters of casesamong families and infection of health care workers pointed tothe human-to-human transmission of the virus. Infected patientspresented mostly with fever, cough, and dyspnea within 7-14days of exposure to the infection, and few showed uppergastrointestinal symptoms [6]. About 25% of the infectedpatients, especially the elderly and those with comorbidities,needed intensive care support for acute respiratory symptoms,multiorgan failure, or coinfections [7].
The case fatality rate in the first published report of 99 casesfrom Wuhan was 11% [8]. Another study reported a mortalityrate of 4.3% [9]. It was also estimated that more than 2 newcases are generated by a single infected patient [10]. Theprobable transmission from individuals before the onset ofsymptoms or very early minimal symptoms makes COVID-19much more difficult to control. It reduces the impact oftemperature screening and highlights the critical need foraccurate contact tracing starting from the day before the onsetof symptoms as well as strict quarantine measures andmonitoring before more chains of contagion are established.
Because of the exponential increase in the number of cases anddeaths, many countries have adopted pandemic preparednessactivities and proactive approaches, such as entry restrictionsfrom affected countries; temperature screening at land, air, andsea checkpoints; mandatory leave of absence for travelers within14 days of their return from affected countries; quarantine ofcontacts or those deemed to be in the incubation period; andpublic education and awareness.
A recent study showed that many countries in Africa includingsome countries that are part of the Eastern Mediterranean Region(EMR) have variable capacity to respond to outbreaks and highvulnerability [11]. Beside the protracted conflicts in manycountries in the region, lack of infrastructure, limited resources,inadequate prevention control practices, poor preparedness
capacity, and inadequate laboratory infrastructures and resourcesin many countries in the EMR are among the main barriers toadequately detect and respond to COVID-19. Many of the EMRcountries addressed the need for increasing capacity in the areasof surveillance and rapid identification of suspected cases,patient transfer and isolation, rapid diagnosis, tracing andfollow-up of potential contacts, strict health facility infectionprevention and control, and other active public health controlinterventions. Moreover, countries addressed the need forcommunication strategies that provide general populations andvulnerable populations with actionable information forself-protection, including identification of symptoms, and clearguidance for seeking treatment.
ObjectivesThis viewpoint aimed to highlight the contribution of the GlobalHealth Development (GHD)/Eastern Mediterranean PublicHealth Network (EMPHNET) and the EMR’s FieldEpidemiology Training Programs (FETPs) to the preparednesscapacities in countries in the EMR to respond to the currentCOVID-19 threat.
The Role of the GHD/EMPHNET inPreparedness and Response toCOVID-19
OverviewGHD/EMPHNET has been playing an active role in supportingthe FETPs across the EMR in their efforts to combat COVID-19threats. On a technical level, EMPHNET’s Public HealthEmergency Management Center (PHEMC) has been the hubfor collecting technical information from the programs,disseminating relevant information, and coordinating responseefforts. The center also directed attention to new publicationsand guidelines issued by the WHO and Centers for DiseaseControl and Prevention (CDC).
GHD/EMPHNET is escalating efforts and activities to supportcountries in the EMR in preparedness and response toCOVID-19 outbreak, through its countries’ FETP graduatesand residents. GHD/EMPHNET has the scientific expertise tocontribute to elevating the level of country alert andpreparedness in the EMR and to provide technical supportthrough promotional material (leaflets and brochures),workshops on contact tracing, dissemination of guidelines,regular sharing of technical updates, development of teachingcase-studies to educate public health professionals onCOVID-19, and rapid response team training.
A core team was formed to discuss the current situation andupdates on COVID-19 emergency on a daily basis andsubsequent steps in its response plan. The group comprises the
JMIR Public Health Surveill 2020 | vol. 6 | iss. 1 | e18503 | p.87http://publichealth.jmir.org/2020/1/e18503/(page number not for citation purposes)
Al Nsour et alJMIR PUBLIC HEALTH AND SURVEILLANCE
XSL•FORenderX

PHEMC and Center of Excellence for Applied Epidemiologyalongside representatives from supporting domains like theKnowledge Exchange and Networking. In the regular weeklyteleconference communications with FETP’s directors from 10countries in the EMR, the team discusses updates and any otherresponse activities, discusses and exchanges information,explores and shares the latest technical tools and guidelineswith the FETPs, coordinates response efforts at the national andregional levels, and explores additional support andcollaboration with partners regarding COVID-19 activities. Thisteam coordinates with the rest of the organization to ensure thatefforts made are in their place and of relevance. All theseactivities are just the first steps taken by the GHD/EMPHNET,FETPs, and other stakeholders to alleviate the effects ofcoronavirus in the region.
Considering that sharing of relevant knowledge is key in suchinstances, GHD/EMPHNET has activated its networkingplatform EpiShares [12] to its full capacity for this cause. Notonly has it created a page titled “COVID-19 Updates” to posthourly updates on the virus and its spread, but it has also createda private group titled “FETP Professionals,” which serves as aspace for FETP directors, advisors, and coordinators to discusskey issues of concern in this regard. The group also allows itsmembers to upload documents, and it is a space for sharingmeeting minutes, meeting agendas, and activities planned inresponse to the outbreak. Although the group is exclusive tospecific members, the page is open for public viewing.
In the area of knowledge sharing, the GHD/EMPHNET alsoproduces daily news round-up that it disseminates widely. Thepurpose of this update is to provide authentic news and ensurethat it is filtered from the rumors that are provided bycrowdsourced news platforms. Believing in the significance ofFETPs and their work in such instances, GHD/EMPHNET isalso publishing weekly bulletins to highlight their achievements.
The Efforts of FETPs to Respond to COVID-19The purpose of the FETPs is to increase the epidemiologiccapacity of a country’s public health workforce in order to detectand respond to health threats and develop internal expertise inarea of field epidemiology [13]. As service-based trainingprograms implement competency-based training under thesupervision of qualified mentors/supervisors, these programsfocus on the practice of epidemiology in real time and real place.These programs are focused on building workforce capacity tocontribute to strengthening their country’s health system todetect, notify, report, and respond to events that threaten thenational and international health. They focus on public healthsurveillance, outbreak investigations, epidemiological methods,laboratory and biosafety, risk communications, health-relatedsurveys, and evaluation of the impact of prevention and controlprograms. The FETPs’ curricula aim to improve public healthsystems and develop professional skills to ensure the countrymeets the surveillance and response requirements. The programsare established within the Ministries of Health and accesstechnical assistance from the CDC.
They play an instrumental role in responding to the currentemergency. Being embedded within the ministries of health,national public health institutes, and other public health
agencies, the FETPS in Afghanistan, Bangladesh, Egypt, Iraq,Jordan, Morocco, Pakistan, Saudi Arabia, Sudan, Tunisia, andYemen have been deeply involved in actions responding toCOVID-19, including case investigations, points ofentry/arrivals screening, isolation protocols, transferring cases,risk communication, and training on infection control.
Management FunctionsFor years, FETP graduates have been leading key positions inthe public health system in the Ministry of Health at central,governorate, and district levels. During the current event, FETPsin many countries are members of technical committees inMinistries of Health, coordination platforms with variousstakeholders, and advisory/higher committees. This enabled theFETPs to directly contribute to the national efforts in managingthe COVID-19 threat.
FETPs are directly involved in developing preparedness plansusing different scenarios for preparedness and response. Inaddition, FETP residents and graduates in the region haveassisted in developing/adapting local guidelines, protocols, andcase definitions for health professionals to implement withvarious interventions against COVID-19. They have directlyassisted in assessing the needs in health facilities and forisolation rooms as well as the preparedness activities, andevaluating the surveillance system to identify the gaps andneeds.
SurveillanceAll FETPs in the region play crucial roles in supporting thesurveillance functions in their countries at this time ofCOVID-19 pandemic. Their support is documented at thecentral, provincial, and even local levels. They are activelyengaged in setting up and running the event and case-basedsurveillance. Moreover, they are engaged in searching forrumors that appear on social media and communicate them tothe concerned bodies in the Ministry of Health.
FETP fellows are involved in close monitoring of the globaltrends of COVID-19 and mortality through relevant websites,with daily monitoring of results of surveillance systems andentry point reports for identifying and following up on suspectedcases.
FETPs advisors, graduates, and residents are involved in themanagement of surveillance data, data analysis, reporting ofcases, and development and distribution of a standard casedefinition for the COVID-19.
The FETP fellows in many countries have been working withhospitals to develop isolation and infection control protocols.They assisted in collecting samples and sent them for laboratorytesting to confirm suspected COVID-19 cases.
Screening and Isolation CentersFETPs are participating in screening passengers at differentpoints of entries. Their roles range from running the thermalscanners installed at entry points, interviewing arrivals, filling-insurveillance forms, and contacting the arrivals in the follow-upperiod. FETPs have a direct role in developing and conductingtraining programs for all those who work at the points of entries,
JMIR Public Health Surveill 2020 | vol. 6 | iss. 1 | e18503 | p.88http://publichealth.jmir.org/2020/1/e18503/(page number not for citation purposes)
Al Nsour et alJMIR PUBLIC HEALTH AND SURVEILLANCE
XSL•FORenderX

including health workers and workers from other sectors. Inaddition, FETP fellows participate in training of health workersand organizing and managing the isolation of suspected casesand quarantines for confirmed cases.
Health Promotion and EducationFETPs have significantly contributed to the design anddevelopment of health education messages and promotionalmaterials. FETPs are supporting the direct communication andfollow-up with arrivals from abroad and providing them withthe needed health messages. In some countries, FETP residentsand graduates are responding to public queries through thespecified hotlines. FETP residents are also playing a leadingrole in developing “Question & Answers” documents withstandard appropriate information to be used by hotline personnelin response to the expected public’s questions as well as thedevelopment of communication materials including brochuresand posters.
In some countries, FETPs conducted a series of specializedorientation sessions for health professionals to standardize theprotocols, agree on the case definition, and unify the messageto the public.
ResearchAll residents of the advanced and intermediate levels wereengaged in searching for published scientific literature, standardoperating procedures, and guidelines, and supporteddevelopment of the national guidelines for the COVID-19epidemic. As one of the core competencies, FETPs have startedworking on different operational research and documents. These
research topics are to study the system readiness, knowledge,attitudes, and practices of the health workforce with regard toCOVID-19, epidemiology of the disease at the national level,best practices at the points of entries and isolation centers, andinfection-control measures.
TrainingFETPs in the entire region are directly and significantly involvedin developing training materials and conducting training eventsfor various health professionals. These trainings cover rapidresponse teams, points of entries, contact tracing, lab and samplemanagement, infection control, cases management, and otherprocesses. The modalities range from in-site training tosimulation exercises to practice the countries’ readiness to facethe threat of COVID-19.
Conclusions
The FETPs in the EMR have implemented and are currentlyworking on many activities to strengthen countries’preparednessagainst COVID-19. The FETPs participated actively in airportsurveillance; implemented temperature screening at ports ofentry; developed communication materials and guidelines; andshared information to health professionals and the public, oftenwith a 24-hour dedicated hotlines. However, some countriesremain ill-equipped, have poor diagnostic capacity, and are inneed of further capacity development in response to publichealth threats. It is essential that GHD/EMPHNET and FETPScontinue building the capacity to respond to COVID-19 andintensify support for preparedness and response to public healthemergencies.
Conflicts of InterestNone declared.
References1. World Health Organization. 2020 Jan 30. Statement on the second meeting of the International Health Regulations (2005)
Emergency Committee regarding the outbreak of novel coronavirus (2019-nCoV) URL: https://tinyurl.com/rjdtx2k [accessed2020-02-22]
2. Worldometer. COVID-19 coronavirus pandemic URL: https://www.worldometers.info/coronavirus/ [accessed 2020-03-19]3. de Wit E, van Doremalen N, Falzarano D, Munster VJ. SARS and MERS: recent insights into emerging coronaviruses.
Nat Rev Microbiol 2016 Aug;14(8):523-534. [doi: 10.1038/nrmicro.2016.81] [Medline: 27344959]4. Yin Y, Wunderink RG. MERS, SARS and other coronaviruses as causes of pneumonia. Respirology 2018 Feb;23(2):130-137
[FREE Full text] [doi: 10.1111/resp.13196] [Medline: 29052924]5. Lipsitch M, Swerdlow DL, Finelli L. Defining the Epidemiology of Covid-19 — Studies Needed. N Engl J Med 2020 Mar
26;382(13):1194-1196. [doi: 10.1056/nejmp2002125]6. Zhang J, Dong X, Cao Y, Yuan Y, Yang Y, Yan Y, et al. Clinical characteristics of 140 patients infected with SARS-CoV-2
in Wuhan, China. Allergy 2020 Feb 19. [doi: 10.1111/all.14238] [Medline: 32077115]7. Special Expert Group for Control of the Epidemic of Novel Coronavirus Pneumonia of the Chinese Preventive Medicine
Association. An update on the epidemiological characteristics of novel coronavirus pneumonia(COVID-19). Article inChinese. Zhonghua Liu Xing Bing Xue Za Zhi 2020 Feb 14;41(2):139-144. [doi: 10.3760/cma.j.issn.0254-6450.2020.02.002][Medline: 32057211]
8. Chen N, Zhou M, Dong X, Qu J, Gong F, Han Y, et al. Epidemiological and clinical characteristics of 99 cases of 2019novel coronavirus pneumonia in Wuhan, China: a descriptive study. The Lancet 2020 Feb;395(10223):507-513. [doi:10.1016/s0140-6736(20)30211-7]
9. Wang D, Hu B, Hu C, Zhu F, Liu X, Zhang J, et al. Clinical Characteristics of 138 Hospitalized Patients With 2019 NovelCoronavirus-Infected Pneumonia in Wuhan, China. JAMA 2020 Feb 07;323(11):1061. [doi: 10.1001/jama.2020.1585][Medline: 32031570]
JMIR Public Health Surveill 2020 | vol. 6 | iss. 1 | e18503 | p.89http://publichealth.jmir.org/2020/1/e18503/(page number not for citation purposes)
Al Nsour et alJMIR PUBLIC HEALTH AND SURVEILLANCE
XSL•FORenderX

10. Wu J, Leung K, Leung G. Nowcasting and forecasting the potential domestic and international spread of the 2019-nCoVoutbreak originating in Wuhan, China: a modelling study. The Lancet 2020 Feb;395(10225):689-697 [FREE Full text][doi: 10.1016/S0140-6736(20)30260-9]
11. Gilbert M, Pullano G, Pinotti F, Valdano E, Poletto C, Boëlle P, et al. Preparedness and vulnerability of African countriesagainst importations of COVID-19: a modelling study. The Lancet 2020 Mar;395(10227):871-877 [FREE Full text] [doi:10.1016/S0140-6736(20)30411-6]
12. Epishares. URL: https://epishares.net/ [accessed 2020-03-26]13. White ME, McDonnell SM, Werker DH, Cardenas VM, Thacker SB. Partnerships in international applied epidemiology
training and service, 1975-2001. Am J Epidemiol 2001 Dec 01;154(11):993-999 [FREE Full text] [doi:10.1093/aje/154.11.993] [Medline: 11724714]
AbbreviationsCDC: Centers for Disease Control and PreventionEMPHNET: Eastern Mediterranean Public Health NetworkEMR: Eastern Mediterranean RegionFETP: Field Epidemiology Training ProgramGHD: Global Health DevelopmentMERS: Middle East Respiratory SyndromePHEMC: Public Health Emergency Management CenterSARS: Severe Acute Respiratory SyndromeWHO: World Health Organization
Edited by T Sanchez, G Eysenbach; submitted 01.03.20; peer-reviewed by A Batieha, R Araj; comments to author 10.03.20; revisedversion received 19.03.20; accepted 19.03.20; published 27.03.20.
Please cite as:Al Nsour M, Bashier H, Al Serouri A, Malik E, Khader Y, Saeed K, Ikram A, Abdalla AM, Belalia A, Assarag B, Baig MA, AlmudarraS, Arqoub K, Osman S, Abu-Khader I, Shalabi D, Majeed YThe Role of the Global Health Development/Eastern Mediterranean Public Health Network and the Eastern Mediterranean FieldEpidemiology Training Programs in Preparedness for COVID-19JMIR Public Health Surveill 2020;6(1):e18503URL: http://publichealth.jmir.org/2020/1/e18503/ doi:10.2196/18503PMID:32217506
©Mohannad Saleh Al Nsour, Haitham Bashier, Abulwahed Al Serouri, Elfatih Malik, Yousef Khader, Khwaja Saeed, AamerIkram, Abdalla Mohammed Abdalla, Abdelmounim Belalia, Bouchra Assarag, Mirza Amir Baig, Sami Almudarra, Kamal Arqoub,Shahd Osman, Ilham Abu-Khader, Dana Shalabi, Yasir Majeed. Originally published in JMIR Public Health and Surveillance(http://publichealth.jmir.org), 27.03.2020. This is an open-access article distributed under the terms of the Creative CommonsAttribution License (https://creativecommons.org/licenses/by/4.0/), which permits unrestricted use, distribution, and reproductionin any medium, provided the original work, first published in JMIR Public Health and Surveillance, is properly cited. The completebibliographic information, a link to the original publication on http://publichealth.jmir.org, as well as this copyright and licenseinformation must be included.
JMIR Public Health Surveill 2020 | vol. 6 | iss. 1 | e18503 | p.90http://publichealth.jmir.org/2020/1/e18503/(page number not for citation purposes)
Al Nsour et alJMIR PUBLIC HEALTH AND SURVEILLANCE
XSL•FORenderX

Original Paper
Follow-Up Investigation on the Promotional Practices of ElectricScooter Companies: Content Analysis of Posts on Instagram andTwitter
Allison Dormanesh1, MS; Anuja Majmundar1, MBA; Jon-Patrick Allem1, MA, PhDKeck School of Medicine of USC, Los Angeles, CA, United States
Corresponding Author:Jon-Patrick Allem, MA, PhDKeck School of Medicine of USC2001 N Soto Street, 3rd FloorLos Angeles, CA, STE K318United StatesPhone: 1 13234427921Email: [email protected]
Related Article: Comment in: https://publichealth.jmir.org/2020/4/e18945/
Abstract
Background: Electric scooters (e-scooters) have become a popular mode of transportation in both the United States and Europe.In the wake of this popularity, e-scooters have changed the commuting experience in many metropolitan areas. Although e-scootersoffer an efficient and economical way to travel short distances in traffic-congested areas, recent studies have raised concerns overtheir safety. Bird and Tier Mobility are 2 popular e-scooter companies in the United States and Europe, respectively. Bothcompanies maintain active social media accounts with hundreds of posts and tens of thousands of followers. Recent studies haveshown that consumer behavior may be influenced by the content posted to popular social media platforms, such as Instagram andTwitter.
Objective: This study aimed to examine the official Instagram and Twitter accounts of Bird and Tier Mobility to determinewhether these companies promote and demonstrate the use of safety gear in their posts to their consumers.
Methods: Posts to Bird’s (n=287) and Tier Mobility’s (n=190) official Instagram accounts, as well as Bird’s (n=313) and TierMobility’s (n=67) official Twitter accounts, were collected from November 9, 2018, to October 7, 2019. Rules for coding contentof posts were informed by previous research.
Results: Among posts to Bird’s Instagram account, 69.3% (199/287) had a person visible with an e-scooter, 9.1% (26/287)contained persons wearing protective gear, and there were no mentions of protective gear in captions corresponding to the post.Among posts to Tier Mobility’s Instagram account, 84.7% (161/190) contained a person visible with an e-scooter, 36.3% (69/190)contained persons wearing protective gear, and 4.2% (8/190) of captions corresponding to posts mentioned protective gear. Amongposts to Bird’s Twitter account, 71.9% (225/313) had an image, of which 44.0% (99/225) contained a person visible with ane-scooter and 15.1% (34/225) contained persons wearing protective gear. Among posts to Tier Mobility’s Twitter account, 78%(52/67) had an image, of which 52% (27/52) contained a person with an e-scooter and 21% (11/52) contained persons wearingprotective gear.
Conclusions: Findings show that modeling and promoting safety is rare on Bird’s and Tier Mobility’s official social mediaaccounts, which may contribute to the normalization of unsafe riding practices. Social media platforms may offer a potentialavenue for public health officials to intervene with rider safety campaigns for public education.
(JMIR Public Health Surveill 2020;6(1):e16833) doi:10.2196/16833
KEYWORDS
electric scooter; scooters; public safety; road safety; social media; marketing; technology; ride sharing; public health
JMIR Public Health Surveill 2020 | vol. 6 | iss. 1 | e16833 | p.91http://publichealth.jmir.org/2020/1/e16833/(page number not for citation purposes)
Dormanesh et alJMIR PUBLIC HEALTH AND SURVEILLANCE
XSL•FORenderX

Introduction
BackgroundOver the past 3 years, electric scooters (e-scooters) have becomea popular mode of transportation in both the United States andEurope [1]. In the wake of this popularity, the commutingexperience in many metropolitan areas has changed. E-scootercompanies offer rentable, dockless, generally affordable,single-rider e-scooters that can reach speeds of 15 miles perhour and traverse 30 miles on 1 charge. Consumers can accessthese e-scooters through Web or downloadable apps on theirsmartphones. Once logged in, each user can be directed to theclosest e-scooter available via global positioning system. Afterfinishing their ride, users can leave the e-scooter anywherewithin the legal parking zones, indicated on their mobile app.
Although e-scooters offer an efficient and economical way totravel short distances in traffic-congested areas [1,2], recentstudies have raised concerns over their safety. For instance, theAustin Public Health Department and Center for Disease Controland Prevention recently published a study on injuries and riskfactors associated with rentable, dockless e-scooter use [3].They found that often the injuries sustained were to the rider’shead (48%), and only 1 in 190 riders were wearing a helmet[3]. A second study on e-scooter injuries from SouthernCalifornia recorded 249 injuries associated with e-scooter useover the course of 1 year [4]. It found that 80% of riders wereinjured from a fall, and 10 out of 249 riders were wearing ahelmet (only 4% of all riders) [4]. European countries likeGermany have also experienced a rise in the use of e-scooters,and subsequent reports of injuries. Within a 3-month period,police statistics showed that 74 e-scooter-related accidentsoccurred in Berlin, and over 200 e-scooter riders were cited fortraffic violations [5]. Taken all together, the growing numberof injuries from the use of e-scooters highlights the importanceof promoting safe riding practices among e-scooter customers.
Previous research has suggested that the promotional activitiesfrom companies on popular social media platforms mayinfluence consumer behavior [5], and this influence may extendto the perceived norms relating to e-scooter safety, for example,wearing safety gear [6]. In a previous study analyzing data from2017 to 2018, Allem and Majmundar demonstrated that poststo Bird’s (one of the leading US e-scooter companies) officialInstagram account rarely (6% of the time) showed users wearingprotective gear when photographed with an e-scooter [6].Although this study was the first to characterize any social mediaactivity from an e-scooter company, additional research isneeded that considers multiple social media platforms frommultiple e-scooter companies to better understand promotionalpractices pertaining to e-scooter safety.
The e-scooter industry is characterized by high growth [4] andintense competition inside and outside of the United States [1].Bird, for example, is valued at over US $2 billion [2,7], and asof October 2019, has been funded US $275 million to expandfurther [8]. Similarly, European countries are experiencingdemand for e-scooter options to lower traffic congestion,increase parking availability, and improve air quality [1]. Forinstance, as of May 2019, Germany legalized e-scooters [9],
and as a result, Tier Mobility (a Berlin-based start-up company)has made efforts to change Germany’s public transportationinfrastructure, including partnerships with public transport,municipal service, and private mobility providers [10]. Theirmain goal is to use these partnerships to change the status quoof urban mobility [10]. Tier Mobility, which started about ayear after Bird in 2018, has quickly received 10 million ridesin the 11 months since they have launched, a majority of whichoccurred between June and October of 2019 [11]. This useractivity is comparable with Bird’s user activity in the UnitedStates (Bird achieved 10 million rides in its first year) [12].Although other companies, for example Uber, provide e-scootersas modes of transportation in the United States and abroad, Uberoffers and promotes bicycles and other ridesharing services.Bicycles are distinct from e-scooters—subjected to differentlaws and risks from riding on the road. As a result, this studyexamined the safety promotions of companies (Bird and TierMobility) that prioritize e-scooters over other ridesharingoptions.
The promotion of safe riding practices on behalf of e-scootercompanies is ever pressing, especially on popular social mediaplatforms. In 2018, Bird went on record stating that it utilizes,“targeted advertising with safety messages on social mediaplatforms” [13]. Tier Mobility has also been on recordencouraging its consumers to wear helmets, as well as engagewith their introductory tutorial to learn how to avoid accidents[14].
ObjectiveThis study revisits the promotional practices of Bird onInstagram to include their most recent posts, and goes beyondprevious research by including the Instagram posts from asecond comparable company, Tier Mobility. In addition, thisstudy includes Twitter posts from Bird and Tier Mobility.Findings could inform health communication campaigns aimedat promoting safe e-scooter practices.
Methods
Posts, including images and captions, were collected from Bird’s(n=287) and Tier Mobility’s (n=190) official Instagram accountsand Bird’s (n=313) and Tier Mobility’s (n=67) official Twitteraccounts between November 9, 2018, and October 7, 2019.
Instagram AnalysisSimilar to previous research [6], each Instagram post wasreviewed by 1 author and characterized as to whether (1)person(s) was or were visible in the post with an e-scooter, (2)person(s) in the post was or were wearing any protective gear(eg, if any of the following were present on the person(s):helmet, wrist guards, elbow pads, or knee pads, then protectivegear was coded as present), (3) protective gear was visibleanywhere in the post, (4) protective gear or safety wasmentioned in the captions corresponding to the post, (5) thepost was a repost or the photo credited to a customer of thecompany and adopted for their own use, and (6) number of likes.To establish interreliability, a second investigator coded asubsample of posts (n=50) from Bird’s Instagram account.Agreement ranged from 92% to 100% for the coded categories.
JMIR Public Health Surveill 2020 | vol. 6 | iss. 1 | e16833 | p.92http://publichealth.jmir.org/2020/1/e16833/(page number not for citation purposes)
Dormanesh et alJMIR PUBLIC HEALTH AND SURVEILLANCE
XSL•FORenderX

The number of followers from each Instagram account werealso recorded.
Twitter AnalysisEach Twitter post was reviewed by 1 author and characterizedas to whether (1) it contained an image (eg, pictures and videos),(2) person(s) was or were visible in the post with an e-scooter,(3) person(s) in the post was or were wearing any protectivegear (eg, if any of the following were present on the person(s):helmet, wrist guards, elbow pads, or knee pads, then protectivegear was coded as present), (4) protective gear was visibleanywhere in the post, (5) protective gear or safety wasmentioned in the post, (6) the number of likes, and (7) thenumber of retweets. To establish interreliability, a secondinvestigator coded a subsample of posts (n=50) from Bird’sTwitter account. Agreement ranged from 90% to 100% for thecoded categories. The number of followers from each Twitteraccount were also recorded.
All analyses relied on publicly available data, accessible throughInstagram’s or Twitter’s website or mobile device app. Thisstudy adhered to the terms and conditions, terms of use, andprivacy policy of Instagram and Twitter. Descriptive statisticswere reported for each category.
Results
Analysis of Instagram PostsThe Instagram accounts of Bird and Tier Mobility hadapproximately 89,000 followers and 12,000 followers,respectively. Among posts to Bird’s Instagram account, 69.3%(199/287) had a person visible with an e-scooter, 9.1% (26/287)contained persons wearing protective gear, 11.5% (33/287)contained protective gear somewhere in the post, and there wereno mentions of protective gear in the captions (see MultimediaAppendix 1 for example posts). About 53.3% (153/287) ofBird’s posts were reposts, and among reposts, 2.9% (4/153) hadpersons wearing protective gear. Likes per post ranged from 89to 28,926 (mean 1155.69, median 598).
Among posts to Tier Mobility’s Instagram account, 84.7%(161/190) contained a person visible with an e-scooter, 36.3%(69/190) contained persons wearing protective gear, 44.7%(85/190) had protective gear somewhere in the post, and 4.2%(8/190) of captions corresponding to the post mentioned safety.About 8.9% (17/190) of Tier’s posts were reposts, and amongreposts, 2% (1/17) had persons wearing protective gear. Likesper post ranged from 34 to 5190 (mean 367.88, median 139.50).
Analysis of TweetsThe Twitter accounts of Bird and Tier Mobility had about 17,000followers and 2000 followers, respectively. Among Bird’sTwitter posts, 71.9% (225/313) had an image, of which 44.0%(99/225) had a person visible with an e-scooter, 15.1% (34/225)contained persons wearing protective gear, and 21.3% (48/225)contained protective gear somewhere in the post. Among allposts, 5.8% (18/313) mentioned safety. Likes per post rangedfrom 0 to 398 (mean 25.58, median 16.00), whereas retweetsper post ranged from 0 to 83 (mean 4.57, median 2.00). AmongTier Mobility’s Twitter posts, 78% (52/67) had an image, of
which 52% (27/52) contained a person visible with an e-scooter,21% (11/52) contained persons wearing protective gear, and25% (13/52) had protective gear somewhere in the post. Amongall posts, 5% (3/67) mentioned safety. Likes per post rangedfrom 1 to 54 (mean 12.04, median 8.00), whereas retweetsranged from 0 to 16 (mean 3.49, median 2.00).
Discussion
Overall FindingsPosts to the official social media accounts of Bird and TierMobility seldomly showed e-scooters being used with protectivegear. In addition, findings showed that Bird and Tier Mobilityutilize customers’ photos of their e-scooter experiences inpromotions through reposts on Instagram. These reposts rarelyshowed e-scooters being used with safety in mind. Posts fromboth companies on both platforms received likes from theirfollowers demonstrating engagement with the promotionalcontent.
Findings from this study are similar to an earlier reportdemonstrating that posts to Bird’s Instagram account rarelyshowed riders wearing protective gear when photographed withe-scooters [6]. Findings from this study call into question Bird’sclaims regarding their use of advertising with safety messageson social media platforms [13]. Taken all together, rider safetydoes not seem to be modeled or promoted on the social mediaaccounts of popular e-scooter companies.
Although e-scooter companies state that they always encourageriders to wear a helmet [15], such companies could takeadvantage of the popularity of their social media accounts, andthe impact of social media, by highlighting the advantages ofusing protective gear while riding e-scooters, and through otherforms of education (eg, short videos). Educating consumersabout the functional benefits of each type of protective gear canhelp reduce the impact of injuries from accidents (eg, kneepadscan help prevent serious bruises in case of a fall and helmetscan help prevent severe head injuries).
Bird’s primary avenue for providing users with safetysuggestions is through their mobile phone app or website, whichincludes (1) suggestions of where to ride and park, (2) requiringusers to be older than 18 years to ride, (3) allowing only 1 riderper vehicle, (4) providing traffic rules, and (5) suggesting helmetuse [13]. Bird users can click on a safety tab, on the mobile app,and get directed to a page that allows them to order a helmetfor US $9.99 (shipping cost). They also provide an optionalhow to ride safety tutorial. Similarly, Tier Mobility urges helmetuse through their how Tier works tab on their website [16]. Incontrast to Bird, Tier Mobility does not currently offer freehelmets. Although both companies give indication of safetymeasures for their users, posts to social media platforms couldfurther influence their users’ attitudes and behaviors [17]. Themajority of e-scooter injuries are among those who are 18 to29 years of age, an age group that often engages with socialmedia [3]. In this study, engagement was measured by recordingthe number of likes and retweets received by Bird’s and TierMobility’s followers. Retweets represent approval for the
JMIR Public Health Surveill 2020 | vol. 6 | iss. 1 | e16833 | p.93http://publichealth.jmir.org/2020/1/e16833/(page number not for citation purposes)
Dormanesh et alJMIR PUBLIC HEALTH AND SURVEILLANCE
XSL•FORenderX

content of the post [18] and can perpetuate such contentthroughout the Twittersphere [19].
Previous studies have highlighted the importance of safety gearas a preventive measure for rider injuries. Thompson et alanalyzed 5 case-control studies and determined that helmetscan reduce the risk of head, brain, and severe brain injury by63% to 88% [20]. Although their study focused on bicyclists,protective gear could provide similar protection for other2-wheel vehicles like e-scooters. Bird’s and Tier Mobility’slack of promotion of safety gear on social media, in combinationwith a lack of warnings within post’s corresponding caption,may influence how riders understand the safety of theseemerging modes of transportation.
LimitationsOur findings are limited to posts on Instagram and Twitter andmay not pertain to posts on other social media platforms likeSnapchat. Our findings are also limited to 2 e-scooter companies(Bird and Tier Mobility) and may not pertain to other companies.Although companies like Lime, Lyft, and Uber offer numerousmodes of transportation, including ridesharing cars, bicycles,
and e-scooters, Bird and Tier Mobility focus on e-scooters.E-scooters have a specific set of risks from use, as well asspecific laws to follow, and as a result, Bird and Tier Mobilitywere the focus of this study. The posts in this study werecollected from an 11-month period and may not extend to othertime periods. This study could not determine whether posts toTwitter or Instagram directly influenced consumer behavior anddid not determine if protective gear would be effective inpreventing injuries. However, previous research has shown thatwearing helmets can mitigate the extent of injuries frommotorized vehicles [20], and that communications on socialmedia platforms may influence behavior [21].
ConclusionsFindings from this study show that modeling and promotingsafety is rare on Bird’s and Tier Mobility’s official social mediaaccounts. These promotional practices may contribute to theperceived norms relating to e-scooter safety. Social media mayoffer a potential avenue for public health officials to intervenewith promotional messages of their own to increase safe ridingpractices.
AcknowledgmentsAll authors volunteered their time for this study. The data collected were free and publicly available.
Conflicts of InterestNone declared.
Multimedia Appendix 1Example posts from Instagram and Twitter.[DOCX File , 684 KB - publichealth_v6i1e16833_app1.docx ]
References1. Hardt C, Bogenberger K. Usage of e-Scooters in urban environments. Transp Res Procedia 2019;37:155-162. [doi:
10.1016/j.trpro.2018.12.178]2. Choron RL, Sakran JV. The integration of electric scooters: useful technology or public health problem? Am J Public Health
2019 Apr;109(4):555-556. [doi: 10.2105/AJPH.2019.304955] [Medline: 30865508]3. Austin Public Health, Center for Disease Prevention and Control. Government of Austin Texas. 2019. Dockless Electric
Scooter-Related Injuries Study URL: http://www.austintexas.gov/sites/default/files/files/Health/Web_Dockless_Electric_Scooter-Related_Injury_Study_final_version_EDSU_5.14.19.pdf [accessed 2020-01-01]
4. Trivedi TK, Liu C, Antonio AL, Wheaton N, Kreger V, Yap A, et al. Injuries associated with standing electric scooter use.JAMA Netw Open 2019 Jan 4;2(1):e187381 [FREE Full text] [doi: 10.1001/jamanetworkopen.2018.7381] [Medline:30681711]
5. Giordano C. Published September 27. 2019 Sep 17. Electric Scooters Cause 74 Accidents and Hundreds of Traffic Offencesin Three Months Since Legalisation in Berlin URL: https://www.independent.co.uk/news/world/europe/electric-scooter-accidents-berlin-germany-legalisation-police-a9108916.html [accessed 2020-01-01]
6. Allem JP, Majmundar A. Are electric scooters promoted on social media with safety in mind? A case study on Bird'sInstagram. Prev Med Rep 2019 Mar;13:62-63 [FREE Full text] [doi: 10.1016/j.pmedr.2018.11.013] [Medline: 30515366]
7. Griffith E. The New York Times. 2019 Jun 22. Bird Is Said to Raise New Funding at $2.5 Billion Valuation URL: https://www.nytimes.com/2019/07/22/technology/bird-scooters-valuation.html [accessed 2020-01-01]
8. Bird - Enjoy the Ride. 2019 Oct 3. Bird Announces $275 Million Series D Funding URL: https://www.bird.co/press/bird-announces-275-million-series-d-funding/ [accessed 2020-01-01]
9. Bloomberg. Scooter Startup Tier Eyes European Market as it Raises $60 Million URL: https://www.bloomberg.com/news/videos/2019-10-07/scooter-startup-tier-eyes-european-market-as-it-raises-60-million-video [accessed 2019-10-16]
10. TIER – change mobility for good. How We Utilise Partnerships to Drive Sustainable Access to Mobility URL: https://www.tier.app/2019/09/26/how-we-use-technology-to-drive-sustainable-and-inclusive-mobility-2/ [accessed 2019-10-28]
JMIR Public Health Surveill 2020 | vol. 6 | iss. 1 | e16833 | p.94http://publichealth.jmir.org/2020/1/e16833/(page number not for citation purposes)
Dormanesh et alJMIR PUBLIC HEALTH AND SURVEILLANCE
XSL•FORenderX
https://www.tier.app/2019/09/26/how-we-use-technology-to-drive-sustainable-and-inclusive-mobility-2/

11. Lunden I. TechCrunch. 2019 Oct 7. Berlin’s Tier Mobility Scoops Up $60M as Its Scooter-based Transportation ServicePasses 10M Rides URL: https://techcrunch.com/2019/10/07/berlins-tier-mobility-scoops-up-60m-for-its-scooter-based-transportation-service/ [accessed 2019-10-16]
12. Dickey MR. TechCrunch. 2018 Sep 20. Bird Hits 10 Million Scooter Rides URL: http://social.techcrunch.com/2018/09/20/bird-hits-10-million-scooter-rides/ [accessed 2019-10-23]
13. Holley P. The Washington Post. 2018 Dec 21. Bird Says Safety is Its ‘Top Priority.’ So Why is the E-scooter Company’sInstagram Page Nearly Devoid of Helmets? URL: https://www.washingtonpost.com/technology/2018/12/21/bird-says-safety-is-their-top-priority-so-why-is-e-scooter-companys-instagram-page-nearly-devoid-helmets/ [accessed2019-10-23]
14. Connolly K. The Guardian. 2019 May 16. Eco Wonder or Safety Nightmare? Germany to Vote on E-scooters URL: https://www.theguardian.com/cities/2019/may/16/germany-to-vote-on-law-allowing-e-scooters-on-roads [accessed 2019-10-25]
15. Bird - Enjoy the Ride. 2019 Oct 16. Safety URL: https://www.bird.co/safety/ [accessed 2020-01-01]16. TIER – change mobility for good. 2019 Oct 23. How TIER works URL: https://www.tier.app/how-tier-works/ [accessed
2020-01-01]17. Scholz C, Jovanova M, Baek EC, Falk EB. Media content sharing as a value-based decision. Curr Opin Psychol 2019 Aug
12;31:83-88. [doi: 10.1016/j.copsyc.2019.08.004] [Medline: 31542712]18. Majmundar A, Allem JP, Cruz TB, Unger JB. The Why We Retweet scale. PLoS One 2018;13(10):e0206076 [FREE Full
text] [doi: 10.1371/journal.pone.0206076] [Medline: 30335827]19. Chu K, Unger JB, Allem JP, Pattarroyo M, Soto D, Cruz TB, et al. Diffusion of messages from an electronic cigarette brand
to potential users through Twitter. PLoS One 2015;10(12):e0145387 [FREE Full text] [doi: 10.1371/journal.pone.0145387][Medline: 26684746]
20. Thompson D, Rivara F, Thompson R. Helmets for preventing head and facial injuries in bicyclists. Cochrane DatabaseSyst Rev 2000(2):CD001855. [doi: 10.1002/14651858.CD001855] [Medline: 10796827]
21. Kumar A, Bezawada R, Rishika R, Janakiraman R, Kannan P. From social to sale: the effects of firm-generated content insocial media on customer behavior. J Mark 2016;80(1):7-25. [doi: 10.1509/jm.14.0249]
Abbreviationse-scooter: electric scooter
Edited by G Eysenbach; submitted 29.10.19; peer-reviewed by B Kerr, R Lee, M Barbosa, A Benis; comments to author 19.11.19;revised version received 28.11.19; accepted 16.12.19; published 23.01.20.
Please cite as:Dormanesh A, Majmundar A, Allem JPFollow-Up Investigation on the Promotional Practices of Electric Scooter Companies: Content Analysis of Posts on Instagram andTwitterJMIR Public Health Surveill 2020;6(1):e16833URL: http://publichealth.jmir.org/2020/1/e16833/ doi:10.2196/16833PMID:32012087
©Allison Dormanesh, Anuja Majmundar, Jon-Patrick Allem. Originally published in JMIR Public Health and Surveillance(http://publichealth.jmir.org), 23.01.2020. This is an open-access article distributed under the terms of the Creative CommonsAttribution License (https://creativecommons.org/licenses/by/4.0/), which permits unrestricted use, distribution, and reproductionin any medium, provided the original work, first published in JMIR Public Health and Surveillance, is properly cited. The completebibliographic information, a link to the original publication on http://publichealth.jmir.org, as well as this copyright and licenseinformation must be included.
JMIR Public Health Surveill 2020 | vol. 6 | iss. 1 | e16833 | p.95http://publichealth.jmir.org/2020/1/e16833/(page number not for citation purposes)
Dormanesh et alJMIR PUBLIC HEALTH AND SURVEILLANCE
XSL•FORenderX

Original Paper
Distracted Driving on YouTube: Categorical and QuantitativeAnalyses of Messages Portrayed
Marko Gjorgjievski1, MD; Sheila Sprague1, PhD; Harman Chaudhry2, MSc, MD; Lydia Ginsberg3, BSc; Alick Wang4,
BSc, MD; Mohit Bhandari3, MD, PhD; Bill Ristevski3, MSc, MD1Centre for Evidence-Based Orthopaedics, McMaster University, Hamilton, ON, Canada2Division of Orthopaedic Surgery, University of Toronto, Toronto, ON, Canada3Division of Orthopaedic Surgery, McMaster University, Hamilton, ON, Canada4Department of Neurosurgery, University of Ottawa, Ottawa, ON, Canada
Corresponding Author:Marko Gjorgjievski, MDCentre for Evidence-Based OrthopaedicsMcMaster University293 Wellington Street NorthHamilton, ONCanadaPhone: 1 6474609692Email: [email protected]
Abstract
Background: Distracted driving is a global epidemic, injuring and killing thousands of people every year. To better understandwhy people still engage in this dangerous behavior, we need to assess how the public gets informed about this issue. Knowingthat many people use the internet as their primary source of initial research on topics of interest, we conducted an assessment ofpopular distracted driving videos found on YouTube.
Objective: This study aimed to gauge the popularity of distracted driving videos and to assess the messages portrayed byclassifying the content, context, and quality of the information available on YouTube.
Methods: We conducted a search on YouTube using 5 different phrases related to distracted driving. Videos with more than3000 views that mentioned or portrayed any aspect of distracted driving were identified, collected, and analyzed. We measuredpopularity by the number of videos uploaded annually and the number of views and reactions. Two independent researchersreviewed all the videos for categorical variables. Content variables included distractions; consequences; orthopedic injuries; andwhether the videos were real accounts, reenactments, fictitious, funny, serious, and graphic. Context variables assessed the settingof the events in the video, and quality of information was measured by the presence of peer-reviewed studies and inclusion andreferencing of statistics. Discrepancies in data collection were resolved by consensus via the coding authors. A comparativesubanalysis of the 10 most viewed videos and the overall results was also done.
Results: The study included a total of 788 videos for review, uploaded to YouTube from 2006 to 2018. An average of 61 videoswith greater than 3000 views were uploaded each year (SD 34.6, range 3-113). All videos accumulated 223 million views, 104million (46.50%) of them being among the 10 most viewed videos. The top 3 distractions depicted included texting, talking onthe phone, and eating and/or drinking. Motor vehicle crashes (MVCs) and death were depicted in 742 (94.2%) videos, whereas166 (21.1%) of the videos depicted injuries. Orthopedic injuries were described in 90 (11.4%) videos. Furthermore, 220 (27.9%)of the videos contained statistics, but only 27 (3.7%) videos referenced a peer-reviewed study.
Conclusions: This study demonstrates that there is a high interest in viewing distracted driving videos, and the popularity ofthese videos appears to be relatively stable over time on a forum that fluxes based on the current opinions of its users. The videosmostly focused on phone-related distractions, overlooking many other equally or more common forms of distracted driving.Death, which in reality is a far less common distracted driving consequence than injuries, was portrayed 1.7 times as much.Surprisingly, orthopedic injuries, which lead to a massive source of long-term disability and often result from MVCs, are vastlyunderrepresented.
(JMIR Public Health Surveill 2020;6(1):e14995) doi:10.2196/14995
JMIR Public Health Surveill 2020 | vol. 6 | iss. 1 | e14995 | p.96https://publichealth.jmir.org/2020/1/e14995(page number not for citation purposes)
Gjorgjievski et alJMIR PUBLIC HEALTH AND SURVEILLANCE
XSL•FORenderX

KEYWORDS
distracted driving; YouTube; texting and driving; car distractions; cell phones; orthopedic injuries
Introduction
BackgroundDistracted driving is a global epidemic and has become thenumber one killer of teenagers [1]. In North America alone,distracted driving plays a role in approximately 4 million roadtraffic accidents a year [2]. According to Mark Edwards,Director of Traffic Safety at the American AutomobileAssociation, somewhere between 25% and 50% of all motorvehicle crashes (MVCs) in the United States are directly relatedto driver distraction as the root cause of automobile accidents[3]. In addition, injuries resulting from MVCs are in the top 10causes of disability and are expected to climb to the top 3 by2030 [4]. The World Health Organization estimates that in 2016,there were 1.35 million road traffic fatalities [5], and itrecommended that future research focus on traffic injuries.
Data from the National Highway Traffic Safety Administrationfor 2015 suggested that for every traffic fatality that occurredbecause of distracted driving, approximately 113 people wereinjured (3477 fatalities to 391,000 accident-related injuries) [6].Many of these acute injuries secondary to this type ofhigh-energy trauma lead to permanent impairments and/ordisabilities. In addition, MVCs in the United States are estimatedto total US $40 billion in direct costs and US $123 billion insocietal costs [6,7].
Distracted driving is anything that diverts a driver’s attentionfrom safely operating a vehicle and subsequently reduces thedriver’s awareness and driving ability, leading to a potentialrisk of compensating actions or crashing [8]. The diversion ofattention should not be because of alcohol, drugs, fatigue, or ahealth condition [9,10]. Texting or talking on a mobile phone,daydreaming, eating and/or drinking, and using a navigationsystem while driving are just a few examples of distracteddriving. Wickens’ Multiple Resource Theory (MRT) [11]explains driving as a visual-spatial-motor task, using cognitive,visual, and motor resources concurrently [12,13]. According toMRT, tasks that compete for the same resource can causedual-task interference in any or all 3 resources, leading todecreased driving ability.
Cognitive distractions happen when a driver’s mind concentrateson mental tasks other than driving, for instance, daydreamingor talking on a hands-free mobile phone.
Visual distractions occur when a driver shifts their gaze awayfrom the safe operation of the vehicle, such as looking at a map.
Manual distraction occurs when the driver takes one or bothhands off the steering wheel for any reason. Some commonexamples include eating and drinking or adjusting the radio inthe car.
An activity such as texting while driving is especially dangerousas it combines all 3 elements of distraction—cognitive, visual,and manual [14]. In fact, text messaging while driving mayincrease the relative risk of being involved in a collision 23
times [15-18]. The National Safety Council estimates that in2013, 26% of crashes involved mobile phone use [15]. Althoughmobile phone use while driving may be the catalyst for renewedconcern of distracted driving, some studies have estimated theuse of mobile phone devices as the second most commondistraction in fatal crashes with 14%, compared withdaydreaming with 61% [6,19].
ObjectivesIt is clear from the data that distracted driving is very dangerousand also very prevalent. Knowing that most people use theinternet as their primary source of information on such topics,we directed our research focus on YouTube, the most popularvideo sharing platform on the internet [20]. A previous studyhas examined whether YouTube can be used as an educationalplatform for curbing adolescent cell phone use while driving[21]. However, no studies have assessed the general messagesbeing portrayed in distracted driving videos and the mostcommon elements in them, such as types of distractorsportrayed, consequences of distracted driving, and statisticsabout distracted driving. Understanding this core informationthat is presented to viewers is novel and will be critical inmitigating the harms of distracted driving.
The specific goals of the study were to gauge the popularityand to categorize and assess the messages being delivered bydistracted driving videos, by methodically classifying thecontent, context, and quality of the information available onYouTube.
Methods
Study DesignThe Distracted Driving on YouTube study is a cross-sectionalstudy examining popular distracted driving videos found on thevideo sharing platform YouTube. The following 5 differentcombinations of keywords and phrases were employed to searchYouTube for distracted driving videos: “distracted driving”,“car distractions”, “cell phone and driving”, “drivers not payingattention”, and “texting and driving”. In the development of oursearch phrases, we relied on YouTube’s smart search, whichautopopulates potential searches with the most common termscontaining those words. Owing to public opinion, governmentcampaigns, and the focus of distracted driving literature onmobile phone distractions, we also included phrases that coveredthese types of distractions. We conducted the search on a singleday, June 13, 2018, and sorted the search results by view count.
Screening and Collection of VideosYouTube videos uploaded after 2006, with more than 3000views, that discussed or demonstrated any aspect of distracteddriving were collected and analyzed. We excluded from thestudy any videos that did not demonstrate or mention distracteddriving, videos about reckless, careless, or impaired driving,and videos not in English. User channels that appeared in thesearch results and copies of collected videos were not included
JMIR Public Health Surveill 2020 | vol. 6 | iss. 1 | e14995 | p.97https://publichealth.jmir.org/2020/1/e14995(page number not for citation purposes)
Gjorgjievski et alJMIR PUBLIC HEALTH AND SURVEILLANCE
XSL•FORenderX

in our review. Identical videos appearing in the results ofmultiple search phrases were analyzed and coded only once.
Data Acquisition and AnalysisThe videos were examined by 2 independent reviewers, andany discrepancies in data collection were resolved by consensusvia the coding authors. The overall interrater reliabilitymeasurement was calculated as the mean from all the kapparesults for the examined variables, which were calculated usingthe Cohen kappa formula for 2 raters. The study recorded thepopularity of the videos via quantitative variables, such as thedate and year the video got uploaded and the number of views,likes, and dislikes it received. Videos from a different uploader,but with identical content, were labeled as duplicates and onlycontributed data for the quantitative variables. They were notincluded in the final analysis of the categorical variables.
We recorded categorical variables under the categories ofcontent, context, and quality of information. Content variablesincluded type (eg, phone, texting, talking on a phone, talkingwith a passenger, eating/drinking, and daydreaming) and form(eg, cognitive, visual, manual, or combinations) of thedistraction; consequences (eg, crash, death, injury, and legal);
orthopedic injuries specifically; and whether the videos werereal accounts, reenactments, fictitious, funny, serious, and/orgraphic. We considered a video to be graphic when there wasan explicit or visual depiction of a serious injury or death.Context variables included whether the video was a public safetyannouncement (PSA), television show or newscast,advertisement, or an amateur video. Finally, the quality ofinformation variables included whether the video containedstatistics and/or studies, and whether the studies were peerreviewed and the statistics referenced. In addition, we conducteda subanalysis of the 10 most viewed videos and performed acomparison with the overall results.
Results
The search methods generated 5,520,000 results for all 5 searchphrases, out of which 987 videos met our eligibility criteria.Once we removed the identical videos appearing in multiplesearches, a total of 788 videos uploaded to YouTube from 2006to 2018 were included for review. An average of 61 videos withgreater than 3000 views were uploaded each year (SD 34.6,range 3-113). Table 1 shows the number of videos uploadedper year matching the search and inclusion criteria.
Table 1. Number of YouTube videos uploaded per year matching search and inclusion criteria.
Number of videos with >3000 views per yearYears
32006
172007
202008
512009
612010
932011
742012
872013
852014
932015
1132016
632017
282018
We performed an analysis of the videos using various categoricalvariables listed in Table 2. Our interrater reliability measurementshowed substantial agreement between the reviewers(κappa=0.73). The review demonstrated that PSAs accountedfor 37.3% (294/788) of the videos, and more than half of thevideos (440/788, 55.8%) were a depiction of a real account.Furthermore, an evaluation of the video’s content revealed thatthe vast majority of the videos were not comedic/funny in natureand were coded as serious (643/788, 81.6%).
Cognitive distractions, depicted in 91.0% (717/788) of thevideos, were the most common form of distraction recorded,whereas manual and visual distractions were depicted in 82.6%(651/788) and 81.6% (643/788) of the videos, respectively.Further review showed that 27.9% (220/788) of the videoscontained statistics, and 10.0% (79/788) referenced the sourceof the statistics, while 3.4% (27/788) videos mentioned apeer-reviewed study. In addition, 21.1% (166/788) of the videosincluded some form of an injury, whereas orthopedic injuriesspecifically were depicted in 11.4% (90/788) of the videos.
JMIR Public Health Surveill 2020 | vol. 6 | iss. 1 | e14995 | p.98https://publichealth.jmir.org/2020/1/e14995(page number not for citation purposes)
Gjorgjievski et alJMIR PUBLIC HEALTH AND SURVEILLANCE
XSL•FORenderX

Table 2. Videos depicting examined categorical variables.
Videos depicting variables, n (%)Categorical variables
294 (37.3)Public safety announcement
135 (17.1)Television show or newscast
272 (34.5)Amateur
68 (8.6)Advertisement
440 (55.8)Real account
12 (1.5)Reenactment
219 (27.8)Fictitious
717 (91.0)Cognitive distraction
643 (81.6)Visual distraction
651 (82.6)Manual distraction
89 (11.3)Funny
643 (81.6)Serious
65 (8.2)Graphic
220 (27.9)Contains statistics
79 (10.0)Statistics referenced
60 (7.6)Study mentioned/discusseda
27 (3.4)Peer-reviewed studyb
90 (11.4)Orthopedic injury
166 (21.1)Injury
aA study about distracted driving was mentioned in the video.bThe mentioned study in the video was published in a peer-reviewed journal.
All included videos were reviewed for specific distractions.Table 3 demonstrates the number and percentage of videos thatportrayed a particular type of distraction. Overall, the 2 mostdepicted distractions were mobile phone related, and includedtexting and talking. Texting while driving was the number onedistracting activity present in 64.6% (509/788) of all videos.Phone conversations, both handheld and hands free, werecalculated together and were depicted in 24.5% (193/788) ofthe videos. Eating and/or drinking and radio manipulation eachoccurred in 9.4% (74/788) of videos, whereas talking with a
passenger was displayed in 9.1% (72/788) of the videos.Daydreaming was present in 2.0% (16/788) of all videos. Itshould be noted that many videos contained more than one formof distraction.
Table 4 illustrates the consequences depicted in the videos. The3 most common outcomes were crash or an accident, seen in58.4% (460/788) of the videos, followed by death and injury at35.8% (282/788) and 21.1% (166/788), respectively. Similarto the specific distractions, multiple consequences were oftenshown in a single video.
JMIR Public Health Surveill 2020 | vol. 6 | iss. 1 | e14995 | p.99https://publichealth.jmir.org/2020/1/e14995(page number not for citation purposes)
Gjorgjievski et alJMIR PUBLIC HEALTH AND SURVEILLANCE
XSL•FORenderX

Table 3. Videos containing a specific driving distraction.
Value, n (%)Driving distractions
509 (64.6)Texting (phone)
193 (24.5)Talking (phone)
74 (9.4)Eating/drinking
74 (9.4)Radio
72 (9.1)Talking with a passenger
67 (8.5)Unknowna
59 (7.5)Phone (app, Web, music, pic, video, reading)
57 (7.2)In-vehicle distraction+reaching for an object
55 (7.0)Grooming
51 (6.5)Otherb
34 (4.3)Programming navigation/GPS systems
32 (4.1)Outer-vehicle distraction
24 (3.0)Interacting with children
21 (2.7)Electronic device (laptop, computer, Mp3, iPod)
18 (2.3)Reading
16 (2.0)Daydreaming
aDistractions were not visible.bDistractions were too few to categorize independently.
Table 4. Videos containing a specific consequence of distracted driving.
Value, n (%)Consequences
460 (58.4)Car crash/accident
282 (35.8)Death
166 (21.1)Injury
130 (16.5)None
90 (11.4)Orthopedic injuries
82 (10.4)Fine (ticket)
32 (4.1)Near crash/accident
27 (3.4)Incarceration
23 (2.9)Police pull over
13 (1.6)Legal
9 (1.1)Warning
38 (4.8)Other
As the 10 most viewed videos accounted for nearly half of allthe views garnered, a separate review of these videos wasconducted. Table 5 represents the various distractions recordedin these videos. The use of mobile phones was once more themost common distracting activity, especially texting, whichwas present in all (10/10, 100%) videos.
Table 6 describes the consequences depicted in the 10 mostviewed videos. A car crash or an accident was the most commonconsequence depicted in 70% (7/10) of the videos. Death wasdepicted in 60% (6/10) of videos, and injury was shown in 40%(4/10) of the videos.
JMIR Public Health Surveill 2020 | vol. 6 | iss. 1 | e14995 | p.100https://publichealth.jmir.org/2020/1/e14995(page number not for citation purposes)
Gjorgjievski et alJMIR PUBLIC HEALTH AND SURVEILLANCE
XSL•FORenderX

Table 5. Specific distractions in the 10 most viewed videos.
Value, n (%)Distractions
10 (100)Texting (phone)
4 (40)Talking with a passenger
3 (30)Eating/drinking
1 (10)Talking (phone)
1 (10)Radio
1 (10)Interacting with children
1 (10)Other
Table 6. Specific consequences in the 10 most viewed videos.
Value, n (%)Consequences
7 (70)Car crash/accident
6 (60)Death
4 (40)Injury
2 (20)Orthopedic injury
1 (10)None
Table 7 presents a comparative analysis of all the categoricalvariables between the 10 most viewed videos and all the videosreviewed. In terms of context, the majority of the 10 mostviewed videos were PSAs (8/10, 80%). However, the percentageof total videos that were PSAs was substantially lower at 37.3%(294/788). In addition, 60% (6/10) of the top 10 videos vieweddepicted fictitious events, compared with 27.8% (219/788) forthe combined data. The character of the content was more evenlydistributed among the top 10 videos, with 60% (6/10) beingserious, 40% (4/10) funny, and 30% (3/10) considered as
graphic, as opposed to all the videos, where the vast majoritywere serious in nature (643/788, 81.6%).
Our comparative analysis also included quantitative variables,which are displayed in Table 8. There were more than 223million views distributed across all 788 examined videos (mean17,211,395.2, SD 16,838,381.6), and 104 million (46.50%) ofthose views belonged to the 10 most popular videos. In addition,48.94% (545,628/1,114,680) of all the reactions (likes/dislikes)and 50.76% of all likes (535,600/1,055,070) were among thetop 10 videos.
JMIR Public Health Surveill 2020 | vol. 6 | iss. 1 | e14995 | p.101https://publichealth.jmir.org/2020/1/e14995(page number not for citation purposes)
Gjorgjievski et alJMIR PUBLIC HEALTH AND SURVEILLANCE
XSL•FORenderX

Table 7. Videos depicting examined categorical variables in the 10 most viewed videos and all videos.
All videos depicting variable (N=788), n (%)Ten most viewed videos depicting variable, n (%)Categorical variables
294 (37.3)8 (80)Public safety announcement
135 (17.1)2 (20)Television show or newscast
272 (34.5)0 (0)Amateur
68 (8.6)2 (20)Advertisement
437 (55.8)3 (30)Real account
12 (1.5)0 (0)Reenactment
219 (27.8)6 (60)Fictitious
717 (91.0)10 (100)Cognitive distraction
643 (81.6)10 (100)Visual distraction
651 (82.6)9 (90)Manual distraction
89 (11.3)4 (40)Funny
643 (81.6)6 (60)Serious
65 (8.2)3 (30)Graphic
220 (27.9)1 (10)Contains statistics
79 (10.0)0 (0)Statistics referenced
60 (7.6)0 (0)Study mentioned/discusseda
27 (3.4)0 (0)Peer-reviewed studyb
90 (11.4)2 (20)Orthopedic injury
166 (21.1)4 (40)Injury
aA study about distracted driving was mentioned in the video.bThe mentioned study in the video was published in a peer-reviewed journal.
Table 8. Videos depicting examined quantitative variables in the 10 most viewed videos and all videos.
All reviewed videosTen most viewed videosQuantitative variables
223,748,138 (100.00)104,057,183 (46.50)Views, n (%)
1,055,070 (100.00)535,600 (50.76)Likes, n (%)
59,610 (100.00)10,028 (16.82)Dislikes, n (%)
1,114,680 (100.00)545,628 (48.94)Total reactions, n (%)
17.753.4Ratio of likes/dislikes
Discussion
Principal FindingsIn this study, the 788 YouTube videos on distracted driving hadmore than 223 million combined views distributed across allyears, demonstrating that there is a high interest in this topic.The number of videos with 3000 views or more uploaded peryear was also relatively stable throughout the years. The increasein the number of uploaded videos after 2006 follows withYouTube inception and growth in popularity. In addition to thefact that 2018 was truncated in June, and representsapproximately 6 months of videos rather than a full year, thedecline in 2017 to 2018 also has to be viewed in the contextthat the newest videos have the least amount of time to garnerviews (and will gain views with additional time).
A large proportion of the videos were PSAs (294/788, 37.3%),with more than one-third of the videos (272/788, 34.5%) havingamateur content. Videos containing statistics with a referencedsource were 10.0% (79/788), and only 3.4% (27/788) videosquoted peer-reviewed studies, signifying most videos wereopinion based. Therefore, the videos demonstrated a significantdisparity between the information presented on this forum andthe current data available on distracted driving. For instance,the results showed texting as the most commonly observeddistracting activity (509/788. 64.6%). However, using data fromthe Fatality Analysis Reporting System, Erie Insurance reportsthat among the top 10 distractions involved in fatal car crashes,mobile phone use ranked as second with 14%, behind lost inthought or daydreaming with 61% [6,19]. In this study,daydreaming was the least represented type of distraction. Thisdiscrepancy is in alignment with data that demonstrate that themajority of people believe that mobile phones are the number
JMIR Public Health Surveill 2020 | vol. 6 | iss. 1 | e14995 | p.102https://publichealth.jmir.org/2020/1/e14995(page number not for citation purposes)
Gjorgjievski et alJMIR PUBLIC HEALTH AND SURVEILLANCE
XSL•FORenderX

one distraction when driving [22]. It should be noted thatcommonality is not to be mistaken for the magnitude ofdistraction that can occur. Studies have placed programmingnavigation/GPS systems and texting while driving as the mostdistracting tasks [23,24]. In this study, programming anavigations/GPS system was seen in only 4.3% (34/788) of allvideos, whereas texting while driving was depicted in 64.6%(509/788) of the videos. Both tasks are obviously exceedinglydangerous, but it is interesting to see that mobile phones aredominating this public forum, although some of the morecommon and potentially equally dangerous distractionsidentified garner so little spotlight.
In the videos, death as a result of distracted driving is grosslyoverrepresented (282/788, 35.8%) relative to injuries sustainedin the same circumstances (166/788, 21.1%). Informationavailable from reported MVCs suggests that injuries fromdistracted driving crashes are nearly 113 times more likely thanfatalities [6]. Furthermore, according to 2011 Canadian datafrom the National Trauma Registry [25], the most commoncause of major injury were MVCs, with 79% of these peoplehaving sustained musculoskeletal injuries. However, in thisstudy, 21.1% (166/788) of the videos depicted some form ofinjury, whereas orthopedic injuries were depicted in only 11.4%(90/788) of the videos, representing once again a huge disparityfrom available data on distracted driving.
A possible reason for the dominance of serious outcomes suchas death is the uploader’s goal of reaching and engaging peoplefor more views, reactions, and comments or demonstrating theextremes to get viewers to think about distracted driving.Although we hope this may build awareness around the risksof distracted driving, it presents messages that can certainly bedramatically different from reality, for example, directing one’sattention to death as a consequence of distracted driving butmassively underrepresenting a life-altering injury withpermanent impairment and/or disability.
Furthermore, because of the fact that the 10 most viewed videosgarnered 46.5% (104,057,183/223,748,138) of all the views andmore than half of all likes (535,600/1,055,070, 50.76%), weperformed a subanalysis of these videos and found similarresults. Car crashes and death were the 2 most commonoutcomes. Mobile phone use, particularly texting, was presentin all 10 videos. Interestingly, there were no studies or statisticsreferenced in the 10 most viewed videos.
LimitationsThis study had several limitations. Data gathering for categoricalvariables relied on the investigator’s ability to scan and detectfor the variables, allowing for the possibility to overlook someinformation. Furthermore, there are no standardized methodsfor analyzing YouTube videos; thus, the interpretation of variousvariables depended on the researcher’s judgment, which couldlead to bias. We minimized these issues by assigning 2independent reviewers to analyze each video and resolved anydiscrepancy between the coded data by consensus via the codingauthors. To our knowledge, this is the largest YouTube study
on distracted driving, and the large sample size would decreasethe potential data skewing that can be observed with smallersample sizes.
Comparison With Prior WorkYouTube is the second most visited website in the world, with5 billion videos and 1 billion hours of content viewed daily, andit is by far the most used video sharing platform on the internet[20,26]. It is available in 76 languages in 88 countries, whichis 95% of all internet users [20], and offers a unique opportunityto reach an audience of millions. Other studies have investigatedthe sharing potential of YouTube for information on variousmedical issues, such as immunizations [27], concussions [28],heart transplantation [29], and sedentary behaviors [30]. A recentstudy about videos on distracted driving on YouTube in 2017analyzed 100 videos specifically on mobile phone use as itapplies to adolescents [21]. However, they only focused on 1form of distraction only in adolescents, compared with thisstudy, which examined multiple forms and types of distractionsand the messages portrayed in them.
ConclusionsThis study demonstrates the overall messages portrayed invideos on YouTube focused on distracted driving and showsdiscrepancies between current data on distracted driving andwhat is described.
The popularity of viewing videos on this topic appears to behigh and relatively stable over time on a forum that fluxes basedon the current opinions of its users. This is encouraging in thesense that people are being exposed to the dangers of distracteddriving. However, overall information presented in these videoscan mostly be classified as opinion based, with a paucity ofreferenced statistics or data from peer-reviewed studies.
Videos most often focused on texting while driving and themost dramatic consequences such as MVCs and death. Althoughwe hope this brings attention to the seriousness of distracteddriving, it is not representative of the known data on distracteddriving. In studies, the most demanding task while driving ispotentially programming a navigation/GPS system and/or textingwhile driving [23,24], whereas the most common distraction isthought to be daydreaming [19]. Unfortunately, daydreamingand programming a navigation/GPS system are largely ignoredin these videos and represent critical information to know aboutdistracted driving. In addition, death was portrayed more than1.7 times compared with injury in terms of potentialconsequences of distracted driving. In reality, injuries are113-fold more common compared with fatalities [6]. Similarly,injuries in general and specifically orthopedic injuries, whichare exceedingly common and can lead to a massive source oflong-term disability and/or impairment, are vastlyunderrepresented compared with reality.
Future research may be aimed at potentially harnessing thisinterest on YouTube with respect to distracted driving toascertain whether perspectives and behaviors can be favorablyaltered to minimize distracted driving.
JMIR Public Health Surveill 2020 | vol. 6 | iss. 1 | e14995 | p.103https://publichealth.jmir.org/2020/1/e14995(page number not for citation purposes)
Gjorgjievski et alJMIR PUBLIC HEALTH AND SURVEILLANCE
XSL•FORenderX

Conflicts of InterestNone declared.
References1. Bailin A, Adesman A, Sunday S. 134. Texting While Driving Among High School Students in the United States: Analysis
of 2011 Data From the National Youth Risk Behavior Survey (YRBS). J Adolesc Health 2013;52(2):S85-S86. [doi:10.1016/j.jadohealth.2012.10.201]
2. Seiden D. Royal Canadian Mounted Police. 2014 Jul 4. Distracted Driving URL: http://www.rcmp-grc.gc.ca/en/gazette/distracted-driving [accessed 2019-12-30]
3. Waterdown Collision.: Waterdown Collision The Leading Causes of Car Accidents URL: https://www.waterdowncollision.com/blog/safe-driving/leading-causes-of-car-accidents/ [accessed 2019-12-30]
4. World Health Organization. Geneva: World Health Organization; 2004. Global Burden of Disease Report 2004 URL: https://www.who.int/healthinfo/global_burden_disease/GBD_report_2004update_full.pdf [accessed 2019-12-30]
5. World Health Organization. Geneva: World Health Organization; 2018. Global Status Report on Road Safety 2018 URL:https://www.who.int/violence_injury_prevention/road_safety_status/2018/en/ [accessed 2019-12-30]
6. CrashStats - NHTSA - DOT. Washington, DC: National Highway Traffic Safety Administration; 2017 Mar. DistractedDriving 2015 URL: https://crashstats.nhtsa.dot.gov/Api/Public/ViewPublication/812381 [accessed 2019-12-30]
7. National Highway Traffic Safety Administration. The Economic and Societal Impact of Motor Vehicle Crashes, 2010(Revised). Ann Emerg Med 2015;66(2):194-196. [doi: 10.1016/j.annemergmed.2015.06.011]
8. Regan M, Hallett C, Gordon C. Driver distraction and driver inattention: definition, relationship and taxonomy. Accid AnalPrev 2011 Sep;43(5):1771-1781. [doi: 10.1016/j.aap.2011.04.008] [Medline: 21658505]
9. Transport Canada. Ottawa, ON: Government of Canada; 2019. Distracted Driving URL: https://www.tc.gc.ca/en/services/road/stay-safe-when-driving/distracted-driving.html#what [accessed 2019-12-30]
10. Canadian Council of Motor Transport Administrators. Ottawa, ON; 2006. Distracted driving sub-group goes to work URL:http://ccmta.ca/images/publications/pdf/ccmta_news_summer_2006.pdf [accessed 2019-12-30]
11. Wickens C. Multiple resources and performance prediction. Theor Issues Ergon Sci 2002;3(2):159-177. [doi:10.1080/14639220210123806]
12. Regan MA, Lee JD, Young K. Driver Distraction: Theory, Effects, And Mitigation. Boca Raton, FL: CRC Press; 2008.13. Esurance Insurance Service. Triple Threat: The 3 Types of Distracted Driving Esurance. URL: https://www.esurance.com/
info/car/3-types-of-distracted-driving [accessed 2019-12-30]14. Vegega M, Jones B, Monk C. National Highway Traffic Safety Administration. Washington, DC: National Highway Traffic
Safety Administration; 2013 Dec. Understanding the Effects of Distracted Driving and Developing Strategies to ReduceResulting Deaths and Injuries: A report to congress URL: https://www.nhtsa.gov/sites/nhtsa.dot.gov/files/812053-understandingeffectsdistracteddrivingreporttocongress.pdf [accessed 2020-01-01]
15. National Safety Council. Itasca, IL: National Safety Council; 2015. Annual Estimate of Cell Phone Crashes 2013 URL:https://www.nsc.org/portals/0/documents/distracteddrivingdocuments/attributable-risk-estimate.pdf [accessed 2019-12-30]
16. Olson R, Hanowski R, Hickman J. Federal Motor Carrier Safety Administration. Washington, DC: US Department ofTransportation; 2009. Driver Distraction in Commercial Vehicle Operations URL: https://www.fmcsa.dot.gov/sites/fmcsa.dot.gov/files/docs/DriverDistractionStudy.pdf [accessed 2019-12-30]
17. Olsen E, Shults R, Eaton D. Texting while driving and other risky motor vehicle behaviors among US high school students.Pediatrics 2013 Jun;131(6):e1708-e1715. [doi: 10.1542/peds.2012-3462] [Medline: 23669511]
18. Farmer C, Braitman K, Lund A. Cell phone use while driving and attributable crash risk. Traffic Inj Prev 2010Oct;11(5):466-470. [doi: 10.1080/15389588.2010.494191] [Medline: 20872301]
19. Erie Insurance. 2018 Apr 3. Erie Insurance releases police data showing daydreaming #1 on top 10 list of fatal distracteddriving behaviors URL: https://www.erieinsurance.com/news-room/press-releases/2018/distracted-driving-survey [accessed2019-12-30]
20. Omnicore. 2019 Sep 5. YouTube by the Numbers: Stats, Demographics & Fun Facts URL: https://www.omnicoreagency.com/youtube-statistics/ [accessed 2019-12-30]
21. Basch C, Mouser C, Clark A. Distracted driving on YouTube: implications for adolescents. Int J Adolesc Med Health 2017May 18;31(2):pii: /j/ijamh. [doi: 10.1515/ijamh-2016-0158] [Medline: 28525349]
22. Travelers Institute. Washington, DC: The Travelers Institute; 2018. Every Second Matters URL: https://www.travelerscanada.ca/iw-documents/Travelers_Institute_Distracted_Driving_Conversation_Starter_EN.pdf [accessed2019-12-30]
23. Canadian Automotive Association. Distracted Driving: Statistics URL: https://www.caa.ca/distracted-driving/statistics/[accessed 2019-12-30]
24. Strayer D, Cooper J, Goethe R, McCarty M, Getty D, Biondi F. The American Automobile Association. Washingon, DC:The American Automobile Association; 2017 Sep. Visual and Cognitive Demands of Using In-Vehicle InfotainmentSystems URL: https://aaafoundation.org/visual-cognitive-demands-using-vehicle-information-systems/ [accessed 2019-12-30]
JMIR Public Health Surveill 2020 | vol. 6 | iss. 1 | e14995 | p.104https://publichealth.jmir.org/2020/1/e14995(page number not for citation purposes)
Gjorgjievski et alJMIR PUBLIC HEALTH AND SURVEILLANCE
XSL•FORenderX

25. Haas B, Poon V, Waller B, Sidhom P. Canadian Institute for Health Information. Toronto, ON: Canadian Institute forHealth Information; 2011. National Trauma Registry 2011 Report: Hospitalizations for Major Injury in Canada, 2008–2009Data URL: https://secure.cihi.ca/free_products/NTR_CDS_2008_2009_Annual_Report.pdf [accessed 2019-12-30]
26. Alexa: The Web Information Company. 2019. YouTube Competitive Analysis, Marketing Mix and Traffic URL: https://www.alexa.com/siteinfo/youtube.com?ver=classic [accessed 2019-12-30]
27. Ache K, Wallace L. Human papillomavirus vaccination coverage on YouTube. Am J Prev Med 2008 Oct;35(4):389-392.[doi: 10.1016/j.amepre.2008.06.029] [Medline: 18675530]
28. Williams D, Sullivan J, Schneiders A, Ahmed O, Lee H, Balasundaram A, et al. Big hits on the small screen: an evaluationof concussion-related videos on YouTube. Br J Sports Med 2014 Jan;48(2):107-111. [doi: 10.1136/bjsports-2012-091853][Medline: 23446643]
29. Chen HM, Hu ZK, Zheng XL, Yuan ZS, Xu ZB, Yuan LQ, et al. Effectiveness of YouTube as a source of medical informationon heart transplantation. Interact J Med Res 2013 Nov 21;2(2):e28 [FREE Full text] [doi: 10.2196/ijmr.2669] [Medline:24263225]
30. Knight E, Intzandt B, MacDougall A, Saunders T. Information seeking in social media: a review of YouTube for sedentarybehavior content. Interact J Med Res 2015 Jan 20;4(1):e3 [FREE Full text] [doi: 10.2196/ijmr.3835] [Medline: 25604433]
AbbreviationsMRT: Multiple Resource TheoryMVC: motor vehicle crashPSA: public safety announcement
Edited by G Eysenbach; submitted 13.06.19; peer-reviewed by S Azer, A Nauth; comments to author 03.10.19; revised version received19.10.19; accepted 19.12.19; published 10.02.20.
Please cite as:Gjorgjievski M, Sprague S, Chaudhry H, Ginsberg L, Wang A, Bhandari M, Ristevski BDistracted Driving on YouTube: Categorical and Quantitative Analyses of Messages PortrayedJMIR Public Health Surveill 2020;6(1):e14995URL: https://publichealth.jmir.org/2020/1/e14995 doi:10.2196/14995PMID:32039816
©Marko Gjorgjievski, Sheila Sprague, Harman Chaudhry, Lydia Ginsberg, Alick Wang, Mohit Bhandari, Bill Ristevski. Originallypublished in JMIR Public Health and Surveillance (http://publichealth.jmir.org), 10.02.2020. This is an open-access articledistributed under the terms of the Creative Commons Attribution License (https://creativecommons.org/licenses/by/4.0/), whichpermits unrestricted use, distribution, and reproduction in any medium, provided the original work, first published in JMIR PublicHealth and Surveillance, is properly cited. The complete bibliographic information, a link to the original publication onhttp://publichealth.jmir.org, as well as this copyright and license information must be included.
JMIR Public Health Surveill 2020 | vol. 6 | iss. 1 | e14995 | p.105https://publichealth.jmir.org/2020/1/e14995(page number not for citation purposes)
Gjorgjievski et alJMIR PUBLIC HEALTH AND SURVEILLANCE
XSL•FORenderX

Original Paper
Trend of Cutaneous Leishmaniasis in Jordan From 2010 to 2016:Retrospective Study
Mohammad Alhawarat1, MD; Yousef Khader2, SCD; Bassam Shadfan3, MD; Nasser Kaplan2, PhD; Ibrahim Iblan1,MD1Jordan Field Epidemiology Training Program, Jordan Ministry of Health, Amman, Jordan2Jordan University of Science and Technology, Irbid, Jordan3Parasitic and Zoonotic Disease Department, Communicable Disease Directorate, Ministry of Health, Amman, Jordan
Corresponding Author:Mohammad Alhawarat, MDJordan Field Epidemiology Training ProgramJordan Ministry of HealthPr. Hamzah StAmman, 11118JordanPhone: 962 772300390Email: [email protected]
Abstract
Background: Cutaneous leishmaniasis (CL) is endemic in the Middle East, with countries such as Syria reporting high incidencerates.
Objective: This study aimed to assess the trends in the incidence of cutaneous leishmaniasis (CL) in Jordan from 2010 to 2016.
Methods: This retrospective study included all cases of CL that had been reported to the Leishmaniasis Surveillance Systemin the Department of Communicable Diseases at the Jordan Ministry of Health during the period from 2010 to 2016. A total of1243 cases were reported and met the case definition.
Results: A total of 1243 cases (60.65% [754/1243] males and 39.34% [489/1243] females) were diagnosed during the studyperiod. Of this sample, 233 patients (19.13%) were aged <5 years old, 451 (37.03%) were aged between 5-14 years old, 190(15.60%) were aged between 15-24 years old, and 344 (28.24%) were aged ≥25 years old. Of those, 646 (51.97%) were Jordaniansand 559 (44.97%) were Syrians. The average annual incidence rate of 1.70 per 100,000 people between 2010 and 2013 increasedto 3.00 per 100,000 people in the years 2014 to 2016. There was no difference in incidence rates between Jordanians and Syrianrefugees between 2010 and 2012. After 2012, the incidence rate increased significantly among Syrian refugees from 1.20 per100,000 people in 2012 to 11.80 per 100,000 people in 2016. On the contrary, the incidence rate did not change significantlyamong Jordanians.
Conclusions: The incidence rate of leishmaniasis in Jordan has increased in the last three years because of the influx of Syrianrefugees into Jordan. A massive effort toward reservoir and vector control, along with actively pursuing diagnosis in endemicfoci, will be helpful. Proper and studious reporting of cases is also a necessity for the eradication of this disease.
(JMIR Public Health Surveill 2020;6(1):e14439) doi:10.2196/14439
KEYWORDS
cutaneous leishmaniasis; incidence; Jordan
Introduction
BackgroundLeishmaniasis is a vector-borne disease that is transmitted viafemale sandflies and caused by an intracellular protozoon calledLeishmania. It is endemic in 98 countries and 3 continents [1].Out of 30 mammal-infecting Leishmania species, 21 are known
to infect humans [1]. Leishmaniasis is subdivided into 3 types:cutaneous, mucocutaneus, and visceral. Cutaneous leishmaniasis(CL) is the most common type, and almost 95% of its cases arefound in North and South America, the Mediterranean region,the Middle East, and Central Asia [2]. It usually manifests inthe form of skin lesions, particularly ulcers, which leavepermanent scars and cause severe disability. An estimate of
JMIR Public Health Surveill 2020 | vol. 6 | iss. 1 | e14439 | p.106http://publichealth.jmir.org/2020/1/e14439/(page number not for citation purposes)
Alhawarat et alJMIR PUBLIC HEALTH AND SURVEILLANCE
XSL•FORenderX

around 0.7 to 1.3 million new cases are reported each year, andmore than two-thirds of the new cases are found in 6 countries:Afghanistan, Algeria, Brazil, Colombia, Iran, and Syria [2].
Poverty, overcrowding, immigration, and other risk factors havea great role in increasing the incidence of CL. There arecurrently no available drugs or vaccines to prevent infections,and despite numerous preventative measures, leishmaniasisremains an important, neglected, zoonotic disease and a bigchallenge to public health, especially in underdevelopedcountries [3]. The trends of CL vary from one country to anotherin the Middle East. The incidence rate has decreased in SaudiArabia, whereas it has increased in Iraq and Syria, especiallyduring the civil war [4]. In general, previous studies in theMiddle East have shown that males are more likely to beaffected with CL [5-7].
In Jordan, it has been an emerging disease since the 1980s, andis still an important public health problem despite existingcontrol and prevention measures. In a previous study in the lastdecades, the incidence rate of CL in Jordan has been shown tobe increasing [8]. One study had assessed the spatial andtemporal characteristics of CL in the years from 1999 to 2010,pre–Arab Spring in Jordan and Syria, and it showed that therisk of CL varied both spatially and temporally in both countries[9]. That study showed that the patterns of the disease in Jordancould be described as relatively low and heterogeneous whereasthose in Syria were relatively much higher and lessheterogeneous.
ObjectivesThe CL surveillance system in Jordan receives reports on aweekly basis from 21 reporting sites from all districts andgovernorates in the country. This study aimed to assess the trendin the incidence of CL in Jordan from 2010 to 2016.
Methods
This retrospective study included all cases of CL that had beenreported to the Leishmaniasis Surveillance System in theDepartment of Communicable Diseases at the Jordan Ministryof Health during the period from 2010 to 2016. A total of 1243cases were reported and met the case definition.
A suspected case is defined as a person who was in Jordanduring the study period and showed clinical signs (skin lesions)of infection, wherein the papule appears and may enlarge tobecome an indolent ulcerated nodule. A confirmed case is aperson who was in Jordan during the study period and showingclinical signs of infection, with paracytological confirmationof the diagnosis by a positive smear or culture from a skin lesion[10].
The necessary and available data were retrieved from thesurveillance system. Data included patient’s age, gender,address, nationality, occupation, reporting site, reporting month,reporting year, and location of lesion. The Ethical Committeeat the Ministry of Health approved the study. Data were enteredinto an Excel (Microsoft, Redmond, Washington, United States)file and analyzed using SPSS Statistics for Windows, Version23.0 (IBM Corporation, Armonk, New York, United States).
Results
Patients’ CharacteristicsA total of 1243 CL cases were reported. Of the total reportedcases, 754 (60.65%) were males, 489 (39.34%) were females,and the mean age of the patients was 18.6 years old (SD 16.8).Overall, 233 (19.13%) patients were aged <5 years old, 451(37.03%) were aged between 5-14 years old, 190 (15.60%) wereaged between 15-24 years old, and 344 (28.24%) were aged≥25 years old. Half of reported cases were from the southernregion of the country (Table 1). A total 563 (45.29%) patientshad head lesions, 186 (14.96%) had trunk lesions, 382(381.60%) had leg lesions, and 426 (34.27%) had arm lesions.
Table 1. Distribution of leishmaniasis cases in Jordan from 2010 to 2016 by age, gender, and region.
Frequency, n (%)Characteristics
Age (years)
233 (19.1)0-4
451 (37.0)5-14
190 (15.6)15-24
344 (28.2)≥25
Gender
754 (60.7)Male
489 (39.3)Female
Region
575 (49.4)South
179 (15.4)North
410 (35.2)Middle
JMIR Public Health Surveill 2020 | vol. 6 | iss. 1 | e14439 | p.107http://publichealth.jmir.org/2020/1/e14439/(page number not for citation purposes)
Alhawarat et alJMIR PUBLIC HEALTH AND SURVEILLANCE
XSL•FORenderX

Incidence and TrendThe average annual incidence rate was 1.70% among 100,000people during the period from 2010 to 2013. In the period from2014 to 2016, when Syrian refugees entered the country, theaverage incidence rate increased to 3.00% in every 100,000people (Figure 1). The incidence rate was higher among thoseaged less than 15 years old compared with those aged ≥15 yearsold (Figure 2), and it was higher among males compared tofemales in all studied years. In both genders, the incidence
decreased during the period from 2010 to 2012, following whichit started to increase again (Figure 3). In total, 646 (51.97%) ofreported leishmaniasis cases were Jordanians and 559 (44.97%)were Syrians. There was no difference in incidence ratesbetween Jordanian and Syrian refugees between 2010 and 2012,but after 2012, the incidence rate increased significantly amongSyrian refugees from 1.20 per 100,000 people in 2012 to 11.80per 100,000 people in 2016. On the contrary, the incidence ratedid not change significantly among Jordanians (Figure 4).
Figure 1. The trend of the overall incidence rate of cutaneous leishmaniasis per 100,000 people in Jordan from 2010 to 2016.
Figure 2. The incidence rate of cutaneous leishmaniasis per 100,000 people in Jordan by age categories from 2010 to 2016.
JMIR Public Health Surveill 2020 | vol. 6 | iss. 1 | e14439 | p.108http://publichealth.jmir.org/2020/1/e14439/(page number not for citation purposes)
Alhawarat et alJMIR PUBLIC HEALTH AND SURVEILLANCE
XSL•FORenderX
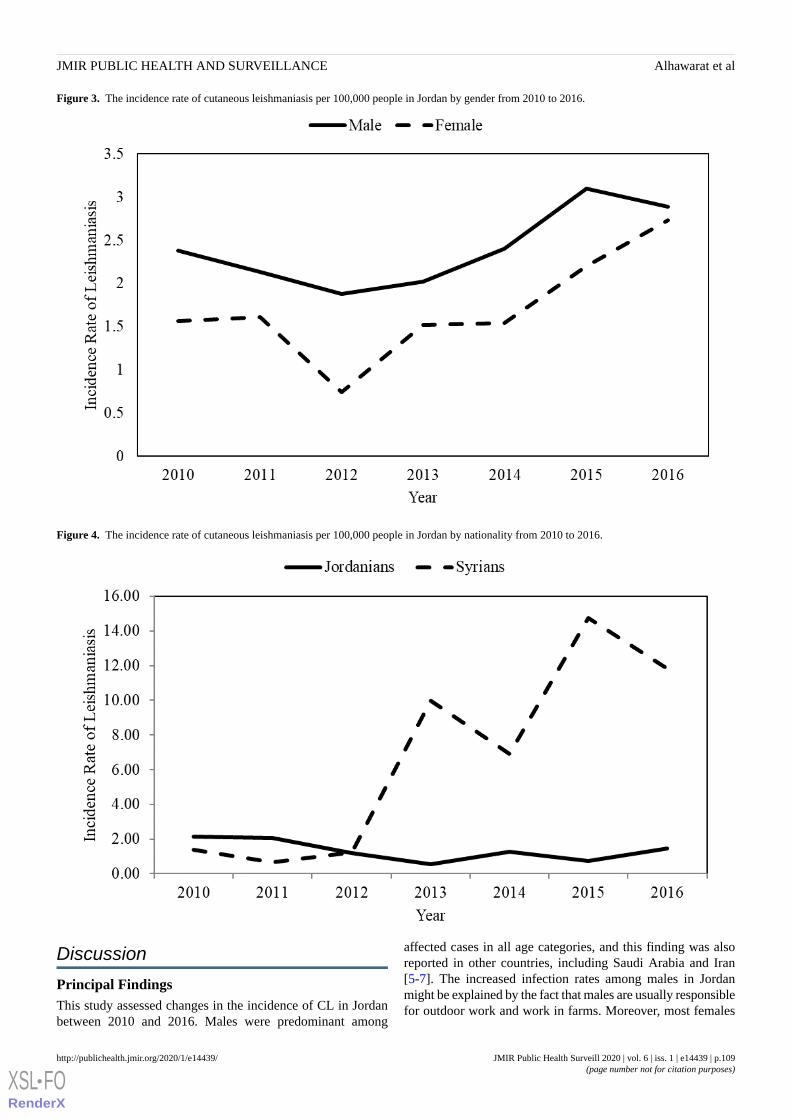
Figure 3. The incidence rate of cutaneous leishmaniasis per 100,000 people in Jordan by gender from 2010 to 2016.
Figure 4. The incidence rate of cutaneous leishmaniasis per 100,000 people in Jordan by nationality from 2010 to 2016.
Discussion
Principal FindingsThis study assessed changes in the incidence of CL in Jordanbetween 2010 and 2016. Males were predominant among
affected cases in all age categories, and this finding was alsoreported in other countries, including Saudi Arabia and Iran[5-7]. The increased infection rates among males in Jordanmight be explained by the fact that males are usually responsiblefor outdoor work and work in farms. Moreover, most females
JMIR Public Health Surveill 2020 | vol. 6 | iss. 1 | e14439 | p.109http://publichealth.jmir.org/2020/1/e14439/(page number not for citation purposes)
Alhawarat et alJMIR PUBLIC HEALTH AND SURVEILLANCE
XSL•FORenderX
in Jordan traditionally cover most parts of their bodies, thusthey are fairly well protected from sandflies.
During the study period, the highest incidence rate was amongsubjects aged less than 15 years old. This finding is consistentwith the findings from a longitudinal study in the endemic areain the eastern region of Saudi Arabia [11], and with the findingsof other studies in Saudi Arabia and Iran [5-7]. This finding isprobably explained by the fact that children spend more timeoutdoors, and therefore are more likely to be exposed to sandflybites. However, other studies in Saudi Arabia [12], Iran [13],and Kuwait [14] have shown that people aged between 21-30years old are the most susceptible because most laborers are inthis age group.
On the basis of the geographic distribution of CL, the southernregion of Jordan was an endemic area. However, the Zarqagovernorate is now a new hot reporting site because of thepresence of the Syrian refugees’ camp in this governorate. Inagreement with the findings of studies in Lebanon [15] andTurkey [16], this study showed an increasing trend in theincidence rate of CL in Jordan during the study period. Theincreased rate of CL in Jordan in the past few years is explainedby an increasing number of Syrian refugees in Jordan over time.Poor housing, absence of clean water, inadequate sanitation,deficient medical facilities and services, and abundant sandflypopulations have contributed to CL among Syrian refugees.
CL emerged in areas where displaced Syrians and diseasereservoirs coexist. In 2013, 1033 new cases were reported inLebanon, of which 96.6% occurred among the displaced Syrianrefugee populations [15]. In Turkey, nonendemic parasitestrains (Leishmania major and Leishmania donovani) wereintroduced by incoming refugees [16]. Other studies in SaudiArabia and Iran have shown a decline in the number andincidence rate of CL in the same period [5,6]. The mainlimitation of this study is the underreporting of CL cases.
ConclusionsIn conclusion, CL is increasing in Jordan, especially after theSyrian war, but countries with ample resources, like Jordan,have taken measures to control the spread of the disease.However, challenges still remain to be solved because of hugerefugee movement into the country. A massive effort towardreservoir and vector control, along with actively pursuingdiagnosis in endemic foci, will be helpful. Proper and studiousreporting of cases is also a necessity for the eradication of thisdisease, as health care practitioners rely on these data forframing health policies. Future research is needed to determinethe main risk factors contributing to the increasing trend of theoccurrence of leishmaniasis, and to implement and evaluatecontrol and prevention measures in Jordan. Moreover, there isan urgent need for developing national health policies and actionplans for combating CL in Jordan.
AcknowledgmentsThe authors would like to acknowledge the Eastern Mediterranean Public Health Network and Jordan Field Epidemiology TrainingProgram for their technical support.
Conflicts of InterestNone declared.
References1. Centers for Disease Control and Prevention. Parasites - Leishmaniasis URL: https://www.cdc.gov/parasites/leishmaniasis/
[accessed 2019-01-15]2. World Health Organization. Leishmaniasis URL: http://www.who.int/mediacentre/factsheets/fs375/en/ [accessed 2019-01-15]3. Pace D. Leishmaniasis. J Infect 2014 Nov;69(Suppl 1):S10-S18. [doi: 10.1016/j.jinf.2014.07.016] [Medline: 25238669]4. Salam N, Al-Shaqha WM, Azzi A. Leishmaniasis in the middle East: incidence and epidemiology. PLoS Negl Trop Dis
2014 Oct;8(10):e3208 [FREE Full text] [doi: 10.1371/journal.pntd.0003208] [Medline: 25275483]5. Amin TT, Al-Mohammed HI, Kaliyadan F, Mohammed BS. Cutaneous leishmaniasis in Al Hassa, Saudi Arabia:
epidemiological trends from 2000 to 2010. Asian Pac J Trop Med 2013 Aug;6(8):667-672 [FREE Full text] [doi:10.1016/S1995-7645(13)60116-9] [Medline: 23790342]
6. Khosravani M, Moemenbellah-Fard MD, Sharafi M, Rafat-Panah A. Epidemiologic profile of oriental sore caused byLeishmania parasites in a new endemic focus of cutaneous leishmaniasis, southern Iran. J Parasit Dis 2016Sep;40(3):1077-1081 [FREE Full text] [doi: 10.1007/s12639-014-0637-x] [Medline: 27605840]
7. Khazaei S, Hafshejani AM, Saatchi M, Salehiniya H, Nematollahi S. Epidemiological aspects of cutaneous leishmaniasisin Iran. Arch Clin Infect Dis 2015;10(3):e28511. [doi: 10.5812/archcid.28511]
8. Khoury S, Saliba EK, Oumeish OY, Tawfig MR. Epidemiology of cutaneous leishmaniasis in Jordan: 1983-1992. Int JDermatol 1996 Aug;35(8):566-569. [doi: 10.1111/j.1365-4362.1996.tb03656.x] [Medline: 8854153]
9. Jaber SM, Ibbini JH, Hijjawi NS, Amdar NM. An exploratory comparative study of recent spatial and temporal characteristicsof cutaneous leishmaniasis in the Hashemite kingdom of Jordan and Syrian Arab Republic pre-Arab spring and their healthpolicy implications. Appl Spat Anal Policy 2014;7(4):337-360. [doi: 10.1007/s12061-014-9113-3]
10. World Health Organization. Neglected Tropical Diseases URL: http://www.emro.who.int/neglected-tropical-diseases/information-resources-leishmaniasis/cl-factsheet.html [accessed 2019-01-15]
JMIR Public Health Surveill 2020 | vol. 6 | iss. 1 | e14439 | p.110http://publichealth.jmir.org/2020/1/e14439/(page number not for citation purposes)
Alhawarat et alJMIR PUBLIC HEALTH AND SURVEILLANCE
XSL•FORenderX
11. Al-Tawfiq JA, AbuKhamsin A. Cutaneous leishmaniasis: a 46-year study of the epidemiology and clinical features in SaudiArabia (1956-2002). Int J Infect Dis 2004 Jul;8(4):244-250 [FREE Full text] [doi: 10.1016/j.ijid.2003.10.006] [Medline:15234329]
12. Elmekki MA, Elhassan MM, Ozbak HA, Qattan IT, Saleh SM, Alharbi AH. Epidemiological trends of cutaneous leishmaniasisin Al-Madinah Al-Munawarah province, western region of Saudi Arabia. J Glob Infect Dis 2017;9(4):146-150 [FREE Fulltext] [doi: 10.4103/jgid.jgid_16_17] [Medline: 29302149]
13. Karami M, Doudi M, Setorki M. Assessing epidemiology of cutaneous leishmaniasis in Isfahan, Iran. J Vector Borne Dis2013 Mar;50(1):30-37 [FREE Full text] [Medline: 23703437]
14. Al-Taqi M, Behbehani K. Cutaneous leishmaniasis in Kuwait. Ann Trop Med Parasitol 1980 Oct;74(5):495-501. [doi:10.1080/00034983.1980.11687374] [Medline: 7469563]
15. Alawieh A, Musharrafieh U, Jaber A, Berry A, Ghosn N, Bizri AR. Revisiting leishmaniasis in the time of war: the Syrianconflict and the Lebanese outbreak. Int J Infect Dis 2014 Dec;29:115-119 [FREE Full text] [doi: 10.1016/j.ijid.2014.04.023][Medline: 25449245]
16. Koltas IS, Eroglu F, Alabaz D, Uzun S. The emergence of Leishmania major and Leishmania donovani in southern Turkey.Trans R Soc Trop Med Hyg 2014 Mar;108(3):154-158. [doi: 10.1093/trstmh/trt119] [Medline: 24449479]
AbbreviationsCL: cutaneous leishmaniasis
Edited by E Mohsni; submitted 18.04.19; peer-reviewed by M Alyahya, M Khatatbeh; comments to author 30.05.19; revised versionreceived 04.10.19; accepted 20.10.19; published 24.03.20.
Please cite as:Alhawarat M, Khader Y, Shadfan B, Kaplan N, Iblan ITrend of Cutaneous Leishmaniasis in Jordan From 2010 to 2016: Retrospective StudyJMIR Public Health Surveill 2020;6(1):e14439URL: http://publichealth.jmir.org/2020/1/e14439/ doi:10.2196/14439PMID:32207696
©Mohammad Alhawarat, Yousef Khader, Bassam Shadfan, Nasser Kaplan, Ibrahim Iblan. Originally published in JMIR PublicHealth and Surveillance (http://publichealth.jmir.org), 24.03.2020. This is an open-access article distributed under the terms ofthe Creative Commons Attribution License (https://creativecommons.org/licenses/by/4.0/), which permits unrestricted use,distribution, and reproduction in any medium, provided the original work, first published in JMIR Public Health and Surveillance,is properly cited. The complete bibliographic information, a link to the original publication on http://publichealth.jmir.org, aswell as this copyright and license information must be included.
JMIR Public Health Surveill 2020 | vol. 6 | iss. 1 | e14439 | p.111http://publichealth.jmir.org/2020/1/e14439/(page number not for citation purposes)
Alhawarat et alJMIR PUBLIC HEALTH AND SURVEILLANCE
XSL•FORenderX

Original Paper
Occupational Exposure to Needle Stick Injuries and Hepatitis BVaccination Coverage Among Clinical Laboratory Staff in Sana’a,Yemen: Cross-Sectional Study
Nabil Al-Abhar1,2, MD; Ghuzlan Saeed Moghram3, MD; Eshrak Abdulmalek Al-Gunaid2, MD; Abdulwahed Al
Serouri1, PhD; Yousef Khader4, SCD1Field Epidemiology Training Program, Sana'a, Yemen2National Center of Public Health Laboratories, Sana'a, Yemen3Al Thawra Hospital, Sana'a, Yemen4Jordan Field Epidemiology Training Program, Jordan Ministry of Health, Amman, Jordan
Corresponding Author:Yousef Khader, SCDJordan Field Epidemiology Training ProgramJordan Ministry of HealthPr. Hamzah StAmman, 11118JordanPhone: 962 796802040Email: [email protected]
Abstract
Background: Laboratory staff handling blood or biological samples are at risk for accidental injury or exposure to blood-bornepathogens. Hepatitis B virus (HBV) vaccinations for laboratory staff can minimize these risks.
Objective: The aims of this study were to determine the prevalence of occupational exposure to needle stick injuries (NSIs)and assess HBV vaccination coverage among clinical laboratory staff in Sana’a, Yemen.
Methods: A cross-sectional survey was conducted among clinical laboratory staff who were involved in handling and processinglaboratory samples at the main public and private clinical laboratories in Sana’a. Data collection was done using a semistructuredquestionnaire. The questionnaire was divided into 3 parts. Part 1 included information on sociodemographic characteristics ofparticipants. Part 2 included information on the availability of the personal protective equipment in the laboratories, such as labcoats and gloves. Part 3 included questions about the history of injury during work in the laboratory and the vaccination statusfor HBV.
Results: A total of 219/362 (60%) participants had been accidentally injured while working in the laboratory. Of those, 14.6%(32/219) had been injured during the last 3 months preceding the data collection. Receiving the biosafety manual was significantlyassociated with lower risk of injury. Out of those who were injured, 54.8% (120/219) had received first aid. About three-quartersof respondents reported that they had been vaccinated against HBV. The vaccination against HBV was significantly higher amonglaboratory staff who were working at private laboratories (P=.01), who had postgraduate degrees (P=.005), and who receivedthe biosafety manual (P=.03).
Conclusions: Occupational exposure to NSI is still a major problem among laboratory staff in public and private laboratoriesin Sana’a, Yemen. The high incidence of injuries among laboratory staff and the low rate of receiving first aid in laboratoriescombined with low vaccination coverage indicates that all laboratory staff are at risk of exposure to HBV. Therefore, strengtheningsupervision, legalizing HBV vaccinations for all laboratory staff, and optimizing laboratory practices regarding the managementof sharps can minimize risks and prerequisites in Yemen.
(JMIR Public Health Surveill 2020;6(1):e15812) doi:10.2196/15812
KEYWORDS
injury; hepatitis B; vaccination; biosafety; laboratory staff; Yemen
JMIR Public Health Surveill 2020 | vol. 6 | iss. 1 | e15812 | p.112http://publichealth.jmir.org/2020/1/e15812/(page number not for citation purposes)
Al-Abhar et alJMIR PUBLIC HEALTH AND SURVEILLANCE
XSL•FORenderX

Introduction
Laboratory staff handling blood or biological samples are atrisk for accidental injury or exposure to blood-borne pathogens[1,2]. This may occur through exposure to aerosols, spills andsplashes, accidental needle stick injuries (NSIs), cuts from sharpobjects and broken glass, oral pipetting, and centrifuge accidents[3,4].
The World Health Organization reported that about three millionhealth care workers worldwide experience percutaneousexposure to blood-borne viruses. Consequently, 2.5% of HIVcases and 40% of Hepatitis B and C cases occurred among healthworkers worldwide [3,5]. Furthermore, different NSI prevalencewere reported among laboratory staff from Kenya (25%), SaudiArabia (14%), and Iran (2.3%) [6-8].
Laboratory staff are at high risk of blood-borne viruses includingHIV and hepatitis B and C because of the limited vaccinationof hepatitis B virus (HBV) among health care workers, the lackof personal protective equipment, and unsafe work practicessuch as improper management of sharp waste [9-11].
There is a scarcity of data in Yemen about occupationalexposure to NSIs and HBV vaccination coverage amonglaboratory staff. One study reported that 55% of staff had beeninjured during their work in the laboratory, with NSIs being thecommonest injury, and only 47% of staff had been vaccinatedagainst HBV [12]. This study aimed to determine prevalenceof occupational exposure to NSIs and assess HBV vaccinationcoverage among clinical laboratory staff in public and privatelaboratories in Sana’a, Yemen.
Methods
Study Design and Study PopulationA descriptive cross-sectional study was conducted among alllaboratory staff who were involved in processing laboratorysamples in the main public and private laboratories in Sana’a.The study included those who were working in the NationalCenter of Public Health Laboratories as well as three of themain public laboratories (Al-Thawra, Al-Jomhory, andAl-Kuwait) and three of the main private laboratories (SaudiGermany, University of Science and Technology, and Azal).Staff who were not involved in processing laboratory samples,such as administrative staff, were excluded.
Data Collection and the Study QuestionnaireData was collected between September 1 and October 31, 2015,using a self-administered semistructured questionnaire. Thequality control officers at each laboratory were trained todistribute the questionnaires to the participants, collect thenecessary data, and review the filled questionnaires on the spot.Ethical approval was obtained from the National Committeefor Medical and Health Research at the Ministry of PublicHealth and Population. Informed consent was obtained fromall participants.
The questionnaire was pilot tested on 10 respondents, who werenot included in this study, and necessary changes were made.The questionnaire was developed based on the available standardguidelines and practices and the reviewed literature [3,6,8-10],as well as feedback from some experts in the field. Thequestionnaire was divided into 3 parts. Part 1 includedinformation on sociodemographic characteristics of participants.Part 2 included information on the availability of the personalprotective equipment in the laboratories, such as lab coats andgloves. Part 3 included questions about the history of injuryduring laboratory work and the vaccination status for HBV.
Statistical AnalysisData was analyzed using SPSS version 18 (SPSS Inc, Chicago,IL). Data was analyzed using frequencies and percentages. Thedifferences between proportions according to studiedcharacteristics were tested using the chi-square test. A P<.05was considered statistically significant.
Results
Of 385 laboratory staff, 362 (292 from public laboratories and70 from private laboratories) completed the study questionnairewith a response rate of 94.0%. Table 1 shows the respondents’sociodemographic characteristics. About half of the respondentswere 30 to 39 years of age. More than two-thirds (298/362,82.3%) had received a bachelor’s degree, and 47.5% (172/362)had more than 10 years of work experience.
A total of 219/362 (60.5%) respondents had been accidentallyinjured during their work in the laboratory (Table 2). Of those,32/219 (14.6%) had been injured during the 3 months precedingdata collection.
Table 3 shows the availability of personal protective equipmentin public and private laboratories. The majority of laboratorystaff reported wearing gloves and lab coats with no significantdifference between private and public laboratories. Althoughother personal protective equipment (eg, masks, goggles, safetycabinets, and eye washers) were generally less available;however, private laboratory staff reported significantly higheravailability (P<.001). Receiving a biosafety manual was theonly factor that was significantly associated with lower injuryincidence. Out of those who were injured, 120/219 (54.8%) hadreceived first aid. Those who were working at privatelaboratories and those who had received a biosafety manual andbiosafety training were significantly more likely to receive firstaid.
About three-quarters of respondents reported that they had beenvaccinated (ie, received the recommended 3 doses) against HBV(Table 4). The vaccination against HBV was significantly higheramong laboratory staff who were working at private laboratories,those who had postgraduate degrees, and those who receivedthe biosafety manual.
JMIR Public Health Surveill 2020 | vol. 6 | iss. 1 | e15812 | p.113http://publichealth.jmir.org/2020/1/e15812/(page number not for citation purposes)
Al-Abhar et alJMIR PUBLIC HEALTH AND SURVEILLANCE
XSL•FORenderX

Table 1. Sociodemographic characteristics of laboratory workers (N=362).
Laboratory workers, n (%)Variable
Gender
178 (49.2)Male
184 (50.8)Female
Age (year)
83 (22.7)20-29
188 (51.9)30-39
70 (19.3)40-49
20 (5.5)50-59
1 (0.3)>59
Education
64 (17.7)Diploma
223 (61.6)Bachelor’s
75 (20.7)Higher than Bachelor’s
Work experience (years)
60 (16.6)1-4
130 (35.9)5-10
74 (20.4)11-15
98 (27.1)>15
Table 2. History of injury among laboratory staff during their work, and associated factors (N=362).
P valueNot injured, n (%)Injured, n (%)Variables
.30Type of laboratory
111 (38.0)181 (62.0)Public
32(45.7)38 (54.3)Private
.41Gender
66 (37.1)112 (62.9)Male
77 (41.8)107 (58.2)Female
.45Education
110 (38.3)177 (61.7)Nonpostgraduate
33 (44.0)42 (56.0)Postgraduate
.91Work experience (years)
74 (38.9)116 (61.1)1-10
69 (40.1)103 (59.9)>10
.01Received biosafety manual
108 (36.4)189 (63.6)No
35 (53.8)30 (46.2)Yes
.13Received biosafety training
80 (36.2)141 (63.8)No
63 (44.7)78 (55.3)Yes
JMIR Public Health Surveill 2020 | vol. 6 | iss. 1 | e15812 | p.114http://publichealth.jmir.org/2020/1/e15812/(page number not for citation purposes)
Al-Abhar et alJMIR PUBLIC HEALTH AND SURVEILLANCE
XSL•FORenderX

Table 3. Availability of personal protective equipment in public and private laboratories.
P valuePrivate laboratories (n=70), n (%)Public laboratories (n=292), n (%)Total (N=362), n (%)Personal protective equipment
.0970 (100.0)276 (94.5)346 (95.6)Gloves
.1870 (100.0)280 (95.9)350 (96.7)Lab coats
<.00138 (54.3)51 (17.5)89 (24.6)Masks
<.00115 (21.4)13 (4.5)28 (7.7)Goggles
<.00154 (77.1)68 (23.3)122 (33.7)Safety cabinet
<.00132 (45.7)38 (13.0)70 (19.3)Eye washer
Table 4. Hepatitis B virus vaccination status and associated factors (N=362).
P valueVaccinated, n (%)Not vaccinated, n (%)Variables
.01Type of laboratory
215 (73.6)77 (26.4)Public
62 (88.6)8 (11.4)Private
.75Gender
138 (77.5)40 (22.5)Male
139 (75.5)45 (24.5)Female
.005Education
210 (73.2)77 (26.8)Nonpostgraduate
67 (89.3)8 (10.7)Postgraduate
.09Work experience (years)
138 (72.6)52 (27.4)1-10
139 (80.8)33 (19.2)>10
.03Received biosafety manual
220 (74.1)77 (25.9)No
57 (87.7)8 (12.3)Yes
.36Received biosafety training
165 (74.7)56 (25.3)No
112 (79.4)29 (20.6)Yes
Discussion
Occupational exposure to NSI increases the risk of acquiringserious blood-borne infections among health care workers. Ourfindings showed that 60% of the laboratory staff had beeninjured while working in laboratories. Similar prevalence rateswere reported from studies in Sana’a and India [12,13].However, lower rates were reported from other countriesincluding Kenya (25%), Saudi Arabia (14%), and Iran (2.3%)[6-8].
Our findings showed low availability of some key personalprotective equipment (eg, masks, goggles, safety cabinets, andeye washers) especially in public laboratories. Injury in thelaboratory was significantly less likely among laboratory staffwho had received the biosafety manual. This indicates thattraining on biosafety helped to raise awareness as well asimprove attitudes and protective practices [14]. Therefore,training of laboratory staff on biosafety manuals and making
personal protective equipment available are crucial to reduceexposure to NSIs and its possible grave consequences.Furthermore, strengthening the biosafety program and policiesin laboratories together with enforcing use of personal protectiveequipment should be a cornerstone for reducing high NSIs inYemen.
Half of the injured staff had received first aid. A lowerpercentage (28.8%) was reported in other counties includingIndia [15]. There is a scarcity of data regarding HBV vaccinationcoverage among laboratory staff. Our study showed that onlythree-quarters of laboratory staff were vaccinated against HBV.In Saudi Arabia and Libya, studies showed that 97% and 82%were vaccinated against HBV, respectively [6,16]. In a previousstudy among laboratory staff in three public laboratories inSana’a, 47% were vaccinated against HBV [12]. The coverageof the HBV vaccine was found to be significantly higher amongpostgraduate laboratory staff and those who had more than 10years of experience, which may reflect their better knowledgeof vaccination importance and the grave consequences of not
JMIR Public Health Surveill 2020 | vol. 6 | iss. 1 | e15812 | p.115http://publichealth.jmir.org/2020/1/e15812/(page number not for citation purposes)
Al-Abhar et alJMIR PUBLIC HEALTH AND SURVEILLANCE
XSL•FORenderX

being vaccinated. In addition, there was significantly highervaccination coverage among laboratory staff in privatelaboratories, which may reflect better biosafety practices andstrict HBV vaccination requirements. Furthermore, laboratorystaff who received the biosafety manual had higher vaccinationcoverage, which also reflects the influence of biosafetyknowledge on vaccination.
In conclusion, occupational exposure to NSIs is still a majorproblem among laboratory staff in public and private
laboratories in Sana’a, Yemen. The high incidence of NSIsamong laboratory staff combined with not receiving first aid innearly half of reported injuries increased the risk of HBVinfection particularly among the nonvaccinated. Therefore,strengthening supervision, legalizing HBV vaccination for alllaboratory staff, and optimizing laboratory practices regardingthe management of sharps can minimize risks and prerequisitesin Yemen.
AcknowledgmentsAuthors would like to acknowledge The Eastern Mediterranean Public Health Network for their technical support.
Conflicts of InterestNone declared.
References1. CDC. Infection prevention & control in dental settings URL: https://www.cdc.gov/oralhealth/infectioncontrol/index.
html?CDC_AA_refVal=https%3A%2F%2Fwww.cdc.gov%2Foralhealth%2Finfectioncontrol%2Findex.htm2. Salmanzadeh S, Rahimi Z, Goshtasbipour M, Meripoor M. The prevalence of needle-stick injuries among healthcare workers
in Dasht-e-Azadegan, southern west of Iran. Int J Pharm Res Allied Sci 2016;5(2):417-422.3. De Carli G, Abiteboul D, Puro V. The importance of implementing safe sharps practices in the laboratory setting in Europe.
Biochem Med (Zagreb) 2014;24(1):45-56 [FREE Full text] [doi: 10.11613/BM.2014.007] [Medline: 24627714]4. Attaullah S, Khan S, Ayaz S, Khan S, Ali I, Hoti N, et al. Prevalence of HBV and HBV vaccination coverage in health care
workers of tertiary hospitals of Peshawar, Pakistan. Virol J 2011;8(1):275. [doi: 10.1186/1743-422x-8-275]5. Alice T, Akhere A, Ikponwonsa O, Grace E. Knowledge and practice of infection control among health workers in a tertiary
hospital in Edo state, Nigeria. Direct Res J Health Pharm 2013;1(2):20-27.6. Masoumi-Asl H, Rahbar M, Soltani A, Pezeshki Z, Khanaliha K, Kolifarhood G. Epidemiology of needlestick injuries
among healthcare workers in Tehran, Iran: a cross-sectional study. Arch Clin Infect Dis 2016 Nov 13. [doi:10.5812/archcid.37605]
7. Akhter J, Al Johani S, Hammad L. Laboratory work practices and occupational hazards among laboratory health careworkers: a health and safety survey. J Pharm Biomed Sci 2011;9(4):1-4.
8. Mbaisi EM, Ng'ang'a Z, Wanzala P, Omolo J. Prevalence and factors associated with percutaneous injuries and splashexposures among health-care workers in a provincial hospital, Kenya, 2010. Pan Afr Med J 2013;14:10 [FREE Full text][doi: 10.11604/pamj.2013.14.10.1373] [Medline: 23504245]
9. Batra V, Goswami A, Dadhich S, Kothari D, Bhargava N. Hepatitis B immunization in healthcare workers. Ann Gastroenterol2015;28(2):276-280 [FREE Full text] [Medline: 25830669]
10. Prüss-Ustün A, Rapiti E, Hutin Y. Estimation of the global burden of disease attributable to contaminated sharps injuriesamong health-care workers. Am J Ind Med 2005 Dec;48(6):482-490. [doi: 10.1002/ajim.20230] [Medline: 16299710]
11. U.S. Department of Health and Human Services. Biosafety in Microbiological and Biomedical Laboratories. 2009. URL:https://www.cdc.gov/labs/pdf/CDC-BiosafetyMicrobiologicalBiomedicalLaboratories-2009-P.PDF
12. Al Eryani Y, Nooradain N, Alsharqi K, Murtadha A, Al Serouri A, Khader Y. Unintentional injuries in the three referenceslaboratories: Sana'a, Yemen. Int J Prev Med 2019;10(1):174 [FREE Full text] [doi: 10.4103/ijpvm.IJPVM_160_17]
13. Anupriya A, Manivelan S. KAP study on the assessment of needlestick injuries and occupational safety among health-careworkers. Int J Med Sci Public Health 2015;4(3):342. [doi: 10.5455/ijmsph.2015.1810201464]
14. Khabour OF, Al Ali KH, Mahallawi WH. Occupational infection and needle stick injury among clinical laboratory workersin Al-Madinah city, Saudi Arabia. J Occup Med Toxicol 2018 May 21;13(1):15 [FREE Full text] [doi:10.1186/s12995-018-0198-5] [Medline: 29942343]
15. Zaveri J, Karia J. Knowledge, attitudes and practice of laboratory technicians regarding universal work precaution. NationalJournal of Medical Research 2012;20(29):25-28 [FREE Full text]
16. Ziglam H, El-Hattab M, Shingheer N, Zorgani A, Elahmer O. Hepatitis B vaccination status among healthcare workers ina tertiary care hospital in Tripoli, Libya. J Infect Public Health 2013 Aug;6(4):246-251 [FREE Full text] [doi:10.1016/j.jiph.2013.02.001] [Medline: 23806698]
AbbreviationsHBV: hepatitis B virus
JMIR Public Health Surveill 2020 | vol. 6 | iss. 1 | e15812 | p.116http://publichealth.jmir.org/2020/1/e15812/(page number not for citation purposes)
Al-Abhar et alJMIR PUBLIC HEALTH AND SURVEILLANCE
XSL•FORenderX

NSI: needle stick injury
Edited by H Abbas; submitted 08.08.19; peer-reviewed by M Alyahya, N Jarour, MJA Mofleh; comments to author 24.10.19; revisedversion received 26.01.20; accepted 12.02.20; published 31.03.20.
Please cite as:Al-Abhar N, Moghram GS, Al-Gunaid EA, Al Serouri A, Khader YOccupational Exposure to Needle Stick Injuries and Hepatitis B Vaccination Coverage Among Clinical Laboratory Staff in Sana’a,Yemen: Cross-Sectional StudyJMIR Public Health Surveill 2020;6(1):e15812URL: http://publichealth.jmir.org/2020/1/e15812/ doi:10.2196/15812PMID:32229462
©Nabil Saleh Al-Abhar, Ghuzlan Saeed Moghram, Eshrak Abdulmalek Al-Gunaid, Abdulwahed Al Serouri, Yousef Khader.Originally published in JMIR Public Health and Surveillance (http://publichealth.jmir.org), 31.03.2020. This is an open-accessarticle distributed under the terms of the Creative Commons Attribution License (https://creativecommons.org/licenses/by/4.0/),which permits unrestricted use, distribution, and reproduction in any medium, provided the original work, first published in JMIRPublic Health and Surveillance, is properly cited. The complete bibliographic information, a link to the original publication onhttp://publichealth.jmir.org, as well as this copyright and license information must be included.
JMIR Public Health Surveill 2020 | vol. 6 | iss. 1 | e15812 | p.117http://publichealth.jmir.org/2020/1/e15812/(page number not for citation purposes)
Al-Abhar et alJMIR PUBLIC HEALTH AND SURVEILLANCE
XSL•FORenderX

Original Paper
How Motivations for Using Buprenorphine Products Differ FromUsing Opioid Analgesics: Evidence from an Observational Studyof Internet Discussions Among Recreational Users
Stephen F Butler1*, PhD; Natasha K Oyedele2*, MPH, MSc; Taryn Dailey Govoni1*, MPH; Jody L Green1*, PhD1Inflexxion, Costa Mesa, CA, United States2Office of Disease Prevention, National Institutes of Health, Rockville, MD, United States*all authors contributed equally
Corresponding Author:Stephen F Butler, PhDInflexxion3070 Bristol StreetSuite 350Costa Mesa, CA, 92626United StatesPhone: 1 6033057068Email: [email protected]
Abstract
Background: Opioid use disorder (OUD) poses medical and societal concerns. Although most individuals with OUD in theUnited States are not in drug abuse treatment, buprenorphine is considered a safe and effective OUD treatment, which reducesillicit opioid use, mortality, and other drug-related harms. However, as buprenorphine prescriptions increase, so does evidenceof misused, abused, or diverted buprenorphine. Users’ motivations for extratreatment use of buprenorphine (ie, misuse or abuseof one’s own prescription or use of diverted medication) may be different from the motivations involved in analgesic opioidproducts. Previous research is based on small sample sizes and use surveys, and none directly compare the motivations for usingbuprenorphine products (ie, tablet or film) with other opioid products having known abuse potential.
Objective: The aim of the study was to describe and compare the motivation-to-use buprenorphine products, includingbuprenorphine/naloxone (BNX) sublingual film and oxycodone extended-release (ER), as discussed in online forums.
Methods: Web-based posts from 2012 to 2016 were collected from online forums using the Web Informed Services internetmonitoring archive. A random sample of posts was coded for motivation to use. These posts were coded into the followingmotivation categories: (1) use to avoid withdrawal, (2) pain relief, (3) tapering from other drugs, (4) opioid addiction treatment,(5) recreational use (ie, to get high), and (6) other use. Oxycodone ER, an opioid analgesic with known abuse potential, wasselected as a comparator.
Results: Among all posts, 0.81% (30,576/3,788,922) discussed motivation to use one of the target products. The examinationof query-selected posts revealed significantly greater discussion of buprenorphine products than oxycodone ER (P<.001). Theposts mentioning buprenorphine products were more likely than oxycodone ER to discuss treatment for OUD, tapering downuse, and/or withdrawal management (P<.001). Buprenorphine-related posts discussed recreational use (375/1020, 36.76%),although much less often than in oxycodone ER posts (425/508, 83.7%). Despite some differences, the overall pattern of motivationto use was similar for BNX sublingual film and other buprenorphine products.
Conclusions: An analysis of spontaneous, Web-based discussion among recreational substance users who post on online drugforums supports the contention that motivation-to-use patterns associated with buprenorphine products are different from thosereported for oxycodone ER. Although the findings presented here are not expected to reflect the actual use of the target products,they may represent the interests and motivations of those posting on the online forums. Buprenorphine-related posts were morelikely to discuss treatment for OUD, tapering, and withdrawal management than oxycodone ER. Although the findings areconsistent with a purported link between the limited availability of medication-assisted therapies for substance use disorders anduse of diverted buprenorphine products for self-treatment, recreational use was a motivation expressed in more than one-third ofbuprenorphine posts.
JMIR Public Health Surveill 2020 | vol. 6 | iss. 1 | e16038 | p.118http://publichealth.jmir.org/2020/1/e16038/(page number not for citation purposes)
Butler et alJMIR PUBLIC HEALTH AND SURVEILLANCE
XSL•FORenderX

(JMIR Public Health Surveill 2020;6(1):e16038) doi:10.2196/16038
KEYWORDS
buprenorphine-naloxone combination; buprenorphine; motivation; controlled substance diversion; addiction, opioid; opioidmedication-assisted treatment
Introduction
BackgroundOpioid use disorder (OUD) poses medical and societal concerns,contributing to an increasing economic burden [1].Approximately 11.8 million individuals older than 12 yearsmisused opioids in 2016, with 11.5 million misusing prescriptionpain relievers [2]. The same source notes that nearly 2.1 millionindividuals received past-year specialty treatment for OUD,where only 1 in 5 individuals (21.1%) with OUD received sucha treatment. A majority of individuals with OUD in the UnitedStates are not enrolled in drug abuse treatment [3]. Nevertheless,the amount of prescribed buprenorphine continues to increase[4-7], as does evidence of use of misused/abused/divertedbuprenorphine [8-10]. Previous research suggests that users’motivations for extra-treatment use of buprenorphine (ie,misuse/abuse of one’s own prescription or use of divertedmedication) may be different from motivations to misuse, abuse,or divert analgesic opioid products [3,8,11-14]. All these studiesare based on relatively small sample sizes and use surveys, andnone directly compare the motivations for using buprenorphineproducts (ie, tablet or film) with other opioid products havingknown abuse potential. This study is an effort to usespontaneously occurring Web-based discussion amongrecreational drug users to better understand the variousmotivations for use, misuse, and diversion of buprenorphineand empirically examine whether and how the motivationsobserved for buprenorphine products differ from an opioidanalgesic with known abuse potential.
Buprenorphine has been shown to be a safe and effectivetreatment for OUD, as well as for use in acute detoxification,stabilization, and long-term maintenance of individuals withOUD [15,16]. Opioid maintenance therapy with buprenorphinereduces illicit opioid use, mortality, and other drug-related harmsamong opioid-dependent individuals [17,18].
Buprenorphine has also been associated with diversion, misuse,and abuse, as the amount of prescribed buprenorphine hasincreased [4-7]. There is evidence that diversion, misuse, andabuse might vary across buprenorphine products. For example,a recent multi-dataset study [19] found evidence to concludethat prescription-adjusted abuse of the sublingual film was lessthan the single-entity tablet. Nevertheless, the abuse ofbuprenorphine quadrupled between 2008 and 2013, whenbuprenorphine was the fourth most commonly divertedprescription drug in law enforcement cases, behind oxycodone,hydrocodone, and alprazolam [20]. This raises the paradoxicalsituation: although buprenorphine is intended as a treatment forOUD, it is also likely to be abused, misused, and diverted.
As the prevalence of buprenorphine use outside the context ofparticipation in an authorized, therapeutic program for treatmentof OUD increases, evidence is emerging on the differences in
the patterns of extra-therapeutic buprenorphine use versusanalgesic opioids. Early work by Cicero and colleagues ofindividuals surveyed in substance abuse treatment [20] foundthat more than 30% of the individuals reported usingbuprenorphine to get high, yet only 1.6% of the individualsindicated buprenorphine as their primary drug of choice,compared with 32.4% of the individuals selecting oxycodoneas their primary drug, with 29.8% of the individuals selectingheroin. A total of 50% to 60% of those using buprenorphinecited motivations, such as maintenance of abstinence, to aid inweaning off other drugs and manage situations when theyneeded to function (eg, work or social events). In a more recentsurvey [8], 52% of the survey respondents reported usingbuprenorphine to get high, and 4% of the respondents reportedit as their drug of choice. In this subsequent survey, 79% of therespondents reported using buprenorphine products to maintainabstinence, and 53% of the respondents reported trying to weanthemselves off other drugs. Self-medication for pain (37%) andtreatment of emotional problems (19%) were also endorsed bysurvey respondents as motivations for using buprenorphine.More than 80% of the respondents who used divertedbuprenorphine indicated that easier access to a buprenorphineprescriber would increase the likelihood of them procuring aprescription rather than obtaining buprenorphine on their own[8]. These findings are supported by a recent survey ofindividuals in Rhode Island [3]. This study revealed that theprimary motivations underlying the use of divertedbuprenorphine were management of withdrawal symptoms andself-treatment of OUD. These authors conclude that restrictiveregulations limiting treatment capacity and inaccessibility ofexisting services have led to diversion of buprenorphine, largelyfor self-treatment. Other studies have reached similarconclusions [11-14], suggesting the possibility that illicit useof buprenorphine in the United States is motivated, at least forsome, by the desire to self-detoxify, self-treat, or manage opioidcravings and other withdrawal symptoms. It is worth notingthat in the studies cited, the authors have assumed that themotivations observed with respect to buprenorphine productsare different from the motivations for nonmedical use (NMU)of analgesic opioids. Although this is understandable, to ourknowledge, this assumption has not been empirically tested.
Discussion on the Web among recreational substance users whopost on online drug forums is a method for understanding howdrug users express their own motivations for using drugs. Onlineforums have been considered an ideal medium for individualswho abuse and misuse prescription drugs to communicate witheach other [21-23], offering their uncensored ideas and beliefs,discussing trends and preferences, and providing educationabout recreational drug use [24]. Public online forums can bemonitored unobtrusively and may reveal the methods, reasoning,and associated sentiment regarding the misuse of prescriptiondrugs [25,26]. These spontaneous, peer-to-peer discussions alsorepresent a different perspective than obtaining beliefs and
JMIR Public Health Surveill 2020 | vol. 6 | iss. 1 | e16038 | p.119http://publichealth.jmir.org/2020/1/e16038/(page number not for citation purposes)
Butler et alJMIR PUBLIC HEALTH AND SURVEILLANCE
XSL•FORenderX

practices reported in consented surveys. Discussions regardingprescription opioids on these websites may provide insights intohow individuals who post on these online forums view theimpetus for use of specific prescription opioid products.Furthermore, the attitudes, preferences, and opinions shared onthese online forums can be expected to inform those who viewthe websites but do not post messages. It is generally believedthat most (over 50%) of those who visit online forums are‘‘lurkers,’’ individuals who frequently read message boards butdo not post messages [27]. Thus, discussion about a particularsubstance or product on these message boards may not onlyrepresent the views and interests of those who post messagesbut also influence the attitudes and interests of the lurkers.Finally, relative to other media sources, such as Twitter,Facebook, or YouTube, online forums appear to retain theirrelevance on discussions on antisocial topics, such as substanceabuse, where anonymity for those who post or read can bemaintained.
ObjectivesThe aim of this study is to describe the motivations forbuprenorphine use, as reported in discussions on the Web. Tocontextualize the findings of reported motivations and providea stark contrast, we compared the motivational profile ofbuprenorphine products with oxycodone extended-release (ER),a nonbuprenorphine, prescription full µ-opioid agonist indicatedfor analgesia, known to be desirable for euphoric purposes orto get high [28]. Oxycodone ER is consistently reported ashighly abused in samples of individuals in chemical dependencetreatment [20,29]. In addition, a subanalysis examined for anydifferences with respect to motivations for usingbuprenorphine/naloxone (BNX) film as compared with otherbuprenorphine products. Quantitative and qualitative analyticapproaches were used to compare the patterns ofmotivation-related discussion associated with each productgroup.
Methods
Study Design and PopulationThis study was a 2-part evaluation comprising (1) retrospective,quantitative analyses of Web-based drug discussion levels ofbuprenorphine products compared with oxycodone ER and (2)a retrospective, qualitative coding of internet post contentregarding the motivation to use these products. A subanalysiswas conducted to test for any motivational differences betweenBNX sublingual film and other buprenorphine formulations.
The study sample was drawn from an archive of internet postsextracted from publicly accessible online forums, whichrepresent a population of recreational substance users and theirWeb-based communications regarding both illicit and
prescription drugs. Posts were identified on 7 online forumsthat are monitored by National Addictions VigilanceIntervention and Prevention Program (NAVIPPRO’s) WebInformed Services. The forums were chosen based on predefinedcriteria [25], specifying that the forum must (1) include amessage board component; (2) be unedited; (3) promote freediscussion of illicit and/or prescription drug use; (4) be open tothe public; (5) be privately funded (eg, private donations); (6)be maintained/moderated by volunteers; and (7) be anEnglish-language website (although not all authors who postmessages on the Web-form reside in the United States). Theposts written between January 1, 2012, and December 31, 2016,were archived in a database for further sampling and analysis.No personal identifiable information related to the author wassaved. All research activities conducted for this study weredeemed exempt from review by the New England InstitutionalReview Board.
Data Sample and Coding
Sampling Process for Quantitative AnalysesAll the posts referencing a buprenorphine product or oxycodoneER during the study period were collected (product categoriesare defined in Table 1).
Oxycodone ER was selected to represent a full µ-opioid agonistproduct with a different medical indication (ie, treatment ofpain), which is also known to be desirable for euphoric purposesor to get high [20,28,29]. Product-specific posts were identifiedfrom the entire archive of messages posted during the studyperiod using standardized queries to identify posts that containedtext matching search-string criteria. Search-string criteria forproducts included common misspellings, slang, and/or wildcardcharacters (eg, suboxone%, _xone, sub%, and bupe%).Search-string criteria were also generated to capture possiblemotivation-related discussion following a review by the researchteam of the literature and a manual review of a sample(approximately 500) of buprenorphine and oxycodone ER posts.In addition, consensus criteria were generated (eg, therapy%,detox%, rehab%, sober%, quit%, abuse%, rush%, high%,euphor%, nod%, relax%, and buzz%). These criteria were usedto identify relevant query-selected posts, along with exclusionterms, to minimize the number of posts that did not pertain tothe specified product or contain motivation-related discussion.Note that multiple posts may be submitted by the same authorand multiple motivations may be mentioned by the same authorin a single post or across multiple posts. In addition, more thanone of the target products may be mentioned in a single post.The posts mentioning BNX sublingual film were classified assuch and excluded from the other buprenorphine productcategories. The posts that mentioned a buprenorphine productand oxycodone ER were included in both categories, so thesecategories are not mutually exclusive.
JMIR Public Health Surveill 2020 | vol. 6 | iss. 1 | e16038 | p.120http://publichealth.jmir.org/2020/1/e16038/(page number not for citation purposes)
Butler et alJMIR PUBLIC HEALTH AND SURVEILLANCE
XSL•FORenderX

Table 1. Query inclusion terms.
Inclusion termsProduct
Suboxone film; associated slang and common misspellingsBuprenorphine/naloxone filma
Subutex; Zubsolv; Bunavail; Suboxone tablets; generic buprenorphine/naloxone and single-ingredientbuprenorphine tablets; and associated slang and common misspellings
Other buprenorphine products
Buprenorphine/naloxone (film or other buprenorphine products)Any buprenorphine product
Original OxyContin extended-release; reformulated OxyContin extended-release; oxycodone extended-release;and associated slang and common misspellings
Oxycodone extended-releaseb
aPosts containing specific mention of buprenorphine/naloxone sublingual film were classified in this category even if the posts also included a discussionof other buprenorphine products.bIt is possible for a post to mention a buprenorphine product and oxycodone extended-release. In those cases, the post would be captured in bothcategories, so there may be some level of overlap with the buprenorphine category.
Analytic Methods for Quantitative AnalysesPercentages and 95% CIs of posts (ie, number ofmotivation-to-use posts per total posts in archive×100) andauthors (ie, number of motivation-to-use authors per totalauthors in archive×100) were included for each productcategory. Analyses compared the extent to which motivationwas discussed and the number of people discussing motivationof the target products relative to the total discussion/authors inthe Web Informed Services archive.
Sampling Process and Sample Size Calculations forQualitative EvaluationThe posts to be analyzed for motivation-to-use comparisonswere selected from the pool of query-selected posts as describedabove. Power analyses required 500 posts per prescription opioid
category. To have a sufficient sample size for the subanalysisto examine differences between BNX sublingual film and otherbuprenorphine products, N=1500 was proposed to ensure 100posts across each year of the 5-year study period for BNXsublingual film, other buprenorphine, and oxycodone ER. Fromamong the pool of query-selected messages discussing themotivation to use the target products, posts were randomlyselected for the evaluation of the motivation-to-use analyses.As some posts may not meet the inclusion criteria, a total of2089 posts were sampled and manually reviewed to ensure thatall posts coded pertained to the specified product and containedmotivation-related content (see the flowchart in Figure 1). Theprimary analyses compared any buprenorphine and oxycodoneER. The category of any buprenorphine was created bycombining the BNX sublingual film and other buprenorphinecategories (Table 1).
Figure 1. Motivation-to-use content analysis flow chart. BNX: buprenorphine/naloxone; ER: extended-release.
JMIR Public Health Surveill 2020 | vol. 6 | iss. 1 | e16038 | p.121http://publichealth.jmir.org/2020/1/e16038/(page number not for citation purposes)
Butler et alJMIR PUBLIC HEALTH AND SURVEILLANCE
XSL•FORenderX

Content Analysis and Qualitative Evaluation ofMotivationA formal content analysis of the motivation to use wasconducted on the random sample of posts related to anybuprenorphine (BNX sublingual film and other buprenorphine)and oxycodone ER. Motivation to use was defined as any postdiscussing the rationale behind the use of a prescription opioidcompound, including use as prescribed. The posts were reviewedby 2 trained coders. Each post was first categorized by codersas having content that was motivation related or not motivation
related and relevant to one of the target products (Figure 1).The posts that were determined to contain motivation-to-usediscussion were further coded into 6 categories: use to avoidwithdrawal symptoms, use for pain relief, use to taper fromother drugs, use to treat OUD, use for recreational purposes,and/or other motivations (Table 2). The posts that weredetermined not to pertain to the target drug of interest or haveany motivation-related content were omitted from coding. Thus,posts were sampled, reviewed, and then resampled to ensurethat the number of posts in each category was consistent withthe power analysis requirements.
Table 2. Motivation-to-use category definitions and examples used to code motivation of use.
Definition and examplesMotivation-to-use categorya
Pertains to any post that discusses the use of a product for opioid use disorder treatment or maintenance, usingonly products prescribed by a medical professional. For example, I was prescribed product X to get off productY; My doctor gave me product X to help me get clean.
Opioid use disorder treatment
Posts that discuss the use of a product to treat physical pain. The source of the product is not considered withinthe context of this category; only the fact that it was discussed as being taken to mitigate pain is considered. Forexample, Product X is strong enough to alleviate pain symptoms; I was surprised that product X helped withmy chronic pain.
Pain
Posts that reference the recreational use of a product, including references to getting high, obtaining enjoyablesensations, and using for general enjoyment. For example, This is my first-time using product X to get high; Itook product X to feel euphoric.
Recreational
Posts that discuss the use of a product to reduce or eliminate the use of another product. This includes self-medication. For example, If you want to taper down, you might consider taking product X; Product X helpedme reduce my use of product Y.
Tapering
Pertains to posts that discuss the use of a product to mitigate or treat opioid withdrawal symptoms. For example,I use product Y to treat withdrawal symptoms; I need to wait until withdrawal symptoms start before usingproduct Y.
Withdrawal
Pertains to posts that contain references to use a product for a purpose not described in the other motivationcategories (eg, as they could not afford another prescription opioid product or to self-medicate depression). Forexample, I take product X to help with depression and anxiety; I regularly use product Y, but I did not have themoney and restored to using product X.
Other
aMotivation-to-use categories are not mutually exclusive, a single post may contain more than one motivation.
Analytic Methods
Intercoder AgreementTo assess the reliability of the coding, a random subsample ofat least 20% of all posts was coded by both the primary andsecondary coder, with the remaining posts coded by the primarycoder [25]. The posts were assigned to the primary or secondarycoder by a random-number generator. The coders were unawareof the posts coded by the other coder. For the overlappingsample, intercoder agreement was assessed. When codersdisagreed, a consensus decision achieved a single set of codesfor analysis. Intercoder agreement was calculated using theKappa statistic [30]. Reliability was separately calculated for 2buprenorphine categories (BNX sublingual film and otherbuprenorphine), along with oxycodone ER. Acceptableintercoder Kappa values were obtained for 2 coders acrossmotivations and products, with an overall Kappa of κ=0.85(Kappa ranged from κ=0.77 to κ=0.91), suggesting excellentagreement.
An Analytic Approach Toward Qualitative Post AnalysesComparisons of the types of motivation discussed werecalculated as percent and CIs (motivation-to-use categorydivided by the total sample randomly chosen to be coded).Comparisons of percents and percentages across productcategories utilized the Chi-square statistic. The Type I error wasset at alpha=.05. These comparisons were intended to comparethe types of motivations discussed for the target products forthe primary analyses (any buprenorphine versus oxycodone ER)and between BNX sublingual film and other buprenorphineproducts.
Results
Data EvaluationA total of 3,788,922 posts were collected on the Web on alltopics between January 1, 2012, and December 31, 2016, onthe monitored online forums. Among all posts, 1,393,059query-selected messages contained motivation-to-use–relatedmentions by a total of 67,156 unique authors (ie, posts submittedby the same username). Of the 3,788,922 motivation-relatedposts, 30,576 posts by 10,889 unique authors (some people
JMIR Public Health Surveill 2020 | vol. 6 | iss. 1 | e16038 | p.122http://publichealth.jmir.org/2020/1/e16038/(page number not for citation purposes)
Butler et alJMIR PUBLIC HEALTH AND SURVEILLANCE
XSL•FORenderX

authored multiple posts) contained a query-identified referenceto one of the target product categories and motivation-related
term(s)—Table 3.
Table 3. Post and author counts of evaluated product categories (between January 1, 2012, and December 31, 2016).
Unique author counts (N=84,711)Post counts (N=3,788,922)Evaluated categories
95% CIFrequency, n (%)95% CIFrequency, n (%)
12.63-13.0810,889 (12.86)0.80-0.8230,576 (0.81)Posts discussing motivation-to-use target product categories
7.30-7.666337 (7.48)0.47-0.4918,170 (0.48)Any buprenorphine product
2.00-2.191772 (2.09)0.09-0.103522 (0.09)Buprenorphine/naloxone sublingual filma
5.24-5.684565 (5.39)0.38-0.3914,648 (0.39)Other buprenorphine products
5.22-5.534552 (5.37)0.32-0.3312,406 (0.33)Oxycodone extended-release
79.01-79.5567,159 (79.28)36.72-36.821,393,059 (36.77)Total posts including motivation key words
aPosts containing specific mention of buprenorphine/naloxone sublingual film were classified in this category, even if the posts also included a discussionof other buprenorphine products. It is possible for a post to mention a buprenorphine product and oxycodone extended-release. In those cases, the postwould be captured in both categories, so there may be some level of overlap.
Quantitative Evaluation of Online Forum DiscussionEstimates of the level of drug motivation-to-use discussionrelative to all discussions on these online forums and 95% CIsderived from percents of target posts/total archive per 100 postsfor each product category are presented in Table 3. The primaryanalysis of any buprenorphine versus oxycodone ER productrevealed a significantly greater level of discussion (ie, mentionsof the product, along with at least one motivation keyword)regarding any buprenorphine product (18,170/3,788,922, 0.49%)than oxycodone ER (12,406/3,788,922, 0.33%; P<.001).Similarly, buprenorphine was discussed by more authors(6337/84,711, 7.50%), compared with oxycodone ER(4552/84,711, 5.44%; P<.001; Table 3).
Within buprenorphine products, significantly fewer postsdiscussed motivation to use BNX sublingual film(3522/3,788,922, 0.09%) than other buprenorphine products(14,648/3,788,922, 0.40%; P<.001; Table 3). Table 3 also showsthat BNX sublingual film had fewer authors (1772/84,711,2.18%) than the other buprenorphine product group(4565/84,711, 5.4%; P<.001).
Qualitative Evaluation of Motivations for Use andDiscussion ThemesThe primary comparison of interest was motivation to use anybuprenorphine product versus motivations discussed in postsreferencing oxycodone ER. As can be seen in Table 4, thepattern of references for motivation to use buprenorphineproducts was very different from oxycodone ER.
Every coded motivation category, except other, was significantlydifferent for these 2 product categories (P<.001; Table 4).Unsurprisingly, the motivations coded for buprenorphine postsreflecting buprenorphine use in a way that is consistent withself-medication aims, such as tapering (430/1020, 42.20%),managing withdrawal (230/1020, 22.50%), and opioid dependenttreatment references (289/1020, 28.30%), were much morelikely to be observed than in posts referencing oxycodone ER.Oxycodone ER posts discussed these self-medication–relatedmotivations in 0 posts for OUD treatment to 14 out of the 508
coded posts (2.8%; P<.001 for all comparisons except for theother category, which was not significant; Table 4).
Discussion related to the use of buprenorphine products forOUD treatment largely mentioned procuring the product via aprescription from a medical professional. References includeduse as prescribed through current participation in a maintenanceprogram or past participation in a treatment program, whichcould no longer be afforded. Nearly 25% of the posts were codedfor both OUD treatment and tapering motivations, particularlywhen there was mention of past participation in an OUDtreatment program. However, discussions of current use tendedto be associated with discussions of self-detoxification (ie,managing withdrawal or tapering from other drugs).
Recreational use, on the other hand, was much more likely tobe mentioned in oxycodone ER posts (425 out of 508 posts,83.7%) than in buprenorphine posts (375 out of 1020 posts,36.76%; P<.001). However, it should be noted that this suggeststhat more than one-third of buprenorphine posts mentioned useto get high, second only to tapering (430/1020 or 42.20%). Aninformal content review of posts referencing buprenorphineproducts’ (BNX sublingual film and other buprenorphineproducts) recreational use suggests a wide range of subtopics,including seeking or obtaining feelings of euphoria andexperiencing hallucinations and sickness. Recreational use postsalso discussed the ease of accessibility and difficulties whileabusing buprenorphine products formulated with naloxone.Several recreation-related buprenorphine posts referenced useby alternative routes of administration, including intravenous(n=54), intranasal (n=23), rectal (n=6), and smoking (n=3; seeMultimedia Appendix 1 for some examples).
The use of oxycodone ER to treat past and/or present physicalpain accounted for nearly one-third of the Web-based discussionof this product compared with less than 5.50% (56/1020) forbuprenorphine (Table 4). There were several mentions of usefor both pain relief and recreational use, where an individualcould be prescribed oxycodone ER for pain management butcould also subsequently progress to recreational use over thecourse of therapy (see Multimedia Appendix 1). The use ofbuprenorphine products for pain was infrequently discussed
JMIR Public Health Surveill 2020 | vol. 6 | iss. 1 | e16038 | p.123http://publichealth.jmir.org/2020/1/e16038/(page number not for citation purposes)
Butler et alJMIR PUBLIC HEALTH AND SURVEILLANCE
XSL•FORenderX

(56/1020, 5.50%) and, when discussed, generally reflected theauthors’ unfamiliarity of their use for pain management. Otherunspecified motivation to use buprenorphine was rarely coded(10/1020, 1.00%) and included off-label use of the product totreat depression and social anxiety.
We also compared the discussion specific to BNX sublingualfilm with other buprenorphine products. As can be seen in Table5, the motivation to use other buprenorphine products for
tapering (236/512, 46.1%) was significantly greater than forBNX sublingual film (194/508, 38.2%; P=.01; Table 5). Theuse of other buprenorphine products to treat physical pain(36/512, 7.0%) was also significantly different from BNXsublingual film (20/508, 3.9%; P=.04). Discussion of OUDtreatment, recreational use, withdrawal, and other topics forother buprenorphine products were not significantly differentfrom sublingual BNX sublingual film (Table 5).
Table 4. Percentage of posts mentioning specific motivation-to-use categories and Chi-square P values for pairwise differences.
Buprenorphine versus oxycodone ex-tended-release
Oxycodone extended-release
(N=508)a,bBuprenorphine products (N=1020)a,bMotivation-to-use category
P valuec95% CIFrequency, n (%)95% CIFrequency, n (%)
<.0010.0-0.00 (0.0)25.6-31.1289 (28.30)Opioid use disorder treatment
<.00128.6-36.8166 (32.7)4.1-6.956 (5.50)Pain
<.00180.5-86.9425 (83.7)33.8-39.7375 (36.80)Recreational
<.0011.4-4.214 (2.8)39.1-45.2430 (42.20)Tapering
<.0010.1-1.93 (0.6)19.9-25.0230 (22.50)Withdrawal
.990.3-2.35 (1.0)0.4-1.610 (1.00)Other
aNumber of posts coded for motivation content for each product category.bAs posts may mention more than one motivation-to-use, percentages do not add up to 100%.cP values in italics are significant.
Table 5. Percentage of posts mentioning specific motivation-to-use categories and Chi-square P values for pairwise differences in buprenorphine/naloxonesublingual film versus other buprenorphine products.
Sublingual film versus otherbuprenorphine
Other buprenorphine products
(N=512)a,bBuprenorphine/naloxone sublingual film
(N=508)a,bMotivation-to-use category
P valuec95% CIFrequency, n (%)95% CIFrequency, n (%)
.1426.5-34.5156 (30.5)22.4-30.0133 (26.2)Opioid use disorder treatment
.044.8-9.236 (7.0)2.4-6.120 (3.9)Pain
.0930.1-38.3175 (34.2)35.1-43.6200 (39.4)Recreational
.0141.8-50.4236 (46.1)34.0-42.4194 (38.2)Tapering
.0616.5-23.4102 (19.9)21.2-28.8127 (25.0)Withdrawal
.550.2-2.04 (0.8)0.4-2.66 (1.2)Other
aNumber of posts coded for motivation content for each product category.bAs posts may mention more than one motivation-to-use, percentages do not add to 100%.cP values in italics are significant.
Discussion
Principal FindingsThis study compared the motivations to use expressed byrecreational substance users in Web-based posts forbuprenorphine products and an opioid analgesic product withknown abuse potential (oxycodone ER). As expected, based onprevious analyses of Web-based discussions of oxycodone ERuse for recreational purposes [25,26], motivations to useoxycodone ER were primarily related to recreational use andtreating pain (the labeled indication). It is unsurprising to notethat on an online forum dedicated to recreational use ofsubstances, recreational use of oxycodone ER (83.7%) was the
most frequently coded category for this medication, with thesecond most often coded motivation being pain treatment(32.7%). In contrast, although recreational use of buprenorphineproducts was observed, at 36.8%, it was coded much less oftenthan oxycodone ER–related posts.
The finding that motivation-to-use patterns of buprenorphineare different from a prescription opioid indicated for thetreatment of pain is consistent with other studies [11-14] usingdifferent data sources and populations. However, to ourknowledge, this study is the first to directly compare motivationto use oxycodone ER with buprenorphine products. This directcomparison confirms the notion that buprenorphine productsare discussed differently than oxycodone ER by those who post
JMIR Public Health Surveill 2020 | vol. 6 | iss. 1 | e16038 | p.124http://publichealth.jmir.org/2020/1/e16038/(page number not for citation purposes)
Butler et alJMIR PUBLIC HEALTH AND SURVEILLANCE
XSL•FORenderX

messages on online forums dedicated to recreational substanceuse. Although it would have been interesting to examineadditional analgesics, the intensive work involved in codingrequired that we identify a single reasonable representative ofan opioid analgesic with known abuse potential, in this case,oxycodone ER. The study period (2012 to 2016) was well afterthe 2010 reformulation of oxycodone ER, although it is possiblethat some oxycodone ER discussion involved references to theprereformulation version. Although not tested directly, it maybe reasonable to speculate that the motivation-to-use patternobserved for oxycodone ER would be similar to other fullµ-opioid agonists. Consider, for instance, a study byMcNaughton and colleagues [25], who coded posts from theWeb Informed Services archive for the extent to which variousopioid compounds were endorsed for recreational use; theyfound endorsement for abuse to be greatest for oxymorphone,followed by hydromorphone, hydrocodone, oxycodone ER,morphine ER, and tramadol. Oxycodone ER was in the middleof this group of products and was significantly less endorsedfor abuse than oxymorphone and hydromorphone, and it wassignificantly more endorsed than tramadol. The calculatedendorsement ratio for oxycodone ER was not significantlydifferent from hydrocodone or morphine ER. Thus, one mightexpect that, with the exception of tramadol, the othercompounds’posts would be similarly discussed in a recreationalcontext on the Web.
Furthermore, although some differences were observed in thisstudy between BNX sublingual buprenorphine and otherbuprenorphine products, the overall pattern of motivationsexamined was quite similar. The examination of both postsreferencing BNX sublingual film and posts referencing otherbuprenorphine products revealed a range of motivations relatedto addiction management, including OUD treatment, andself-management of tapering and withdrawal. Although someinterest in pain relief was detected, this tended to be at muchlower levels than the discussion of efforts to quit or manageopioid withdrawal.
Despite the clearly articulated interest in the use ofbuprenorphine products for withdrawal management andself-tapering, the recreational use of BNX sublingual film andother buprenorphine products was discussed just as frequentlyas the use of these products for addiction management,underscoring the dual use of these products for both recreationaland self-medication intent. Therefore, self-medication in thiscontext does not necessarily imply that the aims of the user isto decrease or stop using opioids. Furthermore, the way theauthors discuss recreational substance use of buprenorphineproducts (BNX sublingual film or other buprenorphine) maybe different from the way products such as oxycodone ER arediscussed. The presence of naloxone, as well as the film orsublingual tablet formulations, may impact the overall sentimentexpressed in Web-based posts regarding recreational use, whichhave been shown to be different for different products [25,31].Further studies are required to investigate whether the natureof recreational-use discussions of buprenorphine differ fromrecreational-use discussions about opioid analgesics.
Owing to the unstructured nature of the online forum content,the source of procurement could not be reliably determined. It
is possible that a lack of reference to obtaining a buprenorphineproduct as a part of an addiction treatment program potentiallyinvolved diverted buprenorphine products. It is also possiblethat some references to tapering and withdrawal in these postsmay be related to appropriate OUD treatment. On the basis ofpost content, it was not always possible to distinguishappropriate medically supervised treatment from the use ofdiverted product to self-medicate. Nevertheless, this study’sfindings are consistent with studies specifically investigatingdiverted buprenorphine use [3,8]. These authors and others [32]suggest that health insurance coverage, limited Medicaidcoverage, and stigma against pharmacotherapy for OUD haveresulted in a shortage of treatment capacity and led toinaccessibility of existing services. Consequently, the persistenceof these societal conditions is likely to ensure that the individualsin need of treatment will continue to self-treat with divertedmedications. Although we concur, generally, with thisconclusion, recreational use (ie, use to get high) was citedrelatively frequently in the coded posts—a finding consistentwith other studies [8]. It may be a mistake to assume thatlegitimate access alone accounts for buprenorphine use outsideof a treatment program.
LimitationsThis study has limitations that should be considered. A commonconcern with respect to data collected from online forums isthat those who post may not be truthful. Although the veracityof any individual post cannot be ascertained, it should be notedthat individuals who participate in the examined forumsrepresent stable communities of drug users who areself-policing; therefore, the posted information that isinconsistent with others’ experiences tends to be corrected bythe online community [33]. As with any self-report data,self-report biases cannot be ruled out. However, the anonymitythat is inherent on these forums, as well as the fact that theopinions expressed are targeted to peers and not researchers orother authorities, renders self-report bias in a different light forthese data.
Although the online forums included were selected accordingto a priori criteria, they were not randomly selected. Samplingbias may exist in trends discussed and users’ traits of selectedforums versus unsampled forums; however, the included forumswere selected based on the volume of recreational-usediscussion, making it a saturated sample. The forums used inthis study may differ in the amount and tone of discussiondevoted to using and potentially abusing pharmacologicalproducts. This study’s findings may only be reflective ofcommunities of recreational drug users who participate in onlineforums and may not be representative of all Web-baseddiscussion. In addition, although discussions on the Web maycapture the interests, intentions, and motivations expressed bythose who post on the Web, these data are not intended tocapture the actual use of the target products.
We have noted that the examination of post content from onlineforums provides many advantages for the researcher, includingthe ability to eavesdrop on conversations among individualswho use drugs illicitly rather than obtain information throughsome authority (ie, researchers, law enforcement, and health
JMIR Public Health Surveill 2020 | vol. 6 | iss. 1 | e16038 | p.125http://publichealth.jmir.org/2020/1/e16038/(page number not for citation purposes)
Butler et alJMIR PUBLIC HEALTH AND SURVEILLANCE
XSL•FORenderX
care workers). However, a disadvantage of the method is thatthe anonymity prevents us from being able to characterize whothe authors are and place them within the context of knownpopulations of illicit and NMU of substances. A study [34]attempted to characterize visitors to a single, large online forum,Bluelight.org, using a survey. Most (63%) of the respondentsfrom a sample 897 respondents were from the United States;the remaining 37% of the respondents were from the UnitedKingdom (12%), Australia (9%), Canada (6%), and 11% werefrom other. The respondents had an average age of 25 years(SD 12) and were mostly male (76%) and white (86%), andalmost 80% of them had some college education, graduatedcollege, or had postgraduate training. About 35% of therespondents reported some alcohol or drug treatment and 31%of the respondents reported past 30-day NMU of a prescriptionopioid. To place these demographics into context, we comparedthem with recent NAVIPPRO Addiction SeverityIndex-Multimedia Version substance use treatment center data[35]. Compared with the demographics of the internet responderscited above, fewer of the 217,240 treatment patients were male(65%) and white (60%), and 22% of these patients reported past30-day prescription opioid NMU, compared with 31% of theonline forum respondents. Another NAVIPPRO treatment centerstudy [36] of prescription opioid NMU reported on educationlevel and found 30% of the patients with some college or higherlevel of education and an older population (nearly 80% of themwere older than 24 years). Although the inability to preciselydescribe the population of authors in this study remains alimitation, it seems likely that the present sample is youngerand more well educated than the individuals in treatment forsubstance use disorder.
We acknowledge that the selection of the specific query termsused to identify posts discussing the target products and potentialmotivations may have excluded terms that omitted relevantposts to an unknown extent. Furthermore, differentiating amongthe motivation categories presented in Table 2 requires someinterpretation of motives. Tapering or managing withdrawalsymptoms does not imply a desire on the part of the author tostop using drugs or seek treatment. However, the high intercoderreliability obtained while coding these categories, as well as theclear differentiation between the results for buprenorphine andoxycodone ER, suggests that the findings presented here arereliable and valid.
Only a sample of posts was selected from the 5-year studyperiod, and longitudinal motivations for use trends were notanalyzed. The identification of product-specific posts byquerying based on keywords is incomplete; it may conflatesome posts discussing more than one of the target products andmay have missed some motivations that were not captured inthe keyword list. Furthermore, as querying methods captureposts that are determined to be irrelevant to the target topic uponreview by trained coders (in this case, specific product mentionsand discussion of motivation-to-use), the quantitative analysesbased on querying results may overestimate the amount of theWeb-based discussion presented here. However, it is unlikelythat this lack of precision differentially impacts the productscompared, as human review of the sampled posts resulted inalmost identical proportions of excluded posts for the products
examined. It is also possible that there are terms and slang thatare unknown to us or references to a product or motivation thatwere not captured in this study. However, coders spendconsiderable time following threads and discussions on theonline forum and becoming familiar with the uniquecommunication styles of these communities on the Web.Therefore, it is likely that coders for this study were able tocapture the essence of the meaning available to the majority offorum visitors [31].
The posts analyzed here were posted over several years, endingin 2016. It is acknowledged that much has changed since then.In recent years, the use of illicit fentanyl has increaseddramatically [37], although at the same time, the prescriptionsdispensed for opioid analgesics have decreased, largely as aresponse to Centers for Disease Control and Preventionguidelines published in 2016 [38,39]. The recent introductionof buprenorphine subcutaneous formulations [40] may furtherimpact the Web-based discussion of buprenorphine products.Future investigations should examine how these changes arereflected in the Web-based discussion of opioids in general,particularly buprenorphine.
StrengthsThe study strengths include the use of a relatively large samplesize, inclusion of quantitative and qualitative analyses, and theuse of systematic and consistent methods that build onpreviously published studies. Additional strengths include theuse of a standardized coding methodology, analysis ofWeb-based post discussions with acceptable interrateragreement, and the systematic archiving and storage of forumposts over time, allowing for retrospective evaluation of dataand circumventing bias of forum moderators who may deleteolder posts.
ConclusionsAlthough prior studies have suggested that the motivation touse diverted buprenorphine products is different from themotivations for abuse of opioid analgesics [20,28,29], nonehave directly compared motivations for abuse of these products.In this study, we directly compared motivations for using orabusing buprenorphine products with those expressed for one,widely abused prescription opioid indicated for analgesia andknown to be desirable for euphoric purposes or to get high (ie,oxycodone ER). Compared with oxycodone ER, discussion ofbuprenorphine was significantly more likely to reflect OUDtreatment, tapering, and withdrawal management. Buprenorphineproducts were associated with less discussion of use forrecreational purposes or pain relief relative to oxycodone ER.These findings are consistent with the work of others. Someauthors have suggested a link between the limited availabilityof medication-assisted therapies and use of divertedbuprenorphine products [3,8,32]. However, this study and others[4-7] found evidence for a meaningful level of misuse, abuse,and diversion of the product, which may or may not beassociated with the availability of medication-assisted therapy.We observed little difference in motivation-to-use patternsbetween BNX sublingual film and other buprenorphine products.Finally, this study also supports the value of Web-baseddiscussions among a population of interest, namely, recreational
JMIR Public Health Surveill 2020 | vol. 6 | iss. 1 | e16038 | p.126http://publichealth.jmir.org/2020/1/e16038/(page number not for citation purposes)
Butler et alJMIR PUBLIC HEALTH AND SURVEILLANCE
XSL•FORenderX

users of drugs, to better understand motivations for using different prescription opioid products.
AcknowledgmentsThe authors would like to acknowledge Lea Chilazi for her contribution to internet monitoring activities. The preparation of thispaper was supported partly by Indivior public limited company (PLC), Richmond, Virginia, and Inflexxion, an IntegratedBehavioral Health (IBH) Company, Waltham, Massachusetts. Indivior PLC provided comments on the final draft of the paper.The authors had sole editorial rights over the paper. The authors conceived of, wrote, reviewed and revised, and approved thepaper. The authors did not receive any fees or financial support for any activities associated with the paper.
Conflicts of InterestAll authors are (or were) employed by Inflexxion, an IBH Company, which provides independent consultation to the pharmaceuticalindustry. Inflexxion, an IBH Company, routinely provides such services to a number of pharmaceutical companies.
Multimedia Appendix 1Examples of motivation-to-use internet discussion posts.[DOCX File , 17 KB - publichealth_v6i1e16038_app1.docx ]
References1. Strassels SA. Economic burden of prescription opioid misuse and abuse. J Manag Care Pharm 2009 Sep;15(7):556-562
[FREE Full text] [doi: 10.18553/jmcp.2009.15.7.556] [Medline: 19739878]2. Ahrnsbrak R, Bose J, Hedden SL, Lipari RN, Park-Lee E. Substance Abuse and Mental Health Services Administration.
2017. Key Substance Use and Mental Health Indicators in the United States: Results from the 2016 National Survey onDrug Use and Health URL: https://www.samhsa.gov/data/sites/default/files/NSDUH-FFR1-2016/NSDUH-FFR1-2016.htm[accessed 2019-10-21]
3. Carroll JJ, Rich JD, Green TC. The more things change: Buprenorphine/Naloxone diversion continues while treatmentremains inaccessible. J Addict Med 2018;12(6):459-465 [FREE Full text] [doi: 10.1097/ADM.0000000000000436] [Medline:30095563]
4. Cassidy TA, DasMahapatra P, Black RA, Wieman MS, Butler SF. Changes in prevalence of prescription opioid abuse afterintroduction of an abuse-deterrent opioid formulation. Pain Med 2014 Mar;15(3):440-451. [doi: 10.1111/pme.12295][Medline: 24330279]
5. Dasgupta N, Bailey EJ, Cicero T, Inciardi J, Parrino M, Rosenblum A, et al. Post-marketing surveillance of methadone andbuprenorphine in the United States. Pain Med 2010 Jul;11(7):1078-1091. [doi: 10.1111/j.1526-4637.2010.00877.x] [Medline:20545875]
6. Lavonas EJ, Severtson SG, Martinez EM, Bucher-Bartelson B, Le Lait M, Green JL, et al. Abuse and diversion ofbuprenorphine sublingual tablets and film. J Subst Abuse Treat 2014 Jul;47(1):27-34 [FREE Full text] [doi:10.1016/j.jsat.2014.02.003] [Medline: 24680219]
7. Larance B, Lintzeris N, Ali R, Dietze P, Mattick R, Jenkinson R, et al. The diversion and injection of abuprenorphine-naloxone soluble film formulation. Drug Alcohol Depend 2014 Mar 1;136:21-27. [doi:10.1016/j.drugalcdep.2013.12.005] [Medline: 24461476]
8. Cicero TJ, Ellis MS, Chilcoat HD. Understanding the use of diverted buprenorphine. Drug Alcohol Depend 2018 Dec1;193:117-123 [FREE Full text] [doi: 10.1016/j.drugalcdep.2018.09.007] [Medline: 30359928]
9. Lin LA, Lofwall MR, Walsh SL, Gordon AJ, Knudsen HK. Perceptions and practices addressing diversion among USbuprenorphine prescribers. Drug Alcohol Depend 2018 May 1;186:147-153 [FREE Full text] [doi:10.1016/j.drugalcdep.2018.01.015] [Medline: 29573649]
10. Lofwall MR, Walsh SL. A review of buprenorphine diversion and misuse: the current evidence base and experiences fromaround the world. J Addict Med 2014;8(5):315-326 [FREE Full text] [doi: 10.1097/ADM.0000000000000045] [Medline:25221984]
11. Bazazi AR, Yokell M, Fu JJ, Rich JD, Zaller ND. Illicit use of buprenorphine/naloxone among injecting and noninjectingopioid users. J Addict Med 2011 Sep;5(3):175-180 [FREE Full text] [doi: 10.1097/ADM.0b013e3182034e31] [Medline:21844833]
12. Mitchell SG, Kelly SM, Brown BS, Reisinger HS, Peterson JA, Ruhf A, et al. Uses of diverted methadone and buprenorphineby opioid-addicted individuals in Baltimore, Maryland. Am J Addict 2009;18(5):346-355 [FREE Full text] [doi:10.3109/10550490903077820] [Medline: 19874152]
13. Monte AA, Mandell T, Wilford BB, Tennyson J, Boyer EW. Diversion of buprenorphine/naloxone coformulated tabletsin a region with high prescribing prevalence. J Addict Dis 2009 Jul;28(3):226-231. [doi: 10.1080/10550880903014767][Medline: 20155591]
JMIR Public Health Surveill 2020 | vol. 6 | iss. 1 | e16038 | p.127http://publichealth.jmir.org/2020/1/e16038/(page number not for citation purposes)
Butler et alJMIR PUBLIC HEALTH AND SURVEILLANCE
XSL•FORenderX

14. Schuman-Olivier Z, Albanese M, Nelson SE, Roland L, Puopolo F, Klinker L, et al. Self-treatment: illicit buprenorphineuse by opioid-dependent treatment seekers. J Subst Abuse Treat 2010 Jul;39(1):41-50. [doi: 10.1016/j.jsat.2010.03.014][Medline: 20434868]
15. Johnson RE, Jaffe JH, Fudala PJ. A controlled trial of buprenorphine treatment for opioid dependence. J Am Med Assoc1992 May 27;267(20):2750-2755. [Medline: 1578593]
16. Jaffe JH, O'Keeffe C. From morphine clinics to buprenorphine: regulating opioid agonist treatment of addiction in theUnited States. Drug Alcohol Depend 2003 May 21;70(2 Suppl):S3-11. [doi: 10.1016/s0376-8716(03)00055-3] [Medline:12738346]
17. Fullerton CA, Kim M, Thomas CP, Lyman DR, Montejano LB, Dougherty RH, et al. Medication-assisted treatment withmethadone: assessing the evidence. Psychiatr Serv 2014 Feb 1;65(2):146-157. [doi: 10.1176/appi.ps.201300235] [Medline:24248468]
18. Thomas CP, Fullerton CA, Kim M, Montejano L, Lyman DR, Dougherty RH, et al. Medication-assisted treatment withbuprenorphine: assessing the evidence. Psychiatr Serv 2014 Feb 1;65(2):158-170. [doi: 10.1176/appi.ps.201300256][Medline: 24247147]
19. Butler SF, Black RA, Severtson SG, Dart RC, Green JL. Understanding abuse of buprenorphine/naloxone film versus tabletproducts using data from ASI-MV substance use disorder treatment centers and RADARS® System Poison Centers. J SubstAbuse Treat 2018 Jan;84:42-49. [doi: 10.1016/j.jsat.2017.10.010] [Medline: 29195592]
20. Cicero TJ, Ellis MS, Surratt HL, Kurtz SP. Factors contributing to the rise of buprenorphine misuse: 2008-2013. DrugAlcohol Depend 2014 Sep 1;142:98-104. [doi: 10.1016/j.drugalcdep.2014.06.005] [Medline: 24984689]
21. Boyer EW, Lapen PT, Macalino G, Hibberd PL. Dissemination of psychoactive substance information by innovative drugusers. Cyberpsychol Behav 2007 Feb;10(1):1-6. [doi: 10.1089/cpb.2006.9999] [Medline: 17305442]
22. Wax PM. Just a click away: recreational drug web sites on the internet. Pediatrics 2002 Jun;109(6):e96. [doi:10.1542/peds.109.6.e96] [Medline: 12042590]
23. Zinkham GM, Kwak H, Morrison M, Peters CO. Web-based chatting: consumer communication in cyberspace. J ConsumPsychol 2003;13(1-2):17-27 [FREE Full text]
24. Nielsen S, Barratt MJ. Prescription drug misuse: is technology friend or foe? Drug Alcohol Rev 2009 Jan;28(1):81-86.[doi: 10.1111/j.1465-3362.2008.00004.x] [Medline: 19320680]
25. McNaughton EC, Black RA, Zulueta MG, Budman SH, Butler SF. Measuring online endorsement of prescription opioidsabuse: an integrative methodology. Pharmacoepidemiol Drug Saf 2012 Oct;21(10):1081-1092. [doi: 10.1002/pds.3307][Medline: 22777908]
26. Vosburg SK, Haynes C, Besharat A, Green JL. Changes in drug use patterns reported on the web after the introduction ofADF OxyContin: findings from the Researched Abuse, Diversion, and Addiction-Related Surveillance (RADARS) SystemWeb Monitoring Program. Pharmacoepidemiol Drug Saf 2017 Sep;26(9):1044-1052. [doi: 10.1002/pds.4248] [Medline:28653782]
27. Nonnecke B, Preece J. Lurker Demographics: Counting the Silent. In: Proceedings of the SIGCHI Conference on HumanFactors in Computing Systems. 2000 Presented at: CHI'00; April 1-6, 2000; The Hague, Netherlands p. 73-80 URL: https://www.cc.gatech.edu/classes/AY2003/cs6470_fall/demographics.pdf
28. Butler SF, Fernandez KC, Chang A, Benoit C, Morey LC, Black R, et al. Measuring attractiveness for abuse of prescriptionopioids. Pain Med 2010 Jan;11(1):67-80. [doi: 10.1111/j.1526-4637.2009.00736.x] [Medline: 20002325]
29. Butler SF, Black RA, Cassidy TA, Dailey TM, Budman SH. Abuse risks and routes of administration of different prescriptionopioid compounds and formulations. Harm Reduct J 2011 Oct 19;8:29 [FREE Full text] [doi: 10.1186/1477-7517-8-29][Medline: 22011626]
30. Landis JR, Koch GG. The measurement of observer agreement for categorical data. Biometrics 1977 Mar;33(1):159-174.[doi: 10.2307/2529310] [Medline: 843571]
31. McNaughton EC, Black RA, Weber SE, Butler SF. Assessing abuse potential of new analgesic medications followingmarket release: an evaluation of Internet discussion of tapentadol abuse. Pain Med 2015 Jan;16(1):131-140. [doi:10.1111/pme.12547] [Medline: 25244069]
32. Mitchell SG, Gryczynski J, Schwartz RP. Commentary on 'The More Things Change: Buprenorphine/Naloxone DiversionContinues While Treatment is Inaccessible'. J Addict Med 2018;12(6):424-425 [FREE Full text] [doi:10.1097/ADM.0000000000000437] [Medline: 30095564]
33. McNaughton EC, Coplan PM, Black RA, Weber SE, Chilcoat HD, Butler SF. Monitoring of internet forums to evaluatereactions to the introduction of reformulated OxyContin to deter abuse. J Med Internet Res 2014 May 2;16(5):e119 [FREEFull text] [doi: 10.2196/jmir.3397] [Medline: 24800858]
34. Chiauzzi E, Dasmahapatra P, Lobo K, Barratt MJ. Participatory research with an online drug forum: a survey of usercharacteristics, information sharing, and harm reduction views. Subst Use Misuse 2013 Jun;48(8):661-670. [doi:10.3109/10826084.2013.800117] [Medline: 23750771]
35. Butler SF, McNaughton EC, Black RA, Cassidy TA. Evaluation of the Relative Abuse of an OROS Extended-releaseHydromorphone HCI Product: Results From 3 Postmarket Surveillance Studies. Clin J Pain 2018 Jul;34(7):618-628. [doi:10.1097/AJP.0000000000000585] [Medline: 29298186]
JMIR Public Health Surveill 2020 | vol. 6 | iss. 1 | e16038 | p.128http://publichealth.jmir.org/2020/1/e16038/(page number not for citation purposes)
Butler et alJMIR PUBLIC HEALTH AND SURVEILLANCE
XSL•FORenderX

36. Cassidy TA, Thorley E, Black RA, DeVeaugh-Geiss A, Butler SF, Coplan P. Abuse of reformulated OxyContin: updatedfindings from a sentinel surveillance sample of individuals assessed for substance use disorder. J Opioid Manag2017;13(6):425-440. [doi: 10.5055/jom.2017.0419] [Medline: 29308589]
37. Centers for Disease Control (CDC). Opioid Overdose: Fentanyl. 2019. URL: https://www.cdc.gov/drugoverdose/opioids/fentanyl.html [accessed 2019-10-07]
38. Dowell D, Haegerich TM, Chou R. CDC Guideline for Prescribing Opioids for Chronic Pain - United States, 2016. MMWRRecomm Rep 2016 Mar 18;65(1):1-49. [doi: 10.15585/mmwr.rr6501e1] [Medline: 26987082]
39. Finnegan J. FierceHealthcare. 2019 Jul 18. Decline in Opioid Prescriptions Translates to Drop in Drug Overdose Deathsfor the First Time in Decades URL: https://www.fiercehealthcare.com/practices/decline-opioid-prescriptions-translates-to-drop-drug-overdose-deaths-for-first-time [accessed 2019-10-07]
40. Albayaty M, Linden M, Olsson H, Johnsson M, Strandgården K, Tiberg F. Pharmacokinetic evaluation of once-weeklyand once-monthly buprenorphine subcutaneous injection depots (CAM2038) versus intravenous and sublingual buprenorphinein healthy volunteers under naltrexone blockade: an open-label phase 1 study. Adv Ther 2017 Feb;34(2):560-575. [doi:10.1007/s12325-016-0472-9] [Medline: 28070862]
AbbreviationsBNX: buprenorphine/naloxoneER: extended-releaseIBH: Integrated Behavioral HealthNAVIPPRO: National Addictions Vigilance Intervention and Prevention ProgramNMU: nonmedical useOUD: opioid use disorderPLC: public limited company
Edited by G Eysenbach; submitted 28.08.19; peer-reviewed by E McNaughton, J Rich, D Newman; comments to author 23.09.19;revised version received 17.10.19; accepted 16.12.19; published 25.03.20.
Please cite as:Butler SF, Oyedele NK, Dailey Govoni T, Green JLHow Motivations for Using Buprenorphine Products Differ From Using Opioid Analgesics: Evidence from an Observational Studyof Internet Discussions Among Recreational UsersJMIR Public Health Surveill 2020;6(1):e16038URL: http://publichealth.jmir.org/2020/1/e16038/ doi:10.2196/16038PMID:32209533
©Stephen F F Butler, Natasha K Oyedele, Taryn Dailey Govoni, Jody L Green. Originally published in JMIR Public Health andSurveillance (http://publichealth.jmir.org), 25.03.2020. This is an open-access article distributed under the terms of the CreativeCommons Attribution License (https://creativecommons.org/licenses/by/4.0/), which permits unrestricted use, distribution, andreproduction in any medium, provided the original work, first published in JMIR Public Health and Surveillance, is properlycited. The complete bibliographic information, a link to the original publication on http://publichealth.jmir.org, as well as thiscopyright and license information must be included.
JMIR Public Health Surveill 2020 | vol. 6 | iss. 1 | e16038 | p.129http://publichealth.jmir.org/2020/1/e16038/(page number not for citation purposes)
Butler et alJMIR PUBLIC HEALTH AND SURVEILLANCE
XSL•FORenderX

Publisher:JMIR Publications130 Queens Quay East.Toronto, ON, M5A 3Y5Phone: (+1) 416-583-2040Email: [email protected]
https://www.jmirpublications.com/
XSL•FORenderX