Vietnam economic review in 2018 - FPTS
95
-
Upload
khangminh22 -
Category
Documents
-
view
1 -
download
0
Transcript of Vietnam economic review in 2018 - FPTS


www.fpts.com.vn Bloomberg – FPTS <GO> | 1
VIETNAM ECONOMIC OUTLOOK
Vietnam economic review in 2018
Vietnam economic outlook in 2019
INDUSTRIES OUTLOOK IN 2019
Construction NEGATIVE
Steel NEGATIVE
Tiles NEGATIVE
Plastic POSITIVE
Aviation POSITIVE
Fertilizer POSITIVE
Beer NEGATIVE
Sugar POSITIVE
Power POSITIVE
TABLE OF CONTENTS
www.fpts.com.vn Bloomberg – FPTS <GO> | 2
VU THI HONG
Email: [email protected]
Tel: (+84) 24 3773 7070
Ext: 4302
NGUYEN TUAN NGHIA
Email: [email protected]
Tel: (+84) 24 3773 7070
Ext: 4343
www.fpts.com.vn Bloomberg – FPTS <GO> | 3
VIETNAM ECONOMIC REVIEW IN 2018
1. Economic growth
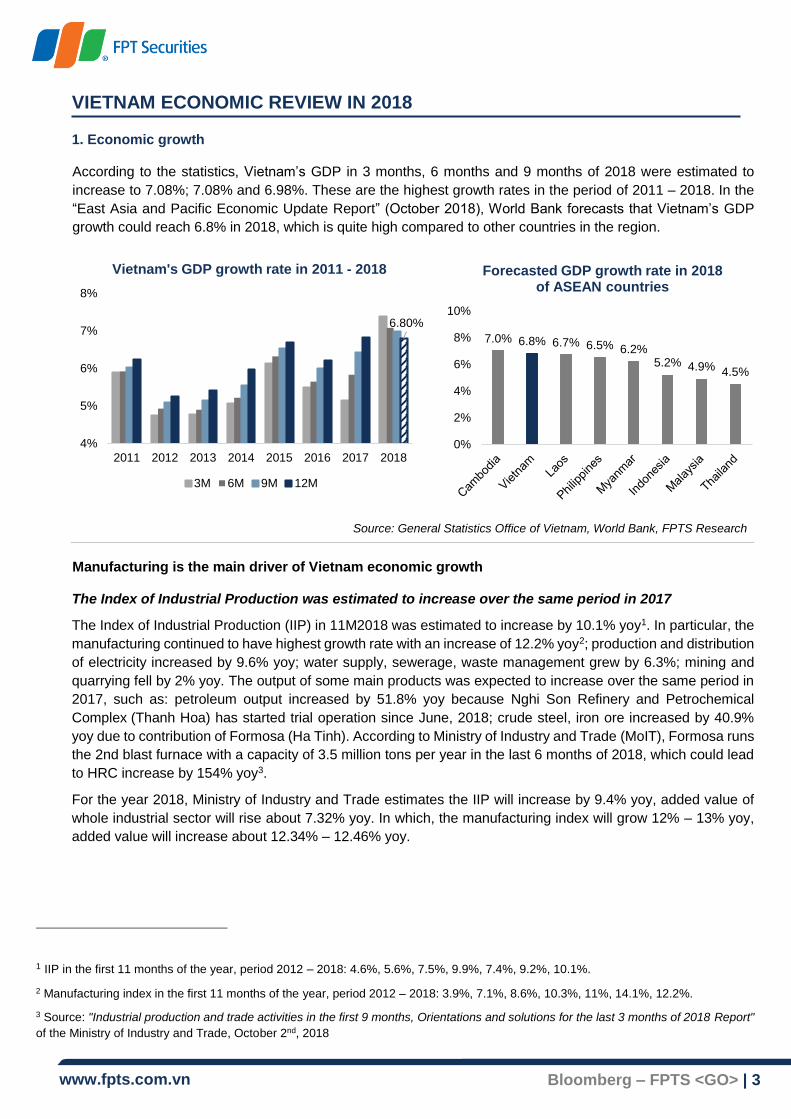
According to the statistics, Vietnam’s GDP in 3 months, 6 months and 9 months of 2018 were estimated to
increase to 7.08%; 7.08% and 6.98%. These are the highest growth rates in the period of 2011 – 2018. In the
“East Asia and Pacific Economic Update Report” (October 2018), World Bank forecasts that Vietnam’s GDP
growth could reach 6.8% in 2018, which is quite high compared to other countries in the region.
Source: General Statistics Office of Vietnam, World Bank, FPTS Research
Manufacturing is the main driver of Vietnam economic growth
The Index of Industrial Production was estimated to increase over the same period in 2017
The Index of Industrial Production (IIP) in 11M2018 was estimated to increase by 10.1% yoy1. In particular, the
manufacturing continued to have highest growth rate with an increase of 12.2% yoy2; production and distribution
of electricity increased by 9.6% yoy; water supply, sewerage, waste management grew by 6.3%; mining and
quarrying fell by 2% yoy. The output of some main products was expected to increase over the same period in
2017, such as: petroleum output increased by 51.8% yoy because Nghi Son Refinery and Petrochemical
Complex (Thanh Hoa) has started trial operation since June, 2018; crude steel, iron ore increased by 40.9%
yoy due to contribution of Formosa (Ha Tinh). According to Ministry of Industry and Trade (MoIT), Formosa runs
the 2nd blast furnace with a capacity of 3.5 million tons per year in the last 6 months of 2018, which could lead
to HRC increase by 154% yoy3.
For the year 2018, Ministry of Industry and Trade estimates the IIP will increase by 9.4% yoy, added value of
whole industrial sector will rise about 7.32% yoy. In which, the manufacturing index will grow 12% – 13% yoy,
added value will increase about 12.34% – 12.46% yoy.
1 IIP in the first 11 months of the year, period 2012 – 2018: 4.6%, 5.6%, 7.5%, 9.9%, 7.4%, 9.2%, 10.1%.
2 Manufacturing index in the first 11 months of the year, period 2012 – 2018: 3.9%, 7.1%, 8.6%, 10.3%, 11%, 14.1%, 12.2%.
3 Source: "Industrial production and trade activities in the first 9 months, Orientations and solutions for the last 3 months of 2018 Report"
of the Ministry of Industry and Trade, October 2nd, 2018
6.80%
4%
5%
6%
7%
8%
2011 2012 2013 2014 2015 2016 2017 2018
Vietnam's GDP growth rate in 2011 - 2018
3M 6M 9M 12M
7.0% 6.8% 6.7% 6.5% 6.2%5.2% 4.9% 4.5%
0%
2%
4%
6%
8%
10%
Forecasted GDP growth rate in 2018 of ASEAN countries
www.fpts.com.vn Bloomberg – FPTS <GO> | 4
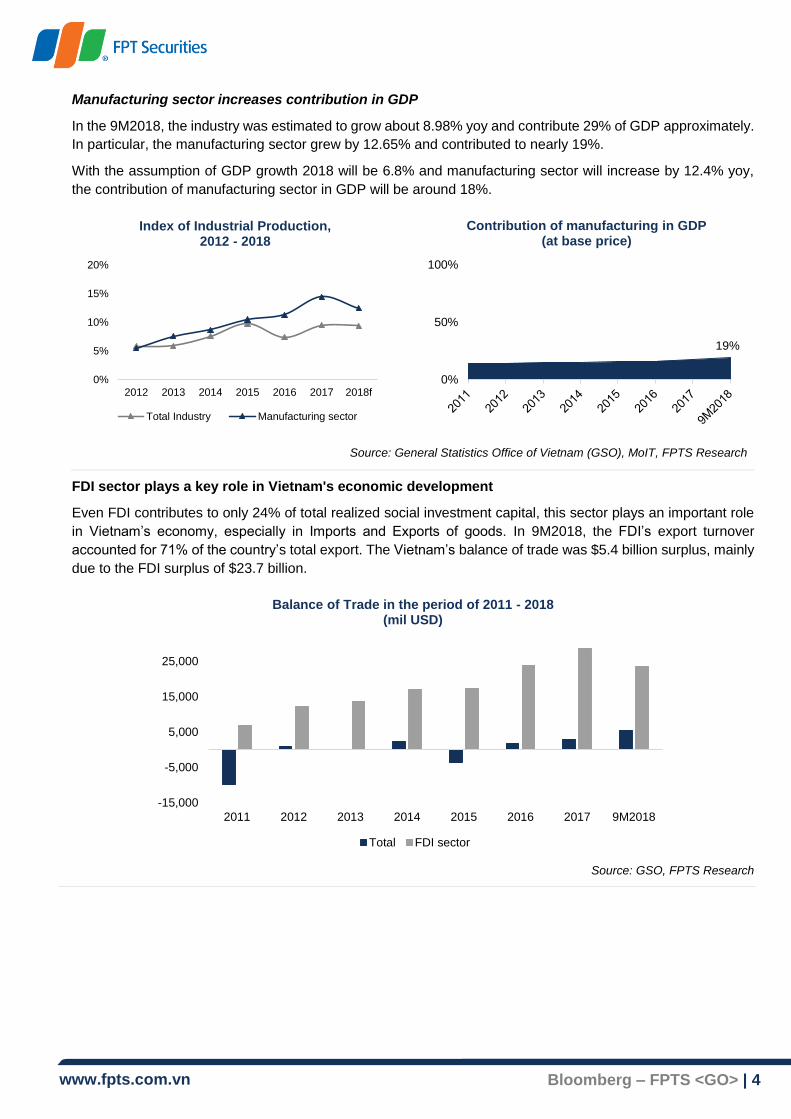
Manufacturing sector increases contribution in GDP
In the 9M2018, the industry was estimated to grow about 8.98% yoy and contribute 29% of GDP approximately.
In particular, the manufacturing sector grew by 12.65% and contributed to nearly 19%.
With the assumption of GDP growth 2018 will be 6.8% and manufacturing sector will increase by 12.4% yoy,
the contribution of manufacturing sector in GDP will be around 18%.
Source: General Statistics Office of Vietnam (GSO), MoIT, FPTS Research
FDI sector plays a key role in Vietnam's economic development
Even FDI contributes to only 24% of total realized social investment capital, this sector plays an important role
in Vietnam’s economy, especially in Imports and Exports of goods. In 9M2018, the FDI’s export turnover
accounted for 71% of the country’s total export. The Vietnam’s balance of trade was $5.4 billion surplus, mainly
due to the FDI surplus of $23.7 billion.
Source: GSO, FPTS Research
-15,000
-5,000
5,000
15,000
25,000
2011 2012 2013 2014 2015 2016 2017 9M2018
Balance of Trade in the period of 2011 - 2018(mil USD)
Total FDI sector
0%
5%
10%
15%
20%
2012 2013 2014 2015 2016 2017 2018f
Index of Industrial Production, 2012 - 2018
Total Industry Manufacturing sector
19%
0%
50%
100%
Contribution of manufacturing in GDP(at base price)

www.fpts.com.vn Bloomberg – FPTS <GO> | 5
Two enterprises that have great influence on the national economy are Formosa Ha Tinh Steel Corporation and
Samsung Corporation in Vietnam. In 9M2018, the IIP in Ha Tinh ranked #1 nationwide with an increase of
110.4% yoy. However, if excluding the effect of Formosa, the IIP of this province increased by only 4.2%4.
According to Ministry of Industry and Trade, as of June 2018, after 10 years of operation in Vietnam, Samsung
Group has produced more than 01 billion mobile devices. In which, Samsung in Bac Ninh has manufactured
more than 625 million products, Thai Nguyen factory has produced over 431 million products and 97% of total
production are for export5.
In 2018, there are large projects have been granted investment registration certificates with total investment of
more than $1 billion:
Smart City project in Dong Anh, Hanoi was granted investment certificate on July 14th 2018 with total
investment capital of $4.138 billion from Sumitomo Corporation (Japan).
The project of Polypropylene (PP) manufacturing and liquefied petroleum gas (LPG) warehouse invested
by Hyosung Corporation (Korea) in Ba Ria - Vung Tau with total investment capital of $1.201 billion, received
investment registration on May 30th 2018.
Laguna (Vietnam) Company Ltd,. project increased investment capital by $1.12 billion on May 25th 2018.
This project was invested by Singaporean in Thua Thien Hue and was granted the certificate of investment
registration in 2007.
2. Inflation
Consumer price index (CPI) might increase by 4% compared to the same period in 2017
The average CPI in 11M2018 was estimated to increase by 3.59% yoy. Average core CPI rose by 1.46% yoy.
According to the “East Asia-Pacific Economic Update Report” (October 2018), CPI in 2018 is forecast to increase
by 4% yoy, equal to the plan of the Government but still higher than that of several countries in the region.
Source: Word Bank, FPTS Research
4 Source: Social and economic situation 9M2018 report in Ha Tinh Province
5 Source: "Industrial production and trade activities in the first 9 months, Orientations and solutions for the last 3 months of 2018 Report"
of the Ministry of Industry and Trade, October 2nd, 2018
8.5%
4.9%4.0%
3.4% 3.2% 3.0%
1.2% 1.0%
0%
2%
4%
6%
8%
10%
Forecasted CPI in 2018 in some countries in ASEAN

www.fpts.com.vn Bloomberg – FPTS <GO> | 6
3. Exchange rate and Interest rate
The exchange rate of USD/VND decreased by 2.7% compared to the beginning of 2018
As of the end of November, the exchange rate between US dollar and Vietnam dong decreased by 2.7%. In
other words, Vietnam dong has depreciated by 2.7% from the beginning of the year. This volatility is low
compared to the volatility of other currencies in the region in relation to the USD: Cambodia (KHR: -0.1%),
Thailand (THB: -1.1%); Vietnam (VND: -2.7%); Laos (LAK: -2.9%); Malaysia (MYR: -3.3%); Philippines (PHP:
-4.8%); Indonesia (IDR: -5.1%); Myanmar (MMK: -14.5%).
Source: Bloomberg, FPTS Research
Deposit rates and lending rates were relatively stable
According to the statistics of State Bank of Vietnam, deposit rates and lending rates in 11M2018 were relatively
stable. Deposit rates in VND were commonly between 0.6% - 7.3%, deposit rate in USD was 0% for individuals
and institutions. The lending rates in VND were between 6.0% - 9% p.a for short term loans, 9% - 11% p.a for
medium and long term loans. The US dollar lending rates ranged from 2.8% to 6.0% p.a.
Deposit rates
Term Rate
VND
Demand and below 1-month 0.6 - 1%
1-month to below 6-month 4.3 – 5.5%
6-month to below 12-month 5.3 – 6.5%
12-month or more 6.5 – 7.3%
USD 0%
Lending rates
Term Rate
VND
Short-term 6.0 – 9.0%
Medium and Long-term
9.0 - 11%
USD
Short-term 2.8 – 4.7%
Medium and Long-term
4.5 – 6.0%
Source: State Bank of Vietnam, FPTS Research
-20%
-15%
-10%
-5%
0%
5%
Jan-18 Feb-18 Mar-18 Apr-18 May-18 Jun-18 Jul-18 Aug-18 Sep-18 Oct-18 Nov-18
Volatility of exchange rate between US dollar and domestic currencies in some countries in ASEAN
(As of November 30th 2018)
THB (Thailand) IDR (Indonesia) MMK(Myanmar) MYR(Malaysia)
PHP(Philippines) LAK(Laos) KHR(Campuchia) VND(Vietnam)

www.fpts.com.vn Bloomberg – FPTS <GO> | 7
IMPORTANT POLICIES IN THE FIELD OF CURRENCY AND BANKING IN 2018
1. Flexible and prudent monetary policy to control inflation and stabilize the macro economy
Source: State Bank of Vietnam, General Statistics Office of Vietnam (GSO)
According to the State Bank of Vietnam, total liquidity increased by 12.5% yoy in 2018 (versus 14.97% yoy in
2017); credit growth rate reached 14% (versus 18.24% in 2017), this result is consistent with the credit growth
target of about 17%.
In 2018, the government's goals of GDP growth (6.7%) and average inflation (4%) were achieved. The GDP in
2018 was estimated to increase by 7.08%, the highest growth since 2011; average CPI in 2018 increased by
3.54% compared with that in 2017.
2. Policy documents issued to tighten credit
Circular No.19/2017/TT-NHNN was issued on the limits and safety ratios in the operation of credit institutions
and international banks. Credit institutions and foreign banks must reduce the proportion of short-term funds for
medium and long-term loans from the current of 45% to 40% since January 1, 2019. Circular No.19 also provides
more detail on the credit limit, such as: do not exclude deposit guarantees including savings deposits from the
credit limit; credit institutions must not lend for investment or stock trading, including cases of stocks collateral
of credit institutions and subsidiaries of credit institutions; stocks collateral of issuing enterprises that customers
borrow to buy shares of these enterprises.
In January 2018, the State Bank lowered the interest rate to buy OMO from 5% p.a to 4.75% p.a, credit
institutions thus reduced the cost of capital and lowered the lending interest rate. The lending interest of the
economy has decreased compared to the same period last year, specifically reducing by roughly 0.5% for priority
sectors, down 0.3% for short-term and 0.8% for long-term loans.
3. Credit structure focused on manufacturing fields, as well as tightened in high potential risky sectors
such as securities and real estates
Credit inflows have focused mainly on priority areas: agricultural and rural development; export goods; small
and medium enterprises; supporting industry; high-tech enterprises, especially the development of agriculture
and rural areas. According to the General Statistic Office, in the end of 2018, the credit for agriculture and rural
Source: State Bank of Vietnam
0%
5%
10%
15%
20%
0
2,000
4,000
6,000
8,000
2015 2016 2017 2018
Credit and credit growth
Credit (Thousand billion dong)
Credit growth rate (%)
0%
5%
10%
15%
7,500
8,000
8,500
9,000
9,500
Total liquidity
Total Liquidity (Thousand billion dong)
The rate of growth as compared to the previous year (%)
0%
10%
20%
30%
0
500
1,000
1,500
2,000
12/2017 3/2018 7/2018 9/2018 11/2018
Credit for the agricultural and rural sector
Credit (Thousand billion dong) Proportion(%)

www.fpts.com.vn Bloomberg – FPTS <GO> | 8
areas increased by 15.5% compared to the end of 2017, accounting for 24% of the total credit of the economy.
For risky areas such as BOT, BT traffic projects, real estate; credit has been directly controlled through
regulations to increase the risk ratio of real estate loans from 150% to 250% and lower the rate of short-term
capital used for medium and long-term loans from 60% to 40%.
COMPREHENSIVE & PROGRESSIVE AGREEMENT FOR TRANS-PACIFIC PARTNERSHIP
Comprehensive and Progressive Agreement for Trans-Pacific Partnership (CPTPP) was officially signed
on March 8, 2018. The CPTPP is a trade agreement between Australia, Brunei, Canada, Chile, Japan,
Malaysia, Mexico, New Zealand, Peru, Singapore, and Vietnam. On November 12, 2018, the National Assembly
of Vietnam passed a resolution to ratify CPTPP. Despite the withdrawal of the United States, CPTPP is still the
largest free trade agreement with a market of about 500 million people, total GDP of 10,100 billion USD, equaling
to 13.5% of global GDP.
There are 2 adjustments compared to TPP:
Change of requirement for effectiveness: if at least six nations approve the CPTPP, it may take effect in
60 days after signing. Additionally, the new agreement has also adds regulations related to the process of
withdrawal, participation, and flexible reviewing.
Delaying implementation of 22 articles of the CPTPP, including the facilitation of trade, investment,
services, government procurement, intellectual property rights, the environment and the
transparency. Intellectual property rights have made the biggest change because most of the strong
commitments was proposed by the US before. CPTPP postponed requesting member countries to change
their laws and practices to protect new drugs, including probiotics; temporary suspension of the regulation
on extension of copyright terms in cases of delay of licensing agencies or unreasonable delays in licensing,
as well as licensing the importation of certain drugs into member countries.
(1) CPTPP has a positive impact on the entire Vietnamese economy
Impact of potential FTAs on Vietnamese economy by 2030 (%)
Standard simulations Simulations with productivity boost
CPTPP TPP12 CPTPP TPP12
GDP 1.1 3.6 3.5 6.6
Exports 4.2 19.1 6.9 22.8
Imports 5.3 21.7 7.6 24.9
Source: World Bank
According to the World Bank's assessment, the benefits that Vietnam will achieve when participating in CPTPP
are lower than TPP. However, in the CPTPP, the export market will be more diversified and uniform, less
dependent on a large US market.
(2) Different effects from lower tariffs and non-tariff measures on various economic sectors
Tariffs and non-tariff measures (NTMs) before and after trade liberalization (%)
CPTPP TPP12
2017 2030 2017 2030
Tariffs faced by Vietnam in FTA markets 1.7 0.2 4.2 0.1
Tariffs imposed by Vietnam on FTA members 2.9 0.1 3.2 0.1
Non-tariff barriers (NTB) faced by Vietnam in FTA markets 9.4 5.8 9.4 4.3
NTB imposed by Vietnam on FTA members 7.9 5.0 10.3 5.0
Source: World Bank

www.fpts.com.vn Bloomberg – FPTS <GO> | 9
Light and labor-intensive industries will benefit such as garments, footwear, food and beverage sectors, etc. The
current export tariff on textiles to non FTA markets is above 10% on average, (US is 17% - 18%), when CPTPP
is effective and products meet strict technical standards as “yarn forward” rule, the tax rate will be at 0%,
therefore, the growth rate of textile exports is forecasted to be up by 8.3% - 10.8%. According to World Bank,
by 2030, exports to CPTPP countries will increase from 54 to 80 billion USD, accounting for 25% of total exports.
Exports increased in the food, beverage and tobacco industries; clothing, leather and textiles will be 10.1; 6.9
and 0.5 billion USD. This result is limited partly because Vietnam has a bilateral and multilateral FTA with 7/10
members in CPTPP.
Negative impacts will focus on the areas of agriculture, livestock and poultry, food processing such as chicken
and pork due to weak competitiveness. The reduction of import tariffs from CPTPP is forecasted to impact the
output of the livestock sector by 0.3%; the growth rate of the food processing industry will decrease by 0.37%
to 0.52%. According to the World Bank, 23 export sectors of Vietnam having the largest net reduction will be:
agriculture (-1.6 billion USD), other industrial production (-1.2 billion USD), electrical equipment (-0.5 billion
USD), metal (-0.4 billion USD).
CPTPP will also divert FDI inflows into industries benefiting from agreements such as textiles and footwear.
Increased investment may increase productivity and increase technology content in exports, exports will be less
dependent on imported materials, but will rely more on domestic supply chains instead, in order to overcome
the limitations of rules of origin, encourage domestic private companies to integrate more actively into the value
chain formed after the CPTPP takes effect, drag on the development of small and medium enterprises.
(3) Lower poverty and increase distribution for skilled labors
Socially, participating in CPTPP will reduce unemployment, increase income and reduce poverty. According to
research of the Ministry of Planning and Investment in September 2017, CPTPP can help increase the average
number of jobs per year by about 20,000 - 26,000 (0.037-0.048% compared to the total number of jobs in
Q2/2018). According to the World Bank report, by 2030, the agreement is expected to help reduce 0.6 million
poor people at a poverty standard of 5.5 USD/day. Although all expected income groups benefit from CPTPP,
the highest skilled workers in the region with 60% of the highest income will benefit more.
(4) Challenges from CPTPP
Cutting import tariffs will reduce budget revenue. In recent years, the Government has determined to reduce the
proportion of revenue from available natural resources such as crude oil as well as continuously lowering
corporate income tax rates to attract FDI, which will worsen the budget decline.
Participation in numerous trade agreements will increase the economy’s openess and vulnerablilty to external
shocks if the world economy is in crisis or recession.
Vietnam might not immediately take advantages from attracting and receiving large FDI inflows due to the lack
of capacity to facilitate global affiliates to join global value chains; high logistics costs and weak infrastructure,
electricity, marine ports. Foreign investment activities still face problems such as environmental issues, transfer
pricing, trade fraud, technology transfer, and supporting industry development.
Strict regulations on standards and technical regulations will be a major barrier to export goods when major
changes are required in the process of farming and exploitation (forest and aqua products); packaging process,
preservation and transportation (agricultural products and food).

www.fpts.com.vn Bloomberg – FPTS <GO> | 10
ECONOMIC OUTLOOK IN 2019
1. Global economic growth forecast
Global economic growth in 2019 is forecast to be equal to or lower than that of 2018. Specifically, the IMF
forecasts the growth of 3.7% (equal to 2018 forecast)6; the OECD gives the forecast of 3.5% (less than 2% compared
to 2018)7 and the forecast of World Bank is 2.9% (down 1% compared to 2018 forecast)8.
2. Commodity prices forecast
According to the World Bank’s Commodity Markets Outlook Report (October 2018), price of most commodities are
expected to increase in 2019. Specifically:
o Energy: Oil prices in 2019 are forecast to increase by $2/barrel (from average $72/barrel in 2018 to $74/barrel
in 2019). Meanwhile, coal and natural gas prices are expected to fall in 2019, the coal price in Australia will
decrease from average $108/mt in 2018 to $100/mt in 2019 approximately, etc.
o Beverage: The price of Arabica coffee is expected to rise about $2.85/kg to $2.89/kg (+1.4%), tea price will
increase from average $2.85/kg to $2.88/kg (+1.1%), etc.
o Food: Thailand rice price will increase slightly from $420/mt to $422/mt (+0.5%); wheat price will rise roughly
from $210/mt to $212/mt (+1.0%); shrimp price will up from $12.4/kg to $12.53/kg (+1.0%); sugar price is
forecast to increase sharply from $0.27/kg to $0.28/kg (+3.7%), etc.
o Raw materials: Rubber price will increase by 3.8% (from average $1.58/kg to $1.64/kg); Cotton prices will
rise slightly 0.5% (from $2.04/kg to $2.05/kg), etc.
3. Vietnam economic growth forecast
Along with the trend of global economic growth, Vietnam’s economy in 2019 is forecast to grow at a 0.2% lower than
forecast in 2018 and reach 6.6%. Inflation will maintain at 4% over the same period last year9.
6 Source: World Economic Growth, October 2018, IMF
7 Source: OECD Economic Outlook, Growth has peaked amidst escalating risks, November 21st 2018
8 Source: World Bank East Asia and Pacific Economic Update October 2018
9 Source: World Bank East Asia and Pacific Economic Update October 2018

www.fpts.com.vn Bloomberg – FPTS <GO> | 11
NGUYEN NGOC DUC
Email: [email protected]
Tel: (+84) 24 3773 7070
Ext: 4307
Source: EzSearch
-4%
-48%
-60%
-30%
0%
30%
Movement of Construction Industry index and VNIndex
VNIndex Construction Industry

www.fpts.com.vn Bloomberg – FPTS <GO> | 12
A. CONSTRUCTION INDUSTRY OVERVIEW
1. Construction Industry Value Chain
(1) Input
Construction materials: main input cost, makes up 45% of construction costs, among which steel accounts
for 60 and cement 20%.
Labor: only makes up 15% of total costs but determines construction quality and speed. Construction
industry is labor intensive because all construction processes requires human operation and oversight.
Construction equipment: accounts for 10% of construction costs, determines construction capacity.
Vietnam is unable to manufacture construction equipment and has to import about $835 million of
construction equipment annually, 70% of which comes from Japan, China, and Korea.
(2) Construction process
The constructions process includes foundation, framing, and finishing.
The weights of each steps vary depending on the type of construction product: for example, finishing
accounts for 35 - 55% of residential building costs, but is usually negligible in transportation projects (roads
and bridges)
Contractors typically face capital appropriation from clients: companies typically get paid after
completion, inspection and settlement, which typically lasts 02 – 03 months depending on the building/client.
Specialization in construction increases with project's size: a single contractor rarely has enough human
resource or machinery to finish the entire project. As a result, subcontracting is prevalent in Vietnam, with main
contractors typically provide management function.
Many of the subcontractors are seasonal workers (makes up ~60% of total construction workers). These
seasonal workers are usually untrained and can only work on low value-added jobs.
On the other hand, some subcontractors are highly specialized and typically work on foundation or finishing.
(3) Key players
Construction market in Vietnam is highly fragmented and features intense competition because (1) large
number of companies, (2) low barriers to entry, and (3) similar construction techniques. At the end of 2017, there
are 67,000 construction companies in Vietnam, making up 13% of total companies.
Competition in construction is based on tender price and capabilities of the contractor. These two factors
are determined by (1) financial capacity, (2) construction techniques, and (3) project management capability.
Based on these, foreign contractors have the highest competitive advantage in Vietnam, next comes domestic
private and public contractors, and lastly state contractors.

www.fpts.com.vn Bloomberg – FPTS <GO> | 13
State Domestic private and public Foreign
Foundation
- Licogi Corporation - Fecon Joint Stock Company
(FCN)
- Minh Duc Cement and
Construction Co., Ltd.
- Phan Vu Group
- Bachy Soletanche Vietnam
- Fico-Corea Construction Co., Ltd
Framing
- Vietnam Construction and
Import - Export Joint Stock
Corporation (Vinaconex -
VCG)
- Lilama Corporation (Lilama)
- 319 Corporation
- Cienco 4 Group (C4G)
- Song Da Corporation Joint
Stock Company
- Cofico Company
- Coteccons Construction
Joint Stock Company (CTD)
- Hoa Binh Corporation
(HBC)
- Phuc Hung Holdings
Construction Joint Stock
Company (PHC)
- Delta Corporation
- Obayashi Vietnam
Corporation
- Sumitomo Mitsui
Construction Co., Ltd.
Maeda Vietnam Co., Ltd
Finishing
- REE Corporation (REE)
- Searefico Refrigeration
Industry Corporation (SRF)
- VietREE Corporation
- Hawee Joint Stock Company
- Kurihara Vietnam Co., Ltd
- Taikisha Vietnam
Engineering Inc
Kinden Vietnam Co., Ltd
(4) Output
Construction output value reached 1,089 trillion VND in 2016, approximately 25% of GDP. Per our estimates,
residential construction has the biggest share, next are infrastructure, non-residential and industrial.
Source: GSO
Construction output is tailored to specific location
and specifications from client – which is different
from mass production without a designated
buyer of typical manufacturing industry.
Construction output is very diverse: there is no
universal law to classify construction output. In
this report, we categorize these output by their
intended use: residential, non-residential,
industrial, and infrastructure.
45%
19%
12%
24%
Construction Output Value
Residential Non-residential
Industrial Infrastructure

www.fpts.com.vn Bloomberg – FPTS <GO> | 14
2. Characteristics of Construction industry
(1) Cyclical industry: short cycle, heavily influenced by real estate market
Source: GSO
In the last 30 years, the construction industry completed 6 complete accelerations – deceleration cycles,
each lasting about 04 – 05 years.
The cycle of construction industry in Vietnam is partly influenced by real estate market: the growth rate
bottomed in 1995, 2008, and 2011 – when market froze after real estate bubble burst.
Construction shows a trend of slowing growth in past years, signing that construction industry is getting
out of rapid growth period following “Doi moi” reforms (1986) and entering the Shakeout phase.
(2) Seasonality: construction work typically concentrates in second half of the year
Source: GSO
Construction works are heavily influenced by weather and Vietnamese habits: the third and fourth quarter
are peak time for construction, many projects are started after Vietnamese Tet holiday and to be finished before
the end of the year.
5.5%
24.1%
9.2%
20.6%
7.9%
19.7%
7.9%
13.7%
3.4%
12.1%
-0.4%
11.4%
-0.3%
10.8%
8.7%
8.6%
y = -0.0035x + 0.1568R² = 0.2459
-5%
0%
5%
10%
15%
20%
25%
30%
Construction real growth 1988 - 2018
Construction real growth Linear (Construction real growth)
25.50
36.04
45.41
65.02
28.35
39.27
49.07
72.48
29.72
43.99
52.66
79.26
32.39
47.37
57.51
-
10.0
20.0
30.0
40.0
50.0
60.0
70.0
80.0
90.0
Bil
VN
D
Construction Value-added, 2010 prices
www.fpts.com.vn Bloomberg – FPTS <GO> | 15
3. Construction demand drivers
Demand for construction is fundamentally driven by: (1) demographic factors determining long-term growth
potential, (2) economic growth influencing short-term investment decisions, and (3) legal framework shaping
the competitive environment. In Vietnam, all three of these factors are positive, creating promising long-term
potential for construction.
(1) Demographics: big potential from golden population, urbanization trend, and middle class growth
On the supply side: abundant and low cost labor force
o Vietnam population reached 96 millions in 2017 (ranks 15 globally) and is relatively young (average age
is 31 years old).
o Vietnam is currently enjoying the golden population period (more than 66% of population in working
age). This period is projected to last another 20 years, according to World Bank population estimates.
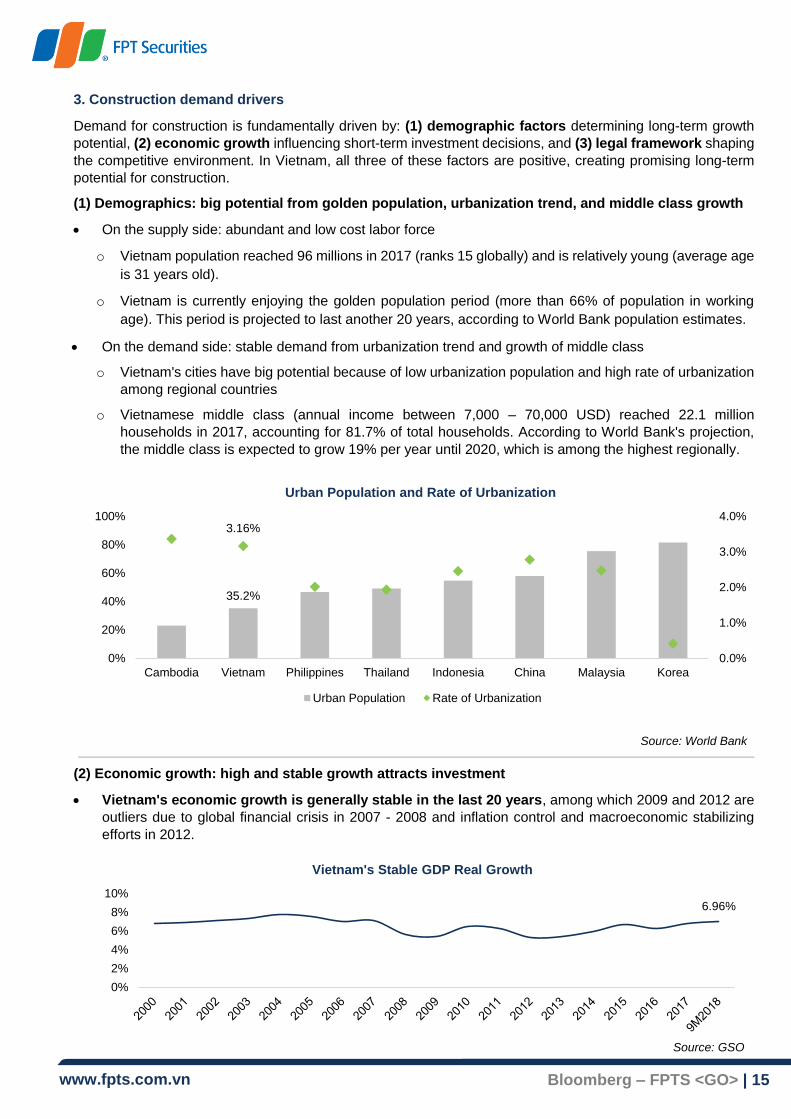
On the demand side: stable demand from urbanization trend and growth of middle class
o Vietnam's cities have big potential because of low urbanization population and high rate of urbanization
among regional countries
o Vietnamese middle class (annual income between 7,000 – 70,000 USD) reached 22.1 million
households in 2017, accounting for 81.7% of total households. According to World Bank's projection,
the middle class is expected to grow 19% per year until 2020, which is among the highest regionally.
Source: World Bank
(2) Economic growth: high and stable growth attracts investment
Vietnam's economic growth is generally stable in the last 20 years, among which 2009 and 2012 are
outliers due to global financial crisis in 2007 - 2008 and inflation control and macroeconomic stabilizing
efforts in 2012.
35.2%
3.16%
0.0%
1.0%
2.0%
3.0%
4.0%
0%
20%
40%
60%
80%
100%
Cambodia Vietnam Philippines Thailand Indonesia China Malaysia Korea
Urban Population and Rate of Urbanization
Urban Population Rate of Urbanization
6.96%
0%
2%
4%
6%
8%
10%
Vietnam's Stable GDP Real Growth
Source: GSO
www.fpts.com.vn Bloomberg – FPTS <GO> | 16
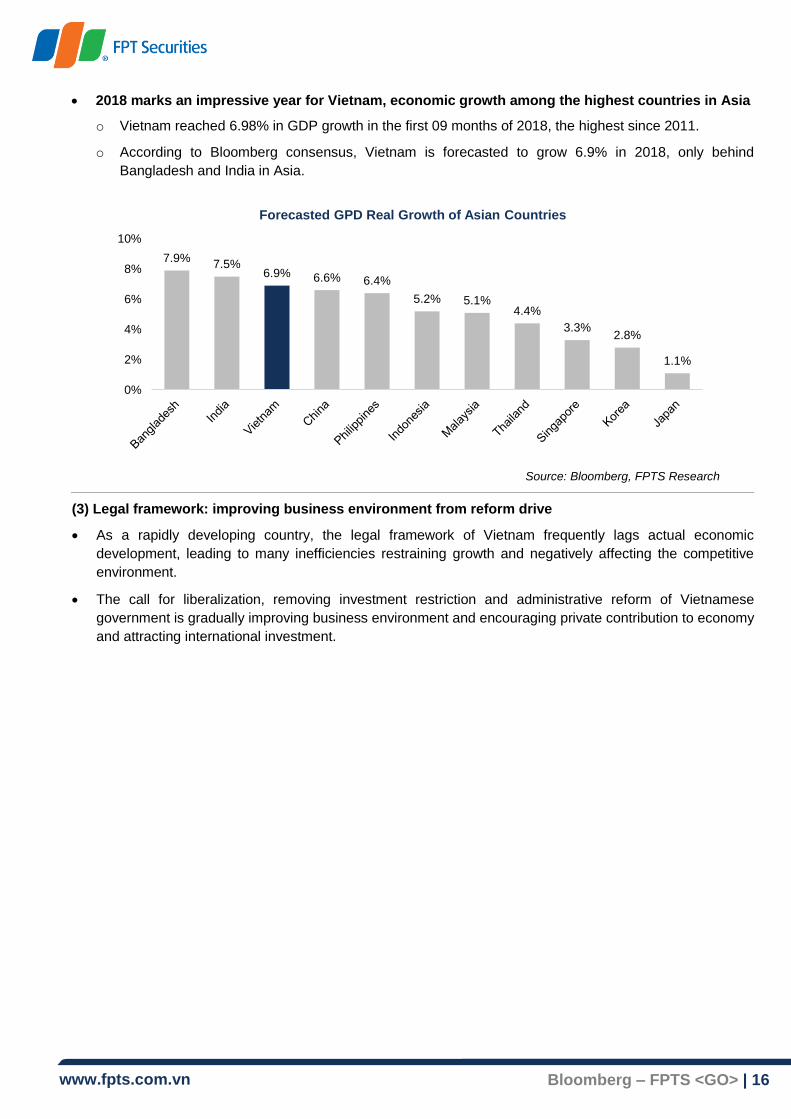
2018 marks an impressive year for Vietnam, economic growth among the highest countries in Asia
o Vietnam reached 6.98% in GDP growth in the first 09 months of 2018, the highest since 2011.
o According to Bloomberg consensus, Vietnam is forecasted to grow 6.9% in 2018, only behind
Bangladesh and India in Asia.
Source: Bloomberg, FPTS Research
(3) Legal framework: improving business environment from reform drive
As a rapidly developing country, the legal framework of Vietnam frequently lags actual economic
development, leading to many inefficiencies restraining growth and negatively affecting the competitive
environment.
The call for liberalization, removing investment restriction and administrative reform of Vietnamese
government is gradually improving business environment and encouraging private contribution to economy
and attracting international investment.
7.9%7.5%
6.9% 6.6% 6.4%
5.2% 5.1%4.4%
3.3%2.8%
1.1%
0%
2%
4%
6%
8%
10%
Forecasted GPD Real Growth of Asian Countries

www.fpts.com.vn Bloomberg – FPTS <GO> | 17
B. CONSTRUCTION IN 2018 AND OUTLOOK 2019
1. Construction growth decelerates in 2018 and 2019
We forecast construction real growth in 2018 will be 8.02%, lower than growth in the first 09 months
(8.62%) mainly due to high growth in 2017Q4. At this growth rate, 2018 will be third year in this deceleration
cycle of construction industry.
In 2019, we expect construction industry will continue its deceleration trend, mainly because residential,
non-residential and infrastructure 2019 outlooks are less promising than 2018. Only industrial construction
enjoys a brighter outlook for 2019, however this is the smallest sectors, only making up 12% output value in
2016. According to BMI forecast, Vietnam construction industry will grow 7.23% in real terms in 2019.
Source: GSO, FPTS, BMI
2. Main input costs: Stable in 2018 and 2019
Main construction input costs generally moved favorably in 2018 and are expected to continue this trend in
2019.
(1) Input costs:
Source: Vietnam Steel Association
-0.3%
3.7%
5.8%
6.9%
10.8%10.0%
8.7%8.0%
7.2%
-2%
0%
2%
4%
6%
8%
10%
12%
2011 2012 2013 2014 2015 2016 2017 2018F 2019F
Forecasted Vietnam Construction Real Growth
4.1%
11.9%9.1%
-8.5%
-18.8%
-10.0%
-25%
-20%
-15%
-10%
-5%
0%
5%
10%
15%
12/2017 03/2018 06/2018 09/2018
Steel and Cement Prices Movement since 12/2017
Steel prices movement Cement prices movement
www.fpts.com.vn Bloomberg – FPTS <GO> | 18
Steel: increased slightly in 2018, decrease in 2019
o In 2014 – 2016, domestic steel price decreased about 30% due to excess supply in China forcing
Chinese steel producers to export below production costs.
o In 2017, domestic steel price increased about 20% due to Vietnam's protective tariffs on Chinese
imported steel.
o In 2018, steel price increased sharply at the beginning of the year and then stabilized around 13,250
VND/kg
o We expect steel price to lower in 2019 due to ~20% increase in domestic supply from major steel
manufacturing projects completion (detail in Steel Industry)
Cement: sharply declined in 2018, decrease in 2019
o Domestic cement price has not increased since 2012 due to difficulties in cement industry: (1) Designed
capacity exceeds domestic demands by ~50% and (2) policy to limit cement export of Vietnamese
government.
o In 2018, cement price has fallen ~10-20% due to diminishing export demand.
o In 2019, we expect cement price to continue the downward trend if Vietnamese government tighten
export restrictions.
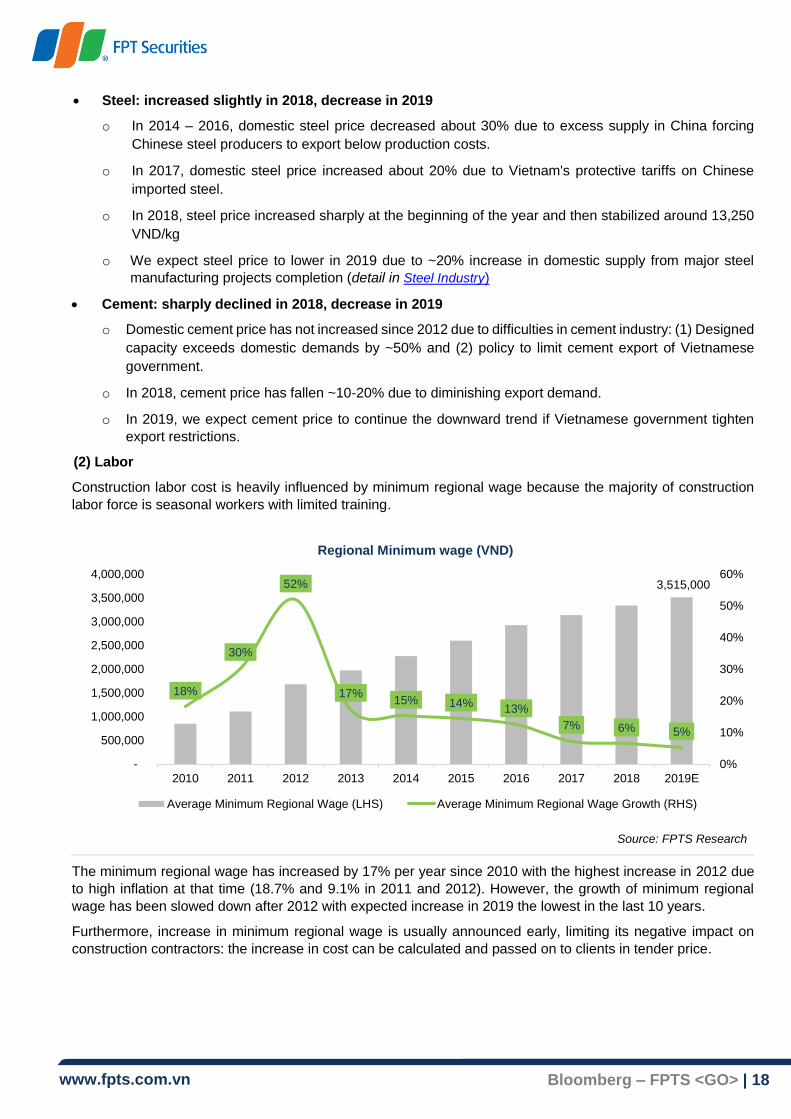
(2) Labor
Construction labor cost is heavily influenced by minimum regional wage because the majority of construction
labor force is seasonal workers with limited training.
Source: FPTS Research
The minimum regional wage has increased by 17% per year since 2010 with the highest increase in 2012 due
to high inflation at that time (18.7% and 9.1% in 2011 and 2012). However, the growth of minimum regional
wage has been slowed down after 2012 with expected increase in 2019 the lowest in the last 10 years.
Furthermore, increase in minimum regional wage is usually announced early, limiting its negative impact on
construction contractors: the increase in cost can be calculated and passed on to clients in tender price.
3,515,000
18%
30%
52%
17%15% 14%
13%
7% 6% 5%
-
500,000
1,000,000
1,500,000
2,000,000
2,500,000
3,000,000
3,500,000
4,000,000
2010 2011 2012 2013 2014 2015 2016 2017 2018 2019E
0%
10%
20%
30%
40%
50%
60%
Regional Minimum wage (VND)
Average Minimum Regional Wage (LHS) Average Minimum Regional Wage Growth (RHS)

www.fpts.com.vn Bloomberg – FPTS <GO> | 19
3. Construction sectors Outlook in 2019
(1) Infrastructure: slows down in 2019 due to structural challenges
Vietnam has high infrastructure investment demands, mainly due to pressure on existing infrastructure from
rapid economic growth and urbanization trend. The Asia Development Bank estimated that Vietnam needs to
spend about 11 – 12% of its GDP on infrastructure per year to maintain current pace of growth.
As one of the main focus of Vietnam economic development model for 2016 – 2020, Vietnam spends about
5.8% of its annual GDP (according to World Bank) on infrastructure. While this level of investment is high
among the region (only lower than China), it is only 50% of Vietnam's investment needs. This is the result of
many structural challenges in Vietnam.
Fiscal budget deficit: continued overspending by Vietnamese government has inflated public debt and
limited the government's ability to invest. The Ministry of Transportation estimated Vietnam needs to invest
1.000.000 billion VND into infrastructure during 2016 – 2020, of which the fiscal budget can only account for
30%.
Official Development Assistance (ODA) drying up: Vietnam becoming a middle-income country has
prompted many countries to tighten their ODA fund. This means future ODA will be harder to obtain and has
higher costs for Vietnam, further limiting the ability to invest of Vietnamese government.
Lack of experience managing large scale infrastructure projects from Vietnamese government: projects
lagging behind schedule and/or running over budget is not a rare occurrence in Vietnam, as evidenced by
major urban transit projects in Hanoi and Ho Chi Minh city.
Facing these challenges, Vietnamese government will have to look for ways to attract private funds to meet
infrastructure investment demands, mainly through (1) Public – Private Partnership (PPP) agreements, (2)
Privatization of State-Owned-Enterprises (SOEs), and (3) Sale of public land. While these channels have shown
some initial success, their effectiveness is marred by underdeveloped legal framework and lack of transparency
of the process.
The problems in infrastructure investment of Vietnam mainly stems from structural challenges and cannot be
solved quickly. Because of this, we expect growth of infrastructure construction to slow down in 2019.
(2) Residential and Non-residential: Real estate regulation efforts slowing down growth in 2019
In the last 10 years, Vietnam real estate market has gone through two property bubbles in 2007 and 2010. The
subsequent bursts had led to bankruptcy of numerous companies, increased non-performing loans in the
banking sectors, and froze real estate market for two to three years.
The acceleration of real estate sector since 2013 and signs of destabilization in the market have prompted
worries of another market bubble in 2018 and 2019, leading to regulation efforts from the government.
Source: GSO
3.80%
1.32%
2.17%
2.80% 2.96%
3.99% 4.07% 4.04%
0%
1%
2%
3%
4%
5%
2011 2012 2013 2014 2015 2016 2017 9M2018
Real Estate Real Growth
www.fpts.com.vn Bloomberg – FPTS <GO> | 20
Tightening real estate credit: The State Bank of Vietnam (SBV) issued Circular No. 06/2016/TT-NHNN in
May 2016 and Circular No. 19/2017/TT-NHNN in December 2017 to curtail credit into real estate.
Specifically, real estate loan risk weights have increased from 150% to 200% (highest among all assets)
and the ratio of short-term capital used for medium and long-term loan decreased from 60% to 45% in 2018
and further to 40% in January 1st 2019.
Stop approving new residential projects in Ho Chi Minh city's Central Business Districts (CBD), which are
District 01 and 03, starting November 2018: according to Ho Chi Minh City Real Estate Association (HoREA),
Ho Chi Minh city real estate market started showing sighs of excess supply in Luxury and High-end sector,
which accounting for 31% of total supply in 9M2018.
These regulation efforts have slowed down the pace of real estate in 2018 and are expected to continue so in
2019. Residential and Non-residential construction growth will similarly be affected in 2019.
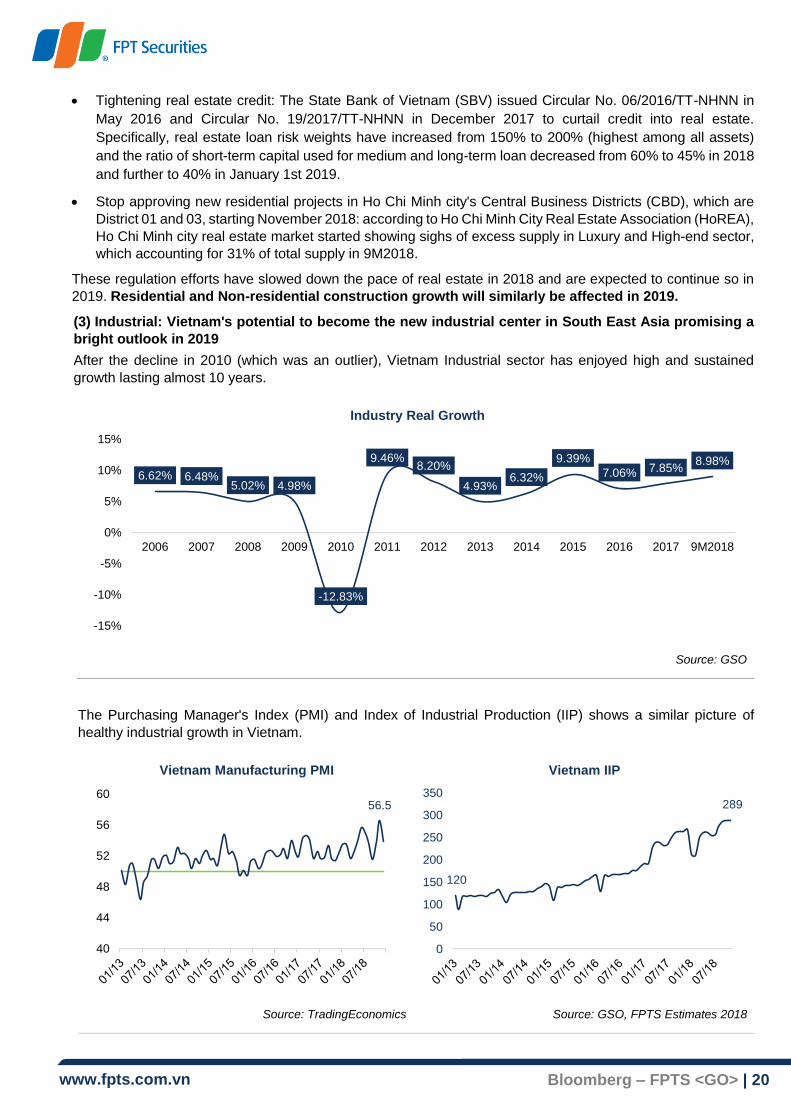
(3) Industrial: Vietnam's potential to become the new industrial center in South East Asia promising a
bright outlook in 2019
After the decline in 2010 (which was an outlier), Vietnam Industrial sector has enjoyed high and sustained
growth lasting almost 10 years.
Source: GSO
The Purchasing Manager's Index (PMI) and Index of Industrial Production (IIP) shows a similar picture of
healthy industrial growth in Vietnam.
Source: TradingEconomics
Source: GSO, FPTS Estimates 2018
6.62% 6.48%5.02% 4.98%
-12.83%
9.46%8.20%
4.93%6.32%
9.39%
7.06% 7.85%8.98%
-15%
-10%
-5%
0%
5%
10%
15%
2006 2007 2008 2009 2010 2011 2012 2013 2014 2015 2016 2017 9M2018
Industry Real Growth
56.5
40
44
48
52
56
60
Vietnam Manufacturing PMI
120
289
0
50
100
150
200
250
300
350
Vietnam IIP

www.fpts.com.vn Bloomberg – FPTS <GO> | 21
The advantages of Vietnam in attracting investment include:
Abundant labor force, competitive cost: this is the essential factor for Vietnam to receive the reallocation
trend of investment from China; mainly because China is no longer the low cost factory of the world and
international trade tensions during 2018 lowers the competitiveness of Chinese exports.
Vietnamese administrative reform drive, policies to attract international investment, and participation in
several Free Trade Agreements (FTA) with major partners such as Japan, China, Europe.
Convenient geological position: near major shipping routes from Indian Ocean to Pacific Ocean (accounts
for 40% of global shipping volume).
With improving attractiveness to international industrial investment, we expect Industrial construction
growth to accelerate in 2019, a silver lining for the Construction Industry in deceleration.
www.fpts.com.vn Bloomberg – FPTS <GO> | 22
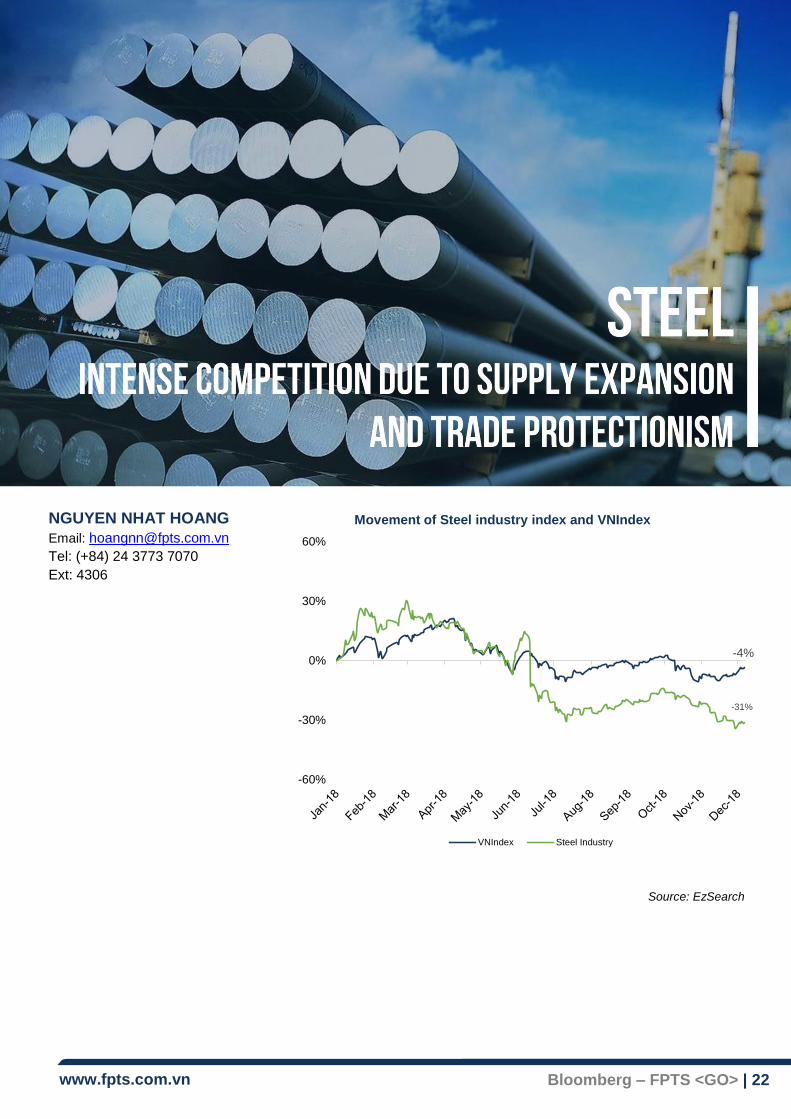
NGUYEN NHAT HOANG
Email: [email protected]
Tel: (+84) 24 3773 7070
Ext: 4306
Source: EzSearch
-4%
-31%
-60%
-30%
0%
30%
60%
Movement of Steel industry index and VNIndex
VNIndex Steel Industry

www.fpts.com.vn Bloomberg – FPTS <GO> | 23
\ \
A. VIETNAM STEEL INDUSTRY OVERVIEW
1. Value chain of Vietnam Steel Industry
Steel production process can be divided into 3 main stages: (1) Cast iron production, (2) Crude steel production,
and (3) Steel processing. In 2018, Vietnam has produced 7 million tons of cast iron, 14 million tons of crude
steel, and 26 million tons of finished steel.
Currently, Vietnam is applying safeguard tariff on billet, long steel, galvanized and color coated steel sheets till
the year 2020.
Source: WSA, VSA, MoIT, FPTS Research
0%
20%
40%
60%
80%
-
5
10
15
20
25
30
mill
ion tons
Steel production of Vietnam
Cast iron Crude steel
Finished steel %crude/finished
0%
5%
10%
15%
20%
25%
Vietnam's tariff on steel products
Billet Long steel Color coated steel
Crude Steel Steel Processing Cast Iron
Iron Ore
Coke
Billet and
bloom
Cast Iron
Scrap steel
Slab Hot rolled coil
(HRC)
Long steel
Steel pipes
Casting & rolling
Blast Oxygen Furnace
(BOF)
Electric Arc Furnace
(EAF)
100% import before Formosa project
Cold rolled coil
(CRC)
Coated steel
Blast Furnace
(BF)
Billet
Converting oxygen

www.fpts.com.vn Bloomberg – FPTS <GO> | 24
2. Characteristics of Vietnam Steel Industry
Mainly usage of EAF, gradually shift to BOF, and have not fully utilized designed capacity
o Cast iron production:
Even it is the most added value process, casting iron is still a underdeveloped stage in Vietnam’s steel value
chain, because of (1) high initial capital requirement, (2) shortage of high quality domestic iron ore and coke.
Recently, several enterprises have started to boost investment in cast iron processing with big projects such
as Formosa in Ha Tinh or Hoa Phat in Dung Quat.
o Crude steel production:
Nowadays, there are 02 distinct processes in steel production used in Vietnam, which are (1) Blast oxygen
furnace (BOF), and (2) Electric arc furnace (EAF). Below are features of each process:
Blast oxygen furnace - BOF Electric arc furnace - EAF
Raw material consumption
(per 01 ton of finished steel)
- Iron ore: 1.4 tons (29% cost of production)
- Coke: 0.45 tons (25% cost of production)
- Scrap steel: 1 ton (55% cost of production)
- Electricity: 400 - 600 kwH (26% cost of
production)
Initial capital requirement Higher Lower
Cost of production Lower Higher
Features
- Require continuous operation, not as
flexible as EAF, due to high cost of restarting.
- Able to expand or increase capacity by
adding BF and BOF
- Able to flexibly switch crude steel sources
(import or self-manufactured)
- Hard to integrate or expand with BF and
EAF
Suitability Large scale enterprises Small and medium scale enterprises
Source: SEAISI, FPTS Research
Before 2015, Vietnam mainly used EAF to produce crude steel (accounting for 60 - 80% of produced crude
steel). However, the appearances of large-scale iron and steel integration such as Hai Duong (Hoa Phat) or
Vung Ang (Formosa), has strongly surged the trend of shifting to BF. It is estimated that, in 2018, there will be
about 7.5 million tons of billets produced from BOF process, equivalent to about 53% of total crude steel
production.
Products Capacity
(mil tons/year)
Production 2018 (est)
Utilization rate
Cast iron 9.6 7.0 73.2%
Crude steel
180 14.0 77.7%
Finished steel
40.0 26.2 65.4%
o Steel processing:
The current capacity has not been fully utilized, the utilization rate of 2018 is estimated at 65%, lower than the
world average of 78% (WSA). According to VSA statistics, modern steel rolling technology accounts for ~30%
of production (capacity of 250,000 - 500,000 tons/year), capable to roll continuously; moderate technology
accounts for ~40%, able to roll semi-continuously (capacity of 150,000 - 300,000 tons/year), the rest is outdated
technology of small mills with capacity of under 20,000 tons/year, outdated equipment, product quality is not
guaranteed.
19
-
5
10
15
20
mill
ion tons
Billet production by technology
BF EAF Other Designed capacitySource: WSA, VSA, FPTS Research

www.fpts.com.vn Bloomberg – FPTS <GO> | 25
Production depends strongly on imports, mainly from China
Source: VSA, GSO, FPTS Research
Currently, Vietnam's steel production still relies heavily on imports, and mainly from China. The main import
product of Vietnam is hot rolled coil (HRC) - main material for flat steel production - as domestic market has not
been able to produce HRC yet. However, after 2017, HRC import demand is expected to decrease, as the
Formosa Ha Tinh project will come into operation and be able to supply this product.
Flat steels segment grows sharply while long steels grow steadily
Vietnam steels products can be divided into 2 categories, which are:
1) Long steels: rebar steel, shaped steel; mainly used to form construction structures, due to their abilities to
bear pressure and other physical characteristics.
2) Flat steels: steel pipes, coated steel sheets, cold rolled coil (CRC) and hot rolled coil (HRC); used in
finishing phase of construction works (rooftop, handrail, shutters, etc.) due to anti-corrosion features.
Source: VSA, FPTS Research
In 2018, it is estimated that Vietnam produced about 26 million tons of finished steel products, including 58% of
flat steels and 42% of long steels. In the recent 2 - 3 years, flat steels segment has been growing sharply,
especially galvanized steel, steel pipes and HRC.
The steel produced is largely served for domestic demand (~80% of production output). The main export steel
products of Vietnam are flat steels, especially galvanized steels (exporting ~50% of production output) mostly
to Southeast Asian countries such as Cambodia, Indonesia or Malaysia.
56%
38%
65% 66%62%
0%
20%
40%
60%
80%
-
2
4
6
8
10
12
14
2013 2014 2015 2016 2017
mill
ion ton
Steel imported of Vietnam
Import HRC %HRC/total import
-20%
0%
20%
40%
60%
80%
-
5
10
15
20
25
30
mill
ion
to
ns
Steel production structure (2007-2018E)
Long steel Flat steel
% yoy long steel % yoy flat steel
93%
87%
68%
71%
-
2
4
6
8
10
2014 2017 2014 2017
Long steel Flat steel
mill
ion
to
n
Steel consumption by market
Export
Domestic
0%
20%
40%
60%
80%
100%
-
5
10
15
20
25
2011 2012 2013 2014 2015 2016 2017
mill
ion ton
Steel production and import of Vietnam
Production Import
%Im./Prod. % Imp. from China/Total imp.

www.fpts.com.vn Bloomberg – FPTS <GO> | 26
3. Key players
List of some large-scale steel enterprises with completed value chain:
Company Ticker Capacity
(mil ton/year) Products Process
Formosa Ha Tinh Unlisted 7,5 HRC, billet, construction steel BF
Hoa Phat Group HPG 3,0 Construction steel, steel pipe BF
Hoa Sen Group HSG 2,8 Coated steel, steel pipe, plastic pipe
Pomina POM 1,5 Construction steel, billet EAF
PoscoSS Unlisted 1,0 Construction steel, CRC EAF
TISCO TIS 1,0 Construction steel, steel pipe BF
Source: FPTS Research
Based on production capacity, Formosa is the largest (7.5 mil ton/year) and the only mill which can produce hot
rolled coil (HRC) in Vietnam. The scale is followed by Hoa Phat Group (3 mil ton/year) and Hoa Sen Group (2.8
mil ton/year). These enterprises are still expanding their capacity and investment in new projects, which will
increase the overall industry capacity in the coming period.
Source: VSA, FPTS Research
Based on 9M2018 market share, HPG is leading in construction steel (23%) and steel pipes (17%). Meanwhile,
HSG is leading in galvanized steel sheets segment (34%) and ranks the 2nd in steel pipes segment (18%).
Besides, there are smaller scale enterprises which participate partially in the value chain, like: billet processing,
casting and rolling steel or commercial activities.
Company Ticker Products
Viet Trung Minerals & Metallurgy Company Limited Unlisted Billet
Tungho Steel Co., Ltd. Unlisted Billet
Viet My Steel JSC Unlisted Billet, long steel
Viet Y Steel JSC VIS Billet, long steel
Thai Trung Steel Rolling JSC TTS Long steel
SMC Steel Trading Investment JSC SMC Trading
Thai Hung Trading JSC Unlisted Trading
Tien Len Steel Group JSC TLH Trading
Thien Nam Import and Export JSC TNA Trading
Source: FPTS Research
HPG23%
PoscoSS10%
POM10%Vinakyoei
8%TIS8%
Formosa5%
Other36%
Construction steel market share (3Q2018)
HPG27%
HSG18%
Minh Ngọc8%
TVP8%
VGS7%
NKG7%
Other25%
Steel pipes market share(3Q2018)
HSG34%
NKG16%
Tôn Đông Á16%
Tôn Phương
Nam6%
CSVC7%
TVP4%
Other17%
Galvanized steel market share(3Q2018)
www.fpts.com.vn Bloomberg – FPTS <GO> | 27
B. REVIEW 2018
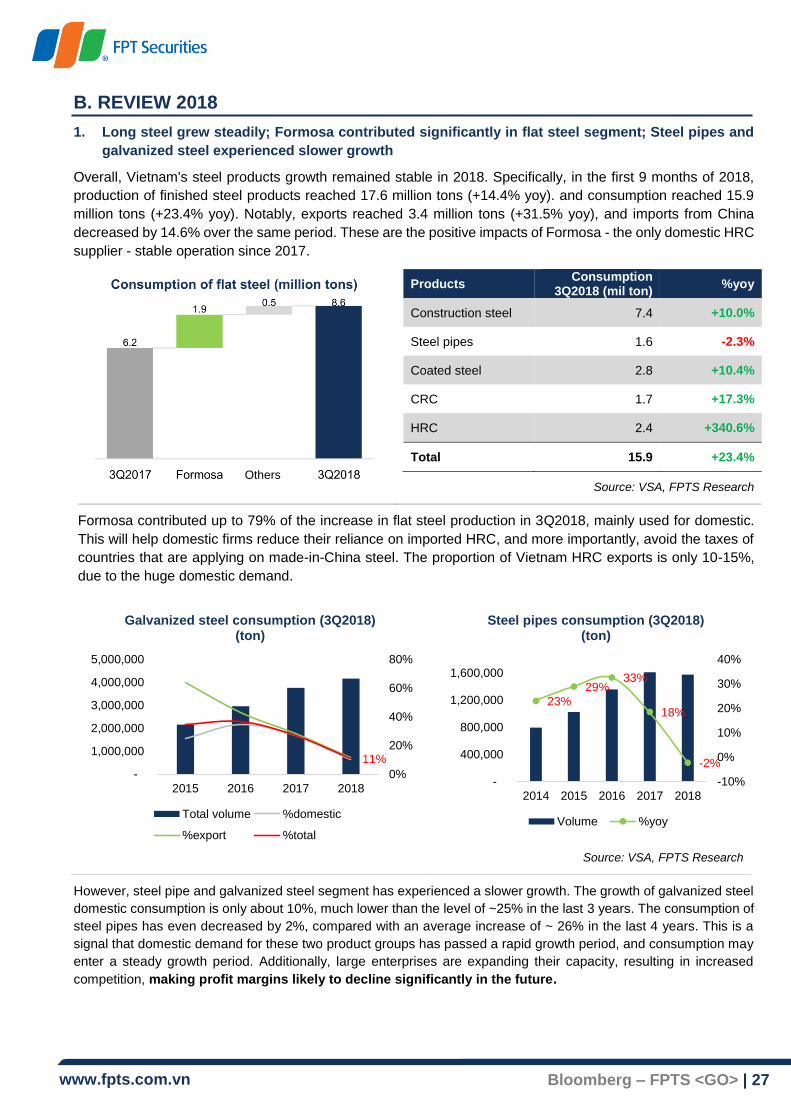
1. Long steel grew steadily; Formosa contributed significantly in flat steel segment; Steel pipes and
galvanized steel experienced slower growth
Overall, Vietnam's steel products growth remained stable in 2018. Specifically, in the first 9 months of 2018,
production of finished steel products reached 17.6 million tons (+14.4% yoy). and consumption reached 15.9
million tons (+23.4% yoy). Notably, exports reached 3.4 million tons (+31.5% yoy), and imports from China
decreased by 14.6% over the same period. These are the positive impacts of Formosa - the only domestic HRC
supplier - stable operation since 2017.
Products
Consumption 3Q2018 (mil ton)
%yoy
Construction steel 7.4 +10.0%
Steel pipes 1.6 -2.3%
Coated steel 2.8 +10.4%
CRC 1.7 +17.3%
HRC 2.4 +340.6%
Total 15.9 +23.4%
Source: VSA, FPTS Research
Formosa contributed up to 79% of the increase in flat steel production in 3Q2018, mainly used for domestic.
This will help domestic firms reduce their reliance on imported HRC, and more importantly, avoid the taxes of
countries that are applying on made-in-China steel. The proportion of Vietnam HRC exports is only 10-15%,
due to the huge domestic demand.
Source: VSA, FPTS Research
However, steel pipe and galvanized steel segment has experienced a slower growth. The growth of galvanized steel
domestic consumption is only about 10%, much lower than the level of ~25% in the last 3 years. The consumption of
steel pipes has even decreased by 2%, compared with an average increase of ~ 26% in the last 4 years. This is a
signal that domestic demand for these two product groups has passed a rapid growth period, and consumption may
enter a steady growth period. Additionally, large enterprises are expanding their capacity, resulting in increased
competition, making profit margins likely to decline significantly in the future.
11%
0%
20%
40%
60%
80%
-
1,000,000
2,000,000
3,000,000
4,000,000
5,000,000
2015 2016 2017 2018
Galvanized steel consumption (3Q2018) (ton)
Total volume %domestic
%export %total
23%
29%33%
18%
-2%
-10%
0%
10%
20%
30%
40%
-
400,000
800,000
1,200,000
1,600,000
2014 2015 2016 2017 2018
Steel pipes consumption (3Q2018) (ton)
Volume %yoy
Others
www.fpts.com.vn Bloomberg – FPTS <GO> | 28
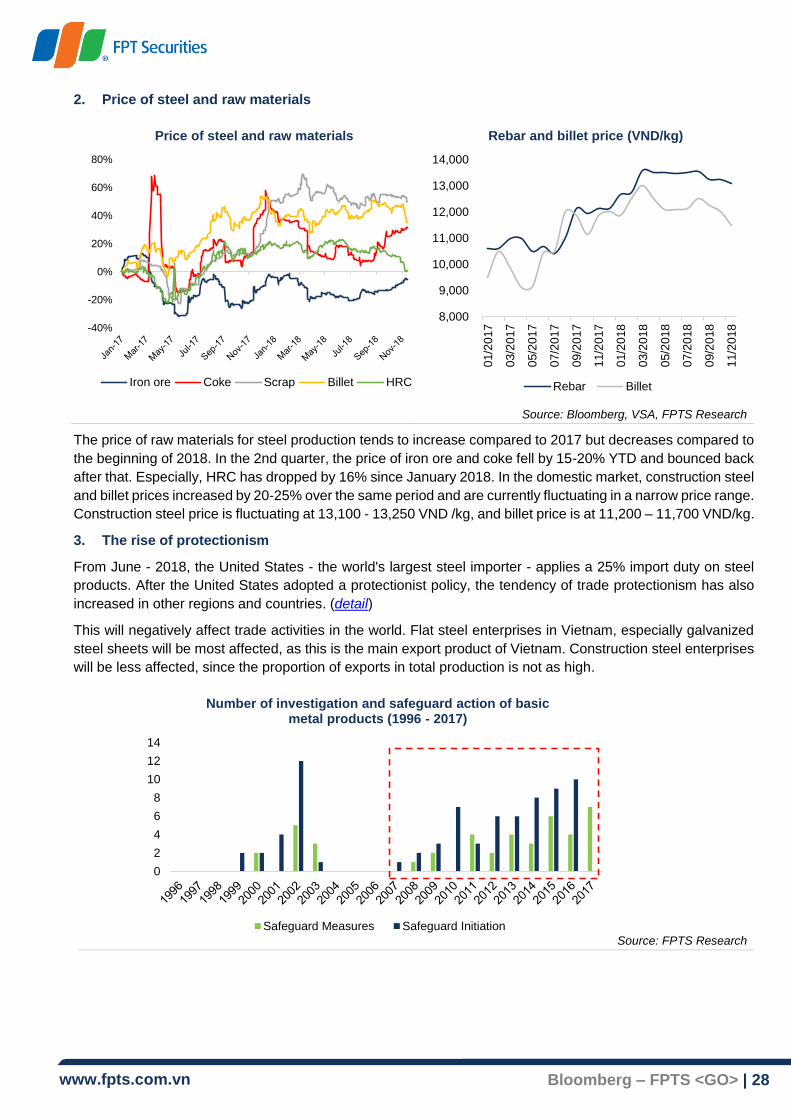
2. Price of steel and raw materials
Source: Bloomberg, VSA, FPTS Research
The price of raw materials for steel production tends to increase compared to 2017 but decreases compared to
the beginning of 2018. In the 2nd quarter, the price of iron ore and coke fell by 15-20% YTD and bounced back
after that. Especially, HRC has dropped by 16% since January 2018. In the domestic market, construction steel
and billet prices increased by 20-25% over the same period and are currently fluctuating in a narrow price range.
Construction steel price is fluctuating at 13,100 - 13,250 VND /kg, and billet price is at 11,200 – 11,700 VND/kg.
3. The rise of protectionism
From June - 2018, the United States - the world's largest steel importer - applies a 25% import duty on steel
products. After the United States adopted a protectionist policy, the tendency of trade protectionism has also
increased in other regions and countries. (detail)
This will negatively affect trade activities in the world. Flat steel enterprises in Vietnam, especially galvanized
steel sheets will be most affected, as this is the main export product of Vietnam. Construction steel enterprises
will be less affected, since the proportion of exports in total production is not as high.
Source: FPTS Research
-40%
-20%
0%
20%
40%
60%
80%
Price of steel and raw materials
Iron ore Coke Scrap Billet HRC
8,000
9,000
10,000
11,000
12,000
13,000
14,000
01/2
017
03/2
017
05/2
017
07/2
017
09/2
017
11/2
017
01/2
018
03/2
018
05/2
018
07/2
018
09/2
018
11/2
018
Rebar and billet price (VND/kg)
Rebar Billet
0
2
4
6
8
10
12
14
Number of investigation and safeguard action of basic metal products (1996 - 2017)
Safeguard Measures Safeguard Initiation
www.fpts.com.vn Bloomberg – FPTS <GO> | 29
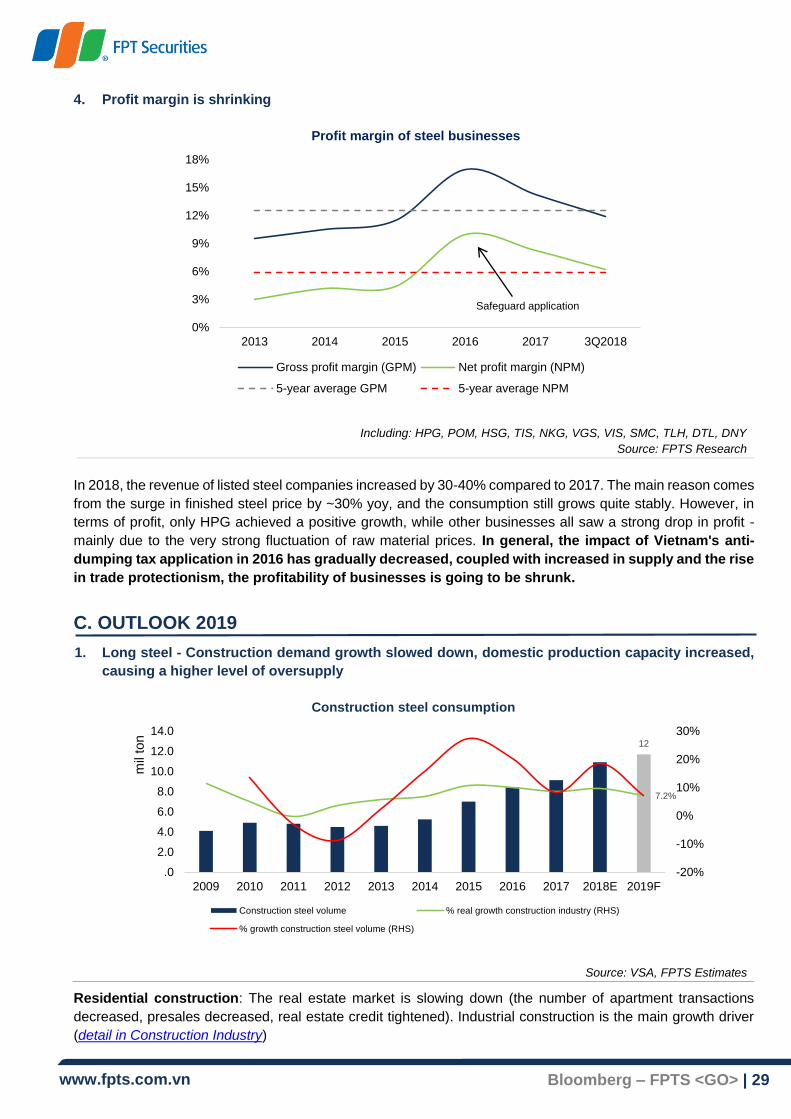
4. Profit margin is shrinking
Including: HPG, POM, HSG, TIS, NKG, VGS, VIS, SMC, TLH, DTL, DNY
Source: FPTS Research
In 2018, the revenue of listed steel companies increased by 30-40% compared to 2017. The main reason comes
from the surge in finished steel price by ~30% yoy, and the consumption still grows quite stably. However, in
terms of profit, only HPG achieved a positive growth, while other businesses all saw a strong drop in profit -
mainly due to the very strong fluctuation of raw material prices. In general, the impact of Vietnam's anti-
dumping tax application in 2016 has gradually decreased, coupled with increased in supply and the rise
in trade protectionism, the profitability of businesses is going to be shrunk.
C. OUTLOOK 2019
1. Long steel - Construction demand growth slowed down, domestic production capacity increased,
causing a higher level of oversupply
Source: VSA, FPTS Estimates
Residential construction: The real estate market is slowing down (the number of apartment transactions
decreased, presales decreased, real estate credit tightened). Industrial construction is the main growth driver
(detail in Construction Industry)
0%
3%
6%
9%
12%
15%
18%
2013 2014 2015 2016 2017 3Q2018
Profit margin of steel businesses
Gross profit margin (GPM) Net profit margin (NPM)
5-year average GPM 5-year average NPM
Safeguard application
12
7.2%
-20%
-10%
0%
10%
20%
30%
.0
2.0
4.0
6.0
8.0
10.0
12.0
14.0
2009 2010 2011 2012 2013 2014 2015 2016 2017 2018E 2019F
mil
ton
Construction steel consumption
Construction steel volume % real growth construction industry (RHS)
% growth construction steel volume (RHS)
www.fpts.com.vn Bloomberg – FPTS <GO> | 30
Accordingly, the estimated demand for construction steel in 2019 will rise by about 7.2%. With the contribution
of Dung Quat Phase 1 - capacity of 2 million tons/year (~20% of construction steel consumption in 2018), the
total designed capacity will be about 17 - 18 million tons/year, the utilization rate is estimated at about 66%. We
believe that construction steel segment will have a steady growth in 2019 but will slow down compared
to 2018 and the competition level will become more intense.
2. Flat steel
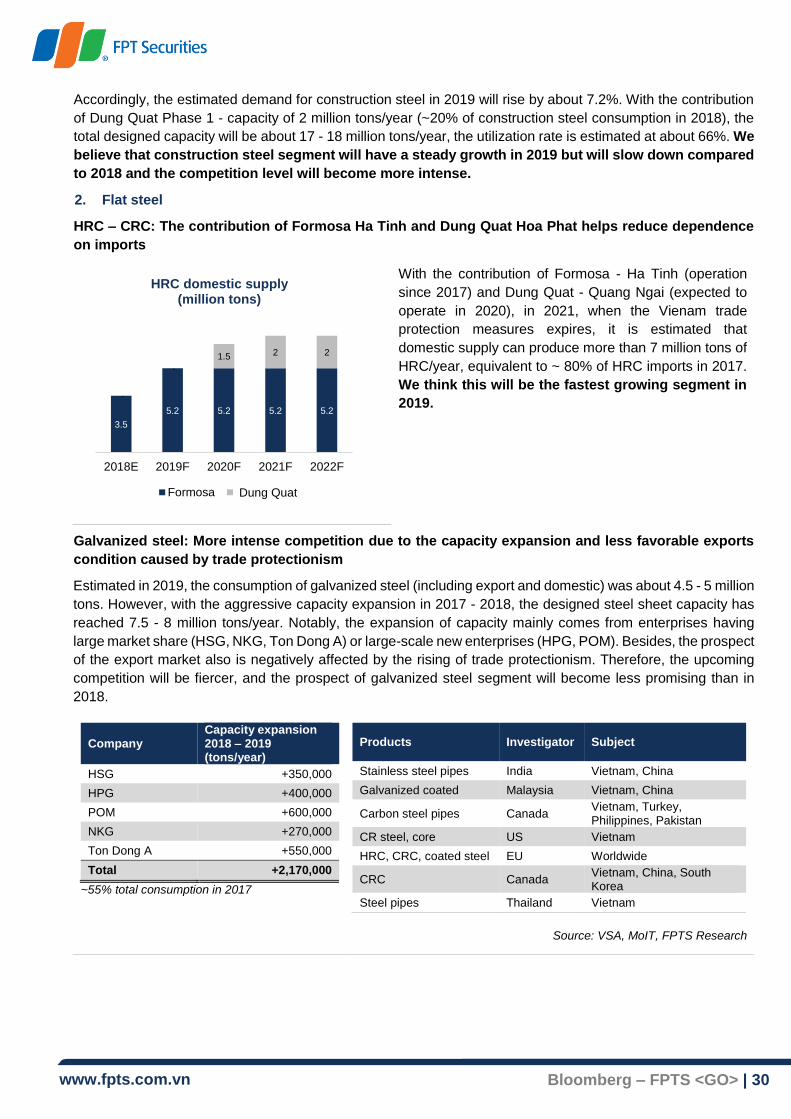
HRC – CRC: The contribution of Formosa Ha Tinh and Dung Quat Hoa Phat helps reduce dependence
on imports
With the contribution of Formosa - Ha Tinh (operation
since 2017) and Dung Quat - Quang Ngai (expected to
operate in 2020), in 2021, when the Vienam trade
protection measures expires, it is estimated that
domestic supply can produce more than 7 million tons of
HRC/year, equivalent to ~ 80% of HRC imports in 2017.
We think this will be the fastest growing segment in
2019.
Galvanized steel: More intense competition due to the capacity expansion and less favorable exports
condition caused by trade protectionism
Estimated in 2019, the consumption of galvanized steel (including export and domestic) was about 4.5 - 5 million
tons. However, with the aggressive capacity expansion in 2017 - 2018, the designed steel sheet capacity has
reached 7.5 - 8 million tons/year. Notably, the expansion of capacity mainly comes from enterprises having
large market share (HSG, NKG, Ton Dong A) or large-scale new enterprises (HPG, POM). Besides, the prospect
of the export market also is negatively affected by the rising of trade protectionism. Therefore, the upcoming
competition will be fiercer, and the prospect of galvanized steel segment will become less promising than in
2018.
Company Capacity expansion 2018 – 2019 (tons/year)
HSG +350,000
HPG +400,000
POM +600,000
NKG +270,000
Ton Dong A +550,000
Total +2,170,000
~55% total consumption in 2017
Source: VSA, MoIT, FPTS Research
Products Investigator Subject
Stainless steel pipes India Vietnam, China
Galvanized coated Malaysia Vietnam, China
Carbon steel pipes Canada Vietnam, Turkey, Philippines, Pakistan
CR steel, core US Vietnam
HRC, CRC, coated steel EU Worldwide
CRC Canada Vietnam, China, South Korea
Steel pipes Thailand Vietnam
3.5
5.2 5.2 5.2 5.2
-
-
1.5 2 2
2018E 2019F 2020F 2021F 2022F
HRC domestic supply (million tons)
Formosa Dung QuấtDung Quat
www.fpts.com.vn Bloomberg – FPTS <GO> | 31
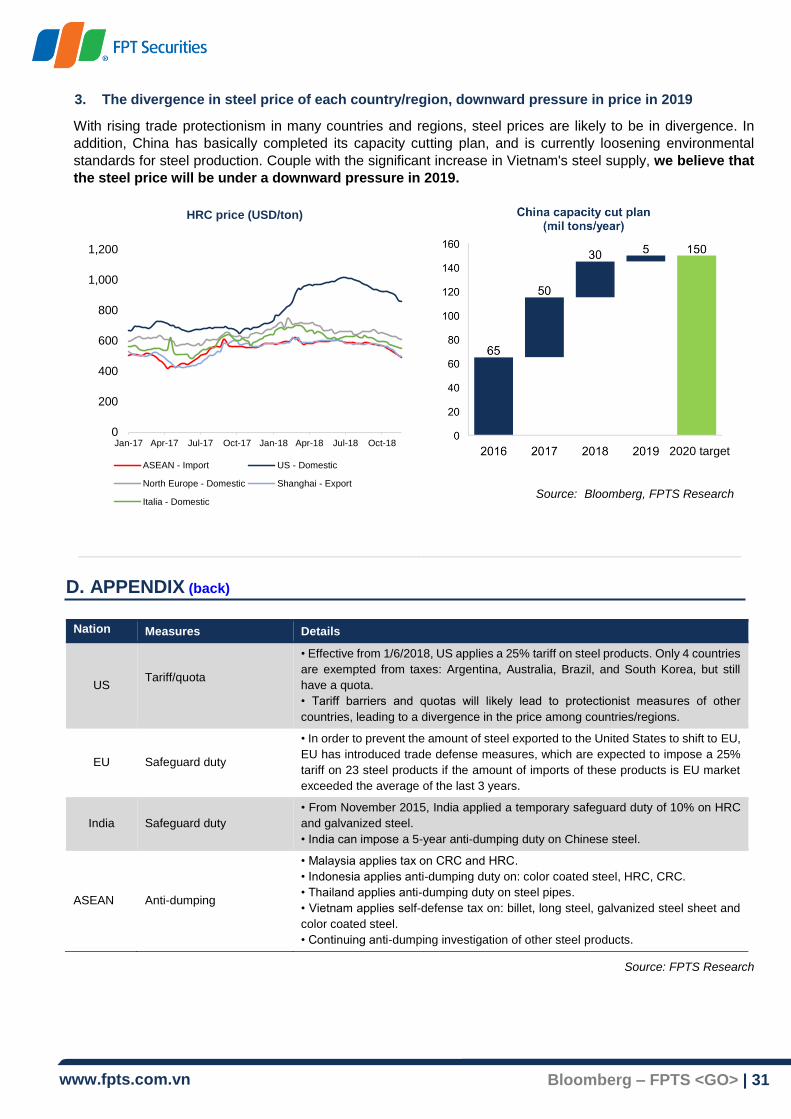
3. The divergence in steel price of each country/region, downward pressure in price in 2019
With rising trade protectionism in many countries and regions, steel prices are likely to be in divergence. In
addition, China has basically completed its capacity cutting plan, and is currently loosening environmental
standards for steel production. Couple with the significant increase in Vietnam's steel supply, we believe that
the steel price will be under a downward pressure in 2019.
Source: Bloomberg, FPTS Research
D. APPENDIX (back)
Nation Measures Details
US Tariff/quota
• Effective from 1/6/2018, US applies a 25% tariff on steel products. Only 4 countries
are exempted from taxes: Argentina, Australia, Brazil, and South Korea, but still
have a quota.
• Tariff barriers and quotas will likely lead to protectionist measures of other
countries, leading to a divergence in the price among countries/regions.
EU Safeguard duty
• In order to prevent the amount of steel exported to the United States to shift to EU,
EU has introduced trade defense measures, which are expected to impose a 25%
tariff on 23 steel products if the amount of imports of these products is EU market
exceeded the average of the last 3 years.
India Safeguard duty
• From November 2015, India applied a temporary safeguard duty of 10% on HRC
and galvanized steel.
• India can impose a 5-year anti-dumping duty on Chinese steel.
ASEAN Anti-dumping
• Malaysia applies tax on CRC and HRC.
• Indonesia applies anti-dumping duty on: color coated steel, HRC, CRC.
• Thailand applies anti-dumping duty on steel pipes.
• Vietnam applies self-defense tax on: billet, long steel, galvanized steel sheet and
color coated steel.
• Continuing anti-dumping investigation of other steel products.
Source: FPTS Research
0
200
400
600
800
1,000
1,200
Jan-17 Apr-17 Jul-17 Oct-17 Jan-18 Apr-18 Jul-18 Oct-18
HRC price (USD/ton)
ASEAN - Import US - Domestic
North Europe - Domestic Shanghai - Export
Italia - Domestic
2020 target
www.fpts.com.vn Bloomberg – FPTS <GO> | 32
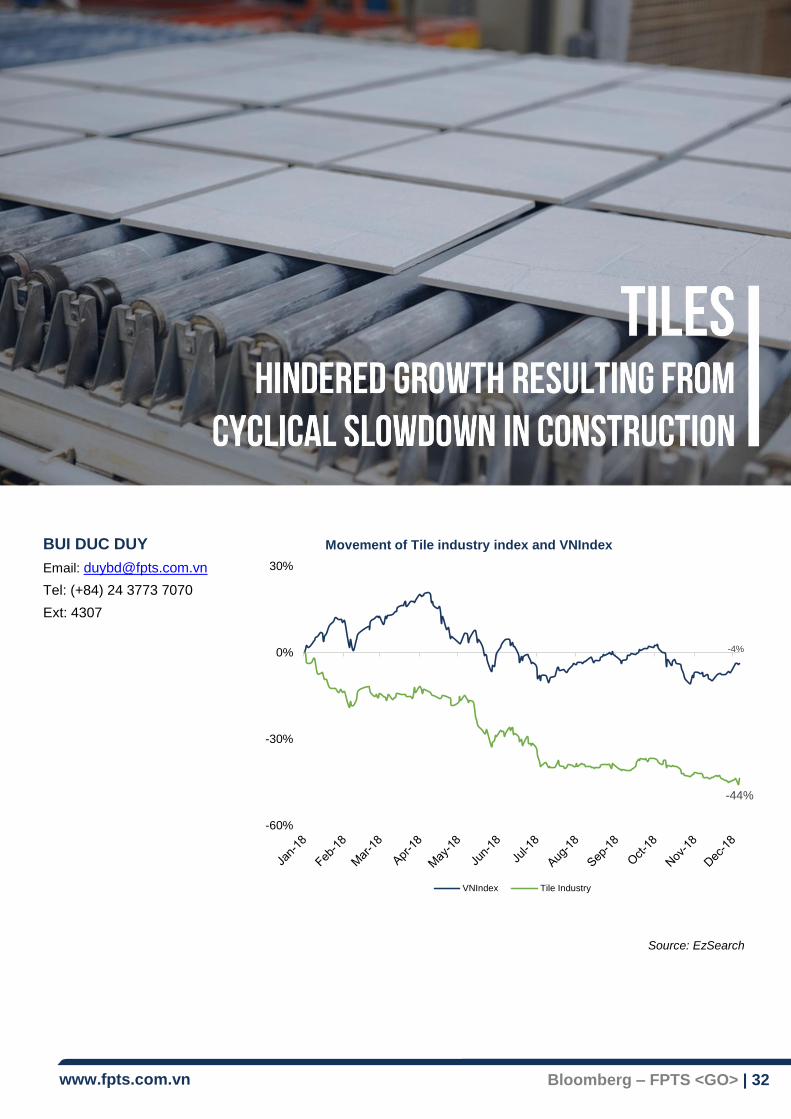
BUI DUC DUY
Email: [email protected]
Tel: (+84) 24 3773 7070
Ext: 4307
Source: EzSearch
-4%
-44%
-60%
-30%
0%
30%
Movement of Tile industry index and VNIndex
VNIndex Tile Industry
www.fpts.com.vn Bloomberg – FPTS <GO> | 33
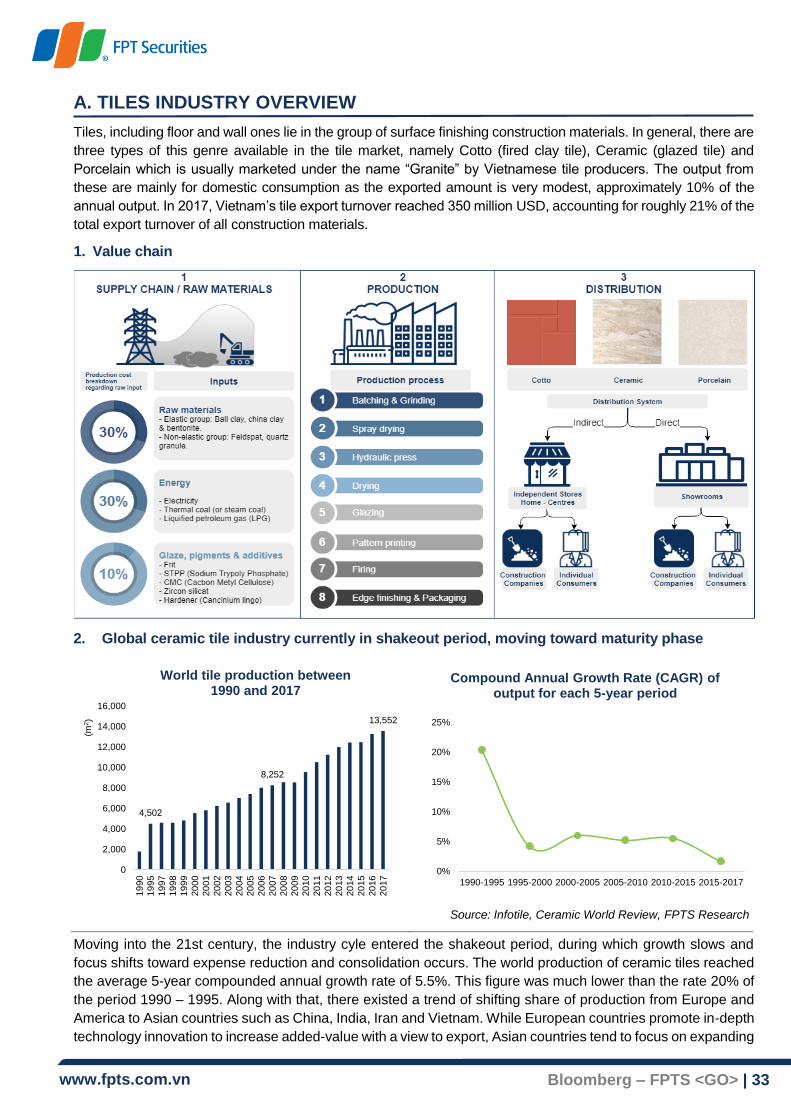
A. TILES INDUSTRY OVERVIEW
Tiles, including floor and wall ones lie in the group of surface finishing construction materials. In general, there are
three types of this genre available in the tile market, namely Cotto (fired clay tile), Ceramic (glazed tile) and
Porcelain which is usually marketed under the name “Granite” by Vietnamese tile producers. The output from
these are mainly for domestic consumption as the exported amount is very modest, approximately 10% of the
annual output. In 2017, Vietnam’s tile export turnover reached 350 million USD, accounting for roughly 21% of the
total export turnover of all construction materials.
1. Value chain
2. Global ceramic tile industry currently in shakeout period, moving toward maturity phase
Source: Infotile, Ceramic World Review, FPTS Research
Moving into the 21st century, the industry cyle entered the shakeout period, during which growth slows and
focus shifts toward expense reduction and consolidation occurs. The world production of ceramic tiles reached
the average 5-year compounded annual growth rate of 5.5%. This figure was much lower than the rate 20% of
the period 1990 – 1995. Along with that, there existed a trend of shifting share of production from Europe and
America to Asian countries such as China, India, Iran and Vietnam. While European countries promote in-depth
technology innovation to increase added-value with a view to export, Asian countries tend to focus on expanding
4,502
8,252
13,552
0
2,000
4,000
6,000
8,000
10,000
12,000
14,000
16,000
19
90
19
95
19
97
19
98
19
99
20
00
20
01
20
02
20
03
20
04
20
05
20
06
20
07
20
08
20
09
20
10
20
11
20
12
20
13
20
14
20
15
20
16
20
17
(m2)
World tile production between 1990 and 2017
0%
5%
10%
15%
20%
25%
1990-1995 1995-2000 2000-2005 2005-2010 2010-2015 2015-2017
Compound Annual Growth Rate (CAGR) of output for each 5-year period
www.fpts.com.vn Bloomberg – FPTS <GO> | 34
capacity and use technology lagging from 2 to 3 years behind Europe. Based on the fact that construction
activity in Asia slowed after the boom period and the diversity of substitute materials, it is forecasted
that world production and consumption of tiles will rise slightly by 3% in the upcoming time.
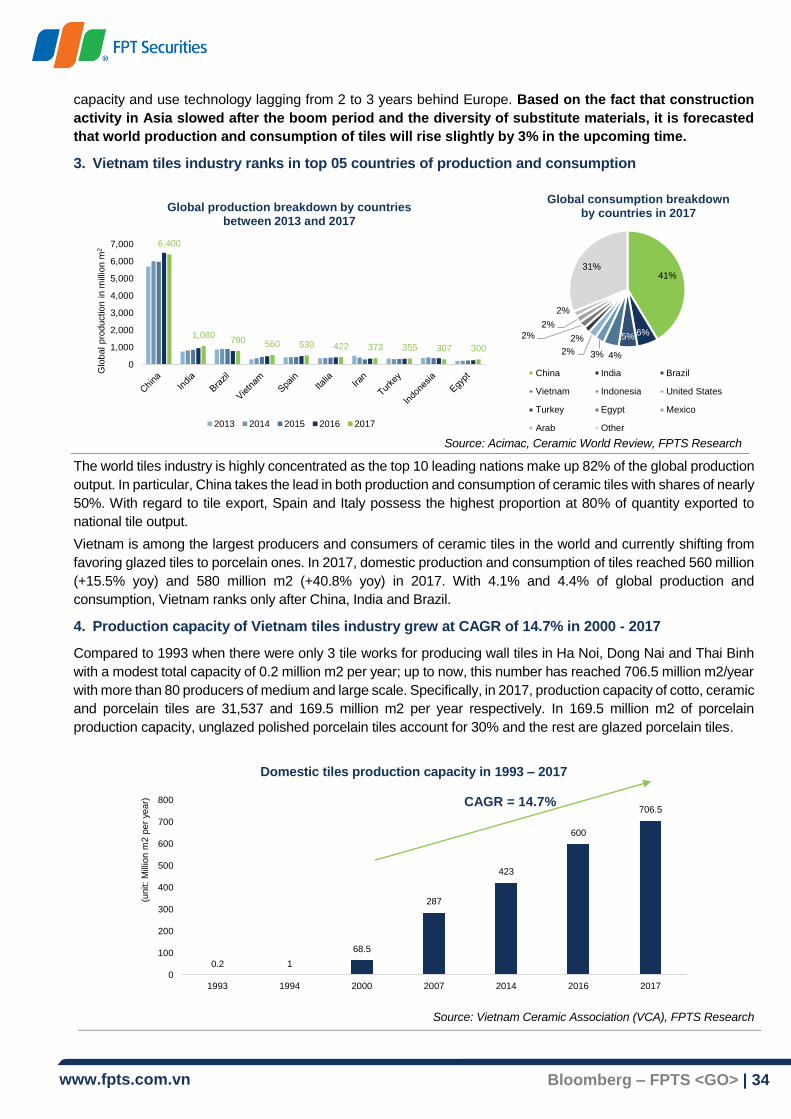
3. Vietnam tiles industry ranks in top 05 countries of production and consumption
The world tiles industry is highly concentrated as the top 10 leading nations make up 82% of the global production
output. In particular, China takes the lead in both production and consumption of ceramic tiles with shares of nearly
50%. With regard to tile export, Spain and Italy possess the highest proportion at 80% of quantity exported to
national tile output.
Vietnam is among the largest producers and consumers of ceramic tiles in the world and currently shifting from
favoring glazed tiles to porcelain ones. In 2017, domestic production and consumption of tiles reached 560 million
(+15.5% yoy) and 580 million m2 (+40.8% yoy) in 2017. With 4.1% and 4.4% of global production and
consumption, Vietnam ranks only after China, India and Brazil.
4. Production capacity of Vietnam tiles industry grew at CAGR of 14.7% in 2000 - 2017
Compared to 1993 when there were only 3 tile works for producing wall tiles in Ha Noi, Dong Nai and Thai Binh
with a modest total capacity of 0.2 million m2 per year; up to now, this number has reached 706.5 million m2/year
with more than 80 producers of medium and large scale. Specifically, in 2017, production capacity of cotto, ceramic
and porcelain tiles are 31,537 and 169.5 million m2 per year respectively. In 169.5 million m2 of porcelain
production capacity, unglazed polished porcelain tiles account for 30% and the rest are glazed porcelain tiles.
Domestic tiles production capacity in 1993 – 2017
Source: Vietnam Ceramic Association (VCA), FPTS Research
6,400
1,080790 560 530 422 373 355 307 300
0
1,000
2,000
3,000
4,000
5,000
6,000
7,000
Glo
bal pro
duction i
n m
illio
n m
2
Global production breakdown by countries between 2013 and 2017
2013 2014 2015 2016 2017
41%
6%5%
4%3%2%
2%2%
2%
2%
31%
Global consumption breakdown by countries in 2017
China India Brazil
Vietnam Indonesia United States
Turkey Egypt Mexico
Arab Other
0.2 1
68.5
287
423
600
706.5
0
100
200
300
400
500
600
700
800
1993 1994 2000 2007 2014 2016 2017
(unit:
Mill
ion m
2 p
er
year) CAGR = 14.7%
Source: Acimac, Ceramic World Review, FPTS Research
www.fpts.com.vn Bloomberg – FPTS <GO> | 35
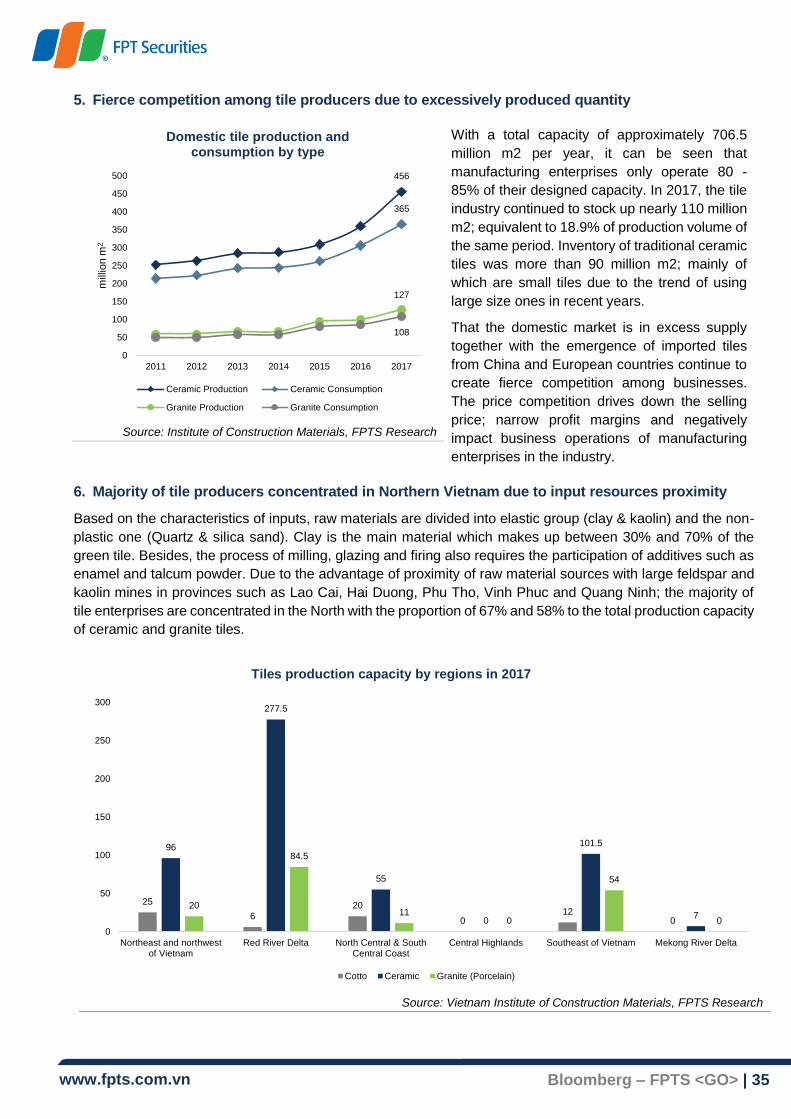
5. Fierce competition among tile producers due to excessively produced quantity
Source: Institute of Construction Materials, FPTS Research
With a total capacity of approximately 706.5
million m2 per year, it can be seen that
manufacturing enterprises only operate 80 -
85% of their designed capacity. In 2017, the tile
industry continued to stock up nearly 110 million
m2; equivalent to 18.9% of production volume of
the same period. Inventory of traditional ceramic
tiles was more than 90 million m2; mainly of
which are small tiles due to the trend of using
large size ones in recent years.
That the domestic market is in excess supply
together with the emergence of imported tiles
from China and European countries continue to
create fierce competition among businesses.
The price competition drives down the selling
price; narrow profit margins and negatively
impact business operations of manufacturing
enterprises in the industry.
6. Majority of tile producers concentrated in Northern Vietnam due to input resources proximity
Based on the characteristics of inputs, raw materials are divided into elastic group (clay & kaolin) and the non-
plastic one (Quartz & silica sand). Clay is the main material which makes up between 30% and 70% of the
green tile. Besides, the process of milling, glazing and firing also requires the participation of additives such as
enamel and talcum powder. Due to the advantage of proximity of raw material sources with large feldspar and
kaolin mines in provinces such as Lao Cai, Hai Duong, Phu Tho, Vinh Phuc and Quang Ninh; the majority of
tile enterprises are concentrated in the North with the proportion of 67% and 58% to the total production capacity
of ceramic and granite tiles.
Tiles production capacity by regions in 2017
Source: Vietnam Institute of Construction Materials, FPTS Research
456
365
127
108
0
50
100
150
200
250
300
350
400
450
500
2011 2012 2013 2014 2015 2016 2017
mill
ion m
2
Domestic tile production and consumption by type
Ceramic Production Ceramic Consumption
Granite Production Granite Consumption
25
620
012
0
96
277.5
55
0
101.5
720
84.5
110
54
0
0
50
100
150
200
250
300
Northeast and northwestof Vietnam
Red River Delta North Central & SouthCentral Coast
Central Highlands Southeast of Vietnam Mekong River Delta
Cotto Ceramic Granite (Porcelain)

www.fpts.com.vn Bloomberg – FPTS <GO> | 36
7. New trend in single firing technology: high-pressure hydraulic presses and inkjet technology
During production process, combinations of clay, feldspar, kaolin and additives are finely ground, then either
semi-dried or dried using sprayers. The composition of the ceramic tiles includes three layers: the green tile
(raw body created by presses), the middle layer of glaze and the upper aesthetic enamel one. Currently, the
technology applied in manufacturing ceramic tiles is categorized by the number of firing times; namely single
firing, double firing and three-step firing. The last one is the most advanced but least popular firing technology
in Vietnam and currently only Prime uses this technology. Due to the trend in energy efficiency and material
saving, domestic tile producers tend to favor single firing to double firing technology.
Comparison between single firing and double firing technologies
Single firing Double firing
Benefits
Shorter production time
Lower energy costs
Lower initial capital and operation costs
Higher durability (100kg/cm2) thanks to higher firing temperature
Unlimited times of printed decorations
Higher rate of type I tiles
Drawbacks
Lower durability (25kg/cm2)
Maximum of two colors can be printed
Lower rate of type I tiles
Higher initial capital investments
10 percent higher energy costs than that of
single firing
Source: FPTS Research
Disadvantages of single firing as mentioned above and the trend in favoring large size panels with diverse
variations of decoration created the need for production process innovation in the past such as changes from
wet grinding to dry grinding; kilns with higher temperatures and shortened firing time. Since the end of 2016,
ceramic tile enterprises have invested in replacing low pressure presses and old rotor color printers with high
pressure hydraulic presses and the inkjet technology for decorations. This has been result from the trend in
which consumers enjoy installing bigger tiles and well customized printed decorations for their houses.
8. Highly segmented and competitive industry: Larger market shares belong to FDI producers
Vietnamese ceramic tile industry is highly segmented with 82 medium and large-scale (more than 2 million m2
per year) enterprises and hundreds of small-scale ones. In 2017, the total capacity of ceramic and granite
production is estimated to reach 537 and 169.5 million m2 per year, respectively. Big players of the industry are
mainly companies with FDI and unlisted domestic public firms such as Prime (70 million m2 per year), Royal,
Vitto (36 million m2 per year), Tasa (24 million m2 per year), Catalan (18 million m2 per year) and Toko (15
million m2 per year). Meanwhile, domestic enterprises such as Viglacera, CMC, Thach Ban or Dong Tam mostly
focus on the mid-end segment and have been in the trend of shifting to high-end since the end of 2015.
Tile market share breakdown by companies in terms quantities sold in 2016
Source: GSO, FPTS Research
16%
7%
4%
4%
3%
3%
3%3%
3%
2%
2%2%
2%2%
2%2%
1%
1%
38%
Prime Royal
Tasa VTC
CMC Toko
Mikado Thach Ban
Catalan Viglacera
Vitto Taicera
Y My Dong Tam
Bach Ma Vitaly
Chang Yih Cosevco
Others

www.fpts.com.vn Bloomberg – FPTS <GO> | 37
B. REVIEW 2018
1. Excessive supply due to the growth of 5.8% in production and consumption
Source: Ministry of Construction, FPTS Estimates
According to the Ministry of Construction,
production of wall and floor tiles reached 257 million
m2 in 6M2018, equivalent to a growth rate of 9%
yoy. FPTS estimates that the whole year production
will be roughly at 617 million m2 (+5.8% yoy).
With the average consumption rate at about 80% of
total production, 2018 consumption of tiles is
estimated at 500 million m2. Thus, with a total
production capacity of 706.5 million m2 per year;
the whole industry is currently in excess supply at
29%. Tile consumers continues to be in favor of
large size ceramic and granite tiles and various
patterns thanks to digital printing technology.
2. Narrower gross profit margins as a result of decreasing selling prices
Due to a huge excessive supply and recently out of the consumption trend, traditional glazed ceramic tiles
suffered the largest price reduction of 20% – 30%, especially with small size products printed using outdated
methods. For granite tiles, the prices went down by 5% - 20% for the two main product lines, which are 600x600
and 800x800 mm.
Selling price (thousand VND) for granite tiles of size 600x600mm & 800x800mm
Companies Granite size 600x600 mm Granite size 800x800 mm
2017 2018 % change 2017 2018 % change
Prime 115 - 135 100 – 125 -10% 170 – 190 135 – 165 -16.7%
Catalan 110 – 130 102 – 120 -7.5% 165 – 220 145 – 165 -19.5%
Hoan My 120 – 130 115 – 125 -4.0% 180 – 200 145 – 165 -18.4%
Viglacera (VGC) 168 – 185 160 – 170 -6.5% 210 – 230 190 – 210 -11.0%
Mikado 105 – 125 100 – 125 -2.2% 180 – 200 160 – 165 -14.5%
Tasa 110 – 130 110 - 115 -6.3%
CMC (CVT) 162 – 192 152 - 182 -5.7% 260 – 400 236 - 338 -13.0%
Source: Vietnam Ceramics Association, Public Report of construction material prices by provinces
The year 2018 continued to witness growth in revenues of tile companies due to rising quantity sold to the
market. However, decreasing selling prices is the direct reason behind the decline in gross profit margin and net
profit Vietnam tile producers.
Net revenue (bil VND) & profit margin for 9M2018 of ceramic tiles industry
Source: FPTS Research
*Statistics from listed tile companies: CVT, VHL, VIT, TTC, GMX, TCR
0
100
200
300
400
500
600
700
2017 2018E 5M2017 5M2018
Total domestic production output in million m2
5.8%
4,724
18.6% 19.3%20.9%
19.5%
17.0%
3.5% 4.5%6.0% 5.7%
3.9%
0.0%
5.0%
10.0%
15.0%
20.0%
25.0%
3,400
3,600
3,800
4,000
4,200
4,400
4,600
4,800
9M2014 9M2015 9M2016 9M2017 9M2018
Pro
fit
marg
ins
bill
ion V
ND
Net revenue Gross profit margin Net profit margin

www.fpts.com.vn Bloomberg – FPTS <GO> | 38
3. Sharp increases in thermal coal and liquified petroleum gas (LPG) in Q2 & Q3 2018
Energy cost, including thermal coal and LPG, accounts for a large proportion of 30% – 35% of the total cost of
producing tiles. Therefore, in addition to the impact of downward selling price, the thermal coal price peaked at
USD 122 per ton in the last 6 years and the steep rise in LPG price in the third quarter of 2018 further drove down
gross profit margin of the tile industry.
FOB price of Australian 5500 & 6500 kcal/kg thermal coal at Newcastle port
Source: Bloomberg
In early August 2018, Australian thermal coal price reached its highest level since 2012 at USD 122.3 per ton. The
increase was 144.6% since 2016 after hitting a record low of 50 USD per ton. Coal demand for import in the first
half 2018 increased sharply, mainly of Asian countries’ demand such as China (+10.2% yoy), India (+3.3% yoy),
Japan (+3.4% yoy) and Korea (+1% yoy). Meanwhile, coal supplies in South America and Australia were disrupted
along with Indonesia’s policy on restriction of coal exports in order to serve the domestic market. These are main
factors pushing up thermal coal prices in 2018.
Global and domestic LPG prices in 9M2018
Source: DoPM
Oil price jumped in the third quarter of 2018 to 80 USD per barrel, leading to a sharp increase in natural gas price.
In the domestic market, LPG price for a 12kg bottle was adjusted up follow upward world’s oil price trend, ranging
from 4.22% to 5.35%
0
20
40
60
80
100
120
140
(un
it: U
SD
pe
r to
n)
COASNE55 COASNE65
0
100
200
300
400
500
600
700
0
50,000
100,000
150,000
200,000
250,000
300,000
350,000
400,000
January February March April May June July August September
Worl
d L
PG
co
ntr
act p
rice
Dom
estic g
as p
rice
Domestic price (unit: dong per 12kg gas bottle) World LPG contract price (unit: USD per ton)
* Data regarding domestic LPG prices are acquired from 4 enterprises:
Saigon Petro, Petrovietnam Gas South Jsc, Tran Hong Quan Gas Trading
Ltd & Super gas Ltd.
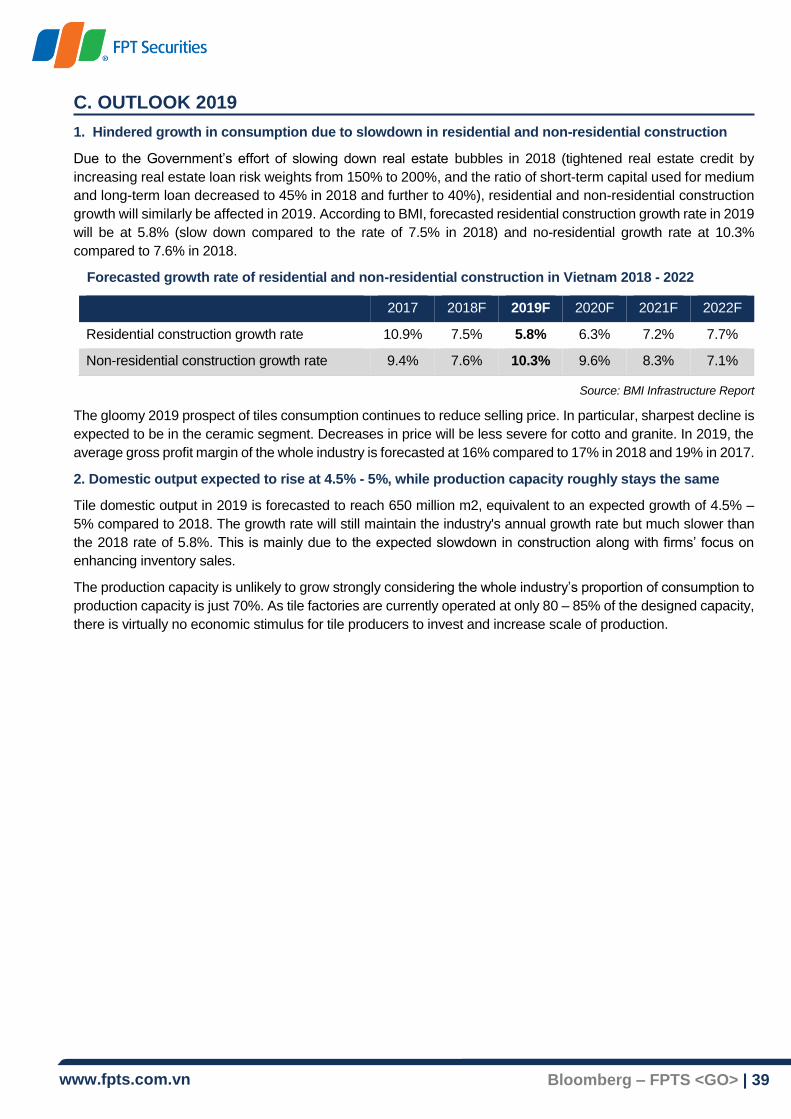
www.fpts.com.vn Bloomberg – FPTS <GO> | 39
C. OUTLOOK 2019
1. Hindered growth in consumption due to slowdown in residential and non-residential construction
Due to the Government’s effort of slowing down real estate bubbles in 2018 (tightened real estate credit by
increasing real estate loan risk weights from 150% to 200%, and the ratio of short-term capital used for medium
and long-term loan decreased to 45% in 2018 and further to 40%), residential and non-residential construction
growth will similarly be affected in 2019. According to BMI, forecasted residential construction growth rate in 2019
will be at 5.8% (slow down compared to the rate of 7.5% in 2018) and no-residential growth rate at 10.3%
compared to 7.6% in 2018.
Forecasted growth rate of residential and non-residential construction in Vietnam 2018 - 2022
2017 2018F 2019F 2020F 2021F 2022F
Residential construction growth rate 10.9% 7.5% 5.8% 6.3% 7.2% 7.7%
Non-residential construction growth rate 9.4% 7.6% 10.3% 9.6% 8.3% 7.1%
Source: BMI Infrastructure Report
The gloomy 2019 prospect of tiles consumption continues to reduce selling price. In particular, sharpest decline is
expected to be in the ceramic segment. Decreases in price will be less severe for cotto and granite. In 2019, the
average gross profit margin of the whole industry is forecasted at 16% compared to 17% in 2018 and 19% in 2017.
2. Domestic output expected to rise at 4.5% - 5%, while production capacity roughly stays the same
Tile domestic output in 2019 is forecasted to reach 650 million m2, equivalent to an expected growth of 4.5% –
5% compared to 2018. The growth rate will still maintain the industry's annual growth rate but much slower than
the 2018 rate of 5.8%. This is mainly due to the expected slowdown in construction along with firms’ focus on
enhancing inventory sales.
The production capacity is unlikely to grow strongly considering the whole industry’s proportion of consumption to
production capacity is just 70%. As tile factories are currently operated at only 80 – 85% of the designed capacity,
there is virtually no economic stimulus for tile producers to invest and increase scale of production.

www.fpts.com.vn Bloomberg – FPTS <GO> | 40
TA VIET PHUONG
Email: [email protected]
Tel: (+84) 24 3773 7070
Ext: 4304
Source: EzSearch
-4%
-43%
-60%
-30%
0%
30%
Movement of Plastic Industry index and VNIndex
VNIndex Plastic Industry

www.fpts.com.vn Bloomberg – FPTS <GO> | 41
A. VIETNAM PLASTIC INDUSTRY OVERVIEW
Plastic industry is one of the sectors with relatively fast growth with CAGR 2012 - 2017 reaching 11.62%.
Vietnam plastic industry is inadequately developed when domestic production fails to meet domestic demand
for plastic material. Downstream of the plastic industry is divided into four main segments: Packaging,
Construction, Household product and Technical product with the industry scale in 2017 estimated at USD 15
billion, accounting for 6.7% of Vietnam's GDP. Within the scope of the report, we will focus more on the two
largest segments in the downstream of the plastics industry: packaging and construction.
1. Value Chain
Vietnam plastic industry as well as other countries in the world, includes two main segments: upstream and
downstream. The upstream of the plastics industry (Petrochemical) includes petrochemical refineries,
chemical plants, which transform fossil feedstocks into plastic resins. Downstream of the plastic industry
(Plastic Converters), consists of manufacturers who convert plastic resins into plastic products. Downstream
of the plastic industry, based on products can be divided into four main segments which are packaging,
construction, household product and technical product.
Upstream (Petrochemical) Downstream (Plastic Converters)
Packaging Construction Household Technique
Binh Son refinery (BSR) AnPhat Plastic (AAA) Binh Minh Plastic
(BMP)
Dai Dong Tien Ha Noi Plastic
(NHH)
Hung Nghiep Formosa Tapack (TPP) Tien Phong Plastic
(NTP)
Long Thanh
Plastic
Mediplast
AGC chemical Viet Nam Batico Dong Nai Plastic
(DNP)
Duy Tan Plastic
Plastic and Chemical TPC Liksin Dong A Group (DAG)
Polystyrene Viet Nam Ngoc Nghia (NNG)
Source: FPTS Research
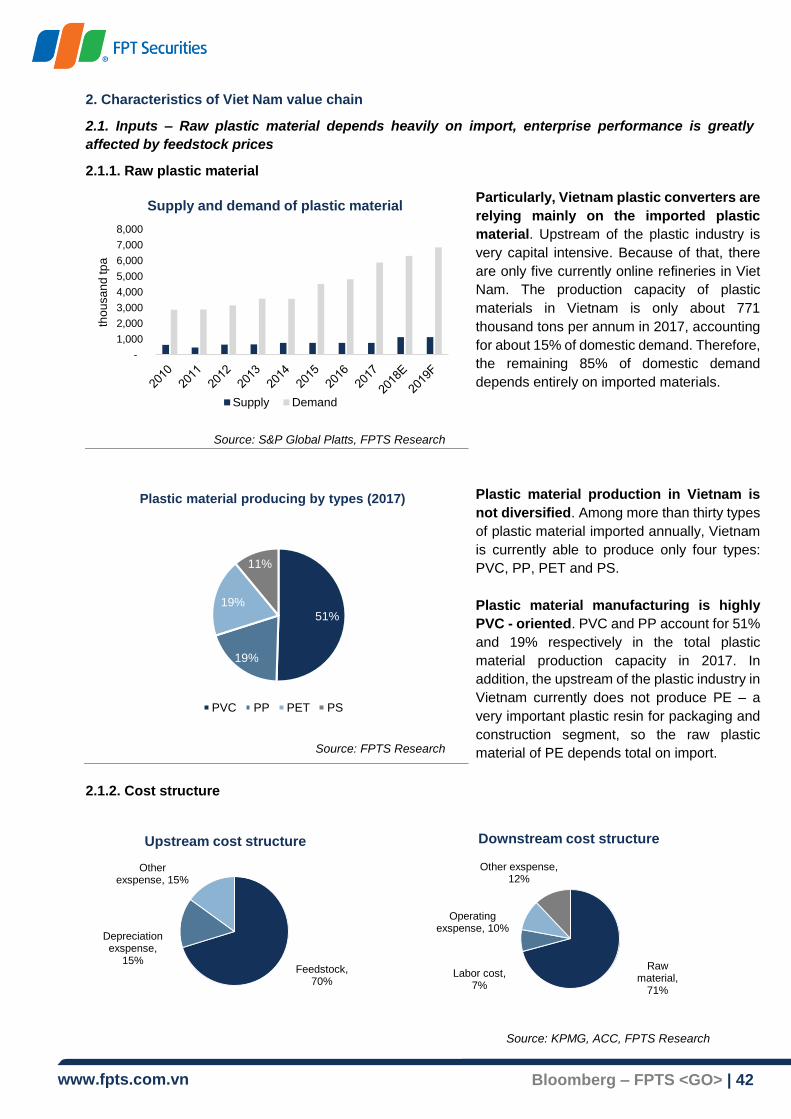
www.fpts.com.vn Bloomberg – FPTS <GO> | 42
2. Characteristics of Viet Nam value chain
2.1. Inputs – Raw plastic material depends heavily on import, enterprise performance is greatly
affected by feedstock prices
2.1.1. Raw plastic material
Source: S&P Global Platts, FPTS Research
Particularly, Vietnam plastic converters are
relying mainly on the imported plastic
material. Upstream of the plastic industry is
very capital intensive. Because of that, there
are only five currently online refineries in Viet
Nam. The production capacity of plastic
materials in Vietnam is only about 771
thousand tons per annum in 2017, accounting
for about 15% of domestic demand. Therefore,
the remaining 85% of domestic demand
depends entirely on imported materials.
Source: FPTS Research
Plastic material production in Vietnam is
not diversified. Among more than thirty types
of plastic material imported annually, Vietnam
is currently able to produce only four types:
PVC, PP, PET and PS.
Plastic material manufacturing is highly
PVC - oriented. PVC and PP account for 51%
and 19% respectively in the total plastic
material production capacity in 2017. In
addition, the upstream of the plastic industry in
Vietnam currently does not produce PE – a
very important plastic resin for packaging and
construction segment, so the raw plastic
material of PE depends total on import.
2.1.2. Cost structure
-
1,000
2,000
3,000
4,000
5,000
6,000
7,000
8,000
tho
usa
nd
tp
a
Supply and demand of plastic material
Supply Demand
51%
19%
19%
11%
Plastic material producing by types (2017)
PVC PP PET PS
Source: KPMG, ACC, FPTS Research
Raw material,
71%
Labor cost, 7%
Operating exspense, 10%
Other exspense, 12%
Downstream cost structure
Feedstock, 70%
Depreciation exspense,
15%
Other exspense, 15%
Upstream cost structure

www.fpts.com.vn Bloomberg – FPTS <GO> | 43
Performance plastic firms are greatly affected by fluctuations in prices of fossil fuels such as crude oil
or natural gas. Typically, for both upstream and downstream manufacturers, the cost of feedstocks and raw
materials account for a large proportion in their cost structures. Therefore, the prices of raw plastic materials
move along side with the prices of feedstocks such as crude oil or natural gas. Thus, a rise in price of feedstock
will most likely affect negatively the performance of plastic converters and vice versa.
2.2. Manufacturing – Shifting toward construction and technical product segments
Source: VPA, MoIT, FPTS Research
Packaging segment accounted for the largest proportion in the total value of Vietnam's plastic
industry in 2017. According to data from the Vietnam Plastics Association and FPTS estimates, Vietnam's
plastic industry value in 2017 is about USD 15 billion, in which plastic packaging accounted for the largest
proportion with the value of about 5.2 billion USD in 2017, growing about 11% compared to 2016.
Industry value is shifting from packaging and household product segments to construction and
technical product segments. Vietnam's plastics industry value tends to shift from low value-added segments
such as packaging and household product to higher value-added segments such as construction and
technical product. In the industry value structure in 2017, construction segment is worth about 3.6 billion USD,
up by 60% yoy, accounting for 24% and technical product segment is worth about 2.8 billion USD, up by 50%
yoy. and account for 19%. According to the industry development plan (QD/2992 - MOIT), two segments of
construction technical product are expected to account for 27% and 25% in the plastic industry value structure
in 2025 respectively.
2.3. Output – Enterprise distribution and output characteristics
Source: GSO
37%
9%
55%
Industry structure by geographic
North Middle South
21%30% 30%
39% 38% 34% 31%
15%
30% 30%21% 18% 25% 27%
60%25% 20% 21% 29% 18% 17%
4%15% 20% 19% 15%
23% 25%
0%
20%
40%
60%
80%
100%
1995 2000 2005 2010 2015 2020F 2025F
Historical and Target industry value structure
Packaging Construction Household Technique
Packaging (USD 5.2 billion),
35%
Construction (USD 3.6 billion), 24%
Household (USD 3.3
billion), 22%
Technique (USD 2.8
billion), 19%
Industry value structure 2017
41%
24%
20%
15%
Industry structure by application
Packaging Construction Household Technique

www.fpts.com.vn Bloomberg – FPTS <GO> | 44
Vietnam plastic industry enterprises are mainly operating in packaging segment and concentrating in
the South. The plastic industry currently has more than 3,300 enterprises, in which the number of enterprises
operating in the packaging sector accounts for 41% of the total number of businesses, equivalent to more
than 1,300 businesses. Plastic enterprises mainly concentrate in the South with about 55% of the total number
of enterprises because the South is the focus of food processing, beverage firms, the main client of the plastic
packaging industry.
Output of packaging segment and construction segment:
Packaging (B2B): this sector is divided into four main groups: monolayer film packaging, multilayer film
packaging, PET bottles and non-PET bottles. Most of plastic packaging products serve beverage,
pharmaceutical and food processing industries, therefore, the growth of plastic packaging segment is
highly dependent on the growth of these industries.
Construction (B2C): main products are water pipes, plastic doors, profiles, ceiling panels, plastic flooring
mostly for the finishing phase of the construction industry. Thus, output growth of the construction plastic
segment depends heavily on the growth of construction and real estate industry.
Source: FPTS Research
The market for plastic packaging is fragmented while the plastic construction market is relatively more
concentrated. Plastic packaging with more than 1,300 enterprises operating has a high level of
fragmentation. The monolayer film packaging sector mainly consists of small enterprises and household
businesses. For the multilayer film packaging sector, the market is also fragmented with thirteen largest
enterprises (each accounting for at least 1% of market share) taking about 41.7% of total market share. In
contrast, construction plastic segment has a higher concentration than plastic packaging segment. For
instance - the plastic pipe market, two leading enterprises Tien Phong Plastic and Binh Minh Plastic are
currently accounting for 54% of the plastic pipe market share in Vietnam.
B. REVIEW 2018
1. Total plastic production slow down in 2018, export value continues to grow
Source: VPA, GSO, FPTS Research
Tan TienTin Thanh
LiksinJ.S
Packaging
Huhtamaki
Thanh Phu
Ngai Mee
SaplasticTong Yuan
Sài Gòn TraphacoMinh Viet
Namkuyng VinaRang Dong
Other firms
Multilayer packaging market share (2017)
NTP, 26%
BMP, 28%HSG, 10%
Other firms, 36%
Plastic pipe market share (2017)
7% 5%
18%13%
6%
16% 18%22%
40%
19%
8% 9% 9%
3%
20%
10%
17%
7%
0%
10%
20%
30%
40%
50%
0
2
4
6
8
10million tons Vietnam plastic production
Plastic production Growth rate

www.fpts.com.vn Bloomberg – FPTS <GO> | 45
Plastic industry is growth industry with average growth rate of 11.62% in the 2012 – 2017 period. In
2017, Vietnam plastic production output reached about 7.8 million tons, up 16.6% compared to 2016. The
main reason for the growth of the plastic industry's output in 2017 is due to the growth of food processing and
beverage industries, retail industry and construction industry. According to the GSO report, manufacturing
and processing industries grew by 17.8% and retail sales from household appliances increased by 8.5%.
These are the two main growth drivers for plastic packaging and household product segment in 2017.
Construction value in 2017 increased by 8.7% compared to 2016 which creates a driving force for output
growth for construction plastic segment.
In 2018, it is estimated that the growth rate of plastic production is about 7% compared to 2017. The
plastic production estimated in 2018 of the plastic industry is about 8.3 million tons, the growth rate of the
plastic production in 2018 is lower than the growth rate in 2017 because the growth of both manufacturing and
construction sectors was slower than in 2017. The reported growth of manufacturing and construction sector
and construction value in nine months of 2018 were 12.6% and 8.6% respectively, lower than in 2017.
Export turnover of plastic products continue to grow in 2017 and 2018. Vietnam's export turnover of
plastic products in 2017 was about USD 2.5 billion, growing by 14.3% compared to 2016, accounting for about
16.7% of the total value of the industry. Export turnover of plastic products in 2018 is estimated to reach USD
2.78 billion, up 13% compared to 2017.
Source: VPA
Packaging accounts for a large proportion in the
export turnover of plastic products. Plastic
packaging segment not only accounts for a large
proportion in the total value of the industry but also
contributes a significant amount in Vietnam's plastic
product export turnover. In 2017, the value of exported
plastic packaging products is estimated at US $ 1.03
billion, accounting for 42% of the export turnover of the
whole industry. The second is construction plastic
products with 32%, equivalent to about 0.8 billion USD
in 2017.
2. Revenue growth slows down and gross profit margin declines
(*based on plastic listed firms: AAA**, NNG, RDP, SPP, VBC, TPP, TPC, NHP, BBS, BPC, PMP, BXH, STP, PBP, BMP, NTP,
DNP, DAG, DPC)
(**exclude resin trading revenue of AAA)
Source: Bloomberg, FPTS Research
00%
05%
10%
15%
20%
25%
30%
Revenue growth rate and gross profit margin
Revenue growth rate y-o-y Gross profit margin
Packaging, 42%
Construction, 32%
Household, 17%
Technique and others, 9%
Export value structure by application (2017)
0
10
20
30
40
50
60
70
80
90
0
200
400
600
800
1000
1200
1400
Jan
-16
Ma
r-16
Ma
y-1
6
Jul-1
6
Se
p-1
6
Nov-1
6
Jan
-17
Ma
r-17
May-1
7
Jul-1
7
Se
p-1
7
Nov-1
7
Jan
-18
Ma
r-18
Ma
y-1
8
Jul-1
8
Se
p-1
8
Nov-1
8
USD/BarrelUSD/Ton
Brent Crude and Plastic material price
PE PP PVC (SE) Brent Crude

www.fpts.com.vn Bloomberg – FPTS <GO> | 46
Revenue of listed plastic companies still maintained the growth momentum. The 3Q2018 revenue of
listed plastic companies continued to grow at an averaging rate of about 11%, slower than the average growth
of 2017 (17%). Revenue of listed plastic businesses slowed down compared to 2017, because the growth of
manufacturing and processing industry was slower than in 2017.
Gross profit margin decreases due to increasing prices of plastic materials. Prices of raw plastic
materials in the period of 2016 - 2018 continued to increase with the recovery of crude oil prices, PE increased
by 5% on average, PP by 43% and PVC increased by 21%. Plastic material costs account for a large
proportion in the cost structure of plastic companies, so gross profit margins of listed plastic companies
continuously decreased from 25% on average in 2016 to 15% by Q3 2018. Another factor which has
negatively impact on the gross profit margin of plastic enterprises was the import tariff of primary PP resins
was adjusted up from 0% to 3%, effective from January 1, 2017.
C. OUTLOOK 2019
1. Plastic production will continue to grow with the decelerating growth rate
The year 2019 is forecasted to be another growth year for Vietnam plastics industry but the expected growth
rate is only about 6% - 7%, slower than 2018. Packaging segment and construction segment is still the two
main growth drivers of Vietnam plastic industry:
1.1. Packaging Plastic:
(thousand billion VND) 2016 2017 2018E 2019F 2020F 2021F 2022F
Household spending 2,469 2,735 3,035 3,397 3,802 4,253 4,756
Growth rate - 2010 prices (%) 5.64% 7.25% 7.26% 7.13% 7.13% 7.12% 7.12%
Food spending 469 519 575 643 720 804 899
Growth rate yoy (%) 8.22% 10.67% 10.86% 11.82% 11.83% 11.79% 11.74%
Non – alcoholic drink spending 37 41 46 51 57 64 72
Growth rate yoy (%) 8.45% 10.94% 11.11% 12.07% 12.05% 11.99% 11.92%
Source: BMI Research
Growth in spending on food and non-alcoholic beverages will be the main growth driver for packaging
segment in 2019. According to BMI, household spending in 2019 will be about 3.3 million billion VND, in
which spending on food and non-alcoholic drinks still accounts for the largest proportion of about 20% of total
household expenditure. The growth of the two segments of food and non-alcoholic beverages is expected to
grow by about 11% in 2019. This is the main driver for the growth of the food processing and beverage
industries which are the main clients of the packaging segment.
1.2. Construction Plastic:
Growth 2018E 2019F 2020F 2021F 2022F 2023F 2024F 2025F
Residential 7.4% 5.7% 6.2% 7.1% 7.7% 7.5% 7.4% 7.3%
Non-residential 5.8% 8.2% 7.5% 6.4% 5.3% 5.3% 5.1% 5.2%
Water infrastructure 6.7% 7.7% 7.2% 7.2% 7.0% 6.8% 6.8% 6.8%
Source: BMI Research
Growth of the construction segment in 2019 comes mainly from non–residential building and water
infrastructure growth. Construction industry is expected to grow by about 8%, slower than the growth rate
of 2018. In which, residential building growth is forecasted to reduce to only 5.7% while growth non –
residential building and water infrastructure are expected to increase by 8.2% and 7.7% respectively.

www.fpts.com.vn Bloomberg – FPTS <GO> | 47
2. Reducing dependence on imported materials, especially PP
Source: S&P Global Platts, FPTS Research
Supply of domestic plastic materials is about to
increase rapidly in order to meet the demand of
downstream plastic converters. In 2018, Nghi Son
oil refinery officially came into operation with a
designed capacity of 370,000 tons of PP per year,
helping the PP production capacity of Viet Nam
increase by 246% and meet about 50% of domestic
demand. In 2018, there are also two major
petrochemical projects approved by the government.
Long Son petrochemical project and HyoSung
petrochemical project of which the main product is still
PP and are currently under construction. After being
completed and put into operation in 2020, the
production of plastic materials in Vietnam is expected
to meet 44% of domestic plastic material demand.
3. The average price of plastic material in 2019 is expected to be more stable
Source: EIA Short term Outlook 06/11/2018
In 2019, according to the forecast of the US energy
agency EIA, the average Brent oil price will be at $72
per barrel, slightly lower than the average of 2018.
Therefore, the price of two materials which are PE and
PP is expected to be stable at an average of $1,210
per ton and $1,255 per ton slightly down by 1%
compared to the 2018 average price. For PVC
material, construction demand in China which is the
largest PVC production and consumption country in
the world has slowed down. Thus, the PVC (Southeast
Asia) average price in 2019 is expected to stabilize at
$926 per ton equal to the average price of 2018.
4. Prospects from EVFTA
Source: TCHQ, FPTS Research
The free trade agreement between EU and Vietnam
is expected to complete the final round of
negotiations and come into effect in 2019. In the
export value structure of plastic products in Vietnam,
EU region accounts for the second largest proportion
with about 22%. Currently, plastic packaging products
of Vietnam have a competitive advantage in the EU
market with plastic packaging products from other
countries in the region due to exemption of anti-
dumping tariff of 4% - 30%. After the EVFTA comes
into effect, the tariffs of most plastic products exported
to the EU market will be removed. This will be a great
opportunity to increase the export volume of plastic
products of Vietnam plastic industry towards important
market like EU.
-
1,000
2,000
3,000
4,000
5,000
6,000
7,000
8,000
thousand tpa
Supply and demand of plastic material
Supply Demand
0
20
40
60
80
100
120
Jan
-14
Jun
-14
Nov-1
4
Ap
r-15
Se
p-1
5
Fe
b-1
6
Jul-
16
Dec-1
6
Ma
y-1
7
Oct-
17
Ma
r-1
8
Au
g-1
8
Jan
-19
Jun
-19
Nov-1
9
USD/BarrelBrent crude price 2014 - 2019
Japan, 22%
EU, 22%
America, 15%
Other regions,
41%
Vietnam plastic export value by regions (2017)

www.fpts.com.vn Bloomberg – FPTS <GO> | 48
Appendix: Oil refineries in Vietnam
Refinery Feedstock Product Capacity
(ton p.a) Active year Status
Binh Son refinery (BSR) Crude oil PP 150,000 2009 Active
Hung Nghiep Formosa Crude oil PET 145,000 2004 Active
AGC chemical Vietnam Crude oil PVC 200,000 2004 Active
Plastic and Chemical TPC VINA Crude oil PVC 190,000 2010 Active
Polystyrene Viet Nam Crude oil PS 48,000 2012 Active
Polystyrene Viet Nam Crude oil PS 38,000 2006 Active
Nghi Son refinery Crude oil PP 370,000 2018 Active
Long Son refinery Crude oil PP, HDPE,
LLDPE 1,410,000 2020
Under
Construction
Hyosung refinery Crude oil PP 600,000 2020 Under
Construction
Vung Ro refinery Crude oil PP 900,000 2018 Delayed
PTT refinery Crude oil PE 800,000 2021 Delayed
Dung Quat expansion - 1st phase Crude oil PP 15,000 2021 Planning
Dung Quat expansion - 2nd phase
(Blue whale feedstock)
Natural
Gas Methanol N/A 2023 – 2035 Planning
PVGas Ba Ria Vung Tau Natural
Gas PP 400,000 2021 Planning
PVGas Ba Ria Vung Tau Natural
Gas Ethane 120,000 2021 Planning
Source: S&P Global Platts, VPA, FPTS Research
www.fpts.com.vn Bloomberg – FPTS <GO> | 49
NGUYEN THI KIM CHI
Email: [email protected]
Tel: (+84) 24 3773 7070
Ext: 4303
Source: EzSearch
-4%
-60%
-30%
0%
30%
Movement of Aviation Industry index and VNIndex
VNIndex Aviation Industry

www.fpts.com.vn Bloomberg – FPTS <GO> | 50
A. AVIATION INDUSTRY OVERVIEW
Vietnam Aviation Industry Value Chain
Source: FPTS Research
Similar to the world aviation value chain, Vietnam's aviation industry includes groups of businesses (1) Aircraft
manufacturers, aircraft leasing companies, (2) Airport enterprises, (3) Airline carriers, (4) Cargo
terminal/Services, (5) Forwarding agent.
Passenger traffic (million passenger kilometer)
Source: GSO
Vietnam Aviation main events from 1996 to 2017:
(1) 1997 – Asian countries were affected by 1997 Asian financial crisis. Numbers of airlines stopped operating
regularly to Vietnam such as Emirates Airlines, Garuda, Philippines Airlines, KLM, Lauda Air, Swiss Air.
(2) 2013 - Translating Sars made flight routes between Vietnam and epidemic areas such as China, Taiwan,
Hong Kong, etc cut and shut down operating.
(3) 2004 - Vietnam - US air transport agreement was signed, VASCO went into operation. The CAAV had a
policy of discounting air traffic control services and airports services to support and attract foreign airlines to
operate in Vietnam. At the same time, airlines also had discount promotional policies to stimulate demand
and attract customers after the SARS pandemic. The growth of aviation industry recovered.
(4) 2011 – Vietjet Air participated in air transport sector.
0
10,000
20,000
30,000
40,000
50,000
60,000 1 2 3 4 5 6
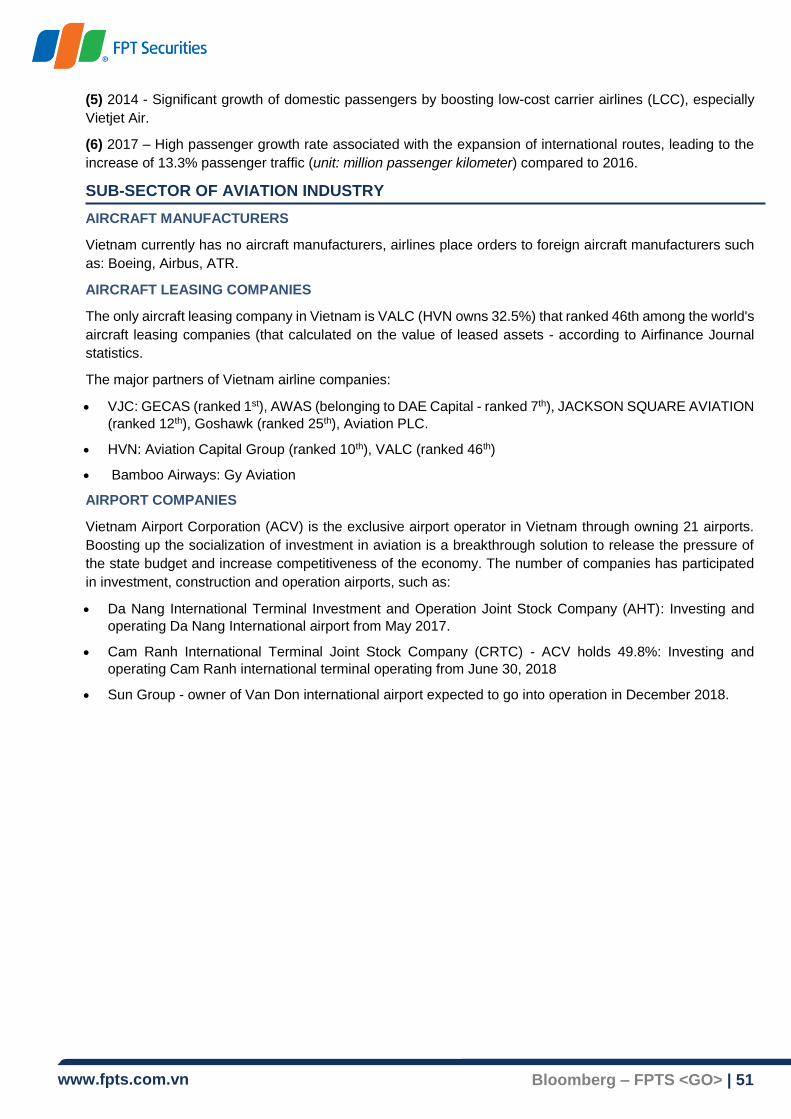
www.fpts.com.vn Bloomberg – FPTS <GO> | 51
(5) 2014 - Significant growth of domestic passengers by boosting low-cost carrier airlines (LCC), especially
Vietjet Air.
(6) 2017 – High passenger growth rate associated with the expansion of international routes, leading to the
increase of 13.3% passenger traffic (unit: million passenger kilometer) compared to 2016.
SUB-SECTOR OF AVIATION INDUSTRY
AIRCRAFT MANUFACTURERS
Vietnam currently has no aircraft manufacturers, airlines place orders to foreign aircraft manufacturers such
as: Boeing, Airbus, ATR.
AIRCRAFT LEASING COMPANIES
The only aircraft leasing company in Vietnam is VALC (HVN owns 32.5%) that ranked 46th among the world's
aircraft leasing companies (that calculated on the value of leased assets - according to Airfinance Journal
statistics.
The major partners of Vietnam airline companies:
VJC: GECAS (ranked 1st), AWAS (belonging to DAE Capital - ranked 7th), JACKSON SQUARE AVIATION
(ranked 12th), Goshawk (ranked 25th), Aviation PLC.
HVN: Aviation Capital Group (ranked 10th), VALC (ranked 46th)
Bamboo Airways: Gy Aviation
AIRPORT COMPANIES
Vietnam Airport Corporation (ACV) is the exclusive airport operator in Vietnam through owning 21 airports.
Boosting up the socialization of investment in aviation is a breakthrough solution to release the pressure of
the state budget and increase competitiveness of the economy. The number of companies has participated
in investment, construction and operation airports, such as:
Da Nang International Terminal Investment and Operation Joint Stock Company (AHT): Investing and
operating Da Nang International airport from May 2017.
Cam Ranh International Terminal Joint Stock Company (CRTC) - ACV holds 49.8%: Investing and
operating Cam Ranh international terminal operating from June 30, 2018
Sun Group - owner of Van Don international airport expected to go into operation in December 2018.
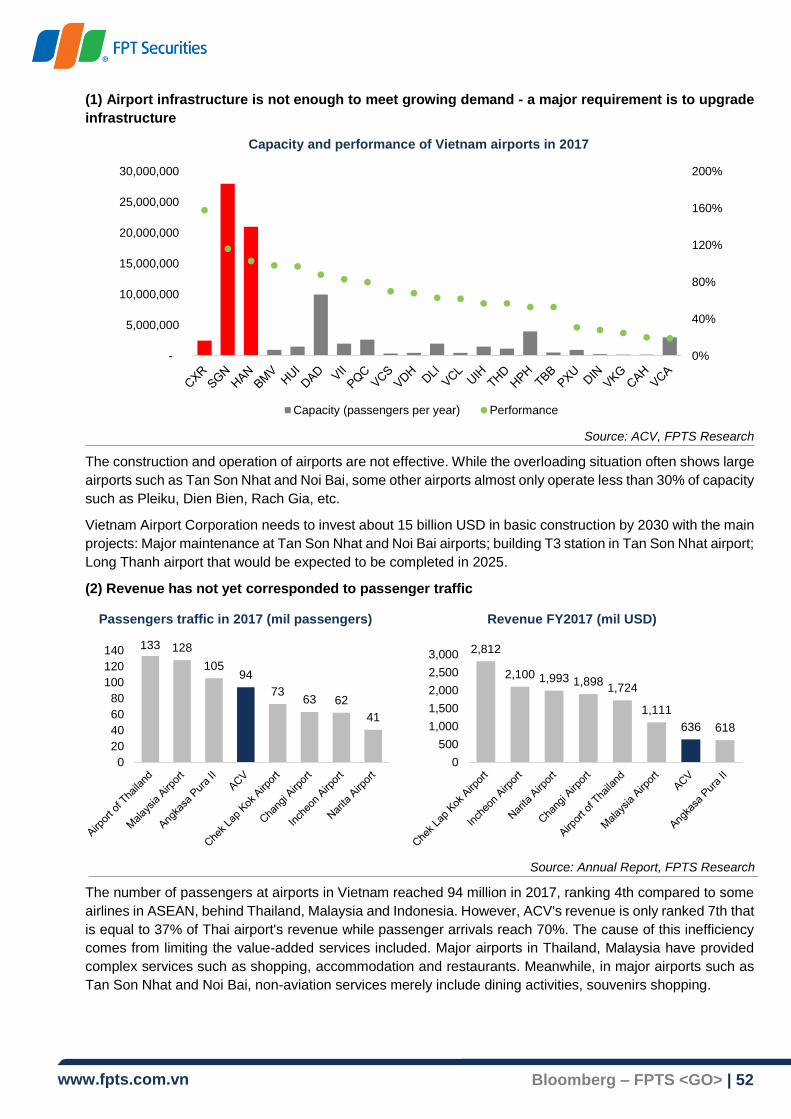
www.fpts.com.vn Bloomberg – FPTS <GO> | 52
(1) Airport infrastructure is not enough to meet growing demand - a major requirement is to upgrade
infrastructure
Source: ACV, FPTS Research
The construction and operation of airports are not effective. While the overloading situation often shows large
airports such as Tan Son Nhat and Noi Bai, some other airports almost only operate less than 30% of capacity
such as Pleiku, Dien Bien, Rach Gia, etc.
Vietnam Airport Corporation needs to invest about 15 billion USD in basic construction by 2030 with the main
projects: Major maintenance at Tan Son Nhat and Noi Bai airports; building T3 station in Tan Son Nhat airport;
Long Thanh airport that would be expected to be completed in 2025.
(2) Revenue has not yet corresponded to passenger traffic
Source: Annual Report, FPTS Research
The number of passengers at airports in Vietnam reached 94 million in 2017, ranking 4th compared to some
airlines in ASEAN, behind Thailand, Malaysia and Indonesia. However, ACV's revenue is only ranked 7th that
is equal to 37% of Thai airport's revenue while passenger arrivals reach 70%. The cause of this inefficiency
comes from limiting the value-added services included. Major airports in Thailand, Malaysia have provided
complex services such as shopping, accommodation and restaurants. Meanwhile, in major airports such as
Tan Son Nhat and Noi Bai, non-aviation services merely include dining activities, souvenirs shopping.
133 128
10594
7363 62
41
0
20
40
60
80
100
120
140 2,812
2,100 1,993 1,8981,724
1,111
636 618
0
500
1,000
1,500
2,000
2,500
3,000
Capacity and performance of Vietnam airports in 2017
Passengers traffic in 2017 (mil passengers) Revenue FY2017 (mil USD)
0%
40%
80%
120%
160%
200%
-
5,000,000
10,000,000
15,000,000
20,000,000
25,000,000
30,000,000
Capacity (passengers per year) Performance

www.fpts.com.vn Bloomberg – FPTS <GO> | 53
AIRLINES CARRIERS
(1) Concentration of Vietnam air transport market is high, only two big players
Currently, Vietnam's aviation industry has 2 main domestic operators, HVN (including Vietnam Airlines, Jetstar
Pacific and VASCO) and VJC (Vietjet Air) with 55% and 45% market share respectively in first 9 months of
2018 (data used from calculations of VJC). At the beginning of January 2019, Bamboo Airlines will enter the
market with plans to exploit 24 domestic routes and 16 international routes.
Annual departing seat capacity in 2018 (mil seats)
* Change in departing seats 2018 vs 2017
Source: OAG Schedules Analyzer
(2) High competition in the low-cost carriers segment - towards new-age generation
Source: Companies Reports
Compared to low-cost carriers in ASEAN, VJC is the best profitable airline in the first 9M2018 when fuel prices
rise sharply. Other airlines have lower load factor compared to 2017 because the number of passengers has
a high sensitivity to the fare increase. VJC still retains the 88% load factor compared to 2017. Not only offering
competitive price campaign, VJC also expanded its operation by increasing the international flights and
ancillary revenue. This market increased strongly to help RASK increase at 4.88 USc / ASK (+15% yoy). This
is also the factor that helped VJC overcome the period of high oil price to get better results than the low-cost
carriers in the region.
0 5 10 15 20 25
Vietnam Airlines (+0.7%)
Vietjet Air (+22.3%)
Jetstar Pacific (+8.2%)
China Southern Airlines (+23.2%)
Korean Air (+33.1%)
AirAsia (+17.2%)
Asiana Airlines (+20.8%)
Qatar Airways (+46.4%)
Jeju Air (+100%)
Thai AirAsia (+21.1%)
Jin Air (+36.3%)
Thai Airways (-2.8%)
84% 80% 81% 82%88%
-40%
-20%
0%
20%
40%
60%
80%
100%
-4
-2
0
2
4
6
8
10
Nok Airlines AirAsia X Asia Aviation AirAsia Vietjet Air
RASK CASK CASK-ex fuel RASK-CASK Hệ số lấp đầyLoad factor
RASK, CASK of VJC vs LCCs in the region in 9M2018
* RASK: Revenue per
available seat kilometer
*CASK: Cost per
available seat kilometer
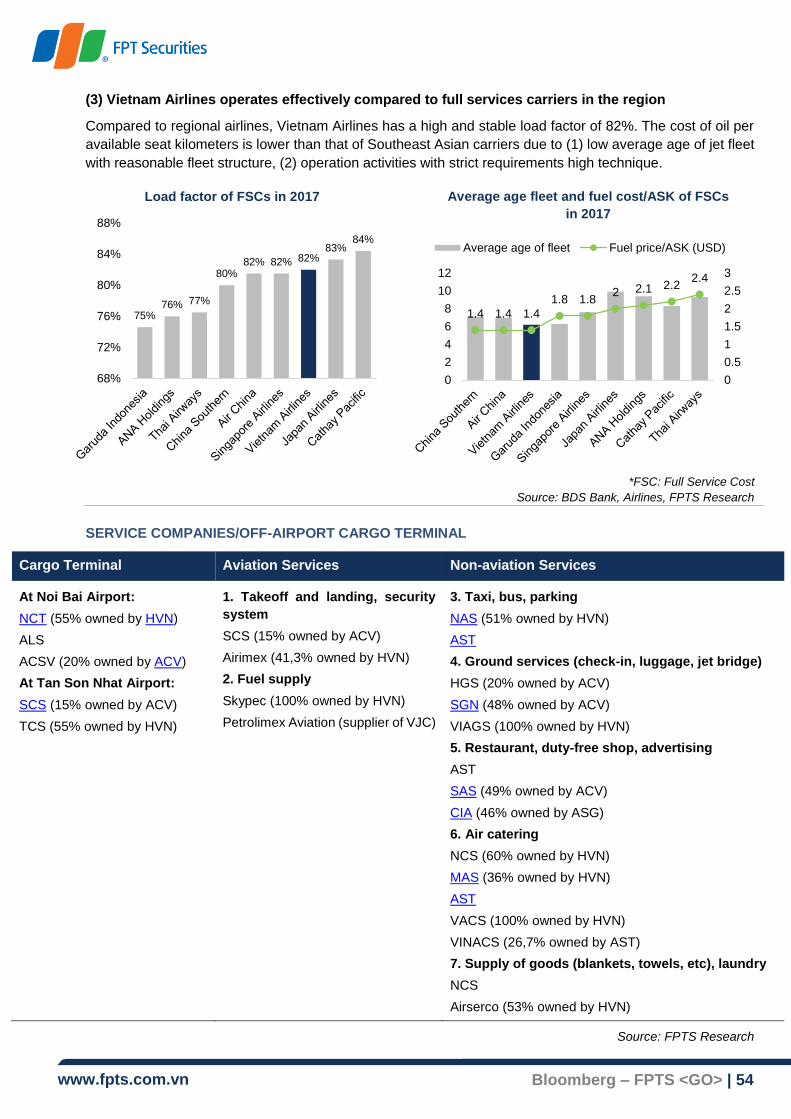
www.fpts.com.vn Bloomberg – FPTS <GO> | 54
(3) Vietnam Airlines operates effectively compared to full services carriers in the region
Compared to regional airlines, Vietnam Airlines has a high and stable load factor of 82%. The cost of oil per
available seat kilometers is lower than that of Southeast Asian carriers due to (1) low average age of jet fleet
with reasonable fleet structure, (2) operation activities with strict requirements high technique.
*FSC: Full Service Cost
Source: BDS Bank, Airlines, FPTS Research
SERVICE COMPANIES/OFF-AIRPORT CARGO TERMINAL
Cargo Terminal Aviation Services Non-aviation Services
At Noi Bai Airport:
NCT (55% owned by HVN)
ALS
ACSV (20% owned by ACV)
At Tan Son Nhat Airport:
SCS (15% owned by ACV)
TCS (55% owned by HVN)
1. Takeoff and landing, security
system
SCS (15% owned by ACV)
Airimex (41,3% owned by HVN)
2. Fuel supply
Skypec (100% owned by HVN)
Petrolimex Aviation (supplier of VJC)
3. Taxi, bus, parking
NAS (51% owned by HVN)
AST
4. Ground services (check-in, luggage, jet bridge)
HGS (20% owned by ACV)
SGN (48% owned by ACV)
VIAGS (100% owned by HVN)
5. Restaurant, duty-free shop, advertising
AST
SAS (49% owned by ACV)
CIA (46% owned by ASG)
6. Air catering
NCS (60% owned by HVN)
MAS (36% owned by HVN)
AST
VACS (100% owned by HVN)
VINACS (26,7% owned by AST)
7. Supply of goods (blankets, towels, etc), laundry
NCS
Airserco (53% owned by HVN)
Source: FPTS Research
Load factor of FSCs in 2017 Average age fleet and fuel cost/ASK of FSCs
in 2017
1.4 1.4 1.4
1.8 1.82 2.1 2.2
2.4
0
0.5
1
1.5
2
2.5
3
0
2
4
6
8
10
12
Average age of fleet Fuel price/ASK (USD)
75%76% 77%
80%82% 82% 82%
83%84%
68%
72%
76%
80%
84%
88%

www.fpts.com.vn Bloomberg – FPTS <GO> | 55
Service quality is at an average level in Southeast Asia such as Singapore, Malaysia or Thailand
Source: IATA Economics
FORWARDING AGENTS
Mostly enterprises operate in the field of freight forwarding from shippers/agents to airports and vice versa.
Currently there are 3 main businesses:
Vinako (not yet equitized): operating at Tan Son Nhat airport
TECS (not yet equitized): operating at Tan Son Nhat airport
ASG (unlisted): operating at Tan Son Nhat and Noi Bai airports
B. REVIEW 2018
1. Profit margin of airline carriers declined due to rising oil price
Source: Bloomberg
-140
-120
-100
-80
-60
-40
-20
0
OverallTicket fare, tax,
feeQuality of
transportationBusiness
Environment Visa requirement
Singapore Malaysia Thailand Indonesia Viet Nam Philippines Laos Cambodia
-10
0
10
20
30
40
50
0
20
40
60
80
100
120
140
160
180
Oct-
98
Jun
-99
Fe
b-0
0
Oct-
00
Jun
-01
Fe
b-0
2
Oct-
02
Jun
-03
Fe
b-0
4
Oct-
04
Jun
-05
Fe
b-0
6
Oct-
06
Jun
-07
Fe
b-0
8
Oct-
08
Jun
-09
Fe
b-1
0
Oct-
10
Jun
-11
Fe
b-1
2
Oct-
12
Jun
-13
Fe
b-1
4
Oct-
14
Jun
-15
Fe
b-1
6
Oct-
16
Jun
-17
Fe
b-1
8
Oct-
18
Gap (RHS) Jet A1 price Brent price
Rating Air Services in ASEAN countries in 2017
Jet price has
started to rise
Brent oil price and Jet A1 price 1998 – 2018 (USD/barrel)

www.fpts.com.vn Bloomberg – FPTS <GO> | 56
Fuel prices at the end of September 2018 increased by 25% compared to the same period in 2017. This made
the gross profit margin of HVN only 13% in 9M2018 compared to 15.1% in the same period. Meanwhile, VJC's
fuel costs also accounted for 38% of total revenue (excluding aircraft sales) in 6 months of 2018, up from 36%
in 2017 and 34% in 2016.
2. Profit margin of cargo terminal and services companies are stable and tends to increase
*Data: NCT, SCS, SGN, SAS, CIA, NAS, AST, NCS, MAS
**Have no data of NAS in 9M2018
Source: FPTS Research
Profitability ratios of cargo terminal and services companies tend to increase from 2014 to 9M2018 due to the
benefits of air passenger traffic growth. This is the group of enterprises with the highest profit margin in the
airline industry. The main risk comes from ownership structure. Those companies are less affected by oil price
fluctuations than airline carriers.
3. The increase in passenger, cargo volume and the proportion of international visitors support the
growth of airport enterprises
Source: Vietnam National Administration of Tourism Source: 2345/QĐ-BGTVT
(USD/passenger) International Domestic Effective period
Aviation security fees
2 0.51 1/10/2017 - 31/12/2017
2 0.59 1/1/2018 - 31/3/2018
2 0.78 From 01/04/2018
Passenger services charges
21.7 2.9 1/10/2017 - 31/12/2017
21.7 3.1 1/1/2018 - 31/3/2018
21.7 3.3 01/04/2018 - 30/06/2018
21.7 3.9 From 01/07/2018
In 2018, aviation security fees and domestic passenger service charge increased by ~40% compared to 2017.
Cost of services from international visitors was still about 7 times higher than that of domestic tourists.
In 2016 and 2017, the growth rate of international tourists reached 32%. According to the data of the first 10
months of 2018, the growth rate of tourists increased by 17% year to year, coming from Northeast Asia such
as Japan, China, and Korea.
35%39% 41% 43% 44%
14% 13%18% 20% 22%
-
2,000
4,000
6,000
8,000
0%
10%
20%
30%
40%
50%
2014 2015 2016 2017 9M2018
(bill
ion V
ND
)
Revenue
Gross profit margin
Net profit margin
24%
11%7%
4%1%
32% 32%
17%
-5%
0%
5%
10%
15%
20%
25%
30%
35%
40%
-
2,000
4,000
6,000
8,000
10,000
12,000
International visitor by air (thousand passengers)
Growth rate (%yoy)
Visitors by air 2010 – 10M2018
Profit margin cargo terminal and services companies

www.fpts.com.vn Bloomberg – FPTS <GO> | 57
4. The positive information affects the airline industry in 2018
Prime Minister Nguyen Xuan Phuc's visit to Japan in May extended opportunities for cooperation in
aviation transport and supply chain; welcome ANA airline of Japan to buy more shares of HVN. In addition,
VJC also signed a cooperation agreement to operate 3 flights between Japan - Vietnam at the end of 2018
and early 2019.
In October 2018, Vietnam Airlines Corporation (Vietnam Airlines) and Vingroup signed a cooperation
agreement to build products combining aviation and tourism across the entire route network,
accommodation facilities and travelling.
In-town check-in service was implemented from October 2018 by VIAGS - a subsidiary of HVN. The
expansion of utility services leads HVN into a 4-star airline company.
C. OUTLOOK 2019
1. Stable passenger growth - Tourism is the driving force for international passenger growth
According to IATA's forecast, Vietnam's aviation industry will grow fastest, becoming the 15th largest market
in 2035.
Source: Vietnam National Administration of Tourism, ACV
Passenger traffic through airports in the first 9 months of 2018 reached 79.3 million passengers (+12.1% yoy)
with the proportion of international passengers increasing to 34% in 2018. As forecasted by the Port
Corporation Vietnam aviation, passenger traffic through airports can reach 127 million passengers by 2021
(equivalent to CAGR 2017 - 2021 = 9.8%) and 185 million passengers by 2025 (equivalent to CAGR 2021 -
2025 = 7.8%). With the expectation of an increase in international passenger rates from (1) Vietnamese
airlines open flights to new markets, especially in Northeast Asia, (2) motivation from tourism industry; profits
of air carriers, airports and services are expected to grow significantly in 2019.
Benefits from increasing the proportion of international visitors:
(1) For airline carriers: Ancillary revenue of international tourists is higher than domestic ones.
(2) For airport terminal: As analyzed above, international passenger service prices are 7 times higher than
domestic ones.
(3) For services companies: Ground service, flight safety, air catering service, duty-free sales, shops in the
isolation area all grow due to international visitors.
137
18535%
32%30% 30%
32%34%
0%
5%
10%
15%
20%
25%
30%
35%
40%
0
20
40
60
80
100
120
140
160
180
200
Domestic
International
Proportion of international passengers
0%
1%
2%
3%
4%
5%
6%
0
2
4
6
8
10
12
mil
pa
sse
ng
ers
Contribution to GDP (%)
International visitors (mil passengers)
The contribution of the tourism industry to GDP and the
number of foreign tourists to Vietnam (2007 - 2027F)
Passengers throughput at Vietnam Airports
(mil passengers)

www.fpts.com.vn Bloomberg – FPTS <GO> | 58
2. Oil prices are on a downward trend in late 2018 and stable in 2019
After soared at $86/barrel on October 2018, brent oil
price is around $60/barrel (down more than 30%
compared to October 2018). Oil prices are expected
to cool down by the end of 2018, reaching an average
of more than 70 USD/barrel in 2018. As forecasted by
some organizations such as World Bank, OECD or
EIA, oil prices in 2019 will be stable at $72/barrel.
With a cost structure of more than 30% from fuel
prices, stable oil prices in 2019 will be a support factor
for the growth of airline carriers.
Source: World Bank, OECD, EIA
3. Competition has increased in cargo terminal and services companies
(1) VINACS participates in air catering services, NCS expands operating activities
NCS MAS VINACS VACS
Initial year of operation 1978 1993 2017 n/a
Capacity 10,000
2,000 25,000 20,000
New capacity in 2018 35,000
Actual volume 25,000 15,000 15,000 12,000
Venue Noi Bai Da Nang, Cam Ranh, Phu Bai
Noi Bai, Cat Bi, Da Nang, Cam
Ranh, Phu Quoc Tan Son Nhat
Revenue 2017 (bil VND) 614 293 78 826
Net Income 2017 (bil VND) 83 39.6 -41 172
Ownership Structure 60% owned by
HVN 36% owned by
HVN 26,7% owned by
AST 100% owned
by HVN
Source: FPTS Research
Previously, enterprises participating in air catering sector were either subsidiaries or affiliates of HVN. In 2017,
VINACS that is AST's affiliated company joined the market, competing directly with NCS, VACS and MAS.
With the goal of building supply chains for airports nationwide, VINACS is focusing on price competition
strategy, attracting customers. In fact, VINACS has won a large customer named Qatar Airways from NCS in
2018, VJC will also work with VINACS in 2019. Big competition makes NCS have to invest more factories that
put into operation from 15 August 2018.
(2) Cargo terminal: Opportunities for businesses to have room for growth
Cargo terminal operation is the business segment that brings the highest profit margin in the airline value
chain with a 9M2018 profit margin of 66% (data calculated on the listed companies NCT and SCS). However,
the situation of these two companies is different. NCT is losing its market share at Noi Bai airport while SCS
is an enterprise with growth momentum at Tan Son Nhat airport.
74
70
72
40
45
50
55
60
65
70
75
80
2015 2016 2017 2018F 2019F
(US
D/b
arr
el)
Bent price forecast
World Bank OECD EIA

www.fpts.com.vn Bloomberg – FPTS <GO> | 59
*Others: including courier companies with a relatively low market share
Source: Companies reports, FPTS Research
NCT, ALS, TCS are enterprises owned by HVN; ACSV, SCS owns ACV. In 2019, we assess that the
competition in this group of enterprises is higher because SCS plans to expand its capacity to 350,000 tons
per year (75% increase compared to the current capacity).
84% 82%
55% 53%
16% 18%
17% 17%
28% 30%
0%
20%
40%
60%
80%
100%
2014 2015 2016 2017
NCT ALS ACSV
76% 74% 70% 66%
24% 26% 30% 34%
0%
20%
40%
60%
80%
100%
2014 2015 2016 2017
TCS và khác SCS
NCT, ALS, ACSV market share at Noi Bai
SCS, TCS market share at Tan Son Nhat
TCS and
others
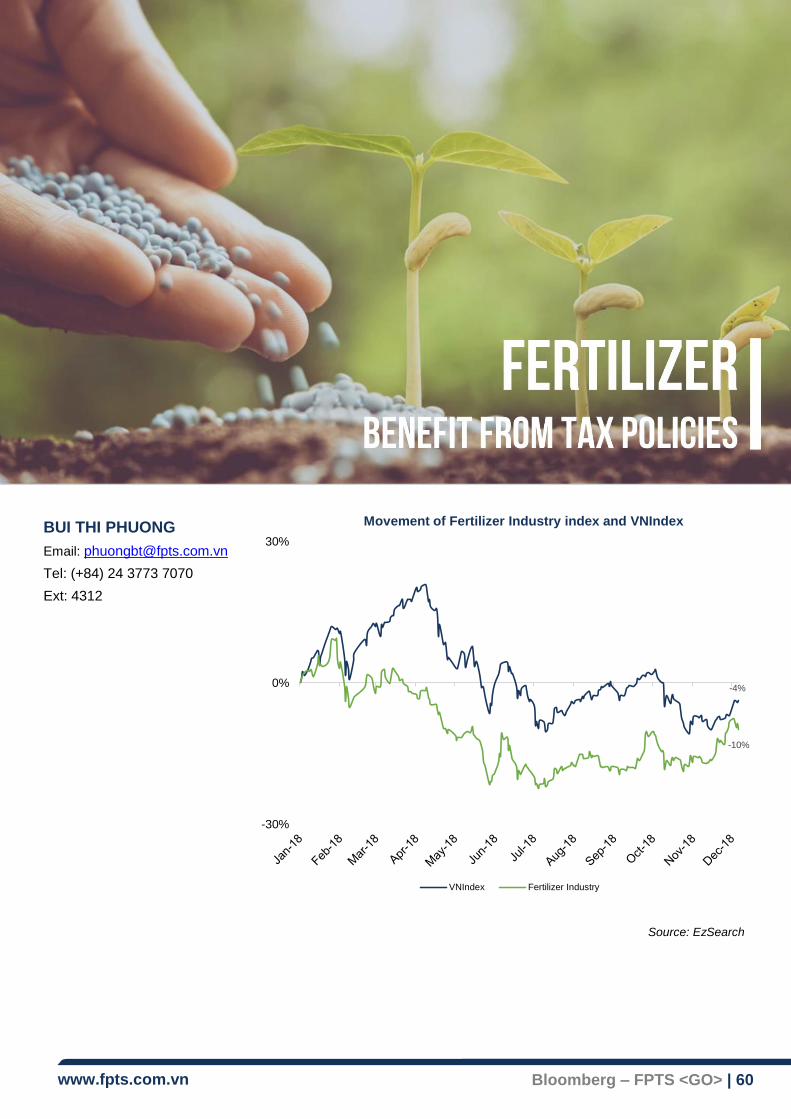
www.fpts.com.vn Bloomberg – FPTS <GO> | 60
BUI THI PHUONG
Email: [email protected]
Tel: (+84) 24 3773 7070
Ext: 4312
Source: EzSearch
-4%
-10%
-30%
0%
30%
Movement of Fertilizer Industry index and VNIndex
VNIndex Fertilizer Industry

www.fpts.com.vn Bloomberg – FPTS <GO> | 61
A. VIETNAM FERTILIZER INDUSTRY OVERVIEW
1. Vietnam Fertilizer Industry Value Chain
(…) In parentheses, Single nutrient fertilizers are inputs to product NPK fertilizers.
(*) Material Inputs of the DPM include: Amoniac (NH3), Axit phosphoric (H3PO4) and Kaliclorua (KCl)
2. Fertilizer industry characteristics
(1) In Vietnam, the Fertilizer industry only supplies NPK, Urea and Phosphate fertilizers
Currently, the domestic fertilizer industry only produces products such as NPK, Urea and Phosphate fertilizers.
Some products such as SA and Potassium fertilizer, etc, due to the limitation of potash sources (the main
material for producing potassium fertilizers) and sulfur sources, therefore domestic production has not able to
supply those products yet, must import from other countries.
(2) High number of enterprises in the industry and differentiated in scale
By the end of the 1H2018, total Fertilizer industry had 735 licensed fertilizer trading and manufacturing
enterprises with total capacity up to 29.5 million tons per year. In which, there are 10 large enterprises under
Vietnam National Chemical Group (Vinachem) and 2 enterprises under Vietnam Oil and Gas Group (PVN)
accounting for most of the annual domestic fertilizer quantity production. The rest are small and medium-sized
enterprises, mainly involved in NPK fertilizer segment.
(3) Similar quality in single nutrient fertilizer segment, strongly differentiated in NPK fertilizer segment
Single nutrient fertilizers including Urea, Phosphate - are fertilizers that can only be produced by chemical
methods from material inputs such as ore, coal or gas. So the process and technology production are
complicated and the investment cost is high. The leading enterprises of the Vinachem and PVN have met all
of the domestic demand with product quality that has no differences among manufacturers.
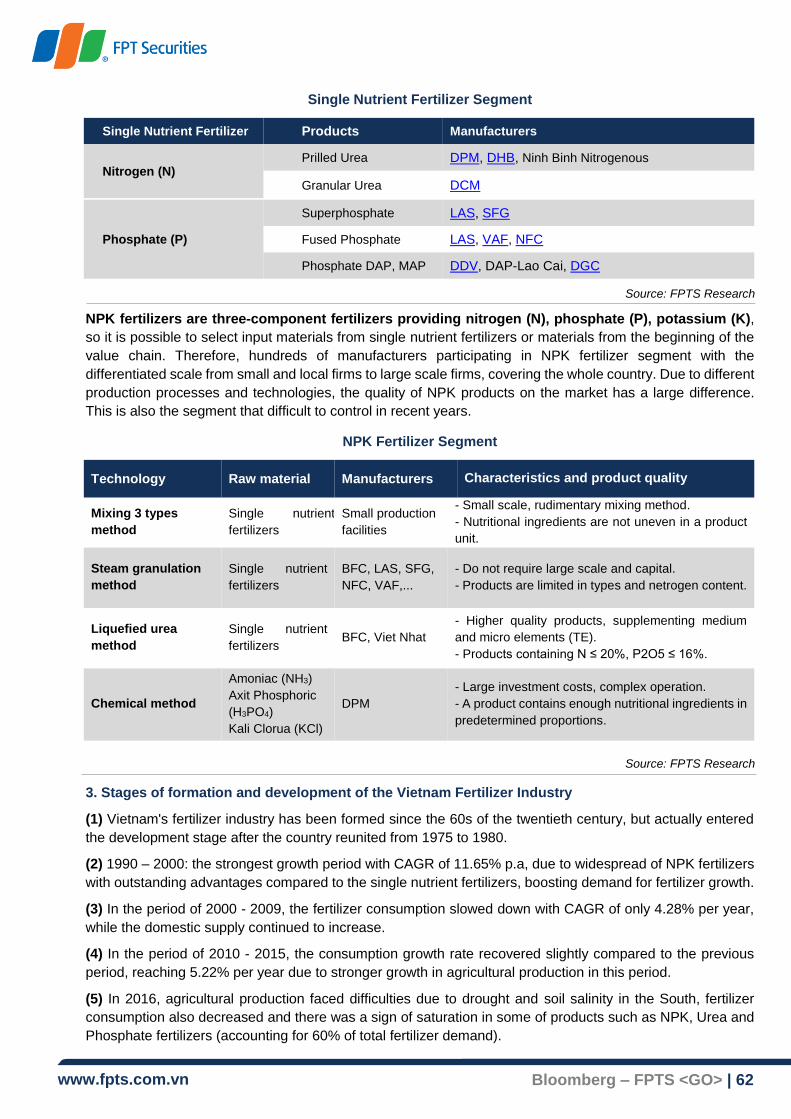
www.fpts.com.vn Bloomberg – FPTS <GO> | 62
Single Nutrient Fertilizer Segment
Single Nutrient Fertilizer Products Manufacturers
Nitrogen (N) Prilled Urea DPM, DHB, Ninh Binh Nitrogenous
Granular Urea DCM
Phosphate (P)
Superphosphate LAS, SFG
Fused Phosphate LAS, VAF, NFC
Phosphate DAP, MAP DDV, DAP-Lao Cai, DGC
Source: FPTS Research
NPK fertilizers are three-component fertilizers providing nitrogen (N), phosphate (P), potassium (K),
so it is possible to select input materials from single nutrient fertilizers or materials from the beginning of the
value chain. Therefore, hundreds of manufacturers participating in NPK fertilizer segment with the
differentiated scale from small and local firms to large scale firms, covering the whole country. Due to different
production processes and technologies, the quality of NPK products on the market has a large difference.
This is also the segment that difficult to control in recent years.
NPK Fertilizer Segment
Technology Raw material Manufacturers Characteristics and product quality
Mixing 3 types
method
Single nutrient
fertilizers
Small production
facilities
- Small scale, rudimentary mixing method.
- Nutritional ingredients are not uneven in a product
unit.
Steam granulation
method
Single nutrient
fertilizers
BFC, LAS, SFG,
NFC, VAF,...
- Do not require large scale and capital.
- Products are limited in types and netrogen content.
Liquefied urea
method
Single nutrient
fertilizers BFC, Viet Nhat
- Higher quality products, supplementing medium
and micro elements (TE).
- Products containing N ≤ 20%, P2O5 ≤ 16%.
Chemical method
Amoniac (NH3)
Axit Phosphoric
(H3PO4)
Kali Clorua (KCl)
DPM
- Large investment costs, complex operation.
- A product contains enough nutritional ingredients in
predetermined proportions.
Source: FPTS Research
3. Stages of formation and development of the Vietnam Fertilizer Industry
(1) Vietnam's fertilizer industry has been formed since the 60s of the twentieth century, but actually entered
the development stage after the country reunited from 1975 to 1980.
(2) 1990 – 2000: the strongest growth period with CAGR of 11.65% p.a, due to widespread of NPK fertilizers
with outstanding advantages compared to the single nutrient fertilizers, boosting demand for fertilizer growth.
(3) In the period of 2000 - 2009, the fertilizer consumption slowed down with CAGR of only 4.28% per year,
while the domestic supply continued to increase.
(4) In the period of 2010 - 2015, the consumption growth rate recovered slightly compared to the previous
period, reaching 5.22% per year due to stronger growth in agricultural production in this period.
(5) In 2016, agricultural production faced difficulties due to drought and soil salinity in the South, fertilizer
consumption also decreased and there was a sign of saturation in some of products such as NPK, Urea and
Phosphate fertilizers (accounting for 60% of total fertilizer demand).

www.fpts.com.vn Bloomberg – FPTS <GO> | 63
Source: MARD, Vinachem, FPTS Research
B. REVIEW 2018
Advantages: In 2017 - 2018, favorable weather and increasing cultivated area are advantage factors for the
fertilizer industry:
o Almost types of fertilizers production in the first 9 months 2018 increased compared to 2017, the strongest
increase was DAP when the self-defense tax policy came into effect, officially from 03/2018.
o Domestic fertilizer prices also increased significantly due to the impact of rising global fertilizer prices and
agricultural cyclical, especially from 10/2018.
Difficulties: Negative influences on fertilizer industry in 2018 such as:
o Prices of energy products such as oil, gas, coal increased, which pushed up the production cost of fertilizer
enterprises.
o In the opposite direction, prices of industrial crops such as coffee, pepper, rubber, etc, are low. Demand
for investment to take care of these crops decreases. However, with each type of fertilizers, the above
factors will have different impact on the inputs and outputs of each type.
Source: MoIT, GSO, FPTS Research
9.70%
11.65%
4.28%3.39%
0%
2%
4%
6%
8%
10%
12%
14%
0
2
4
6
8
10
12
Mill
ion
to
ns
Fertilizer consumption and annual growth rate
Fertilizer consumption CAGR (% per year)
30%
6%
-2%
2%
-5%
0%
5%
10%
15%
20%
25%
30%
35%
-300
0
300
600
900
1,200
1,500
1,800
2,100
2,400
DAP Phosphate Urea NPKfertilizer
Main fertilizers production in 9M2018(million tons)
9M2017 9M2018 % yoy
0
2
4
6
8
10
12
14
Domestic retail price of main fertilizers(Million VND/ton)
Phu My Urea Ca Mau Urea
Russia Kali DAP

www.fpts.com.vn Bloomberg – FPTS <GO> | 64
1. NPK fertilizers grows faster than industry average, high quality is growth motivation
NPK fertilizer is a late-appearing but most consumed fertilizer, accounting for nearly 40% of the total
domestic consumption due to its easy mixing, convenience to use and products containing enough nutrients.
In the period 2000 - 2015, NPK consumption increased rapidly and steadily, CAGR about 8% per year, higher
than the industry average growth rate. Besides, the supply also increased rapidly with CAGR about 10% per
year, quickly offset the demand.
In 2016, the negative impact of weather and natural disasters on agricultural production made fertilizer demand
decline and oversupply, especially NPK fertilizer, the excess supply of up to 120,000 tons.
In 2017 - 2018, NPK fertilizer demand has recovered at a slower rate than the previous period, estimated
CAGR about 4.6% per year.
Source: MARD, Agromonitor, FPTS Research
On the supply side, 2018 is a challenging year for manufacturers in the NPK segment. While demand
grew slowly, manufacturing enterprises continued to expand capacity, built factories, towards high quality NPK
segment such as DPM, BFC. Competition in this segment was very intense, local production facilities may
lose market share to large enterprises, good brand positioning and wide distribution channels in the future.
Besides, in 2018 the prices of inputs are increasing significantly from the end of 2017 until now, due to the
increase of world fertilizer prices and raw material prices. In intense competition market, NPK price cannot
increase accordingly. Therefore, the gross profit margin 9M2018 of most NPK enterprises decreased
compared to the same period in 2017. Typically, BFC had to buy out all of input single nutrient fertilizers from
other suppliers. The increase in input price will make the gross profit margin of BFC significantly decrease
compared to the previous year.
2. Urea grows slowly, tending to shift to compound fertilizers
Urea is the fertilizer with 2nd largest consumption after NPK fertilizer, accounting for about 22% of the
annual fertilizer consumption.
Urea is one of the earliest fertilizers since 1975, manufactured by Ha Bac Fertilizer Plant - the first fertilizer
plant in Vietnam. Over 30 years of development, the growth of nitrogen fertilizer demand has started to decline.
In the period of 2005 - 2015, demand growth rate CAGR was 2.5% per year and estimated to be only 1.4%
per year from 2016 to 2018 due to demand saturation and shifting trend to use NPK fertilizers.
0
500
1,000
1,500
2,000
2,500
3,000
3,500
4,000
4,500
NPK fertilizer supply and demand Growth(thousand tons)
Supply Demand

www.fpts.com.vn Bloomberg – FPTS <GO> | 65
(*) In 2010, Ha Bac Nitrogenous expanded capacity
Source: Agromonitor, Vinachem, FPTS Research
Currently, there are 4 nitrogen plants in Vietnam: Ha Bac and Ninh Binh Nitrogenous (using coal) in the
North, 2 plants in the South are DPM and DCM (using natural gas). Since 2012, the introduction of 2 nitrogen
plants has pushed the total nitrogen capacity of the whole country to 2.66 million tons per year, while the
annual demand is only about 2.4 - 2.5 million tons. Overcapacity has made nitrogen-coal factories
disadvantaged due to high production costs. These factories have cut production, operating only about 40%
of the plant's capacity. In 2017 - 2018, the sharp increase in global coal price made these factories more
difficult, had to close due to losses. Besides, the world crude oil price also increased strongly, nitrogen-natural
gas factories (DPM, DCM) were also negatively affected by the natural gas price being floating according to
the world oil price
In 2018, domestic urea price has increased significantly and increased strongly from 10/2018 to now,
this positive impacts in the short-term to the operating revenue of enterprises in the Q4 2018. However, the
price increasing is inevitable when the input materials price increase sharply. The fertilizer price from
beginning of the year increased more slowly than the price of raw materials, which made the profit of these
enterprises decrease compared to the same period in 2017.
3. Phosphate: Demand for super and fused phosphate is stable, DAP benefit from self-defense tax
For superphosphate and fused phosphate: the demand for these two fertilizers is quite stable, growing at
CAGR of 3.3% per year in the period 2000 - 2015, lower than NPK fertilizer growth rate. We believe that in
the coming time, the consumption of these two fertilizers will continue to be stable, the growth potential for
fused phosphate will be higher because this fertilizer is suitable for many types of soil, especially sour soil and
alum soil in the lowland plains.
For DAP fertilizer: DAP demand in recent years has
grown quite high from 400 thousand tons in 2005 to 1
million tons in 2015, corresponding to CAGR of 12%.
However, the country currently has only 2 DAP plants of
Vinachem, meeting 35% of domestic DAP demand, the
rest must be imported.
Although the growth potential for DAP is very high,
domestic producers still face intense competition by
imported products. Therefore, from March 2, 2018, the
Ministry of Industry and Trade officially applied the self-
defense tax on DAP and MAP products imported into
Vietnam with the tariff schedule to 2020. Domestic DAP
prices has increased sharply since the end of 2017 and
will continue this trend until Q1 2020.
Source: MoIT, FPTS Research
1,855,790
1,128,531 1,072,104
0
Tariff schedule for imported DAP, MAP(VND/tons)
19
/08
/20
17
07
/03
/20
18
07
/03
/20
19
07
/03
/20
20
180 180500 500
800
800 800
560
800
1975 2004 2010(*) 2012
Urea production capacity total industry(thousand tons per year)
Ha Bac DPM
Ninh Binh DCM
0
500
1,000
1,500
2,000
2,500
3,000
2005 … 2010 … 2015 2016 2017 2018F
Domestic Urea consumption 2005 - 2018(thousand tons)
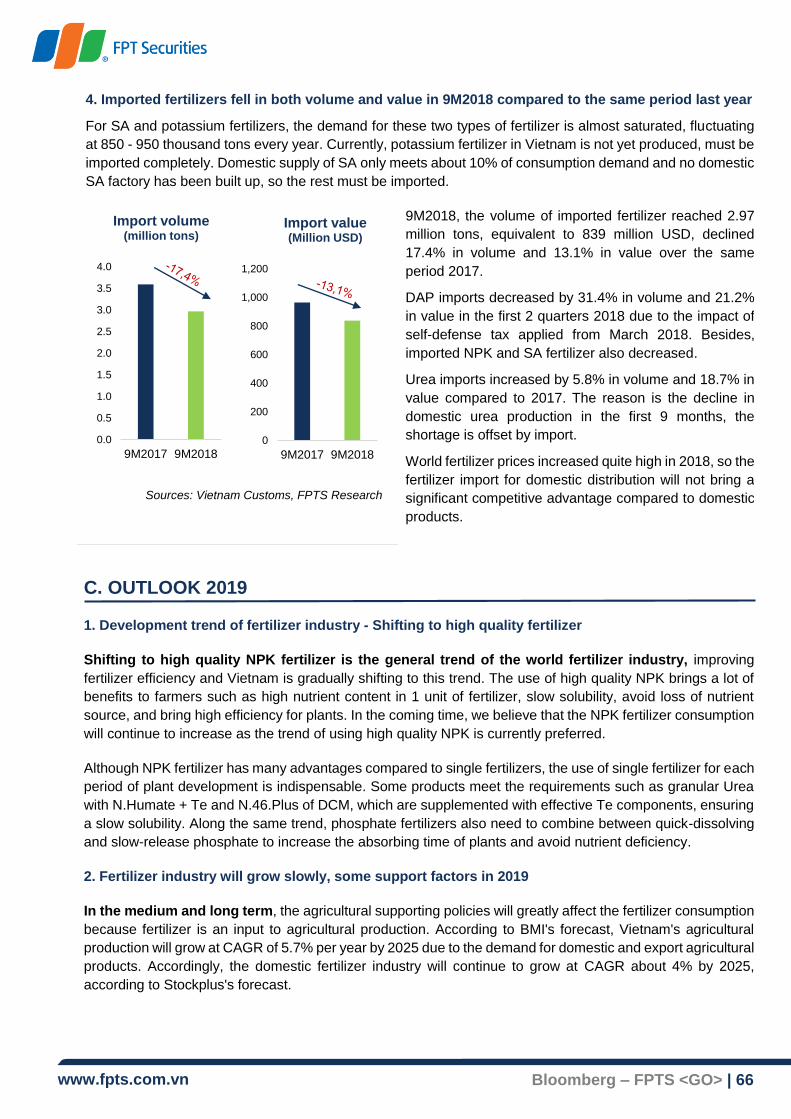
www.fpts.com.vn Bloomberg – FPTS <GO> | 66
4. Imported fertilizers fell in both volume and value in 9M2018 compared to the same period last year
For SA and potassium fertilizers, the demand for these two types of fertilizer is almost saturated, fluctuating
at 850 - 950 thousand tons every year. Currently, potassium fertilizer in Vietnam is not yet produced, must be
imported completely. Domestic supply of SA only meets about 10% of consumption demand and no domestic
SA factory has been built up, so the rest must be imported.
9M2018, the volume of imported fertilizer reached 2.97
million tons, equivalent to 839 million USD, declined
17.4% in volume and 13.1% in value over the same
period 2017.
DAP imports decreased by 31.4% in volume and 21.2%
in value in the first 2 quarters 2018 due to the impact of
self-defense tax applied from March 2018. Besides,
imported NPK and SA fertilizer also decreased.
Urea imports increased by 5.8% in volume and 18.7% in
value compared to 2017. The reason is the decline in
domestic urea production in the first 9 months, the
shortage is offset by import.
World fertilizer prices increased quite high in 2018, so the
fertilizer import for domestic distribution will not bring a
significant competitive advantage compared to domestic
products.
C. OUTLOOK 2019
1. Development trend of fertilizer industry - Shifting to high quality fertilizer
Shifting to high quality NPK fertilizer is the general trend of the world fertilizer industry, improving
fertilizer efficiency and Vietnam is gradually shifting to this trend. The use of high quality NPK brings a lot of
benefits to farmers such as high nutrient content in 1 unit of fertilizer, slow solubility, avoid loss of nutrient
source, and bring high efficiency for plants. In the coming time, we believe that the NPK fertilizer consumption
will continue to increase as the trend of using high quality NPK is currently preferred.
Although NPK fertilizer has many advantages compared to single fertilizers, the use of single fertilizer for each
period of plant development is indispensable. Some products meet the requirements such as granular Urea
with N.Humate + Te and N.46.Plus of DCM, which are supplemented with effective Te components, ensuring
a slow solubility. Along the same trend, phosphate fertilizers also need to combine between quick-dissolving
and slow-release phosphate to increase the absorbing time of plants and avoid nutrient deficiency.
2. Fertilizer industry will grow slowly, some support factors in 2019
In the medium and long term, the agricultural supporting policies will greatly affect the fertilizer consumption
because fertilizer is an input to agricultural production. According to BMI's forecast, Vietnam's agricultural
production will grow at CAGR of 5.7% per year by 2025 due to the demand for domestic and export agricultural
products. Accordingly, the domestic fertilizer industry will continue to grow at CAGR about 4% by 2025,
according to Stockplus's forecast.
0.0
0.5
1.0
1.5
2.0
2.5
3.0
3.5
4.0
9M2017 9M2018
Import volume(million tons)
0
200
400
600
800
1,000
1,200
9M2017 9M2018
Import value(Million USD)
Sources: Vietnam Customs, FPTS Research

www.fpts.com.vn Bloomberg – FPTS <GO> | 67
In short term, the fertilizer demand is expected to not increase in the first half of 2019
(1) The first half of 2019 weather is forecasted to be complicated
El Nino is forecast to maintain in the last months of 2018 and the first half of 2019 with the probability of about
70 - 80%. It is forecasted that in the first half of 2019, the weather will be erratic, the average temperature will
increase, the rainfall will be low and may appear cold, affecting agricultural cultivation in the Winter-Spring
crop 2018 - 2019.
(2) Agricultural product prices are forecasted to
increase slightly in 2019
In the second half of 2018, prices of agricultural products
have gradually fallen to the bottom of 2016. According to
the World Bank's forecast, the downward trend of these
products will continue until the end of 2018 and forecast to
increase by 2 % in 2019 due to the increase in energy costs
and input fertilizers.
The above factors may adversely affect domestic
agricultural production in the first half of 2019, especially
industrial crops such as rubber, coffee, pepper, etc. That
may make fertilizer consumption demand do not grow in
short term.
Gross profit margin of enterprises in the industry will stabilize after strong fluctuations in 2018.
(3) Prices of crude oil and coal are forecasted to decrease slightly in 2019, which will help reduce input
costs for fertilizer enterprises
Source: World Bank, OECD, EIA, Bloomberg
In 2018, brent oil price averaged over $73/barrel. According to some organizations such as World Bank,
OECD or EIA, brent oil price in 2019 will be stable at $72/barrel. Coal price is also expected to decrease
significantly compared to 2018, in particular, Australian hard coal price decreases from $197.3/ton to
$179.7/ton, thermal coal decreases from $109.5/ton to $104/ton in 2019. After strong fluctuations in 2018, the
energy price dropped slightly in 2019 will help netrogenous enterprises improve their gross profit margin over
the same period when natural gas and coal costs account for nearly 70% of the total cost of production.
74
70
72
30
40
50
60
70
80
2015 2016 2017 2018F 2019F
Brent oil price forecast(USD/barrel)
World Bank OECD EIA
114 110 104 96 93
187197
180165 159
50
100
150
200
250
08/2018 2018F 2019F 2020F 2021F
Coal price forcast(USD/ton)
Thermal coal - Australia Hard coal - Australia
40
60
80
100
120
140
160
Jan
-13
Jan
-14
Jan
-15
Jan
-16
Jan
-17
Jan
-18
Grains
Oils and meals
Other crops
Agriculture product prices(USD/tons)
Sources: World Bank, CMO Oct2018

www.fpts.com.vn Bloomberg – FPTS <GO> | 68
(4) The world fertilizer price is forecasted to grow about 2% in 2019
Currently, world fertilizer prices have risen quite high in 2018. According to the World Bank's forecast, this
price will continue to increase by about 2% in 2019 due to rising energy and input prices. Domestic fertilizer
prices are influenced by world fertilizer prices with a lag, also increased strongly from the end of 2018.
Forecast, domestic fertilizer prices will continue to increase slightly in 2019.
When the price of raw materials is more stable in 2019, the increase in output price will help to improve the
gross profit margin of manufacturing enterprises from the beginning of the value chain. For NPK complex
segment, the increase in single fertilizer price will make gross profit margin of NPK businesses decrease
slightly because NPK price increases more slowly when competition of this segment is very intense.
(5) The Government support policies: VAT and self-defense tax policy
VAT policy for fertilizer products
The amendment of the Value Added Tax Law No.13/2008/QH12, the new tax rate will be applied to fertilizer
products of 6%, instead of not taxable under the amended law No.71/2014/QH13. The amendment of this tax
law will have a positive impact on the business results of most fertilizer producers from the beginning of the
value chain. Specifically, these enterprises will be deducted from the input VAT instead of adding to production
cost as before. However, currently there is no official decision passed by the National Assembly, we expect
that the amended Law will be officially applied from 2019.
Self-defense tax policy for DAP and MAP fertilizers
The self-defense tax on DAP and MAP will help DAP, MAP enterprises take their competitive advantages in
2019 before the tax rate is 0% from March 7, 2020.

www.fpts.com.vn Bloomberg – FPTS <GO> | 69
PHAM QUANG THANH
Email: [email protected]
Tel: (+84) 24 3773 7070
Ext: 4304
Source: EzSearch
-4%
-8%
-30%
0%
30%
Movement of Beer Industry index and VNIndex
VNIndex Beer Industry
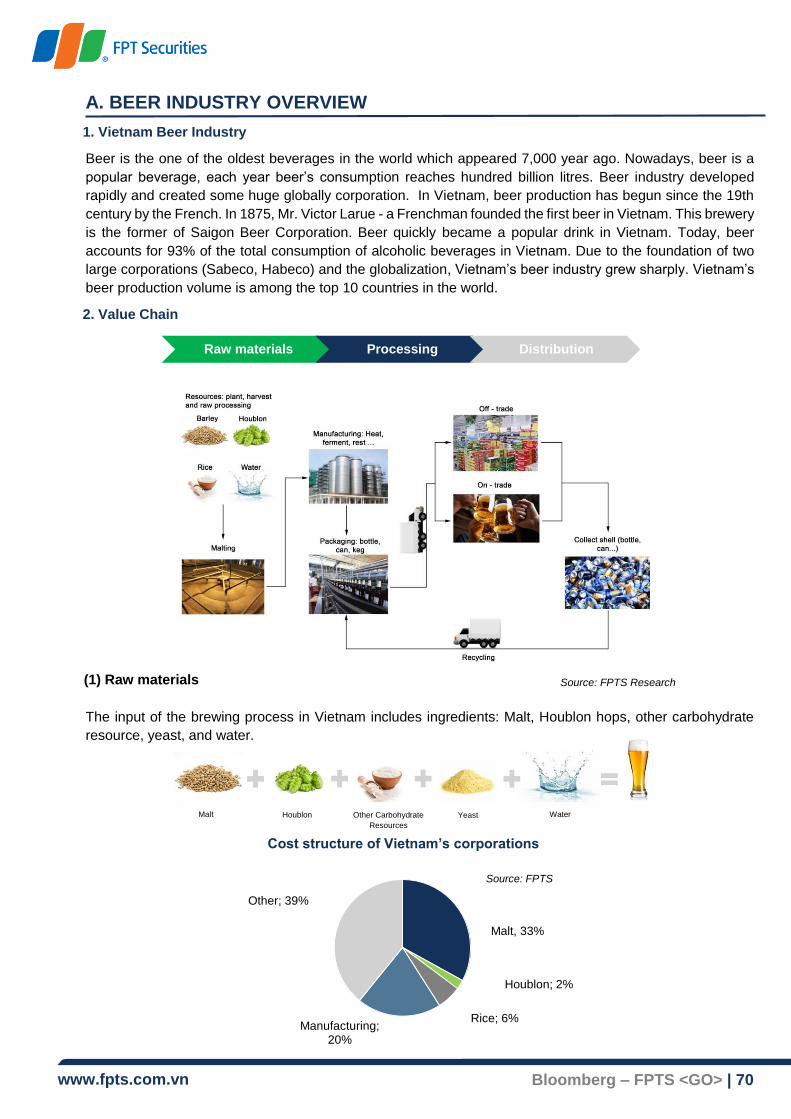
www.fpts.com.vn Bloomberg – FPTS <GO> | 70
Other Carbohydrate
Resources
A. BEER INDUSTRY OVERVIEW
1. Vietnam Beer Industry
Beer is the one of the oldest beverages in the world which appeared 7,000 year ago. Nowadays, beer is a
popular beverage, each year beer’s consumption reaches hundred billion litres. Beer industry developed
rapidly and created some huge globally corporation. In Vietnam, beer production has begun since the 19th
century by the French. In 1875, Mr. Victor Larue - a Frenchman founded the first beer in Vietnam. This brewery
is the former of Saigon Beer Corporation. Beer quickly became a popular drink in Vietnam. Today, beer
accounts for 93% of the total consumption of alcoholic beverages in Vietnam. Due to the foundation of two
large corporations (Sabeco, Habeco) and the globalization, Vietnam’s beer industry grew sharply. Vietnam’s
beer production volume is among the top 10 countries in the world.
2. Value Chain
(1) Raw materials
The input of the brewing process in Vietnam includes ingredients: Malt, Houblon hops, other carbohydrate
resource, yeast, and water.
Cost structure of Vietnam’s corporations
Source: FPTS Research
Raw materials Processing Distribution
Malt, 33%
Houblon; 2%
Rice; 6%Manufacturing;
20%
Other; 39%
Source: FPTS
Malt Houblon Yeast Water

www.fpts.com.vn Bloomberg – FPTS <GO> | 71
Malt: is the primary ingredient used in beer manufacturing process. Malt used in Vietnam is made from two
row barleys (2R). Because the Vietnam’s climate isn’t suitable for barley planting, malt is mainly imported. Malt
suppliers for Vietnam’s beer market are mostly from Australia and Europe.
Houblon hop: Houblon hops are used to increase foaming ability and create bitter favor of beer. Houblon hops
grow well in Central Europe and North America, hops grown in Slovakia and Czech regions are the best quality.
This material is also not available in Vietnam, the source comes entirely from imports.
Source: UNcomtrade
Yeast (Saccharomyces): Yeast is essential ingredient in beer making process. There are two kinds of yeasts:
ale (ale beer) and lager (lager beer). In Vietnam, most firms use lager in manufacturing beer.
Alternative materials: are other carbohydrate resources besides malt. Its functions are lowering production
cost, and creating signature favor of beer. Cereals such as rice, wheat, corn, sweet potatoes and cassava
could be used as alternative materials. In Vietnam, most firms use rice or corn due to their common.
Water: 90% of beer is water. Water is used to support chemical and biological reactions occur. In Vietnam,
most beer manufacturers have a water treatment system.
Evaluation: Malt and Houblon hops are materials which depend strongly on imports. The source is not
available in Vietnam, so the beer industry is heavily influenced by material price movements. Moreover,
shipping cost is also a factor that pushes the cost of domestic beer brewers.
(2) Processing
The brewing process includes grinding stages, heating, boiling, fermentation, brewing, sterilizing and
packaging. Each stage has absolute mandatory conditions and non – mandatory conditions which can change
within an allowable range. Changing these conditions affects the taste and quality of beer thus creating
differentiation in products of the manufacturers.
Germany66%
Slovenia25%
Cezch7%
Other2%
Houblon supply resources for Vietnam's beer production
Australia33%
France18%
China12%
Belgium11%
Germany11%
Other15%
Malt supply resources for Vietnam's beer production
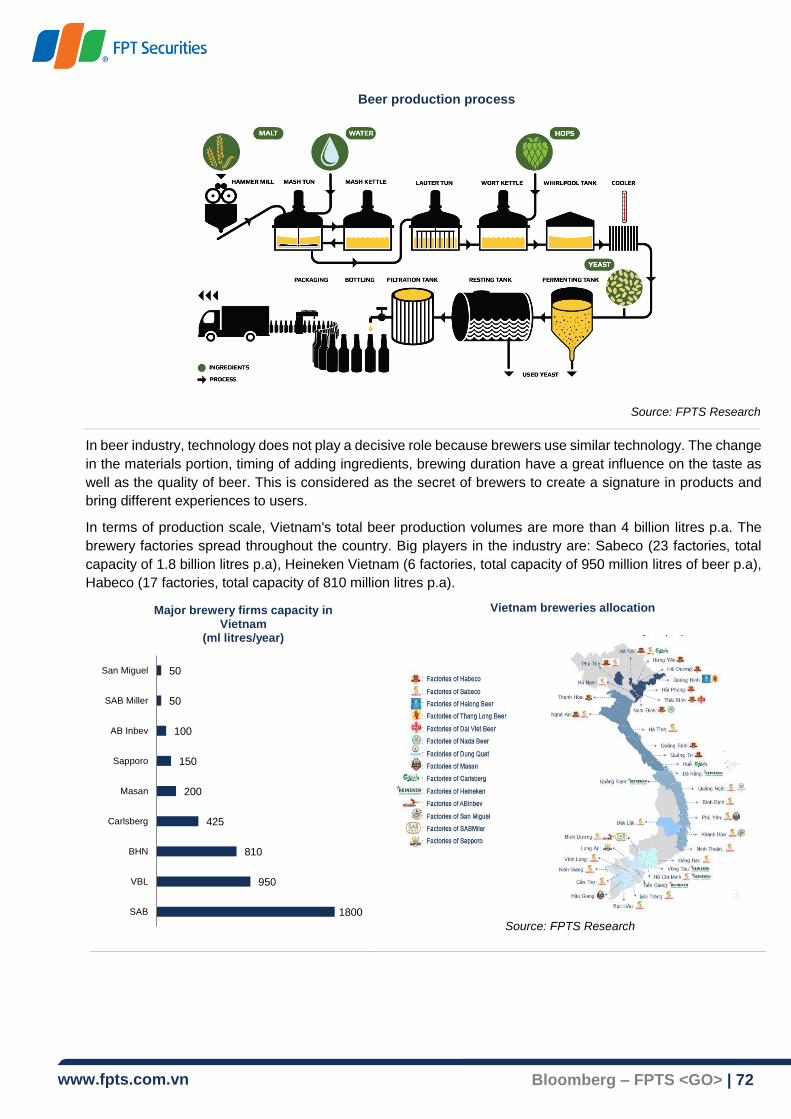
www.fpts.com.vn Bloomberg – FPTS <GO> | 72
Beer production process
Source: FPTS Research
In beer industry, technology does not play a decisive role because brewers use similar technology. The change
in the materials portion, timing of adding ingredients, brewing duration have a great influence on the taste as
well as the quality of beer. This is considered as the secret of brewers to create a signature in products and
bring different experiences to users.
In terms of production scale, Vietnam's total beer production volumes are more than 4 billion litres p.a. The
brewery factories spread throughout the country. Big players in the industry are: Sabeco (23 factories, total
capacity of 1.8 billion litres p.a), Heineken Vietnam (6 factories, total capacity of 950 million litres of beer p.a),
Habeco (17 factories, total capacity of 810 million litres p.a).
Vietnam breweries allocation
Source: FPTS Research
1800
950
810
425
200
150
100
50
50
SAB
VBL
BHN
Carlsberg
Masan
Sapporo
AB Inbev
SAB Miller
San Miguel
Major brewery firms capacity in Vietnam
(ml litres/year)

www.fpts.com.vn Bloomberg – FPTS <GO> | 73
(3) Products and distribution
Based on quality and price, beer would be divided into 3 product segments:
Premium products have high price, high quality, sold to high-income users. The popular brands in this
segment are Heineken, Truc Bach, Saigon Gold, etc. The premium segment accounts for about 10% of
total market consumption.
Mid-price products sold at an average price, with average quality towards most users in Vietnam.
Common brands in this segment are Bia Saigon Lager, Saigon Export, 333, Bia Ha Noi, etc. This segment
contributes roughly 60% in market share.
Economic products have a low price and quality, mainly targeted towards low–income consumers. “Bia
hoi”, which is often home–brewed, is an affordable beer in suburban and rural areas. The economy segment
accounts for about 30% of total consumption.
Based on method of sales, beer produced in Vietnam is mainly consumed domestically and distributed through
2 channels:
On–trade channel: is a form of consumption that
buyers consume products directly at the place of
purchase, usually a restaurant.
Off–trade channel: is a form of consumption that
buyers consume products at another location
beside purchase places, such as: buying at
supermarkets, grocery stores and consuming at
home, or at leisure places, etc.
On-trade and Off-trade consumption
3. Vietnam beer characteristics
(1) Large scale and rapid growth market
Top 10 countries with the largest market size in 2017
2017 2016 2007
2017 Rank
2016 Rank
2007 Rank
Country Volume (bil
litres) Global
market share %yoy
10 year CAGR
Volume (bil
litres) %yoy
Volume (bil litres)
1 1 1 China 39.8 20.8% -3.9% 0.2% 41.4 -3.7% 38.9
2 2 2 United State
21.8 11.4% -2.6% -0.7% 22.4 -0.3% 23.3
3 3 6 Brazil 14.0 7.3% 5.0% 3.0% 13.3 -3.8% 10.4
4 4 4 Mexico 11.0 5.8% 4.8% 0.4% 10.5 8.1% 10.6
5 5 5 Germany 9.3 4.9% -2.0% -1.1% 9.5 -0.7% 10.4
6 6 3 Russia 7.4 3.9% -4.9% -4.2% 7.8 -0.3% 11.5
7 7 7 Japan 5.2 2.7% -2.1% -1.8% 5.4 -1.9% 6.3
8 8 8 United Kingdom
4.4 2.3% 0.7% -1.5% 4.4 -0.9% 5.1
9 9 9 Poland 4.1 2.1% -2.1% 1.3% 4.1 1.1% 3.6
10 10 25 Vietnam 4.0 2.1% 5.7% 8.3% 3.8 9.3% 1.8
Source: MoIT, Kirin Holding
Off -trade30%
On -trade70%
Source: Euromonitor International
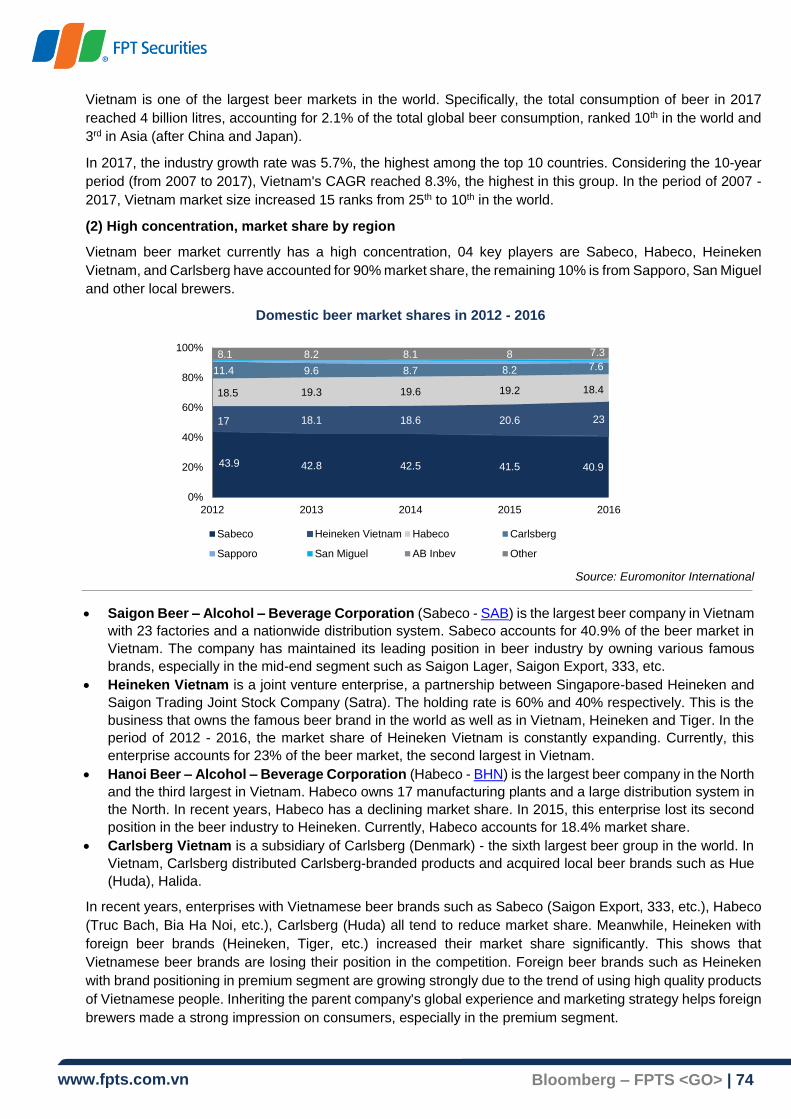
www.fpts.com.vn Bloomberg – FPTS <GO> | 74
Vietnam is one of the largest beer markets in the world. Specifically, the total consumption of beer in 2017
reached 4 billion litres, accounting for 2.1% of the total global beer consumption, ranked 10th in the world and
3rd in Asia (after China and Japan).
In 2017, the industry growth rate was 5.7%, the highest among the top 10 countries. Considering the 10-year
period (from 2007 to 2017), Vietnam's CAGR reached 8.3%, the highest in this group. In the period of 2007 -
2017, Vietnam market size increased 15 ranks from 25th to 10th in the world.
(2) High concentration, market share by region
Vietnam beer market currently has a high concentration, 04 key players are Sabeco, Habeco, Heineken
Vietnam, and Carlsberg have accounted for 90% market share, the remaining 10% is from Sapporo, San Miguel
and other local brewers.
Domestic beer market shares in 2012 - 2016
Source: Euromonitor International
Saigon Beer – Alcohol – Beverage Corporation (Sabeco - SAB) is the largest beer company in Vietnam
with 23 factories and a nationwide distribution system. Sabeco accounts for 40.9% of the beer market in
Vietnam. The company has maintained its leading position in beer industry by owning various famous
brands, especially in the mid-end segment such as Saigon Lager, Saigon Export, 333, etc.
Heineken Vietnam is a joint venture enterprise, a partnership between Singapore-based Heineken and
Saigon Trading Joint Stock Company (Satra). The holding rate is 60% and 40% respectively. This is the
business that owns the famous beer brand in the world as well as in Vietnam, Heineken and Tiger. In the
period of 2012 - 2016, the market share of Heineken Vietnam is constantly expanding. Currently, this
enterprise accounts for 23% of the beer market, the second largest in Vietnam.
Hanoi Beer – Alcohol – Beverage Corporation (Habeco - BHN) is the largest beer company in the North
and the third largest in Vietnam. Habeco owns 17 manufacturing plants and a large distribution system in
the North. In recent years, Habeco has a declining market share. In 2015, this enterprise lost its second
position in the beer industry to Heineken. Currently, Habeco accounts for 18.4% market share.
Carlsberg Vietnam is a subsidiary of Carlsberg (Denmark) - the sixth largest beer group in the world. In
Vietnam, Carlsberg distributed Carlsberg-branded products and acquired local beer brands such as Hue
(Huda), Halida.
In recent years, enterprises with Vietnamese beer brands such as Sabeco (Saigon Export, 333, etc.), Habeco
(Truc Bach, Bia Ha Noi, etc.), Carlsberg (Huda) all tend to reduce market share. Meanwhile, Heineken with
foreign beer brands (Heineken, Tiger, etc.) increased their market share significantly. This shows that
Vietnamese beer brands are losing their position in the competition. Foreign beer brands such as Heineken
with brand positioning in premium segment are growing strongly due to the trend of using high quality products
of Vietnamese people. Inheriting the parent company's global experience and marketing strategy helps foreign
brewers made a strong impression on consumers, especially in the premium segment.
43.9 42.8 42.5 41.5 40.9
17 18.1 18.6 20.6 23
18.5 19.3 19.6 19.2 18.4
11.4 9.6 8.7 8.2 7.68.1 8.2 8.1 8 7.3
0%
20%
40%
60%
80%
100%
2012 2013 2014 2015 2016
Sabeco Heineken Vietnam Habeco Carlsberg
Sapporo San Miguel AB Inbev Other
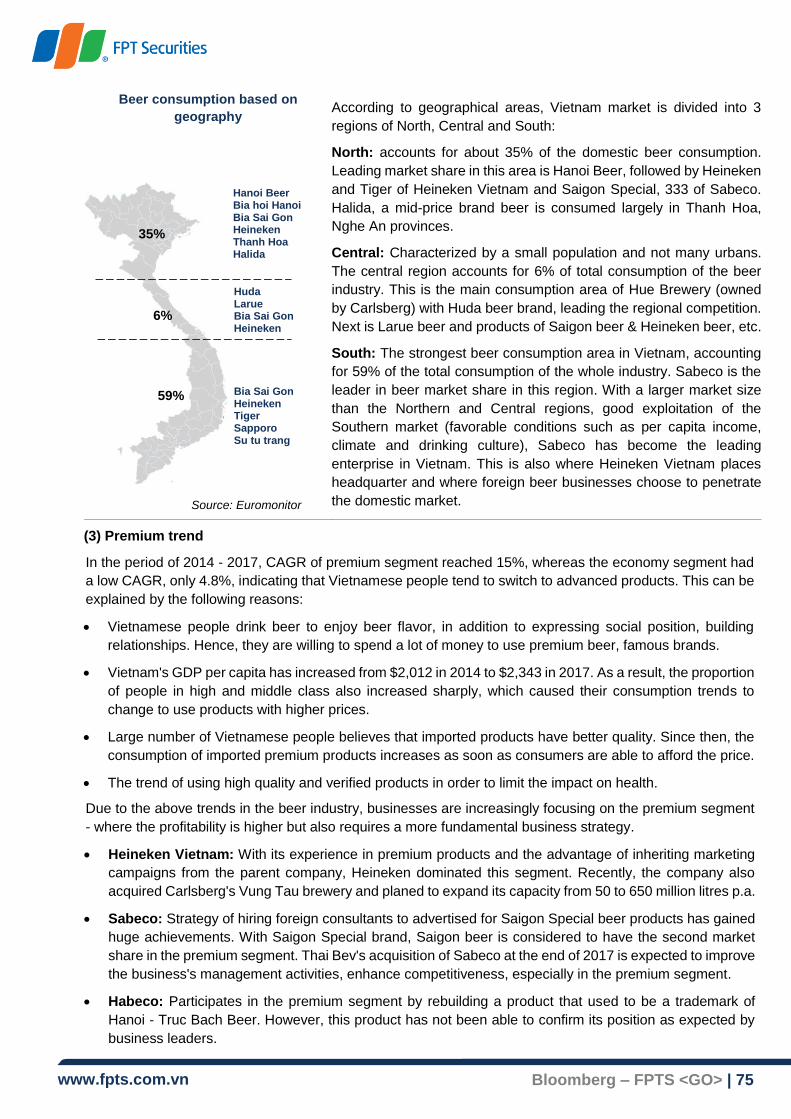
www.fpts.com.vn Bloomberg – FPTS <GO> | 75
Beer consumption based on
geography
According to geographical areas, Vietnam market is divided into 3
regions of North, Central and South:
North: accounts for about 35% of the domestic beer consumption.
Leading market share in this area is Hanoi Beer, followed by Heineken
and Tiger of Heineken Vietnam and Saigon Special, 333 of Sabeco.
Halida, a mid-price brand beer is consumed largely in Thanh Hoa,
Nghe An provinces.
Central: Characterized by a small population and not many urbans.
The central region accounts for 6% of total consumption of the beer
industry. This is the main consumption area of Hue Brewery (owned
by Carlsberg) with Huda beer brand, leading the regional competition.
Next is Larue beer and products of Saigon beer & Heineken beer, etc.
South: The strongest beer consumption area in Vietnam, accounting
for 59% of the total consumption of the whole industry. Sabeco is the
leader in beer market share in this region. With a larger market size
than the Northern and Central regions, good exploitation of the
Southern market (favorable conditions such as per capita income,
climate and drinking culture), Sabeco has become the leading
enterprise in Vietnam. This is also where Heineken Vietnam places
headquarter and where foreign beer businesses choose to penetrate
the domestic market.
(3) Premium trend
In the period of 2014 - 2017, CAGR of premium segment reached 15%, whereas the economy segment had
a low CAGR, only 4.8%, indicating that Vietnamese people tend to switch to advanced products. This can be
explained by the following reasons:
Vietnamese people drink beer to enjoy beer flavor, in addition to expressing social position, building
relationships. Hence, they are willing to spend a lot of money to use premium beer, famous brands.
Vietnam's GDP per capita has increased from $2,012 in 2014 to $2,343 in 2017. As a result, the proportion
of people in high and middle class also increased sharply, which caused their consumption trends to
change to use products with higher prices.
Large number of Vietnamese people believes that imported products have better quality. Since then, the
consumption of imported premium products increases as soon as consumers are able to afford the price.
The trend of using high quality and verified products in order to limit the impact on health.
Due to the above trends in the beer industry, businesses are increasingly focusing on the premium segment
- where the profitability is higher but also requires a more fundamental business strategy.
Heineken Vietnam: With its experience in premium products and the advantage of inheriting marketing
campaigns from the parent company, Heineken dominated this segment. Recently, the company also
acquired Carlsberg's Vung Tau brewery and planed to expand its capacity from 50 to 650 million litres p.a.
Sabeco: Strategy of hiring foreign consultants to advertised for Saigon Special beer products has gained
huge achievements. With Saigon Special brand, Saigon beer is considered to have the second market
share in the premium segment. Thai Bev's acquisition of Sabeco at the end of 2017 is expected to improve
the business's management activities, enhance competitiveness, especially in the premium segment.
Habeco: Participates in the premium segment by rebuilding a product that used to be a trademark of
Hanoi - Truc Bach Beer. However, this product has not been able to confirm its position as expected by
business leaders.
35%
6%
59%
Hanoi Beer Bia hoi Hanoi Bia Sai Gon Heineken Thanh Hoa Halida
Huda Larue Bia Sai Gon Heineken
Bia Sai Gon Heineken Tiger Sapporo Su tu trang
Source: Euromonitor
International

www.fpts.com.vn Bloomberg – FPTS <GO> | 76
B. REVIEW 2018
1. Beer industry increased by 5.7% in total volume, reached 4.2 billion litres
In 2018, Vietnam's beer industry has about 110 manufacturing enterprises, widely distributed in regions with
an estimated production output of 4.3 billion litres of beer, estimated consumption volume of 4.2 billion litres.
Thus, it is likely that Vietnam will surpass Poland to become the world's 9th largest beer market.
Consumption growth is estimated at 5.7%, equivalent to the growth rate in 2017. Vietnam continues to be the
fastest growing market among the 10 countries with the largest market size.
Vietnam’s total beer consumption volume 2007 - 2018
Source: MoIT, Euromonitor International
The growth of the beer industry is showing signs of slowing down, the last 3 years of the growth rate are all
lower than those of the previous periods. Specifically, in the period of 2007 - 2011 CAGR reached 9.7%, the
period from 2012 to 2015 CAGR was 7.3%, while the period from 2016 to 2018 was only 6.8%. However, the
trend of declining growth rate is also weakening, the growth rate of 2018 is equivalent to the growth rate in
2017. This shows that the market has undergone a rapid growth period and the beer industry growth is
gradually more stable.
2. The profit margin of the industry decreased due to increasing material costs
Business results for the first 9M2018 of beer companies showed a decline in profit margin. Specifically,
Sabeco's accumulated 3Q2018 business results recorded a gross profit margin of 23%, net profit margin of
14%; these two indicators in the same period in 2017 were 27% and 16% respectively. Habeco's accumulated
results in the first 3Q2018 recorded gross profit margin of 25%, profit after tax margin of 8%; These two
indicators in the same period in 2017 were 27% and 9% respectively.
Increasing input costs mainly cause the profit margin of beer industry declined in 2018. Specifically, the average
barley grain price in the 9M2018 is $127/ton (+30% yoy). The average rice price in the 9M2018 reached
$424/ton (+6% yoy). Special consumption tax increased from 60% to 65% in 2018, this tax burden was not
transferred to end users, which also contributed to reduce the profitability of enterprises in the industry.
1.8 1.85
2.22.41
2.612.82
3.03 3.143.46
3.794.01
4.22
0%
2%
4%
6%
8%
10%
12%
0
0.5
1
1.5
2
2.5
3
3.5
4
4.5
2007 2008 2009 2010 2011 2012 2013 2014 2015 2016 2017 2018E
Volume Growth
CAGR +9.7%
CAGR +7.3%CAGR +6.8%
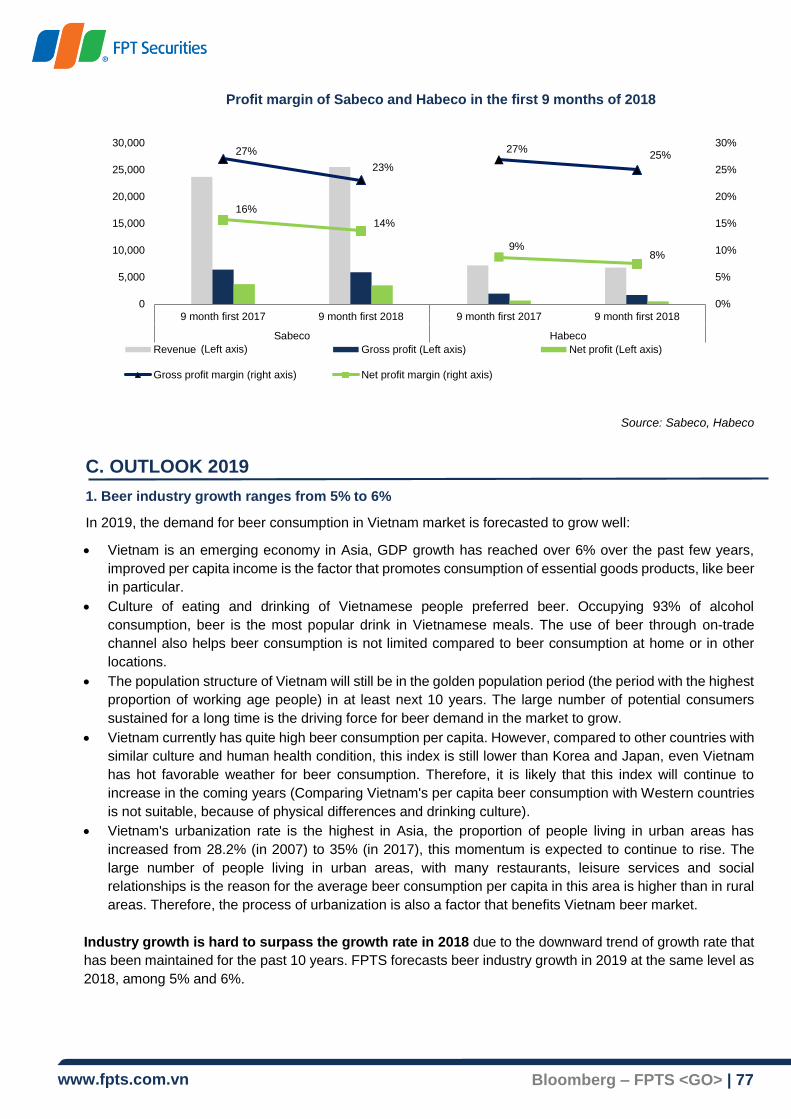
www.fpts.com.vn Bloomberg – FPTS <GO> | 77
Profit margin of Sabeco and Habeco in the first 9 months of 2018
Source: Sabeco, Habeco
C. OUTLOOK 2019
1. Beer industry growth ranges from 5% to 6%
In 2019, the demand for beer consumption in Vietnam market is forecasted to grow well:
Vietnam is an emerging economy in Asia, GDP growth has reached over 6% over the past few years,
improved per capita income is the factor that promotes consumption of essential goods products, like beer
in particular.
Culture of eating and drinking of Vietnamese people preferred beer. Occupying 93% of alcohol
consumption, beer is the most popular drink in Vietnamese meals. The use of beer through on-trade
channel also helps beer consumption is not limited compared to beer consumption at home or in other
locations.
The population structure of Vietnam will still be in the golden population period (the period with the highest
proportion of working age people) in at least next 10 years. The large number of potential consumers
sustained for a long time is the driving force for beer demand in the market to grow.
Vietnam currently has quite high beer consumption per capita. However, compared to other countries with
similar culture and human health condition, this index is still lower than Korea and Japan, even Vietnam
has hot favorable weather for beer consumption. Therefore, it is likely that this index will continue to
increase in the coming years (Comparing Vietnam's per capita beer consumption with Western countries
is not suitable, because of physical differences and drinking culture).
Vietnam's urbanization rate is the highest in Asia, the proportion of people living in urban areas has
increased from 28.2% (in 2007) to 35% (in 2017), this momentum is expected to continue to rise. The
large number of people living in urban areas, with many restaurants, leisure services and social
relationships is the reason for the average beer consumption per capita in this area is higher than in rural
areas. Therefore, the process of urbanization is also a factor that benefits Vietnam beer market.
Industry growth is hard to surpass the growth rate in 2018 due to the downward trend of growth rate that
has been maintained for the past 10 years. FPTS forecasts beer industry growth in 2019 at the same level as
2018, among 5% and 6%.
27%
23%
27%25%
16%
14%
9%8%
0%
5%
10%
15%
20%
25%
30%
0
5,000
10,000
15,000
20,000
25,000
30,000
9 month first 2017 9 month first 2018 9 month first 2017 9 month first 2018
Sabeco Habeco
Revenue (Lefr axis) Gross profit (Left axis) Net profit (Left axis)
Gross profit margin (right axis) Net profit margin (right axis)
(Left axis)
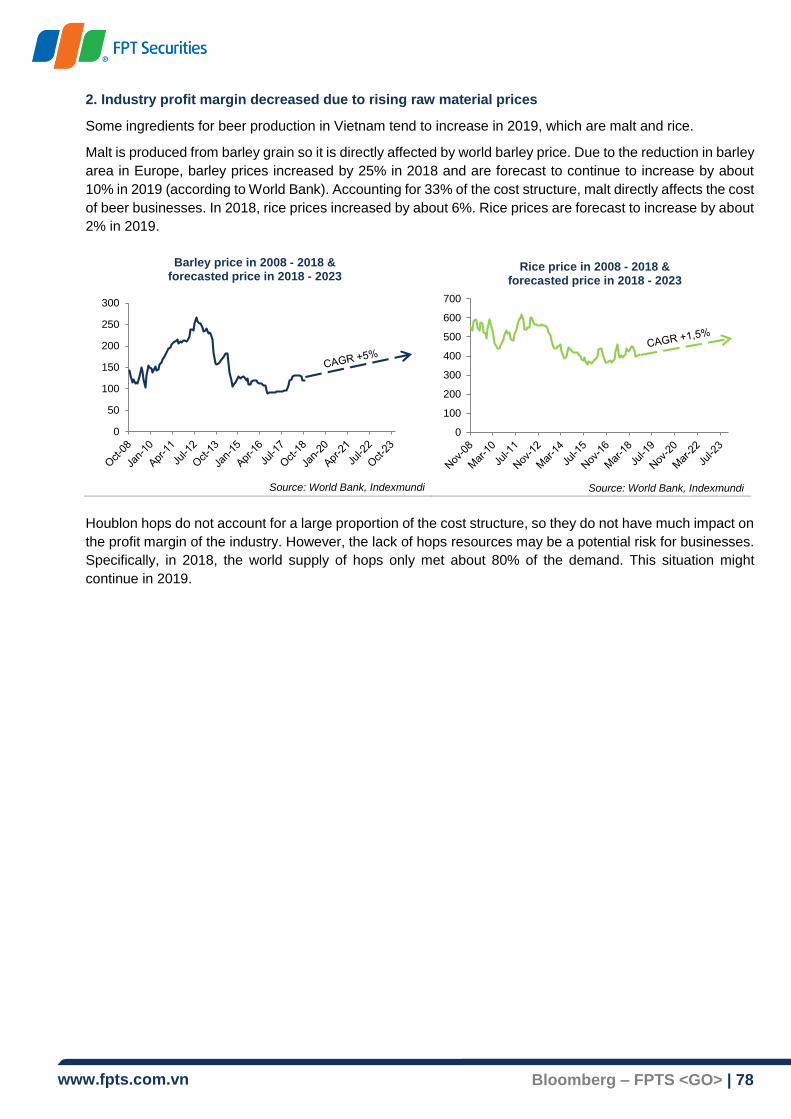
www.fpts.com.vn Bloomberg – FPTS <GO> | 78
2. Industry profit margin decreased due to rising raw material prices
Some ingredients for beer production in Vietnam tend to increase in 2019, which are malt and rice.
Malt is produced from barley grain so it is directly affected by world barley price. Due to the reduction in barley
area in Europe, barley prices increased by 25% in 2018 and are forecast to continue to increase by about
10% in 2019 (according to World Bank). Accounting for 33% of the cost structure, malt directly affects the cost
of beer businesses. In 2018, rice prices increased by about 6%. Rice prices are forecast to increase by about
2% in 2019.
Source: World Bank, Indexmundi
Source: World Bank, Indexmundi
Houblon hops do not account for a large proportion of the cost structure, so they do not have much impact on
the profit margin of the industry. However, the lack of hops resources may be a potential risk for businesses.
Specifically, in 2018, the world supply of hops only met about 80% of the demand. This situation might
continue in 2019.
0
50
100
150
200
250
300
Barley price in 2008 - 2018 &forecasted price in 2018 - 2023
0
100
200
300
400
500
600
700
Rice price in 2008 - 2018 & forecasted price in 2018 - 2023
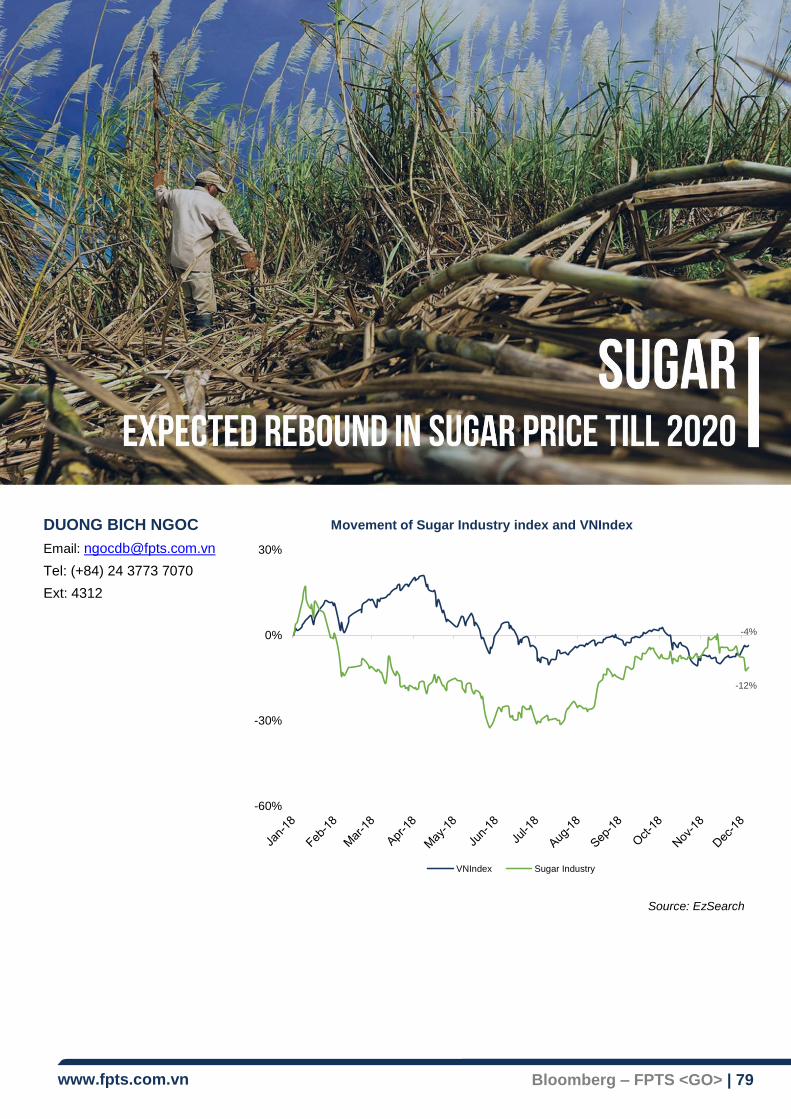
www.fpts.com.vn Bloomberg – FPTS <GO> | 79
DUONG BICH NGOC
Email: [email protected]
Tel: (+84) 24 3773 7070
Ext: 4312
Source: EzSearch
-4%
-12%
-60%
-30%
0%
30%
Movement of Sugar Industry index and VNIndex
VNIndex Sugar Industry

www.fpts.com.vn Bloomberg – FPTS <GO> | 80
A. VIETNAM SUGAR INDUSTRY OVERVIEW
Sugar is one of basic and essential commodities, used directly in daily life and as an input for food & beverage
industry, which contributes 15% to Vietnam's GDP 2017. Sugarcane and imported raw sugar are the inputs
of sugar production. Sugarcane is supplied from mills’ planting areas and purchased from farmers. Sugarcane
accounts for more than 90% of the input proportion in extracting sugar. Sugar production from sugarcane
includes following steps: purchasing sugarcane, crushing sugarcane, centrifuging cane to sugar and other
sub-products. Purchase price of sugarcane accounts for about 70% of the sugar production cost.
Raw sugar is imported by sugar mills and food processors every year and can be used for year-round refining
sugar. In 2018, raw sugar import volume were around 144,000 tons of sugar (10% of production), mainly
imported according to WTO quota and sugar from SBT's mill in Attapue (Laos).
(1) Natural and weather conditions affect sugarcane quality
Sugarcane crushing period usually lasts for 4 - 5 months. Mills start crushing cane from December to May of
the following year. The sugarcane planting area of Vietnam reached nearly 250,000 ha (2017/18), of which,
mainly concentrated in the Central Coast and Central Highlands (48%). Natural and weather conditions have
a great influence on sugarcane quality such as cane’s yield and sugar content level.
Cane production in Vietnam (crop year 2017/18)
Planted
area (ha) Yield
(tons/ha)
Cane production
(tons)
Sweetness (CCS)
Note
North & Northern Central
67,350 56 3,902,395 9.79 ► Favorable natural conditions bring high level of sugar content in cane (sweetness)
Central Coast – Central Highlands
119,060 60 5,779,913 9.10
► The largest sugarcane plantation area in country, average yield and average sugar content due to unfavorable weather factors
Southeastern 25,570 72 2,021,504 9.20 ► Small planting area due to competition with other crops, less affected by weather conditions
Mekong Delta 36,950 75 1,752,825 9.92 ► Highest yield and level of sugar content
Total 248,930 65 13,456,637 9.45
Source: FPTS Research
Source: Vietnam Sugarcane and Sugar Association (VSSA), FPTS Research
Vietnam Sugar Value Chain
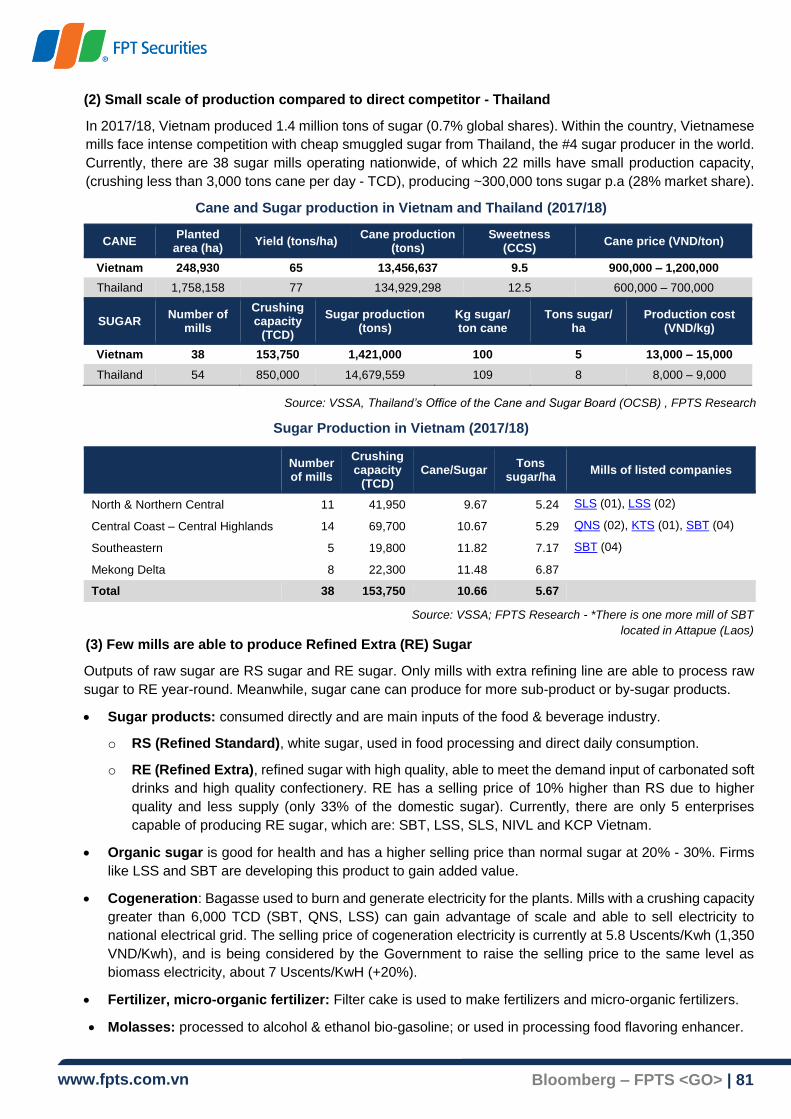
www.fpts.com.vn Bloomberg – FPTS <GO> | 81
(2) Small scale of production compared to direct competitor - Thailand
In 2017/18, Vietnam produced 1.4 million tons of sugar (0.7% global shares). Within the country, Vietnamese
mills face intense competition with cheap smuggled sugar from Thailand, the #4 sugar producer in the world.
Currently, there are 38 sugar mills operating nationwide, of which 22 mills have small production capacity,
(crushing less than 3,000 tons cane per day - TCD), producing ~300,000 tons sugar p.a (28% market share).
Cane and Sugar production in Vietnam and Thailand (2017/18)
CANE Planted
area (ha) Yield (tons/ha)
Cane production (tons)
Sweetness (CCS)
Cane price (VND/ton)
Vietnam 248,930 65 13,456,637 9.5 900,000 – 1,200,000
Thailand 1,758,158 77 134,929,298 12.5 600,000 – 700,000
SUGAR Number of
mills
Crushing capacity
(TCD)
Sugar production (tons)
Kg sugar/ ton cane
Tons sugar/ ha
Production cost (VND/kg)
Vietnam 38 153,750 1,421,000 100 5 13,000 – 15,000
Thailand 54 850,000 14,679,559 109 8 8,000 – 9,000
Sugar Production in Vietnam (2017/18)
Number of mills
Crushing capacity
(TCD) Cane/Sugar
Tons sugar/ha
Mills of listed companies
North & Northern Central 11 41,950 9.67 5.24 SLS (01), LSS (02)
Central Coast – Central Highlands 14 69,700 10.67 5.29 QNS (02), KTS (01), SBT (04)
Southeastern 5 19,800 11.82 7.17 SBT (04)
Mekong Delta 8 22,300 11.48 6.87
Total 38 153,750 10.66 5.67
(3) Few mills are able to produce Refined Extra (RE) Sugar
Outputs of raw sugar are RS sugar and RE sugar. Only mills with extra refining line are able to process raw
sugar to RE year-round. Meanwhile, sugar cane can produce for more sub-product or by-sugar products.
Sugar products: consumed directly and are main inputs of the food & beverage industry.
o RS (Refined Standard), white sugar, used in food processing and direct daily consumption.
o RE (Refined Extra), refined sugar with high quality, able to meet the demand input of carbonated soft
drinks and high quality confectionery. RE has a selling price of 10% higher than RS due to higher
quality and less supply (only 33% of the domestic sugar). Currently, there are only 5 enterprises
capable of producing RE sugar, which are: SBT, LSS, SLS, NIVL and KCP Vietnam.
Organic sugar is good for health and has a higher selling price than normal sugar at 20% - 30%. Firms
like LSS and SBT are developing this product to gain added value.
Cogeneration: Bagasse used to burn and generate electricity for the plants. Mills with a crushing capacity
greater than 6,000 TCD (SBT, QNS, LSS) can gain advantage of scale and able to sell electricity to
national electrical grid. The selling price of cogeneration electricity is currently at 5.8 Uscents/Kwh (1,350
VND/Kwh), and is being considered by the Government to raise the selling price to the same level as
biomass electricity, about 7 Uscents/KwH (+20%).
Fertilizer, micro-organic fertilizer: Filter cake is used to make fertilizers and micro-organic fertilizers.
Molasses: processed to alcohol & ethanol bio-gasoline; or used in processing food flavoring enhancer.
Source: VSSA; FPTS Research - *There is one more mill of SBT
located in Attapue (Laos)
Source: VSSA, Thailand’s Office of the Cane and Sugar Board (OCSB) , FPTS Research
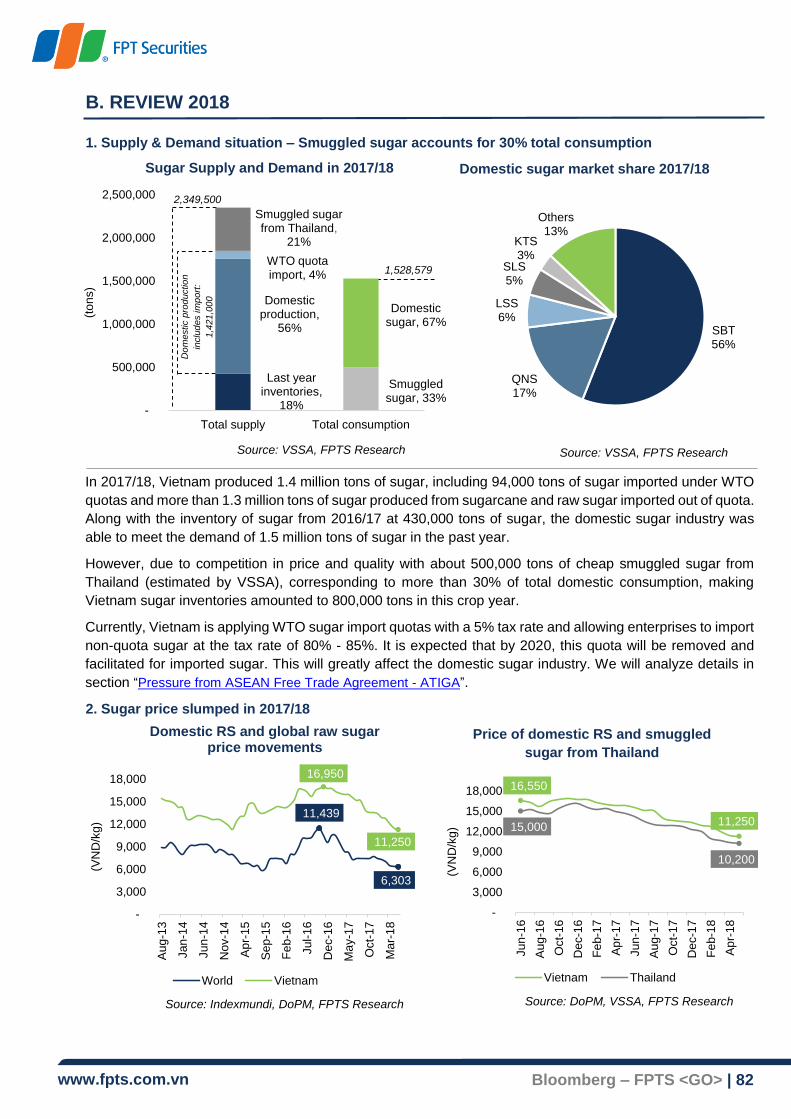
www.fpts.com.vn Bloomberg – FPTS <GO> | 82
B. REVIEW 2018
1. Supply & Demand situation – Smuggled sugar accounts for 30% total consumption
In 2017/18, Vietnam produced 1.4 million tons of sugar, including 94,000 tons of sugar imported under WTO
quotas and more than 1.3 million tons of sugar produced from sugarcane and raw sugar imported out of quota.
Along with the inventory of sugar from 2016/17 at 430,000 tons of sugar, the domestic sugar industry was
able to meet the demand of 1.5 million tons of sugar in the past year.
However, due to competition in price and quality with about 500,000 tons of cheap smuggled sugar from
Thailand (estimated by VSSA), corresponding to more than 30% of total domestic consumption, making
Vietnam sugar inventories amounted to 800,000 tons in this crop year.
Currently, Vietnam is applying WTO sugar import quotas with a 5% tax rate and allowing enterprises to import
non-quota sugar at the tax rate of 80% - 85%. It is expected that by 2020, this quota will be removed and
facilitated for imported sugar. This will greatly affect the domestic sugar industry. We will analyze details in
section “Pressure from ASEAN Free Trade Agreement - ATIGA”.
2. Sugar price slumped in 2017/18
Source: VSSA, FPTS Research
Source: Indexmundi, DoPM, FPTS Research
Domestic RS and global raw sugar price movements
Price of domestic RS and smuggled
sugar from Thailand
Source: DoPM, VSSA, FPTS Research
Domestic sugar market share 2017/18
Source: VSSA, FPTS Research
2,349,500
1,528,579
Last year inventories,
18%
Domestic production,
56%
WTO quota import, 4%
Smuggled sugar from Thailand,
21%
Smuggled sugar, 33%
Domestic sugar, 67%
-
500,000
1,000,000
1,500,000
2,000,000
2,500,000
Total supply Total consumption
(to
ns)
Do
mestic p
rod
uctio
n
inclu
des im
port
:
1,4
21,0
00
SBT56%
QNS17%
LSS6%
SLS5%
KTS3%
Others13%
Sugar Supply and Demand in 2017/18
11,439
6,303
16,950
11,250
-
3,000
6,000
9,000
12,000
15,000
18,000
Au
g-1
3
Jan
-14
Jun
-14
Nov-1
4
Ap
r-15
Se
p-1
5
Fe
b-1
6
Jul-
16
Dec-1
6
Ma
y-1
7
Oct-
17
Ma
r-1
8
(VN
D/k
g)
World Vietnam
16,550
11,250 15,000
10,200
-
3,000
6,000
9,000
12,000
15,000
18,000
Jun
-16
Au
g-1
6
Oct-
16
Dec-1
6
Fe
b-1
7
Ap
r-17
Jun
-17
Au
g-1
7
Oct-
17
De
c-1
7
Fe
b-1
8
Ap
r-18
(VN
D/k
g)
Vietnam Thailand

www.fpts.com.vn Bloomberg – FPTS <GO> | 83
The 2017/18 season is a difficult period for the world sugar and Vietnamese sugar industry. In May 2018,
world raw sugar price fell to 10.4 UScents/pound (6,300 VND/kg) due to global excessive supply. Sugar
production in 2017/18 reached 191.8 million tons (+10.3% yoy), consumption reached 174 million tons (+2%
yoy). This situation comes from record production in major sugar producing countries in the world such as
India (+46% yoy), Thailand (+37% yoy) and EU (+15% yoy).
Meanwhile, Vietnam's sugar price decreased by 35% compared to 2016/17, down to 11,250 VND/kg, due to
the influences of the following factors:
(1) Pressure from ASEAN Free Trade Agreement - ATIGA: On January 1st 2018, the ATIGA was expected
to go into effect. This agreement has 02 main issues affecting the Vietnamese sugar industry.
(back)
Effects of ATIGA on Vietnam Sugar Industry
Before ATIGA After ATIGA
1. Import Quota:
Quota under WTO agreement (94,000 tons of
sugar in year 2018, increase 5% p.a) and
agreement between Vietnam - Laos (50,000 tons,
2.5% tariff).
1. Remove quota imported from ASEAN countries.
2. Tariff:
In quota: 5%
Out of quota: 80% - 85%
2. Tariff among ASEAN countries remained at 5%.
Due to the fact that Vietnam located near Thailand (#4 sugar producer, #2 sugar exporter in the
world), domestic sugar will face great competition with cheap Thai sugar flowing into Vietnam. This
is the main competitor of the whole industry as well as domestic sugar enterprises.
ATIGA is suspended until January 1st 2020. This is a 1-year opportunity for Vietnam sugar to
reduce the competition gap with Thai sugar.
(2) Smuggled sugar from Thailand across the Southwest border: Smuggled sugar from Thailand is
cheaper than domestic RS about 10%. Smuggled volume of up to 400,000 - 500,000 tons/year (30% of total
consumption in Vietnam), lead to high domestic sugar inventories of over 800,000 tons in May 2018.
(3) HFCS sweetener with 0% tariff, no quota from China: Because HFCS is 10% cheaper than domestic
white sugar, its sweetness is 1.2 times higher than cane sugar, HFCS is used by many small and medium
food processors. The level of HFCS sweetener imported to Vietnam in 2017 is up to 89,434 tons (7% of the
demand for sugar in Vietnam).
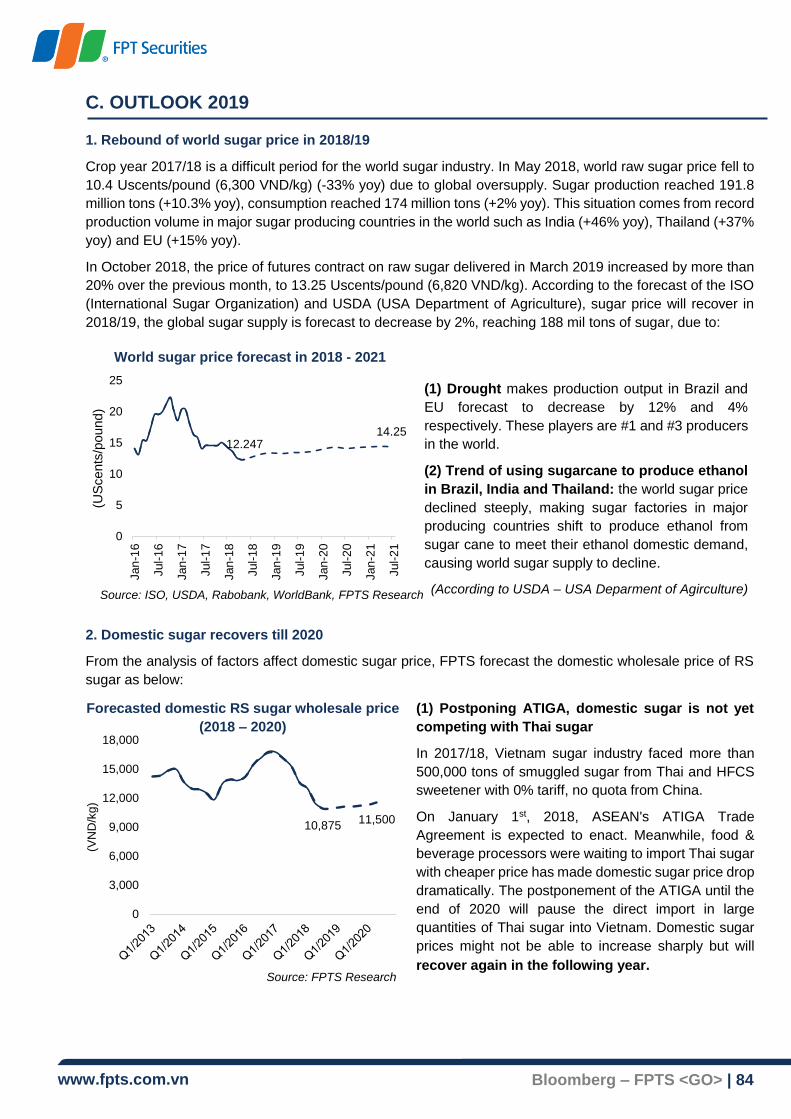
www.fpts.com.vn Bloomberg – FPTS <GO> | 84
C. OUTLOOK 2019
1. Rebound of world sugar price in 2018/19
Crop year 2017/18 is a difficult period for the world sugar industry. In May 2018, world raw sugar price fell to
10.4 Uscents/pound (6,300 VND/kg) (-33% yoy) due to global oversupply. Sugar production reached 191.8
million tons (+10.3% yoy), consumption reached 174 million tons (+2% yoy). This situation comes from record
production volume in major sugar producing countries in the world such as India (+46% yoy), Thailand (+37%
yoy) and EU (+15% yoy).
In October 2018, the price of futures contract on raw sugar delivered in March 2019 increased by more than
20% over the previous month, to 13.25 Uscents/pound (6,820 VND/kg). According to the forecast of the ISO
(International Sugar Organization) and USDA (USA Department of Agriculture), sugar price will recover in
2018/19, the global sugar supply is forecast to decrease by 2%, reaching 188 mil tons of sugar, due to:
2. Domestic sugar recovers till 2020
From the analysis of factors affect domestic sugar price, FPTS forecast the domestic wholesale price of RS
sugar as below:
11,50010,875
0
3,000
6,000
9,000
12,000
15,000
18,000
(VN
D/k
g)
14.2512.247
0
5
10
15
20
25
Jan
-16
Jul-
16
Jan
-17
Jul-
17
Jan
-18
Jul-
18
Jan
-19
Jul-
19
Jan
-20
Jul-
20
Jan
-21
Jul-
21
(US
cents
/pound)
Source: ISO, USDA, Rabobank, WorldBank, FPTS Research
Source: FPTS Research
World sugar price forecast in 2018 - 2021
(1) Drought makes production output in Brazil and
EU forecast to decrease by 12% and 4%
respectively. These players are #1 and #3 producers
in the world.
(2) Trend of using sugarcane to produce ethanol
in Brazil, India and Thailand: the world sugar price
declined steeply, making sugar factories in major
producing countries shift to produce ethanol from
sugar cane to meet their ethanol domestic demand,
causing world sugar supply to decline.
(According to USDA – USA Deparment of Agirculture)
Forecasted domestic RS sugar wholesale price
(2018 – 2020)
(1) Postponing ATIGA, domestic sugar is not yet
competing with Thai sugar
In 2017/18, Vietnam sugar industry faced more than
500,000 tons of smuggled sugar from Thai and HFCS
sweetener with 0% tariff, no quota from China.
On January 1st, 2018, ASEAN's ATIGA Trade
Agreement is expected to enact. Meanwhile, food &
beverage processors were waiting to import Thai sugar
with cheaper price has made domestic sugar price drop
dramatically. The postponement of the ATIGA until the
end of 2020 will pause the direct import in large
quantities of Thai sugar into Vietnam. Domestic sugar
prices might not be able to increase sharply but will
recover again in the following year.

www.fpts.com.vn Bloomberg – FPTS <GO> | 85
Besides, Vietnam Sugarcane and Sugar Association (VSSA) has proposed to the Government to develop a
policy mechanism to manage and develop the sugar industry sustainably. If approved, these policies will have
positive impacts on the whole Vietnamese sugar industry, including:
Draft of “Sugar and Sugarcane Act”
Sugarcane development fund, profit sharing policy between sugar mills and farmers
Sugarcane plantation planning to 2020 and vision to 2030, forming sugar mills with over 6,000 TCD
crushing capacity and power plants complex
Protection and limitation on HFCS sweetener from China
(2) Demand for domestic sugar will grow 5% in the period of 2019 - 2023
1,528,579
1,931,957
0
400,000
800,000
1,200,000
1,600,000
2,000,000
2018 2019F 2020F 2021F 2022F 2023F
(tons)
CAGR = 5%
Currently, Vietnamese people is consuming more than 1.5
million tons of sugar per year, equivalent to 16 kg/per
capita per year, which is 7 kg lower than the world average.
We forecast that the demand for domestic sugar
consumption will increase about 5% in 2023, compared to
the current level, consuming nearly 2 million tons of sugar
according to following factors:
Vietnam’s population growth rate in the period of
2019 – 2023 is 1.12% p.a (IMF)
Sugar consumption growth rate in developing
coutries is 2% p.a (OECD)
Vietnam’s food and beverage sector growth rate is
11% p.a (OECD)
Forecasted average sugar consumption growth
reaches 5% p.a (OECD)
Past sugar consumption growth was 5% p.a
(USDA)
Source: FPTS Research
Forecast domestic sugar demand
(2019 – 2023)
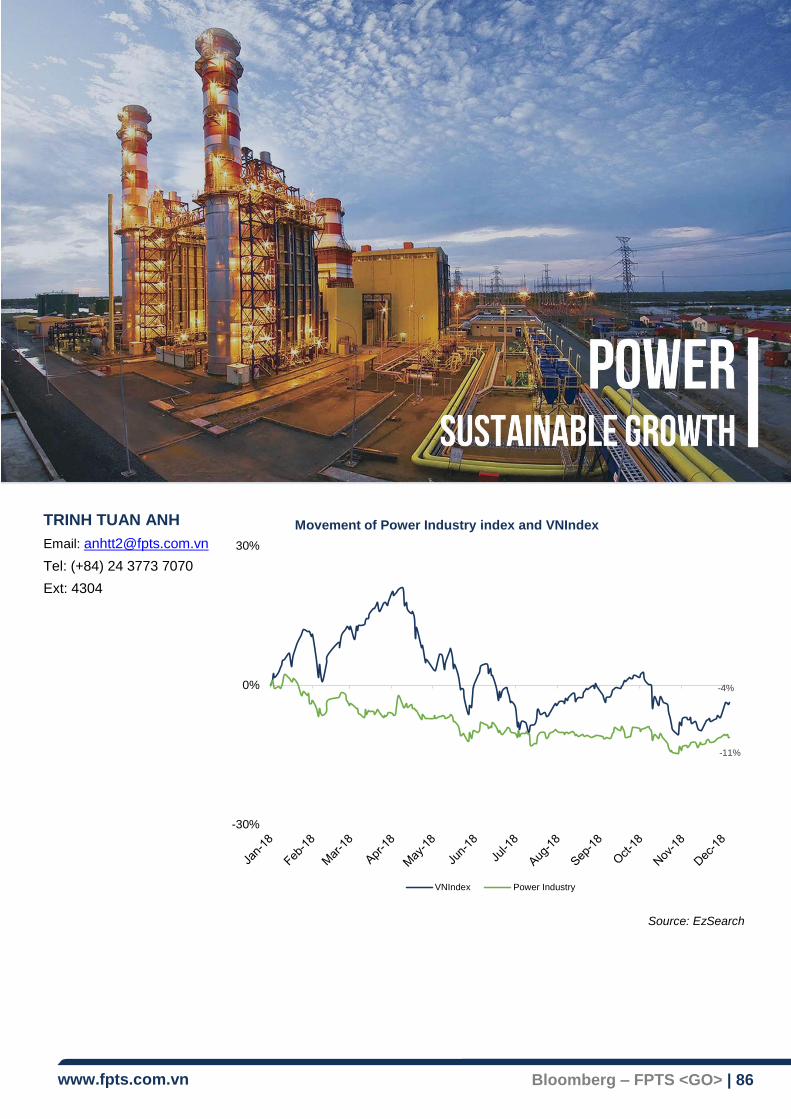
www.fpts.com.vn Bloomberg – FPTS <GO> | 86
TRINH TUAN ANH
Email: [email protected]
Tel: (+84) 24 3773 7070
Ext: 4304
Source: EzSearch
-4%
-11%
-30%
0%
30%
Movement of Power Industry index and VNIndex
VNIndex Power Industry

www.fpts.com.vn Bloomberg – FPTS <GO> | 87
A. POWER INDUSTRY OVERVIEW
1. Value chain
Grouping businesses in the power industry:
Group Operating activities Participating units
Power production Hydropower, coal-fired, oil-fired, gas-fired EVN, TKV, PVN, IPPS
Electrical business
activities
Distribute electricity to end-users Mainly controlled by EVN
Auxiliary services Design and construct the electrical
infrastructure; Transmission Mainly controlled by EVN
Within the scope of the report, we will only mention the information related to the power production group in
the value chain of this industry.
2. Vietnam Power industry characteristics
In Vietnam, there are 4 main sources of electric power: Coal, Natural Gas, Hydropower and renewable energy.
Electricity of Vietnam depends heavily on traditional energy sources (hydropower, coal, natural gas),
which accounts for more than 90% of total designed capacity. By the end of 2016, hydropower, coal-fired
and gas-fired power plants are still three largest power sources with the proportion of 38%, 34% and 18%
respectively. Together with oil-fired power plants, which are currently being used for hedging purpose,
renewable energy power plants (commonly wind and solar energy) have a small weighted in national system.
In the near future, the proportion of renewable energy group is expected to increase and replace hydropower
as one main source of electricity.

www.fpts.com.vn Bloomberg – FPTS <GO> | 88
Source: EVN
Power source of the whole country has a significant differentiation by region and natural conditions.
Coal thermal plants mainly concentrate in the North, Gas & Oil thermal plants concentrate in the South and the
hydropower plants are concentrated mainly across 3 river systems: Dong Nai, Se San and Da river.
Power plants allocation in Vietnam
Source: FPTS Research
Electricity production is shifting to use imported
resources. With the aim of making the most out of available
resources, power production activities mainly have been
using domestic resources. However, according to the
evaluation of the supply - demand for fuel, from 2019, coal-
fired thermal power plants in operation and coming into
operation will start using imported coal. For thermal power
plants, gas from domestic mines is still sufficient for the next
2 - 3 years.
Due to strong dependence on hydropower, the national
electricity supply is seasonal. Occupying nearly 40% of the
electricity supply, the seasonality of hydropower often has a
great impact on the country's power output. At times when the
availability of hydroelectricity is limited, thermal power plants
will be mobilized for stabilizing electricity market. That creates
the seasonality of the year for power plants in Vietnam.
Generally, thermal power plants will be mobilized a lot during
first and fourth quarters while hydropower will be mobilized
for the rest of the year.
Power sales of plants are fully purchased by EVN.
Consuming products is one of the biggest advantages of
electricity production activities compared to other
manufacturing industries. Electricity produced by power
plants is fully purchased by EVN.
15,85718,060
20,362
14,448
25,620
47,575
7,5028,940
15,054
2,4185,940
12,063
0
5,000
10,000
15,000
20,000
25,000
30,000
35,000
40,000
45,000
50,000
2016 2020F 2025F
MW
Vietnam's installed capacity portfolio by fuel
Hydropower Coal-fired Oil-fired Gas-fired Renewable energy Import
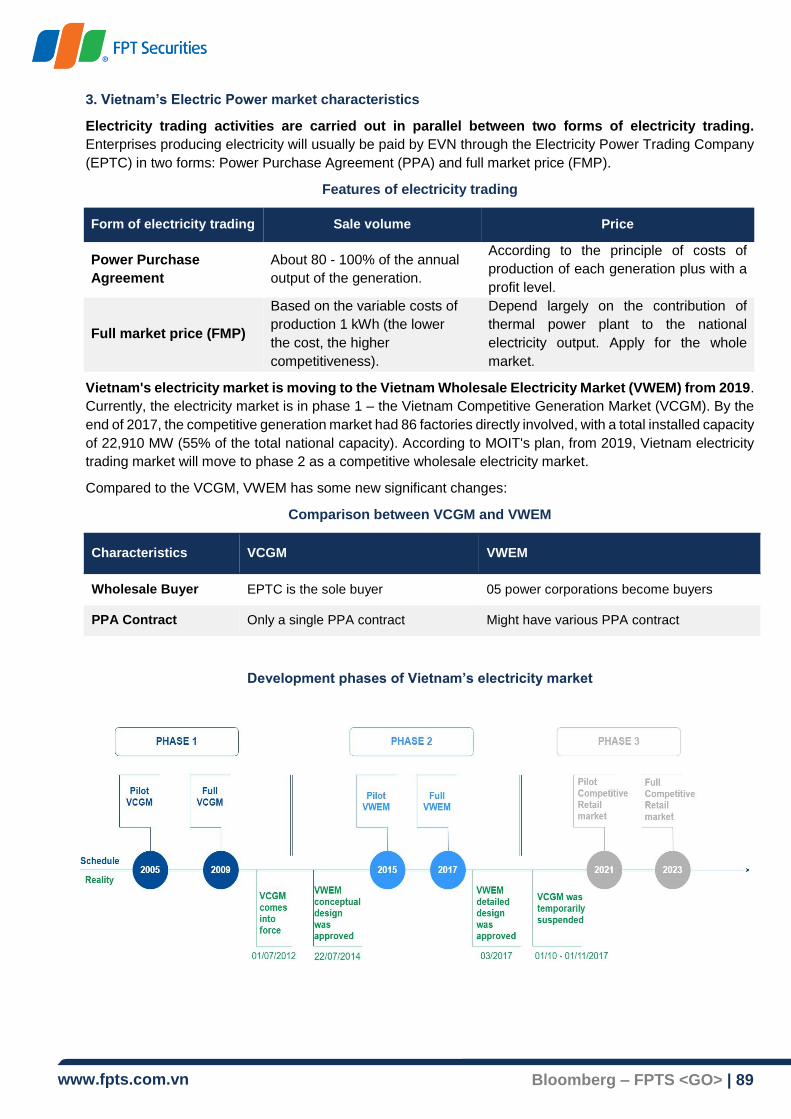
www.fpts.com.vn Bloomberg – FPTS <GO> | 89
3. Vietnam’s Electric Power market characteristics
Electricity trading activities are carried out in parallel between two forms of electricity trading.
Enterprises producing electricity will usually be paid by EVN through the Electricity Power Trading Company
(EPTC) in two forms: Power Purchase Agreement (PPA) and full market price (FMP).
Features of electricity trading
Form of electricity trading Sale volume Price
Power Purchase
Agreement
About 80 - 100% of the annual
output of the generation.
According to the principle of costs of
production of each generation plus with a
profit level.
Full market price (FMP)
Based on the variable costs of
production 1 kWh (the lower
the cost, the higher
competitiveness).
Depend largely on the contribution of
thermal power plant to the national
electricity output. Apply for the whole
market.
Vietnam's electricity market is moving to the Vietnam Wholesale Electricity Market (VWEM) from 2019.
Currently, the electricity market is in phase 1 – the Vietnam Competitive Generation Market (VCGM). By the
end of 2017, the competitive generation market had 86 factories directly involved, with a total installed capacity
of 22,910 MW (55% of the total national capacity). According to MOIT's plan, from 2019, Vietnam electricity
trading market will move to phase 2 as a competitive wholesale electricity market.
Compared to the VCGM, VWEM has some new significant changes:
Comparison between VCGM and VWEM
Characteristics VCGM VWEM
Wholesale Buyer EPTC is the sole buyer 05 power corporations become buyers
PPA Contract Only a single PPA contract Might have various PPA contract
Development phases of Vietnam’s electricity market

www.fpts.com.vn Bloomberg – FPTS <GO> | 90
B. REVIEW 2018
1. Electricity output continued to grow at a stable rate
Source: FPTS Research
Generally, electricity production and consumption
still tend to increase compared to previous years.
The annual growth rate of power industry still
reaches 9% – 10%. In 9 months of 2018, total
power production and import reached 163.5 billion
kWh, showing an increase of 10.54% over the
same period in 2017. Accumulated 9M2018,
power sales are estimated at 143 billion kWh (+
10.1% yoy), of which domestic power sales
increased by 10.21%.
2. Thermal power plant’s output and selling price increased due to decreasing rainfall
(*) Output is estimated based on 2 assumptions: (1) the selling
price of TPPs is fixed about 1,200 VND/kWh; and (2) the
performance over 9M of 6 companies QTP, HND, PPC, NBP,
NT2, BTP.
Source: IMH, FPTS Research
Electricity output from thermal power plants (TPPs) increased thanks to favorable weather in 2018. In
9M2018, the average rainfall is estimated to decrease about 5% compared to 2017, in which the South has
the most fluctuating rainfall with a decrease of 16%. The disappearing La Nina has reduced the amount of
water flowing to the reservoirs, thus reducing the power supply of the hydropower plants (HPPs). As a result,
this has made a positive impact on the total output of thermal power plants. Power sales 9M2018 of listed
company in this group contributed to the market reached about 21 billion kWh, 9% higher than the same
period in 2017.
The average selling price in the market tends to increase again after La Nina ends. Reaching the lowest
point in the last 6 years in 2017, the average selling price is gradually recovering and reached an average of
VND 870/kWh in 9 months of 2018. The main reason for this recovery comes from the increased output of
thermal power plants in the first 6 months, when the weather is not favorable for hydropower. In the last 3
months of the year, the electricity price continues to be higher than the same period of 2017 due to the end
of the rainy season. The hydropower reservoirs have to start storing water for the beginning of next year.
Thus, it will boost the power supply from hydropower, and raise the electricity price in the market
0
50
100
150
200
2015 2016 2017 2018
Bill
ion k
Wh
National 9M2018 production output
Power production & import Commercial power
23
20 20
22403
420
520496
0
100
200
300
400
500
600
18
19
20
21
22
23
2015 2016 2017 2018
mm
Bill
ion
kW
h
9M2018 TPP's output* and rainfall
TPPs' output Rainfall
1,008 929
623
866 403 420
520 496
0
100
200
300
400
500
600
0
200
400
600
800
1,000
1,200
2015 2016 2017 2018
mm
VN
D/k
Wh
Average selling price and rainfall 9M2018
Average market's selling price
Rainfall (right)
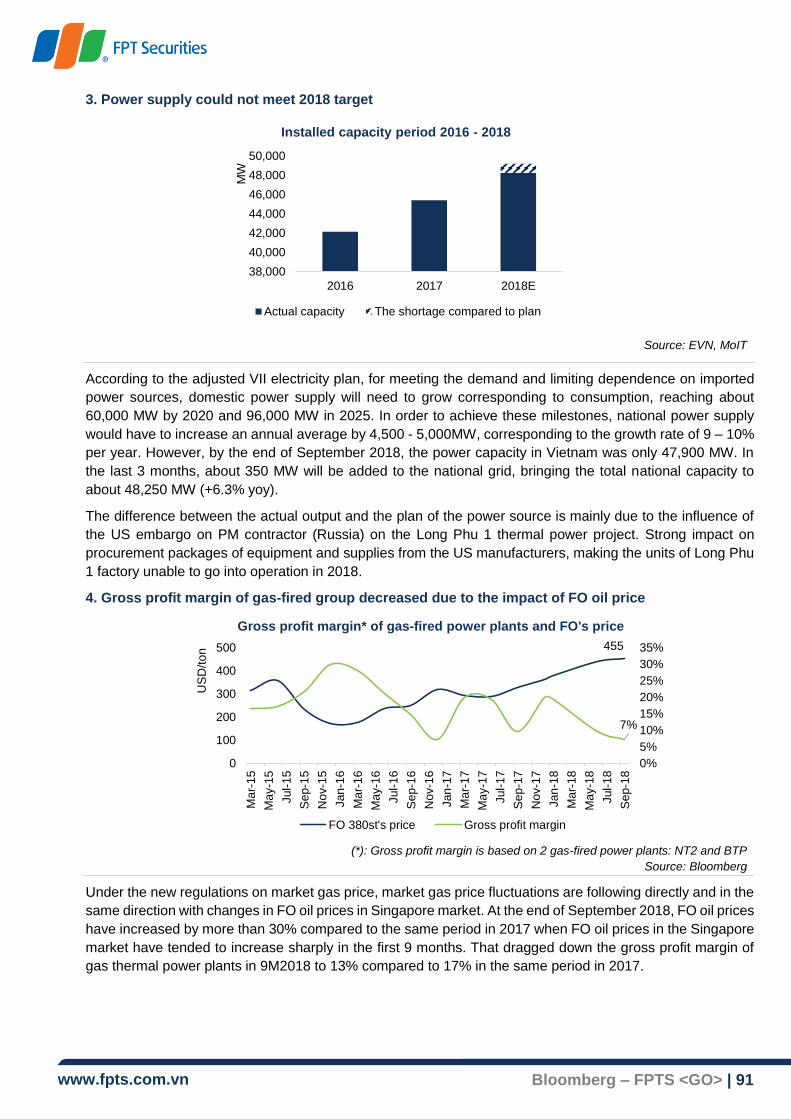
www.fpts.com.vn Bloomberg – FPTS <GO> | 91
3. Power supply could not meet 2018 target
Source: EVN, MoIT
According to the adjusted VII electricity plan, for meeting the demand and limiting dependence on imported
power sources, domestic power supply will need to grow corresponding to consumption, reaching about
60,000 MW by 2020 and 96,000 MW in 2025. In order to achieve these milestones, national power supply
would have to increase an annual average by 4,500 - 5,000MW, corresponding to the growth rate of 9 – 10%
per year. However, by the end of September 2018, the power capacity in Vietnam was only 47,900 MW. In
the last 3 months, about 350 MW will be added to the national grid, bringing the total national capacity to
about 48,250 MW (+6.3% yoy).
The difference between the actual output and the plan of the power source is mainly due to the influence of
the US embargo on PM contractor (Russia) on the Long Phu 1 thermal power project. Strong impact on
procurement packages of equipment and supplies from the US manufacturers, making the units of Long Phu
1 factory unable to go into operation in 2018.
4. Gross profit margin of gas-fired group decreased due to the impact of FO oil price
(*): Gross profit margin is based on 2 gas-fired power plants: NT2 and BTP
Source: Bloomberg
Under the new regulations on market gas price, market gas price fluctuations are following directly and in the
same direction with changes in FO oil prices in Singapore market. At the end of September 2018, FO oil prices
have increased by more than 30% compared to the same period in 2017 when FO oil prices in the Singapore
market have tended to increase sharply in the first 9 months. That dragged down the gross profit margin of
gas thermal power plants in 9M2018 to 13% compared to 17% in the same period in 2017.
38,000
40,000
42,000
44,000
46,000
48,000
50,000
2016 2017 2018E
MW
Installed capacity period 2016 - 2018
Actual capacity The shortage compared to plan
455
7%
0%
5%
10%
15%
20%
25%
30%
35%
0
100
200
300
400
500
Ma
r-1
5
Ma
y-1
5
Jul-
15
Se
p-1
5
Nov-1
5
Jan
-16
Ma
r-1
6
Ma
y-1
6
Jul-
16
Se
p-1
6
Nov-1
6
Jan
-17
Ma
r-1
7
Ma
y-1
7
Jul-
17
Se
p-1
7
No
v-1
7
Jan
-18
Ma
r-1
8
Ma
y-1
8
Jul-
18
Se
p-1
8
US
D/t
on
Gross profit margin* of gas-fired power plants and FO's price
FO 380st's price Gross profit margin

www.fpts.com.vn Bloomberg – FPTS <GO> | 92
C. OUTLOOK 2019
1. The electricity demand is expected to keep increasing in 2019
As the input of the economy, the growth of electricity demand always leads the GDP growth. National
electricity consumption in the period of 2011 - 2016 has always increased twice as fast as the growth of GDP.
According to the World Bank's forecast for the period of 2018 - 2022, Vietnam's GDP growth rate will fall to
about 6.5%. In response to this GDP growth, the demand for electricity consumption is expected to increase
approximately 11 - 13% per year in the coming years.
Source: FPTS Research
2. Supply growth is gradually not keeping up with electricity demand
As above estimated, the growth rate of electricity consumption will reach about 11% in the period of 2018 -
2022 and then fall to 9 - 10% by 2030. Meanwhile, the actual power supply currently reaches only 6 - 7%. The
difference between the growth of supply and demand is still being offset by the operation of oil-fired power
plants. It is expected that in 2019 and 2020, oil thermal power will contribute about 4.4 and 5.2 billion kWh,
helping to ensure the balance of electricity supply and demand. However, after 2021, Vietnam will be more
likely to face power shortage risks in the market. A number of factors leading to slow growth in supply include:
Source: MOIT, FPTS Estimates
Low water level in hydroelectric reservoir
limits the ability to generate electricity.
Gas mining projects such as Blue Whale,
Block B - O Mon are facing a risk of slow
progress while existing gas fields are
beginning to run out. The shortage of gas
supply will affect the operation of gas power
plants in the coming years.
Coal-fired thermal power investment projects
in the South are also being delayed. It is
estimated that for each coal-fired thermal
power plant to be delayed, the electricity
market is suffering from a loss of 7.2 - 7.5
billion kWh, equivalent to about 3% of the
system's output.
0
0.5
1
1.5
2
2.5
3
0%
3%
6%
9%
12%
15%
2003 - 2007 2008 - 2012 2013 - 2017 2018F - 2022F
(tim
es)
GDP and Electricity consumption' growth 2003 - 2022
GDP's growth rate
Electricity consumption's growth rate
Electricity consumption's growth rate/GDP's growth rate
11%
9%
10%11% 11%
9%
8%
6%7% 7%
0%
2%
4%
6%
8%
10%
12%
2016 2017 2018 2019F 2020F
Electricity supply and demand forecast
Electricity consumption growth
Capacity growth

www.fpts.com.vn Bloomberg – FPTS <GO> | 93
3. Weather forecast for early 2019 shows positive signs for thermal power plants
According to the forecast report of Vietnam Institute of Meteorology, Hydrology and Climate change, ENSO
phenomenon is forecasted to gradually shift to El Nino status in the last months of 2018, early of the year
2019 with a probability of 80%. We estimate that moving to El Nino will reduce about 10 - 15% of rainfall
flowing to reservoirs at hydropower plants, which will help thermal power plants to increase about 10% of
output compared to 2018.
Source: IRI, IMH
4. Oil prices tend to decrease at the end of 2018 and stabilize in 2019
After skyrocketing to $508 per ton in October 2018, the current price of FO oil has gradually decreased to
USD400 per barrel (20% lower compared to October 2018). As forecasted by some organizations such as
World Bank, OECD or EIA, oil prices in 2019 will tend to be stable compared to the end of 2018. With oil prices
stabilizing around $455 per ton, Gross profit margin of gas thermal power plants is expected to remain at a
low level of 7% as of 9M2018, thus affecting the profitability of enterprises as fuel costs account for more than
80% of the cost structure of this group.
Source: FPTS Research
0%
20%
40%
60%
80%
ENSO probability forecast (10/2018 - 7/2019)
La Nina Neutral El Nino
80%
2%
9%
6% 2%
Cost structure of gas-fired power plants
Raw Material
Labor
Depreciation,Armortization
Service cost
Other cost
www.fpts.com.vn Bloomberg – FPTS <GO> | 94
RESEARCH DEPARTMENT
Deputy Director:
Nguyen Thi Kim Chi
Fundamental Analysts:
Senior Analyst:
Nguyen Nhat Hoang
Analysts:
Nguyen Ngoc Duc
Bui Duc Duy
Ta Viet Phuong
Bui Thi Phuong
Duong Bich Ngoc
Pham Quang Thanh
Trinh Tuan Anh
Data Analysts
Analysts:
Vu Thi Hong
Nguyen Tuan Nghia
Technical Analysts
Team Leader:
Nguyen Ngoc Tuan
Analysts:
Nguyen Duc Anh
DISCLAIMER
All of information and analysis in this report made by FPTS based on reliable, public and legal sources. Except for information about
FPTS, we do not guarantee about the accuracy and completeness of these information.
Investors who use this report need to note that all of judgements in this report are only subjective opinions of FPTS. Investors have
to take responsibility about their decisions when using this report.
FPTS might make investment decisions based on information in this report or others and do not have any claim on legal perspective
of given information.
This report many not be copied, reproduced, published or redistributed for any purpose without written permission of an
authorized representative of FPTS. Please cite sources when quoting. Information related to stocks and industries could
be viewed at https://ezsearch.fpts.com.vn or will be provided upon official request.
© Copyright by FPT Securities 2010
FPT Securities Joint Stock Company
Head Office
No. 52 Lac Long Quan, Buoi Ward,
Tay Ho District, Hanoi, Vietnam.
Tel: (84.24) 3 773 7070 / 271 7171
Fax: (84.24) 3 773 9058
FPT Securities Joint Stock Company
Ho Chi Minh City Office
3rd Floor, Ben Thanh Times Square
Building, 136-138 Le Thi Hong Gam,
District 1, Ho Chi Minh City, Vietnam.
Tel: (84.28) 6 290 8686
Fax: (84.28) 6 291 0607
FPT Securities Joint Stock Company
Da Nang Office
No. 100 Quang Trung, Thach Thang
Ward, Hai Chau District, Da Nang,
Vietnam.
Tel: (84.236) 3553 666
Fax: (84.236) 3553 888