Economic performance of Vietnam, 1976-2000: New evidence from input-output model
Upload
independentCategory
view
0download
0
DDEEPPOOCCEENN Working Paper Series No. 2007/13
Economic performance of Vietnam, 1976-2000: New evidence from input-output model
Ngoc Q. Pham*
Bui Trinh** Thanh Duc Nguyen***
* Pham Quang Ngoc, Development and Policies Research Center, 216 Tran Quang Khai Street, Hanoi, Vietnam. ** Bui Trinh, General Statistics Office of Vietnam – Ministry of Planning and Investment. *** Thanh Duc Nguyen, National Graduate Institute for Policy Studies (GRIPS), Tokyo, Japan. The DEPOCEN WORKING PAPER SERIES disseminates research findings and promotes scholar exchanges in all branches of economic studies, with a special emphasis on Vietnam. The views and interpretations expressed in the paper are those of the author(s) and do not necessarily represent the views and policies of the DEPOCEN or its Management Board. The DEPOCEN does not guarantee the accuracy of findings, interpretations, and data associated with the paper, and accepts no responsibility whatsoever for any consequences of their use. The author(s) remains the copyright owner. DEPOCEN WORKING PAPERS are available online at http://www.depocenwp.org

Economic performance of Vietnam, 1976-2000: New evidence from input-output model Ngoc Quang Pham 1
Development and Policies Research Center (DEPOCEN), 216 Tran Quang Khai Street, Hanoi Vietnam
Tel.: +84-4-9351419; fax: +84-4-9351418; email: [email protected]
Bui Trinh
National Account Department, General Statistical Office of Vietnam; e-mail: [email protected]
Thanh Duc Nguyen
National Graduate Institute for Policy Studies (GRIPS), Tokyo, Japan, e-mail: [email protected]
This version 9 November 2007 2
Abstract. This study provides a concise introduction to the economic history of Vietnam from 1976 to present. We identify different phases of the development of the Vietnamese economy, from its unification after a Vietnam war to the current phases of the transition (1989-2000) and propose a specific pattern of transition in the case of Vietnam. This research is the first attempt to make a synthesis quantitative analysis of socio-economic aggregate data during different phases of the Vietnamese economy in 1986-2000, in which different national input-output tables (1989, 1996 and 2000) in constant prices have been employed. The economic performances are investigated from three aspects: (i) evolution of domestic final demand; (ii) evolution of international trade structure and (iii) the technological change. The analysis shows economic history of Vietnam from 1986 up to present as a continuous evolutionary process and integration in to the international market is inevitable. Government programmes only played a vital role of accommodator to the economic changes of the Vietnamese economy.
JEL classification: C67, N15, P27, E60.
Key words: input-output analysis, Vietnamese economy, economic history, transition economy, macro-economic policy.
1 All correspondence to Ngoc Quang Pham. The authors are grateful to Pierre Mohnen (University of
Maastricht), Gabriel Palma (University of Cambridge), Anh Ngoc Nguyen (DEPOCEN) for their comments and
suggestions. Comments from anonymous participants in conferences are appreciated. We alone are responsible
for the errors and omissions.
2 Section 1 and 2 are based on paper presented at Singapore Economic Review Conference (SERC 2005,
Singapore, 4 – 6 August, 2005) by Ngoc and Thanh (2005). Section 3 to 5 are based on papers presented at 2006
Intermediate Input-Output Meeting (Sendai, Japan, July 26-28, 2006) by Ngoc et al (2006) and Public Economic
Theory 2006 Hanoi (PET 06 Hanoi, Hanoi, Vietnam, July 31-August 2, 2006) by Ngoc et al (2006).

2
1. A quick tour on literature on the Vietnamese economy
As early as the 1980s, Marr & White (1988) introduced to the West an early assessment of
the Vietnamese postwar economy (1975-86), presenting its increasing troubles in a centrally
planning economy. This collection of works done by Western researchers with their limited
data reflected the difficulty at that time in accessing to data. One may still remember that
during such period all production statistics and other economic data were considered “top
secret” (tuyet mat), and circulated only in the top leaders or planning authorities. However,
Kimura’s (1989) seminal analysis of the process of changes in Vietnam during 1975-86,
provides a set of rich data for such an ambiguous period. Vo Nhan Tri’s (1990) excellent
study on the country’s economic conditions before 1975, followed by a careful investigation
on the policy change since 1975 and its economic consequences up to the end of 1988, may
be the earliest publication systematically dealing with the Doi Moi (Renovation) conducted
by a Vietnamese. The accelerated changes occurred in Vietnam after the collapse of the
Soviet Union quickly captured by the Japanese scholars and policy makers. As a result, a new
strategy for the regional cooperation is proposed by Murano & Takeuchi (1992). In addition,
Than & Tan (1993) collect a number of researches prepared by regional economists up to
1991, showing the regional realization of a changing Vietnam. Ljunggren (1993) provides a
collection of insight work, of which Dollar (1993) investigates the macroeconomic conditions
of the country until the beginning of the 1990s. Tran T. Dang (1994) provides a succinct
overview of the economy during a wide span of time from 1955 to 1992 with an attempt to
achieve the continuity in data of various aspects.
Ten year after, the Doimoi was officially carried out, Fforde & de Vylder (1996a) started to
evaluate the Reforms in detail from various aspects (up to 1990). As a consequent
development, their seminal book (Fforde & de Vylder, 1996b) provides a detailed story of the
process from its beginning until early 1990s (1993), quickly becoming a classic reference for
these turning periods. One of the most important message Fforde and de Vylder emphasize is
that the “Reform” is in nature a “bottom-up” process, and the “Renovation” is therefore
responsive rather than proactive. Moreover, as early as that time, Le Dang Doanh (1996)
foretells the slowdown of the economy if the reform fails to deal with the idling state sector.
Concerning the pattern of the Reform, Riedel and Comer (1997) argue that the one in
Vietnam is as “big-bang” as the ones in Eastern Europe, but the key difference is that since
the former (like China) is a purely agricultural country, the “shock-therapy” generates
outcomes far different from the latter’s. Sharing the view that the initial conditions of
3
Vietnam (and China) are essential to its success, Griffin (1998), however, insists in the
conventional view that Vietnam and its neighbor have been adopting a gradual approach to
the Reform.
Besides, Harvie & Tran (1997) study the economy until the end of 1995, and then Wolff
(1999) updates the country’s situation until 1996. Beresford and Dang’s (2000)
comprehensive work on trade and aid up to the mid 1990s produces a valuable investigation
on Vietnam’s international trades since 1960s.
After 1997, when signs of slowdown arose, both in the economic performance as well as the
government’s will to cope with further challenges, and the economy itself began to reveal
many weak characteristics, observers seemed to be skeptical of a miracle in Southeast Asia
and less enthusiastic with the affairs of Vietnam. Many authors called for further changes
from various aspects (Kokko (1999), Anderson (1999), Litvack & Rondinelli (1999))
However, Tran-Nam Binh & Chi Do Pham (2000) try to warm up the interest by bringing the
literature up to date till the end of 1990s. Boothroyd and Pham (2000) attempt to evaluate the
socio-economic impact of the Reform until 1995. Importantly, Tran Van Tho et al. (2000)
successfully generate a synthesis of data on economic performance of the country from 1955
until late 1999. Alpert’s (2005) collection of essays by various authors, although it appeared
recently, is not very updated, and seems to fail to achieve the ambition reflected in its title.
Most recently, CIEM (2005), an annual report by and for the Vietnamese policy makers,
discusses the current situations of the economy from the Vietnamese orthodox point of view.
This study provides a concise introduction to the economic performance of Vietnam from
1986 to present, the paper focuses on the Vietnamese economy’s structural change and its
performance. The paper focus on the current phases of the economic transition of Vietnam
(1986-2000) by exploring the three national input-output tables (1989, 1996 and 2000). The
interrelationships between structural change and economic performance are investigated from
three aspects: (i) evolution of domestic final demand; (ii) evolution of international trade
structure; and (iii) the technological change. A multi-sectoral dynamic input-output model is
presented to quantitatively assess the potential effects of structural changes in the
performance of the economy.
The main contributions of this paper are three. First, we demonstrate that the economic
structural change in Vietnam is one of the most important driving forces of economic
performance. Second, we propose a specific pattern of transition in the case of Vietnam.
Third, this research is the first attempt to make a synthesis quantitative analysis of socio-

4
economic aggregate data during different phases of the Vietnamese economy in 1986-2000,
in which different national input-output tables in constant prices employed.
The paper is organized as follows. Section 2 presents an outline of economic history of
Vietnam from 1976-2004. Section 3 presents the data of the Vietnamese economy from 1989-
2000 and proposes the IO framework to derive non-competitive IO tables at constant prices.
In section 4 we propose the static IO model for measuring input-output multipliers and for
calculating the impact of various types of structural changes on economic performance.
Section 5 provides an input-output analysis of the economic history of Vietnam from 1986 to
the present, in which the historical picture is enriched by evidence from exploring the three
input-output tables of Vietnam. The last section concludes.
2. An outline of the economic history of Vietnam from 1976-present
In this paper, we return to the period rightly after the reunification of the country in 1975 to
study the economic policies during this period as well as their serious consequences, and then
pointed out why the Reform had been necessarily carried out. As we will see the seeds of
reformation had emerged long before it was formally announced. We are trying to explain
the economic history of Vietnam from 1976 up to present as a continuous historical process,
in which many policies were, on the one hand, endogenous (forced to be carried out by the
economic conditions with only one choice), and on the other hand, by being dominated by the
ideological views, had substantially influence the economic development. More concretely, it
is the market-oriented policy that creates engine for the economy, but the policy itself is
obstinately based on a groundless principle that the SOE (state owned enterprise) sector
should dominate the economy. As a result, all developmental policies, implicitly or explicitly,
must follow the principle. This fact has been a string to connect most of important events in
the recent economic history of Vietnam.

5
0
50
100
150
200
250
300
350
400
450
500
1977 1979 1981 1983 1985 1987 1989 1991 1993 1995 1997 1999 2001 2003
Year
GD
P (
1976=
100)
-4
-2
0
2
4
6
8
10
12
Pe
rce
nt
GDP
(1977=100)
GDP growth
rate
FIGURE 1 Economic Growth in Vietnam, 1977-2003
Source: Tran Van Tho et al. (2004) for data to 1999, post 1999 data from CIEM (2005)
Figure 1 shows the growth of Vietnam’s GDP during 1977-2003. One may notice that in
general the economy has been achieving a continuously steady growth. However, a closer
look at the growth rate may tell us a more interesting and concrete story. An important feature
is that the rate severely falls down until 1980. This is the first phase in our story. The second
phase ranges from 1980 to 1986, when the economy first recovered quickly, and then slowed
down again. The third phase is from 1986 to the end of 1990, when the Soviet Union
collapsed. This phase must have observed drastic struggles for changing ideas and
development models. The fourth phase is from 1990 to 1996, when the economy underwent a
smooth progress. However, in the fifth phase, ranging from 1996 to 1999, there is again a
slowdown. The final phase is from 2000 to present, when the economy shows signs of
recovery. In the following sections, we will look into each phase in more detail, and point out
the rise and fall of the growth rate in each phase are different in nature.
2.1. “Socialist Transformation” Expanded to the South, 1976 - 1979
Although the making of Vietnam’s modern history is remarked by the fall of Saigon on April
30, 1975, its modern economic history only began in December 1976, when the sixth
congress of the Vietnamese Communist Party (VCP) closed and officially concluded the way

6
ahead for the unified Vietnam. The conclusion was: “[to move] directly from small-scale
production to large-scale production without passing through the capitalist stage, to give
priority to heavy industry, and to turn Vietnam into a socialist country with modern
agriculture and industry within twenty years.” (Ton That Thien, 2005: 26)
By that time, the US aids to the South had ceased for one year. In addition, aids from China to
the North were being cut step by step, along with emerging political conflicts of the two
countries’ leaderships, and would come to an end in 1978. However, a grand program called
“socialist transformation” (cai tao xa hoi chu nghia) was firmly imposed throughout the
defeated South. The agriculture was collectivized, while industry and commerce were
nationalized. Hundred thousands of people leaving the country at that time led to a huge lost
in human capital. The incentive system of the new regime immediately showed its impacts:
productivity rapidly decreased, agricultural outputs fell down, industry stagnated and
commerce froze. The country began to suffer from a shortage of food.
However, during this difficult time, most of investment resources were driven to the heavy
industry, whose output did not meet the immediate demand of the people. During 1976-9,
about 65% annual state investment was given to this industry (Figure 2). Moreover, it should
be noted that the state budget was strongly dependent on external sources, most of them from
the Soviet Union (Table 1).
TABLE 1 Foreign economic aid, 1976-1980
1976 1977 1978 1979 1980
Foreign grants and loans
(% of Budget Revenues)
44.8
34.5
32.9
40.8
40.6
Source: Vo Nhan Tri (1990: 101)
2.2. The “bottom-up” Reforms, 1979-1986
The “socialist transformation” program in the South, along with the impulse of the so called
“socialist relation of production” in the whole country had economically failed, especially in
agriculture. Since Vietnam was typically a agricultural country (by that time 80% of
population were farmers), the fall in agricultural output directly and harshly affected the
people’s living standard. Burdens of the wars with Cambodia (ended at the late of 1978) and

7
with China (1979) must have become extremely heavy to an economy which had been
exhausted after a 30-year war against the French and then US.
In the summer of 1980, when poverty was spreading nation-wide, the first, small-scale trials
of reforming the agriculture took place in Hai Phong, a port-city near Hanoi. That is the idea
of making “end-product contract” with households (khoán hộ), which was not new but used
to be pitilessly attacked from the top leaders, who insisted that it was a dangerous deviation
from the socialist path. However, changing in incentive system had improved the efficiency
dramatically (see, for example, Kompas (2002) for an estimation). The immediate success of
the case encouraged the authorities to expand (but still cautiously) it to other localities. To
January of 1981, Party Secretariat’s Directive No 100CT/TU was issued as an act of
recognizing the idea. However, only until April 1988 was Politburo’s Resolution No.
10/NQTU on the “Renovation of economic management in agriculture” approved, and was
the reformation in agriculture officially accepted. This revealed that there must have been a
persistent struggle within the leadership. The process of the reform also shows that that is in
fact a reform from the “grass-root,” or a “bottom-up” one.
0
20
40
60
80
100
120
1976 1977 1978 1979 1980 1981 1982 1983 1984 1985
Year
Percent
Light Industry
Heavy Industry
FIGURE 2 State Investment by Industry, 1976-1985
Source: Vo Nhan Tri (1990), Table 2.3 and Table 3.3
As Rozelle and Swinnen (2004) point out, to transition economies, success in agriculture
plays an essential role in determining the success and pattern of the economy’s transition path
afterwards. It is likely that most of the transition economies have commenced their reform in
agriculture, but only few of them (including Vietnam and China) succeeded. Earlier, Riedel

8
&Comer (1997) and Grifin (1998) have emphasized the significance of the initial conditions
in these countries. It may be true because both China and Vietnam had a big share of farmers
in population (around 70%), whereas in Eastern European and Central Asian countries this
share accounted for about 10-30%. It is the stabilization of a major part of population that
rapidly releases pressure over the leadership, help to keep the social disorder not to go too far.
Therefore, the economy is stable enough to be possibly shifted to another stage of reform,
rather than falling into a political chaos. Moreover, and more importantly, the impressive
performance in agriculture must have been more convincing than any other ideological
dogmas, helping to change insights of all factions in the ruling group surviving after the
crises, to allow them to have both time to restore order and changing views to start reforming
the remaining parts of the economy. That is exactly what had happened to Vietnam in this
period.
2.3. The Economic Renovation, 1986 - 1990
Under the pressure of the “bottom up” reforms without political disorders, the Party started a
formal reform called Doi Moi (Renovation). The years of 1986-1990 are a phase of decisive
transformation, which proves the significant contribution of institutional changes to economic
performance.
In 1987, the domestic market was liberalized: rationing system abolished for many
commodities and market determined prices for nonessential goods introduced, the dual price
system was modified to reduce the differentials between state controlled and free market
prices. At the end of 1987, two important laws were approved: Land Law and Law on
Foreign Investment. While the former, followed by Resolution 10 (as mentioned above) in
1998, helped to liberalize the huge resource in rural areas by identifying households as basic
production units in rural economy, and therefore providing an effective incentive system, the
latter mobilize the external resources, most of them from capitalist countries. In March, 1988,
several important Decrees were issued, encouraging the development of the non-state sectors.
At the same time, land-use right was set at 15 years (and would be increased to 20-50 years in
1993). The SOEs was also reformed so that they become more autonomous in determining
their business plans.
However, it must be noticed that the time these important reforms occurred, the State budget
was almost exhausted, and it must print a huge amount of money to finance the deficit. This
immediately led to hyperinflation in 1986 (see Figure 3).

9
0
100
200
300
400
500
600
700
800
900
1976 1978 1980 1982 1984 1986 1988 1990 1992 1994 1996 1998
Year
Percent
Inf lation rate
FIGURE 3. Inflation Rate 1976-1999 Source: Tran Van Tho et al. (2004)
However, this time also observed a dramatic success in taming inflation. In mid 1988, the
Government increased interest rate up to 6%/month, and then inflation quickly slowed down.
The interest rate was increased one more in the end of 1989 (almost 10%/month), and
inflation was under control. (see Dollar’s 1993: Figure 8-1, p. 213)
Although the collapse of the Soviet Union in 1989 was a disaster to poor socialist countries
like Vietnam, but the shock, in today’s retrospective, seems to hit the country mostly
politically, but not economically. One looking into the economic data during that time may
find that the economy evolved in a surprisingly smooth manner. Although Vietnam fell into a
“classic case of a developing country with macroeconomic instability” (Dollar 1993: 211) in
1989, the crisis was much smaller than that of 1986.
The achievements in the period were impressive. In agriculture, the initial institutional
reforms in 1979/80 had helped to reduce amount of food imported. But after the reforms in
1988, agricultural outputs soared and in the following year Vietnam became a rice exporter
(Figure 4). Nguyen Tri Khiem (1996:22) provides a useful summary of the reforms and their
impressive consequences in agriculture during the 1980s.

10
-2000
-1000
0
1000
2000
3000
4000
1976 1978 1980 1982 1984 1986 1988 1990 1992 1994 1996 1998
Year
tho
usan
d t
on
s
Net Paddy Export
FIGURE 4 Net Paddy Export, 1976-1998
Source: Author’s calculation from Tran Van Tho et al. (2004)
Table 2 below summarized some impacts of the reforms during each steps of the reformation.
TABLE 2 Impact of Reforms (average annual percent change)
Indicator Pre-reform
(1976-1979)
First Reform
(1980-1985)
Second Reform
(1986-1990)
Real GDP per capita -0.9 2.1 1.8
Agricultural output per person employed -10.7 0.8 0.8
Industrial output per person employed 3.2 2.8 8.8
Heavy indusrty -4.9 -3.8 11.7
Light industry -0.5 11.3 7.6
Source: Dang T. Tran (1994: 35)
2.4. More Opened Economy, 1990-1996
As pointed out in the previous section, the last phase ends with the collapse of the Soviet
Union. Although general economic performance of Vietnam was not severely affected before
and after the event, it is obvious that there had been a great shift in international economic

11
relations of the country. Therefore, if the last phase was recognized by many fundamental
internal reforms, this phase can be marked with a new development in international economic
relations. There was a big re-orientation of trade partners from the Soviet Union and East
European countries to Japan, EU, China (1991), and then ASEAN countries (to be an
ASEAN full member in 1995), and finally the United State (1995). Figure 5 clearly shows
that the international trade started to take off since 1989.
0
5000
10000
15000
20000
25000
1976 1978 1980 1982 1984 1986 1988 1990 1992 1994 1996 1998
Year
bil U
SD
Import turnov er
Ex port Turnov er
FIGURE 5 Foreign Trade, 1976-1999
Source: Tran Van Tho et al. (2004)
In 1990, SOEs were restructured under the form of mergers and consolidations, reducing their
number from 12000 to less than 6000. Government’s transfers (subsidies) to SOEs also
reduced. However, the SOEs reform did not mean to weaken their economic power. That the
share of State sector in GDP was firmly increasing during this period (see Figure 6) reflects
“Hanoi’s consensus” on the “dominating role of state sector” as a fundamental characteristic
of the “socialism-oriented market economy”. This fact seems to explain why the economic
growth started to slow down since 1996.

12
0
20
40
60
80
100
120
1989 1991 1993 1995 1997 1999 2001 2003
Year
Percent
Non-State
State
FIGURE 6 GDP by ownership, 1989-2004
Source: Tran Van Tho et al. (2004) for data to 1999, post 1999 data from CIEM (2005)
2.5. Economic Slowdown, 1996-2000
One widely-observed feature of the economy in this period is its slowdown. Superficially,
one may, as Vietnamese politicians have been doing, relate such phenomenon to the Asian
crisis in 1997. However, critical observers may find that the economy had revealed signs of
slowdown at least since 1996 (Kokko (1999), Truong Do Xuan (2000), for examples).
Looking at Figure 1 one may realize that the growth rate began to diminish after reaching its
height in 1995. Figure 6 shows that at least since 1989, the state sector’s share in GDP had
kept increasing during 1989-1995 and standing constant for a quite long period of time. This
discloses a fact that SOE restructuring programs only aims at strengthening the state sector.
Especially, the year 1996 observed a series of conservative policies. Early in the year there
was a hostile campaign against “advertisements using foreign languages” (Womack 1997).
This is however only a prelude. In June, The Eighth Party Congress reemphasized the
“leading role” of the state sector as a strategic task3. The state investment then accelerated
with a pace more rapid than any other period (see Figure 7).
3 In the draft of Political Report, it was suggested to increase the state sector’s share in GDP from current 40% to
60%, but then softened to a “leading role” (Womack 1997).

13
After the outbreak of the Asian crisis in July 1997, the economy was influenced but at a
degree lower than other Southeast Asian countries. Foreign investment relatively decreased
(Figure 7) and the growth of foreign trade suffered a pause (in that year only). The economy
decelerated until 1999 and shows signs of recovery in 2000.
0
20
40
60
80
100
120
1990 1992 1994 1996 1998 2000 2002 2004
Year
Percent
Foreign
Non-State
State
FIGURE 7 Structure of Investment by ownership, 1990-2004 Source: Pham & Le (2003) for 1990-94 data, Tran Van Tho et al. (2004)
for 1995-99 data, post-1999 data from CIEM (2003, 2005)
2.6. Signs of Recovery, 2000- present
Since 2000, the Vietnamese economy seems to return to its track of high economic growth.
Table 3 shows a picture of the economy during this period. However, what is the engine of
the growth is still questionable. The unstableness of the macro economy can be observed by
the fluctuation of inflation which seems to be very unpredictable. While inflation rate is very
low until 2003, it increases sharply up to almost 10% in 2004. Some blamable causes are
global petroleum price increase, flu bird disease. However, many economists argue that a
main cause is the increase in state’s credit to SOEs. Although official data is not available, we
can estimate how rapid the state’s credit expands before 2004 by looking at the development
as well as structure of state investment in industrial sector (Table 4). This measure may help

14
to accelerate the economy in short-run. But due to inherent weakness of this sector, one may
be not optimistic about the long-run achievement.
TABLE 3 Key Economic Indicators, 2000-2004
2000 2001 2002 2003 2004(p)
GDP growth rate (%) 5.5 6.9 7.0 7.2 7.2
Industrial production growth rate (%) 15.7 14.6 14.5 16.0 16.0
Unemployment rate (%) 6.4 6.3 6.0 5.8 5.8
Inflation rate (%) -0.6 0.8 4.0 3.0 9.0
Government balance (%GDP) -2.8 -2.9 -2.0 -2.2 -2.5
Domestic Public Sector Debt (accumulated, %GDP) 2.0 3.3 4.3 5.0 4.5
Trade balance (USD mil) -1,187 -1,135 -3,027 -5,141 -5,865
Current account balance (USD mil) 503 670 -500 -1,930 -1,990
Current account balance (% GDP) 1.5 2.1 -1.1 -4.7 -4.4
Total external debt (%GDP) 41.2 38.5 38.1 37.8 37.1
Source: World Bank (2005). (p): projection.
TABLE 4 Investment of Enterprises Managed by the Ministry of Industry (Unit: Billion dong)
2002 (actual) 2003 (est) 2004 (planned) 2003/02 (%) 2004/03 (%)
Total 21018,26 29360,14 48702,51 139,69 165,88
State Budget 567,65 428,31 727,44 75,45 169,84
State credit 3910,65 4365,63 12027,93 111,63 275,51
Discount 7309,69 6913,71 7807,98 94,58 112,93
Foreign loans 4387,13 6021,00 5082,05 137,24 84,41
Commercial credit 2579,19 8720,06 17277,16 338,09 198,13
Self investment 282,08 796,04 928,93 282,20 116,69
Others 2064,01 2174,38 5040,76 105,35 231,82 Source: Ministry of Industry (http://www.moi.gov.vn/News/detail.asp?Sub=42&id=694)
15
3. The Data and Input-Output methodology to derive non-competitive
Input-Output tables at constant prices
3.1. Review of the economic account compilation in Vietnam
3.1.1. National Accounts
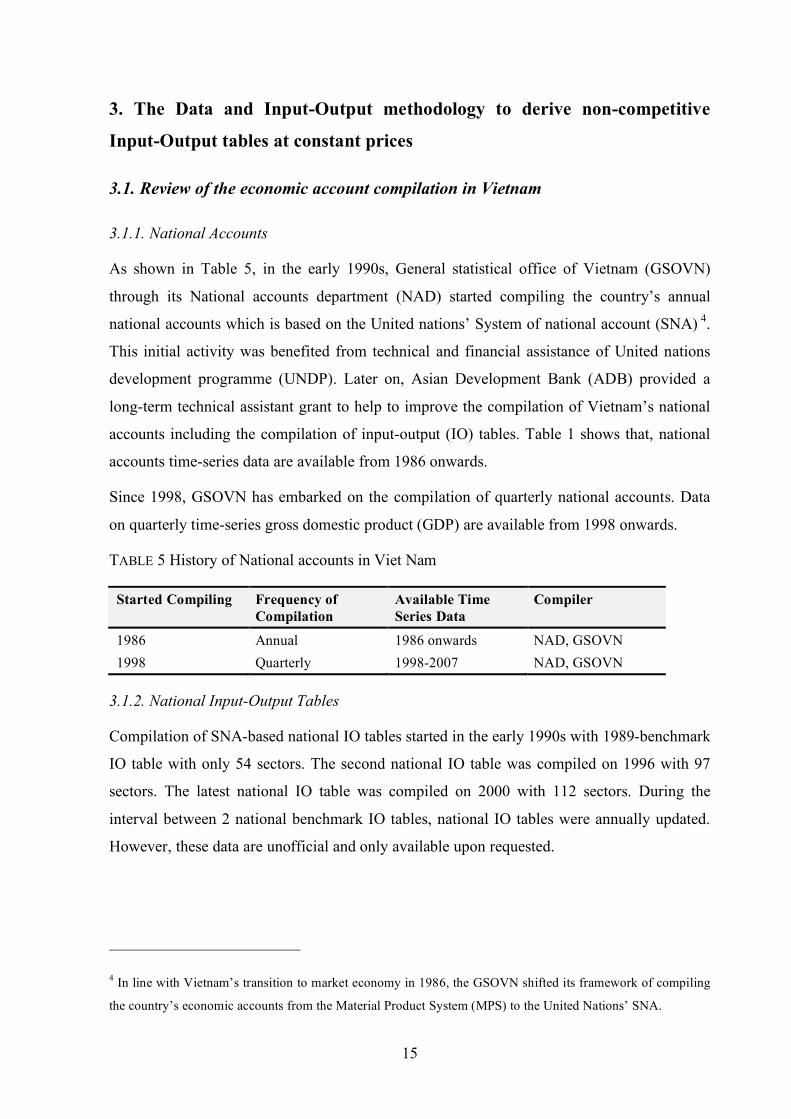
As shown in Table 5, in the early 1990s, General statistical office of Vietnam (GSOVN)
through its National accounts department (NAD) started compiling the country’s annual
national accounts which is based on the United nations’ System of national account (SNA) 4.
This initial activity was benefited from technical and financial assistance of United nations
development programme (UNDP). Later on, Asian Development Bank (ADB) provided a
long-term technical assistant grant to help to improve the compilation of Vietnam’s national
accounts including the compilation of input-output (IO) tables. Table 1 shows that, national
accounts time-series data are available from 1986 onwards.
Since 1998, GSOVN has embarked on the compilation of quarterly national accounts. Data
on quarterly time-series gross domestic product (GDP) are available from 1998 onwards.
TABLE 5 History of National accounts in Viet Nam
Started Compiling Frequency of Compilation
Available Time Series Data
Compiler
1986 Annual 1986 onwards NAD, GSOVN 1998 Quarterly 1998-2007 NAD, GSOVN
3.1.2. National Input-Output Tables
Compilation of SNA-based national IO tables started in the early 1990s with 1989-benchmark
IO table with only 54 sectors. The second national IO table was compiled on 1996 with 97
sectors. The latest national IO table was compiled on 2000 with 112 sectors. During the
interval between 2 national benchmark IO tables, national IO tables were annually updated.
However, these data are unofficial and only available upon requested.
4 In line with Vietnam’s transition to market economy in 1986, the GSOVN shifted its framework of compiling
the country’s economic accounts from the Material Product System (MPS) to the United Nations’ SNA.

16
TABLE 6. SNA-Based IO Compilation in Vietnam
Kind / Reference Year Size Type Methodology
National Benchmark Tables
1) 1989 54x54 Competitive/Current price Direct Full Survey
2) 1996 97x97 Competitive/Current price Direct Full Survey
3) 2000 112x112 Competitive/Current price Direct Full Survey
National Updated Tables*
1) 1990 54x54 Competitive/Current price RAS Method
2) 1991 20x20 Competitive/Current price RAS Method
3) 1992 20x20 Competitive/Current price RAS Method
4) 1993 20x20 Competitive/Current price RAS Method
5) 1994 43x43 Competitive/Current price RAS Method
6) 1995 45x45 Competitive/Current price RAS Method
* unofficial data are available upon request
3.2. Compilation Methodology
For the purpose of comparative analysis, the following data transformation was undertaken
by the GSO of Vietnam.
1. Unifying sector classification of three national benchmark IO tables (1989, 1996 and
2000) into 52-sector classification;
2. Building of import matrices for the three national benchmark IO tables;
3. Derivation of the non-competitive type of IO tables ; and
4. Generation of the non-/competitive IO tables at constant prices of 1994.
3.2.1. Sector re-classification
The first task done was to reclassify the sectors of the available three national benchmark IO
tables into a common classification. As it was shown in table 2, in 1989 it was only 54 sectors
involved in the survey. However the number of sectors increased to 97 and 112 in 1996 and
2000 respectively. For the purpose of comparative analysis, all these three table need to be
unified in the sole sector classification. Shown in Annex A is the revised 52-sector
classification followed in reconstructing the three IO tables.

17
3.2.2. Building of import matrices
As shown in Table 2, Vietnam’s national IO tables are of the competitive-imports type
wherein no distinction is made between domestically and imported products consumed in
production and consumption. So far, no attempt has been made to construct the more useful
non-competitive type of table that explicitly distinguishes the usage of imported from
domestic products.
For the purpose of building non-competitive IO tables, the following method was conducted
to calculate the national import matrix by the non-survey method.
The starting point for derivation of non-competitive IO tables is the material balance equation
of the input-output account:
(1) X
i=W
i+ D
i+ E
i! M
i
where:
X
i = gross output of sector i
W
i = intermediate domestic demand for the output of sector i 1
D
i = final domestic demand of product i
E
i = export demand of product i
M
i = total imports of products classified in sector i
Import of commodity i, M
i, consists of M
w for intermediate demand and Mf for final
demand. They appear in the total import supply and as part of both intermediate and final
demand in equation (3-1). Let u
i
w and u
i
f stand for the domestic supply ratios (the proportion
of intermediate and of final demand produced domestically). Thus:
(2) X
i= u
i
w aijX
jj! + ui
f Di+ E
i
(3) M
i= m
i
wWi+ m
i
f Di
where the import coefficients are define as m
i= 1! u
i( ) for both intermediate and final
goods.

18
Here, the assumptions are that: first, there is no direct re-export of imports; second, imports
and domestic goods with the same sector classification are alternative sources of supply and
are perfect substitutes in all uses; third, the domestic supply ratio for intermediate use, u
i
w , is
assumed to be same for all sectors using commodity i as an input.
Equation (2) and (3) can be conveniently restated in matrix notation as:
(4) X = uw AX + u f D + E
(5) M = mw AX + m f D
In this study, however, it was imperative that a national imports table be generated that could
adequately serve as the basis in regionalizing the import transaction. For this purpose, a direct
estimation methodology was developed to build the import coefficient matrices. The
approximation of diagonal matrix of import coefficients for intermediate use mw can be
calculated as follows:
The import coefficient of sector i, m
ii
w , can be estimated by the equation:
(6)
mii
w=
Mi
TDDi
,
where
TDD
i = total domestic demand for sector i.
By definition TDD
i=W
i+ D
i= X
i! E
i+ M
i (which is can be calculated with the data can be
extracted from competitive IO table).
3.2.3. Derivation of IO tables of the non-competitive type
With the availability of the 52-sector national import tables, we can now derive the non-
competitive type of IO tables that is universally accepted as the more effective instrument for
a more meaningful micro-economic analysis. Subtracting the imports table from the given
competitive IO tables gives the non-competitive IO tables wherein input-output transactions
are net of imported inputs. To balance the IO tables a separated import column is added to the
IO matrices.

19
Based on the non-competitive tables which were generated in the phase 3 and the 52- sector
vectors of deflation for the year of 1989, 1996 and 2000, the non-competitive IO tables at
constant price of 1994 were calculated.
4. The Input-Output models
4.1. Static IO Model - Derivation of Leontief inverse matrices (type I and II)5
In the standard input-output model, the Leontief inverse matrices show how much of total
change in each industry’s output is needed, in terms of direct, indirect and, in types II
matrices, induced requirements, due to one unit change in the final demand of a given
industry.
The type I Leontief [inverse] matrix is defined as follows:
(7) B = (I ! A)!1
where:
B = Type I standard Leontief inverse matrix
I = Identity matrix
A = Direct input coefficient matrix
In order to derive the type II Leontief inverse matrix we assume that the value added of
production could be decomposed into two components: (i) income paid to household as wage
paid to employees and (ii) income paid to capital includes amount of depreciation and a part
of operating surplus (excluding amount redistributed). Hence, not like other studies where
type II of IO model is developed with households endogenous, in our paper the type II of IO
model is constructed with two income groups, namely the employment income group and the
capital income group. In this revision of the IO model, household and capital are considered
like industries, selling service/good (labour/capital), earning revenues (compensation of
employees and rents) and making purchases (household expenditure and capital formation).
As sources of income paid to household can be: compensation of employees and
redistribution of operating surplus, hence we have:
5 This section refer to the concept developed by (Trinh et all, 2005), presented at PAPAIOS conference, 2005

20
(8) W =W
1+W
2
where :
W
1 = compensation of employees
W
2 = income created by redistribution of operating surplus.
Similarly, income paid to capital, denoted by R includes amount of depreciation, a remaining
part of operating surplus (excluding amount redistributed), foreign direct investment and
capital transfer or borrowing.6
(9) R = R
1+ R
2
where:
R
1 = Depreciation (consumption of fixed capital).
R
2 = Income created by redistribution of operating surplus.
Hence, we may decompose value added va into:
(10) VA =W
1+W
2+ R =W + R
Using w to denote vector of coefficient of income paid to household (1xn) and r (1xn)
denotes vector of coefficient of income paid to capital. For each industry i we have:
w
i=W
i/ X
iand
r
i= R
i/ X
i where
X
i denotes gross output of sector i.
Using C to denote vector of household expenditure and c a corresponding vector of
coefficients and I to denote a vector of investment and i a vector of coefficients, we have:
(11)
ci=
Ci
Wi
i=1
n
!
and
ii=
Ii
Ri
i!1
n
"
6 In fact source of total income paid to household consists of compensation to employees (income from
production-earned income) and other unearned income sources such as property incomes and transfer incomes.
Similar to capital, total capital resources, apart from operating surplus and depreciation, also includes capital
resources received by foreign direct investment and capital transfer or borrowing. Due to the limitation of data
sources, in this study, we assume the unearned income 2
W and exogenous sources of capital income 2R are
zeros.

21
Hence, we may rewrite extension formulation based on Leontief standard system as follows:
(12) X = AX + cW + iR + f
W = wX
R = rX
where:
X = vector of gross output (nx1);
f = vector of final demand except consumption and capital formation (nx1)
W = total income paid to household (scalar)
R = total income paid to capital (scalar)
Rewrite equation (12) in a matrix form, we have7:
(13)
X
W
R
!
"
###
$
%
&&&=
A c i
w 0 0
r 0 0
!
"
###
$
%
&&&
X
W
R
!
"
###
$
%
&&&+
f
0
0
!
"
###
$
%
&&&= A* X *
+ F *
Therefore, the direct purchase coefficient matrix is extended by adding two extra rows and
columns. The tow rows are “compensation of employees” and “the consumption of capital
plus operating surplus” coefficients; the two columns are “household expenditure” and
“capital formation” coefficients respectively.
The equation (13) suggests us the type II Leontief inverse matrix, which is calculated in this
study as follows:
(14) B*= (I ! A
*)!1
where:
B* = Type II Leontief inverse matrix
7 Theoretically, *0
0
ij
hh
kk
A c i
A w A
r A
! "# $
= # $# $% &
where: hhA = household consumption per unit of exogenous household income and
kkA = capital formation per
unit of exogenous capital income. In this study these cells are set to zero.

22
4.2. Measure of industry’s impacts – Input-output multipliers
4.2.1. Concept of the multiplier – from Keynes, Kalecki, Leontief to Miyazawa
The concept of multiplier, according to Keynes: “… was first introduced into economic
theory by Mr. R. F. Kahn in his article on ‘The Relation of Home Investment to
Employment’ (Economic Journal, June 1931)’ ” (Keynes, 1946, p.113). However, it is widely
recognized that the concept of [investment] multiplier was first defined by Keynes.
According to Keynes, consumption C is originally induced by the [real] income Y 8:
Y C I! = ! + ! , where I denotes investment. Therefore, by defining the marginal propensity
to consume (or consumption coefficient in our input-output model) dCc
dY= , then the
Keynesian investment multiplier equation would be: Y k I! = ! , where 1
1k
c=
!. The
investment multiplier k, “tells us that, when there is an increment of aggregate investment,
income will increase an amount which is k times the increment of investment” (Keynes, 1946,
p.115).
However, in the community, there are always number of income groups, thus the Keynesian
investment multiplier holds only for a particular income distribution pattern. Miyazawa
(1976), in his lecture note on “input-output analysis and the structure of income distribution”,
developed a concept of income multiplier for an economy with r different income-groups. In
fact, the Miyazawa income multiplier is the extension and improvement of Kalecki income
multiplier for income distribution pattern of two income-groups. Let 1d and
2d denote the
relative shares of the 1st and the 2nd income group; and 1c ,
2c denote the marginal propensity
to consume of the 1st and the 2nd income group respectively, the generalized Kalecki income
multiplier, as described by Miyazawa, is as follows: 1 1 2 2
1
1 ( )k
c d c d=
! + (Miyazawa, 1976,
p.3).
8 Originally, Keynes had distinguished the two terms: income and real income. However as stated in his General
Theory, he considered them as virtually interchangeable “In certain contexts we must not overlook the fact that,
in general, Y increase and decrease in a greater proportion than real income; but in other contexts the fact that
they always increase and decrease together renders them virtually interchangeable” (Keynes, 1946, p. 114)

23
In this paper we combine Kalecki multiplier and simple Leontief output multiplier by
applying the concept of Miyazawa multiplier for the two different income group, namely
household and capital income group.
By endogenising the household and capital sectors, we propose to enlarge the coefficient
matrix as described in the previous section (3.1). Based on the basic Keynesian argument that
Income = Consumption + Investment, we argue that income of the community includes not
only income from individual owners of factors (household group) but also from
entrepreneurs. Hence, it is a mistake to allocate all income to consumption as a household
expenditure since there are always the decisions to consume and the decisions to invest. The
formal is belong to household income group and later is of capital income group. It is the
reason why income needed also allocated to capital formation.
“Income is created by the value in excess of user cost which the producer obtains for
the output he has sold; but the whole of this output must obviously have been sold
either to a consumer or to another entrepreneur; and each entrepreneur’s current
investment is equal to the excess of the equipment which he has purchased from
other entrepreneurs over his own user cost. Hence, in the aggregate the excess of
income over consumption, which we call saving, cannot differ from the addition to
capital equipment which we call investment… The decisions to consume and the
decisions to invest between them determine incomes”. (Keynes, 1946, p.64)
4.2.2. Derivation of Input-output multipliers and effects
An input-output multiplier is an indicator for measuring of an industrial impact on the
economy. As multiplier is defined as the ratio of the industry’s total impact to its direct
impact. The peculiarity of our definition of multiplier is in the way to construct the enlarged
inverse matrix multiplier (see section 3.1).
Borrowing the traditional definitions described in Johnson, T.G. (1999), we distinguish
between variety kinds of effects and between multipliers and total effects as follows:
Initial effect: The exogenous change in final demand.
Direct effect: The direct effect is the first round of response to the initial effect. It may
be the same as the initial effect, if the initial change in final demand is
entirely absorbed domestically. Otherwise the direct effect will be
smaller than the initial effect. The direct effect may be in different units

24
than initial effects. The direct effect may be in income or employment
while the initial effect was expressed in output, for example.
Indirect effect: The impact on the economy as the demand for intermediate inputs
changes.
Induced effect: The change in the economy due to the re-spending of income earned as a
result of the initial and subsequent changes.
Simple effect: The sum of direct and indirect effects.
Total effect: The sum of direct, indirect and induced effects.
Simple multiplier: The sum of direct plus indirect effects divided by direct effects. Also
known as the Type I multiplier.
Total multiplier: The sum of direct plus indirect plus induced effects divided by direct
effects. Also known as the Type II multiplier
In this paper, we calculate various types of multipliers for both type I and type II effects. The
Gross output multipliers are calculated by using both competitive and non-competitive type
IO tables.
Gross output multiplier
Direct and indirect effects (type I) 1
n
j ij
i
OM b=
=! (15)
Direct, indirect and induced effects (type II) * *
1
n
j ij
i
OM b=
=! (16)
Where:
ijb = coefficient of Leontief inverse matrix (type I)
*
ijb = coefficient of enlarged Leontief inverse matrix (type II)
Income multipliers (for both household and capital income)
Direct and indirect effects (type I) 1
ni ij
j
i j
v bIM
v=
=! (17)
Direct, indirect and induced effects (type II) *
*
1
ni ij
j
i j
v bIM
v=
=! (18)

25
Where:
iv = labour or capital income of industry i (or j) per one VND of total output of that industry.
Employment multipliers
Direct and indirect effects (type I) 1
ni ij
j
i j
e bEM
e=
=! (19)
Direct, indirect and induced effects (type II) *
*
1
ni ij
j
i j
wbEM
w=
=! (20)
Where:
ie = employment per VND 1 million of total output of industry i.
Consumption, Investment and Export multipliers
Consumption, Investment and Export multipliers type I and II are calculated as follows:
( )1
. /FM I A F F!
= ! (21)
( )1
* *. /FM I A F F
!
= ! (22)
where:
( )1
*I A
!
! = enlarged inverse matrix multiplier type II
FM = matrix of final demand multipliers (nx3)
F = matrix of final demands includes consumption, investment and
export (nx3)
./ = matrix operator - element by element divide
From (3-9) and (3-10), Consumption, Investment and Export multipliers of the industry i are
calculated as follows:
Direct and indirect effects (type I) 1
nij j
i
j i
b fFM
f=
=! (23)
Direct, indirect and induced effects (type II) *
*
1
nij j
i
j i
b fFM
f=
=! (24)

26
5. A economic structural change of Vietnam from 1986-present – evidence
from input-output tables
In this section, we return to the period rightly after the Doi Moi (renovation) of the country in
1986 to study the economic structural change during this period as well as their serious
consequences, and then pointed out why the Reform had been necessarily carried out.
Structural change has a number of dimensions. Firstly, this is an evolution of domestic final
demand resulted from a shift from agriculture to industry and services, and from low labour
productivity sector to the sector which has higher labour productivity or to the relative more
capital intensive sector. Some completely new sectors, such as fine arts and handcrafts,
electronics and car and motorcycle assembly, have begun to emerge, contributing to industrial
growth, and we are seeing the emergence and development of new sophisticated engineering
industries such as chemicals, computer and office equipment, electric and electronic
equipment, telecommunication, based on substantial change within already-existing sectors.
Secondly is the evolution of international trade structure; and Thirdly is the technological
change, and lastly is ownership restructuring, meaning the decline of state owned industrial
enterprise along with the growth of foreign-owned and non-state sector, is affecting the
structure of industry, and may be one of the main drivers of productivity improvement.
Shift in GDP Structure has indeed occurred since 1976. During 1976 – 2000, the Vietnamese
economy saw a transformation from an agriculture-based toward an industry-and-service-
based economy. However, the domination of the agriculture was only sharply declined since
the early 1990s. Before this turning point, the agriculture was still dominated more or less
than 40% of the GDP, and the economy did not show any clear trend in restructuring (Figure
8). After 1992, there is a continuous trend in transformation with a steady expansion of the
industry. The share of the service sector seems to be stable at about 40% of the GDP.
Since the early 1980s, structural change in final demands has occurred. The proportion of
investment in GDP has been increasing. As a result, the total final consumption relatively
declined (see Figure 9). During this period, thank to the access to new markets, the
international trade has also been extended with a remarkable growth of more than 20% per
annum (Figure 9). These structural changes (both in production and final demand) must have
been the major engine for the economy to achieve its sound growth since mid of the 1980s.

27
0
20
40
60
80
100
120
1976
1978
1980
1982
1984
1986
1988
1990
1992
1994
1996
1998
2000
2002
2004
Year
percent
Service
Industry (incConstruction)Agriculture
FIGURE 8 Structure of GDP by Sector, 1976-2004 Source: Tran Van Tho et al. (2004) for data to 1999, post 1999 data from CIEM (2005)
-40
-20
0
20
40
60
80
100
120
1976 1978 1980 1982 1984 1986 1988 1990 1992 1994 1996 1998
Year
percent
Consumption
Investment
Net Export
FIGURE 9 Structure of Final Demand, 1976-1999
Source: Tran Van Tho et al. (2004)

28
Next part of the paper focus on the current phases of the economic transition of Vietnam
(1986-2000) by exploring the three national input-output tables (1989, 1996 and 2000). Input-
output analysis is consistent with the different phases of the development of the Vietnamese
economy which were identified in the previous sections.
5.1 The Economic Renovation, 1986 - 1990
Let us take a close look at the evidence from 1989 input-output table. Table 7 shows the level
of output multiplier (OM) calculated from competitive type IO table and non-competitive one
for three phases of reform. The different between two types of OM shows precisely the
impact of international trade on economic performance which we call the outer impact. In the
first phase of reform, we could see that, OM competitive type is 2.317. It shows that if
imports and domestically produced goods in each sector are not treated separately, or saying
in the other way if the contribution of import substitution is neglected, then in order to
produce one additional unit of output, the total of all outputs from each industry need to be
increased for 2.317 units more. However, as we have mentioned, since there are no impacts
of import substitution, by calculating OM in such a way, the whole increment of 2.317 units
is concerned as domestically produced. In fact, thank for the international trade, part of the
output requirement is substituted by imported goods. That is the reason why we need to
calculate OM from the non-competitive type IO table. As shown in table 7, due to the impact
of import substitution, OM drops to 1.510, it means instead of 2.317 units of total output need
to be increased, the requirement now is only 1.510 units. Hence we can calculate the outer
impact from international trade which is 1.534. This is a strong supported evidence for the
evolutionary movement of Vietnamese economy, or in our terminology, a bottom-up process,
in which Doi Moi is a critical point marks the shift of Vietnamese economy from planned
economy to marker oriented one. We could say integration in to the international market is
inevitable. Import substitution and export expansion resulted from various liberalizations in
this period, of which the critical one is liberalization of domestic market, are reactions of the
economy under the pressure of the “bottom up” reforms (1979-1986), the exhaustion of State
budget and mainly the collapse of the Soviet Union – which is used to be a formal big export-
market of Vietnam.

29
TABLE 7 Output multipliers and Outer Impact (type I)
Phase of reform Output Multiplier
Competitive type
Output Multiplier Non-competitive type
Outer impact
The Economic Renovation, 1986-1990 (IO 1989) 2.317 1.510 1.534
More Opened Economy, 1990-1996 (IO 1996) 2.392 1.540 1.553
Economic Slowdown, 1996-2000 (IO 2000) 2.573 1.518 1.695
Table 7 shows the OMs only at the highest aggregated level. Break-down OMs in to 52-sector
are shown in table 8. We could see that, except sector 39 (Petroleum and natural gas) and
sector 2 (Animal husbandry), 38 (Products of publishing house) where there are no impact of
international trade (outer impact is or almost is zeros)9, the other sectors’ outer impacts are
about 1.2 and above. Sectors, whose outer impacts are higher than 1.5, are concentrated in
manufacturing sectors. Some sectors have incredible high outer impact (more than 2.0), such
as sector 26 (Soap, detergents, perfumes and other toilet preparation), sector 27 (Plastic,
plastic products). Reason for these high impacts lays on the import substitution for domestic
intermediate and final demand of manufacturing goods. Few sectors have high impact but are
not manufacture, such as sector 5 (coal) and sector 9 (Processed and preserved fruits and
vegetables) due to Vietnam has a traditional of exporting coal as well as agricultural products,
thus reason here is export expansion. It again, confirms the impacts of international trade
which is certainly an inevitable movement toward economic integration of Vietnamese
economy.
Table 9 presents level of labour and capital income multipliers (VND income/VND output)
type I and II in 1989. Obviously, level of type II multipliers are always greater than those of
type I one, due to the induced effects. Looking at the results presented in table 9, we could
say how much total income increment (paid to household and capital) will be generated in all
sector of the economy that results from a change of VND 1 of income from labour/capital in
each industry. From that we could see how is efficiency of industries. Labour income
9 In Vietnam, since there is no oil refinery industry, all domestic demand of petroleum and gas are imported. In
contrast, in 1989 Animal husbandry and Products of publishing house are sectors with few imports/exports.

30
generated is higher in manufacturing industries, due to that fact that in this period most of the
newly emerged manufacture sectors are labour intensive. Increments of labour in come in
agriculture related sectors are not quite high, except animal husbandry. In term of capital, the
picture is not quite clear, it also reflected the technology of a nation at this time, where most
of sectors are labour intensive.
Table 10 shows the level of employment multipliers (type I and II) in 1989, 1996 and 2000.
The employments multipliers show the total increases in employment throughout the
Vietnamese economy which results from an increase in final demand which is enough to
create one additional employment in that industry. Again, the picture of labour intensive is
looming. Most of sectors have its high level of multipliers. Sectors have low level of
employment multiplier is agriculture and most of the service sectors. This implies that these
sectors do not attract much labour.

31
TABLE 8 Vietnam Output Multipliers and Outer impacts, 1989, 1996 and 2000 2000 1996 1989 Code
OM competitive
OM non-competitive
Outer impact
OM competitive
OM non-competitive
Outer impact
OM competitive
OM non-competitive
Outer impact
1 1.603 1.249 1.284 1.642 1.170 1.403 1.716 1.287 1.334 2 2.138 1.509 1.417 1.842 1.454 1.266 1.800 1.657 1.086 3 1.602 1.214 1.319 1.476 1.196 1.234 1.501 1.218 1.232 4 2.228 1.288 1.729 1.634 1.270 1.287 1.968 1.328 1.482 5 1.827 1.302 1.403 2.334 1.570 1.486 2.384 1.469 1.622 6 2.231 1.624 1.373 2.238 1.581 1.416 1.734 1.324 1.309 7 1.668 1.295 1.288 2.178 1.536 1.418 1.600 1.268 1.263 8 2.855 1.899 1.503 2.819 2.043 1.380 2.499 1.672 1.494 9 2.395 1.696 1.412 2.575 1.783 1.445 2.453 1.469 1.669
10 2.656 1.725 1.540 2.298 1.563 1.470 2.558 1.732 1.477 11 2.358 1.760 1.340 2.712 2.043 1.327 2.249 1.607 1.399 12 2.386 1.767 1.350 2.428 1.818 1.336 1.943 1.597 1.217 13 3.203 1.913 1.674 2.211 1.693 1.306 2.376 1.712 1.388 14 3.113 2.125 1.465 2.290 1.907 1.201 2.343 1.848 1.268 15 2.698 2.145 1.258 2.403 1.870 1.285 2.606 2.059 1.265 16 2.543 1.481 1.717 2.249 1.539 1.462 2.298 1.549 1.483 17 2.449 1.573 1.557 2.003 1.612 1.242 2.209 1.666 1.326 18 3.069 1.851 1.658 2.299 1.626 1.414 2.575 1.781 1.446 19 2.466 1.552 1.589 2.942 1.924 1.529 2.665 1.843 1.447 20 2.907 1.636 1.777 2.951 1.769 1.668 2.783 1.811 1.536 21 2.416 1.653 1.462 2.768 1.995 1.387 2.234 1.810 1.234 22 2.409 1.345 1.792 2.109 1.545 1.365 3.166 1.770 1.789 23 2.543 1.420 1.791 2.902 1.489 1.949 2.427 1.814 1.338 24 2.619 1.305 2.007 3.006 1.503 2.000 2.667 1.461 1.826 25 2.744 1.579 1.737 2.422 1.444 1.677 2.540 1.649 1.541 26 2.732 1.332 2.050 2.978 1.474 2.021 3.017 1.477 2.043 27 2.673 1.450 1.843 3.767 1.556 2.421 3.336 1.309 2.549 28 2.786 1.390 2.004 2.829 1.658 1.707 2.853 1.571 1.816 29 3.511 1.513 2.321 2.985 1.268 2.354 2.267 1.194 1.899 30 2.883 1.364 2.114 3.253 1.440 2.259 2.326 1.266 1.838 31 3.487 1.470 2.372 3.074 1.456 2.111 2.313 1.186 1.950 32 3.873 1.722 2.249 2.725 1.422 1.916 2.594 1.360 1.907 33 3.508 1.503 2.334 2.479 1.490 1.663 2.774 1.185 2.342 34 3.468 1.598 2.170 2.905 1.640 1.771 2.545 1.513 1.682 35 3.225 1.581 2.040 2.781 1.507 1.845 2.590 1.526 1.698 36 3.661 1.836 1.994 2.512 1.458 1.723 3.272 1.675 1.954 37 3.165 1.801 1.757 2.669 1.597 1.672 2.249 1.604 1.402 38 2.608 1.587 1.643 2.761 1.860 1.484 1.216 1.116 1.089 39 2.758 1.244 2.218 1.405 1.091 1.288 1.000 1.000 1.000 40 1.982 1.173 1.689 2.437 1.453 1.677 2.456 1.465 1.677 41 1.753 1.230 1.426 2.551 1.651 1.545 2.060 1.513 1.362 42 2.984 1.630 1.831 2.623 1.717 1.528 2.021 1.483 1.363 43 2.503 1.474 1.698 1.613 1.249 1.292 1.577 1.319 1.195 44 2.756 1.372 2.009 2.202 1.237 1.780 2.842 1.361 2.089 45 2.315 1.547 1.497 2.126 1.613 1.318 2.200 1.681 1.309 46 2.233 1.248 1.788 2.207 1.315 1.678 2.420 1.412 1.714 47 1.687 1.179 1.430 1.986 1.419 1.399 2.032 1.242 1.636 48 1.716 1.282 1.339 1.565 1.254 1.248 2.147 1.584 1.356 49 2.308 1.475 1.565 1.957 1.319 1.483 3.234 1.759 1.838 50 2.174 1.398 1.555 1.853 1.435 1.292 2.424 1.689 1.435 51 2.014 1.304 1.544 1.804 1.344 1.343 2.127 1.466 1.452 52 1.883 1.300 1.449 1.595 1.238 1.288 1.310 1.174 1.116
Total 2.573 1.518 1.695 2.392 1.540 1.553 2.317 1.510 1.534

32
TABLE 9 Labour and Capital income multiplier (type I and II) - 1989 Type I Type II Code Description
Labour Capital Labour Capital 1 Agriculture (except animal husbandry) 1.16 4.83 5.17 86.21 2 Animal husbandry 2.01 13.21 1.53 3.20 3 Forestry 1.18 5.80 1.15 3.80 4 Fishing 1.23 5.34 2.19 15.22 5 Coal 1.50 7.21 1.62 5.75 6 Mineral mining 1.20 5.14 2.07 17.33 7 Other mining 1.16 5.25 1.55 7.33 8 Other food stuff 1.78 7.92 2.05 10.99 9 Processed, preserved fruits and vegetables 1.99 8.99 1.46 7.03
10 Alcohol, beer and liquors 2.13 9.84 1.73 7.31 11 Sugar, refined 2.40 10.98 1.47 6.49 12 Tea, coffee processing 1.77 7.44 1.89 21.11 13 Cigarettes and other tobacco products 5.08 25.29 1.37 4.31 14 Processed seafood and by-products 2.71 12.44 1.66 7.27 15 Milling and grain products 2.84 12.71 2.24 11.66 16 Ceramics, glass, porcelain 1.53 7.17 1.85 7.30 17 Bricks, title (all kinds) 1.55 7.42 1.99 7.16 18 Cement 3.71 21.51 1.59 3.76 19 Other construction materials 1.82 8.14 5.64 28.82 20 Paper pulp and paper products and by-products 2.99 14.92 2.76 8.57 21 Processed wood and wood products 1.77 7.82 2.67 15.30 22 Chemical products 2.74 13.68 3.88 12.02 23 Fertilizer, pesticides and veterinary medicine 4.82 24.06 1.90 5.91 24 Health medicine 1.58 7.82 1.51 4.85 25 Processed rubber and by-products 2.14 9.90 1.76 7.32 26 Soap, detergents, perfumes and other toilet preparations 1.73 8.45 1.58 5.27 27 Plastic, plastic products 1.44 7.04 1.57 5.19 28 Other chemical products 1.93 9.27 1.81 6.39 29 Other metallic products 1.13 5.31 1.23 4.81 30 Equipment, machinery 1.21 5.46 1.41 6.63 31 Electrical and electronic products 1.22 7.06 1.16 2.73 32 Ferrous metal and products 1.36 6.54 1.58 5.53 33 Non-Ferrous metal and products except machinery and
equipments 1.21 5.84 1.29 4.50
34 Manufacture of textiles 1.52 6.87 1.72 8.26 35 Carpet and rugs 1.48 6.42 2.77 19.08 36 Leather, footwear, bleaching, dyeing of fabrics 3.30 15.05 4.64 21.08 37 Other industry 1.57 7.27 1.53 6.29 38 Products of publishing house (newspapers, periodicals
and books) 1.07 4.38 1.48 45.78
39 Petroleum, natural gas . . . . 40 Electricity and gasoline 7.37 50.26 1.42 2.88 41 Water 1.81 18.26 1.23 2.13 42 Construction 1.24 5.44 1.89 11.83 43 Trade 1.26 6.67 1.16 3.14 44 Personal repairs 1.48 6.61 2.57 13.65 45 Hotel and restaurants 1.64 7.74 1.58 5.93 46 Freight and passenger transport 1.89 9.15 2.15 7.45 47 Communication services 1.23 6.41 1.20 3.34 48 Banking, credit, treasury, lotto, insurance and retirement
subsidy 1.73 8.99 1.25 3.56
49 Science and technology 2.05 9.81 5.15 18.25 50 State management, defense & compulsory social security 1.52 6.68 2.19 12.78 51 Culture, health, education, sport 1.36 6.19 1.39 6.22 52 Other services (Tourism, Real estate, business and
consultancy services, and other personal services) 1.36 11.12 1.04 1.92

33
TABLE 10 Employment multiplier in 1989, 1996 and 2000 (type I and II)
2000 1996 1989 Code Description I II I II I II
1 Agriculture (except animal husbandry) 1.07 1.73 1.06 2.00 1.13 3.39 2 Animal husbandry 4.79 19.88 6.13 30.36 4.43 47.39 3 Forestry 1.51 17.75 1.27 17.75 2.01 36.78 4 Fishing 1.22 5.04 1.28 10.56 1.15 4.89 5 Coal 1.37 10.67 1.84 13.09 1.55 14.60 6 Mineral mining 1.51 4.24 1.44 5.81 1.17 4.28 7 Other mining 2.01 47.25 2.97 27.74 1.45 22.73 8 Other food stuff 3.19 8.99 4.33 15.17 3.88 33.13 9 Processed, preserved fruits and vegetables 4.44 9.70 8.08 18.45 3.83 18.12
10 Alcohol, beer and liquors 13.36 43.13 8.56 47.69 10.77 92.89 11 Sugar, refined 14.00 29.93 17.56 36.37 5.34 24.82 12 Tea, coffee processing 2.85 5.04 4.09 8.80 6.99 39.11 13 Cigarettes and other tobacco products 15.52 42.49 42.25 119.35 25.39 110.84 14 Processed seafood and by-products 11.31 38.47 6.80 64.78 9.67 58.42 15 Milling and grain products 155.57 261.65 146.22 315.54 8.12 44.55 16 Ceramics, glass, porcelain 1.73 8.79 1.50 10.43 1.45 10.55 17 Bricks, title (all kinds) 1.75 9.22 1.74 14.88 1.60 13.90 18 Cement 2.78 14.15 2.44 20.85 2.18 16.15 19 Other construction materials 2.48 24.85 10.11 85.45 9.56 139.50 20 Paper pulp and paper products and by-products 2.85 16.69 4.10 29.16 2.42 20.51 21 Processed wood and wood products 1.46 5.93 2.83 18.41 2.15 31.61 22 Chemical products 1.16 3.49 1.53 10.13 1.28 3.47 23 Fertilizer, pesticides and veterinary medicine 3.43 32.57 3.09 23.10 2.36 24.92 24 Health medicine 1.69 9.38 2.36 11.22 2.08 16.51 25 Processed rubber and by-products 8.13 31.43 3.91 16.47 9.10 58.92 26 Soap, detergents, perfumes and other toilet preparations 3.21 28.26 2.57 14.65 3.61 34.47 27 Plastic, plastic products 1.88 13.22 1.85 6.26 1.28 4.84 28 Other chemical products 2.37 17.35 8.37 40.87 2.77 18.11 29 Other metallic products 1.68 7.12 1.17 3.62 1.21 13.16 30 Equipment, machinery 2.79 24.14 2.26 14.69 2.87 92.24 31 Electrical and electronic products 3.65 22.73 2.60 21.94 1.36 19.03 32 Ferrous metal and products 6.87 40.61 2.47 32.38 1.91 23.40 33 Non-Ferrous metal and products except machinery and
equipments 4.79 32.35 5.15 50.01 1.76 37.69
34 Manufacture of textiles 6.36 31.65 6.50 39.78 3.29 43.83 35 Carpet and rugs 1.42 3.36 1.45 4.90 1.86 19.31 36 Leather, footwear, bleaching, dyeing of fabrics 1.76 3.71 1.17 2.81 1.14 2.76 37 Other industry 2.18 4.26 2.18 6.86 1.23 5.16 38 Products of publishing house (newspapers, periodicals
and books) 1.16 1.54 1.25 2.50 1.07 10.17
39 Petroleum, natural gas 1.21 4.78 1.07 6.79 . . 40 Electricity and gasoline 1.67 28.96 2.61 44.82 2.58 21.98 41 Water 1.20 7.72 1.84 14.31 1.36 9.80 42 Construction 10.21 91.78 1.91 13.34 1.69 24.31 43 Trade 1.14 3.39 1.11 4.59 1.15 6.22 44 Personal repairs 1.14 2.84 1.09 3.22 1.79 17.76 45 Hotel and restaurants 1.67 5.84 1.56 7.42 1.41 6.91 46 Freight and passenger transport 1.09 3.13 1.14 4.53 1.27 4.34 47 Communication services 1.62 23.53 1.65 17.81 1.13 7.98 48 Banking, credit, treasury, lotto, insurance and retirement
subsidy 2.07 22.10 1.59 25.16 1.38 7.07
49 Science and technology 2.32 21.11 3.29 18.32 1.92 11.22 50 State management, defense & compulsory social security 1.31 4.04 1.32 6.75 1.82 12.58 51 Culture, health, education, sport 1.25 4.41 1.24 5.97 1.15 4.81 52 Other services (Tourism, Real estate, business and
consultancy services, and other personal services) 5.58 106.19 6.01 140.36 2.67 112.67

34
TABLE 11 Output induced by types of final demands – 1989
Year/Type Consumption Investment Export
Type I 1.42 1.45 1.42 1989
Type II 6.50 6.42 6.48
Table 11 presents interesting results, which are output induced by types of final demands in
type I and type II. The results show that, in 1989 impacts of increasing in final demands are
quite balancing. If we consider direct and indirect impacts, with an certain increment ether in
consumption or export, the total output of the nation needed to be produced to satisfy are
equally. Result of type I suggests that investment has highest level. However, the picture is
not the same if we consider the induced effect. Again we see the level of impacts is higher.
But relatively, investment is no longer the top. Induced of consumption is highest followed by
export. It suggests that, in this time, domestic consumption is a most importance factors
which influence the total gross output of the economy.
Table 12 shows the value added induced by types of final demand. In 1989, labour income
generated by any increasing in investment was lowest. It shows that there is a low level of
efficiency of investment or capital formation in generating labour income. Consistence with
picture from table 4-5, household consumption plays a highest level of inducement. The
induced impacts of household consumption on labour income are highest in both tow type of
multipliers, followed by export.
In terms of capital income, there is a shift in the roles of investment. In both types of
multipliers, induced impacts of investment are highest, followed by export.
In short, the results of the exercise from input-output table of 1989 have confirmed our
argument above that the evolutionary movement of Vietnamese economy towards market one
with more integration and an increasing role of international trade. Important roles of export
expansion and domestic final consumption are the motivation induces all the reform process.
And then, liberalizations, one implemented, has it own impacts on domestic consumptions,
import substitutions and export expansions. Different with the previous reform, which is
reform from the “grass-root” or a “bottom-up” one, the economic renovation of 1986-1990 on
the one hand is a Doi Moi programme endogenously, but in the other hand, consistence with
the previous reform, is an evolutionary process, in which government programmes play a role
of accommodator to the economic structural changes of the Vietnamese economy.

35
TABLE 12 Value added induced by types of final demands – 1989
Type I Type II Year Type of
income Household
Consumption Investment Export Household
Consumption Investment Export
Labor income 1.32 1.25 1.33 6.03 5.60 5.94
1989
Capital income 1.46 1.59 1.51 6.53 8.04 7.63
5.2. More Opened Economy, 1990-1996
As pointed out in the previous section, the last phase ends with the collapse of the Soviet
Union and this phase can be marked a great shift in international economic relations
associated by new development in international economic relations, which are shifts from
East European countries to Japan, EU, China (1991), and then ASEAN countries (to be an
ASEAN full member in 1995), and finally the United State (1995). Figure 5 (section 2)
clearly shows that the international trade started to take off since 1989.
Evidence from 1996 input-output table is strongly supportive. As described in table 7, there is
an increasing in outer impact (1.553 in 1996 vs. 1.534 in 1989). In this phase of reform, OM
competitive type is 2.392 (compared to 2.317 in 1989) and OM of non-competitive type is
1.540. It again shows clearly that international trade soared. Taken into account the
contribution of import substitution and export expansion, the total of all outputs from each
industry need to be domestically produced 1.540 units more compared to 2.392 units more
when there are assume no international trade impacts.
As shown in table 8, most of the manufacturing sectors have its high outer impact (greater
than 1.5), any the majority of them are greater than 2.0. These are indeed a record number.
Industries, whose outer impacts in 1989 are close to 1.0 such as sector 2 (Animal husbandry),
sector 38 (Products of publishing house) and even sector 39 (Petroleum and gas) whose outer
impact in 1989 is zeros, shows its integration into the world economy.
Looking at the level of labour and capital income multiplier (table 13), we could see there is a
shift in level of labour income multipliers. Labour income generated in manufacturing
industries due to any increment in domestic final demand is higher compared to the previous
phase. It also reflects the fact that there is a trend in allocation of productive factors towards

36
labour intensive manufacture. Contrast to this, in agriculture and some of the service sector
and state management sectors, labour income multipliers decrease slightly.
In term of capital, there are a sharp decrease in agriculture (sector 1), fishing (sector 4) and all
kind of mining (sector 6, 7) compared in the previous phase. There is also an boost in capital
income multipliers of the manufacturing sectors but not all. Hence, the picture still reflects
the technology of a nation at this time, where most of sectors are labour intensive.
The employments multipliers (table 13) show the increases in employment throughout the
Vietnamese economy compared with the previous phase. Most of sectors have its higher level
of multipliers, particularly in sector 9 (processed, preserved fruits and vegetable), sector 11
(sugar, refined), sector 15 (milling and grain products) and sector 34 (manufacture of textile)
which are high-labour intensive sectors, employment multipliers are more than double.
Output induced by types of final demand presented in table 14 (type I and type II). The results
(type I) show that, balancing impacts among all types of final demand, which taken in the
previous phase, no longer remain. In 1996 impact is highest in investment, followed by
export and lowest in consumption. If we consider not only direct and indirect impacts, but
also induced impacts, we see the level of impacts is much higher. But relatively, investment is
no longer the top. Induce by consumption is highest followed by export. It suggests that, in
this time, domestic consumption and export are still most importance factors which influence
the total gross output of the economy.
TABLE 14 Output induced by types of final demands – 1996 and 2000
Year/Type Consumption Investment Export
Type I 1.51 1.67 1.54 1996
Type II 5.48 4.71 5.14
Type I 1.57 1.62 1.54 2000
Type II 4.33 3.59 3.93

37
TABLE 13 Labour and Capital income multiplier (type I and II) - 1996
Type I Type II Code Description Labour Capital Labour Capital
1 Agriculture (except animal husbandry) 1.11 3.39 1.41 16.32 2 Animal husbandry 1.38 4.31 1.96 14.42 3 Forestry 1.13 3.54 1.33 10.05 4 Fishing 1.19 3.78 1.56 9.33 5 Coal 1.60 5.88 1.61 4.46 6 Mineral mining 1.55 5.43 1.86 5.82 7 Other mining 2.73 14.93 1.24 2.34 8 Other food stuff 3.87 12.91 2.29 8.88 9 Processed, preserved fruits and vegetables 4.31 13.96 2.43 11.66
10 Alcohol, beer and liquors 1.98 8.23 1.28 2.91 11 Sugar, refined 15.07 50.31 1.82 7.09 12 Tea, coffee processing 3.32 10.71 1.89 9.21 13 Cigarettes and other tobacco products 2.91 10.14 1.36 4.35 14 Processed seafood and by-products 2.99 9.74 2.44 10.96 15 Milling and grain products 8.38 26.76 2.40 13.04 16 Ceramics, glass, porcelain 1.63 6.87 1.48 3.30 17 Bricks, title (all kinds) 2.04 7.73 1.49 3.85 18 Cement 2.60 14.15 1.38 2.61 19 Other construction materials 3.27 12.74 3.78 9.37 20 Paper pulp and paper products and by-products 4.06 15.30 2.03 5.33 21 Processed wood and wood products 3.70 12.59 2.79 9.79 22 Chemical products 1.67 5.74 1.70 5.78 23 Fertilizer, pesticides and veterinary medicine 2.19 8.13 2.72 7.35 24 Health medicine 2.05 8.03 1.64 4.02 25 Processed rubber and by-products 1.79 6.27 1.50 4.69 26 Soap, detergents, perfumes and other toilet preparations 2.35 8.56 2.20 6.19 27 Plastic, plastic products 3.57 14.17 2.16 5.17 28 Other chemical products 2.82 9.86 2.77 8.82 29 Other metallic products 1.37 4.78 1.52 4.93 30 Equipment, machinery 2.06 7.16 3.06 9.96 31 Electrical and electronic products 1.74 6.35 1.82 5.10 32 Ferrous metal and products 1.57 5.82 1.44 3.92 33 Non-Ferrous metal and products except machinery and
equipments 1.66 5.92 1.71 5.06
34 Manufacture of textiles 2.22 8.05 1.89 5.36 35 Carpet and rugs 1.71 6.22 1.52 4.27 36 Leather, footwear, bleaching, dyeing of fabrics 1.42 4.79 1.75 6.42 37 Other industry 2.01 7.04 1.67 5.23 38 Products of publishing house (newspapers, periodicals
and books) 2.20 8.25 1.75 4.62
39 Petroleum, natural gas 1.05 3.32 1.20 7.26 40 Electricity and gasoline 1.34 4.54 1.53 5.52 41 Water 2.84 12.27 1.35 2.94 42 Construction 1.83 7.11 2.37 5.87 43 Trade 1.15 4.07 1.19 3.62 44 Personal repairs 1.23 4.99 1.11 2.59 45 Hotel and restaurants 1.87 7.79 1.30 2.95 46 Freight and passenger transport 1.34 5.40 1.32 3.10 47 Communication services 1.40 5.42 1.42 3.56 48 Banking, credit, treasury, lotto, insurance and retirement
subsidy 1.19 4.52 1.20 3.09
49 Science and technology 1.24 3.77 . . 50 State management, defense & compulsory social security 1.25 3.91 4.15 28.40 51 Culture, health, education, sport 1.18 3.75 1.74 9.87 52 Other services (Tourism, Real estate, business and
consultancy services, and other personal services) 1.20 5.52 1.08 2.25

38
Table 15 shows the value added induced by types of final demand. In 1996, labour income
generated by any increasing in household consumption is lowest. It shows that even
consumption is a most importance factors influences the total gross output of the economy,
but it contribution to GDP is lowest. Hence, there is a low level of efficiency of household
consumption investment or capital formation in generating labour income. Regarding to
capital income, the most importance source is investment. Export expansion and household
consumption plays a same role. Investment plays a same critical role in both type I and II of
multiplier. It shows the importance of capital formation in this phase of economic
development. It also consistence with the neo-classical argument of industrialization, when
the economy is shifted, in the longer-time, apart from expansion of the economy it is a
technological change process, hence its trend reflected by importance role of capital intensive
sectors.
TABLE 15 Value added induced by types of final demands – 1996 and 2000
Type I Type II Year Type of
income Household
Consumption Investment Export Household
Consumption Investment Export
Labor income 1.62 1.76 1.73 5.43 6.69 6.06
1996
Capital income 1.45 2.20 1.46 5.51 5.63 4.62
Labor income 1.69 1.69 1.64 4.32 4.80 4.53
2000
Capital income 1.69 1.72 1.46 4.81 3.61 3.23
5.3. Economic Slowdown, 1996-2000
As presented in the section 2, widely-observed feature of the economy in this period is its
slowdown which resulted partly from to the Asian crisis in 1997.
The economic slowing down trend is quite obviously if we look at the output induced by
types of final demands in 2000 (table 14), all impact levels of consumption, investment and
export are lower than those of 1996. This shows the less efficiency of the economy.
Contribution to GDP of investment still plays a highest role (table 15) but the different
between type I and type II multipliers are narrowed. It reflects the slowing down trend of the

39
economy. Among the decreasing in efficiency of all types of final demand, the worse one is
investment. Lowest level of efficiency in investment is a critical reason why the is a
decreasing in share of foreign investment in GDP this phase.
Look at the level of OMs (table 7), we still perceive the increasing in level of outer impact. In
2000, impact from international trade is 1.695 compared with 1.540 in 1996 and 1.534 in
1989. It, again, shows obviously the importance role of economic integration, or saying in the
other way of import substitution and export expansion. Vietnam now is on the way to be fully
integrated in ASEAN group and is a new member of WTO. This trend is evitable and
unchangeable.
6. Conclusion
In this paper we are trying to explain the economic history of Vietnam from 1986 up to
present as a continuous historical process, in which many policies were, in one hand,
endogenous (forced to be carried out by the economic conditions with only one choice), and
in the other, in turns, by being dominated by the ideological views, had substantially
influence the economic development. The result from three national IO tables strong support
for the evolutionary movement of Vietnamese economy, or in our terminology, a bottom-up
process, in which Doi Moi is a critical point marks the shift of Vietnamese economy from
planned economy to marker oriented one. Hence, we could say integration in to the
international market is inevitable and domestic final demand, through its impact of
consumption, investment and export, play a vital role not only in the wealth of nation (gross
output) but also in improvement of welfare (GDP).
Since movements of Vietnamese economy there is an evolutionary process, any movement
against this trend will caused the sufferings to the economy. Government programmes, hence,
have played and should play a vital role of accommodator to the economic structural changes
of the Vietnamese economy.

40
TABLE 16 Labour and Capital income multiplier (type I and II) - 2000 Type I Type II Code Description
Labour Capital Labour Capital 1 Agriculture (except animal husbandry) 1.15 2.77 1.38 6.06 2 Animal husbandry 1.38 3.38 1.72 6.18 3 Forestry 1.16 3.06 1.21 3.00 4 Fishing 1.21 3.19 1.29 3.25 5 Coal 1.25 3.35 1.26 2.97 6 Mineral mining 1.63 4.47 1.71 3.86 7 Other mining 1.31 4.10 1.17 2.18 8 Other food stuff 2.77 7.41 2.29 5.44 9 Processed, preserved fruits and vegetables 2.36 6.24 1.61 3.98
10 Alcohol, beer and liquors 1.94 5.19 1.83 4.40 11 Sugar, refined 3.90 11.47 1.45 2.88 12 Tea, coffee processing 2.80 7.13 1.93 5.54 13 Cigarettes and other tobacco products 4.80 14.70 2.12 4.02 14 Processed seafood and by-products 8.65 23.59 3.62 8.21 15 Milling and grain products 21.84 53.48 6.35 23.39 16 Ceramics, glass, porcelain 1.58 4.37 1.71 3.76 17 Bricks, title (all kinds) 2.12 7.13 1.59 2.80 18 Cement 3.18 10.07 2.11 3.88 19 Other construction materials 1.39 3.78 1.71 3.90 20 Paper pulp and paper products and by-products 2.27 7.03 1.72 3.24 21 Processed wood and wood products 3.05 8.89 1.78 3.59 22 Chemical products 1.33 3.73 1.39 3.00 23 Fertilizer, pesticides and veterinary medicine 1.56 4.58 1.43 2.86 24 Health medicine 1.30 3.49 1.39 3.31 25 Processed rubber and by-products 1.87 5.07 1.67 3.85 26 Soap, detergents, perfumes and other toilet preparations 1.36 3.67 1.53 3.56 27 Plastic, plastic products 1.51 4.33 1.48 3.07 28 Other chemical products 1.36 3.77 1.38 3.02 29 Other metallic products 1.61 4.50 1.60 3.46 30 Equipment, machinery 1.34 3.68 1.38 3.07 31 Electrical and electronic products 1.72 4.77 1.73 3.77 32 Ferrous metal and products 2.51 7.09 2.43 5.15 33 Non-Ferrous metal and products except machinery and
equipments 1.69 4.65 1.77 3.93
34 Manufacture of textiles 2.14 6.23 1.82 3.67 35 Carpet and rugs 1.79 5.00 1.80 3.88 36 Leather, footwear, bleaching, dyeing of fabrics 2.58 7.29 2.37 5.02 37 Other industry 2.79 7.65 2.00 4.50 38 Products of publishing house (newspapers, periodicals
and books) 1.51 4.36 1.48 3.02
39 Petroleum, natural gas 1.32 3.66 1.49 3.28 40 Electricity and gasoline 1.13 3.27 1.12 2.28 41 Water 1.17 3.36 1.14 2.34 42 Construction 1.67 4.86 1.74 3.52 43 Trade 1.44 4.00 1.43 3.14 44 Personal repairs 1.29 3.29 1.62 4.57 45 Hotel and restaurants 1.56 4.29 1.46 3.22 46 Freight and passenger transport 1.24 3.46 1.19 2.56 47 Communication services 1.13 3.40 1.09 2.12 48 Banking, credit, treasury, lotto, insurance and retirement
subsidy 1.22 3.40 1.24 2.72
49 Science and technology 1.36 3.44 1.75 5.11 50 State management, defense & compulsory social security 1.24 3.00 2.32 9.32 51 Culture, health, education, sport 1.17 2.89 1.44 4.84 52 Other services (Tourism, Real estate, business and
consultancy services, and other personal services) 1.19 3.18 1.27 3.02

41
Reference
Alpert, W.T., (ed) (2005). The Vietnamese Economy and Its Transformation to an Open
Market System (New York: M.E. Sharpe).
Beresford, M. and Phong, D. (2000). Economic Transition in Vietnam: Trade and Aid in the
Demise of the Centrally Planned Economy (Edward Elgar).
Boothroyd, P. and Pham Xuan Nam, eds. (2000). Socioeconomic Renovation in Vietnam- the
Origin, Evolution, and Impact of DoiMoi (International Development Research Centre
& Institute of Southeast Asian Studies).
Central Institute for Economic Management (2003). Kinh te Viet Nam 2002 (The Vietnamese
Economy 2002) (Hanoi: National Politics Publishing House).
Central Institute for Economic Management (2005). Kinh te Viet Nam 2004 (The Vietnamese
Economy 2004) (Hanoi: Science and Technology Publishing House).
Dang, T.T. (1994) Vietnam – Socialist Economic Development 1955-1992, Country Studies
No. 12, International Center for Economic Growth.
Dapice, D. (1993). “Vietnam at the starting point: Just another East Asian Economy?” in
Ljunggren, B. ed. (1993). The Challenge of Reform in Indochina (Cambridge MA:
Harvard Institute for International Development).
Doanh, L. D. (1996), “Economic Developments and Prospects,” in Suiwah Leung, ed. (1996),
Vietnam Assessment – Creating a Sound Investment Climate, Institute of Southeast
Asian Studies, Singapore and National Centre for Development Studies, Australia, pp.
6-20.
Dodswort, J. R. et al. (1996), “Vietnam: Transition to a Market Economy,” IMF Occasional
Paper, No. 135 (Washington D.C.: International Monetary Fund).
Dollar, D. (1993). “Vietnam: Successes and Failures of Macroeconomic Stabilization”, in
Ljunggren, B. ed. (1993). The Challenge of Reform in Indochina (Cambridge MA:
Harvard Institute for International Development).
Fforde, A. and Vylder, S. (1996a). “Viet Nam” part 3 in Pradumna, B. R. and Navaed, H.
(1996). From Centrally Planned to Market Economies: The Asian Approach, Vol 3: Lao
PDR, Myanmar and Viet Nam (Hong Kong: Oxford University Press).

42
Fforde, A. and Vylder, S. (1996b). From Plan to Market: The Economic Transition in
Vietnam (Westview Press).
Griffin, K. ed. (1998). Economic Reform in Vietnam (London: Macmillan Press).
Harvie, C. & Hoa, T.V. (1997). Vietnam’s reforms and Economic Growth (London:
Macmillan).
Keynes, J.M. (1949). The General theory of employment interest and money (London:
Macmillan).
Khiem, N.T. (1996) “Policy Reform and the Microeconomic Environment in the Agricultural
Sector” in Leung, S. (ed) (1996) Vietnam Assessment – Creating a Sound Investment
Climate, Institute of Southeast Asian Studies, Singapore, and National Centre for
Development Studies, Australia, pp 21-41.
Kokko, A. (1999), “Vietnam: Ready for Doi Moi II?” pp 81-92 in H.W. Arndt and Hal Hill,
eds (1999), Southeast Asia’s Economic Crisis, Singapore: Institute of Southeast Asian
Studies.
Kompas, T. (2002), “Market Reform, Productivity and Efficiency in Vietnamese Rice
Production,” working paper, National Centre for Development Studies, Australian
National University.
Litvack, J. and Rondinelli, D. (1999). Market Reform in Vietnam: Building Institutions for
development (Westport: Quorum Books).
Ljunggren, B. ed. (1993), The Challenge of Reform in Indochina. Harvard Institute for
International Development, Cambridge.
Marr, D. & White, C. (eds) (1988). Postwar Vietnam: Dilemmas in Socialist Development,
(New York: Southeast Asia Program, Cornell University).
Miyazawa, K. (1976) Input-Output Analysis and the Structure of Income Distribution (Berlin:
Springer-Verlag).
Murano, T. and Takeuchi, I. (eds) (1992) Indochina Economic Reconstruction and
International Cooperation (Tokyo: Institute of Developing Economies).
Ngoc, Q.P. and Thanh, D.N. (2005) “Structural change and economic performance of
Vietnam, 1976-2000”. Singapore Economic Review Conference (SERC) 2005 organised
by the Singapore Economic Review, 4 – 6 August, Singapore.

43
Ngoc, Q.P. Trinh, B. and Thanh D.N. (2006) “Structural change and economic performance
of a country in transition”. Paper for the Public Economic Theory 2006 Hanoi (PET
06 Hanoi) on July 31 - August 2, 2006.
Ngoc Q.P., Trinh, B. and Thanh D.N. (2006). “Structural change and economic performance
of Vietnam 1986-2000: Evidence from Vietnam Input-output tables”. Paper for the
Intermediate Input-Output Meetings 2006 on Sustainability, Trade & Productivity,
Sendai, Japan, July 26 - 28, 2006.
Riedel, J. & Comer, B. (1997). “Transition to a Market Economy in Vietnam,” pp. 189-213 in
Wing Thye Woo, Stephan Parker and Jeffrey D. Sachs (eds) Economies in Transition:
Comparing Asia and Eastern Europe, Chapter 7 (Cambridge, MA: MIT Press).
Rozelle, S. & Swinnen J.F.M. (2004). “Success and Failure of Reform: Insights from the
Transition of Agriculture”, Journal of Economic Literature, XLII (2), pp. 404-456.
Tetsusaburo, K. (1989), The Vietnamese Economy 1975-86: Reforms and International
Relations, Institute of Developing Economies, Tokyo.
Than, M. & Tan, J.L.H. (1993). Vietnam’s Dilemmas and Options (Singapore: Institute of
Southeast Asian Studies).
Thọ, V.T., Đức, N.N., Chỉnh, V.N. and Quán, N. (2000) Kinh tế Việt nam 1955-2000, tính
toán mới phân tích mới (The Vietnamese Economy 1955-2000, new calculations and
new analyes) (Hanoi: Statistical Publishing House).
Tri, N.V. (1990) Vietnamese Economic Policy Since 1975 (Singapore: Institute of Southeast
Asian Studies).
Trinh, B., Thanh, H. L., Toan, M. N and Chon, L. V. (2005). Analyzing the relationship
between income groups and final demand in Vietnam based on extended IO framework.
Mimeo.
Xuan, D.T. (2000) Vietnam’s Economy, After the Asian Crisis, Asian Pacific Economic
Literature, 14 (1), pp. 36-43.
Wolff, P. (1999) Vietnam – the Incomplete Transformation, German Book Series No 12,
(London: Frank Cass).
Womack, B. (1997) Vietnam in 1996: Reform Immobilism, Asian Survey, 37 (1), A Survey
of Asia in 1996: Part I (Jan., 1997), pp. 79-87.

44
World Bank (2005), Vietnam: Key Economic Indicators. (see:
http://siteresources.worldbank.org/INTVIETNAM/Resources/Vaitnam-Indicators-
Nov04.pdf)

ANNEX 1 Sector Classification and Aggregation
Code Description Code 2000 Code 1996 Code 1989 1 Agriculture (except animal husbandry) 01-06 01-05 37 2 Animal husbandry 07-12 06-10 38 3 Forestry 13 11 39 4 Fishing 14, 15 12 24 5 Coal 16 13 2 6 Mineral mining 17 15 3 7 Other mining 18-21 14, 16, 17 4 8 Other food stuff 22-25 18-21 31 9 Processed, preserved fruits and vegetables 26 22 26
10 Alcohol, beer and liquors 27-29 23, 24 30 11 Sugar, refined 30 25 25 12 Tea, coffee processing 31, 32 26, 27 27 13 Cigarettes and other tobacco products 33 28 28 14 Processed seafood and by-products 34 29 29 15 Milling and grain products 35, 36 30 23 16 Ceramics, glass, porcelain 37, 38 31, 32 22 17 Bricks, title (all kinds) 39 36 18 18 Cement 40 35 17 19 Other construction materials 41, 42 37, 38 19 20 Paper pulp and paper products and by-products 43 33 21 21 Processed wood and wood products 44 34 20 22 Chemical products 45, 46 39, 40 10 23 Fertilizer, pesticides and veterinary medicine 47-50 41, 42 11 24 Health medicine 51 43 14 25 Processed rubber and by-products 52 44 12 26 Soap, detergents, perfumes and other toilet preparations 53, 54 45 13 27 Plastic, plastic products 55, 56 46, 47 15 28 Other chemical products 57,58,59 48, 49 16 29 Other metallic products 60-64, 66 50-54 9 30 Equipment, machinery 65, 67-69 55, 56 7 31 Electrical and electronic products 70-72 57, 58 8 32 Ferrous metal and products 73 59 5 33 Non-Ferrous metal and products except machinery and equipments 74 60 6 34 Manufacture of textiles 75-77 61, 62 32 35 Carpet and rugs 78, 79 63, 64 33 36 Leather, footwear, bleaching, dyeing of fabrics 80, 81 65, 66 34 37 Other industry 82, 83, 85 67-69, 71 36 38 Products of publishing house (newspapers, periodicals and books) 84 70 47 39 Petroleum, natural gas 86 72, 73 55 40 Electricity and gasoline 87 74, 75 1 41 Water 88 76 35 42 Construction 89, 90 77 40 43 Trade 91 78 44, 46 44 Personal repairs 92 79 53 45 Hotel and restaurants 93, 94 80 45 46 Freight and passenger transport 95-98 81-84 41, 42 47 Communication services 99 85 43 48 Banking, credit, treasury, lotto, insurance and retirement subsidy 101-103 87, 88 48 49 Science and technology 104 89 50 50 State management, defense & compulsory social security 107, 111 91, 95 49, 54 51 Culture, health, education, sport 108-110 92-94 51 52 Other services (Tourism, Real estate, business and consultancy
services, and other personal services) 100, 105, 106, 112
86, 90, 96, 97
52
Copyright © 2022 FDOKUMEN