victoria university of wellington graduate school of business ...
37
VICTORIA UNIVERSITY OF WELLINGTON GRADUATE SCHOOL OF BUSINESS AND GOVERNMENT MANAGEMENT WORKING PAPER SERIES 8/92 A description of the advertising and direct marketing decision processes of the New Zealand marketing managers Peter Thirkell* and David Stewart* * Marketing Group Faculty of Commerce and Administration Victoria University of Wellington October 1992 ISSN 0114 7420 ISBN O 475 11452-3
-
Upload
khangminh22 -
Category
Documents
-
view
3 -
download
0
Transcript of victoria university of wellington graduate school of business ...
VICTORIA UNIVERSITY OF WELLINGTON
GRADUATE SCHOOL OF BUSINESS
AND GOVERNMENT MANAGEMENT
WORKING PAPER SERIES 8/92
A description of the advertising
and direct marketing decision processes
of the New Zealand marketing managers
Peter Thirkell*
and
David Stewart*
* Marketing Group Faculty of Commerce and Administration Victoria University of Wellington
October 1992
ISSN 0114 7420 ISBN O 475 11452-3
ABSTRACT
A critical component of the marketing mix for most organisations is the development and execution of an effective communications strategy. Yet managers often have little guidance in advertising and promotional decisions other than past practice within their own organisations, or rules of thumb formed over years of training and experience. The New Zealand Advertising and Direct Marketing Project was initiated as a baseline study with the objective of better understanding the beliefs, opinions and practices of marketing managers in respect of marketing communications within their orgainsations.
A sample of about 200 large companies known to have reasonably significant advertising budgets was surveyed late in 1991. A usable sample of 91 actual responses forms the basis of a generally descriptive survey which examines: what managers believe about advertising and its effects, how the advertising function is organised, the setting and allocating of budgets, rules of thumb which guide advertising practice, measures of advertising effectiveness, and general issues to do with the future of advertising and direct marketing. The results provide an interesting benchmark against which practitioners can assess their own particular beliefs and practices, as well as a good overview of management practice for marketing students and educators. Where appropriate, the results are broken down into four predominant industry categories: fastmoving consumer goods, consumer durables, financial services, and business to business marketers.
KEY WORDS
Advertising, direct marketing, beliefs, practices.

1 1. INTRODUCTION
In December 1991 the first ever national survey of advertising and direct marketing was initiated by the Marketing Group at Victoria University. The research objectives of this first stage were to increase understanding of the beliefs and principles which underlie sound advertising and direct marketing practice, so as to assist New Zealand marketing managers in making better advertising decisions through gaining insight into generally accepted views and practices. A further benefit of the study was to assist marketing students in better understanding the practical aspects of advertising decision-making and budgeting in medium to large enterprises.
An increasingly important goal of any marketing department should be to strengthen the links between practitioners and the university itself, so as to provide mutual understanding and support. This project has provided an opportunity for marketing practitioners to contrast their own views and· practices with other managers, as well as highlighting some important relationships and rules of thumb uncovered during the study. A number of the participating managers commented that the survey form provided a useful self-audit of advertising within their own firms, and were optimistic about the benefits to be accrued from similar studies being conducted on an annual basis to monitor trends and shifts over time.
The principle objective of this survey was to solicit information about the advertising and direct marketing beliefs, opinions and practices of marketing managers ( or their equivalent) in medium to large enterprises throughout New Zealand. The information obtained provides a baseline against which future similar studies can be compared, and as a point of reference for other surveys exploring specific aspects of the subject area in greater depth. The insights gained in this base-line study are only the beginning of an ongoing programme of research aimed at gaining further insights into existing beliefs and practice in the area of advertising and direct marketing. It is hoped however that these preliminary results will be of value and interest to marketing managers, advertising executives and academics involved in business education generally in enhancing our understanding of communications decision processes within organisations.
We are grateful to the many managers who took a genuine interest in this study, and gave freely of their scarce time resources in completing the detailed questionnaire. It is our hope that this first output from the New Zealand Advertising and Direct Marketing programme will be of interest and value, and we thank you particularly for the support provided.
We also gratefully acknowledge the financial support of the Graduate School of Business and Government at Victoria University, and of New Zealand Post, without whose support this study would not have been possible. This study was conducted entirely independently of these sponsors however, and any responsibility for omissions or oversights rests entirely with the authors.
Professor Peter Thirkell Mr David Stewart Victoria University of Wellington
June 1992
2
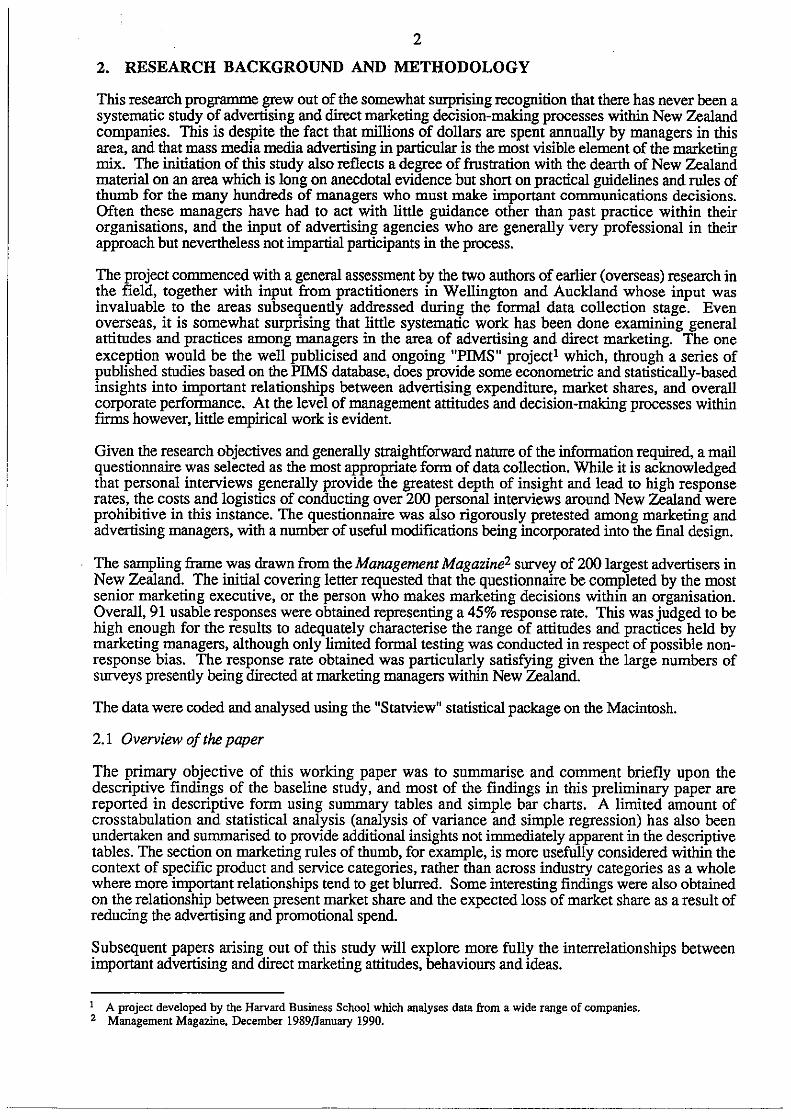
2. RESEARCH BACKGROUND AND METHODOLOGY
This research programme grew out of the somewhat surprising recognition that there has never been a systematic study of advertising and direct marketing decision-making processes within New Zealand companies. This is despite the fact that millions of dollars are spent annually by managers in this area, and that mass media media advertising in particular is the most visible element of the marketing mix. The initiation of this study also reflects a degree of frustration with the dearth of New Zealand material on an area which is long on anecdotal evidence but short on practical guidelines and rules of thumb for the many hundreds of managers who must make important communications decisions. Often these managers have had to act with little guidance other than past practice within their organisations, and the input of advertising agencies who are generally very professional in their approach but nevertheless not impartial participants in the process.
The project commenced with a general assessment by the two authors of earlier (overseas) research in the field, together with input from practitioners in Wellington and Auckland whose input was invaluable to the areas subsequently addressed during the formal data collection stage. Even overseas, it is somewhat surprising that little systematic work has been done examining general attitudes and practices among managers in the area of advertising and direct marketing. The one exception would be the well publicised and ongoing "PIMS" project1 which, through a series of published studies based on the PIMS database, does provide some econometric and statistically-based insights into important relationships between advertising expenditure, market shares, and overall corporate performance. At the level of management attitudes and decision-making processes within firms however, little empirical work is evident
Given the research objectives and generally straightforward nature of the information required, a mail questionnaire was selected as the most appropriate form of data collection. While it is acknowledged that personal interviews generally provide the greatest depth of insight and lead to high response rates, the costs and logistics of conducting over 200 personal interviews around New Zealand were prohibitive in this instance. The questionnaire was also rigorously pretested among marketing and advertising managers, with a number of useful modifications being incorporated into the final design.
The sampling frame was drawn from the Management Magazine2 survey of 200 largest advertisers in New Zealand. The initial covering letter requested that the questionnaire be completed by the most senior marketing executive, or the person who makes marketing decisions within an organisation. Overall, 91 usable responses were obtained representing a 45% response rate. This was judged to be high enough for the results to adequately characterise the range of attitudes and practices held by marketing managers, although only limited formal testing was conducted in respect of possible nonresponse bias. The response rate obtained was particularly satisfying given the large numbers of surveys presently being directed at marketing managers within New Zealand.
The data were coded and analysed using the "Statview" statistical package on the Macintosh.
2.1 Overview of the paper
The primary objective of this working paper was to summarise and comment briefly upon the descriptive findings of the baseline study, and most of the findings in this preliminary paper are reported in descriptive form using summary tables and simple bar chans. A limited amount of crosstabulation and statistical analysis (analysis of variance and simple regression) has also been undertaken and summarised to provide additional insights not immediately apparent in the descriptive tables. The section on marketing rules of thumb, for example, is more usefully considered within the context of specific product and seivice categories, rather than across industry categories as a whole where more important relationships tend to get blurred. Some interesting findings were also obtained on the relationship between present market share and the expected loss of market share as a result of reducing the advertising and promotional spend.
Subsequent papers arising out of this study will explore more fully the interrelationships between important advertising and direct marketing attitudes, behaviours and ideas.
1 A project developed by the Harvard Business School which analyses data from a wide range of companies. 2 Management Magazine. December 1989/January 1990.
3
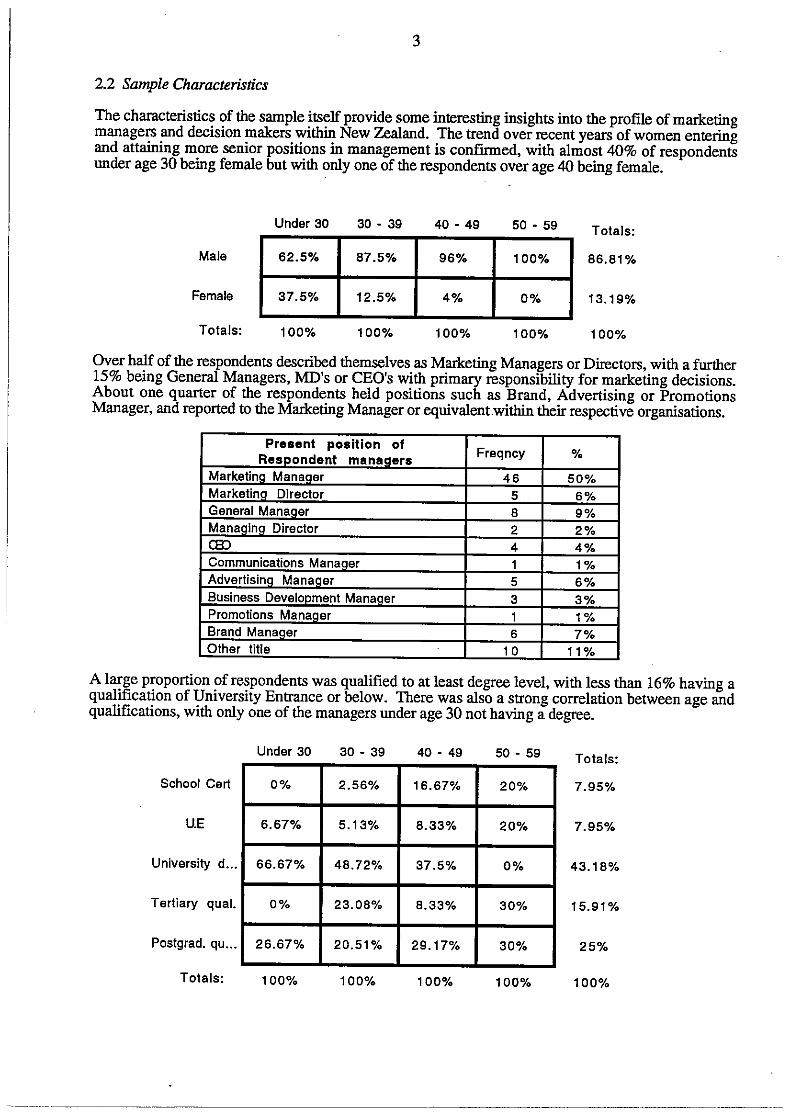
2.2 Sample Characteristics
The characteristics of the sample itself provide some interesting insights into the profile of marketing managers and decision makers within New Zealand. The trend over recent years of women entering and attaining more senior positions in management is confirmed, with almost 40% of respondents under age 30 being female but with only one of the respondents over age 40 being female.
Male
Female
Totals:
Under 30
62.5%
37.5%
100%
30 - 39
87.5%
12.5%
100%
40 - 49
96%
4%
100%
50 • 59
100%
0%
100%
Totals:
86.81%
13.19%
100%
Over half of the respondents described themselves as Marketing Managers or Directors, with a further 15% being General Managers, MD's or CEO's with primary responsibility for marketing decisions. About one quarter of the respondents held positions such as Brand, Advertising or Promotions Manager, and reported to the Marketing Manager or equivalent.within their respective organisations.
Present position of Freqncy % Res0ondent manaaers
Marketina Manaaer 46 50% Marketina Director 5 6% General Manaaer B 9% Manaaina Director 2 2% CBJ 4 4% Communications Manaaer 1 1% Advertisina Manaaer 5 6% Business Develooment Manaaer 3 3% Promotions Manaaer 1 1% Brand Manaaer 6 7% Other title 10 11%
A large proportion of respondents was qualified to at least degree level, with less than 16% having a qualification of University Entrance or below. There was also a strong correlation between age and qualifications, with only one of the managers under age 30 not having a degree.
Under 30 30 - 39
School Cert 0% 2.56%
U.E 6.67% 5.13%
University d •.. 66.67% 48.72%
Tertiary qual. 0% 23.08%
Postgrad. qu •.. 26.67% 20.51%
Totals: 100% 100%
40 - 49
16.67%
8.33%
37.5%
8.33%
29.17%
100%
50 - 59
20%
20%
0%
30%
30%
100%
Totals:
7.95%
7.95%
43.18%
15.91%
25%
100%
4
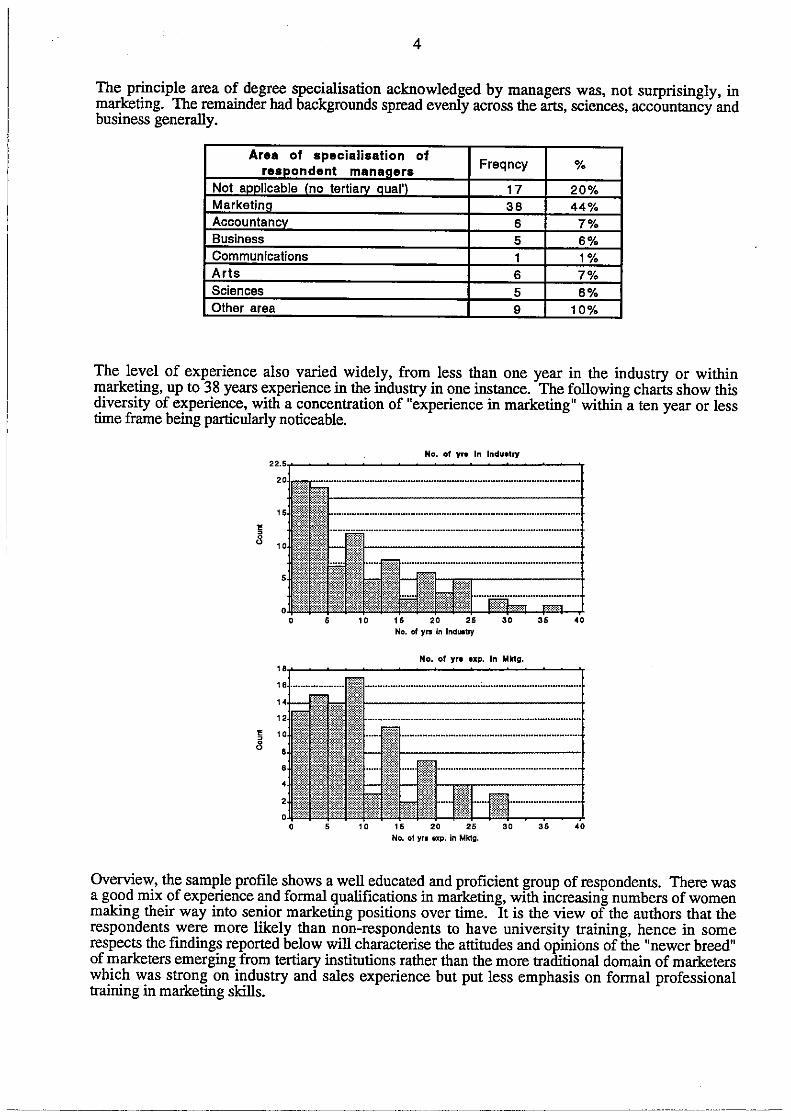
The principle area of degree specialisation acknowledged by managers was, not surprisingly, in marketing. The remainder had backgrounds spread evenly across the arts, sciences, accountancy and business generally.
Area of apecialisation of Freqncy % respondent manaaers
Not aoolicable (no tertiarv aual'\ 17 20% MarketinQ 38 44% Accountancy 6 7% Business 5 6% Communications 1 1% Arts 6 7% Sciences 5 6% Other area 9 10%
The level of experience also varied widely, from less than one year in the industry or within marketing, up to 38 years experience in the industry in one instance. The following charts show this diversity of experience, with a concentration of "experience in marketing" within a ten year or less time frame being particularly noticeable.
~
8
No. of yr-. In lndu•try 22.s,...._----------~---------;-20Jim==-----------------t tit~~; "!----------------,-
........ 0 5 10 15 20 25 30 35 " No. of yrs in lndU1try
No. of yr• exp. In Mktg. 1•------------~---------;-16 ifil.1---------'--------+
0 5 10 15 20 25 30 No. ol yr, eXp. in Mktg.
35 "
Overview, the sample profile shows a well educated and proficient group of respondents. There was a good mix of experience and formal qualifications in marketing, with increasing numbers of women making their way into senior marketing positions over time. It is the view of the authors that the respondents were more likely than non-respondents to have university training, hence in some respects the findings reported below will characterise the attitudes and opinions of the "newer breed" of marketers emerging from tertiary institutions rather than the more traditional domain of marketers which was strong on industry and sales experience but put less emphasis on formal professional training in marketing skills.

5
3. OVERVIEW AND DISCUSSION OF FINDINGS
The main findings of the research are reported in the next section in tabular and graphical form. The questionnaire was divided into seven main sections covering the major decision areas faced by managers when formulating their marketing communications programmes and strategies. These sections are as follows:
• Beliefs and opinions about advertising
• Organising the advertising and direct marketing function
• Setting and allocating the budget
• Marketing rules of thumb
• Measuring advertising effectiveness
• Advertising and direct marketing issues
• Background information on respondent companies
As these sections logically follow the key aspects of advertising and direct marketing planning, a similar format is followed in the overview and discussion.
3.1 Beliefs and opinions about advertising
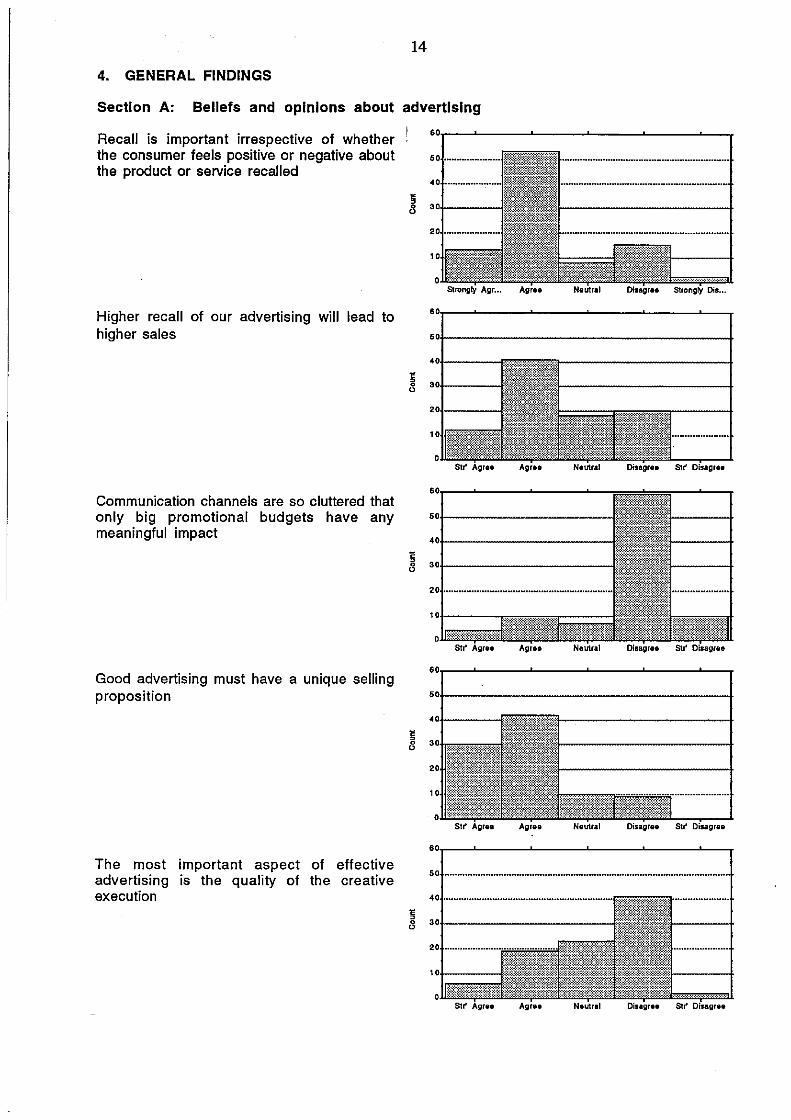
Managers generally accept that recall of advertisements is important irrespective of whether the consumer attitude is positive or negative, and most also see a direct relationship between recall and sales. It is still the prevailing view that good advertising needs a unique selling proposition (USP). Managers still see positioning as the key strategic issue facing their organisations. They downplay however the importance of creative execution, despite the fact that many advertising experts rate this as the most important aspect in determining advertising effectiveness, and certainly an important determinant of positioning.
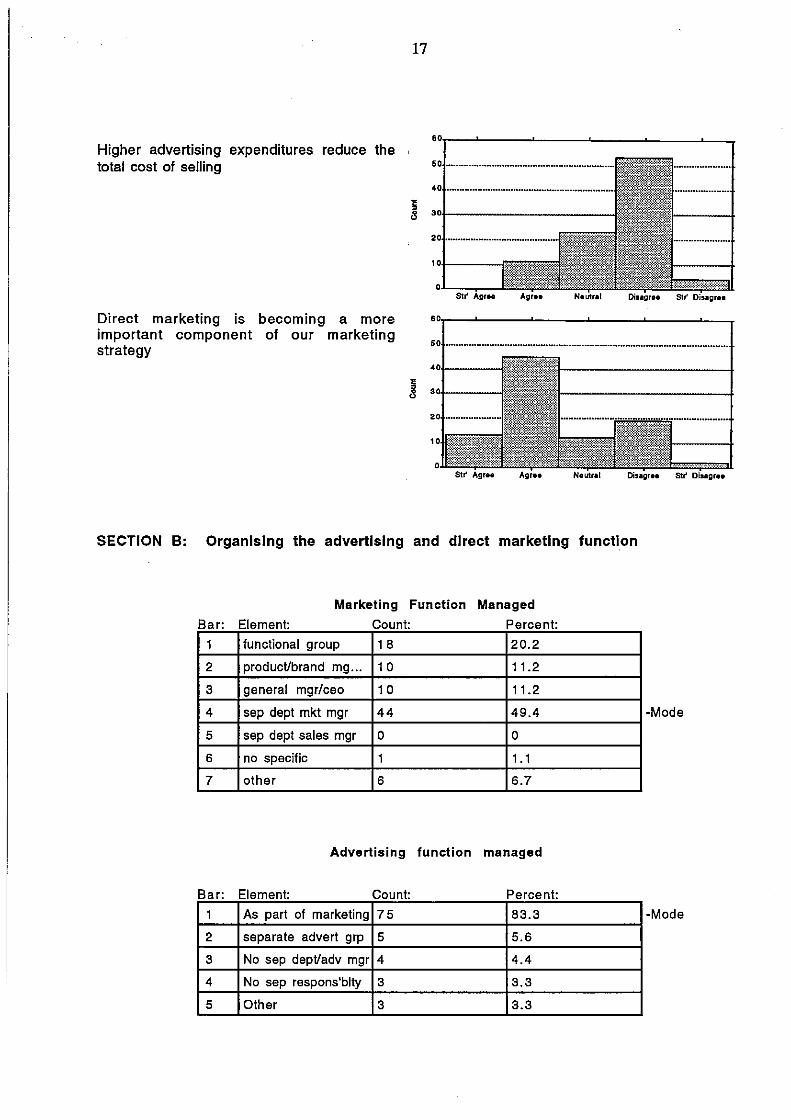
Most managers recognise or are beginning to recognise direct marketing as a central element of their marketing communications strategies. This extends to a realisation that customising product and service option to individual consumer needs is a commercially viable proposition, and recognition that a database-driven programme is essential for success in the nineties. The prevailing view is that direct marketing is becoming a more important component of corporate marketing strategies.
Opinion is divided on whether sales promotions are more effective than advertising in generating additional sales, and this pattern does not vary by industry type. Opinion is also divided on the relative importance of new versus existing customers, with the number of "neutral" responses suggesting that a number of managers view both categories as equally important. In a similar vein, respondents had polarised views on whether a push versus pull strategy was more appropriate for their respective industries. This reflected in part the nature of different businesses, with fastrnoving consumer good and consumer durables marketers relying more upon pull strategies, while those in other industry sectors relied more upon push strategies.
3.2 Organising the advertising and direct marketing function
The vast majority of respondents (70%) indicated that the marketing function within their organisations is managed either as a functional group or as a separate department under a marketing manager. In 11 % of firms a product/brand management structure was adopted, and in a further 11 % of cases marketing was managed by the general manager or CEO. No particular pattern emerged across industry sectors, although the use of product/brand management structures was greater within consumer durable companies. The advertising function was generally managed as part of the marketing function, although I 0% of firms had a separate department or at least a separate advertising manager.
6
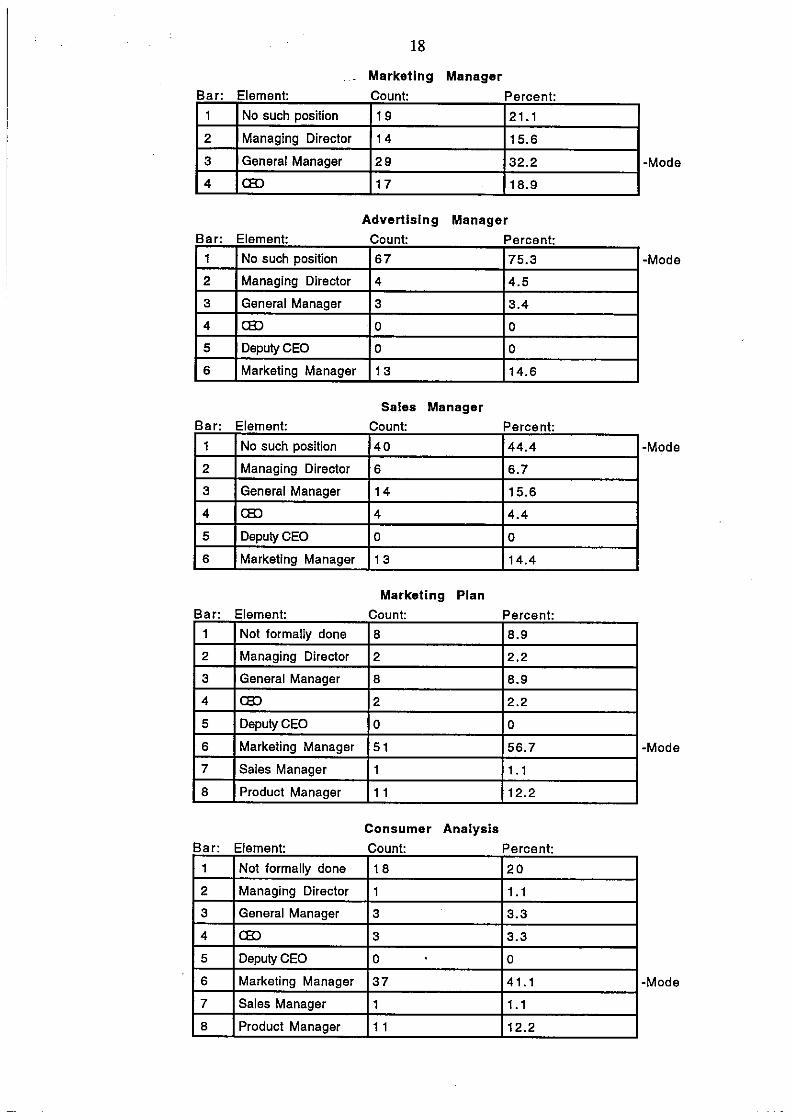
Responsibility for preparing marketing plans typically rests with the marketing manager, with only a small minority of respondents admitting that their organisations do not formally prepare a marketing plan. In product/brand management oriented firms, marketing plans are generally prepared by individual product managers. Consumer analyses and positioning strategies are prepared by the same managers as part of the marketing planning exercise.
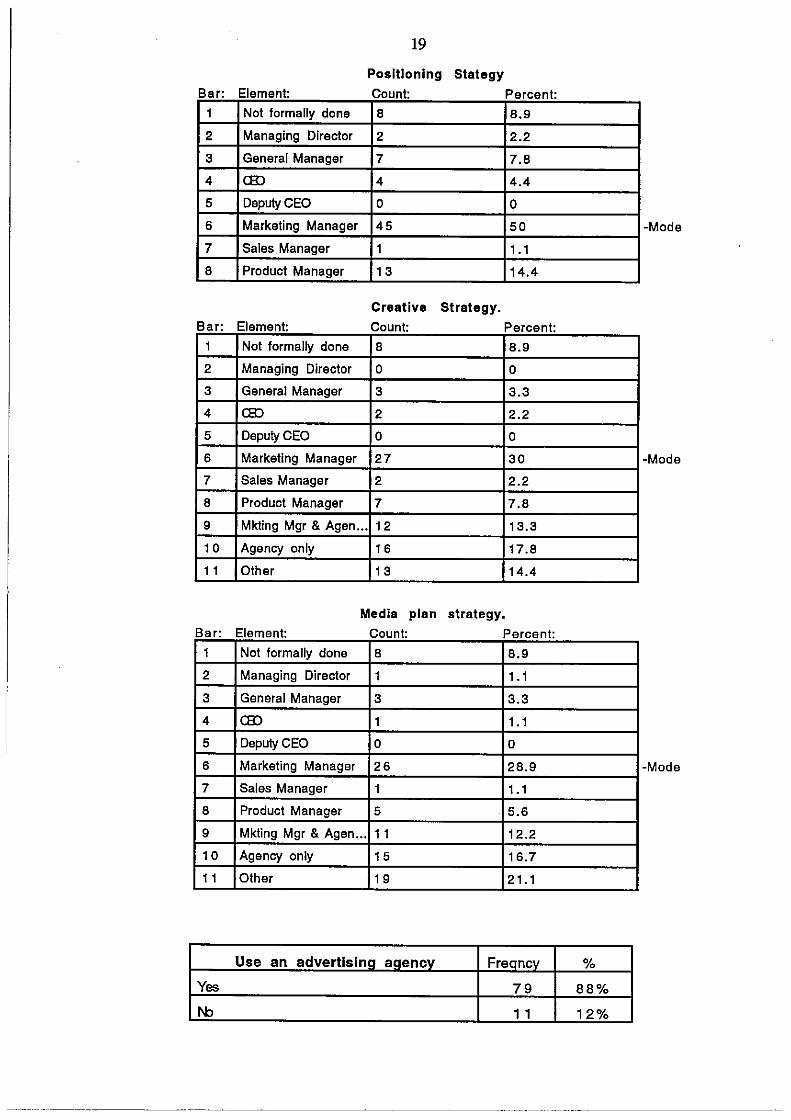
Advertising agencies are involved in the development of creative strategies, although not to the extent that conventional wisdom would suggest. Only 18% of respondents specifically volunteered that development of the creative strategy was solely the responsibility of the advertising agency, with a further 13% indicating that the strategy was determined jointly by the marketing manager and the agency. A similar pattern emerged with development of the media plan, where many managers like to maintain total or a high level of control over the process.
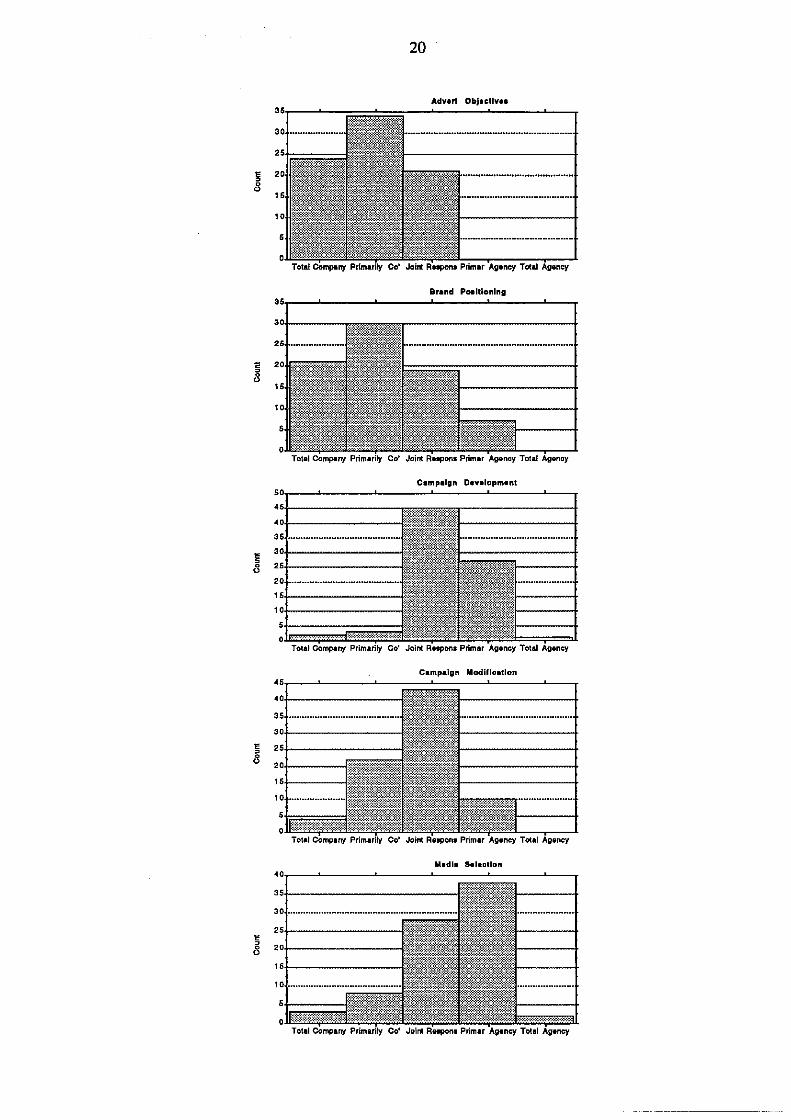
The actual use of advertising agencies is widespread, with almost 90% of organisations having at least one agency. In a related series of questions about the relative responsibilities of company managers and agencies, a significant number of "joint responsibility" responses were recorded in relation to campaign development and modification, and media selection. Agencies are also significant players in the media selection and placement aspects of advertising and promotional activities.
3.3 Setting and allocating the budget
The setting of advertising and promotional budgets appears to rely heavily upon the objective and task method for existing products and services, although almost equal numbers of managers qualified this by adding "executive judgement" as an important aspect. Almost half of the respondents admitted to using "percent of sales" and/or "same as last year", with a number using "all they could afford" or "to match competition" as a guide to setting budgets. Allocation methods were similar for new products and services, although somewhat greater use was made of the objective and task method.
The principle advertising objectives reported were to create awareness, build loyalty, position the brand, and encourage repeat purchase. It must be recognised however that these responses to an open-ended question echoed the set of "examples" provided to guide respondents. There is therefore some doubt about their true representativeness. ·
Advertising and promotional spends are typically timed to coincide with peak sales periods and/or to coincide with specific sales promotions, with "concentrated bursts" also being a common pattern of spend. In about 18% of cases managers report that spending is evenly spread, and similar numbers report that budgets are spent to match competitor advertising activity.
3.4 Marketing rules of thumb
An important aim of the present study was to gain some insight into the heuristics or "rules of thumb" used by marketing managers when making advertising decisions. Since such rules were observed (not surprisingly) to vary by product category, the results of section D were analysed and reported separately for each of four industry categories, as shown.
Product Cateaorv Freoncv %
Fastmovino consumer aoods 28 32%
Consumer durables 2 1 24%
Financial services 19 22%
Business to business 1 2 14%
Other cateaorv 8 9%
7
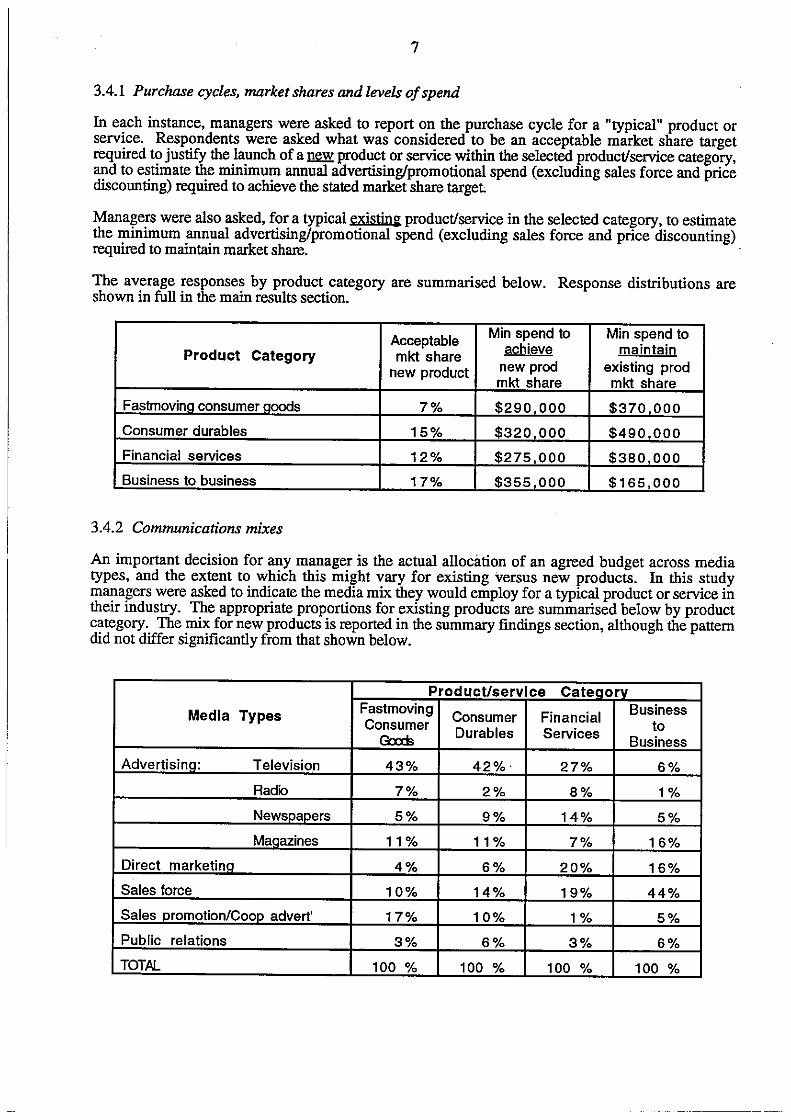
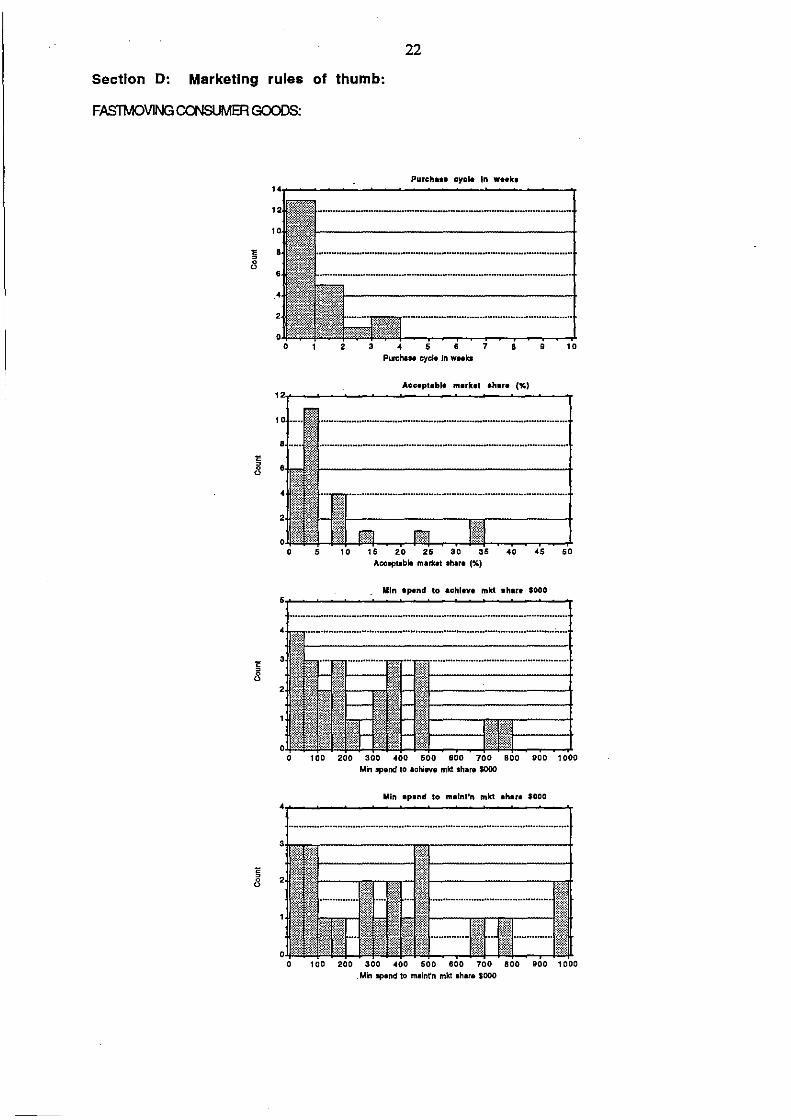
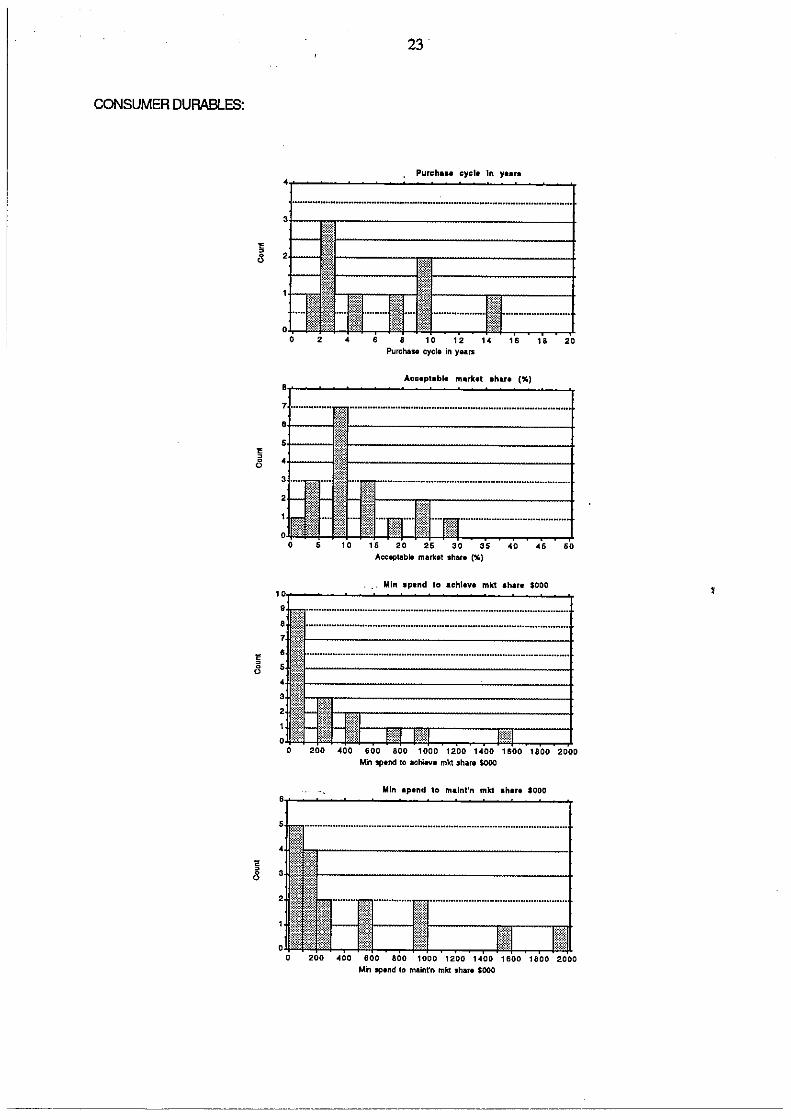
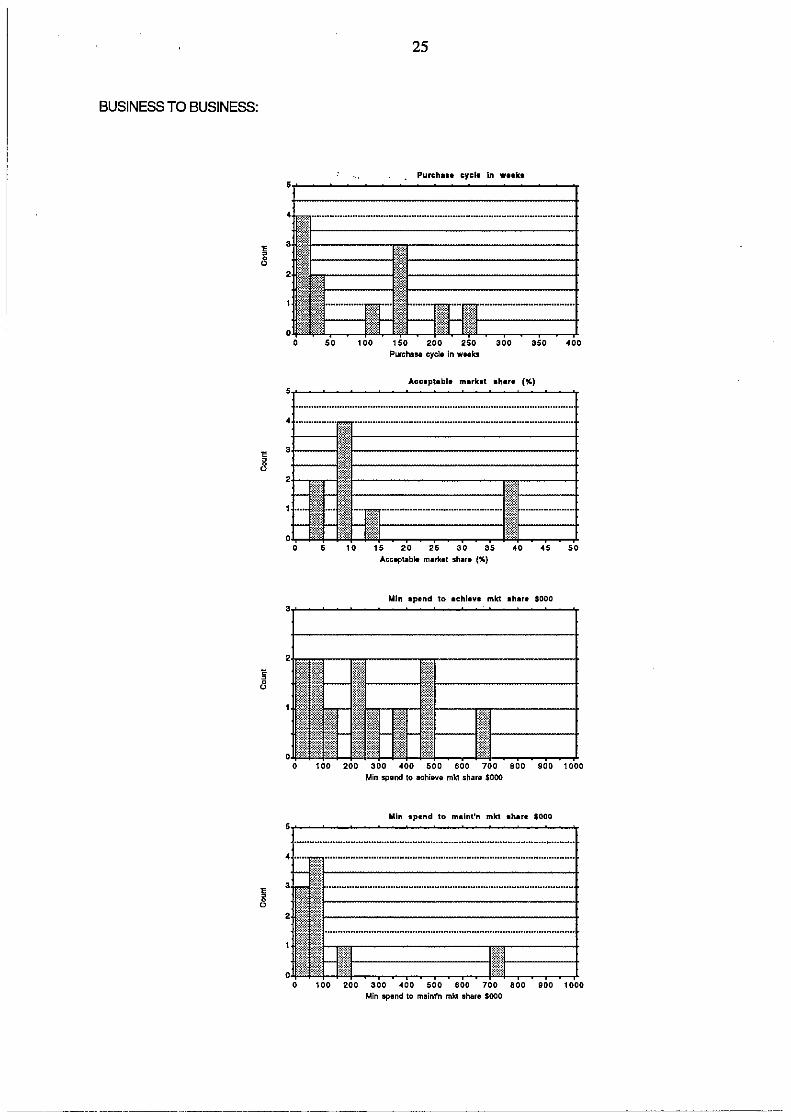
3.4.1 Purchase cycles, market shares and levels of spend
In each instance, managers were asked to report on the purchase cycle for a "typical" product or service. Respondents were asked what was considered to be an acceptable market share target required to justify the launch of a~ product or service within the selected product/service category, and to estimate the minimum annual advertising/promotional spend (excluding sales force and price discounting) required to achieve the stated market share target
Managers were also asked, for a typical existin~ product/service in the selected category, to estimate the minimum annual advertising/promotional spend (excluding sales force and price discounting) required to maintain market share.
The average responses by product category are summarised below. Response distributions are shown in full in the main results section.
Acceptable Min spend to Min spend to achieve maintain Product Category mkt share
new prod existing prod new product mkt share mkt share
Fastmovina consumer aoods 7% $290.000 $370.000
Consumer durables 15% $320.000 $490.000
Financial services 12% $275,000 $380,000
Business to business 17% $355,000 $165,000
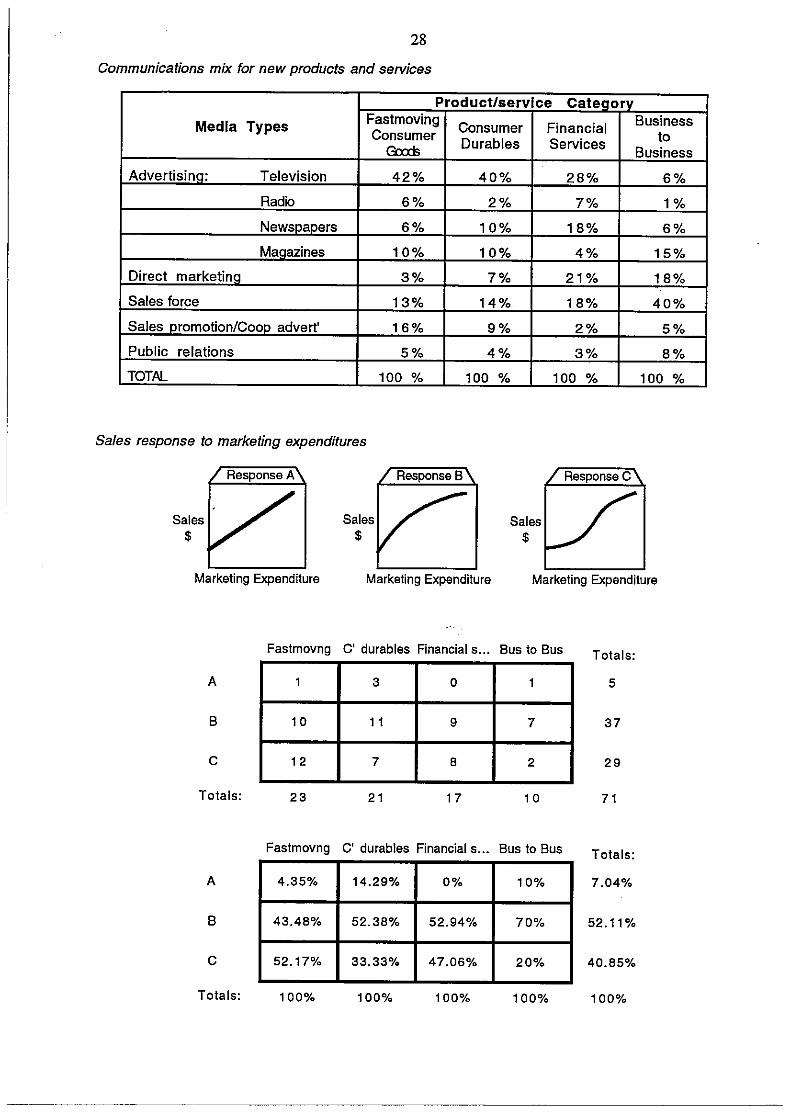
3.4.2 Communications mixes
An important decision for any manager is the actual allocation of an agreed budget across media types, and the extent to which this might vary for existing versus new products. In this study managers were asked to indicate the media mix they would employ for a typical product or service in their industry. The appropriate proportions for existing products are summarised below by product category. The mix for new products is reported in the summary findings section, although the pattern did not differ significantly from that shown below.
Product/service Cateaorv
Media Types Fastmoving Consumer Financial Business
Consumer to Qxxls Durables Services
Business
Advertisina: Television 43% 42%· 27% 6%
Radio 7% 2% 8% 1%
Newspapers 5% 9% 14% 5%
Maoazines 11 % 11 % 7% 16%
Direct marketina 4% 6% 20% 16%
Sales force 10% 14% 19% 44%
Sales promotion/Coop advert' 17% 10% 1% 5%
Public relations 3% 6% 3% 6%
TOTAL 100 % 100 % 100 % 100 %
8
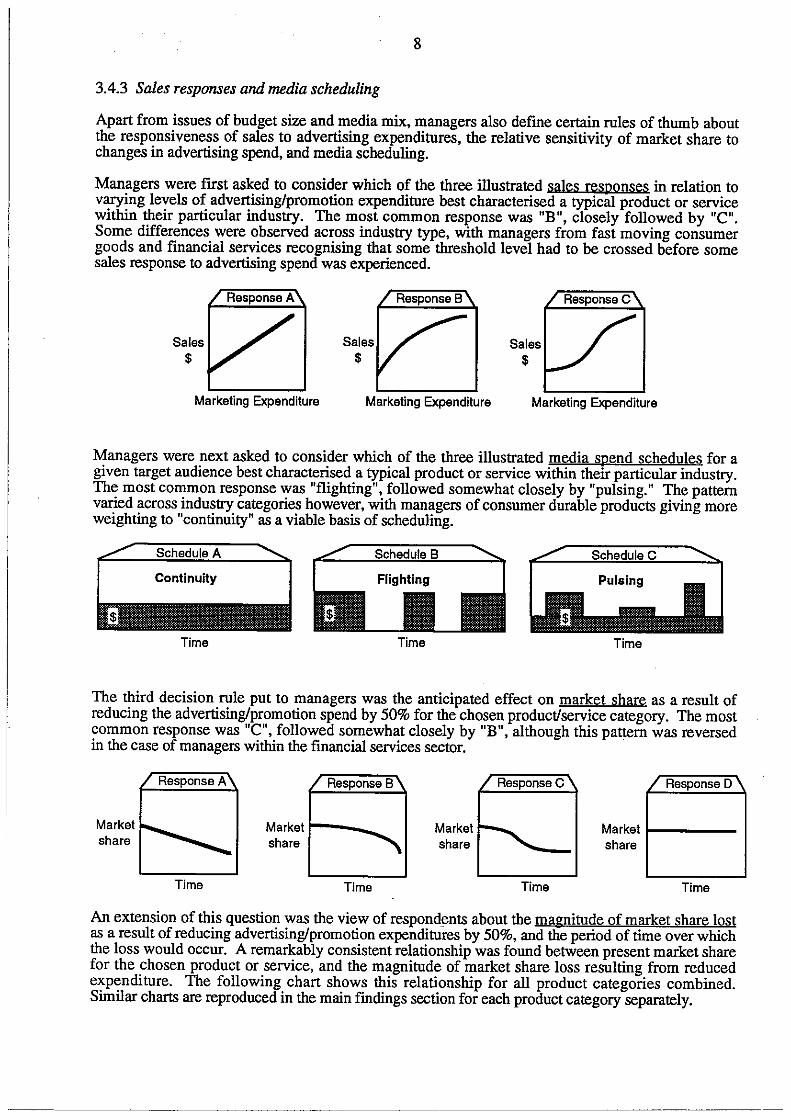
3.4.3 Sales responses and media scheduling
Apart from issues of budget size and media mix, managers also define certain rules of thumb about the responsiveness of sales to advertising expenditures, the relative sensitivity of market share to changes in advertising spend, and media scheduling.
Managers were first asked to consider which of the three illustrated sales responses in relation to varying levels of advertising/promotion expenditure best characterised a typical product or service within their particular industry. The most common response was "B", closely followed by "C". Some differences were observed across industry type, with managers from fast moving consumer goods and financial services recognising that some threshold level had to be crossed before some sales response to advertising spend was experienced.
Sales $
Marketing Expenditure Marketing Expenditure
Sales $
Marketing Expenditure
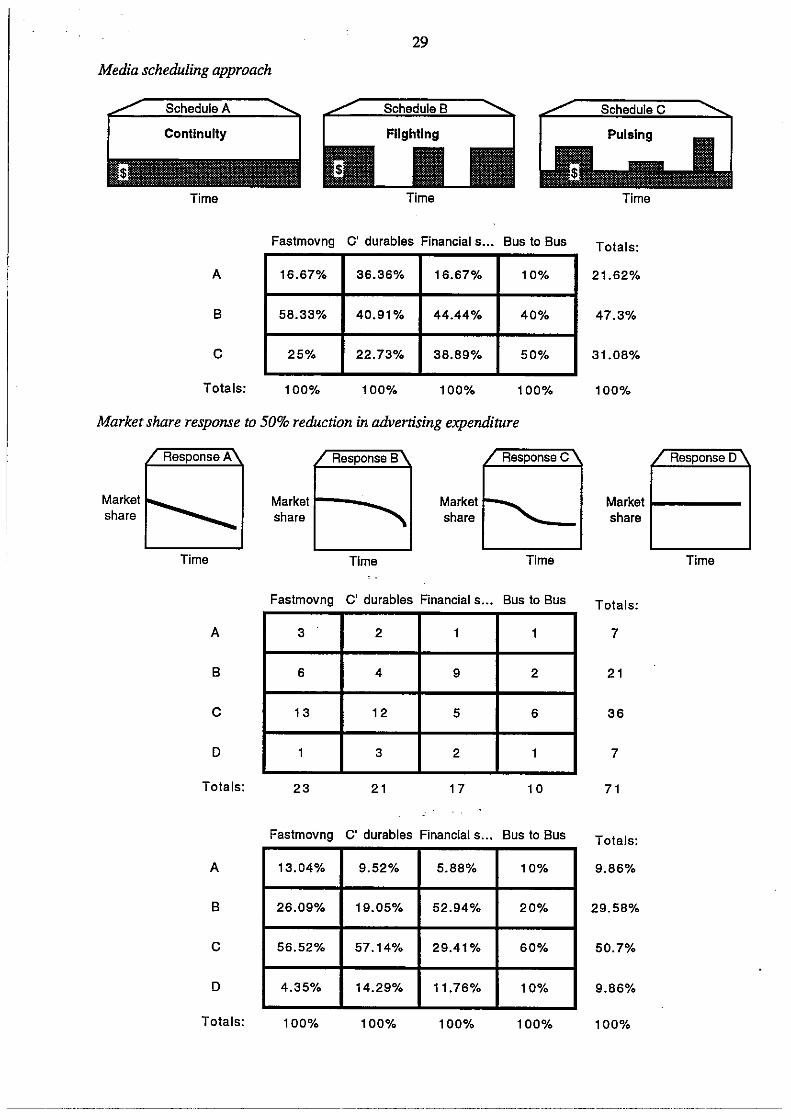
Managers were next asked to consider which of the three illustrated media spend schedules for a given target audience best characterised a typical product or service within their particular industry. The most common response was "flighting", followed somewhat closely by "pulsing." The pattern varied across industry categories however, with managers of consumer durable products giving more weighting to "continuity" as a viable basis of scheduling.
Schedule A Schedule B Schedule C
Continuity Pulsing
Time Time Time
The third decision rule put to managers was the anticipated effect on market share as a result of reducing the advertising/promotion spend by 50% for the chosen product/service category. The most common response was "C", followed somewhat closely by "B", although this pattern was reversed in the case of managers within the financial services sector.
Market share
Time
Response B
Market t---~ share
Time
Market share
Response C
Time
/ Response D '
Market 1----share
Time
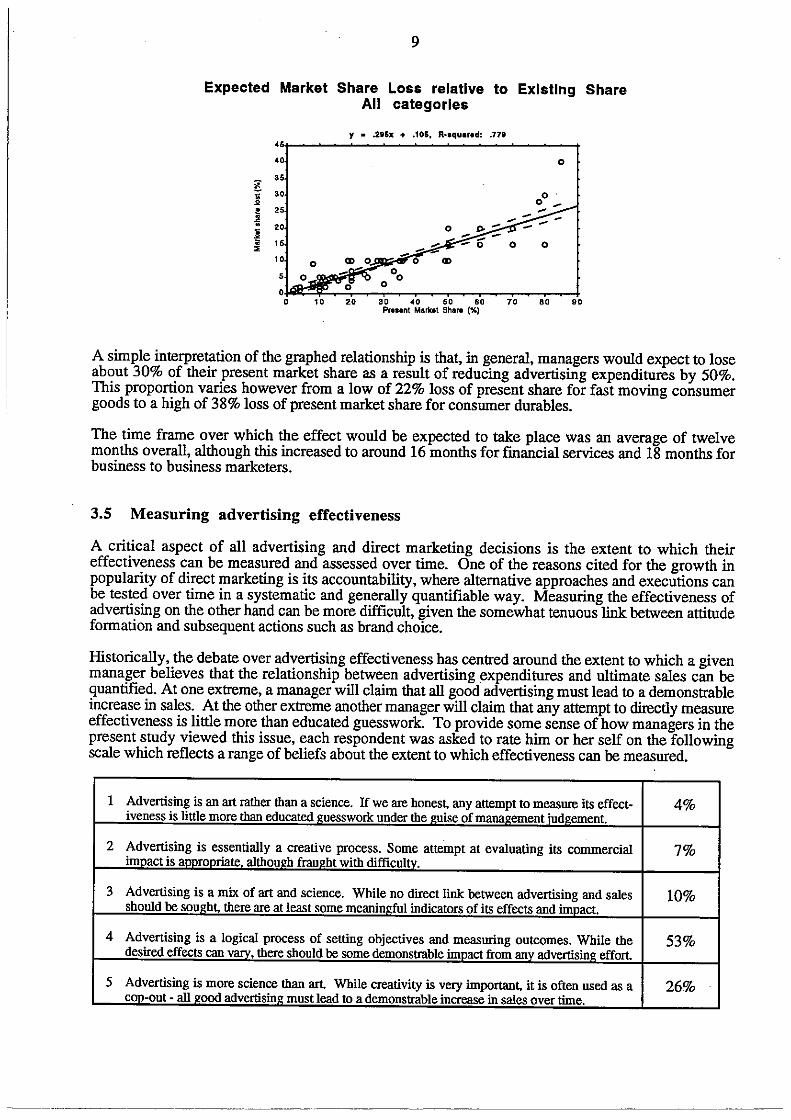
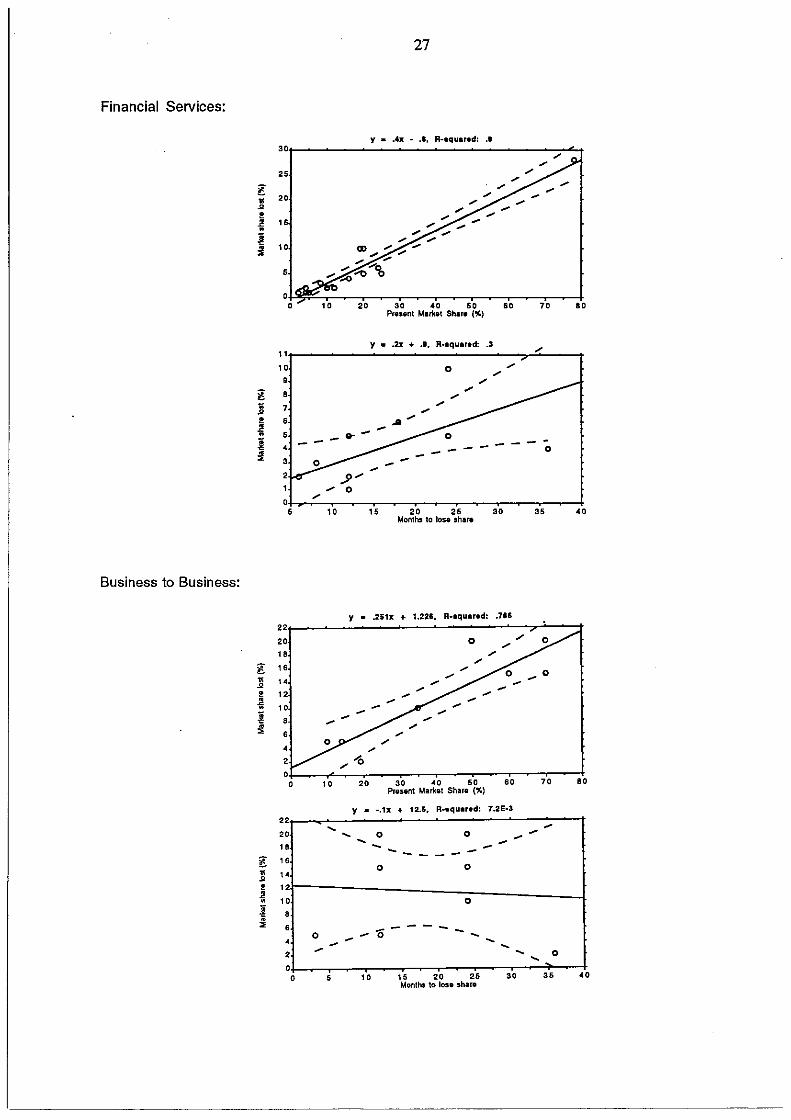
An extension of this question was the view of respondents about the magnitude of market share lost as a result of reducing advertising/promotion expenditures by 50%, and the period of time over which the loss would occur. A remarkably consistent relationship was found between present market share for the chosen product or service, and the magnitude of market share loss resulting from reduced expenditure. The following chart shows this relationship for all product categories combined. Similar charts are reproduced in the main findings section for each product category separately.
9
Expected Market Share Loss relatlve to Existing Share All categories
i!: • -" • ! I :.
" 40
35
30
0
10 20 30 40 50 60 70 80 90 Present Market Share (%)
A simple interpretation of the graphed relationship is that, in general, managers would expect to lose about 30% of their present market share as a result of reducing advertising expenditures by 50%. This proportion varies however from a low of 22% loss of present share for fast moving consumer goods to a high of 38% loss of present market share for consumer durables.
The time frame over which the effect would be expected to take place was an average of twelve months overall, although this increased to around 16 months for financial services and 18 months for business to business marketers.
3.5 Measuring advertising effectiveness
A critical aspect of all advertising and direct marketing decisions is the extent to which their effectiveness can be measured and assessed over time. One of the reasons cited for the growth in popularity of direct marketing is its accountability, where alternative approaches and executions can be tested over time in a systematic and generally quantifiable way. Measuring the effectiveness of advertising on the other hand can be more difficult, given the somewhat tenuous link between attitude formation and subsequent actions such as brand choice.
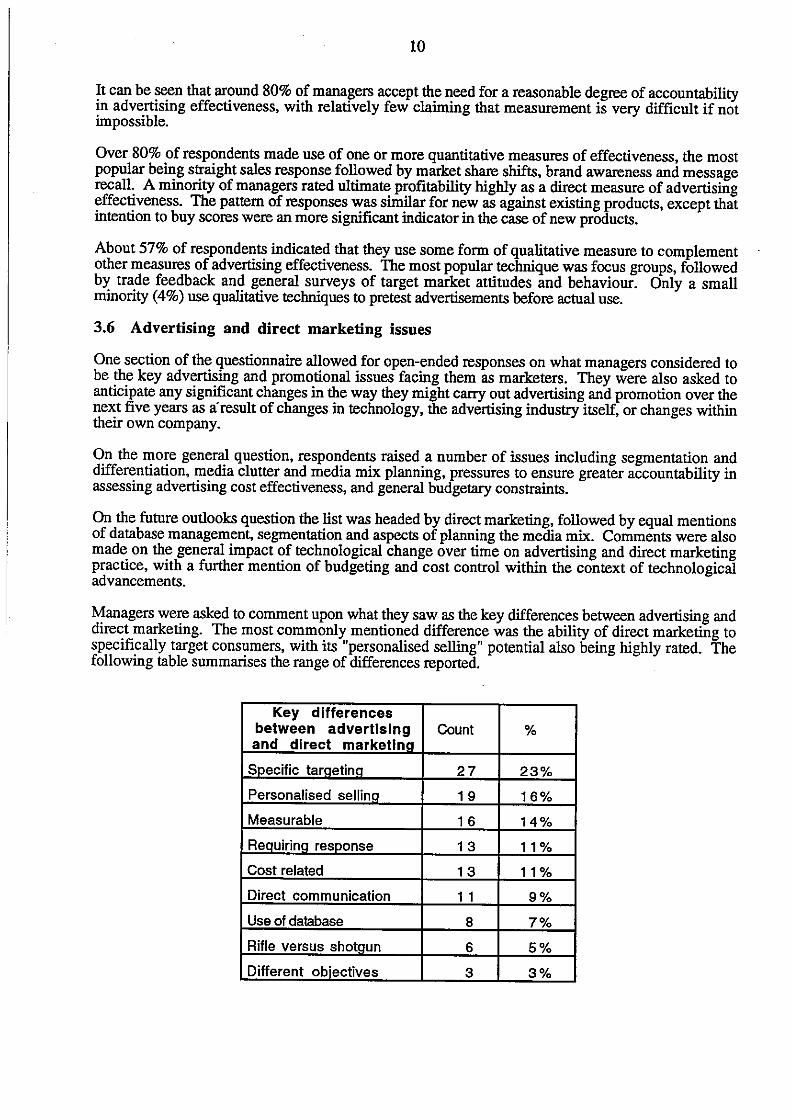
Historically, the debate over advertising effectiveness has centred around the extent to which a given manager believes that the relationship between advertising expenditures and ultimate sales can be quantified. At one extreme, a manager will claim that all good advertising must lead to a demonstrable increase in sales. At the other extreme another manager will claim that any attempt to directly measure effectiveness is little more than educated guesswork. To provide some sense of how managers in the present study viewed this issue, each respondent was asked to rate him or her self on the following scale which reflects a range of beliefs about the extent to which effectiveness can be measured.
1 Advertising is an art rather than a science. If we are honest, any attempt to measure its effect-iveness is little more than educated 2uesswork under the onise of mana2ement iud2ement.
4%
2 Advertising is essentially a creative process. Some attempt at evaluating its commercial 7% inmact is a=ronriate. althou2h frau2ht with difficul"'.
3 Advertising is a mix of art and science. While no direct link between advertising and sales 10% should be sou2ht, there are at least some meaninoful indicators of its effects and impact.
4 Advertising is a logical process of setting objectives and measuring outcomes. While the desired effects can varv, there should be some demonstrable imnact from anv advertisin2 effort.
53%
5 Advertising is more science than art. While creativity is very important, it is often used as a 26% con-out • all oood advertisin2 must lead to a demonstrable increase in sales over time.
10
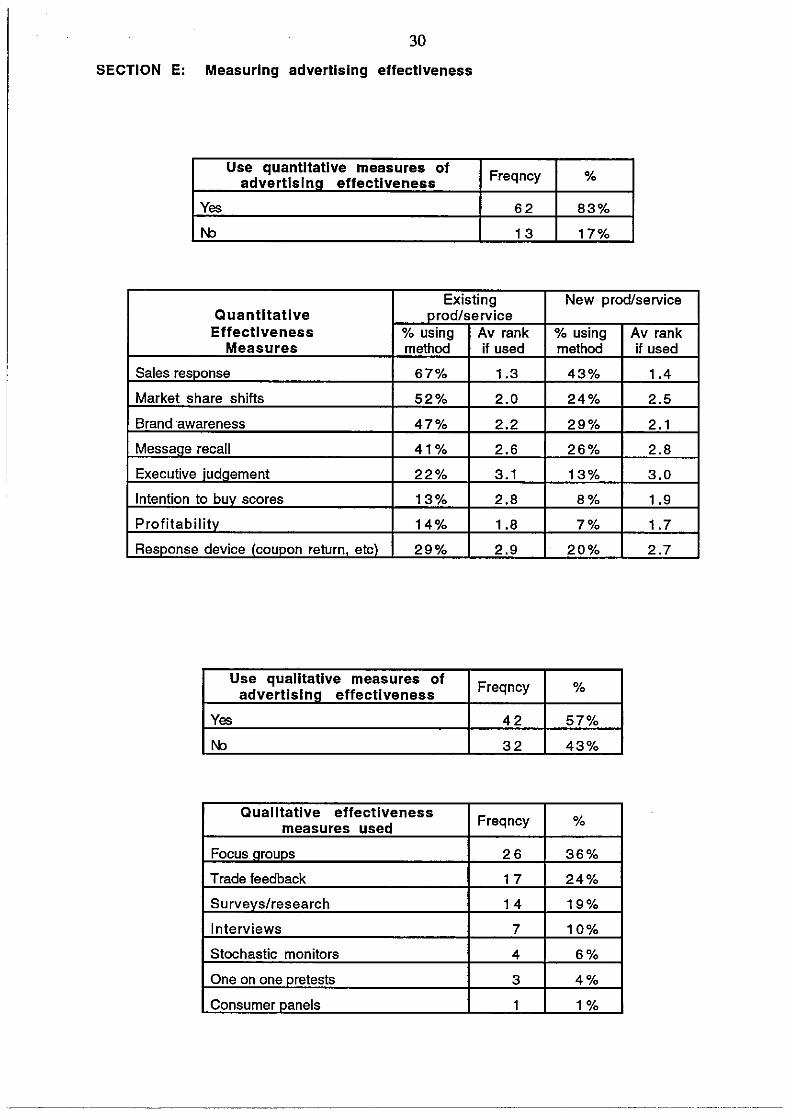
It can be seen that around 80% of managers accept the need for a reasonable degree of accountability in advertising effectiveness, with relatively few claiming that measurement is very difficult if not impossible.
Over 80% of respondents made use of one or more quantitative measures of effectiveness, the most popular being straight sales response followed by market share shifts, brand awareness and message recall. A minority of managers rated ultimate profitability highly as a direct measure of advertising effectiveness. The pattern of responses was similar for new as against existing products, except that intention to buy scores were an more significant indicator in the case of new products.
About 57% of respondents indicated that they use some form of qualitative measure to complement other measures of advertising effectiveness. The most popular technique was focus groups, followed by trade feedback and general surveys of target market attitudes and behaviour. Only a small minority (4%) use qualitative techniques to pretest advertisements before actual use.
3.6 Advertising and direct marketing issues
One section of the questionnaire allowed for open-ended responses on what managers considered to be the key advertising and promotional issues facing them as marketers. They were also asked to anticipate any significant changes in the way they might carry out advertising and promotion over the next five years as a· result of changes in technology, the advertising industry itself, or changes within their own company.
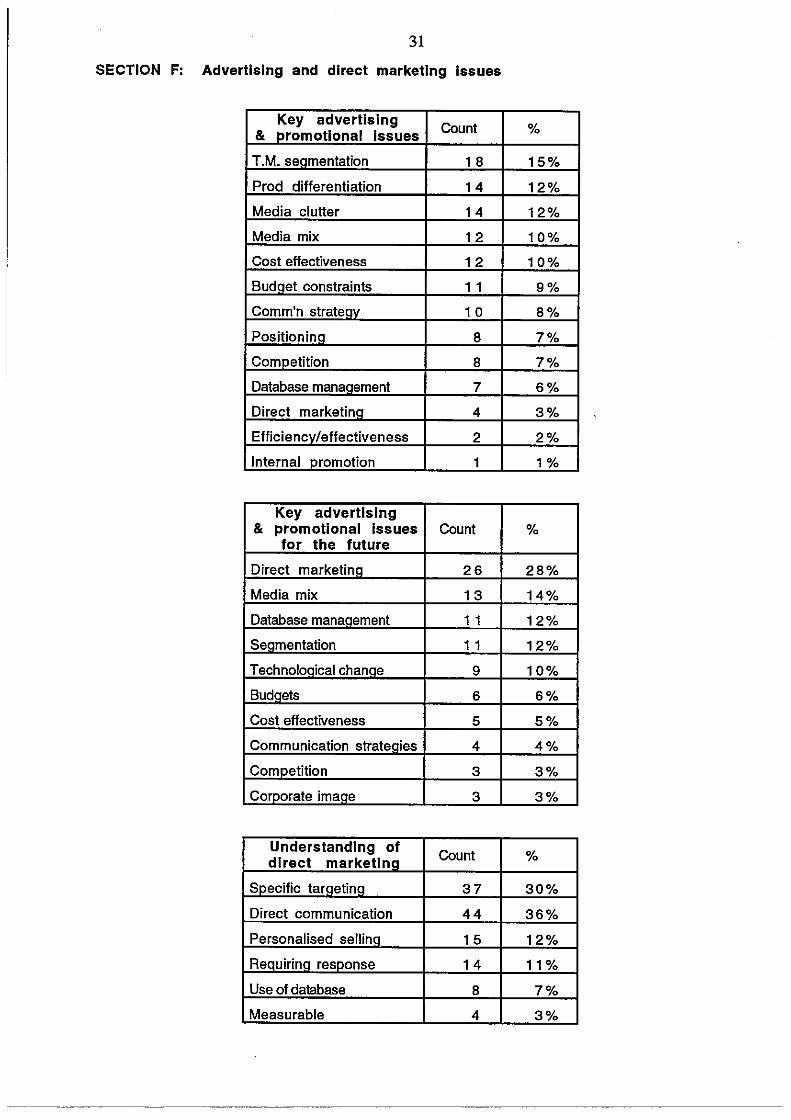
On the more general question, respondents raised a number of issues including segmentation and differentiation, media clutter and media mix planning, pressures to ensure greater accountability in assessing advertising cost effectiveness, and general budgetary constraints.
On the future outlooks question the list was headed by direct marketing, followed by equal mentions of database management, segmentation and aspects of planning the media mix. Comments were also made on the general impact of technological change over time on advertising and direct marketing practice, with a further mention of budgeting and cost control within the context of technological advancements.
Managers were asked to comment upon what they saw as the key differences between advertising and direct marketing. The most commonly mentioned difference was the ability of direct marketing to specifically target consumers, with its "personalised selling" potential also being highly rated. The following table summarises the range of differences reported.
Key differences between advertising Count % and direct marketlna
Specific tarqetino 27 23%
Personalised sellinn 1 9 16%
Measurable 1 6 14%
Reauiring resoonse 13 11 %
Cost related 13 11%
Direct communication 1 1 9%
Use of database 8 7%
Rifle versus shotoun 6 5%
Different objectives 3 3%
11
This section also raised specific questions about the understanding and use of direct marketing as part of a total communications programme. There was generally good understanding of what the term direct marketing encompasses, with reference to terms such as "specific/direct targeting/ communication", "requiring a response", "personalised selling", and "use of a database." Only a small minority of respondents admitted to being unsure about what direct marketing actually means.
A similar question on what managers saw as the key differences between advertising and direct marketing led to similar comments about "specific targeting", "personalised selling", "measurability/ requiring response", "cost related", and "direct communication." Broadly speaking, a clear picture of greater perceived precision and accountability in the use of direct marketing emerges for the large majority of marketing managers. There was no evidence ofdirect marketing being seen as a "fringe" activity, and a question specifically on the role of direct marketing within the overall advertising and promotional programme yielded the following range of responses.
Role of direct mkt in Count % advert & oromo oroa
None 25 29%
Limited oart of stratenv 23 26%
I ncreasinn use 22 25%
Sinnificant role 1 6 20%
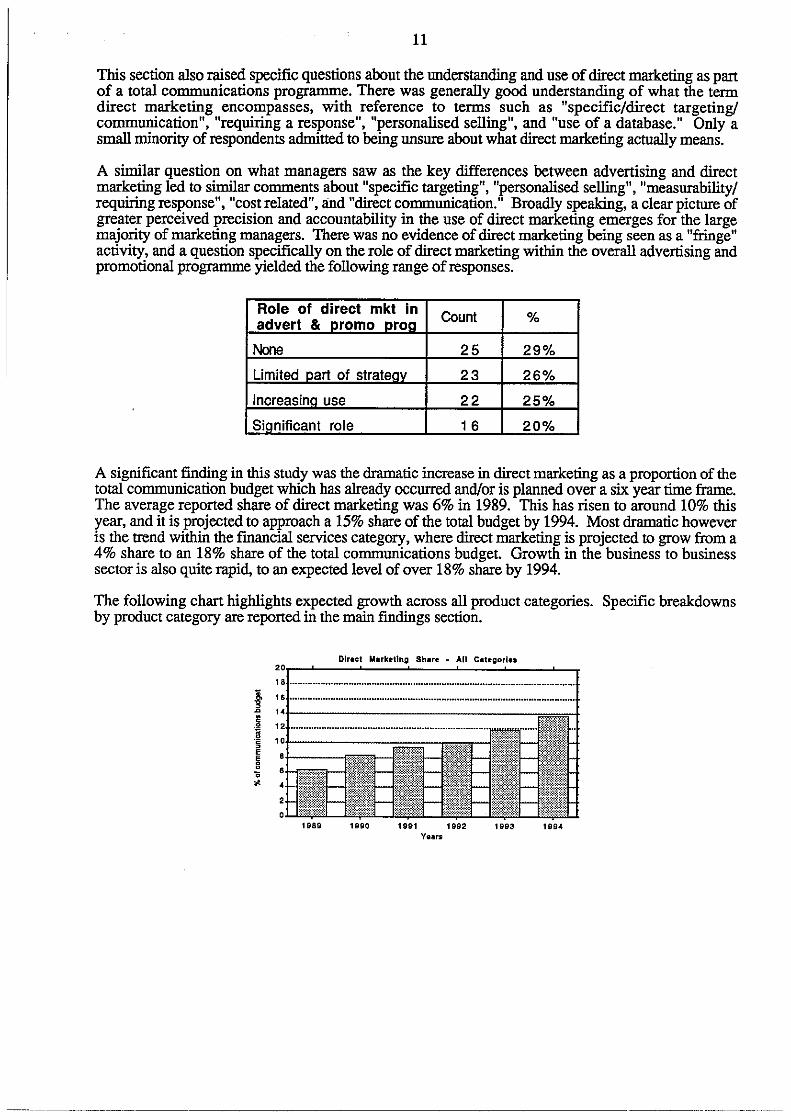
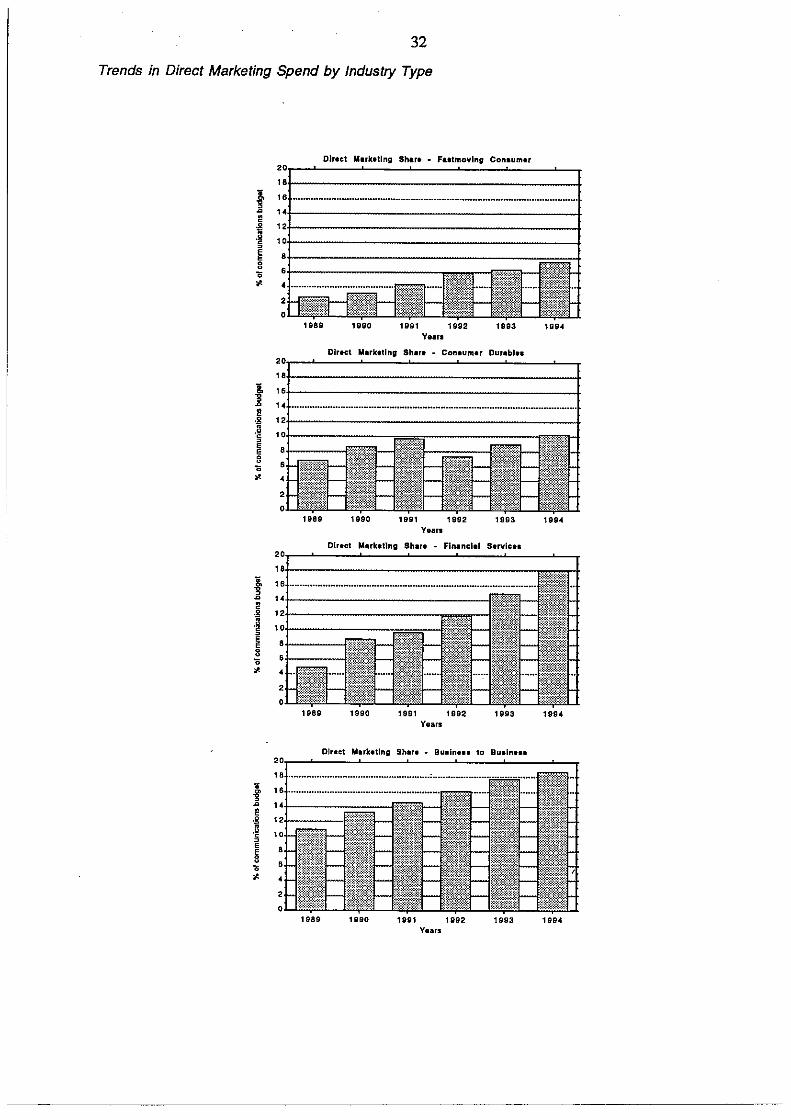
A significant finding in this study was the dramatic increase in direct marketing as a proportion of the total communication budget which has already occurred and/or is planned over a six year time frame. The average reported share of direct marketing was 6% in 1989. This has risen to around 10% this year, and it is projected to approach a 15% share of the total budget by 1994. Most dramatic however is the trend within the financial services category, where direct marketing is projected to grow from a 4% share to an 18% share of the total communications budget. Growth in the business to business sector is also quite rapid, to an expected level of over 18% share by 1994.
The following chart highlights expected growth across all product categories. Specific breakdowns by product category are reported in the main findings section.
Direct Marketing Sh• re - All Categor_le• 2,,_~---'---~--~-~--~-18,1----------------~
f ''!----------------~ - ''+---------------~=:-! § 12:t=================::::::::;-- ...... k ::::::❖•• ..
I '! 1=t-Jlll 1989 1990 1991 1992 1993 199,(
Years
12
3.7 Background information on respondent companies
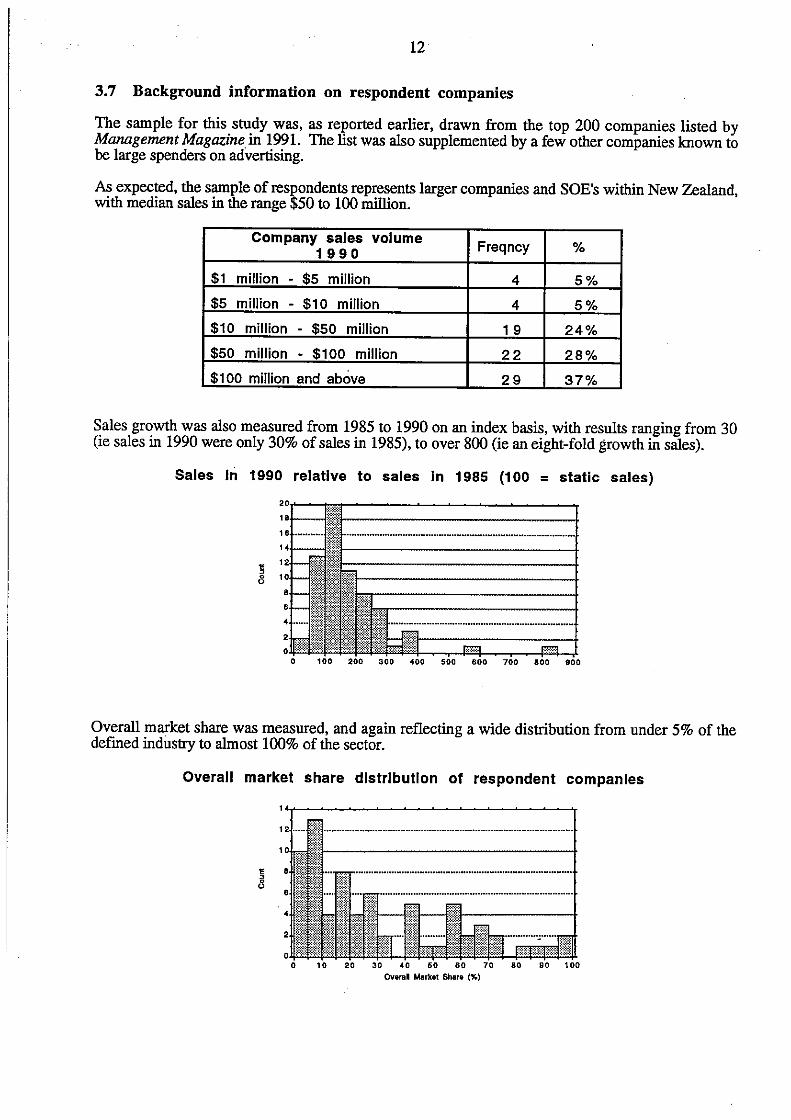
The sample for this study was, as reported earlier, drawn from the top 200 companies listed by Management Magazine in 1991. The list was also supplemented by a few other companies known to be large spenders on advertising.
As expected, the sample of respondents represents larger companies and SOE's within New Zealand, with median sales in the range $50 to 100 million.
Company sales volume Freqncy % 1990
$1 million • $5 million 4 5%
$5 million • $1 o million 4 5%
$10 million • $50 million 1 9 24%
$50 million • $100 million 22 28%
$100 million and above 29 37%
Sales growth was also measured from 1985 to 1990 on an index basis, with results ranging from 30 (ie sales in 1990 were only 30% of sales in 1985), to over 800 (ie an eight-fold growth in sales).
Sales Iri 1990 relative to sales In 1985 (100 = static sales)
20,,....-t•,:."-':❖,....----------------;-18t- t{f~'l---------------1
0 100 200 300 -400 SOO 600 700 800 900
Overall market share was measured, and again reflecting a wide distribution from under 5% of the defined industry to almost 100% of the sector.
Overall market share distribution of respondent companies ,,,.... _______________ .....,. , .
• 8
20 30 •O 50 60 70 80 SO 100
OVeral Market Share (%)

13
3.7.1 Communications Budget
A further indication of the relative importance of respondent companies is given by the size of reported communications budgets, excluding sales force costs. The average budget across the- total sample was $3.2 million, although this varied markedly from a low of $5,000 to a high approaching $20 million. Given the spread in size of sales budget, the distributions are shown separately for companies with budgets $5 million and under, and companies with budgets over $5 million.
Communications Budgets for firms with $5 million budgets and below 20,,.....--------~----~----1 8 ===~-::-~: rt:_ ............... ___ _
12 ita-• -------------------1
l '!fL-1.. ~ ~ I 0 500 1000 1500 2000 2500 3000 3500 4000 4500 6000
Commun'1 Budget $000
Communications Budgets for firms with budgets above $5 mllllon •,.....--------~----~----..
•+------~-------------4
~~?: '''---'2Z
0 ;:;:;:;:;
0 2000 4'000 6000 8000 1000012000 14000 16000 18000 20000 Commun's Budget $000
In addition, 80% of respondents indicated that they had a domestic sales force. The size of sales forces varied markedly, and some managers in the financial services sector interpreted this question to include retail bank staff as "salespeople." The average sales force size for companies with a domestic sales force, and excluding respondents from the financial services sector, was 27. The range was from one to 130 salespeople.
Number of Sales Rep's In Domestic Sales Force*
§ 8
Hl1to;r• m of X1: No. r1p1 In NZ
0 10 20 30 40 50 60 70 80 90 100 No. reps in NZ
*excluding financial services
14
4. GENERAL FINDINGS
Section A: Bellefs and opinions about advertising
Recall is important irrespective of whether the consumer feels positive or negative about the product or service recalled
Higher recall of our advertising will lead to higher sales
Communication channels are so cluttered that only big promotional budgets have any meaningful impact
Good advertising must have a unique selling proposition
The most advertising execution
important aspect is the quality of
of effective the creative
E , 0 0
••,---~---~---~~---~---~-~ ·•1-------f~jl*1t1~:1:~[~ti'.(i~@l~@t@~l-----------------l
::.+------illllll .... _______________ .. *.tB:[email protected]~
:: l}f!ltlil ll!ill lt!ti¾illi llllllllr ... -.-----t strongly Agr ... AgrH Neutral DisagrH Strongly Dis ...
so,.--~----~---~~---~---~~-~ ·••+-----------------------4 ·••f-----rn,rn~,rnc1-------------I
:~ .111• -----+
Str' AgrH AgrH Neutral DisagrH Str' D1sagrH
·••,-~---~---~-;;;;;;;;;$;;;;;;;--~-, ·•·+-----------------i;iff.ttifil~it~j~-----4 ~s@mum:: 4 o l~~itli:X•ii::
:~ ~ l"i_%_i_[ .. ~:-fil: .. fil: .. [ .. lf-~$-J+
Str' Agree AgrH Neutral DisagrH Str' Disagree
60•~-~---~----~---~---~-~
·••+-----------------------4
Sir' Agree Agree Neutral Disagree Str' DisagrH
60
50
40
30
20
10
0 Sir' Agree AgrH Neutral Disagree Str' DisagrH
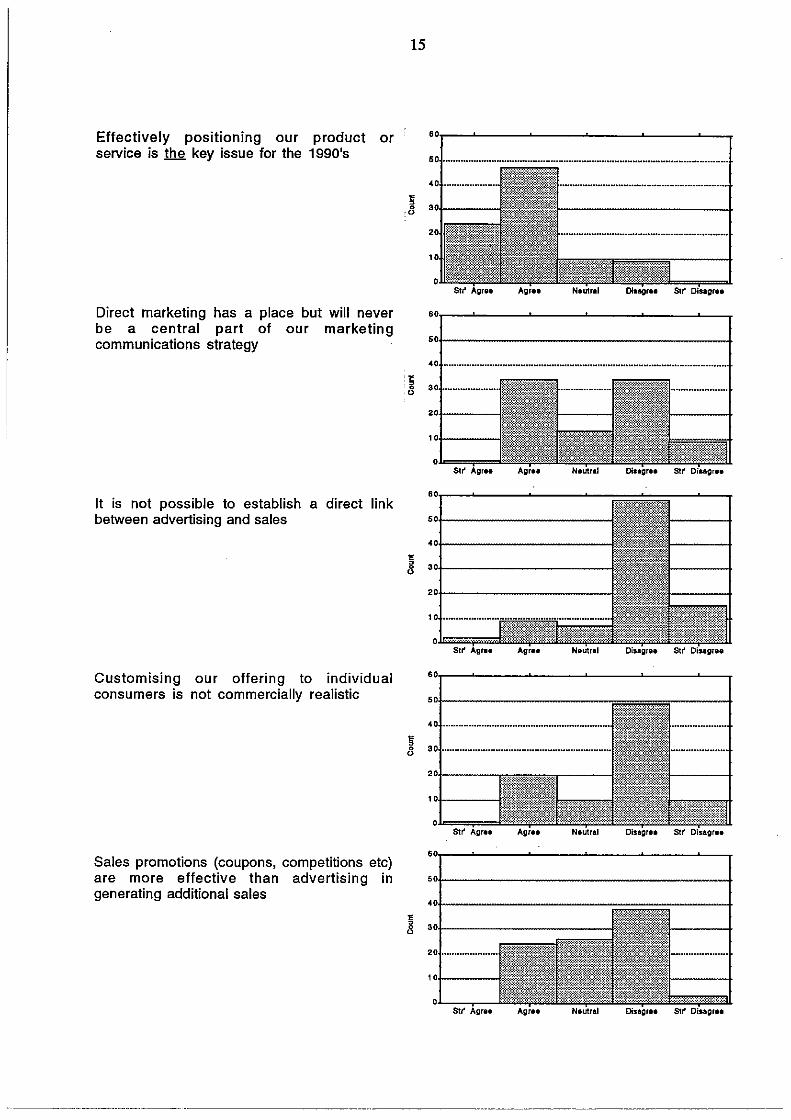
Effectively positioning our service is the key issue for the
product 1990's
or
Direct marketing has a place but will never be a central part of our marketing communications strategy
Customising our offering to individual consumers is not commercially realistic
Sales promotions (coupons, competitions etc) are more effective than advertising in generating additional sales
15
~ . /l
••·,--~---~----~---~---~-~ ·•,----;;:;;;;:;;;;:;;;;;-------------i-••+------~ ••t-------i
10
••,--~---~---~~---~---~-~ ••t-------------------------+ ••t-------------------------+
!~ .8 30t------~
10f-----
•-'===,,=~ Str' AgrH Oi11grH
SU' AgrH Agree Nautral Disagree Str' DisagrH
,o,,-~----~---~~---~----~-""T so,1-------------;;;;..a..a..a.------t
·•'t----------------• ttlf ltlllct:------+ l 30 ·•··•· .... ·--------------<®MtiMM1------+
itt,wmiiirti
~::::::::::::::[l.1r1.J~.!;l.f2t212]}Jl ]tv2t~]l?]]}.1l;~r.~+.1.•~~.~jit.f.l.~~.J;1r~J,l,l]i]!t!»,]f,;:·t.f,1i;li1i;c1,i,la~ll Str' Agree Agree Neutral DisagrH Str' DisagrH
··'~-~----~---~~---~----~-""T ·•·+--------------------------•
30,t---------------1

customers is more to prospective
Advertising to existing important than advertising customers
A database-driven marketing programme is essential for success in the 1990's
In our business pushing the product through the channels is more important than relying on advertising to pull it through
Higher advertising expenditures reduce buyers' price sensitivity
Advertising expenditures have a greater sales impact on low-price products than high-price products
16
60
•O ~ , /.l 30
20
10
0 Stl' AgrH AgrH N•utrat Dis•gr•• Sll' DisagrH
60
60j.------------------------¼
•Ot---------------------t ! 30+-----
~ , 0
"
~ , /.l
20
DisagrH SU' DisagrH
60,--~----~---~----~---~--~
60+----------------------+
•0t----------------------+
Sir' AgrH AgrH D1sagrH Str' D1sagrH
60
50
•O
30
20
10
0 !t!ll\f II i11i1itl!l ll!ll!llltl < ;ii:1FT Str' Agree Agree Neutral OisagrH Str' DisagrH
60
50
40
30
20
, 0
0 Sir' AgrH Neutral Oisag, .. Str' D1sagrH
----------------------------------------------------"·----~-
17
60
Higher advertising expenditures reduce the total cost of selling 50
,o ~ /l 30
20
10
0 Sti' AgrH AgrH Sir' DlsagrH
Direct marketing is becoming a more 60
important component of our marketing strategy
50
,o ~ • 30 /l
20
10
0 Str' Agree Di,agrH Sir' DisagrH
SECTION B: Organising the advertising and direct marketing functl_on
Marketing Function Managed
Bar· Element· Count· Percent·
1 functional group 1 8 20.2
2 product/brand mg ... 1 0 11.2
3 general mgr/ceo 1 0 11.2
4 sep dept mkt mgr 44 49.4 -Mode
5 sep dept sales mgr 0 0
6 no specific 1 1 . 1
7 other 6 6.7
Advertising function managed
Bar· Element· Count· Percent·
1 As part of marketing 75 83.3 -Mode
2 separate advert grp 5 5.6
3 No sep dept/adv mgr 4 4.4
4 No sep respons'blty 3 3.3
5 Other 3 3.3
Bar· Element·
1 No such position
2 Managing Director
3 General Manager
4 CID
Bar· Element·
1 No such position
2 Managing Director
3 General Manager
4 CID
5 Deputy CEO
6 Marketing Manager
Bar· Element·
1 No such position
2 Managing Director
3 General Manager
4 CID
5 Deputy CEO
6 Marketing Manager
Bar· Element·
1 Not formally done
2 Managing Director
3 General Manager
4 CID
5 Deputy CEO
6 Marketing Manager
7 Sales Manager
8 Product Manager
Bar· Element·
1 Not formally done
2 Managing Director
3 General Manager
4 CID
5 Deputy CEO
6 Marketing Manager
7 Sales Manager
B Product Manager
18
Marketing Manager
Count· Percent·
19 21. 1
14 15.6
29 32.2
17 18.9
Advertising Manager
Count·
67
4
3
0
0
1 3
Sales Manager Count·
40
6
14
4
0
13
Marketing Plan Count·
8 .
2
8
2
0
51
1
1 1
Consumer Analysis
Count·
1 8
1
3
3
0
37
1
1 1
Percent·
75.3
4.5
3.4
0
0
14.6
Percent·
44.4
6.7
15.6
4.4
0
14.4
Percent·
8.9
2.2
8.9
2.2
0
56.7
1 . 1
12.2
Percent·
20
1 . 1
3.3
3.3
0
41.1
1. 1
12.2
-Mode
-Mode
-Mode
-Mode
-Mode
19
Positioning Stategy Bar· Element·
1 Not formally done
2 Managing Director
3 General Manager
4 CID
5 Deputy CEO
6 Marketing Manager
7 Sales Manager
B Product Manager
Bar· Element·
1 Not formally done
2 Managing Director
3 General Manager
4 CID
5 Deputy CEO
6 Marketing Manager
7 Sales Manager
8 Product Manager
9 Mkting Mgr & Agan .••
10 Agency only
1 1 Other
Count·
8
2
7
4
0
45
1
1 3
Creative Strategy.
Count·
8
0
3
2
0
27
2
7
12
1 6
13
Percent·
8.9
2.2
7.B
4.4
0
50
1. 1
14.4
Percent·
8.9
0
3.3
2.2
0
30
2.2
7.8
13.3
17.8
14.4
Media plan strategy. Bar· Element· Count· Percent·
1 Not formally done B 8.9
2 Managing Director 1 1 . 1
3 General Manager 3 3.3
4 CID 1 1. 1
5 Deputy CEO 0 0
6 Marketing Manager 26 28.9
7 Sales Manager 1 1 . 1
8 Product Manager 5 5.6
9 Mkting Mgr & Agan ••. 1 1 12.2
10 Agency only 1 5 16.7
11 Other 19 21.1
Use an advertising agency Freancv
Yes 79
f'--b 1 1
-Mode
-Mode
-Mode
%
88%
12%
----·-----------------------------~ ---·------------------~
20
Advert Obj1ctlYH
li 20
B
" 8
§ /j
Total Company Primarily Co' Joirt Rnpon1 Primar Ag1ncy Total Ag1ncy
Brand Paltlonlng .,, ..... _ __._ ___ __. ____ ._ ___ .,__ ___ ~---,-
15
10
5
Total Company Primarily Co' Joint RMpon• Primar Agency Total Agency
so,---~---~~---~----~----~--~ ••1---------~====~--------• "'+-----------1HUtN1Ut4111-----------+ 35 :::.~:1:::.1f~1------------+
~/ _llllt-----•
Total Company Primarily Co' Joint RHpons Primar Agancy Total Agency
Campaign Modification
·•,-~--~--;:;;;;;;;;;;;;;;;;;-~---~, ••+-----------lh::}::::::-x:;:,.;;:::;::(-=:;;:::;;1-----------+
35+-------................. ~;1111~1111 ................... ------+ :: ... _________ _,illililtl~f~ +-------__ -__ -__ -__ -__ -___ -__ -__ -__ -1 __ ntwtwmmm1-----------+
:i _llml-----• Total Compatl)' Prrmarrly Co' Joint R1,pons Pnmar 'Agency Total Agency
Madia Salectlon
·•,-~--~--~--;:;;;;:;:;;:;:;;:;;;;;--~, 35f-----------------t:3/'/}::.':w.?\c1-----•
7\0,v;r::x:n?: ••,-----------;;;;;;;;;;;;;;;;;;;l❖'❖•❖;:;-.-1;:=::❖x❖•:;::,::"<1-----➔
25f-----------1~fiffiffJIEt llllt!~lll'=1-----•
:i_..ll_ Total Company Primarily Co' Joint Respons Primar Agancy Total Agency

21
SECTION C: Setting and allocatlng the budget
Existing nrod/service
Budgeting Method % using Av rank method if used
Obiective and task 55% 1.2
Percent of sales 35% 1 .6
Executive iudnement 47% 1.5
All vou can afford 16% 2.3
Match comnetition 17% 2.6
Same as last vear 11 % 1.7
Same as last vear with adiustment 13% 2.1
Advertising & Existing Promotion oblectlves Customers
Create awareness 33 21%
Build lovalh, 36 23%
Brand nositionina 30 19%
Encourane trial 2 1%
Educate and inform 6 4%
Sunnort sales staff 22 14%
Sunnort branches 2 1%
Sunnort distributors 4 3%
Channe nercentions 2 1%
Prod differentiation 7 5%
Renea! nurchase 1 1 7%
Existing • rod/service
Timing of advertising and % using Av rank nromotlonal scends method if used
Timed for sales nromotions 47% 1.5
About the same each month 18% 1.9
Comnetitor related 19% 2.2
Snend most in neak neriods 37% 1.4
Concentrated bursts 4.0% 1.5
Snend most in low sales "eriods 3% 1.3
Other lsnecifv\ 10% 1.2
New prod/service
% using Av rank method if used
69% 1 . 1
17% 2.0
47% 1 .5
20% 2.2
5% 2.8
5% 2.2
7% 2.2
New Customers
53 36%
15 10%
25 17%
12 8%
7 5%
1 6 11 %
2 1%
4 3%
2 1%
8 5%
2 1%
New prod/service
% using Av rank method if used
42% 1.3
8% 1 .9
16% 2.3
22% 1.5
37% 1.4
0
10% 1. 1
22
Section D: Marketing rules of thumb:
FASTMOVING CONSUMER GOODS:
§ /l
PurchaH cycle In wHke ,.,,.... ______________________ ...,. :$J.::1::[:;';\
12 twffit---------------------t 10 (11•,--------------------------+
i 11·~-~;-.~:-:;-;-,1 ::-_f_.&_1_5~-fJ----------------• o,'1"_"'!"_'4_"'f_=ll----~~~~~-------
o 2 3 4 5 6 7 8 9 10 PwchaM cycle Jn WNkl
Acceptable m• rket • h• re (%) 12,.,.... _____________________ __,.
'!l!. 10 .•.•• 11>----------------------+
8 ••••• ;~•·1-------------------------• .{~~
~11=1~-~-.-.-!-----.,-.-.----1·1·1·1--------0 5 10 15 20 25 30 35 40 45 50
Aoceptable marictit •h•r• (%)
Min • pend to achieve mkt • her• $000 5.,._ _______________________ ....,.
4
3
2 r11-------------•
11-------i~t·lf.fl~~l_ -----+ O·'F'°"'"l"""""'l""""-<'""""l-"°"-------1=<1='1----+
0 100 200 300 400 500 BOO 700 BOO 900 1000 Min ,pend to achieve mkt share $000
Min • p•nd to m• lnt'n mkt • h• r• $000 4,._ ____________________ ..,.
a;,,,,.,,,,,--------..~0rr,----------~ '%;'
i----------1x;:1-------------•
... ;,_;!_il------------l~J;: © tt 1----.,,,,,... .... ,,,,,----1fJ:~
l;···············l.1
2
0 100 200 300 400 500 600 700 800 900 1000
. Min spend to maint'n mkt •hare SOOD
CONSUMER DURABLES:
§ /j
23
PurchaH cycle In YHl'9
................. ____ _ 31j--,,,,,.-------------------I
+---•~"~l,I: ----------------------•
2 fi ;;.c:-t
- M~ filf,1•-------------• Il it : ~-) 1 ···· 1 ····... I · I:•: ::::::::::·F·.i·_;" .. -.. -.:::::::::::
0 2 4 6 • 10 12 14 16 18 20 Purchasa cycle in years
Acceptable marbt •h•r• (%)
7 ................ _____ _
:::w:
:.-t-----,l,'.1---------------------1 4'r---tsii¾1•1----------------------1
''*'
: if 1~ l,rl-,·t"l"~1,-----------1 0 5 10 15 20 25 30 35 40 ... 60
Aeceptable market share (%)
Min apend to achieve mkt ahare S0OO 101.,...---~----~--------~----. ••brr-------------------1 : fill:--------------s 11~:-------------------------t : ii--------------------------+
:,Jllr.ll.]e-e-.... l.J,"II-H-l,:1t.~1.,:1-_-_-._-_-;r,',"i,,"@~l:~·,l'·"r,,"m •. ·_-_-_-_-,-_-:..-.-_-_-_-_-;1.~·r,s•n.:·_-_-_-_-,-_-_-_-_-_-~• 0 200 400 600 800 1000 1200 1400 1600 1800 2000
Min spend to achieve mkt share $000
Min •pend to malnt'n mkt • hare SOOO ''r----~~-~-~----~-~-;
Min spend to maint'n mkt share $000

FINANCIAL SERVICES:
24
. . Purch•H eye~ In WHkS .,.... ____________________ .,. ·······························-------------t
31,,,-----------~=-------+ t_t_:r::;_t.<. --------------1'* ,h,~ 1I;--------•
20 ~--.• _l __ :.r __ :"_i,_.~:-.. ~ .. i.·,·}.i.,=.-.. -.·:,r._:.. __ ~,·~,;._,,.'.! •. ·: .. -.. -.. -.. -.. -.-L.,._, .. · .• _.-~,,_~---.·:_•·:.'·-:._.-.. -.·r., __ \,·_1.:.: •. ·,_:•.·:.i._~----11 i < ;~· :r ;~:1------fl• ··············-,,II !II ···· !I 0 50 100 150 200 250 300 350 400
PurchaM cycle in weeks
Acc•ptabl• market ,hare 1%) . .,.... ____________________ .,. •-1=--------------------+ • 11:t-------------------------+ n=
>:<=.~: 3
11· fllii .:,:,;,: :•:❖:•
2 ~=~:=: :=:~:~,------------------------+
r,.~,-~.: .. ~.i.·::,_l_l,_~ .. i.~.!.,.....,,,,.---... ,,,,-,,,,,,.-------------t 0 """·:•. ""l-<• -1"'111!4-,-'I ---.--=ltltll-+'l!""l-t11 ~~~........,.
0 • 10 15 20 26 30 35 Acceptable market share (%)
e excludes one firm stating 70%
40 ••
Min 1pend to achieve mkt • hare SOOD
50
3 ...... --------------------..
100 200 300 •00 500 600 700 Min spend to achieve mkt share S000
Min spend to m• lnt'n mkt • hare SOOD 7.,._ _______________________ .....,.
•
: 1= i1!-----------------------t : ... 1"1.:-"t"::::.i"i"!.T.:a.'.~.i:=::=:==:=,'1";";;~"t·:~+1·1_-_-.---,-_-_-.-_-_-"---.-----.-----.---,-_-_-:1:i"t"J0["::;
0 200 400 600 800 1000 1200 1-400 1600 1800 2000
Min ap.nd to maint'n mkt shar• SOOO
BUSINESS TO BUSINESS:
25
PurchaH cycl• In wHk9 ,,.....--------------------.. 4 =~=~=-£~1--------------------------f
3 ::::~.--,i r .. ~_i:~·~:~'~, .... ---------------+ m: ~---2 ii•~·~·,------~=w
OJF1=.i.t.,.lc··•··_··_··_··_··_··_1=F~":"'. .··_··.,~1•l~FlRc·~··~··~··--_.:1:1~~:::~·--_.-.,-~~i-,"i~:~~~~~~~~~~~~~~~~~~• 0 60 100 150 200 250 300 350 ,oo
Purchase cycle in wNks
Acc1ptabl• market •h•r• (%)
, ...... ------------------~----......
•-f----~~----------------+ +-----,,is,1!1---------------------+
:+--.-.. -.-•111---------------------+ :;~:::: ~,:::~: f,f,
,_ it~ - tmi---------------1""1------+ 1
: f_i!.! = !.lr.~.•H----1 ;:_;_r_~_t. :i!:1------+ .. • ,,., .f~.-.'.•.~.B.·.l 0 ~=:::: ~,~:::: :e:::=:1
0 5 10 15 20 26 30 ... 50 Acc11ptable market share (%)
Min spend to 1chl1v1 mkt • hare SOOO 3,._ ____________________ .,.
Min spend to achieve mkt share S000
Min 1p1nd to m• lnt'n mkt 1hu1 $000 ,,,.... ____________________ ..,. ....... s .. ··········· ................................................................................... . - M1------------------------•
3 !; ;.g;,_ _______________________ • 2 M #!------------------------• I!:!! ... -----------------------•
:: ;,:-fa::: :~11•:1-----+ o,.11"4'"1-4''"1------~~~~-<""l-~~~~.,L
100 200 3Qo •oo sOo eoo 160 aoo eOo 1000 Min sp•nd to mainrn mkt share S000
0

26
Relationship between present market share and expected loss from 50% advertising reduction
Fastmoving Consumer Goods:
Y • ,2tlx + 1.401, R-• qu• r•d: .I
10 20 30 40 50 " 70 " 90 PrHent Market Share (%)
y • .Ix + 1.3, R-•quared: .. 22
20 0 18
i!: 16 ~ 0 - 0 a • ~ i 8 :i'! •
4
2
2.5 5 7.5 10 12.5 15 17,5 20 22.5 25 Monti. to los• ,hare
Consumer Durables:
y - ,311X - 2.073, R-•qu• r• d: .7H 45
40 0
l 35 -
~ 30 a • 25 --i1 20 -I
15 :i'! -10 0 -o 5 0 -0
0 --,o 20 30 40 50 60 70 80 90 - Present Market Share (%)
y - .sx + 5.5, R••quued: ~ 45
" 0
l ~
35
30 0 a
! 25 -i
20
• 15 - - ..... ,. - -10 0 ~o ~ - _g _o
5 00 g- 0 -
0 0 2.5 5 7.5 10 12.5 15 17.5 20 22.5 25
Months to lose share
Financial Services:
z • -" • -i1 I :ii
l ~ -"
i i :ii
Business to Business:
z • -" • ¾ i :ii
z • -" • -i1 I :l'!
30
25
20
15
10
5
0 0
11
10
9
' 7
• 5
4
3
2
,,
27
y • .41: - .I, R-•quarad: .I
20 30 40 60 Present Marbt Sha.-. (%)
y • .2x + .1, R-aquuad: .3
-... -.,. .,.
0
,,,. ,,
•• 70
,, ,,
- - ----0 .,. -
••
. ..., ________________________ ... ' 10 15 20 25 30 35
Months to lose share
y - .2&1x + 1.226, R-aquarad: .711 22
20
18
15
14
' 6
4
2
0 0 10 20 30 " so
Present Markel Shara (%) 50 70 80
y - -.1x + 12.5, R-•quarad: 7.2E-3
22
--.,.
20 -- 0 0 ---- -18 --- - -18 0 0
14
12
10 0
8
6 - - - -0 --0 4 - -- --2 - -- 0 -- -0 ,.,
0 ' 15 20 26 30 35 40 Months to los. share
28
Communications mix for new products and seNices
Product/service Cateoorv
Media Types Fastmoving Consumer Financial Business
Advertisina: Television
Radio
Newsoaoers
Maoazines
Direct marketina
Sales force
Sales nromotion/Cooo advert'
Public relations
TOTAL
Sales response to marketing expenditures
Sales $
Consumer G:xrl;
42%
6%
6%
10%
3%
13%
16%
5%
100 %
Durables
40%
2%
10%
10%
7%
14%
9%
4%
100 %
Sales $
.
to Services Business
28% 6%
7% 1%
18% 6%
4% 15%
21% 18%
18% 40%
2% 5%
3% 8%
100 % 100 %
Marketing Expenditure Marketing Expenditure Marketing Expenditure
Fastmovng C' durables Financial s... Bus to Bus
A 1 3 0 1
B 10 11 9 7
C 12 7 8 2
Totals: 23 21 1 7 10
Fastmovng C' durables Financials... Bus to Bus
A 4.35% 14.29% 0% 10%
B 43.48% 52.38% 52.94% 70%
C 52.17% 33.33% 47.06% 20%
Totals: 100% 100% 100% 100%
Totals:
5
37
29
71
Totals:
7.04%
52.11 %
40.85%
100%
29
Media scheduling approach
Schedule A Schedule B
Continuity
Time Time
Fastmovng C' durables Financial s... Bus to Bus
A 16.67% 36.36% 16.67% 10%
B 58.33% 40.91% 44.44% 40%
C 25% 22.73% 38.89% 50%
Totals: 100% 100% 100% 100%
Market share response to 50% reduction in advertising expenditure
Market share
Time
A
B
C
D
Totals:
A
B
C
D
Totals:
Market 1---~ share
Time
Market share
Response C
Time
Fastmovng C' durables Financial s... Bus to Bus
3 2 1 1
6 4 9 2
13 12 5 6
1 3 2 1
23 21 17 10
Fastmovng C' durables Financials... Bus to Bus
13.04% 9.52% 5.88% 10%
26.09% 19.05% 52.94% 20%
56.52% 57.14% 29.41% 60%
4.35% 14.29% 11.76% 10%
100% 100% 100% 100%
Schedule C
Pulsing
Time
Totals:
21.62%
47.3%
31.08%
100%
/ Response D '
Market 1----share
Totals:
7
21
36
7
71
Totals:
9.86%
29.58%
50.7%
9.86%
100%
Time
30
SECTION E: Measuring advertising effectiveness
Use quantitative measures of advertlslna effectiveness
Yes
t'-b
Freqncy
62
13
Existing Quantitative orod/service Effectiveness % using Av rank
Measures method if used
Sales resoonse 67% 1.3
Market share shifts 52% 2.0
Brand awareness 47% 2.2
Messane recall 41% 2.6
Executive iudnement 22% 3.1
Intention to buv scores 13% 2.8
Profitabilitv 14% 1.8
Resoonse device /couoon return, etc\ 29% 2.9
Use qualitative measures of Freqncy advertlslna effectiveness
Yes 42
t'-b 32
Qualltatlve effectiveness Freqncy measures used
Focus arouos 26
Trade feedback 1 7
Survevs/research 1 4
Interviews 7
Stochastic monitors 4
One on one nretests 3
Consumer oanels 1
%
83%
17%
New prod/service
% using Av rank method if used
43% 1.4
24% 2.5
29% 2.1
26% 2.8
13% 3.0
8% 1.9
7% 1.7
20% 2.7
%
57%
43%
%
36%
24%
19%
10%
6%
4%
1%
31
SECTION F: Advertising and direct marketing Issues
Key advertising Count % & Dromotlonal Issues
T.M. seamentation 18 15%
Prod differentiation 14 12%
Media clutter 14 12%
Media mix 1 2 10%
Cost effectiveness 12 10%
Budoet constraints 1 1 9%
Comm'n stratenv 1 0 8%
Position in a 8 7%
Comoetition 8 7%
Database manaaement 7 6%
Direct marketina 4 3%
Efficiencv/effectiveness 2 2%
Internal oromotion 1 1%
Key advertising & promotional Issues Count %
for the future
Direct marketino 26 28%
Media mix 13 14%
Database manaaement 1 1 12%
Seamentation 1 1 12%
Technoloaical chanae 9 10%
Budaets 6 6%
Cost effectiveness 5 5%
Communication strateoies 4 4%
Comoetition 3 3%
Coroorate imaae 3 3%
Understanding of Count % direct marketlna
Soecific taraetina 37 30%
Direct communication 44 36%
Personalised sellina 1 5 12%
Reauirina resoonse 14 11 %
Use of database 8 7%
Measurable 4 3%
32
Trends in Direct Marketing Spend by Industry Type
g, ,! ~
! .• .li C • E E 8 .. ,,_
I ~
! ·~ .. § E E 8 .. "
Direct Muketlng Shu• - Futmovlng Consumer 20~-~---~--~---~---~---~-~ 1•1-----------------------+ 1•1-----------------------+ 14+-----------------------4 12f--------------------~ 10+-----------------------4 ••+------------------------0.=,,.=.❖=-❖=:❖=,.:-+
~+1--,-}-¥-•-,-s-a---lEH-1t-:ir-t-rt-J~---,;-~:-r-tt-;;1-11r=-,,i.ir·,·i·1·•~--fr]i]i]1]1]1~i---lti1I~
1989 1990 1991 1992 1993 199,( Years
Direct Muketlng Sh• r• Con• umar Dur• blH 20•~-~----~----~ ·----~ ·---~~---~-~ 18Lf-----------------------+ 16Lf-----------------------+ 14L+------------------------1-12!f-----------------------+ 10,j----------,;;;,;,s--------r;!)wm--l
~:1=ll1:JI~ 1989 1990 1991 1992 1993 199•
Years
20 Direct Marketing Shara - Fin• ncl• I S• rv_lcH
18
16
14
12 10
• 6
• .. 2 0
::::S%::H
1----------------------.,::--~=-❖,-( ... -.... -~-·{f,:.t,~.,.t,~.',~.t.f,~.:.i _
--------------... .., .... .,..--1:_t_'.<.❖·•t.~ .•. ~,z.:_t~ .• 1.l.- .,.;,<.,.;;.,-::: %\j~: .,_' ~•:=:>:❖:::::❖
------_---....,=,:=•~!=t=~i=\•---1~f~!1~: ~i~ij~ ·:·:}rF~
~-lr:=1:t:i ~
19B9 1990 1991 1992 1993 199" Years
Direct Marketing Shu• • Bu• inH• to Elusln• H 20 18
16 14
• •
1989 1990 1991 1992 1993 199-4 Y• ars
THE GSBGM WORKING PAPER SERIES
The main purpose of this series is to reach a wide audience quickly for feedback on recently completed or in progress research. All papers are reviewed before publication.
A full catalogue with abstracts and details of other publications is available, for enquiries and to be included in our distribution list, write to:
The Research Co-ordinator, GSBGM, Victoria University of Wellington, PO Box 600, Wellington, New Zealand Tel: (04) 495 5085; Fax: (04) 712 200
Code in bold denotes order number, eg: WP 1/90
--- Group denotes the author's academic discipline Group (note this does not necessarily define the subject matter, as staffs interests may not be confined to the subjects they teach).
WP 1/90 Economics Group Hall, V.B.; T .P. Truong and Nguyen Van Anh 'An Austtalian fuel substitution tax model: ORANl-LFT. 1990Pp 16
---- 'An Austtalian fuel substitution model: ORANl-LFT' Energy Economics, 12(4) October 1990, 255-268
WP 2/90 Accountancy Group Heian, James B. and Alex N. Chen 'An enquiry into self-monitoring: its relationships to physical illness and psychological distress.' 1990 Pp 16
WP 3/90 Economics Group Bertram, LG.; R.J. Stephens and C.C. Wallace 'Economic instruments and the greenhouse effect' 1990 Pp39
WP4/90 Money and Finance Group Keef, S.P. 'Commerce matriculants: gender and ability.' 1990 Pp 17
WP S/90 Economics Group Coleman, William 'Harrod's Growth Model: an illumination using the multiplier-accelerator model.' 1990Pp 19
WP 6/90 Quantitative Studies Group Jackson, L. Fraser 'On generalising Engel's Law: commodity expenditure shares in hierarchic demand systems.' 1990 Pp 9
WP 7/90 Money and Finance Group Burnell, Stephen 'Rational theories of the future in general equilibrium models.' 1990 Pp 20
WPS/90 Management Group Shane, Scott A. Why do some societies invent more than others?' 1990 Pp 16
WP 9/90 Management Group Shane, Scott A. Individualism, opportunism and the preference for direct foreign investment across cultures.' 1990 Pp 19
WP 10/90 Economics Group Kunhong Kim 'Nominal wage stickiness and the natural rate hypothesis: an empirical analysis.' 1990 Pp 40
WP 11/90 Economics Group Robert A Buckle and Chris S Meads 'How do finns react to surprising changes in demand? A vector auto-regressive analysis using business survey data.' 1990 Pp 18
---- and ---- 'How do finns react to surprising changes in demand? A vector auto-regressive analysis using business survey data.' OJifordBulletin of Economics and Statistics Vo! 53, No 4, November 1991, 451-466
WP 12/90 Money and Finance Group S P Keef'Gender Performance Difference in High School Economics and Accounting: Some Evidence from New Zealand.' 1990 Pp 18
WP 1/91 Economic History Group Keith Rankin 'Gross National Product Estimates for New Zealand; 1859-1939.' 1991 Pp 27
WP 2/91 Public Policy and Economics Group Sylvia Dixon 'Cost Utility Analysis in Health Policy.' 1991 Pp43.
WP 3/91 Accountancy Group Paul V. Dunmore 'A test of the effects of changing information asymmetry in a capital market.' 1991 Pp 34.
WP 4/91 Economics Group Lewis Evans 'On the Restrictive nature of Constant Elasticity Demand Functions.' 1991 Pp 20.
WP 5/91 lnformation Systems Group David G. Keane 'How senior executives think and work: implications for the design of executive information systems.' 1991 Pp 9.
WP 6/91 Economics Group Hall, V.B. and R.G. Trevor 'Long run equilibrium estimation and inference.' 1991 Pp 29
---- 'Long run equilibrium estimation and inference: a non-parametric application', forthcoming in P.C.B. Phillipps (ed.) Models, metlwds and applications of econometrics: essays in lwnour of Rex Bergstrom Oxford: Basil Blackwell 1992
WP 7/91 Economics and Public Policy Groups Williams, Michael, and G. Reuten 'Managing the Mixed Economy: The Necessity of Welfare Policy' 1991 Pp 23.
WP 8/91 Management Group Brocklesby, J; S. Cummings and J. Davies 'Cybernetics and organisational analysis; towards a better understanding of Beer's Viable Systems Model.' 1991 Pp 27
WP 9/91 Accountancy Group Firth, Michael and Andrew Smith 'The selection of auditor finns by companies in the new issue market.' 1991. Pp 22.
---- 'The selection of auditor firms by companies in the new issue market.' Forthcoming Applied Economics Vo! 24 1992
WP 10/91 Economics Group Bertram, LG. 'The rising energy intensity of the New '.lealand economy.' 1991 Pp 45.
WP 11/91 Economics Group Hall, V.B. 'Long run concepts in New '.lealand macroeconometric and CGE models' 1991 Pp 22.
WP12/91 GSBGM Cartner, Monica' An analysis of the importance of management research topics to academics and chief executives in New '.lealand and Canada' 1991 Pp 11.
WP 13/91 Economics Group McDermott, John 'Where did the robber barons and moneylenders meet? A time series analysis of financial market development.' 1991 Pp 31.
WP 1/92 Money and Finance Group Burnell, Stephen J. and David K. Sheppard 'Upgrading New '.lealand's competitive advantage: a critique and sone proposals.' 1992 Pp 26.
WP 2/92 Quantitative Studies Group Poot, Jacques and Jacques J. Siegers' An economic analysis of fertility and female labour force participation in New '.lealand.' 1992 Pp 27.
WP 3/92 Money and Finance Group Lally, Martin 'Project valuation using state contingent claim prices.' 1992 Pp 9.
WP 4/92 Economics Group Kim, Kunhong, R.A. Buckle and V.B. Hall 'Key features of New '.lealand Business Cycles.'
WPS/92 Management Group McLennan, Roy 'The OD Focus Group: A versatile tool for planned change.'
WP6/92 Information Systems Group Jackson, Ivan F. 'Customer-oriented strategic information systems.'
WP 7/92 Quantitative Studies Group Krawczyk, Jacek B. and Boleslaw Tolwinski 'A cooperative solution for the three-nation problem of exploitation of the southern blue tuna.'
WP 8/92 Marketing Group Thirkell, Peter and David Stewart' A description of the advertisding and direct marketing decision processes of New '.lealand marketing managers.'