Verification and Optimization of an Ultra-Low Volume (ULV ...
17
applied sciences Article Verification and Optimization of an Ultra-Low Volume (ULV) Sprayer Used for the Inactivation of Indoor Total Bacteria Yun-Hee Choi 1,2 , Da-An Huh 3 , Ju-Yeon Lee 1,2 , Ji Yoon Choi 1 and Kyong Whan Moon 2,4, * Citation: Choi, Y.-H.; Huh, D.-A.; Lee, J.-Y.; Choi, J.Y.; Moon, K.W. Verification and Optimization of an Ultra-Low Volume (ULV) Sprayer Used for the Inactivation of Indoor Total Bacteria. Appl. Sci. 2021, 11, 3713. https://doi.org/10.3390/ app11083713 Academic Editor: Andrew May Received: 2 March 2021 Accepted: 18 April 2021 Published: 20 April 2021 Publisher’s Note: MDPI stays neutral with regard to jurisdictional claims in published maps and institutional affil- iations. Copyright: © 2021 by the authors. Licensee MDPI, Basel, Switzerland. This article is an open access article distributed under the terms and conditions of the Creative Commons Attribution (CC BY) license (https:// creativecommons.org/licenses/by/ 4.0/). 1 Department of Health and Safety Convergence Science, Korea University, Anam-ro 145, Seongbuk-gu, Seoul 02841, Korea; [email protected] (Y.-H.C.); [email protected] (J.-Y.L.); [email protected] (J.Y.C.) 2 BK21 FOUR R & E Center for Learning Health System, Korea University, Anam-ro 145, Seongbuk-gu, Seoul 02841, Korea 3 Institute of Health Sciences, Korea University, Anam-ro 145, Seongbuk-gu, Seoul 02841, Korea; [email protected] 4 Department of Health and Environmental Science, Korea University, Anam-ro 145, Seongbuk-gu, Seoul 02841, Korea * Correspondence: [email protected]; Tel.: +82-2-940-2768 Abstract: Physical and chemical cleaning for the removal of indoor microorganisms, which can cause allergic reactions and respiratory diseases, is labor-intensive and time-consuming. An ultra- low volume (ULV) sprayer, a newly introduced device to inactivate pathogenic microorganisms, allows the disinfectant particles to reach hard-to-reach spaces indoors and is more cost-effective than the existing methods. However, few studies have been conducted to verify the efficiency of the ULV sprayer. Here, we verified the disinfection efficiency of the ULV sprayer for inactivating total bacteria present on indoor surfaces, considering the factors affecting bacteria inactivation, and presented the optimal ULV sprayer usage conditions to achieve the highest disinfection efficiency depending on room size. The total bacteria removal efficiency was high (range: 0.56–2.46 log 10 reductions), including hard-to-reach spaces. A response surface model was developed to identify the individual and interactive effects of the disinfectant concentration, spray amount, and room size on total bacteria disinfection efficiency. These three variables had interactive effects on the total bacteria disinfection efficiency. The experimental data were fitted to a second-order polynomial model, with high coefficients of determination (R 2 ) for all models (R 2 > 0.82). The optimum conditions were a spray amount of 3.08–6.40 L in 160 m 3 , 3.78–7.22 L in 230 m 3 , and 5.68–8 L in 300 m 3 surface area when using dilution rates of 100 times. These conditions predicted a bacterial disinfection efficiency of >1.10 log 10 reductions (92%) on all surfaces. Our results clearly indicate that the ULV sprayer effectively inactivates total bacteria present on indoor surfaces. Keywords: bacteria inactivation; indoor disinfection; response surface methodology; total bacteria; ULV sprayer 1. Introduction Nowadays, as people spend approximately 80–90% of their time in indoor environ- ments, it is crucial to prevent infections caused by biological pollutants indoors [1]. Among the various biological pollutants (insects, bacteria, fungi, and mites), bacteria cause the most common infectious diseases as they are present in most indoor spaces, including multi-use facilities and houses, and cause various allergic reactions and respiratory dis- eases [2,3]. Several studies reported that typical indoor bacterial concentrations were approximately 10 2 to 10 6 colony forming units (CFU) m -3 , which means the viable bacteria cells per cubic meter [4], and this concentration increased children’s risk of asthma, chronic inflammatory lung diseases, and even lung cancer [5,6]. Bacteria in such environments are transmitted primarily through airborne routes or contaminated environmental surfaces Appl. Sci. 2021, 11, 3713. https://doi.org/10.3390/app11083713 https://www.mdpi.com/journal/applsci
-
Upload
khangminh22 -
Category
Documents
-
view
0 -
download
0
Transcript of Verification and Optimization of an Ultra-Low Volume (ULV ...
applied sciences
Article
Verification and Optimization of an Ultra-Low Volume (ULV)Sprayer Used for the Inactivation of Indoor Total Bacteria
Yun-Hee Choi 1,2, Da-An Huh 3 , Ju-Yeon Lee 1,2, Ji Yoon Choi 1 and Kyong Whan Moon 2,4,*
�����������������
Citation: Choi, Y.-H.; Huh, D.-A.;
Lee, J.-Y.; Choi, J.Y.; Moon, K.W.
Verification and Optimization of an
Ultra-Low Volume (ULV) Sprayer
Used for the Inactivation of Indoor
Total Bacteria. Appl. Sci. 2021, 11,
3713. https://doi.org/10.3390/
app11083713
Academic Editor: Andrew May
Received: 2 March 2021
Accepted: 18 April 2021
Published: 20 April 2021
Publisher’s Note: MDPI stays neutral
with regard to jurisdictional claims in
published maps and institutional affil-
iations.
Copyright: © 2021 by the authors.
Licensee MDPI, Basel, Switzerland.
This article is an open access article
distributed under the terms and
conditions of the Creative Commons
Attribution (CC BY) license (https://
creativecommons.org/licenses/by/
4.0/).
1 Department of Health and Safety Convergence Science, Korea University, Anam-ro 145, Seongbuk-gu,Seoul 02841, Korea; [email protected] (Y.-H.C.); [email protected] (J.-Y.L.);[email protected] (J.Y.C.)
2 BK21 FOUR R & E Center for Learning Health System, Korea University, Anam-ro 145, Seongbuk-gu,Seoul 02841, Korea
3 Institute of Health Sciences, Korea University, Anam-ro 145, Seongbuk-gu, Seoul 02841, Korea;[email protected]
4 Department of Health and Environmental Science, Korea University, Anam-ro 145, Seongbuk-gu,Seoul 02841, Korea
* Correspondence: [email protected]; Tel.: +82-2-940-2768
Abstract: Physical and chemical cleaning for the removal of indoor microorganisms, which cancause allergic reactions and respiratory diseases, is labor-intensive and time-consuming. An ultra-low volume (ULV) sprayer, a newly introduced device to inactivate pathogenic microorganisms,allows the disinfectant particles to reach hard-to-reach spaces indoors and is more cost-effectivethan the existing methods. However, few studies have been conducted to verify the efficiency ofthe ULV sprayer. Here, we verified the disinfection efficiency of the ULV sprayer for inactivatingtotal bacteria present on indoor surfaces, considering the factors affecting bacteria inactivation, andpresented the optimal ULV sprayer usage conditions to achieve the highest disinfection efficiencydepending on room size. The total bacteria removal efficiency was high (range: 0.56–2.46 log10
reductions), including hard-to-reach spaces. A response surface model was developed to identify theindividual and interactive effects of the disinfectant concentration, spray amount, and room size ontotal bacteria disinfection efficiency. These three variables had interactive effects on the total bacteriadisinfection efficiency. The experimental data were fitted to a second-order polynomial model, withhigh coefficients of determination (R2) for all models (R2 > 0.82). The optimum conditions were aspray amount of 3.08–6.40 L in 160 m3, 3.78–7.22 L in 230 m3, and 5.68–8 L in 300 m3 surface areawhen using dilution rates of 100 times. These conditions predicted a bacterial disinfection efficiencyof >1.10 log10 reductions (92%) on all surfaces. Our results clearly indicate that the ULV sprayereffectively inactivates total bacteria present on indoor surfaces.
Keywords: bacteria inactivation; indoor disinfection; response surface methodology; total bacteria;ULV sprayer
1. Introduction
Nowadays, as people spend approximately 80–90% of their time in indoor environ-ments, it is crucial to prevent infections caused by biological pollutants indoors [1]. Amongthe various biological pollutants (insects, bacteria, fungi, and mites), bacteria cause themost common infectious diseases as they are present in most indoor spaces, includingmulti-use facilities and houses, and cause various allergic reactions and respiratory dis-eases [2,3]. Several studies reported that typical indoor bacterial concentrations wereapproximately 102 to 106 colony forming units (CFU) m−3, which means the viable bacteriacells per cubic meter [4], and this concentration increased children’s risk of asthma, chronicinflammatory lung diseases, and even lung cancer [5,6]. Bacteria in such environments aretransmitted primarily through airborne routes or contaminated environmental surfaces
Appl. Sci. 2021, 11, 3713. https://doi.org/10.3390/app11083713 https://www.mdpi.com/journal/applsci
Appl. Sci. 2021, 11, 3713 2 of 17
indoors [7]. Several disinfection methods have been developed to control this spread effec-tively [8–10]. Thus far, physical removal methods or chemical agents are used to controlindoor microorganisms, including bacteria [10,11]. A typical physical removal method isto wipe the surfaces of the objects with a cloth or sponge soaked in chemical disinfectant.Cleaning (or the physical removal method) is considered the most effective method as itphysically removes the source of infection. However, this method has disadvantages, e.g.,the spreading of pollutants and organic matter (e.g., blood, secretions, and excretions), ifthe user does not use the appropriate disinfectants, such as hydrogen peroxide or alcohol.Additionally, physical cleaning requires one to completely empty the indoor space that is tobe disinfected and remove all equipment and furniture so that the workers can thoroughlyscrub all the surfaces. Therefore, this method is time- and labor-intensive.
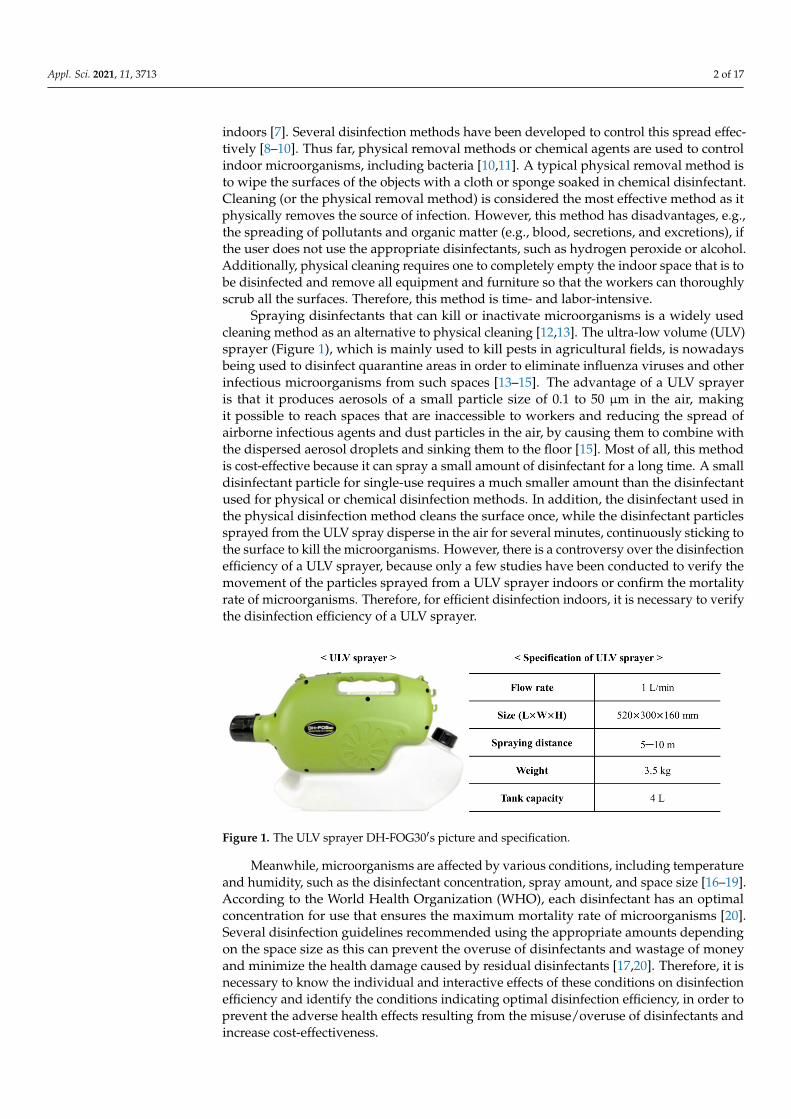
Spraying disinfectants that can kill or inactivate microorganisms is a widely usedcleaning method as an alternative to physical cleaning [12,13]. The ultra-low volume (ULV)sprayer (Figure 1), which is mainly used to kill pests in agricultural fields, is nowadaysbeing used to disinfect quarantine areas in order to eliminate influenza viruses and otherinfectious microorganisms from such spaces [13–15]. The advantage of a ULV sprayeris that it produces aerosols of a small particle size of 0.1 to 50 µm in the air, makingit possible to reach spaces that are inaccessible to workers and reducing the spread ofairborne infectious agents and dust particles in the air, by causing them to combine withthe dispersed aerosol droplets and sinking them to the floor [15]. Most of all, this methodis cost-effective because it can spray a small amount of disinfectant for a long time. A smalldisinfectant particle for single-use requires a much smaller amount than the disinfectantused for physical or chemical disinfection methods. In addition, the disinfectant used inthe physical disinfection method cleans the surface once, while the disinfectant particlessprayed from the ULV spray disperse in the air for several minutes, continuously sticking tothe surface to kill the microorganisms. However, there is a controversy over the disinfectionefficiency of a ULV sprayer, because only a few studies have been conducted to verify themovement of the particles sprayed from a ULV sprayer indoors or confirm the mortalityrate of microorganisms. Therefore, for efficient disinfection indoors, it is necessary to verifythe disinfection efficiency of a ULV sprayer.
Appl. Sci. 2021, 11, x FOR PEER REVIEW 2 of 17
environments are transmitted primarily through airborne routes or contaminated envi-ronmental surfaces indoors [7]. Several disinfection methods have been developed to con-trol this spread effectively [8–10]. Thus far, physical removal methods or chemical agents are used to control indoor microorganisms, including bacteria [10,11]. A typical physical removal method is to wipe the surfaces of the objects with a cloth or sponge soaked in chemical disinfectant. Cleaning (or the physical removal method) is considered the most effective method as it physically removes the source of infection. However, this method has disadvantages, e.g., the spreading of pollutants and organic matter (e.g., blood, secre-tions, and excretions), if the user does not use the appropriate disinfectants, such as hy-drogen peroxide or alcohol. Additionally, physical cleaning requires one to completely empty the indoor space that is to be disinfected and remove all equipment and furniture so that the workers can thoroughly scrub all the surfaces. Therefore, this method is time- and labor-intensive.
Spraying disinfectants that can kill or inactivate microorganisms is a widely used cleaning method as an alternative to physical cleaning [12,13]. The ultra-low volume (ULV) sprayer (Figure 1), which is mainly used to kill pests in agricultural fields, is now-adays being used to disinfect quarantine areas in order to eliminate influenza viruses and other infectious microorganisms from such spaces [13–15]. The advantage of a ULV sprayer is that it produces aerosols of a small particle size of 0.1 to 50 μm in the air, mak-ing it possible to reach spaces that are inaccessible to workers and reducing the spread of airborne infectious agents and dust particles in the air, by causing them to combine with the dispersed aerosol droplets and sinking them to the floor [15]. Most of all, this method is cost-effective because it can spray a small amount of disinfectant for a long time. A small disinfectant particle for single-use requires a much smaller amount than the disinfectant used for physical or chemical disinfection methods. In addition, the disinfectant used in the physical disinfection method cleans the surface once, while the disinfectant particles sprayed from the ULV spray disperse in the air for several minutes, continuously sticking to the surface to kill the microorganisms. However, there is a controversy over the disin-fection efficiency of a ULV sprayer, because only a few studies have been conducted to verify the movement of the particles sprayed from a ULV sprayer indoors or confirm the mortality rate of microorganisms. Therefore, for efficient disinfection indoors, it is neces-sary to verify the disinfection efficiency of a ULV sprayer.
Figure 1. The ULV sprayer DH-FOG30′s picture and specification.
Meanwhile, microorganisms are affected by various conditions, including tempera-ture and humidity, such as the disinfectant concentration, spray amount, and space size [16–19]. According to the World Health Organization (WHO), each disinfectant has an optimal concentration for use that ensures the maximum mortality rate of microorganisms [20]. Several disinfection guidelines recommended using the appropriate amounts de-pending on the space size as this can prevent the overuse of disinfectants and wastage of money and minimize the health damage caused by residual disinfectants [17,20]. There-fore, it is necessary to know the individual and interactive effects of these conditions on
Figure 1. The ULV sprayer DH-FOG30′s picture and specification.
Meanwhile, microorganisms are affected by various conditions, including temperatureand humidity, such as the disinfectant concentration, spray amount, and space size [16–19].According to the World Health Organization (WHO), each disinfectant has an optimalconcentration for use that ensures the maximum mortality rate of microorganisms [20].Several disinfection guidelines recommended using the appropriate amounts dependingon the space size as this can prevent the overuse of disinfectants and wastage of moneyand minimize the health damage caused by residual disinfectants [17,20]. Therefore, it isnecessary to know the individual and interactive effects of these conditions on disinfectionefficiency and identify the conditions indicating optimal disinfection efficiency, in order toprevent the adverse health effects resulting from the misuse/overuse of disinfectants andincrease cost-effectiveness.
Appl. Sci. 2021, 11, 3713 3 of 17
It is expected that the ULV sprayer will be more effective and useful in removing andinactivating total bacteria when used in conjunction with physical and chemical cleaningmethods. In this study, we evaluated the disinfection efficiency of the ULV sprayer in termsof inactivating total bacteria in indoor spaces and analyzed this efficiency according to thedisinfectant concentration, spray amount, and space size. Finally, depending on the sizeof the space to be disinfected, we presented the optimal ULV sprayer usage conditions toachieve the highest disinfection efficiency.
2. Materials and Methods
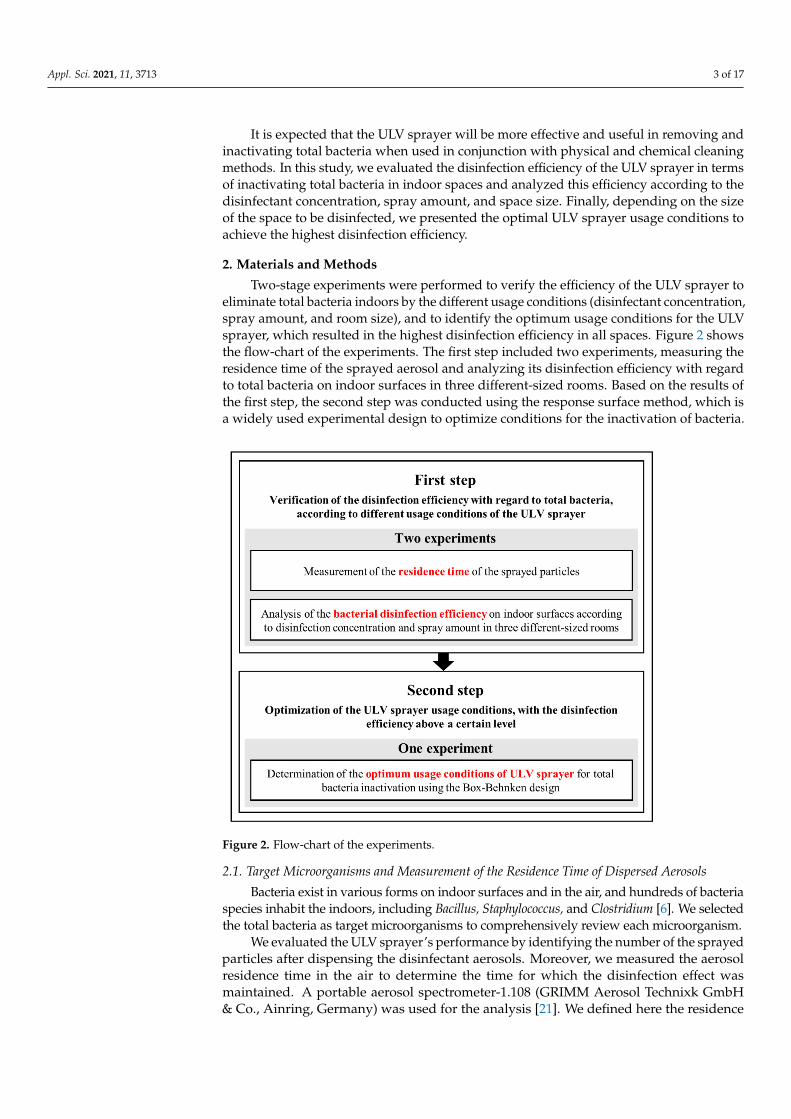
Two-stage experiments were performed to verify the efficiency of the ULV sprayer toeliminate total bacteria indoors by the different usage conditions (disinfectant concentration,spray amount, and room size), and to identify the optimum usage conditions for the ULVsprayer, which resulted in the highest disinfection efficiency in all spaces. Figure 2 showsthe flow-chart of the experiments. The first step included two experiments, measuring theresidence time of the sprayed aerosol and analyzing its disinfection efficiency with regardto total bacteria on indoor surfaces in three different-sized rooms. Based on the results ofthe first step, the second step was conducted using the response surface method, which isa widely used experimental design to optimize conditions for the inactivation of bacteria.
Appl. Sci. 2021, 11, x FOR PEER REVIEW 3 of 17
disinfection efficiency and identify the conditions indicating optimal disinfection effi-ciency, in order to prevent the adverse health effects resulting from the misuse/overuse of disinfectants and increase cost-effectiveness.
It is expected that the ULV sprayer will be more effective and useful in removing and inactivating total bacteria when used in conjunction with physical and chemical cleaning methods. In this study, we evaluated the disinfection efficiency of the ULV sprayer in terms of inactivating total bacteria in indoor spaces and analyzed this efficiency according to the disinfectant concentration, spray amount, and space size. Finally, depending on the size of the space to be disinfected, we presented the optimal ULV sprayer usage conditions to achieve the highest disinfection efficiency.
2. Materials and Methods Two-stage experiments were performed to verify the efficiency of the ULV sprayer
to eliminate total bacteria indoors by the different usage conditions (disinfectant concen-tration, spray amount, and room size), and to identify the optimum usage conditions for the ULV sprayer, which resulted in the highest disinfection efficiency in all spaces. Figure 2 shows the flow-chart of the experiments. The first step included two experiments, meas-uring the residence time of the sprayed aerosol and analyzing its disinfection efficiency with regard to total bacteria on indoor surfaces in three different-sized rooms. Based on the results of the first step, the second step was conducted using the response surface method, which is a widely used experimental design to optimize conditions for the inac-tivation of bacteria.
Figure 2. Flow-chart of the experiments.
2.1. Target Microorganisms and Measurement of the Residence Time of Dispersed Aerosols Bacteria exist in various forms on indoor surfaces and in the air, and hundreds of
bacteria species inhabit the indoors, including Bacillus, Staphylococcus, and Clostridium [6]. We selected the total bacteria as target microorganisms to comprehensively review each microorganism.
Figure 2. Flow-chart of the experiments.
2.1. Target Microorganisms and Measurement of the Residence Time of Dispersed Aerosols
Bacteria exist in various forms on indoor surfaces and in the air, and hundreds of bacteriaspecies inhabit the indoors, including Bacillus, Staphylococcus, and Clostridium [6]. We selectedthe total bacteria as target microorganisms to comprehensively review each microorganism.
We evaluated the ULV sprayer’s performance by identifying the number of the sprayedparticles after dispensing the disinfectant aerosols. Moreover, we measured the aerosolresidence time in the air to determine the time for which the disinfection effect wasmaintained. A portable aerosol spectrometer-1.108 (GRIMM Aerosol Technixk GmbH& Co., Ainring, Germany) was used for the analysis [21]. We defined here the residence
Appl. Sci. 2021, 11, 3713 4 of 17
time as the time taken for the concentration of sprayed particles to decrease to less than15 cm−3 without further reductions.
2.2. Analysis of the Total Bacterial Disinfection Efficiency on Surfaces2.2.1. Microbiological Culture and Biofilm Templates
We prepared microorganisms used for experiments. We obtained total bacteria from aclassroom wall (10 × 10 cm2) by gently rubbing it with a sterile cotton swab (3M pipetteswab, 3M, St. Paul, MN, USA) and stored it in saline solution (0.9% NaCl). Then, 1 mLof microbial suspension was inoculated onto a tryptic soy agar medium and incubatedovernight at 37 ◦C in an incubator (WiseCubeTM Fuzzy Control System, DAIHAN Scien-tific, Wonju, Korea) [22,23]. Then, we inoculated the incubated bacteria into the sterilizedtrypticase soy broth (TSB) and incubated overnight at 37 ◦C. We followed the serial dilu-tion method to obtain a moderate number of colonies. The inoculum concentration wasenumerated and adjusted by the plate count method [24]. According to this method, theinoculum density was approximately 5–6 log10 CFU/mL.
We prepared hydrophobic polypropylene plastic film (5 × 5 cm2) which was pre-cleaned with 70% isopropyl alcohol to make experimental biofilm templates [25]. Eachtemplate was inoculated with TSB containing approximately 2–3 log10 CFU/plate of totalbacteria and dried overnight on a clean bench.
2.2.2. Disinfection Using the ULV Sprayer and Total Bacteria Sampling
We used a ULV sprayer (DH-FOG30, DAEHO GREEN, Gyeongnam, Korea) to con-duct indoor disinfection. The flow rate of a sprayer was approximately 1 L/min and ithad a spraying distance of 5–10 m horizontally. We used a Rely+OnTM VirkonTM Microdisinfectant (Rely+OnTM VirkonTM Micro, Antec International Limited, Sudbury, Suffolk,UK) containing peroxygen compounds [26]. All doors, windows, and ventilation outlets inthe area to be sprayed were closed at the time of spraying.
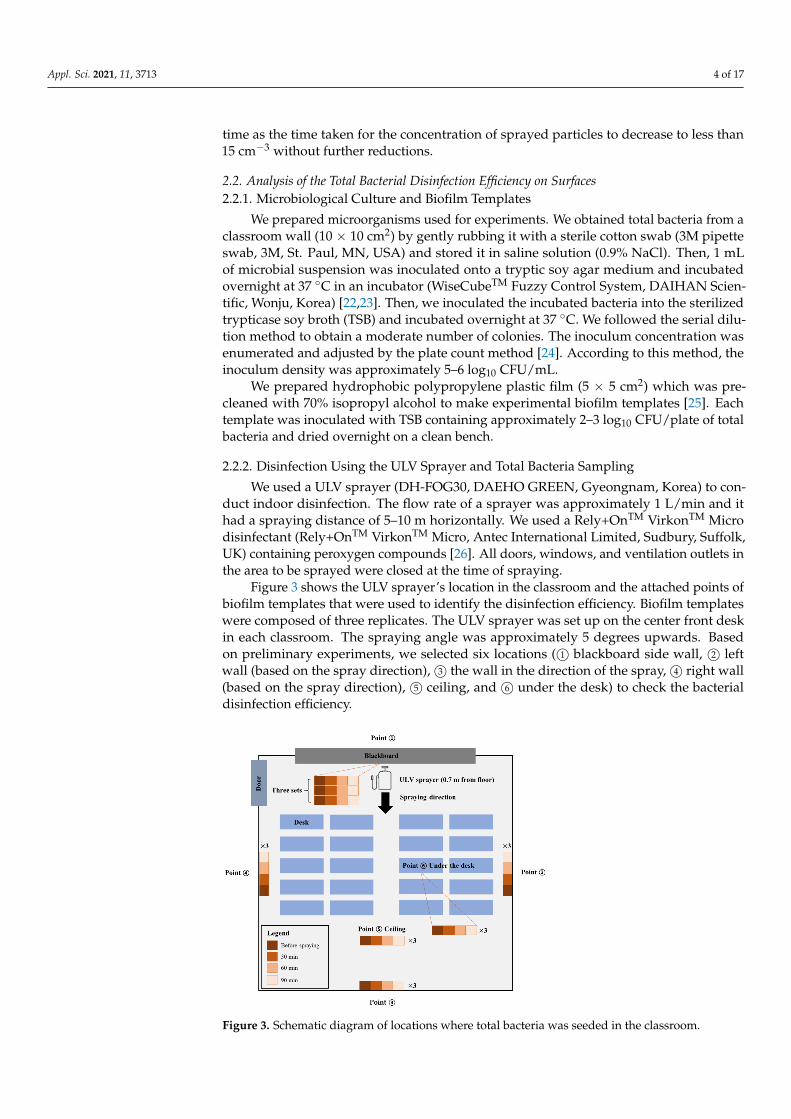
Figure 3 shows the ULV sprayer’s location in the classroom and the attached points ofbiofilm templates that were used to identify the disinfection efficiency. Biofilm templateswere composed of three replicates. The ULV sprayer was set up on the center front deskin each classroom. The spraying angle was approximately 5 degrees upwards. Basedon preliminary experiments, we selected six locations ( 1© blackboard side wall, 2© leftwall (based on the spray direction), 3© the wall in the direction of the spray, 4© right wall(based on the spray direction), 5© ceiling, and 6© under the desk) to check the bacterialdisinfection efficiency.
Appl. Sci. 2021, 11, x FOR PEER REVIEW 5 of 17
Figure 3. Schematic diagram of locations where total bacteria was seeded in the classroom.
We observed the disinfection efficiency for 30, 60, and 90 min after spraying the dis-infectant. Bacteria that remained on the biofilms templates at the six points (①–⑥) were recovered using Rodac plates (Trypticase soy agar, B & S, Sanimall, Gyeonggi-do, Korea) [27]. Next, the Rodac plates were incubated overnight at 37 °C. Access to disinfectant-sprayed areas was restricted during and following the ULV spraying. Temperature and humidity were also measured using a thermometer data logger (HOBO MX temp/RH log-ger, Onset computer co., Bourne, MA, USA) [28]. The experiments were conducted from 28 August 2020 to 9 September 2020.
2.2.3. Determination of the Factors Affecting Bacterial Inactivation Microorganisms exhibit various inactivation characteristics according to the disin-
fectant concentration, spray amount, and room size [16–18]. Therefore, we determined whether the change in these factors affected the disinfection efficiency of bacteria. To set the minimum and maximum levels of each factor on efficiency, we reviewed several stud-ies and determined the ranges based on the recommended volume and actual-use concen-trations. We set the values to be elements of an arithmetic sequence. Disinfectant concen-tration (dilution rate) was divided into 50, 100, and 200 times based on the recommended dilution rate of the disinfectant we used of 100 times. Spray amount was divided into 2, 5, and 8 L, based on the recommended usage volume of ULV sprayer per time of 5 L. The rooms were selected in order of size by measuring the room size in advance. They re-flected the size of the location where quarantine was conducted at the actual site. Room sizes were 8400 mm (length) × 7500 mm (width) × 2500 mm (height) (approximately 160 m3), 10,800 mm (length) × 8400 mm (width) × 2500 mm (height) (approximately 230 m3), and 12,600 mm (length) × 9500 mm (width) × 2500 mm (height) (approximately 300 m3), respectively.
The Box–Behnken design (BBD), one of the response surface methodology designs, was used to identify the individual and interaction effects of each factor on the disinfec-tion efficiency. Response surface methodology is a combination of statistical and mathe-matical techniques used to develop and optimize processes in which the response of in-
Figure 3. Schematic diagram of locations where total bacteria was seeded in the classroom.
Appl. Sci. 2021, 11, 3713 5 of 17
We observed the disinfection efficiency for 30, 60, and 90 min after spraying the disin-fectant. Bacteria that remained on the biofilms templates at the six points ( 1©– 6©) were re-covered using Rodac plates (Trypticase soy agar, B & S, Sanimall, Gyeonggi-do, Korea) [27].Next, the Rodac plates were incubated overnight at 37 ◦C. Access to disinfectant-sprayedareas was restricted during and following the ULV spraying. Temperature and humiditywere also measured using a thermometer data logger (HOBO MX temp/RH logger, Onsetcomputer co., Bourne, MA, USA) [28]. The experiments were conducted from 28 August2020 to 9 September 2020.
2.2.3. Determination of the Factors Affecting Bacterial Inactivation
Microorganisms exhibit various inactivation characteristics according to the disin-fectant concentration, spray amount, and room size [16–18]. Therefore, we determinedwhether the change in these factors affected the disinfection efficiency of bacteria. Toset the minimum and maximum levels of each factor on efficiency, we reviewed severalstudies and determined the ranges based on the recommended volume and actual-useconcentrations. We set the values to be elements of an arithmetic sequence. Disinfectantconcentration (dilution rate) was divided into 50, 100, and 200 times based on the recom-mended dilution rate of the disinfectant we used of 100 times. Spray amount was dividedinto 2, 5, and 8 L, based on the recommended usage volume of ULV sprayer per timeof 5 L. The rooms were selected in order of size by measuring the room size in advance.They reflected the size of the location where quarantine was conducted at the actual site.Room sizes were 8400 mm (length)× 7500 mm (width)× 2500 mm (height) (approximately160 m3), 10,800 mm (length) × 8400 mm (width) × 2500 mm (height) (approximately230 m3), and 12,600 mm (length) × 9500 mm (width) × 2500 mm (height) (approximately300 m3), respectively.
The Box–Behnken design (BBD), one of the response surface methodology designs,was used to identify the individual and interaction effects of each factor on the disinfectionefficiency. Response surface methodology is a combination of statistical and mathematicaltechniques used to develop and optimize processes in which the response of interest isinfluenced by several factors [29]. The BBD is an independent and rotatable quadraticdesign with variable combinations at the edges’ midpoints and the center of the experi-mental space. It requires three levels for each explanatory variable, which requires fewerexperiments than the other response surface methodology designs to estimate the effectsof variables and their interactions. It is a widely used method for optimizing variousconditions for bacteria inactivation [30].
2.2.4. Calculation of the Disinfection Efficiency of Total Bacteria
We counted the viable cell colony grown on the plate using the plate method tocalculate the disinfection efficiency [31]. The equations we used are as follows:
DE = log10NBNA
(1)
where DE is the disinfection efficiency, NB is the number of colonies before the disinfection,and NA is the number of colonies after the disinfection.
2.3. Statistical Analysis
Data of bacterial disinfection efficiency on indoor surfaces present the average numberof colonies for triplicate disinfection experiments. In the optimization analysis, disinfectantconcentration, spray amount, and room size were the explanatory variables, and totalbacteria disinfection efficiency was the response variable. Each of the three explanatoryvariables’ levels was standardized. A second-order polynomial model was fitted to cor-relate the relationship between the response and explanatory variables. The data wereevaluated by statistical analysis of variance (ANOVA) using the statistical software Minitab(version 19, Minitab Inc., State College, PA, USA). We also estimated the goodness-of-fit
Appl. Sci. 2021, 11, 3713 6 of 17
and coefficients of each model. A quadratic model that includes the linear model is asfollows [32]:
Y = β0 +3
∑i=1
βiXi +3
∑i=1
βiiX2i +
2
∑i=1
3
∑j=2
βijXiXj + ei, (2)
where Y is the response variable, Xi and Xj are the explanatory variables, β0 is the modelconstant, βi represents the linear coefficient, βii denotes the quadratic coefficient, βij indi-cates the interaction coefficient, and ei is the statistical error.
We performed a Pearson correlation analysis to verify that different size fractions ofPMs were correlated with each other during the dispersed aerosols’ residence time. ASpearman correlation analysis was conducted to determine the relationship between thethree disinfection conditions and bacterial disinfection efficiency. These statistical analyseswere conducted using SPSS version 25.0 (IBM, New York, NY, USA). Statistically significantdifferences were reported with p-values < 0.05.
3. Results3.1. Residence Time of Dispersed Aerosols
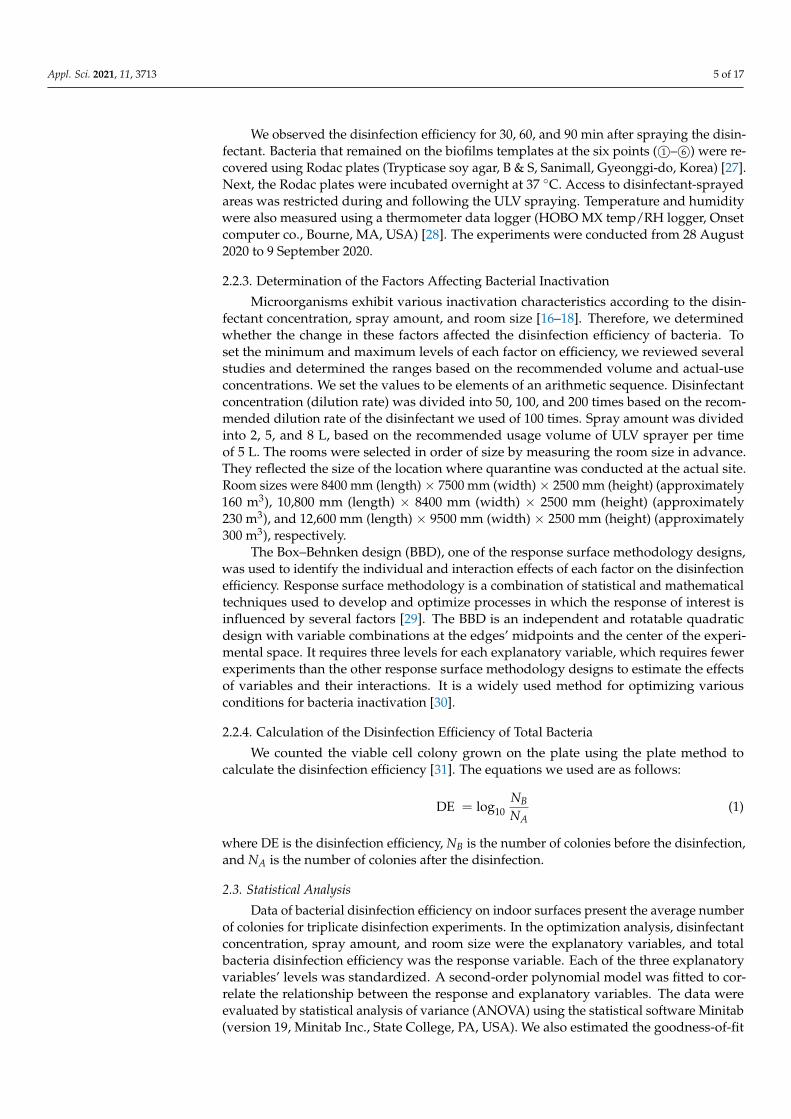
The residence time of dispersed aerosols following spraying using the ULV sprayer ispresented in Figure 4. Residence time, the duration until the sprayed aerosol particle con-centration decreased to less than 15 cm−3 without further reductions, was approximately90 min when spraying 5 L over 230 m3 (Figure 4b). The highest number of PM10, PM2.5,and PM1.0 particles was 39,869, 5987, and 969, respectively, following spraying with theULV sprayer. After 30 min, the number of particles was 543, 349, and 113, respectively,and after 60 min, it was reduced to 8, 8, and 7, respectively. Even if the spray amount wasreduced or increased, the sprayed particles sank after 91 min and 76 min, respectively,resulting in a residence time similar to that for the 5 L spray amount of 91 min (Figure 4a,c).
Appl. Sci. 2021, 11, x FOR PEER REVIEW 7 of 17
Figure 4. Variation of three different sizes of PM fractions after spraying with ULV sprayer: (a) variation of PM10, PM2.5, and PM1.0 after dispensing using a ULV sprayer when the spray amount was 2 L in 230 m3, (b) variation of PM10, PM2.5, and PM1.0 after dispensing using a ULV sprayer when the spray amount was 5 L in 230 m3, and (c) variation of PM10, PM2.5, and PM1.0 after dispensing using a ULV sprayer when the spray amount was 8 L in 230 m3.
3.2. Efficacy of Bacterial Disinfection on Indoor Surfaces The disinfection efficiency for total bacteria on indoor surfaces is presented in Figure
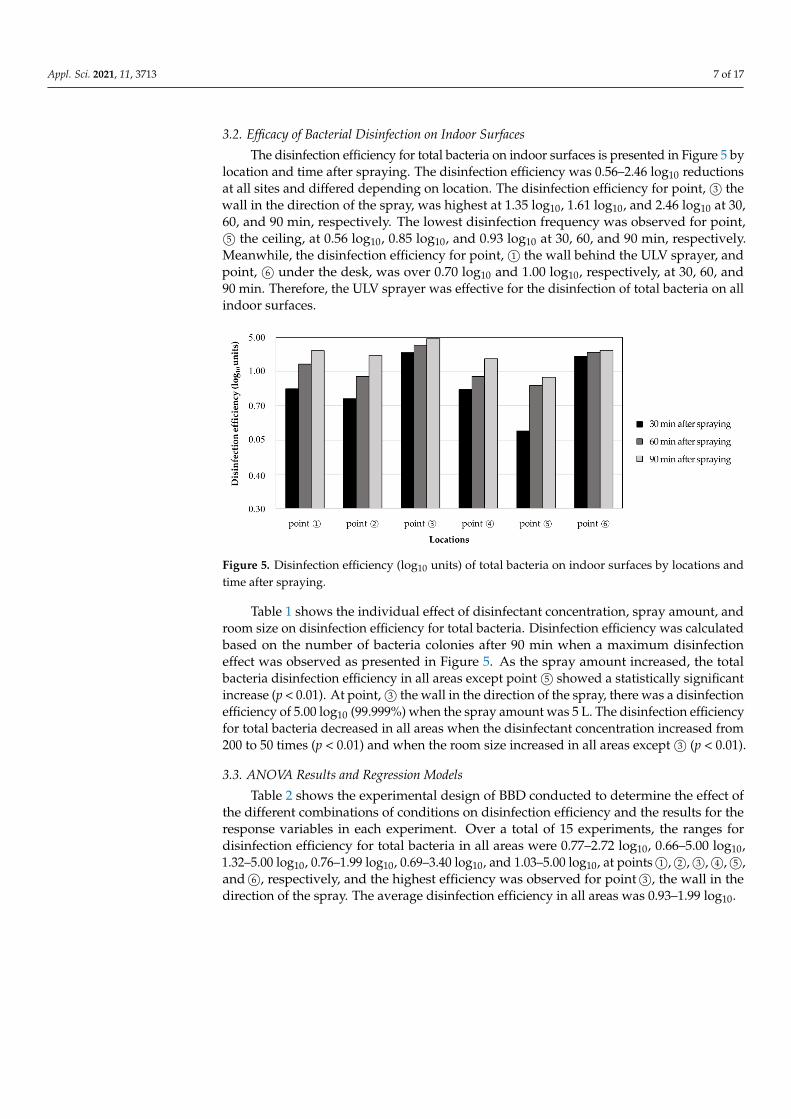
5 by location and time after spraying. The disinfection efficiency was 0.56–2.46 log10 re-ductions at all sites and differed depending on location. The disinfection efficiency for point, ③ the wall in the direction of the spray, was highest at 1.35 log10, 1.61 log10, and 2.46 log10 at 30, 60, and 90 min, respectively. The lowest disinfection frequency was ob-served for point, ⑤ the ceiling, at 0.56 log10, 0.85 log10, and 0.93 log10 at 30, 60, and 90 min, respectively. Meanwhile, the disinfection efficiency for point, ① the wall behind the ULV sprayer, and point, ⑥ under the desk, was over 0.70 log10 and 1.00 log10, respectively, at 30, 60, and 90 min. Therefore, the ULV sprayer was effective for the disinfection of total bacteria on all indoor surfaces.
Figure 5. Disinfection efficiency (log10 units) of total bacteria on indoor surfaces by locations and time after spraying.
Figure 4. Variation of three different sizes of PM fractions after spraying with ULV sprayer: (a) variation of PM10, PM2.5,and PM1.0 after dispensing using a ULV sprayer when the spray amount was 2 L in 230 m3, (b) variation of PM10, PM2.5,and PM1.0 after dispensing using a ULV sprayer when the spray amount was 5 L in 230 m3, and (c) variation of PM10, PM2.5,and PM1.0 after dispensing using a ULV sprayer when the spray amount was 8 L in 230 m3.
Appl. Sci. 2021, 11, 3713 7 of 17
3.2. Efficacy of Bacterial Disinfection on Indoor Surfaces
The disinfection efficiency for total bacteria on indoor surfaces is presented in Figure 5 bylocation and time after spraying. The disinfection efficiency was 0.56–2.46 log10 reductionsat all sites and differed depending on location. The disinfection efficiency for point, 3© thewall in the direction of the spray, was highest at 1.35 log10, 1.61 log10, and 2.46 log10 at 30,60, and 90 min, respectively. The lowest disinfection frequency was observed for point,5© the ceiling, at 0.56 log10, 0.85 log10, and 0.93 log10 at 30, 60, and 90 min, respectively.
Meanwhile, the disinfection efficiency for point, 1© the wall behind the ULV sprayer, andpoint, 6© under the desk, was over 0.70 log10 and 1.00 log10, respectively, at 30, 60, and90 min. Therefore, the ULV sprayer was effective for the disinfection of total bacteria on allindoor surfaces.
Appl. Sci. 2021, 11, x FOR PEER REVIEW 7 of 17
Figure 4. Variation of three different sizes of PM fractions after spraying with ULV sprayer: (a) variation of PM10, PM2.5, and PM1.0 after dispensing using a ULV sprayer when the spray amount was 2 L in 230 m3, (b) variation of PM10, PM2.5, and PM1.0 after dispensing using a ULV sprayer when the spray amount was 5 L in 230 m3, and (c) variation of PM10, PM2.5, and PM1.0 after dispensing using a ULV sprayer when the spray amount was 8 L in 230 m3.
3.2. Efficacy of Bacterial Disinfection on Indoor Surfaces The disinfection efficiency for total bacteria on indoor surfaces is presented in Figure
5 by location and time after spraying. The disinfection efficiency was 0.56–2.46 log10 re-ductions at all sites and differed depending on location. The disinfection efficiency for point, ③ the wall in the direction of the spray, was highest at 1.35 log10, 1.61 log10, and 2.46 log10 at 30, 60, and 90 min, respectively. The lowest disinfection frequency was ob-served for point, ⑤ the ceiling, at 0.56 log10, 0.85 log10, and 0.93 log10 at 30, 60, and 90 min, respectively. Meanwhile, the disinfection efficiency for point, ① the wall behind the ULV sprayer, and point, ⑥ under the desk, was over 0.70 log10 and 1.00 log10, respectively, at 30, 60, and 90 min. Therefore, the ULV sprayer was effective for the disinfection of total bacteria on all indoor surfaces.
Figure 5. Disinfection efficiency (log10 units) of total bacteria on indoor surfaces by locations and time after spraying.
Figure 5. Disinfection efficiency (log10 units) of total bacteria on indoor surfaces by locations andtime after spraying.
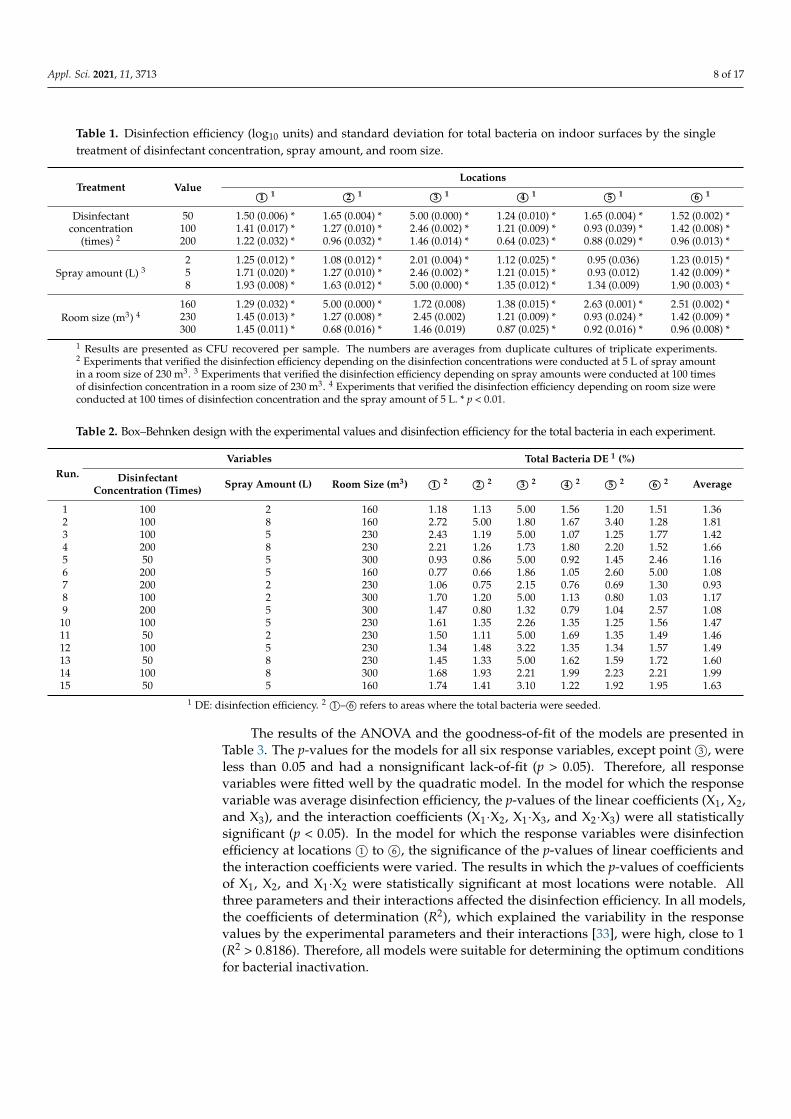
Table 1 shows the individual effect of disinfectant concentration, spray amount, androom size on disinfection efficiency for total bacteria. Disinfection efficiency was calculatedbased on the number of bacteria colonies after 90 min when a maximum disinfectioneffect was observed as presented in Figure 5. As the spray amount increased, the totalbacteria disinfection efficiency in all areas except point 5© showed a statistically significantincrease (p < 0.01). At point, 3© the wall in the direction of the spray, there was a disinfectionefficiency of 5.00 log10 (99.999%) when the spray amount was 5 L. The disinfection efficiencyfor total bacteria decreased in all areas when the disinfectant concentration increased from200 to 50 times (p < 0.01) and when the room size increased in all areas except 3© (p < 0.01).
3.3. ANOVA Results and Regression Models
Table 2 shows the experimental design of BBD conducted to determine the effect ofthe different combinations of conditions on disinfection efficiency and the results for theresponse variables in each experiment. Over a total of 15 experiments, the ranges fordisinfection efficiency for total bacteria in all areas were 0.77–2.72 log10, 0.66–5.00 log10,1.32–5.00 log10, 0.76–1.99 log10, 0.69–3.40 log10, and 1.03–5.00 log10, at points 1©, 2©, 3©, 4©, 5©,and 6©, respectively, and the highest efficiency was observed for point 3©, the wall in thedirection of the spray. The average disinfection efficiency in all areas was 0.93–1.99 log10.
Appl. Sci. 2021, 11, 3713 8 of 17
Table 1. Disinfection efficiency (log10 units) and standard deviation for total bacteria on indoor surfaces by the singletreatment of disinfectant concentration, spray amount, and room size.
Treatment ValueLocations
1© 1 2© 1 3© 1 4© 1 5© 1 6© 1
Disinfectantconcentration
(times) 2
50 1.50 (0.006) * 1.65 (0.004) * 5.00 (0.000) * 1.24 (0.010) * 1.65 (0.004) * 1.52 (0.002) *100 1.41 (0.017) * 1.27 (0.010) * 2.46 (0.002) * 1.21 (0.009) * 0.93 (0.039) * 1.42 (0.008) *200 1.22 (0.032) * 0.96 (0.032) * 1.46 (0.014) * 0.64 (0.023) * 0.88 (0.029) * 0.96 (0.013) *
Spray amount (L) 32 1.25 (0.012) * 1.08 (0.012) * 2.01 (0.004) * 1.12 (0.025) * 0.95 (0.036) 1.23 (0.015) *5 1.71 (0.020) * 1.27 (0.010) * 2.46 (0.002) * 1.21 (0.015) * 0.93 (0.012) 1.42 (0.009) *8 1.93 (0.008) * 1.63 (0.012) * 5.00 (0.000) * 1.35 (0.012) * 1.34 (0.009) 1.90 (0.003) *
Room size (m3) 4160 1.29 (0.032) * 5.00 (0.000) * 1.72 (0.008) 1.38 (0.015) * 2.63 (0.001) * 2.51 (0.002) *230 1.45 (0.013) * 1.27 (0.008) * 2.45 (0.002) 1.21 (0.009) * 0.93 (0.024) * 1.42 (0.009) *300 1.45 (0.011) * 0.68 (0.016) * 1.46 (0.019) 0.87 (0.025) * 0.92 (0.016) * 0.96 (0.008) *
1 Results are presented as CFU recovered per sample. The numbers are averages from duplicate cultures of triplicate experiments.2 Experiments that verified the disinfection efficiency depending on the disinfection concentrations were conducted at 5 L of spray amountin a room size of 230 m3. 3 Experiments that verified the disinfection efficiency depending on spray amounts were conducted at 100 timesof disinfection concentration in a room size of 230 m3. 4 Experiments that verified the disinfection efficiency depending on room size wereconducted at 100 times of disinfection concentration and the spray amount of 5 L. * p < 0.01.
Table 2. Box–Behnken design with the experimental values and disinfection efficiency for the total bacteria in each experiment.
Run.Variables Total Bacteria DE 1 (%)
DisinfectantConcentration (Times) Spray Amount (L) Room Size (m3) 1© 2 2© 2 3© 2 4© 2 5© 2 6© 2 Average
1 100 2 160 1.18 1.13 5.00 1.56 1.20 1.51 1.362 100 8 160 2.72 5.00 1.80 1.67 3.40 1.28 1.813 100 5 230 2.43 1.19 5.00 1.07 1.25 1.77 1.424 200 8 230 2.21 1.26 1.73 1.80 2.20 1.52 1.665 50 5 300 0.93 0.86 5.00 0.92 1.45 2.46 1.166 200 5 160 0.77 0.66 1.86 1.05 2.60 5.00 1.087 200 2 230 1.06 0.75 2.15 0.76 0.69 1.30 0.938 100 2 300 1.70 1.20 5.00 1.13 0.80 1.03 1.179 200 5 300 1.47 0.80 1.32 0.79 1.04 2.57 1.08
10 100 5 230 1.61 1.35 2.26 1.35 1.25 1.56 1.4711 50 2 230 1.50 1.11 5.00 1.69 1.35 1.49 1.4612 100 5 230 1.34 1.48 3.22 1.35 1.34 1.57 1.4913 50 8 230 1.45 1.33 5.00 1.62 1.59 1.72 1.6014 100 8 300 1.68 1.93 2.21 1.99 2.23 2.21 1.9915 50 5 160 1.74 1.41 3.10 1.22 1.92 1.95 1.63
1 DE: disinfection efficiency. 2 1©– 6© refers to areas where the total bacteria were seeded.
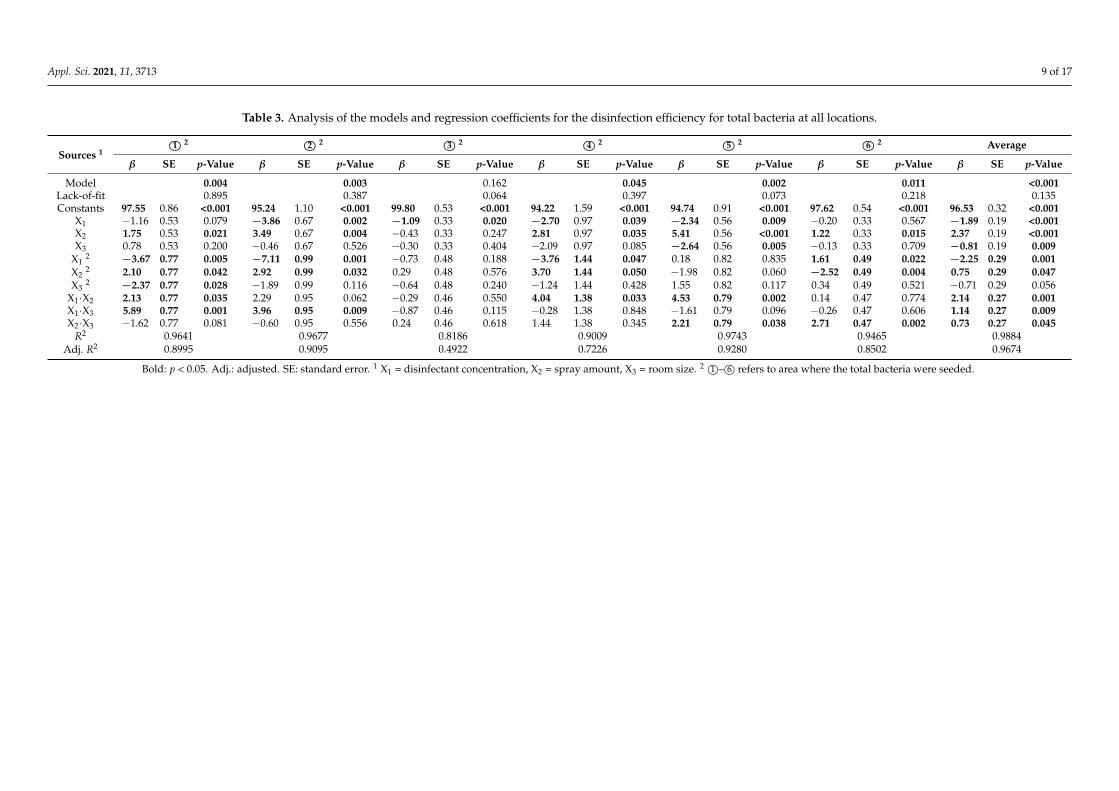
The results of the ANOVA and the goodness-of-fit of the models are presented inTable 3. The p-values for the models for all six response variables, except point 3©, wereless than 0.05 and had a nonsignificant lack-of-fit (p > 0.05). Therefore, all responsevariables were fitted well by the quadratic model. In the model for which the responsevariable was average disinfection efficiency, the p-values of the linear coefficients (X1, X2,and X3), and the interaction coefficients (X1·X2, X1·X3, and X2·X3) were all statisticallysignificant (p < 0.05). In the model for which the response variables were disinfectionefficiency at locations 1© to 6©, the significance of the p-values of linear coefficients andthe interaction coefficients were varied. The results in which the p-values of coefficientsof X1, X2, and X1·X2 were statistically significant at most locations were notable. Allthree parameters and their interactions affected the disinfection efficiency. In all models,the coefficients of determination (R2), which explained the variability in the responsevalues by the experimental parameters and their interactions [33], were high, close to 1(R2 > 0.8186). Therefore, all models were suitable for determining the optimum conditionsfor bacterial inactivation.
Appl. Sci. 2021, 11, 3713 9 of 17
Table 3. Analysis of the models and regression coefficients for the disinfection efficiency for total bacteria at all locations.
Sources 11© 2 2© 2 3© 2 4© 2 5© 2 6© 2 Average
β SE p-Value β SE p-Value β SE p-Value β SE p-Value β SE p-Value β SE p-Value β SE p-Value
Model 0.004 0.003 0.162 0.045 0.002 0.011 <0.001Lack-of-fit 0.895 0.387 0.064 0.397 0.073 0.218 0.135Constants 97.55 0.86 <0.001 95.24 1.10 <0.001 99.80 0.53 <0.001 94.22 1.59 <0.001 94.74 0.91 <0.001 97.62 0.54 <0.001 96.53 0.32 <0.001
X1 −1.16 0.53 0.079 −3.86 0.67 0.002 −1.09 0.33 0.020 −2.70 0.97 0.039 −2.34 0.56 0.009 −0.20 0.33 0.567 −1.89 0.19 <0.001X2 1.75 0.53 0.021 3.49 0.67 0.004 −0.43 0.33 0.247 2.81 0.97 0.035 5.41 0.56 <0.001 1.22 0.33 0.015 2.37 0.19 <0.001X3 0.78 0.53 0.200 −0.46 0.67 0.526 −0.30 0.33 0.404 −2.09 0.97 0.085 −2.64 0.56 0.005 −0.13 0.33 0.709 −0.81 0.19 0.009
X12 −3.67 0.77 0.005 −7.11 0.99 0.001 −0.73 0.48 0.188 −3.76 1.44 0.047 0.18 0.82 0.835 1.61 0.49 0.022 −2.25 0.29 0.001
X22 2.10 0.77 0.042 2.92 0.99 0.032 0.29 0.48 0.576 3.70 1.44 0.050 −1.98 0.82 0.060 −2.52 0.49 0.004 0.75 0.29 0.047
X32 −2.37 0.77 0.028 −1.89 0.99 0.116 −0.64 0.48 0.240 −1.24 1.44 0.428 1.55 0.82 0.117 0.34 0.49 0.521 −0.71 0.29 0.056
X1·X2 2.13 0.77 0.035 2.29 0.95 0.062 −0.29 0.46 0.550 4.04 1.38 0.033 4.53 0.79 0.002 0.14 0.47 0.774 2.14 0.27 0.001X1·X3 5.89 0.77 0.001 3.96 0.95 0.009 −0.87 0.46 0.115 −0.28 1.38 0.848 −1.61 0.79 0.096 −0.26 0.47 0.606 1.14 0.27 0.009X2·X3 −1.62 0.77 0.081 −0.60 0.95 0.556 0.24 0.46 0.618 1.44 1.38 0.345 2.21 0.79 0.038 2.71 0.47 0.002 0.73 0.27 0.045
R2 0.9641 0.9677 0.8186 0.9009 0.9743 0.9465 0.9884Adj. R2 0.8995 0.9095 0.4922 0.7226 0.9280 0.8502 0.9674
Bold: p < 0.05. Adj.: adjusted. SE: standard error. 1 X1 = disinfectant concentration, X2 = spray amount, X3 = room size. 2 1©– 6© refers to area where the total bacteria were seeded.
Appl. Sci. 2021, 11, 3713 10 of 17
3.4. Response Surface and Contour Plot Analysis
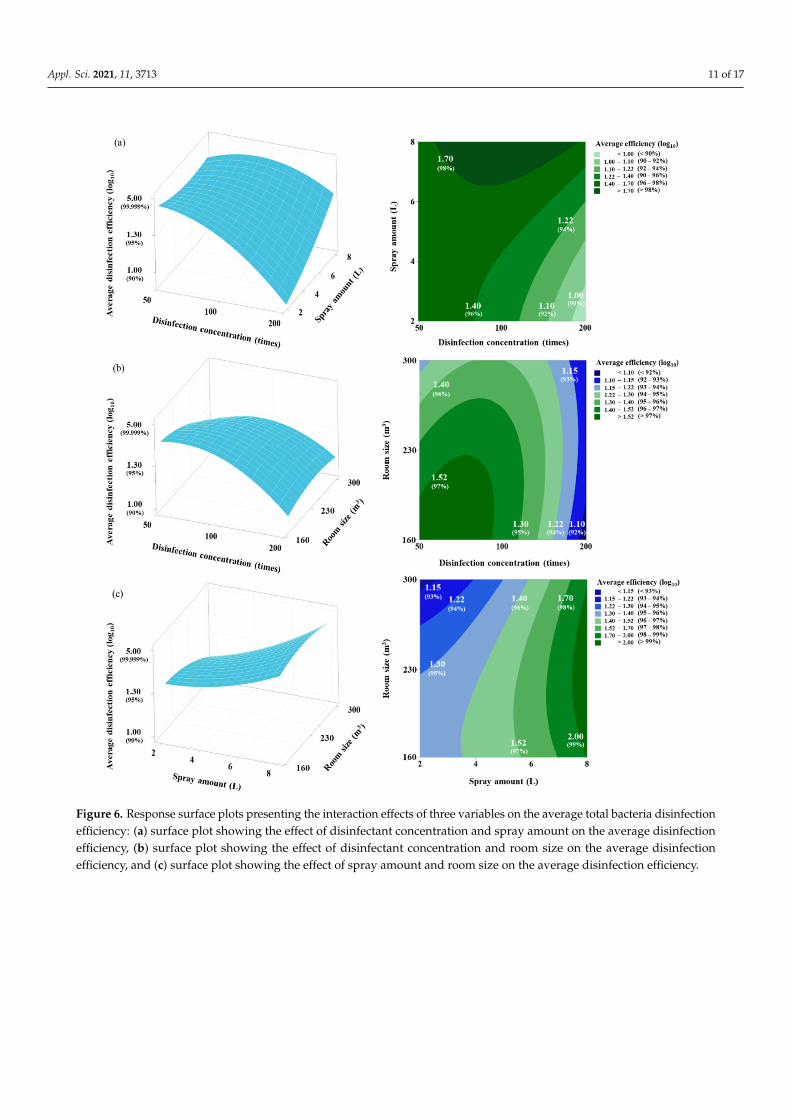
Figure 6 illustrates three-dimensional response surface plots and two-dimensionalcontour plots explaining the relationship between the explanatory and response variables.We visually determined how the three explanatory variables had interaction effects on thetotal bacteria disinfection efficiency and how one factor was influenced by another’s change.The average total bacteria disinfection efficiency was considered a response variable andrepresentatively used to examine the relationships between the variables and the totalbacteria disinfection efficiency. Figure 6a–c shows the effects of two explanatory variablesand their interactions with the response of total bacteria disinfection efficiency at the middlelevel of another variable. The interaction effect between the disinfectant concentration andspray amount was notable. As both the spray amount and the disinfectant concentrationincreased, the disinfection efficiency increased (Figure 6a). The higher the disinfectantconcentration and the smaller the room size, the higher was the disinfection efficiency(Figure 6b). With an increase in the spray amount and a decrease in room size, therewas a slight increase in disinfection efficiency (Figure 6c). When determining the totalbacteria disinfection efficiency based on the combinations of the three explanatory variables,although the magnitudes were different, the interaction effects of the three factors on thetotal bacteria disinfection efficiency were observed in all areas (data not shown).
3.5. Optimum Operating Conditions for the ULV Sprayer
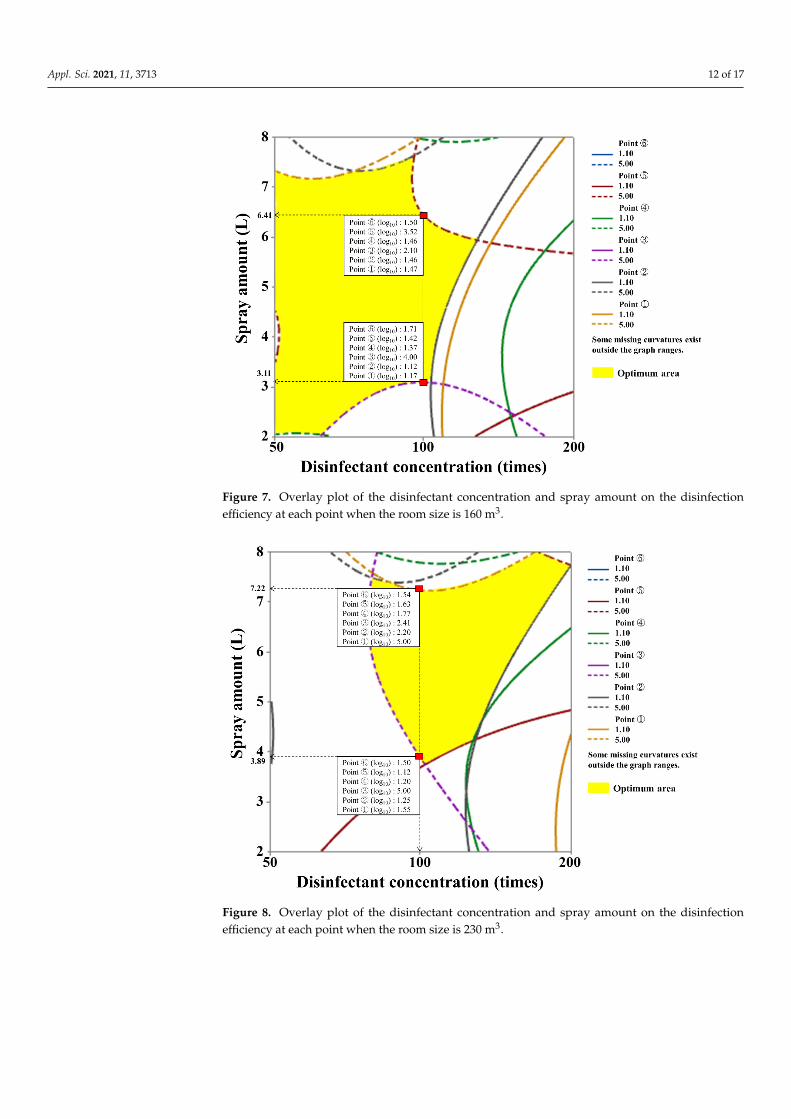
After studying the effects of the explanatory variables on the response variables,we optimized the six explanatory variables using the desirability function. We aimedto determine the optimum conditions that resulted in maximum bacteria disinfectionefficiency in all areas. Moreover, workers cannot control the room size, as the disinfectionspace size is fixed. Therefore, we presented the optimum ranges for operating the ULVsprayer by room size to demonstrate conditions that can actually be controlled and used atthe quarantine site. Figures 7–9 depict the overlay plots of the effects of the disinfectantconcentration and spray amount on the response variables at each room size. The yellowedarea is the zone of the disinfection concentration and spray amount that demonstrated theoptimal disinfection efficiencies at all locations. The different colors of curved plots showthe disinfection efficiency in locations 1©– 6©. We found the optimum usage conditionsthat predicted the total bacteria disinfection efficiency of >1.10 log10 reductions (92%) inall areas. As per the room size, the optimum conditions when using the recommendeddilution factor of 100 were as follows: spray amount of 3.08–6.40 L in 160 m3, 3.78–7.22 L in230 m3, and 5.68–8 L in 300 m3. Therefore, it can be concluded that the larger the room size,the higher the required spray amount for optimal disinfection efficiency when using therecommended disinfectant concentration.
Appl. Sci. 2021, 11, 3713 11 of 17
Appl. Sci. 2021, 11, x FOR PEER REVIEW 11 of 17
Figure 6. Response surface plots presenting the interaction effects of three variables on the average total bacteria disinfec-tion efficiency: (a) surface plot showing the effect of disinfectant concentration and spray amount on the average disinfec-tion efficiency, (b) surface plot showing the effect of disinfectant concentration and room size on the average disinfection efficiency, and (c) surface plot showing the effect of spray amount and room size on the average disinfection efficiency.
3.5. Optimum Operating Conditions for the ULV Sprayer After studying the effects of the explanatory variables on the response variables, we
optimized the six explanatory variables using the desirability function. We aimed to de-termine the optimum conditions that resulted in maximum bacteria disinfection efficiency in all areas. Moreover, workers cannot control the room size, as the disinfection space size is fixed. Therefore, we presented the optimum ranges for operating the ULV sprayer by room size to demonstrate conditions that can actually be controlled and used at the quar-antine site. Figures 7–9 depict the overlay plots of the effects of the disinfectant concentra-tion and spray amount on the response variables at each room size. The yellowed area is the zone of the disinfection concentration and spray amount that demonstrated the opti-mal disinfection efficiencies at all locations. The different colors of curved plots show the
Figure 6. Response surface plots presenting the interaction effects of three variables on the average total bacteria disinfectionefficiency: (a) surface plot showing the effect of disinfectant concentration and spray amount on the average disinfectionefficiency, (b) surface plot showing the effect of disinfectant concentration and room size on the average disinfectionefficiency, and (c) surface plot showing the effect of spray amount and room size on the average disinfection efficiency.
Appl. Sci. 2021, 11, 3713 12 of 17
Appl. Sci. 2021, 11, x FOR PEER REVIEW 12 of 17
disinfection efficiency in locations ①–⑥. We found the optimum usage conditions that predicted the total bacteria disinfection efficiency of >1.10 log10 reductions (92%) in all ar-eas. As per the room size, the optimum conditions when using the recommended dilution factor of 100 were as follows: spray amount of 3.08–6.40 L in 160 m3, 3.78–7.22 L in 230 m3, and 5.68–8 L in 300 m3. Therefore, it can be concluded that the larger the room size, the higher the required spray amount for optimal disinfection efficiency when using the rec-ommended disinfectant concentration.
Figure 7. Overlay plot of the disinfectant concentration and spray amount on the disinfection effi-ciency at each point when the room size is 160 m3.
Figure 7. Overlay plot of the disinfectant concentration and spray amount on the disinfectionefficiency at each point when the room size is 160 m3.
Appl. Sci. 2021, 11, x FOR PEER REVIEW 12 of 17
disinfection efficiency in locations ①–⑥. We found the optimum usage conditions that predicted the total bacteria disinfection efficiency of >1.10 log10 reductions (92%) in all ar-eas. As per the room size, the optimum conditions when using the recommended dilution factor of 100 were as follows: spray amount of 3.08–6.40 L in 160 m3, 3.78–7.22 L in 230 m3, and 5.68–8 L in 300 m3. Therefore, it can be concluded that the larger the room size, the higher the required spray amount for optimal disinfection efficiency when using the rec-ommended disinfectant concentration.
Figure 7. Overlay plot of the disinfectant concentration and spray amount on the disinfection effi-ciency at each point when the room size is 160 m3.
Figure 8. Overlay plot of the disinfectant concentration and spray amount on the disinfectionefficiency at each point when the room size is 230 m3.
Appl. Sci. 2021, 11, 3713 13 of 17
Appl. Sci. 2021, 11, x FOR PEER REVIEW 13 of 17
Figure 8. Overlay plot of the disinfectant concentration and spray amount on the disinfection effi-ciency at each point when the room size is 230 m3.
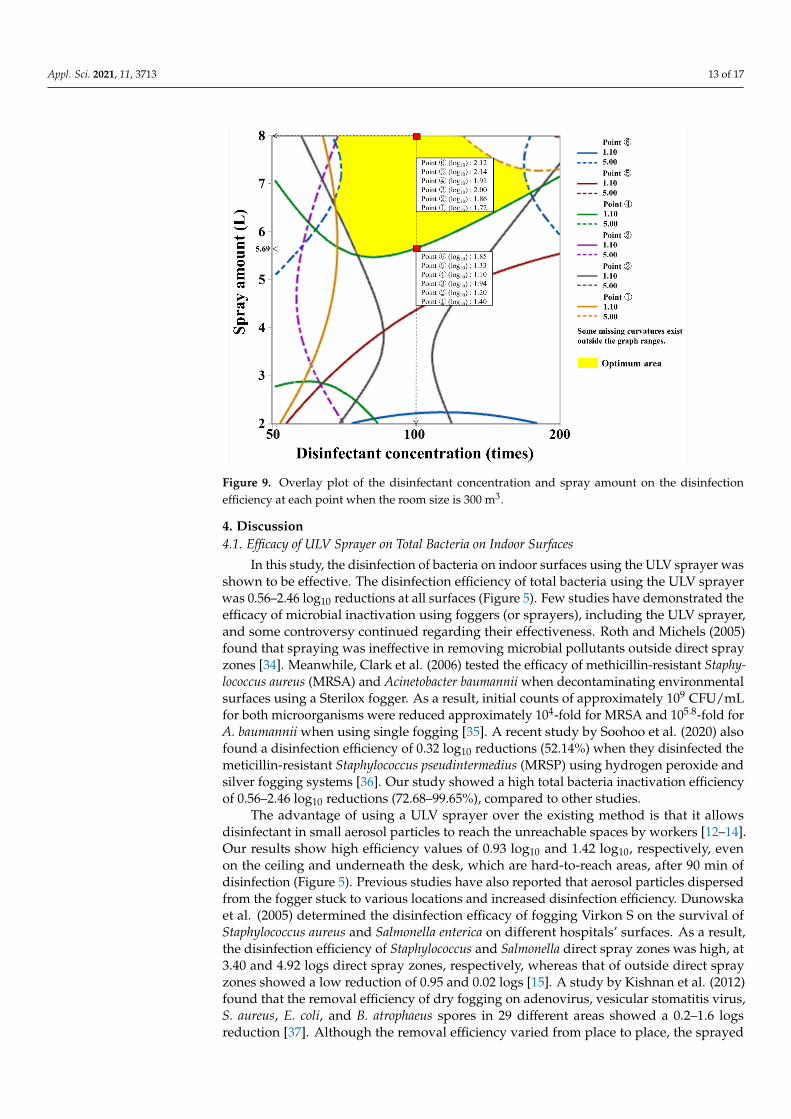
Figure 9. Overlay plot of the disinfectant concentration and spray amount on the disinfection effi-ciency at each point when the room size is 300 m3.
4. Discussion 4.1. Efficacy of ULV Sprayer on Total Bacteria on Indoor Surfaces
In this study, the disinfection of bacteria on indoor surfaces using the ULV sprayer was shown to be effective. The disinfection efficiency of total bacteria using the ULV sprayer was 0.56–2.46 log10 reductions at all surfaces (Figure 5). Few studies have demon-strated the efficacy of microbial inactivation using foggers (or sprayers), including the ULV sprayer, and some controversy continued regarding their effectiveness. Roth and Michels (2005) found that spraying was ineffective in removing microbial pollutants out-side direct spray zones [34]. Meanwhile, Clark et al. (2006) tested the efficacy of methicil-lin-resistant Staphylococcus aureus (MRSA) and Acinetobacter baumannii when decontami-nating environmental surfaces using a Sterilox fogger. As a result, initial counts of approx-imately 109 CFU/mL for both microorganisms were reduced approximately 104-fold for MRSA and 105.8-fold for A. baumannii when using single fogging [35]. A recent study by Soohoo et al. (2020) also found a disinfection efficiency of 0.32 log10 reductions (52.14%) when they disinfected the meticillin-resistant Staphylococcus pseudintermedius (MRSP) us-ing hydrogen peroxide and silver fogging systems [36]. Our study showed a high total bacteria inactivation efficiency of 0.56–2.46 log10 reductions (72.68–99.65%), compared to other studies.
The advantage of using a ULV sprayer over the existing method is that it allows dis-infectant in small aerosol particles to reach the unreachable spaces by workers [12–14]. Our results show high efficiency values of 0.93 log10 and 1.42 log10, respectively, even on the ceiling and underneath the desk, which are hard-to-reach areas, after 90 min of disin-fection (Figure 5). Previous studies have also reported that aerosol particles dispersed from the fogger stuck to various locations and increased disinfection efficiency. Dunow-ska et al. (2005) determined the disinfection efficacy of fogging Virkon S on the survival of Staphylococcus aureus and Salmonella enterica on different hospitals’ surfaces. As a result, the disinfection efficiency of Staphylococcus and Salmonella direct spray zones was high, at 3.40 and 4.92 logs direct spray zones, respectively, whereas that of outside direct spray
Figure 9. Overlay plot of the disinfectant concentration and spray amount on the disinfectionefficiency at each point when the room size is 300 m3.
4. Discussion4.1. Efficacy of ULV Sprayer on Total Bacteria on Indoor Surfaces
In this study, the disinfection of bacteria on indoor surfaces using the ULV sprayer wasshown to be effective. The disinfection efficiency of total bacteria using the ULV sprayerwas 0.56–2.46 log10 reductions at all surfaces (Figure 5). Few studies have demonstrated theefficacy of microbial inactivation using foggers (or sprayers), including the ULV sprayer,and some controversy continued regarding their effectiveness. Roth and Michels (2005)found that spraying was ineffective in removing microbial pollutants outside direct sprayzones [34]. Meanwhile, Clark et al. (2006) tested the efficacy of methicillin-resistant Staphy-lococcus aureus (MRSA) and Acinetobacter baumannii when decontaminating environmentalsurfaces using a Sterilox fogger. As a result, initial counts of approximately 109 CFU/mLfor both microorganisms were reduced approximately 104-fold for MRSA and 105.8-fold forA. baumannii when using single fogging [35]. A recent study by Soohoo et al. (2020) alsofound a disinfection efficiency of 0.32 log10 reductions (52.14%) when they disinfected themeticillin-resistant Staphylococcus pseudintermedius (MRSP) using hydrogen peroxide andsilver fogging systems [36]. Our study showed a high total bacteria inactivation efficiencyof 0.56–2.46 log10 reductions (72.68–99.65%), compared to other studies.
The advantage of using a ULV sprayer over the existing method is that it allowsdisinfectant in small aerosol particles to reach the unreachable spaces by workers [12–14].Our results show high efficiency values of 0.93 log10 and 1.42 log10, respectively, evenon the ceiling and underneath the desk, which are hard-to-reach areas, after 90 min ofdisinfection (Figure 5). Previous studies have also reported that aerosol particles dispersedfrom the fogger stuck to various locations and increased disinfection efficiency. Dunowskaet al. (2005) determined the disinfection efficacy of fogging Virkon S on the survival ofStaphylococcus aureus and Salmonella enterica on different hospitals’ surfaces. As a result,the disinfection efficiency of Staphylococcus and Salmonella direct spray zones was high, at3.40 and 4.92 logs direct spray zones, respectively, whereas that of outside direct sprayzones showed a low reduction of 0.95 and 0.02 logs [15]. A study by Kishnan et al. (2012)found that the removal efficiency of dry fogging on adenovirus, vesicular stomatitis virus,S. aureus, E. coli, and B. atrophaeus spores in 29 different areas showed a 0.2–1.6 logsreduction [37]. Although the removal efficiency varied from place to place, the sprayed
Appl. Sci. 2021, 11, 3713 14 of 17
disinfectant aerosols reached all sites and showed a disinfection effect. This was truefor the current study as well. The disinfection efficiency for removal of total bacteriawas >0.70 log10 (80%) for not only 3© the wall in the direction of the spray but also 5©the ceiling, and 6© the bottom of the desk (Table 1). Similar results were observed evenwhen the space size increased. Meanwhile, 5© the ceiling showed the lowest disinfectionefficiency (0.93 log10) compared to other walls because the ceiling was far, approximately1.8 m above the ULV installation position and 4–6 m forward from the ULV sprayer. Theforward dispensing particles are sufficiently convective within a certain height. Still, theyare considered to have a limited ability to reach the ceiling. This is consistent with ourassumption that a non-directly dispensed direction from the wall would show relativelyless efficiency. It is nevertheless worth noting that it showed a high efficiency of more than0.7 log10.
Disinfectant microparticles sprayed from ULV interact with small particles such asaerosols, droplet nuclei, and air. The microparticles also combine with infectious agents ordust particles (chemical irritants or toxins) in the air to kill pathogens or make them heavyand sink [15]. In this study, the sprayed small particles (PM10, PM2.5, and PM1.0) stayedin the air for 90 min and then sank (Figure 4). In addition, the number of particles in theair and disinfection efficiency increased 30, 60, and 90 min after the ULV spray (Figure 5).A study conducted by Dunowska et al. (2005) also reported that as time passed from30 min to 2 h after spraying, fogged disinfectants increased Salmonella and Staphylococcusdisinfection efficiencies [15]. Therefore, we concluded that sprayed (or fogged) disinfectantaerosol adhered to the surface for approximately 30 min to 2 h while floating in the air,increasing the disinfection efficiency.
4.2. Optimal Usage Conditions of the ULV Sprayer Considering Factors Affecting TotalBacteria Inactivation
The disinfectant concentration, spray amount, and room size, factors that affected theinactivation of microorganisms, had an interaction effect on bacteria disinfection efficiency(Table 3). With regard to room size, the optimum conditions when using the recommendeddilution factor of 100 were as follows: a spray amount of 3.08–6.40 L in 160 m3, 3.78–7.22 Lin 230 m3, and 5.68–8 L in 300 m3 (Figures 7–9). These conditions predicted the bacteriainactivation efficiency to be above 1.10 log10 (92%) at all surfaces. Among various factors,disinfectant concentration, spray amount, and space size are the main factors that affectdisinfection efficiency, either individually or interactively. In general, there is an appropriateconcentration for maximum disinfection efficiency. For example, ethanol is known to havemaximum efficiency at 70% [38]. In studies using a disinfectant such as VirkonTM Micro,which was used in this experiment, the disinfection effect significantly increased as theconcentration of disinfectant increased to 2 and 4% based on the recommended dilutionfactor of 1% (100 times). In contrast, the disinfection effect significantly decreased as theconcentration of disinfectant decreased from 1 to 0.1 and 0.05% [25]. In addition, theincrease in the amount of spraying increased disinfectant efficiency by increasing thecontact time [20], which is consistent with the results of this study showing a positivecorrelation among the disinfectant concentration, spray amount, and disinfection efficiency(Table 1).
This study also identified the interactive effect of the factors on disinfection efficiency,unlike previous studies, which observed only the disinfection efficiency of individualfactors. The result showed that the disinfectant concentration and spray amount had asignificant interaction effect on the total disinfection efficiency under the assumption thatspace size cannot be changed during quarantine (Table 3). Meanwhile, when observing thetotal bacteria disinfection efficiency at locations 1© to 6©, the significance of the p-valuesof linear coefficients and the interaction coefficients were varied. It seemed to be becauseeach area was affected by the direct/indirect spray zones and the distance away from theULV sprayer. In particular, the effects were not observed well at 3©, which showed thehighest disinfection efficiency, because 3© was a direct spray zone, and the direct sprayzone had the most significant impact on disinfection efficiency other than the three factors.
Appl. Sci. 2021, 11, 3713 15 of 17
However, the results in which the p-values of the coefficients of disinfection concentration,spray amount, and the interaction term were statistically significant at most locationswere notable.
To the best of our knowledge, this is the first study that confirmed the disinfection effi-ciency of the ULV sprayer as a method for inactivating bacteria present on indoor surfaces,and found the optimum conditions using BBD. While the importance and urgency of indoormicrobial disinfection have been publicly recognized, few studies have been conductedto quantitatively suggest conditions for optimal disinfection efficiency according to thesize of the workspace. Thus, there is no specific guideline for this. This study modeled theresponse variable and explanatory variable as a second-order polynomial using BBD, oneof the experimental design methods, and calculated and quantified the optimized valueof the explanatory variable by the desirability function. As the room size increased, theminimum spray amount required was increased to achieve the best disinfection efficiencywhen using the recommended dilution factor of 100 times. It indicates that quarantineworkers can obtain optimal disinfection efficiency when using the recommended disin-fection concentration by disinfecting with the suggested spray amount from our resultsdepending on the quarantine site’s room size. It is expected to prevent the overuse ofdisinfectants. The study results can be used as basic data for the effective control of indoorsurface microbials using a ULV sprayer based on quantitative evidence.
5. Conclusions
In this study, we verified the disinfection efficiency of a ULV sprayer for the inacti-vation of bacteria present on indoor surfaces according to the disinfectant concentration,spray amount, and room size. We present the optimum conditions on the basis of theroom size to achieve the target disinfection efficiency using a Box–Behnken design. Theinactivation efficiency for total bacteria using a ULV sprayer was 0.56–2.46 log10 reductions,and it was high even on the ceiling and under the desk where it was hard to reach. Thedisinfectant concentration, spray amount, and room size had an interaction effect on theefficiency of bacterial disinfection. With regard to the room size, the optimum conditionswere found to be a spray amount of 3.08–6.40 L in 160 m3, 3.78–7.22 L in 230 m3, and5.68–8 L in 300 m3 when using dilution rates of 1:100, which is the recommended concen-tration. These conditions predicted a bacteria inactivation efficiency of above 1.10 log10reductions (92%) for all surfaces. Our results can be used as basic data for efficient indoorbacterial disinfection using a ULV sprayer.
Author Contributions: Conceptualization, Y.-H.C., D.-A.H., and K.W.M.; methodology, Y.-H.C. andD.-A.H.; data curation, Y.-H.C., J.-Y.L., and J.Y.C.; formal analysis, Y.-H.C. and K.W.M.; writing—original draft preparation, Y.-H.C.; writing—review and editing, Y.-H.C., D.-A.H., and K.W.M. Allauthors have read and agreed to the published version of the manuscript.
Funding: This research received no external funding.
Institutional Review Board Statement: Not applicable.
Informed Consent Statement: Not applicable.
Data Availability Statement: All data and models generated during the study appear in the submit-ted article.
Acknowledgments: This work was supported by the National Research Foundation of Korea (NRF)grant funded by the Korea government (Ministry of Science and ICT) (No. NRF-2019R1F1A1064259).
Conflicts of Interest: The authors declare no conflict of interest.
Appl. Sci. 2021, 11, 3713 16 of 17
References1. Yang, J.N.; Nam, I.; Yun, H.; Kim, J.; Oh, H.-J.; Lee, D.; Jeon, S.-M.; Yoo, S.-H.; Sohn, J.-R. Characteristics of indoor air quality
at urban elementary schools in Seoul, Korea: Assessment of Effect of Surrounding Environments. Atmos. Pollut. Res. 2015, 6,1113–1122. [CrossRef]
2. Moon, K.W.; Huh, E.H.; Jeong, H.C. Seasonal evaluation of bioaerosols from indoor air of residential apartments within themetropolitan area in South Korea. Environ. Monit. Assess. 2014, 186, 2111–2120. [CrossRef]
3. Bragoszewska, E.; Biedron, I. Indoor air quality and potential health risk impacts of exposure to antibiotic resistant bacteria in anoffice rooms in Southern Poland. Int. J. Environ. Res. Public Health 2018, 15, 2604.
4. Prussin, A.J., II; Garcia, E.B.; Marr, L.C. Total virus and bacteria concentrations in indoor and outdoor air. Environ. Sci. Technol.Lett. 2015, 2, 84. [CrossRef]
5. Fu, X.; Norbäck, D.; Yuan, Q.; Li, Y.; Zhu, X.; Hashim, Z.; Ali, F.; Zheng, Y.W.; Lai, X.X.; Spangfort, M.D.; et al. Indoor microbiome,environmental characteristics and asthma among junior high school students in Johor Bahru, Malaysia. Environ. Int. 2020,138, 105664. [CrossRef] [PubMed]
6. Yang, J.; Kim, Y.K.; Kang, T.S.; Jee, Y.K.; Kim, Y.Y. Importance of indoor dust biological ultrafine particles in the pathogenesis ofchronic inflammatory lung diseases. Environ. Health Toxicol. 2017, 32, e2017021. [CrossRef] [PubMed]
7. Meadow, J.F.; Altrichter, A.E.; Kembel, S.W.; Moriyama, M.; O’Connor, T.K.; Womack, A.M.; Brown, G.Z.; Green, J.L.; Bohannan,B.J. Bacterial communities on classroom surfaces vary with human contact. Microbiome 2014, 2, 7. [CrossRef] [PubMed]
8. Bradbeer, S.J.; Coughlan, N.E.; Cuthbert, R.N.; Crane, K.; Dick, J.T.A.; Caffrey, J.M.; Lucy, F.E.; Renals, T.; Davis, E.; Warren,D.A.; et al. The effectiveness of disinfectant and steam exposure treatments to prevent the spread of the highly invasive killershrimp, Dikerogammarus villosus. Sci. Rep. 2020, 10, 1919. [CrossRef]
9. Ríos-Castillo, A.G.; González-Rivas, F.; Rodríguez-Jerez, J.J. Bactericidal efficacy of hydrogen peroxide-based disinfectants againstgram-positive and gram-negative bacteria on stainless steel surfaces. Int. J. Food Sci. 2017, 82, 2351–2356. [CrossRef]
10. Tuladhar, E.; Hazeleger, W.C.; Koopmans, M.; Zwietering, M.H.; Beumer, R.R.; Duizer, E. Residual viral and bacterial contamina-tion of surfaces after cleaning and disinfection. Appl. Environ. Microbiol. 2012, 78, 7769–7775. [CrossRef]
11. Meade, E.; Garvey, M. Efficacy testing of novel chemical disinfectants on clinically relevant microbial pathogens. Am. J. Infect.Control 2018, 46, 44–49. [CrossRef]
12. Nasr, G.G.; Whitehead, A.Y.; Yule, A.J. Fine sprays for disinfection within healthcare. Int. J. Multiphys. 2012, 6, 149–166. [CrossRef]13. Van Niekerk, J.M.; Mavuso, Z.S. Evaluation of ultra-low volume (ULV) fungicide applications for the control of diseases on
avocado fruit–Results from the 2009/10 season. S. Afr. Avocado Grow. Assoc. Yearb. 2011, 34, 71–76.14. Farajollahi, A.; Healy, S.P.; Unlu, I.; Gaugler, R.; Fonseca, D.M. Effectiveness of ultra-low volume nighttime applications of an
adulticide against diurnal Aedes albopictus, a critical vector of dengue and chikungunya viruses. PLoS ONE 2012, 7, e49181.[CrossRef] [PubMed]
15. Dunowska, M.; Morley, P.S.; Hyatt, D.R. The effect of Virkon S fogging on survival of Salmonella enterica and Staphylococcusaureus on surfaces in a veterinary teaching hospital. Vet. Microbiol. 2005, 105, 281–289. [CrossRef]
16. Zou, S.; Guo, J.; Gao, R.; Dong, L.; Zhou, J.; Zhang, Y.; Dong, J.; Bo, H.; Qin, K.; Shu, Y. Inactivation of the Novel Avian InfluenzaA (H7N9) virus under physical conditions or chemical agents treatment. Virol. J. 2013, 10, 289. [CrossRef] [PubMed]
17. Rutala, W.A.; Weber, D.J. The Healthcare Infection Control Practices Advisory Committee (HICPAC). Guideline for Disinfection andSterilization in Healthcare Facilities, 2008; C.D.C.: Atlanta, GA, USA, 2008.
18. Gholami-ahangaran, M.; Shahzamani, S.; Yazdkhasti, M. Comparison of Virkon S® and formaldehyde on hatchability andsurvival rate of chicks in disinfection of fertile eggs. Rev. Méd. Vét. 2016, 167, 45–49.
19. Joshi, S.D.; Memon, I.; Shaikh, T.; Khan, I.; Samanta, S. Evaluation study for determination of quantities of disinfectant solutionused for fogging of clean rooms with respect to area volume. Int. J. Basic Appl. Res. 2019, 9, 507–512.
20. World Health Organization (WHO). Cleaning and Disinfection of Environmental Surfaces in the Context of COVID-19; WHO: Geneva,Switzerland, 2020.
21. Sousan, S.; Koehler, K.; Hallett, L.; Peters, T.M. Evaluation of the Alphasense optical particle counter (OPC-N2) and the Grimmportable aerosol spectrometer (PAS-1.108). Aerosol Sci. Technol. 2016, 50, 1352–1365. [CrossRef] [PubMed]
22. Gołofit-Szymczak, M.; Stobnicka-Kupiec, A.; Górny, R.L. Impact of air-conditioning system disinfection on microbial contamina-tion of passenger cars. Air Qual. Atmos. Health 2019, 12, 1127–1135. [CrossRef]
23. Liu, X.; Wang, H.; Wang, B.; Pan, L. High-level extracellular protein expression in Bacillus subtilis by optimizing strong promotersbased on the transcriptome of Bacillus subtilis and Bacillus megaterium. Protein Expr. Purif. 2018, 151, 72–77. [CrossRef]
24. Sutton, S. Determination of inoculum for microbiological testing. J. GXP Compliance 2011, 15, 49.25. Rutala, W.A.; Gergen, M.F.; Weber, D.J. Efficacy of different cleaning and disinfection methods against Clostridium difficile spores:
Importance of physical removal versus sporicidal inactivation. Infect. Control Hosp. Epidemiol. 2012, 33, 1255–1258. [CrossRef][PubMed]
26. Hernndez, A.; Martró, E.; Matas, L.; Martín, M.; Ausina, V. Assessment of in-vitro efficacy of 1% Virkon against bacteria, fungi,viruses and spores by means of AFNOR guidelines. J. Hosp. Infect. 2000, 46, 203–209.
27. Jones, C.L. Guidelines for the assessment of viable fungal hygiene on indoor surfaces using RODAC petri plates. J. Bacteriol.Mycol. 2019, 7, 116–126.
Appl. Sci. 2021, 11, 3713 17 of 17
28. Islam, M.; Ikeguchi, A.; Naide, T. Concentrations of aerosol numbers and airborne bacteria, and temperature and relativehumidity, and their interrelationships in a tie-stall dairy barn. Animals 2019, 9, 1023. [CrossRef]
29. Bas, D.; Boyacı, I.H. Modeling and optimization I: Usability of response surface methodology. J. Food Eng. 2007, 78, 836–845.[CrossRef]
30. Huh, D.A.; Chae, W.R.; Lim, H.L.; Kim, J.H.; Kim, Y.S.; Kim, Y.W.; Moon, K.W. Optimizing operating parameters of high-temperature steam for disinfecting total nematodes and bacteria in soil: Application of the Box-Behnken design. Int. J. Environ.Res. Public Health 2020, 17, 5029. [CrossRef]
31. Biesta-Peters, E.G.; Reij, M.W.; Joosten, H.; Gorris, L.G.; Zwietering, M.H. Comparison of two optical-density-based methodsand a plate count method for estimation of growth parameters of bacillus cereus. Appl. Environ. Microbiol. 2010, 76, 1399–1405.[CrossRef] [PubMed]
32. Wu, L.Y.; Yick, K.; Ng, S.-P.; Yip, J. Application of the Box-Behnken design to the optimization of process parameters in foam cupmolding. Expert Syst. Appl. 2012, 39, 8059–8065. [CrossRef]
33. Khataee, A.R.Z.; Zarei, M.; Moradkhannejhad, L. Application of response surface methodology for optimization of azo dyeremoval by oxalate catalyzed photoelectro-fenton process using carbon nanotube-PTFE cathode. Desalination 2010, 258, 112–119.[CrossRef]
34. Roth, K.; Michels, W. Inter-hospital trials to determine minimal cleaning performance according to the guideline by DGKH,DGSV and AKI. Zentr Steril. 2005, 13, 106–116.
35. Clark, J.; Barrett, S.P.; Rogers, M.; Stapleton, R. Efficacy of super-oxidized water fogging in environmental decontamination. J.Hosp. Infect. 2006, 64, 386–390. [CrossRef] [PubMed]
36. Soohoo, J.; Daniels, J.B.; Brault, S.A.; Rosychuk, R.A.; Schissler, J.R. Efficacy of three disinfectant formulations and a hydrogenperoxide/silver fogging system on surfaces experimentally inoculated with meticillin-resistant Staphylococcus pseudintermedius.Vet. Dermatol. 2020, 31, 350-e91. [CrossRef] [PubMed]
37. Krishnan, J.; Fey, G.; Stansfield, C.; Landry, L.; Nguy, H.; Klassen, S.; Robertson, C. Evaluation of a dry fogging system forlaboratory decontamination. Appl. Biosaf. 2012, 17, 132–141. [CrossRef]
38. Møretrø, T.; Vestby, L.K.; Nesse, L.L.; Storheim, S.E.; Kotlarz, K.; Langsrud, S. Evaluation of efficacy of disinfectants againstSalmonella from the feed industry. J. Appl. Microbiol. 2009, 106, 1005–1012. [CrossRef] [PubMed]