Ventilator use in finding Water Permeability of Capillaries in ...
12
Journal of Physiology The circumventricular organs (CVOs) are structures bordering the third and fourth ventricles and are considered to be important sites for communicating between neural cells, cerebrospinal fluid and blood. CVOs have been characterized as regions of the brain with permeable capillaries, which can pass marker dyes from blood (Davson et al. 1987). This high tracer transportability of vessels in the CVOs was explained by the histological findings of the capillary endothelium, which has cyto- plasmic vesicles, caveolae, pits, fenestrations and a few tight junctions (Bouchaud & Bosler, 1986; Gross, 1992). Several substances such as horseradish peroxidase and a- aminoisobutyric acid (AIB) have been used as markers, and it has been revealed that the various parts of the CVOs have different permeability values. The order of permeability of AIB from highest to lowest was pineal gland > the posterior lobe of the pituitary gland > the subfornical organ (SFO), area postrema (AO), and median eminence (ME) > subcommissural organ (SCO) (Brodie et al. 1960a,b; Broadwell & Brightman, 1976; Bouchaud & Bosler, 1986; Gross et al. 1987; Gross, 1992). The SFO might be a part of the sensory system involved in body fluid homeo- stasis, and it might transfer information on the osmolarity of serum to neurons. However, no direct observations on water permeability in the SFO have been reported. In order to measure water permeability in the SFO in situ, we applied 1 H magnetic resonance imaging (MRI). The principle of the method is based on that reported by Fabry & Eisenstadt (1975). Most of the 1 H nuclear magnetic resonance (NMR) signal from biological tissue derives Water permeability of capillaries in the subfornical organ of rats determined by Gd-DTPA 2_ enhanced 1 H magnetic resonance imaging Yoshiteru Seo*, Akira Takamata†, Takashi Ogino‡, Hironobu Morita §, Shun Nakamura ‡ and Masataka Murakami|| *Department of Physiology, Kyoto Prefectural University of Medicine, Kyoto, †Department of Environmental Health, Nara Women’s University, Nara, ‡Department of Biochemistry and Cellular Biology, National Institute of Neuroscience, National Center of Neurology and Psychiatry, Kodaira, Tokyo, §Department of Physiology, School of Medicine, Gifu University, Gifu and ||Department of Molecular Physiology, National Institute for Physiological Sciences, Okazaki, Japan The water permeability of capillaries in the subfornical organ (SFO) of rat was measured by a 1 H nuclear magnetic resonance method in combination with a venous injection of a relaxation reagent, gadolinium-diethylene triamine-N,N,N‚,N‚‚ ,N‚‚-pentaacetic acid (Gd-DTPA 2_ ), which could not pass through the blood–brain barrier (BBB). Judging from results of Gd-DTPA 2_ dose dependency in the intact brain and the BBB-permeabilized brain, Gd-DTPA 2_ could not have leaked out from the capillaries in the cortex, thalamus or SFO, but it could have been extravasated in the posterior lobe of the pituitary gland. The longitudinal (T 1 ) relaxation time of water in the SFO region was measured by inversion-recovery magnetic resonance imaging at 4.7 T. The T 1 relaxation rates (1/T 1 ) before and after Gd-DTPA 2_ infusion were 0.70 ± 0.02 s _1 (mean ± S.E.M., n = 9) and 1.53 ± 0.11 s _1 (n = 9), respectively. The rate constant for water influx to the capillaries was estimated to be 0.84 ± 0.11 s _1 (n = 9) which corresponds with a diffusive membrane permeability (P d ) of 3.7 w 10 _3 cm s _1 . Compared with values found in the literature available on this subject, this P d value for the capillaries in the SFO was the same order of magnitude as that for transmembrane permeability of water for the vasa recta, and it may be 10–100 times larger than that of the blood–brain barrier in the cortex. Areas of the cortex and thalamus showed minimal changes in the T 1 relaxation rate (ca 0.09 s _1 ), but these values were not statistically significant and they corresponded to P d values much smaller than those found in the SFO. From these results, we conclude that the capillaries in the SFO have one of the highest water permeability values among all of the capillaries in the brain. It is also suggested that this magnetic resonance imaging, based on T 1 relaxation rate, is a useful method to detect local water permeability in situ. (Resubmitted 21 June 2002; accepted after revision 2 September 2002; first published online 4 November 2002) Corresponding author Y. Seo: Department of Physiology, Kyoto Prefectural University of Medicine, Kawaramachi-Hirokoji, Kamigyo-ku, Kyoto, 602-0841 Japan. Email: [email protected] Journal of Physiology (2002), 545.1, pp. 217–228 DOI: 10.1113/jphysiol.2002.027227 © The Physiological Society 2002 www.jphysiol.org
-
Upload
khangminh22 -
Category
Documents
-
view
1 -
download
0
Transcript of Ventilator use in finding Water Permeability of Capillaries in ...

Jou
rnal
of P
hysi
olog
y
The circumventricular organs (CVOs) are structures
bordering the third and fourth ventricles and are
considered to be important sites for communicating
between neural cells, cerebrospinal fluid and blood. CVOs
have been characterized as regions of the brain with
permeable capillaries, which can pass marker dyes from
blood (Davson et al. 1987). This high tracer transportability
of vessels in the CVOs was explained by the histological
findings of the capillary endothelium, which has cyto-
plasmic vesicles, caveolae, pits, fenestrations and a few
tight junctions (Bouchaud & Bosler, 1986; Gross, 1992).
Several substances such as horseradish peroxidase and a-
aminoisobutyric acid (AIB) have been used as markers,
and it has been revealed that the various parts of the CVOs
have different permeability values. The order of permeability
of AIB from highest to lowest was pineal gland > the
posterior lobe of the pituitary gland > the subfornical
organ (SFO), area postrema (AO), and median eminence
(ME) > subcommissural organ (SCO) (Brodie et al.1960a,b; Broadwell & Brightman, 1976; Bouchaud & Bosler,
1986; Gross et al. 1987; Gross, 1992). The SFO might be a
part of the sensory system involved in body fluid homeo-
stasis, and it might transfer information on the osmolarity
of serum to neurons. However, no direct observations on
water permeability in the SFO have been reported.
In order to measure water permeability in the SFO in situ,
we applied 1H magnetic resonance imaging (MRI). The
principle of the method is based on that reported by Fabry
& Eisenstadt (1975). Most of the 1H nuclear magnetic
resonance (NMR) signal from biological tissue derives
Water permeability of capillaries in the subfornical organ ofrats determined by Gd-DTPA2_ enhanced 1H magneticresonance imagingYoshiteru Seo*, Akira Takamata†, Takashi Ogino‡, Hironobu Morita§, Shun Nakamura‡ andMasataka Murakami||
*Department of Physiology, Kyoto Prefectural University of Medicine, Kyoto, †Department of Environmental Health, Nara Women’s University,Nara, ‡Department of Biochemistry and Cellular Biology, National Institute of Neuroscience, National Center of Neurology and Psychiatry, Kodaira,Tokyo, §Department of Physiology, School of Medicine, Gifu University, Gifu and ||Department of Molecular Physiology, National Institute forPhysiological Sciences, Okazaki, Japan
The water permeability of capillaries in the subfornical organ (SFO) of rat was measured by a1H nuclear magnetic resonance method in combination with a venous injection of a relaxation
reagent, gadolinium-diethylene triamine-N,N,N‚,N‚‚,N‚‚-pentaacetic acid (Gd-DTPA2_), which
could not pass through the blood–brain barrier (BBB). Judging from results of Gd-DTPA2_ dose
dependency in the intact brain and the BBB-permeabilized brain, Gd-DTPA2_ could not have leaked
out from the capillaries in the cortex, thalamus or SFO, but it could have been extravasated in the
posterior lobe of the pituitary gland. The longitudinal (T1) relaxation time of water in the SFO
region was measured by inversion-recovery magnetic resonance imaging at 4.7 T. The T1 relaxation
rates (1/T1) before and after Gd-DTPA2_ infusion were 0.70 ± 0.02 s_1 (mean ± S.E.M., n = 9) and
1.53 ± 0.11 s_1 (n = 9), respectively. The rate constant for water influx to the capillaries was
estimated to be 0.84 ± 0.11 s_1 (n = 9) which corresponds with a diffusive membrane permeability
(Pd) of 3.7 w 10_3 cm s_1. Compared with values found in the literature available on this subject, this
Pd value for the capillaries in the SFO was the same order of magnitude as that for transmembrane
permeability of water for the vasa recta, and it may be 10–100 times larger than that of the
blood–brain barrier in the cortex. Areas of the cortex and thalamus showed minimal changes in the
T1 relaxation rate (ca 0.09 s_1), but these values were not statistically significant and they
corresponded to Pd values much smaller than those found in the SFO. From these results, we
conclude that the capillaries in the SFO have one of the highest water permeability values among all
of the capillaries in the brain. It is also suggested that this magnetic resonance imaging, based on T1
relaxation rate, is a useful method to detect local water permeability in situ.
(Resubmitted 21 June 2002; accepted after revision 2 September 2002; first published online 4 November 2002)
Corresponding author Y. Seo: Department of Physiology, Kyoto Prefectural University of Medicine, Kawaramachi-Hirokoji,Kamigyo-ku, Kyoto, 602-0841 Japan. Email: [email protected]
Journal of Physiology (2002), 545.1, pp. 217–228 DOI: 10.1113/jphysiol.2002.027227
© The Physiological Society 2002 www.jphysiol.org

Jou
rnal
of P
hysi
olog
y
from water. The intrinsic longitudinal relaxation time (T1)
of water in the intravascular, interstitial and intracellular
water is in the range of 1.5–2 s This occurs because the
water exchange between these compartments averages the
differences in T1 relaxation times of the water in the
compartments. In the brain, almost all capillaries are
impermeable, forming the blood–brain barrier (BBB). It is
possible to distinguish between intravascular and
extravascular water molecules by adding an impermeant
relaxation reagent to the intravascular fluid (Fig. 1).
Gadolinium-diethylene triamine-N,N,N‚,N‚‚,N‚‚-pentaacetic
acid (Gd-DTPA2_) is a well-known T1 relaxation reagent
which cannot cross the intact blood–brain barrier (Abbott
et al. 1999). The reagent accelerates the relaxation of the
intravascular water protons by two orders of magnitude.
In the absence of diffusive water exchange across the
capillary membrane, the extravascular water protons relax
at the normal rate. If the transmural water exchange rate is
in the order of the T1 relaxation rate or higher, the
extravascular water protons can relax more rapidly by
diffusing out of the extravascular space and into the
presence of the relaxation reagent. In this case, the rate
constant of the diffusive water efflux can be estimated
from the relaxation rate of the extravascular water protons.
This method was previously used to measure the water
permeability of cellular membranes, such as Necturusgallbladder epithelial membrane and salivary acinar cells
in vitro (Steward & Garson, 1985; Steward et al. 1990), and
the values obtained were in good agreement with those
based on optical measurements of the changes in cellular
volume (Persson & Spring, 1982). In this study, we
detected water permeable sites in CVOs using T1-weighted
MRI. Then we confirmed the capillary impermeability of
Gd-DTPA2_ in the SFO. Finally, we estimated the water
permeability of capillaries in the SFO from the changes in
the T1 relaxation rate of the water.
METHODS Preparation of animalsTwenty-six Wistar-Hamamatsu rats (300–350 g, 7–9 weeks old)were used in the study. The actual number of rats used in eachexperiment was as follows: anatomical imaging, 3; angiography, 4; T1
relaxation in intact brains, 11; dose dependency of Gd-DTPA2_, 3;permeabilization of the BBB, 3 (the details for each experiment aredescribed in the following sections). Rats were anaesthetized withpentobarbital (50 mg (kg body wt)_1
I.P.). After inserting thetracheal cannula, anaesthesia was changed to 1 % enflurane in a gasmixture of 36 % O2–2 % CO2–62 % NO delivered through thetracheal cannula by an artificial ventilator (tidal volume 4 ml,ventilation rate 50 min_1; Harvard Apparatus, MA, USA) (Takamataet al. 2001). An intravenous cannula was inserted in either the rightor left femoral vein and polyethylene tubing was connected with a5 ml syringe for injection. Body temperature was maintained using awarm-water circuit. Arterial blood was taken from the right femoralartery through an indwelling catheter. After the experiments, the ratswere killed by an overdose of anaesthesia (pentobarbital,
500 mg (kg body wt)_1I.V.). All of the animal experiments
conducted in this study were carried out under the rules andregulations of the Animal Care and Use Committee, NationalInstitute for Physiological Sciences, Japan, which are based on theGuiding Principles for the Care and Use of Animals, as approved bythe Council of the Physiological Society of Japan.
Acquisition of MR imagesRats were placed in the prone position on a custom-built Plexiglassledge, and the position of the head was fixed with a pair ofearplugs and a bite bar. A home-built 1H radio frequency (RF)surface coil (18 or 23 mm in diameter) was placed on the surfaceof the head, and the centre of the coil was positioned on thebregma. 1H MR images were obtained by a BioSpec spectrometerbuilt for animal imaging (ABX-4.7/40, Bruker, Karlsruhe,Germany). ParaVison operating software (version 2.1, Bruker)was employed to obtain the images. A 4.7 T horizontal-boremagnet with a free bore size of 40 cm was equipped with an activeshielded gradient (B-GA12, Bruker). The RF powers of the RFpulses were adjusted by employing a spherical water sample(8 mm in diameter) set in the centre of the RF coil.
The imaging parameters used for T1-weighted sagittal gradient-echo imaging were as follows: 2.5 cm w 2.5 cm field of view(FOV), 128 w 128 data matrix, 1 mm slice thickness, 100 msrelaxation delay (TR), 4.2 ms echo-time (TE), 7 slices and 2 or 4accumulations. A sinc-shaped pulse (duration 2 ms, with abandwidth 2.5 kHz) was used for excitation. The RF power wasadjusted for 180 deg pulse in the centre of the RF coil, whichroughly corresponded to the 90 deg pulse in the depth of thelateral ventricles of the rats. The total time required for an imagewas 28 or 56 s. A high resolution T1-weighted image was obtainedfor depicting anatomical structures. The imaging parameters usedwere as follows: 2.5 cm w 2.5 cm FOV, 256 w 256 data matrix,1 mm slice thickness, 100 ms TR, 6.76 ms TE, 5 slices and 8accumulations.
The T1 relaxation times were measured using an inversion-recovery fast-imaging sequence (fast-T1 MRI) employing a single180 deg pulse prior to the acquisition of a series of low flip angledetection pulses (FLASH) (Haase et al. 1989). The parametersused were as follows: 2.5 cm w 2.5 cm FOV, 128 w 128 datamatrix, 1 mm slice thickness, 1 slice and 2 accumulations. Anadiabatic pulse (4 ms duration, 2.5 kHz bandwidth) was used forinversion (Silver et al. 1984). The RF power was adjusted so that itwas two times that required for a 180 deg pulse at the centre of theRF coil. This produced a 180 deg pulse at the depth of the lateralventricles of the rats. A series of 16 Gaussian-shaped RF pulses(90 deg flip angle in the centre of the RF coil, 1 ms duration and3 kHz bandwidth) with a short TE (3.1 ms) was used for detection.Eight or ten inversion recovery delays (TI, 38–7000 ms) were used,and were optimized for the T1 measurements in a range of T1
relaxation times from 500 ms to 1.5 s The total time required forthe fast-T1 measurement was 9.5 or 12.75 min. In order to test theaccuracy and reproducibility of the fast-T1 measurements, acylindrical sample, with a diameter and length of 12.5 mm and3 cm, respectively (containing 0.2 mM MnCl2 solution) wasmeasured under the same conditions employed for the rat brainmeasurements. As a reference, the T1 relaxation rate of the 0.2 mM
MnCl2 solution was measured by the conventional inversion-recovery pulse sequence (180–VD–90–acquire) using a bird-cageRF coil (52 mm in diameter) which can produce a uniformexcitation RF pulse over the whole sample range, where 180 and
Y. Seo and others218 J. Physiol. 545.1
ron
ron
ron
ron
ron
ron
ron

Jou
rnal
of P
hysi
olog
y
90 are, respectively, the 180 and 90 deg RF pulses, and VD is thevariable delay after the inversion pulse.
In order to confirm the positions of the arteries and veins, a 3D-angiography of the brain was measured with a vascular contrastreagent, AMI-227 (Advanced Magnetics Inc., MA, USA). AMI-227 is a dextran-coated ultrasmall superparamagnetic iron oxide(USPIO) particle (400–900 kDa), which will stay in the intra-vascular space and be detected as a high signal intensity in the T1-weighted MR image (Siauve et al. 1999). 3D-angiography wasconducted 15 min after the intravenous injection of AMI-227 (Fe:0.25 mmol (kg body wt)_1. The imaging parameters used were asfollows: 2.8 cm w 2.8 cm w 3.5 cm FOV, 196 w 196 w 256 datamatrix, 143 mm w 143 mm w 137 mm voxel resolution, 40 ms TR,3.2 ms TE and 6 accumulations. The total acquisition time of the3D data set was 154 min.
Assessment of capillary permeability of Gd-DTPA2_
We employed T1-weighted gradient-echo MRI and the T1 relaxationreagent Gd-DTPA2_ to detect the water-permeable regions. In theT1-weighted gradient-echo imaging with a 90 deg excitation pulse,the observed signal intensity (I) of the image reached a steadyvalue:
I = I0(1 _ exp(_TR/T1))exp(_TE /T2*), (1)
where T2* is the apparent transverse relaxation time, I0 is the signalintensity corresponding to the fully relaxed magnetization of thesample, TR is the repetition time of the excitation pulse and TE isthe echo-time after the excitation pulse. The T1 and T2 relaxationrate constants are mainly determined by the concentration of theGd-DTPA2_. Judging from the relaxivity of Gd-DTPA2_
(K = 1/(T1 w [Gd-DTPA2_]) = 4 mM s_1 for T1; and the T1/T2
ratio = k = 1–3; Muller, 1996; Caravan et al. 1999) and eqn (1), theGd-DTPA2_ infusion induces shorter T1 and T2 relaxation times.In cases where a low concentration of Gd-DTPA2_ (~10 mM) isemployed, the T1/T2 and T2/T2* ratios are relatively small, so theimage intensity will depend on the T1 relaxation rate, and producea broad peak at around 5–10 mM of Gd-DTPA2_. Therefore, the T1
relaxation rate of the higher signal intensity region could beestimated as being higher than that of the surrounding lowersignal intensity areas. Thus, it was easy to detect high signalintensity regions due to either high Gd-DTPA2_ permeability orhigh water exchanges between the intravascular and theextravascular spaces.
In order to confirm the capillary permeability of Gd-DTPA2_, wemeasured changes in the signal intensity of the T1-weightedimages and the T1 relaxation rates of rat brain when the BBB waspermeabilized by hyperosmotic stress (Nagy et al. 1979). Inaddition to a cannula in the left femoral vein for the injection ofGd-DTPA2_, a polyethylene tube was inserted into the rightinternal carotid artery and connected to a 5 ml syringe for aninjection of 25 % (w/v) mannitol solution. After 5 min undercontrol conditions, Gd-DTPA2_ (Magnevist, Schering, Berlin,Germany) was injected over 4 min at a rate of 0.57 mmol (kg bodywt)_1 min_1, then maintained at a constant infusion rate at0.14 mmol (kg body wt)_1 h_1. The extracellular Gd-DTPA2_
concentration was maintained at around 11 mM, which wasestimated from the dosage of the Gd-DTPA2_ and total extra-cellular fluid volume (20 % of body weight) in the rat (Nose et al.1983). After 35 min of the Gd-DTPA2_ infusion, a 25 % (w/v)mannitol solution was injected into the internal carotid artery(5 ml (kg body wt)_1) which permeabilized capillaries in the righthemisphere, including the mid-sagittal part of the thalamus, the
hypothalamus and the midbrain. The pons and most parts of theleft hemisphere were not affected because these parts are fed by thebasilar artery or the left internal carotid artery. Thereafter,changes in the signal intensity were measured for 35 min. The T1-weighted images were measured every 56 s throughout thisprotocol. A pair of T1 relaxation time measurements was obtained,one measurement before and one after the protocol.
Measurement of T1 relaxation rates induced by the Gd-DTPA2_ perfusion in the intact rat brainIn order to minimize the dosage of Gd-DTPA2_, renal arteries andveins were tied by silk threads in order to prohibit any renalexcretion of Gd-DTPA2_. Before the Gd-DTPA2_ injection, the T1
relaxation times of the SFO and other regions in the brainwere measured. Then Gd-DTPA2_ was injected intravenously(1.4 mmol (kg body wt)_1) within 30 s, followed by a continuousinjection of Gd-DTPA2_ (0.14–1.4 mmol (kg body wt)_1) to keepthe plasma concentration of Gd-DTPA2_ at around 10 mM
(7–13 mM). The infusion of Gd-DTPA2_ was monitored by a T1-weighted gradient-echo fast imaging method in order to confirmthat it reached a steady state. After 30 min of the Gd-DTPA2_
infusion, the T1 relaxation times were measured again. This pair ofT1 relaxation rates was used to obtain an estimation of thediffusive water permeability of capillaries in the SFO. In separateexperiments, T1 relaxation rate constants were measured for arange of Gd-DTPA2_ doses (0.38–4.5 mmol (kg body wt)_1) and asuitable dosage of Gd-DTPA2_ was determined. At each dosage,Gd-DTPA2_ was applied intravenously over 1–2 min. The stabilityof the Gd-DTPA2_ concentration was confirmed by the imageintensity of the T1-weighted MRI. Fifteen minutes after theinjection, the T1 relaxation rate constant was measured by the fast-T1 MRI method.
Estimation of water permeabilityThe analysis of T1 relaxation data was based on a simple two-siteexchange model, and has been described previously (Fabry &Eisenstadt, 1975, 1978; Steward et al. 1990). Briefly, when arelaxation reagent was added to the intravascular fluid, sets ofrelaxation data showed two exponential components with thefollowing parameters: (i) the relaxation rate constant of the fastercomponent (RF) and (ii) the relaxation rate constant of the slowercomponent (RS). Assuming that the relaxation rate of the slowcomponent reflected water efflux from the extravascular space(Fig. 1 and see Discussion), the following derived parameters(Fig. 1) were calculated: (iii) the rate constant of diffusive waterefflux from the extravascular space (ke) given by:
ke = RS _ Re, (2)
where Re is the relaxation rate constant for the extravascular water;(iv) the rate constant of diffusive water efflux from theintravascular space (kv) given by:
kv = RF _ RGd, (3)
where RGd is the relaxation rate constant for the intravascularwater containing Gd-DTPA2_; (v) kv is also represented by:
kv = keVe/Vv, (4)
where Ve and Vv are the volumes of extravascular water andintravascular water, respectively; and (vi) diffusive waterpermeability (PdB) is calculated by:
PdB = keVe/Av, (5)
where Av is the surface area of vessels.
Water permeability of capillaries in the SFOJ. Physiol. 545.1 219
Jou
rnal
of P
hysi
olog
y
When we applied this analysis to the data obtained by MRI, weoptimized the fast-T1 MRI pulse sequence to measure the slowcomponent in order to obtain a single exponential relaxation (RS),because the fast-T1 MRI is not suitable for measuring the fasterrelaxation component (T1 < ca 25 ms), and the conventionalinversion-recovery MRI is prohibitively time consuming. Asshown in eqn (4), it is also true that the RS and RF should give thesame results (Steward et al. 1990). Moreover, as shown in eqns (2)and (3), RS depends only on the exchange rate of water at a highintravascular concentration of Gd-DTPA2_, but RF depends on theintravascular relaxation rate (RGd), which was much higher thanthe water exchange rate (kv). Therefore, as long as we can measurethe slow component, we do not need to control the Gd-DTPA2_
concentration strictly. This makes such experiments much easierto perform and facilitates reliability. The intrinsic T1 relaxationrate constant for the extravascular water (Re) was assumed to bethat obtained before the Gd-DTPA2_ injection, because thefraction of vascular space in the SFO is approximately 2.5 %(Sposito & Gross, 1987), and accordingly, almost all of theobserved water molecules are in the extravascular space.
StatisticsAll numerical values are expressed as means ± S.E.M. ormeans ± S.D. Student’s t test was employed for the statisticalsignificance tests, and it was considered that P values of less than0.05 indicated significance.
RESULTSDetection of water permeable sites using T1-weightedMRIWe employed T1-weighted gradient-echo MRI and the T1-
relaxation reagent Gd-DTPA2_ to detect the water-
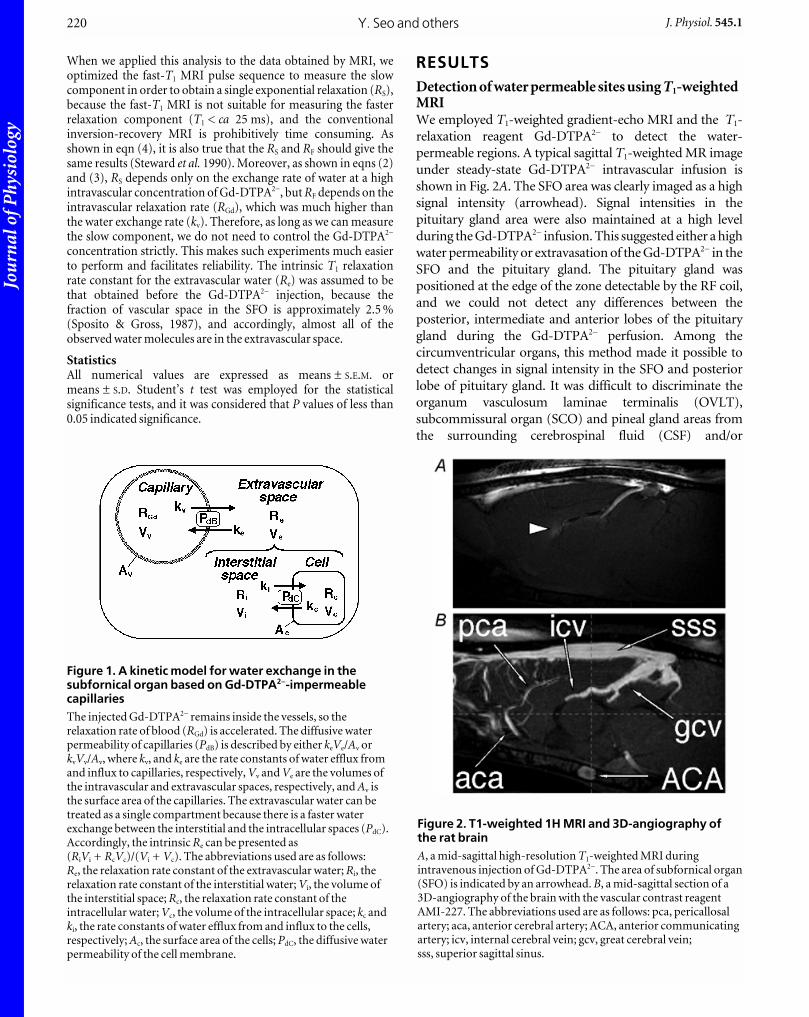
permeable regions. A typical sagittal T1-weighted MR image
under steady-state Gd-DTPA2_ intravascular infusion is
shown in Fig. 2A. The SFO area was clearly imaged as a high
signal intensity (arrowhead). Signal intensities in the
pituitary gland area were also maintained at a high level
during the Gd-DTPA2_ infusion. This suggested either a high
water permeability or extravasation of the Gd-DTPA2_ in the
SFO and the pituitary gland. The pituitary gland was
positioned at the edge of the zone detectable by the RF coil,
and we could not detect any differences between the
posterior, intermediate and anterior lobes of the pituitary
gland during the Gd-DTPA2_ perfusion. Among the
circumventricular organs, this method made it possible to
detect changes in signal intensity in the SFO and posterior
lobe of pituitary gland. It was difficult to discriminate the
organum vasculosum laminae terminalis (OVLT),
subcommissural organ (SCO) and pineal gland areas from
the surrounding cerebrospinal fluid (CSF) and/or
Y. Seo and others220 J. Physiol. 545.1
Figure 1. A kinetic model for water exchange in thesubfornical organ based on Gd-DTPA2_-impermeablecapillariesThe injected Gd-DTPA2_ remains inside the vessels, so therelaxation rate of blood (RGd) is accelerated. The diffusive waterpermeability of capillaries (PdB) is described by either keVe/Av orkvVv/Av, where kv, and ke are the rate constants of water efflux fromand influx to capillaries, respectively, Vv and Ve are the volumes ofthe intravascular and extravascular spaces, respectively, and Av isthe surface area of the capillaries. The extravascular water can betreated as a single compartment because there is a faster waterexchange between the interstitial and the intracellular spaces (PdC).Accordingly, the intrinsic Re can be presented as(RiVi + RcVc)/(Vi + Vc). The abbreviations used are as follows:Re, the relaxation rate constant of the extravascular water; Ri, therelaxation rate constant of the interstitial water; Vi, the volume ofthe interstitial space; Rc, the relaxation rate constant of theintracellular water; Vc, the volume of the intracellular space; kc andki, the rate constants of water efflux from and influx to the cells,respectively; Ac, the surface area of the cells; PdC, the diffusive waterpermeability of the cell membrane.
Figure 2. T1-weighted 1H MRI and 3D-angiography ofthe rat brainA, a mid-sagittal high-resolution T1-weighted MRI duringintravenous injection of Gd-DTPA2_. The area of subfornical organ(SFO) is indicated by an arrowhead. B, a mid-sagittal section of a3D-angiography of the brain with the vascular contrast reagentAMI-227. The abbreviations used are as follows: pca, pericallosalartery; aca, anterior cerebral artery; ACA, anterior communicatingartery; icv, internal cerebral vein; gcv, great cerebral vein;sss, superior sagittal sinus.
Jou
rnal
of P
hysi
olog
y
vasculature. The area postrema (AP) was out of the area
detectable by the RF coil. There were minimal changes in the
cortex and thalamus areas. In order to confirm the positions
of the arteries and veins, a 3D-angiography of the brain was
obtained with a vascular contrast reagent, AMI-227. As
shown in Fig. 2B, in the mid-sagittal section with a voxel
resolution of 143 mm w 143 mm w 137 mm, arteries and
veins were clearly depicted by a high signal intensity, but no
vessels were detected in the SFO area. These results suggested
that the capillaries in the SFO have higher permeability than
the blood–brain barrier in the cortex and thalamus.
Increases in the signal intensity of the CSF in ventricles were
also detected in most of the rats (but not in all cases). This
was likely to have been caused by leakage of Gd-DTPA2_
from the choroid plexus due to the high osmotic stress of the
bolus infusion of 500 mM Gd-DTPA2_.
T1 relaxation rate constants in the intact rat brainWe measured the T1 relaxation rate using an inversion-
recovery fast-imaging sequence (fast-T1 MRI). In this
pulse sequence, we used an adiabatic pulse for the
inversion of the magnetization. This adiabatic pulse produce
a 180 deg inversion over a broad range of RF power, so it
was possible to apply a uniform 180 deg pulse over the rat
brain. In order to confirm accuracy, we measured a phantom
region of interest (ROI) containing a 0.2 mM MnCl2
solution, and the resulting T1 relaxation rate was 1.77 s_1
using a conventional inversion-recovery pulse sequence
with uniform block RF pulses. The dependencies on
vertical and horizontal distances that were demonstrated
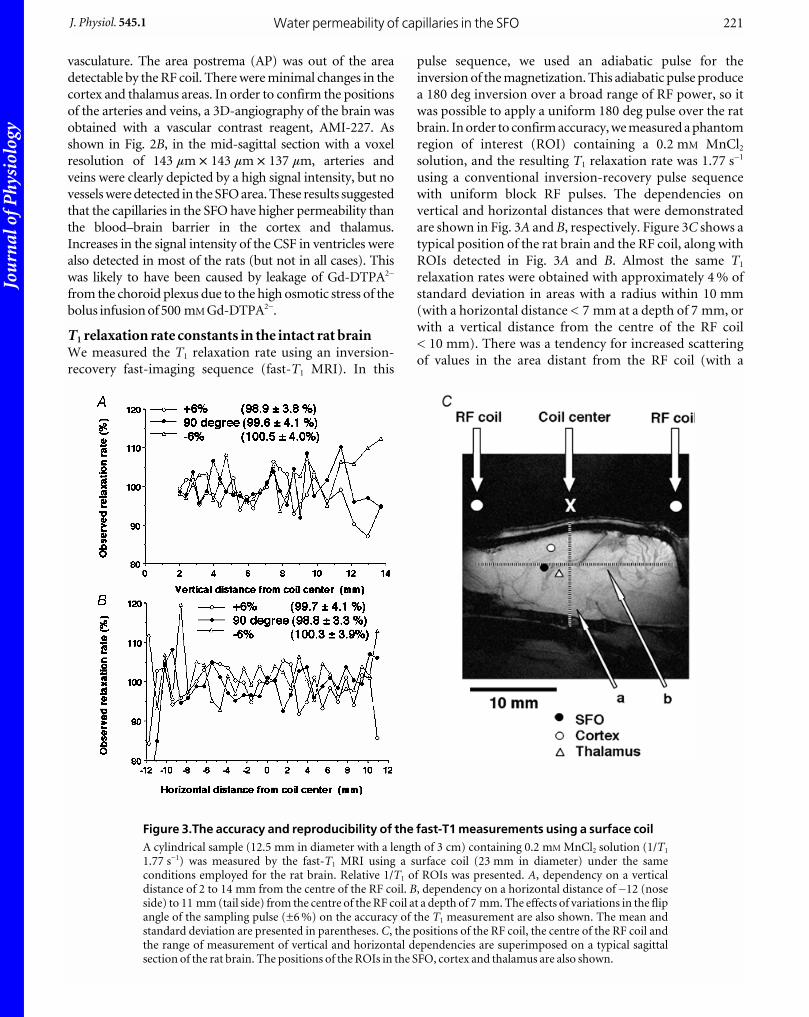
are shown in Fig. 3A and B, respectively. Figure 3C shows a
typical position of the rat brain and the RF coil, along with
ROIs detected in Fig. 3A and B. Almost the same T1
relaxation rates were obtained with approximately 4 % of
standard deviation in areas with a radius within 10 mm
(with a horizontal distance < 7 mm at a depth of 7 mm, or
with a vertical distance from the centre of the RF coil
< 10 mm). There was a tendency for increased scattering
of values in the area distant from the RF coil (with a
Water permeability of capillaries in the SFOJ. Physiol. 545.1 221
Figure 3.The accuracy and reproducibility of the fast-T1 measurements using a surface coilA cylindrical sample (12.5 mm in diameter with a length of 3 cm) containing 0.2 mM MnCl2 solution (1/T1
1.77 s_1) was measured by the fast-T1 MRI using a surface coil (23 mm in diameter) under the sameconditions employed for the rat brain. Relative 1/T1 of ROIs was presented. A, dependency on a verticaldistance of 2 to 14 mm from the centre of the RF coil. B, dependency on a horizontal distance of _12 (noseside) to 11 mm (tail side) from the centre of the RF coil at a depth of 7 mm. The effects of variations in the flipangle of the sampling pulse (±6 %) on the accuracy of the T1 measurement are also shown. The mean andstandard deviation are presented in parentheses. C, the positions of the RF coil, the centre of the RF coil andthe range of measurement of vertical and horizontal dependencies are superimposed on a typical sagittalsection of the rat brain. The positions of the ROIs in the SFO, cortex and thalamus are also shown.

Jou
rnal
of P
hysi
olog
y
horizontal distance > 7 mm at a depth of 7 mm, or with a
vertical distance from the centre of the RF coil > 10 mm),
which might be caused by a low signal-to-noise ratio for
images in these areas. No influence on the accuracy of the
T1 measurement was shown with variations of the flip
angle of the sampling pulse (±6 %). The average positions
of the SFO (7.26 ± 0.1 mm in depth, _2.80 ± 0.23 mm
horizontal, n = 9), cortex (4.96 ± 0.11 mm in depth,
_2.32 ± 0.21 mm horizontal, n = 9) and thalamus
(7.78 ± 0.09 mm in depth, _1.88 mm ± 0.23 mm horizontal,
n = 4) are also presented in Fig. 3C. From these results, we
can conclude that it is possible to obtain accurate
measurements of the T1 values in the SFO, thalamus and
cortex areas using the fast-T1 MRI method.
The dose dependency of the T1 relaxation rate constant is
shown in Fig. 4 for a range of doses of Gd-DTPA2_ from
0.38 to 4.5 mmol (kg body wt)_1. In the SFO, the T1
relaxation rate was increased by the Gd-DTPA2_ injection,
and then reached a steady level (approximately 1.6 s_1)
with a dosage of more than 1.5 mmol (kg body wt)_1. This
plateau was expected from eqn (2). The observed T1
relaxation rate depends on the water exchange rate, and is
not dependent on the intravascular relaxation rate, which
was accelerated by the high dosage of Gd-DTPA2_. In the
thalamus and cortex, the T1 relaxation rate constants were
maintained at the original values (approximately 0.7–0.8 s_1),
within the range of errors of T1 measurement (Fig. 4B). In
the skin, veins, and the posterior and anterior lobes of the
pituitary gland, T1 relaxation rate constants were increased
proportionally when the dosage of Gd-DTPA2_ was
increased (Fig. 4A; data for the anterior lobe of the
pituitary gland and veins are not shown). Due to their fast
T1 relaxation, we could not determine T1 relaxation rates at
the higher dosage of Gd-DTPA2_. From these results, we
determined the dosage of Gd-DTPA2_ (1.5–2.5 mmol (kg
body wt)_1) employed for the following T1 relaxation
measurement of the SFO.
Typical sets of T1 relaxation of water in the SFO and cortex
are shown in Fig. 5. The relaxation represented a single
exponential decay, not a bi-exponential decay, within the
error of measurement. In this experiment, the plasma
concentration of Gd-DTPA2_ was maintained at
approximately 10 mM, which corresponds to the plasma T1
relaxation rate of approximately 40 s_1. Therefore, almost
all of the magnetization of the intravenous compartment
relaxed before the inversion-recovery delay (T1) of 100 ms.
In other words, contamination of the blood compartment
in the SFO, cortex and thalamus could be neglected, not
Y. Seo and others222 J. Physiol. 545.1
Figure 4. Dose dependency of T1 relaxation rate constants over the Gd-DTPA2_ dosage rangeA, a typical result obtained from a rat with a Gd-DTPA2_ dosage range from 0.38 to 4.3 mmol (kg body wt)_1.T1 relaxation rate constants and standard errors of the regression are presented. For each dosage, Gd-DTPA2_
was applied intravenously within 1–2 min. T1 relaxation rate constants were measured 15 min after theinjection using the fast-T1 MRI method. B, Gd-DTPA2_ dose dependency obtained from nine rats. Filledsymbols present the same data shown in A obtained from a sequential experiment on a single rat. Opensymbols present data from eight rats, and so each symbol represents data obtained from a different rat. Theline is a polynomial fit plotted to guide the eye of the reader. The positions of the ROIs are the same as shownsuperimposed on a sagittal image of the brain in Fig. 7D.

Jou
rnal
of P
hysi
olog
y
only due to its small volume fraction (2–3 %), but also
because of this faster relaxation. The T1 relaxation rate
values in the SFO, cortex and thalamus were measured
before and after the Gd-DTPA2_ infusion, and the results
are summarized in Table 1. Only the SFO region
demonstrated a statistically significant increase (P < 0.05)
in T1 relaxation rate. Regions of the cortex and thalamus
showed minimal increase, but the differences were not
statistically significant. The T1 relaxation rate of the pituitary
gland could not be determined precisely because of the low
signal-to-noise ratio and also the fast relaxation.
Capillary permeability of Gd-DTPA2_
The anatomical definition of the Gd-DTPA2_ compartment
is essential for a definition of the water permeability in the
SFO. It is known that Gd-DTPA2_ does not cross the intact
blood–brain barrier (Abbott et al. 1999). However, there are
no reports on the Gd-DTPA2_ permeability of the capillaries
in the SFO. Accordingly, we conducted tests to determine
whether or not Gd-DTPA2_ could cross the capillaries in the
SFO. The intensity of the T1-weighted MR images of the
SFO, cortex (motor area), thalamus and the great cerebral
vein were measured every 30 s after the Gd-DTPA2_ injection.
Typical results shown in Fig. 6 are based on a sagittal image of
the midline ROIs (390 mm w 390 mm). In the SFO, the image
intensity was decreased transiently by the I.V. injection of Gd-
DTPA2_, and then increased by approximately 100 %
compared with the control level. This transient decrease in
the image intensity might be due to a bolus infusion of a high
concentration of the Gd-DTPA2_ (500 mM), which could
have caused a large magnetic susceptibility difference
between vessels and the extravascular space. As a result, the
T2* relaxation time in the tissue was decreased, which forced
a decrease in the image intensity. When the Gd-DTPA2_ was
distributed in the extracellular space, it usually took
10–15 min to reach a steady state, with a venous Gd-DTPA2_
concentration of approximately 10 mM. Therefore, these
transient changes could not be explained by a simple T1 effect
due to the Gd-DTPA2_. However, the righthand part of Fig. 6
Water permeability of capillaries in the SFOJ. Physiol. 545.1 223
Figure 5. T1 relaxation of water protons in the SFO andthe cortex with and without intravenous infusion of Gd-DTPA2_
Data are plotted as the natural logarithm of the difference of theimage intensity (It), after the inversion recovery time (t), from thefully relaxed magnetization (I0). The lines indicate the results oflinear fitting data. The relaxation rate constants and standarderrors of the regression for the SFO and cortex before the Gd-DTPA2_ injection (SFO and cortex) were 0.627 ± 0.017 s_1
(r 2 = 0.996) and 0.646 ± 0.007 s_1 (r 2 = 0.999), respectively. Therelaxation rate constants for the SFO and cortex after the Gd-DTPA2_ injection (SFO (Gd-DTPA) and cortex (Gd-DTPA)) were1.695 ± 0.101 s_1 (r 2 = 0.995) and 0.744 ± 0.006 s_1 (r 2 = 0.999),respectively.
Figure 6. The changes in signal intensity of T1-weighted1H MRI induced by the intravenous injection of Gd-DTPA2_
Data are typical results induced by the intravenous injection ofGd-DTPA2_ (1.4 mmol (kg body wt)_1 within 30 s followed by0.7 mmol (kg body wt)_1 h_1). The image intensities in the SFO,cortex, thalamus and the great cerebral vein (vein) werenormalized by those obtained before the Gd-DTPA2_ injection.The inset image is a T1-weighted sagittal gradient-echo image of arat brain at the midline showing the position of the ROIs. Theactual size of ROIs were 2 pixels w 2 pixels (0.153 mm2).

Jou
rnal
of P
hysi
olog
y
contains the important findings. We did not observe any
delayed increase in the signal intensity in the SFO, which
would indicate leakage of the Gd-DTPA2_ from the vessels to
the interstitial space. The area of the high signal intensity in
the SFO did not change over a period of 2 h. If extravasation
of Gd-DTPA2_ occurs, the area and signal intensity of the
high signal intensity region should expand and increase
time-dependently.
In order to confirm the low Gd-DTPA2_ permeability in
the SFO, we measured changes in the signal intensity of the
T1-weighted images and T1 relaxation rates when the BBB
was permeabilized by hyperosmotic shock. The changes
seen in the SFO and nine ROIs are summarized in Fig. 7. In
this experiment, we reduced the initial infusion rate of Gd-
DTPA2_ in order to reduce the effects of the magnetic
susceptibility of the high concentration of Gd-DTPA2_.
Therefore, the image intensities in the SFO and the blood
in the anterior communicating artery (ACA) increased
faster and without the transient dip. However, the dilution
process induced by the distribution of Gd-DTPA2_ in the
extravascular extracellular space caused a late decrease in
the image signal intensity. After these transient changes, the
extracellular Gd-DTPA2_ concentration was approximately
11 mM, and the signal intensities in all of the ROIs showed
steady levels. When the BBB was broken by the bolus
injection of 25 % (w/v) mannitol, the image intensity in
the SFO increased again, and this increase was continued
after the transient changes induced by the mannitol
injection. Image intensities in the cortex and thalamus
were maintained at their original signal intensities before
the mannitol injection, but they were also increased very
sharply by the mannitol injection, with a gradual increase
maintained thereafter. These results suggest that the
mannitol injection caused a breakdown of the BBB such
that the Gd-DTPA2_ leaked out into the extravascular
Y. Seo and others224 J. Physiol. 545.1
Figure 7. Transient changes in the signal intensity of the T1-weighted images and theT1 relaxation rates of rat brain when the BBB was permeabilized due to hyperosmotic stressAfter 5 min under control conditions, Gd-DTPA2_ was injected over 4 min at a rate of 0.57 mmol (kgbody wt)_1 min_1 (black box), then maintained at a constant infusion rate of 0.14 mmol (kg body wt)_1 h_1
(bold line). After 35 min of the Gd-DTPA2_ infusion, 25 % (w/v) mannitol solution (5 ml (kg body wt)_1)was injected from the internal carotid artery (open arrow), which made capillaries in the right hemispherepermeable, including the mid-sagittal part of the thalamus, hypothalamus and the midbrain. A–C, changesin T1-weighted image intensity of a single voxel (195 mm w 195 mm w 1000 mm) were plotted every 56 s.D, the positions of the 10 ROIs are shown superimposed on a sagittal image of the brain.

Jou
rnal
of P
hysi
olog
y
space in the cortex, thalamus and SFO. These results are
consistent with the changes in the T1 relaxation rates in the
SFO, cortex and thalamus, where values increased from
0.678, 0.681 and 0.661 _1 to 1.90, 1.88 and 1.67 _1,
respectively, after the mannitol injection.
If the capillaries in the SFO were permeable by the Gd-
DTPA2_, we should not observe this additional increase in
the image intensity in the SFO. This is also the case in the
skin and the anterior lobe of the pituitary gland, as both of
these regions have ordinary capillaries that are permeable
to Gd-DTPA2_. The image intensities in both of these
regions were increased by the infusion of Gd-DTPA2_, and
minimal changes were demonstrated by the mannitol
injection. Therefore, the Gd-DTPA2_ was distributed
throughout the extracellular space in these regions before
the mannitol injection. The changes in the image intensity
in the posterior lobe of the pituitary gland, one of the
CVOs, were almost the same as those in the skin and the
anterior lobe of the pituitary gland, suggesting that
capillaries in the posterior lobe of the pituitary gland might
be permeable to Gd-DTPA2_. A region in the hypo-
thalamus was measured as a reference because this region
also receives blood perfusion from the superior
hypophyseal artery, a branch from the internal carotid
artery, which perfuses the posterior lobe of the pituitary
gland. The hypothalamus showed results similar to those
obtained in the cortex and thalamus. Therefore, the
mannitol infusion might have affected these regions so
that the capillaries were permeable to Gd-DTPA2_. An ROI
in the pons was employed as a negative control, in order to
demonstrate any changes shown in this experiment,
because the pons is perfused by the basilar artery, and
accordingly, the mannitol could not reach this region.
Changes in the signal intensity of the cerebrospinal fluid in
the fourth ventricle were small and increased slowly before
the mannitol injection, and then increased significantly
after the injection. In preliminary experiments using an
isotonic Gd-DTPA2_ solution (100 mM), it was difficult to
detect any Gd-DTPA2_ leakage into the CSF. These results
suggested that the choroid plexus might have a low Gd-
DTPA2_ permeability under the control conditions, and
they also suggested that the hypertonic stress might have
significantly permeabilized the choroid plexus.
Quantitative handling of data might be difficult because
the ventricular system is an open system. The CSF is
secreted by the choroid plexuses in the lateral and fourth
ventricle, and it is then transported to the subarachnoidal
space and drained off via the arachnoid granulations into
the dural sinus. Therefore, Gd-DTPA2_, leaked from the
choroid plexuses, is also transported to the subarachnoidal
space. Since pores of about 1 mm in diameter are present in
the apical surface of the granulations, the Gd-DTPA2_ may
be drained off into the venous system (Takamata et al. 2001).
DISCUSSIONCapillary permeability of Gd-DTPA2_
It is believed that the blood–brain barrier is impermeable
to Gd-DTPA2_ (742 Da) (Abbott et al. 1999). The question
arises: is this true of the capillaries in the SFO? As
summarized by Abbott et al. (1999), almost all of the
reports published have treated abnormal BBB that
suffered from pathological conditions, such as ischaemia.
We found only a limited number of reports on the
capillary permeability of Gd-DTPA2_ in the intact brain.
Whole-body autoradiographic studies in rats after
intravenous administration of 153Gd-DTPA2_ and Gd-
[14C]DTPA2_ (Täuber et al. 1986) showed that Gd-DTPA2_
was very rapidly distributed thoughout the body except for
the central nervous system and fetus. Since the distributions
of both of the labelled Gd-DTPA2_ compounds were
similar, there was no indication of a dissociation of the Gd-
DTPA2_ complex. The pharmacokinetics and tissue
distribution of a similar substance, the gadobenate ion
(Gd-BOTPA2_; 862 Da), have also been reported (Lorusso
et al. 1999). Gd-BOTPA2_ was also distributed over the
whole body, except for the central nervous system. There
was no mention of the CVOs in the reports on these
autoradiography studies, and there was no staining in the
SFO region of the sagittal section of rat brain. Thus,
Täuber’s study (Täuber et al. 1986) may actually be the first
showing Gd-DTPA2_ capillary permeability in the CVOs.
As shown in Fig.7, the T1-weighted MR image intensity of
the SFO was increased by the injection of Gd-DTPA2_,
then maintained at a stable level, but it was increased again
by the injection of hypertonic mannitol solution. The T1
relaxation rate was also accelerated from 0.68 to 1.9 s_1.
After the BBB breakdown, image intensities in the SFO,
cortex and thalamus were almost the same, and they
increased continuously. These results indicate that Gd-
DTPA2_ can enter the interstitial spaces of the SFO, cortex
and thalamus after the BBB breakdown, and the
concentration of Gd-DTPA2_ may be the same in those
Water permeability of capillaries in the SFOJ. Physiol. 545.1 225

Jou
rnal
of P
hysi
olog
y
regions that show similar T1 relaxation rates (1.7–1.9 s_1).
Therefore, it must be difficult for the Gd-DTPA2_ to cross
the capillaries in an intact SFO. The Gd-DTPA2_-induced
shortening of the T1 relaxation time was mainly caused by
water exchange between the intravenous and the extra-
vascular fluid. In contrast, capillaries in the posterior lobe
of the pituitary gland could pass Gd-DTPA2_ freely
because there was no change following mannitol
administration. The faster T1 relaxation, which could not
be measured precisely, also supports the concept of
extravasation of Gd-DTPA2_ in the pituitary gland.
The reason why much bigger molecules, e.g. horseradish
peroxidase (HRP; 40 kDa), penetrate capillaries in the SFO is still
puzzling. HRP has been used as a marker of endocytosis (Gross,
1992). Histologically, most of the capillaries in the SFO are
classified as Type I and Type III. Type I capillaries are relatively
thick-walled capillaries, with a high density of cytoplasmic
vesicles, caveolae and pits. Type I capillaries are found in almost
all of the areas of the SFO, and they are predominant in the
transitional sub-region between the rostral and central parts of
the nucleus. Type III capillaries have a thin endothelium with
numerous fenestrations, vesicular profiles and perivascular
lacunae. Type III capillaries are present only in the transitional,
central and caudal SFO sub-regions. There are loosely
interconnected tight junctions in the endothelium in both types
of capillaries, but there are no gap junctions (Bouchaud & Bosler,
1986; Gross, 1992). After intravenous administration, HRP was
usually found in the cytoplasmic vesicles, which shuttle
bidirectionally between plasma membranes. It is considered that
endocytosis is the major transport pathway of HRP in the BBB,
and not paracellular pathways (Gross, 1992; Lu et al. 1993; Banks
& Broadwell, 1994). When wheat germ agglutinin is conjugated
to HRP (WGA–HRP), it can enter the brain 10 times more
rapidly than HRP alone despite its larger molecular size
(77 kDa). It is likely that WGA–HRP undergoes adsorptive
transcytosis through cerebral endothelia from blood to brain via
specific subcellular compartments within the endothelium
(Banks & Broadwell, 1994). Trypan blue (961 Da) is almost the
same size as Gd-DTPA2_, but it forms a complex with plasmatic
protein in blood (Bouchaud & Bosler, 1986). Therefore, it might
be transported by endocytosis, as was observed with
albumin–Gd-DTPA (92 kDa) and carboxymethyldextran–Gd-
DTPA (38.9 kDa) (Siauve et al. 1999). The capillaries in the
subcommissural organ (SCO) have no fenestration, but HRP
appears in the extravascular space (Bouchaud & Bosler, 1986).
This also suggests the importance of the endocytosis of HRP. As
far as we are aware, no reports have been published on the
transcellular transport of Gd-DTPA2_. Therefore, this
contradiction in the relationship between molecular size and
permeability could be explained by the endocytosis of HRP.
Another tracer commonly employed for the detection of
capillary permeability is a-aminoisobutyric acid (AIB).
Because AIB is a small (103 Da) and neutral amino acid, it
is able to cross the tight junctions not only in the CVOs but
also in the normal BBB (Gross et al. 1987). The epithelial
paracellular pathway shows cation selectivity. This
selectivity is caused by negatively charged groups that
might form a line in tight junctions, because the pH at
which alterations in cation permeability (isoelectric pH)
occur is between pH 3 and 5 (Powell, 1981). Therefore, it is
not easy for Gd-DTPA2_ to pass through the tight
junctions within the physiological range of pH. Our
molecular knowledge of the tight junction has been
advanced significantly by the identification of claudin
(Furuse et al. 1998). The tight junction is not a simple static
barrier, but rather combinations of claudin proteins that
produce a specific pore. For example, in the thick ascending
limb of Henle claudin-16 forms a pore as an Mg2+ channel
(Tsukita et al. 2001). In the central nervous system,
claudin-11 was found in the myelin sheath, and claudin-5
has been found in the endothelial cells in capillaries. It is
likely that claudin-5 is involved in the low permeability of
the BBB, but the details of the molecular mechanisms
involved are still under investigation (Tsukita et al. 2001).
Judging from the results of this study, we can say that it is
difficult for Gd-DTPA 2_, a moderate size molecule with a
strong negative charge, to pass through the capillaries in
the SFO, but it might cross the capillaries in the posterior
lobe of the pituitary gland. The development of caludin-5
knockout mice may provide some insight into the capillary
permeability of Gd-DTPA2_.
Estimation of water permeabilityAs far as we can determine, there are no reports on Pd
values for the SFO. On the assumption that the relaxation
time course of the slow component (RS) was mainly
determined by the rate of the diffusive water exchange
between the extravascular space and the intravascular
space, we have calculated the rate constant (ke) in the SFO
to be 0.84 ± 0.11 s_1 (n = 9). As shown in eqn (5), in order
to convert the ke to a diffusive permeability coefficient
(PdB), the volume/area ratio of the volume of the extra-
vascular space (Ve) and the surface area of the capillaries
(Av) is required. From several morphological studies of the
SFO in rats (Sposito & Gross, 1987; Gross, 1992), we have
taken the volume fraction of the capillaries as 2.3 ± 0.5 %
of the tissue, which corresponds to the Vv/Ve ratio, and the
capillary surface area as 22.7 ± 3.8 mm2 mm_3, which
corresponds to the value of Av/(Ve + Vv). Using these values,
the apparent diffusive water permeability of the surface of
capillaries in the SFO is estimated to be 3.7 w 10_3 cm s_1.
This PdB value is similar to values obtained for the vasa
recta of rat kidney (2 w 10_3 cm s_1, Morgan & Berliner,
1968), and is 10 times larger than that of capillaries in dog
skeletal muscle (2.8 w 10_4 cm s_1, House, 1974). It is also
much bigger than that in non-leaky epithelium such as the
renal collecting duct and bladder epithelium (Table 2).
Most of the water permeability studies on the brain
Y. Seo and others226 J. Physiol. 545.1

Jou
rnal
of P
hysi
olog
y
capillaries have determined hydraulic conductivity (Lp)
values and some were obtained values of the permeability
surface area product (PS). The LP value for brain capillaries
that form the blood–brain barrier (3 w 10_7 cm atom_1 s_1) is
two orders smaller than that of muscle capillaries
(2.5 w 10_5 cm atom_1 s_1) (House, 1974) and the vasa
recta (3.1 w 10_5 cm atom_1 s_1) (Morgan & Berliner, 1968).
Since Lp and Pd have different units, these LP values did not
compare directly with the diffusive water permeability
(Pd), but Pd values of the SFO were similar to those of the
vasa recta. Therefore, it is likely that the Pd value of the SFO
might be 10–100 times higher than that of the brain
capillaries that form the blood–brain barrier. The very
small changes in the relaxation rates seen in the thalamus
and cortex in this study also support this estimation.
Therefore, we conclude that the SFO region has one of the
highest water permeability values among all of the
capillaries in the brain.
REFERENCESABBOTT, N. J., CHUGANI, D. C., ZAHARCHUK, G. & ROSEN, B. R. (1999).
Delivery of imaging agents into brain. Advanced Drug DeliveryReviews 37, 253–277.
BANKS, W. A. & BROADWELL, R. D. (1994). Blood to brain and brain to
blood passage of native horseradish peroxidase, wheat germ
agglutinin, and albumin: pharmacokinetic and morphological
assessments. Journal of Neurochemistry 62, 2404–2419.
BOUCHAUD, C. & BOSLER, O. (1986). The circumventricular organs of
the mammalian brain with special reference to monoaminergic
innervation. International Review of Cytology 105, 283–327.
BROADWELL, R. D. & BRIGHTMAN, M. W. (1976). Entry of peroxidase
into neurons of the central and peripheral nervous systems from
extracerebral and cerebral blood. Journal of ComparativeNeurology 166, 257–283.
BRODIE, B. B., KURZ, H. & SCHANKER, L. S. (1960a). The importance
of dissociation constant and lipid-solubility in influencing the
passage of drugs into the cerebrospinal fluid. Journal ofPharmacology and Experimental Therapeutics 130, 20–25.
BRODIE, B. B., TITUS, E. O. & WILSON, C. W. N. (1960b). The absence
of the blood–brain barrier from special areas of the brain. Journalof Physiology 152, 20–22P.
CARAVAN, P., ELLISON, J. J., MCMURRY, T. J. & LAUFFER, R. B. (1999).
Gadolinium(III) chelates as MRI contrast agents: Structure,
dynamics, and applications. Chemical Reviews 99, 2293–2352.
DAVSON, H., WELCH, K. & SEGAL, M. B. (1987). Physiology andPathology of the Cerebrospinal Fluid. Churchill Livingstone,
London.
FABRY, M. E. & EISENSTADT, M. (1975). Water exchange between red
cells and plasma. Measurement by nuclear magnetic relaxation.
Biophysical Journal 15, 1101–1110.
FABRY M. E. & EISENSTADT, M. (1978). Water exchange across red cell
membranes. Measurement by nuclear magnetic resonance T1, T2,
and T12 hybrid relaxation. The effects of osmolarity, cell volume,
and medium. Journal of Membrane Biology 42, 375–398.
FURUSE, M., FUJITA, K., HIIRAGI, T., FUJIMOTO, K. & TSUKITA, S.
(1998). Claudin-1 and -2: novel integral membrane proteins
localizing at tight junctions with no sequence similarity to
occludin. Journal of Cell Biology 141, 1539–1550.
GROSS, P. M. (1992). Circumventricular organ capillaries. Progress inBrain Research 91, 219–233.
GROSS, P. M., BLASBERG, R. G., FENSTERMACHER, J. D. & PATLAK, C. S.
(1987). The microcirculation of rat circumventricular organs and
pituitary gland. Brain Research Bulletin 18, 73–85.
HAASE, A., MATTHAEI, D., BARTKOWSKI, R., DUHMKE, E. & LEIBFRITZ,
D. (1989). Inversion recovery snapshot FLASH MR imaging.
Journal of Computer Assisted Tomography 13, 1036–1040.
HOUSE, C. R. (1974). Water Transport in Cells and Tissues. Arnold,
London.
KUWAHARA, M. & VERKMAN, A.S. (1988). Direct fluorescence
measurement of diffusional water permeability in the vasopressin-
sensitive kidney collecting tubule. Biophysical Journal 54, 587–593.
LAVELLE, J. P., APODACA, G., MEYERS, S. A., RUIZ, W. G. & ZEIDEL, M.
L. (1998). Disruption of guinea pig urinary bladder permeability
barrier in noninfectious cystitis. American Journal of Physiology274, F205–214.
LAVELLE, J. P., NEGRETE, H. O., POLAND, P. A., KINLOUGH, C. L.,
MEYERS, S. D., HUGHEY, R. P. & ZEIDEL, M. L. (1997). Low
permeabilities of MDCK cell monolayers: a model barrier
epithelium. American Journal of Physiology 273, F67–75.
LORUSSO, V., ARBUGHI, T., TIRONE, P. & DE HAEN, C. (1999).
Pharmacokinetics and tissue distribution in animals of gadobenate
ion, the magnetic resonance imaging contrast enhancing
component of gadobenate dimeglumine 0.5 M solution for
injection (MultiHance). Journal of Computer Assisted Tomography23, suppl. 1, S181–S194.
LU, J., KAUR, C. & LING, E. A. (1993). Uptake of tracer by the
epiplexus cells via the choroid plexus epithelium following an
intravenous or intraperitoneal injection of horseradish peroxidase
in rats. Journal of Anatomy 183, 609–617.
MORGAN, T. & BERLINER, R. W. (1968). Permeability of the loop of
Henle, vasa recta, and collecting duct to water, urea, and sodium.
American Journal of Physiology 215, 108–115.
MULLER, R. N. (1996) Contrast agents in whole body magnetic
resonance: Operating mechanisms. In Encyclopedia of NuclearMagnetic Resonance, pp. 1438–1444. Wiley, New York.
NAGY, Z., PAPPIUS, H. M., MATHIESON, G. & HÜTTNER, I. (1979).
Opening of tight junctions in cerebral endothelium, I. Effect of
hyperosmolar mannitol infused through the internal carotid
artery. Journal of Comparative Neurology 185 569–578.
NOSE, H., MORIMOTO, T. & OGURA, K. (1983). Distribution of water
losses among fluid compartments of tissues under thermal
dehydration in the rat. Japanese Journal of Physiology 33,
1019–1029.
PERSSON, B.-E. & SPRING, K. R. (1982). Gallbaldder epithelial cell
hydraulic water permeability and volume regulation. Journal ofGeneral Physiology 79, 481–505.
POWELL, D. W. (1981). Barrier function of epithelia. AmericanJournal of Physiology 241, G275–288.
SIAUVE, N., CUENOD, C. A., CLEMENT, O., RASIO, E., BENDAYAN, M. &
FRIJA, G. (1999). The rete mirabile of the eel: a useful model for the
study of transcapillary passage of MR contrast agents. Journal ofMagnetic Resonance Imaging 9, 353–361.
SILVER, M. S., JOSEPH, R. I., CHEN, C.-N., SANK, V. J. & HOULT, D. I.
(1984). Selective population inversion in NMR. Nature 310,
681–683.
SPOSITO, N. M. & GROSS, P. M. (1987). Topography and
morphometry of capillaries in the rat subfornical organ. Journal ofComparative Neurology 260, 36–46.
Water permeability of capillaries in the SFOJ. Physiol. 545.1 227

Jou
rnal
of P
hysi
olog
y
STEWARD, M. C. & GARSON, M. J. (1985). Water permeability of
Necturus gallbladder epithelial cell membranes measured by
nuclear magnetic resonance. Journal of Membrane Biology 86,
203–210.
STEWARD, M. C., SEO, Y., RAWLINGS, J. M. & CASE, R. M. (1990).
Water permeability of acinar cell membranes in the isolated
perfused rabbit mandibular salivary gland. Journal of Physiology431, 571–583.
TAKAMATA, A., SEO, Y., OGINO, T., TANAKA, K., FUJIKI, N., MORITA, H.
& MURAKAMI, M. (2001). Effects of pCO2 on the CSF turnover rate
in T1-weighted magnetic resonance imaging. Japanese Journal ofPhysiology 51, 555–562.
TÄUBER, U., WEINMANN, H. J., PANZER, M., ACKSTEINER, B., VOLLERT,
B. & SCHULZE, P.E. (1986). Whole-body autoradiographic studies
in rats with gadolinium-diethylenetriaminepentaacetic acid, a new
contrast agent for magnetic resonance imaging.
Arzneimittelforschung 36, 1089–1091.
TSUKITA, S., FURUSE, M. & ITOH, M. (2001). Multifunctional strands
in tight junctions. Nature Review Molecular Cell Biology 2,
285–293.
Acknowledgements The authors would like to express their gratitude to Professor K.Nagayama (National Institute for Physiological Sciences, Japan;NIPS) for his support and encouragement, and also thank Mr S.Sato, and Mr H. Okawara (NIPS) for their technical assistance.Support for a part of this study was provided by the CollaborativeResearch Project of the Laboratory for Magnetic Resonance Imagingand Spectroscopy, NIPS and by Grants-in-Aid for ScientificResearch from the Ministry of Education, Science and Culture ofJapan.
Y. Seo and others228 J. Physiol. 545.1