
Interpretation of Gas/Water Relative Permeability of Coal ...
19
energies Article Interpretation of Gas/Water Relative Permeability of Coal Using the Hybrid Bayesian-Assisted History Matching: New Insights Jiyuan Zhang 1,2 , Bin Zhang 1,2 , Shiqian Xu 1,2 , Qihong Feng 1,2 , Xianmin Zhang 1,2, * and Derek Elsworth 3,4,5 Citation: Zhang, J.; Zhang, B.; Xu, S.; Feng, Q.; Zhang, X.; Elsworth, D. Interpretation of Gas/Water Relative Permeability of Coal Using the Hybrid Bayesian-Assisted History Matching: New Insights. Energies 2021, 14, 626. https://doi.org/ 10.3390/en14030626 Academic Editor: Vladimir Alvarado Received: 15 December 2020 Accepted: 21 January 2021 Published: 26 January 2021 Publisher’s Note: MDPI stays neutral with regard to jurisdictional claims in published maps and institutional affil- iations. Copyright: © 2021 by the authors. Licensee MDPI, Basel, Switzerland. This article is an open access article distributed under the terms and conditions of the Creative Commons Attribution (CC BY) license (https:// creativecommons.org/licenses/by/ 4.0/). 1 Key Laboratory of Unconventional Oil & Gas Development, China University of Petroleum (East China), Qingdao 266580, China; [email protected] (J.Z.); [email protected] (B.Z.); [email protected] (S.X.); [email protected] (Q.F.) 2 School of Petroleum Engineering, China University of Petroleum (East China), Qingdao 266580, China 3 Department of Energy and Mineral Engineering, Pennsylvania State University, State College, PA 16802, USA; [email protected] 4 EMS Energy Institute, Pennsylvania State University, State College, PA 16802, USA 5 G3 Center, Pennsylvania State University, State College, PA 16802, USA * Correspondence: [email protected] Abstract: The relative permeability of coal to gas and water exerts a profound influence on fluid transport in coal seams in both primary and enhanced coalbed methane (ECBM) recovery processes where multiphase flow occurs. Unsteady-state core-flooding tests interpreted by the Johnson–Bossler– Naumann (JBN) method are commonly used to obtain the relative permeability of coal. However, the JBN method fails to capture multiple gas–water–coal interaction mechanisms, which inevitably results in inaccurate estimations of relative permeability. This paper proposes an improved assisted history matching framework using the Bayesian adaptive direct search (BADS) algorithm to interpret the relative permeability of coal from unsteady-state flooding test data. The validation results show that the BADS algorithm is significantly faster than previous algorithms in terms of convergence speed. The proposed method can accurately reproduce the true relative permeability curves without a presumption of the endpoint saturations given a small end-effect number of <0.56. As a comparison, the routine JBN method produces abnormal interpretation results (with the estimated connate water saturation ≈33% higher than and the endpoint water/gas relative permeability only ≈0.02 of the true value) under comparable conditions. The proposed framework is a promising computationally effective alternative to the JBN method to accurately derive relative permeability relations for gas– water–coal systems with multiple fluid–rock interaction mechanisms. Keywords: coalbed methane; relative permeability; unsteady-state flooding tests; assisted history matching; JBN method; Bayesian adaptive direct search 1. Introduction The recovery of coalbed methane (CBM) from underground coal seams has multiple benefits. These include the reduction of greenhouse gases released into the atmosphere and the enhancement of underground coal mining safety and in augmenting the supply of natural gas [1]. Most coal seams are initially saturated with water at in situ conditions [2]. Hence, two-phase gas/water flow is frequently encountered in the primary recovery of coalbed methane (CBM) by either routine dewatering or enhanced coalbed methane (ECBM) strategies such as the injection of N 2 and/or CO 2 . It is well recognized that the relative permeability of coal exerts a profound effect on multiphase fluid transport behavior [3,4] and controls gas/water production rates [5,6], the cost of produced water disposal [7], and N 2 /CO 2 injectivity [8,9]. Experimental methods to obtain the relative permeability curves of coal typically include the unsteady-state [10] core flooding, steady-state [11] core flooding, and microflu- idic flow [12] tests. The steady-state method is reputed to produce more accurate and Energies 2021, 14, 626. https://doi.org/10.3390/en14030626 https://www.mdpi.com/journal/energies
-
Upload
khangminh22 -
Category
Documents
-
view
5 -
download
0
Transcript of Interpretation of Gas/Water Relative Permeability of Coal ...

energies
Article
Interpretation of Gas/Water Relative Permeability of Coal Usingthe Hybrid Bayesian-Assisted History Matching: New Insights
Jiyuan Zhang 1,2, Bin Zhang 1,2, Shiqian Xu 1,2, Qihong Feng 1,2, Xianmin Zhang 1,2,* and Derek Elsworth 3,4,5
�����������������
Citation: Zhang, J.; Zhang, B.; Xu, S.;
Feng, Q.; Zhang, X.; Elsworth, D.
Interpretation of Gas/Water Relative
Permeability of Coal Using the
Hybrid Bayesian-Assisted History
Matching: New Insights. Energies
2021, 14, 626. https://doi.org/
10.3390/en14030626
Academic Editor: Vladimir Alvarado
Received: 15 December 2020
Accepted: 21 January 2021
Published: 26 January 2021
Publisher’s Note: MDPI stays neutral
with regard to jurisdictional claims in
published maps and institutional affil-
iations.
Copyright: © 2021 by the authors.
Licensee MDPI, Basel, Switzerland.
This article is an open access article
distributed under the terms and
conditions of the Creative Commons
Attribution (CC BY) license (https://
creativecommons.org/licenses/by/
4.0/).
1 Key Laboratory of Unconventional Oil & Gas Development, China University of Petroleum (East China),Qingdao 266580, China; [email protected] (J.Z.); [email protected] (B.Z.);[email protected] (S.X.); [email protected] (Q.F.)
2 School of Petroleum Engineering, China University of Petroleum (East China), Qingdao 266580, China3 Department of Energy and Mineral Engineering, Pennsylvania State University,
State College, PA 16802, USA; [email protected] EMS Energy Institute, Pennsylvania State University, State College, PA 16802, USA5 G3 Center, Pennsylvania State University, State College, PA 16802, USA* Correspondence: [email protected]
Abstract: The relative permeability of coal to gas and water exerts a profound influence on fluidtransport in coal seams in both primary and enhanced coalbed methane (ECBM) recovery processeswhere multiphase flow occurs. Unsteady-state core-flooding tests interpreted by the Johnson–Bossler–Naumann (JBN) method are commonly used to obtain the relative permeability of coal. However,the JBN method fails to capture multiple gas–water–coal interaction mechanisms, which inevitablyresults in inaccurate estimations of relative permeability. This paper proposes an improved assistedhistory matching framework using the Bayesian adaptive direct search (BADS) algorithm to interpretthe relative permeability of coal from unsteady-state flooding test data. The validation results showthat the BADS algorithm is significantly faster than previous algorithms in terms of convergencespeed. The proposed method can accurately reproduce the true relative permeability curves withouta presumption of the endpoint saturations given a small end-effect number of <0.56. As a comparison,the routine JBN method produces abnormal interpretation results (with the estimated connate watersaturation ≈33% higher than and the endpoint water/gas relative permeability only ≈0.02 of thetrue value) under comparable conditions. The proposed framework is a promising computationallyeffective alternative to the JBN method to accurately derive relative permeability relations for gas–water–coal systems with multiple fluid–rock interaction mechanisms.
Keywords: coalbed methane; relative permeability; unsteady-state flooding tests; assisted historymatching; JBN method; Bayesian adaptive direct search
1. Introduction
The recovery of coalbed methane (CBM) from underground coal seams has multiplebenefits. These include the reduction of greenhouse gases released into the atmosphereand the enhancement of underground coal mining safety and in augmenting the supply ofnatural gas [1]. Most coal seams are initially saturated with water at in situ conditions [2].Hence, two-phase gas/water flow is frequently encountered in the primary recoveryof coalbed methane (CBM) by either routine dewatering or enhanced coalbed methane(ECBM) strategies such as the injection of N2 and/or CO2. It is well recognized thatthe relative permeability of coal exerts a profound effect on multiphase fluid transportbehavior [3,4] and controls gas/water production rates [5,6], the cost of produced waterdisposal [7], and N2/CO2 injectivity [8,9].
Experimental methods to obtain the relative permeability curves of coal typicallyinclude the unsteady-state [10] core flooding, steady-state [11] core flooding, and microflu-idic flow [12] tests. The steady-state method is reputed to produce more accurate and
Energies 2021, 14, 626. https://doi.org/10.3390/en14030626 https://www.mdpi.com/journal/energies

Energies 2021, 14, 626 2 of 19
reliable results than the unsteady-state method [13]; however, the former is rarely used forestimating gas/water relative permeability of coal due to its cumbersome nature and ex-perimental difficulties [14]. So far, only Gash [11] and Reznik et al. [13] reported the use ofsteady-state tests to obtain the gas and water relative permeability of coal. The microfluidicmethod is capable of visualizing the fluid flow through coal cleats, which however requiresan expensive experimental apparatus and complicated operational procedures [15]. As acomparison, the unsteady-state gas-displacing-water flooding test is much easier and morerapid, which is widely used for determining relative permeability of coals [16].
Although the unsteady-state flooding test demonstrates a remarkable superiority overother methods in terms of experimental efficiency and cost-effectiveness, the interpretationof relative permeability from the unsteady displacement data (i.e., pressures and fluidproductions) is much more complex [17,18]. To date, various interpretation methods havebeen proposed to derive relative permeability from unsteady-state experiments, which canbe classified into analytical and history matching methods [19]. The analytical methods userelatively simple and straightforward computational schemes and are easy to implement,which therefore are currently most routinely used. Among the analytical methods, theJohnson–Bossler–Neumann (JBN) method [20] is most commonly used in the CBM researchcommunity. However, the JBN method was initially developed for water/oil flows insandstones, and its accuracy remains questionable when applied in a gas–water–coalsystem that involves more complex mechanisms. The JBN model was initially developedunder three fundamental assumptions that (i) capillary end-effects are negligible, (ii)the density of each phase remains constant (i.e., neither phase is compressible), and (iii)piston-like displacement occurs throughout the core sample. The first assumption can besatisfied in reality by using high-speed displacement rates to diminish the relative effect ofcapillary pressure. However, the latter two assumptions are difficult to accommodate for agas/water system because (i) gas is extremely compressible with strongly varying densityin the displacement process, especially for cases where the pressure gradient along thecore sample is high, and (ii) gas and water have a distinctive contrast in viscosities, whichmay result in viscous fingering during the displacement process that fails the assumptionof a piston-like displacement [21–23]. Moreover, when an adsorbing gas species (such asmethane, nitrogen, and CO2 that are of interest to CBM recovery processes) is injected intoa coal sample, the adsorption of the gas typically results in changes in the coal permeability,which inevitably affects the gas/water production curves that are used to calculate relativepermeability. These factors cannot be captured by the JBN method.
Compared with the JBN method, the assisted history matching method, based onnumerical simulations, is capable of tracking gas compressibility, gas adsorption, and coalpermeability evolution provided that these mechanisms are incorporated in the numer-ical simulator. The assisted history matching method in essence solves a mathematicaloptimization problem with an objective function of minimizing the errors between thesimulated and experimental production curves by tuning the relative permeability curveswith an optimization algorithm(s). The assisted history matching method has been success-fully used to derive water/oil relative permeability curves from core-flooding tests [24–26].Shaw et al. [27] used manual history matching to simultaneously derive relative permeabil-ity and capillary pressure for gas–water–coal systems. However, to the best knowledge ofthe authors, no publication has ever reported the application of assisted history matchingin deriving the relative permeability (RP) from core-flooding tests for a gas/liquid system.
To date, various algorithms have been applied to assist in history matching, includ-ing (i) gradient-based methods, e.g., the Levenberg–Marquardt (LM) [25] and the quasi-Newton [28] methods; (ii) ensemble-based methods, e.g., the ensemble Kalman filter(EnKF) [24] and ensemble smoother with multiple data assimilations (ES-MDA) [29] meth-ods; and (iii) swarm intelligence algorithms [30]. It should be noted that, for these methods,the saturation endpoints for both phases should be assumed to be known prior to conduct-ing history matching, which, if not assumed correctly, may produce unreliable results [31].For a real gas-displacing-water test, the saturation endpoint for water can be readily deter-

Energies 2021, 14, 626 3 of 19
mined based on the sample weights before and after gas flooding. However, determinationof the saturation endpoint for gas can be extremely difficult without expensive online X-raycomputed tomography (X-ray CT) [32] or nuclear magnetic resonance (NMR) imaging [33].This may significantly hinder the application of assisted history matching in a gas/liquidsystem. It should also be noted that gradient-based methods are prone to being trapped inlocal minima if not properly initialized [34]. Moreover, for the ensemble and swarm intelli-gence methods, a large number of numerical simulation runs are needed in order to achievea satisfactory result. This makes the estimation of relative permeability a low-efficiencyand computationally expensive process.
In summary of previous studies, the JBN method is most frequently used for in-terpreting relative permeability from unsteady-state displacement experiments, whichhowever is highly questionable with application to the gas/water/coal system due to itsinherent theoretical deficiencies. As a comparison, the assisted history matching methodis more reliable provided that complex fluid–rock interaction mechanisms are properlyaccounted for. However, most of the existing assisted history matching methods requirea prior assumption or determination of the endpoint saturations, which is difficult toachieve for systems involving compressible phase(s). In addition, existing algorithms areassociated with the issue of high computational overhead and in being time-consuming.Addressing these issues will improve the utility of assisted history matching methodsin estimating gas/water relative permeability curves in coals—enabling them to be usedwith both high accuracy and efficiency. This study presents an improved method using ahybrid Bayesian optimization (BO) and mesh adaptive direct search (MADS) algorithmto automatically history-match production profiles to determine relative permeabilitiesof coals from unsteady-state core-flooding experiments. The improved accuracy of theproposed method is demonstrated on synthetic numerical core-flooding experiments. Inaddition, the superiority of the method is highlighted by comparison with the routineapplication of the JBN method.
2. Methods2.1. Hybridizing BO with MADS
The MADS algorithm is a local optimizer that has been hybridized with global op-timization algorithms to solve varying optimization problems related to the petroleumengineering (PE) community [35–37]. Although the application of BO within the PE com-munity is only sparingly reported, it has been actively studied in other areas involvingexpensive cost functions such as in machine learning [38].
2.1.1. Basics of BO
The BO is an efficient framework for solving black box optimization problems thatinvolve objective functions that are computationally expensive to evaluate. A BO typicallyconsists of two consecutive steps (Figure 1). First, a prior over function is built to representthe belief about the objective function. When observations of the objective function areobtained, the posterior distribution over functions can be updated by combining the priordistribution with the observations, which forms a surrogate model on the objective function.Because of its flexibility and tractability, Gaussian process (GP) priors are frequently utilizedto represent the assumptive prior distribution on functions [39]. Second, an acquisitionfunction is applied to construct a utility function from the model posterior, which is thenmaximized to select the next query point at which to evaluate the function. After newfunction evaluations are conducted, the updated observations are combined with theprevious posterior estimation to construct a new posterior distribution over functions. Thisiterative search process is repeated until an optimal value is obtained.

Energies 2021, 14, 626 4 of 19
Figure 1. Illustration of the Bayesian optimization (BO) algorithm.
The covariance and acquisition functions are two key elements that may significantlyinfluence the performance of the Gaussian process. Stationary covariance functions includethe automatic relevance determination (ARD), squared exponential (SE), rational quadratic(RQ), Matérn 3/2, and Matérn 5/2 kernels. The acquisition functions that are commonlyused include the lower confidence bound (LCB), upper confidence bound (UCB), andexpected improvement (EI). In this study, we adopt the recommendation of [40] for thestationary covariance and acquisition functions, which are set to be the ARD RQ and theLCB, respectively.
2.1.2. Basics of MADS
The MADS algorithm is a directional direct search method proposed by [41]. At eachiteration, the MADS updates the candidate solutions in two sequential steps, namely thesearch stage and poll stage (Figure 2). In the search stage, MADS can use strategies such asheuristics and surrogate models (e.g., GPs in the BO process) to generate a finite number oftrial points on the mesh for following functional evaluations [42]. The use of a surrogate inthis step is generally less costly and can save considerable computational expenditure [43].The poll stage is performed if the search stage fails to improve the objective function value.It has been theoretically proven that the poll stage ensures the convergence of MADS tolocal optima for non-smooth functions [44]. If either the search or poll succeeds in finding amesh point with an improved objective value, the incumbent is updated and the mesh sizeremains the same or is multiplied by a factor τ > 1. If neither search nor poll are successful,the incumbent does not move and the mesh size is divided by τ. The algorithm proceedsuntil a stopping criterion is met (e.g., when a budget of evaluations has been exhausted).
Figure 2. Illustration of the mesh adaptive direct search (MADS) algorithm.

Energies 2021, 14, 626 5 of 19
2.1.3. Hybridization
The philosophy behind the Bayesian adaptive direct search (BADS) is to utilize thesurrogate models (GPs) constructed in the BO process to assist in generating candidatesolutions in the search and poll stages of the MADS. Mathematical details on the BADS aregiven in [40], and the workflow is illustrated in Figure 3, which is briefly introduced asfollows for completeness of this paper.
Figure 3. Workflow of the Bayesian adaptive direct search (BADS) algorithm.
For a Dn-dimension minimization problem x∗ = argminx∈RDn f (x), the BADS methodbegins function evaluations with an initial variable vector x0 and a number of Dn additionalpoints chosen via a space-filling quasi-random Sobol sequence [45] that are forced to be onthe mesh grid (Figure 3). The initial mesh size (∆mesh
0 ) and poll size (∆poll0 ) are set to 2−10 and
1.0 according to [40], respectively. The GP surrogate model is updated every 2Dn to 5Dnfunction evaluations and whenever the accuracy of the current GP is unreliable by refittingthe hyperparameters of GP using the gradient-based fmincon optimizer implemented inthe Optimization Toolbox of MATLAB.
At the kth iteration, the candidate solutions in the search stage xsearch are generatedby performing a local optimization of the acquisition function in the neighborhood ofthe incumbent xk using the two-step evolutionary strategy adapted from the covariancematrix adaptation evolutionary strategies (CMA-ES) -based MADS (which is also termedas LTMADS) algorithm [41] and are then scaled to the GP kernel length scales to constructthe final polling directions Dk. In this way, the solution candidates xpoll in the pollingstage can be updated according to xpoll =
{xk + ∆m
k υ : υ ∈ Dk}
. The polling sets areevaluated according to their ranking given by the acquisition function. If the poll succeeds insufficiently improving the objective function within three consecutive steps, the incumbentis updated and BADS switches to a new iteration with mesh and poll sizes multipliedby τ = 2; otherwise, the incumbent remains unchanged and BADS switches to a newiteration with the mesh and poll sizes divided by τ = 2. These steps are repeated until apreset maximum number of iterations is met, the algorithm stalls, or the poll size becomesextremely small.
2.2. Representation of Relative Permeability and Capillary Pressure
Power-law models are frequently used to represent relative permeability in historymatches due to the small number of tunable parameters. Although Shawn et al. [27] suggest

Energies 2021, 14, 626 6 of 19
that the simple modified Brooks–Corey-type model [46] is adequate in representing gas andwater relative permeability curves of coals, we adopt Chen et al.’s model [2] in this study,which is more versatile than the Brooks–Corey model. Chen et al.’s relative permeabilitymodel is developed specifically for coals and incorporates both the match-stick geometryof cleats and its effect on the computation of the capillary pressure. The applicability andaccuracy of this model has been confirmed against a large number of relative permeabilitycurves for a variety of coals [47,48]. The general form of Chen et al.’s model is writtenas follows:
krw = k∗rwSη+1+2/λwD (1)
krg = k∗rg(1− SwD)η(
1− S1+2/λwD
)(2)
SwD =Sw − Swc
1− Swc − Sgr(3)
where k∗rw and k∗rg are endpoint relative permeabilities for the water and gas phase, respec-tively; Swc and Sgr are connate water and irreducible gas saturations, respectively; and ηand λ are positive fitting exponents that represent the tortuosity and cleat size distributionof the cleat system.
For the unsteady-state flooding test, the displacement rate (or pressure gradient ap-plied between core ends) should be properly set such that the reservoir conditions areappropriately replicated while the capillary end-effect can be neglected [49]. However, it isusually difficult to define the proper values without knowledge of the capillary pressurecharacteristics in real laboratory tests. To the best knowledge of the authors, experimentaldata on capillary pressure for gas–liquid–coal systems at high pore pressures and underconfined conditions are still lacking due to the difficulty in making such measurements [27].As such, it is of practical significance to estimate relative permeability and capillary pres-sure simultaneously from an individual unsteady-state displacement test to eliminate thedifficulty of capillary pressure measurement. To represent the capillary pressure curve,which may be simultaneously interpreted with that for relative permeability, the Liu et al.model [50] (developed specifically for coal) was used to represent the capillary pressurecurve, which is written as follows:
pc = pc,max[1− bSγ
wD]− 1
β (4)
where pc,max is the maximum pressure on the capillary pressure curve and b, γ, and β arethe fitting parameters.
2.3. Implementation of the Assisted History Matching Framework
The workflow for the assisted history matching is shown in Figure 4 and is describedas follows:
Step 1: Randomly initialize the control parameters (k*rw, k*
rg, Swc, Sgr, η, λ, b, β, γ, andpc,max) shown in Equations (1)–(4) within their respective constraint boundaries that aregiven in [47,50].
Step 2: Calculate the relative permeability and capillary pressure curves according toEquations (1)–(4).
Step 3: Update the data file for numerical simulation.Step 4: Call the reservoir simulator to conduct numerical simulation for each solu-
tion candidate.In this study, we set the inlet and outlet pressures as constraints and attempt to
simultaneously match the cumulative productions of gas and water at outlet. Thus, theobjective function to be minimized is written as follows:
f =∑
Ngi=1
(qg
cal,i − qgobs,i
)2
Ng+
∑Nwi=1
(qw
cal,i − qwobs,i
)2
Nw(5)

Energies 2021, 14, 626 7 of 19
where q is cumulative production; N is the number of points on the cumulative productioncurve; the subscripts “g” and “w” represent gas and water phase, respectively; and thesubscript “cal” and “obs” represent calculated and observed values, respectively.
Step 6: Update the optimal solution, and generate new solutions using the BADSalgorithm. In this study, the MATLAB implementation of BADS developed by [40] is used,which is available at https://github.com/lacerbi/bads#reference.
Step 7: Check if the maximum number of function evaluations is met. If not, re-peat steps 2 through 6; otherwise, terminate history matching, and output the relativepermeability and capillary pressure.
Figure 4. Illustration of the assisted history matching framework.
3. Validation of the Framework
Compared to real laboratory tests, a most distinguishing advantage of using syntheticnumerical core flooding tests is that the true properties of the core samples are definitivelyknown and can therefore be used to test the accuracy of an interpretation technique [51,52].Relative to this, numerical methane-displacing-water core flooding tests are constructed,conducted, and used to validate the proposed interpretation framework.
Cylindrical core samples are typically used for laboratory flooding tests (Figure 5a). Thisgeometry can be approximated by a rectangular cuboid in numerical simulations providedthat their cross-sectional areas are identical [53,54] with no loss in fidelity (Figure 5b). Thetubing network of the experimental equipment exerts a finite influence on gas storage andflow behavior and, therefore, should also be accounted for in the grid model [53,55]. Inthis study, a rectangular grid model with 50 grid blocks along the x-, y-, and z-directionswas constructed for simulating unsteady gas-displacing-water tests with capacitance inthe tubing represented by single grid blocks both upstream and downstream. The central50 grid blocks represented the coal core, whereas 1 grid block on either side representedthe upper- and downstream tubing voids. Each grid block had a respective dimension of0.2, 5.321, and 5.321 cm in the x- (axial), y-, and z- (lateral) directions so that a coal coresample with a respective diameter and length of 5 cm and 10 cm was represented.

Energies 2021, 14, 626 8 of 19
Figure 5. Illustration of the (a) real core flooding and (b) synthetic numerical core flooding tests.
The coal core was initially saturated with water, with the basic properties summarizedin Table 1. The grid blocks on either end of the grid were penetrated with an injection andproduction well, respectively, to simulate the injection/production process of the fluids. Forthe two grid blocks at either end, the reservoir properties were set as follows: (i) Langmuirvolume and volumetric strain were zero, and compressibility was extremely small sinceno gas sorption or volumetric variation occurred in the tubing system; (ii) porosity wasassumed to be 0.02% to account for the tubing voids; and (iii) permeability was set to be100D so that the bottomhole pressures (BHPs) approximated the grid block pressures oneither end.
Table 1. Coal properties used in the synthetic numerical model.
Property Value
Cleat porosity, % 3.00Permeability, mD * 0.1
Rock compressibility, KPa−1 2.5 × 10⁻⁵
Sorption strain, fraction 0.009Pε, KPa 2700
Poison ratio, fraction 0.35Young’s Modulus, KPa 3.0 × 10⁶
Initial pressure, KPa 101.1Initial water saturation, % 100Langmuir volume, m3/t 24.0Langmuir pressure, KPa 2300
Desorption time, d 0.5Temperature, K 308.15
Bulk density, g/cm3 1.4
* The permeability value is assumed to be with reference to the averaged inlet and outlet pressures.
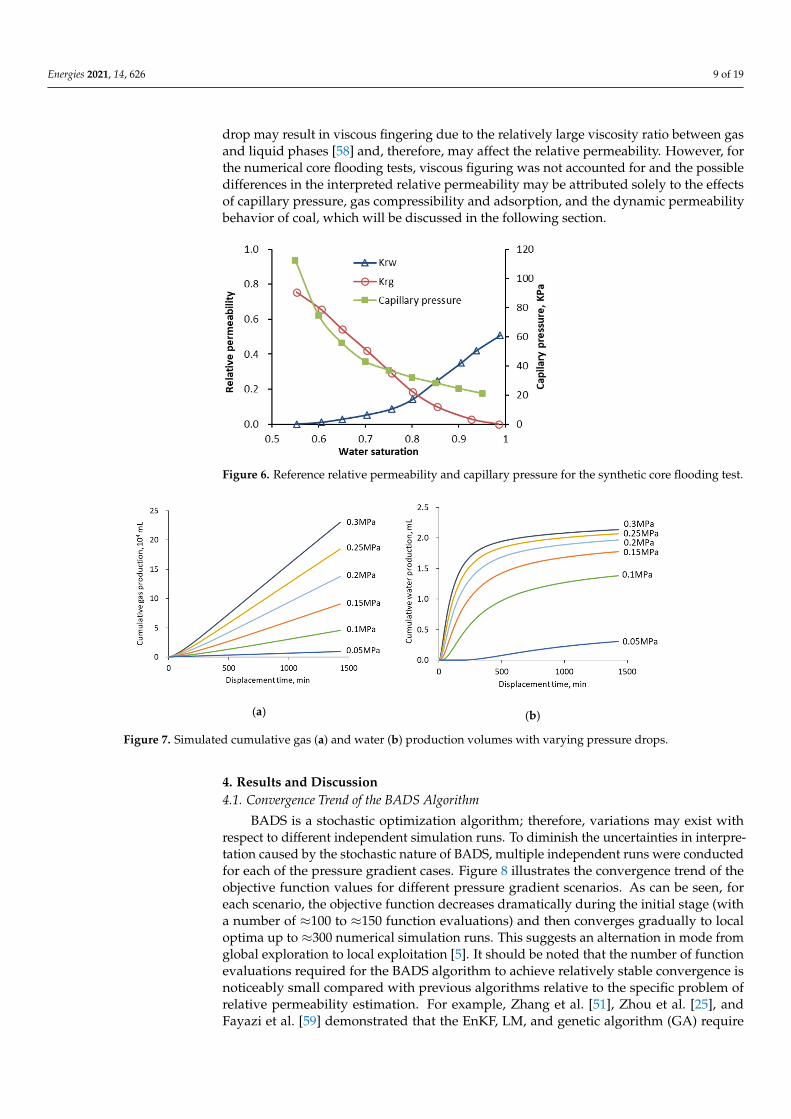
For real unsteady-state flooding tests, relative permeability and capillary pressure areinevitably associated with measurement uncertainties and thus may deviate from the idealmodeled curves. In other words, real relative permeability and/or capillary curves canonly be represented with analytical models if noise is added. In this regard, the referencerelative permeability and capillary pressure curves are generated by adding noise to thedata points generated with the Chen et al. [2] and Liu et al. [50] models, respectively, inorder to mimic the real cases (Figure 6). Previous studies conclude that the pressure drop(or fluid injection rate) applied on the core sample exerts a nonnegligible effect on therelative permeability due to the presence of capillary end-effect [56,57]. To examine therobustness and accuracy of the proposed framework, different simulation scenarios withvarying pressure drops were investigated. The BHP of the injector was set to 4.0 MPa,which generally approximates the methane desorption pressure of the coal seams in theQinshui basin. The BHPs of the producer were varied at 3.7, 3.75, 3.8, 3.85, 3.9, and3.95 MPa to represent pressure drops of 0.3, 0.25, 0.2, 0.15, 0.1, and 0.05 MPa, respectively.The corresponding simulated cumulative gas and water production rates are shown inFigure 7. It should be noted that, for real core flooding tests, applying a large pressure
Energies 2021, 14, 626 9 of 19
drop may result in viscous fingering due to the relatively large viscosity ratio between gasand liquid phases [58] and, therefore, may affect the relative permeability. However, forthe numerical core flooding tests, viscous figuring was not accounted for and the possibledifferences in the interpreted relative permeability may be attributed solely to the effectsof capillary pressure, gas compressibility and adsorption, and the dynamic permeabilitybehavior of coal, which will be discussed in the following section.
Figure 6. Reference relative permeability and capillary pressure for the synthetic core flooding test.
Energies 2021, 14, x FOR PEER REVIEW 10 of 21
(a)
(b)
Figure 7. Simulated cumulative gas (a) and water (b) production volumes with varying pressure drops.
4. Results and Discussion 4.1. Convergence Trend of the BADS Algorithm
BADS is a stochastic optimization algorithm; therefore, variations may exist with respect to different independent simulation runs. To diminish the uncertainties in interpretation caused by the stochastic nature of BADS, multiple independent runs were conducted for each of the pressure gradient cases. Figure 8 illustrates the convergence trend of the objective function values for different pressure gradient scenarios. As can be seen, for each scenario, the objective function decreases dramatically during the initial stage (with a number of ≈100 to ≈150 function evaluations) and then converges gradually to local optima up to ≈300 numerical simulation runs. This suggests an alternation in mode from global exploration to local exploitation [5]. It should be noted that the number of function evaluations required for the BADS algorithm to achieve relatively stable convergence is noticeably small compared with previous algorithms relative to the specific problem of relative permeability estimation. For example, Zhang et al. [51], Zhou et al. [25], and Fayazi et al. [59] demonstrated that the EnKF, LM, and genetic algorithm (GA) require respectively ≈1000, ≈950, and ≈500 simulation runs to achieve stable convergence. This highlights the efficiency of the BADS algorithm in assisted history matching.
Also shown in Figure 8, for each pressure difference scenario, the ten independent runs exhibit noticeable variations in the final objective function values after even ≈300 simulation runs. The variations are attributed to the stochastic nature of the iterative process in BADS in the generation of solution candidates, which is a common issue for stochastic optimization algorithms [5]. The averaged final objective function values (even after ≈300 numerical simulations) are also affected by the differential pressure. The final averaged objective function values are ≈0.001, 0.005, and 0.45 for scenarios with pressure drops of >0.15 MPa, 0.1 MPa, and 0.05 MPa, respectively. The variations in the final objective function values indicate a noticeable influence of the pressure drop in the interpretation accuracy, which will be discussed in the following section.
Figure 7. Simulated cumulative gas (a) and water (b) production volumes with varying pressure drops.
4. Results and Discussion4.1. Convergence Trend of the BADS Algorithm
BADS is a stochastic optimization algorithm; therefore, variations may exist withrespect to different independent simulation runs. To diminish the uncertainties in interpre-tation caused by the stochastic nature of BADS, multiple independent runs were conductedfor each of the pressure gradient cases. Figure 8 illustrates the convergence trend of theobjective function values for different pressure gradient scenarios. As can be seen, foreach scenario, the objective function decreases dramatically during the initial stage (witha number of ≈100 to ≈150 function evaluations) and then converges gradually to localoptima up to ≈300 numerical simulation runs. This suggests an alternation in mode fromglobal exploration to local exploitation [5]. It should be noted that the number of functionevaluations required for the BADS algorithm to achieve relatively stable convergence isnoticeably small compared with previous algorithms relative to the specific problem ofrelative permeability estimation. For example, Zhang et al. [51], Zhou et al. [25], andFayazi et al. [59] demonstrated that the EnKF, LM, and genetic algorithm (GA) require

Energies 2021, 14, 626 10 of 19
respectively ≈1000, ≈950, and ≈500 simulation runs to achieve stable convergence. Thishighlights the efficiency of the BADS algorithm in assisted history matching.
Figure 8. Evolution of the objective function values at varying pressure drops of (a) 0.3 MPa,(b) 0.25 MPa, (c) 0.2 MPa, (d) 0.15 MPa, (e) 0.1 MPa, and (f) 0.05 MPa: the dashed lines are for10 individual and independent runs, whereas solid lines are averaged values of the independent runs.
Also shown in Figure 8, for each pressure difference scenario, the ten independentruns exhibit noticeable variations in the final objective function values after even ≈300 sim-ulation runs. The variations are attributed to the stochastic nature of the iterative processin BADS in the generation of solution candidates, which is a common issue for stochas-tic optimization algorithms [5]. The averaged final objective function values (even after

Energies 2021, 14, 626 11 of 19
≈300 numerical simulations) are also affected by the differential pressure. The final aver-aged objective function values are ≈0.001, 0.005, and 0.45 for scenarios with pressure dropsof >0.15 MPa, 0.1 MPa, and 0.05 MPa, respectively. The variations in the final objectivefunction values indicate a noticeable influence of the pressure drop in the interpretationaccuracy, which will be discussed in the following section.
4.2. Effect of Pressure Drop on the Interpretation Accuracy
Figure 9 depicts the interpreted relative permeability with reference to the “true”curves. As shown, the interpreted relative permeability curves from different independentruns are scattered around the true curves, which is possibly due to the random initializationand stochastic nature of the BADS algorithm. Nonetheless, the averaged relative perme-ability of ten independent runs agree well with the true curves at larger pressure drops(0.2, 0.25, and 0.3 MPa) (Figure 9a–c). For a pressure drop of 0.15 MPa, the interpreted gasrelative permeability agrees well with the true permeability, whereas small discrepanciesexist for the water relative permeability at water saturations of >0.9 (Figure 9d). For thescenario with a pressure drop of 0.1 MPa, the interpreted gas and water relative perme-ability curves deviate noticeably from the true behavior especially in the region aroundthe endpoint saturations (Figure 9e). For the scenario with an extreme small pressuredrop of 0.05 MPa, significant discrepancies exist between the estimated and true relativepermeability curves: the connate water saturation is overestimated, whereas the relativepermeabilities for both the gas and water phases are generally underestimated comparedwith the true ones (Figure 9f). The discrepancies between the interpreted and true connatewater saturation for the extreme low pressure drop (0.05 MPa) may be attributed to thedominating role of capillary forces relative to viscous forces that results in a high watersaturation remaining at the end of the displacement experiment (Figure 7b). The relativelyhigh residual water saturation misleads the BADS algorithm to derive a relatively highconnate water saturation. Once the connate water saturation is overestimated, the relativepermeability for both the gas and water phases should be forced to reduce in order toimprove the estimation accuracy.
To further investigate the effect of pressure drop on the interpretation accuracy, thedimensionless flow parameter of end-effect number (Nc,end) [60] is included. This is definedas follows:
Nc,end =Pc,max
∆p(6)
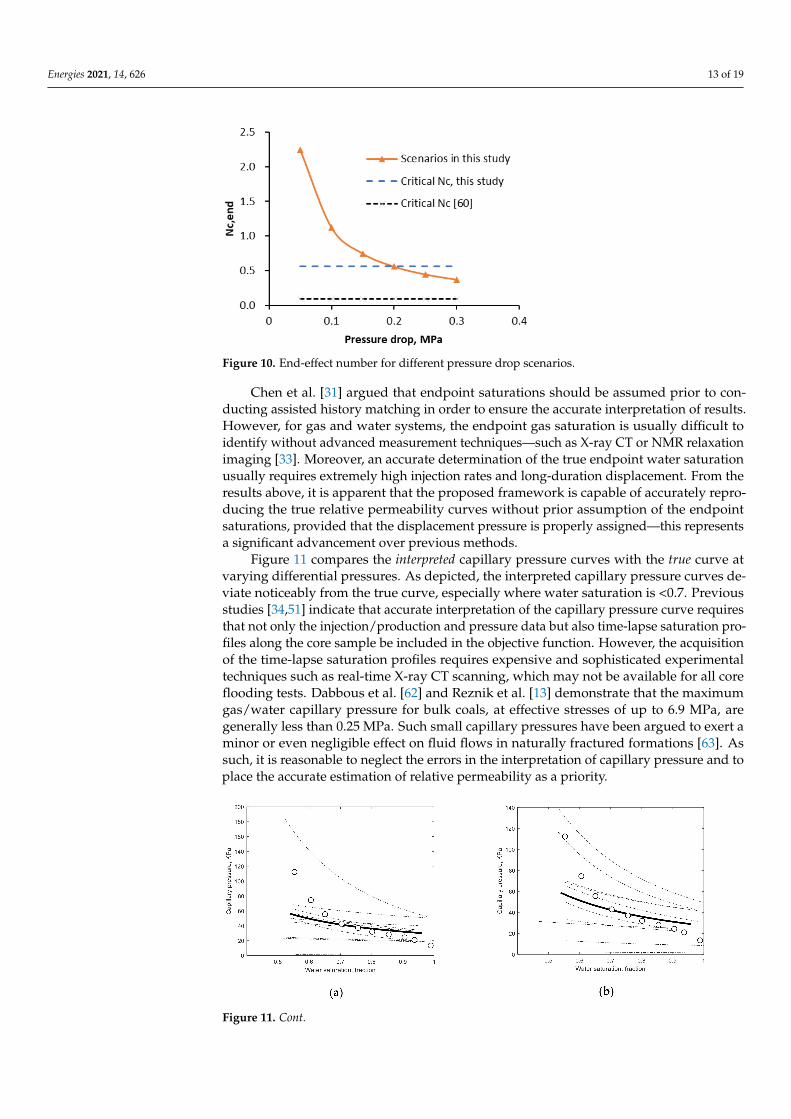
where ∆p is the pressure drop along the core sample.For the specific synthetic models in this work, the calculated end-effect number
values are shown in Figure 10. As addressed previously, the interpretation accuracy isrelatively high provided that the applied pressure drop on the core sample is not lowerthan ≈0.1 MPa—this corresponds to an Nc,end of ≈0.56. Bentsen [61] suggests that theeffect of the capillary term on fluid displacement can be neglected given Nc,end < 0.01 andNc,end < 0.1 for two-phase systems with mobility ratios of 2 and 10, respectively. For thespecific conditions of this study (Table 1), the mobility ratio of gas over water is muchhigher (≈70) than that of [61]. Nonetheless, by analogy with [61], it should be reasonable toassume a higher critical Nc,end value below which the capillary end-effect can be neglected,specifically for the gas/water system in this study.
Numerous studies have documented the use of significantly larger pressure drops orflow rates than those in real reservoirs in order to minimize the capillary end-effect in coreflooding tests and thus to improve the interpretation accuracy of relative permeability [56,57].However, applying a large pressure gradient tends to increase the possibility of viscousfiguring considering the necessarily unfavorably high mobility ratio of gas relative towater [21–23]. This may produce relative permeability curves that are not representativeof the true reservoir conditions. For the methane–water–coal system, applying largerpressure drops also results in more significant variations in the permeability change andin gas adsorption along the core sample. Therefore, it should be of practical significance

Energies 2021, 14, 626 12 of 19
to minimize the pressure drop applied on the core sample while ensuring the accuracy ofinterpretation, which can be readily achieved using the interpretation framework proposedin this study.
Figure 9. Comparison of interpreted versus true relative permeability curves for the synthetic samplewith pressure drops of (a) 0.3 MPa, (b) 0.25 MPa, (c) 0.2 MPa, (d) 0.15 MPa, (e) 0.1 MPa, and (f)0.05 MPa: Open circles are reference data points (red for gas and blue for water); dashed lines areindependent runs; solid lines are averaged values of the independent runs; and gray bands are the±5% confidence interval.
Energies 2021, 14, 626 13 of 19
Figure 10. End-effect number for different pressure drop scenarios.
Chen et al. [31] argued that endpoint saturations should be assumed prior to con-ducting assisted history matching in order to ensure the accurate interpretation of results.However, for gas and water systems, the endpoint gas saturation is usually difficult toidentify without advanced measurement techniques—such as X-ray CT or NMR relaxationimaging [33]. Moreover, an accurate determination of the true endpoint water saturationusually requires extremely high injection rates and long-duration displacement. From theresults above, it is apparent that the proposed framework is capable of accurately repro-ducing the true relative permeability curves without prior assumption of the endpointsaturations, provided that the displacement pressure is properly assigned—this representsa significant advancement over previous methods.
Figure 11 compares the interpreted capillary pressure curves with the true curve atvarying differential pressures. As depicted, the interpreted capillary pressure curves de-viate noticeably from the true curve, especially where water saturation is <0.7. Previousstudies [34,51] indicate that accurate interpretation of the capillary pressure curve requiresthat not only the injection/production and pressure data but also time-lapse saturation pro-files along the core sample be included in the objective function. However, the acquisitionof the time-lapse saturation profiles requires expensive and sophisticated experimentaltechniques such as real-time X-ray CT scanning, which may not be available for all coreflooding tests. Dabbous et al. [62] and Reznik et al. [13] demonstrate that the maximumgas/water capillary pressure for bulk coals, at effective stresses of up to 6.9 MPa, aregenerally less than 0.25 MPa. Such small capillary pressures have been argued to exert aminor or even negligible effect on fluid flows in naturally fractured formations [63]. Assuch, it is reasonable to neglect the errors in the interpretation of capillary pressure and toplace the accurate estimation of relative permeability as a priority.
Figure 11. Cont.

Energies 2021, 14, 626 14 of 19
Figure 11. Comparison of interpreted versus true capillary pressure curves at varying pressure dropsof (a) 0.3 MPa, (b) 0.25 MPa, (c) 0.2 MPa, (d) 0.15 MPa, (e) 0.1 MPa, and (f) 0.05 MPa: open circles arereference data points; dashed lines are 10 independent solution runs; and solid lines are averages ofthe independent runs.
4.3. Comparison with the JBN Method
Figure 12 depicts the interpretation results of the routine JBN method for the relativelylarge pressure drop of 0.3 MPa (corresponding to a large end-effect number value of ≈2.2).As clearly shown, the derived relative permeability curves for both water and gas phasesusing the JBN method deviate significantly from the true reference data. The derivedconnate water saturation is approximately 0.738, which is 33% higher than the true values(0.553). The derived water relative permeability values are on the order of magnitude of10−5 to 10−3, with the endpoint water relative permeability being ≈0.01 of the true value.The derived gas relative permeability is of the order of≈10−2, with the endpoint gas relativepermeability being ≈0.02 of the true value. Compared with the proposed interpretationframework introduced and benchmarked in this study, the results interpreted using the JBNare, in contrast, highly questionable and unreliable. As noted previously, the JBN methodwas initially developed to represent incompressible two-phase water and oil flow underthe assumption of negligible capillary end-effects. For a real methane-displacing-watertest on a coal sample, three discrepancies exist relative to the necessary assumptions forJBN: (i) the capillary end-effects are nonnegligible, (ii) gas compressibility and adsorptioneffects are significant, and (iii) permeability evolves in coal due to gas injection and as aresult of both sorptive-swelling and the pressure sensitive nature of the cleat system. Thesefactors are not accounted for in the JBN method, which therefore result in the discrepanciesbetween the interpreted and true relative permeabilities that we observe.

Energies 2021, 14, 626 15 of 19
Figure 12. Comparison of the Johnson–Bossler–Naumann (JBN) interpreted versus true relativepermeability curves.
To ascertain the effect of each of these factors on the JBN interpretation results, threesimulation model cases are tuned based on the basic model parameterization (Table 1 andFigures 5 and 6), and the JBN method is applied to interpret the relative permeabilities foreach individual case (Figure 13). For all these cases, the pressure drop applied on the coresample is set to be relatively large (0.3 MPa).
(1) A first case involves only gas compressibility and adsorption by assuming zerocapillary pressure and by accommodating no evolution in permeability. As can beseen from Figure 13, for this case, the JBN-interpreted relative permeability curvesagree well with the true relations, indicating that gas compressibility and adsorptionexert minor effects on the accuracy of interpretation using the JBN algorithm.
(2) A second case is constructed by adding the capillary pressure while still excludingpermeability evolution. Apparent in Figure 13 is that the inclusion of the capillaryeffect tends to lower the interpreted water relative permeability with reference tothe true curve. The interpretation of gas phase relative permeability appears to beless affected compared with that for the water phase over the range of high watersaturations; however, the interpreted gas relative permeability is lower than the realmagnitude when the water saturation approximates the connate water saturation.
(3) A third case is constructed by adding the permeability evolution effect while stillexcluding the impact of capillary pressure but otherwise represents the conditionsof the first case. As depicted in Figure 13, for this case, the JBN-interpreted relativepermeability curves deviate significantly from the true behavior. These results areactually quite similar to the curves interpreted for the basic model (that incorporatecapillary end-effects, gas compressibility and adsorption, and permeability evolution).
Energies 2021, 14, x FOR PEER REVIEW 16 of 21
Figure 12. Comparison of the Johnson–Bossler–Naumann (JBN) interpreted versus true relative permeability curves.
To ascertain the effect of each of these factors on the JBN interpretation results, three simulation model cases are tuned based on the basic model parameterization (Table 1 and Figures 5 and 6), and the JBN method is applied to interpret the relative permeabilities for each individual case (Figure 13). For all these cases, the pressure drop applied on the core sample is set to be relatively large (0.3 MPa).
Figure 13. Effects of varying factors on the interpretation of results recovered from the JBN method.
(1) A first case involves only gas compressibility and adsorption by assuming zero capillary pressure and by accommodating no evolution in permeability. As can be seen from Figure 13, for this case, the JBN-interpreted relative permeability curves agree well with the true relations, indicating that gas compressibility and adsorption exert minor effects on the accuracy of interpretation using the JBN algorithm.
(2) A second case is constructed by adding the capillary pressure while still excluding permeability evolution. Apparent in Figure 13 is that the inclusion of the capillary effect tends to lower the interpreted water relative permeability with reference to the true curve. The interpretation of gas phase relative permeability appears to be less affected compared with that for the water phase over the range of high water saturations; however, the interpreted gas relative permeability is lower than the real magnitude when the water saturation approximates the connate water saturation.
(3) A third case is constructed by adding the permeability evolution effect while still excluding the impact of capillary pressure but otherwise represents the conditions of the first case. As depicted in Figure 13, for this case, the JBN-interpreted relative
Figure 13. Effects of varying factors on the interpretation of results recovered from the JBN method.

Energies 2021, 14, 626 16 of 19
In summary, the effect of gas compressibility and adsorption can be neglected in aninterpretation using the JBN method. Capillary end-effects exert a nonnegligible but signif-icantly smaller effect on the accuracy of interpretation using the JBN algorithm comparedto the impacts of permeability evolution. This latter effect of permeability evolution isthe primary source of error causing unreliable interpretation of permeabilities from theJBN method. In other words, the JBN method only yields reliable relative permeabilityestimates where capillary end-effects and permeability evolution (due to swelling andchanges in effective stress) are negligible.
However, swelling and stress-dependent permeability evolution are inherent in frac-tured coals. This effect may however be reduced by using non-adsorbing gases as thedisplacing fluid. As stated previously, the impact of the capillary end-effect may be reducedby using a large pressure gradient. To further evaluate the flow regime where the JBNmethod is valid for cases where permeability evolution is negligible, additional simulationruns are conducted for increased pressure drops (0.4 and 0.5 MPa). The interpreted resultsare shown in Figure 14. As apparent from the figure, the JBN method gives an accurateestimation for the gas relative permeability at pressure drops of 0.4 and 0.5 MPa. Forthe water phase, the estimated relative permeability curves at pressure drops of 0.4 and0.5 MPa also agree with the true values for water saturations lower than the cross-pointsaturation but are slightly lower than the true values at water saturations higher thanthis. Overall, the accuracy of interpretation of the JBN algorithm is acceptable for pressuredrops larger than 0.4 MPa, which correspond to an Nc,end of ≈3.3. By comparison, theproposed framework introduced in this study is capable of accurately reproducing therelative permeability given an Nc,end of >0.56, which is obviously lower that that requiredfor the JBN method to return reasonable estimates.
Figure 14. Effects of varying factors on the interpretation results of the JBN method.
5. Conclusions
An improved assisted history matching framework is developed and implementedto improve the fidelity of relative permeability estimates where the impacts of end-capeffects, capillary pressure differentials, and sorptive/stress-induced changes in perme-ability are present. This new algorithm (BADS) is applied to recover gas/water relativepermeability curves of coals from unsteady-state gas-displacing-water tests and to defineits improvement over existing methods. Synthetic phase displacement experiments areconducted by numerical simulation and by using varied pressure drops to both validatethe proposed framework and to determine its relative improvement. The performance ofthe framework was compared with the performance of the existing JBN algorithm. Wedemonstrate that the BADS algorithm is capable of reproducing the relative permeabilitiesfrom unsteady-state displacement tests on synthetic samples with relatively high accuracyprovided that the end-effect number is higher than 0.56. The BADS algorithm is remarkably

Energies 2021, 14, 626 17 of 19
efficient, which requires only a small number of numerical simulation runs to achievestable convergence: ≈100 to 150 runs. This rapid convergence represents a significantimprovement over previous algorithms, such as EnKF, LM, and GA, that typically requirein excess of 500 numerical simulation runs to converge for the same representative problem.Furthermore, we demonstrate that the JBN method leads to unreliable interpretation resultsin the presence of capillary end-effects and when permeability evolution as a result ofchanges in pressure (impacts of sorption/swelling and changes in effective stress) arepresent and significant. Conversely, the JBN method produces reasonable estimationsonly where relatively large pressure drops (corresponding to an end-effect number of>3.3) are present and where changes in permeability due to gas injection are negligible.Future work is anticipated regarding application of the proposed framework in interpretinggas/water relative permeability of coal from real core flooding tests so that the effects ofvarying factors (i.e., pore pressure, displacement rate, etc.) on the relative permeability canbe identified. The proposed framework should be rather easily extended for water/oil,gas/oil, and gas/water in shale, sand, and carbonate rocks. As far as we are concerned, theonly issue of the proposed method for application in other porous flow problems is therepresentation of the relative permeability pressure curve. As has been stated previously,for the gas/water/coal system, the relative permeability curve has been proven to bewell represented with Chen et al.’s model, which however may be replaced with otherrepresentation methods such as the Corey-type or B-spline models [31] for other typeof rocks.
Author Contributions: Conceptualization, J.Z.; methodology, J.Z.; software, B.Z. and S.X.; validation,X.Z.; formal analysis, S.X.; investigation, B.Z.; writing—original draft preparation, J.Z.; writing—review and editing, X.Z. and D.E.; supervision, Q.F.; funding acquisition, J.Z and X.Z. All authorshave read and agreed to the published version of the manuscript.
Funding: This research was funded by the China National Natural Science Foundation, grantnumbers 51904319 and U1810105, and by the China Postdoctoral Science Foundation, grant num-ber 2018M642727.
Institutional Review Board Statement: Not applicable.
Informed Consent Statement: Not applicable.
Data Availability Statement: Data used in this study is available at request.
Acknowledgments: The authors are grateful to the three anonymous reviewers for their constructiveand critical comments that helped improve the manuscript.
Conflicts of Interest: The authors declare no conflict of interest.
References1. Zhang, J.; Feng, Q.; Zhang, X.; Hu, Q.; Yang, J.; Wang, N. A Novel data-driven method to estimate methane adsorption isotherm
on coals using the gradient boosting decision tree: A case study in the Qinshui Basin, China. Energies 2020, 13, 5369. [CrossRef]2. Chen, D.; Pan, Z.; Liu, J.; Connell, L.D. An improved relative permeability model for coal reservoirs. Int. J. Coal Geol. 2013,
109-110, 45–57. [CrossRef]3. Clarkson, C.R.; Rahmanian, M.; Kantzas, A.; Morad, K. Relative permeability of CBM reservoirs: Controls on curve shape. Int. J.
Coal Geol. 2011, 88, 204–217. [CrossRef]4. Karacan, C.Ö. Production history matching to determine reservoir properties of important coal groups in Upper Pottsville
formation, Brookwood and Oak Grove fields, Black Warrior Basin, Alabama. J. Nat. Gas Sci. Eng. 2013, 10, 51–67. [CrossRef]5. Zhang, J.; Feng, Q.; Zhang, X.; Bai, J.; Karacan, O.; Elsworth, D. A two-stage step-wise framework for fast optimization of well
placement in coalbed methane reservoirs. Int. J. Coal Geol. 2020, 225, 103479. [CrossRef]6. Zhang, J.; Feng, Q.; Zhang, X.; Hu, Q.; Weng, S.; Chen, D.; Zhai, Y.; Yan, X. Multi-fractured horizontal well for improved coalbed
methane production in eastern Ordos basin, China: Field observations and numerical simulations. J. Petrol. Sci. Eng. 2020,194, 107488. [CrossRef]
7. Ham, Y.S.; Kantzas, A. Relative permeability of coal to gas (helium, methane, and carbon dioxide) and water: Results andexperimental limitations. In Proceedings of the Canadian Unconventional Resources Conference, Calgary, Alberta, Canada, 15–17November 2011. [CrossRef]

Energies 2021, 14, 626 18 of 19
8. Deng, H.; Stauffer, P.H.; Dai, Z.; Jiao, Z.; Surdam, R.C. Simulation of industrial-scale CO2 storage: Multi-scale heterogeneity andits impacts on storage capacity, injectivity and leakage. Int. J. Greenh. Gas Control 2012, 10, 397–418. [CrossRef]
9. Kumar, H.; Elsworth, D.; Liu, J.; Pone, D.; Mathews, J.P. Optimizing enhanced coalbed methane recovery for unhinderedproduction and CO2 injectivity. Int. J. Greenh. Gas. Control 2012, 11, 86–97. [CrossRef]
10. Durucan, S.; Ahsan, M.; Shi, J.Q.; Syed, A.; Korre, A. Two phase relative permeabilities for gas and water in selected Europeancoals. Fuel 2014, 134, 226–236. [CrossRef]
11. Gash, B.W. Measurement of “rock properties” in coal for coalbed methane production. In Proceedings of the SPE AnnualTechnical Conference and Exhibition, Dallas, TX, USA, 6–9 October 1991. [CrossRef]
12. Gerami, A.; Mostaghimi, P.; Armstrong, R.T.; Zamani, A.; Warkiani, M.E. A microfluidic framework for studying relativepermeability in coal. Int. J. Coal Geol. 2016, 159, 183–193. [CrossRef]
13. Reznik, A.A.; Dabbous, M.K.; Fulton, P.F.; Taber, J.J. Air-water relative permeability studies of Pittsburgh and Pocahontas coals.SPE J. 1974, 14, 556–562. [CrossRef]
14. Maini, B. Is it futile to measure relative permeability for heavy oil reservoirs? J. Can. Petrol. Tech. 1998, 37, 7. [CrossRef]15. Gerami, A.; Armstrong, R.T.; Johnston, B.; Warkiani, M.E.; Mosavat, N.; Mostaghimi, P. Coal-on-a-chip: Visualizing flow in coal
fractures. Energy Fuel 2017, 31, 10393–10403. [CrossRef]16. Zhang, J.; Feng, Q.; Zhang, X.; Wen, S.; Zhai, Y. Relative permeability of coal: A review. Transp. Porous Media 2015, 106, 563–594.
[CrossRef]17. Shen, S.; Fang, Z.; Li, X. Laboratory measurements of the relative permeability of coal: A review. Energies 2020, 13, 5568. [CrossRef]18. Shen, J.; Qin, Y.; Li, Y.; Wang, G. Experimental investigation into the relative permeability of gas and water in low-rank coal. J.
Petrol. Sci. Eng. 2019, 175, 303–316. [CrossRef]19. Le-Hussain, F.; Cinar, Y.; Bedrikovetsky, P.G. Comparison of methods for drainage relative permeability estimation from
displacement tests. In Proceedings of the SPE Improved Oil Recovery Symposium, Tulsa, OK, USA, 24–28 April 2010. [CrossRef]20. Johnson, E.F.; Bossler, D.P.; Naumann, V.O. Calculation of relative permeability from displacement experiments. Pet. Trans. AIME
1959, 216, 370–372. [CrossRef]21. Chakrabarty, C.; Bentsen, R.G. Instability theory for immisicible displacements in tubular systems. SPE Reserv. Eng. 1992, 7,
187–194. [CrossRef]22. Pavone, D. Observations and correlations for immiscible viscous-fingering experiments. SPE Reserv. Eng. 1992, 7, 187–194.
[CrossRef]23. Peters, E.J.; Flock, D.L. The onset of instability during two-phase immiscible displacement in porous media. SPE J. 1981, 21,
249–258. [CrossRef]24. Zhang, Y.; Song, C.; Yang, D. A damped iterative EnKF method to estimate relative permeability and capillary pressure for tight
formations from displacement experiments. Fuel 2016, 167, 306–315. [CrossRef]25. Zhou, K.; Hou, J.; Fu, H.; Wei, B.; Liu, Y. Estimation of relative permeability curves using an improved Levenberg-Marquardt
method with simultaneous perturbation Jacobian approximation. J. Hydrol. 2017, 544, 604–612. [CrossRef]26. Adibifard, M.; Talebkeikhah, M.; Sharifi, M.; Hemmati-Sarapardeh, A. Iterative ensemble Kalman filter and genetic algorithm for
automatic reconstruction of relative permeability curves in the subsurface multi-phase flow. J. Petrol. Sci. Eng. 2020, 192, 107264.[CrossRef]
27. Shaw, D.; Mostaghimi, P.; Armstrong, R.T. The dynamic behaviour of coal relative permeability curves. Fuel 2019, 253, 293–304.[CrossRef]
28. Eydinov, D.; Gao, G.; Li, G.; Reynolds, A.C. Simultaneous estimation of relative permeability and porosity/permeability fields byhistory matching production data. J. Can. Petrol. Tech. 2009, 48, 13–25. [CrossRef]
29. Emerik, A.A.; Reynolds, A.C. Ensemble smoother with multiple data assimilation. Comput. Geosci. 2013, 55, 3–15. [CrossRef]30. Chai, Z.; Nwachukwu, A.; Zagayevskiy, Y.; Amini, S.; Madasu, S. An integrated closed-loop solution to assisted history matching
and field optimization with machine learning techniques. J. Petrol. Sci. Eng. 2020, 108204. [CrossRef]31. Chen, S.; Li, G.; Peres, A.M.; Reynolds, A.C. A well test for in-situ determination of relative permeability curves. SPE Reserv. Eval.
Eng. 2008, 11, 95–107. [CrossRef]32. Aljehani, A.S.; Wang, Y.D.; Rahman, S.S. An innovative approach to relative permeability estimation of naturally fractured
carbonate rocks. J. Petrol. Sci. Eng. 2018, 162, 309–324. [CrossRef]33. Sun, X.; Yao, Y.; Ripepi, N.; Liu, D. A novel method for gas-water relative permeability measurement of coal using NMR relaxation.
Transp. Porous Media 2018, 124, 73–90. [CrossRef]34. Schembre, J.M.; Kovscek, A.R. Estimation of dynamic relative permeability and capillary pressure from countercurrent imbibition
experiments. Transp. Porous Media 2004, 65, 31–51. [CrossRef]35. Aliyev, E.; Durlofsky, L.J. Multilevel field-development optimization using a sequence of upscaled models. In Proceedings of the
SPE Reservoir Simulation Symposium, Houston, TX, USA, 23–25 February 2015. [CrossRef]36. Yang, H.; Kim, J.; Choe, J. Field development optimization in mature oil reservoirs using a hybrid algorithm. J. Petrol. Sci. Eng.
2017, 156, 41–50. [CrossRef]37. Chen, H.; Feng, Q.; Zhang, X.; Wang, S.; Ma, Z.; Zhou, W.; Liu, C. A meta-optimized hybrid global and local algorithm for well
placement optimization. Comput. Chem. Eng. 2018, 117, 209–220. [CrossRef]

Energies 2021, 14, 626 19 of 19
38. Brochu, E.; Cora, V.M.; De Freitas, N. A Tutorial on Bayesian Optimization of Expensive Cost Functions, with Application to Active UserModeling and Hierarchical Reinforcement Learning; Cornell University: Ithaca, NY, USA, 2010.
39. Snoek, J.; Larochelle, H.; Adams, R.P. Practical Bayesian optimization of machine learning algorithms. In Proceedings of theAdvances in Neural Information Processing Systems, Lake Tahoe, NV, USA, 3–6 December 2012; pp. 2951–2959.
40. Acerbi, L.; Ma, W.J. Practical Bayesian optimization for model fitting with Bayesian adaptive direct search. In Proceedings of theAdvances in Neural Information Processing Systems, Long Beach, CA, USA, 4–9 December 2017; pp. 1834–1844.
41. Audet, C.; Dennis, J.E. Mesh adaptive direct search algorithms for constrained optimization. SIAM J. Optimiz. 2006, 17, 188–217.[CrossRef]
42. Audet, C.; Dennis, J.E.; Le Digabel, S. Globalization strategies for mesh adaptive direct search. Comput. Optim. Appl. 2010, 46,193–215. [CrossRef]
43. Booker, A.J.; Dennis, J.E., Jr.; Frank, P.D.; Serafini, D.B.; Torczon, V.; Trosset, M.W. A rigorous framework for optimization ofexpensive functions by surrogates. Struct. Optim. 1999, 17, 1–13. [CrossRef]
44. Clarke, F.H. Optimization and Nonsmooth Analysis; SIAM Publications: Philadelphia, PA, USA, 1990.45. Bratley, P.; Fox, B.L. Algorithm 659: Implementing Sobol’s quasirandom sequence generator. ACM Trans. Math. Softw. 1988, 14,
88–100. [CrossRef]46. Lake, L.W. Enhanced Oil Recovery; Prentice Hall: Englewood Cliffs, NJ, USA, 1989; pp. 61–62.47. Chen, D.; Shi, J.-Q.; Durucan, S.; Korre, A. Gas and water relative permeability in different coals: Model match and new insights.
Int. J. Coal Geol. 2014, 122, 37–49. [CrossRef]48. Zhang, Z.; Yan, D.; Yang, S.; Zhuang, X.; Li, G.; Wang, G.; Wang, X. Experimental studies on the movable-water saturations of
different-scale pores and relative permeability of low-medium rank coals from the Southern Junggar Basin. J. Nat. Gas Sci. Eng.2020, 83, 103585. [CrossRef]
49. Almutairi, A.; Le-Hussain, F. Effect of injection rate on oil water relative permeability accounting for capillary pressure and outletend effects. In Proceedings of the International Petroleum Technology Conference, Dhahran, Saudi Arabia, 13–15 June 2020.[CrossRef]
50. Liu, P.; Yuan, Z.; Li, K. An improved capillary pressure model using fractal geometry for coal rock. J. Petrol. Sci. Eng. 2016, 145,473–481. [CrossRef]
51. Zhang, Y.; Yang, D. Simultaneous estimation of relative permeability and capillary pressure for tight formations using ensemble-based history matching method. Comput. Fluids 2013, 71, 446–460. [CrossRef]
52. Richmond, P.C.; Watsons, A.T. Estimation of multiphase flow functions from displacement experiments. SPE Reserv. Eng. 1990, 5,121–127. [CrossRef]
53. Sander, R.; Connell, L.D.; Pan, Z.; Camilleri, M.; Heryanto, D.; Lupton, N. Core flooding experiments of CO2 enhanced coalbedmethane recovery. Int. J. Coal Geol. 2014, 131, 113–125. [CrossRef]
54. Zhou, F.; Hussain, F.; Cinar, Y. Injecting pure N2 and CO2 to coal for enhanced coalbed methane: Experimental observations andnumerical simulation. Int. J. Coal Geol. 2013, 116, 53–62. [CrossRef]
55. Connell, L.D.; Sander, R.; Pan, Z.; Camilleri, M.; Heryanto, D. History matching of enhanced coal bed methane laboratory coreflood tests. Int. J. Coal Geol. 2011, 87, 128–138. [CrossRef]
56. Singh, M.; Mani, V.; Honarpour, M.M. Comparison of viscous and gravity dominated gas-oil relative permeabilities. J. Petrol. Sci.Eng. 2001, 30, 67–81. [CrossRef]
57. Rostami, B.; Kharrat, R.; Ghotbi, C. Gas-oil relative permeability and residual oil saturation as related to displacement instabilityand dimensionless numbers. Oil. Gas. Sci. Technol. 2009, 65, 299–313. [CrossRef]
58. Austin-Adigio, M.; Gates, I.D. Thermal viscous fingering in thermal recovery processes. Energies 2020, 13, 4986. [CrossRef]59. Fayazi, A.; Bagherzadeh, H.; Shahrabadi, A. Estimation of pseudo relative permeability curves for a heterogeneous reservoir with
a new automatic history matching algorithm. J. Petro. Sci. Eng. 2016, 140, 154–163. [CrossRef]60. Sigmund, P.M.; McCaffery, F.G. An improved unsteady-state procedure for determining relative permeability characteristics of
heterogeneous porous media. SPE J. 1979, 19, 15–28. [CrossRef]61. Bentsen, R.G. Conditions under which the capillary term may be neglected. J. Can. Petrol. Tech. 1978, 17. [CrossRef]62. Dabbous, M.K.; Reznik, A.A.; Taber, J.J.; Fulton, P.F. The permeability of coal to gas and water. SPE J. 1974, 14, 563–572. [CrossRef]63. Al Ghamdi, B.N.; Ayala, L.F. Analysis of capillary pressure and relative permeability effects on the productivity of naturally
fractured gas-condensate reservoirs. In Proceedings of the SPE/DGS Saudi Arabia Section Technical Symposium and Exhibition,Al-Khobar, Saudi Arabia, 4–7 April 2010. [CrossRef]