Introduction to low permeability nanocrystalline soft magnetic ...

International Journal of Multiphase Flow 47 (2012) 85–93
Contents lists available at SciVerse ScienceDirect
International Journal of Multiphase Flow
journal homepage: www.elsevier .com/ locate / i jmulflow
Relative permeability for two-phase flow through corrugated tubes as modelporous media
Majid Ahmadlouydarab a, Zhong-Sheng (Simon) Liu b, James J. Feng a,c,⇑a Department of Chemical and Biological Engineering, University of British Columbia, Vancouver, BC, Canada V6T 1Z3b NRC Institute for Fuel Cell Innovation, 4250 Wesbrook Mall, Vancouver, BC, Canada V6T 1W5c Department of Mathematics, University of British Columbia, Vancouver, BC, Canada V6T 1Z2
a r t i c l e i n f o
Article history:Received 1 May 2012Received in revised form 23 June 2012Accepted 11 July 2012Available online 20 July 2012
Keywords:Interfacial flowViscous couplingPore-scale simulationMoving contact lineCahn–Hilliard modelLubrication effect
0301-9322/$ - see front matter � 2012 Elsevier Ltd. Ahttp://dx.doi.org/10.1016/j.ijmultiphaseflow.2012.07.0
⇑ Corresponding author at: Department of ChemicaUniversity of British Columbia, Vancouver, BC, Canad
E-mail address: [email protected] (J.J. Feng).
a b s t r a c t
We report finite-element simulations of gas–liquid two-phase flows through a model porous mediummade of corrugated tubes. By resolving the pore-scale fluid dynamics and interfacial morphology, wecompute the relative permeability of the porous medium by averaging over a pore-size-distribution ofa real porous medium. A constant pressure gradient is applied on both fluids to simulate a pressure-dri-ven creeping flow, and a diffuse-interface model is used to compute the interfacial evolution and the con-tact line motion. We observe a number of flow regimes in the micro-pores, depending on the pore size,imposed pressure gradient, and other geometric and physical parameters. The flow rates vary nonlinearlywith the pressure gradient, and the extended Darcy’s law does not hold in general. The interactionbetween the two phases, known as viscous coupling, is a prominent feature of the process. As a result,the relative permeability depends not only on saturation, but also on the capillary number, viscosity ratio,wettability of the solid wall, pore geometry, and the initial configuration. The effects of these factors areexplored systematically and compared with previous studies.
� 2012 Elsevier Ltd. All rights reserved.
1. Introduction
Conventionally, two-phase flow in porous media is modeled bygeneralizing Darcy’s law into a linear relationship between thevelocity and pressure gradient for each phase:
v i ¼jjr;i
lirpi; ð1Þ
where vi, pi, and li are the velocity, pressure and viscosity of fluid i,i = w or n for the wetting or non-wetting phase. j is the intrinsicpermeability of the porous medium, and jr,i is the relative perme-ability of phase i. This extended Darcy’s law is based on a physicalpicture of each phase flowing as if in a single-phase flow with theother phase serving only to reduce the size of the flow passage(Muskat and Meres, 1936). Fluid–fluid interaction across the inter-face is ignored, and jr,i is taken to be only a function of the averagevolume fraction in the pores, known as the saturation S.
Though appealing for its simplicity, the extended Darcy’s lawhas limited success in representing reality. For one, the two fluidsgenerally do not follow bicontinuous pathways that remain invari-ant (Avraam and Payatakes, 1999). Instead, the interface evolvesdynamically as a result of viscous and capillary forces, and
ll rights reserved.05
l and Biological Engineering,a V6T 1Z3.
undergoes morphological changes such as rupture and coalescenceto produce slugs and bubbles (Ahmadlouydarab et al., 2011). Sec-ond, the hydrodynamic interaction between the two fluids intro-duces viscous coupling (Kalaydjian, 1990), such that the flow ofone phase affects the other by viscous shearing, for example. Final-ly, transient flows, such as occur in water–oil displacement, pro-duce temporal and spatial variations of the interface that cannotbe predicted by the extended Darcy’s law (Avraam and Payatakes,1999). Alternatively, Eq. (1) may be viewed as the definition of therelative permeabilities. Then jr,i must be understood as a conve-nient catchall into which all the complexities of the interfacial fluiddynamics have been lumped. Taking it to be a function of thesaturation S alone is indefensible.
Then it comes as no surprise that measurement of jr, i(S) hasproduced not only large quantitative scatter but sometimes quali-tative contradictions in the literature (Demond and Roberts, 1987).For instance, the assumption of separate, uncoupled single-phaseflow implies jr,n + jr,w 6 1 (Demond and Roberts, 1987). Thisseems to be confirmed by some measurements (e.g. Dana andSkoczylas, 2002) but violated by others (e.g. Avraam and Payatakes,1995a, 1999). Notably, Ehrlich (1993) and Yiotis et al. (2007)reported a jr,n that varies with S non-monotonically, with amaximum above 1 at an intermediate saturation. There are alsolong-running controversies over whether the interfacial tensionand viscosity ratio between the two fluids affect the relativepermeability (Amaefule and Handy, 1982; Demond and Roberts,
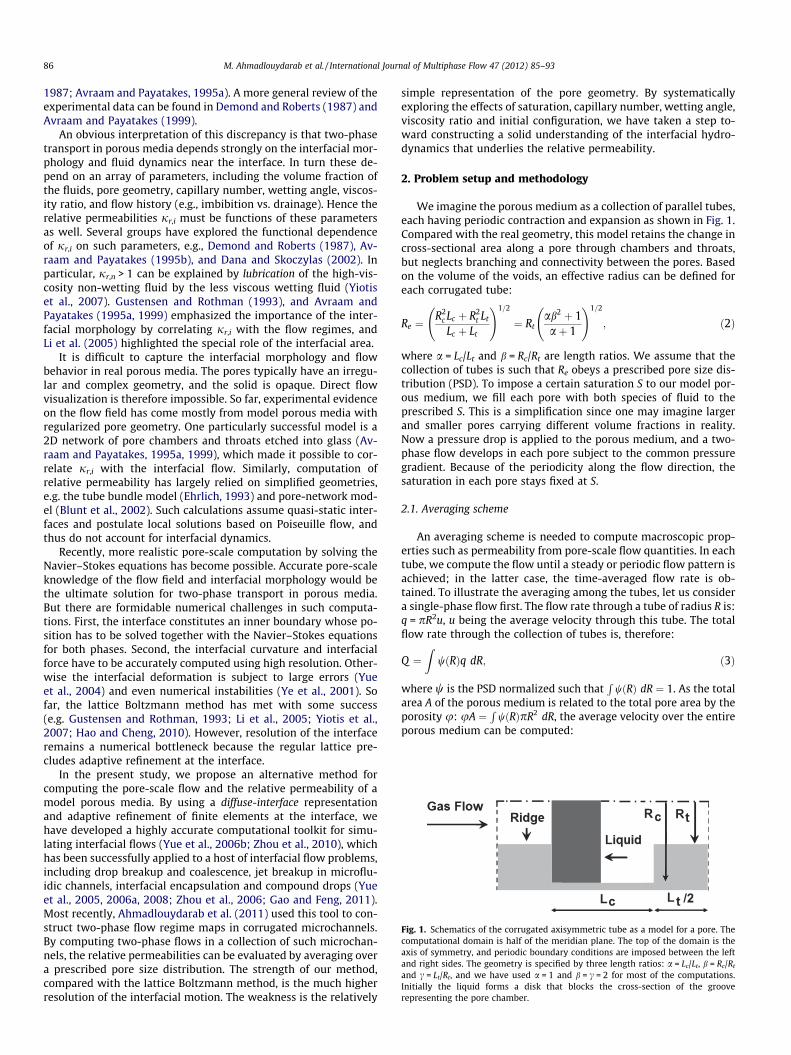
Fig. 1. Schematics of the corrugated axisymmetric tube as a model for a pore. Thecomputational domain is half of the meridian plane. The top of the domain is theaxis of symmetry, and periodic boundary conditions are imposed between the leftand right sides. The geometry is specified by three length ratios: a = Lc/Lt, b = Rc/Rt
and c = Lt/Rt, and we have used a = 1 and b = c = 2 for most of the computations.Initially the liquid forms a disk that blocks the cross-section of the grooverepresenting the pore chamber.
86 M. Ahmadlouydarab et al. / International Journal of Multiphase Flow 47 (2012) 85–93
1987; Avraam and Payatakes, 1995a). A more general review of theexperimental data can be found in Demond and Roberts (1987) andAvraam and Payatakes (1999).
An obvious interpretation of this discrepancy is that two-phasetransport in porous media depends strongly on the interfacial mor-phology and fluid dynamics near the interface. In turn these de-pend on an array of parameters, including the volume fraction ofthe fluids, pore geometry, capillary number, wetting angle, viscos-ity ratio, and flow history (e.g., imbibition vs. drainage). Hence therelative permeabilities jr,i must be functions of these parametersas well. Several groups have explored the functional dependenceof jr,i on such parameters, e.g., Demond and Roberts (1987), Av-raam and Payatakes (1995b), and Dana and Skoczylas (2002). Inparticular, jr,n > 1 can be explained by lubrication of the high-vis-cosity non-wetting fluid by the less viscous wetting fluid (Yiotiset al., 2007). Gustensen and Rothman (1993), and Avraam andPayatakes (1995a, 1999) emphasized the importance of the inter-facial morphology by correlating jr,i with the flow regimes, andLi et al. (2005) highlighted the special role of the interfacial area.
It is difficult to capture the interfacial morphology and flowbehavior in real porous media. The pores typically have an irregu-lar and complex geometry, and the solid is opaque. Direct flowvisualization is therefore impossible. So far, experimental evidenceon the flow field has come mostly from model porous media withregularized pore geometry. One particularly successful model is a2D network of pore chambers and throats etched into glass (Av-raam and Payatakes, 1995a, 1999), which made it possible to cor-relate jr,i with the interfacial flow. Similarly, computation ofrelative permeability has largely relied on simplified geometries,e.g. the tube bundle model (Ehrlich, 1993) and pore-network mod-el (Blunt et al., 2002). Such calculations assume quasi-static inter-faces and postulate local solutions based on Poiseuille flow, andthus do not account for interfacial dynamics.
Recently, more realistic pore-scale computation by solving theNavier–Stokes equations has become possible. Accurate pore-scaleknowledge of the flow field and interfacial morphology would bethe ultimate solution for two-phase transport in porous media.But there are formidable numerical challenges in such computa-tions. First, the interface constitutes an inner boundary whose po-sition has to be solved together with the Navier–Stokes equationsfor both phases. Second, the interfacial curvature and interfacialforce have to be accurately computed using high resolution. Other-wise the interfacial deformation is subject to large errors (Yueet al., 2004) and even numerical instabilities (Ye et al., 2001). Sofar, the lattice Boltzmann method has met with some success(e.g. Gustensen and Rothman, 1993; Li et al., 2005; Yiotis et al.,2007; Hao and Cheng, 2010). However, resolution of the interfaceremains a numerical bottleneck because the regular lattice pre-cludes adaptive refinement at the interface.
In the present study, we propose an alternative method forcomputing the pore-scale flow and the relative permeability of amodel porous media. By using a diffuse-interface representationand adaptive refinement of finite elements at the interface, wehave developed a highly accurate computational toolkit for simu-lating interfacial flows (Yue et al., 2006b; Zhou et al., 2010), whichhas been successfully applied to a host of interfacial flow problems,including drop breakup and coalescence, jet breakup in microflu-idic channels, interfacial encapsulation and compound drops (Yueet al., 2005, 2006a, 2008; Zhou et al., 2006; Gao and Feng, 2011).Most recently, Ahmadlouydarab et al. (2011) used this tool to con-struct two-phase flow regime maps in corrugated microchannels.By computing two-phase flows in a collection of such microchan-nels, the relative permeabilities can be evaluated by averaging overa prescribed pore size distribution. The strength of our method,compared with the lattice Boltzmann method, is the much higherresolution of the interfacial motion. The weakness is the relatively
simple representation of the pore geometry. By systematicallyexploring the effects of saturation, capillary number, wetting angle,viscosity ratio and initial configuration, we have taken a step to-ward constructing a solid understanding of the interfacial hydro-dynamics that underlies the relative permeability.
2. Problem setup and methodology
We imagine the porous medium as a collection of parallel tubes,each having periodic contraction and expansion as shown in Fig. 1.Compared with the real geometry, this model retains the change incross-sectional area along a pore through chambers and throats,but neglects branching and connectivity between the pores. Basedon the volume of the voids, an effective radius can be defined foreach corrugated tube:
Re ¼R2
c Lc þ R2t Lt
Lc þ Lt
!1=2
¼ Rtab2 þ 1aþ 1
!1=2
; ð2Þ
where a = Lc/Lt and b = Rc/Rt are length ratios. We assume that thecollection of tubes is such that Re obeys a prescribed pore size dis-tribution (PSD). To impose a certain saturation S to our model por-ous medium, we fill each pore with both species of fluid to theprescribed S. This is a simplification since one may imagine largerand smaller pores carrying different volume fractions in reality.Now a pressure drop is applied to the porous medium, and a two-phase flow develops in each pore subject to the common pressuregradient. Because of the periodicity along the flow direction, thesaturation in each pore stays fixed at S.
2.1. Averaging scheme
An averaging scheme is needed to compute macroscopic prop-erties such as permeability from pore-scale flow quantities. In eachtube, we compute the flow until a steady or periodic flow pattern isachieved; in the latter case, the time-averaged flow rate is ob-tained. To illustrate the averaging among the tubes, let us considera single-phase flow first. The flow rate through a tube of radius R is:q = pR2u, u being the average velocity through this tube. The totalflow rate through the collection of tubes is, therefore:
Q ¼Z
wðRÞq dR; ð3Þ
where w is the PSD normalized such thatR
wðRÞ dR ¼ 1. As the totalarea A of the porous medium is related to the total pore area by theporosity u: uA ¼
RwðRÞpR2 dR, the average velocity over the entire
porous medium can be computed:

M. Ahmadlouydarab et al. / International Journal of Multiphase Flow 47 (2012) 85–93 87
v ¼ QA¼ u
RwðRÞR2u dRRwðRÞR2 dR
: ð4Þ
Now the intrinsic permeability of the model porous medium can becomputed from v and the imposed pressure gradient: j = lv/jrpj,lbeing the viscosity.
The same averaging scheme can be repeated for a two-phaseflow simulation to yield the effective permeabilities for each phase.The ratio between the effective permeability and the intrinsic per-meability gives the relative permeability for each phase. The poros-ity u will cancel out and will not affect the relative permeability.But it does enter the average velocity for each phase and the cap-illary numbers. In all results to be presented, we have used the PSDof Fig. 2 for a gas diffusion layer (Toray TGP-H-060) of hydrogenfuel cells (Koido et al., 2008). The porosity for this porous medium,u = 0.8, is used throughout the paper. Note that this value is largerthan typical porosity in natural sandstones, and is specific to theengineered gas diffusion layer. The integrals in Eq. (4) are com-puted by summing over increments of the pore size; 25 pore sizesare computed in the range of 5.35–25 lm, corresponding to themeasured data points in Fig. 2.
2.2. Governing equations and numerical method
To solve the two-phase flow in the periodic axisymmetric do-main of Fig. 1, we use a diffuse-interface formulation that accom-modates evolving interfaces and moving contact lines in anenergy-based framework. Various aspects of the theoretical modeland numerical algorithms have been described at length elsewhere(Feng et al., 2005; Yue et al., 2006b; Zhou et al., 2010), and the cur-rent computations follow closely our recent study of two-phaseflow regimes in corrugated microchannels (Ahmadlouydarabet al., 2011). Therefore, we will only list the governing equationsbelow and briefly mention a few features of the numerical method.
A phase-field variable / is introduced such that / = 1 in onefluid and / = �1 in the other. The two-phase flow in the pore is de-scribed by the Navier–Stokes and Cahn–Hilliard equations:
r � u ¼ 0; ð5Þrp ¼ r � ½lðruþruTÞ� þ Gr/þ B; ð6Þ@/@tþ u � r/ ¼ mr2G; ð7Þ
where m is the Cahn–Hilliard mobility, G is the chemical potentialand Gr/ is the diffuse-interface representation of the interfacial
Fig. 2. Pore size distribution (PSD) of a model porous medium. The distributionfunction w(R) is converted from the data of Koido et al. (2008) on pore volumedistribution.
tension. B is a constant body force acting on both phases that rep-resents the pressure gradient imposed over each periodic lengthof the pore: B = Dp/(Lc + Lt). The effective viscosity l is defined asan average between that of the fluids weighted by the volume frac-tions (1 ± /)/2. For typical flow in microscopic pores, the Reynoldsand Bond numbers are much below unity (Zhang et al., 2006; Koidoet al., 2008), and we have neglected inertia and gravity. The flow isthus governed by the external pressure gradient along with capil-lary and viscous forces.
The initial condition typically has the liquid and gas at rest inthe domain of Fig. 1 with the desired saturation S and a certain ini-tial configuration for the interface. Under the constant drivingforce B, both components start to flow and eventually a steady,time-periodic or quasi-periodic flow pattern establishes itself. Peri-odic boundary conditions are imposed between the left and rightends of the computational domain, and symmetry conditions onthe top of the domain. On the solid substrate, no-slip conditionsare used for velocity, and contact line motion is implemented viaCahn–Hilliard diffusion (Yue et al., 2010). The contact angle isintroduced via surface energies between each fluid and the solid(Yue et al., 2010; Yue and Feng, 2011).
The dimensionless parameters of the problem include an effec-tive Bond number F = B L2/r, which indicates the ratio between thedriving force and the surface tension, the saturation S, non-wettingto wetting phase viscosity ratio M = ln/lw, contact angle h, and thelength ratios a, b and c. The length scale L will be specified below. Acapillary number Ca can be defined for each phase using its averagevelocity (Eq. (4)): Cai = livi/r. But this will be an outcome of thesimulation, not a control parameter. The results consist mainly ofthe relative permeabilities as functions of these parameters.
The governing equations are solved using finite elements on anunstructured triangular grid. The grids near the fluid interface areadaptively refined and coarsened as the interface moves. An impli-cit time-marching scheme is used, with Newton iterations at eachtime step. The algorithm has been validated previously using dropmotion problems as benchmarks (Yue et al., 2006b; Zhou et al.,2010). For the specific setup here, (Ahmadlouydarab et al., 2011)have done mesh-refinement tests to ensure that the numerical re-sults have converged with the grid size.
3. Results and discussions
We have chosen a problem setup with a set of baseline param-eters: a = 1,b = 2 and c = 2, wetting angle h = 135�, and viscosity ra-tio M = 18. The h and M values correspond to typical operatingconditions in the gas diffusion layer (GDL) of PEM fuel cells, withwater and air at 80 �C. The solid wall is hydrophobic; water isthe non-wetting phase while air is the wetting phase. For conve-nience, we will refer to the non-wetting phase as water or liquid,and to the wetting phase as air or gas. The conclusions drawn, ofcourse, will be general and not restricted to this specific pair of flu-ids. In the following, S or ‘‘saturation’’ refers to that of the liquid, i.e.non-wetting, phase. Initially a liquid bridge of thickness Lc/2 oc-cludes the pore chambers entirely (Fig. 1). This initial setup givesa liquid saturation S = 40%, which will remain fixed throughouteach computation. In the subsections to follow, we will vary oneof the parameters to examine its effects while keeping the otherparameters at their baseline values.
Since our porous medium consists of tubes of different sizes,and the same effective body force B is applied to all of them, theflow regime varies among the tubes. This is conveniently indicatedby a local Bond number FR ¼ BR2
e=r defined for each tube. A num-ber of flow regimes have been observed with increasing FR: block-age, gas flow, liquid flow, bubble-slug, shell, annular and drop flow.Three of these are illustrated in Fig. 3. Note that the flow regimes

(a)
(b)
(c)
Fig. 3. Temporal development of three flow regimes for the baseline parameter values: length ratios a = 1,b = 2,c = 2; liquid–gas viscosity ratio M = 18, liquid saturationS = 40% and wetting angle h = 135�. Time is scaled by ln Re/r. (a) Blockage at FR = 0.38, when the imposed pressure fails to dislodge the liquid bridge pinned at the corner of thepore chamber; (b) liquid flow regime at FR = 0.56, with the gas entirely trapped in the pore chamber; (c) drop flow regime at FR = 1.4, with large liquid drops being surroundedand conveyed by a continuous gas phase.
88 M. Ahmadlouydarab et al. / International Journal of Multiphase Flow 47 (2012) 85–93
are sensitive to the pore geometry and initial configuration (seeSection 3.5). A more detailed description of the regimes and thetemporal evolution of the interfacial morphology can be found inour previous study (Ahmadlouydarab et al., 2011).
Once we have detailed flow data, we compute the relative per-meability jr,n and jr,w from Eq. (1) by averaging over the PSD of amodel GDL (Fig. 2). In this context, it is necessary to have an overallBond number F = BL2/r, in which the characteristic length is chosento be L = 18.25 lm, the effective pore radius corresponding to themaximum of the PSD of Fig. 2, that is, the effective radius of themost common pore size. Now the relative permeabilities shouldbe complex functions of the flow parameters (Avraam and Paya-takes, 1995b):
jr;i ¼ jr;iðS;Can;Caw;M; hÞ: ð8Þ
In addition, jr,i may depend on the geometrical parameters, initialconfiguration and flow history. In our setup, the key control param-eter is actually the driving force F; the capillary numbers for theflow Cai come out as a result. We list Cai instead of F in keeping withthe conventional protocol in the literature.
3.1. Capillary number effect
The premise for Darcy’s law is the linearity between the flowrate and the imposed pressure drop. In single-phase, inertialessflow this holds. A fluid interface that deforms according to viscousand capillary forces introduces a geometric nonlinearity into the
Fig. 4. Dependence of the liquid and gas capillary numbers on the driving force F.All other parameters are at the baseline values given in Fig. 3.
problem, and it is important to see if this compromises the linear-ity underlying the extended Darcy’s law. We vary the imposedbody force B and compute the average velocity of each phase anda capillary number: Cai = livi/r. Fig. 4 plots the liquid and gas cap-illary numbers as functions of F.
For both phases, the variation of Ca with F is decidedly nonlin-ear. For F < 0.29, the blockage regime prevails even in the largestpores, with neither phase moving (cf. Fig. 3a). With increasing F,capillary breakthrough takes place first in the largest pores (Djilali,2007). This causes a transition to the liquid flow regime (Fig. 3b),and produces a positive Can for the non-wetting liquid phase. Thegas is still trapped in the pore chambers by the liquid at this stage.Gas flow starts around F = 0.84, when the liquid core breaks up intodrops, liberating the gas pocket in the largest pores and causing atransition to the drop flow regime (Fig. 3c). Increasing F furtheractivates gas flow in smaller pores, and causes Caw to rise sharply.For even larger F, the drop flow regime prevails in most pores; fur-ther increase in F reduces the size of the liquid drops but producesno new flow regimes. Since the gas is much less viscous than theliquid, Caw increases more steeply with F than Can. Based on theabove, it is obvious that the evolution of interfacial morphologymakes the overall flow nonlinear in the porous medium.
It is interesting to compare our result with the lattice-Boltz-mann computations of Gustensen and Rothman (1993). First, theyhave also observed a blockage regime at weak forcing and a subse-quent breakthrough. However, they adopted a smoothed geometrywith no interfacial pinning, and started from a core-annular initialmorphology with the non-wetting fluid enveloped by the wettingone (see their Fig. 10). In their setup, therefore, it is the non-wettingspecies that is blocked at weak forcing. This comparison helps toillustrate the important role of the pore geometry and the initialconfiguration, which will be examined at greater length in Section3.5. Furthermore, they have recognized that the evolving interfa-cial morphology produces a nonlinear Ca � F relationship, in qual-itative agreement with our simulation. Finally, in the limit ofstrong forcing, they predicted drop flow for S = 10% and annularflow for S = 30%. These regimes have been seen in our simulationsas well (see phase diagram in Ahmadlouydarab et al. (2011)).Interestingly, (Gustensen and Rothman, 1993) observed that theCa � F relationship becomes more or less linear in this limit, sincethe two phases are flowing roughly in stratified layers with lesscoupling. This can also be said of our drop flow regime of Fig. 3c.Therefore, a fast linear regime may exist in our Fig. 4 as well,though our data do not range to sufficiently large F values to pro-vide clear evidence.

Fig. 6. Relative permeabilities as functions of the liquid (non-wetting) saturation S.F = 1.4 and all other parameters are at their baseline values given for Fig. 3.
M. Ahmadlouydarab et al. / International Journal of Multiphase Flow 47 (2012) 85–93 89
The same nonlinearity can be illustrated by plotting the relativepermeability of each phase as a function of their respective capil-lary number (Fig. 5). As expected, jr,i is not a constant; it variesappreciably with the flow. This is particularly true for the wettingphase. The nearly linear rise of jr,w with Caw mirrors the sharp up-turn in Fig. 4; in the drop flow regime the gas transport increasesmore rapidly with increasing driving force than the liquid trans-port. For the non-wetting liquid phase, the initial rise of jr,n withCan is due to the progressive formation of a liquid core lubricatedby a gas pocket in the pore chamber, similar to Fig. 3c. For higherCan, jr,n saturates because even in the smaller pores, the liquid be-comes fully insulated from the solid wall by a gas cushion, andlubrication cannot be further enhanced. That jr,n is nearly flat forCan > 0.04 is consistent with the near linearity of Fig. 4a for largerCan, and can be likened to the fast linear flow regime of Gustensenand Rothman (1993) mentioned above.
3.2. Saturation effect
To study the effect of the saturation level on the relative perme-ability, we use the same baseline geometry as illustrated in Fig. 1.By varying the initial thickness of the liquid bridge, we have com-puted liquid saturation S ranging from 10% to 80%. Fig. 6 plots jr,i
as functions of S. Note that in our setup, the liquid is the non-wet-ting phase.
In straight pores, it is intuitive to think that increasing the liquidsaturation will increase the liquid-phase permeability and de-crease the gas-phase permeability. In our geometry with porethroats and chambers, this intuition is mostly valid for the gasphase but not for the liquid. This can be understood from the flow
(a)
(b)
Fig. 5. Variation of the relative permeability of (a) the wetting (gas) phase and (b)the non-wetting (liquid) phase with the respective capillary number. All otherparameters are at the baseline values given for Fig. 3.
regimes appearing in pores of different sizes at different satura-tions. We refer the reader to our earlier paper (Ahmadlouydarabet al., 2011) for images of the various flow morphologies cited be-low. At low saturation levels S < 20%, the drop flow regime prevailsin almost all pores. Thus, increasing S leads to larger drops thatflow in the central part of the pore, being lubricated by a gas layerthat separates the drops from the solid walls. As a result, the liquidpermeability jr,n increases and the gas permeability jr,w decreaseswith S. In this range, the behavior is consistent with convention inthe literature (Demond and Roberts, 1987). Beyond S = 20%, the li-quid drops become larger and start to come into contact with thesolid walls, especially in the smaller pores. This significantly sup-presses the lubrication effect. Some of the liquid may even beentrapped in the pore chamber and excluded from the liquidthroughput altogether. The dominant flow regime becomes bub-ble-slug flow. Consequently, jr,n declines with S. Meanwhile, inthe smallest pores the gas starts to be entrapped in the pore cham-bers by liquid. Thus jr,w continues its decline. For S > 40%, gas fluxis maintained only in the largest pores, in the form of gas bubblescarried by a continuous liquid stream. In this stage, the liquid per-meability levels off and becomes insensitive to S. Finally, as S ? 1,the gas bubbles shrink and eventually disappear; jr,n climbs backto unity.
The distinctive features of jr,i seen in our simulations are clo-sely related to the geometry of our model porous medium. Theinterfacial morphology and flow regimes have much to do withinterface pinning at sharp corners and with initial layout of theinterface. Such detailed characteristics have not been recorded inprior experiments and computations. It is therefore particularlyinteresting to compare our results with prior studies. There is awealth of experimental and numerical data in the literature onjr,i as functions of S, as the saturation is the parameter most thor-oughly studied. Unfortunately, there are great variations in the val-ues of other parameters, which make quantitative comparison verydifficult. We have collected in Fig. 7 what appear to be reliable andrepresentative data sets for a comparison with our numericalresults.
All studies have produced a jr,w in close agreement with oneanother. In general, the gas permeability jr,w decreases with S,which in our convention denotes the saturation of the liquid,non-wetting phase. This robust trend can be attributed to the grad-ual narrowing of flow areas available to the gas with increasing S.Our jr,w being relatively low may be because in our geometry, thegas tends to be trapped in the pore chamber in certain flowregimes.
For jr,n, there are much greater variations in the data. Previousresults seem to segregate into two groups: the tube-bundle

(a)
(b)
Fig. 7. Comparison of the relative permeabilities jr,i(S) with previous studies. (a)jr,w of the wetting phase; (b) jr,n of the non-wetting phase. Open symbols denotecomputational results while closed ones experimental results. For our result, thebody force F = 1.4 and the other parameters are the same as in Fig. 3.
Fig. 8. Relative permeabilities as functions of the liquid wetting angle h on the solidsurface. F = 1.4, and the other parameters are at the baseline values of Fig. 3. Thewetting and non-wetting phases refer respectively to the gas and liquid, regardlessof the h value. The insets show dominant flow patterns among the pores responsiblefor the overall jr,i.
90 M. Ahmadlouydarab et al. / International Journal of Multiphase Flow 47 (2012) 85–93
(Ehrlich, 1993) and pore-network models (Yiotis et al., 2007) pre-dict a higher jr,n that exceeds unity, while lattice-Boltzmann com-putations in random porous media (Li et al., 2005; Koido et al.,2008) and experiments (Amaefule and Handy, 1982; Avraam andPayatakes, 1995a) give a much lower jr,n that increases monoton-ically with S. Our prediction falls into the first group for smaller S,and then crosses over to the second for larger S. In the first group,the larger jr,n is clearly due to lubrication. In relatively simplegeometries, stratification of the two phases occurs more consis-tently than in tortuous and random flow conduits. Besides, thelubrication effect is accentuated by a high non-wetting-to-wettingviscosity ratio M, which happens to be the case in the first group ofstudies (M � 10 compared with M � 1 for the second group). Theseconspire to produce the higher jr,n. With increasing S, the watertends to touch the solid wall at the pore throat as mentionedabove. This hampers lubrication and causes our jr,n to decreaseand join the second group of curves. In general, one can summarizethe jr,n data as follows. The non-wetting phase typically staysaway from the solid walls, and its interfacial morphology is moresensitive to material and flow parameters than for the wettingphase. Hence, its relative permeability exhibits greater variationamong different studies.
3.3. Wettability effect
Wettability of the pores is an important determinant of the rel-ative permeabilities. This property affects the interfacial morphol-ogy and, if a three-phase contact line appears, how fast the contactline moves on the walls. To examine this effect in our pore-scalecalculations, we have used the same baseline setup (Fig. 1) andtested four values of the contact angle h from 60� to 165�. Fig. 8 de-picts the variation of jr,i with h. The main finding is that by makingthe pores more hydrophobic, with increasing h, both relative
permeabilities tend to decrease up to h = 135�. With further in-crease in h, the liquid relative permeability jr,n increases while thatfor gas jr,w stays near zero. Note that for h 6 90�, the liquid be-comes the wetting phase. For simplicity, however, we have notswitched the subscript in Fig. 8; jr,n refers to the liquid and jr,w
to the gas regardless of h.If the solid is hydrophilic (h < 90�), the smaller pores are blocked
by a liquid meniscus, but the dominant flow regime in larger poresis the liquid drop regime depicted by insets in the figure. Some li-quid is retained in the pore chamber, while the rest is carried bythe gas as large drops in the center of the pore. The liquid phaseenjoys a large jr,n because of this lubrication effect. Its decline fromh = 60� to 135� has to do with the narrow pore throat in our geom-etry. With increasing h, more liquid is initially driven out of thepore chamber. It then makes contact with the wall in the throatand thus suppresses lubrication by the underlying gas. As a result,jr,n decreases. While hydrophobicity rejects the liquid from thenear-wall regions, the gas is increasingly pushed into the porechambers. As a result, the gas permeability jr,w continues to de-cline. At h = 135�, the liquid tends to seal the gas completely inthe chamber for smaller pores (lower inset) or to form liquid slugsseparated by thin gas films in the larger pores (upper inset). Thegas permeability approaches zero. At even higher h, the liquid–so-lid contact becomes so energetically prohibitive that the liquidstarts to detach from the wall, allowing a gas film to wedge in be-tween. In the end, the shell flow regime prevails in most of thepores, as illustrated by the inset for h = 165�, with a liquid coreenveloped by a thin gas sheath. This leads to the observed recoveryof jr,n, again thanks to the lubrication effect.
Fig. 9 compares our prediction of the wettability effect with sev-eral lattice-Boltzmann computations. We have found no clear-cutexperimental results; those that changed h by using differentmaterials typically had other parameters changed as well. Amongthe lattice-Boltzmann computations, the geometry ranges fromrelatively regular (pore-network) to highly random. The physicalparameters differ widely as well. For jr,w, the qualitative trend isthe same for all studies: jr,w decreases with h. Note, however, thatthe prior computations are limited to relatively large h, where thedecrease of jr,w with h is mild. Our computation includes smaller hwhere the effect is stronger. The difference in the numerical valuesamong different studies has probably stemmed from the differentphysical and geometric parameters.
(a)
(b)
Fig. 9. Effect of the contact angle h on the relative permeabilities jr,w (a) and jr,n
(b): comparison with lattice-Boltzmann computations in the literature.
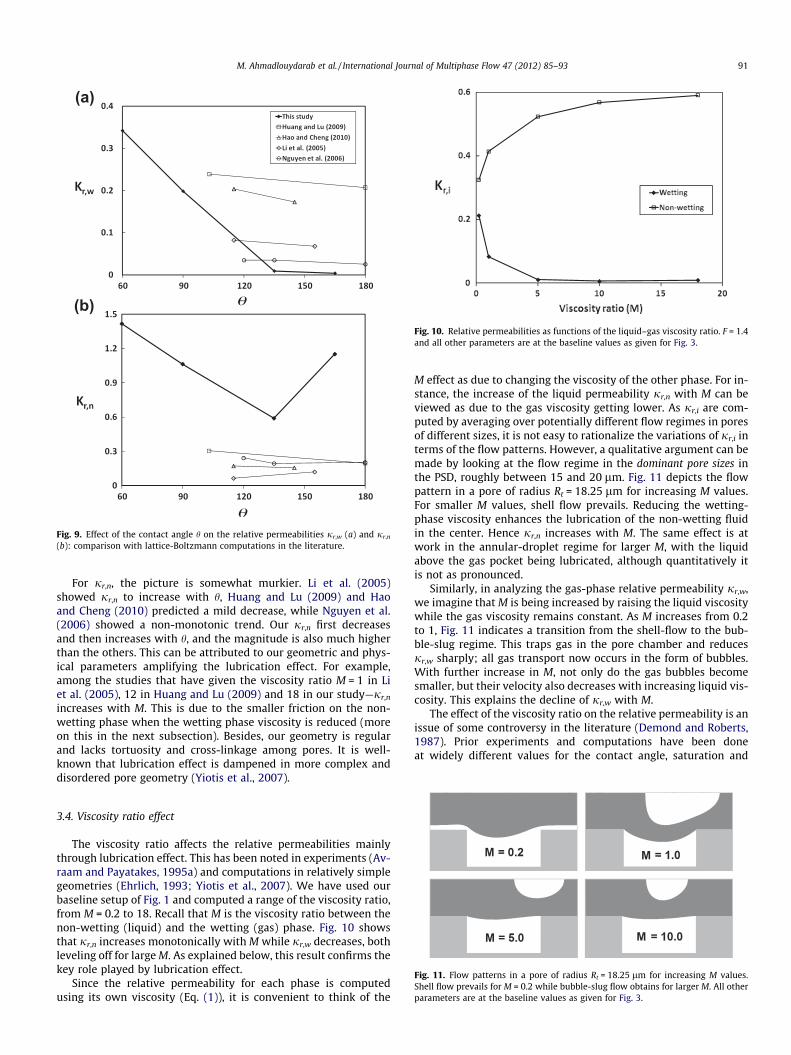
Fig. 10. Relative permeabilities as functions of the liquid–gas viscosity ratio. F = 1.4and all other parameters are at the baseline values as given for Fig. 3.
M. Ahmadlouydarab et al. / International Journal of Multiphase Flow 47 (2012) 85–93 91
For jr,n, the picture is somewhat murkier. Li et al. (2005)showed jr,n to increase with h, Huang and Lu (2009) and Haoand Cheng (2010) predicted a mild decrease, while Nguyen et al.(2006) showed a non-monotonic trend. Our jr,n first decreasesand then increases with h, and the magnitude is also much higherthan the others. This can be attributed to our geometric and phys-ical parameters amplifying the lubrication effect. For example,among the studies that have given the viscosity ratio M = 1 in Liet al. (2005), 12 in Huang and Lu (2009) and 18 in our study—jr,n
increases with M. This is due to the smaller friction on the non-wetting phase when the wetting phase viscosity is reduced (moreon this in the next subsection). Besides, our geometry is regularand lacks tortuosity and cross-linkage among pores. It is well-known that lubrication effect is dampened in more complex anddisordered pore geometry (Yiotis et al., 2007).
Fig. 11. Flow patterns in a pore of radius Rt = 18.25 lm for increasing M values.Shell flow prevails for M = 0.2 while bubble-slug flow obtains for larger M. All otherparameters are at the baseline values as given for Fig. 3.
3.4. Viscosity ratio effect
The viscosity ratio affects the relative permeabilities mainlythrough lubrication effect. This has been noted in experiments (Av-raam and Payatakes, 1995a) and computations in relatively simplegeometries (Ehrlich, 1993; Yiotis et al., 2007). We have used ourbaseline setup of Fig. 1 and computed a range of the viscosity ratio,from M = 0.2 to 18. Recall that M is the viscosity ratio between thenon-wetting (liquid) and the wetting (gas) phase. Fig. 10 showsthat jr,n increases monotonically with M while jr,w decreases, bothleveling off for large M. As explained below, this result confirms thekey role played by lubrication effect.
Since the relative permeability for each phase is computedusing its own viscosity (Eq. (1)), it is convenient to think of the
M effect as due to changing the viscosity of the other phase. For in-stance, the increase of the liquid permeability jr,n with M can beviewed as due to the gas viscosity getting lower. As jr,i are com-puted by averaging over potentially different flow regimes in poresof different sizes, it is not easy to rationalize the variations of jr,i interms of the flow patterns. However, a qualitative argument can bemade by looking at the flow regime in the dominant pore sizes inthe PSD, roughly between 15 and 20 lm. Fig. 11 depicts the flowpattern in a pore of radius Rt = 18.25 lm for increasing M values.For smaller M values, shell flow prevails. Reducing the wetting-phase viscosity enhances the lubrication of the non-wetting fluidin the center. Hence jr,n increases with M. The same effect is atwork in the annular-droplet regime for larger M, with the liquidabove the gas pocket being lubricated, although quantitatively itis not as pronounced.
Similarly, in analyzing the gas-phase relative permeability jr,w,we imagine that M is being increased by raising the liquid viscositywhile the gas viscosity remains constant. As M increases from 0.2to 1, Fig. 11 indicates a transition from the shell-flow to the bub-ble-slug regime. This traps gas in the pore chamber and reducesjr,w sharply; all gas transport now occurs in the form of bubbles.With further increase in M, not only do the gas bubbles becomesmaller, but their velocity also decreases with increasing liquid vis-cosity. This explains the decline of jr,w with M.
The effect of the viscosity ratio on the relative permeability is anissue of some controversy in the literature (Demond and Roberts,1987). Prior experiments and computations have been doneat widely different values for the contact angle, saturation and

(a)
(b)
Fig. 12. Comparison of (a) jr,w and (b) jr,n as functions of the viscosity ratio M withprevious studies. Open symbols denote computations and filled ones experiments.
92 M. Ahmadlouydarab et al. / International Journal of Multiphase Flow 47 (2012) 85–93
capillary number. Nevertheless, we have compiled some data inFig. 12 for a qualitative comparison. All computations, includingours, show a common trend that jr,w decreases with M while jr,n
increases. This is mostly due to lubrication, although the effectshould be tempered in real porous medium by the disordered nat-ure of pore geometry (Yiotis et al., 2007). The two experiments donot agree with the computational trend. Amaefule and Handy(1982) showed both jr,i to decrease with M while Avraam and
(a)
(b)
(c)
Fig. 13. Effect of pore geometry and initial interfacial configuration. (a) Pore with sharpPore with rounded corners and the liquid bridge initially at the upstream end of the pdownstream end of the pore chamber. The parameters are the same for all three cases:M = 18.
Payatakes (1995a) showed both to increase with M. We do nothave an explanation for this discrepancy. Clearly more computa-tional and experimental data are needed for a coherent picture toemerge.
3.5. Effects of pore geometry and initial configuration
Aside from the factors considered so far, Ahmadlouydarab et al.(2011) have demonstrated that the interface morphology and flowregimes are also sensitive to the pore geometry and the initial con-figuration. For one, sharp corners tend to pin interfaces. This givesrise to very strong hysteresis in flow regimes, i.e. dependence oninitial condition and flow history. Consequently, the relative per-meability is expected to depend on these as well (Avraam andPayatakes, 1995a). Ahmadlouydarab et al. (2011) have examinedthese effects in considerable detail by varying the initial configura-tions and approaching a given flow condition by ramping up ordown the flow rate. In the following we will briefly explore theirramifications for the relative permeabilities.
Fig. 13 compares flow in micro-pores with sharp and roundedcorners (a and b), and in the latter case, two different initial posi-tions for the liquid bridge (b and c). In Fig. 13a, interface pinningat the two sharp corners slows down the movement of the liquidcore and allows time for all the liquid to be drawn out of the porechamber. In the end the liquid flow regime emerges, with the gascompleted trapped in the pore chamber. In comparison, the flowdevelops much more rapidly with the rounded corners (Fig. 13b),leading to the drop flow regime. To evaluate jr,i for pores withsharp and rounded corners, we again average the flow of bothphases over the PSD of Fig. 2. Obviously other flow regimes will ap-pear in pores of larger and smaller sizes than that of Fig. 13, but thegeneral trend seems to hold: sharp corners pin interfaces and gen-erally tend to reduce both jr,i relative to the rounded geometry. Forthe geometric and flow parameters tested, the sharp-corneredpores give jr,w = 0.023 and jr,n = 0.42, while the round-corneredones have jr,w = 0.069 and jr,n = 1.34. In the latter, the large rela-tive permeability for the liquid phase is thanks to the lubricationof the liquid drops by the gas in the larger pores (Fig. 13b).
If the liquid bridge is initially next to the downstream end of thepore chamber (Fig. 13c), it wraps around the solid ridge and forms
corners and the liquid bridge initially at the upstream end of the pore chamber. (b)ore chamber. (c) Pore with rounded corners and the liquid bridge initially at theeffective pore radius Re = 20 lm, a = 1, b = 3, c = 2, S = 40.5%, FR = 1.4, h = 135�, and
M. Ahmadlouydarab et al. / International Journal of Multiphase Flow 47 (2012) 85–93 93
a continuous liquid film sealing some gas in the chamber. Mean-while gas bubbles are transported in the middle in this bubble-slugregime. The difference between Fig. 13b and c is a special case ofthe hysteretic effect, where flow history affects the interfacial pat-tern that emerges eventually (Ahmadlouydarab et al., 2011). Afteraveraging over the PSD, we obtain jr,w = 0.013 and jr,n = 0.53, com-parable to the sharp-cornered geometry and much below those ofFig. 13b. As in Fig. 13a, the liquid flow is hindered by wall frictionand much of the gas is trapped. The lack of lubrication effect is thekey factor in the lower jr,i.
4. Conclusion
In this work we use pore-scale flow simulations to compute therelative permeability of a model porous medium and test the valid-ity of the so-called extended Darcy’s law for gas–liquid two-phaseflow. The main conclusions can be summarized as follows:
(a) The averaged gas and liquid flow rates both depend nonlin-early on the imposed pressure gradient. Thus the extendedDarcy’s law does not hold in the usual sense. Instead, itcan be viewed as the definition of the relative permeabilities,which are complex functions of the geometric and flowparameters of the system.
(b) The relative permeability of the wetting phase jr,w behavesmore or less as expected from previous studies. It increaseswith the wetting-phase capillary number and the wetting-phase saturation, but decreases with the wettability of the poresurface and with the non-wetting-to-wetting viscosity ratio.
(c) The relative permeability of the non-wetting phase jr,n has amuch more complex behavior. It increases monotonicallywith the viscosity ratio, but exhibits non-monotonic depen-dence on the saturation and wetting angle. This is becausethe non-wetting phase tends to occupy the central part ofthe pore, and jr,n is much more sensitive to the interface mor-phology than jr,w. In particular, lubrication of the non-wet-ting phase by a cushion of the wetting phase is responsiblefor elevated jr,n, and loss of lubrication, e.g. when the non-wetting phase makes contact with the wall, leads to lowerjr,n.
The strength of our work lies in the pore-scale resolution of theinterfacial shape and its temporal evolution, as well as contact-linemotion on the solid walls of the pore. Thus, the relative permeabil-ities can be directly related to the flow regimes and interfacial evo-lution in the two-phase flow. The role of interface pinning at sharpcorners is highlighted, which leads to a dependence on flow his-tory. The shortcoming of this work is the simplicity of its poregeometry. Periodic contraction (pore throat) and expansion (porechamber) are accounted for, but connectivity among pores is ne-glected, as is the disordered nature of pore geometry in real porousmedia. This may have magnified the lubrication effect.
Comparisons with experimental and computational results inthe literature show qualitative agreement in cases where a consis-tent trend exists. In other cases, previous papers have presentedconflicting data. Our study adds more data to this situation, butcannot resolve the existing discrepancies. More studies under care-fully controlled conditions are needed in the future.
Acknowledgment
This work was supported by an NSERC Strategic Project Grant.We thank G.H. (Bud) Homsy of UBC and John Shen of Palcan FuelCell Co. Ltd. for helpful discussions. JJF also acknowledges partialsupport from the Canada Research Chair program, NSERC’s Discov-ery Program and the Canada Foundation for Innovation.
References
Ahmadlouydarab, M., Liu, Z.S., Feng, J.J., 2011. Interfacial flows in corrugatedmicrochannels: flow regims, transitions and hysteresis. Int. J. Multiphase Flow37, 1266–1276.
Amaefule, J.O., Handy, L.L., 1982. The effect of interfacial tensions on relative oil/water permeabilities of consolidated porous media. Soc. Pet. Eng. J. 22, 371–381.
Avraam, D.G., Payatakes, A.C., 1995a. Flow regimes and relative permeabilitiesduring steady-state two-phase flow in porous media. J. Fluid Mech. 293, 207–236.
Avraam, D.G., Payatakes, A.C., 1995b. Generalized relative permeability coefficientsduring steady-state two-phase flow in porous media, and correlation with theflow mechanisms. Trans. Porous Media 20, 135–168.
Avraam, D.G., Payatakes, A.C., 1999. Flow mechanics, relative permeabilities, andcoupling effects in steady-state two-phase flow through porous media, the caseof strong wettability. Ind. Eng. Chem. Res. 38, 778–786.
Blunt, M.J., Jackson, M.D., Piri, M., Valvatne, P.H., 2002. Detailed physics, predictivecapabilities and macroscopic consequences for pore-network models ofmultiphase flow. Adv. Water Resour. 25, 1069–1089.
Dana, E., Skoczylas, F., 2002. Experimental study of two-phase flow in threesandstones. I measuring relative permeabilities during two-phase steady-stateexperiments. Int. J. Multiphase Flow 293, 1719–1736.
Demond, A.H., Roberts, P.V., 1987. An examination of relative permeability relationsfor two-phase flow in porous media. Water Resour. Bull. 23, 617–628.
Djilali, N., 2007. Computational modelling of polymer electrolyte membrane (PEM)fuel cells: challenges and opportunities. Energy 32, 269–280.
Ehrlich, R., 1993. Viscous coupling in two-phase flow in porous media and its effecton relative permeabilities. Trans. Porous Media 11, 201–218.
Feng, J.J., Liu, C., Shen, J., Yue, P., 2005. An energetic variational formulation withphase field methods for interfacial dynamics of complex fluids: advantages andchallenges. In: Calderer, M.C.T., Terentjev, E.M. (Eds.), Modeling of Soft Matter.Springer, New York, pp. 1–26.
Gao, P., Feng, J.J., 2011. Spreading and breakup of a compound drop on a partiallywetting substrate. J. Fluid Mech. 682, 415–433.
Gustensen, A.K., Rothman, D.H., 1993. Lattice-Boltzmann studies of immiscible two-phase flow through porous media. J. Geophys. Res. 98, 6431–6441.
Hao, L., Cheng, P., 2010. Pore-scale simulations on relative permeabilities of porousmedia by lattice Boltzmann method. Int. J. Heat Mass Trans. 53, 1908–1913.
Huang, H., Lu, X.Y., 2009. Relative permeabilities and coupling effects in steady-state gas–liquid flow in porous media: a lattice Boltzmann study. Phys. Fluids21, 092104.
Kalaydjian, F., 1990. Origin and quantification of coupling between relativepermeabilities for two-phase flows in porous media. Trans. Porous Media 5,215–229.
Koido, T., Furusawa, T., Moriyama, K., 2008. An approach to modeling two-phasetransport in the gas diffusion layer of a proton exchange membrane fuel cell. J.Power Sour. 175, 127–136.
Li, H., Pan, C., Miller, C.T., 2005. Pore-scale investigation of viscous coupling effectsfor two-phase flow in porous media. Phys. Rev. E 72, 026705.
Muskat, M., Meres, M.W., 1936. The flow of heterogeneous fluids through porousmedia. Physics 7, 346–363.
Nguyen, V.H., Sheppard, A.P., Knackstedt, M.A., Pinczewski, W.V., 2006. The effect ofdisplacement rate on imbibition relative permeability and residual saturation. J.Petrol. Sci. Eng. 52, 54–70.
Ye, T., Shyy, W., Chung, J.N., 2001. A fixed-grid, sharp-interface method for bubbledynamics and phase change. J. Comput. Phys. 174, 781–815.
Yiotis, A.G., Psihogios, J., Kainourgiakis, M.E., Papaioannou, A., Stubos, A.K., 2007. Alattice boltzmann study of viscous coupling effects in immiscible two-phaseflow in porous media. Coll. Surf. A: Physicochem. Eng. Aspects 300, 35–49.
Yue, P., Feng, J.J., 2011. Wall energy relaxation in the Cahn–Hilliard model formoving contact lines. Phys. Fluids 23, 012106.
Yue, P., Feng, J.J., Liu, C., Shen, J., 2004. A diffuse-interface method for simulatingtwo-phase flows of complex fluids. J. Fluid Mech. 515, 293–317.
Yue, P., Feng, J.J., Liu, C., Shen, J., 2005. Diffuse-interface simulations of dropcoalescence and retraction in viscoelastic fluids. J. Non-Newton. Fluid Mech.129, 163–176.
Yue, P., Zhou, C., Dooley, J., Feng, J.J., 2008. Elastic encapsulation in bicomponentstratified flow of viscoelastic fluids. J. Rheol. 52, 1027–1042.
Yue, P., Zhou, C., Feng, J.J., 2006a. A computational study of the coalescence betweena drop and an interface in Newtonian and viscoelastic fluids. Phys. Fluids 18,102102.
Yue, P., Zhou, C., Feng, J.J., 2010. Sharp-interface limit of the Cahn–Hilliard model formoving contact lines. J. Fluid Mech. 645, 279–294.
Yue, P., Zhou, C., Feng, J.J., Ollivier-Gooch, C.F., Hu, H.H., 2006b. Phase-fieldsimulations of interfacial dynamics in viscoelastic fluids using finite elementswith adaptive meshing. J. Comput. Phys. 219, 47–67.
Zhang, F.Y., Yang, X.G., Wang, C.Y., 2006. Liquid water removal from a polymerelectrolyte fuel cell. J. Electrochem. Soc. 153, A225–A232.
Zhou, C., Yue, P., Feng, J.J., 2006. Formation of simple and compound drops inmicrofluidic devices. Phys. Fluids 18, 092105.
Zhou, C., Yue, P., Feng, J.J., Ollivier-Gooch, C.F., Hu, H.H., 2010. 3D phase-fieldsimulations of interfacial dynamics in Newtonian and viscoelastic fluids. J.Comput. Phys. 229, 498–511.
Copyright © 2022 FDOKUMEN