Vehicle impact analysis of flexible barriers supported by different shaped posts in sloping ground
15
Vehicle impact analysis of flexible barriers supported by different shaped posts in sloping ground Dong-Woo Lee, Jae-Seok Ahn, Kwang-Sung Woo * Department of Civil Engineering, Yeungnam University, Gyeongsan 712-749 Republic of Korea ABSTRACT A roadside guardrail may be constructed near slopes. The desired safety behavior is ensured not only by the guardrail structure itself, but also by the interaction between soil and guardrail post. In the case of horizontal ground, the elastic Winkler spring model and the p-y curve approach can be used to estimate the soil-post interaction by the finite element method. However, it is difficult to apply those models with the sloping ground cases unless sufficient experimental data are given through the single post impact tests. This paper evaluates, using LS-DYNA software, the vehicle impact performance of flexible barriers made of steel W-Beam guardrails in sloping ground that are also supported over three different types of post configurations. The dynamic performance is tested in terms of maximum deflection, absorbing impact energy and occupant risk index according to post types. Keywords: soil-post model, flexible barrier, post configuration, sloping ground, LS-DYNA, road- side safety 1. Introduction Many safety barriers that protect vehicle occupants in roadside accidents are installed near the sloping ground and are supported by the passive resistance of guardrail post. The guardrail system, especially deformable guardrail post, is exposed to considerable lateral loads due to vehicle collision. To provide appropriate safety of vehicle occupants on impact, the safety barriers should be designed so as to absorb impact energy as much as possible through their deformation and concurrently maintain their integrity. To ensure such a deformable guardrail with the safety behavior desired in * Corresponding author. Tel.: +82 (0) 53 810 2593; fax: +82 (0) 53 8104622. E-mail address: [email protected] (Prof. Kwang-Sung Woo)
Transcript of Vehicle impact analysis of flexible barriers supported by different shaped posts in sloping ground

Vehicle impact analysis of flexible barriers supported by different shaped posts in sloping ground
Dong-Woo Lee, Jae-Seok Ahn, Kwang-Sung Woo*
Department of Civil Engineering, Yeungnam University, Gyeongsan 712-749 Republic of Korea
ABSTRACT
A roadside guardrail may be constructed near slopes. The desired safety behavior is ensured not only
by the guardrail structure itself, but also by the interaction between soil and guardrail post. In the case
of horizontal ground, the elastic Winkler spring model and the p-y curve approach can be used to
estimate the soil-post interaction by the finite element method. However, it is difficult to apply those
models with the sloping ground cases unless sufficient experimental data are given through the single
post impact tests. This paper evaluates, using LS-DYNA software, the vehicle impact performance of
flexible barriers made of steel W-Beam guardrails in sloping ground that are also supported over three
different types of post configurations. The dynamic performance is tested in terms of maximum
deflection, absorbing impact energy and occupant risk index according to post types.
Keywords: soil-post model, flexible barrier, post configuration, sloping ground, LS-DYNA, road-side safety
1. Introduction
Many safety barriers that protect vehicle occupants in roadside accidents are installed near the
sloping ground and are supported by the passive resistance of guardrail post. The guardrail system,
especially deformable guardrail post, is exposed to considerable lateral loads due to vehicle collision.
To provide appropriate safety of vehicle occupants on impact, the safety barriers should be designed
so as to absorb impact energy as much as possible through their deformation and concurrently
maintain their integrity. To ensure such a deformable guardrail with the safety behavior desired in
*Corresponding author. Tel.: +82 (0) 53 810 2593; fax: +82 (0) 53 8104622. E-mail address: [email protected] (Prof. Kwang-Sung Woo)

accident, the soil-post interaction is an important issue to be investigated. The theoretical background
of soil-post interaction is based on the theory of laterally loaded pile embedded in horizontal ground
that has received considerable attention over the past several decades [1][2].
In general, the elastic spring model and p-y curve approach are common tools to model the laterally
loaded piles or guardrail posts embedded in horizontal ground by the finite element method. The p-y
method is based on the numerical solution of beam-on-elastic foundation, where the structural
behavior of a drilled shaft is modeled as a beam and the soil-shaft interaction is represented by
discrete, inelastic springs characterized by p-y curves [3,4]. However, two models cannot be extended
to sloping ground since the spring constants for elastic or inelastic cases have not been clearly
investigated. The variation of passive resistance depending on ground slop is very significant for
sloping ground. Recently, some developments towards the analysis of piles in sloping ground have
been made either by experiments in laboratory [3,4] or by numerical analysis [5,6]. Results indicate
that ground inclination significantly affects ultimate load pu of the p-y curves according to loading
direction, angle of inclined pile and soil density, etc.
As mentioned before, the available methods of analysis for laterally loaded guardrail posts in
horizontal ground cannot be directly applied to the laterally loaded guardrail posts in sloping ground.
The field test is the best option for investigating the post response for varying slope angles, but it is
not cost-effective. Even though scaling effects influence results of model tests, the computer
simulation of numerical model would be an alternative to field test to analyze the soil-post interaction
of laterally loaded guardrail posts in sloping ground [7][8]. The simulation of the appropriate field
condition is also a challenging task while using the commercially available software, LS-DYNA. The
input data of FHWA soil are used in this study [9]. Material FHWA Soil(MAT147) in LS-DYNA
software is developed by the Federal Highway Administration for applications involving road-base
soils. For this purpose, the 3-D soil-material model is used to model the three dimensional sloping
ground. Also, the dynamic performance of flexible barriers made of steel W-Beam guardrails
supported over three different types of post configurations. These types include one open section(C-
shape post) and two closed sections(circular shape and square shape posts). The strength capacity of

barriers and the impact severity of occupant have been estimated by deformation as well as occupant
risk indices.
2. FINITE ELEMENT MODELING
2.1 Soil-Post Model
The material model for the soil is based on FHWA Soil(MAT147) in LS-DYNA[10] that has been
developed by the Federal Highway Administration for applications involving road-base soils. Initial
parameters for material type 147 are selected from LS-DYNA models provided by the developer.
These models included two tri-axial compression tests and a hydrostatic tension test. This material
model has been developed specially to predict the dynamic performance of the foundation soil in
which roadside safety structures are mounted when undergoing a collision by a motor vehicle. Though
total twenty four input parameters should be required, only twelve main input parameters for the soil
model are shown in Table 1 that include the density at an initial state, bulk and shear moduli,
compaction curve and a yield surface. Table 1 has been slightly modified from baseline material
parameters given by model developer of FHWA soil [9]. Especially, the elastic modulus E is assumed
to 18MPa from Yoshida’s SPT test results [12]. The stiffness parameters K and G are also modified
according to E that may belong to the range of dense sand in Table 2. As evidenced in direct shear
tests, there is a gradual decrease in shear strength after the peak. Thus the residual shear strength,
PHIRES denoted in Table 1, is assumed as 80% of peak value. Since the Mohr-Coulomb failure
criteria is used, values for cohesion and the angle of internal friction should be determined through
direct shear testing or tri-axial compression tests.
Table 1. Modified material parameters in FHWA soil material model.
RO /
NPLOT SPGRAV RHOWAT
/
2.35E-6 3 2.79 1.0E-6
VN K(MPa) G(MPa) PHIRES
1.1 11.766 7.06 0.9
INTRMX MCONT ECCEN COH(GPa)
10 0.034 0.7 6.2E-6

RO : Mass density kg/mm , NPLOT : Plotting options SPGRAV : Specific Gravity of Soil used to get porosity. RHOWAT : Density of water in model units kg/mm VN : Viscoplasticity parameter (strain-rate enhanced strength). K : Bulk Modulus(MPa), G : Shear modulus(MPa). PHIRES : The minimum internal friction angle, radians(residual shear strength). INTRMX : Maximum number of plasticity iterations MCONT : Moisture Content of Soil (Determines amount of air voids) ECCEN : Eccentricity parameter for third invariant effects. COH : Cohesion Shear Strength at zero confinement(MPa).
Table 2. General range of bulk and shear moduli for Poisson’s ratio μ=0.25[9].
Soil Type Modulus of Elasticity
E(MPa) Bulk Modulus
K(MPa) Shear Modulus
G(MPa)
Loose Sand 10.35-24.15 6.90-16.10 4.14-9.66
Medium Dense Sand 10.35-17.25 6.90-11.50 4.14-6.90
Dense Sand 17.25-27.60 11.50-18.40 6.90-11.04
Silty Sand 34.50-55.20 23.00-36.80 13.80-22.08
Sand and Gravel 69.00-172.50 46.00-115.00 27.60-69.00
The geometry of soil analyzed is illustrated in Fig.1, which shows a post of length L and width D
placed at the near crest of a slope. The eight-node hexagonal solid and six-node triangular prism
elements are used to consider the sloping ground domain to be capable of modeling soil continuity,
post-soil interface behavior, and three-dimensional boundary conditions. The bottom boundary of the
3-D mesh shown in Figs.2-4 is fixed in all directions and the vertical boundaries are fixed only in the
normal direction. The top and inclined surfaces are not constrained. The gravity loading of soils is
considered. On the other hand, the steel post is modeled using shell elements and piecewise-linear-
plasticity model(MAT24) [10] that will be precisely explained in the next section. The eight node
quadrilateral interface elements are used for the post-soil interface [11]. Instead of an approximation
of the three-dimensional stress strain state by continuum elements, the interface of post and soil is
discretized by the interface element based on traction-separation model with two degrees of
freedom(normal tangential directions). In other words, the constitutive behavior must be formulated
between the interface tractions and the displacement jumps that can represent the differences of the
displacement at the surfaces of the soils. Details of interface element available in LS-DYNA is
explained in reference[11]. Figure 1 shows a schematic diagram of a laterally loaded post embedded

completely in the 1:1.5 sloping ground inclined to the horizontal line. The steel W-Beam guardrails
supported over three different types of post configurations. These types include one open section(C-
shaped post) and two closed sections(circular shaped and square shaped posts). For the sake of
convenience, three different post shapes are classified from CASE 1 to CASE 3 as shown in Figs. 2-4.
The cross-section of the post has been considered by a width D. In case of two closed sections, D
represents a square side and diameter of circle. On the other hand, the height of web for an open
section, respectively. The layouts of three guardrails are determined on the basis of same cross
sectional area as shown in Table 3 and Fig. 5. The 500mm overlap length in reference to the ground
level is also considered with twice of 4.5mm post thickness to increase the flexural strength to vehicle
collision, or to prevent the seriously large deformation at the ground level. For instance, the inner steel
tubes with 4.5mm thickness and 500mm overlap length slide into the circular shaped and square
shaped posts, respectively. Thus total embedded length of post is 1500mm. Also the geometric
dimensions of three posts are presented in Table 3.
Table 3. Dimension of three different posts.
Post Type Width(mm) Height(mm) Thickness(mm) Area(mm2)
CASE1(Circular) 140 140 4.5 1980
CASE2(Channel) 120 150 4.5 1980
CASE3(Square) 110 110 4.5 1980
Fig. 1 Problem definition of a laterally loaded post in sloping ground.

Fig.2 CASE 1 (Circular Shape)
Fig. 3 CASE 2 (C-Shape)
Fig. 4 CASE 3 (Square Shape)
Fig. 5 Layout of steel guardrail posts considered in this study.
2.2 W-Beam Guardrail Model
The safety barrier parts are consisted of the guardrail, the posts and distance spacers shown in
Figs.2-5. The W-shaped, galvanized 4mm steel sheet metal is attached to 4.5mm thick steel posts
using two different distance spacers. Along the whole length of 40m guardrail system, 20 posts and
distance spacers are placed 2m apart. The posts are embedded 1500mm into the ground, and the end
terminals are neglected. The sheet metal of guardrail system is a type of mild steel with yield

strength( 230MPa) and elastic modulus(E 200GPa). The W-Beam guardrail is modeled with
full-integration shell elements with five integration points through shell thickness to prevent the
hourglass mode due to impact loading. On the other hand, the four node Belytscho-Tsay shell finite
elements with three integration points through the thickness are used for posts and distance spacers to
reduce the computational time. Bolt connections are modeled by nodal rigid joint
option(*CONSTRAINED_NODAL_RIGID) in LS-DYNA. An isotropic piecewise linear plasticity
model has been adopted, and material failure is introduced by defining the ultimate effective plastic
strain denoted by 0.28. Due to high impact loadings, the material models employ kinematic hardening
rule and Cowper-Symonds strain rate dependency. The following equation is suggested by Cowper
and Symonds [13] to describe the material behavior at different strain rate.
1 / (1)
In the structural crash analysis in the field of road and vehicle safety, typical values of strain rate
range from 10 to 1000 where and σ are dynamic and quasi-static stress, respectively;
is strain rate; D and q are Cowper-Symonds coefficients that are determined by D=40.4 and q=5
[7].
Four different contact options are used in the finite element model such as contact between safety
barrier parts, vehicle parts, impacting parts of vehicle-barrier, and wheels of vehicle-ground. The
static and dynamic frictions in the first three contact definitions are set to 0.2 and 0.15, respectively. In
the fourth contact problem, both friction coefficients are set to 0.3 [14]. No constraint condition used
at the end of 40m guardrail system.
The finite element vehicle models for crash test originate from public library of the National Crash
Analysis Center(NCAC). The vehicle wheels are modified to enable their rotational movement that is
very important during the vehicle impact since the vehicle wheel is in direct contact with the barrier.
The wheel tire is modeled using LS-DYNA airbag model with internal pressure. A rigid shell element

has been added at the vehicle gravity center to act an accelerometer and to record the kinematic
quantities in the vehicle local coordinate system [14]. There are two vehicle models. The 8ton truck
impacts the W-Beam guardrail system with a speed of 65km/h and an angle of 15 degrees to estimate
the structural adequacy. This model is comprised of approximately 30,000 nodes and 27,500 elements.
The 1.3ton car is tested to evaluate the occupant risk at an angle of 20 to the safety barrier and the
initial velocity is equal to 85km/h. The initial and boundary conditions are followed by Korean
Standard for Road Safety Structures that is equivalent to MASH(2009)[15] and EN-1317(2010)[16].
Fig. 6 FE model for W-beam guardrail system in sloping ground.
Table 4. Number of nodes and elements for vehicle model.
Vehicle Node Element
1.3ton Car 26,450 28,321
8ton Truck 29,535 27,517
Fig. 7 The FE vehicle models used in crash simulations.
3. NUMERICAL RESULTS
Three identical posts are tested with a 8ton truck at an impact speed 65km/h. The finite element
simulation is performed for a maximum time of 600ms and a time step of 2.0μs using the nonlinear

FE code LS-DYNA. The FE model of guardrail, post and sloping ground is presented in Fig. 6. This
guardrail system model excluding vehicle model is comprised of 222,249 nodes and 204,680 elements
for CASE 1, 149,637 nodes and 134,880 elements for CASE 2, and 137,680 nodes and 126,900
elements for CASE 3, respectively. As we aware of it, the number of FE elements for a vehicle should
be same. However, the FE mesh design is dependent upon three CASEs since the guardrail system
including rail part, post, and distance spacer are different each other. Also, the shape of post can affect
the mesh design of the soil.
Deformed shapes of the guardrail system during vehicle impact are investigated with a 8ton truck
at an impact speed 65km/h. Also, maximum deflections of beam and post for three guardrail post
configurations are calculated. It is observed that in all cases the danger of tire snagging is not faced
regardless of the type of posts used. While figures 8 and 9 show the deformed shape for different post
conditions not only for horizontal ground but also for sloping ground, it can be noted that guardrail
system with CASE 1 post provides the least deformation, however, CASE 2 post shows the largest
lateral movement. Same tendency is identified for both horizontal ground and sloping ground. In other
words, the post with open section type(CASE 2) generally exhibits larger deformation due to severe
torsion than other posts with closed sections(CASE 1, CASE 3). As a supplementary explanation, the
hour glass mode due to severe distortion of the soil mesh is generally controlled by
*CONTROL_HOURGLASS command available in LS-DYNA program[10]. These tendencies have
been easily identified from the displacement-time history plotted in Fig. 10 and Fig. 11. As shown in
Table 5, it is noted that the passive resistance for sloping ground shows approximately 30% decrease
as compared with that for horizontal ground when the ground slope is 1:1.5 since the maximum
deflections of posts are related to the passive resistance of ground.
CASE 1 CASE 2 CASE 3

Fig. 8 Deformed shapes of the guardrail system during vehicle impact in horizontal ground.
CASE 1 CASE 2 CASE 3
Fig. 9 Deformed shapes of the guardrail system during vehicle impact in sloping ground.
Fig. 10 Displacement-time history for different posts embedded in horizontal ground.
Fig. 11 Displacement-time history for different posts embedded in sloping ground.
The deformation of safety barriers during impact tests is characterized by the dynamic deflection and
by the working width. It is important that the deformation should be compatible with the available
space or distance behind the system. The working width (W) is the distance between the side facing
the traffic before the impact of the road restraint system and the maximum dynamic lateral position of
any major part of the system. The working classes according to EN-1317 standard[16] are presented
in Table 6 using working width values with respect to three different posts. A higher working class for
CASE 2 is expected as W3 to be consistent with previous findings on the basis of displacement-time
history graphs. Other working classes for CASE 1 and CASE 3 are determined by W2 due to
relatively small deformations.
Also, the results of computational simulations are shown in Figs. 12-14. Those figures show the
vehicle trajectory and the deformation shape of safety barriers when the 8ton truck impacts the W-
Beam guardrail system with a speed of 65km/h and an angle of 15 degrees. The exit angles for CASE

1-CASE 3 are calculated by 6.9 , 8.1 , and 7.1 , respectively that are lower than 60% of impact
angle.
Table 5. Comparison of maximum deflection of three different posts.(unit: mm)
Table 6. Horizontal of working width for different post configurations.
Type CASE 1 CASE 2 CASE 3
Working Width(mm) 730 827 763
Working Class
(EN1317 Code)
W2 W3 W2
Fig. 12 Vehicle(8ton) trajectory during the vehicle impact for Case1.
Fig. 13 Vehicle(8ton) trajectory during the vehicle impact for Case2.
Fig. 14 Vehicle(8ton) trajectory during the vehicle impact for Case3.
Ground Condition CASE 1 CASE 2 CASE 3
Horizontal Ground 369.6 414.6 378.2
Sloping Ground 462.0 556.6 507.1
Difference(%) 25 34 34
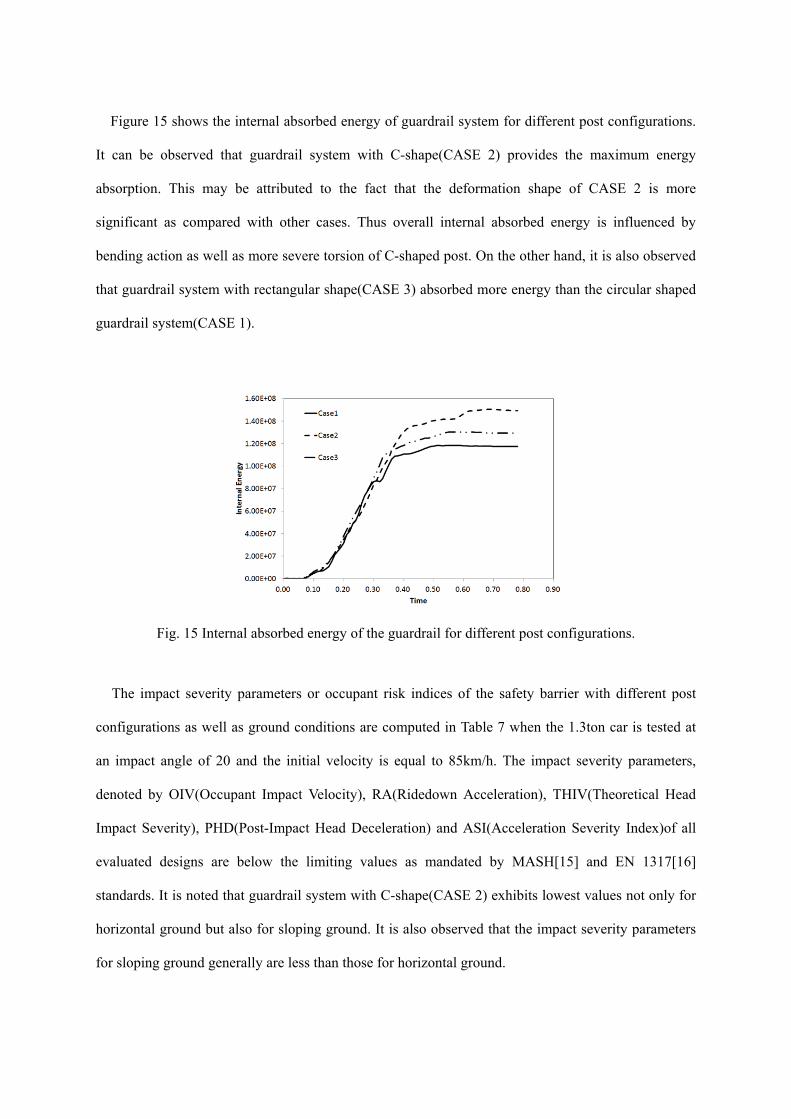
Figure 15 shows the internal absorbed energy of guardrail system for different post configurations.
It can be observed that guardrail system with C-shape(CASE 2) provides the maximum energy
absorption. This may be attributed to the fact that the deformation shape of CASE 2 is more
significant as compared with other cases. Thus overall internal absorbed energy is influenced by
bending action as well as more severe torsion of C-shaped post. On the other hand, it is also observed
that guardrail system with rectangular shape(CASE 3) absorbed more energy than the circular shaped
guardrail system(CASE 1).
Fig. 15 Internal absorbed energy of the guardrail for different post configurations.
The impact severity parameters or occupant risk indices of the safety barrier with different post
configurations as well as ground conditions are computed in Table 7 when the 1.3ton car is tested at
an impact angle of 20 and the initial velocity is equal to 85km/h. The impact severity parameters,
denoted by OIV(Occupant Impact Velocity), RA(Ridedown Acceleration), THIV(Theoretical Head
Impact Severity), PHD(Post-Impact Head Deceleration) and ASI(Acceleration Severity Index)of all
evaluated designs are below the limiting values as mandated by MASH[15] and EN 1317[16]
standards. It is noted that guardrail system with C-shape(CASE 2) exhibits lowest values not only for
horizontal ground but also for sloping ground. It is also observed that the impact severity parameters
for sloping ground generally are less than those for horizontal ground.

Table 7. Impact severity parameters for horizontal ground and sloping ground.
Post Type THIV(m/s) PHD(g’s) OIV(m/s) RA(g’s) ASI X Y X Y
CASE 1 Horizontal Ground
6.9 16.8 2.5 6.9 -27.0 -16.8 1.49
Sloping Ground 6.4 16.9 3.0 5.7 -18.0 -16.7 1.32 CASE 2 Horizontal
Ground 6.2 15.3 2.0 5.8 -13.1 -19.4 1.15
Sloping Ground 6.1 17.9 1.4 6.0 -8.2 -16.2 1.01 CASE 3 Horizontal
Ground 7.4 16.7 1.8 7.1 -13.4 -12.8 1.15
Sloping Ground 6.7 16.7 2.0 6.6 -14.3 -12.1 1.18 Design Limit <9.0 <20 <12 <12 <20 <20 <1.0(A)
<1.4(B)
4. CONCLUSIONS
This paper presents computer simulations for different types of guardrail systems embedded in
horizontal ground as well as sloping ground, and their interaction with soil during vehicle impacts
using the proposed three dimensional soil-post models. The post type is proved to be a fundamental
component of a guardrail system. According to the simulation results, the following conclusions have
been drawn:
1. The decrease of passive resistance of guardrail post is more significant for sloping ground due
to ground slope. It is noted that the passive resistance for sloping ground shows approximately
30% decrease as compared with the horizontal ground condition when the ground slope is
1:1.5.
2. The danger of tire snagging is not faced regardless of different post configurations.
3. It is noted that guardrail system with circular shaped post(CASE 1) provides the least
deformation, however, C- shaped post(CASE 2) shows the largest lateral movement. Same
tendency is identified for both horizontal ground and sloping ground.
4. It can be observed that guardrail system with C-shaped post(CASE 2) provides the maximum
energy absorption. This may be attributed to the fact that the distortional tendency of CASE 2
is more significant as compared with other cases.
5. A higher working class for CASE 2 is expected as W3 to be consistent with previous findings
on the basis of displacement-time history graphs. Other working classes for CASE 1 and
CASE 3 are determined by W2 due to relatively small deformations.
Acknowledgement
This work was supported by National Research Foundation of Korea(NRF) grant funded by the Korea
government(MEST) (NRF-2013R1A1A2057756).
CONFLICT OF INTERESTS
The authors declare that there is no conflict of interests regarding the publication of this article.
References
[1] Reese LC. Handbook on design of piles and drilled shafts under internal loads. U.S. DOT,
FHWA, Washington D.C;1984.
[2] Prakash S, Kumar S. Nonlinear Lateral Pile Deflection Prediction in Sands, Geotechnical
Engineering 1996;130-138.
[3] Mezazigh S, Levacher D. Laterally Loaded Piles in Sand: Slope Effect on p-y Reaction
Curves, Can. Geotech. J. 1998;35:433-441.
[4] Muthukkumaran K, Sundaravadivelu R, Gandhi SR. Effect of Sloping Ground on Single Pile
Load Deflection Behaviour under Lateral Soil Movement, Proceedings of the 13th World
Conference on Earthquake Engineering. 2004;1-6.2.
[5] Chae KS, Ugai K, Wakai A. Lateral Resistance of Short Single Piles and Pile Groups
Located Near Slopes, Int. J. Geomech., 2004;4:93-103.
[6] Sawant VA, Shukla SK. Finite Element Analysis for Laterally Loaded Piles in Sloping
Ground, Coupled Systems Mechanics 2012;1:59-78.

[7] Wu W, Thomson R. A Study of the Interaction Between a Guardrail Post and Soil During
Quasi-Static and Dynamic Loading, Impact Engineering 2007;34:883-98.
[8] Sheikh NM, Abu-Odeh AY, Bligh RP. Finite Element Modeling and Validation of Guardrail
Steel Post Deflecting in Soil at Varying Embedment Depths, 11th International LS-DYNA
Users Conference 2011;11-32.
[9] Reid JD. Evaluation of LS-DYNA Soil Material Model 147: FHWA(Federal Highway
Administration) FHWA-HRT-04-094. 2004:1-77.
[10] Livemore Software Technology Corporation(LSTC) (2012), LS-DYNA 971 R6.0.0
Keyword User’s Manual.
[11] Gerlach S., Fiolka M., Matzenmiller A. (2005). Modeling and analysis of adhesively
bonded joints with interface elements for crash analysis, 4. LS-DYNA Anwenderforum,
Bamberg, Stuttgart, DYNAmore GmbH, B-I-35~B-I-44.
[12] Yoshida Y, Motonori I, Kokusho T. Empirical formulas of SPT blow-counts for gravelly
soils, Proceedings of ISOPT-1 for Penetration Testing 1998;381-387.
[13] Cowper GR, Symonds PS. Strain hardening and strain-rate effects in the impact loading of
cantilever beams. Report No. 28, Brown University, Division of Applied Mathematics; 1957.
[14] Borovinsek M, Vesenjak M, Ulbin M, Ren Z. Simulation of crash tests for high containment
horizontals of road safety barriers, Engineering Failure Analysis 2007;14:1711-1718.
[15] AASHTO. Manual for Assessing Safety Hardware(MASH). Washington D.C., USA;2009
[16] European Standards EN 1317, Road Restraint Systems-Part 2: Performance classes, impact
test acceptance criteria and test methods for safety barriers; 2010.