Variations in the activity of digestive enzymes along the intestine of the burbot Lota lota...
13
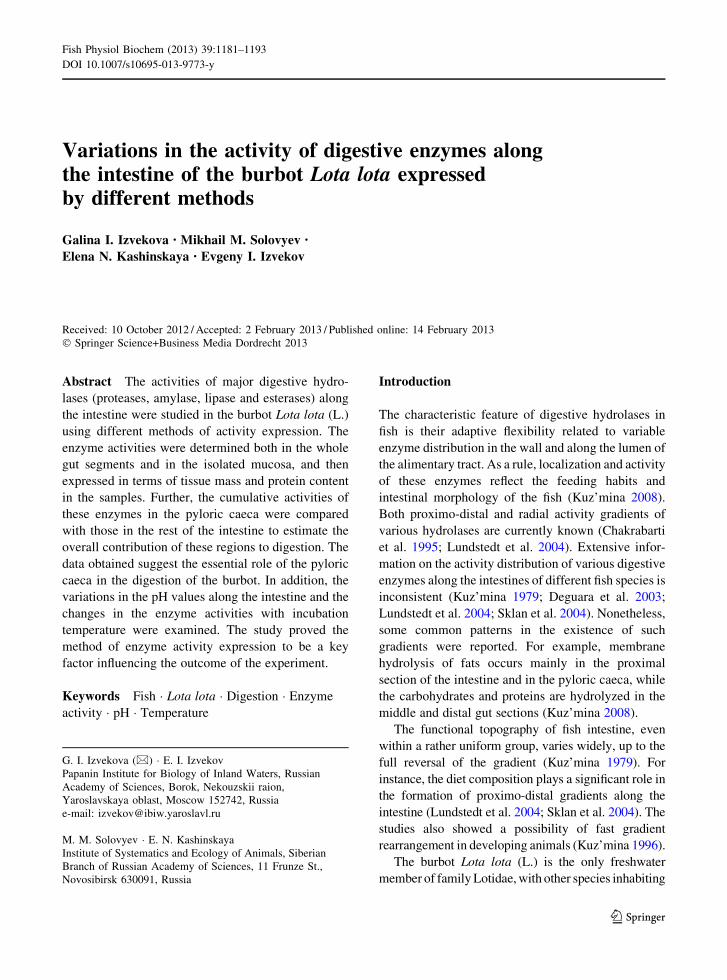
Variations in the activity of digestive enzymes along the intestine of the burbot Lota lota expressed by different methods Galina I. Izvekova • Mikhail M. Solovyev • Elena N. Kashinskaya • Evgeny I. Izvekov Received: 10 October 2012 / Accepted: 2 February 2013 / Published online: 14 February 2013 Ó Springer Science+Business Media Dordrecht 2013 Abstract The activities of major digestive hydro- lases (proteases, amylase, lipase and esterases) along the intestine were studied in the burbot Lota lota (L.) using different methods of activity expression. The enzyme activities were determined both in the whole gut segments and in the isolated mucosa, and then expressed in terms of tissue mass and protein content in the samples. Further, the cumulative activities of these enzymes in the pyloric caeca were compared with those in the rest of the intestine to estimate the overall contribution of these regions to digestion. The data obtained suggest the essential role of the pyloric caeca in the digestion of the burbot. In addition, the variations in the pH values along the intestine and the changes in the enzyme activities with incubation temperature were examined. The study proved the method of enzyme activity expression to be a key factor influencing the outcome of the experiment. Keywords Fish Lota lota Digestion Enzyme activity pH Temperature Introduction The characteristic feature of digestive hydrolases in fish is their adaptive flexibility related to variable enzyme distribution in the wall and along the lumen of the alimentary tract. As a rule, localization and activity of these enzymes reflect the feeding habits and intestinal morphology of the fish (Kuz’mina 2008). Both proximo-distal and radial activity gradients of various hydrolases are currently known (Chakrabarti et al. 1995; Lundstedt et al. 2004). Extensive infor- mation on the activity distribution of various digestive enzymes along the intestines of different fish species is inconsistent (Kuz’mina 1979; Deguara et al. 2003; Lundstedt et al. 2004; Sklan et al. 2004). Nonetheless, some common patterns in the existence of such gradients were reported. For example, membrane hydrolysis of fats occurs mainly in the proximal section of the intestine and in the pyloric caeca, while the carbohydrates and proteins are hydrolyzed in the middle and distal gut sections (Kuz’mina 2008). The functional topography of fish intestine, even within a rather uniform group, varies widely, up to the full reversal of the gradient (Kuz’mina 1979). For instance, the diet composition plays a significant role in the formation of proximo-distal gradients along the intestine (Lundstedt et al. 2004; Sklan et al. 2004). The studies also showed a possibility of fast gradient rearrangement in developing animals (Kuz’mina 1996). The burbot Lota lota (L.) is the only freshwater member of family Lotidae, with other species inhabiting G. I. Izvekova (&) E. I. Izvekov Papanin Institute for Biology of Inland Waters, Russian Academy of Sciences, Borok, Nekouzskii raion, Yaroslavskaya oblast, Moscow 152742, Russia e-mail: [email protected] M. M. Solovyev E. N. Kashinskaya Institute of Systematics and Ecology of Animals, Siberian Branch of Russian Academy of Sciences, 11 Frunze St., Novosibirsk 630091, Russia 123 Fish Physiol Biochem (2013) 39:1181–1193 DOI 10.1007/s10695-013-9773-y
-
Upload
independent -
Category
Documents
-
view
2 -
download
0
Transcript of Variations in the activity of digestive enzymes along the intestine of the burbot Lota lota...
Variations in the activity of digestive enzymes alongthe intestine of the burbot Lota lota expressedby different methods
Galina I. Izvekova • Mikhail M. Solovyev •
Elena N. Kashinskaya • Evgeny I. Izvekov
Received: 10 October 2012 / Accepted: 2 February 2013 / Published online: 14 February 2013
� Springer Science+Business Media Dordrecht 2013
Abstract The activities of major digestive hydro-
lases (proteases, amylase, lipase and esterases) along
the intestine were studied in the burbot Lota lota (L.)
using different methods of activity expression. The
enzyme activities were determined both in the whole
gut segments and in the isolated mucosa, and then
expressed in terms of tissue mass and protein content
in the samples. Further, the cumulative activities of
these enzymes in the pyloric caeca were compared
with those in the rest of the intestine to estimate the
overall contribution of these regions to digestion. The
data obtained suggest the essential role of the pyloric
caeca in the digestion of the burbot. In addition, the
variations in the pH values along the intestine and the
changes in the enzyme activities with incubation
temperature were examined. The study proved the
method of enzyme activity expression to be a key
factor influencing the outcome of the experiment.
Keywords Fish � Lota lota � Digestion � Enzyme
activity � pH � Temperature
Introduction
The characteristic feature of digestive hydrolases in
fish is their adaptive flexibility related to variable
enzyme distribution in the wall and along the lumen of
the alimentary tract. As a rule, localization and activity
of these enzymes reflect the feeding habits and
intestinal morphology of the fish (Kuz’mina 2008).
Both proximo-distal and radial activity gradients of
various hydrolases are currently known (Chakrabarti
et al. 1995; Lundstedt et al. 2004). Extensive infor-
mation on the activity distribution of various digestive
enzymes along the intestines of different fish species is
inconsistent (Kuz’mina 1979; Deguara et al. 2003;
Lundstedt et al. 2004; Sklan et al. 2004). Nonetheless,
some common patterns in the existence of such
gradients were reported. For example, membrane
hydrolysis of fats occurs mainly in the proximal
section of the intestine and in the pyloric caeca, while
the carbohydrates and proteins are hydrolyzed in the
middle and distal gut sections (Kuz’mina 2008).
The functional topography of fish intestine, even
within a rather uniform group, varies widely, up to the
full reversal of the gradient (Kuz’mina 1979). For
instance, the diet composition plays a significant role in
the formation of proximo-distal gradients along the
intestine (Lundstedt et al. 2004; Sklan et al. 2004). The
studies also showed a possibility of fast gradient
rearrangement in developing animals (Kuz’mina 1996).
The burbot Lota lota (L.) is the only freshwater
member of family Lotidae, with other species inhabiting
G. I. Izvekova (&) � E. I. Izvekov
Papanin Institute for Biology of Inland Waters, Russian
Academy of Sciences, Borok, Nekouzskii raion,
Yaroslavskaya oblast, Moscow 152742, Russia
e-mail: [email protected]
M. M. Solovyev � E. N. Kashinskaya
Institute of Systematics and Ecology of Animals, Siberian
Branch of Russian Academy of Sciences, 11 Frunze St.,
Novosibirsk 630091, Russia
123
Fish Physiol Biochem (2013) 39:1181–1193
DOI 10.1007/s10695-013-9773-y

cold marine waters. The burbot experiences consider-
ably larger temperature changes as compared to its
marine ancestors and is well adapted to freshwater
habitats (Hardewig et al. 2004). For instance, in the
Rybinsk reservoir (Russian Federation, 58�2203000N38�2800400E), the burbot spawns and actively feeds in
January and February (Kuperman and Kuz’mina 1994).
Adult burbots are categorized as primary piscivores and
facultative benthivores. The burbot is currently regarded
as a promising finfish species for cold-water aquacul-
ture. The above explains a considerable interest in the
studies on feeding and digestion of the burbot.
Enzyme activity can be expressed by different
methods, and in many cases, the results and their
interpretation would depend on the way of activity
calculation. Most commonly, enzyme activity is given
per gram of intestine tissue or per milligram of protein
contained in a sample. Furthermore, activity can be
determined either in the intestinal mucosa alone
(Kuz’mina 1979) or in the whole gut segment (Chak-
rabarti et al. 1995; Deguara et al. 2003; Day et al. 2011).
The main objective of the study was to examine the
activity distributions for major digestive enzymes
along the burbot intestine, and compare the distribu-
tion patterns using different methods of activity
expression. Besides, the pH values were determined
in different segments of the gut, and the enzyme
activities in these segments measured at various
incubation temperatures as the burbot is a cold-water
species that actively feeds in winter.
Materials and methods
Study specimens and tissue preparations
The study was conducted with adult burbots caught in
the Rybinsk reservoir in January and February 2011 by
local fishermen. The standard length of the fish ranged
from 380 to 460 mm. Fish were taken from the daily gill
net catches, killed by a blow on their head and dissected.
Shortly after capture, the digestive tracts of five
specimens were extracted and split into five segments
(the stomach, pyloric caeca, anterior, middle and
posterior sections). Immediately after dissection, the
pH values were measured in each segment using the
pH meter HI 8314 (Hanna Instruments, Romania) with
microelectrode HI 1083 B (3 mm in diameter).
For enzyme assays, the intestines of 26 burbots
were frozen and stored in liquid nitrogen until
analysis. Before the assays, the intestines were
dissected, the chyme was removed, and each gut was
split into six segments (I pyloric caeca, II–VI further
intestinal segments, each from 4 to 5 cm long).
To compare various methods of activity expression,
the homogenates for enzyme assays were prepared in
two different ways. In the first group of fish (n = 9),
homogenates were obtained from the whole intestinal
segments, while in the second group (n = 17), only
the isolated mucosa of each segment was used. For this
purpose, the intestines were cut lengthwise, cleaned of
chyme, and the mucosa was removed with a plastic
spatula. When preparing the homogenates, 0.1 M
Tris–HCl buffer (pH 7.5) was added to weighed
samples of the gut segments or net mucosa, and the
mixture was centrifuged at 10,000g for 10 min at 4 �C
using the microcentrifuge 5417R (Eppendorf, Ger-
many). The preparation of active enzyme samples was
carried out in an ice bath (at 0 �C).
Enzyme assays
The enzyme activities were determined at ambient
temperature of 25 �C. The total activity of proteinases
(activities of trypsin EC 3.4.21.4, chemotrypsin EC
3.4.21.1, and dipeptidases EC 3.4.13.18) was deter-
mined using 0.3 % (w/v) azocasein as substrate
(Alarcon et al. 2002). The activity of amylase (EC
3.2.1.1) was determined using 1 % (w/v) soluble
starch as the substrate (Deguara et al. 2003). The
activity of lipase (nonspecific lipases EC 3.1.1) was
analyzed with 0.4 mM p-nitrophenyl-myristate as the
substrate (Gawlicka et al. 2000). The activity of
esterases (nonspecific esterases EC 3.1.1) was deter-
mined with 0.27 mM p-nitrophenil acetate as the
substrate (Prabhakaran and Kamble 1995). The sub-
strates for the determination of the total proteolytic
activity and the activity of a-amylase were prepared
using Tris–HCl buffer (pH 7.5); for the determination
of the activities of nonspecific esterases, using 0.1 M
phosphate buffer (pH 7.5); for the determination of
lipase, using 24 mM ammonium bicarbonate (pH 7.5)
with 0.5 % (w/v) triton X-100 added as the detergent.
The dissolved protein concentration in the samples
was measured using the Bradford’s method (Bradford
1976). The color development proportional to enzy-
matic activities was measured using the microplate
1182 Fish Physiol Biochem (2013) 39:1181–1193
123

spectrophotometer Multiskan Ascent (Thermo,
Germany).
Expression of enzyme activities
The activities of the studied enzymes were expressed
as the difference of spectrophotometer readings for the
sample with the substrate versus a blank sample per
minute (DAbs min-1). In four different estimates, this
value was divided by: (1) mass of mucosa in a gut
segment, g; (2) protein content in a mucosa sample,
mg; (3) mass of a gut segment, g; (4) protein content in
a gut segment, mg. In order to evaluate the total
digestive capacities of pyloric caeca and the rest of the
gut, the cumulative activities of each enzyme in these
two regions were calculated. For this purpose, the
activity for each section was multiplied by the
corresponding mass of the gut tissue, with subsequent
summing of the values for all sections. The cumulative
activities for both pyloric caeca and the entire gut were
calculated in two modifications: per total weight of
wet intestinal tissue and per weight of mucosa alone.
Measuring the effects of pH and temperature
on enzyme activities
In a special series of experiments, the proteolytic
activity in the burbot stomach (n = 26) was deter-
mined at two different pH values (3 and 6) with 0.3 %
(w/v) hemoglobin as the substrate (Anson 1938).
Additionally, the activity of each enzyme in all the
intestinal segments of five burbots was measured at
various incubation temperatures (4, 15 and 25 �C),
and averaged for all segments.
Statistical analysis
The results are given as means ± SE. Statistical
analyses were carried out using the software package
STATISTICA 6.0 (StatSoft, Inc., Tulsa, OK, USA).
First, the distribution of each data set was tested for
normality using the Shapiro–Wilk W test. In some
cases, the distributions were close to normal, while in
others, significant departures from normality were
observed. Therefore, nonparametric statistical analy-
ses were applied throughout. Friedman ANOVA with
a posteriori testing was used to examine statistical
differences between the intestinal segments. The post
hoc analyses were conducted using the Wilcoxon
pairwise t test with Bonferroni adjustment for multiple
comparisons. When comparing the mucosa and seg-
ment samples within any particular portion of the gut,
the Mann–Whitney U test was used. All the tests were
two-tailed, and the level of significant difference was
set at P \ 0.05.
Results
Variations in pH values and protein content
along the digestive tract
The lowest pH values (5.08 ± 0.43 as average) were
found in the burbot stomach (Fig. 1). These values
were significantly lower compared with those for
pyloric caeca or any intestinal segment (P \ 0.05)
which were superior to 7. The pH reached the
maximum values in the anterior section of the intestine
and decreased toward the posterior segment.
The greatest protein content was detected in the
pyloric caeca compared to the intestine, both in the
whole segments and in the mucosa (P \ 0.01), and in
most cases, concentrations of protein in the mucosa
were higher than in the whole segments, with signif-
icant differences (P \ 0.01) for pyloric caeca
(Table 1).
Enzyme activities expressed per tissue mass
and protein content
The distributions of enzyme activities along the
intestinal tract of the burbot are given in Figs. 2 and
3. As a rule, the proteolytic activity in the pyloric
caeca was lower compared to the rest of the intestine,
bdbc
c
b
a
4
5
6
7
8
S PC A M P
Sections of digestive tract
Fig. 1 The pH values (mean ± SE, n = 5) in different sections
of the gastrointestinal tract of the burbot: S stomach, PC pyloric
caeca, A anterior, M middle, P posterior. Means with different
letters are significantly different (P \ 0.05)
Fish Physiol Biochem (2013) 39:1181–1193 1183
123

whatever the way of representation (Fig. 2a, b). In
case of mucosa samples, significant (P \ 0.05) dif-
ferences were observed between the pyloric caeca and
the next gut segment (II). At the same time, no
significant differences in proteinase activities were
found among the intestinal segments (II–VI), irre-
spective of the calculation method.
The calculation method considerably influenced the
pattern of activity distribution along the gut for
amylase, lipase and esterases (Figs. 2c, d, 3a–d). For
Table 1 Concentrations of protein (mg ml-1) in the intestine and pyloric caeca of the burbot
Samples Segments
I II III IV V VI
Segment (n = 9) 1.55* ± 0.28a 0.86 ± 0.20b 0.67 ± 0.15c 0.53 ± 0.06c 0.80 ± 0.25bc 1.29 ± 0.22ab
Mucosa (n = 17) 4.21* ± 0.49a 0.96 ± 0.11b 0.99 ± 0.21b 1.11 ± 0.30b 1.37 ± 0.30b 1.16 ± 0.22b
Each value represents mean ± SE. I pyloric caeca, II–VI further intestinal segments, n fish number
Different superscripts show significant differences between the data in a row (i.e., between the different gut segments) (P \ 0.01).
Asterisks show significant differences between the data in a column (i.e., between the segment and mucosa samples) (P \ 0.01)
b
aa
aa
aa
AA
A
AA
A
0.0
0.2
0.4
0.6
I II III IV V VI
Abs
min
–1 g
–1 s
egm
ent
0.00
0.02
0.04
0.06
Abs
min
–1 m
g–1
pro
tein
3 4
ab
ababab
b
a
A
A
A
AA
A
0.00
0.01
0.02
0.03
0.04
I II III IV V VI
Abs
min
–1 g
–1 s
egm
ent
0.000
0.001
0.002
0.003
0.004
Abs
min
–1 m
g–1
pro
tein
d
a
abab
abab
b
a
ABAB
AB
AB
B
A0.0
0.1
0.2
0.3
0.4
0.5
I II III IV V VI
Abs
min
–1 g
–1 m
ucos
a
0.00
0.01
0.02
0.03
Abs
min
–1 m
g–1
pro
tein
1 2
aa
aa
a a
A
B BB
AB AB
0.00
0.02
0.04
0.06
I II III IV V VI
Abs
min
–1 g
–1 m
ucos
a
0.000
0.001
0.002
0.003
0.004
Abs
min
–1 m
g–1
pro
tein
c
Protease activity (mucosa)
Amylase activity (segment)
Protease activity (segment)
Amylase activity(mucosa)
Fig. 2 Proteolytic (a, b) and amylolytic (c, d) activities in
different segments of the burbot intestine. 1 DAbs min-1 g-1
mucosa, 2 DAbs min-1 mg-1 protein in mucosa, 3 DAbs
min-1 g-1 segment, 4 DAbs min-1 mg-1 protein in segment, I
pyloric caeca, II–VI further intestinal segments. Mean ± SE
indicated, n = 17 (a, c), n = 9 (b, d). Within the same curve,
values marked with different letters are significantly different
(P \ 0.05)
1184 Fish Physiol Biochem (2013) 39:1181–1193
123

instance, when the amylase activity was expressed per
gram of mucosa or per milligram of protein in the
whole segments, no clear distribution pattern was
seen. On the contrary, when using two other methods
of activity expression, there were significant differ-
ences (P \ 0.05) between the amylase activity levels
in the pyloric caeca and those in the next gut segments.
When expressing the results per tissue mass unit,
the activities of lipase and esterases in the pyloric
caeca were significantly (P \ 0.05) higher than those
in the next gut segments (both in the mucosa samples
and in the whole gut segments). However, when these
activities were given per milligram of protein, this
difference reversed its sign (in the mucosa samples), or
tended to disappear (in the gut segments) (Fig. 3).
The activities of amylase, lipase and esterases per
gram of tissue were significantly higher for the mucosa
samples than for the whole gut segments in most
intestinal sections (Table 2). On the other hand, in
terms of protein, no significant differences in amylase
activity were found between mucosa and segment
samples, while in case of lipase and esterases, the
lower activity values were observed in mucosa
(Table 2).
In addition, the A/P ratio (i.e., amylase activity
divided by the activity of proteases) was calculated for
each segment (Table 3). This ratio was less than 1 in
each segment of the burbot intestine. When expressing
enzyme activity per gram of mucosa, the A/P ratio for
pyloric caeca was 2–2.4 times higher than that for the
d
Ab b b b
A
a A
A A
A b
0
1
2
3
4
I II III IV V VI
Abs
min
–1 g
–1 s
egm
ent
0
0.1
0.2
0.3
Abs
min
–1 m
g–1
pro
tein
b
A
A
AAA
A
b
bbb
b
a
0.0
0.2
0.4
0.6
I II III IV V VI
Abs
min
–1 g
–1 s
egm
ent
0.00
0.01
0.02
0.03
0.04
0.05
Abs
min
–1 m
g–1
pro
tein
3 4
c
a
bb ab
ab ab
A
B
B
ABAB AB
0
1
2
3
4
I II III IV V VI
Abs
min
–1 g
–1 m
ucos
a
0.0
0.1
0.2
0.3
Abs
min
–1 m
g–1
pro
tein
a
a
b
acac
ac ac
A
B B B
AB AB
0.0
0.2
0.4
0.6
I II III IV V VI
Abs
min
–1 g
–1 m
ucos
a
0.00
0.01
0.02
0.03
Abs
min
–1 m
g–1
pro
tein
1 2
Esterase activity (mucosa)
Lipase activity (mucosa)
Esterase activity (segment)
Lipase activity (segment)
Fig. 3 Lipase (a, b) and esterase (c, d) activities in different segments of the burbot intestine. See Fig. 2 for elucidation
Fish Physiol Biochem (2013) 39:1181–1193 1185
123
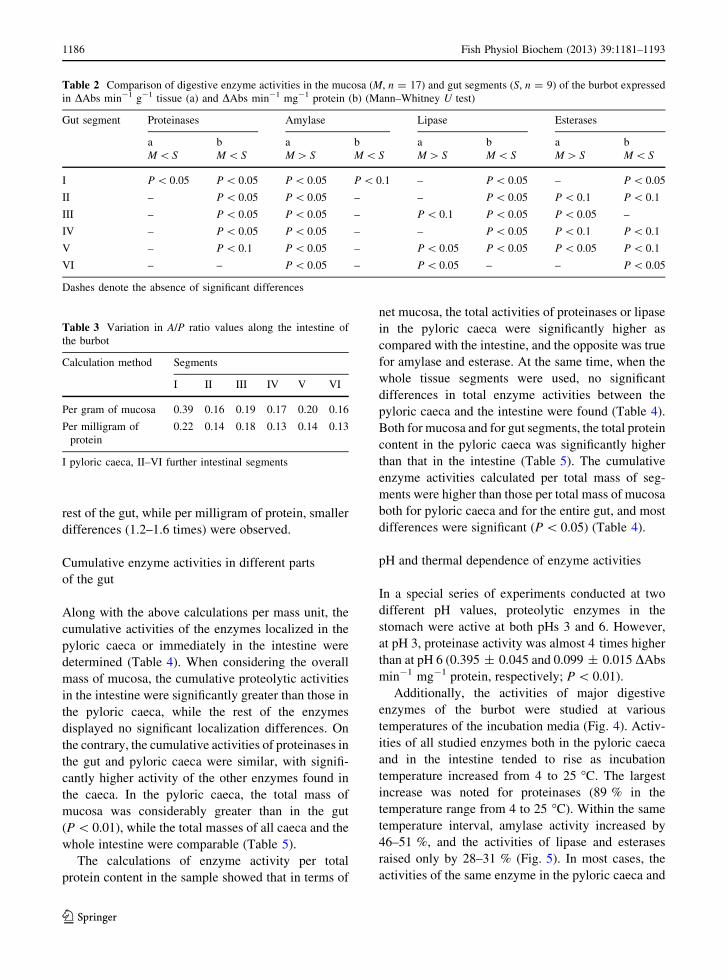
rest of the gut, while per milligram of protein, smaller
differences (1.2–1.6 times) were observed.
Cumulative enzyme activities in different parts
of the gut
Along with the above calculations per mass unit, the
cumulative activities of the enzymes localized in the
pyloric caeca or immediately in the intestine were
determined (Table 4). When considering the overall
mass of mucosa, the cumulative proteolytic activities
in the intestine were significantly greater than those in
the pyloric caeca, while the rest of the enzymes
displayed no significant localization differences. On
the contrary, the cumulative activities of proteinases in
the gut and pyloric caeca were similar, with signifi-
cantly higher activity of the other enzymes found in
the caeca. In the pyloric caeca, the total mass of
mucosa was considerably greater than in the gut
(P \ 0.01), while the total masses of all caeca and the
whole intestine were comparable (Table 5).
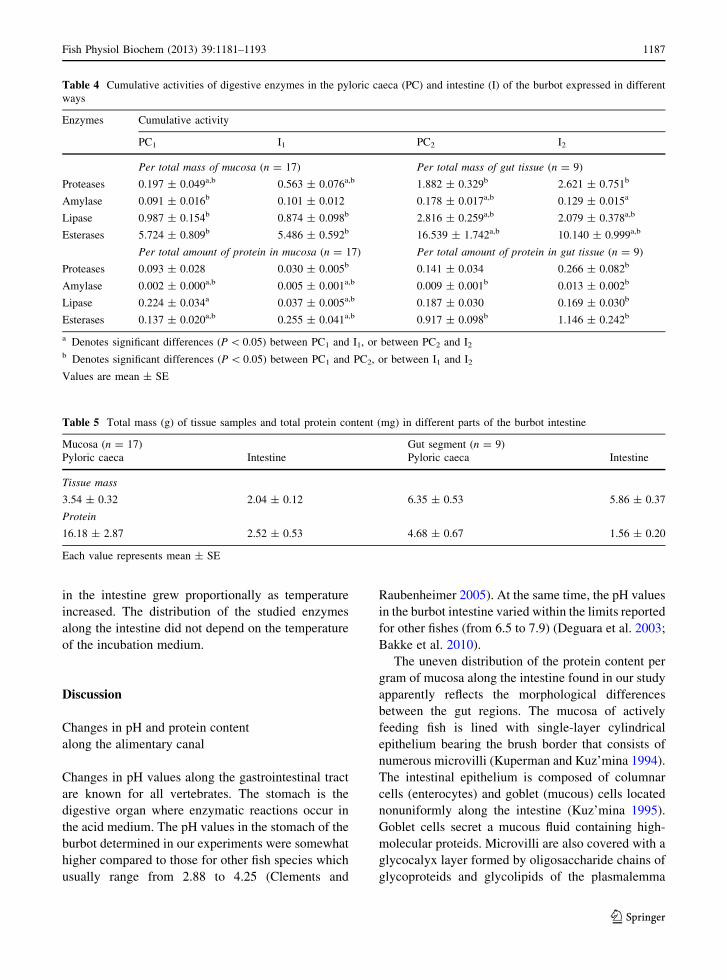
The calculations of enzyme activity per total
protein content in the sample showed that in terms of
net mucosa, the total activities of proteinases or lipase
in the pyloric caeca were significantly higher as
compared with the intestine, and the opposite was true
for amylase and esterase. At the same time, when the
whole tissue segments were used, no significant
differences in total enzyme activities between the
pyloric caeca and the intestine were found (Table 4).
Both for mucosa and for gut segments, the total protein
content in the pyloric caeca was significantly higher
than that in the intestine (Table 5). The cumulative
enzyme activities calculated per total mass of seg-
ments were higher than those per total mass of mucosa
both for pyloric caeca and for the entire gut, and most
differences were significant (P \ 0.05) (Table 4).
pH and thermal dependence of enzyme activities
In a special series of experiments conducted at two
different pH values, proteolytic enzymes in the
stomach were active at both pHs 3 and 6. However,
at pH 3, proteinase activity was almost 4 times higher
than at pH 6 (0.395 ± 0.045 and 0.099 ± 0.015 DAbs
min-1 mg-1 protein, respectively; P \ 0.01).
Additionally, the activities of major digestive
enzymes of the burbot were studied at various
temperatures of the incubation media (Fig. 4). Activ-
ities of all studied enzymes both in the pyloric caeca
and in the intestine tended to rise as incubation
temperature increased from 4 to 25 �C. The largest
increase was noted for proteinases (89 % in the
temperature range from 4 to 25 �C). Within the same
temperature interval, amylase activity increased by
46–51 %, and the activities of lipase and esterases
raised only by 28–31 % (Fig. 5). In most cases, the
activities of the same enzyme in the pyloric caeca and
Table 2 Comparison of digestive enzyme activities in the mucosa (M, n = 17) and gut segments (S, n = 9) of the burbot expressed
in DAbs min-1 g-1 tissue (a) and DAbs min-1 mg-1 protein (b) (Mann–Whitney U test)
Gut segment Proteinases Amylase Lipase Esterases
a
M \ S
b
M \ S
a
M [ S
b
M \ S
a
M [ S
b
M \ S
a
M [ S
b
M \ S
I P \ 0.05 P \ 0.05 P \ 0.05 P \ 0.1 – P \ 0.05 – P \ 0.05
II – P \ 0.05 P \ 0.05 – – P \ 0.05 P \ 0.1 P \ 0.1
III – P \ 0.05 P \ 0.05 – P \ 0.1 P \ 0.05 P \ 0.05 –
IV – P \ 0.05 P \ 0.05 – – P \ 0.05 P \ 0.1 P \ 0.1
V – P \ 0.1 P \ 0.05 – P \ 0.05 P \ 0.05 P \ 0.05 P \ 0.1
VI – – P \ 0.05 – P \ 0.05 – – P \ 0.05
Dashes denote the absence of significant differences
Table 3 Variation in A/P ratio values along the intestine of
the burbot
Calculation method Segments
I II III IV V VI
Per gram of mucosa 0.39 0.16 0.19 0.17 0.20 0.16
Per milligram of
protein
0.22 0.14 0.18 0.13 0.14 0.13
I pyloric caeca, II–VI further intestinal segments
1186 Fish Physiol Biochem (2013) 39:1181–1193
123
in the intestine grew proportionally as temperature
increased. The distribution of the studied enzymes
along the intestine did not depend on the temperature
of the incubation medium.
Discussion
Changes in pH and protein content
along the alimentary canal
Changes in pH values along the gastrointestinal tract
are known for all vertebrates. The stomach is the
digestive organ where enzymatic reactions occur in
the acid medium. The pH values in the stomach of the
burbot determined in our experiments were somewhat
higher compared to those for other fish species which
usually range from 2.88 to 4.25 (Clements and
Raubenheimer 2005). At the same time, the pH values
in the burbot intestine varied within the limits reported
for other fishes (from 6.5 to 7.9) (Deguara et al. 2003;
Bakke et al. 2010).
The uneven distribution of the protein content per
gram of mucosa along the intestine found in our study
apparently reflects the morphological differences
between the gut regions. The mucosa of actively
feeding fish is lined with single-layer cylindrical
epithelium bearing the brush border that consists of
numerous microvilli (Kuperman and Kuz’mina 1994).
The intestinal epithelium is composed of columnar
cells (enterocytes) and goblet (mucous) cells located
nonuniformly along the intestine (Kuz’mina 1995).
Goblet cells secret a mucous fluid containing high-
molecular proteids. Microvilli are also covered with a
glycocalyx layer formed by oligosaccharide chains of
glycoproteids and glycolipids of the plasmalemma
Table 4 Cumulative activities of digestive enzymes in the pyloric caeca (PC) and intestine (I) of the burbot expressed in different
ways
Enzymes Cumulative activity
PC1 I1 PC2 I2
Per total mass of mucosa (n = 17) Per total mass of gut tissue (n = 9)
Proteases 0.197 ± 0.049a,b 0.563 ± 0.076a,b 1.882 ± 0.329b 2.621 ± 0.751b
Amylase 0.091 ± 0.016b 0.101 ± 0.012 0.178 ± 0.017a,b 0.129 ± 0.015a
Lipase 0.987 ± 0.154b 0.874 ± 0.098b 2.816 ± 0.259a,b 2.079 ± 0.378a,b
Esterases 5.724 ± 0.809b 5.486 ± 0.592b 16.539 ± 1.742a,b 10.140 ± 0.999a,b
Per total amount of protein in mucosa (n = 17) Per total amount of protein in gut tissue (n = 9)
Proteases 0.093 ± 0.028 0.030 ± 0.005b 0.141 ± 0.034 0.266 ± 0.082b
Amylase 0.002 ± 0.000a,b 0.005 ± 0.001a,b 0.009 ± 0.001b 0.013 ± 0.002b
Lipase 0.224 ± 0.034a 0.037 ± 0.005a,b 0.187 ± 0.030 0.169 ± 0.030b
Esterases 0.137 ± 0.020a,b 0.255 ± 0.041a,b 0.917 ± 0.098b 1.146 ± 0.242b
a Denotes significant differences (P \ 0.05) between PC1 and I1, or between PC2 and I2
b Denotes significant differences (P \ 0.05) between PC1 and PC2, or between I1 and I2
Values are mean ± SE
Table 5 Total mass (g) of tissue samples and total protein content (mg) in different parts of the burbot intestine
Mucosa (n = 17) Gut segment (n = 9)
Pyloric caeca Intestine Pyloric caeca Intestine
Tissue mass
3.54 ± 0.32 2.04 ± 0.12 6.35 ± 0.53 5.86 ± 0.37
Protein
16.18 ± 2.87 2.52 ± 0.53 4.68 ± 0.67 1.56 ± 0.20
Each value represents mean ± SE
Fish Physiol Biochem (2013) 39:1181–1193 1187
123

a
a b bA
B
C
0.000
0.004
0.008
0.012
0.016
0.020
4° 15° 25°
Abs
min
-1 m
g-1 p
rote
in
Pyloric caeca
Intestine
b
ab
c
A
B
C
0.000
0.001
0.002
0.003
0.004
4° 15° 25°
c
aa
bA
A
B
0.000
0.005
0.010
0.015
0.020
0.025
4° 15° 25°
Temperature
Abs
-1m
g-1 p
rote
in
d
a a
b
AA
B
0.00
0.04
0.08
0.12
0.16
4° 15° 25°
Temperature
Proteinases Amylase
Lipase Esterases
Fig. 4 Mean ± SE activities of digestive enzymes in burbot at different incubation temperatures. Bars with different lower case letters
(pyloric caeca) or different upper case letters (intestine) are significantly different (P \ 0.05, n = 5)
-20
0
20
40
60
80
100
PP I PP I PP I PP I
Proteinases Amilase Lipase Esterases
4–15°C15–25°C
4–25°C
Act
ivity
cha
nges
(%
)
Fig. 5 Relative changes (%) in the activities of burbot digestive enzymes in response to elevation of the incubation temperature. PP
pyloric caeca, I intestine. Mean ± SE indicated (n = 5)
1188 Fish Physiol Biochem (2013) 39:1181–1193
123

(Kuz’mina 1995). The ultrastructure analysis of the
enterocytes from different parts of the intestine shows
considerable differences in the structural organization
of the brush border in the burbot. In mid-intestine, the
brush border bears longer and more widely spaced
microvilli compared to those in the anterior part, in the
region of pyloric caeca (Kuperman and Kuz’mina
1994). Our data on the protein content in the mucosa of
the burbot agree with the nonuniform distribution of
goblet cells and glycocalyx layer along the fish
intestine.
When measuring the enzyme activity in the intes-
tine, the weighed sample, besides mucosa, contains
submucous, muscular and serous layers. The higher
protein contents per gram of mucosa relative to those
for the gut segments could be explained by the fact that
the method used allows determining only soluble
protein in a sample (Bradford 1976). In turn, the
concentration of soluble protein in mucosa would be
higher than in the muscular and serous layers that both
contain a greater portion of insoluble structural
proteins. These differences in protein content could
affect the activity levels of the studied enzymes.
Enzyme activity patterns along the gut depending
on the method of activity expression
Differences in activity of digestive enzymes depend-
ing on the method of its expression were also noted by
other authors (Kuz’mina et al. 1982; Chan et al. 2004).
Expressing the activity per mass of intestinal tissue or
per protein mass can change the absolute activity
values, and even cause the reversal of inter-species
differences (Chan et al. 2004), which is probably
associated with differences in protein content between
the samples.
Similar levels of proteolytic activity in the mucosa
and intestine segments calculated per gram of tissue
(Table 2) suggest rather uniform distribution of pro-
teinases between the mucosa and intestinal wall. These
data agree with the earlier findings, showing a
considerable proteolytic activity in the muscular layer
of the intestine in the bream Abramis brama (Ugolev
and Kuz’mina 1992). The comparative analysis of
amylase, lipase and esterase activities per 1-g mucosal
and intestinal weighed samples in the burbot has
shown these enzymes to be localized mostly in the
mucosa. In the burbot, lower levels of protease, lipase
and esterase activities in mucosa versus segment
samples when expressing activity in milligrams of
protein could be explained by higher protein content in
the mucosa. The same explanation would be reason-
able for the insignificant differences between the
amylase activities in the mucosa and whole segments.
Terrestrial vertebrates generally display relative
functional specialization of different sections of their
small intestine. The distribution of enzyme and
transport activities along the small intestine is related
to the adaptation of its parts to various functional loads
(e.g., changes in diet composition, velocity of chyme
movement) (Ugolev and Iezuitova 1985). In fishes, the
activities of major digestive enzymes (trypsin, amy-
lase, lipase, etc.) are present along the whole length of
the digestive tract (Tengjaroenkul et al. 2000; Deguara
et al. 2003; Lundstedt et al. 2004; Sklan et al. 2004). In
our experiments, the activities of proteinases, amylase,
lipase and esterases were also found all along the
burbot intestine.
The lack of clear gradients in the enzyme distribu-
tion within sections II–VI of the burbot intestine
corresponds to the data by other authors (Kuz’mina
1979; Deguara et al. 2003; Lundstedt et al. 2004; Day
et al. 2011). They have shown that in many fish
species, the proximo-distal gradients of various
enzymes (trypsin, chymotrypsin, aminopeptidase,
amylase, maltase and lipase) could be feebly marked.
The A/P ratio is used to evaluate the relative
activities of amylolytic and proteolytic enzymes in the
intestine of fish. This ratio reflects the feeding habits of
the fish: in predators, it is less than 1, whereas in
planktophages and benthophages, it is usually more
than 1 (Ugolev and Kuz’mina 1994; Kuz’mina 1996).
The A/P values obtained for the burbot agree with this
concept. In addition, the A/P ratio in the intestine
decreases caudally, suggesting the greater contribu-
tion of proteases to digestion in the burbot intestine
compared with the pyloric caeca.
The activities of all tested enzymes in the pyloric
caeca converted to DAbs min-1 per milligram of
protein were lower than those in the other parts of the
gut. At the same time, the activities of lipase and
esterases calculated per gram of tissue in the pyloric
caeca exceeded those in further segments, which is
consistent with the concept of pyloric caeca signifi-
cance for hydrolysis of fats (Kapoor et al. 1975; Fange
and Grove 1979). The lower levels of enzyme activity
in the pyloric caeca are apparently related to the higher
protein content per gram of mucosa in this region of
Fish Physiol Biochem (2013) 39:1181–1193 1189
123

Ta
ble
6E
xam
ple
so
fen
zym
eac
tiv
ity
dis
trib
uti
on
alo
ng
the
dig
esti
ve
trac
tin
fish
es
Fis
hsp
ecie
sE
nzy
mes
Act
ivit
yd
istr
ibu
tio
nR
efer
ence
s
Nil
eti
lap
iaO
reo
chro
mis
nil
oti
cus
(om
niv
oro
us,
mo
stly
her
biv
oro
us)
Mal
tase
Am
ino
pep
tid
ase
and
alk
alin
e
ph
osp
hat
ase
Lip
ase
No
nsp
ecifi
ces
tera
ses
Seg
men
t3
ou
to
f5
(max
imu
m)
Seg
men
ts1
–3
ou
to
f5
(max
imu
m)
Seg
men
ts1
and
2o
ut
of
5(m
axim
um
)
Seg
men
ts1
–4
ou
to
f5
(max
imu
m)
Ten
gja
roen
ku
l
etal
.(2
00
0)
Hy
bri
dti
lap
ia(O
.n
ilo
ticu
s9
O.
au
reu
s)T
ryp
sin
,am
yla
sean
dli
pas
eD
ecre
ases
dis
tall
yS
kla
net
al.
(20
04
)
Gil
thea
dse
ab
ream
Sp
aru
sa
ura
ta(o
mn
ivo
rou
s)A
my
lase
,tr
yp
sin
and
chy
mo
try
psi
n
Car
bo
xy
pep
tid
ases
Aan
dB
Ev
end
istr
ibu
tio
n
Dec
reas
esd
ista
lly
Deg
uar
aet
al.
(20
03
)
Car
pC
ypri
nu
sca
rpio
(om
niv
oro
us)
Pro
teas
esS
egm
ents
2an
d4
ou
to
f5
(max
imu
m)
Jon
aset
al.
(19
83
)
Sil
ver
carp
Hyp
op
hth
alm
ich
thys
mo
litr
ix(h
erb
ivo
rou
s)P
rote
ases
Dec
reas
esd
ista
lly
Jon
aset
al.
(19
83
)
Eas
tern
riv
erg
arfi
shH
ypo
rha
mp
hu
sre
gu
lari
sa
rdel
io
(her
biv
oro
us)
Am
yla
se,
try
psi
n,
amin
op
epti
das
ean
d
lip
ase
Mal
tase
Ev
end
istr
ibu
tio
n
Seg
men
t1
ou
to
f4
(max
imu
m)
Day
etal
.(2
01
1)
So
uth
east
ern
snu
b-n
ose
dg
arfi
shA
rrh
am
ph
us
scle
role
pis
kref
ftii
(her
biv
oro
us)
Am
yla
se,
mal
tase
,tr
yp
sin
,
amin
op
epti
das
ean
dli
pas
e
Ev
end
istr
ibu
tio
nD
ayet
al.
(20
11)
Lo
ng
tom
Str
on
gyl
ura
kref
ftii
(car
niv
oro
us)
Am
yla
se
Try
psi
n
Am
ino
pep
tid
ase
Mal
tase
and
lip
ase
Seg
men
t1
ou
to
f4
(max
imu
m)
Seg
men
t3
ou
to
f4
(max
imu
m)
Seg
men
ts2
and
3o
ut
of
5(m
axim
um
)
Ev
end
istr
ibu
tio
n
Day
etal
.(2
01
1)
Sto
ut
lon
gto
mT
ylo
suru
sg
avi
alo
ides
(car
niv
oro
us)
Am
yla
se
Mal
tase
Try
psi
nan
dam
ino
pep
tid
ase
Lip
ase
Seg
men
t2
ou
to
f4
(max
imu
m)
Seg
men
ts1
–3
ou
to
f4
(max
imu
m)
Ev
end
istr
ibu
tio
n
Seg
men
t3
ou
to
f4
(max
imu
m)
Day
etal
.(2
01
1)
Sp
ott
edso
rub
im(‘
pin
tad
o’
catfi
sh)
Pse
ud
op
laty
sto
ma
orr
usc
an
s(c
arn
ivo
rou
s)
Am
yla
se
Try
psi
n
Lip
ase
Max
imu
mac
tiv
ity
inth
est
om
ach
or
even
dis
trib
uti
on
(dep
end
ing
on
die
t)
Sto
mac
h(m
axim
um
)
Seg
men
t2
ou
to
f3
(max
imu
m)
Lu
nd
sted
tet
al.
(20
04
)
Sh
eatfi
shS
ilu
rus
gla
nis
(car
niv
oro
us)
Pro
teas
esIn
crea
ses
dis
tall
yJo
nas
etal
.(1
98
3)
1190 Fish Physiol Biochem (2013) 39:1181–1193
123

digestive tract. Thus, the uneven distribution of
protein along the intestine affects the profiles of
enzyme activity expressed in DAbs min-1 per milli-
gram of protein.
Currently, there is no common opinion on the
functions of pyloric caeca and relation of their
location, number and structure with feeding habits of
fish. In some species, the most intensive hydrolysis of
lipids was shown to occur in the proximal sections of
the gut (Kapoor et al. 1975; Fange and Grove 1979),
though the other intestinal regions can also participate
in digestion of fats (Chakrabarti et al. 1995; Day et al.
2011). Moreover, noticeable activities of maltase,
trehalase, dextrin-a-(1–6) glucosidase and amylase
were present in the pyloric caeca of the milkfish
Chanos chanos (Chiu and Benitez 1981). According to
our data, the pyloric caeca show similar or even higher
cumulative activities of the studied enzymes com-
pared to those found in the intestine. The higher
cumulative activity of enzymes per segment mass
could be explained by the greater mass of segments
(both for pyloric caeca and for gut fragments) relative
to the mucosa mass in these intestinal regions. These
data suggest the considerable contribution of the
pyloric caeca to the digestion of the burbot.
pH and temperature dependence of enzyme
activities
It is known that both in the stomach and in the intestine
of fishes, the pH values are generally outside the
optima cited for a number of digestive enzymes (Chiu
and Benitez 1981; Deguara et al. 2003). These findings
accord with our data on the burbot proteolytic activity:
stomach proteinases displayed higher activity at pH 3,
while the actual pH values in this part of the digestive
tract averaged 5.08 ± 0.43. As it was shown by other
authors (Sabapathy and Teo 1993; Deguara et al.
2003), the pH values in the intestine are significantly
different from those in the stomach. In some fishes,
pepsin activity is found exclusively in the stomach
(Deguara et al. 2003). However, according to other
reports, a fairly high pepsin activity is also present in
the intestine (Sabapathy and Teo 1993). Besides, the
pH values have a greater effect on the pepsin activity
that drops to zero at pH 5. At the same time, the
trypsin-like enzymes with pH optima between 7 and 8
remain active between 3 and 5 (de la Parra et al. 2007).
The above explains why the proteolytic activity in the
burbot’s stomach is manifested at both pH values 3
and 6.
Our research also showed that all the enzyme
activities tested both in the gut and in the pyloric caeca
grew as the temperature increased. A rise in digestive
enzyme activity with temperature was noted by many
authors (Chiu and Benitez 1981; Jonas et al. 1983;
Kuz’mina 2001). Our data suggest a particular sensi-
tivity of intestinal proteinases in the burbot to an
increase in temperature compared to the other
enzymes.
Distribution of enzyme activity along the intestine
in various fish species
The available data testify to a great diversity in
distribution of enzyme activities along the digestive
tract in fishes with different feeding preferences
(Table 6). Along with the above species differences,
the activity of digestive hydrolases reveals consider-
able individual variability, including both activity
levels and distribution patterns of the same enzymes
(Ugolev and Kuz’mina 1994; Kuz’mina 2001). The
lack of correspondence between the available data on
the distribution of enzyme activity along the fish gut
can have multiple causes, such as differences in life
patterns of the fish, their feeding habits and diet, age,
physiological state and health of the individuals,
season of investigation, arbitrary segmentation of the
gut, different methods of enzyme assay, and other
factors hard to identify. Moreover, it was shown that
the activity pattern is essentially influenced by the way
of activity expression (e.g., either in terms of mucosa
mass unit or in terms of length and surface area of the
intestine) (Kuz’mina et al. 1982), which is also
supported by the results of the present study.
Our data on the activity distributions of digestive
enzymes in the intestine of the burbot, along with some
other reports (Tengjaroenkul et al. 2000; Deguara et al.
2003; Lundstedt et al. 2004; Sklan et al. 2004), confirm
the well-established concepts on the functioning of
digestive hydrolases in fish (Kuz’mina 2001). Taken
together, these findings show that owing to its
extraordinary plasticity, inclusive of variable func-
tional topography, the enzyme system of the intestinal
mucosa plays a significant role in effective nutrition of
fish. The results of these studies also suggest that
various methods for enzyme activity expression could
reflect different aspects of digestion physiology, thus
Fish Physiol Biochem (2013) 39:1181–1193 1191
123
leading to opposite conclusions on the relative signif-
icance of different gut portions in digestion.
Conclusions
Our research has shown considerable variations in pH
values, mucosa mass, content of soluble protein and
activity of digestive enzymes along the gastrointesti-
nal tract of the burbot. The evaluation of the enzyme
activity levels and the determination of activity
distribution along the gut were greatly influenced by
the method of expression of the measured activity.
Based on the A/P ratio values (amylolytic activity
divided by the proteolytic activity), proteinases have a
greater contribution to digestion in the intestine than in
the pyloric caeca. Also, the activity of proteinases
appears to be more temperature-dependent in com-
parison with other enzymes. In the pyloric caeca, the
greater mass of mucosa and higher protein content
compared to those in the intestine were found. As a
consequence, for the majority of calculation methods,
the cumulative activities of each tested enzyme in the
pyloric caeca were comparable to or even higher than
those in the intestine, suggesting the essential role of
the pyloric caeca in the digestion of the burbot.
References
Alarcon FJ, Martınez TF, Barranco P, Cabello T, Dıaz M,
Moyano FJ (2002) Digestive proteases during development
of larvae of red palm weevil, Rhynchophorus errugineus
(Olivier, 1790) (Coleoptera: Curculionidae). Insect Bio-
chem Mol Biol 32:265–274. doi:10.1016/s0965-1748(01)
00087-x
Anson M (1938) The estimation of pepsin, tripsin, papain and
cathepsin with hemoglobin. J Gen Physiol 22:79–83. doi:
10.1085/jgp.22.1.79
Bakke AM, Glover C, Krogdahl A (2010) Feeding, digestion
and absorption of nutrients. In: Farrell AP, Brauner CJ
(eds) The multifunctional gut of fish. Fish physiology, vol
30. Academic Press, London, Burlington, San Diego,
pp 57–110. doi:10.1016/S1546-5098(10)03002-5
Bradford MM (1976) A rapid and sensitive method for the
quantitation of microgram quantities of protein utilizing
the principle of protein-dye binding. Anal Biochem
72:248–254. doi:10.1016/0003-2697(76)90527-3
Chakrabarti I, Gani Md A, Chaki KK, Sur R, Misra KK (1995)
Digestive enzymes in 11 freshwater teleost fish species in
relation to food habit and niche segregation. Comp Bio-
chem Physiol A 112:167–177. doi:10.1016/0300-9629(95)
00072-f
Chan AS, Horn MH, Dicksonand KA, Gawlicka A (2004)
Digestive enzyme activities in carnivores and herbivores:
comparisons among four closely related prickleback fishes
(Teleostei: Stichaeidae) from a California rocky intertidal
habitat. J Fish Biol 65:848–858. doi:10.1111/j.1095-8649.
2004.00495
Chiu YN, Benitez LV (1981) Studies on the carbohydrases in the
digestive tract of the milkfish Chanos chanos. Mar Biol
61:247–254. doi:10.1007/BF00386667
Clements KD, Raubenheimer D (2005) Feeding and nutrition.
In: Evans DH, Claiborne JB (eds) The physiology of fishes,
3rd edn. CRC Press, Boca Raton, pp 47–82
Day RD, German DP, Manjakasy JM, Farr I, Hansen MJ,
Tibbetts IR (2011) Enzymatic digestion in stomachless
fishes: how a simple gut accommodates both herbivory and
carnivory. J Comp Physiol B 81:603–613. doi:10.1007/
s00360-010-0546-y
de la Parra AM, Rosas A, Lazo JP, Viana MT (2007) Partial
characterization of the digestive enzymes of Pacific bluefin
tuna Thunnus orientalis under culture conditions. Fish
Physiol Biochem 33:223–231. doi:10.1007/s10695-007-
9134-9
Deguara S, Jauncey K, Agius C (2003) Enzyme activities and
pH variations in the digestive tract of gilthead sea bream.
J Fish Biol 62:1033–1043. doi:10.1046/j.1095-8649.2003.
00094.x
Fange R, Grove D (1979). Digestion. In: Hoar WS, Randall DJ,
Brett JR (eds) Fish physiology, vol 8. Academic Press,
New York, San Francisco, London, pp 162–260. doi:
10.1016/S1546-5098(08)60027-8
Gawlicka A, Parent B, Horn MH, Ross N, Opstad I, Torrissen OJ
(2000) Activity of digestive enzymes in yolk-sac larvae of
Atlantic halibut (Hippoglossus hippoglossus): indication of
readiness for first feeding. Aquaculture 184:303–314. doi:
10.1016/s0044-8486(99)00322-1
Hardewig I, Portner HO, van Dijk P (2004) How does the cold
stenothermal gadoid Lota lota survive high water temper-
atures during summer? J Comp Physiol B 174:149–156.
doi:10.1007/s00360-003-0399-8
Jonas E, Ragyanszki M, Olah J, Boross L (1983) Proteolytic
digestive enzymes of carnivorous (Silurus glanis L.), her-
bivorous (Hypophthalmichthys molitrix Val.) and omniv-
orous (Cyprinus carpio L.) fishes. Aquaculture
30:145–154. doi:10.1016/0044-8486(83)90158-8
Kapoor BG, Smit H, Verigina IA (1975) The alimentary canal
and digestion in teleosts. Adv Mar Biol 13:109–239. doi:
10.1016/s0065-2881(08)60281-3
Kuperman BI, Kuz’mina VV (1994) The ultrastructure of the
intestinal epithelium in fishes with different types of
feeding. J Fish Biol 44:181–193. doi:10.1006/jfbi.1994.
1018
Kuz’mina VV (1979) The distribution of a-amylase along the
gut in freshwater teleosts. J Ichthyol 19:698–708
Kuz’mina VV (1995) The defensive function of alimentary tract
in fishes. J Ichthyol 35:86–93
Kuz’mina VV (1996) Influence of age on digestive enzyme
activity in some freshwater teleosts. Aquaculture
148:25–37. doi:10.1016/s0044-8486(96)01370-1
Kuz’mina VV (2001) Physiological adaptations (by the example
of the exotrophy process in fish). J Evol Biochem Physiol
37:285–299. doi:10.1023/a:1012627625563
1192 Fish Physiol Biochem (2013) 39:1181–1193
123
Kuz’mina VV (2008) Classical and modern concepts in fish
digestion. In: Cyrino JEP, Bureau DP, Kapoor BG (eds)
Feeding and digestive functions of fishes. Science Pub-
lishers, Enfield, pp 85–154
Kuz’mina VV, Poddubnyi AG, Landsberg DE (1982) The role
of enzymatic activity estimation methods in studying
digestion in fish at the population level. J Ichthyol
22:165–166
Lundstedt LM, Melo JFB, Moraes G (2004) Digestive enzymes
and metabolic profile of Pseudoplatystoma orruscans
(Teleostei: Siluriformes) in response to diet composition.
Comp Biochem Physiol B 137:331–339. doi:10.1016/
j.cbpc.2003.12.003
Prabhakaran SK, Kamble ST (1995) Purification and charac-
terization of an esterase isozyme from insecticide resistant
and susceptible strains of German cockroach, Blattella
germanica (L.). Insect Biochem Mol Biol 25:519–524. doi:
10.1016/0965-1748(94)00093-e
Sabapathy U, Teo LH (1993) A quantitative study of some
digestive enzymes in the rabbitfish, Siganus canaliculatus
and the sea bass, Lates calcarifer. J Fish Biol 42:595–602.
doi:10.1006/jfbi.1993.1062
Sklan D, Prag T, Lupatsch I (2004) Structure and function of the
small intestine of the tilapia Oreochromis niloticus 9
Oreochromis aureus (Teleostei, Cichlidae). Aquaculture
Res 35:350–357. doi:10.1111/j.1365-2109.2004.01020.x
Tengjaroenkul B, Smith BJ, Caceci T, Smith SA (2000) Dis-
tribution of intestinal enzyme activities along the intestinal
tract of cultured Nile tilapia, Oreochromis niloticus L.
Aquaculture 182:317–327. doi:10.1016/s0044-8486(99)
00270-7
Ugolev AM, Iezuitova NN (1985) Membrane digestion.
Structural and functional organization. Uspekhi Fiz-
iologicheskikh Nauk (Advances in Physiological Sciences)
16:3–34
Ugolev AM, Kuz’mina VV (1992) Distribution of digestive
enzyme activity in epithelial, submucosal and musculos-
erous layers of fish intestine. Doklady RAS 326:566–569
Ugolev AM, Kuz’mina VV (1994) Fish enterocyte hydrolases.
Nutrition adaptations. Comp Biochem. Physiol A 107:187–
193. doi:10.1016/0300-9629(94)90292-5
Fish Physiol Biochem (2013) 39:1181–1193 1193
123