Variation in essential oil composition of Ocimum americanum L. from north-western Himalayan region
14
This article was downloaded by: [University Of South Australia Library] On: 29 September 2013, At: 19:57 Publisher: Taylor & Francis Informa Ltd Registered in England and Wales Registered Number: 1072954 Registered office: Mortimer House, 37-41 Mortimer Street, London W1T 3JH, UK Journal of Essential Oil Research Publication details, including instructions for authors and subscription information: http://www.tandfonline.com/loi/tjeo20 Variation in essential oil composition of Ocimum americanum L. from north-western Himalayan region S. Singh , G. Tewari a , C. Pande a & C. Singh a a Department of Chemistry , Kumaun University , Nainital , 263 002 , Uttarakhand , India Published online: 20 Mar 2013. To cite this article: S. Singh , G. Tewari , C. Pande & C. Singh (2013) Variation in essential oil composition of Ocimum americanum L. from north-western Himalayan region, Journal of Essential Oil Research, 25:4, 278-290, DOI: 10.1080/10412905.2013.775079 To link to this article: http://dx.doi.org/10.1080/10412905.2013.775079 PLEASE SCROLL DOWN FOR ARTICLE Taylor & Francis makes every effort to ensure the accuracy of all the information (the “Content”) contained in the publications on our platform. However, Taylor & Francis, our agents, and our licensors make no representations or warranties whatsoever as to the accuracy, completeness, or suitability for any purpose of the Content. Any opinions and views expressed in this publication are the opinions and views of the authors, and are not the views of or endorsed by Taylor & Francis. The accuracy of the Content should not be relied upon and should be independently verified with primary sources of information. Taylor and Francis shall not be liable for any losses, actions, claims, proceedings, demands, costs, expenses, damages, and other liabilities whatsoever or howsoever caused arising directly or indirectly in connection with, in relation to or arising out of the use of the Content. This article may be used for research, teaching, and private study purposes. Any substantial or systematic reproduction, redistribution, reselling, loan, sub-licensing, systematic supply, or distribution in any form to anyone is expressly forbidden. Terms & Conditions of access and use can be found at http:// www.tandfonline.com/page/terms-and-conditions
Transcript of Variation in essential oil composition of Ocimum americanum L. from north-western Himalayan region

This article was downloaded by: [University Of South Australia Library]On: 29 September 2013, At: 19:57Publisher: Taylor & FrancisInforma Ltd Registered in England and Wales Registered Number: 1072954 Registered office: Mortimer House,37-41 Mortimer Street, London W1T 3JH, UK
Journal of Essential Oil ResearchPublication details, including instructions for authors and subscription information:http://www.tandfonline.com/loi/tjeo20
Variation in essential oil composition of Ocimumamericanum L. from north-western Himalayan regionS. Singh , G. Tewari a , C. Pande a & C. Singh aa Department of Chemistry , Kumaun University , Nainital , 263 002 , Uttarakhand , IndiaPublished online: 20 Mar 2013.
To cite this article: S. Singh , G. Tewari , C. Pande & C. Singh (2013) Variation in essential oil composition ofOcimum americanum L. from north-western Himalayan region, Journal of Essential Oil Research, 25:4, 278-290, DOI:10.1080/10412905.2013.775079
To link to this article: http://dx.doi.org/10.1080/10412905.2013.775079
PLEASE SCROLL DOWN FOR ARTICLE
Taylor & Francis makes every effort to ensure the accuracy of all the information (the “Content”) containedin the publications on our platform. However, Taylor & Francis, our agents, and our licensors make norepresentations or warranties whatsoever as to the accuracy, completeness, or suitability for any purpose of theContent. Any opinions and views expressed in this publication are the opinions and views of the authors, andare not the views of or endorsed by Taylor & Francis. The accuracy of the Content should not be relied upon andshould be independently verified with primary sources of information. Taylor and Francis shall not be liable forany losses, actions, claims, proceedings, demands, costs, expenses, damages, and other liabilities whatsoeveror howsoever caused arising directly or indirectly in connection with, in relation to or arising out of the use ofthe Content.
This article may be used for research, teaching, and private study purposes. Any substantial or systematicreproduction, redistribution, reselling, loan, sub-licensing, systematic supply, or distribution in anyform to anyone is expressly forbidden. Terms & Conditions of access and use can be found at http://www.tandfonline.com/page/terms-and-conditions

Variation in essential oil composition of Ocimum americanum L. from north-westernHimalayan region
S. Singh, G. Tewari*, C. Pande and C. Singh
Department of Chemistry, Kumaun University, Nainital 263 002, Uttarakhand, India
(Received 8 April 2012; final form 21 January 2013)
The essential oils of ten wild growing Ocimum americanum L. of the family Lamiaceae collected from differentlocations in Uttarakhand, India, were analyzed by capillary gas chromatography (GC) and GC/mass spectrometry(GC/MS). On the basis of chemical composition and cluster analysis, O. americanum was classified into six groups.Group I was significantly rich in methyl chavicol, 1,8-cineole, (E)-γ-bisabolene, β-bisabolene and eugenol, whilegroup II has (E)-γ-bisabolene, aliphatic hydrocarbons, eugenol, β-bisabolene and methyl chavicol as major constitu-ents. Eugenol and (E)-caryophyllene were found in abundant quantity in group III and linalool with methyl chavicolin group IV. Group V contained aliphatic hydrocarbons, eugenol, camphor and 1,8-cineole in high content while cam-phor and aliphatic hydrocarbons were found in group VI. Linalool was positively correlated with methyl chavicol,while eugenol with (E)-α-bisabolene and β-bisabolene with (E)-γ-bisabolene. The essential oil composition of O.amercanum was found to be affected by variation in soil properties and microclimatic conditions.
Keywords: Ocimum americanum L; groups; eugenol; methyl chavicol; camphor; linalool; δ-cadinene; bisabolenes
1. Introduction
Ocimum species (basil) is an annual, aromatic,branched herb, 30–150 cm high. The plant has beenused for medicinal purposes as a digestive stimulantand for treatment of insomnia and constipation. Theoils of basil have been used principally in the food andcosmetic industries (1, 2). Some of the volatile com-pounds of Ocimum have been suggested as allelopathicagents (3). Essential oil of O. americanum has antibac-terial activity against Staphylococcus aureus, Strepto-mycespyo genes, Escherichia coli, Streptococcusmutans, Candida albicans and Salmonella typhos (4).The oil of O. americanum also has antifungal activityagainst a great number of fungi including some humanpathogens (5). On the basis of the available data, it hasbeen found that Ocimum species has various chemo-types. Essential oils compositions of twelve varieties ofbasil grown in Colombia were found with the existenceof three chemotypes (6). Ocimum basilicum alsoshowed chemotaxonomical variations (7, 8) Terpinene-4-ol chemotype has been reported from O. americanumalong with other chemotypes (9–11). The genus Oci-mum has a large number of subspecies and varietiesdue to abundant cross-pollination. To the best of ourknowledge, no work has been done on the chemicalvariability of Ocimum americanum growing wild inUttarakhand. Therefore, the aim of present study wasto classify this species on the basis of chemicalmarkers.
2. Materials and methods
2.1. Plant collection and identification
Fresh plant materials of O. americanum L. at floweringstage along with its soil samples (0–20 cm) were col-lected in August to November 2008 from ten locations,namely Rudrapur (29°30′N, 79°28′E), Nainital (29°23′N, 79°30′E), Banbasa (28°59′N, 80°04′E), Rushi vil-lage (29°23′N, 79°30′E), Champawat (29°36′N, 79°30′E), Almora (29°37′N, 79°40′E), Kilbury (29°23′N, 79°30′E), Dhoulchina (29°37′N, 79°40′E), Mussoorie (30°27′N, 78°06′E) and Dharchula (29°51′00′′N: 80°31′60′′E) in Kumaun Himalaya (Uttarakhand, India). Ocimumamericanum plants were in full blooming stage. Thebotanical identification of the specimen was done at theBotany Department, Kumaon University, Nainital, andsubmitted to the Botanical Survey of India, Dehradun(Voucher no. 33483).
2.2. Physicochemical properties of soil properties
The soil pH and EC was determined in 1:2 soil/watersuspension (12), the soil organic carbon content wasdetermined by the Walkley and Black method and thetexture was determined by the hydrometer method (13).The cation exchange capacity was measured by theNH4
+ saturation method given by Chapman (14). Thetotal metal content of the soils was determined in aquaregia digests (15). The water holding capacity of thesoils was determined by using Hilgard apparatus (16).
*Corresponding author. Email: [email protected]
The Journal of Essential Oil Research, 2013Vol. 25, No. 4, 278–290, http://dx.doi.org/10.1080/10412905.2013.775079
� 2013 Taylor & Francis
Dow
nloa
ded
by [
Uni
vers
ity O
f So
uth
Aus
tral
ia L
ibra
ry]
at 1
9:57
29
Sept
embe
r 20
13

Table
1.Phy
sicochem
ical
prop
ertiesof
soils.
General
soil
prop
erties
Banbasa
Rushi
Champawat
Nainital
Dho
ulchina
Rud
rapu
rDharchu
laAlm
ora
Kilb
ury
Mussoorie
Mechanical
analysis
Sand(%
)76
.0±0
.00
82.0±1
.00
78.0±0
.00
66.0±0
.00
76.0±0
.00
66.0±1
.00
73.0±1
.00
84.0±0
.00
68.0±0
.00
46.0±0
.00
Silt
(%)
18±1
.00
16±0
.00
12±1
.00
20±0
.00
22±0
.00
22±0
.00
26±0
.014
±0.00
26±0
.00
40.0±1
.00
Clay(%
)6.0±
0.00
2.0±
0.00
8.0±
0.00
16.0±0
.00
2.0±
0.00
16.0±0
.00
2.0±
0.00
2.0±
0.00
6.0±
0.00
14.0±0
.00
Texture
Loamysand
Loamysand
Loamysand
Sandy
loam
Sandy
loam
Sandy
loam
Sandy
loam
Loamysand
Sandy
loam
Other
soil
prop
-erties
pH(1:2)
7.44
±0.040
6.00
±0.130
5.61
±0.050
7.09
±0.070
8.2±
0.06
05.83
±0.060
7.17
±0.030
7.32
±0.110
7.41
±0.040
7.65
±.0.33
0EC
0.34
0±0.00
40.01
6±0.00
40.07
4±0.00
90.18
9±0.00
60.02
5±0.00
40.111±
0.00
10.19
5±0.02
10.05
9±0.00
60.32
3±0.00
50.14
2±0.00
4O.C.%
3.26
±0.005
1.54
5±0.00
63.22
8±0.00
63.83
1±0.00
70.66
8±0.011
1.70
6±0.09
83.93
1±0.05
21.20
2±0.00
63.00
4±0.01
54.52
1±0.03
9CEC
42.40±
0.04
044
.51±
0.04
025
.76±
0.09
029
.38±
0.04
014
.81±
0.07
010
.26±
0.05
042
.40±
0.50
019
.72±
0.05
028
.53±
0.05
025
.89±
0,06
0WHC
46.08±
0.07
039
.65±
0.05
039
.57±
0.06
037
.92±
0.05
036
.10±
0.06
053
.28±
0.07
040
.13±
0.06
049
.69±
0.07
058
.51±
0.05
020
.28±
0.05
0Total content
(mg/kg
)Zn
91.677
±0.012
49.466
±0.026
40.5±0
.016
55.307
±0.223
27.600
±0.035
35.05±
0.02
390
.358
±0.005
73.021
±0.094
54.281
±0.012
33.920
±0.021
Fe
559.24
8±0.01
757
2.68
7±0.00
953
6.47
7±0.01
256
0.115±
0.01
049
3.35
0±0.28
055
9.68
2±0.01
355
0.57
8±0.05
155
6.64
7±0.02
552
2.06
4±0.01
552
0.00
0±0.16
0Cu
15.550
±0.012
12.900
±0.063
15.300
±0.053
16.250
±0.013
10.500
±0.031
24.630
±0.014
11.125
±0.037
28.350
±0.079
19.825
±0.029
21.080
±0.110
Mn
348.02
3±0.112
323.89
4±4.00
526
4.39
6±0.02
716
5.90
9±0.47
384
.775
±0.086
160.07
3±0.07
817
1.19
3±0.01
035
2.77
8±0.01
322
0.89
7±0.99
998
.999
±0.301
Available
content
(mg/kg
)Zn
12.262
±0.018
1.32
4±0.00
27.36
8±0.00
62.71
0±0.01
03.95
4±0.02
26.38
4±0.01
08.93
0±0.15
69.45
2±0.02
90.98
4±0.02
01.46
6±0.01
0Fe
57.980
±0.005
35.380
±0.015
28.770
±0.490
22.646
±0.005
16.016
±0.005
36.676
±0.003
95.954
±0.008
29.940
±0.011
91.701
±0.013
35.844
±0.045
Cu
7.32
6±0.01
50.52
6±0.02
31.83
0±0.01
40.15
0±0.02
01.14
8±0.10
21.119±
0.00
80.35
9±0.00
22.25
6±0.02
41.82
0±0.09
00.32
4±0.01
4Mn
17.396
±0.167
6.68
0±0.27
315
.430
±1.260
7.07
6±0.57
72.06
0±0.13
814
.278
±0.471
3.16
0±0.53
014
.560
±0.090
17.108
±1.807
15.169
±0.157
Macronu
-trients(%
)N(av)
0.00
65±0
.00
0.01
45±0
.00
0.00
83±0
.001
0.00
56±0
.002
0.00
47±0
.001
0.01
07±0
.001
0.00
42±0
.00
0.01
03±0
.001
0.00
87±0
.00
224.00
±0.680
N(tot)
0.34
8±0.08
40.27
6±0.04
90.18
0±0.01
50.20
0±0.06
50.16
3±0.00
50.30
0±0.00
70.03
0±0.01
50.23
5±0.05
70.03
6±0.00
20.02
3±0.01
3P
0.00
24±0
.001
0.00
9±0.00
30.00
14±0
.00
0.00
26±0
.001
0.00
25±0
.00
0.00
3±0.00
10.00
3±0.00
20.00
19±0
.00
0.00
28±0
.001
0.00
3±0.00
1K
0.00
90±0
.00
0.01
90±0
.00
0.01
32±0
.00
0.01
63±0
.002
0.00
90±0
.001
0.02
18±0
.008
0.02
44.±0.00
20.01
00±0
.005
0.00
57±0
.002
0.00
60±0
.002
Notes:EC,electrical
conductiv
ity(dS/cm);O.C.%
,organiccarbon
;CEC,catio
nexchange
capacity
(cmol/kg);WHC,water
holdingcapacity;(av),available;
(tot),total.
The Journal of Essential Oil Research 279
Dow
nloa
ded
by [
Uni
vers
ity O
f So
uth
Aus
tral
ia L
ibra
ry]
at 1
9:57
29
Sept
embe
r 20
13

Total nitrogen was determined by the Kjeldhal method(17). Available phosphorus in the soil was determinedby Olsen’s method and potassium estimation was doneby using a flame photometer (16). Soil samples wereextracted for DTPA extractable metals following theprocedure developed by Lindsay and Norvell (18). Theproperties of the soil samples taken for this study aregiven in Table 1, and climatic and some other proper-ties are given in Table 2.
2.3. Preparation of plant samples for micronutrientanalysis
The collected plant material were washed sequentiallywith tap water, 0.1 N HCl solution and finally with dis-tilled water. Dry plant tissue was finely ground and wetashed using HNO3:H2SO4:HClO4 (10:1:4 v/v) (19).
2.4. Heavy metal analysis in soil and plant samples
Concentrations of Zn, Cu, Mn and Fe in prepared plantand soil samples were analyzed by atomic absorptionspectrophotometer (GBC-902 and Avanta sigmaModels).
2.5. Isolation of essential oil
One kilogram of fresh aerial plant material was steamdistilled for 3 hours using a copper still fitted withspiral glass condensers and extracted with 80 mLn-hexane and 40 mL dichloromethane. The organicphase was dried over anhydrous sodium sulfate and thesolvent removed by distillation using a thin film rotaryvacuum evaporator at 25–30°C. The oil yield was0.36–0.98% (v/w).
2.6. Analysis of the essential oil
The oil was analyzed by using a Perkin Elmer Autosys-tem XL gas chromatograph (GC). The column tempera-ture was programmed from 70° to 290° at 3°C/minuteusing hydrogen as the carrier gas at 10 psi columnhead pressure. The injector temperature was 220°C anddetector (flame ionization, FID) temperature was290°C. The GC/mass spectrometer (GC/MS) used wasan Autosystem XL GC (Equity-5, 60 m � 0.32 mm �0.25 μm i.d., FID) coupled with a Perkin Elmer Turbo-mass fitted with a fused silica capillary column(Equity-5; 60 m � 0.32 mm � 0.25 μm film thick-ness). The column temperature ranged from 70° to300°C at 3°C/minute using helium as the carrier gas.The injector temperature was 220°C, and the injectionvolume 0.05 μL in n-hexane, with a split ratio of 1:50.MS were taken at 70 eV with a mass range of 40–450amu (oil from Nainital, Banbasa, Rushi, Champawat,Almora, Kilbury, Dhoulchina, Mussoorie andDharchula). Oil from Rudrapur was analyzed by Nucon5765 gas chromatograph (Rtx-5 column, 30 m � 0.32mm, FID), split ratio 1:48, N2 flow of 4 kg/cm2 andT
able
2.Geographicandoilprop
erties.
Microclim
atic
cond
ition
sandotherprop
erties
Banbasa
Rushi
Champawat
Nainital
Dho
ulchina
Rud
rapu
rDharchu
laAlm
ora
Kilb
ury
Mussoorie
Altitude
(m)
375
1620
1650
1950
1800
243
2283
1550
2220
1600
Tem
perature
(°C)
3024
2520
2437
2130
1922
Plant
height
21.0±0
.200
25.0±0
.600
23.5±0
.400
27.5±0
.400
27.5±0
.300
16.0±0
.200
29.5±0
.700
12.5±0
.700
45.3±0
.500
22.5±0
.400
Sun
/shady
side
Sun
nyShady
Sun
nySun
nySun
nySun
nySun
nyShady
Shady
Sun
nyMon
thof
collectionin
2008
September
Aug
ust
September
September
Aug
ust
Aug
ust
Aug
ust
September
September
September
Oilcolor
Darkyello
wYellow
Yellow
Yellow
Light
yello
wDarkyello
wDarkyello
wLight
yello
wYellow
Yellow
Oil%
0.36
0.48
0.54
0.60
0.84
0.42
0.98
0.36
0.60
0.38
280 S. Singh et al.
Dow
nloa
ded
by [
Uni
vers
ity O
f So
uth
Aus
tral
ia L
ibra
ry]
at 1
9:57
29
Sept
embe
r 20
13

Table
3.Chemical
compo
sitio
nof
Ocimum
american
umcollected
from
differentsites.
S.
No.
Com
poun
dsa
RIb
RIc
Typ
eI
Type
IITyp
eIII
Type
IVTyp
eV
Typ
eVI
Rud
rapu
r,24
3m
Nainital,
1950
mBanbasa,
375m
Rushi,
1620
mChampawat,
1650
mAlm
ora,
1550
mKilb
ury,
2220
mDho
ulchina,
1800
mMussoorie,
1600
mDharchu
la,
2283
m
1α-Thu
jene
(MH)
930
924
––
––
––
0.3
––
–2
α-Pinene(M
H)
939
932
––
––
0.6
–0.4
––
t3
Sabinene(M
H)
975
969
––
tt
0.1
t0.2
–0.3
t4
β-Pinene(M
H)
979
974
t0.2
t0.3
tt
––
1.6
t5
3-Octanone(A
C)
983
979
––
––
0.5
t–
––
–6
β-Myrcene
(MH)
990
988
0.3
–t
0.1
0.2
––
–0.2
0.2
7α-Terpinene
(MH)
1017
1014
–t
–t
––
––
0.3
–8
p-Cym
ene(M
H)
1024
1020
0.2
––
––
0.3
–0.2
–t
9Lim
onene(M
H)
1029
1024
t–
0.2
0.2
0.1
0.2
1.1
–t
0.1
101,8-Cineole
(OM)
1031
1026
t4.5
12.4
10.3
16.8
11.5
28.4
1.2
0.7
t11
(Z)-β-Ocimene(M
H)
1037
1032
t–
––
4.9
–1.0
––
0.6
12(E)-β-Ocimene(M
H)
1050
1044
t1.6
1.2
3.8
–0.2
––
0.4
–13
γ-Terpinene(M
H)
1059
1054
––
––
t–
–0.3
0.8
–14
Linaloo
l(O
M)
1096
1095
tt
––
t2.2
3.0
2.9
0.4
14.2
15(E)-Sabinenehy
drate
(MH)
1099
1098
––
––
0.4
2.8
1.8
––
–
16Cam
phor
(OM)
1146
1141
––
––
–49
.442
.00.5
23.0
–17
δ-Terpineol
(OM)
1166
1162
t–
––
0.2
1.9
0.9
0.4
–18
Borneol
(OM)
1169
1165
t–
t0.2
––
––
0.4
–19
Terpinen-4-ol(O
M)
1177
1174
––
––
0.1
–2.0
–1.0
–20
Iso-Menthol(O
M)
1182
1179
––
––
––
0.5
––
–21
α-Terpineol
(OM)
1188
1186
–0.3
0.4
0.4
0.6
3.8
2.2
1.1
––
22Myrtenol(O
M)
1195
1194
––
––
–3.3
––
0.9
–23
Methy
lchavicol
(PP)
1196
1195
–1.7
10.2
11.7
12.9
–1.3
28.9
–78
.324
Chavicol(PP)
1250
1247
–7.8
0.4
0.8
0.1
–0.5
0.5
0.5
0.3
25Thy
mol
(OM)
1290
1289
––
––
––
–0.3
––
262E
,4Z-D
ecadienal
(OM)
1293
1292
––
––
––
––
1.7
–
27δ-Elemene(SH)
1338
1335
––
–0.2
––
–0.2
––
28Eug
enol
(PP)
1359
1356
45.2
37.8
38.2
31.8
27.6
–8.6
14.7
––
29α-Cop
aene
(SH)
1376
1374
0.8
––
––
––
––
30β-Bou
rbon
ene(SH)
1386
1387
0.5
––
––
––
––
–31
D-Elemene(SH)
1390
1388
––
t–
––
––
0.6
–32
Methyleugenol
(PP)
1400
1403
14.8
––
––
––
––
–33
α-Cedrene
(OM)
1411
1410
t–
––
––
––
––
34Thy
moh
ydroqu
inon
edi
methy
lether(O
M)
1418
-–
––
––
––
0.3
––
35(E)-Caryo
phyllene
(SH)
1419
1417
30.2
1.2
1.0
1.8
2.3
1.0
0.6
1.6
2.4
0.5
36β-Gurjunene
(SH)
1433
1431
t–
––
––
––
–
(Contin
ued)
The Journal of Essential Oil Research 281
Dow
nloa
ded
by [
Uni
vers
ity O
f So
uth
Aus
tral
ia L
ibra
ry]
at 1
9:57
29
Sept
embe
r 20
13

Table3.
(Contin
ued)
S.
No.
Com
poun
dsa
RIb
RIc
Typ
eI
Typ
eII
Typ
eIII
Typ
eIV
Typ
eV
Typ
eVI
Rudrapur,
243m
Nainital,
1950
mBanbasa,
375m
Rushi,
1620
mChampawat,
1650
mAlm
ora,
1550
mKilb
ury,
2220
mDho
ulchina,
1800
mMussoorie,
1600
mDharchu
la,
2283
m
37(E)-α-Bergamotene
(SH)
1434
1432
–1.0
1.1
1.5
0.3
––
1.8
–T
38β-(E)-Farnesene
(SH)
1456
1454
–0.8
0.6
1.0
0.7
–0.2
––
0.5
39α-Hum
ulene(SH)
1454
1452
1.6
–1.3
1.6
1.3
–1.1
1.6
–0.3
40γ-Muu
rolene
(SH)
1480
1478
0.6
––
––
–41
Germacrene
D(SH)
1485
1484
0.8
5.4
2.8
4.0
3.6
1.6
0.5
1.4
4.4
0.7
42α-Selinene(SH)
1498
1498
––
––
––
––
–t
43Bicyclogerm
acrene
(SH)
1500
1500
––
––
–0.3
0.8
––
t
44(E),(E)-α-Farnesene
(SH)
1505
1505
t–
0.2
0.2
––
––
–0.1
45β-Bisabolene(SH)
1505
1505
–17
.812
.513
.59.9
–0.7
14.7
––
46(E)-γ-Bisabolene(SH)
1522
1529
t15
.814
.512
.59.8
0.6
–7.1
––
47Spathulenol
(OS)
1578
1577
––
––
–0.3
–0.7
–2.1
48Caryo
phyllene
oxide
(OS)
1583
1582
0.8
t–
0.2
––
–0.8
0.3
–
49Hum
uleneepox
ideII
(OS)
1608
1608
t–
––
––
––
––
5010
-Epi-γ-eud
esmol
(OS)
1623
1622
t–
––
––
––
––
51Epi-α-Cadinol
(OS)
1640
1638
t–
––
––
–0.2
0.2
–52
Cub
enol
(OS)
1646
1645
––
––
t–
––
––
53β-Eud
esmol
(OS)
1649
1650
t–
––
–54
α-Cadinol
(OS)
1654
1652
––
––
––
0.2
0.4
–55
(Z)-α-(E)-Bergamotol
(OS)
1690
1690
––
––
0.4
––
1.0
––
562(E),6(E)-Farnesol
(OS)
1743
1742
–0.3
0.3
0.5
––
––
––
57n-Octadecane(A
C)
1800
1800
––
––
––
––
10.9
–58
n-Non
adecane(A
C)
1900
1900
––
––
––
––
16.0
–59
Eicosane(A
C)
1988
1987
––
––
––
––
17.2
–60
Docosene<1>
(AC)
2182
2189
––
––
4.1
––
––
–61
n-Tetracosane
(AC)
2400
2400
––
––
–1.6
––
––
62Hexacosane(A
C)
2600
2600
––
––
–4.4
0.5
8.4
––
63Octacosane(A
C)
2800
2800
––
––
–5.4
0.6
––
–%
Identified
95.8
96.2
97.3
96.6
97.5
90.8
99.2
91.0
84.6
97.9
Notes:a M
odeof
identifi
catio
n:retentionindex,
coinjectionwith
standards/peak
enrichmentwith
know
noilconstituents.
bRetentio
nindicesdeterm
ined
ontheEquity
-5columnusingan
n-alkane
homol-
ogousseries
(C9–C
24).
c Retentio
nindicesfrom
theliterature(20).Boldtype
indicatesmajor
compo
nents,t,trace(<0.1%
);MH,mon
oterpene
hydrocarbons;OM,ox
ygenated
monoterpenes;SH,sesqui-
terpenes
hydrocarbons;OS,oxygenated
sesquiterpenes;AC,aliphatic
compounds;PP,
phenyl
propanoids.
282 S. Singh et al.
Dow
nloa
ded
by [
Uni
vers
ity O
f So
uth
Aus
tral
ia L
ibra
ry]
at 1
9:57
29
Sept
embe
r 20
13

Thermo Quest Trace GC 2000 interfaced with FinniganMAT Polaris Q Ion Trap Mass spectrometer fitted witha Rtx-5 (Restek Corp.) fused silica capillary column(30 m � 0.25 mm; 0.25 μm film coating). The columntemperature was programmed from 60° to 210°C at3°C/minute using helium as the carrier gas at1.0 mL/minute. The injector temperature was 210°C,injection size 0.1 μL prepared in n-hexane, split ratio1:40. MS were taken at 70 eV with a mass range of40–450 amu.
2.7. Identification of the components
Identification of constituents were done on the basis ofretention index [RI, determined with reference tohomologous series of n-alkanes (C9–C24, PolyscienceCorp., Niles, IL) under identical experimental condi-tion], co-injection with standards (Sigma) and knownessential oil constituents (standard isolates), MS Librarysearch (NIST: NIH version 2.1 and WILEY: 7thedition), by comparing with the MS literature data (20).The relative amounts of individual components were
calculated based on GC peak area (FID response)without using correction factor.
2.8. Statistical analysis
Experimental data were processed using MicrosoftExcel XP. Correlation coefficients were calculatedamong the major constituents of oil, micro- andmacronutrients, microclimatic conditions and physicalproperties of soil. The significance level of correlationcoefficient was checked on probability levels ofp60.05 and p60.01. Ward’s hierarchical clusteringanalysis of major constituents of essential oils was con-ducted in order to discriminate groups. All statisticalanalyses were performed using SPSS 16.0 and theresulting dendrogram was illustrated.
3. Results and discussion
3.1. Essential oil composition
The essential oil composition of aerial parts of ten sam-ples of O. americanum L., family Lamiaceae, collected
Figure 1. Gas chromatogram of the essential oil of Ocimum americanum L. from Banbasa.
The Journal of Essential Oil Research 283
Dow
nloa
ded
by [
Uni
vers
ity O
f So
uth
Aus
tral
ia L
ibra
ry]
at 1
9:57
29
Sept
embe
r 20
13
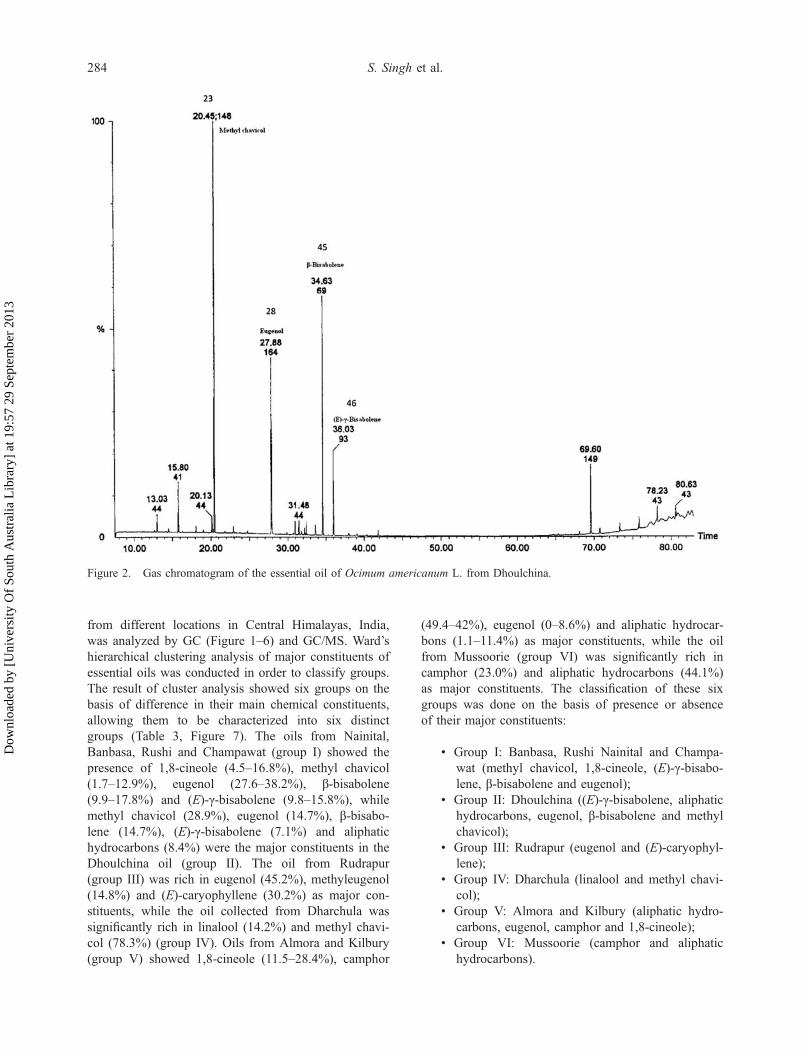
from different locations in Central Himalayas, India,was analyzed by GC (Figure 1–6) and GC/MS. Ward’shierarchical clustering analysis of major constituents ofessential oils was conducted in order to classify groups.The result of cluster analysis showed six groups on thebasis of difference in their main chemical constituents,allowing them to be characterized into six distinctgroups (Table 3, Figure 7). The oils from Nainital,Banbasa, Rushi and Champawat (group I) showed thepresence of 1,8-cineole (4.5–16.8%), methyl chavicol(1.7–12.9%), eugenol (27.6–38.2%), β-bisabolene(9.9–17.8%) and (E)-γ-bisabolene (9.8–15.8%), whilemethyl chavicol (28.9%), eugenol (14.7%), β-bisabo-lene (14.7%), (E)-γ-bisabolene (7.1%) and aliphatichydrocarbons (8.4%) were the major constituents in theDhoulchina oil (group II). The oil from Rudrapur(group III) was rich in eugenol (45.2%), methyleugenol(14.8%) and (E)-caryophyllene (30.2%) as major con-stituents, while the oil collected from Dharchula wassignificantly rich in linalool (14.2%) and methyl chavi-col (78.3%) (group IV). Oils from Almora and Kilbury(group V) showed 1,8-cineole (11.5–28.4%), camphor
(49.4–42%), eugenol (0–8.6%) and aliphatic hydrocar-bons (1.1–11.4%) as major constituents, while the oilfrom Mussoorie (group VI) was significantly rich incamphor (23.0%) and aliphatic hydrocarbons (44.1%)as major constituents. The classification of these sixgroups was done on the basis of presence or absenceof their major constituents:
• Group I: Banbasa, Rushi Nainital and Champa-wat (methyl chavicol, 1,8-cineole, (E)-γ-bisabo-lene, β-bisabolene and eugenol);
• Group II: Dhoulchina ((E)-γ-bisabolene, aliphatichydrocarbons, eugenol, β-bisabolene and methylchavicol);
• Group III: Rudrapur (eugenol and (E)-caryophyl-lene);
• Group IV: Dharchula (linalool and methyl chavi-col);
• Group V: Almora and Kilbury (aliphatic hydro-carbons, eugenol, camphor and 1,8-cineole);
• Group VI: Mussoorie (camphor and aliphatichydrocarbons).
Figure 2. Gas chromatogram of the essential oil of Ocimum americanum L. from Dhoulchina.
284 S. Singh et al.
Dow
nloa
ded
by [
Uni
vers
ity O
f So
uth
Aus
tral
ia L
ibra
ry]
at 1
9:57
29
Sept
embe
r 20
13

Table
4.Correlatio
nmatrix(r)am
ongiron
(Fe),copp
er(Cu)
insoilandplantwith
major
constituentsin
soil.
12
34
56
78
910
1112
1314
1516
S.No.
Fe
FeDTPA
FePlant
Cu
CuDTPA
CuPlant
1,8-
Cineole
Linaloo
lCam
phor
Methy
lchavicol
Eug
enol
(E)-Caryo
-ph
yllene
β-Bisabolene
δ-Cadinene
(E)-α-
Bisabolene
Alip
hatic
hydrocarbo
ns
11.00
0.05
90.18
60.24
20.34
70.10
80.34
8�0
.383
�0.364
0.01
90.25
0�0
.217
�0.228
21.00
0.47
6�0
.132
�0.093
0.60
0�0
.263
�0.533
�0.113
�0.493
�0.232
�0.351
0.67
6⁄
31.00
0.56
2�0
.371
0.51
9�0
.451
�0.369
�0.524
�0.085
�0.267
0.07
60.50
14
1.00
0.05
20.93
9⁄⁄
0.07
80.50
20.18
30.29
3�0
.359
0.16
5�0
.547
�0.109
�0.569
0.05
45
1.00
�0.173
0.18
0�0
.166
�0.106
�0.092
0.15
0�0
.221
0.27
3�0
.280
0.40
6�0
.073
61.00
0.07
20.59
60.30
90.34
7�0
.460
0.21
5�0
.678
⁄�0
.015
�0.747
⁄�0
.010
71.00
�0.219
0.48
9�0
.343
�0.031
�0.332
�0.027
�0.280
0.15
9�0
.316
81.00
�0.022
0.91
3⁄⁄
�0.571
�0.233
�0.382
0.04
6�0
.432
�0.145
91.00
�0.372
�0.615
�0.236
�0.584
�0.144
�0.496
0.33
810
1.00
�0.366
�0.237
�0.090
0.19
1�0
.216
�0.221
111.00
0.52
40.55
8�0
.145
0.67
1⁄�0
.531
121.00
�0.299
�0.107
�0.231
�0.133
131.00
0.33
90.78
8⁄⁄
�0.341
141.00
�0.294
0.05
815
1.00
�0.386
161.00
Notes:⁄ C
orrelatio
nissignificant
atthe0.05
level.
⁄⁄Correlatio
nissignificant
atthe0.01
level.
Table
5.Correlatio
nmatrix(r)betweenmicroclim
atic
cond
ition
sandmajor
constituentsof
essentialoil.
12
34
56
78
910
1112
1314
Tem
pAltitude
Oil%
Plant
height
1,8-
Cineole
Linaloo
lCam
phor
Methy
lchavicol
Eug
enol
(E)-
Caryo
phyllene
β-Bisabolene
δ-Cadinene
(E)-α-
Bisabolene
Alip
hatic
hydrocarbo
ns
11.00
�0.888
⁄⁄�0
.516
�0.757
⁄�0
.223
�0.330
�0.099
�0.280
0.47
50.76
2⁄�0
.195
�0.040
�0.084
�0.161
21.00
0.62
90.62
90.18
70.50
30.26
30.38
9�0
.646
⁄�0
.695
⁄�0
.002
0.13
1�0
.181
0.07
53
1.00
0.51
0�0
.232
0.78
5⁄⁄�0
.319
0.83
7⁄⁄
�0.327
�0.270
0.09
70.44
8�0
.248
�0.278
41.00
0.50
00.29
50.113
0.20
0�0
.239
�0.391
0.04
80.05
1�0
.063
�0.173
Notes:⁄ C
orrelatio
nissign
ificant
atthe0.05
level.
⁄⁄Correlatio
nissignificant
atthe0.01
level.
The Journal of Essential Oil Research 285
Dow
nloa
ded
by [
Uni
vers
ity O
f So
uth
Aus
tral
ia L
ibra
ry]
at 1
9:57
29
Sept
embe
r 20
13

The main component in the volatile leaf oil constit-uents of Ocimum americanum L. collected from Wes-tern Kenya was terpinen-4-ol (43.21%), followed by1,8-cineole (16.13%) and α-terpineol (4.01%) alongwith cis-sabinene hydrate (2.59%), α-bergamotene(2.68%) and trans-caryophyllene (3.06%) as minor con-stituents (9). Mondello et al. (10) have reported thepresence of two chemotypes of O. americanum. Onebeing the citral-type oil, according to its content ofneral (27.9%) and geranial (37.7%), whereas the otheroil was characterized by a high content of camphor(38.6%). In our report, the main constituents of oilswere different from these reports. Our results confirm ahigh variation in essential oil composition and thepresence of various chemotypes in O. americanum.Essential oil composition of O. americanum wasaffected by variation in soil properties and microclimat-ic conditions.
3.2. Correlations
All the statistically significant correlation coefficientsare given in Tables 4–6. Linalool was positivelycorrelated with methyl chavicol while eugenol with(E)-α-bisabolene and β-bisabolene with (E)-γ-bisabo-lene. Correlation analysis revealed that the essential oilcomposition was affected by variation in soil micronu-trients in soil and plant. Available iron was positivelycorrelated with aliphatic hydrocarbons, while total cop-per in plant was negatively correlated with β-bisaboleneand (E)-γ-bisabolene, indicating the role of iron andcopper in their biosynthesis in O. americanum (Tables4 and 5). Kanias et al. (21) found a significant negativecorrelation of iron, scandium and chromium with carva-crol and positive with thymol in Origanum vulgare,suggesting that these correlations could make probablerole of the particular elements in the biosynthesis of thepredominant compounds. Percentage oil yield was posi-tively correlated with linalool and methyl chavicol.Temperature was positively correlated with (E)-caryo-phyllene (Table 6). Several reports on phenol rich Lam-iaceae species have shown that their essential oilcompositions were significantly associated to climaticconditions (22, 23) and Vokou et al. (22) found that thesum of phenolic compounds was positively correlatedwith air temperature. Rahimmalek et al. (24) found thathigh level of inter- and intra-species chemical polymor-phism among Achillea species was due to genetic andenvironmental factors and their interactions. In ourstudy, the variation in chemical composition does notseem to be altitudinal/climatic; rather, it may begenetic. A similar study on the chemotypic variation ofessential oils in Anemopsis californica has largelyattributed it to genetic factors (25).
Iron in soil positively affects the biosynthesis of ali-phatic hydrocarbons and copper negatively affects theTa
ble6.
Correlatio
nmatrix(r)betweenph
ysical
prop
ertiesof
soilandmajor
constituentsof
essentialoil.
12
34
56
78
910
1112
1314
1516
1718
pHEC
OC%
CEC
WHC
Sand%
Silt%
Clay%
1,8-
Cineole
Linaloo
lCam
phor
Methy
lchavicol
Eug
enol
(E)-
Caryo
-ph
yllene
β-Bisabolene
δ-Cadinene
(E)-α-
Bisabolene
Alip
hatic
hydrocarbo
ns
11.00
0.29
90.05
2�0
.036
�0.173
�0.239
0.47
4�0
.236
0.14
2�0
.427
0.22
9�0
.430
0.14
30.30
7�0
.179
0.05
9�0
.137
0.21
22
1.00
0.58
10.37
80.40
6�0
.277
0.26
30.17
1�0
.406
�0.112
0.13
4�0
.099
�0.290
�0.005
�0.129
0.14
0�0
.252
0.59
43
1.00
0.43
2�0
.297
�0.634
⁄0.50
90.44
5�0
.573
�0.238
0.02
9�0
.260
0.09
50.48
2�0
.041
0.34
3�0
.303
0.20
84
1.00
�0.179
0.18
1�0
.056
�0.364
0.15
4�0
.534
0.16
2�0
.452
0.07
5�0
.049
0.18
10.06
50.13
00.09
75
1.00
0.29
5�0
.290
�0.071
0.03
60.43
60.31
80.30
3�0
.749
⁄�0
.536
�0.379
�0.232
�0.288
0.57
46
1.00
�0.900
⁄⁄�0
.711
⁄0.73
5⁄�0
.125
0.25
0�0
.135
�0.148
�0.813
⁄⁄0.37
4�0
.185
0.48
6�0
.130
71.00
0.35
3�0
.501
�0.036
�0.001
�0.080
0.10
90.81
7⁄⁄�0
.562
�0.043
�0.491
0.21
78
1.00
�0.766
⁄⁄0.51
0�0
.505
0.60
1�0
.013
0.36
9�0
.017
0.49
5�0
.377
�0.065
Notes:EC,electrical
conductiv
ity;OC%,organiccarbon;CEC,catio
nexchange
capacity;WHC,water
holdingcapacity.⁄ C
orrelatio
nis
significant
atthe0.05
level.
⁄⁄Correlatio
nis
significant
atthe
0.01
level.
286 S. Singh et al.
Dow
nloa
ded
by [
Uni
vers
ity O
f So
uth
Aus
tral
ia L
ibra
ry]
at 1
9:57
29
Sept
embe
r 20
13

synthesis of β-bisabolene and (E)-γ-bisabolene in O.americanum. Under warm conditions, the plant synthe-sizes more (E)-caryophyllene. In moist soils, there areless chances of the synthesis of eugenol.
AcknowledgementsThe author is grateful to the Director, USERC, Dehradun, forfinancial support and the Head, Chemistry Department,Kumaun University, Nainital, for providing the necessarylaboratory facilities and encouragement.
References1. J. Javanmardi, A. Khalighi, A. Kashi, H.P. Bais and J.M.
Vivanco, Chemical characterization of basil (Ocimumbasilicum L.) found in local assession and used in tradi-tional medicines in Iran. J. Agric. Food Chem., 50,5878–5883 (2002).
2. D.J. Charles and J.E. Simon, Comparison of extractionmethods for the rapid determination of essential oil con-tent and composition of basil. Am. Soc. Hort. Sci., 115,458–462 (1990).
3. J.E. Simon, J. Quinn and R.G. Murray, Basil: A source ofessential oils. In: Advances in New Crops. Edits., J.Janick and J.E. Simon, pp. 484–489, Timber Press, Port-land, OR (1990).
4. S. Thaweboon and B. Thaweboon, In vitro antimicrobialactivit of Ocimum americanum L. essential oil againstoral microorganisms. Southeast Asian J. Trop. Med. Pub-lic Health, 40, 1025–1033 (2009).
5. L. Ntezurubanza, J.J. Scheffer and A. Looman, Composi-tion of the essential oil of Ocimum americanum grown inRwanda. Pharm. Weekblad Sci. Ed., 7, 273–276 (1986).
6. A. Vina and E. Murillo, Essential oil composition fromtwelve varieties of basil (Ocimum spp.) grown in Colom-bia. Braz. Chem. Soc., 14, 744–749 (2003).
7. S.J. Lee, K. Umano and G.T.S. Kwang, Identification ofvolatile components in basil (Ocimum basilicum) andthyme leaves (Thymus vulgaris L.) and their antioxidantproperties. Food Chem., 91, 131–137 (2005).
8. M. Özcan and J.E.C. Chalchat, Essential oil compositionof Ocimum basilicum L. and Ocimum minimum L. inTurkey. Czech J. Food Sci, 20, 223–228 (2002).
9. J.C. Matasyoh, M.M. Bandera, J.O. Ogendo, E.O. Omol-lo and A. L. Deng, Volatile leaf oil constituents of O.americanum L. occurring in West Kenya. Bull. Chem.Soc. Ethiopia, 20, 177–180 (2006).
Figure 3. Gas chromatogram of the essential oil of Ocimum americanum L. from Rudrapur.
The Journal of Essential Oil Research 287
Dow
nloa
ded
by [
Uni
vers
ity O
f So
uth
Aus
tral
ia L
ibra
ry]
at 1
9:57
29
Sept
embe
r 20
13

Figure 4. Gas chromatogram of the essential oil of Ocimum americanum L. from Dharchula.
Figure 5. Gas chromatogram of the essential oil of Ocimum americanum L. from Kilbury.
288 S. Singh et al.
Dow
nloa
ded
by [
Uni
vers
ity O
f So
uth
Aus
tral
ia L
ibra
ry]
at 1
9:57
29
Sept
embe
r 20
13

10. L. Mondello, G. Zappia, A. Controneo, I. Bonaccorsi, J.U. Chowdhury, M. Yusuf and G. Dugo, Studies on theessential oil-bearing plants of Bangladesh part VIII.Composition of some Ocimum oils O. basilicum L varpurpurascens, O. sanctum L. purple, O. americanum L.camphor type. Flavour. Fragr. J., 17, 335–340 (2002).
11. R.K. Upadhyay, L.N. Misra and G. Singh, Sesquiterpenealcohol of the copane series from essential oil of O.americanum. Phytochemistry, 30, 691–693 (1991).
12. M.L. Jackson, Soil Chemical Analysis. Prentice HallInc., Englewood Cliffs, NJ (1958).
13. J. Kilmer and L.T. Alexander, Methods of makingmechanical analysis of soils. Soil Sci., 68, 15–24 (1949).
14. H.D. Chapman, Cation exchange capacity. In: Methods ofSoil Analysis. Edits., C.A. Black. Part 2. Agron. Monogr.9, Madison, WI, pp. 894–897 (1969).
15. H. Lokeshwari and G.T. Chandrappa, Impact ofheavy metal contamination of Bellandur Lake on soiland cultivated vegetation. Curr. Sci., 91, 622–627(2006).
16. C.A. Black, Methods of Soil Analysis, Part 2. ASA, Inc.,Madison, WI (1965).
17. R.G. Gavlak, D.A. Horneck and R.O. Miller, Plant, Soil,and Water Reference Methods for the Western Region.Western Region Extension Publication 125. University ofFairbanks–Alaska (1994).
18. W.L. Lindsay and W.A. Norvell, Development of a DTPAsoil test for zinc, iron, manganese and copper. Soil Sci.Soc. Am. J., 42, 421–428 (1978).
19. C.S. Piper, Soil and Plant Analysis. The University ofAdelaide, Adelaide (1942).
Figure 6. Gas chromatogram of the essential oil of Ocimum americanum L. from Mussoorie.
Figure 7. Agglomerative hierarchical clustering analysis (Dendrogram) by SPSS 16.0 for the chemical abundances of 12essential oil components in the 10 populations of Ocimum americanum L.
The Journal of Essential Oil Research 289
Dow
nloa
ded
by [
Uni
vers
ity O
f So
uth
Aus
tral
ia L
ibra
ry]
at 1
9:57
29
Sept
embe
r 20
13

20. R.P. Adams, Identification of Essential Oil Compo-nents by Gas Chromatography/Mass Spectrometry.Allured Publishing Corporation, Carol Stream, IL(2007).
21. G.D. Kanias, C. Souleles, A. Loukis and E. Philoteou-Panou, Trace elements and essential oil compositon inchemotypes of the aromatic plant Origanum vulgare.Journal of Radioanalytical and Nuclear Chemistry, 227,23–29 (1998).
22. D. Vokou and S. Kokkini, J.M. and Bessiere, Geographicvariation of Greek oregano (Origanum vulgare ssp. Hir-tum) essential oils. Biochem. Syst. Ecol., 21, 287–295(1993).
23. H. Boira and A. Blanquer, Environmental factors affect-ing chemical variability of essential oils in Thymus pipe-rella L. Biochem. Syst. Ecol., 26, 811–822 (1998).
24. M. Rahimmalek, B.E.S. Tabatabaei, N. Etemadi, S.A.H.Goli, A. Arzani and H. Zeinali, Essential oil variationamong and within six Achillea species transferred fromdifferent ecological regions in Iran to the field conditions.Ind. Crops Prod., 29, 348–355 (2009).
25. N.B. Perry, N.J. Brennan, J.W. van Klink, W. Harris, M.H. Douglas, J.A. McGlimpsey, B.M. Smallfield and R.E.Anderson, Essential oils from New Zealand manukand kauka: chemotaxonomy of Leptospermum.Phytochemistry, 44, 1485–1494 (1997).
290 S. Singh et al.
Dow
nloa
ded
by [
Uni
vers
ity O
f So
uth
Aus
tral
ia L
ibra
ry]
at 1
9:57
29
Sept
embe
r 20
13