Variation and ecological characteristics of coarse woody debris in Lahemaa and Karula National...
10
ORIGINAL ARTICLE Variation and ecological characteristics of coarse woody debris in Lahemaa and Karula National Parks, Estonia KAJAR KO ¨ STER 1 , KALEV JO ˜ GISTE 1 , HARRI TUKIA 2 , MATS NIKLASSON 3 & TO ˜ NU MO ¨ LS 4 1 Institute of Forestry and Rural Engineering, Estonian Agricultural University, Tartu, Estonia, 2 Finnish Environment Institute, Helsinki, Finland, 3 Southern Swedish Forest Research Centre, Swedish University of Agricultural Sciences, Alnarp, Sweden, and 4 Department of Bioinformatics, Institute of Molecularand Cell Biology, Tartu University, Tartu, Estonia Abstract The coarse woody debris (CWD) was inventoried in two boreal Estonian conifer-dominated forest landscapes/national parks, Lahemaa and Karula, with different forestry history and management intensity. The inventoried areas in both national parks consisted of a core with a strict nature reserve (unmanaged) and the surrounding protected special and restricted management zones (management activities in the past). Stands with no records of silvicultural activity since the 1920s (unmanaged) were compared with traditionally harvested stands. CWD was measured as standing dead trees, logs and snags /10 cm in diameter and /1.3 m in length in 304 circular plots (Lahemaa 134 plots, Karula 170 plots; r /11.28 m, 400 m 2 ). The volumes of CWD varied considerably between individual stands. The mean volume of CWD (standing and down combined) in Lahemaa was 48.5 m 3 ha 1 , ranging from 0.6 to 148.6 m 3 ha 1 . The mean volume of CWD in Karula was 27.6 m 3 ha 1 , ranging from 0.2 to 193.7 m 3 ha 1 from stand to stand. On average, 19.5 m 3 ha 1 (40.2%) of CWD in Lahemaa was standing dead wood and 29.1 m 3 ha 1 (59.8%) down dead wood. In Karula standing dead wood formed 15.2 m 3 ha 1 (55.7%) and down dead wood 12.2 m 3 ha 1 (44.3%). Variation in CWD volumes was clearly dependent on the management history of the stands. Stands with a documented history of management (e.g. cuttings and thinnings) had significantly lower CWD volume than natural stands found mainly in strict nature reserves. Stands selectively logged a long time ago (more than approximately 60 years) did not differ considerably from natural stands in the amount of CWD. The amount of CWD in managed stands (Lahemaa 14.1 m 3 ha 1 and Karula 10.6 m 3 ha 1 ) was comparable to other studies in silviculturally managed forests in the boreal zone. The study shows that CWD amounts in Estonian conditions are similar to previous studies in this region. Keywords: Boreal forest, coarse woody debris, management history, natural and selectively managed stands, nature conservation. Introduction Dead wood is recognized as an important compo- nent of forest ecosystems linked to biodiversity and ecosystem processes (Esseen et al., 1992; Samuels- son et al., 1994; Angelstam, 1998; Arsenault, 2002; Karjalainen & Kuuluvainen, 2002). The crucial role of dead and dying wood for the biodiversity (e.g. invertebrates, swamps and lichens) of boreal and boreo-nemoral forests has been emphasized by several authors (Haila et al., 1993; Samuelsson et al., 1994; Niemela ¨, 1997; Angelstam, 1998; Linder &O ¨ stlund, 1998; Kuuluvainen et al., 2005). There is a general lack of knowledge of dead wood dynamics in forest ecosystems. Although the microbiological aspects have been covered in the literature (Harmon et al., 1986), specific models are needed to combine the effects of key groups in boreal forests (e.g. decaying swamps, saproxylic species, woodpeckers) and their effects on a certain stage and habitat type of forests, predicting the amount of dead wood and succes- sion. Dead wood, also known as coarse woody debris (CWD), is commonly treated as two fractions in Correspondence: K. Ko ¨ster, Institute of Forestry and Rural Engineering, Estonian Agricultural University, Kreutzwaldi 5, 51014, Tartu, Estonia. E-mail: [email protected] Scandinavian Journal of Forest Research, 2005; 20(Suppl 6): 102 /111 ISSN 1400-4089 print/ISSN 1651-2561 online # 2005 Taylor & Francis DOI: 10.1080/14004080510042137
Transcript of Variation and ecological characteristics of coarse woody debris in Lahemaa and Karula National...
ORIGINAL ARTICLE
Variation and ecological characteristics of coarse woody debris inLahemaa and Karula National Parks, Estonia
KAJAR KOSTER1, KALEV JOGISTE1, HARRI TUKIA2, MATS NIKLASSON3 &
TONU MOLS4
1Institute of Forestry and Rural Engineering, Estonian Agricultural University, Tartu, Estonia, 2Finnish Environment
Institute, Helsinki, Finland, 3Southern Swedish Forest Research Centre, Swedish University of Agricultural Sciences, Alnarp,
Sweden, and 4Department of Bioinformatics, Institute of Molecular and Cell Biology, Tartu University, Tartu, Estonia
AbstractThe coarse woody debris (CWD) was inventoried in two boreal Estonian conifer-dominated forest landscapes/nationalparks, Lahemaa and Karula, with different forestry history and management intensity. The inventoried areas in bothnational parks consisted of a core with a strict nature reserve (unmanaged) and the surrounding protected specialand restricted management zones (management activities in the past). Stands with no records of silvicultural activitysince the 1920s (unmanaged) were compared with traditionally harvested stands. CWD was measured as standing deadtrees, logs and snags �/10 cm in diameter and �/1.3 m in length in 304 circular plots (Lahemaa 134 plots, Karula 170 plots;r�/11.28 m, 400 m2). The volumes of CWD varied considerably between individual stands. The mean volume of CWD(standing and down combined) in Lahemaa was 48.5 m3 ha�1, ranging from 0.6 to 148.6 m3 ha�1. The mean volume ofCWD in Karula was 27.6 m3 ha�1, ranging from 0.2 to 193.7 m3 ha�1 from stand to stand. On average, 19.5 m3 ha�1
(40.2%) of CWD in Lahemaa was standing dead wood and 29.1 m3 ha�1 (59.8%) down dead wood. In Karula standingdead wood formed 15.2 m3 ha�1 (55.7%) and down dead wood 12.2 m3 ha�1 (44.3%). Variation in CWD volumes wasclearly dependent on the management history of the stands. Stands with a documented history of management (e.g. cuttingsand thinnings) had significantly lower CWD volume than natural stands found mainly in strict nature reserves. Standsselectively logged a long time ago (more than approximately 60 years) did not differ considerably from natural stands in theamount of CWD. The amount of CWD in managed stands (Lahemaa 14.1 m3 ha�1 and Karula 10.6 m3 ha�1) wascomparable to other studies in silviculturally managed forests in the boreal zone. The study shows that CWD amounts inEstonian conditions are similar to previous studies in this region.
Keywords: Boreal forest, coarse woody debris, management history, natural and selectively managed stands, nature
conservation.
Introduction
Dead wood is recognized as an important compo-
nent of forest ecosystems linked to biodiversity and
ecosystem processes (Esseen et al., 1992; Samuels-
son et al., 1994; Angelstam, 1998; Arsenault, 2002;
Karjalainen & Kuuluvainen, 2002). The crucial role
of dead and dying wood for the biodiversity (e.g.
invertebrates, swamps and lichens) of boreal and
boreo-nemoral forests has been emphasized by
several authors (Haila et al., 1993; Samuelsson et
al., 1994; Niemela, 1997; Angelstam, 1998; Linder
& Ostlund, 1998; Kuuluvainen et al., 2005).
There is a general lack of knowledge of dead
wood dynamics in forest ecosystems. Although
the microbiological aspects have been covered in
the literature (Harmon et al., 1986), specific
models are needed to combine the effects of key
groups in boreal forests (e.g. decaying swamps,
saproxylic species, woodpeckers) and their effects
on a certain stage and habitat type of forests,
predicting the amount of dead wood and succes-
sion.
Dead wood, also known as coarse woody debris
(CWD), is commonly treated as two fractions in
Correspondence: K. Koster, Institute of Forestry and Rural Engineering, Estonian Agricultural University, Kreutzwaldi 5, 51014, Tartu, Estonia. E-mail:
Scandinavian Journal of Forest Research, 2005; 20(Suppl 6): 102�/111
ISSN 1400-4089 print/ISSN 1651-2561 online # 2005 Taylor & Francis
DOI: 10.1080/14004080510042137

studies: standing dead trees and down woody
material (according to Bobiec, 2002).
The amount of dead wood in a natural forest
depends basically on three factors: the fertility of the
site, the decaying process of dead trees (position,
species, microclimate, fungal decomposition) and
disturbances that affect the mortality rates and
patterns of trees (Harmon et al., 1986; Jonsson,
2000; Siitonen, 2001; Tonteri & Siitonen, 2001).
The formation of dead wood is largely driven by
natural disturbance agents, such as storms and
wildfires (Harmon et al., 1986; Esseen et al., 1992;
Samuelsson et al., 1994; Kuuluvainen et al., 2005).
In natural conditions, recurring disturbances, either
small-scale gap perturbations or large-scale stand-
replacing catastrophic events (continuously but irre-
gularly) replenish and create CWD (Kuuluvainen,
1994; Siitonen et al., 2000; Kuuluvainen et al.,
2005). The ultimate effect of a disturbance
(tornado-like strong turbulent winds) can kill and
fell all the trees in a large area instantly.
In natural south and middle boreal forests in
Fennoscandia, the amount of dead wood is reported
to be between 60 and 120 m3 ha�1 (Linder et al.,
1997; Jonsson, 2000; Siitonen, 2001; Sippola, 2001;
Karjalainen & Kuuluvainen, 2002). In general, pine-
dominated forests have lower CWD volumes than
spruce-dominated ones (Sippola, 2001; Tonteri &
Siitonen, 2001). Most studies have found that about
30% of the total CWD volume is in standing dead
trees and 70% in down woody material and stumps.
In pine-dominated forests the standing part of the
total CWD volume is usually higher than in spruce-
dominated ones (Tonteri & Siitonen, 2001).
In Fennoscandia, intensive forest management has
considerably reduced the amount of decaying wood
(Linder & Ostlund, 1992; Siitonen et al., 2000). The
regular thinning of stands, clear-cut harvesting,
efficient forest fire prevention, etc., have all con-
tributed to a general decrease in CWD in managed
forests (Siitonen et al., 2000). There are also forests
where no silviculture has been practised during the
past few decades, but which bear signs of impact in
earlier days. These kinds of forests have been called,
among other things, selectively logged (Rouvinen,
2002). Selectively logged/semi-natural stands have
still a quite high volume of CWD compared with
managed stands and almost the same volume of
CWD as natural stands, but they can be poorer in
decaying wood-associated (saproxylic) species than
natural stands (Rouvinen, 2002). The diversity of
species, including autotrophs and heterotrophs,
depending on dead wood is higher in unmanaged
forests (Andersson & Hytteborn, 1991). In addition,
the presence of different decay classes typical for old-
growth forests enhances the biological diversity
(Renvall, 1995). Wood of large-diameter classes
(�/20 cm) is particularly important for threatened
and rare saproxylic species (Andersson & Hytteborn,
1991; Jonsell et al., 1998; Siitonen, 2001; Rouvinen,
2002). One reason for this may be that large trunks
decay more slowly than twigs, branches and small
trunks (Harmon et al., 1986; Sippola, 2001). By
holding more moisture, they provide continuous and
more stable substrate suitable for specialist species.
Large-diameter trunks are suitable habitats for a
greater number of organisms and cannot easily be
replaced (Arsenault, 2002).
The main aim of the present study was the
description of CWD (status) in formerly managed
and untouched (minimum 60 years without inter-
ference in the course of the last century) stands in
two hemiboreal Estonian National Park forest eco-
systems. It was hypothesized that the amount of
CWD is higher in unmanaged areas and that
management history predicts the amount of CWD.
Materials and methods
Study areas
The study areas are situated in north-east Estonia
in Lahemaa National Park (59831? N 25890? E) and
in south-east Estonia in Karula National Park
(57843? N 26835? E) in the hemiboreal vegetation
zone (Ahti et al., 1968) (Figure 1).
A national park may belong to one of the following
protection categories: strict nature reserve, special
management zone or restricted management zone.
Usually these three categories are combined over the
whole area, to ensure the most effective protection of
biodiversity.
In Lahemaa and Karula National Parks two areas
were selected with different management histories
(one strict reserve and one managed area). In total,
304 sample plots (134 in Lahemaa, 170 in Karula)
Figure 1. Map of the Baltic Sea region. Circle (a) marks Lahemaa
National Park and circle (b) marks Karula National Park.
Coarse woody debris in Lahemaa and Karula National Parks 103

of 11.28 m radius were randomly located for the
dead wood inventory. The area under study (differ-
ent management histories) in Lahemaa was 141 ha
and the total area of sample plots was 5.36 ha (3.8%
of the total, regarding both strict nature reserve and
managed areas). The area in Karula was 158.6 ha
(different management histories) and the total area
of sample plots was 6.8 ha (4.3% of the total,
regarding both strict nature reserve and managed
areas zones). The inventory took place in summer
2001.
Lahemaa National Park was established in 1971.
The area of the national park is 725 km2, of which
474 km2 is land and 251 km2 is sea. Sixty per cent of
the forests in the park are owned by private citizens.
As mentioned above, certain areas (belonging mainly
to special and restricted management zone) of the
national park are partly managed by traditional
methods.
The forest flora of Lahemaa, as in the whole of
north Estonia, is quite poor. More than 70% of
Lahemaa’s territory is covered with forests. The
majority of them are dry boreal, heath and ombro-
trophic bog forests, poor in species (Kalda, 1988).
The Lahemaa study area is divided by the Baltic Ice
Lake shore (esker and sand formations) into two
different types of forest: pine-dominated forests
growing on the sandy plateau of the Baltic Sea in
the south, and moist and rich spruce-dominated
mixed forests growing on the wet north-facing
slopes. The main conifers in study area were Norway
spruce [Picea abies (L.) Karst.] (38% from the
stands) and Scots pine (Pinus sylvestris L.) (34%
from the stands). Birch (Betula pendula Roth and
B. pubescens Ehrh.) (20% from the stands) and black
alder [Alnus glutinosa (L.) J. Gaertn.] (8% of the
stands) were the most common deciduous trees. The
average age of the studied stands was 80 years (range
40�/200 years). Coniferous-dominated forests are
considered to be mature after 90 years and decid-
uous-dominated areas after 75 years in Estonia.
The Karula National Park was created in 1993
and since 1979 it has been a landscape reserve
(meaning that more intensive management is
allowed). The smallest national park in Estonia, it
covers 111 km2 and was created to protect the
typical south-east Estonian forest- and lake-rich
landscapes. About 70% of the park area is covered
with forests. The majority of the sampling plots were
placed inside and close to strict nature reserve. The
reserve has been outside commercial forestry for
more than 30 years. The study also included the
surrounding areas of reserve belonging to special and
restricted management zones of the park. The main
tree species in study area were Scots pine (75% of
the stands), Norway spruce (14% of the stands) and
birch (17% of the stands). The average age of the
studied stands was 75 years (range 20�/160 years).
Historical data
The average ages of the stands were taken from
forestry inventory data. The detailed management
history data (cutting type, time and intensity) were
available only for Lahemaa, and the descriptions
went back to the beginning of the 1920s (Juhandi,
1991). For Karula only records on management
activity were available, without specification of con-
crete management operation. To have comparable
data describing the influence of management history
on CWD, all old stand records from both national
parks were used. The analysis of more detailed
management history was possible only for Lahemaa.
The clear-cutting, selective cutting and thinned
areas were compared with the unmanaged situation.
Management history was based on old maps and
inventory records. In the case of spruce and pine
stands, all stands older than 90 years were used; in
the case of birch and black alder, all stands older
than 75 years were included.
Sampling and measurements
The sampling unit in managed and unmanaged areas
was the tree stand. Inside each stand (uniform forest
subcompartment with size �/0.1 ha) sample plots
were located at random. In stands with area B/1 ha
one plot was established, while in larger stands two
or even three or four sample plots were established.
Sample plots were circular, with 11.28 m radius
(0.04 ha). In each plot all standing and lying dead
wood with diameter �/10 cm at the thinner end was
measured. For standing dead trees (minimum height
1.3 m) the following variables were recorded: tree
species, diameter at breast height, height of the tree/
snag and decay stage, divided into five groups. For
lying dead wood the following variables were
recorded: tree species, diameter at both ends of
stumps (thin and large end), decay stage divided into
five classes (decay data were not analysed in this
work) and the way of falling (natural/cut). In the case
of stumps all stump diameters and decay stages were
measured, but natural stumps were separated from
artificial ones, where possible. The sampling system
and the CWD measuring methods and classification
used in the fieldwork are described more detailed in
Jaakkola et al. (2005).
The Estonian forest management site index
classification system according to Krigul (1971)
was used to describe stand quality and productivity
of the site (Table I). The site type, age, standing
104 K. Koster et al.

stock and management history data were taken from
local forestry inventory databases.
Statistical analyses
Before data processing, the binary logarithm was
calculated for the recorded CWD volume measure-
ments to approximate the residual distribution of
this variable to the normal distribution. Five
observations with residuals higher than 3.5 were
excluded as obvious measurement errors. After
this filtering, the residual distribution of CWD
appeared to be very similar to a normal distribu-
tion, the one that is assumed in analysis of
variance (ANOVA).
The main statistical analysis was carried out with
the SAS procedure Mixed (Release 8.2). This
procedure realizes the general linear mixed model
analysis (SAS Institute, 1999), which in the pre-
sent case enables one to test whether, and how, the
tree stand properties determine the CWD volume
in the stand. The questions concerning the influ-
ence of various tree stand factors on CWD were
formulated as specifically tailored Estimate and
Contrast statements of the basic Mixed procedure.
Results are presented in the form of two ANOVA
tables.
The final version of the mixed model that was
used to draw statistical conclusions consisted of four
factors (see Appendix 1). The factors National park
(two levels) and Forest type (six levels) were of
classification type; the other factors, Stand age and
Site index, were treated as continuous numerical
factors (covariates). The two last factors were
included in the model through cubic polynomials,
whereas age dependence was presented by different
polynomials for different national parks. The same
model but with Site index replaced by Standing
volume was used to obtain p-values for Standing
volume. It was decided not to include these two
factors simultaneously because the site index is
highly correlated with the standing stock volume.
Apart from the mixed model analysis described
above, the simple one-way ANOVA was used to
compare stands that had been managed in the past
with unmanaged stands.
Results
Different management history influences the
amount and diversity of CWD. ANOVA demonstrated
that in areas where there has been no management
the amount of CWD was significantly greater (p�/
0.0404) than in areas where there have been occa-
sional silvicultural operations (selective cuttings).
In the stands in Lahemaa with no management,
the average amount of CWD was 85.9 m3 ha�1
(range 28.3�/148.6 m3 ha�1). In managed areas in
Lahemaa, the average amount of CWD was 63.2 m3
ha�1 (range 24.3�/134.4 m3 ha�1; here, only mature
forests are taken into consideration). In clear-cut
areas the average amount of CWD was 51.2 m3
ha�1 and in thinned areas it was 75.1 m3 ha�1 (only
mature forests are taken into consideration). When
all stands were taken into consideration, the amount
of CWD in managed stands was 14.1 m3 ha�1 in
Lahemaa and 10.6 m3 ha�1 in Karula.
Although management has not been active in areas
designated for national parks the differences in
CWD are considerable. In Lahemaa the mean
CWD volume was 48.5 m3 ha�1. Pine-dominated
forests had a considerably lower CWD volume than
spruce-dominated forests, 18.2 and 69.4 m3 ha�1,
respectively (Table II). In Karula the mean
CWD volume was 27.6 m3 ha�1 and varied on
average from 9.6 m3 ha�1 in birch-dominated
Table I. Site index classification system according to Krigul (1971).
Average height of trees (m) in stands with different site index
Age (years) I II III IV V
60 �/20 19�/17 16�/14 13�/11 B/10
80 �/24 23�/21 20�/17 16�/14 B/13
100 �/27 26�/24 23�/20 19�/16 B/15
Table II. Area and volumes (9/SE) of total, standing and down coarse woody debris (CWD) in Lahemaa, by dominant tree species.
Area (ha) Total CWD (m3 ha�1) Standing CWD (m3 ha�1) Fallen CWD (m3 ha�1)
All plots (n�/79) 141 48.469/2.41 19.499/1.13 29.079/1.61
Norway spruce (n�/30) 68.4 69.49/4.06 25.499/2.04 43.829/2.79
Birch sp. (n�/16) 23.7 52.879/4.93 23.529/2.4 30.019/3.45
Scots pine (n�/27) 38.4 18.29/2.09 9.469/1.09 8.729/1.2
Black alder (n�/6) 10.5 68.199/8.97 23.869/5.82 44.359/4.44
Coarse woody debris in Lahemaa and Karula National Parks 105

forests to 30.9 m3 ha�1 in pine-dominated forests
(Table III).
The CWD volume was significantly affected by
standing stock volume, site index, site type and age
(Table IV). Standing stock and site index are
strongly correlated, so it was not reasonable include
these two factors simultaneously in the model. In
each national park different factors had the strongest
influence on CWD volumes. In Lahemaa, the factors
having the strongest influences on amount of CWD
were stand age (p�/0.008) and site index (p�/0.02).
In Karula, the most important factor affecting the
amount of CWD was standing stock (p�/0.02).
Volume of CWD depends on site index class. In
Lahemaa, CWD formed 21% of the standing stock
of the stands. It varied from 6% in site index class V
(the lowest site index class) to 24% in site index
classes I and II. In Karula the volume of CWD
formed 15% of the total timber volume of the stand.
It varied from 11% in site index class V to 19% in
site index class I. No significant difference in CWD
volume was found between Karula and Lahemaa
(Table V).
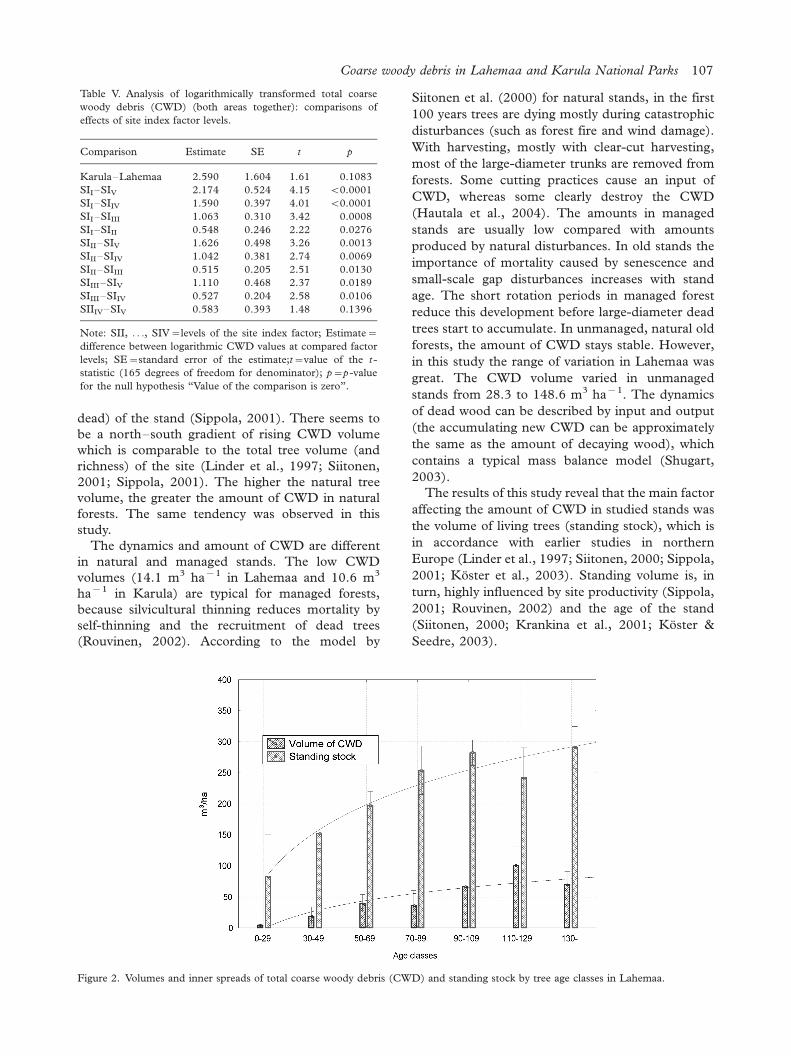
The CWD volume increased significantly with
stand age in the studied area (Table IV). The
partition of the stands into age classes clearly
revealed that with increasing age, both the amount
of standing stock and CWD are increasing until a
certain age (Figures 2 and 3). In mature stands, the
volume of neither standing stock nor CWD changed
with age.
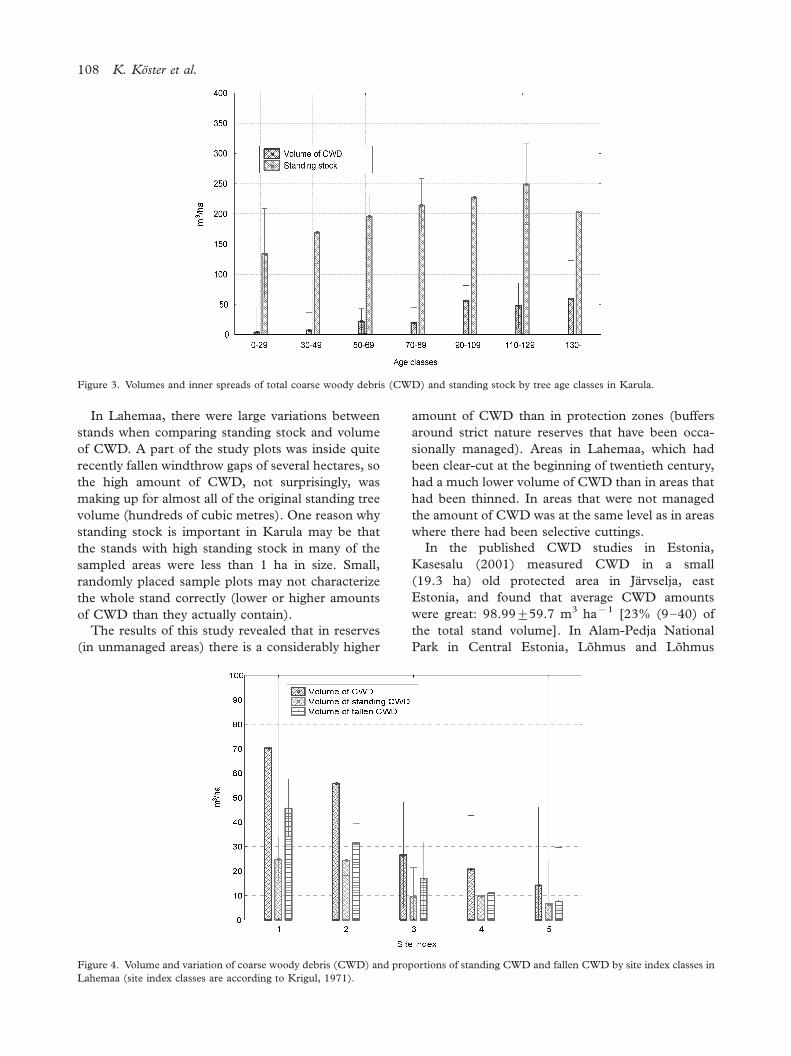
The volume of CWD did not depend on either the
site type (Lahemaa, p�/0.09; Karula, p�/0.37) or
dominant tree species (Lahemaa, p�/0.65; Karula,
p�/0.07). There were some tendencies, but these
were not significant statistically. In Karula, where
pine was the dominant species in CWD (76%
of measured stands were pine dominant), standing
CWD volume exceeded usually fallen CWD
(Figure 4). In Lahemaa the opposite tendency was
observed in first three site index classes owing to
Norway spruce dominance. In site index classes IV
and V, which were mostly dominated by pine, the
volumes of standing CWD and fallen CWD were
almost equal (Figure 5).
Discussion
The results of this study are consistent with other
studies of CWD stores in similar managed and
unmanaged ecosystems. For example, in southern
Finland the CWD volume in mature and overmature
silviculturally managed forests was 14.4 and 23.3 m3
ha�1, respectively (Siitonen, 2001; Tonteri &
Siitonen, 2001). In the St Petersburg region of
Russia, the volume of CWD in mature and over-
mature forests was 24 m3 ha�1 (Krankina et al.,
2002). In natural or semi-natural forests in the
southern boreal forest zone the amount of CWD
can be much higher, from 70 to 184 m3 ha�1
depending on the successional stage of the stand
and the input rate caused by disturbances (Siitonen
et al., 2000). In virgin taiga forests in north-western
Russia, the proportion of CWD can be as much as
35�/40% of the total volume (Kuuluvainen et al.,
1998). In northern Finland, in old-growth timber-
line forest, the CWD volumes corresponded to
20�/30% of the total timber volume (living and
Table III. Area and volumes (9/SE) of total, standing and down coarse woody debris (CWD) in Karula, by dominant tree species.
Area (ha) Total CWD (m3 ha�1) Standing CWD (m3 ha�1) Fallen CWD (m3 ha�1)
All plots (n�/109) 158.6 27.599/1.54 15.199/0.88 12.239/0.87
Norway spruce (n�/15) 15.4 33.819/4.67 15.669/1.71 17.569/3.43
Birch sp. (n�/19) 22.4 9.619/2.36 8.489/2.37 1.069/0.21
Scots pine (n�/75) 120.8 30.959/1.88 16.829/1.07 14.029/1.01
Table IV. Analysis of logarithmically transformed total coarse woody debris (CWD) (both areas together): ANOVA type 3 test results for
factors and contrasts.
Factor or contrast NDF DDF F p -value
Stand age in Karula 3 165 103.17 B/0.0001
Stand age in Lahemaa 3 165 38.71 B/0.0001
Difference between the age dependencies in Karula and Lahemaa 3 165 1.19 0.3165
Site index 3 165 6.74 0.0003
Standing stock volume 3 165 11.0 B/0.0001
Site type 6 165 2.81 0.0124
Dominant tree species 2 165 1.15 0.318
Note: NDF�/numerator degrees of freedom for the F -test; DDF�/denominator degrees of freedom; F�/value of the F -statistic; p -value
tests the null hypothesis ‘‘Factor or contrast has no effect on CWD volume’’.
106 K. Koster et al.
dead) of the stand (Sippola, 2001). There seems to
be a north�/south gradient of rising CWD volume
which is comparable to the total tree volume (and
richness) of the site (Linder et al., 1997; Siitonen,
2001; Sippola, 2001). The higher the natural tree
volume, the greater the amount of CWD in natural
forests. The same tendency was observed in this
study.
The dynamics and amount of CWD are different
in natural and managed stands. The low CWD
volumes (14.1 m3 ha�1 in Lahemaa and 10.6 m3
ha�1 in Karula) are typical for managed forests,
because silvicultural thinning reduces mortality by
self-thinning and the recruitment of dead trees
(Rouvinen, 2002). According to the model by
Siitonen et al. (2000) for natural stands, in the first
100 years trees are dying mostly during catastrophic
disturbances (such as forest fire and wind damage).
With harvesting, mostly with clear-cut harvesting,
most of the large-diameter trunks are removed from
forests. Some cutting practices cause an input of
CWD, whereas some clearly destroy the CWD
(Hautala et al., 2004). The amounts in managed
stands are usually low compared with amounts
produced by natural disturbances. In old stands the
importance of mortality caused by senescence and
small-scale gap disturbances increases with stand
age. The short rotation periods in managed forest
reduce this development before large-diameter dead
trees start to accumulate. In unmanaged, natural old
forests, the amount of CWD stays stable. However,
in this study the range of variation in Lahemaa was
great. The CWD volume varied in unmanaged
stands from 28.3 to 148.6 m3 ha�1. The dynamics
of dead wood can be described by input and output
(the accumulating new CWD can be approximately
the same as the amount of decaying wood), which
contains a typical mass balance model (Shugart,
2003).
The results of this study reveal that the main factor
affecting the amount of CWD in studied stands was
the volume of living trees (standing stock), which is
in accordance with earlier studies in northern
Europe (Linder et al., 1997; Siitonen, 2000; Sippola,
2001; Koster et al., 2003). Standing volume is, in
turn, highly influenced by site productivity (Sippola,
2001; Rouvinen, 2002) and the age of the stand
(Siitonen, 2000; Krankina et al., 2001; Koster &
Seedre, 2003).
Table V. Analysis of logarithmically transformed total coarse
woody debris (CWD) (both areas together): comparisons of
effects of site index factor levels.
Comparison Estimate SE t p
Karula�/Lahemaa 2.590 1.604 1.61 0.1083
SII�/SIV 2.174 0.524 4.15 B/0.0001
SII�/SIIV 1.590 0.397 4.01 B/0.0001
SII�/SIIII 1.063 0.310 3.42 0.0008
SII�/SIII 0.548 0.246 2.22 0.0276
SIII�/SIV 1.626 0.498 3.26 0.0013
SIII�/SIIV 1.042 0.381 2.74 0.0069
SIII�/SIIII 0.515 0.205 2.51 0.0130
SIIII�/SIV 1.110 0.468 2.37 0.0189
SIIII�/SIIV 0.527 0.204 2.58 0.0106
SIIIV�/SIV 0.583 0.393 1.48 0.1396
Note: SII, . . ., SIV�/levels of the site index factor; Estimate�/
difference between logarithmic CWD values at compared factor
levels; SE�/standard error of the estimate;t�/value of the t -
statistic (165 degrees of freedom for denominator); p�/p -value
for the null hypothesis ‘‘Value of the comparison is zero’’.
Figure 2. Volumes and inner spreads of total coarse woody debris (CWD) and standing stock by tree age classes in Lahemaa.
Coarse woody debris in Lahemaa and Karula National Parks 107
In Lahemaa, there were large variations between
stands when comparing standing stock and volume
of CWD. A part of the study plots was inside quite
recently fallen windthrow gaps of several hectares, so
the high amount of CWD, not surprisingly, was
making up for almost all of the original standing tree
volume (hundreds of cubic metres). One reason why
standing stock is important in Karula may be that
the stands with high standing stock in many of the
sampled areas were less than 1 ha in size. Small,
randomly placed sample plots may not characterize
the whole stand correctly (lower or higher amounts
of CWD than they actually contain).
The results of this study revealed that in reserves
(in unmanaged areas) there is a considerably higher
amount of CWD than in protection zones (buffers
around strict nature reserves that have been occa-
sionally managed). Areas in Lahemaa, which had
been clear-cut at the beginning of twentieth century,
had a much lower volume of CWD than in areas that
had been thinned. In areas that were not managed
the amount of CWD was at the same level as in areas
where there had been selective cuttings.
In the published CWD studies in Estonia,
Kasesalu (2001) measured CWD in a small
(19.3 ha) old protected area in Jarvselja, east
Estonia, and found that average CWD amounts
were great: 98.999/59.7 m3 ha�1 [23% (9�/40) of
the total stand volume]. In Alam-Pedja National
Park in Central Estonia, Lohmus and Lohmus
Figure 3. Volumes and inner spreads of total coarse woody debris (CWD) and standing stock by tree age classes in Karula.
Figure 4. Volume and variation of coarse woody debris (CWD) and proportions of standing CWD and fallen CWD by site index classes in
Lahemaa (site index classes are according to Krigul, 1971).
108 K. Koster et al.

(2001) found that amounts of standing CWD were
21 m3 ha�1. In the present study the volume of
CWD was on average 48.5 m3 ha�1 in Lahemaa and
27.6 m3 ha�1 in Karula. The percentage of CWD
from total timber volume was on average 21% in
Lahemaa and 15% in Karula.
Clear stand effects can be seen in the CWD
measurements, but others can be linked directly to
the silvicultural methods used in the past, the lack of
very decayed trees, almost total lack of CWD in
certain areas and the homogeneous and steady-aged
living tree cohorts. The parts with highest CWD
volumes are comparable to the natural forests in the
regional context.
Because the largest (in diameter) CWD is the
most valuable local resource in the coniferous forests
in the long run, the protected areas are extremely
valuable as reference areas and core areas. Often
because of the similar silvicultural background of
protected areas all over Scandinavia and northern
Europe, CWD is a critical resource limiting the
existence (possibilities) of species and continuity of
forest habitats. The long time-lag between tree death
and its development to a relatively short time-scale
log habitat makes it very difficult to restore parts of
the ‘‘original’’ biodiversity and prevents endangered
species by increasing the local extinction risk. A
carefully planned and far-reaching restoration pro-
gramme of those areas poorest in CWD is strongly
recommended.
Acknowledgements
Kaisu Aapala is thanked for improving the manu-
script and its scientific language. This study was
supported by co-operation programme ‘‘Forest
restoration in Estonian reserves’’ between Finnish
and Estonian Environmental Ministries in 1999�/
2001 and by the Estonian Science Foundation
(grants no. 4980 and 6008).
References
Ahti, T., Hamet-Ahti, L. & Jalas., J. (1968). Vegetation zones and
their sections in the north-western Europe. Annales Botanici
Fennici , 5 , 169�/211.
Andersson, L. I. & Hytteborn, H. (1991). Bryophytes and
decaying wood*/A comparison between managed and
natural forests. Holarctic Ecology, 14 , 121�/130.
Angelstam, P. K. (1998). Maintaining and restoring biodiversity in
European boreal forests by developing natural disturbance
regimes. Journal of Vegetation Science , 9 , 593�/602.
Arsenault, A. (2002). Managing coarse woody debris in British
Columbia’s forests: A cultural shift for professional forester?
In W. F. Laudenslayer, P. J. Shea, B. E. Valentine, C. P.
Weatherspoon & T. E. Lisle (Technical Coordinators),
Proceedings of the symposium on the ecology and management
of dead wood in western forests , Reno, NV, 2�/4 November
1999 (Gen. Tech. Rep. PSW-GTR-181, pp. 869�/878).
Albany, CA: US Department of Agriculture, Forest Service,
Pacific Southwest Research Station.
Bobiec, A. (2002). Living stands and dead wood in the Bialowieza
forest: Suggestions for restoration management. Forest Ecol-
ogy and Management , 165 , 125�/140.
Esseen, P.-A., Ehnstrom, B., Ericson, L. & Sjoberg, K. (1992).
Boreal forests*/The focal habitats of Fennoscandia. In L.
Hansson (Ed.), Ecological principles of nature conservation.
Applications in temperate and boreal environments (pp. 252�/
325). London: Elsevier Science.
Haila, Y., Hanski, I. K., Niemela, J., Punttila, P., Raivio, S. &
Tukia, H. (1994). Forestry and the boreal fauna: Matching
management with natural forest dynamics. Annales Zoologici
Fennici , 31 , 187�/202.
Harmon, M. E., Franlin, J. F., Swanson, F. J., Sollins, P., Gregory,
S. V., Lattin, J. D., et al. (1986). Ecology of coarse woody
debris in temperate ecosystems. Advances in Ecological
Research , 15 , 133�/320.
Figure 5. Volume and variation of coarse woody debris (CWD) and proportions of standing CWD and fallen CWD by site index classes in
Karula (site index classes are according to Krigul, 1971).
Coarse woody debris in Lahemaa and Karula National Parks 109

Hautala, H., Jalonen, J., Laaka-Lindberg, S. & Vanha-Majamaa, I.
(2004). Impacts of retention felling on coarse woody debris
(CWD) in mature boreal spruce forests in Finland. Biodi-
versity and Conservation , 13 , 1541�/1554.
Jaakkola, S., Tukia, H. & Lindholm, T. (2005). The quality of
coarse woody debris (CWD) and aspects of naturality in two
national parks in Estonia. Suomen Ymparisto , submitted. (In
Finnish with English abstract.)
Jonsell, M., Weslien, J. & Ehnstrom, B. (1998). Substrate
requirements of red-listed saproxylic invertebrates in Swe-
den. Biodiversity and Conservation , 7 , 749�/764.
Jonsson, B. G. (2000). Availability of coarse woody debris in an
old-growth boreal spruce forest landscape. Journal of Vegeta-
tion Science , 11 , 51�/56.
Juhandi, A. (1991). Koljaku-Oandu reservaadi puistud ja nende
seisund (Koljaku-Oandu reserve: Stands and their descrip-
tion) (Trans. by authors). Eesti Graduation Thesis, Pollu-
majanduse Akadeemia, Tartu. (In Estonian.)
Kalda, A. (1988). Lahemaa rahvuspargi taimkatte ja selle geobo-
taanine liigestus (Plant cover and geobotanical division of
Lahemaa National Park. In I. Etverk (Ed.), Lahemaa
uusimused III. Rahvuspargi looduse inventeerimine (pp. 68�/
87). Tallinn: Valgus. (In Estonian with English abstract.)
Karjalainen, L. & Kuuluvainen, T. (2002). Amount and diversity
of coarse woody debris within a boreal forest landscape
dominated by Pinus sylvestris in Vienansalo wilderness,
eastern Fennoscandia. Silva Fennica , 36 , 147�/167.
Kasesalu, H. (2001). Changes in the Nature Reserve District
stands at Jarvselja during the last six decades. Metsanduslikud
Uurimused , XXXV , 74�/88. (In Estonian with English
abstract.)
Koster, K. & Seedre, M. (2003). Coarse woody debris analysis in
Karula and Lahemaa National Parks . Graduation Thesis,
Estonian Agricultural University, Tartu. (In Estonian with
English abstract.)
Koster, K., Seedre, M., Jogiste, K. & Tukia, H. (2003). The
quantitative measurements of coarse woody debris in Lahe-
maa and Karula National Parks in Estonia. In Postgraduate
Research Papers at the Faculty of Forestry. Transactions of the
Faculty of Forestry. Estonian Agricultural University, 36 , 55�/
70.
Krankina, O. N., Treyfeld, R. F., Harmon, M. E., Spycher, G. &
Povarov, E. D. (2001). Coarse woody debris in the forest of
the St. Petersburg region, Russia. Ecological Bulletins , 49 ,
93�/104.
Krankina, O. N., Harmon, M. E., Kukuev, Y. A., Treyfeld, R. F.,
Kashpor, N. N., Kresnov, V. G., et al. (2002). Coarse woody
debris in forest regions of Russia. Canadian Journal of Forest
Research , 32 , 768�/778.
Krigul, T. (1971). Metsataksaatori teadmik (Guidelines for forest
taxation). Tartu: Eesti Pollumajandus Akadeemia . (In Esto-
nian.)
Kuuluvainen, T. (1994). Gap disturbance, ground microtopogra-
phy, and the regeneration dynamics of the boreal coniferous
forests in Finland: A review. Annales Zoologici Fennici , 31 ,
35�/51.
Kuuluvainen, T., Syrjanen, K. & Kalliola, R. (1998). Structure of
pristine spruce taiga in north-eastern Europe. Journal of
Vegetation Science , 9 , 563�/574.
Kuuluvainen, T., Tukia, H. & Aapala, K. (2005). Ecological
restoration of forested ecosystems in Finland. In J. A.
Stanturf, & P. Madsen (Eds.), Restoration of the boreal
and temperate forests (pp. 285�/298). Boca Raton, FL: CRC
Press.
Linder, P. & Ostlund, L. (1992). Changes in the boreal forests of
Sweden 1870�/1991. Svensk botanisk tidskrift , 86 , 199�/215.
(In Swedish with English summary.)
Linder, P. & .Ostlund, L. (1998). Structural changes in three
midporeal Swedish forest landscapes, 1885�/1996. Biological
Conservation , 85 , 9�/19.
Linder, P., Elfving, B. & Zackrisson, O. (1997). Stand structure
and successional trends in virgin boreal forest reserves in
Sweden. Forest Ecology and Management , 98 , 17�/33.
Lohmus, P. & Lohmus, A. (2001). Snags, and their lichens in old
Estonian peatland forests. Annales Botanici Fennici , 38 , 265�/
280.
Niemela, J. (1997). Invertebrates and the boreal forest manage-
ment. Conservation Biology, 11 , 601�/610.
Renvall, P. (1995). Community structure and dynamics of wood-
rotting Basidiomycetes on decomposing conifer trunks in
northern Finland. Karstenia , 35 , 1�/51.
Rouvinen, S. (2002). Amount, diversity and spatio-temporal avail-
ability of dead wood in old forest in boreal Fennoscandia
(Research Notes 140). Faculty of Forestry, University of
Joensuu.
Samuelsson, J., Gustafsson, L. & Ingelog, T. (1994). Dying and
dead trees*/A review of their importance for biodiversity.
Uppsala: Swedish Threatened Species Unit, SLU.
SAS Institute (1999). SAS online doc. (Version 8). Cary, NC: SAS
Institute.
Shugart, H. H. (2003). A theory of forest dynamics: The ecological
implications of forest succession models . Caldwell, New Jersey:
Blackburn Press.
Siitonen, J. (2001). Forest management, coarse woody debris and
saproxylic organisms: Fennoscandian forests as an example.
Ecological Bulletins , 49 , 11�/41.
Siitonen, J., Martikainen, P., Punttila, P. & Rauh, J. (2000).
Coarse woody debris and stand characteristics in mature
managed and old-growth boreal mesic forest in southern
Finland. Forest Ecology and Management , 128 , 211�/225.
Sippola, A.-L. (2001). Forest structure and biodiversity in northern
boreal forests: Effects of regeneration cutting on flying beetles and
wood-decomposing fungi (Arctic Centre Reports 35). Helsinki:
Hakapaino Oy.
Tonteri, T. & Siitonen, J. (2001). Lahopuu talousmetsissa
valtakunnan metsien 9. inventoinnin tulosten mukaan. In J.
Siitonen (Ed.), Monimuotoinen metsa- metsaluonnon monimuo-
toisuuden tutkimusohjelman loppuraportti (pp. 57�/72). Met-
santutkimuslaitoksen tiedonantoja , 812. (In Finnish.)
110 K. Koster et al.

Appendix 1
Core of the SAS (Release 8.2) program for obtaining the results in Tables IV and V. Notations: K_L�/National
park; type�/Forest type; logCDW�/logarithmic CDW; age�/Stand age; si�/Site index. Uppercase words are
SAS keywords.
PROC MIXED DATA�/Kajar4;
CLASS K_L type;
MODEL logCDW�/K_L age(K_L)jage(K_L)jage(K_L) sijsijsi type/HTYPE�/3;
CONTRAST ‘AgeK’ age(K_L) 1, age*age(K_L) 1, age*age*age(K_L) 1; * for Table IV;
CONTRAST ‘AgeL’ age(K_L) 0 1, age*age(K_L) 0 1, age*age*age(K_L) 0 1;
CONTRAST ‘AgeK-L’ age(K_L) 1 -1, age*age(K_L) 1 -1, age*age*age(K_L) 1 -1;
CONTRAST ‘Site Index’ si 1, si*si 1, si*si*si 1;
ESTIMATE ‘K_L’ K_L 1 -1; * Comparison of Karula and Lahemaa parks, for Table V;
ESTIMATE ‘si 1-5’ si -4 si*si -24 si*si*si -124 /CL;
ESTIMATE ‘si 1-4’ si -3 si*si -15 si*si*si -63/CL;
ESTIMATE ‘si 1-3’ si -2 si*si -8 si*si*si -26/CL;
ESTIMATE ‘si 1-2’ si -1 si*si -3 si*si*si -7/CL;
ESTIMATE ‘si 2-5’ si -3 si*si -21 si*si*si -117/CL;
ESTIMATE ‘si 2-4’ si -2 si*si -12 si*si*si -56/CL;
ESTIMATE ‘si 2-3’ si -1 si*si -5 si*si*si -19/CL;
ESTIMATE ‘si 3-5’ si -2 si*si -16 si*si*si -98/CL;
ESTIMATE ‘si 3-4’ si -1 si*si -7 si*si*si -37/CL;
ESTIMATE ‘si 4-5’ si -1 si*si -9 si*si*si -61/CL; RUN; QUIT;
Coarse woody debris in Lahemaa and Karula National Parks 111


![[Estonia] National Cyber Security Strategy - 2008 - EN - ENISA](https://static.fdokumen.com/doc/165x107/63256e49051fac18490d427a/estonia-national-cyber-security-strategy-2008-en-enisa.jpg)