Variability of the compression properties of cork
12
ORIGINAL Variability of the compression properties of cork Vanda Oliveira • M. Emı ´lia Rosa • Helena Pereira Received: 26 November 2013 / Published online: 19 June 2014 Ó Springer-Verlag Berlin Heidelberg 2014 Abstract The variability of the compression properties of cork was determined after field sampling covering the main production area in Portugal (10 sites) with samples taken from 20 trees per site at the time of cork stripping. In all cases, cork showed compressive stress–strain curves typical for cellular materials, which are characterized by an approximately ‘‘elastic’’ region up to a 5 % strain, followed by a large plateau up to 70 % strain caused by progressive buckling of cell walls, and a steep stress increase for higher strains corresponding to cell collapse. The radial direction of compression offered higher strength. The Young’s moduli averaged 10.4 and 9.2 MPa for radial and non-radial directions, respectively, spreading from 3.5 to 22.5 MPa for the non-radial and 4.2 to 21.5 MPa for the radial directions. The geographical location of cork production was the major factor of variability. Den- sity, annual growth ring width and chemical composition influenced compression. Cork samples with higher density showed overall larger resistance to compression. The energy absorbed per unit volume to achieve the maximal deformation with full densification of cork is higher when the average annual ring width is smaller. Cork samples with relatively higher suberin content required less stress for deformation. The results encompass the natural variability of cork and are the most extensive to characterize cork. They allow a better insight into the differences that may explain the variation in cork properties and strengthen its use either in the known appli- cations, i.e. as a sealant, or in novel applications. V. Oliveira (&) Á H. Pereira Centro de Estudos Florestais, Instituto Superior de Agronomia, Universidade de Lisboa, Tapada da Ajuda, 1349-017 Lisbon, Portugal e-mail: [email protected] M. E. Rosa ICEMS-Instituto de Cie ˆncia e Engenharia de Materiais e Superfı ´cies, Instituto Superior Te ´cnico, Universidade de Lisboa, 1049-001 Lisbon, Portugal 123 Wood Sci Technol (2014) 48:937–948 DOI 10.1007/s00226-014-0651-2
Transcript of Variability of the compression properties of cork

ORI GIN AL
Variability of the compression properties of cork
Vanda Oliveira • M. Emılia Rosa • Helena Pereira
Received: 26 November 2013 / Published online: 19 June 2014
� Springer-Verlag Berlin Heidelberg 2014
Abstract The variability of the compression properties of cork was determined
after field sampling covering the main production area in Portugal (10 sites) with
samples taken from 20 trees per site at the time of cork stripping. In all cases, cork
showed compressive stress–strain curves typical for cellular materials, which are
characterized by an approximately ‘‘elastic’’ region up to a 5 % strain, followed by a
large plateau up to 70 % strain caused by progressive buckling of cell walls, and a
steep stress increase for higher strains corresponding to cell collapse. The radial
direction of compression offered higher strength. The Young’s moduli averaged
10.4 and 9.2 MPa for radial and non-radial directions, respectively, spreading from
3.5 to 22.5 MPa for the non-radial and 4.2 to 21.5 MPa for the radial directions. The
geographical location of cork production was the major factor of variability. Den-
sity, annual growth ring width and chemical composition influenced compression.
Cork samples with higher density showed overall larger resistance to compression.
The energy absorbed per unit volume to achieve the maximal deformation with full
densification of cork is higher when the average annual ring width is smaller. Cork
samples with relatively higher suberin content required less stress for deformation.
The results encompass the natural variability of cork and are the most extensive to
characterize cork. They allow a better insight into the differences that may explain
the variation in cork properties and strengthen its use either in the known appli-
cations, i.e. as a sealant, or in novel applications.
V. Oliveira (&) � H. Pereira
Centro de Estudos Florestais, Instituto Superior de Agronomia, Universidade de Lisboa,
Tapada da Ajuda, 1349-017 Lisbon, Portugal
e-mail: [email protected]
M. E. Rosa
ICEMS-Instituto de Ciencia e Engenharia de Materiais e Superfıcies, Instituto Superior Tecnico,
Universidade de Lisboa, 1049-001 Lisbon, Portugal
123
Wood Sci Technol (2014) 48:937–948
DOI 10.1007/s00226-014-0651-2
Introduction
Cork is a natural cellular material characterized by an interesting combination of
properties that have been valued in research and in practical utilizations, e.g. low
density, reduced permeability to liquids and gases, chemical and biological inertia,
mechanical elasticity, and insulation properties (Pereira 2007). Of all the
mechanical properties, it is the compression behaviour that has attracted most
attention, triggered by the role of the compression properties in the world-renown
use of cork, which is sealing of wine bottles. The cork used for wine stoppers comes
from the cork oak (Quercus suber L.), a species distributed around the western
Mediterranean basin, with most cork-producing forests located in Portugal, followed
by Spain.
The compression behaviour of cork is largely explained by the features of its
cellular structure (Pereira et al. 1987). The three-dimensional structure of cork is
compact and may be described as an array of closed prismatic, on average
hexagonal cells stacked base-to-base making rows oriented in the radial direction of
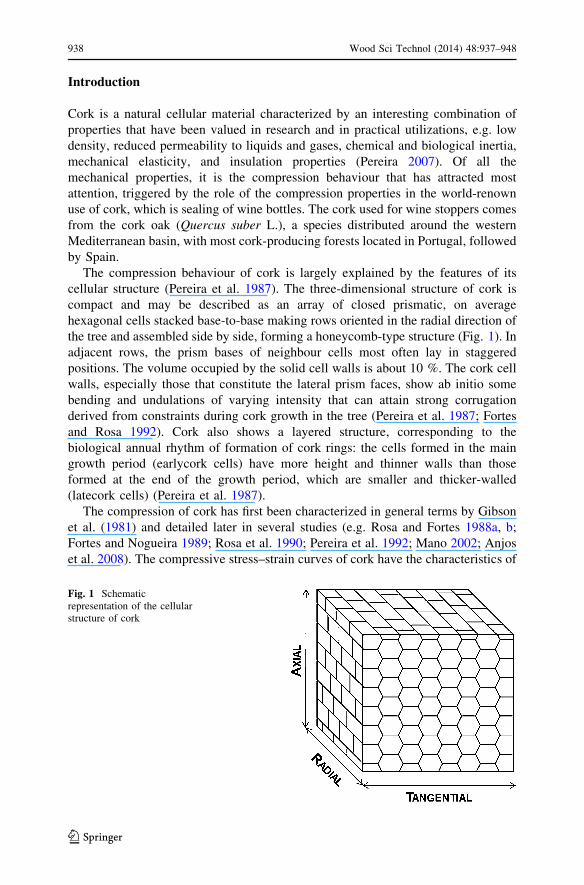
the tree and assembled side by side, forming a honeycomb-type structure (Fig. 1). In
adjacent rows, the prism bases of neighbour cells most often lay in staggered
positions. The volume occupied by the solid cell walls is about 10 %. The cork cell
walls, especially those that constitute the lateral prism faces, show ab initio some
bending and undulations of varying intensity that can attain strong corrugation
derived from constraints during cork growth in the tree (Pereira et al. 1987; Fortes
and Rosa 1992). Cork also shows a layered structure, corresponding to the
biological annual rhythm of formation of cork rings: the cells formed in the main
growth period (earlycork cells) have more height and thinner walls than those
formed at the end of the growth period, which are smaller and thicker-walled
(latecork cells) (Pereira et al. 1987).
The compression of cork has first been characterized in general terms by Gibson
et al. (1981) and detailed later in several studies (e.g. Rosa and Fortes 1988a, b;
Fortes and Nogueira 1989; Rosa et al. 1990; Pereira et al. 1992; Mano 2002; Anjos
et al. 2008). The compressive stress–strain curves of cork have the characteristics of
Fig. 1 Schematicrepresentation of the cellularstructure of cork
938 Wood Sci Technol (2014) 48:937–948
123

those of cellular foams: an approximately ‘‘elastic’’ region up to a strain of 5–7 %,
followed by a broad plateau with strong dimensional reductions for small stress
increases, and a sharp increase in stress starting at a strain of about 70 %
corresponding to the densification of the material. Full densification should occur at
about 85 % strain. Under compression, cork does not fracture neither across cells
nor across cell walls. Fracture only occurs when cork is submitted to tensile or
torsion stresses overcoming the material’s strength (Anjos et al. 2010, 2011a, b;
Rosa and Fortes 1991).
Although anisotropic, the difference in the compressive behaviour of cork in the
different directions is not very large, although strength in the radial direction is
higher than that in axial and tangential directions, which are more similar; for this
reason, frequently only two compression directions, radial and non-radial, are
considered as an approximation to a perfect hexagonal prismatic structure where
there is symmetry around the radial direction, as in Fig. 1.
The cell wall chemical composition of cork should also play a role in its
properties in compression. The distinctive features of cork are the presence of
suberin as the main cell wall structural component, amounting on average to 43 %,
and of lignin with 22 % (Pereira 1988, 2013). Therefore, the mechanical properties
of cork should be related mostly to the combined presence of these two polymers.
Their mechanical role should be different as a result of their contrasting spatial
development, as discussed by Pereira (2007, 2013): (a) lignin, a networked three-
dimensional aromatic polymer with rather isotropically distributed inter-monomeric
bonds, should be responsible for the resistance values under compression (Pereira
and Marques 1988); (b) suberin, a polymer with glyceridic-linked long-chain
aliphatic acids forming rather flexible planar ribbon-like structures, is the
preferential contributor to the elasticity and relaxation properties.
The natural variability of the compressive properties of cork has only been very
partially addressed, and most studies were made on only a few samples. The
variation in the cork properties between samples of known origin from different
production areas has not been investigated yet.
This is addressed in the present study where the compression properties of cork
were determined on a large number of samples that were collected in a field
sampling covering a large diversity of locations in the main production area in
Portugal. A total of 200 cork boards were studied from ten locations (20 corks per
location), allowing to cover between-tree and between-site variation.
The results in this study cover the natural variability of cork’s compressive
properties and correspond to the most extensive work so far undertaken to explain
and characterize the variation in cork compressive properties.
Materials and methods
Sampling
Cork samples were taken directly in the cork oak forests at different locations in the
major regions of cork production in Portugal. At each location, mature cork oak
Wood Sci Technol (2014) 48:937–948 939
123

trees under production of reproduction cork were randomly selected (20 trees per
site) at the time of cork stripping excluding trees with visible phytosanitary damage.
A total of ten sites were sampled for the study of the compressive properties of cork.
The location of the sampling sites is shown in Fig. 2, superposed on a schematic
representation of the cork oak area.
The cork samples were taken at breast height (1.3 m above ground) from the cork
plank (reproduction cork) at the time of cork stripping and taken to the laboratory
where they were allowed to air-dry under well-ventilated conditions.
Sample preparation
A sample with approximately 20 9 20 cm2 was cut from the raw cork plank and
boiled in water at atmospheric pressure for 1 h and left to air-dry. This is a post-
harvest procedure that is made in the industry for all the raw reproduction cork
boards.
After equilibration in the laboratorial environment at about 20 �C and 80 % RH
to approximately 7 % mean moisture content, the cork thickness of the board was
measured in four positions in the radial direction, the total number of complete
annual rings was counted, and their radial width was determined, and a mean ring
width was calculated. The values obtained are indicated in Table 1.
Fig. 2 Schematicrepresentation of continentalPortugal including the cork oakarea distribution and the locationof the 10 cork sampling points
940 Wood Sci Technol (2014) 48:937–948
123
The test specimens were cut from each cork sample as cubes with 18 mm edge,
oriented with the edges parallel to the radial, axial and tangential directions of cork.
Care was taken not to include non-cork tissues such as the outer layer of phloemic
lignocellulosic material (the so-called back of the cork plank) or conspicuous
defects, i.e. fractures or holes. The specimens were weighed, and density was
calculated. The moisture content of the specimens was confirmed to be of a mean
value of 7 %. The mechanical properties vary with moisture content (as compiled in
Pereira 2007), but most compression tests of cork use air-dried samples at 6–7 %
moisture content (e.g. Anjos et al. 2008; Pereira et al. 1992).
Compression tests were undertaken using a mechanical testing machine
Shimadzu AG-5000 at a constant crosshead speed of 2 mm min-1 (strain
rate = 2 9 10-3 s-1) up to a maximum load of 5,000 N. The compression axis
was, in different tests, parallel to the radial and non-radial (axial and tangential)
directions. Stress–strain curves and data were recorded. Young’s modulus (E, MPa)
was calculated from the average slope of the stress–strain curve between 1 % and
2 % strain. The strain for the maximal load (emax, %) was recorded as well as the
energy per unit volume absorbed at that strain (M, J cm-3). The stresses required for
strains of 20 and 30 % (r20 and r30, respectively) were measured. These strain
values correspond approximately to those occurring when a cork stopper is inserted
in a wine bottle and when it is compressed by the bottling machine prior to insertion.
Three replicate cubes were tested for each sample and compression direction.
Statistical analysis
To assess the main factors of variation in compression parameters, the results were
statistically analysed using a nested-factorial design analysis of variance with
direction (radial and non-radial) and site as fixed effects and trees as random effects
and nested within site. The analysis of variance was followed by a Tukey HSD
multiple comparison test to provide specific information on which means were
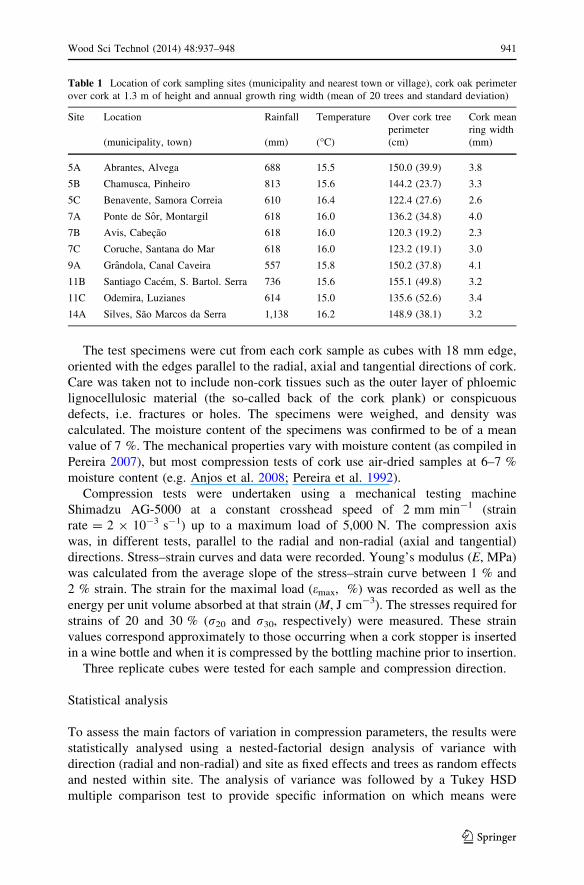
Table 1 Location of cork sampling sites (municipality and nearest town or village), cork oak perimeter
over cork at 1.3 m of height and annual growth ring width (mean of 20 trees and standard deviation)
Site Location Rainfall Temperature Over cork tree
perimeter
Cork mean
ring width
(municipality, town) (mm) (�C) (cm) (mm)
5A Abrantes, Alvega 688 15.5 150.0 (39.9) 3.8
5B Chamusca, Pinheiro 813 15.6 144.2 (23.7) 3.3
5C Benavente, Samora Correia 610 16.4 122.4 (27.6) 2.6
7A Ponte de Sor, Montargil 618 16.0 136.2 (34.8) 4.0
7B Avis, Cabecao 618 16.0 120.3 (19.2) 2.3
7C Coruche, Santana do Mar 618 16.0 123.2 (19.1) 3.0
9A Grandola, Canal Caveira 557 15.8 150.2 (37.8) 4.1
11B Santiago Cacem, S. Bartol. Serra 736 15.6 155.1 (49.8) 3.2
11C Odemira, Luzianes 614 15.0 135.6 (52.6) 3.4
14A Silves, Sao Marcos da Serra 1,138 16.2 148.9 (38.1) 3.2
Wood Sci Technol (2014) 48:937–948 941
123

significantly different from each other. A variance components procedure for
mixed-effects nested model was applied to estimate the contribution of each effect
to the variance of the dependent variable.
The normality assumption for all independent variables was investigated by the
application of Kolmogorov–Smirnov test with Lilliefors significance correction and
analysis of skewness and kurtosis. Despite a few deviations from normality, it was
considered that the analysis of variance is robust and only slightly affected by them.
The equality of variances was validated with the Levene test.
It was considered that effects were statistically significant when the p value was
less than or equal to 0.05. All the statistical analysis were performed using SPSS�
statistical software (version 20.0; SPSS Inc., Chicago, IL).
Results and discussion
Cork compression properties
The compression behaviour of the cork samples is shown in Fig. 3 by the average
stress–strain curves for compression parallel to the radial and non-radial directions
for all the samples tested. In all cases, the curves followed the known pattern of an
approximately ‘‘elastic’’ region up to a strain of approximately 5 %, followed by a
large plateau with a small positive slope for strains between about 5–70 % and a
subsequent steep increase in stress for higher strains.
The large number of cork samples and compression tests that were made in this
work allow for firmly establishing the behaviour of cork in compression: a short
elastic region, a broad plateau and a densification region.
This behaviour has previously been described in studies involving the compres-
sion of cork and corresponds to the following phenomena for the cells: the ‘‘elastic’’
region of compression curve corresponds to the bending and compression of the cell
walls and is practically fully reversible; after this region, the plateau corresponds to
the buckling of cell walls that starts in a localized region of weaker cells and further
extends throughout the material; during densification, there is the collapse of cells
and compaction of the successive cell walls (Rosa et al. 1990; Rosa and Fortes
1988b; Gibson et al. 1981).
The overall mean, maximal and minimal values, standard deviation, and
coefficient of variation in the mean for the compression parameters of cork are
given in Table 2. Cork strength in the radial direction is higher with average stresses
of 1.2 and 1.5 MPa for strains of 20–30 %, respectively, in comparison with the 1.0
and 1.3 MPa for the non-radial directions. The Young’s moduli averaged 10.4 and
9.2 MPa for the radial and non-radial directions, respectively, with individual values
covering a large range spreading from 3.5 to 22.5 MPa for the non-radial direction
and 4.2 to 21.5 MPa for the radial direction.
The maximum strain was similar for compression in radial and non-radial
directions (at & 83 %), but the corresponding absorbed energy per unit volume was
slightly higher for the radial compression (2.4 vs. 2.2 J cm-3) as a consequence of
the higher strength of cork under radial compression, as seen in Fig. 3.
942 Wood Sci Technol (2014) 48:937–948
123

The data reported in the literature for Young’s modulus are in the range of
10–20 MPa, and the same type of anisotropy between radial and non-radial
directions was also reported (Rosa et al. 1990; Rosa and Pereira 1994; Pereira et al.
1992; Anjos et al. 2008). The present work firmly establishes the mean Young’s
modulus of cork at the lower end of the reported values, although the individual
values cover a larger range (Table 2).
Cork strength in the radial direction is higher, especially for strains above 10 %,
as previously described (Rosa et al. 1990). It is noteworthy that the range of
variation is wide, especially regarding the energy consumed for the maximal strain
(M, J cm-3). However, in the case of the Young’s modulus, emax, r20 and r30
values, the distribution of values is rather concentrated, and the coefficients of
variation of the mean values are moderate (Table 2).
Variation in cork compression properties
The mean compression parameters of the cork samples collected from the ten
production sites are summarized in Table 3. The variation in cork properties
between samples of known origin from different production areas is reported here
for the first time.
The analysis of variance showed that the direction of compression is a
statistically significant factor of variation in all the compression variables, but there
was no interaction between production site and the direction of compression. The
anisotropic behaviour in the compression of cork is thus clearly revealed and is
independent of the cork origin.
The average Young’s modulus is higher for compression in the radial direction
independently of site: it ranged between 9.1 MPa (site 11B) and 12.3 MPa (site 7A)
in the radial direction and 8.0 MPa (site 5C) and 10.6 MPa (site 7C) in the non-
radial direction. The strain obtained for the maximal load (emax) was slightly higher,
while the energy consumed for that strain (M) was slightly lower for compression in
non-radial direction for all sites. The strain obtained for the maximal load for radial
compression varied from 81.8 % (site 5A) to 87.5 % (site 5C) and for non-radial
compression between 82.1 % (site 5A) and 87.8 % (site 5C). The highest M value
0
2
4
6
8
10
12
0 10 20 30 40 50 60 70 80
σ(M
Pa)
ε (%)
radial
non-radial
Fig. 3 Average stress–strain curves for the compression of cork in the radial and non-radial directions
Wood Sci Technol (2014) 48:937–948 943
123
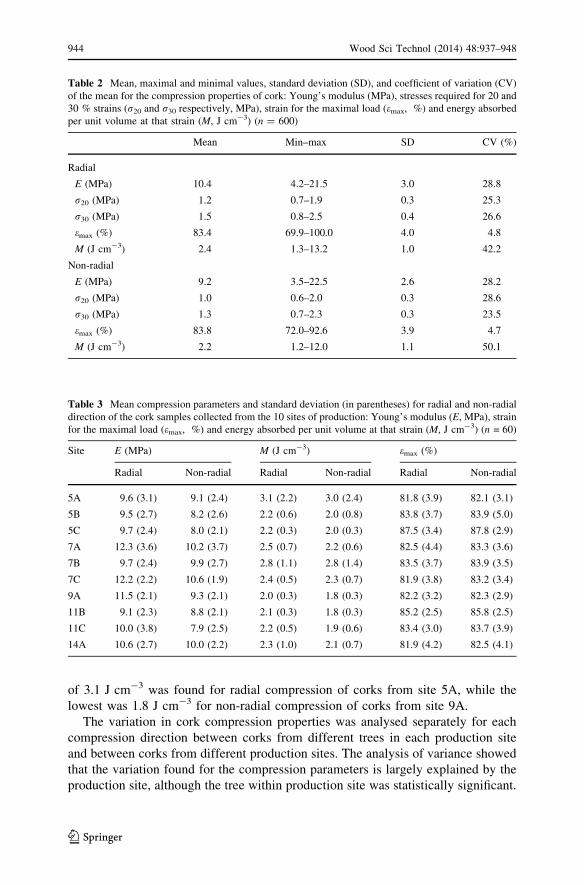
of 3.1 J cm-3 was found for radial compression of corks from site 5A, while the
lowest was 1.8 J cm-3 for non-radial compression of corks from site 9A.
The variation in cork compression properties was analysed separately for each
compression direction between corks from different trees in each production site
and between corks from different production sites. The analysis of variance showed
that the variation found for the compression parameters is largely explained by the
production site, although the tree within production site was statistically significant.
Table 2 Mean, maximal and minimal values, standard deviation (SD), and coefficient of variation (CV)
of the mean for the compression properties of cork: Young’s modulus (MPa), stresses required for 20 and
30 % strains (r20 and r30 respectively, MPa), strain for the maximal load (emax, %) and energy absorbed
per unit volume at that strain (M, J cm-3) (n = 600)
Mean Min–max SD CV (%)
Radial
E (MPa) 10.4 4.2–21.5 3.0 28.8
r20 (MPa) 1.2 0.7–1.9 0.3 25.3
r30 (MPa) 1.5 0.8–2.5 0.4 26.6
emax (%) 83.4 69.9–100.0 4.0 4.8
M (J cm-3) 2.4 1.3–13.2 1.0 42.2
Non-radial
E (MPa) 9.2 3.5–22.5 2.6 28.2
r20 (MPa) 1.0 0.6–2.0 0.3 28.6
r30 (MPa) 1.3 0.7–2.3 0.3 23.5
emax (%) 83.8 72.0–92.6 3.9 4.7
M (J cm-3) 2.2 1.2–12.0 1.1 50.1
Table 3 Mean compression parameters and standard deviation (in parentheses) for radial and non-radial
direction of the cork samples collected from the 10 sites of production: Young’s modulus (E, MPa), strain
for the maximal load (emax, %) and energy absorbed per unit volume at that strain (M, J cm-3) (n = 60)
Site E (MPa) M (J cm-3) emax (%)
Radial Non-radial Radial Non-radial Radial Non-radial
5A 9.6 (3.1) 9.1 (2.4) 3.1 (2.2) 3.0 (2.4) 81.8 (3.9) 82.1 (3.1)
5B 9.5 (2.7) 8.2 (2.6) 2.2 (0.6) 2.0 (0.8) 83.8 (3.7) 83.9 (5.0)
5C 9.7 (2.4) 8.0 (2.1) 2.2 (0.3) 2.0 (0.3) 87.5 (3.4) 87.8 (2.9)
7A 12.3 (3.6) 10.2 (3.7) 2.5 (0.7) 2.2 (0.6) 82.5 (4.4) 83.3 (3.6)
7B 9.7 (2.4) 9.9 (2.7) 2.8 (1.1) 2.8 (1.4) 83.5 (3.7) 83.9 (3.5)
7C 12.2 (2.2) 10.6 (1.9) 2.4 (0.5) 2.3 (0.7) 81.9 (3.8) 83.2 (3.4)
9A 11.5 (2.1) 9.3 (2.1) 2.0 (0.3) 1.8 (0.3) 82.2 (3.2) 82.3 (2.9)
11B 9.1 (2.3) 8.8 (2.1) 2.1 (0.3) 1.8 (0.3) 85.2 (2.5) 85.8 (2.5)
11C 10.0 (3.8) 7.9 (2.5) 2.2 (0.5) 1.9 (0.6) 83.4 (3.0) 83.7 (3.9)
14A 10.6 (2.7) 10.0 (2.2) 2.3 (1.0) 2.1 (0.7) 81.9 (4.2) 82.5 (4.1)
944 Wood Sci Technol (2014) 48:937–948
123

Radial and non-radial Young’s moduli were explained in 93 % by the production
site. The group of production sites 5A, 5B, 5C, 11B and 11C presented non-radial
Young’s modulus lower than 9.1 MPa, while production sites 7A, 7C and 9A could
be grouped together and had a radial Young’s modulus higher than 11.5 MPa.
The production site also largely explained the variation in the energy absorbed
per unit volume at the strain obtained for the maximal load: 82.2 and 86.0 % for
non-radial and radial compression, respectively.
The differences between corks from the same production site can be perceived by
their corresponding coefficient of variation in the site mean (Table 3): it was very
small for the strain obtained for the maximal load (coefficient of variation of 4.2 %),
but higher for the Young’s modulus (26.6 %) and energy consumed (34.3 and
29.8 % for non-radial and radial compression, respectively).
Based on these results, it seems possible to have a provenance differentiation
using compression properties, i.e. a geographical differentiation of cork origin. The
major role of genetics in cork oak growth and cork formation has been repeatedly
stressed leading to large variation in cork features (Pereira 2007) that have so far
hindered origin differentiations using other characteristics, i.e. chemical composi-
tion (Pereira 2013).
Influence of physical and chemical characteristics
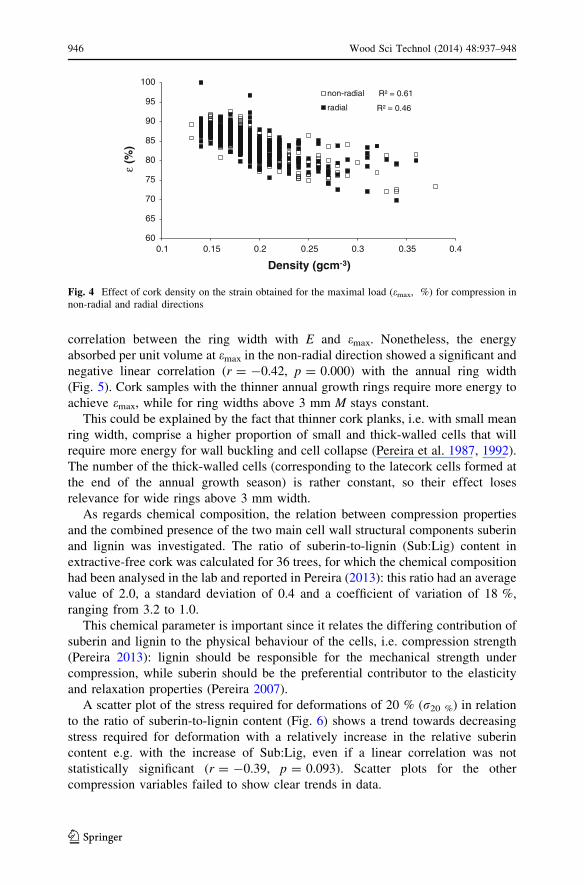
In the present study, the densities of the cork samples ranged from 0.13 to
0.38 g cm-3 and a correlation analysis was made with the compression properties.
The Young’s modulus had a significant and strong positive correlation with density
with Pearson’s coefficient of 0.34 and 0.46 for non-radial and radial compression,
respectively. The strain obtained for the maximal load (emax) has a significant and
strong negative correlation with density (-0.78 and -0.67 for non-radial and radial
compression), while between M and density, this correlation was strongly positive
(0.73 and 0.65 for non-radial and radial compression).
A linear model between emax and density could be adjusted (Fig. 4). Using non-
radial direction data, more than 60 % of the variation in the strain obtained for the
maximal load is explained by the model (R2 = 0.61).
The results showed that cork density influenced compression and the cork
samples with higher density showed overall larger resistance to compression, e.g.
Young’s modulus and the energy consumed to densification had an increasing trend
with density while densification tended to occur earlier (&75 %) (Fig. 4). A similar
trend of compression with density has previously been described by Anjos et al.
(2008).
Another factor of variation regards the thickness of the original cork plank or its
mean annual growth ring width, since it is related to cork density. The influence of
the mean annual ring width of the original cork plank on the compression was
therefore also investigated. It has previously been reported that cork samples from
planks with 2 to 4 mm ring width showed higher strength in compression than cork
samples with a mean 6 mm annual ring width (Pereira et al. 1992).
The mean ring width ranged in these samples from 1.63 to 6.15 mm, with an
average value of 3.37 mm and a coefficient of variation of 25 %. There was no
Wood Sci Technol (2014) 48:937–948 945
123
correlation between the ring width with E and emax. Nonetheless, the energy
absorbed per unit volume at emax in the non-radial direction showed a significant and
negative linear correlation (r = -0.42, p = 0.000) with the annual ring width
(Fig. 5). Cork samples with the thinner annual growth rings require more energy to
achieve emax, while for ring widths above 3 mm M stays constant.
This could be explained by the fact that thinner cork planks, i.e. with small mean
ring width, comprise a higher proportion of small and thick-walled cells that will
require more energy for wall buckling and cell collapse (Pereira et al. 1987, 1992).
The number of the thick-walled cells (corresponding to the latecork cells formed at
the end of the annual growth season) is rather constant, so their effect loses
relevance for wide rings above 3 mm width.
As regards chemical composition, the relation between compression properties
and the combined presence of the two main cell wall structural components suberin
and lignin was investigated. The ratio of suberin-to-lignin (Sub:Lig) content in
extractive-free cork was calculated for 36 trees, for which the chemical composition
had been analysed in the lab and reported in Pereira (2013): this ratio had an average
value of 2.0, a standard deviation of 0.4 and a coefficient of variation of 18 %,
ranging from 3.2 to 1.0.
This chemical parameter is important since it relates the differing contribution of
suberin and lignin to the physical behaviour of the cells, i.e. compression strength
(Pereira 2013): lignin should be responsible for the mechanical strength under
compression, while suberin should be the preferential contributor to the elasticity
and relaxation properties (Pereira 2007).
A scatter plot of the stress required for deformations of 20 % (r20 %) in relation
to the ratio of suberin-to-lignin content (Fig. 6) shows a trend towards decreasing
stress required for deformation with a relatively increase in the relative suberin
content e.g. with the increase of Sub:Lig, even if a linear correlation was not
statistically significant (r = -0.39, p = 0.093). Scatter plots for the other
compression variables failed to show clear trends in data.
R² = 0.61
R² = 0.46
60
65
70
75
80
85
90
95
100
0.1 0.15 0.2 0.25 0.3 0.35 0.4
ε(%
)
Density (gcm-3)
non-radial
radial
Fig. 4 Effect of cork density on the strain obtained for the maximal load (emax, %) for compression innon-radial and radial directions
946 Wood Sci Technol (2014) 48:937–948
123

These results suggest that the cellular characteristics of the cork certainly
superpose on the chemical features of the cells in complex interactions that are
difficult to single out.
Conclusion
1. The behaviour of cork in compression was firmly established in this work by
encompassing its natural variability: an elastic region up to a yield point of
about 5 % strain, a plateau with a small positive slope until about 70 % strain
and a densification with steeply increasing stress.
2. Cork shows higher strength in compression along the radial direction, which is
independent of the cork origin.
3. The geographical location of cork production was the major factor of variation
in compression features, allowing for considering them for cork provenance
differentiation.
R² = 0.55
0
2
4
6
8
10
0 1 2 3 4 5 6 7
M (
Jcm
-3)
Ring width (mm)
Fig. 5 Effect of the mean annual growth ring width on the energy absorbed per unit volume at the strainobtained for the maximal load (M, J cm-3) for compression in the non-radial direction
0
0.2
0.4
0.6
0.8
1
1.2
1.4
1.6
1.8
2
0.8 1.3 1.8 2.3 2.8
σ20
%
suberin-to-lignin content
Fig. 6 Effect of suberin-to-lignin ratio of extractive-free cork on the stress required for strain 20 %(r20 %, MPa)
Wood Sci Technol (2014) 48:937–948 947
123
4. Density, annual growth ring width and chemical composition influenced
compression. Cork samples with high density and small ring width showed
overall larger resistance to compression, while cork samples with a high
suberin-to-lignin ratio required less stress for deformation.
Acknowledgments The research was carried out under the framework of Centro de Estudos Florestais,
a research unit funded by Fundacao para a Ciencia e Tecnologia, Portugal (Pest OE/AGR/UI0239/2011)
and within project PAMAF 4053. Funding from Fundacao para a Ciencia e Tecnologia is acknowledged
by Vanda Oliveira as doctoral student (SFRH/BD/77550/2011). Thanks are due to Fernando Lopes who
designed and coordinated the sampling and to Alexandra Lauw for sample handling.
References
Anjos O, Pereira H, Rosa ME (2008) Effect of quality, porosity and density on the compression properties
of cork. Holz Roh-Werkst 66:295–301
Anjos O, Pereira H, Rosa ME (2010) Tensile properties of cork in the tangential direction: variation with
quality, porosity, density and radial position in the cork plank. Mater Des 31:2085–2090
Anjos O, Pereira H, Rosa ME (2011a) Tensile properties of cork in axial stress and influence of porosity,
density, quality and radial position in the plank. Eur J Wood Wood Prod 69:85–91
Anjos O, Pereira H, Rosa ME (2011b) Characterization of radial bending properties of cork. Eur J Wood
Wood Prod 69:557–563
Fortes MA, Nogueira MT (1989) The poisson effect in cork. Mater Sci Eng A Struct 122:227–232
Fortes MA, Rosa ME (1992) Growth stresses and strains in cork. Wood Sci Technol 26:241–258
Gibson LJ, Easterling KE, Ashby MF (1981) The structure and mechanics of cork. Proc R Soc Lond A
Math Phys Sci 377:99–117
Mano JF (2002) The viscoelastic properties of cork. J Mater Sci 37:257–263
Pereira H (1988) Chemical composition and variability of cork from Quercus suber L. Wood Sci Technol
22:211–218
Pereira H (2007) Cork: biology, production and uses. Elsevier, Amsterdam
Pereira H (2013) Variability of the chemical composition of cork. Bioresources 8:2246–2256
Pereira H, Marques AV (1988) The effect of chemical treatments on the cellular structure of cork. IAWA
Bull 9:337–345
Pereira H, Rosa ME, Fortes MA (1987) The cellular structure of cork from Quercus suber L. IAWA Bull
8:213–218
Pereira H, Graca J, Baptista C (1992) The effect of growth rate on the structure and compressive
properties of cork Quercus suber L. IAWA Bull 13:389–396
Rosa ME, Fortes MA (1988a) Stress relaxation and creep of cork. J Mater Sci 23:35–42
Rosa ME, Fortes MA (1988b) Rate effects on the compression and recovery of dimensions of cork.
J Mater Sci 23:879–885
Rosa ME, Fortes MA (1991) Deformation and fracture of cork in tension. J Mater Sci 26:341–348
Rosa ME, Pereira H (1994) The effect of long term treatment at 100�C–150�C on the structure, chemical
composition and compression behaviour of cork. Holzforschung 48:226–232
Rosa ME, Pereira H, Fortes MA (1990) Effects of water treatment on the structure and properties of cork.
Wood Fiber Sci 22:149–164
948 Wood Sci Technol (2014) 48:937–948
123