Variability in Blood Chemistry of Yellowtail Flounder, Limanda ferruginea, with Regard to Sex,...
31
Errata for NOAA Technical Memorandum NMFS-NE-180 1. Pg. 5, col. 2, para. 3: After “(Umminger and Mahoney 1972),” insert “A more comprehensive analysis of Hudson-Raritan Estuary winter flounder hematological variables (Mahoney and McNulty 1992) showed hemoglobin and hematocrit values to be high from October to April and low from June through September; values in May were transitional.” 2. Pg. 6, col. 1, para. 1: After last sentence, insert “Mean MCHC in winter flounder from the Hudson-Raritan Estuary was generally higher during the period October through April as compared to May through September (Mahoney and McNulty 1992).” 3. Pg. 9, col. 2: After “Lux” entry, insert “Mahoney, J.B.; McNulty, J.K. 1992. Disease-associated blood changes and normal seasonal hematological variation in winter flounder in the Hudson-Raritan Estuary. Trans. Am. Fish. Soc. 12:261-268.”
-
Upload
independent -
Category
Documents
-
view
0 -
download
0
Transcript of Variability in Blood Chemistry of Yellowtail Flounder, Limanda ferruginea, with Regard to Sex,...

Errata for NOAA Technical Memorandum NMFS-NE-180
1. Pg. 5, col. 2, para. 3: After “(Umminger and Mahoney 1972),” insert
“A more comprehensive analysis of Hudson-Raritan Estuary winter flounder hematologicalvariables (Mahoney and McNulty 1992) showed hemoglobin and hematocrit values to behigh from October to April and low from June through September; values in May weretransitional.”
2. Pg. 6, col. 1, para. 1: After last sentence, insert
“Mean MCHC in winter flounder from the Hudson-Raritan Estuary was generally higherduring the period October through April as compared to May through September (Mahoneyand McNulty 1992).”
3. Pg. 9, col. 2: After “Lux” entry, insert
“Mahoney, J.B.; McNulty, J.K. 1992. Disease-associated blood changes and normalseasonal hematological variation in winter flounder in the Hudson-Raritan Estuary.Trans. Am. Fish. Soc. 12:261-268.”

NOAA Technical Memorandum NMFS-NE-180
Variability in Blood Chemistryof Yellowtail Flounder,Limanda ferruginea,
with Regard to Sex, Season,and Geographic Location
U. S. DEPARTMENT OF COMMERCENational Oceanic and Atmospheric Administration
National Marine Fisheries ServiceNortheast Fisheries Science Center
Woods Hole, Massachusetts
September 2003

155. Food of Northwest Atlantic Fishes and Two Common Species of Squid. By Ray E. Bowman, Charles E. Stillwell, WilliamL. Michaels, and Marvin D. Grosslein. January 2000. xiv + 138 p., 1 fig., 7 tables, 2 app. NTIS Access. No. PB2000-106735.
156. Proceedings of the Summer Flounder Aging Workshop, 1-2 February 1999, Woods Hole, Massachusetts. By GeorgeR. Bolz, James Patrick Monaghan, Jr., Kathy L. Lang, Randall W. Gregory, and Jay M. Burnett. May 2000. v + 15 p., 5 figs.,5 tables. NTIS Access. No. PB2000-107403.
157. Contaminant Levels in Muscle of Four Species of Recreational Fish from the New York Bight Apex. By Ashok D.Deshpande, Andrew F.J. Draxler, Vincent S. Zdanowicz, Mary E. Schrock, Anthony J. Paulson, Thomas W. Finneran, BethL. Sharack, Kathy Corbo, Linda Arlen, Elizabeth A. Leimburg, Bruce W. Dockum, Robert A. Pikanowski, Brian May, andLisa B. Rosman. June 2000. xxii + 99 p., 6 figs., 80 tables, 3 app., glossary. NTIS Access. No. PB2001-107346.
158. A Framework for Monitoring and Assessing Socioeconomics and Governance of Large Marine Ecosystems. ByJon G. Sutinen, editor, with contributors (listed alphabetically) Patricia Clay, Christopher L. Dyer, Steven F. Edwards, JohnGates, Tom A. Grigalunas, Timothy Hennessey, Lawrence Juda, Andrew W. Kitts, Philip N. Logan, John J. Poggie, Jr.,Barbara Pollard Rountree, Scott R. Steinback, Eric M. Thunberg, Harold F. Upton, and John B. Walden. August 2000. v+ 32 p., 4 figs., 1 table, glossary. NTIS Access. No. PB2001-106847.
159. An Overview and History of the Food Web Dynamics Program of the Northeast Fisheries Science Center, WoodsHole, Massachusetts. By Jason S. Link and Frank P. Almeida. October 2000. iv + 60 p., 20 figs., 18 tables, 1 app. NTISAccess. No. PB2001-103996.
160. Measuring Technical Efficiency and Capacity in Fisheries by Data Envelopment Analysis Using the GeneralAlgebraic Modeling System (GAMS): A Workbook. By John B. Walden and James E. Kirkley. October 2000. iii + 15 p.,9 figs., 5 tables. NTIS Access. No. PB2001-106502.
161. Demersal Fish and American Lobster Diets in the Lower Hudson - Raritan Estuary. By Frank W. Steimle, RobertA. Pikanowski, Donald G. McMillan, Christine A. Zetlin, and Stuart J. Wilk. November 2000. vii + 106 p., 24 figs., 51 tables.NTIS Access. No. PB2002-105456.
162. U.S. Atlantic and Gulf of Mexico Marine Mammal Stock Assessments – 2000. Edited by Gordon T. Waring, JaneenM. Quintal, and Steven L. Swartz, with contributions from (listed alphabetically) Neilo B. Barros, Phillip J. Clapham, TimothyV.N. Cole, Carol P. Fairfield, Larry J. Hansen, Keith D. Mullin, Daniel K. Odell, Debra L. Palka, Marjorie C. Rossman, U.S.Fish and Wildlife Service, Randall S. Wells, and Cynthia Yeung. November 2000. ix + 303 p., 43 figs., 55 tables, 3 app. NTISAccess. No. PB2001-104091.
163. Essential Fish Habitat Source Document: Red Deepsea Crab, Chaceon (Geryon) quinquedens, Life History andHabitat Characteristics. By Frank W. Steimle, Christine A. Zetlin, and Sukwoo Chang. January 2001. v + 27 p., 8 figs.,1 table. NTIS Access. No. PB2001-103542.
164. An Overview of the Social and Economic Survey Administered during Round II of the Northeast Multispecies FisheryDisaster Assistance Program. By Julia Olson and Patricia M. Clay. December 2001. v + 69 p., 3 figs., 18 tables, 2 app.NTIS Access. No. PB2002-105406.
165. A Baseline Socioeconomic Study of Massachusetts’ Marine Recreational Fisheries. By Ronald J. Salz, David K.Loomis, Michael R. Ross, and Scott R. Steinback. December 2001. viii + 129 p., 1 fig., 81 tables, 4 app. NTIS Access. No.PB2002-108348.
166. Report on the Third Northwest Atlantic Herring Acoustic Workshop, University of Maine Darling Marine Center,Walpole, Maine, March 13-14, 2001. By William L. Michaels, editor and coconvenor, and Philip Yund, coconvenor.December 2001. iv + 18 p., 14 figs., 2 app. NTIS Access. No. PB2003-101556.
Recent Issues in This Series:

U. S. DEPARTMENT OF COMMERCEDonald L. Evans, Secretary
National Oceanic and Atmospheric AdministrationVice Admiral Conrad C. Lautenbacher, Jr., USN (ret.), Administrator
National Marine Fisheries ServiceWilliam T. Hogarth, Assistant Administrator for Fisheries
Northeast Fisheries Science CenterWoods Hole, Massachusetts
September 2003
Renee Mercaldo-Allen1,2, Margaret A. Dawson1,Catherine A. Kuropat1,3, and Diane Kapareiko1,4
This series represents a secondary level of scientific publishing. All issues employthorough internal scientific review; some issues employ external scientific review.Reviews are -- by design -- transparent collegial reviews, not anonymous peerreviews. All issues may be cited in formal scientific communications.
NOAA Technical Memorandum NMFS-NE-180
Variability in Blood Chemistryof Yellowtail Flounder, Limanda ferruginea,
with Regard to Sex, Season, and Geographic Location
Postal Address: 1National Marine Fisheries Serv., Milford Lab., 212 Rogers Ave., Milford, CT 06460E-Mail Address: [email protected]
[email protected]@noaa.gov

Editorial Notes
Species Names: The NEFSC Editorial Office’s policy on the use of species names in all technical communications isgenerally to follow the American Fisheries Society’s lists of scientific and common names for fishes (i.e., Robins et al.1991aa,bb) mollusks (i.e., Turgeon et al. 1998c), and decapod crustaceans (i.e., Williams et al. 1989d), and to follow theSociety for Marine Mammalogy's guidance on scientific and common names for marine mammals (i.e., Rice 1998e).Exceptions to this policy occur when there are subsequent compelling revisions in the classifications of species, resultingin changes in the names of species (e.g., Cooper and Chapleau 1998f, McEachran and Dunn 1998g).
Statistical Terms: The NEFSC Editorial Office’s policy on the use of statistical terms in all technical communications isgenerally to follow the International Standards Organization’s handbook of statistical methods (i.e., ISO 1981h).
Internet Availability: This issue of the NOAA Technical Memorandum NMFS-NE series is being copublished, i.e., asboth a paper and Web document. The Web document, which will be in HTML (and thus searchable) and PDF formats,can be accessed at: http://www.nefsc.noaa.gov/nefsc/publications/.
aRobins, C.R. (chair); Bailey, R.M.; Bond, C.E.; Brooker, J.R.; Lachner, E.A.; Lea, R.N.; Scott, W.B. 1991. Common and scientific namesof fishes from the United States and Canada. 5th ed. Amer. Fish. Soc. Spec. Publ. 20; 183 p.
bRobins, C.R. (chair); Bailey, R.M.; Bond, C.E.; Brooker, J.R.; Lachner, E.A.; Lea, R.N.; Scott, W.B. 1991. World fishes important toNorth Americans. Amer. Fish. Soc. Spec. Publ. 21; 243 p.
cTurgeon, D.D. (chair); Quinn, J.F., Jr.; Bogan, A.E.; Coan, E.V.; Hochberg, F.G.; Lyons, W.G.; Mikkelsen, P.M.; Neves, R.J.; Roper, C.F.E.;Rosenberg, G.; Roth, B.; Scheltema, A.; Thompson, F.G.; Vecchione, M.; Williams, J.D. 1998. Common and scientific names of aquaticinvertebrates from the United States and Canada: mollusks. 2nd ed. Amer. Fish. Soc. Spec. Publ. 26; 526 p.
dWilliams, A.B. (chair); Abele, L.G.; Felder, D.L.; Hobbs, H.H., Jr.; Manning, R.B.; McLaughlin, P.A.; Pérez Farfante, I. 1989. Commonand scientific names of aquatic invertebrates from the United States and Canada: decapod crustaceans. Amer. Fish. Soc. Spec. Publ. 17;77 p.
eRice, D.W. 1998. Marine mammals of the world: systematics and distribution. Soc. Mar. Mammal. Spec. Publ. 4; 231 p.
fCooper, J.A.; Chapleau, F. 1998. Monophyly and interrelationships of the family Pleuronectidae (Pleuronectiformes), with a revisedclassification. Fish. Bull. (Washington, DC) 96:686-726.
gMcEachran, J.D.; Dunn, K.A. 1998. Phylogenetic analysis of skates, a morphologically conservative clade of elasmobranchs(Chondrichthyes: Rajidae). Copeia 1998(2):271-290.
hISO [International Organization for Standardization]. 1981. ISO standards handbook 3: statistical methods. 2nd ed. Geneva, Switzerland:ISO; 449 p.

iiiPage
Contents
Abstract ................................................................................................................................................................................ vIntroduction ........................................................................................................................................................................... 1Materials and Methods .......................................................................................................................................................... 1Results ................................................................................................................................................................................... 2
Sex-Related Differences in Blood Chemistry ................................................................................................................ 2Seasonal Differences in Blood Chemistry .................................................................................................................... 2Location-Related Differences in Blood Chemistry as Compared to Georges Bank ....................................................... 3
Discussion ............................................................................................................................................................................. 3Seasonal and Sex-Related Differences in Blood Chemistry ......................................................................................... 3Location-Related Differences in Blood Chemistry as Compared to Georges Bank ....................................................... 6
Conclusions ........................................................................................................................................................................... 7Acknowledgments ................................................................................................................................................................. 8References Cited .................................................................................................................................................................... 8
Figures
Figure 1. Stations for trawl collection of adult yellowtail flounder in the Northwest Atlantic during 1978-85 ..................vi
Tables
Table 1. General coordinates of stations, and numbers of adult yellowtail flounder collected at those stations, during1978-85 .............................................................................................................................................................. 11
Table 2. Pearson product moment correlations for Northwest Atlantic hydrographic conditions and blood constituentlevels in trawl-collected adult yellowtail flounder during 1978-1985 ................................................................. 12
Table 3. MANCOVA results for blood constituent levels in trawl-collected adult yellowtail flounder from the NorthwestAtlantic during 1978-1985 ................................................................................................................................. 13
Table 4. Blood osmolality in adult yellowtail flounder trawl-collected from the Northwest Atlantic during 1978-1985 .. 14Table 5. Blood sodium concentrations in adult yellowtail flounder trawl-collected from the Northwest Atlantic during
1978-1985 .......................................................................................................................................................... 15Table 6. Blood potassium concentrations in adult yellowtail flounder trawl-collected from the Northwest Atlantic during
1978-1985 .......................................................................................................................................................... 16Table 7. Blood calcium concentrations in adult yellowtail flounder trawl-collected from the Northwest Atlantic during
1978-1985 .......................................................................................................................................................... 17Table 8. Hematocrit in adult yellowtail flounder trawl-collected from the Northwest Atlantic during 1978-1985 ........... 18Table 9. Hemoglobin concentrations in adult yellowtail flounder trawl-collected from the Northwest Atlantic during 1978-
1985 ................................................................................................................................................................... 19Table 10. Mean corpuscular hemoglobin concentration in adult yellowtail flounder trawl-collected from the Northwest
Atlantic during 1978-1985 ................................................................................................................................. 20
Common and Scientific Names of Species Discussed
Atlantic halibut ........................................................................................................................... Hippoglossus hippoglossusBrook trout ............................................................................................................................................. Salvelinus fontinalisChannel catfish ........................................................................................................................................ Ictalurus punctatusEnglish sole ................................................................................................................................................. Parophrys vetulaEurasian perch .............................................................................................................................................. Perca fluviatilisEuropean flounder ...................................................................................................................................... Platichthys flesusLake trout .......................................................................................................................................................... S. namaycushLargescale blackfish ..................................................................................................................................... Girella punctataMadai ................................................................................................................................................................. Pagrus majorMummichog .........................................................................................................................................Fundulus heteroclitus

Page iv
Pinfish ................................................................................................................................................... Lagodon rhomboidesPlaice .................................................................................................................................................... Pleuronectes platessaRainbow trout ...................................................................................................................................... Oncorhynchus mykissRedear sunfish ...................................................................................................................................... Lepomis microlophusRock bass .............................................................................................................................................. Ambloplites rupestrisSmallmouth bass ................................................................................................................................. Micropterus dolomieuStriped bass ................................................................................................................................................. Morone saxatilisStriped mullet ................................................................................................................................................. Mugil cephalusSummer flounder ..................................................................................................................................Paralichthys dentatusWindowpane ..................................................................................................................................... Scophthalmus aquosusWinter flounder ................................................................................................................... Pseudopleuronectes americanusYellowtail flounder .................................................................................................................................. Limanda ferruginea
Acronyms
MCHC .............................................................................................................. mean corpuscular hemoglobin concentrationNEFSC .............................................................................................................................. Northeast Fisheries Science CenterNEMP..................................................................................................................................... Northeast Monitoring ProgramOPP ........................................................................................................................................................Ocean Pulse Program

vPage
ABSTRACT
Yellowtail flounder, Limanda ferruginea, were collected from six locations along coastal New England (i.e., Cape CodBay, Georges Bank, Massachusetts Bay, mouth of the Merrimack River, Mud Patch (south of Marthas Vineyard), and NewYork Bight), and were monitored for blood chemistry and hematology. Plasma osmolality, sodium, potassium, calcium,hemoglobin, hematocrit, and mean corpuscular hemoglobin concentration (MCHC) were measured.
Osmolality and sodium concentrations were frequently reduced during spring. Potassium was generally elevated duringspring and/or summer, and reduced during fall and/or winter. Calcium was usually highest during fall. The hematologicalindices of hematocrit, hemoglobin, and MCHC showed an overall elevation during winter as compared to fall. Fish from theinshore locations of Cape Cod Bay, Massachusetts Bay, Merrimack River, Mud Patch, and New York Bight differedsignificantly from fish from the offshore reference location of Georges Bank for particular blood parameters during certainseasons.
These data provide a baseline range for blood constituents of yellowtail flounder over an annual cycle and at keylocations in the Northeast U.S. Shelf Ecosystem. These results present evidence of possible anthropogenic effects on theblood chemistry and hematology of yellowtail flounder collected from inshore areas. Variability in blood chemistry appearsto be regulated by seasonally-induced physiological and/or environmental factors, and influenced by sex and capturelocation. This information may prove to be useful in monitoring the health of field-collected yellowtail flounder and inassessing the condition of aquacultured fish of this species.

Page vi
Figure 1. Stations for trawl collection of adult yellowtail flounder in the Northwest Atlantic during 1978-85. (Each station isassigned to one of five inshore (Merrimack River, Massachusetts Bay, Cape Cod Bay, Mud Patch, and New YorkBight) or one offshore (Georges Bank) location.)

1Page
INTRODUCTION
Yellowtail flounder, Limanda ferruginea, is a commer-cially important flatfish inhabiting Northwest Atlantic wa-ters ranging from the Gulf of St. Lawrence to ChesapeakeBay (Bigelow and Schroeder 1953; Collette and Klein-MacPhee 2002). Evidence suggests that yellowtail floun-der from Cape Cod Bay, Georges Bank, and the region en-compassing Southern New England to the Mid-AtlanticBight represent three distinct stocks (Cadrin 2003; Cadrinand King 2003). Yellowtail flounder are fast growing, havehigh market value (Johnson et al. 1999), and have beenidentified as a candidate species for aquaculture (Rabe andBrown 2000). Despite the historical importance of yellow-tail flounder as a commercial resource, relatively little infor-mation is available concerning the blood chemistry of thisspecies.
Blood chemistry and hematological measurements canprovide valuable tools for monitoring the health and condi-tion of both wild and cultured fish. Physiological indicescan offer critical feedback on rearing conditions and nutri-tional status, and can aid in the diagnosis of disease. Thesemonitoring and feedback applications require an understand-ing of normal blood component levels specific to yellowtailflounder, as blood chemistry concentrations are known tovary among fish species (Larsson et al. 1976; Hardig andHoglund 1983; Folmar 1993). Natural changes in environ-mental conditions associated with season can affect bloodchemistry and hematology (Bridges et al. 1976; Warner andWilliams 1977; Lane 1979; Dawson 1990; Folmar 1993; Hous-ton 1997; Luskova 1998; O’Neill et al. 1998; Edsall 1999).Physiological variation in fish may be influenced by bothinternal and external cues, including reproductive stage,water temperature, dissolved oxygen, nutrient availability,and photoperiod, all of which undergo annual cycles(Sandstrom 1989; Dawson 1990). Seasonal changes mayalso be influenced by nonenvironmental factors such asdiet, metabolic adaptations, and activity levels (Denton andYousef 1975).
Hematological measures, which can be affected by ex-posure to chemical pollutants (Heath 1995), are useful indi-cators of sublethal environmental stress in fish (Bridges etal. 1976; Warner and Williams 1977; Folmar 1993). Yellow-tail flounder demonstrate strong site fidelity, are found bothinshore and offshore (Royce et al. 1959; Lux 1964; Johnsonet al. 1999; Cadrin 2003; Cadrin and King 2003), and live onor close to bottom sediments where contaminant loadingoccurs. Resident bottom-dwelling organisms, such as flat-fish, often exhibit environmentally-induced disease(Ziskowski et al. 1987), making them potential indicator spe-cies for monitoring of anthropogenic effects. Before bloodconstituent data can be applied as a diagnostic tool, how-ever, general patterns related to season, sex, and collectionlocation need to be well documented and understood(Bridges et al. 1976; Courtois 1976; Hardig and Hoglund1983; Folmar 1993).
The goal of this study was to determine baseline levelsof blood parameters for yellowtail flounder. Blood chemis-try and hematological measurements of osmolality, potas-sium, sodium, calcium, hematocrit, hemoglobin, and meancorpuscular hemoglobin (MCHC) were determined for fishcollected from various locations in the Northeast U.S. ShelfEcosystem. Blood measurements were compared with re-gard to fish sex, season, and collection location.
MATERIALS AND METHODS
Yellowtail flounder were collected from Northwest At-lantic waters between 1978 and 1985 aboard National Ma-rine Fisheries Service, Northeast Fisheries Science Center(NEFSC) cruises. Nearly all fish were collected on cruisesassociated with the NEFSC’s Ocean Pulse Program (OPP)and Northeast Monitoring Program (NEMP); a few fish werecollected on cruises associated with the NEFSC’s BottomTrawl Survey Program. (The OPP and NEMP were the samefundamental program; the name changed from the former tothe latter early in the effort, though.) The focus of NEMPwas assessment of ecological, genetic, pathological, andphysiological changes in coastal and shelf organisms ofthe Northeast U.S. Shelf Ecosystem, which had been po-tentially exposed to the effects of contaminant stress (Pearce1998).
Yellowtail flounder were collected using a “¾ Yankee”(or “No. 36") otter trawl towed for a 30-min period (SurveyWorking Group, Northeast Fisheries Center 1988). Animalswere obtained from five nearshore locations, including CapeCod Bay, Massachusetts Bay, mouth of the Merrimack River,Mud Patch (south of Marthas Vineyard on the continentalshelf), and New York Bight, as well as from an offshorelocation, Georges Bank (Figure 1). Table 1 shows the gen-eral coordinates (i.e., latitude and longitude) of the collec-tion stations, as well as the number of adult yellowtail floun-der collected at each station. For the Georges Bank, MudPatch, and New York Bight locations, fish caught at adja-cent stations within a given location were pooled to in-crease sample size for statistical analysis. Environmentalconditions (e.g., depth, substrate, temperature) at theseadjacent stations were fundamentally similar.
Fish were transferred to flowing seawater aboard shipand processed immediately to minimize stress-inducedchanges associated with capture (Larsson et al. 1976;Wedemeyer and Yasutake 1977; Dawson 1990). Changes inblood concentrations can occur within hours to days ofcollection (Umminger 1970; Wedemeyer and Yasutake 1977;Bourne 1986); therefore, it was critical that samples col-lected at sea be processed without delay. Blood was col-lected by cardiac puncture using a 3-ml plastic syringe witha 22-ga needle and transferred gently into an 8-ml glass vialcoated with 150 units of dried ammonium heparin as ananticoagulant. Hemoglobin (g/100 ml) was determined bythe cyanmethemoglobin method using Hycel reagents and

Page 2
a Bausch and Lomb Spectronic 20 spectrophotometer. (Note:Use of trade names does not imply endorsement by NMFS.)Hematocrit was determined by collecting blood in micro-hematocrit tubes, which were then centrifuged at 13,500 × gfor 5 min and read. Hematrocrit was expressed as a percent-age of the volume of the whole blood sample. The remainderof each blood sample was centrifuged at 12,000 × g, and theresulting plasma was frozen until further analyses could beconducted. The MCHC, the ratio between hemoglobin andhematocrit, was expressed as g/100 ml of packed red bloodcells, and was calculated by the formula: MCHC = hemoglo-bin/hematocrit × 100. Plasma osmolality was determinedusing an Advanced 3L or 3C2 Cryomatic Osmometer andAdvanced Instruments freezing-point calibration standards.Sodium, potassium, and calcium (mEq/L) were determinedusing a Perkin Elmer Coleman 51 Flame Photometer.
Sampling dates were assigned to a season accordingto calendar designations: winter (December 22 - March19), spring (March 20 - June 20), summer (June 21 - Sep-tember 22), and fall (September 23 - December 21). Somelocations and seasons were sampled more frequently thanothers because of problems often associated with exten-sive field sampling at sea, such as equipment failure, in-clement weather, and variation in fish availability. Occa-sionally, a sample was not obtained for a given season.Small sample sizes were included in a data set when infor-mation was available for other seasons at that location.
A Pearson product moment correlation was used todetermine whether hydrographic characteristics such astemperature, salinity, and dissolved oxygen are associatedwith blood chemistry values. A multivariate analysis ofvariance was conducted to determine effects of sex, loca-tion, and season on osmolality, sodium, potassium, calcium,hemoglobin, hematocrit, and MCHC. These seven bloodparameters served as the dependent variables. Indepen-dent variables for the model included sex (males and fe-males), location (Cape Cod Bay, Georges Bank, Massachu-setts Bay, Merrimack River, Mud Patch, and New York Bight),season (winter, spring, summer, and fall), sex × location, sex× season, and sex × location × season. Fish length wasused as a covariate. Post-hoc tests consisted of multiplepairwise comparisons of least square means for significanteffects (P<0.05). Statistical comparisons were limited toseasons and locations containing a sample size of N>5.The significant differences which have been reported, butbased on small sample sizes, should be interpreted conser-vatively. All statistical analyses were performed using PC-SAS Software Version 8.3 (SAS Institute 1989).
RESULTS
Two of the three hydrographic parameters correlatedhighly with blood indices. Salinity correlated positivelywith MCHC (Table 2). Dissolved oxygen correlated posi-tively with hemoglobin and MCHC, and negatively withosmolality and sodium. There were also relationships be-
tween certain blood parameters. Sodium correlated posi-tively with osmolality, and negatively with MCHC. Hemo-globin correlated positively with hematocrit and MCHC. Asignificant difference was observed for sex × location ×season for all seven blood parameters (Table 3). Followingare results for differences related to sex, season, and loca-tion. Location-related differences are limited to a compari-son of results from the five inshore locations versus thosefrom Georges Bank, the offshore reference location.
SEX-RELATED DIFFERENCES IN BLOODCHEMISTRY
Significant differences in blood parameters were ob-served between males and females within the same seasonat Georges Bank (8 instances), New York Bight (5), MudPatch (5), and Merrimack River (2), and are shown under-lined in Tables 4-10. These differences were observed mostfrequently during spring (8), but were also observed duringsummer (6), winter (4), and fall (2). Male and female bloodchemistry concentrations differed significantly from oneanother for hemoglobin (6), osmolality (4), hematocrit (4),calcium (3), potassium (2), and MCHC (1).
Mud Patch males had significantly greater hematocritduring winter, and hematocrit, hemoglobin, and osmolalityduring spring, than females. Mud Patch females had sig-nificantly greater hemoglobin during summer than males.Merrimack River females had significantly greater calciumduring spring and summer than males. New York Bightmales had significantly greater hematocrit and osmolalityduring winter, hemoglobin and osmolality during spring,and potassium during fall, than females. Georges Bank maleshad significantly greater hemoglobin during winter, hemat-ocrit and hemoglobin during spring, hemoglobin, potas-sium, and MCHC during summer, and osmolality during fall,than females; however, females had significantly greatercalcium during summer than males.
SEASONAL DIFFERENCES IN BLOOD CHEMISTRY
Overall, osmolality showed few significant differencesamong seasons, although there was a minor trend towardreduced osmolality during spring, as observed in both malesand females from Georges Bank (Table 4). Fall osmolality inMud Patch fish was significantly greater than summer os-molality in males, and spring osmolality in females. Osmo-lality in New York Bight males was significantly elevatedduring winter and spring, and reduced during fall.
Generally, sodium concentrations were significantlylower during spring, as observed in males from GeorgesBank, Merrimack River, Mud Patch, and New York Bight,and in females from Georges Bank and Mud Patch (Table 5).
Potassium concentrations were often significantlyhigher during spring or summer, and significantly lowerduring fall or winter (Table 6). Potassium showed signifi-
3Page
cantly higher levels during spring in males from MerrimackRiver, and in females from Georges Bank and Mud Patch.Summer levels were significantly higher in fish of both sexesfrom Georges Bank and Mud Patch. Potassium was signifi-cantly lower during fall than spring and/or summer in malesfrom Georges Bank, Merrimack River, and Mud Patch, andin females from Georges Bank. Winter potassium was sig-nificantly lower than summer for females from Georges Bankand Mud Patch.
Calcium concentrations were generally higher duringfall, as observed in fish of both sexes from George Bank andMud Patch, and in females from New York Bight (Table 7). Ahighly elevated calcium concentration during spring wasdocumented in females from Merrimack River.
Yellowtail flounder demonstrated a trend toward sig-nificantly higher hematocrit during spring, as compared withfall (Table 8). Hematocrit was significantly greater duringspring than fall in fish of both sexes from Merrimack River,Mud Patch, and New York Bight, and in males from GeorgesBank. Winter hematocrit concentration was significantlygreater than fall concentration in females from Georges Bank.
Hemoglobin showed a similar pattern to that observedfor hematocrit, but the results were less consistent (Table9). Hemoglobin tended toward significantly greater con-centrations during winter and/or spring than fall. Hemoglo-bin in fish of both sexes from Georges Bank and MerrimackRiver was significantly higher during winter than fall, whilespring levels were significantly higher than fall levels inmales and females from Merrimack River, Mud Patch, andNew York Bight, and in males from Georges Bank.
MCHC was generally higher during winter than spring,as observed at Georges Bank and Merrimack River for males,and at Merrimack River and New York Bight for females(Table 10). Winter also tended to have higher MCHC thanfall, as seen at Georges Bank and Merrimack River for males,and at Merrimack River and Mud Patch for females.
LOCATION-RELATED DIFFERENCES IN BLOODCHEMISTRY AS COMPARED TO GEORGES BANK
Blood parameters in fish from the inshore locations werecompared to such parameters in fish from Georges Bank,the reference location. During winter, osmolality in femaleyellowtail flounder from Merrimack River was significantlylower. During spring, osmolality in both sexes from NewYork Bight and in males from Cape Cod Bay was signifi-cantly higher. During summer, osmolality in both sexesfrom Merrimack River and in males from Mud Patch wassignificantly lower. During fall, osmolality in males fromMerrimack River, Mud Patch, and New York Bight was sig-nificantly lower (Table 4).
During winter, Merrimack River, Mud Patch, and NewYork Bight sodium concentrations in females were signifi-cantly reduced. During spring, sodium in females fromMassachusetts Bay, males from Cape Cod Bay, and bothsexes from New York Bight was significantly elevated. Fall
sodium concentrations were reduced in both sexes fromMerrimack River (Table 5).
Reduced potassium was observed during spring in malesfrom Cape Cod Bay and in females from MassachusettsBay and New York Bight. Merrimack River showed elevatedpotassium during spring in males. Significantly reducedpotassium was measured in Merrimack River males duringsummer. Females from Merrimack River and Mud Patchand both sexes from New York Bight had elevated fall po-tassium (Table 6).
Females from Merrimack River and Massachusetts Bayhad significantly higher calcium during spring. Summercalcium was reduced in female fish from Mud Patch. Cal-cium concentrations during fall were significantly lower inboth sexes from Merrimack River and in males only fromMud Patch (Table 7).
During winter, hematocrit was significantly lower inmales from Cape Cod Bay and in females from Mud Patch.During spring, hematocrit was significantly higher in bothsexes from Merrimack River, and in females from New YorkBight. During summer, hematocrit was significantly higherin females from New York Bight (Table 8).
During winter, hemoglobin in males from Cape Cod Bayand New York Bight, and in both sexes from Mud Patch,was significantly reduced. Merrimack River females hadgreater winter hemoglobin. During spring, hemoglobin wasreduced in female fish from Massachusetts Bay and elevatedin females from Merrimack River. Summer hemoglobin wasreduced in Mud Patch males. Fall hemoglobin in New YorkBight and Mud Patch males was significantly higher (Table9).
Males from Cape Cod Bay and New York Bight hadsignificantly lower winter MCHC, while in females fromMerrimack River, MCHC was significantly greater. Duringsummer, males from Merrimack River and females from NewYork Bight had significantly reduced MCHC. Male fishfrom Merrimack River, Mud Patch, and New York Bight hadsignificantly higher MCHC during fall (Table 10).
DISCUSSION
SEASONAL AND SEX-RELATED DIFFERENCES INBLOOD CHEMISTRY
Blood chemistry and hematological measurements aresignificantly affected by the wide range of natural environ-mental conditions experienced by fish over the course of ayear (Bridges et al. 1976; Warner and Williams 1977; Lane1979; Dawson 1990; Folmar 1993; Houston 1997; Luskova1998; O’Neill et al. 1998; Edsall 1999). Changes in tempera-ture (Powers 1980) and season (Shell 1961) are known toaffect oxygen metabolism and hematology. Variations inblood constituents may be related to natural physiologicalcycles, environmental stimuli, or both (Bridges et al. 1976;Luskova 1998). Metabolic fluctuations in fish such asgrowth, activity, and feeding are strongly influenced by

Page 4
environmental cues (Barnhart 1969; Fletcher 1977). Repro-ductive cycles, associated with season, can place fish un-der extremes of metabolism and osmoregulation (Courtois1976), and may alter the content of fish blood (Nagler et al.1987; Sandstrom 1989; Bjornsson et al. 1998; Luskova 1998).
Osmolality
Yellowtail flounder experienced only minor seasonal fluc-tuations. In several cases, osmolality values were reducedduring spring. Windowpane (Scophthalmus aquosus) alsoexperience significantly lower osmolality during spring thansummer and fall (Dawson 1990). In a laboratory study, how-ever, no significant differences were observed in the serumosmolality of winter flounder (Pseudopleuronectesamericanus) held at –1° and 15°C (Umminger 1970).
The significantly elevated osmolality observed duringwinter and spring in males from New York Bight in our studyhas some adaptive significance. Pearcy (1961) suggeststhat elevated osmotic pressure in flounder during coolerweather may protect against freezing in fishes inhabitingcold shallow waters. Serum osmolality was also highest inwinter flounder during the winter months, just prior tospawning (Pearcy 1961; Umminger and Mahoney 1972).Osmolality in mummichog (Fundulus heteroclitus) wasfound to increase significantly at colder water temperatures(Umminger 1969).
Seasonal differences in osmotic pressure may be causedby osmotic imbalance or other factors (Pearcy 1961). Anincrease in serum constituents other than the major ions,such as a buildup of organic and inorganic materials, canelevate osmolality during cold weather (Pearcy 1961;Umminger 1969; Umminger and Mahoney 1972). An in-crease in serum electrolytes may be a compensatory mecha-nism used by fish to maintain the total number of osmoti-cally active particles in the plasma (Shell 1961). In severalinstances, males showed significantly greater osmolalitythan females during winter and/or spring. Perhaps femalesare undergoing osmotic changes, specifically hemodilution,related to preparations for late spring spawning.
In our study, osmolality and sodium were highly posi-tively correlated. This high positive correlation would beexpected, as sodium is an important osmotic constituent.In our study, both of these parameters had similar patternsof reductions during spring. Also in our study, dissolvedoxygen and osmolality were highly negatively correlated,which suggests that the reduced osmolality during springmay be associated with the elevated dissolved oxygen lev-els following spring turnover.
Sodium
Marine fish exposed to low seawater temperatures of-ten experience increased sodium (Umminger 1969; Murphyand Houston 1977; Sandstrom 1989). Increases in freezing
point depression of winter flounder blood serum during thewinter months can be attributed in part to elevated plasmasodium (Fletcher 1981). Winter flounder sampled in New-foundland had significantly higher sodium during winterthan summer (Fletcher 1977), while sodium in winter floun-der from New England was also higher during late winter(Pearcy 1961; Fletcher 1977). Winter-collected windowpanehad significantly higher sodium than summer and autumnfish (Dawson 1990). Interestingly, Umminger and Mahoney(1972) noted no seasonal change in sodium among winterflounder collected from New Jersey.
In measurements on freshwater fish, sodium levels inthe Eurasian perch (Perca fluviatilis) reached their maxi-mum during mid-winter (Sandstrom 1989), and in rainbowtrout (Oncorhynchus mykiss) were higher during both falland winter than during summer (Houston et al. 1968). Inour study, dissolved oxygen concentrations were correlatednegatively with both sodium and osmolality. This correla-tion suggests a possible disruption of osmoregulatory func-tion at reduced oxygen levels.
Potassium
The significantly reduced potassium levels during coldweather, which were observed in our study, have also beendescribed in winter flounder, and may be related to a declinein metabolism and feeding at lower temperatures (Ummingerand Mahoney 1972; Bentinck-Smith et al. 1987). Reducedblood potassium concentrations during winter may also beattributed to a loss of potassium from the cells of bodytissues in response to the cold (Umminger 1969). Potas-sium in the windowpane was also found to be higher duringsummer than fall and winter (Dawson 1990).
Changes in blood potassium levels have also been ob-served in freshwater fish. Rainbow trout collected duringfall-winter had reduced levels as compared to those fishcollected during summer (Houston et al. 1968). Elevatedpotassium levels were also observed at high water tempera-tures in smallmouth bass (Micropterus dolomieu) (Shell1961), rainbow trout (Murphy and Houston 1977), channelcatfish (Ictalurus punctatus) (Ellsaesser and Clem 1987),Eurasian perch (Sandstrom 1989), and madai (Pagrus ma-jor) (Woo 1990).
Increased plasma potassium may result from disruptionof potassium regulatory ability at either the external level(i.e., between the fish and seawater) or internal level (i.e.,between the intracellular and extracellular fluid), with a re-sulting release of potassium into the blood. Serum potas-sium levels may increase in response to elevated tissuecatabolism, or due to osmotic adjustment when compensat-ing for a decline in other serum components (Shell 1961).
Calcium
Calcium plays an important role in osmoregulation (Shell1961), and is a critical component in the reproductive pro-

5Page
cesses of fish. In our study, calcium concentrations weregenerally higher during fall and lower during spring. Thistrend toward calcium being elevated during fall and de-pressed during spring may reflect the spring and summerspawning pattern of yellowtail flounder, which peaks dur-ing late May (Bigelow and Schroeder 1953; Royce et al.1959; Fahay 1983; Collette and Klein-MacPhee 2002; Cadrinand King 2003). Also in our study, a contrasting patternwas observed in females from Merrimack River; they showedsignificantly elevated calcium during spring which may berelated to anthropogenic, rather than seasonal, influences.
In our study, female fish from Georges Bank andMerrimack River had significantly elevated spring and/orsummer calcium levels as compared to males. These el-evated calcium levels in females are most likely related tohormonal changes linked to spawning activity. In freshwa-ter fish also, calcium concentrations in females during thespawning period were significantly higher than in males forlake trout (Salvelinus namaycush)(Edsall 1999), brook trout(Salvelinus fontinalis)(Booke 1964), and rock bass(Ambloplites rupestris)(Bidwell and Heath 1993).
Blood calcium has been shown to follow spawning pat-terns in numerous fish including brook trout (Booke 1964),rainbow trout (Nagler et al. 1987), English sole (Parophrysvetula)(Johnson et al. 1991), striped mullet (Mugilcephalus), pinfish (Lagodon rhomboides) (Folmar et al.1992), rock bass (Bidwell and Heath 1993), and Atlantic hali-but (Hippoglossus hippoglossus) (Bjornsson et al. 1998).Blood calcium in rainbow trout rises in connection withyolk synthesis and reaches maximum levels just prior tospawning (Hille 1982). High spring calcium levels observedin windowpane (Dawson 1990) appear to correspond with alate spring and summer spawning season (Bigelow andSchroder 1953). Calcium varied irregularly in the Eurasianperch, with fluctuations increasing sharply before and afterspring spawning (Sandstrom 1989). Variations in blood cal-cium of fish appear to be tied more closely to reproductivechanges than to seasonality or hematopoiesis (i.e., bloodformation) (Luskova 1998).
Hematocrit, Hemoglobin, and MCHC
Hematocrit and Hemoglobin
Hematocrit provides a measurement of red blood cells(erythrocytes) in whole blood, while the hemoglobin withinthose erythrocytes is the main transport mechanism for oxy-gen and carbon dioxide in the blood. Alterations in bloodoxygen capacity reflect seasonal adjustment in oxygentransport (Cameron 1970; Anderson et al. 1985). Elevationsin spring hematocrit and hemoglobin are likely due, in part,to an increase in oxygen consumption and metabolic ratescorresponding to a rise in water temperatures (Powers 1980;Dwyer et al. 1983; Zanuy and Carrillo 1985; Martinez et al.1994). Spring hemoconcentration of the blood may alsocontribute to elevated hematological levels (Preston 1960).
In addition to these seasonal rhythms, sex also appearsto play a role in hematocrit and hemoglobin levels. In ourstudy, males sometimes showed higher hematocrit and he-moglobin levels than females during winter and spring. Lane(1979) also observed significantly higher hematocrit andhemoglobin levels in male versus female rainbow trout.These differences in hematology with regard to males andfemales may be related to differential oxygen demand bysex, which in turn may be related to reproductive activity.Elevations in hematocrit and hemoglobin of rock bassseemed to occur in relation to the onset of spawning (Bidwelland Heath 1993).
The fall reduction in yellowtail flounder hematocrit andhemoglobin levels observed in our study may reflect a cor-responding hemodilution of the blood which results in de-creased hematological parameters and/or a reduction inhemopoetic capacity (Preston 1960). Rhythms in hemat-ocrit and hemoglobin concentration may also result fromchanges in plasma volume or erythrocyte volume (Sandstrom1989), for example, an expansion of plasma volume reducesthe density of circulating red blood cells, thereby decreas-ing hematocrit (Courtois 1976). Changes in metabolism andhormonal activity, triggered by cooler water temperaturesand declining photoperiod during fall, may result in anemia(Lane 1979) and reduced erythropoetic production (Lane1979; Zanuy and Carrillo 1985). Physiological stresses as-sociated with fasting and spawning can trigger a decline infish condition (Bridges et al. 1976; Sano 1960ab; Lane 1979;Zanuy and Carrillo 1985).
Seasonal hematological patterns vary among species.In plaice, Pleuronectes platessa, hematocrit was lowestduring winter, increased through the spring into summer,and declined again into fall. Hemoglobin levels in that spe-cies were high at the end of winter, were lowest duringspring, were again high during the summer, and had a fur-ther decline during late fall (Preston 1960). In windowpane,Dawson (1990) found significantly lower winter hematocrit.Winter flounder from Maine had the lowest levels of hema-tocrit and hemoglobin during winter and early spring(Bridges et al. 1976), while winter flounder from New Jerseyhad lower levels of hemoglobin during late winter (Ummingerand Mahoney 1972). Tun and Houston (1986) found in-creased hematocrit and hemoglobin in rainbow trout ex-posed to summer versus winter conditions. An overall trendtoward increased hemoglobin was observed in pinfish andstriped mullet held at high temperatures (Cameron 1970).Hematocrit and hemoglobin in striped bass (Moronesaxatilis) were highest during fall and winter and lowestduring summer (Lochmiller et al. 1989). Haider (1969) foundhemoglobin in rainbow trout to be highest during winterand lowest during fall.
MCHC
Changes in the hemoglobin content of the blood in re-sponse to the environment might come about either by a

Page 6
change in the number of erythrocytes or by a change in thehemoglobin concentration of the individual cells (Anthony1961). MCHC, the amount of hemoglobin in a given numberof red blood cells, was generally higher during winter thanspring and fall. Since MCHC values are directly related toerythrocyte maturation, the relatively high proportion ofnewly proliferated young erythrocytes during late spring-- when fish are in a state of rapid growth -- is associatedwith relatively low MCHC values (Denton and Yousef 1975;Hardig and Hoglund 1983). MCHC corresponded with he-matocrit and hemoglobin in striped bass, being highestduring fall and winter and lowest during summer (Lochmilleret al. 1989). MCHC in the largescale blackfish (Girellapunctata), increased during spring and decreased duringfall (Kakuno and Koyama 1994). Dawson (1990) observedno seasonal or location differences in MCHC among win-dowpane collected from various locations in Long IslandSound.
As hemoglobin is a measure of the amount of oxygencarried in the blood, the strong positive correlation observedin our study between dissolved oxygen and two hemato-logical indices, hemoglobin and MCHC, would be expected.Similarly, Kakuno and Koyama (1994) observed a strongpositive correlation between hematological parameters anddissolved oxygen in teleost fishes. Also in our study, MCHCcorrelated positively with salinity and negatively with so-dium concentration. These results suggest that hemato-logical indices may be affected by seasonal changes in hy-drographic conditions.
LOCATION-RELATED DIFFERENCES IN BLOODCHEMISTRY AS COMPARED TO GEORGES BANK
One of the most important potential uses of blood chem-istry data from a toxicological perspective is to assess envi-ronmental quality by comparing animals from different lo-cations (i.e., reference versus contaminated locations)(Folmar 1993). Physiological biomonitoring, using hemato-logical and metabolic indices to assess stress, could pro-vide an alternative to traditional population-based ap-proaches (Lochmiller et al. 1989). A knowledge of normalphysiological values is necessary to evaluate the health offish with respect to their physiological responses to a stimu-lus or stress which affects homeostasis (Luskova 1998). Avariety of environmental pollutants, such as certain chlori-nated hydrocarbons and heavy metals, have been shownto affect osmotic and ionic regulation in fish (Haux 1979;Heath 1995).
Differences in blood parameters between yellowtailflounder from inshore locations and those from GeorgesBank, the offshore location, suggest a possible anthropo-genic effect at several inshore locations. Blood constitu-ents that are significantly elevated or reduced in inshorefish as compared to Georges Bank fish may indicate a physi-ologically stressed condition (Reid et al. 1987). By virtue oflocation, the Georges Bank location experiences minimal
input from anthropogenic sources, whereas the inshore lo-cations are known to contain contaminated sediments(Boehm 1983). In a summary of the NEMP, Reid et al. (1987)documented elevated trace metals in the sediments fromNew York Bight, Mud Patch, and Massachusetts Bay, aswell at the mouths of coastal estuaries. New York Bight hadthe highest measurements of polychlorinated biphenyls,while the incidence of fin rot at that location was found tobe significantly greater than at other Northwest Atlanticlocations (Ziskowski et al. 1987).
Osmolality and Sodium
Significantly lower osmolality levels in Merrimack River,Mud Patch, and New York Bight male yellowtail flounderduring fall, and significantly lower sodium levels inMerrimack River males and females during the same sea-son, suggest reduced osmoregulatory capacity, and mayindicate an anthropogenic effect, as chronic low osmolalitylevels are thought to result from exposure to contaminants(Wedemeyer and Yasutake 1977). Dawson (1990) docu-mented significantly reduced osmolality in windowpane froma polluted harbor in Long Island Sound as compared to fishfrom other, less impacted areas. European flounder(Platichthys flesus) exposed to titanium dioxide industrialeffluent experienced reductions in osmolality and bloodsodium (Larsson et al. 1980). Reduced blood sodium wasdocumented in rainbow trout exposed to chlorine (Zeitounet al. 1977). Leakage of sodium and other ions from extra-cellular fluids, or decreased uptake of these ions throughthe gills, can contribute to impaired osmoregulatory ability(Pearcy 1961; Larsson et al. 1980).
The significantly elevated spring osmolality and bloodsodium levels observed in New York Bight male and femaleyellowtail flounder may indicate a pollutant effect. Win-dowpane exposed to mercury in the laboratory showed el-evated sodium concentrations (Dawson 1990). A markedincrease in blood sodium was observed in seawater-accli-mated rainbow trout exposed to bunker C oil, most likelyresulting from direct interference of the oil with the sodiumtransport system of the gills (McKeown and March 1978).
Potassium
Significantly elevated potassium levels were observedduring fall in yellowtail flounder males and females fromNew York Bight, and in females from Merrimack River andMud Patch. These elevated levels may result from impaireduptake of potassium ions through the gills, disruption offood absorption in the intestinal mucosa, or defective renalfunction and impaired reabsorption of potassium ions inthe renal tubes (Larsson et al. 1981).
Elevated potassium is also known to result from chlo-rine exposure in rainbow trout (Zeitoun et al. 1977). Euro-pean flounder exposed to sublethal cadmium concentra-

7Page
tions showed a dose-dependent reduction in potassiumconcentration (Larsson et al. 1981).
Calcium
Calcium was significantly elevated in MassachusettsBay and Merrimack River females during spring, while lev-els were significantly reduced in females from Mud Patchduring summer, and in fish of both sexes from MerrimackRiver and males from Mud Patch during fall. These valuesdiffered significantly from Georges Bank, perhaps symp-tomatic of impaired physiological processes. Larsson et al.(1981) speculates that a disturbance in calcium metabolismof fish may be caused by defective calcium absorption orimpaired calcium reabsorption in the renal tubes, or a com-bination of these effects.
In laboratory exposures, windowpane exposed to mer-cury (Dawson 1990) and European flounder exposed to cad-mium experienced reduced calcium concentration (Larssonet al. 1981).
Hematocrit, Hemoglobin, and MCHC
With only one exception, yellowtail flounder from CapeCod Bay had the lowest levels of hematocrit, hemoglobin,and MCHC by sex during winter. These levels for Cape CodBay fish were also among the lowest levels over all seasonsand locations in our study. Mud Patch females had thelowest level of winter hematocrit; they also had the next-to-lowest level of winter hemoglobin. Similarly, anemic sum-mer flounder (Paralichthys dentatus), winter flounder, andwindowpane were also collected from Cape Cod Bay andMud Patch during NEMP cruises (Reid et al. 1987). Re-duced hematocrit and/or hemoglobin can indicate physi-ological stresses such as anemia, dehydration, and hemodi-lution resulting from either gill damage (Wedemeyer andYasutake 1977) or increased red blood cell breakdown in thespleen (Larsson et al. 1980). Reduced MCHC suggestsdisruption of the hemoglobin-forming process as opposedto the rate of blood cell production (Heath 1995). Reducedhematocrit, hemoglobin, and MCHC were documented inredear sunfish (Lepomis microlophus) collected next to aselenium discharge site; the selenium appeared to interferewith normal hemoglobin formation, evidenced by the dis-proportionate reduction in hemoglobin as compared to redblood cells (Sorensen and Bauer 1983). European flounderexposed to cadmium in the laboratory experienced signifi-cant reductions in hematocrit and hemoglobin with no as-sociated change in MCHC. In this case, the cadmium-in-duced anemic response may be due to increased bloodplasma volume, accelerated loss or destruction of erythro-cytes, and/or decreased rate of erythrocyte production(Johansson-Sjobeck and Larsson 1978).
During spring, elevated hematocrit was noted in yel-lowtail flounder males and females from Merrimack River,and females from New York Bight; it likely represents a swell-ing of cells in response either to high blood levels of carbondioxide or to low pH rather than an increase in the numberof circulating erythrocytes (Heath 1995), as no significantdifference was noted in MCHC. Hematocrit may increase inresponse to stress at a different rate than that of the hemo-globin contained in the erythrocytes (Wells et al. 1986).
During fall, males from Mud Patch and New York Bightshowed elevated hemoglobin, possibly a response to an-thropogenic factors. Abnormally elevated hematocrit orhemoglobin may be related to hemoconcentration, dehy-dration stress, or polycythemia (Wedemeyer and Yasutake1977), or to osmoregulatory dysfunction (Heath 1995). Alsoduring fall, significantly elevated MCHC was measured inmales from Merrimack River, Mud Patch, and New York Bight,and may indicate a greater amount of hemoglobin per unitof red blood cells and possibly swollen erythrocytes. Win-dowpane from a polluted harbor in Long Island Sound hadsignificantly higher hematocrit and hemoglobin than otherless-impacted areas, suggesting increased hematopoiesis(Dawson 1990). Larsson et al. (1980) also saw increasedhematocrit and hemoglobin in female European flounderexposed to titanium dioxide industrial effluent in the field,and noted that flounder may try to compensate for impairedoxygen uptake by a release of erythrocytes from the spleen.Increased hematocrit was observed in rainbow trout stressedby chlorine exposure (Zeitoun et al. 1977).
CONCLUSIONS
Seasonally-induced variability was observed in yellow-tail flounder blood constituent levels. This variability sug-gests that blood chemistry values are best defined in termsof a physiological reference range (Luskova 1998).
Seasonal patterns were not always consistent amongthe study locations and may reflect natural variabilityamong locations (Bidwell and Heath 1993). This variabilitymay result from inherent differences in regional oceano-graphic conditions, such as temperature and salinity, butmay also be influenced by handling stress, and/or stock-related variations or a combination of these factors(McCarthy et al. 1973; Hille 1982).
Our results present some evidence for possible anthro-pogenic effects on certain blood chemistry parameters ofyellowtail flounder collected from inshore locations. Per-haps the most valuable aspect of this study, though, is thatit presents a benchmark for changes due to environmentalfactors or anthropogenic influences over an annual cycle atkey locations in the Northeast U.S. Shelf Ecosystem.
Page 8
ACKNOWLEDGMENTS
The authors thank Anthony Calabrese, RonaldGoldberg, and Frederick Thurberg for editorial assistance,Suellen Fromm for providing the NEMP hydrographic data,Christine Zetlin for designing Figure 1, and Jose Pereira andDee Tucker for technical assistance.
REFERENCES CITED
Anderson, N.A.; Laursen, J.S.; Lykkeboe, G. 1985. Sea-sonal variations in hematocrit, red cell hemoglobin andnucleoside triphosphate concentrations in the Euro-pean eel Anguilla anguilla. Comp. Biochem. Physiol.81A:87-92.
Anthony, E.H. 1961. The oxygen capacity of goldfish(Carassius auratus L.) blood in relation to thermal en-vironment. J. Exp. Biol. 38:93-107.
Barnhart, R.A. 1969. Effects of certain variables on hema-tological characteristics of rainbow trout. Trans. Am.Fish. Soc. 98:411-418.
Bentinck-Smith, J.; Beleau, M.H.; Waterstrat, P.; Tucker, C.S.;Stiles, F.; Bowser, P.R.; Brown, L.A. 1987. Biochemicalreference ranges for commercially reared channel cat-fish. Prog. Fish-Cult. 49:108-114.
Bidwell, J.R.; Heath, A.G. 1993. An in situ study of rockbass (Ambloplites rupestris) physiology: effect of sea-son and mercury contamination. Hydrobiologia264:137-152.
Bigelow, H.B.; Schroeder, W.C. 1953. Fishes of the Gulf ofMaine. U.S. Fish Wildl. Serv. Fish. Bull. 53; 577 p.
Bjornsson, B.T.; Halldorsson, O.; Haux, C.; Norberg, B.;Brown, C.L. 1998. Photoperiod control of sexual matu-ration of the Atlantic halibut (Hippoglossushippoglossus): plasma thyroid hormone and calciumlevels. Aquaculture 166:117-140.
Boehm, P. 1983. Chemical contaminants in Northeast UnitedStates marine sediments. NOAA [Natl. Ocean. Atmos.Admin.] Tech. Rep. NOS [Natl. Ocean Serv.] 99; 82 p.
Booke, H.E. 1964. Blood serum protein and calcium levelsin yearling brook trout. Prog. Fish-Cult. 26:107-110.
Bourne, P.K. 1986. Changes in hematological parametersassociated with capture and captivity of the marineteleost, Pleuronectes platessa L. Comp. Biochem.Physiol. 85A:435-443.
Bridges, D.W.; Cech, J.J.; Pedro, D.N. 1976. Seasonal he-matological changes in winter flounder,Pseudopleuronectes americanus. Trans. Am. Fish. Soc.105:596-600.
Cadrin, S.X. 2003. Stock assessment of yellowtail flounderin the Southern New England - Mid-Atlantic Bight area.U.S. Dep. Commer. Northeast Fish. Sci. Cent. Ref. Doc.03-02; 101 p.
Cadrin, S.X.; King, J. 2003. Stock assessment of yellowtailflounder in the Cape Cod - Gulf of Maine area. U.S.
Dep. Commer. Northeast Fish. Sci. Cent. Ref. Doc. 03-03; 84 p.
Cameron, J.N. 1970. The influence of environmental vari-ables on the hematology of pinfish (Lagodonrhomboides) and striped mullet (Mugil cephalus).Comp. Biochem. Physiol. 32:175-192.
Collette, B.B.; Klein-MacPhee, G., editors. 2002. Bigelowand Schroeder’s fishes of the Gulf of Maine. Washing-ton, DC: Smithsonian Press; 748 p.
Courtois, L.A. 1976. Hematology of juvenile striped bass,Morone saxatilis (Walbaum), acclimated to differentenvironmental conditions. Comp. Biochem. Physiol.54A:221-223.
Dawson, M.A. 1990. Blood chemistry of the windowpaneflounder Scophthalmus aquosus in Long Island Sound:geographical, seasonal and experimental variations.Fish. Bull. (Washington, DC) 88:429-437.
Denton, J.E.; Yousef, M.K. 1975. Seasonal changes in he-matology of rainbow trout, Salmo gairdneri. Comp.Biochem. Physiol. 51A: 151-153.
Dwyer, W.P.; Piper, R.G.; Smith, C.E. 1983. Brook trout growthefficiency as affected by temperature. Prog. Fish-Cult.45(3):161-163.
Edsall, C.C. 1999. A blood chemistry profile for lake trout.J. Aquat. Anim. Health 11:81-86.
Ellsaesser, C.F.; Clem, L.W. 1987. Blood serum chemistrymeasurements of normal and acutely stressed channelcatfish. Comp. Biochem. Physiol. 88A(3):589-594.
Fahay, M.P. 1983. Guide to the early stages of marine fishesoccurring in the western North Atlantic Ocean, CapeHatteras to the southern Scotian Shelf. J. NorthwestAtl. Fish. Sci. 4; 423 p.
Fletcher, G.L. 1977. Circannual cycles of blood plasma freez-ing point Na+ and Cl- concentrations in Newfoundlandwinter flounder (Pseudopleuronectes americanus): cor-relation with water temperature and photoperiod. Can.J. Zool. 55:789-795.
Fletcher, G.L. 1981. Effects of temperature and photoperiodon the plasma freezing point depression, Cl- concen-tration, and protein “antifreeze” in winter flounder. Can.J. Zool. 59:193-201.
Folmar, L.C. 1993. Effects of chemical contaminants onblood chemistry of teleost fish: a bibliography and syn-opsis of selected effects. Environ. Toxicol. Chem.12:337-375.
Folmar, L.C.; Moody, T.; Bonomelli, S.; Gibson, J. 1992.Annual cycle of blood chemistry parameters in stripedmullet (Mugil cephalus L.) and the pinfish (Lagodonrhomboids L.) from the Gulf of Mexico. J. Fish Biol.41:999-1011.
Haider, G. 1969. Hematological observation on rainbowtrout (Salmo gairdneri Rich.). I. Changes of the hemo-globin level caused by age and season. Zool. Anz.185:36-46.
Hardig, J.; Hoglund, L.B. 1983. On accuracy in estimatingfish blood variables. Comp. Biochem. Physiol.75A(1):35-40.
9Page
Haux, C. 1979. Effects of DDT on blood plasma electrolytesin the flounder, Platichthys flesus L, in hypotonic brack-ish water. Ambio 8(4):171-173.
Heath, A.G. 1995. Water pollution and fish physiology.Boca Raton, FL: Lewis Publishers; 359 p.
Hille, S. 1982. A literature review of the blood chemistry ofrainbow trout, Salmo gairdneri Rich. J. Fish Biol.20:535-569.
Houston, A.H.; Reaves, R.S.; Madden, J.A.; DeWilde, M.A.1968. Environmental temperature and the body fluidsystem of the fresh-water teleost. I. Ionic regulation inthermally acclimated rainbow trout, Salmo gairdneri.Comp. Biochem. Physiol. 25:563-581.
Houston, A.H. 1997. Review: Are the classical hematologi-cal variables acceptable indicators of fish health? Trans.Am. Fish. Soc. 126(6):879-894.
Johansson-Sjobeck, M.-L.; Larsson, A. 1978. The effect ofcadmium on the hematology and on the activity ofaminolevulinic acid dehydratase (ALA-D) in blood andhematopoietic tissues of the flounder Pleuronectesflesus L. Environ. Res. 17:191-204.
Johnson, D.L.; Morse, W.W.; Berrien, P.L.; Vitaliano, J.J.1999. Essential fish habitat source document: yellow-tail flounder, Limanda ferruginea, life history and habi-tat characteristics. NOAA [Natl. Ocean. Atmos. Admin.]Tech. Memo. NMFS [Natl. Mar. Fish. Serv.]-NE-140; 29 p.
Johnson, L.L.; Casillas, E.; Myers, M.S.; Rhodes, L.D.;Olson, O.P. 1991. Patterns of oocyte development andrelated changes in plasma 17-ß estradiol, vitellogenin,and plasma chemistry in English sole Parphyrys vetulusGirard. J. Exp. Mar. Biol. Ecol. 152:161-185.
Kakuno, A.; Koyama, J. 1994. Comparative studies on fishblood. II. Seasonal variations of hematological param-eters on marine teleostei. Bull. Natl. Res. Inst. Fish.Sci. 6:67-77.
Lane, H.C. 1979. Progressive changes in haematology andtissue water of sexually mature trout, Salmo gairdneriRichardson during the autumn and winter. J. Fish Biol.15:425-436.
Larsson, A.; Bengtsson, B.-E.; Haux, C. 1981. Disturbedion balance in flounder, Platichthys flesus L. exposedto sublethal levels of cadmium. Aquat. Toxicol. 1:19-35.
Larsson, A.; Johannsson-Sjobeck, M.L.; Fange, R. 1976.Comparative study of some hematological and bio-chemical blood parameters in fishes from the Skagerrak.J. Fish Biol. 9:425-440.
Larrson, A.; Lehtinen, K.J.; Haux, C. 1980. Biochemical andhematological effects of a titanium dioxide industrialeffluent on fish. Bull. Environ. Contam. Toxicol. 25:427-435.
Lochmiller, R.L.; Weichman, J.D.; Zale, A.V. 1989. Hemato-logical assessment of temperature and oxygen stressin a reservoir population of striped bass (Moronesaxatilis). Comp. Biochem. Physiol. 93A(3):535-541.
Luskova, V. 1998. Factors affecting haematological indices infree-living fish populations. Acta Vet. Brno 67:249-255.
Lux, F.E. 1964. Identification of New England yellowtailflounder groups. U.S. Fish Wildl. Serv. Fish. Bull.63(1):1-10.
Martinez, F.J.; Garcia-Riera, M.P.; Canteras, M.; De Costa,J.; Zamora, S. 1994. Blood parameters in rainbow trout(Oncorhynchus mykiss): simultaneous influence of vari-ous factors. Comp. Biochem. Physiol. 107(A):95-100.
McCarthy, D.H.; Stevenson, J.P.; Roberts, M.S. 1973. Someblood parameters of the rainbow trout (Salmo gairdneriRichardson) I. The Kamloops variety. J. Fish Biol. 5:1-8.
McKeown, B.A.; March, G.L. 1978. The acute affect ofbunker C oil and an oil dispersant on: 1 serum glucose,serum sodium and gill morphology in both freshwaterand seawater acclimated rainbow trout (Salmogairdneri). Water Res. 12:157-163.
Murphy, P.; Houston, A.H. 1977. Temperature, photope-riod, and water-electrolyte balance in rainbow trout,Salmo gairdneri. Can. J. Zool. 55(9):1377-1388.
Nagler, J.J.; Ruby, S.M.; Idler, D.R.; So, Y.P. 1987. Serumphosphoprotein phosphorus and calcium levels as re-productive indicators of vitellogenin in highlyvitellogenic mature female and estradiol-injected imma-ture rainbow trout (Salmo gairdneri). Can. J. Zool.65:2421-2425.
O’Neill, M.D.; Wesp, H.M.; Mensinger, A.F.; Hanlon, R.T.1998. Initial baseline blood chemistry of the oystertoadfish, Opsanus tau. Biol. Bull. (Woods Hole)195:228-229.
Pearce, J.B. 1998. A short history of marine environmentalmonitoring. Mar. Poll. Bull. 37:1-2.
Pearcy, W.G. 1961. Seasonal changes in osmotic pressureof flounder sera. Science 134 (3473):193-194.
Powers, D.A. 1980. Molecular ecology of teleost fish he-moglobins: strategies for adapting to changing envi-ronments. Am. Zool. 20:139-162.
Preston, A. 1960. Red blood values in the plaice(Pleuronectes platessa L.) J. Mar. Biol. Assoc. U.-K.39:681-687.
Rabe, J.; Brown, J.A. 2000. A pulse feeding strategy forrearing larval fish: an experiment with yellowtail floun-der. Aquaculture 191:289-302.
Reid, R.N.; Ingham, M.C.; Pearce, J.B., editors. 1987.NOAA’s Northeast Monitoring Program (NEMP): a re-port on progress of the first five years (1979-84) and aplan for the future. NOAA [Natl. Ocean. Atmos. Admin.]Tech. Memo. NMFS [Natl. Mar. Fish. Serv.]-F/NEC-44;138 p.
Royce, W.F.; Buller, R.J.; Premetz, E.D. 1959. Decline of theyellowtail flounder (Limanda ferruginea) off New En-gland. U.S. Fish Wildl. Serv. Fish. Bull. 59:169-267.
Sano, T. 1960a. Haematological studies of the culture fishesin Japan. 2. Seasonal variation of the blood constitu-ents of rainbow trout. J. Tokyo Univ. Fish. 46:67-75.
Sano, T. 1960b. Haematological studies of the culture fishesin Japan. 3. Changes in blood constituents with growthof rainbow trout. J. Tokyo Univ. Fish. 46:77- 87.

Page 10
Sandstrom, O. 1989. Seasonal variations in some bloodparameters in perch, Perca fluviatilis L. J. Appl.Ichthyol. 5:80-84.
SAS Institute. 1989. SAS/STAT user’s guide, version 6.Fourth ed., vol. 2. Cary, NC: SAS Institute.
Shell, E.W. 1961. Chemical composition of blood of small-mouth bass. U.S. Fish Wildl Serv. Res. Rep. 57; 36 p.
Sorensen, E.M.B.; Bauer, T.L. 1983. Hematological dyscra-sia in teleosts chronically exposed to selenium-ladeneffluent. Arch. Environ. Contam. Toxicol. 12:135-141.
Survey Working Group, Northeast Fisheries Center. 1988.An evaluation of the bottom trawl survey program ofthe Northeast Fisheries Center. NOAA [Natl. Ocean.Atmos. Admin.] Tech. Memo. NMFS [Natl. Mar. Fish.Serv.]-F/NEC-52; 83 p.
Tun, N.; Houston, A.H. 1986. Temperature, oxygen, photope-riod, and the hemoglobin system of the rainbow trout,Salmo gairdneri. Can. J. Zool. 64:1883-1888.
Umminger, B.L. 1969. Physiological studies on supercooledkillifish (Fundulus heteroclitus). I. Serum inorganic con-stituents in relation to osmotic and ionic regulation atsubzero temperatures. J. Exp. Zool. 172:283-302.
Umminger, B.L. 1970. Effects of subzero temperatures andtrawling stress on serum osmolality in the winter flounderPseudopleuronectes americanus. Biol. Bull. (WoodsHole) 139:574-579.
Umminger, B.L.; Mahoney, J.B. 1972. Seasonal changes in theserum chemistry of the winter flounder,Pseudopleuronectes americanus. Trans. Am. Fish. Soc.4:746-748.
Warner, M.C.; Williams, R.W. 1977. Comparisons betweenserum values of pond and intensive raceway culturedchannel catfish Ictalurus punctatus (Rafinesque). J. FishBiol. 11:385-391.
Wedemeyer, G.A.; Yasutake, W.T. 1977. Clinical methods forthe assessment of the effects of environmental stress onfish health. Tech. Pap. U.S. Fish Wildl. Serv. 89; 18 p.
Wells, R.M.G.; McIntyre, R.H.; Morgan, A.K.; Davie, P.S. 1986.Physiological stress responses in big gamefish after cap-ture: observations on plasma chemistry and blood fac-tors. Comp. Biochem. Physiol. 84A(3):565-571.
Woo, N.Y.S. 1990. Metabolic and osmoregulatory changesduring temperature acclimation in the red sea bream,Chrysophrys major: implications for its culture in the sub-tropics. Aquaculture 87:197-208.
Zanuy, S.; Carrillo, M. 1985. Annual cycles of growth, feedingrate, gross conversion efficiency and hematocrit levels ofsea bass (Dicentrarchus labrax L.) adapted to two differ-ent osmotic media. Aquaculture 44:11-25.
Zeitoun, I.H.; Hughes, L.D.; Ullrey, D.E. 1977. Effects of shockexposure on the plasma electrolyte concentrations of adultrainbow trout (Salmo gairdneri). J. Fish. Res. Board Can.34:1034-1039.
Ziskowski, J.J.; Despres-Patanjo, L.; Murchelano, R.A.; Howe,A.B.; Ralph, D.; Atran, S. 1987. Disease in commerciallyvaluable fish stocks in the Northwest Atlantic. Mar. Pollut.Bull. 18(9):496-504.

Tab
le 1
. Gen
eral
coo
rdin
ates
(la
titud
e an
d lo
ngitu
de)
of s
tatio
ns, a
nd n
umbe
rs o
f ad
ult y
ello
wta
il fl
ound
er c
olle
cted
at t
hose
sta
tions
, dur
ing
1978
-85
Co
ord
ina
tes
Lo
ca
tio
nS
tati
on
No
.L
ati
tud
eL
on
git
ud
eN
o.
of
Fis
h
Geo
rges
Ban
k
17
4
2°
00
'N
67
°0
0'W
35
20
4
0°
58
'N
67
°3
3'W
1
22
24
40
°2
0'N
69
°0
0'W
11
84
40
°4
8'N
67
°4
1'W
18
26
14
0°
48
'N6
8°
38
'W2
0
26
44
0°
35
'N6
9°
31
'W1
3
Merr
imack
Riv
er
13
42
°4
8'N
70
°4
5'W
18
4
Mass
ach
use
tts
Bay
14
42
°1
9'N
70
°3
6'W
34
Cap
e C
od
Bay
15
42
°0
9'N
70
°2
5'W
34
Mu
d P
atc
h
27
40
°2
9'N
70
°1
2'W
20
35
40
°4
1'N
71
°2
2'W
14
3
23
74
0°
43
'N7
0°
11
'W1
5
25
04
0°
27
'N7
0°
14
'W2
0
25
44
0°
50
'N7
0°
32
'W2
0
New
Yo
rk B
igh
t
40
40
°2
6'N
73
°1
1'W
48
42
40
°2
5'N
73
°4
6'W
10
47
40
°0
1'N
73
°2
5'W
76
23
54
0°
19
'N7
2°
07
'W2
0
11Page

Tab
le 2
. Pe
arso
n pr
oduc
t mom
ent c
orre
latio
ns f
or N
orth
wes
t Atla
ntic
hyd
rogr
aphi
c co
nditi
ons
and
bloo
d co
nstit
uent
leve
ls in
traw
l-co
llect
ed a
dult
yello
wta
il fl
ound
er d
urin
g19
78-8
5. (
Sam
ple
size
s ra
nged
fro
m 2
68 to
830
. R
-val
ues>
0.4,
sho
wn
in b
old,
wer
e co
nsid
ered
sig
nifi
cant
.)
Tem
per
atu
reS
ali
nit
yD
isso
lved
Oxygen
Osm
ola
lity
Sod
ium
Pota
ssiu
mC
alc
ium
Hem
ato
cri
tH
em
og
lob
inM
CH
C
Tem
per
atu
re-
Sal
init
y0
.11
-
Dis
solv
ed O
xygen
-0.1
50
.22
-
Osm
ola
lity
-0.0
1-0
.12
-0.6
5-
So
diu
m0
.11
-0.3
8-0
.57
0.5
6-
Po
tass
ium
0.3
8-0
.08
-0.0
20
.14
0.1
6-
Cal
ciu
m0
.15
0.0
0-0
.03
0.3
30
.27
0.0
1-
Hem
ato
crit
-0.0
10
.01
0.0
80
.08
0.0
00
.04
0.1
1-
Hem
og
lob
in-0
.23
0.3
30
.57
-0.1
2-0
.22
-0.0
30
.06
0.7
4-
MC
HC
-0.1
40
.52
0.9
8-0
.36
-0.4
4-0
.03
-0.0
8-0
.23
0.5
3-
Page 12

Tab
le 3
. MA
NC
OV
A r
esul
ts f
or b
lood
con
stitu
ent l
evel
s in
traw
l-co
llect
ed a
dult
yello
wta
il fl
ound
er f
rom
the
Nor
thw
est A
tlant
ic d
urin
g 19
78-8
5
Co
nst
itu
en
t
Va
ria
ble
Osm
ola
lity
So
diu
mP
ota
ssiu
mC
alc
ium
Hem
ato
crit
Hem
og
lob
inM
CH
C
Sex
0.1
88
40
.14
75
0.8
53
90
.34
80
0.2
80
90
.15
25
0.6
78
8
Sit
e<
0.0
00
1<
0.0
00
10
.01
10
0.0
04
1<
0.0
00
1<
0.0
00
10
.00
12
Sea
son
0.8
97
90
.00
02
<0
.00
01
<0
.00
01
<0
.00
01
<0
.00
01
<0
.00
1
Sex
× S
ite
0.0
18
30
.69
18
0.2
61
60
.00
18
0.2
50
10
.12
91
0.6
75
0
Sex
× S
easo
n0
.59
23
0.1
02
80
.16
69
0.5
39
60
.00
24
0.0
17
90
.05
22
Sex
× S
ite
× S
easo
n0
.00
01
<0
.00
01
<0
.00
01
<0
.00
01
<0
.00
01
<0
.00
01
<0
.00
01
Len
gth
0.0
33
1<
0.0
00
1<
0.0
00
10
.02
18
0.0
13
70
.00
63
0.4
44
2
13Page

Tab
le 4
.
Blo
od o
smol
ality
(ls
mea
n m
Osm
/kg
± s
(N
)) in
adu
lt ye
llow
tail
flou
nder
traw
l-co
llect
ed f
rom
six
Nor
thw
est A
tlant
ic lo
catio
ns d
urin
g 19
78-8
5. (
Stat
ion-
rela
ted
diff
eren
ces
(i.e
., be
twee
n th
e fi
ve in
shor
e st
atio
ns a
nd th
e G
eorg
es B
ank
offs
hore
sta
tion)
for
a g
iven
sea
son
and
sex
are
indi
cate
d by
bol
d va
lues
(re
ad h
oriz
onta
lly).
Seas
on-r
elat
ed d
iffe
renc
es f
or a
giv
en s
tatio
n an
d se
x ar
e in
dica
ted
by th
e pr
esen
ce o
r ab
senc
e of
sup
ersc
ript
s fo
r th
e va
lues
(re
ad v
ertic
ally
); v
alue
s w
ith th
e sa
me
or n
o su
pers
crip
t are
not
sig
nifi
cant
ly d
iffe
rent
; val
ues
with
dif
fere
nt s
uper
scri
pts
are
sign
ific
antly
dif
fere
nt.
Sex-
rela
ted
diff
eren
ces
for
a gi
ven
stat
ion
and
seas
on a
rein
dica
ted
by u
nder
lined
val
ues
(rea
d ve
rtic
ally
). F
or s
ome
stat
ions
and
sea
sons
, no
data
(“nd
”) w
ere
avai
labl
e. F
or s
tatis
tical
sig
nifi
canc
e, P
< 0
.05.
)
Off
shor
e St
atio
nIn
shor
e St
atio
ns
Sex
Seas
onG
eorg
es B
ank
Mer
rim
ack
Riv
erM
assa
chus
etts
Bay
Cap
e C
od B
ayM
ud P
atch
New
Yor
k B
ight
Male
Win
ter
494.
16 ±
18.
43 (
4)41
8.49
± 1
3.01
(8)
431.
70 ±
15.
07 (
6)50
3.39
± 1
8.41
(4)
454.
29 ±
13.
95 (
7)46
3.40
± 9
.98
(14)
a
Spri
ng44
0.14
± 6
.97
(28)
a42
9.47
± 1
6.47
(5)
430.
09 ±
26.
19 (
2)48
5.76
± 1
0.21
(13
)45
0.00
± 7
.91
(22)
47
6.4
4 ±
7.2
2 (
27
)a
Sum
mer
472.
57 ±
10.
21 (
13)b
426.
77 ±
8.9
3(1
7)nd
nd43
6.58
± 8
.39
(20)
and
Fall
48
7.1
0 ±
9.8
9 (
14
)b4
12
.47
± 6
.54
(3
2)
nd
nd
46
1.6
7 ±
6.6
7 (
32
)b4
36
.02
± 1
0.2
7 (
14
)b
Fem
ale
Win
ter
44
7.6
8 ±
7.8
0 (
24
)a4
10
.44
± 1
3.9
1 (
7)
45
5.3
6 (
1)
49
5.4
9 ±
26
.03
(2
)4
35
.45
± 1
0.2
1 (
13)
43
4.3
3 ±
9.2
2 (
16
)
Sp
rin
g4
25
.17
± 6
.36
(3
5)b
43
6.4
5 ±
16
.51
(5
)4
54
.18
± 1
3.9
3 (
7)
48
8.4
5 ±
18
.57
(4
)4
28
.86
± 6
.66
(3
2)a
45
3.8
3 ±
8.2
4 (
20
)
Sum
mer
450.
51 ±
5.6
2 (4
4)a
423.
31 ±
10.
30 (
13)
ndnd
440.
05 ±
8.6
7 (1
8)44
8.31
± 2
1.45
(3)
Fall
436.
43 ±
11.
27 (
11)
415.
25 ±
5.2
3 (5
3)nd
nd45
1.65
± 5
.15
(51)
b4
34
.85
± 9
.99
(14
)
x
Page 14

Tab
le 5
.
Blo
od s
odiu
m c
once
ntra
tion
(ls m
ean
mE
q/L
± s
(N
)) in
adu
lt ye
llow
tail
flou
nder
traw
l-co
llect
edfr
om si
x N
orth
wes
t Atla
ntic
loca
tions
dur
ing
1978
-85.
(St
atio
n-re
late
ddi
ffer
ence
s (i
.e.,
betw
een
the
five
insh
ore
stat
ions
and
the
Geo
rges
Ban
k of
fsho
re s
tatio
n) f
or a
giv
en s
easo
n an
d se
x ar
e in
dica
ted
by b
old
valu
es (
read
hor
izon
tally
).Se
ason
-rel
ated
dif
fere
nces
for
a g
iven
sta
tion
and
sex
are
indi
cate
d by
the
pres
ence
or
abse
nce
of s
uper
scri
pts
for
the
valu
es (
read
ver
tica
lly);
val
ues
with
the
sam
eor
no
supe
rscr
ipt a
re n
ot s
igni
fica
ntly
dif
fere
nt; v
alue
s w
ith d
iffe
rent
sup
ersc
ript
s ar
e si
gnif
ican
tly d
iffe
rent
. Se
x-re
late
d di
ffer
ence
s fo
r a
give
n st
atio
n an
d se
ason
are
indi
cate
d by
und
erlin
ed v
alue
s (r
ead
vert
ical
ly).
For
som
e st
atio
ns a
nd s
easo
ns, n
o da
ta (
“nd”
) w
ere
avai
labl
e. F
or s
tatis
tical
sig
nifi
canc
e, P
< 0
.05.
)
Off
sho
re S
tati
on
Insh
ore S
tati
on
s
Sex
Sea
son
Geo
rg
es
Ba
nk
Merrim
ack
Riv
er
Ma
ssa
ch
use
tts
Ba
yC
ap
e C
od
Ba
yM
ud
Pa
tch
New
Yo
rk
Big
ht
Mal
e
Win
ter
248.
84 ±
7.9
7 (4
)20
9.58
± 5
.63
(8)
206.
71 ±
6.5
2 (6
)20
3.85
± 7
.96
(4)
227.
16 ±
6.0
3 (7
)a22
1.64
± 4
.18
(15)
Sprin
g20
5.61
± 2
.55
(39)
a20
1.27
± 7
.12
(5)a
217.
97 ±
11.
32 (2
)23
5.02
± 4
.41
(13)
201.
26 ±
3.4
1 (2
2)b
217.
18 ±
3.0
7 (2
8)a
Sum
mer
218.
72 ±
4.4
2 (1
3)b
220.
44 ±
3.8
6 (1
7)b
nd
nd
214.
28 ±
3.5
4 (2
1)a
nd
Fall
223.
80 ±
4.0
1 (1
6)b
200.
77 ±
2.7
9 (3
3)a
ndnd
215.
21 ±
2.8
0 (3
4)a
229.
90 ±
4.9
4 (1
1)b
Fem
ale
Win
ter
253.
99 ±
3.3
0 (2
5)a
209.
03 ±
6.0
2 (7
)23
1.85
(1)
206.
50 ±
9.2
0 (3
)22
5.14
± 4
.42
(13)
a21
7.29
± 3
.99
(16)
Sprin
g20
4.15
± 2
.51
(42)
b20
5.63
± 7
.14
(5)
217.
23 ±
5.6
5 (8
)24
2.67
± 8
.03
(4)
209.
89 ±
2.7
9 (3
4)b
215.
41 ±
3.5
7 (2
0)
Su
mm
er
213.
15 ±
2.4
3 (4
4)c
216
.68
± 4.
28 (1
4)a
nd
nd
218.
68 ±
3.6
5 (1
9)25
7.52
± 9
.27
(3)
Fall
216.
82 ±
4.8
7 (1
1)c
203.
65 ±
2.3
0 (5
0)b
n
d
nd21
3.85
± 2
.23
(51)
b21
9.30
± 4
.48
(13)
15Page
x

Tab
le 6
.
Blo
od p
otas
sium
con
cent
ratio
n (l
s m
ean
mE
q/L
± s
(N
)) in
adu
lt ye
llow
tail
flou
nder
traw
l-co
llect
edfr
om s
ix N
orth
wes
t Atla
ntic
loca
tions
dur
ing
1978
-85.
(St
atio
n-re
late
d di
ffer
ence
s (i
.e.,
betw
een
the
five
insh
ore
stat
ions
and
the
Geo
rges
Ban
k of
fsho
re s
tati
on)
for
a gi
ven
seas
on a
nd s
ex a
re in
dica
ted
by b
old
valu
es (
read
hori
zont
ally
). S
easo
n-re
late
d di
ffer
ence
s fo
r a
give
n st
atio
n an
d se
x ar
e in
dica
ted
by th
e pr
esen
ce o
r ab
senc
e of
sup
ersc
ript
s fo
r th
e va
lues
(re
ad v
ertic
ally
); v
alue
s w
ithth
e sa
me
or n
o su
pers
crip
t are
not
sig
nifi
cant
ly d
iffe
rent
; val
ues
with
dif
fere
nt s
uper
scri
pts
are
sign
ific
antly
dif
fere
nt. S
ex-r
elat
ed d
iffe
renc
es f
or a
giv
en s
tatio
n an
dse
ason
are
indi
cate
d by
und
erlin
ed v
alue
s (r
ead
vert
ical
ly).
For
som
e st
atio
ns a
nd s
easo
ns, n
o da
ta (
“nd”
) w
ere
avai
labl
e. F
or s
tatis
tical
sig
nifi
canc
e, P
< 0
.05.
)
Off
sho
re S
tati
on
In
sho
re S
tati
on
s
Sex
Sea
son
Geo
rg
es
Ba
nk
Merrim
ack
Riv
er
Ma
ssa
ch
use
tts
Ba
yC
ap
e C
od
Ba
yM
ud
Pa
tch
New
Yo
rk
Big
ht
Mal
e
Win
ter
4.6
0 ±
1.0
9 (
4)
3.9
8 ±
0.7
7 (
8)a
3.7
8 ±
0.8
9 (
6)
3.5
6 ±
1.0
9 (
4)
4.7
4 ±
0.8
3 (
7)
2.90
± 0
.57
(15)
a
Sp
rin
g4
.54
± 0
.34
(3
9)b
6.5
9 ±
0.9
7 (
5)b
3.3
7 ±
1.2
7 (
3)
2.9
5 ±
0.6
3 (
12
)4
.87
± 0
.48
(2
1)b
4.4
5 ±
0.4
4 (
26
)b
Su
mm
er6
.98
± 0
.60
(1
3)a
5.2
4 ±
0.5
3 (
17
)n
dn
d6
.28
± 0
.48
(2
1)a
nd
Fal
l4
.30
± 0
.55
(1
6)b
4.3
1 ±
0.3
7 (
35
)an
dn
d4
.93
± 0
.40
(3
1)b
7.6
2 ±
0.6
5 (
12
)c
Fem
ale
Win
ter
4.2
2 ±
0.4
5 (
25
)a 3
.53
± 0
.82
(7
) 4
.65
(1
) 4
.74
± 1
.26
(3
) 3
.77
± 0
.60
(1
3)a
3.1
0 ±
0.5
5 (
16
)
Sp
rin
g
5.3
0 ±
0.3
4 (
42
)b
4.1
6 ±
0.9
8 (
5)
3.3
5 ±
0.7
7 (
8)
2.4
5 ±
1.1
0 (
4)
5.6
2 ±
0.3
9 (
32
)b
4.0
2 ±
0.5
0 (
19
)
Su
mm
er
5.4
7 ±
0.3
3 (
44
)b4
.36
± 0
.59
(1
4)
nd
n
d
6.4
0 ±
0.5
0 (
19
)b
11
.69
± 1
.27
(3
)
Fal
l 3
.03
± 0
.67
(1
1)a
5.0
2 ±
0.3
2 (
50
) n
d
nd
5
.36
± 0
.32
(4
6)b
5
.68
± 0
.64
(1
2)
Page 16
x

Tab
le 7
.
Blo
od c
alci
um c
once
ntra
tion
(ls
mea
n m
Eq/
L ±
s (
N))
in a
dult
yello
wta
il fl
ound
er tr
awl-
colle
cted
fro
m s
ix N
orth
wes
t Atla
ntic
loca
tions
dur
ing
1978
-85.
(St
atio
n-re
late
d di
ffer
ence
s (i
.e.,
betw
een
the
five
insh
ore
stat
ions
and
the
Geo
rges
Ban
k of
fsho
re s
tati
on)
for
a gi
ven
seas
on a
nd s
ex a
re in
dica
ted
by b
old
valu
es (
read
hori
zont
ally
). S
easo
n-re
late
d di
ffer
ence
s fo
r a
give
n st
atio
n an
d se
x ar
e in
dica
ted
by th
e pr
esen
ce o
r ab
senc
e of
sup
ersc
ript
s fo
r th
e va
lues
(re
ad v
ertic
ally
); v
alue
s w
ithth
e sa
me
or n
o su
pers
crip
t are
not
sig
nifi
cant
ly d
iffe
rent
; val
ues
with
dif
fere
nt s
uper
scri
pts
are
sign
ific
antly
dif
fere
nt. S
ex-r
elat
ed d
iffe
renc
es f
or a
giv
en s
tatio
n an
dse
ason
are
indi
cate
d by
und
erlin
ed v
alue
s (r
ead
vert
ical
ly).
For
som
e st
atio
ns a
nd s
easo
ns, n
o da
ta (
“nd”
) w
ere
avai
labl
e. F
or s
tatis
tical
sig
nifi
canc
e, P
< 0
.05.
)
Off
sho
re S
tati
on
Insh
ore S
tati
on
s
Sex
Sea
son
Geo
rg
es
Ba
nk
Merrim
ack
Riv
er
Ma
ssa
ch
use
tts
Ba
yC
ap
e C
od
Ba
yM
ud
Pa
tch
New
Yo
rk
Big
ht
Mal
e
Win
ter
4.1
9 ±
0.6
4 (
4)
4.5
1 ±
0.4
5 (
8)
4.5
3 ±
0.5
2 (
6)
4.6
0 ±
0.6
4 (
4)
4.5
2 ±
0.4
8 (
7)
5.3
1 ±
0.3
4 (
15
)
Sp
rin
g4
.50
± 0
.20
(3
9)a
4.8
6 ±
0.5
7 (
5)
5.7
6 ±
0.9
1 (
2)
3.7
9 ±
0.3
7 (
12
) 4
.24
± 0
.27
(2
2)
5.0
5 ±
0.2
5 (
28
)
Su
mm
er4
.34
± 0
.35
(1
3)a
4.2
2 ±
0.3
1(1
7)
nd
nd
3.9
7 ±
0.2
8 (
21
)an
d
Fal
l6
.31
± 0
.34
(1
4)b
4.2
4 ±
0.2
4 (
29
)n
dn
d4
.78
± 0
.22
(3
4)b
5.3
3 ±
0.3
8 (
12
)
Fem
ale
Win
ter
4.6
4
± 0
.26
(2
5)a
4.7
5 ±
0.4
8 (
7)b
,c4
.77
(1
)5
.08
± 0
.74
(3
)4
.25
± 0
.35
(1
3)
4.8
4 ±
0.3
2 (
16
)
Sp
rin
g4
.44
± 0
.20
(4
1)a
7.7
5 ±
0.5
2 (
6)a
5.6
7 ±
0.4
5 (
8)
4.6
6 ±
0.6
4 (
4)
4.2
3 ±
0.2
2 (
34
)a4
.40
± 0
.29
(1
9)a
Su
mm
er5
.27
± 0
.19
(4
4)b
5.2
5 ±
0.3
4 (
14
)bn
dn
d3
.97
± 0
.29
(1
9) a
2.5
6 ±
0.7
4 (
3)
Fal
l5
.64
± 0
.39
(1
1)b
4.2
8 ±
0.1
9 (
47
)cn
dn
d4
.99
± 0
.18
(5
1)b
5.7
1 ±
0.3
6 (
13
)b
17Page
x
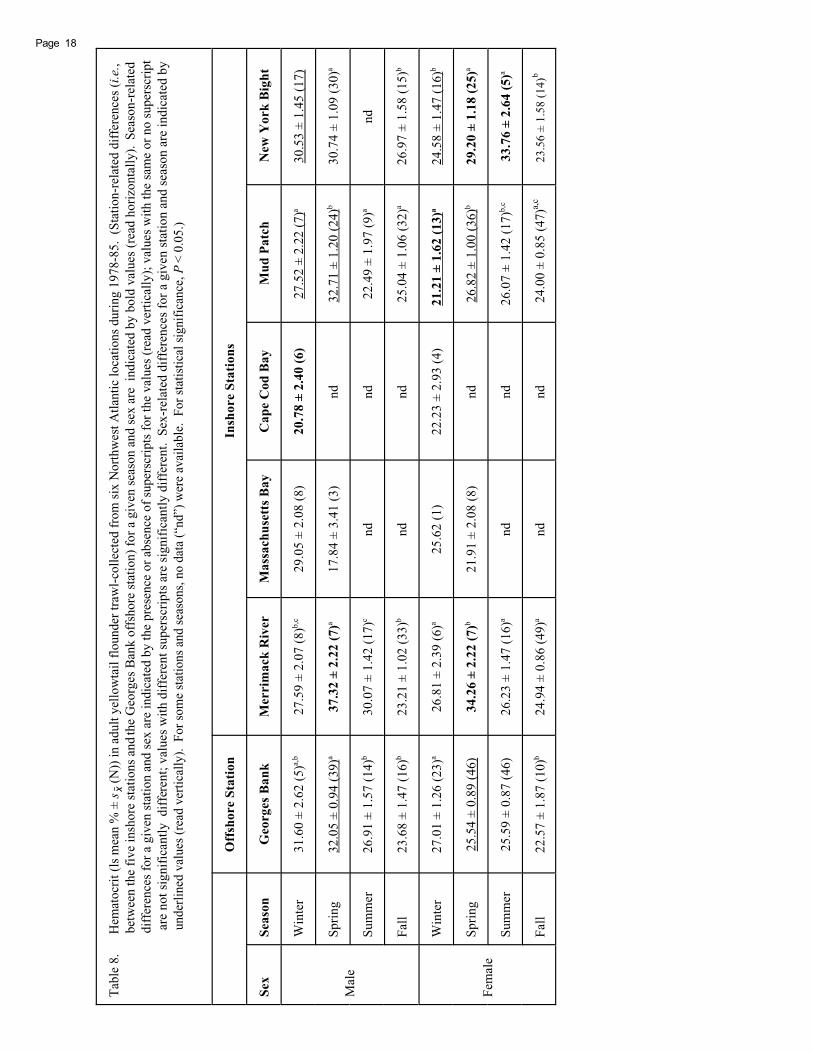
Tab
le 8
. H
emat
ocri
t (ls
mea
n %
± s
(N
)) in
adu
lt ye
llow
tail
flou
nder
traw
l-co
llect
ed f
rom
six
Nor
thw
est A
tlant
ic lo
catio
ns d
urin
g 19
78-8
5. (
Stat
ion-
rela
ted
diff
eren
ces
(i.e
.,be
twee
n th
e fi
ve in
shor
e st
atio
ns a
ndth
e G
eorg
es B
ank
offs
hore
sta
tion)
for
a g
iven
sea
son
and
sex
are
indi
cate
d by
bol
d va
lues
(re
ad h
oriz
onta
lly).
Sea
son-
rela
ted
diff
eren
ces
for
a gi
ven
stat
ion
and
sex
are
indi
cate
d by
the
pres
ence
or
abse
nce
of s
uper
scri
pts
for
the
valu
es (
read
ver
tical
ly);
val
ues
with
the
sam
e or
no
supe
rscr
ipt
are
not
sig
nifi
cant
ly d
iffe
rent
; val
ues
with
dif
fere
nt s
uper
scri
pts
are
sign
ific
antly
dif
fere
nt.
Sex-
rela
ted
diff
eren
ces
for
a gi
ven
stat
ion
and
seas
on a
re in
dica
ted
by u
nder
lined
val
ues
(rea
d ve
rtic
ally
). F
or s
ome
stat
ions
and
sea
sons
, no
data
(“n
d”)
wer
e av
aila
ble.
For
sta
tistic
al s
igni
fica
nce,
P <
0.0
5.)
Off
sho
re S
tati
on
Insh
ore S
tati
on
s
Sex
Sea
son
Geo
rg
es
Ba
nk
Merrim
ack
Riv
er
Ma
ssa
ch
use
tts
Ba
yC
ap
e C
od
Ba
yM
ud
Pa
tch
New
Yo
rk
Big
ht
Mal
e
Win
ter
31
.60
± 2
.62
(5
)a,b
27
.59
± 2
.07
(8
)b,c
29
.05
± 2
.08
(8
)2
0.7
8 ±
2.4
0 (
6)
27
.52
± 2
.22
(7
)a3
0.5
3 ±
1.4
5 (
17
)
Sp
rin
g3
2.0
5 ±
0.9
4 (
39
)a3
7.3
2 ±
2.2
2 (
7)a
17
.84
± 3
.41
(3
)n
d3
2.7
1 ±
1.2
0 (
24
)b3
0.7
4 ±
1.0
9 (
30
)a
Su
mm
er2
6.9
1 ±
1.5
7 (
14
)b3
0.0
7 ±
1.4
2 (
17
)cn
dn
d2
2.4
9 ±
1.9
7 (
9)a
nd
Fal
l2
3.6
8 ±
1.4
7 (
16
)b2
3.2
1 ±
1.0
2 (
33
)bn
dn
d2
5.0
4 ±
1.0
6 (
32
)a2
6.9
7 ±
1.5
8 (
15
)b
Fem
ale
Win
ter
27
.01
± 1
.26
(2
3)a
26
.81
± 2
.39
(6
)a2
5.6
2 (
1)
22
.23
± 2
.93
(4
)2
1.2
1 ±
1.6
2 (
13
)a2
4.5
8 ±
1.4
7 (
16
)b
Sp
rin
g2
5.5
4 ±
0.8
9 (
46
)3
4.2
6 ±
2.2
2 (
7)b
21
.91
± 2
.08
(8
)n
d2
6.8
2 ±
1.0
0 (
36
)b2
9.2
0 ±
1.1
8 (
25
)a
Su
mm
er2
5.5
9 ±
0.8
7 (
46
)2
6.2
3 ±
1.4
7 (
16
)an
dn
d2
6.0
7 ±
1.4
2 (
17
)b,c
33
.76
± 2
.64
(5
)a
Fal
l 2
2.5
7 ±
1.8
7 (
10
)b
24
.94
± 0
.86
(4
9)a
nd
n
d
24
.00
± 0
.85
(4
7)a,
c23
.56
± 1.
58 (1
4)b
Page 18
x

Tab
le 9
.H
emoglo
bin
conce
ntr
atio
ns
(ls
mea
n g
/100 m
l ±
s (N
)) i
n a
dult
yel
low
tail
flo
under
tra
wl-
coll
ecte
dfr
om
six
Nort
hw
est
Atl
anti
c lo
cati
ons
duri
ng 1
978-8
5.
(Sta
tion-
rela
ted
dif
fere
nces
(i.e
., b
etw
een
th
e f
ive i
nsh
ore
sta
tio
ns
an
d t
he G
eo
rges
Ban
k o
ffsh
ore
sta
tio
n)
for
a g
iven
seaso
n a
nd
sex
are
in
dic
ate
d b
y b
old
valu
es
(read
ho
rizo
nta
lly
).
Sea
son
-rel
ated
dif
fere
nce
s fo
r a
giv
en s
tati
on
an
d s
ex a
re i
nd
icat
ed b
y t
he
pre
sen
ce o
r ab
sen
ce o
f su
per
scri
pts
fo
r th
e v
alu
es (
read
ver
tica
lly
); v
alu
es w
ith
the
sam
e or
no
super
scri
pt
are
not
signif
ican
tly
dif
fere
nt;
val
ues
wit
h d
iffe
ren
t su
per
scri
pts
are
sig
nif
ican
tly d
iffe
rent.
Sex
-rel
ated
diff
eren
ces f
or a
giv
en st
atio
n an
dse
aso
n a
re i
ndic
ated
by u
nder
lined
val
ues
(re
ad v
erti
call
y).
F
or
som
e st
atio
ns a
nd se
ason
s, no
dat
a (“
nd”)
wer
e av
aila
ble.
For
stat
istic
al si
gnifi
canc
e, P
< 0
.05.
)
Off
sho
re S
tati
on
Insh
ore S
tati
on
s
Sex
Sea
son
Geo
rg
es
Ba
nk
Merrim
ack
Riv
er
Ma
ssa
ch
use
tts
Ba
yC
ap
e C
od
Ba
yM
ud
Pa
tch
New
Yo
rk
Big
ht
Mal
e
Win
ter
6.4
0 ±
0.4
9 (
5)a
6.1
8 ±
0.3
8 (
8)a
5.8
7 ±
0.3
8 (
8)
3.2
9 ±
0.4
4 (
6)a
5.0
0 ±
0.4
1 (
7)a,
c5
.23
± 0
.27
(1
7)
Sp
rin
g5
.65
± 0
.17
(4
0)a
6.2
1 ±
0.4
1 (
7)a
3.1
7 ±
0.6
3 (
3)
4.9
8 ±
0.3
0 (
13
)b5
.67
± 0
.22
(2
5)a
5.4
8 ±
0.1
9 (
35
)a
Su
mm
er5
.54
± 0
.31
(1
2)a
5.0
2 ±
0.2
6 (
17
)bn
dn
d4
.01
± 0
.24
(2
1)b
nd
Fal
l3
.70
± 0
.27
(1
6)b
4.2
8 ±
0.1
8 (
35
)cn
dn
d4
.37
± 0
.20
(3
2)c
4.8
0 ±
0.2
9 (
15
)b
Fem
ale
Win
ter
5.1
3 ±
0.2
2 (
26
)a6
.12
± 0
.41
(7
)a6
.32
(1
)3
.72
± 0
.54
(4
)4
.19
± 0
.30
(1
3)
4.6
0 ±
0.2
6 (
17
)
Sp
rin
g4
.48
± 0
.16
(4
7)b
5.4
5 ±
0.4
1 (
7)a
3.4
2 ±
0.3
8 (
8)
4.6
8 ±
0.4
9 (
5)
4.8
6 ±
0.1
9 (
36
)a4
.86
± 0
.22
(2
5)a
Su
mm
er4
.74
± 0
.18
(3
6)
4.4
1 ±
0.2
7 (
16
)bn
dn
d4
.75
± 0
.25
(1
9)a
4.7
9 ±
0.4
9 (
5)
Fal
l4
.04
± 0
.35
(1
0)b
4.3
1 ±
0.1
5 (
52
)bn
dn
d4
.16
± 0
.15
(5
1)b
4.0
8 ±
0.2
8 (
15
)b
19Page
x

Tab
le 1
0.
Mea
n co
rpus
cula
r hem
oglo
bin
conc
entr
atio
ns (l
s mea
n g/
100
ml p
acke
d re
d bl
oodc
ells
± s
(N
)) in
adu
lt ye
llow
tail
flou
nder
traw
l-co
llect
ed fr
om si
x N
orth
wes
t A
tlant
iclo
catio
ns d
urin
g 19
78-8
5. (
Stat
ion-
rela
ted
diff
eren
ces
(i.e
., be
twee
n th
e fi
ve in
shor
e st
atio
ns a
nd th
e G
eorg
es B
ank
offs
hore
sta
tion)
for
a g
iven
sea
son
and
sex
are
indi
cate
dby
bol
d va
lues
(rea
d ho
rizo
ntal
ly).
Sea
son-
rela
ted
diff
eren
ces
for
a gi
ven
stat
iona
nd s
ex a
re in
dica
ted
by th
e pr
esen
ce o
r ab
senc
e of
sup
ersc
ript
s fo
r th
e va
lues
(rea
d ve
rtic
ally
); v
alue
s w
ith
the
sam
e or
no
supe
rscr
ipt a
re n
ot s
igni
fica
ntly
dif
fere
nt; v
alue
s w
ith
diff
eren
t sup
ersc
ript
s ar
e si
gnif
ican
tly
diff
eren
t. S
ex-r
elat
ed d
iffe
renc
es f
or a
giv
en s
tati
on a
nd s
easo
n ar
e in
dica
ted
by u
nder
line
d va
lues
(re
ad v
erti
call
y). F
or s
ome
stat
ions
and
sea
sons
, no
data
(“n
d”)
wer
e av
aila
ble.
For
stat
istic
al s
igni
fica
nce,
P <
0.0
5.)
Off
sho
re S
tati
on
Insh
ore S
tati
on
s
Sex
Sea
son
Geo
rg
es
Ba
nk
Merrim
ack
Riv
er
Ma
ssa
ch
use
tts
Ba
yC
ap
e C
od
Ba
yM
ud
Pa
tch
New
Yo
rk
Big
ht
Mal
e
Win
ter
21
.63
± 1
.45
(5
)a2
2.4
7 ±
1.1
4 (
8)a
20
.41
± 1
.15
(8
)1
6.0
7 ±
1.3
3 (
6)
18
.23
± 1
.22
(7
)1
7.2
0 ±
0.8
0 (
17
)
Sp
rin
g1
8.1
4 ±
0.5
2 (
39
)b1
6.6
6 ±
1.2
2 (
7)b
,c1
8.1
7 ±
1.8
8 (
3)
nd
17
.34
± 0
.66
(2
4)
17
.61
± 0
.60
(3
0)
Su
mm
er2
1.1
6 ±
0.9
3 (
12
)a,c
16
.73
± 0
.78
(1
7)b
nd
nd
19
.72
± 1
.09
(9
)n
d
Fal
l1
5.3
9 ±
0.8
1 (
16
)d1
8.9
1 ±
0.5
7 (
32
)cn
dn
d1
7.8
5 ±
0.6
0 (
30
)1
8.1
2 ±
0.8
7 (
15
)
Fem
ale
Win
ter
19
.14
± 0
.69
(2
3)
22
.73
± 1
.32
(6
)a2
4.9
1 (
1)
16
.57
± 1
.62
(4
)1
9.8
5 ±
0.9
0 (
13
)a1
9.2
7 ±
0.8
1 (
16
)a
Sp
rin
g1
7.7
5 ±
0.4
9 (
46
)1
6.0
6 ±
1.2
3 (
7)b
15
.45
± 1
.15
(8
)n
d1
8.2
2 ±
0.5
5 (
36
)1
7.0
2 ±
0.6
5 (
25
)b
Su
mm
er1
8.2
0 ±
0.5
4 (
36
)1
7.4
4 ±
0.8
1 (
16
)bn
dn
d1
9.0
4 ±
0.7
8 (
17
)1
4.5
8 ±
1.4
6 (
5)b
Fal
l1
7.7
3 ±
1.0
4 (
10
)1
8.3
5 ±
0.4
7 (
49
)bn
dn
d1
7.7
2 ±
0.4
7 (
47
)b1
7.6
3 ±
0.8
8 (
14
)
Page 20
x

Publishing in NOAA Technical Memorandum NMFS-NE
Manuscript Qualification
This series represents a secondary level of scientificpublishing in the National Marine Fisheries Service (NMFS).For all issues, the series employs thorough internal scientificreview, but not necessarily external scientific review. For mostissues, the series employs rigorous technical and copy editing.Manuscripts that may warrant a primary level of scientificpublishing should be initially submitted to one of NMFS'sprimary series (i.e., Fishery Bulletin, NOAA Technical ReportNMFS, or Marine Fisheries Review).
Identical, or fundamentally identical, manuscripts shouldnot be concurrently submitted to this and any other publicationseries. Manuscripts which have been rejected by any primaryseries strictly because of geographic or temporal limitationsmay be submitted to this series.
Manuscripts by Northeast Fisheries Science Center(NEFSC) authors will be published in this series upon approvalby the NEFSC's Deputy Science & Research Director. Manu-scripts by non-NEFSC authors may be published in this seriesif: 1) the manuscript serves the NEFSC's mission; 2) themanuscript meets the Deputy Science & Research Director'sapproval; and 3) the author arranges for the printing and bindingfunds to be transferred to the NEFSC's Research Communica-tions Unit account from another federal account. For allmanuscripts submitted by non-NEFSC authors and publishedin this series, the NEFSC will disavow all responsibility for themanuscripts' contents; authors must accept such responsibil-ity.
The ethics of scientific research and scientific publishingare a serious matter. All manuscripts submitted to this seriesare expected to adhere -- at a minimum -- to the ethical guidelinescontained in Chapter 1 ("Ethical Conduct in Authorship andPublication") of the CBE Style Manual, fifth edition (Chicago,IL: Council of Biology Editors). Copies of the manual areavailable at virtually all scientific libraries.
edition of the United States Government Printing Office StyleManual. That style manual is silent on many aspects of scientificmanuscripts. NEFSC publication and report series rely more on theCBE Style Manual, fifth edition.
For in-text citations, use the name-date system. A specialeffort should be made to ensure that the list of cited works containsall necessary bibliographic information. For abbreviating serialtitles in such lists, use the guidance of the International StandardsOrganization; such guidance is easily accessed through the variousCambridge Scientific Abstracts’ serials source lists (see http://www.public.iastate.edu/~CYBERSTACKS/JAS.htm). Personal com-munications must include date of contact and full name and mailingaddress of source.
For spelling of scientific and common names of fishes, mol-lusks, and decapod crustaceans from the United States and Canada,use Special Publications No. 20 (fishes), 26 (mollusks), and 17(decapod crustaceans) of the American Fisheries Society (Bethesda,MD). For spelling of scientific and common names of marinemammals, use Special Publication No. 4 of the Society for MarineMammalogy (Lawrence, KS). For spelling in general, use the mostrecent edition of Webster’s Third New International Dictionary ofthe English Language Unabridged (Springfield, MA: G.&C.Merriam).
Typing text, tables, and figure captions: Text, tables, andfigure captions should be converted to WordPerfect. In general,keep text simple (e.g., don't switch fonts and type sizes, don't usehard returns within paragraphs, don't indent except to beginparagraphs). Also, don't use an automatic footnoting function; allnotes should be indicated in the text by simple numerical super-scripts, and listed together in an "Endnotes" section prior to the"References Cited" section. Especially, don't use a graphicsfunction for embedding tables and figures in text.
Tables should be prepared with a table formatting function.Each figure should be supplied both on paper and on disk, unlessthere is no digital file of a given figure. Except under extraordinarycircumstances, color will not be used in illustrations.
Manuscript Preparation
Organization: Manuscripts must have an abstract, tableof contents, and -- if applicable -- lists of tables, figures, andacronyms. As much as possible, use traditional scientificmanuscript organization for sections: "Introduction," "StudyArea," "Methods & Materials," "Results," "Discussion" and/or "Conclusions," "Acknowledgments," and "References Cited."
Style: All NEFSC publication and report series areobligated to conform to the style contained in the most recent
Northeast Fisheries Science CenterOperations, Management & Information Services Staff
Research Communications UnitEditorial Office
Manuscript Submission
Authors must submit one paper copy of the double-spacedmanuscript, one disk copy, and original figures (if applicable).NEFSC authors must include a completely signed-off "NEFSCManuscript/Abstract/Webpage Review Form." Non-NEFSC au-thors who are not federal employees will be required to sign a"Release of Copyright" form.
Send all materials and address all correspondence to: Jon A.Gibson (Biological Sciences Editor), NMFS Northeast FisheriesScience Center, 166 Water Street, Woods Hole, MA 02543-1026.
National Marine Fisheries Service166 Water Street
Woods Hole, MA 02543-1026
Publications and Reportsof the
Northeast Fisheries Science Center
The mission of NOAA's National Marine Fisheries Service (NMFS) is "stewardship of living marine resources for the benefit of thenation through their science-based conservation and management and promotion of the health of their environment." As the researcharm of the NMFS's Northeast Region, the Northeast Fisheries Science Center (NEFSC) supports the NMFS mission by "planning,developing, and managing multidisciplinary programs of basic and applied research to: 1) better understand the living marine resources(including marine mammals) of the Northwest Atlantic, and the environmental quality essential for their existence and continuedproductivity; and 2) describe and provide to management, industry, and the public, options for the utilization and conservation of livingmarine resources and maintenance of environmental quality which are consistent with national and regional goals and needs, and withinternational commitments." Results of NEFSC research are largely reported in primary scientific media (e.g., anonymously-peer-reviewed scientific journals). However, to assist itself in providing data, information, and advice to its constituents, the NEFSCoccasionally releases its results in its own media. Currently, there are three such media:
NOAA Technical Memorandum NMFS-NE -- This series is issued irregularly. The series typically includes: data reports oflong-term field or lab studies of important species or habitats; synthesis reports for important species or habitats; annual reportsof overall assessment or monitoring programs; manuals describing program-wide surveying or experimental techniques; literaturesurveys of important species or habitat topics; proceedings and collected papers of scientific meetings; and indexed and/orannotated bibliographies. All issues receive internal scientific review and most issues receive technical and copy editing.
Northeast Fisheries Science Center Reference Document -- This series is issued irregularly. The series typically includes: datareports on field and lab studies; progress reports on experiments, monitoring, and assessments; background papers for, collectedabstracts of, and/or summary reports of scientific meetings; and simple bibliographies. Issues receive internal scientific review,but no technical or copy editing.
Resource Survey Report (formerly Fishermen's Report) -- This information report is a quick-turnaround report on the distributionand relative abundance of selected living marine resources as derived from each of the NEFSC's periodic research vessel surveysof the Northeast's continental shelf. There is no scientific review, nor any technical or copy editing, of this report.
OBTAINING A COPY: To obtain a copy of a NOAA Technical Memorandum NMFS-NE or a Northeast Fisheries Science CenterReference Document, or to subscribe to the Resource Survey Report, either contact the NEFSC Editorial Office (166 Water St.,Woods Hole, MA 02543-1026; 508-495-2228) or consult the NEFSC webpage on "Reports and Publications" (http://www.nefsc.noaa.gov/nefsc/publications/).
ANY USE OF TRADE OR BRAND NAMES IN ANY NEFSC PUBLICATION OR REPORT DOES NOT IMPLYENDORSEMENT.
Media Mail