Vapor Intrusion in Homes over Gasoline-Contaminated Ground Water in Stafford, New Jersey
10
Vapor Intrusion in Homes over Gasoline-Contaminated Ground Water in Stafford, New Jersey by Paul F. Sanders and Ian Hers Abstract The potential for chemical vapor intrusion from contaminated ground water to the interior of homes was investigated at a site with a leaking underground gasoline storage tank in Stafford Township, New Jersey. This location exhibited conditions favorable to vapor intrusion, with sand soil and a water table depth of 3.3 m. Concentrations of volatile organic chemicals in the ground water were as high as 82 mg/L for total benzene, toluene, ethylbenzene, and xylene (BTEX) and up to 590 mg/L for methyl-t-butyl ether (MTBE). Soil vapor samples at multiple depths were taken adjacent to several homes. Inside the homes, air samples were taken on the main floor, in the basement, and under the foundation slab. Despite high ground water concentrations, only one home had measurable impacts to indoor air quality attributable to some of the ground water con- taminants. In this house, the BTEX chemicals were not detected in the basement, indicating a lack of indoor air impacts from the ground water for these chemicals. Oxygen measurements suggested that degradation attenuated these chemicals as they dif- fused through the vadose zone. However, MTBE, 2,2,4-trimethylpentane (isooctane), and cyclohexane were found in the indoor air. The first two of these chemicals served as gasoline-specific tracers and indicated that vapor intrusion was occurring. Attenu- ation factors (the ratio of the indoor air concentration to a source soil vapor concentration) for the BTEX chemicals between the ground water and the indoor air were <1 3 10 ÿ5 , and for MTBE was 1.2 3 10 ÿ5 . Attenuation factors between the deep-soil vapor and the basement air were as follows: BTEX compounds, <1 3 10 ÿ5 ; MTBE, 2.2 3 10 ÿ5 ; 2,2,4-trimethylpentane, 3.6 3 10 ÿ4 ; and cyclohexane, 1.2 3 10 ÿ4 . Attenuation factors between the subslab vapor and the basement air were 7 to 8 3 10 ÿ3 . Introduction The U.S. EPA has recently released draft guidance for evaluating contaminant vapor intrusion into indoor air, which includes ground water screening levels for various volatile organic chemicals (VOCs) when the ground water flows under occupied structures (U.S. EPA 2002). Concen- trations of contaminants in ground water above the screen- ing levels indicate the need for further investigation in order to determine whether there is a concern with indoor air quality. However, the U.S. EPA warns against using the document for estimating the impacts of petroleum- contaminated ground water (and soil) to indoor air because the procedures used for estimating screening numbers do not include the effects of biodegradation of these chemi- cals. Biodegradation has been shown to be a predominant fate mechanism for aromatic petroleum hydrocarbon va- pors as they diffuse through the soil column (Ririe et al. 2002; Fitzpatrick and Fitzgerald 2002; Roggemans et al. 2001; Hers et al. 2000; Lahvis et al. 1999; DeVaull et al. 1997; Ostendorf and Kampbell 1991). By not including this mechanism, the U.S. EPA procedures yield screening levels that may be lower than necessary. In order to contribute to the information database per- taining to indoor impacts from petroleum-contaminated ground water, the vapor intrusion pathway was studied at a site with a leaking underground storage tank in Stafford Township, New Jersey. Attenuation factors (the ratio of the indoor air concentration to a source soil vapor concentration) were determined for benzene, toluene, ethylbenzene, and xylene (BTEX) and the gasoline-related chemicals methyl- t-butyl ether (MTBE), 2,2,4-trimethylpentane, and cyclohex- ane. Additionally, the study included the measurement of ancillary ground water and soil vapor parameters and the col- lection of meterological and building depressurization data. Description of Site The area under study was near a gasoline station in Stafford Township, New Jersey, where removal of a Copyright ª 2006 The Author(s) Journal compilation ª 2006 National Ground Water Association. Ground Water Monitoring & Remediation 26, no. 1/ Winter 2006/pages 63–72 63
Transcript of Vapor Intrusion in Homes over Gasoline-Contaminated Ground Water in Stafford, New Jersey

Vapor Intrusion in Homes overGasoline-Contaminated Ground Water
in Stafford, New Jerseyby Paul F. Sanders and Ian Hers
AbstractThe potential for chemical vapor intrusion from contaminated ground water to the interior of homes was investigated at
a site with a leaking underground gasoline storage tank in Stafford Township, New Jersey. This location exhibited conditionsfavorable to vapor intrusion, with sand soil and a water table depth of 3.3 m. Concentrations of volatile organic chemicals inthe ground water were as high as 82 mg/L for total benzene, toluene, ethylbenzene, and xylene (BTEX) and up to 590 mg/Lfor methyl-t-butyl ether (MTBE). Soil vapor samples at multiple depths were taken adjacent to several homes. Inside thehomes, air samples were taken on the main floor, in the basement, and under the foundation slab. Despite high ground waterconcentrations, only one home had measurable impacts to indoor air quality attributable to some of the ground water con-taminants. In this house, the BTEX chemicals were not detected in the basement, indicating a lack of indoor air impacts fromthe ground water for these chemicals. Oxygen measurements suggested that degradation attenuated these chemicals as they dif-fused through the vadose zone. However, MTBE, 2,2,4-trimethylpentane (isooctane), and cyclohexane were found in the indoorair. The first two of these chemicals served as gasoline-specific tracers and indicated that vapor intrusion was occurring. Attenu-ation factors (the ratio of the indoor air concentration to a source soil vapor concentration) for the BTEX chemicals between theground water and the indoor air were <1 3 10�5, and for MTBE was 1.2 3 10�5. Attenuation factors between the deep-soilvapor and the basement air were as follows: BTEX compounds, <13 10�5; MTBE, 2.2 3 10�5; 2,2,4-trimethylpentane, 3.6 3
10�4; and cyclohexane, 1.23 10�4. Attenuation factors between the subslab vapor and the basement air were 7 to 83 10�3.
IntroductionThe U.S. EPA has recently released draft guidance for
evaluating contaminant vapor intrusion into indoor air,which includes ground water screening levels for variousvolatile organic chemicals (VOCs) when the ground waterflows under occupied structures (U.S. EPA 2002). Concen-trations of contaminants in ground water above the screen-ing levels indicate the need for further investigation inorder to determine whether there is a concern with indoorair quality. However, the U.S. EPA warns against usingthe document for estimating the impacts of petroleum-contaminated ground water (and soil) to indoor air becausethe procedures used for estimating screening numbers donot include the effects of biodegradation of these chemi-cals. Biodegradation has been shown to be a predominantfate mechanism for aromatic petroleum hydrocarbon va-pors as they diffuse through the soil column (Ririe et al.2002; Fitzpatrick and Fitzgerald 2002; Roggemans et al.
2001; Hers et al. 2000; Lahvis et al. 1999; DeVaull et al.1997; Ostendorf and Kampbell 1991). By not includingthis mechanism, the U.S. EPA procedures yield screeninglevels that may be lower than necessary.
In order to contribute to the information database per-taining to indoor impacts from petroleum-contaminatedground water, the vapor intrusion pathway was studied ata site with a leaking underground storage tank in StaffordTownship, New Jersey. Attenuation factors (the ratio of theindoor air concentration to a source soil vapor concentration)were determined for benzene, toluene, ethylbenzene, andxylene (BTEX) and the gasoline-related chemicals methyl-t-butyl ether (MTBE), 2,2,4-trimethylpentane, and cyclohex-ane. Additionally, the study included the measurement ofancillary ground water and soil vapor parameters and the col-lection of meterological and building depressurization data.
Description of SiteThe area under study was near a gasoline station in
Stafford Township, New Jersey, where removal of aCopyright ª 2006 The Author(s)Journal compilationª 2006National GroundWater Association.
Ground Water Monitoring & Remediation 26, no. 1/ Winter 2006/pages 63–72 63
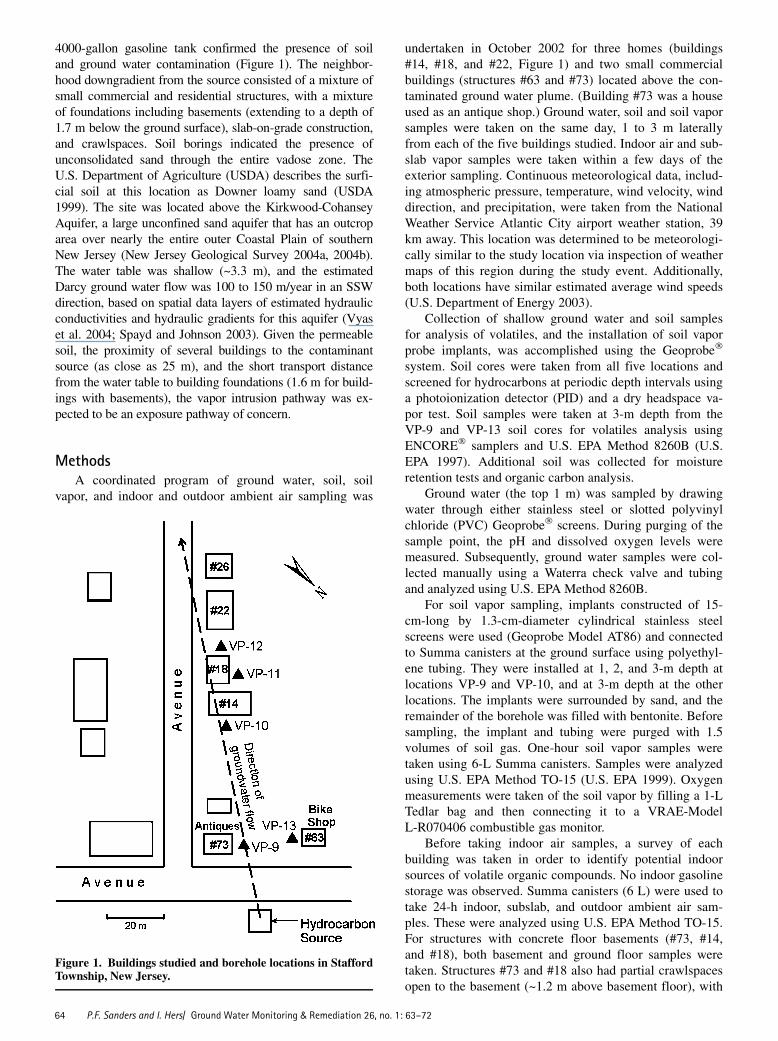
4000-gallon gasoline tank confirmed the presence of soiland ground water contamination (Figure 1). The neighbor-hood downgradient from the source consisted of a mixture ofsmall commercial and residential structures, with a mixtureof foundations including basements (extending to a depth of1.7 m below the ground surface), slab-on-grade construction,and crawlspaces. Soil borings indicated the presence ofunconsolidated sand through the entire vadose zone. TheU.S. Department of Agriculture (USDA) describes the surfi-cial soil at this location as Downer loamy sand (USDA1999). The site was located above the Kirkwood-CohanseyAquifer, a large unconfined sand aquifer that has an outcroparea over nearly the entire outer Coastal Plain of southernNew Jersey (New Jersey Geological Survey 2004a, 2004b).The water table was shallow (~3.3 m), and the estimatedDarcy ground water flow was 100 to 150 m/year in an SSWdirection, based on spatial data layers of estimated hydraulicconductivities and hydraulic gradients for this aquifer (Vyaset al. 2004; Spayd and Johnson 2003). Given the permeablesoil, the proximity of several buildings to the contaminantsource (as close as 25 m), and the short transport distancefrom the water table to building foundations (1.6 m for build-ings with basements), the vapor intrusion pathway was ex-pected to be an exposure pathway of concern.
MethodsA coordinated program of ground water, soil, soil
vapor, and indoor and outdoor ambient air sampling was
undertaken in October 2002 for three homes (buildings#14, #18, and #22, Figure 1) and two small commercialbuildings (structures #63 and #73) located above the con-taminated ground water plume. (Building #73 was a houseused as an antique shop.) Ground water, soil and soil vaporsamples were taken on the same day, 1 to 3 m laterallyfrom each of the five buildings studied. Indoor air and sub-slab vapor samples were taken within a few days of theexterior sampling. Continuous meteorological data, includ-ing atmospheric pressure, temperature, wind velocity, winddirection, and precipitation, were taken from the NationalWeather Service Atlantic City airport weather station, 39km away. This location was determined to be meteorologi-cally similar to the study location via inspection of weathermaps of this region during the study event. Additionally,both locations have similar estimated average wind speeds(U.S. Department of Energy 2003).
Collection of shallow ground water and soil samplesfor analysis of volatiles, and the installation of soil vaporprobe implants, was accomplished using the Geoprobe�
system. Soil cores were taken from all five locations andscreened for hydrocarbons at periodic depth intervals usinga photoionization detector (PID) and a dry headspace va-por test. Soil samples were taken at 3-m depth from theVP-9 and VP-13 soil cores for volatiles analysis usingENCORE� samplers and U.S. EPA Method 8260B (U.S.EPA 1997). Additional soil was collected for moistureretention tests and organic carbon analysis.
Ground water (the top 1 m) was sampled by drawingwater through either stainless steel or slotted polyvinylchloride (PVC) Geoprobe� screens. During purging of thesample point, the pH and dissolved oxygen levels weremeasured. Subsequently, ground water samples were col-lected manually using a Waterra check valve and tubingand analyzed using U.S. EPA Method 8260B.
For soil vapor sampling, implants constructed of 15-cm-long by 1.3-cm-diameter cylindrical stainless steelscreens were used (Geoprobe Model AT86) and connectedto Summa canisters at the ground surface using polyethyl-ene tubing. They were installed at 1, 2, and 3-m depth atlocations VP-9 and VP-10, and at 3-m depth at the otherlocations. The implants were surrounded by sand, and theremainder of the borehole was filled with bentonite. Beforesampling, the implant and tubing were purged with 1.5volumes of soil gas. One-hour soil vapor samples weretaken using 6-L Summa canisters. Samples were analyzedusing U.S. EPA Method TO-15 (U.S. EPA 1999). Oxygenmeasurements were taken of the soil vapor by filling a 1-LTedlar bag and then connecting it to a VRAE-ModelL-R070406 combustible gas monitor.
Before taking indoor air samples, a survey of eachbuilding was taken in order to identify potential indoorsources of volatile organic compounds. No indoor gasolinestorage was observed. Summa canisters (6 L) were used totake 24-h indoor, subslab, and outdoor ambient air sam-ples. These were analyzed using U.S. EPA Method TO-15.For structures with concrete floor basements (#73, #14,and #18), both basement and ground floor samples weretaken. Structures #73 and #18 also had partial crawlspacesopen to the basement (~1.2 m above basement floor), with
Figure 1. Buildings studied and borehole locations in StaffordTownship, New Jersey.
P.F. Sanders and I. Hers/ Ground Water Monitoring & Remediation 26, no. 1: 63–7264
exposed soil. Building #22 had an unlined (earthen) crawl-space under the entire structure, and a sample was taken atthat location and on the main floor. Building #63 had slab-on-grade construction; only a ground floor sample wastaken. For all buildings except #22, subslab vapor sampleswere taken simultaneously with the indoor air samples. A1-cm hole was drilled through the foundation floor of thebuilding in a central location. Slab thicknesses were ~10cm. The end of a length of Teflon�-lined tubing (~1-cmouter diameter) was wrapped with Teflon tape and tightlyinserted into the drilled hole. The tubing was then con-nected to the Summa canisters. The low sampling flow rate(4.2 mL/min) and the dry sand observed under the slabresulted in minimal resistance to subslab vapor sampling.
For selected structures (#73, #22, and #14), differentialpressure measurements between the outdoor and the indoorair were taken during sampling, using an Omniguard IIIdifferential pressure recorder. For buildings #73 and #14,the pressure difference between the basement and the out-door air was measured. For building #14, the subslab tobasement pressure differential was also measured. Forbuilding #22, the pressure differential between the crawl-space and the indoor air was measured. To connect to theexterior, 0.6-cm polyethylene tubing was run througha small crack in an almost closed window. The exteriorend of the tubing was shielded from wind by placing it inthe interior of a large PVC pipe (30 cm long by 10-cmdiameter).
Outdoor ambient air samples (24 h) were taken using6-L Summa canisters adjacent to buildings #73 and #22.These samples were analyzed using U.S. EPA MethodTO-15.
Results and DiscussionThe Stafford Township site, although small, was
selected for study because it exhibited several features thatwould promote indoor air impacts from contaminatedground water. These features included sand soil throughthe entire soil column, a shallow water table, basements inseveral of the buildings that reduced the transport distancebetween the water table and the building foundation to~1.6 m, and high concentrations of gasoline constituents inground water. Five homes were subjected to both indoorair sampling and exterior sampling of soil vapor andground water in order to elucidate concentration patternsand attenuation factors for the vapor intrusion pathway.
The study was conducted after 2 months of near-normalrainfall that was preceded by 2 months where rainfall was40% of normal. No rainfall occurred at least 2 d prior tosampling events. Thus, water table elevations may havebeen slightly lower than normal, while soil moisture levelswere expected to be nearly normal for the time of yearsampled. All buildings were occupied during the sampling,so doors were periodically opened. Nighttime temperatureswere between �1�C and 14�C, and daytime temperatureswere typically 7�C to 16�C. These temperatures were~3�C cooler than normal. Due to the cool weather, win-dows were largely, but not entirely, closed, and heating
systems (natural gas–fueled forced air or oil-fueled hotwater radiant) were under moderate use. The average dailywind speed during indoor air sampling at the Atlantic Cityweather station ranged from 2 to 6 m/s, and barometricpressure variations were moderate (1010 to 1030 mbar).Except for somewhat breezy and slightly cooler than nor-mal weather, the environmental conditions important forvapor intrusion sampling were judged to be near normalfor that time of the year.
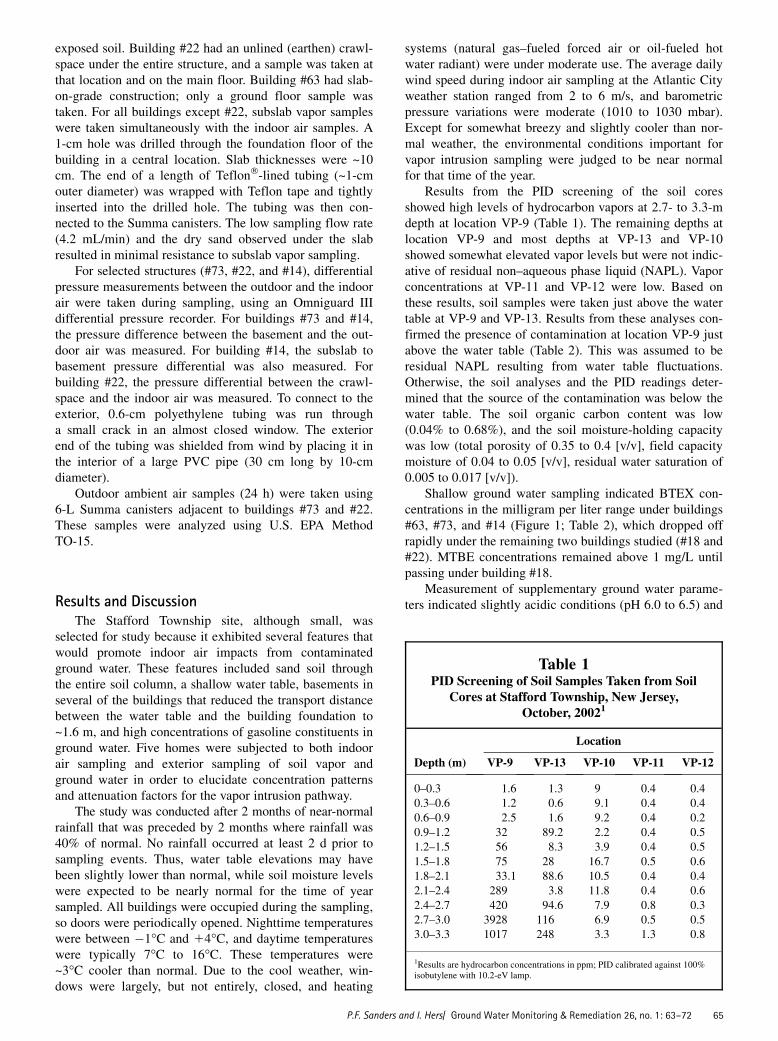
Results from the PID screening of the soil coresshowed high levels of hydrocarbon vapors at 2.7- to 3.3-mdepth at location VP-9 (Table 1). The remaining depths atlocation VP-9 and most depths at VP-13 and VP-10showed somewhat elevated vapor levels but were not indic-ative of residual non–aqueous phase liquid (NAPL). Vaporconcentrations at VP-11 and VP-12 were low. Based onthese results, soil samples were taken just above the watertable at VP-9 and VP-13. Results from these analyses con-firmed the presence of contamination at location VP-9 justabove the water table (Table 2). This was assumed to beresidual NAPL resulting from water table fluctuations.Otherwise, the soil analyses and the PID readings deter-mined that the source of the contamination was below thewater table. The soil organic carbon content was low(0.04% to 0.68%), and the soil moisture-holding capacitywas low (total porosity of 0.35 to 0.4 [v/v], field capacitymoisture of 0.04 to 0.05 [v/v], residual water saturation of0.005 to 0.017 [v/v]).
Shallow ground water sampling indicated BTEX con-centrations in the milligram per liter range under buildings#63, #73, and #14 (Figure 1; Table 2), which dropped offrapidly under the remaining two buildings studied (#18 and#22). MTBE concentrations remained above 1 mg/L untilpassing under building #18.
Measurement of supplementary ground water parame-ters indicated slightly acidic conditions (pH 6.0 to 6.5) and
Table 1PID Screening of Soil Samples Taken from Soil
Cores at Stafford Township, New Jersey,October, 20021
Depth (m)
Location
VP-9 VP-13 VP-10 VP-11 VP-12
0–0.3 1.6 1.3 9 0.4 0.40.3–0.6 1.2 0.6 9.1 0.4 0.40.6–0.9 2.5 1.6 9.2 0.4 0.20.9–1.2 32 89.2 2.2 0.4 0.51.2–1.5 56 8.3 3.9 0.4 0.51.5–1.8 75 28 16.7 0.5 0.61.8–2.1 33.1 88.6 10.5 0.4 0.42.1–2.4 289 3.8 11.8 0.4 0.62.4–2.7 420 94.6 7.9 0.8 0.32.7–3.0 3928 116 6.9 0.5 0.53.0–3.3 1017 248 3.3 1.3 0.8
1Results are hydrocarbon concentrations in ppm; PID calibrated against 100%isobutylene with 10.2-eV lamp.
P.F. Sanders and I. Hers/ Ground Water Monitoring & Remediation 26, no. 1: 63–72 65

Table
2ConcentrationsofSelectedPetroleum-R
elatedVOCsin
Air,Water,andSoilatFiveProperties
Impacted
byGasoline-Contaminated
GroundWaterin
Stafford
Township,New
Jersey,October,20021
Soil
(3-m
depth)
(lg/kg)
ShallowGround
Water
(3.3-to
4.3-m
depth)
(lg/L)
Deep-Soil
Vapor
(3-m
depth)
(lg/m
3)
Middepth-Soil
Vapor
(2-m
depth)
(lg/m
3)
Shallow-Soil
Vapor
(1-m
depth)
(lg/m
3)
SubslabVapor
(2-m
depth)
(lg/m
3)
Basement
Air(lg/m
3)
Ground
FloorAir
(lg/m
3)
Outdoor
Air
(lg/m
3)
Building#73and
locationVP-9
Benzene
6400
12,000
660,000
250,000
<1600
<1000
<8
<2
<1.6
Toluene
150,000
43,000
1,100,000
580,000
1000
<1000
<10
46
<1.9
Ethylbenzene
56,000
3500
<150,000
<67,000
<2000
<1000
<11
11
<2.2
Xylenes
(total)
360,000
24,000
<150,000
<67,000
<2000
<1000
<24
57
<4.5
MTBE
18,000
590,000
5,900,000
1,700,000
<2000
18,000
130
52
<1.8
2,2,4-Trimethylpentane
NM
NM
1,900,000
1,000,000
53,000
96,000
700
160
<2.4
Cyclohexane
39,000
<25,000
1,100,000
530,000
10,000
15,000
130
26
<1.8
Oxygen
NM
NM
<12
1.3
29.3
2NM
NM
NM
NM
Building#63and
locationVP-13
Benzene
<3.6
7500
390,000
NM
NM
<30
NM
3<2
NM
Toluene
<18
14,000
540,000
NM
NM
<40
NM
33.2
NM
Ethylbenzene
<14
4200
<67,000
NM
NM
<40
NM
3<2
NM
Xylenes
(total)
<18
20,000
<160,000
NM
NM
<100
NM
3<5
NM
MTBE
63
190,000
444,700
NM
NM
2.6
NM
32.8
NM
2,2,4-Trimethylpentane
NM
NM
2,400,000
NM
NM
<50
NM
3<2
NM
Cyclohexane
<18
<5000
710,000
NM
NM
<40
NM
3<2
NM
Oxygen
NM
0.634
0.4
2NM
NM
NM
NM
3NM
NM
Building#14and
locationVP-10
Benzene
NM
6000
<2100
69
<8
<3
<2
<2
NM
Toluene
NM
<12,000
3300
890
43
36
13
9.3
NM
Ethylbenzene
NM
2200
<2800
270
14
15
5.4
3NM
Xylenes
(total)
NM
3300
<5700
1200
72
75
27
17
NM
MTBE
NM
310,000
56,000
320
18
<4
<2
<2
NM
2,2,4-Trimethylpentane
NM
NM
1700
720
77
<5
<2
<2
NM
Cyclohexane
NM
<12,000
<2300
160
26
<4
<2
<2
NM
Oxygen
NM
0.434
NM
NM
NM
NM
NM
NM
NM
Building#18andlocations
VP-11andVP-12
Benzene
NM
100;27
9.2;<9.2
NM
NM
2.1
3.9
3NM
Toluene
NM
<50;<25
13;12
NM
NM
38
34
21
NM
Ethylbenzene
NM
<40;<20
<12;<12
NM
NM
18
5.8
4.1
NM
Xylenes
(total)
NM
<50;<25
<26;<37
NM
NM
94
25
18
NM
MTBE
NM
1300;370
<10;<10
NM
NM
5.2
9.6
5.2
NM
2,2,4-Trimethylpentane
NM
NM
31;46
NM
NM
5.3
11
4.5
NM
Cyclohexane
NM
<50;<25
<9.9;<9.9
NM
NM
<2
<2
<2
NM
Oxygen
NM
2.3,2.0
420.3
2NM
NM
NM
NM
NM
NM
Building#22and
locationVP-12
Benzene
NM
27
<9.2
NM
NM
<25
NM
3<2
<1.6
Toluene
NM
<25
12
NM
NM
5.0
5NM
314
3.9
Ethylbenzene
NM
<20
<12
NM
NM
<25
NM
3<2
<2.2
Xylenes
(total)
NM
<25
<37
NM
NM
9.2
5NM
311
4.5
MTBE
NM
370
<10
NM
NM
2.3
5NM
3<2
<3.7
2,2,4-Trimethylpentane
NM
NM
46
NM
NM
<25
NM
3<2
<2.4
Cyclohexane
NM
<25
<9.9
NM
NM
<25
NM
3<2
<1.8
Oxygen
NM
2.0
419.8
2NM
NM
NM
NM
3NM
NM
NM
¼notmeasured.
1Resultsshow
nas
‘‘<XX’’werenondetects;‘‘XX’’representsthedetectionlimitforthatsample.
2Percent.
3Buildingdoes
nothaveabasem
ent.
4mg/L.
5Crawlspace.
P.F. Sanders and I. Hers/ Ground Water Monitoring & Remediation 26, no. 1: 63–7266
a low oxygen environment (dissolved oxygen levels of 0.4to 2.3 mg/L, Table 2), with the lower oxygen concen-trations located nearer to the contamination source.
Outdoor air samples indicated undetectable levels ofbenzene, ethylbenzene, MTBE, 2,2,4-trimethylpentane,and cyclohexane (Table 2). Detection limits for benzeneand ethylbenzene (~2 lg/m3) were at or above commonlyobserved outdoor concentrations recently reported by Sextonet al. (2004). Approximately 4 lg/m3 of toluene and xylenewere detected outside of building #22 but not at building#73. Sexton et al. reported median outdoor concentrationsof these two chemicals of 2 to 3 lg/m3. Elevated outdoorconcentrations of these chemicals were not expectedbecause Stafford Township is bounded on the east by theAtlantic Ocean and on the west by the Pine Barrens, a 30-mile-wide region of undeveloped land. Also, the gas stationresponsible for the ground water contamination had ceasedoperations prior to this study, so it did not represent a localabove ground source of gasoline vapors.
The Use of Gasoline Tracers2,2,4-Trimethylpentane (isooctane) and MTBE are
chemicals added to gasoline to achieve desirable perfor-mance and environmental characteristics and do not haveother common sources (Hazardous Substances Databank2004). This contrasts with the BTEX chemicals, which arecommonly reported in indoor air and may have varioussources. The appearance of gasoline-specific chemicalsindoors may therefore serve as an indication that the indoorair has been impacted by gasoline. A decreasing sequenceof concentrations between the ground water and the indoorair for these chemicals may yield further evidence that thesource of indoor air contamination is gasoline-contaminatedground water, as opposed to gasoline vapors from othersources (e.g., outdoors or an attached garage). For this rea-son, 2,2,4-trimethylpentane results were added to thosenormally investigated. Results for cyclohexane are alsoreported in this study. Although perhaps less useful asa tracer chemical due to other potential indoor sources, itwas included because it was another gasoline constituentobserved at significant levels in this study.
Concentration Patterns—Building #73Concentrations of benzene, toluene, xylene, and
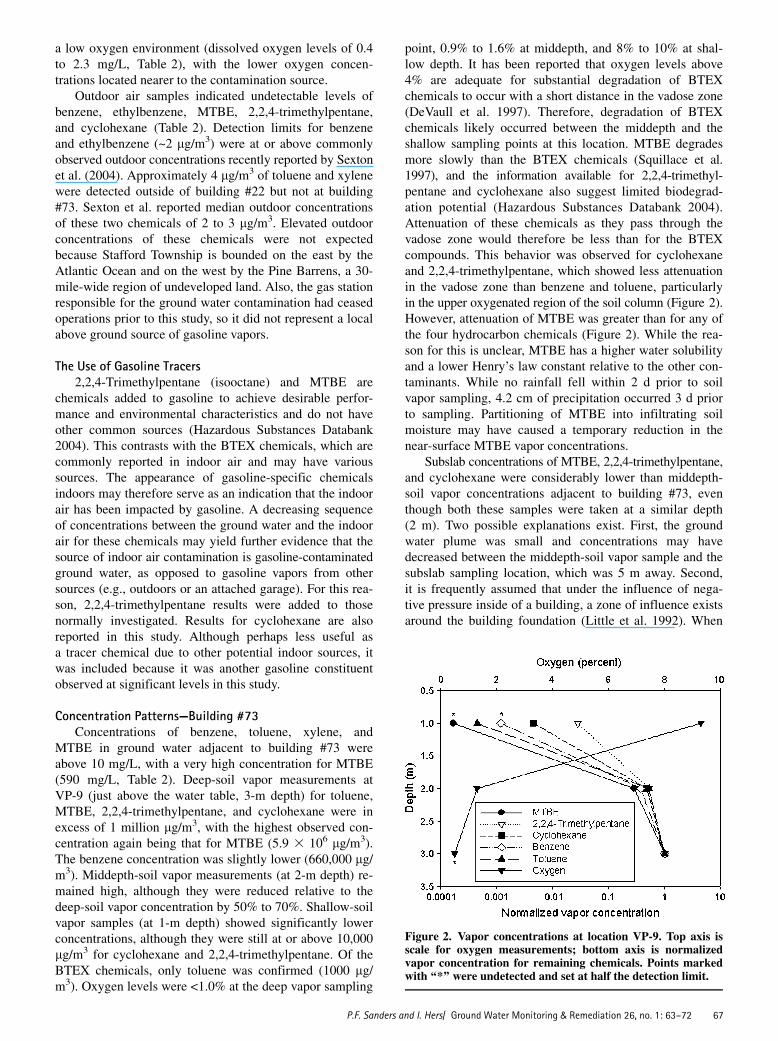
MTBE in ground water adjacent to building #73 wereabove 10 mg/L, with a very high concentration for MTBE(590 mg/L, Table 2). Deep-soil vapor measurements atVP-9 (just above the water table, 3-m depth) for toluene,MTBE, 2,2,4-trimethylpentane, and cyclohexane were inexcess of 1 million lg/m3, with the highest observed con-centration again being that for MTBE (5.9 3 106 lg/m3).The benzene concentration was slightly lower (660,000 lg/m3). Middepth-soil vapor measurements (at 2-m depth) re-mained high, although they were reduced relative to thedeep-soil vapor concentration by 50% to 70%. Shallow-soilvapor samples (at 1-m depth) showed significantly lowerconcentrations, although they were still at or above 10,000lg/m3 for cyclohexane and 2,2,4-trimethylpentane. Of theBTEX chemicals, only toluene was confirmed (1000 lg/m3). Oxygen levels were <1.0% at the deep vapor sampling
point, 0.9% to 1.6% at middepth, and 8% to 10% at shal-low depth. It has been reported that oxygen levels above4% are adequate for substantial degradation of BTEXchemicals to occur with a short distance in the vadose zone(DeVaull et al. 1997). Therefore, degradation of BTEXchemicals likely occurred between the middepth and theshallow sampling points at this location. MTBE degradesmore slowly than the BTEX chemicals (Squillace et al.1997), and the information available for 2,2,4-trimethyl-pentane and cyclohexane also suggest limited biodegrad-ation potential (Hazardous Substances Databank 2004).Attenuation of these chemicals as they pass through thevadose zone would therefore be less than for the BTEXcompounds. This behavior was observed for cyclohexaneand 2,2,4-trimethylpentane, which showed less attenuationin the vadose zone than benzene and toluene, particularlyin the upper oxygenated region of the soil column (Figure 2).However, attenuation of MTBE was greater than for any ofthe four hydrocarbon chemicals (Figure 2). While the rea-son for this is unclear, MTBE has a higher water solubilityand a lower Henry’s law constant relative to the other con-taminants. While no rainfall fell within 2 d prior to soilvapor sampling, 4.2 cm of precipitation occurred 3 d priorto sampling. Partitioning of MTBE into infiltrating soilmoisture may have caused a temporary reduction in thenear-surface MTBE vapor concentrations.
Subslab concentrations of MTBE, 2,2,4-trimethylpentane,and cyclohexane were considerably lower than middepth-soil vapor concentrations adjacent to building #73, eventhough both these samples were taken at a similar depth(2 m). Two possible explanations exist. First, the groundwater plume was small and concentrations may havedecreased between the middepth-soil vapor sample and thesubslab sampling location, which was 5 m away. Second,it is frequently assumed that under the influence of nega-tive pressure inside of a building, a zone of influence existsaround the building foundation (Little et al. 1992). When
Figure 2. Vapor concentrations at location VP-9. Top axis isscale for oxygen measurements; bottom axis is normalizedvapor concentration for remaining chemicals. Points markedwith ‘‘*’’ were undetected and set at half the detection limit.
P.F. Sanders and I. Hers/ Ground Water Monitoring & Remediation 26, no. 1: 63–72 67

chemicals enter this zone, they are rapidly swept throughthe building foundation via soil-gas convection. Pressuremeasurements at this building indicated a slight depressur-ization relative to the exterior (�0.6 Pa), so convectionmay have been occurring. The dilution caused by convec-tion could reduce subslab soil-gas concentrations relativeto those measured adjacent to the building at a similardepth. BTEX chemicals were not detected in the subslabvapor, even though benzene and toluene were measured atsubstantial levels in the middepth-soil vapor sample. Deg-radation of these chemicals may have been occurring in thesubslab soil zone, due to access of this area to oxygen fromopenings in the slab. Alternatively, the building’s zone ofinfluence may promote oxygen convection from the exte-rior soil surface to the subslab.
Measurable levels of MTBE, 2,2,4-trimethylpentane, andcyclohexane were found both in the basement air and atreduced levels in the ground floor in building #73. Theappearance of the first two chemicals indoors suggested thatthe indoor air was impacted by gasoline vapors. Thesequence of decreasing concentrations of these chemicals inthe ground water, deep-soil vapor, middepth-soil vapor, sub-slab vapor, and indoor air, indicates that the likely sourceof these indoor contaminants was the ground water. Thedecrease in concentrations observed between the basementand the first floor is also compatible with a subsurface sourcesince the first floor is further removed from the source andits air exchange would combine a portion of the basement airwith additional outside air. Further evidence of a subsurfacegasoline source was the presence of elevated levels of degra-dation-resistant MTBE, 2,2,4-trimethylpentane, and cyclo-hexane in the basement relative to the degradable BTEXcompounds. An indoor gasoline source would have alsoyielded significant BTEX concentrations in the basement.
While BTEX concentrations in the basement were low,significant levels of toluene, ethylbenzene, and xylenewere observed in the ground floor (Table 2). This buildingfunctioned as an antique shop, so contribution of chemicalsfrom refinished furniture and related chemical storage wasa distinct possibility. Indoor background concentrations ofBTEX chemicals have been reported to be as high as thosemeasured in building #73 (U.S. EPA 1987; Clayton et al.1999; Edwards et al. 2001; Sexton et al. 2004). Resultsfrom the recent study by Sexton et al. (288 indoor air sam-ples in the Minneapolis/St. Paul metropolitan area) give thefollowing 10th to 90th percentile concentration ranges forthe BTEX chemicals, in micrograms per cubic meter: ben-zene, 0.8 to 15.3; toluene, 2.4 to 53.8; ethylbenzene, 0.5 to8.9; xylene, 2.2 to 48. The ethylbenzene and xylene con-centrations in building #73 slightly exceed these ranges.However, they are below 90th percentile concentrations re-ported in the total exposure assessment methodology study(U.S. EPA 1987), which ranged up to 27 and 100 lg/m3 forethylbenzene and xylene, respectively (786 indoor air sam-ples in New Jersey and California).
Consideration of available indoor data on the othergasoline-related contaminants was also useful. Whileindoor levels of 2,2,4-trimethylpentane could not belocated in the literature, some data are available for the re-maining two contaminants. Edwards et al. (2001) reported
that indoor cyclohexane concentrations measured in Helsinki,Finland (183 samples), were below the detection limit 80%of the time (<2 lg/m3) and the 90th percentile concentra-tion was 2.73 lg/m3. In a survey of existing data, Brownet al. (1994) reported mean indoor air cyclohexane concen-trations in various buildings of between 1 and 5 lg/m3. Thebasement and indoor air concentrations measured in build-ing #73 were considerably higher than these values (130and 26 lg/m3, respectively). Information on indoor levelsof MTBE (100 homes in Elizabeth, New Jersey) suggestsa median value of 6 lg/m3 (Weisel 2002). This concentra-tion is considerably lower than the levels measured inbuilding #73 (52 to 130 lg/m3). The indoor concentrationsof cyclohexane, MTBE, and 2,2,4-trimethylpentane are suf-ficiently elevated in this building to suggest a subsurfacesource.
Concentration Patterns—Other BuildingsThe ground water underlying buildings #63 and #14
also contained milligrams per liter concentrations of gaso-line constituents, although lower than those for building#73 (Table 2). The deep-soil vapor adjacent to building#63 also exhibited high concentrations of contaminants;however, subslab and indoor air concentrations were low.Degradation or attenuation of chemicals during transportwas apparently adequate to eliminate the potential for indoorair impacts. This building consisted of a slab-on-grade con-struction, so the transport distance in this case was 3.3 m,twice the distance for building #73. The deep-soil vaporadjacent to building #14 exhibited >1000 lg/m3 for toluene,MTBE, and 2,2,4-trimethylpentane, and in the middepth-soilvapor sample, several hundred micrograms per cubic meterwere measured for MTBE, 2,2,4-trimethylpentane, cyclo-hexane, and all BTEX chemicals except benzene. However,relatively low concentrations in the shallow-soil vapor, sub-slab, basement, and indoor samples were observed. Thisbuilding exhibited an average depressurization of �4.1 Pa,which, as explained previously, could result in loweredsubslab concentrations relative to middepth-soil vapor con-centrations. MTBE, 2,2,4-trimethylpentane, and cyclohexanewere not detected indoors, suggesting a lack of gasoline im-pacts. The BTEX chemical concentrations, although low, didshow a decreasing trend between the subslab vapor, base-ment air, and ground floor air concentrations. However, thedifferences between the subslab and the basement con-centrations were not large enough to suggest vapor in-trusion because a minimum 10-fold decrease would beexpected (U.S. EPA 2002). Furthermore, indoor concen-trations were not above levels commonly observed due toother sources.
Buildings #18 and #22 were over relatively low con-taminant concentrations in the ground water. Measurablelevels of many of the studied chemicals were foundindoors and in the subslab samples (Table 2). However, theobserved indoor concentrations were not above commonlyobserved levels, and some of the contaminants were mea-sured at higher levels indoors than in the subslab vapor.This suggests that the sources of these chemicals were notfrom the subsurface. All buildings in this study stored somecleaners or solvents indoors, which could have been sources
P.F. Sanders and I. Hers/ Ground Water Monitoring & Remediation 26, no. 1: 63–7268

of some of these chemicals. Other factors potentially con-tributing to VOC levels in building #18 were recent paint-ing and heavy smoking by an occupant of the building.
Contaminant Attenuation near the Water TableWhen calculating ground water screening levels for the
vapor intrusion pathway, the contaminant concentration insoil vapor at the base of the capillary fringe is estimatedfrom the ground water concentration using the Henry’s lawconstant and assuming equilibrium partitioning (U.S. EPA2003). Measured contaminant concentrations in deep-soilvapor should always be less than the estimated concentra-tion as a result of contaminant attenuation through thecapillary transition zone and possible nonequilibrium con-ditions for partitioning. This was confirmed in the presentstudy, where measured concentrations in deep-soil vaporwere frequently <1% of the concentrations predicted at thebase of the capillary fringe (Table 3). At well locationsthat exhibited evidence of residual NAPL near the watertable (VP-9 and VP-13), the measured concentrations insoil vapor were often between 10% and 50% of predictedconcentrations. Higher percentages would be expected atthese locations since residual NAPL was likely presentabove the water table. In addition, Raoult’s law may bea more applicable model than Henry’s law for prediction ofvapor concentrations where NAPL is present.
Attenuation FactorsThe attenuation factor may be defined as the ratio of the
indoor air concentration to a source soil-gas concentration
at a specified location (Johnson and Ettinger 1991). Whenthe source location is the ground water, the ground waterconcentration may be converted to an equivalent equilibriumsoil-gas concentration using the Henry’s law constant. Whenpredicting indoor air concentrations from measured groundwater concentrations in the absence of site-specific data, theU.S. EPA recommends using a generic attenuation factor of1 3 10�3 to determine whether a particular location requiresfurther investigation (U.S. EPA 2002). The generic factorwas developed by studying the distribution of experimen-tally determined attenuation factors from past site inves-tigations and selecting a value that was protective for 95% ofthe residences studied. The factor is also compatible withtheoretical predictions from the Johnson and Ettinger model(U.S. EPA 2003; Johnson and Ettinger 1991), when runusing conservative assumptions (sand soil, shallow depth towater table, and no degradation). More typical attenuationfactors between the indoor air and the ground water havebeen observed to be in the range of 10�3 to 10�6 for non-degrading chlorinated compounds and 10�4 to 10�7 fordegradable BTEX compounds (U.S. EPA 2002; Hers et al.2003). The Johnson and Ettinger model also predicts lowerattenuation factors when less-conservative assumptions areused (Johnson et al. 1999).
One of the five buildings studied (building #73)yielded sampling results for MTBE, cyclohexane, and2,2,4-trimethylpentane that clearly indicated that therewere indoor air impacts from gasoline-contaminatedground water. For this location, attenuation factors werecalculated between various sampling points and the indoor
Table 3Contaminant Attenuation near the Water Table
Location
Concentration inShallow Ground Water
(3.3- to 4.3-m depth) (lg/L)
PredictedConcentration inVapor at Base of
Capillary Fringe (lg/m3)
MeasuredConcentration inDeep-Soil Vapor at3-m Depth (lg/m3)
Concentration Ratio,Deep-Soil Vapor/Baseof Capillary Fringe
VP-9 Benzene 12,000 1,920,000 660,000 0.34Toluene 43,000 7,826,000 1,100,000 0.14Ethylbenzene 3500 724,500 <150,000 <0.21Xylenes (total) 24,000 4,200,000 <150,000 <0.04MTBE 590,000 11,033,000 5,900,000 0.53
VP-13 Benzene 7500 1,200,000 390,000 0.32Toluene 14,000 2,548,000 540,000 0.21Ethylbenzene 4200 869,400 <67,000 <0.08Xylenes (total) 20,000 3,500,000 <160,000 <0.04MTBE 190,000 3,553,000 444,700 0.12
VP-10 Benzene 6000 960,000 <2100 <0.002Ethylbenzene 2200 455,400 <2800 <0.006Xylenes (total) 3300 577,500 <5700 <0.01MTBE 310,000 5,797,000 56,000 0.01
VP-11 Benzene 100 16,000 9.2 <0.0006MTBE 1300 24,310 <10 <0.0004
VP-12 Benzene 27 4320 <9.2 <0.002MTBE 370 6919 <10 <0.001
Note: Henry’s law constants (17�C)—benzene, 0.160; toluene, 0.182; ethylbenzene, 0.207; xylenes, 0.175 (average); MTBE, 0.0187.
P.F. Sanders and I. Hers/ Ground Water Monitoring & Remediation 26, no. 1: 63–72 69
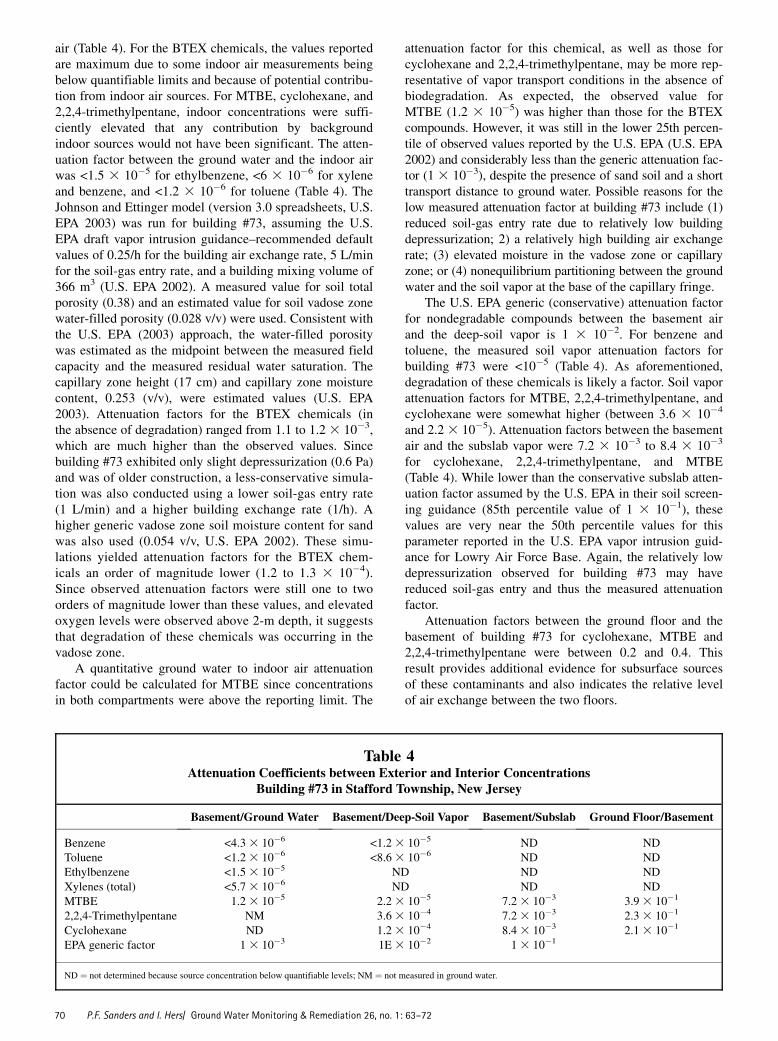
air (Table 4). For the BTEX chemicals, the values reportedare maximum due to some indoor air measurements beingbelow quantifiable limits and because of potential contribu-tion from indoor air sources. For MTBE, cyclohexane, and2,2,4-trimethylpentane, indoor concentrations were suffi-ciently elevated that any contribution by backgroundindoor sources would not have been significant. The atten-uation factor between the ground water and the indoor airwas <1.5 3 10�5 for ethylbenzene, <6 3 10�6 for xyleneand benzene, and <1.2 3 10�6 for toluene (Table 4). TheJohnson and Ettinger model (version 3.0 spreadsheets, U.S.EPA 2003) was run for building #73, assuming the U.S.EPA draft vapor intrusion guidance–recommended defaultvalues of 0.25/h for the building air exchange rate, 5 L/minfor the soil-gas entry rate, and a building mixing volume of366 m3 (U.S. EPA 2002). A measured value for soil totalporosity (0.38) and an estimated value for soil vadose zonewater-filled porosity (0.028 v/v) were used. Consistent withthe U.S. EPA (2003) approach, the water-filled porositywas estimated as the midpoint between the measured fieldcapacity and the measured residual water saturation. Thecapillary zone height (17 cm) and capillary zone moisturecontent, 0.253 (v/v), were estimated values (U.S. EPA2003). Attenuation factors for the BTEX chemicals (inthe absence of degradation) ranged from 1.1 to 1.2 3 10�3,which are much higher than the observed values. Sincebuilding #73 exhibited only slight depressurization (0.6 Pa)and was of older construction, a less-conservative simula-tion was also conducted using a lower soil-gas entry rate(1 L/min) and a higher building exchange rate (1/h). Ahigher generic vadose zone soil moisture content for sandwas also used (0.054 v/v, U.S. EPA 2002). These simu-lations yielded attenuation factors for the BTEX chem-icals an order of magnitude lower (1.2 to 1.3 3 10�4).Since observed attenuation factors were still one to twoorders of magnitude lower than these values, and elevatedoxygen levels were observed above 2-m depth, it suggeststhat degradation of these chemicals was occurring in thevadose zone.
A quantitative ground water to indoor air attenuationfactor could be calculated for MTBE since concentrationsin both compartments were above the reporting limit. The
attenuation factor for this chemical, as well as those forcyclohexane and 2,2,4-trimethylpentane, may be more rep-resentative of vapor transport conditions in the absence ofbiodegradation. As expected, the observed value forMTBE (1.2 3 10�5) was higher than those for the BTEXcompounds. However, it was still in the lower 25th percen-tile of observed values reported by the U.S. EPA (U.S. EPA2002) and considerably less than the generic attenuation fac-tor (1 3 10�3), despite the presence of sand soil and a shorttransport distance to ground water. Possible reasons for thelow measured attenuation factor at building #73 include (1)reduced soil-gas entry rate due to relatively low buildingdepressurization; 2) a relatively high building air exchangerate; (3) elevated moisture in the vadose zone or capillaryzone; or (4) nonequilibrium partitioning between the groundwater and the soil vapor at the base of the capillary fringe.
The U.S. EPA generic (conservative) attenuation factorfor nondegradable compounds between the basement airand the deep-soil vapor is 1 3 10�2. For benzene andtoluene, the measured soil vapor attenuation factors forbuilding #73 were <10�5 (Table 4). As aforementioned,degradation of these chemicals is likely a factor. Soil vaporattenuation factors for MTBE, 2,2,4-trimethylpentane, andcyclohexane were somewhat higher (between 3.6 3 10�4
and 2.2 3 10�5). Attenuation factors between the basementair and the subslab vapor were 7.2 3 10�3 to 8.4 3 10�3
for cyclohexane, 2,2,4-trimethylpentane, and MTBE(Table 4). While lower than the conservative subslab atten-uation factor assumed by the U.S. EPA in their soil screen-ing guidance (85th percentile value of 1 3 10�1), thesevalues are very near the 50th percentile values for thisparameter reported in the U.S. EPA vapor intrusion guid-ance for Lowry Air Force Base. Again, the relatively lowdepressurization observed for building #73 may havereduced soil-gas entry and thus the measured attenuationfactor.
Attenuation factors between the ground floor and thebasement of building #73 for cyclohexane, MTBE and2,2,4-trimethylpentane were between 0.2 and 0.4. Thisresult provides additional evidence for subsurface sourcesof these contaminants and also indicates the relative levelof air exchange between the two floors.
Table 4Attenuation Coefficients between Exterior and Interior Concentrations
Building #73 in Stafford Township, New Jersey
Basement/Ground Water Basement/Deep-Soil Vapor Basement/Subslab Ground Floor/Basement
Benzene <4.33 10�6 <1.23 10�5 ND NDToluene <1.23 10�6 <8.63 10�6 ND NDEthylbenzene <1.53 10�5 ND ND NDXylenes (total) <5.73 10�6 ND ND NDMTBE 1.2 3 10�5 2.23 10�5 7.23 10�3 3.93 10�1
2,2,4-Trimethylpentane NM 3.63 10�4 7.23 10�3 2.33 10�1
Cyclohexane ND 1.23 10�4 8.43 10�3 2.13 10�1
EPA generic factor 1 3 10�3 1E 3 10�2 13 10�1
ND ¼ not determined because source concentration below quantifiable levels; NM ¼ not measured in ground water.
P.F. Sanders and I. Hers/ Ground Water Monitoring & Remediation 26, no. 1: 63–7270
Temporal Variability of Measured ConcentrationsThe work conducted at Stafford Township was limited
to one round of sampling in October 2002, after 2 monthsof relatively normal weather conditions. No significantweather events occurred immediately prior to or during thesampling time period. Therefore, the concentrationsobserved were expected to be reasonably representative forthe time of year sampled. The variation with time of soilvapor concentrations and indoor air concentrations at thissite is not known. Short-term fluctuations in measured con-centrations may be caused by weather events and changesin building air exchange rates due to opening of windowsand the use of heating and air-conditioning systems (Herset al. 2001). Seasonal variations in water table heights andsoil moisture may also affect the vapor intrusion measure-ments. To obtain better estimates of this variability, meas-urements taken at several times during the year would berecommended.
ConclusionsThe potential for chemical vapor intrusion from gasoline-
contaminated ground water to the interior of homes wasstudied at a site in Stafford Township, New Jersey. Whilemeasurable levels of BTEX chemicals were observedindoors in all the buildings studied, only one of them(building #73) was found to exhibit indoor air impactsattributable to the gasoline, and these impacts were limitedto MTBE, 2,2,4-trimethylpentane, and cyclohexane. Thisconclusion was based on consideration of several lines ofevidence, including (1) vapor attenuation patterns betweenthe contaminant source and the indoor air; (2) observationof indoor concentrations that were significantly higherthan background indoor or outdoor levels commonly re-ported in the literature, or in adjacent buildings; (3) thelack of observed indoor sources of gasoline; and (4) ele-vated indoor levels of the aforementioned three chemicalsrelative to the BTEX chemicals. Data on indoor concentra-tions of MTBE are scarce, but based on the results of thisstudy, this chemical was found to be a potential indoor aircontaminant from gasoline-contaminated ground water,although only at high milligrams per liter levels. Measuredattenuation factors for all chemicals studied at StaffordTownship were one to three orders of magnitude lowerthan U.S. EPA default factors, even though the site ex-hibited conditions favorable to vapor intrusion. Finally,while interpretation of measured indoor BTEX concentra-tions is often difficult due to multiple possible sources, theanalysis of tracer chemicals associated mainly with gaso-line (MTBE and 2,2,4-trimethylpentane) can help confirmindoor impacts from this contaminant.
AcknowledgmentsThis research was supported by the New Jersey Depart-
ment of Environmental Protection, under the HazardousWaste Research Fund. The authors thank John Boyer,Kevin Schick, and Kathy Grimes (New Jersey Department
of Environmental Protection) and Marie Lewis (Golder As-sociates) for assistance with this project.
ReferencesBrown, S.K., M.R. Sim, M.J. Abramson, and C.N. Gray. 1994.
Concentrations of volatile organic compounds in indoor air—A review. Indoor Air 4, no. 2: 123–134.
Clayton, C.A., E.D. Pellizari, R.W. Whitmore, R.L. Perritt, andJ.J. Quackenboss. 1999. National human exposure assessmentsurvey (NHEXAS): Distributions and associations of lead,arsenic and volatile organic compounds in EPA Region 5.Journal of Exposure Analysis and Environmental Epidemiol-ogy 9, no. 5: 381–392.
DeVaull, G.E., R.A. Ettinger, J.P. Salanitro, and J.B. Gustafson.1997. Benzene, toluene, ethylbenzene and xylenes [BTEX]degradation in vadose zone soils during vapor transport: First-order rate constants. In Proceedings of the Petroleum Hydro-carbons and Organic Chemicals in Ground Water Conference:Prevention, Detection and Remediation, November 12–14,Houston, Texas, 365–379. Westerville, Ohio: Ground WaterPublishing Company.
Edwards, R.D., J. Jurvelin, K. Saarela, and M. Jantunen. 2001.VOC concentrations measured in personal samples and resi-dential indoor, outdoor and workplace microenvironments inEXPOLIS-Helsinki, Finland. Atmospheric Environment 35, no.27: 4531–4543.
Fitzpatrick, N.A., and J.J. Fitzgerald. 2002. An evaluation ofvapor intrusion into buildings through a study of field data.Soil and Sediment Contamination 11, no. 4: 603–623.
Hazardous Substances Databank. 2004. National Library of Medi-cine, Bethesda, Maryland. http://toxnet.nlm.nih.gov. AccessedJune 23, 2004.
Hers, I., J. Atwater, L. Li, and R. Zapf-Gilje. 2000. Evaluation ofvadose zone BTX biodegradation. Journal of ContaminantHydrology 46, no. 3–4: 233–264.
Hers, I., R. Zapf-Gilje, P.C. Johnson, and L. Li. 2003. Evaluationof the Johnson and Ettinger model for prediction of indoorair quality. Ground Water Monitoring & Remediation 23, no.2: 119–133.
Hers, I., R. Zapf-Gilje, L. Li, and J. Atwater. 2001. The use ofindoor air measurements to evaluate intrusion of subsurfaceVOC vapors into buildings. Air & Waste Management Associ-ation 51, no. 9: 1318–1331.
Johnson, P.C., and R.A. Ettinger. 1991. Heuristic model for predict-ing the instrusion rate of contaminant vapors into buildings.Environmental Science and Technology 25, no. 8: 1445–1452.
Johnson, P.C., M.W. Kemblowski, and R.L. Johnson. 1999.Assessing the significance of subsurface contaminant vapormigration to enclosed spaces: Site-specific alternatives togeneric estimates. Journal of Soil Contamination 8, no. 3:389–421.
Lahvis, M.A., A.L. Baehr, and R.J. Baker. 1999. Quantification ofaerobic biodegradation and volatilization rates of gasolinehydrocarbons near the water table under natural attenuationconditions.Water Resources Research 35, no. 3: 753–765.
Little, J.C., J.M. Daisey, and W.W. Nazaroff. 1992. Transport ofsubsurface contaminants into buildings. Environmental Sci-ence and Technology 26, no. 11: 2058–2066.
New Jersey Geological Survey. 2004a. Aquifers of New Jersey.Map DGS98-5, Digital Geodata Archive. Trenton, New Jersey:New Jersey Department of Environmental Protection. http://www.nj.gov/dep/njgs/. Accessed June 23, 2004.
P.F. Sanders and I. Hers/ Ground Water Monitoring & Remediation 26, no. 1: 63–72 71
New Jersey Geological Survey. 2004b. Physiographic Provinces ofNew Jersey. Map DGS02-7, Digital Geodata Archive. Trenton,New Jersey: New Jersey Department of Environmental Pro-tection. http://www.nj.gov/dep/njgs/. Accessed June 23, 2004.
Ostendorf, D.W., and D.H. Kampbell. 1991. Biodegradation ofhydrocarbon vapors in the unsaturated zone. Water ResourcesResearch 27, no. 4: 453–462.
Ririe, G.T., R.E. Sweeney, and S.J. Daugherty. 2002. A compari-son of hydrocarbon vapor attenuation in the field with pre-dictions from vapor diffusion models. Soil and SedimentContamination 11, no. 4: 529–554.
Roggemans, S., C.L. Bruce, P.C. Johnson, and R.L. Johnson.2001. Vadose zone natural attenuation of hydrocarbon vapors:An empirical assessment of soil gas vertical profile data. APISoil and Groundwater Research Bulletin No. 15. Washington,D.C.: American Petroleum Institute.
Sexton, K., J.L. Adgate, G. Ramachandran, G.C. Pratt, S.J.Mongin, T.H. Stock, and M.T. Morandi. 2004. Comparison ofpersonal, indoor and outdoor exposures to hazardous air pollu-tants in three urban communities. Environmental Science andTechnology 38, no. 2: 423–430.
Spayd, S.E., and S.W. Johnson. 2003. Guidelines for delineationof well head protection areas in New Jersey. New Jersey Geo-logical Survey Open File Report OFR 03-1. Trenton, NewJersey: New Jersey Department of Environmental Protection.
Squillace, P.J., J.F. Pankow, N.E. Korte, and J.S. Zogorski. 1997.Review of the environmental behavior and fate of methyl tert-butyl ether. Environmental Toxicology and Chemistry 16, no.9: 1836–1844.
U.S. Department of Agriculture (USDA). 1999. Soil survey geo-graphic (SSURGO) database for New Jersey. Fort Worth,Texas: USDA Natural Resources Conservation Service.
U.S. Department of Energy. 2003. New Jersey 30 m wind speedmap. Golden, Colorado: National Renewable Energy Laboratory.http://www.eren.doe.gov/windpoweringamerica/where_is_wind_new_jersey.html. Accessed February 11, 2003.
U.S. EPA. 2003. User’s guide for evaluating subsurface vaporintrusion into buildings. Washington, D.C.: Office of Emer-gency Response.
U.S. EPA. 2002. Draft guidance for evaluating the vapor intrusionto indoor air pathway from groundwater and soils. EPA530-F-02-052. Washington, D.C.: Office of Solid Waste and Emer-gency Response.
U.S. EPA. 1999. Determination of volatile organic compounds(VOCs) in air collected in specially-prepared canisters andanalyzed by gas chromatography/mass spectrometry (GC/MS).EPA/625/R-96/010b. Cincinnati, Ohio: Office of Research andDevelopment.
U.S. EPA. 1997. Test Methods for Evaluating Solid Waste, 3rd ed.,Update III. Washington, D.C.: Office of Solid Waste.
U.S. EPA. 1987. The total exposure assessment methodology(team) study: Summary and analysis, vol. I. EPA 600/6-87002a. U.S. EPA, Washington, D.C.
Vyas, V.M., S.N. Tong, C. Uchrin, P.G. Georgopoulos, and G.P.Carter. 2004. Geostatistical estimation of horizontal hydraulicconductivity for the Kirkwood-Cohansey aquifer. Journalof the American Water Resources Association 40, no. 1: 187–195.
Weisel, C.P. 2002. Assessing exposure to air toxics relative toasthma. Environmental Health Perspectives, Supplements S4,no. 110: 527–537.
Biographical SketchesPaul F. Sanders, Ph.D., is a research scientist at New Jersey
Department of Environmental Protection, Division of Science,Research and Technology, P.O. Box 409, Trenton, NJ 08625;(609) 292-9998; [email protected].
Ian Hers, Ph.D., P. Eng., is a senior consultant at GolderAssociates, Suite 500, 4260 Still Creek Drive, Burnaby, BritishColumbia, Canada V5C 6C6; (604) 296-4233; [email protected].
P.F. Sanders and I. Hers/ Ground Water Monitoring & Remediation 26, no. 1: 63–7272