Valuing the benefits of implementing a national strategy on biological diversity—The case of...
21
Social benefits of implementing a national strategy on biological diversity in Germany Jürgen Meyerhoff *,# , Daija Angeli * , Volkmar Hartje * Abstract The Millennium Ecosystem Assessment has drawn the attention of both economists and the public to the meaning of ecosystem services for human well-being and the role biodiversity plays in maintaining these services. In this paper we present results from a contingent valuation study determining the benefits people would derive from implementing a national strategy on biological diversity in Germany, i.e., the provision the ecosystem service maintenance of biodiversity. In an online survey respondents were presented three randomly selected conservation programmes from the following six ecosystem specific programmes: forests, arable land, pastures and meadows, peatlands, flood plains, and dry grasslands. Subsequently, respondents were presented one of two different overall programmes for Protecting biological diversity in Germany. One programme consists of all six ecosystem specific programmes, the other additionally included a climate change precaution by implementing protection measures on a 20% bigger area. Each time respondents were presented a single bounded dichotomous choice question asking for their willingness to pay (WTP) framed as a referendum. Results indicate that benefits from implementing the strategy would be substantial. Modelling results from the random effects probit reveals that the choices are significantly influenced by observable explanatory variables such as number of nature related trips and conservation activity and shows that the four choices are correlated. However, using different functional forms reveals that the results are very prone to model specification, especially when response uncertainty is taken into account. Thus, the preferred WTP estimates results from the non-parametric Turnbull lower bound estimator based on responses adjusted for response uncertainty. Keywords: contingent valuation, ecosystem services, random effects probit model, Turnbull lower bound, willingness to pay, TEEB * Chair in Environmental and Land Economics, Institute for Landscape Architecture and Environmental Planning, Technische Universität Berlin # Corresponding author: [email protected]
-
Upload
metropolitanstudies -
Category
Documents
-
view
0 -
download
0
Transcript of Valuing the benefits of implementing a national strategy on biological diversity—The case of...
Social benefits of implementing a national
strategy on biological diversity in Germany
Jürgen Meyerhoff*,#
, Daija Angeli*, Volkmar Hartje
*
Abstract
The Millennium Ecosystem Assessment has drawn the attention of both economists and the public to
the meaning of ecosystem services for human well-being and the role biodiversity plays in maintaining
these services. In this paper we present results from a contingent valuation study determining the
benefits people would derive from implementing a national strategy on biological diversity in
Germany, i.e., the provision the ecosystem service maintenance of biodiversity. In an online survey
respondents were presented three randomly selected conservation programmes from the following six
ecosystem specific programmes: forests, arable land, pastures and meadows, peatlands, flood plains,
and dry grasslands. Subsequently, respondents were presented one of two different overall
programmes for Protecting biological diversity in Germany. One programme consists of all six
ecosystem specific programmes, the other additionally included a climate change precaution by
implementing protection measures on a 20% bigger area. Each time respondents were presented a
single bounded dichotomous choice question asking for their willingness to pay (WTP) framed as a
referendum. Results indicate that benefits from implementing the strategy would be substantial.
Modelling results from the random effects probit reveals that the choices are significantly influenced
by observable explanatory variables such as number of nature related trips and conservation activity
and shows that the four choices are correlated. However, using different functional forms reveals that
the results are very prone to model specification, especially when response uncertainty is taken into
account. Thus, the preferred WTP estimates results from the non-parametric Turnbull lower bound
estimator based on responses adjusted for response uncertainty.
Keywords: contingent valuation, ecosystem services, random effects probit model, Turnbull lower
bound, willingness to pay, TEEB
* Chair in Environmental and Land Economics, Institute for Landscape Architecture and Environmental
Planning, Technische Universität Berlin
# Corresponding author: [email protected]
- 1 -
1. Introduction
The failure of society to place a value on nature has, as Jones-Walters and Mulder (2009) point out,
resulted in the degradation of ecosystems, a consequent reduction in ecosystem services, and
contributed to a significant decline in biodiversity. Although determining the benefits people obtain
from the natural environment has been an essential topic in environmental economics for a long time
(cf. Hanley & Barbier 2009), recently two initiatives have brought this issue to the attention of both
economics as well as the public consciousness. The Millennium Ecosystem Assessment (2005)
emphasizes the significance of ecosystem services for human well-being, i.e., the benefits that people
derive from the process and functioning of both „natural‟ and „managed‟ ecosystems. It also
accentuates the role of biodiversity in providing ecosystem services. The Economics of Ecosystems
and Biodiversity (TEEB) initiative, building on the Millennium Ecosystem Assessment, aims at
drawing attention to the (global) economic benefits of biodiversity and highlights the growing costs of
biodiversity loss and ecosystem degradation (www.teebweb.org/). One of the ecosystem services
which are said to provide benefits to society is the maintenance of species and the preservation of
ecosystems. This service can provide both use values, e.g. through use for recreation, and non-use
values, e.g., through knowing that animal and plant species exist (cf. Barbier et al. 2009; Heal et al.
2005).
In this paper we present results from a valuation study aiming at determining the economic value of
the service maintenance of species and ecosystems in Germany. The German government has issued a
“National Strategy on biological Diversity” (NBS) in 2007 (BMU). With this strategy, Germany fulfils
its obligations under Article 6 of the Convention on biological Diversity (CBD) and implements the
Convention at the national level. It aims at significantly minimising, and eventually halting altogether,
the threat to biological diversity. The NBS defines about 330 goals and about 430 measures to realize
a sustainable use of natural resources and to stop the loss of biodiversity for a range of sectors on the
one hand, and a range of ecosystems on the other hand.
The present study is part of a project assessing the costs of inaction with respect to biodiversity
protection under present conditions as well as changing climate. At the same time, the present study is
to some extent an update of a survey undertaken 20 years ago by Hampicke et al. (1991) who have
conducted the first, and to date only, investigation of nationwide benefits from nature protection in
Germany. Like Hampicke et al. (1991), we employed the survey-based Contingent Valuation method
(CVM) to capture the benefits that would arise from implementing a nationwide programme
protecting biodiversity. It belongs to the group of stated preference methods directly asking
individuals how they value environmental change. The method is well established (Carson &
Haneman 2005) and has been applied several thousand times in environmental economics in order to
capture the benefits that, for example, specific nature and biodiversity conservation measures would
provide.
- 2 -
The paper proceeds as follows. The next section gives a brief overview of studies providing benefit
estimates of nature and biodiversity conservation measures in Germany. Section 3 proceeds with
presenting the nature conservation programmes and the survey instrument while section 4 details the
econometric specification chosen. Section 5 presents the results before section 6 offers a conclusion.
2. Willingness to pay (WTP) for nature conservation in Germany – existing studies
Although environmental valuation has so far only played a minor role in environmental decision
making a number of studies have investigated the benefits of nature and biodiversity conservation
measures in Germany starting in the 1980‟ (see Meyerhoff & Elsasser 2007 or Degenhardt &
Gronemann 2000 for an overview). Looking at these studies, we can differentiate four levels of scope:
nationwide studies (e.g. Hampicke et al. (1991)), studies at the regional level (e.g. Küpker (2007)) or
on the level of protected areas (e.g. Rommel (1998), Enneking (1999)) and studies with regard to a
particular species or habitat (e.g. Bräuer (2002)).
Hampicke et al. (1991) conducted a mail survey determining the WTP of a random sample of the
German population for different species and habitat protection programmes. A bundle of protection,
maintenance and development measures as well as the land requirement was determined for different
habitats (extensive pastures and meadows, semi-dry and calcareous grasslands, heath formations, salt
meadows, arable land, traditional orchards, rivers and floodplains, bogs, forests) as well as water
quality of small and medium size rivers. A detailed quantity structure was used to determine the costs
of this programme for species and habitat protection. Among other things, participants were presented
three programmes with different costs and benefits. Programme A would protect many species to
some extent in selected, valuable areas at an annual cost of € 511 million (DM 1 billion) or € 0.77
(DM 1.50) monthly per person. Programme B would protect more species to a larger extent and in
more areas at annual costs of € 1.53 billion (3 billion DM) or € 2.30 (DM 4.50) monthly per person,
and Programme C would lead to a significant improvement of the state of nature that would allow
bathing in lakes and rivers in a few years from then without health risks at the costs of € 4.6 billon
(DM 9 billion) or € 6.9 (DM 13.50) monthly per person. Respondents were then asked which
programme they would like to see implemented and which one they would be willing to pay for.
Küpker (2007) estimated the benefits of a biodiversity protection and enhancement programme
including five measures (preservation of dead wood, reduction of game density, creation of protected
areas in forests, conversion of coniferous to mixed forest, linking fragmented stocks). The payment
vehicle was a fund, and a payment card was used, showing monetary values from 0 to above 200 Euro.
He investigated a random sample of the State of Schleswig-Holstein as well as the German population
using face-to-face interviews. While Küpker found a similarly high WTP of 25 Euro per household per
year, only 31% of participants in Schleswig-Holstein were willing to pay for the biodiversity
- 3 -
protection measures in contrast to 47% of the overall German population. This was explained by a
limited acceptance of the measures for biodiversity enhancement.
Two studies situated at protected areas are presented by Rommel (1998) and Enneking (1999). The
first examined the environmental and recreation services of the biosphere reserve Schorfheide-Chorin,
asking both inhabitants of the biosphere reserve and those in surrounding area up to 8 km, as well as
visitors to the area. Both groups were asked for the maximum amount they were willing to pay for a
bundle of measures. The WTP of inhabitants added up to € 26.00 (DM 50.78) per person per month;
visitors were willing to pay € 1.54 (DM 3.01) per visit per person. Rommel added this to an
aggregated total annual WTP of 5.08 million € (DM 9.93 million). Enneking (1999) investigated the
economic value of a nature conservation project on the Steinhuder Meer, a large inland lake in
Northwestern Germany. He asked visitors to the lake if they were willing to pay a certain amount on a
badge or, respectively, if the badge is not introduced, willing to make a voluntary payment to a fund
for a planned rewetting project for the protection of ground breeders. The median value was between €
1.06 (DM 3.08) per visitor per day and € 2.67 (DM 5.23) for the one time payment to the fund. This
value was not aggregated due to the uncertainty about total visitors to the area.
Bräuer (2002) focused on a single species and its habitat. He determined visitor‟s willingness to
pay for a programme for the protection of the beaver and its floodplain habitat. The programme
described measures needed (land purchase, habitat enhancement, reintroduction costs). Visitors to the
northern part of the Spessart, a low mountain range in north-western Bavaria and southern Hesse, were
handed a payment card with amounts between 0 and 20 DM in 0.5 DM intervals and asked if they
would be willing to pay the amount as a nature tax per visitor per day. Bräuer determined a WTP of
about € 0.75 per visitor per day. Karkow and Gronemann (2005) conducted two verbal interview
surveys, in Berlin and in the Biosphere Reserve of southwest Rügen, to investigate the WTP for the
experience and recreation value of agricultural lands rich in wildflowers. Participants were presented a
programme for changing cultivation on 10% of Germany‟s arable land area so that a rich, typical
wildflower flora can develop. These sites will be distributed evenly over the country so that every
participant would have personal use of it for local recreation. If participants stated that they were
generally willing to contribute to the good, they were asked the maximum amount they would be
willing to pay.
3. Study design and sample
3.1 The Biodiversity Protection Programme
The National Strategy on Biological Diversity (NBS) provides a range of goals and measures to stop
biodiversity loss and, in the long term, increase biodiversity. However, for the purpose of the
economic evaluation, these goals and measures need to be refined and quantified. A detailed quantity
structure was developed (Spielmans 2010) which complements the specifications of the NBS through
- 4 -
more detailed requirements of existing legislation and a literature review. We focused on land based
ecosystems which are influenced either by conservation efforts or agricultural and forestry
management. Though mentioned in the NBS, sea and coastal as well as freshwater habitats and those
habitats which are not influenced by human land use or conservation efforts, like rock formations,
were left out.
Based on the quantitative structure, a generally understandable programme “Protection of
biological diversity in Germany” was developed for the survey. It consists of measures for six
ecosystem types, arable land, pastures and meadows, forests (excluding woodlands on peat soil and in
floodplains), peatlands (including woodlands on peat soils), floodplains (including woodlands in
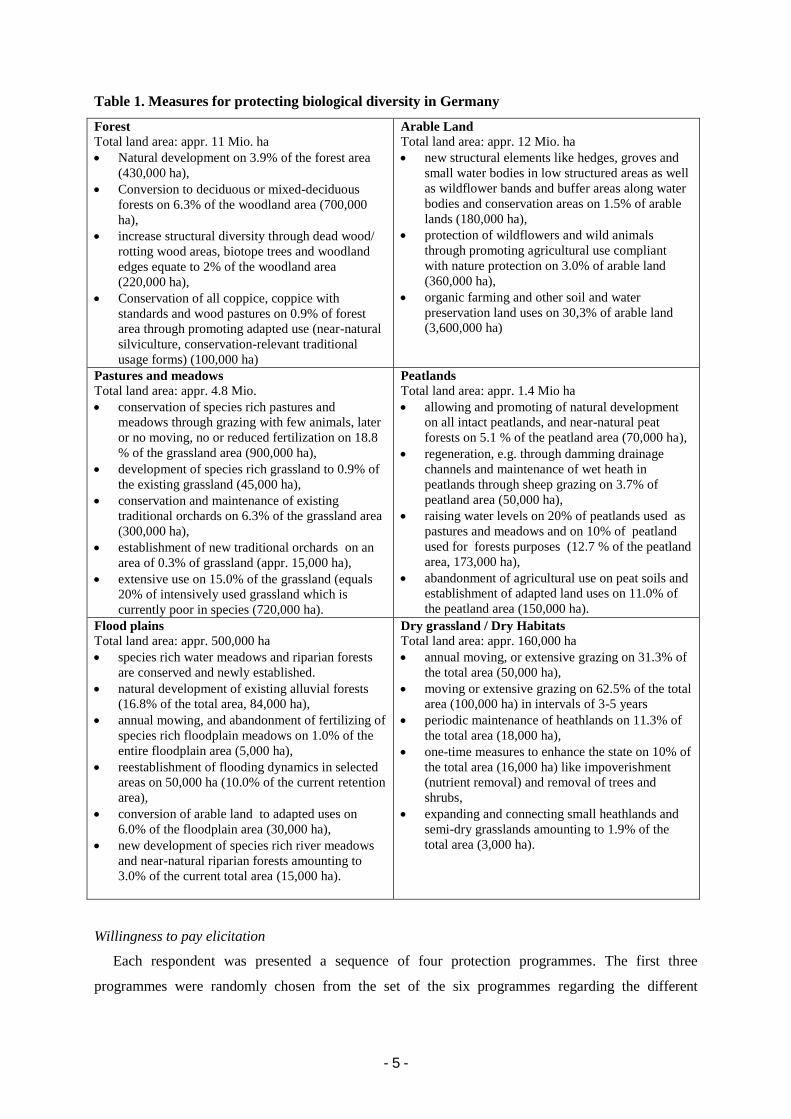
floodplains) and dry habitats (includes heathlands, natural semi-dry and dry grassland). Table 1 shows
the measures as well as the area (in hectare) on which these measures should be implemented.
3.2 Questionnaire and WTP elicitation
In the first part of a five part questionnaire, participants are informed about the aim of the study in a
very general way. To warm up, they were asked a few questions regarding the environment, for
example which area of environmental policy should receive more attention by the federal government
in the future. Participants were also introduced to the term biodiversity, which was defined as
including the diversity of species and habitats and the genetic diversity within the individual animal
and plant species. The second part was designed to determine participants‟ willingness-to-pay for the
conservation programmes (see below). The following questions then investigated participant‟s attitude
and aimed to find determinants that might explain people‟s willingness or unwillingness to contribute
financially to the biodiversity protection programmes presented to them. Through a series of questions
in the fourth part of the survey, we wanted to find out more about the role nature and landscape play
for recreation in Germany. Participants were asked about day trips and short trips which were defined
as trips with up to three overnight stays. If being in nature and landscape was an important motivation
for this trip, participants were asked to give details on the area they visited, costs that the trip incurred
and so on. Finally, socio-demographics such as age, highest education level, net household income as
well as membership in an environmental protection organization were requested.
The questionnaire was pretested twice. The first pretest was conducted with around 30 respondents,
researchers from our institute and from the project accompanying expert group. Subsequently, the
survey institute managed the second pretest with 106 participants drawn randomly from their panel
(see 3.3 Sampling).
- 5 -
Table 1. Measures for protecting biological diversity in Germany
Forest
Total land area: appr. 11 Mio. ha
Natural development on 3.9% of the forest area
(430,000 ha),
Conversion to deciduous or mixed-deciduous
forests on 6.3% of the woodland area (700,000
ha),
increase structural diversity through dead wood/
rotting wood areas, biotope trees and woodland
edges equate to 2% of the woodland area
(220,000 ha),
Conservation of all coppice, coppice with
standards and wood pastures on 0.9% of forest
area through promoting adapted use (near-natural
silviculture, conservation-relevant traditional
usage forms) (100,000 ha)
Arable Land
Total land area: appr. 12 Mio. ha
new structural elements like hedges, groves and
small water bodies in low structured areas as well
as wildflower bands and buffer areas along water
bodies and conservation areas on 1.5% of arable
lands (180,000 ha),
protection of wildflowers and wild animals
through promoting agricultural use compliant
with nature protection on 3.0% of arable land
(360,000 ha),
organic farming and other soil and water
preservation land uses on 30,3% of arable land
(3,600,000 ha)
Pastures and meadows
Total land area: appr. 4.8 Mio.
conservation of species rich pastures and
meadows through grazing with few animals, later
or no moving, no or reduced fertilization on 18.8
% of the grassland area (900,000 ha),
development of species rich grassland to 0.9% of
the existing grassland (45,000 ha),
conservation and maintenance of existing
traditional orchards on 6.3% of the grassland area
(300,000 ha),
establishment of new traditional orchards on an
area of 0.3% of grassland (appr. 15,000 ha),
extensive use on 15.0% of the grassland (equals
20% of intensively used grassland which is
currently poor in species (720,000 ha).
Peatlands
Total land area: appr. 1.4 Mio ha
allowing and promoting of natural development
on all intact peatlands, and near-natural peat
forests on 5.1 % of the peatland area (70,000 ha),
regeneration, e.g. through damming drainage
channels and maintenance of wet heath in
peatlands through sheep grazing on 3.7% of
peatland area (50,000 ha),
raising water levels on 20% of peatlands used as
pastures and meadows and on 10% of peatland
used for forests purposes (12.7 % of the peatland
area, 173,000 ha),
abandonment of agricultural use on peat soils and
establishment of adapted land uses on 11.0% of
the peatland area (150,000 ha).
Flood plains
Total land area: appr. 500,000 ha
species rich water meadows and riparian forests
are conserved and newly established.
natural development of existing alluvial forests
(16.8% of the total area, 84,000 ha),
annual mowing, and abandonment of fertilizing of
species rich floodplain meadows on 1.0% of the
entire floodplain area (5,000 ha),
reestablishment of flooding dynamics in selected
areas on 50,000 ha (10.0% of the current retention
area),
conversion of arable land to adapted uses on
6.0% of the floodplain area (30,000 ha),
new development of species rich river meadows
and near-natural riparian forests amounting to
3.0% of the current total area (15,000 ha).
Dry grassland / Dry Habitats
Total land area: appr. 160,000 ha
annual moving, or extensive grazing on 31.3% of
the total area (50,000 ha),
moving or extensive grazing on 62.5% of the total
area (100,000 ha) in intervals of 3-5 years
periodic maintenance of heathlands on 11.3% of
the total area (18,000 ha),
one-time measures to enhance the state on 10% of
the total area (16,000 ha) like impoverishment
(nutrient removal) and removal of trees and
shrubs,
expanding and connecting small heathlands and
semi-dry grasslands amounting to 1.9% of the
total area (3,000 ha).
Willingness to pay elicitation
Each respondent was presented a sequence of four protection programmes. The first three
programmes were randomly chosen from the set of the six programmes regarding the different
- 6 -
ecosystem types. They have a typical set up: the first paragraph characterises the ecosystem type, its
current total area in hectare and gives examples of typical species. The second paragraph outlines
causes and current threats to biodiversity relevant to this ecosystem type, and points out the need for
additional measures. The third paragraph listed measures for the protection of biodiversity as well as
their extent in hectare (as presented in Table 1). All paragraphs were presented on one computer
screen. The fourth programme, also randomly assigned to a respondent, concerned either the
comprehensive programme “Protection of biological diversity in Germany” (BIOPROG), or a version
extended by a climate change precaution measure. BIOPROG+ comprises the measures for all six
ecosystem types programmes. It was introduced in the survey as follows:
“The programme for the protection of biological diversity in Germany comprises all measures in
forests and peatlands, in dry habitats, on arable land, pastures and meadows as well as in
floodplains. Some of these measures you already got to know in the previous programmes. You
can read and print the description of the comprehensive programme as a pdf-file [here, a link to
the pdf file was inserted]. This programme aims at halting the loss of biological diversity in
Germany and to conserve the diversity of species and habitats in the long term.”
In order to test if anticipated climate change influences participants WTP, the Biodiversity protection
programme was extended. The second comprehensive programme (BIOPROG+) was summarized like
the first; however, the following information was added:
“The anticipated climate change will quite possibly have negative effects on biodiversity. While
particular species in some regions might benefit from climate change, many animal and plant
species will experience a higher adaptation pressure. Therefore it is even more important that the
near-natural habitats of endangered species are large enough and pathways for species exist. As a
precaution, the measures should be implemented in an area that is 20% larger than intended with
the comprehensive programme.”
The payment vehicle used is a contribution to a fund “Protection of biological diversity” managed
by the German Federal Nature Conservation Agency. Payments are earmarked for biodiversity
protection and the agency would report on the programmes implementation regularly on the internet.
The bid vector (amount of money to be paid for a programme), for the sub-programmes was {1, 3, 5,
10, 15, 20, 30, 50, 75} and for the nationwide programmes {3, 5, 10, 15, 20, 30, 50, 75, 110}. Also the
bid values were each time chosen randomly by the survey software. The response options were: “Yes,
I agree”, “No, I disagree” or “Don‟t know”. In order to reduce incentives for strategic behaviour, the
WTP question was framed as a referendum saying that the programme will only be implemented if at
least half of those who faced the programme were willing to pay (implementation rule). The WTP
question was worded as follows: “If you would have to make a monthly payment of X Euro, would
you than vote for the programme Y? It will be implemented if at least half of the participants approve
the programme. If it is not implemented, nobody needs to pay anything.”
- 7 -
Response certainty scale
Evidence provided by Contingent Valuation studies suggests that respondents are uncertain about their
responses and several approaches have been developed to incorporate the degree of uncertainty in
WTP estimations (e.g., Champ et al. 1997 [Asymmetric Uncertainty Model]; Loomis & Ekstrand 1998
[Symmetric Uncertainty Model]; Akter et al. 2009; Lyssenko & Martinez-Espineira 2009). One
approach, the asymmetric uncertainty model, has been used by many researchers. Directly after the
WTP question respondents are presented a certainty scale ranging from 1 to 10 where 1 equals “not
certain at all” and 10 equals “absolutely certain”. Champ et al. (1997) recoded all responses to „no‟ if
the respondent has not expressed an “absolutely certain” on the scale. They argue that only in this case
responses to the hypothetical WTP question would match actual WTP. Subsequently, several authors
found out that this assumption is too strong. Comparing results from an actual referendum with
contingent referenda Morrison and Brown (2009) find that a cut-off rating at 7 on the certainty scale
produces estimates that match actual payments. As the authors point out, this adds to a number of
studies that also concluded that a cut-off of either 7 or 8 is needed to equalise hypothetical and actual
willingness to pay. In this survey participants were presented a certainty scale after they had responded
to the fourth WTP question. The wording was as follows: “On a scale from 1 to 10, where 1 equals
„not at all sure‟ and 10 „very sure‟, how would you rank your previous answer?”
3.3 Sampling
Participants were randomly drawn from the panel of the survey institute (LINK Institut für Markt- und
Sozialforschung GmbH). The panel, which is said to represent German internet users between 18 and
69 years who use the internet for private purposes at least once a week, comprises 150,000 people. It
was recruited by Computer Aided Telephone Interview (CATI) interviews (no self selection bias).
Those panellists selected were invited to participate in the survey via e-mail by the Link Institute by
providing a link to the survey and a personalized code. For finalizing the interview respondents were
rewarded with a 4 € voucher for an online bookstore. As the internet reach among people 70 years and
over is smaller than 5% in Germany, this age group is underrepresented in the panel. However, due to
research economic reasons, an additional recruiting of people is this group was refrained. Overall,
8662 panel members were invited1 in four waves, a week between each wave. After five days,
panellists who had not participated yet were sent an e-mail reminder. One week before the end of the
survey, all interviewees who had not responded yet were reminded a second time. The field time of the
survey also allowed participants who do not use the internet on a daily basis to participate. The main
survey was conducted from the beginning of November to the beginning of December 2009.
1 The reason for inviting such a high number of respondents was not only to have at least 1000 observations for each
conservation programme but also to record details about a large number of nature oriented trips respondents have done within
the twelve months prior to the interview. A high number of interviews should facilitate a good coverage of destinations in all
regions of Germany. The approximately reported 2400 nature oriented trips are not subject of the present analysis.
- 8 -
4. Econometric specification
The literature shows that WTP estimates derived from dichotomous choice valuation questions can be
very sensitive to the empirical model used. A common suggestion is thus to present a suite of models
to deal with the underlying fragility of the welfare measure estimation (Bengochea-Morancho et al.
2005; Vaughan et al. 1999). Accordingly, we will present estimates from the Turnbull lower bound as
a non-parametric approach and from a random effects probit model as a parametric approach. Both
have been frequently used for estimating willingness to pay from dichotomous responses (Holmes et
al. 2004; Loomis & González-Cabán 1998; Petrolia et al. 2009; Loureiro et al. 2009).
The Turnbull lower-bound estimator as a distribution-free strategy eliminates the possibility of
negative WTP estimates that can be problematic in linear parametric models (Haab & McConnel
1997). It is based on the grouping of the binary responses to the WTP question in bid intervals, i.e., the
bid level presented to the respondent and the next higher bid level. To ensure non-negative outcomes,
the probability of WTP responses is constrained to be positive and sum to unity across bid intervals. A
monotonically increasing cumulative probability density function (CPDF) is secured by pooling
intervals if necessary. Mean WTP is calculated as the sum of probabilities of respondent voting times
the various bid levels used, or, as in the case of the lower bound estimate, times the lower of the two
prices of the interval. Thus the estimate offers a conservative lower bound on WTP for all non-
negative distributions of WTP. This gives
1
1
0
( ) *
m
LB i i
i
E WTP P B (1)
where LBE is the mean lower bound value, iP is the probability of respondents replying negatively in
the bid interval i 1 i(B ,B ) , i 1B the lower bound bid level, and m the maximum bid level. An
advantage of the Turnbull estimator is that standard errors can be computed easily and thus 95%
confidence intervals can be provided. One the other hand, covariates such as demographics cannot be
included when estimating WTP (Giraud et al. 2001). It is only possible to calculate mean WTP for
subgroups if the sample is large enough. Thus, testing the validity of the stated WTP responses
requires other approaches.
A parametric alternative to the Turnbull estimator is the probit model. Hanemann (1984) showed
how responses from a dichotomous valuation question can be used to obtain social welfare measure
(mean and median of the WTP). In a random utility model, which assumes that the utility function has
some components which are unobservable to the researcher and are treated as stochastic, the
probability of an individual (i) voting YES can be expressed as
Prob(paying) = Prob1 0
1 1 0 0[V (z , y P,s) V (z , y,s,) ], (2)
where V is the observable component of utility and the random component, the subscripts 1 and 0
indicate the situation with and without conservation programme, y represents income, P the additional
- 9 -
costs that would arise because of the conservation programme, and s is a vector of individual
characteristics. Rewriting Eq. (2) gives
Prob(paying) = Prob i0 i1 i0 i1[V V ] . (3)
If it is assumed that the difference between both random terms follows a standard normal CDF, the
probability that an individual pays for the conservation programme corresponds to a standard normal
probit model. In order to constrain WTP to be non-negative, we used a logarithmic transformation of
the bid amount. In this case the mean WTP is computed from the parameter estimates of the probit
model as in Eq. (4):
Mean WTP = 2
bid
X 'exp 0.5
(4)
where bid is the coefficient on the bid variable, X is either the estimated constant or the “grand”
constant computed as the sum of the estimated constant plus the product of the additional explanatory
variables, ' is the column vector of corresponding coefficients, and 2 the variance.
As respondents were asked to evaluate all four options in the same survey, it is likely that the errors
across the four choices are correlated. Thus, a panel model is used to address this correlation, i.e., the
random portion of the utility function consists of two error terms. The random effects model is written
as
*
it it i itY X , (5)
where *
itY is an unobserved latent variable, itX is a 1 k vector of exogenous variables and a 1k
vector of coefficients. The remaining two terms represent error components. The first, i , represents
an unobservable characteristic specific to the individual i that does not vary among the t observations
from i . The second term, it , varies among individuals and across the t observations from each
individual. Both terms are normally distributed with zero means and independently of one another. In
the random effects model the correlation is equal to the ratio of the variance of the individual
specific component to the overall variance:
2
2 2
. (6)
As in dichotomous choice models it is generally assumed that 2 1 , the value of increases as the
variance of the individual specific component increases relative to the variance of the random
component. If no correlation exists, 0 and the standard probit model would be appropriate. If
- 10 -
0 the standard probit would result in biased standard errors of the coefficients and the random
effects model must be considered.
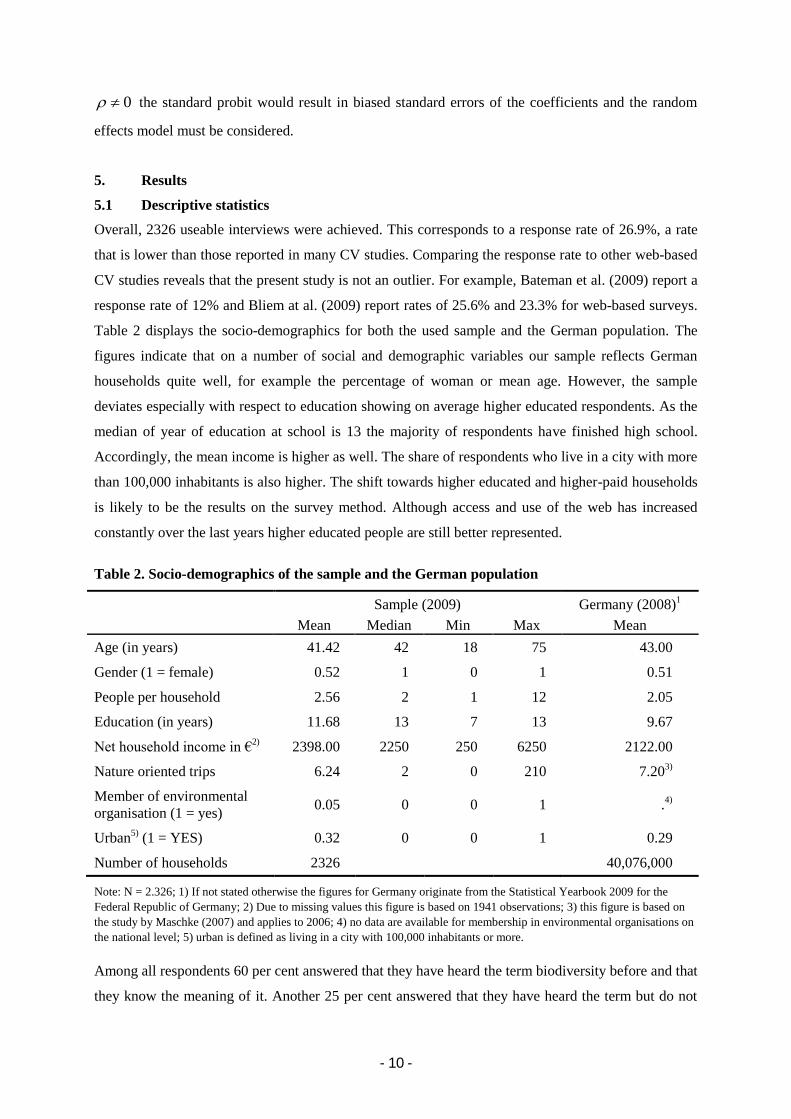
5. Results
5.1 Descriptive statistics
Overall, 2326 useable interviews were achieved. This corresponds to a response rate of 26.9%, a rate
that is lower than those reported in many CV studies. Comparing the response rate to other web-based
CV studies reveals that the present study is not an outlier. For example, Bateman et al. (2009) report a
response rate of 12% and Bliem at al. (2009) report rates of 25.6% and 23.3% for web-based surveys.
Table 2 displays the socio-demographics for both the used sample and the German population. The
figures indicate that on a number of social and demographic variables our sample reflects German
households quite well, for example the percentage of woman or mean age. However, the sample
deviates especially with respect to education showing on average higher educated respondents. As the
median of year of education at school is 13 the majority of respondents have finished high school.
Accordingly, the mean income is higher as well. The share of respondents who live in a city with more
than 100,000 inhabitants is also higher. The shift towards higher educated and higher-paid households
is likely to be the results on the survey method. Although access and use of the web has increased
constantly over the last years higher educated people are still better represented.
Table 2. Socio-demographics of the sample and the German population
Sample (2009) Germany (2008)1
Mean Median Min Max Mean
Age (in years) 41.42 42 18 75 43.00
Gender (1 = female) 0.52 1 0 1 0.51
People per household 2.56 2 1 12 2.05
Education (in years) 11.68 13 7 13 9.67
Net household income in €2)
2398.00 2250 250 6250 2122.00
Nature oriented trips 6.24 2 0 210 7.203)
Member of environmental
organisation (1 = yes) 0.05 0 0 1 .
4)
Urban5)
(1 = YES) 0.32 0 0 1 0.29
Number of households 2326 40,076,000
Note: N = 2.326; 1) If not stated otherwise the figures for Germany originate from the Statistical Yearbook 2009 for the
Federal Republic of Germany; 2) Due to missing values this figure is based on 1941 observations; 3) this figure is based on
the study by Maschke (2007) and applies to 2006; 4) no data are available for membership in environmental organisations on
the national level; 5) urban is defined as living in a city with 100,000 inhabitants or more.
Among all respondents 60 per cent answered that they have heard the term biodiversity before and that
they know the meaning of it. Another 25 per cent answered that they have heard the term but do not
- 11 -
know the meaning of it. Only 11 percent stated that they have never heard this term while 4 percent
answered don‟t know. The high percentage of those who have heard the term before might be biased
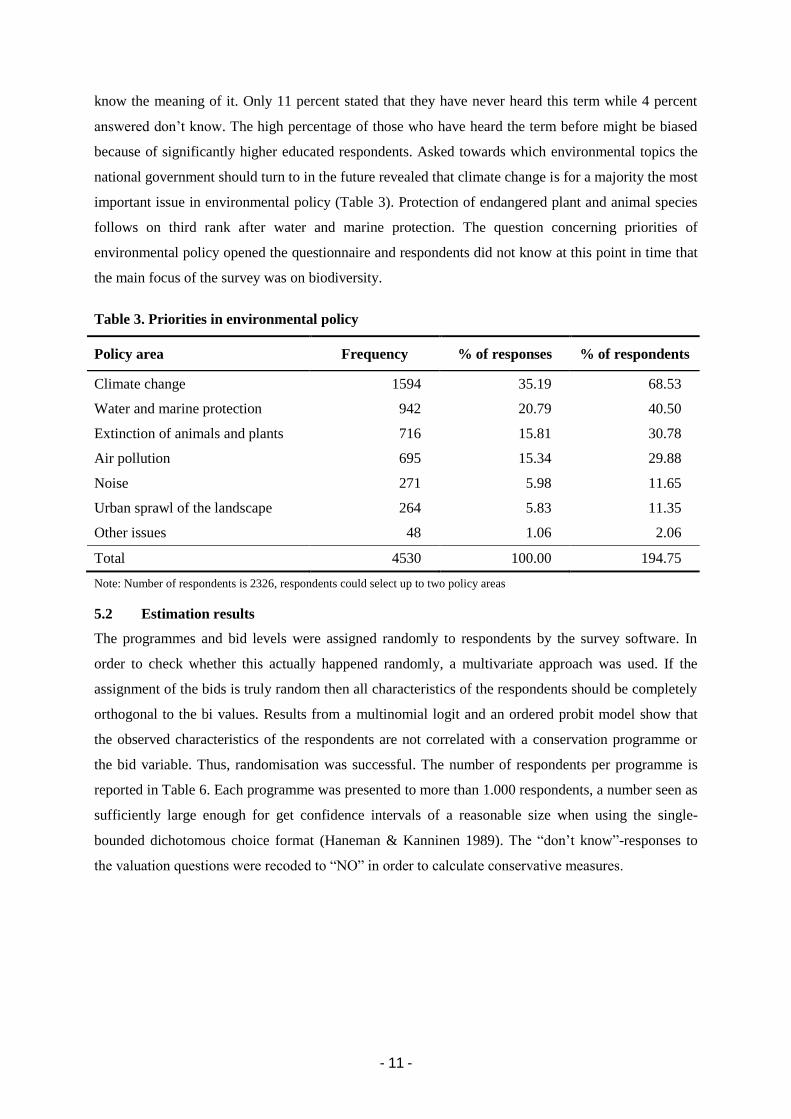
because of significantly higher educated respondents. Asked towards which environmental topics the
national government should turn to in the future revealed that climate change is for a majority the most
important issue in environmental policy (Table 3). Protection of endangered plant and animal species
follows on third rank after water and marine protection. The question concerning priorities of
environmental policy opened the questionnaire and respondents did not know at this point in time that
the main focus of the survey was on biodiversity.
Table 3. Priorities in environmental policy
Policy area Frequency % of responses % of respondents
Climate change 1594 35.19 68.53
Water and marine protection 942 20.79 40.50
Extinction of animals and plants 716 15.81 30.78
Air pollution 695 15.34 29.88
Noise 271 5.98 11.65
Urban sprawl of the landscape 264 5.83 11.35
Other issues 48 1.06 2.06
Total 4530 100.00 194.75
Note: Number of respondents is 2326, respondents could select up to two policy areas
5.2 Estimation results
The programmes and bid levels were assigned randomly to respondents by the survey software. In
order to check whether this actually happened randomly, a multivariate approach was used. If the
assignment of the bids is truly random then all characteristics of the respondents should be completely
orthogonal to the bi values. Results from a multinomial logit and an ordered probit model show that
the observed characteristics of the respondents are not correlated with a conservation programme or
the bid variable. Thus, randomisation was successful. The number of respondents per programme is
reported in Table 6. Each programme was presented to more than 1.000 respondents, a number seen as
sufficiently large enough for get confidence intervals of a reasonable size when using the single-
bounded dichotomous choice format (Haneman & Kanninen 1989). The “don‟t know”-responses to
the valuation questions were recoded to “NO” in order to calculate conservative measures.
- 12 -
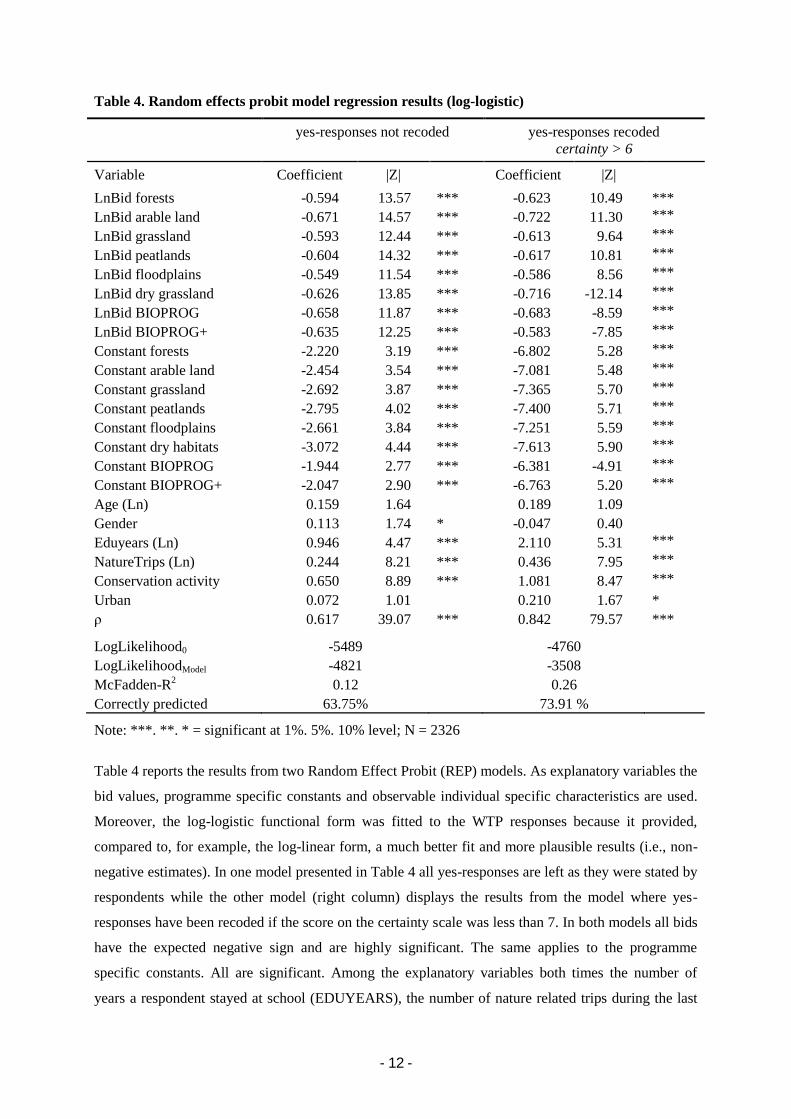
Table 4. Random effects probit model regression results (log-logistic)
yes-responses not recoded yes-responses recoded
certainty > 6
Variable Coefficient |Z| Coefficient |Z|
LnBid forests -0.594 13.57 *** -0.623 10.49 ***
LnBid arable land -0.671 14.57 *** -0.722 11.30 ***
LnBid grassland -0.593 12.44 *** -0.613 9.64 ***
LnBid peatlands -0.604 14.32 *** -0.617 10.81 ***
LnBid floodplains -0.549 11.54 *** -0.586 8.56 ***
LnBid dry grassland -0.626 13.85 *** -0.716 -12.14 ***
LnBid BIOPROG -0.658 11.87 *** -0.683 -8.59 ***
LnBid BIOPROG+ -0.635 12.25 *** -0.583 -7.85 ***
Constant forests -2.220 3.19 *** -6.802 5.28 ***
Constant arable land -2.454 3.54 *** -7.081 5.48 ***
Constant grassland -2.692 3.87 *** -7.365 5.70 ***
Constant peatlands -2.795 4.02 *** -7.400 5.71 ***
Constant floodplains -2.661 3.84 *** -7.251 5.59 ***
Constant dry habitats -3.072 4.44 *** -7.613 5.90 ***
Constant BIOPROG -1.944 2.77 *** -6.381 -4.91 ***
Constant BIOPROG+ -2.047 2.90 *** -6.763 5.20 ***
Age (Ln) 0.159 1.64 0.189 1.09
Gender 0.113 1.74 * -0.047 0.40
Eduyears (Ln) 0.946 4.47 *** 2.110 5.31 ***
NatureTrips (Ln) 0.244 8.21 *** 0.436 7.95 ***
Conservation activity 0.650 8.89 *** 1.081 8.47 ***
Urban 0.072 1.01 0.210 1.67 *
ρ 0.617 39.07 *** 0.842 79.57 ***
LogLikelihood0 -5489 -4760
LogLikelihoodModel -4821 -3508
McFadden-R2 0.12 0.26
Correctly predicted 63.75% 73.91 %
Note: ***. **. * = significant at 1%. 5%. 10% level; N = 2326
Table 4 reports the results from two Random Effect Probit (REP) models. As explanatory variables the
bid values, programme specific constants and observable individual specific characteristics are used.
Moreover, the log-logistic functional form was fitted to the WTP responses because it provided,
compared to, for example, the log-linear form, a much better fit and more plausible results (i.e., non-
negative estimates). In one model presented in Table 4 all yes-responses are left as they were stated by
respondents while the other model (right column) displays the results from the model where yes-
responses have been recoded if the score on the certainty scale was less than 7. In both models all bids
have the expected negative sign and are highly significant. The same applies to the programme
specific constants. All are significant. Among the explanatory variables both times the number of
years a respondent stayed at school (EDUYEARS), the number of nature related trips during the last
- 13 -
twelve months (NATURETRIPS), and membership in an environmental or nature conservation
organization (CONSERVATION ACTIVITY) positively influence peoples WTP. In contrast,
respondents AGE does not show any influence while each GENDER or living in a city with more than
100.000 (URBAN) affects WTP responses significantly in one of the models but only at a 10% level.
Finally, the correlation coefficient is significantly different from zero in both model with a value of
0.62 respectively 0.84. This indicates that preferences among respondents are heterogonous after
controlling for the effects of the explanatory variables.
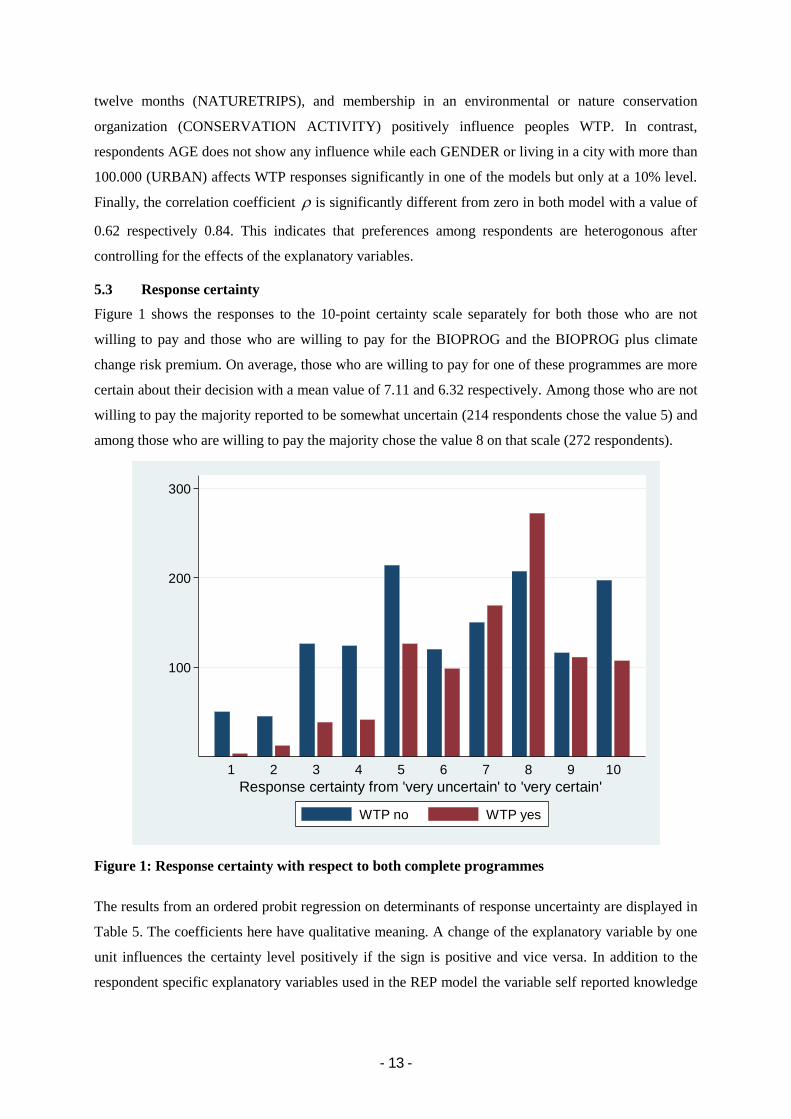
5.3 Response certainty
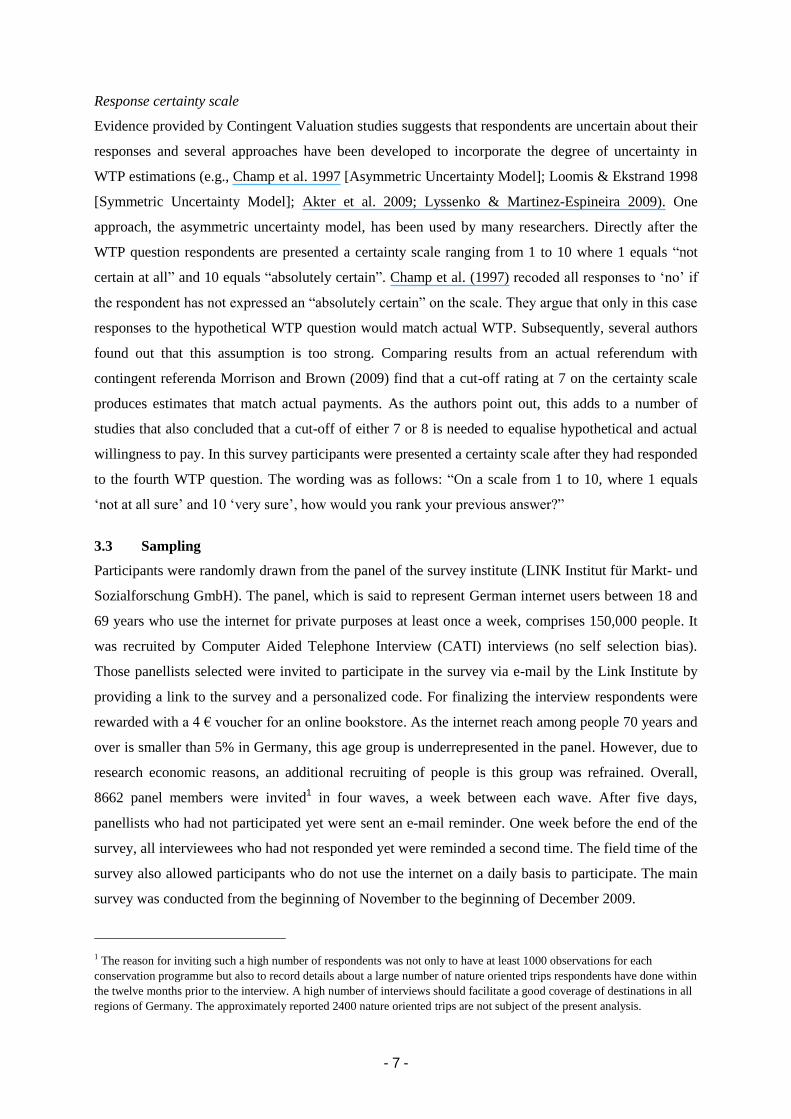
Figure 1 shows the responses to the 10-point certainty scale separately for both those who are not
willing to pay and those who are willing to pay for the BIOPROG and the BIOPROG plus climate
change risk premium. On average, those who are willing to pay for one of these programmes are more
certain about their decision with a mean value of 7.11 and 6.32 respectively. Among those who are not
willing to pay the majority reported to be somewhat uncertain (214 respondents chose the value 5) and
among those who are willing to pay the majority chose the value 8 on that scale (272 respondents).
100
200
300
Fre
que
ncy
1 2 3 4 5 6 7 8 9 10
Response certainty from 'very uncertain' to 'very certain'
WTP no WTP yes
Figure 1: Response certainty with respect to both complete programmes
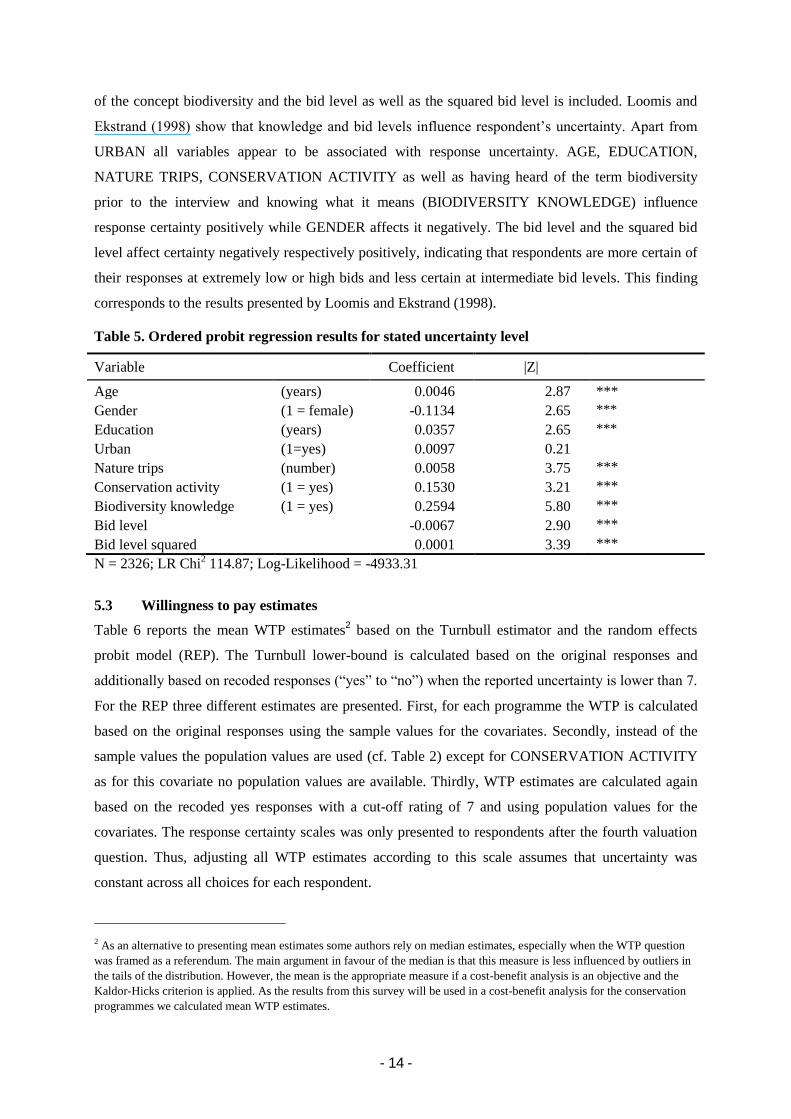
The results from an ordered probit regression on determinants of response uncertainty are displayed in
Table 5. The coefficients here have qualitative meaning. A change of the explanatory variable by one
unit influences the certainty level positively if the sign is positive and vice versa. In addition to the
respondent specific explanatory variables used in the REP model the variable self reported knowledge
- 14 -
of the concept biodiversity and the bid level as well as the squared bid level is included. Loomis and
Ekstrand (1998) show that knowledge and bid levels influence respondent‟s uncertainty. Apart from
URBAN all variables appear to be associated with response uncertainty. AGE, EDUCATION,
NATURE TRIPS, CONSERVATION ACTIVITY as well as having heard of the term biodiversity
prior to the interview and knowing what it means (BIODIVERSITY KNOWLEDGE) influence
response certainty positively while GENDER affects it negatively. The bid level and the squared bid
level affect certainty negatively respectively positively, indicating that respondents are more certain of
their responses at extremely low or high bids and less certain at intermediate bid levels. This finding
corresponds to the results presented by Loomis and Ekstrand (1998).
Table 5. Ordered probit regression results for stated uncertainty level
Variable Coefficient |Z|
Age (years) 0.0046 2.87 ***
Gender (1 = female) -0.1134 2.65 ***
Education (years) 0.0357 2.65 ***
Urban (1=yes) 0.0097 0.21
Nature trips (number) 0.0058 3.75 ***
Conservation activity (1 = yes) 0.1530 3.21 ***
Biodiversity knowledge (1 = yes) 0.2594 5.80 ***
Bid level -0.0067 2.90 ***
Bid level squared 0.0001 3.39 ***
N = 2326; LR Chi2 114.87; Log-Likelihood = -4933.31
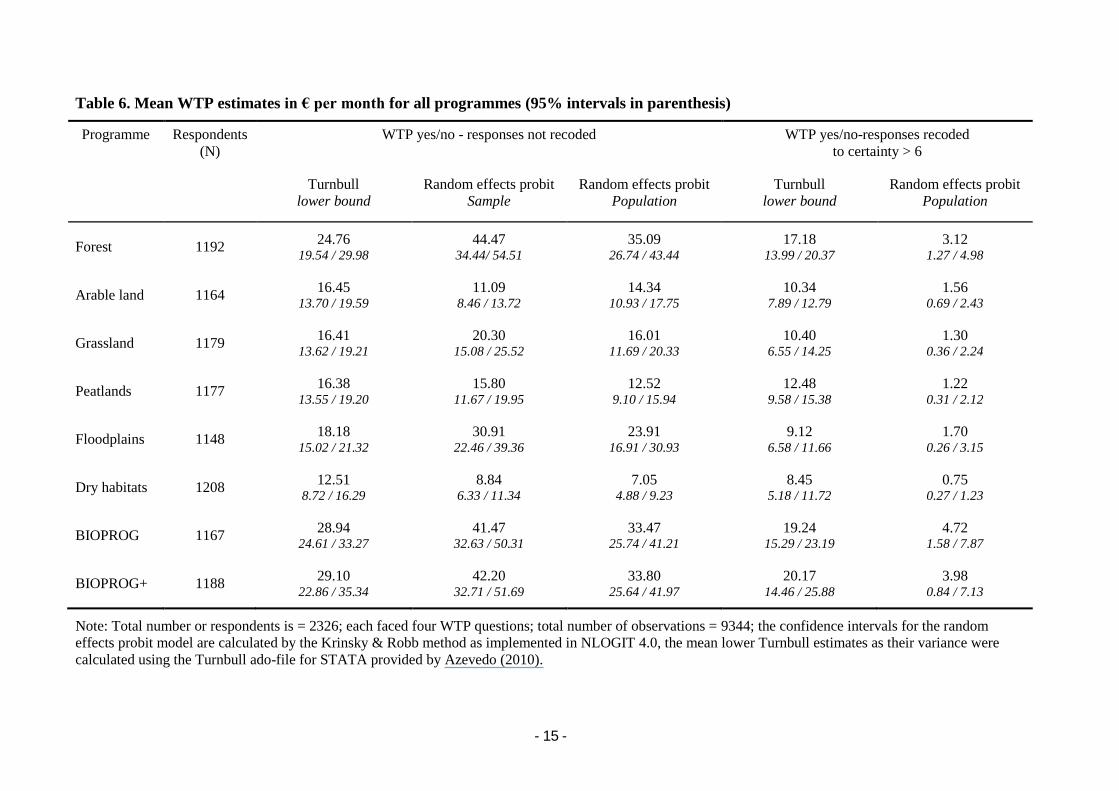
5.3 Willingness to pay estimates
Table 6 reports the mean WTP estimates2 based on the Turnbull estimator and the random effects
probit model (REP). The Turnbull lower-bound is calculated based on the original responses and
additionally based on recoded responses (“yes” to “no”) when the reported uncertainty is lower than 7.
For the REP three different estimates are presented. First, for each programme the WTP is calculated
based on the original responses using the sample values for the covariates. Secondly, instead of the
sample values the population values are used (cf. Table 2) except for CONSERVATION ACTIVITY
as for this covariate no population values are available. Thirdly, WTP estimates are calculated again
based on the recoded yes responses with a cut-off rating of 7 and using population values for the
covariates. The response certainty scales was only presented to respondents after the fourth valuation
question. Thus, adjusting all WTP estimates according to this scale assumes that uncertainty was
constant across all choices for each respondent.
2 As an alternative to presenting mean estimates some authors rely on median estimates, especially when the WTP question
was framed as a referendum. The main argument in favour of the median is that this measure is less influenced by outliers in
the tails of the distribution. However, the mean is the appropriate measure if a cost-benefit analysis is an objective and the
Kaldor-Hicks criterion is applied. As the results from this survey will be used in a cost-benefit analysis for the conservation
programmes we calculated mean WTP estimates.
- 15 -
Table 6. Mean WTP estimates in € per month for all programmes (95% intervals in parenthesis)
Programme Respondents
(N)
WTP yes/no - responses not recoded WTP yes/no-responses recoded
to certainty > 6
Turnbull
lower bound
Random effects probit
Sample
Random effects probit
Population
Turnbull
lower bound
Random effects probit
Population
Forest 1192 24.76
19.54 / 29.98 44.47
34.44/ 54.51 35.09
26.74 / 43.44 17.18
13.99 / 20.37 3.12
1.27 / 4.98
Arable land 1164 16.45
13.70 / 19.59 11.09
8.46 / 13.72 14.34
10.93 / 17.75 10.34
7.89 / 12.79 1.56
0.69 / 2.43
Grassland 1179 16.41
13.62 / 19.21 20.30
15.08 / 25.52 16.01
11.69 / 20.33 10.40
6.55 / 14.25 1.30
0.36 / 2.24
Peatlands 1177 16.38
13.55 / 19.20 15.80
11.67 / 19.95 12.52
9.10 / 15.94 12.48
9.58 / 15.38 1.22
0.31 / 2.12
Floodplains 1148 18.18
15.02 / 21.32 30.91
22.46 / 39.36 23.91
16.91 / 30.93 9.12
6.58 / 11.66 1.70
0.26 / 3.15
Dry habitats 1208 12.51
8.72 / 16.29 8.84
6.33 / 11.34 7.05
4.88 / 9.23 8.45
5.18 / 11.72 0.75
0.27 / 1.23
BIOPROG 1167 28.94
24.61 / 33.27 41.47
32.63 / 50.31 33.47
25.74 / 41.21 19.24
15.29 / 23.19 4.72
1.58 / 7.87
BIOPROG+ 1188 29.10
22.86 / 35.34 42.20
32.71 / 51.69 33.80
25.64 / 41.97 20.17
14.46 / 25.88 3.98
0.84 / 7.13
Note: Total number or respondents is = 2326; each faced four WTP questions; total number of observations = 9344; the confidence intervals for the random
effects probit model are calculated by the Krinsky & Robb method as implemented in NLOGIT 4.0, the mean lower Turnbull estimates as their variance were
calculated using the Turnbull ado-file for STATA provided by Azevedo (2010).
- 16 -
Two results from Table 6 are striking. First, the WTP estimates for the BIOPROG and the
BIOPROG+ do not differ. The mean values are very similar and the confidence intervals overlap
strongly. People do not seem the value these two programmes differently. Second, the WTP estimates
for the forest programme and the two complete programmes do not differ either. The mean estimates
from the Turnbull and the calculations for the recoded yes/no responses due to certainty vary at a first
glance but again the confidence intervals strongly overlap. This indicates that the programme to
achieve nature protections in the forests in seen as very valuable by respondents.
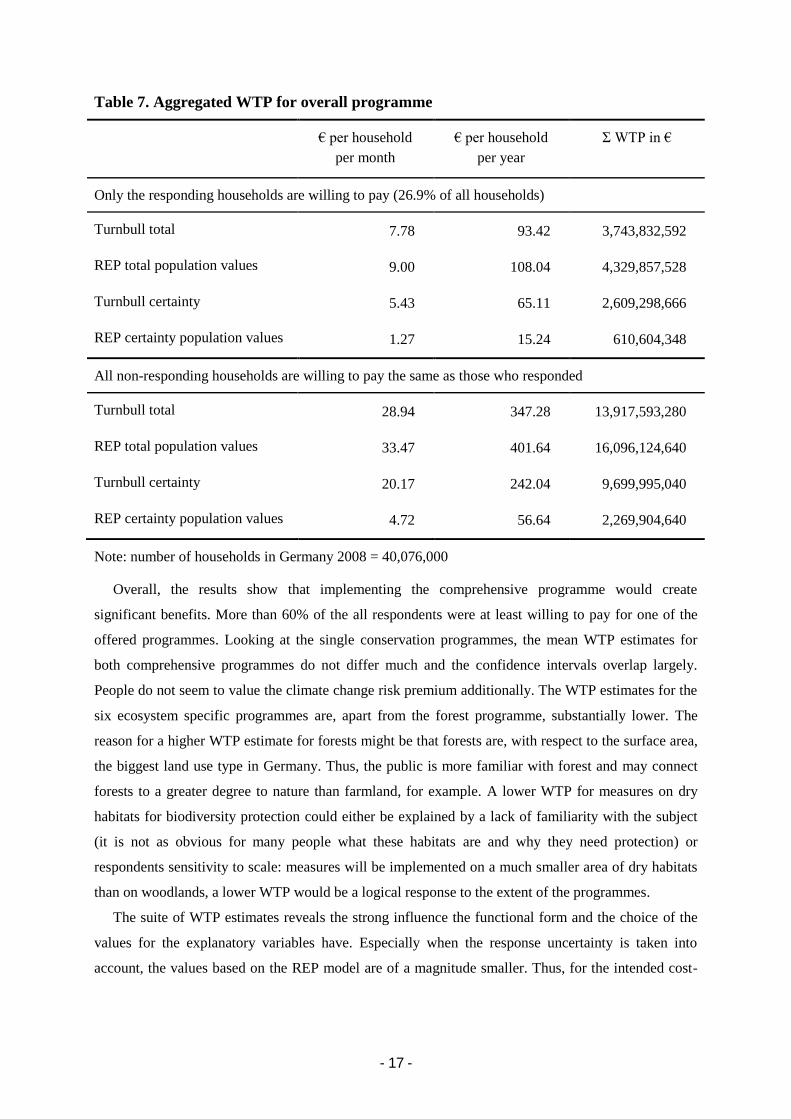
Aggregation of WTP estimates for Germany
To calculate the total willingness to pay of the German population, four different estimates for the
BIOPROG programme are multiplied by the number of households in Germany. We use both WTP
estimates from the lower Turnbull estimate and from the REP model. According to the Federal
Statistical Agency (2009) the number of households in 2008 in Germany was 40,076,000. However, it
has to be taken into account that the majority of selected panellists did not respond. Only 26.9% of
those invited actually participated and finished the questionnaire. Thus, around 73% were non-
responding and thus their willingness to pay is unknown and aggregation across the whole population
requires some assumptions about their willingness to pay. On the one hand, all non-responding
households could be treated as if they are not willing to pay because they have not participated in the
survey. This might indicate that they are not interested in biodiversity conservation at all. On the other
hand, and at the other end of the range of possible outcomes, all non-respondents could be treated as
having on average the same WTP as those who participated. Table 7 reports in the upper part the WTP
estimates when all non-responding households would have a zero WTP and in the lower part the WTP
estimates when all non-responding households would on average have the same willingness to pay as
survey respondents.
6. Discussion and conclusion
The goal of this paper was to present the benefits that would result from implementing a national
strategy on biological diversity in Germany. Thus, six ecosystem specific conservation programmes
were developed and offered to participants of an online survey. During the survey each respondent
faced four conservation programmes accompanied by a willingness to pay question. The first three
conservation programmes were randomly drawn from the six programmes. The fourth programme,
also randomly chosen, was either a comprehensive programme “Protection of biological Diversity in
Germany” consisting of all six programmes or a comprehensive programme plus a climate change risk
premium of a 20% increased area where measures would be implemented.
- 17 -
Table 7. Aggregated WTP for overall programme
€ per household
per month
€ per household
per year
Σ WTP in €
Only the responding households are willing to pay (26.9% of all households)
Turnbull total 7.78 93.42 3,743,832,592
REP total population values 9.00 108.04 4,329,857,528
Turnbull certainty 5.43 65.11 2,609,298,666
REP certainty population values 1.27 15.24 610,604,348
All non-responding households are willing to pay the same as those who responded
Turnbull total 28.94 347.28 13,917,593,280
REP total population values 33.47 401.64 16,096,124,640
Turnbull certainty 20.17 242.04 9,699,995,040
REP certainty population values 4.72 56.64 2,269,904,640
Note: number of households in Germany 2008 = 40,076,000
Overall, the results show that implementing the comprehensive programme would create
significant benefits. More than 60% of the all respondents were at least willing to pay for one of the
offered programmes. Looking at the single conservation programmes, the mean WTP estimates for
both comprehensive programmes do not differ much and the confidence intervals overlap largely.
People do not seem to value the climate change risk premium additionally. The WTP estimates for the
six ecosystem specific programmes are, apart from the forest programme, substantially lower. The
reason for a higher WTP estimate for forests might be that forests are, with respect to the surface area,
the biggest land use type in Germany. Thus, the public is more familiar with forest and may connect
forests to a greater degree to nature than farmland, for example. A lower WTP for measures on dry
habitats for biodiversity protection could either be explained by a lack of familiarity with the subject
(it is not as obvious for many people what these habitats are and why they need protection) or
respondents sensitivity to scale: measures will be implemented on a much smaller area of dry habitats
than on woodlands, a lower WTP would be a logical response to the extent of the programmes.
The suite of WTP estimates reveals the strong influence the functional form and the choice of the
values for the explanatory variables have. Especially when the response uncertainty is taken into
account, the values based on the REP model are of a magnitude smaller. Thus, for the intended cost-
- 18 -
benefit-analysis the WTP estimate of around € 20.0 per month from the lower bound Turnbull
estimator is preferred.
Comparing this figure with the estimates presented by Hampicke et al. (1991) for a more or less
comparable nationwide conservation programme shows that when adjusted for inflation (on average
2% per year over the 20 years) their WTP estimate of € 10 (an average estimate over the programmes
they presented to respondents) equal in today‟s prices approximately € 16 per month per household.
Thus, the value of biodiversity protection has increased and a net increase of around 4.6 Euro
compared to 1989 occurs. Taking into account that Hampicke et al. (1991) used a different elicitation
format and did not adjust their estimates for response uncertainty, the more appropriate WTP estimate
from the present study might be the unadjusted Turnbull estimate. In this case the net difference is
even bigger.
The cost-benefit analysis will show whether the benefits outweigh the costs associated with the
conservation programmes and whether biodiversity protection is still as beneficial to society as
Hampicke et al. (1991) demonstrated 20 years ago.
Acknowledgement
Funding for the project “Biodiversity and climate change: adaptation strategies - cost-benefit scenarios
and climate-benefits” (Fkz. 3508 81 2100) is provided by the German Federal Nature Conservation
Agency, Bonn, and is gratefully acknowledged.
References
Akter, S., R. Brouwer, L. Brander, P. van Beukering (2009). Respondent uncertainty in a contingent
market for carbon offsets. Ecological Economics 68(6): 1858-1863.
Azevedo, J. P. (2010). TURNBULL: Stata module to estimate the Turnbull empirical distribution
estimator of willingness to pay. http://ideas.repec.org/c/boc/bocode/s457125.html.
Barbier, E. B., S. Baumgärtner, K. Chopra, C. Costello, R. Hassan, A. P. Kinzig, M. Lehman, U.
Pascual, C. Perrings, S. Polasky (2009). The valuation of ecosystem services. Biodiversity,
Ecosystem Functioning, and Human Wellbeing. Naeem, S., Bunker, D. E., Hector, A. (eds.),
Oxford, pp. 248-262.
Batemann, I. J., Brouwer, R., Ferrini, S., Schaafsma, M., Barton, D.N., Dubgaard, A., Hasler, B.,
Hime, S., Liekens, I., Navrud, S., De Nocker, L., Ščeponavičiūtė, R., and Semėnienė, D. (2009).
Making benefit transfers work: Deriving and testing principles for value transfers for similar and
dissimilar sites using a case study of the non-market benefits of water quality improvements across
Europe. CSERGE Working Paper EDM 09-10, Norwich.
Bengochea-Morancho, A., Fuertes-Eugenio, A. M., del Saz-Salazar, S. (2005). A comparison of
empirical models used to infer the willingness to pay in contingent valuation. Empirical Economics
30(1), 235-244.
Bliem, M., Getzner, M., Rodriga-Laßnig, P. (2009). Temporal stability of individual preferences for
river restoration in Austria using a choice experiment. IHSK Working paper 02/2009, Klagenfurt.
- 19 -
Bräuer, I. (2002). Artenschutz aus volkswirtschaftlicher Sicht. Die Nutzen-Kosten-Analyse als
Entscheidungshilfe. Marburg.
Carson, R. T., W. M. Hanemann (2005). Contingent Valuation. Handbook of Enviromental
Economics. K.-G. Mäler, J. R. Vincent. Amsterdam, pp. 821-936.
Champ, P. A., R. C. Bishop, T. C. Brown, D. W. McCollum (1997). Using Donation Mechanisms to
Value Nonuse Benefits from Public Goods. Journal of Environmental Economics and Management
33(2), 151-162.
Degenhardt, S., Gronemann, S., 2000. Was darf Naturschutz kosten? – Ein Meinungsbild. In:
Handbuch Naturschutz und Landschaftspflege: Kompendium zu Schutz und Entwicklung von
Lebensräumen und Landschaften, Teil IX-3, 1-9.
Enneking, U. (1999). Ökonomische Verfahren im Naturschutz. Der Einsatz der Kontingenten
Bewertung im Entscheidungsprozeß. Frankfurt/M., Peter Lang Verlag.
Federal Ministry for the Environment, Nature Conservation and Nuclear Safty (BMU) 2007. National
strategy on biological diversity. Berlin.
Haab, T. C., McConnel, K. E. (1997). Referendum Models and Negative Willingness to Pay:
Alternative Solutions. Journal of Environmental Economics and Management 32(2): 251-270.
Hanley, N, Barbier, E. B. (2009). Pricing Nature: Cost-Benefit Analysis and Environmental Policy.
Cheltenham.
Hampicke, U., Tampe, K., Kiemstedt, H., Horlitz, T., Walters, M., Timp, D. (1991): Kosten und
Wertschätzung des Arten- und Biotopschutzes. Berlin.
Hanemann, M., Kanninen, B. (1999). The Statistical Analysis of Discrete-response CV Data. Valuing
Environmental Preferences. Theory and Practice of the Contingent Valuation Method in the US,
EU, and Developing Countries. Bateman, I. J., Willis, K. G. (eds.), Oxford, pp. 302-441.
Hanemann, W.M., (1984), “Welfare analysis with discrete choice models”, Working
Heal et al (2005). Valuing Ecosystem Services: Toward Better Environmental Decision-Making.
Heal, G. M., Barbier, E. B., Boyle, K. J., Covich, A. P., Gloss, S. P., Hershner, C. H., Hoehn, J. P.
Pringle, C. M., Polasky, S., Segerson, K., Shrader-Frechette, K. (2005). Valuing Ecosystem
Services. Toward better environmental decision-making. Washington, D.C.
Holmes, T. P., Bergstrom, J. C., Huszar, E., Kask, S., Orr, F. (2004). Contingent valuation, net
marginal benefits, and the scale of riparian ecosystem restoration. Ecological Economics 49, 19-30.
Jones-Walters. L., Mulder, I. (2009). Valuing nature: The economics of biodiversity. Journal of
Nature Conservation 17. 245-247.
Karkow, K., Gronemann, S. (2005). Akzeptanz und Zahlungsbereitschaft bei Besuchern der
Ackerlandschaft. In: Hampicke, U., Litterski, B., Wichtmann, W. (eds.), Ackerlandschaften.
Nachhaltigkeit und Naturschutz auf ertragsschwachen Standorten. Berlin, Heidelberg, pp. 115-128.
Küpker, M. (2007). Der Wert biologischer Vielfalt von Wäldern in Deutschland. Eine
sozioökonomische Untersuchung von Maßnahmen zur Förderung der Biodiversitä. Hamburg.
Loomis, J. B., Ekstrand, E. (1998). Alternative approaches for incorporating respondent uncertainty
when estimating willingness to pay: the case of the Mexican spotted owl. Ecological Economics
27(1), 29 - 41.
Loomis, J., A. Gonzáles-Cabán (1998). A willingness-to-pay function for protecting acres of spotted
owl habitat from fire. Ecological Economics 25(3): 315 - 322.
Loureiro, M., J. Loomis, M. Vázquez (2009). Economic Valuation of Environmental Damages due to
the Prestige Oil Spill in Spain. Environmental and Resource Economics 44(4): 537-553.
- 20 -
Lyssenko, Nikita and Martinez-Espineira, Roberto (2009). Respondent uncertainty in contingent
valuation: the case of whale conservation in Newfoundland and Labrador. http://mpra.ub.uni-
muenchen.de/21969/
Maschke, J. (2007). Tagesreisen der Deutschen Teil III. Deutsches Wirtschaftswissenschaftliches
Institut an der Universität München (ed.), München.
Meyerhoff, J., Elsasser, P. (2007). A Bibliography of Stated Preference Studies in Austria, Germany,
and Switzerland. Stated Preference Methods for Environmental Valuation: Applications from
Austria and Germany. In Meyerhoff, J., Lienhoop, N., Elsasser, P. (eds.) Marburg, pp. 309-322.
Meyerhoff, J., Elsasser, P. (2007): A bibliography on stated preference studies in Austria, Germany
and Switzerland. In: Meyerhoff, J., Lienhoop, N., Elsasser, P. (eds.), Stated Preference Methods for
Environmental Valuation: Applications from Austria and Germany, Marburg, pp. 313-326
Morrison, M., Brown, T. C. (2009). Testing the effectiveness of certainty scales, cheap talk, and
dissonance-minimization in reducing hypothetical bias in contingent valuation studies.
Environment & Resource Economics 44(3), 307-326.
Petrolia, D. R., T.-G. Kim (2009). What are barrier islands Worth? Estimates of Willingness to Pay for
Restoration. Marine Resource Economics 24, 131-146.
Rommel, K. (1998). Methodik umweltökonomischer Bewertungsverfahren. Kosten und Nutzen des
Biosphärenreservates Schorfheide-Chorin. Regensburg.
Spielmans, S. (2010). Erstellung des Mengengerüstes. Working Paper. Unpublished. Berlin.
Vaughan, W. J., Russell, C. S., Rodriguez, D. J., Darling, A. C. (1999). Central Tendency Measures of
Willingness to Pay from Referendum Contingent Valuation Data: Issues and Alternatives in Project
Analysis. Washington D.C.