
Valuing options for reserve water in the Fitzroy Basin*
24
The Australian Journal of Agricultural and Resource Economics, 49, 91–114 Valuing options for reserve water in the Fitzroy Basin ∗ John Rolfe and Jill Windle † Option values may be an important component of non-use values when development options for environmental assets are considered. These are values that the community might hold for maintaining options to make future choices about allocating resources. However, option values are very difficult to define, at both theoretical and practical levels, and there has been a retreat over the past decade to the more inclusive concept of option prices. In the present paper, estimates of option values are reported for retaining unallocated water in reserve rather than using it for current development. The use of option values rather than option prices is justified on the basis that the focus is on non- use values, and demand and supply uncertainties have been minimised. These values have been assessed through a series of nine choice modelling surveys that have been conducted over a 3-year period in the Fitzroy River Basin in central Queensland. The results are then extrapolated to the case study areas within the basin to assess whether unallocated water should be held in reserve or used for development. Key words: choice modelling, environmental assets, supply response. 1. Introduction Recent water reforms in Queensland have resulted in the development of Water Re- source Plans (WRP), which provide the strategic framework for water allocation and management in the major river systems (QDNRM 2003). Once allocations for environ- mental purposes and existing allocations for irrigation and other uses are confirmed, any remaining water in a river system can be identified. This surplus water (if it is avail- able in a river system) is currently unallocated. An interesting challenge for economists is to evaluate different options for allocating that water. There are economic benefits in allocating water for development (e.g., for agriculture, industry and mining), but there are also likely to be benefits associated with keeping the water unallocated and in reserve. A key benefit is that options for future allocation are still available. If the water remains unallocated, it will not be reserved in any particular location, such as a dam, and will remain in the river system. ∗ The research reported in the present paper has been supported by the Australian Research Council, the Queensland Department of Natural Resources and Mines and Central Queensland University. The contributions of Adam Loch and Jeff Bennett to the project and the design of the surveys are gratefully acknowledged. † John Rolfe (email: [email protected]) is in the Faculty of Business and Law, Central Queensland University, Emerald, Australia. Jill Windle is from the Centre for Environmental Management, Central Queensland University, Rockhampton, Australia. C Australian Agricultural and Resource Economics Society Inc. and Blackwell Publishing Ltd 2005
Transcript of Valuing options for reserve water in the Fitzroy Basin*

The Australian Journal of Agricultural and Resource Economics, 49, 91–114
Valuing options for reserve water in theFitzroy Basin∗
John Rolfe and Jill Windle†
Option values may be an important component of non-use values when developmentoptions for environmental assets are considered. These are values that the communitymight hold for maintaining options to make future choices about allocating resources.However, option values are very difficult to define, at both theoretical and practicallevels, and there has been a retreat over the past decade to the more inclusive concept ofoption prices. In the present paper, estimates of option values are reported for retainingunallocated water in reserve rather than using it for current development. The use ofoption values rather than option prices is justified on the basis that the focus is on non-use values, and demand and supply uncertainties have been minimised. These valueshave been assessed through a series of nine choice modelling surveys that have beenconducted over a 3-year period in the Fitzroy River Basin in central Queensland. Theresults are then extrapolated to the case study areas within the basin to assess whetherunallocated water should be held in reserve or used for development.
Key words: choice modelling, environmental assets, supply response.
1. Introduction
Recent water reforms in Queensland have resulted in the development of Water Re-source Plans (WRP), which provide the strategic framework for water allocation andmanagement in the major river systems (QDNRM 2003). Once allocations for environ-mental purposes and existing allocations for irrigation and other uses are confirmed,any remaining water in a river system can be identified. This surplus water (if it is avail-able in a river system) is currently unallocated. An interesting challenge for economistsis to evaluate different options for allocating that water. There are economic benefitsin allocating water for development (e.g., for agriculture, industry and mining), butthere are also likely to be benefits associated with keeping the water unallocated andin reserve. A key benefit is that options for future allocation are still available. If thewater remains unallocated, it will not be reserved in any particular location, such as adam, and will remain in the river system.
∗The research reported in the present paper has been supported by the Australian Research
Council, the Queensland Department of Natural Resources and Mines and Central QueenslandUniversity. The contributions of Adam Loch and Jeff Bennett to the project and the design ofthe surveys are gratefully acknowledged.
† John Rolfe (email: [email protected]) is in the Faculty of Business and Law, CentralQueensland University, Emerald, Australia. Jill Windle is from the Centre for EnvironmentalManagement, Central Queensland University, Rockhampton, Australia.
C© Australian Agricultural and Resource Economics Society Inc. and Blackwell Publishing Ltd 2005

92 J. Rolfe and J. Windle
Economists typically address allocation questions by assessing the net benefits froma development option compared to the net benefits from a preservation option. Theeconomic benefits of allocating water to development are relatively easy to assess usingstandard cost–benefit analysis. Such an exercise might involve the assessment of the netreturns from increased irrigation production once the costs of infrastructure and waterdelivery systems had been factored in. Any changes in recreational and environmentalbenefits would also be included.
The estimation of values for preserving environmental assets is more challenging.Many changes in the provision of environmental assets are not reflected in markets;partly because people hold values for environmental goods without actually usingthem. These non-use values can be separated into existence values, bequest values andoption values (the latter also includes quasi-option values). It is very difficult to assessthe different components of non-use values separately and, apart from a few studies(e.g., Walsh et al. 1984; Langford et al. 1998), these values are regularly assessed asa group. However, there are some situations where it is important to specify non-usevalues separately. An example might be where specific components of value are neededfor a benefit transfer exercise. As a result, there is interest in developing mechanismsand approaches to more accurately measure items like option values.
The key focus of the present paper is to estimate option values associated withreserving water in the Fitzroy Basin. For this purpose, the target was to estimate optionvalues separate to use values and existence values. Choice Modelling (CM) experimentswere used for this purpose, where one of the component attributes was framed in away to explicitly capture option values. However, the design was complicated by thedifficulty of defining exactly what option values are.
Option values are usually associated with preservation scenarios, as the choice be-tween development and preservation remains open. In contrast, development benefitsdo not usually include option values as a component, because environmental losses arenormally non-reversible. Option and quasi-option values incorporate notions of risk,uncertainty and ignorance.1 Option value refers to the values that people might hold foravoiding irreversible decisions and maintaining future options (Weisbrod 1964; Bishop1982). The concept of option value can be considered as a risk premium associatedwith possible risk aversion and implies that individuals’ risk preferences can affect theirvalues (Chevas and Mullarkey 2002). Quasi-option values are a separate concept. Theyrefer to the value that people have for improving the knowledge about particular trade-offs so that more accurate choices can be made (Arrow and Fisher 1974). This impliesthat there is a value in delaying irreversible decisions until more complete knowledgeis available. Quasi-option values were not explored in the experiments reported in thepresent paper, and are not discussed further.
A debate over the role played by option values has arisen because earlier beliefs thatoption values were always positive have been shown to be wrong (Hanley and Spash1993). One difficulty is that values for preserving options may be offsetting when
1 Risk is the known probability of known outcomes, whereas uncertainty is the unknownprobability of known outcomes. Ignorance relates to unknown outcomes and, hence, unknownprobability.
C© Australian Agricultural and Resource Economics Society Inc. and Blackwell Publishing Ltd 2005

Valuing options for reserve water 93
use and non-use purposes are considered. To resolve this, economists have moved todistinguish option value from option price. Freeman (2003) states:
If option price is defined as the maximum sum the individual would be willing topay to preserve the option to visit the site before his or her own demand uncertaintyis resolved, then the excess of option price over expected consumer’s surplus can becalled option value. (p. 248)
The consumer surplus referred to relates to use values, so the option value can bethought of as that component of WTP to resolve uncertainty that can be attributedto non-use values. Hanley and Spash (1993) recommend that total value be separatedinto two components: option price and existence values, where option price is the sumof use values and option values, and existence value is the sum of existence and bequestvalues.
It is expected that the value of maintaining options will be reduced if there isuncertainty about future demands or about the potential supply of the item. Shogrenand Crocker (1990) specify that option values will only be positive when there is nodemand uncertainty and when supply uncertainty can be completely removed by theproposed actions (Hanley and Spash 1993). However, these conditions are likely to bemet in the case study outlined below, where there is certain demand for environmentalgoods and where there are clear rules about the allocation of resources in the system. Inthe case study outlined below, the environmental good in question is unallocated waterin a river system and values to be measured are those associated with keeping this waterin reserve. It is expected that these values are associated with non-use components, asthere is little recreation use or other uses of the water bodies by the populations ofinterest. The focus of the present study, therefore, is on estimating option values forkeeping water in reserve, rather than option price to capture both use values anduncertainty considerations.
In the case of water resources, high levels of uncertainty about resource condi-tions, environmental resilience, and the interrelationships between various ecologicalfunctions all contribute to people being more cautious about the possibilities of envi-ronmental losses. In the Fitzroy Basin in central Queensland, there is some potentialoption value associated with holding water in reserve until more certainty exists aboutecological thresholds and the accuracy of current biometric modelling relied on in theFitzroy WRP assessment. This is partly because the Fitzroy River discharges into theGreat Barrier Reef lagoon, and potential environmental losses may be associated withestuary, reef and marine zones (Productivity Commission 2003; State of Queenslandand Commonwealth of Australia 2003). Keeping water in reserve rather than allocat-ing it immediately for development would preserve current and future environmentalvalues while keeping future options open.
Identifying how uncertainty about future environmental trends and conditions im-pacts on value formation is an important topic for research in applications of non-market valuation techniques. People’s preferences for non-use aspects of environmentalgoods are not revealed in market transactions. As a result, revealed preference tech-niques are not capable of measuring these concepts, and stated preference techniquesneed to be employed. These include the contingent valuation method (CVM) and
C© Australian Agricultural and Resource Economics Society Inc. and Blackwell Publishing Ltd 2005

94 J. Rolfe and J. Windle
CM.2 Most development options tend to have multiple impacts on use, indirect useand non-use values; making it difficult to separate out specific option values. CM,with its ability to disaggregate choices according to underlying attributes, has someadvantages over CVM in this regard (Morrison et al. 1996; Adamowicz et al. 1998;Hanley et al. 1998; Rolfe et al. 2000).
In the present paper, one approach to dealing with this issue is outlined. The resultsare reported for a series of CM surveys that have been conducted over a 3-year periodin the Fitzroy River Basin in central Queensland. One of the attributes used in the CMsurveys has been labelled in a way that captures concerns about future environmentalimpacts. The attribute used for this purpose was the ‘amount of water kept in reserve’.It was expected that people who were concerned about the risks and uncertainties ofenvironmental impacts would prefer to keep higher levels of water in reserve above thespecified levels held for environmental purposes. In this sense, water kept in reserve canact as an insurance policy in case the environmental risks associated with allocatingwater to development is subsequently found to be higher than is currently modelled.
The present paper is organised as follows. An overview of water reserves in theFitzroy Basin is presented in the next section and is followed by a description of theapplication of the CM surveys and the results. The results are discussed in Section 4,followed by some extrapolation to cost–benefit analysis and specific case studies inSection 5. Conclusions are presented in the final section.
2. Water reserves in the Fitzroy Basin
The Fitzroy Basin, encompassing 142 000 km2, is the second largest externally drainingbasin in Australia. Beef cattle, grain, irrigated crops and coal are key primary productsin the region. The Fitzroy Basin has two major irrigation centres: the Emerald irrigationarea located on the Comet/Nogoa/Mackenzie (CNM) River systems and the DawsonValley irrigation area located along the Dawson River (Figure 1). The Fitzroy Basin’sWater Allocation and Management Plan (WAMP) was released in December 1999(QDNR 1999). It was amended in December 2003, becoming the WRP (Fitzroy Basin)2003 (QDNRM 2003), to ensure that it conforms to the statutory requirements (WaterAct 2000) of a water resource plan.
The WRP establishes the strategic framework for water allocation and managementin the Fitzroy basin and provides for:
• Security of existing users• Security of water infrastructure operators• Environmental water requirements• Opportunities for new water development in the catchment (QDNRM 2003)
Allocations for environmental purposes were generally set at 50 per cent of medianflow levels, although slightly lower levels were set in some catchments. Because streamflows are highly variable in the Fitzroy, median flow levels are substantially below mean
2 Also known as choice-based conjoint and choice experiments.
C© Australian Agricultural and Resource Economics Society Inc. and Blackwell Publishing Ltd 2005

Valuing options for reserve water 95
Figure 1 The Fitzroy Basin.
flow levels. The Fitzroy WRP confirmed existing allocations of water, together withthe following additional water allocations:
• 190 000 megalitres (ML) of medium priority water for the proposed constructionof the Natham Dam
• 3000 ML of high priority water in the Mackenzie River following the stage 2raising of Bingegang Weir
• 300 ML of high priority water from the minor raising of Moura Weir
C© Australian Agricultural and Resource Economics Society Inc. and Blackwell Publishing Ltd 2005

96 J. Rolfe and J. Windle
In addition, the following amounts were identified as unallocated water (and canpotentially be diverted for other uses):
• Up to 300 000 ML of additional mean annual diversions on the Isaac/Connors/lower Fitzroy River systems
• Up to 40 000 ML of additional mean annual diversions in the CNM River system• Up to 11 500 ML of mean annual diversions from the upper Dawson River above
Taroom
Queensland is in the fortunate situation of not having already over-committed wa-ter resources in the Fitzroy Basin. However, while the amount of unallocated water(referred to as water reserve) in the lower Fitzroy appears plentiful, demand for wateris high in the other catchments, particularly in the CNM River system, as this regionsupports profitable cotton and horticulture industries that rely on irrigation supplies.
The initial WAMP did not explicitly cover overland flows, although these water re-sources were counted once they reached defined watercourses. When the initial WAMPwas being implemented, a moratorium was placed on taking water from defined water-courses. This resulted in substantial development (on-farm dams) to capture overlandflows before they reached defined watercourses. In 2002, an additional moratoriumwas placed on the capture of overland flows. When the additional water captured fromoverland flows in the 1999–2002 period is taken into consideration there is very littlewater left as a reserve in the CNM system.
3. Choice Modelling applications
Three CM studies have been conducted to assess the environmental and social impactsof water development in the Fitzroy Basin. Results of these studies have been reportedin a series of research reports. Details and results from Survey One have been reportedin Loch et al. (2002) and Rolfe et al. (2002b). Details and results from Survey Two havebeen reported in Windle and Rolfe (2002a, 2003), and results from Survey Three havebeen reported in Rolfe and Bennett (2003). These CM studies have presented waterdevelopment in terms of a number of associated social and environmental attributes.One of those attributes, ‘amount of water in reserve’, has been framed in terms ofassessing option values.
Choice Modelling involves asking survey respondents to make a series of choicesfrom alternative options for environmental management. Each choice set involves anumber of profiles describing the alternatives on offer. One of the profiles describes acurrent or future status quo option, and remains constant between the choice sets. Theother profiles vary, so that respondents are being asked to make a series of similar, butdifferent choices.
The profiles are made up of a number of attributes that describe the issue in question.For example, profiles about environmental issues in floodplain management might bedescribed in terms of the ‘health of the waterways, the amount of remnant vegetationin good condition on floodplains, and the proportion of stream flows that are reservedfor environmental purposes’. To generate differences between profiles, these attributesare allowed to vary across a number of different levels (e.g., 30, 40 or 50 per cent of
C© Australian Agricultural and Resource Economics Society Inc. and Blackwell Publishing Ltd 2005

Valuing options for reserve water 97
healthy vegetation in floodplains). These profiles then represent different options forfuture development and protection of the issue in question.
The choice information is analysed using a multinomial logistic (MNL) regressionmodel. The probability that a respondent would choose a particular option can berelated to the levels of each attribute making up the profile (and the alternative profileson offer), the socioeconomic characteristics of the respondent, and other factors. Thelatter might include the ways in which the choices are framed to respondents, throughbackground information and structure of the survey, and the way in which the surveysare conducted (Bennett and Blamey 2001; Rolfe et al. 2002a).
The logistic regression function can be used to generate probabilities of choice, andestimates of value (compensating surplus) differences between different choice profiles.Most interest usually lies in finding the difference in value between the status quooption and specific policy relevant profiles. As well as these estimates of value, themodels can also be used to generate estimates of marginal value changes for eachattribute (Rolfe et al. 2000). Known as part-worths, implicit prices, or attribute values,these provide an indication of the value to respondents of each unit change in theprovision of an attribute. Both the part-worth and the compensating surplus estimatescan be used for testing the equivalence of different models. They may also be usedfor transferring values (benefit transfer) to other case studies (Morrison and Bennett2000; Rolfe et al. 2000).
The CM surveys reported in the present paper presented respondents with fourchoice attributes and an associated cost attribute. Four attributes were common toeach survey:
• Payment levy (environmental levy collected annually through rate payments for20 years)
• Amount of healthy vegetation left in floodplains (percentage of original)• Kilometres of waterways in good health• Amount of unallocated water in reserve (percentage above the WRP limits)
In Survey One and Survey Three, the fifth attribute was: ‘people leaving countryareas each year’, while in Survey Two the fifth attribute was ‘protection of Aboriginalcultural heritage sites’. An example of the choice set presented to respondents in SurveyTwo is presented in Figure 2.
The design of a CM study involves several logistical and framing challenges, in termsof condensing key factors into a number of attributes and levels, and then defining anddescribing them concisely to respondents. There are other methodological challengesas well.
Water development trade-offs are typically complex, and can involve both use andnon-use values. For example, water may contribute to recreation choices (use values)and biodiversity support (non-use values). A key challenge was to select attributesthat captured the multifunctionality of water resources, while keeping the choice setsrelevant to the population groups of interest. A small number of attributes was used,to minimise the substitution problems identified by Hoehn (1991). Two attributes weredesigned to elicit existence values (for waterway health and vegetation) separate tothe option value (for keeping water in reserve). The survey was framed to capture
C© Australian Agricultural and Resource Economics Society Inc. and Blackwell Publishing Ltd 2005

98 J. Rolfe and J. Windle
Question X: Options A, B and C.
Please choose the option you prefermost by ticking ONE box.
Fifteen-year effects How much I
pay eachyear
Healthy vegetation leftin floodplains
Kilometres ofwaterways ingood health
Protection ofAboriginal
Cultural sites
Unallocated water
I would choose
Option A
$0 20% 1500 25% 0%
Option B $20 30% 1800 35% 5%
Option C $50 40% 2100 45% 10%
Figure 2 Example choice set used in Survey Two.
non-use values rather than use values, given that the bulk of the population surveyedwas 700 km from the catchment. Two population centres within the catchment werealso surveyed to ascertain if their responses were also driven by use values (e.g., forrecreation purposes).
Another relevant issue for the present study was the possibility that the water reserveattribute was a causal (prior) attribute for the other environmental attributes. If thiswas the case, respondents may rate this attribute more highly because they perceive thatthey will get a range of other associated benefits. Careful consideration was given to theinformation presented to respondents about the water reserve attribute, to ensure it wasassociated with option values, and that it would not be perceived as a causal attributefor other environmental attributes. Focus groups were held to test that informationpresented in the survey was sufficient and framed in the intended context (Loch et al.2001). Post-survey tests for causal attributes were also conducted and details are re-ported in Section 4.
Table 1 displays the description of the water reserve attribute in Survey One.In survey Two, the last statement was modified and three new statements were added
to include issues of relevance to the Aboriginal community (see Table 2).In Survey Three, a briefer description was used (see Table 3).Attention in the present paper focuses on two of the attributes common to each
survey: cost (payment) and water reserve. The attribute levels presented in the differentsurveys are shown in Table 4. In each case, the base level describes the estimatedcondition of the attribute in 20 years time (Survey One and Three) and in 15 years time(Survey Two). The shorter time frame in the second survey resulted from discussionsin focus groups with Aboriginal participants and was considered more realistic giventheir shorter life expectancy.
C© Australian Agricultural and Resource Economics Society Inc. and Blackwell Publishing Ltd 2005

Valuing options for reserve water 99
Table 1 Survey 1: description of water reserve attribute
What does ‘amount of water in reserve’ mean?
Note that some water in the Fitzroy:Is committed to irrigators and townshipsIs reserved to avoid large future environmental problemsThe reserve is the water that has not yet been allocated between those above
The surplus could be allocated now or held. Consider that:Our future demands for water are uncertainKeeping water for the future keeps our options open for either growth or environmental
purposesWater kept in reserve now has environmental benefitsWater used for development now has economic benefitsIt is not clear how accurate our current scientific knowledge is
Table 2 Survey 2: description of water reserve attribute
What does ‘unallocated water’ mean?
Note that some water in the Fitzroy: is already being used and some is allocated toenvironmental flows (see information above). The remainder, approximately 15 per cent oftotal flows, could be allocated now or held in reserve.
Consider that:Water allocated for development has economic benefitsWater kept in reserve has environmental benefitsUnallocated water allows for possible Native Title claimsOur future demands for water are uncertainKeeping water in reserve for the future keeps our options open for either growth or
environmental purposesKeeping water in reserve allows for Indigenous and other groups to develop their interestsKeeping water in reserve allows for more accurate scientific knowledge to be collectedKeeping water in reserve provides a buffer if ecological impacts of development end up being
larger than currently thought
Table 3 Survey 3: description of water reserve attribute
Currently, Fitzroy River Basin water is either allocated to environmental flows (50 per cent) orto irrigators and other users (35%).
The remaining water (15 per cent) is being held in reserve for future options. In the future, itmay be found that more water is required to protect the environment. If the reserve isallocated to irrigation development now, then the flexibility to increase environmental flowin the future is greatly reduced.
3.1 Survey details and results
The same sampling and collection procedure (drop-off/collect from a random sampleof households) was applied in all three surveys. Survey One was conducted in late2000 and populations were sampled from Brisbane (urban centre), Rockhampton(regional centre) and Emerald (regional town). In Rockhampton and Emerald, the
C© Australian Agricultural and Resource Economics Society Inc. and Blackwell Publishing Ltd 2005

100 J. Rolfe and J. Windle
Table 4 Cost (payment) and water reserve attribute levels
CNM Dawsonsubcatchment subcatchment Fitzroy Basin
Base Choice Base Choice Base ChoiceAttribute levels set levels levels set levels levels set levels
Survey OnePayment ($A) 0 10, 20, 50 0 10. 20, 50 0 20, 50, 100Water Reserve (%) 0 –2, 2, 4 0 –5, 5, 10 0 5, 10, 15
Survey TwoPayment ($A) — — — — 0 10, 20, 50, 100Water Reserve (%) — — — — 0 −15, −10, −5, 0,
5, 10, 15, 20†
Survey ThreePayment ($A) — — — — 0 20, 50, 100Water Reserve (%) — — — — 0 4, 8, 12
†The value of 20 per cent is 5 per cent higher than the current reserve level. In the two subcatchment models,the highest reserve level represented the current reserve level. CNM, Comet/Nogoa/Mackenzie; —, notapplicable.
survey focused on the whole Fitzroy Basin. In Brisbane, the survey was split into threeversions that focused on:
• The whole Fitzroy Basin• The Dawson River subcatchment• The CNM subcatchment
In Brisbane, 340 surveys were collected (all three versions); 122 in Rockhamptonand 149 in Emerald. Of all people approached, 50.5 per cent gave back a fully com-pleted survey, 41.5 per cent declined to complete the survey, and 9 per cent of peopleapproached took a survey form and either did not return it to the collector or did notcomplete it fully. There were five choice sets in each survey, which meant 1700, 610 and745 choice sets were completed in Brisbane, Rockhampton and Emerald, respectively.
Survey Two was conducted in late 2001 and populations were sampled from theAboriginal community in Rockhampton, and the general community in both Rock-hampton and Brisbane. From an Aboriginal sample of the Rockhampton area, 63surveys were collected (response rate of 56 per cent); 100 surveys were collected fromthe general community in Rockhampton (response rate of 83 per cent), and 58 sur-veys were collected from Brisbane (response rate of approximately 70 per cent). Therewere eight choice sets in each survey, providing a total of 504, 800 and 464 completedchoice sets from the Rockhampton Aboriginal, Rockhampton general and Brisbanepopulations, respectively.
Survey Three was conducted in mid-2002, and only the Brisbane population wassampled. A total of 168 households were invited to participate, and 98 questionnaireswere completed. Of all people approached, 58.3 per cent gave back a fully completedquestionnaire, while 26.5 per cent of all people approached declined to complete one,and 15.2 per cent of people approached took a questionnaire and either did not returnit to the collector or did not complete it fully. There were eight choice sets in eachsurvey, providing a total of 784 choices sets for the data analysis.
C© Australian Agricultural and Resource Economics Society Inc. and Blackwell Publishing Ltd 2005
Valuing options for reserve water 101
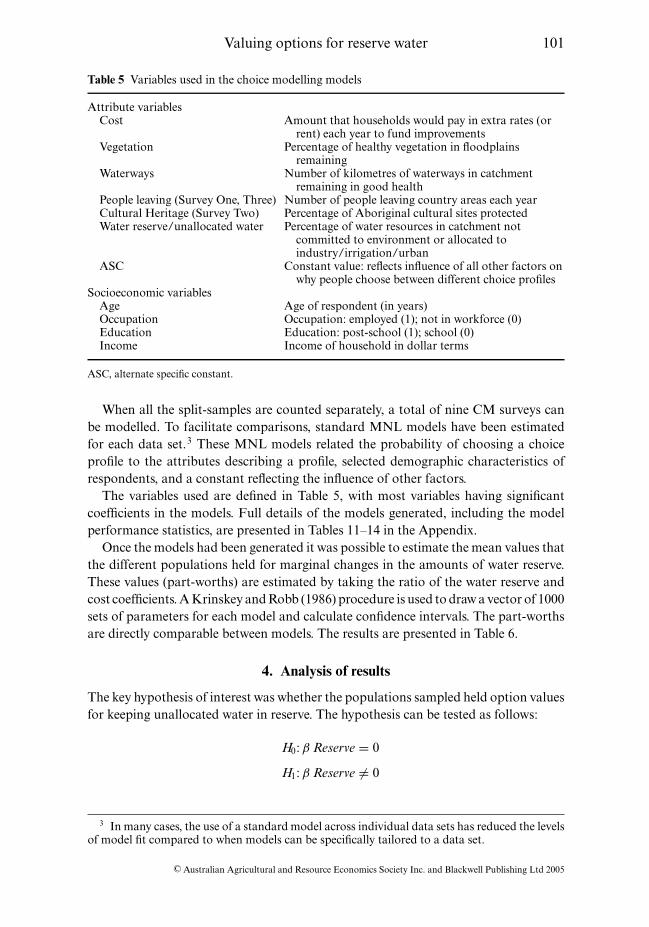
Table 5 Variables used in the choice modelling models
Attribute variablesCost Amount that households would pay in extra rates (or
rent) each year to fund improvementsVegetation Percentage of healthy vegetation in floodplains
remainingWaterways Number of kilometres of waterways in catchment
remaining in good healthPeople leaving (Survey One, Three) Number of people leaving country areas each yearCultural Heritage (Survey Two) Percentage of Aboriginal cultural sites protectedWater reserve/unallocated water Percentage of water resources in catchment not
committed to environment or allocated toindustry/irrigation/urban
ASC Constant value: reflects influence of all other factors onwhy people choose between different choice profiles
Socioeconomic variablesAge Age of respondent (in years)Occupation Occupation: employed (1); not in workforce (0)Education Education: post-school (1); school (0)Income Income of household in dollar terms
ASC, alternate specific constant.
When all the split-samples are counted separately, a total of nine CM surveys canbe modelled. To facilitate comparisons, standard MNL models have been estimatedfor each data set.3 These MNL models related the probability of choosing a choiceprofile to the attributes describing a profile, selected demographic characteristics ofrespondents, and a constant reflecting the influence of other factors.
The variables used are defined in Table 5, with most variables having significantcoefficients in the models. Full details of the models generated, including the modelperformance statistics, are presented in Tables 11–14 in the Appendix.
Once the models had been generated it was possible to estimate the mean values thatthe different populations held for marginal changes in the amounts of water reserve.These values (part-worths) are estimated by taking the ratio of the water reserve andcost coefficients. A Krinskey and Robb (1986) procedure is used to draw a vector of 1000sets of parameters for each model and calculate confidence intervals. The part-worthsare directly comparable between models. The results are presented in Table 6.
4. Analysis of results
The key hypothesis of interest was whether the populations sampled held option valuesfor keeping unallocated water in reserve. The hypothesis can be tested as follows:
H0: β Reserve = 0
H1: β Reserve �= 0
3 In many cases, the use of a standard model across individual data sets has reduced the levelsof model fit compared to when models can be specifically tailored to a data set.
C© Australian Agricultural and Resource Economics Society Inc. and Blackwell Publishing Ltd 2005

102 J. Rolfe and J. Windle
Table 6 Mean part-worths and confidence intervals for the water reserve attribute
Population Fitzroy CNM Dawson
Survey One 2000 Brisbane 1.52 (0.22–2.81)† 9.36 (5.15–15.65) 2.24 (1.49–3.17)Rockhampton 1.43 (not significant)Emerald 2.20 (0.71–3.71)
Survey Two 2001 Brisbane 3.19 (1.79–5.32)Rockhampton 2.95 (1.93–4.35)Rockhampton 3.86 (2.02–6.73)
AboriginalSurvey Three 2002 Brisbane 5.77 (3.20–8.85)
†The values in parenthesis are confidence intervals. CNM, Comet/Nogoa/Mackenzie.
where β Reserve is the parameter vector corresponding to the water reserve/unallocated water attribute in the surveys.
The results of the surveys indicate that Reserve was always a significant variable inthe models, except for the 2000 Rockhampton survey for the Fitzroy. In all surveyswhere the attribute was significant, it was signed as expected (positive); indicating thatsurvey respondents preferred increased amounts of the attribute. Therefore, the nullhypothesis can be rejected; the evidence suggests that the populations of interest dohold option values in relation to Fitzroy water resources.
The results in Table 6 suggest that Brisbane respondents are prepared to pay$A9.36 for each 1 per cent of water reserve in the CNM system. Survey respondentswere informed that current reserves in the CNM system (the 40 000 ML identifiedin the Fitzroy WRP) equated to approximately 4 per cent of the system. Therefore,Brisbane households, on average, would pay approximately 4 times the amount above,or $A37.44 per annum, to preserve the entire 40 000 ML. For the Dawson system, re-spondents were willing to pay $A2.24 to preserve each 1 per cent of water reserve. Thetotal reserves in the Dawson were nominated as being 10 per cent of water resources inthe valley. This means that the value of preserving all of that reserve was $A22.40 perhousehold per year. For the Fitzroy system, respondents were willing to pay $A1.52 topreserve each 1 per cent of water reserve. The total reserves in the Fitzroy were nom-inated as being 15 per cent of water resources in the basin. This means that the valueof preserving all of that reserve was $A22.80 per household per year.
Total willingness to pay was approximately equivalent across the Fitzroy andDawson catchments, but the values were much higher in the CNM valley where therewere smaller reserves of water. As expected, this implies that marginal values appearto be higher as reserves become diminished.
To assess whether there are significant differences between the part-worths for thedifferent populations and over the different time periods, a Poe et al. (2001) simpleconvolutions process was followed. A Krinskey and Robb (1986) procedure was usedto draw a vector of 1000 sets of parameters for each model, and part-worths werecalculated for each set of parameters. Differences between part-worths were calculatedby taking one vector of part-worths from another. This process is repeated 100 timesby randomly reordering one vector of parameters. The 95 per cent confidence interval
C© Australian Agricultural and Resource Economics Society Inc. and Blackwell Publishing Ltd 2005

Valuing options for reserve water 103
Table 7 Proportion of part-worth differences for the reserve attribute falling below zero
Survey One 2000 Brisbane (Fitzroy, CNM)∗ Brisbane (Fitzroy, Dawson)0.99999 0.81858
Survey One 2000 Brisbane, Emerald Brisbane (CNM, Dawson)∗
0.75536 1Survey Two 2001 Brisbane, Rockhampton general Brisbane, Rockhampton Aboriginal
0.42613 0.66503Survey Two 2001 Rock general, Rock Aboriginal Brisbane 2001, Brisbane 2000
0.73819 0.05204Survey Three 2002 Brisbane 2002, Brisbane 2001 Brisbane 2002, Brisbane 2000
0.05669 0.0015
∗Denotes significance at the 5 per cent level. CNM, Comet/Nogoa/Mackenzie.
is approximated by identifying the proportion of differences that fall below zero. Theresults are presented in Table 7.
These results indicate that significant differences only occur between the Brisbane2000 values for CNM subcatchment and the Dawson and Fitzroy systems. There isno significant difference between the different populations surveyed in 2000 or 2001.There is a difference between the Brisbane 2002 and Brisbane 2000 part-worths for theFitzroy Basin, with values increasing over the 3-year period (Table 6).4
In all of the surveys, considerable attention was paid to framing the information sup-plied. One problem that was considered was the potential for respondents to link thereserve attribute with waterway health. It was possible that some respondents viewedkeeping more water in reserve as a causal attribute for waterway health, and may haveplaced more emphasis on the reserve attribute to achieve higher levels of waterwayhealth. To test whether prior causality was a significant influence, an interaction vari-able, which combined the results for waterways and reserve, was added and new MNLmodels were run. The results are presented in Table 8.
The interaction variable was significant in three out of the nine models, indicatingthat some causality may have been present. However, the size of the coefficient wasvery small, indicating that the impact of causality was negligible.
5. Should water be reserved rather than allocated?
Once the value that people hold for keeping water in reserve has been established,it is possible to make a tentative assessment on whether to keep water in reserve orallocate it for development. In other words, do the values people have for keepingwater in reserve outweigh the economic gains that can be made if the water is allocatedto development? These assessments are made in relation to the values held by theBrisbane population for the water reserve in the three different catchment areas, usinginformation collected in the first survey. In order to extrapolate values from a sampleto the whole population there are four important issues to consider:
4 It is possible that this difference was caused by the slight changes in the way that the reserveattribute was described.
C© Australian Agricultural and Resource Economics Society Inc. and Blackwell Publishing Ltd 2005

104 J. Rolfe and J. Windle
Table 8 The significance of interactions between the waterways and reserve attributes
Waterways/reserve Coefficient Standard error Significance
Survey One 2000Dawson −0.00007 0.0002 Not significant at 10% levelCNM −0.00007 0.00008 Not significant at 10% levelFitzroy/Brisbane −0.00009 0.00004 Significant at 5% levelEmerald −0.00005 0.00003 Not significant at 10% levelRockhampton 0.000003 0.00003 Not significant at 10% level
Survey Two 2001Rockhampton Aboriginal −0.00004 0.00003 Not significant at 10% levelRockhampton general 0.00005 0.00002 Significant at 5% levelBrisbane −0.000005 0.00003 Not significant at 10% level
Survey Three 2002Brisbane 0.0003 0.0001 Significant at 5% level
CNM, Comet/Nogoa/Mackenzie.
• How should the values of non-respondents be treated?• How far does the population extend?• Do the socioeconomic characteristics of the sample match those of the population• What is the appropriate discount rate?
The first issue to consider is that of non-response bias: do the people who declined toanswer the survey hold the same values as those who responded? The lowest responserate in any of the surveys and places was 50 per cent, which means that in some placesup to half the sample population did not respond. Various authors have suggesteddifferent ways of assessing the preferences of the non-response sample (Morrison2000). No information was collected on the reasons why people did not respond, butin a CM valuation of a major wetland area Morrison (2000) reported that 30 per centof non-responses were a result of people being too busy, and these preferences weretreated as being the same as those in the survey sample. For the purposes of the presentpaper, it will be assumed that 30 per cent of the households that did not respond to thesurvey hold the same preferences as those in the sample survey.
The second issue is how broadly can these values be extrapolated? Three popula-tions were surveyed in the first survey: Brisbane, the state capital, and Emerald andRockhampton, two local regional communities. Clearly the values of the whole Bris-bane population can be included, but to what extent can the values of the rest ofthe state population be included? The values held by the Emerald community weresignificant and although Rockhampton values were not significant in 2000, they werein 2001 (Table 6). There was no significant difference between the values held by theBrisbane and Emerald communities in 2000 and between Brisbane and Rockhamptonin 2001 (Table 7). In the present paper, a conservative approach to extrapolation will beadopted. The values of people outside the state will not be included. Within the state,only the values of the Fitzroy region (approximately 5 per cent of the state population,or 63 000 households) and the Brisbane community (approximately 26 per cent of thestate population, or 330 000 households) will be estimated.
C© Australian Agricultural and Resource Economics Society Inc. and Blackwell Publishing Ltd 2005
Valuing options for reserve water 105
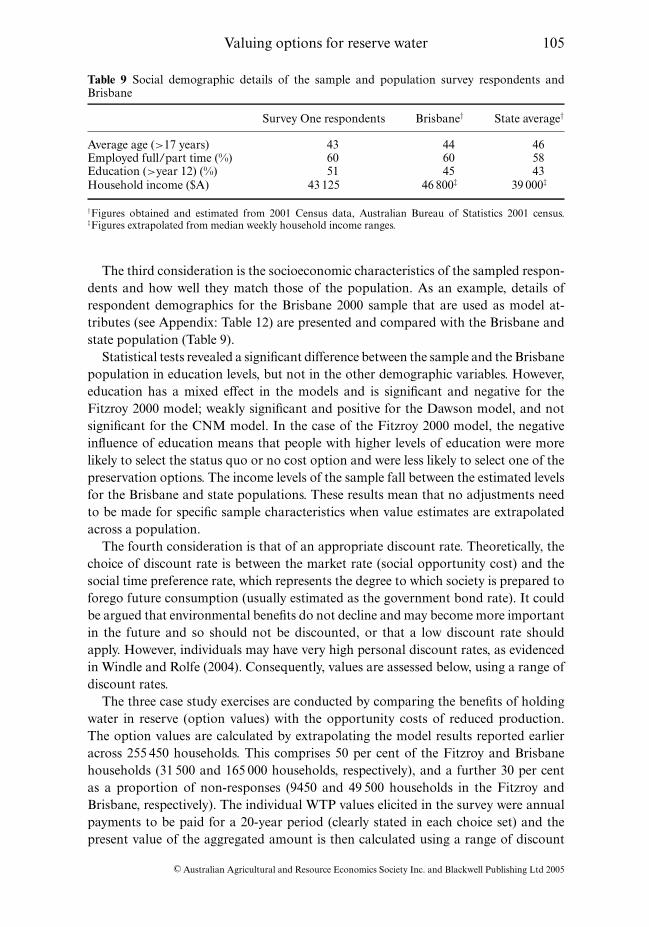
Table 9 Social demographic details of the sample and population survey respondents andBrisbane
Survey One respondents Brisbane† State average†
Average age (>17 years) 43 44 46Employed full/part time (%) 60 60 58Education (>year 12) (%) 51 45 43Household income ($A) 43 125 46 800‡ 39 000‡
†Figures obtained and estimated from 2001 Census data, Australian Bureau of Statistics 2001 census.‡Figures extrapolated from median weekly household income ranges.
The third consideration is the socioeconomic characteristics of the sampled respon-dents and how well they match those of the population. As an example, details ofrespondent demographics for the Brisbane 2000 sample that are used as model at-tributes (see Appendix: Table 12) are presented and compared with the Brisbane andstate population (Table 9).
Statistical tests revealed a significant difference between the sample and the Brisbanepopulation in education levels, but not in the other demographic variables. However,education has a mixed effect in the models and is significant and negative for theFitzroy 2000 model; weakly significant and positive for the Dawson model, and notsignificant for the CNM model. In the case of the Fitzroy 2000 model, the negativeinfluence of education means that people with higher levels of education were morelikely to select the status quo or no cost option and were less likely to select one of thepreservation options. The income levels of the sample fall between the estimated levelsfor the Brisbane and state populations. These results mean that no adjustments needto be made for specific sample characteristics when value estimates are extrapolatedacross a population.
The fourth consideration is that of an appropriate discount rate. Theoretically, thechoice of discount rate is between the market rate (social opportunity cost) and thesocial time preference rate, which represents the degree to which society is prepared toforego future consumption (usually estimated as the government bond rate). It couldbe argued that environmental benefits do not decline and may become more importantin the future and so should not be discounted, or that a low discount rate shouldapply. However, individuals may have very high personal discount rates, as evidencedin Windle and Rolfe (2004). Consequently, values are assessed below, using a range ofdiscount rates.
The three case study exercises are conducted by comparing the benefits of holdingwater in reserve (option values) with the opportunity costs of reduced production.The option values are calculated by extrapolating the model results reported earlieracross 255 450 households. This comprises 50 per cent of the Fitzroy and Brisbanehouseholds (31 500 and 165 000 households, respectively), and a further 30 per centas a proportion of non-responses (9450 and 49 500 households in the Fitzroy andBrisbane, respectively). The individual WTP values elicited in the survey were annualpayments to be paid for a 20-year period (clearly stated in each choice set) and thepresent value of the aggregated amount is then calculated using a range of discount
C© Australian Agricultural and Resource Economics Society Inc. and Blackwell Publishing Ltd 2005

106 J. Rolfe and J. Windle
Table 10 Production returns from additional water allocations in the Fitzroy Basin
Values where Average acrossValues where existing farms operations
Model farm new farms increase assumingModel farm irrigation developed operations 6 ML/ha
Location size (ha) area (ha) ($A/ha) $A/ha (unit: $A/ML)
Upper Comet 3845 249 802 2386 266Lower Comet 1370 213 2738 4413 596Upper Mackenzie 892 267 5574 6512 1007Dawson 1127 332 2419 3513 494Lower Fitzroy 1000 115 1686 3934 468
ML, megalitre.
rates (6 per cent, 8 per cent and 12 per cent). The total estimated value for the threeriver systems are described in detail below.
The production benefits available from further water harvesting in the Fitzroy Basinwere assessed by Donnett (1998), using a sample of irrigation properties in each catch-ment. Properties were typically mixed enterprises, with further areas available fordevelopment. Donnett (1998) estimated values from increased water harvesting wheretwo separate scenarios were modelled. The first scenario was where further waterallocations were used to develop new farms (of similar sizes to the existing ones),and the second scenario was where further water allocations were used to expand andintensify water use on existing farms. Production and cost data from the irrigationproperties were used to model returns under different water supply scenarios.
Water supplies were modelled using 95 years of available hydrological data. In eachdata run, net returns from further irrigation development over 30-year periods wereassessed, and then averaged across the number of hydrological patterns modelled. Theresults indicated the expected returns from further water harvesting over the longerterm when variability in streamflow in different sections of the basin was taken intoaccount. In the results, net farm income was averaged to identify the net returns perhectare irrigated.
Results from Donnett (1998) are summarised in Table 10, where estimated returnsper hectare have been modelled over 30 years of operation and a net present valueanalysis applied. Estimated returns per megalitre are also shown. The returns havebeen averaged across the two scenarios using a base application rate of 6 ML perhectare. The results show that returns range from $A266/ML in the upper Comet to$A1007/ML in the upper Mackenzie. The average across the combined upper andlower Comet and Mackenzie systems is $A623/ML. This value will be used in theassessment of production benefits for the CNM River system outlined below. A valueof $A494/ML is used for the Dawson system and $A468/ML for the Fitzroy system.
5.1 Values in the Comet/Nogoa/Mackenzie system
Survey respondents indicated that their households, on average, were willing to pay$A9.36 per annum to preserve each 1 per cent of water reserve in the CNM system or
C© Australian Agricultural and Resource Economics Society Inc. and Blackwell Publishing Ltd 2005

Valuing options for reserve water 107
approximately $A37.44 per annum, to preserve the entire 4 per cent (40 000 ML) ofunallocated water in the CNM system. This payment stream was converted to presentvalue terms, and extrapolated to a total of 255 450 households. This payment streamamounted to $A109.70m, $A93.90m and $A71.44m using a 6 per cent, 8 per cent,and 12 per cent discount rate, respectively, over a 20-year period. If WTP values arecalculated based on the lower ($A5.15) and upper ($A15.65) bounds (Table 6) anda 6 per cent discount rate is applied, the payment stream amounts to $A60.36m and$A183.42m, respectively.
These preservation values can be compared to the production benefits that allocatingthe water might generate. These have been estimated from the work of Donnett (1998)at approximately $A623/ML. If the whole 40 000 ML were to be valued at approxi-mately $623/ML, the net present value of the production benefits can be calculated atapproximately $A25m.
It appears that, on the preliminary figures at least, the option values outweighthe potential production benefits from allocating more water in the CNM system.There may be particular situations where further allocations of water have positivesocial outcomes without many environmental losses, in which case there may be somejustification for allocating more reserve. However, some environmental consequencesfrom allocating more water would normally be expected. This means that in mostcases there would appear to be more value in reserving the 40 000 ML of water in theCNM system than allocating it to irrigation. This does not preclude it from futureuse; the value expressed is to keep it as a backup so that the options for using it forenvironmental or development purposes remain open.
5.2 Values in the Dawson system
Survey respondents indicated that their households were willing to pay $A2.24 topreserve each 1 per cent of water reserve in the Dawson system. The lower part-worthvalues for the water reserve in the Dawson system reflect the larger amounts of waterthat are potentially available for irrigation in the valley. There is effectively a larger gapbetween the 50 per cent set for environmental flows and the amount currently allocated(excluding the provision for the Nathan Dam) than is the case in the CNM. Becausethere is a larger amount effectively in reserve at this point compared to the CNM, thevalue of each 1 per cent loss in water reserve is lower.
The total reserves in the Dawson were nominated as being 10 per cent of waterresources in the valley. This means that the value of preserving all of that reserve was$A22.40 per household per year. This translates into a present value of $A65.63m,$A56.18m, and $A42.74m at a 6 per cent, 8 per cent, and 12 per cent discount rate,respectively, over a 20-year period. If WTP values are calculated based on the lower($A1.49) and upper ($A3.17) bounds (Table 6) and a 6 per cent discount rate is applied,the payment stream amounts to $A43.66m and $A92.88m, respectively.
Under the Fitzroy WRP, 190 000 ML of water supply is reserved for the NathanDam, and a further 11 500 ML of supply remains unallocated in the Upper Dawsonregion. At $A494/ML, the 201 500 ML of extracted water indicates that the totaleconomic benefit from irrigation is approximately $A99m. These preliminary values
C© Australian Agricultural and Resource Economics Society Inc. and Blackwell Publishing Ltd 2005

108 J. Rolfe and J. Windle
suggest that the development of the Nathan Dam may create economic value evenafter option values have been considered. However, there may be marginal effectsto consider across the full volume of additional supply, particularly where there aredeclining qualities of agricultural land available for irrigation expansion.
5.3 Values in the whole Fitzroy system
Respondents in Brisbane indicated that their households were willing to pay $A1.52 topreserve each 1 per cent of water reserve in the whole Fitzroy system. The total reservesin the Fitzroy were nominated as being 15 per cent of water resources in the basin. Thismeans that the value of preserving all of that reserve was $A22.80 per household peryear. The net present value of these payments, for 255 450 households, over a 20-yearperiod, is $A66.80m, $A57.18m and $A43.50m, respectively, for a discount rate of6 per cent, 8 per cent and 12 per cent, respectively.
If WTP values are calculated based on the lower ($A0.22) and upper($A2.81) bounds (Table 6) and a 6 per cent discount rate is applied, the paymentstream amounts to $A9.67m and $A123.50m, respectively. If the WTP values are ex-trapolated to account for all households in the Brisbane and Fitzroy population, thepayment stream amounts to $A102.78m and ranges from $A14.88m to $A190.00m.When all households in Queensland are included, then the payment stream totals$A329.77m and ranges from $A47.73m to $A609.64m.
Under the Fitzroy WRP, a total of 544 800 ML of annual supply is identified. Ata net economic value of $A468/ML, the economic value of additional water use isapproximately $A254m. This suggests that room for development remains even afteroption values have been considered. It is only when the WTP values are extrapolatedto include the whole state population that the option values start to outweigh theeconomic benefits of development. Again, there may be important marginal effects toconsider, particularly where the use of unallocated water is limited by the supply ofsuitable land.
5.4 Issues in extrapolating the option values
There are two potential reasons why the option values estimated in the above examplesmay be too high. The first is that future establishment of water trading mechanisms maymake it relatively easy in the future to divert water back for environmental purposes.Allocations can be simply purchased in the market place, and effectively added toenvironmental flows. The survey results indicate that respondents place a high optionvalue on preserving environment assets associated with the Fitzroy system. High valueshave been generated for the water reserve attribute, because this is the vehicle that wasgiven for expressing those sentiments. If those options can be maintained withoutholding some or all of the water in reserve, then it is not clear that the values cancontinue to be associated with reserving water.
The second reason why some caution needs to be exercised in interpreting the optionvalues for the water reserve attribute is that respondents may not have fully understoodthe distinction between water already committed to the environment (approximately
C© Australian Agricultural and Resource Economics Society Inc. and Blackwell Publishing Ltd 2005

Valuing options for reserve water 109
50 per cent of median flow amounts), and the surplus unallocated water. If respondentsinterpreted the water reserve attribute as the only way of holding water back forenvironmental purposes, then they may place greater importance on the attributethan is warranted. The survey design, labels and explanation sections were focused onavoiding this problem, but the possibility that it may have influenced resulting valuesshould still be recognised.
6. Conclusion
The experiment results presented in the present paper represent one approach to theestimation of option values as a separate component of non-use values. By describ-ing the retention of water in reserve as an available option in the CM experiments,the intention was to specify preference trade-offs and, hence, values, for an optionvalue concept. However, there were a number of practical and theoretical issues thatmade it difficult to demarcate the attribute clearly in this way.
One issue was that the holding of water in reserve may have generated other useand non-use values apart from the option value. For example, water kept in reservemay have current benefits for recreation and environmental goals apart from main-taining options for future development/preservation choices. Another issue was thatoption values may not be independent from other use and non-use values. For exam-ple, respondents with higher recreation and/or biodiversity protection values might beexpected to hold higher option values. These issues were partly tested by conductingsome versions of the experiments within the catchment (where recreation and otheruse values might be important), and others outside the catchment (where recreationand other direct uses are not possible). There were no differences identified for thereserve values held by population samples within or outside of the catchment, imply-ing that those values were at least independent from use values. This provides somejustification for defining the values estimated as option values rather than optionprices.
An associated problem with this issue of potential substitutability between valuesfor reserve water and values for other environmental goods was that reserve water mayact as a causally prior attribute. This is the situation where some respondents mightchoose higher levels of the reserve attribute in the expectation that there would besubsequent benefits for waterway health and other environmental goals. Tests for thiswere conducted by identifying significant interactions between the reserve and water-ways attributes in the different models, with mixed results. In some cases interactionswere significant but minor, implying that causality might have been present but hadnegligible impact.
Results from the different surveys indicated that option values did display significantmarginal effects. In the CNM system, where there are existing high levels of develop-ment, the marginal values for the option of keeping water in reserve were significantlyhigher than values in the other subcatchment or the whole catchment where there weresubstantial amounts of unallocated water.
However, the experiment results and extrapolation into policy situations also demon-strated the potential problems that occur when multicomponent situations are valued
C© Australian Agricultural and Resource Economics Society Inc. and Blackwell Publishing Ltd 2005
110 J. Rolfe and J. Windle
separately. Values for reserving water in the Fitzroy, Dawson and CNM systems wereestimated separately, even though the latter two are subcatchments of the former.When the total reserve values were estimated for each catchment, the values for thewhole catchment were similar to one subcatchment (Dawson), and much lower for theother (CNM). This demonstrates the arguments of Hoehn and Randall (1989) thatpart-whole estimation problems can seriously influence the conduct of benefit–costtests.
It is possible that the option values used in the benefit–cost exercises were overstatedbecause of these substitution effects and part-whole estimation problems. However, theresults indicate that option values may be high enough to reserve water in the CNMsystem even if the values were overstated by a factor of three. In contrast, there are netbenefits in allowing further economic development in the Dawson subcatchment andthe Fitzroy system as a whole.
References
Adamowicz, W., Boxall, P., Williams, M. and Louviere, J. (1998). Stated preference approachesfor measuring passive use values: choice experiments and contingent valuation, AmericanJournal of Agricultural Economics 80, 64–75.
Arrow, K.J. and Fisher, A.C. (1974). Environmental preservation, uncertainty, and irreversibil-ity, Quarterly Journal of Economics 88, 312–319.
Bennett, J.W. and Blamey, R.K. (2001). The Choice Modelling Approach to Environmental Valu-ation. Edward Elgar Publishing, Cheltenham.
Bishop, R. (1982). Option value: an exposition and extension, Land Economics 58, 1–15.Chevas, J.P. and Mullarkey, D. (2002). On the valuation of uncertainty in welfare analysis,
American Journal of Agricultural Economics 84, 23–38.Donnett, R. (1998). Potential Economic Benefits from Additional Private Water Harvesting De-
velopment in Central Queensland, Report prepared for the Department of Natural Resources.Queensland Government, Brisbane.
Freeman, A.M. (2003). The Measurement of Environmental and Resource Values. Theory andMethods, 2nd edn. Resources for the Future, Washington, DC.
Hanley, N. and Spash, C. (1993). Cost–Benefit Analysis and the Environment, Edward ElgarPublishing, Cheltenham.
Hanley, N., Wright, R. and Adamowicz, W. (1998). Using choice experiments to value theenvironment: design issues, current experience, and future prospects, Environmental ResourceEconomics 3–4, 413–428.
Hoehn, J.P. (1991). Valuing the multidimensional impacts of environmental policy: theory andmethods, American Journal of Agricultural Economics 73, 289–299.
Hoehn, J.P. and Randall, A. (1989). Too many proposals pass benefit cost test, American Eco-nomic Review 79, 544–551.
Krinskey, I. and Robb, A. (1986). On approximating the statistical properties of elasticities,Review of Economics and Statistics 68, 715–719.
Langford, I.H., Kontogianni, A., Skourtos, M.S., Georgiou, S. and Bateman, I.J. (1998). Mul-tivariate mixed models for open-ended contingent valuation data – willingness to pay forconservation of monk seals, Environmental and Resource Economics 12, 443–456.
Loch, A., Rolfe, J. and Bennett, J. (2002). Scale Effects and Their Importance for Benefit Transferof Natural Resource Values in the Fitzroy Basin, Valuing Floodplain Development in the FitzroyBasin, Research report no. 5. Central Queensland University, Emerald.
Loch, A., Rolfe, J. and Windle, J. (2001). Using Focus Groups to Design Choice ModellingValuation Frameworks for Floodplain Development, Valuing Floodplain Development in theFitzroy Basin, Research report no. 3. Central Queensland University, Emerald.
C© Australian Agricultural and Resource Economics Society Inc. and Blackwell Publishing Ltd 2005

Valuing options for reserve water 111
Morrison, M. (2000). Aggregation biases in stated preference studies, Australian EconomicPapers 39, 215–230.
Morrison, M.D. and Bennett, J.W. (2000). Choice modelling, non-use values and benefit transfer,Economic Analysis and Policy 30, 13–32.
Morrison, M.D., Blamey, R.K., Bennett, J.W. and Louviere, J.J. (1996). Comparison of StatePreference Techniques for Estimating Environmental Values. Choice modelling research reportno. 1. The University of New South Wales, Canberra.
Poe, G.L., Giraud, K.L. and Loomis, J.B. (2001). Simple Computational Methods for Measuringthe Differences of Empirical Distributions: Application to Internal and External Scope Testsin Contingent Valuation, Staff paper 2001–2005. Department of Agricultural, Resource andManagerial Economics, Cornell University, Ithaca, NY.
Productivity Commission. (2003). Industries, Land Use and Water Quality in the Great BarrierReef Catchment, Research report, Australian Government, Canberra.
QDNR (Queensland Department of Natural Resources). (1999). Water Allocation and Manage-ment Plan (Fitzroy Basin) 1999 (WAMP). Queensland Department of Natural Resources,Brisbane.
QDNRM (Queensland Department of Natural Resources and Mines). (2003). Water Allocationand Management (Fitzroy Basin) Amendment Plan 2003. Queensland Department of NaturalResources and Mines, Brisbane.
Rolfe, J. and Bennett, J. (2003). WTP and WTA in relation to irrigation development in theFitzroy Basin, Queensland, Valuing Floodplain Development in the Fitzroy Basin. Researchreport no. 7. Central Queensland University, Emerald.
Rolfe, J.C., Bennett, J.W. and Louviere, J.J. (2000). Choice modelling and its potential applicationto tropical rainforest preservation, Ecological Economics 35, 289–302.
Rolfe, J.C., Bennett, J.W. and Louviere, J.J. (2002a). Stated values and reminders of substitutegoods: testing for framing effects with choice modelling, Australian Journal of Agriculturaland Resource Economics 46, 1–20.
Rolfe, J., Loch, A. and Bennett, J. (2002b). Tests of benefit transfer across sites and populationin the Fitzroy Basin. Valuing Floodplain Development in the Fitzroy Basin. Research reportno. 4. Central Queensland University, Emerald.
Shogren, J. and Crocker, T. (1990). Adaptation and the option value of uncertain environmentalresources, Ecological Economics 2, 301–310.
State of Queensland and Commonwealth of Australia. 2003, Reef Water Quality ProtectionPlan for Catchments Adjacent to the Great Barrier Reef World Heritage Area, QueenslandDepartment of Premier and Cabinet, Brisbane.
Walsh, R.G., Loomis, J.B. and Gillman, R.A. (1984). Valuing option, existence and bequestdemands for wilderness, Land Economics 60, 14–29.
Weisbrod, B. (1964). Collective consumption services of individual-consumption goods, Quar-terly Journal of Economics 78, 471–477.
Windle, J. and Rolfe, J. (2002a). Assessing indigenous values associated with water resourcesand floodplain development, Valuing Floodplain Development in the Fitzroy Basin. Researchreports no. 6, June 2002. Central Queensland University, Emerald.
Windle, J. and Rolfe, J. (2002b). Natural Resource Management and the Protection of AboriginalCultural Heritage. Institute for Sustainable Regional Development, occasional paper 5/2002.Central Queensland University, Rockhampton.
Windle, J. and Rolfe, J. (2003). Valuing Aboriginal cultural heritage sites in central Queensland,Australian Archaeology 56, 35–41.
Windle, J. and Rolfe, J. (2004). Assessing Values for Estuary Protection Using Different PaymentMechanisms in the Choice Modelling Technique. Paper presented at the Australian Agriculturaland Resource Economics Society 48th Annual Conference, Melbourne, Australia, 11–13February 2004.
C© Australian Agricultural and Resource Economics Society Inc. and Blackwell Publishing Ltd 2005
112 J. Rolfe and J. Windle
Appendix
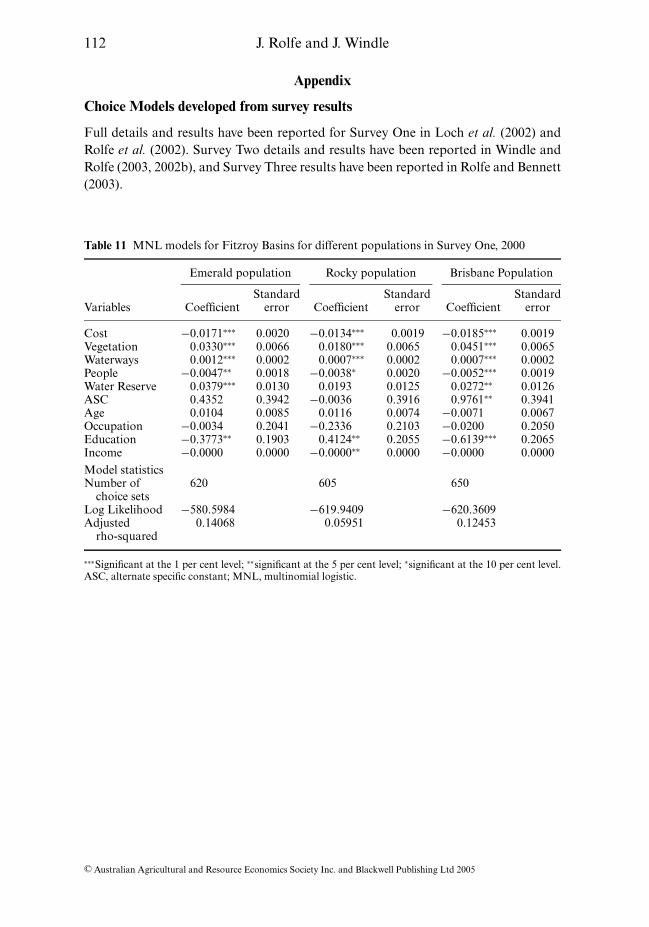
Choice Models developed from survey results
Full details and results have been reported for Survey One in Loch et al. (2002) andRolfe et al. (2002). Survey Two details and results have been reported in Windle andRolfe (2003, 2002b), and Survey Three results have been reported in Rolfe and Bennett(2003).
Table 11 MNL models for Fitzroy Basins for different populations in Survey One, 2000
Emerald population Rocky population Brisbane Population
Standard Standard StandardVariables Coefficient error Coefficient error Coefficient error
Cost −0.0171∗∗∗ 0.0020 −0.0134∗∗∗ 0.0019 −0.0185∗∗∗ 0.0019Vegetation 0.0330∗∗∗ 0.0066 0.0180∗∗∗ 0.0065 0.0451∗∗∗ 0.0065Waterways 0.0012∗∗∗ 0.0002 0.0007∗∗∗ 0.0002 0.0007∗∗∗ 0.0002People −0.0047∗∗ 0.0018 −0.0038∗ 0.0020 −0.0052∗∗∗ 0.0019Water Reserve 0.0379∗∗∗ 0.0130 0.0193 0.0125 0.0272∗∗ 0.0126ASC 0.4352 0.3942 −0.0036 0.3916 0.9761∗∗ 0.3941Age 0.0104 0.0085 0.0116 0.0074 −0.0071 0.0067Occupation −0.0034 0.2041 −0.2336 0.2103 −0.0200 0.2050Education −0.3773∗∗ 0.1903 0.4124∗∗ 0.2055 −0.6139∗∗∗ 0.2065Income −0.0000 0.0000 −0.0000∗∗ 0.0000 −0.0000 0.0000
Model statisticsNumber of 620 605 650
choice setsLog Likelihood −580.5984 −619.9409 −620.3609Adjusted 0.14068 0.05951 0.12453
rho-squared
∗∗∗Significant at the 1 per cent level; ∗∗significant at the 5 per cent level; ∗significant at the 10 per cent level.ASC, alternate specific constant; MNL, multinomial logistic.
C© Australian Agricultural and Resource Economics Society Inc. and Blackwell Publishing Ltd 2005

Valuing options for reserve water 113
Table 12 MNL models for CNM, Dawson and Fitzroy Sites (Brisbane population) in SurveyOne, 2000
CNM Dawson Fitzroy†Standard Standard Standard
Variables Coefficient error Coefficient error Coefficient error
Cost −0.0195∗∗∗ 0.0042 −0.0303∗∗∗ 0.0039 −0.0185∗∗∗ 0.0019Vegetation 0.0451∗∗∗ 0.0087 0.0278∗∗∗ 0.0062 0.0451∗∗∗ 0.0065Waterways 0.0028∗∗∗ 0.0005 0.0021∗∗∗ 0.0004 0.0007∗∗∗ 0.0002People −0.0124∗∗∗ 0.0034 −0.0039∗∗ 0.0019 −0.0052∗∗∗ 0.0019Water reserve 0.1756∗∗∗ 0.0318 0.0667∗∗∗ 0.0104 0.0272∗∗ 0.0126ASC 0.6198 0.4668 0.1648 0.4434 0.9761∗∗ 0.3941Age −0.0055 0.0072 −0.0021 0.0067 −0.0071 0.0067Occupation −0.5220∗∗ 0.2411 −0.0742 0.2303 −0.0200 0.2050Education −0.1656 0.2694 0.3356∗ 0.2011 −0.6139∗∗∗ 0.2065Income 0.0000 0.0000 −0.0000∗∗ 0.0000 −0.0000 0.0000
Model statisticsNumber of 435 605 650
choice setsLog likelihood −389.4536 −572.7126 −620.3609Adjusted 0.17559 0.13116 0.12453
rho-squared
†These results are the same as for the Brisbane population in Table 11 above. ∗∗∗Significant at the 1 percent level; ∗∗significant at the 5 per cent level; ∗significant at the 10 per cent level. ASC, alternate specificconstant; CNM, Comet/Nogoa/Mackenzie; MNL, multinomial logistic.
Table 13 MNL models for the Indigenous and general communities in Survey Two, 2001
Rocky Rockhampton BrisbaneIndigenous community general community general community
Standard Standard StandardVariables Coefficient error Coefficient error Coefficient error
Cost −0.0093∗∗∗ 0.0021 −0.0126∗∗∗ 0.0018 −0.0125∗∗∗ 0.0023Vegetation 0.0036 0.0064 0.0270∗∗∗ 0.0056 0.0304∗∗∗ 0.0073Waterways 0.0005∗ 0.0003 0.0006∗∗ 0.0002 0.0007∗∗ 0.0003Cultural Heritage 0.0300∗∗∗ 0.0066 −0.0252∗∗∗ 0.0055 −0.0159∗∗ 0.0071Water Reserve 0.0337∗∗∗ 0.0066 0.0361∗∗∗ 0.0055 0.0384∗∗∗ 0.0073ASC −0.3525 0.4317 0.0357 0.3425 −1.2773∗∗∗ 0.4939Age −0.0268∗∗∗ 0.0086 −0.0095∗ 0.0057 0.0124∗ 0.0074Education −0.0489 0.2460 0.3509∗ 0. 1849 0.5020∗∗ 0.2441Income 0.0000∗∗∗ 0.0000 0.0000∗∗∗ 0.0000 0.0000∗∗∗ 0.0000
Model StatisticsN (choice sets) 488 704 408Log L −478.8394 −681.3383 −394.3468Adjusted 0.09853 0.11339 0.11041
rho-squared
∗∗∗Significant at the 1 per cent level; ∗∗significant at the 5 per cent level; ∗significant at the 10 per cent level.ASC, alternate specific constant; MNL, multinomial.
C© Australian Agricultural and Resource Economics Society Inc. and Blackwell Publishing Ltd 2005

114 J. Rolfe and J. Windle
Table 14 MNL models for Brisbane community in Survey Three, 2002
Coefficient Standard error
Cost −0.0172∗∗∗ 0.0021Vegetation 0.0493∗∗∗ 0.0156Waterways 0.0010∗∗ 0.0004People leaving −0.0152∗∗ 0.0074Water reserve 0.0980∗∗∗ 0.0198ASC constant −2.7110∗∗∗ 0.4360Age 0.0137∗∗ 0.0059Education 0.7092∗∗∗ 0.1653Income 0.0000∗∗∗ 0.0000
Model statisticsN (choice sets) 784Log L −723.4250Adjusted rho-squared 0.15524
∗∗∗Significant at the 1 per cent level; ∗∗significant at the 5 per cent level; ∗significant at the 10 per cent level.ASC, alternate specific constant; MNL, multinomial logistic.
C© Australian Agricultural and Resource Economics Society Inc. and Blackwell Publishing Ltd 2005