RESERVE BANK O F INDIA
210
Report on Trend and Progress of Banking in India for the year ended June 30, 1997 submitted to the Central Government in terms of Section 36(2) of the Banking Regulation Act, 1949 RESERVE BANK OF INDIA REPORT ON TREND AND PROGRESS OF BANKING IN INDIA 1-6-97 (JULY-JUNE)
-
Upload
khangminh22 -
Category
Documents
-
view
1 -
download
0
Transcript of RESERVE BANK O F INDIA

Report on Trend and Progress of Banking in India f o r the year ended June 30, 1997 submitted to the Central Government in terms of Section 36(2) of the Banking Regulation Act, 1949
RESERVE BANK O F INDIA
REPORT ON TREND AND PROGRESS OF BANKING IN INDIA
1-6-97 (JULY-JUNE)

Price : In India - Rs. 85 (inclusive of postage) Abroad - US$ 35 (inclusive of Registered Air Mail Book-Post charges)
Published by K U,B. Kno for thr Reserve Bank of M i a M u m h 400 OQ1 and pnntrti by him at
Repro lndid Limited, A2, 207 S I i n t ~ h Nahar Inc3 Lstatc. Dtianrtll Mill Cnrrlp Lcrrvcr P;trcl h2tr:nlixr (lW 01 3

vdi GOVERNOR
RESERVE BANK OF INDIA CENTRAL OFFICE, SHAHEED BHAGAT SINGH ROAD, MUMBAI - 400 001. INDIA.
LETTER OF TRANSMITTAL
November 29, 1997 Agrahayana 8, 1919 (Saka)
The Secretary to the Government of India, Ministry of Finance, Department of Economic Affairs, New Delhi - 110 001.
Dear Finance Secretary,
In pursuance of the provisions of Section 36(2) of the Banking Regulation
Act, 1949, I transmit herewith two copies of the Report on Trend and
Pmgrsss af Banking in India for the year ended June 30, 1997.
Yours faithfully,

CONTENTS
S . Nos . Pnrtlculars Page Nos .
CHAmER I : BANKING DEVELOPMENTS AND POLICY PERSPECT~VES
1 . 1 introduction ............................................................................................................... 1
............................................................................................................... 1.2 Rural Credit 1
1.3 Financial Sector Reform Measures .......................................................................... 2 Interest Rate Deregulation ....................................................................................... - 2
Bank Rate ................................................................................................................... 2
Rates on Domestic Term Deposits ............................................................................. - 2
Rates on Nan-Resident Bank Deposits ...................................................................... 3
Interest Rate on Cash Balances Maintained with the Reserve Bank under CRR ....................................................................................... 3
Lending Rates ............................................................................................................ 3
Interest Rates o n Term Loans of 3 years and Above ................................................. 4
Export Credit ............................................................................................................. 4
Pre-Shipment Rupee Export Credit ............................................................................. 4
Post-Shipment Rupee Export Credit ................. ..... ............... ... . . . . 4 Interest Rate on Bank Finance to Housing Finance
......................................................... Intermediary Agencies 4
.................................... ................................ Changes in Statutory Pre-emptions ... 4
........................................................................................ Cash Reserve Requirements 4
Removal of Reserve Requirements on Inter-Bank Liabilities ....................................... 5
Reserves on Non-Resident Deposits ........................................................................... 5 . - .......................................................................................... Statutory Liquidity Ratio 5
................................................................................... Money Market Developments 6
............................................................................................. Certificate of Deposits 6 ....................................................... Routing of Transactions Through Primary Dealers 6
Investment by Money Market ~ u f u a l Funds .......................................................-...... 6
lmprovlng Credit Delhrery System .. ........................................................................... 6
Loan System for Delively of Bank Credit .................................................................... 6 Bill Finance For Settlement of Dues of 551 Suppliers 6 ...................................................

Debt Market ............................................................................................................. 6
Primary and Satellite Dealers ...................................................................................... 6 . introduction of 28-day Treasury Bills 7 .......................................................................... Introduction of Unihorm Price Auction ....................................................................... 7 Issue Amounts to be Notified in respect of all Auctions ............................................ 7 investments by Flis with 30 per cent Ceiling in Government Dated Securities .................................................................................... 7
Retailing of Government Securities by Banks ............................................................. 7 Bonds and Prlvate Debt Market ................................................................................ 7
Ready Forward Transactions in PSU Bonds and Private Debt Securities .......................................................................................... 7
.................................................................. Prudential Reguktlons and Supervision 7 ............................................................................... Prudential Accounting Standards 7
Write Back of Excess Provision Towards Depreciation on Investments ....................... 8
Banks' Access to Capital Market and Capital Adequacy ............................................. 8
Deposit Insurance ....................................................................................................... 9
........................................ .................................................................. Supervision ... 9
Restructuring of Banks .............................................................................................. 9
Revival Package For Public Sector Banks ................................................................... 9 ..................................................................... Recapitallsation of Public Sector Banks 10
Transactions in Government Dated Securities ......................................................................... by Foreign institutional Investors 1 0
Banks Allowed Freedom to Invest Foreign Currency Funds ...................................... 10
Monetary Policy Initiatives ...................................................................................... 1 1 General Refinance Facility ......................................................................................... 1 1
Bank Rate ............................................................................................................... 1 1
Financial Performance of Scheduled Commercial Banks During 1 996-97 ........... 1 1
Profitability ............................................................................................................... 1 1
Spread ................................................................................................................... I 3
Non-Performing Assets ............................................................................................ 1 3
.......................................................... Capital to Risk Weighted Assets Ratio (CRAR) 15 Payments and Settlement System ........................................................................... 1 5
Overlapping Functions of Banks and Financial institutions .................................. 1 5
Perspectives ............................................................................................................. 1 5
impact of Financial Sector Reforms .......................................................................... 1 5 Interest Rate ............................................................................................................. 1 6
Financial Soundness ......................... .... ..........,., I (j

Need for Enhancing Credit Off-take .......................................................................... I G
..................................................................................... Competition and Autonomy 17
Asset and Liability Management ............................................................................... 17
Payment and Settlement System .............................................................................. 18
TechnoloS~ U gradation ........................................................................................... 18
Rural Credit and Priority Sector Lending .................................................................. 19 Strengthening of the Supervisory System ................................................................ 19
CHAPTER I1 : DEVELOPMENTS IN COMMERCIAL BANKING
(.herview .................................................................................................................. 21
2.2 Ljabjljjl and Asset Structure of Banks .............................................................. 21
Bank Credit .............................................................................................................. -24
Investments .............................................................................................................. 29
Cash Reserves ........................................................................................................... 29
................................ ,........................ Cash Reserves on Inter-Bank Liabilities ........ 29
Export Credit ............................................................................................................ 32
Bank Credit to SicklWeak Industries ...................................................................... 32
Flow of Credit to the Small S d e Industries Sector ......................... .... ............... 32
Recommendations of t h e Abid Hussain Committee Report ...................................... 33
............................................................... 2.3 Working ResuIts of Commercial Banks 33
................................................................................... Scheduled Commercial Banks 33
................................................................................................... Public Sector Banks 34
................................................ Performance of Public Sector Banks in Stock Market 35
.................................................................................... Indian Private Sector Banks 36 ......................................................................................... New Private Sector Banks 3 8
........................................................................................................... Foreign Banks 3 9 ................................................................................... Regional Rural Banks (RRBs) 3 9
Working Results .. 3 9 ............................................................................. ......................... ...................................................................................... Deposit and Credit Growth - 3 9
.............................................................................................. Priority Sector Targets -40 ......................................................................................... Restructuring Programme 41
.................................................................................. Regional Spread of Banking -42
Money M d e t Insfrumen& ................................................ ... . ... .... .... ... .............. ... .. 45

viii
Money Market Mutual Funds (MMMFs) ................................................................... 46 ................................................................................ Government Securities Market 46
Trends in Yields in Primary and Secondary Market in ............................................................................................ Government Securities -47
Withdrawal of Refinance Against Government Securities ........................................ 4 7
.............................................................. Liquidity in Government Securities Market 47
............................................................................ Secondary Market Developments -48
Routing of Transactions Through DFHI .................................................................... 48
........................................................................................ Repos and Reverse Repos -48
.......................................................................... Treasury Bills of Varying Maturities -48
Liquidity Support to Primary Dealers (PDs) ............................................................. 48
............................................................................................... Satellite Dealers (SDs) 49
RBI Guidelines for Foreign Institutional Investors (FIls) Investment in Dated Government Securities .................................................... 49
Valuation of Investment Portfolio of Banks ........................................................... 50
Technical Advisory Committee .............................................................................. 5 0
............................................................................................................. Rural Credit 50
.......................................................... Rural lnfrastmctural Development Fund (RIDF) 52
...................................................... Priority Sector Advances by Public Sector Banks 53
................................. Priority Sector Advances by Indian Private Sector Banks (Old) 5 3
............................... Priority Sector Advances by Indian Private Sector Banks (New) 5 3
Priority Sector Advances by Foreign Banks ............................................................. 5 3
Integrated Rural Development Programme (IRDP) .................................................... 5 3
Recovery under IRDP ............................................................................................ 5 4
Lead Bank Scheme (LBS) ......................................................................................... 5 4
............................ Prime Minister's Rozgar Yojna for Educated Unemployed (PMRY) 54
......................................................... Prudential and Capftal Adequacy Measures 55
..................................................................................... Capital Adequacy Measures 55
Prudential Accounting Standards ............................................................................. 5 5
Prudential Accounting Norms ................................................................................ 5 6
Bookjng of income on Investments in Shares and Bonds ......................................... 56
Classification of Investments under 'Permanent' and 'Current' Category .................. 57
.... ...... Equity Capital and Subordinated Debt raised by Banks ........................... ,,, 57 Moratoflum. Llquldation and Amalgamation ........................................................... 57
Forejgn Banks in India ............................................................................................. gg
2*a0 lssues .......................................... ........... .......................................... 58
Network .................................................................................... 60 Shared Payment Network System (SPNS) ................................................................ 60
2.1 1 Diversification in k M n g ....................................................................................... 60 ................................................................................................. Stock-lnvest Scheme GO
Other Subsidiaries/Activities .....................................................................................GO
Scheme for Money k'larket Mutual Funds ................................................................ GO Credit card ........................................................................................................... 60
............................................................................................................ 2.12 Other I s s u e 60
Banking Ombudsmen ............................................................................................... 60
Housing Finance by Commercial Banks .................................... .... ....................... 61
Frauds and Robberies ................................................................................................ 61
Relaxations to Trade and Industry in the State of Jarnmu and Kashrnir ..................... 61
CHAPTER 111 : DEVELOPMENTS IN CO.OPERBTl VE. BANKING
.................................................................................................................. Overview 62
3.2 Progress of Credit Co-operathes ........................................................................... 6 2
..................................................................... Primary Co-operdve Banks (PCBs) 6 2
......................................................................................................... Policy Changes 6 2
....................................................................................... Interest Rate Deregulation - 6 2 .......................................................................................................... Deposit Rates - 6 3
Lending Rates ........................................................................................................... 6 3
.......................................................................... Aggregate Deposits and Advances 64
.................................................................................................... kfinance Facilities 6 5
............................................................... . hofit.maklng Weak and Nonviable PCBs 6 5
............................................................................................ Non-Perlorrning Assets 6 5 .............................................................................................. Mori ty Sector Targets -65
....................................................................................... Regulation and Supervision 66 . ....................................................................................................... Branch Lfcmslng 66 .............................................................. Maximum Umlt on Single PaRy Exposures
66

..................................................................... Mmary AMculhral Credit Societies 68
.................................................................. 3.3 NABARD and the Co-operathe Sector 68 .............................................................................................. Resources of NABARD 69
......................................................................................... Refinance from NABARD 7 1
.......................................................... Rural lnfrastructural Development Fund (RIDF) 71
.......................................... Agricultural Development Finance Companies (ADFG) 72
Development Action Plans (DAPs) and Memoranda of Understandings (MoUs) ............................................................................................ 72
Policy Initiatives by NABARD .................................................................................... 73
CHAPTER IV: FINANCIAL INSTITUTIONS Overview ....................................................................................................... 76
............................................................................ 4.2 Assets of Financial Institutions 76
............................................................ 4.3 Term Lending and Investment Institutions 77
.................................................................................................. Financial Assistance 77
................................................. Pattern of Sources and Deployment of Funds of Fls 80
Prime Lending Rates of FIs ........................................................................................ 80
Resource Raising by Major Financial Institutions ....................................................... 81
Merger of SCICI with ICICI ........................................................................................ 8 1
................................................................................. Conversion of IRBl into IIBl Ltd 81
Rs' Recourse to Capital Market ................................................................................. 82
Other Developments Relating to FIs ...................................................................... 82
........ Prudential and Capital Adequacy Measures .................................................. 83
4.4 Reserve Bank Assfstance to Finnncinl lnstftutions ............................................... 84
4.5 Infrastructure Development Finance Company ................................................... 86
Incorporation of lDFC ............................................................................................... -86 Shareholding Pattern ................................................................................................ 8G Objectives ......................................................................................................... 8 G
......................................................................................................... 4.6 Mutual Funds 89
........................................ New Guidelines for Mutual Funds
........................................................... Types of Mutual Fund Schemes in Operation 90 New Mutual Fund Schemes ...................................................................................... 90 Asset A4anagement Committees (AMCs) by Unit Trust of India ............ ..... .......... 90

4.7 Non-Banking Financial Companies ........................................................................ 90 Regulation of NBFCs ................................................................................................. 91
Inadequacy of Legislative Framework Prior to the 1 997 Amendment .................................................................................................... 91 Recommendations of Shah Working Group ........................ ......,............. ............. 9 2
Amendments to t h e Reserve Bank of India Act. 1934 ....... : ..................................... 9 2
Amendment to NBFC (Reserve Bank) Directions. 1977 .......................................... 97
Prudential Regulation and Capital Adequacy Stipulations ......................................... 97
........................................................................................ New Guidelines for NBFCs 97
............................................................................ Supervisory Framework for NBFCs 97
Amendments to Residuary Non-Banking (Reserve Bank) Directions. 1987 ....................................................................................................... 9 8
Trends in the Growth of Deposits with Non-Banking Companies during the year ended March 31 . 1996 ................................................................... 98
Shere Working Group ............................................................................................... 9 8
List of Boxes ......................................................................................................................... xi
......................................................................................................................... List of Tables xii
Llst of Charts ....................................................................................................................... xiii
ANNEXURE I : Progress of Financial Sector Reforms : 1992-93 to 1996-97 ..................... xiv
....................................................................................................... List of Appendix Tables xvi
LIST OF BOXES
Box Nos .
....................................................................................... 11.1 Risk Management in Banks 22
.................................................................................................. 11.2 The 'Narrow Banks' 26
............................................... 11.3 Capltal Convertibility and Commercial Banks in India 27 ...................................................... 11.4 Directed Credit . Issues Relating to Rural Credit 51
Ill. 1 The Role of the Reserve Bank in Promoting Rural Development ............................. 69
............ . .................................................. IV I Speciallsed Finandal Institutions in India ; 78 ............................................................................. IV.2 Modes of Infrastructure Financing 87
1V.3 Deposit Insurance ........................ ......... .................................................................... 93 ....................................... IV.4 nmnclal frauds and Banking Instability ......... ............ 95

LIST QF TABLES
Table Nos . 1.1 Working ~esults'of Scheduled Commercial Banks .
............. . Group-wise : Some Important Financial Indicators 1995-96 and 1996-97 12
....................................... 1.2A Frequency Distribution of Net NPAs : Public Sector Banks 13
1.20 Frequency Distribution of Net NPAs : Indian Private Sector and Foreign Banks ........ 1 4
.............................................. 1.3A Frequency Distribution of CRAR : Public Sector Banks 14
. ............... 1 Y) Frequency Distribution of CRAR : indian Private Sector and Foreign Banks 14
11.1 The New Structure of Prime Lending Rate of Public Sector Banks ............................ 23
11.2 Important Banking Indicators . Scheduled Commercial Banks . .............................................................................................. 1995-96 and 1996-97 24
11.3 Sectoral Deployment of Gross Bank Credit by Major Sectors .................................. 30
...................................................... 11.4 Industry-wise Deployment of Cross Bank Credit 31
11.5 Working Results of Scheduled Commercial Banks for the years .............................................................................................. 1995-96 and 1 996-97 34
1 Working Results of 27 Public Sector Banks for the years 1 995-96 and 1 996-97 ...... 36
11.7 Working Results of State Bank of India and 7 Associates for the years 1 995-96 and 1 996-97 ............................................................................................. 3 7
....... 11.8 Working Results of 19 Nationalised Banks for the years 1995-96 and 1996-97 38
................................. 11.9 Performance of Public Sector Bank Scrips in the Stock Market 39
11.10 Working Results of 25 Old Indian Private Sector Banks for the years 1 995-96 and 1996-97 ............................................................................................. -40
11.1 1 Working Results of 9 New Indian Private Sector Banks for the years 1 995-96 and 1 996-97 .............................................................................................. 41
11.12 Working Results of 39 Foreign Banks in India for the years 1 995-96 and 1 996-97 .............................................................................................. 4 2
11.13 Working Results of RRBs : 1 994-95 and 1 995-96 .................................................... 43
............................................................. 11.14 Selected Indicators of Regional Rural Banks 44
11.15 Purpose-wise Advances of RRBs ............................................................................... 44
11.16 Yields on Government Securities in the Primary Market . 1994-95 to 1997-98 (April-October) ....................................................................... 47
11.1 7 Advances under JRDP ............................................................................................ 5 4
...................... 11.18 Annual Credit Plan of Financial Institutions under Lead Bank Scheme 55

Chart Nos .
Issue of Equity Capital by Nationalised Banks ......................................................... 57
................................................................. Ehanches of New Foreign Banks in India 59
New Foreign Bank Branches opened in India ..................................................... 59
New Representative Offices of Foreign Banks .......................................................... 59
Primary Urban Co-operative Banks . Structure 63 ....................................................... Primary (Urban) Co-operative Banks .......................................................................... G 4
Non-Performing Assets of PCBs - 1994-95 and 1995-96 .................................. ...... 65
Net Accretion in the Resources of NABARD .......................................................... 70
NABARD's Credit to State Co-operative Banks and State Governments ................... 71
NABARD's Structure of Interest Rates for Term Loans .............................................. 72
Sanctions and Disbursements under RIDF.1. RIDF-11 and RIDF-Ill .............................. 73
Prime Lending Rates of Major Term-Lending Institutions ......................................... 81 Resources Mobilised by All-India Development Banks ........................................... 8 2
Prudential Regulatory Framework for Financial Institutions ...................................... 84
Capital Adequacy Ratio of Select Fls as on March 31 . 1997 .................................... 84
Asset Classification of Select Financial lnstitutions as at t h e end of .............................................................................................. March 1 996 and 1 997 85
................................ Amounts Mobilised by Mututal Funds (1 99 1-92 to 1996-97) 89
LIST OF CHARTS
Growth Rate of Bank Deposits and Non-Food Credit of Scheduled Commercial Banks in India: 1995.96. ......................................................................... 1996-97 and April.October. 1997 2 5
Investment and Reserve Deposit Ratios of Scheduled Commercial Banks in India: 1995.96. ...................................................................................... 1996-97 and October 1997 -29
Net kofits to Total Assets of Scheduled Commercial Banks . ............................................................... Bank Group-wise : 1995-96 and 1996-97 33
Snr~ad of Scheduled Commercial Banks in lndia . Bank Group-wise :
111. 1 Growth Rate of Deposlts and Credlt of Primary (Urban) ................................................................ Co-operative Banks: 1994-95 to 1 996-97 65
111.2 Growth Rate of Deposits and Credlt of State ................................................................ Co-operative Banks: 1993-94 to 1995-96 67
111.3 Growth Rate of Deposits and Credit of Central ................................................................ Co-operative Banks: 1993-94 to 1995-96 67
111.4 Growth Rate of Deposits and Credit of Primary ................................................... Agricultural Credit Societies: 1903-94 to 1995-96 68
111.5 Overdues to Demand of Co-operative Credit Institutions: ................................................................................................. 1 993-94 to 1995-96 68
IV . 1 Share of Banks and Financial lnstltutions in .............................................................................. . Financial Assets 1 994 to 1997 7 7
................... . IV.2 Financial Assistance by All-Financial Institutions 1994-95 to 1996-97 77
................................................................. IV.3 Resource Mobillsatlon by Mutual Funds 86
1'4 Share of Banks and Non-Bank Deposits in Financial Assets ................................................................................................ of Household Sector 91
ANNEXURE . PROGRESS OF FINANCIAL SECTOR REFORMS : 1992-93 TO 1996-97
* . 1 . Cash Reserve Ratio (CRR) ......................................................................................... 99
.................................................................................................... Domestic Deposits 99
...................................................................................................... External Deposits 100
2 . Statutory Liquidity Ratio (SLR) ................................................................................. 101 Domestic Deposits .................................................................................................... 101
External Deposits .................................................................................................... 102
3 . Deregulation of Interest Rates ................................................................................ 102
Lending Rates ........................................................................................................... 102
Export Credit ............................................................................................................ 104
Deposit Rates ............................................................................................................ 105
Domestic Deposits ....................................................................................... 105
External Deposits ........................................ 106
4 . Changes in the Refinance Facilities ................................................................... 107
Export Credit (Rupee) Refinance ........................................................................... 107
Export Credit Refinance - Denominated in US Dollars (PSCFC) .................................. 108
Government Securities Refinance .............................................................................. 1 0 9 General Refinance 110 ......................................................................................................
5. Bank Rate ................................................................................................................. 1 10

Term Money Market .................................................................................................. I11
Certificate Deposits (CDs) ...................................................................................... 111
~ommer=ia' Paper (CP) .............................................................................................. 111
Inter Pa*i=ipations (IBPs) ................................................................................... 112
Rediscounting Co~mercial Bills ................................................................................. 113
Money Market Mutual Funds (MMMFs) ..................................................................... 113
Internal Debt Management Policies ........................................................................ 113
............................................................. ............................... Pmdentia1 Norms ......... 119
Capital Adequacy Norms .......................................................................................... 119
Capital Restructuring .................... ! ............................................................................. 120
lncome Recognition. Asset' Classification and Provisioning Requirements .................. 121
Credit Delivery System ........................................................................................ 124
.......................... Recovery of Bank Loans and Disclosure on Defaulting Borrowers 126
......................................... Term Lending/Bridge Loan Norms ......................... .... 127
lnvestment Norms ..................................................................................................... 128
Functional Autonomy in Nationalised Banks ............................................................ 129
Technologid Issues .............................................................................................. 129
Regulatory and Supervisory Issues ................................... .... ................................. 129 ..................................................................................................... Supervisory Issues 129
.................................................................................................. Private Sector Banks 130
Local Area Banks ................................................ ................................................... 131 ............................................................................................................ Foreign Banks 131
............................................................................................... Bank Branch Licensing 131 . ............................................................................. ................ Priority Sector Lending ; 132
..................................................................................................... Customer Services 135 .......................................................................... Preventing Frauds and Malpractices 135
Bank Restructuring ..................................................................................................... 136 ................................................................................................. Regi anal Rural Banks 136
.................................................................................. Dividend Declaration by Banks 137 ........................................................................... Reforms In Co-ope&e mklng 137

LIST OF APPENDIX TABLS
Table Nos . I . 1 (A)
1 . 1(B)
......... Net Nan-Perfirming Assets of Public Sector Banks . 1995-96 and 1 996-97 143
Net Non-Performing Assets of lndian Private Sector Banks . .............................................. ......... 195-96 and 1996-97 ................................ 144
..... . Net Non-Performing Assets of Foreign Banks in India 1995-96 and 1996-97 145
................ . Capital Adequacy Ratio of Public Sector Banks 1995-96 and 1996-97 147
.... . Capltal Adequacy Ratio of Indian Private Sector Banks 1995-96 and 1996-97 148
................................. . Capital Adequacy Ratio of Foreign Banks in India 1996-97 149 ........................................... RBI Accommodation to Scheduled Commercial Banks 150
....................................................... Viability Position of Sick/Weak Industrial Units 151
. ................................ 11.3(A) Parameters of the Working of Public Sector Banks 1996-97 152
11.3(B) Financial Ratios of Public Sector Banks . Performance Indicators . ............................................................................................... 1 99 1-92 to 1996-97 153
11.3(C) Financial Ratios of Public Sector Banks . Performance Indicators . 199 1-92 to 1996-97 ............................................................................................... 1 54
11.3(D) Financial Ratios of Public Sector Banks . Performance Indicators . 199 1-92 to 1 996-97 ............................................................................................... 155
11.3(E) Financial Ratios of Public Sector Banks . Performance lndicators . 1991-92 to 1996-97 ............................................................................................... 156
11.3(F) Financial Ratios of Public Sector Banks . Performance lndicators . 1991 -92 to 1996-97 ............................................................................................... 157
11.3(G) Financial Ratios of Public Sector Banks . Performance lndicators . 1991-92 to 1996-97 ............................................................................................... 158
II.3(H) Financial Ratios of Public Sector Banks . Performance lndicators . 1991-92 to 1996-97 ............................................................................................. 159
.................... 11.4(A) Parameters of the Working of Indian Private Sector Banks . 1996-97 160
11.4(B) Financial Ratios of Indian Private Sector Banks in India . . Performance Indicators 1 99 1 -92 to 1 996-97 ..................................................... 161
4 ( C ) Financial Ratios of lndian Private Sector Banks in India . Performance Indicators . 1 99 1 -92 to 1 996-97 ...................................................... 142
11.4(D) Financial Ratios of lndian Private Sector Banks in India . Performance Indicators . 1 991 -92 to 1 996-97 ...................................................... 163
11.4(E) Financial Ratios of lndian Private Sector Banks in India . Performance Indicators . 1 991 -92 to 1996-97 ...................................................... 1 64
11.4(F) Financial Ratios of lndian Private Sector Banks in lndia . Performance Indicators . 1 99 1-92 to 1 996-97 ...................................................... 1 65
11.4(G) Financial Ratios of lndian Private Sector Banks in India . Performance Indicators . 199 I -92 to 1 996-97 ...................................................... 1 66

11.8
11.9
11.10
11.1 1
11.1 2
11.13
11.14
Ill . 1
IV . 1 (A)
IV . 1 (B)
IV.2
IV.3
Financial Ratios of lndian Private Sector Banks in India . Performance Indicators . 1 99 1-92 to 1 996-97 ...................................................... 167
Parameters of the Working of Foreign Banks in India . 1996-97 ............................ 168 Financial Ratios of Foreign Banks in lndia . Performance lndicators .
............................................................................................... 1991-92 to 1996-97 169
Financial Ratios of Foreign Banks in lndia . Performance lndicators . ............................................................................................... 1991-92 to 1996-97 170
Financial Ratios of Foreign Banks in lndia . Performance lndicators . ............................................................................................... 1991-92 to 1996-97 171
Financial Ratios of Foreign Banks in lndia . Performance Indicators . ............................................................................................... 1991-92 to 1996-97 172
Financial Ratios of Foreign Banks in lndia . Performance lndicators . ............................................................................................... 1991-92 to 1996-97 173
Financial Ratios of Foreign Banks in lndia . Performance Indicators . ............................................................................................... 1991-92 to 1996-97 174
Financial Ratios of Foreign Banks in lndia . Performance lndicators . 1 99 1 -92 to 1 99697 .......................................................................................... 175
Bank Group-wise/Population Group-wise Distribution of Commercial Bank Branches in India .................... ..... ....................................... 1 7 6
RegionIState-wise Credit Deposit Ratio and Investment t Credit Deposit Ratio of Scheduled Commercial Banks .................................................... 177
Region/State/Union Territory-wise Distribution of Commercial Bank Branches ........ 178
Issue of Certificate of Deposits by Scheduled Commercial Banks .......................... 179
.................................................................................................. Commercial Paper 180
Advances to the Priority Sectors by Public Sector Banks ....................................... 181
Advances to the Priority Sectors By Indian Private Sector Banks (Old) ................... 182
................. Advances to the Priority Sectors By Indian Private Sector Banks (New) 182
................................................ Advances to the Priority Sectors By Foreign Banks 182
............................................. Progress of Co-operative Credit Movement in India 183
........................... ............ Financial Assets of Banks and Financial Institutions ..... 184 .............................. Total Financial Assets of Financial Institutions : Institution-wise 185
............ Financial Assistance Sanctioned and Disbursed by All Financial Institutions 186
Pattern of Sources and Deployment of Funds of Term ........................................................................... Lending Institutions . 199G-97 1 8 8 ................................................................... RBI Assistance to Financial Institutions 188
................................................................. Resource Mobilisation by Mutual Funds 189
Growth In Aggregate Deposits of Scheduled .......................... Commercial Banks and Non-Banking Companies : 1991 to 1996 190

ABBREVIATIONS
ABS - Asset Backed Securltisatlon DCA - Department of Company Affairs
ADFCS - A~rlcultural Development DCCBS - District Central Co-operative Finance Companfes Banks
AlDBs - All-lndla Development Banks DFHI - Discount and Finance House of
AMC - Asset Management Committee India Ltd. A R K - Agricultural Refinance and DFls - Development Financial
Development Corporation Institutions ARDR - Agricultural and Rural Debt DIC - Deposit Insurance Corporation Scheme Relief Scheme DlCGC - Deposit Insurance and Credit ARF - Asset Reconstruction Fund/ Guarantee Corporation
Automatic Refinance Facility DRI - Differential Rate of Interest ATM - Automated Teller Machine Scheme Scheme BCCl - Bank of Credit and Commerce DTL - Demand and Time Liabilities
International DTP - Development of Tribal BFS - Board b r Financial Supervision Programme Population Programme BGB - Bangladesh Grameen Bank ECGC - Export Credit Guarantee BOB - Bank of Baroda Corporation 501 - Bank of India ECS - Electronic Clearing Service BOLT - Build, Operate, Lease and Exim Bank - Export-Import Bank of India
Transfer FCNR(B) - Foreign Currency Non-Resident BOO - Build, Own and Operate (Banks) Accounts Scheme BOOS - Build, Own, Operate and Sale FG - Financial Guarantee BOOT - Build, Own, Operate and FIs - Financial Institutions
Transkr Flls - Foreign Institutional Investors BOT - Build, Operate and Transfer GDR - Global Depository Receipt BSE - Bombay Stock Exchange CIC - General Insurance Corporation CAC - Capital Account Convertibility GLC - General Line of Credit CAMEL - Capital Adequacy, Asset GPV - General Purpose Vehicle
quality, Management, Earnings GRF - General Refinance Facility and Liquidity HDFC - Housing DeWopment Finance
CAR - CapItal Adequacy Ratio Corporation CCBs - Central Co-operative Banks HFG - Housing Finance Companies CDs - Certificate of Deposits HPAEs - High performing Asian CD Ratio - Credit-Deposit Ratio Economies CP - Commercial Paper IBA - Indian Banks' Association CRAR - Capital to Risk-weighted Asset IBl - Industrial Bank of Japan
Ratio IBL - Inter-Bank Liabilities CRISIL - Credit Rating Information ICAl - Institute of Chartered
Services of India Ltd. Accountants of India -Cash Reserve Ratio ICD Ratio - Investment plus Credit Deposit
DAP - Development Action Plan Ratlo

1ClCl
ICS IDBl
lDCs IDFC
IDMT
IFCl
IIBl
IRBI
IRDP
KVlC
LABS LBS LIBOR LIC LTO LTPR MF MlCR
MIS
MMMF MoU MPBF
MSTLR
MTLR MTNL
MTPR NABARD
- Industrial Credit and Investment Corporation of lndia
- investor Compensation Scheme - Industrial Development Bank of
lndia - Institutional Development Cells - Infrastructure Development
Finance Company - Institute for Development and
Research in Banking Technology - Industrial Finance Corporation of
lndia - Industrial lnvestment Bank of
India - Industrial Reconstruction Bank
of lndia - Integrated Rural Development
Programme - Khadi and Village Industries
Commission - Local Area Banks - Lead Bank Scheme - London Inter-Bank Offer Rate - Life Insurance Corporation - Long-Term Operation - Long-Term Prime Rate -Mutual Fund - Magnetic Ink Character
Recognition - Management Information
System - Money Market Mutual Fund - Memorandum of Understanding
-Maximum Permissible Bank Finance
- Minimum Short Term Lending
Rate - Medium Term Lending Rate - Mahanagar Telephone Nigam
Ltd. - Medium Term Prime Rate - National Bank for Agriculture
and Rural Development
NBC - Net Bank Credit NBCs - Non-banking Companies NCC - National Clearing Centre NBDs - Non-bank Deposits NBFCs - Non-banking Financial
Companies NBNFCs - Non-banking Non-financial
Companies NDTL - Net Demand and Time
Liabilities NFA - Net Foreign Exchange Assets NGOs - Non-Governmental
Organisations NHB - National Housing Bank NHC(LT0) - National Housing Credit (Long Fund Term Operations ) Fund NOF - Net Owned Fund NPA - Non-Performing Asset NRC - National Rural Credit Stabilisation Stabilisation Fund Fund NRC (LTO) - National Rural Credit (Long- Fund Term Operations) Fund NRE - Non-Resident (External) Rupee Accounts Accounts NRNR - Non-Resident Non-Repatriable
Rupee Deposit
NSE - National Stock Exchange OTC - Over-the-counter PACS - Primary Agricultural Credit
Societies
PCBs - Primary (Urban) Co-operative Banks
PDs -'Primary Dealers PLDBs - Primary Land Development
Banks
PLR - Prime Lending Rate
PMRY - Prime Minister's Rozgar Yojana
PNB - Punjab National Bank PSBs - Public Sector Banks PSUs - Public Sector Undertakings l l L R - Prime Term Lending Rate

X X
ROC - Msk Capltal and Technology FInance Corporation Ltd.
NDF - Rural InFrastructural Development Fund
RNBCs - Residuary Non-banking Companies
RRBs -Regional Rural Banks SAO - Seasonal Agricultural
Operations SBI - State Bank of India SCARDBs - State Co-operative and
Agricultural Rural Development Banks
SGISTs - Scheduled Castes/Scheduled Tribes
SCBs - Scheduled Commercial Banks/ State Co-operative Banks
SClCl - Shipping Credit and Investment Corporation of lndia
SDs - Satellite Dealers SEBI - Securities and Exchange Board
of lndia SFCs - State Financial Corporations SF0 - Structured Financing Option SGL - Subsidiary General Ledger
SHGs - Self-Help Groups SlDBl - Small Industries Development
Bank of lndia SlDCs - State Industrial Development
Corporations SLDB - State Land Development Bank SLR - Statutory Liquidity Ratio SLRCCCDI - State Level Review and Co-
ordination Committee on Credit Delivery Innovations
SPNS - Shared Payment Network System
SPV - Special Purpose Vehicle SSI - Small Scale Industries STPLR -Short Term Prime Lending Rate TDlCl - Technology Development and
Information Company of India TDS - Tax Deduction at Source TFCI - Tourism Finance Corporation of
lndia UTI - Unit Trust of India VAR - Value-at-risk VSAT - Very Small Aperture Terminal VSNL - Videsh Sanchar Nigam Ltd. YTM - Yield to Maturity

CHAPTER 1
BANKING DEVELOPMENTS AND POLICY PLRSPLCTlVES
Introduction
The performance of the Indian banking syst6m in 1996-97 showed a distinct improvement. There was a marked relaxation of availability constraints as well as policy- based constraints on the banking system. Reductions in Cash Reserve Ratio (CRR) injected substantial liquidity, while policy initiatives such as the freedom provided to banks in regard to the application of Maximum Permissible Bank Finance (MPBF) and relaxation of the norms of consortium lending, enhanced their operational flexibility. Release of substantial liquidity through reductions in CRR and the increase in net foreign exchange assets (NFA) along with some softening of inflationary expectations led to strong deposit growth of scheduled commercial banks (SCBs), and a general softening of prime lending rates. Long-term interest rates which had exhibited downward rigidity for most part of t h e year, also tended to soften with the inflation rate coming down towards the later part of the year. All these factors, taken together, had a distinct positive impact in terms of the improvement in net profitability positions of SCBs. Furthermore, t h e r e was some improvement in the spread (i.e., net interest income).
1.2 Notwithstanding these favourable developments, credit expansion remained subdued during 1996-97. Faced with an easy liquidity situation, banks resorted to treasury operations also to improve their earnings and profitability. A substantial part of the enhanced liquidity was absorbed through Investments
in Government securities. During the first half of the current financial year i.e. 1997-98, aggregate deposits of banks continued to grow strongly. Non-food credit has shown a pickup in recent period. Besides, banks' investments in commercial paper, bonds/ debenturesfshares of Public Sector Undertal<ings (PSUs) and private corporate sector have shown a growth compared with that in the previous year. Thus, the flow of resources from banks to commercial sector has been significantly larger than in the corresponding period last year.
2. Rural Credit
1.3 Provision of adequate and timely institutional credit for rural sector continued to be a major policy concern during 1996-97. Towards t h i s end, the refinancing capacity of the National Bank for Agriculture and Rural Development (NABARD) was enhanced with t h e increase in the General Line of Credit limit from the Reserve Bank from Rs. 5,250 crore to Rs.5,500 crore during 1996-97 for short- term and seasonal agricultural operations. The limit is set to be further raised to Rs. 5,700 crore during 1997-98. Besides, the share capital of t h e NABARD was enhanced by Rs. 500 crore to Rs.1,000 crore during 1996-97 with a contribution of Rs.400 crore from the Reserve Bank and Rs. 100 crore from t h e Government of India. The Monetary and Credit Policy for the first-half of 1997-98 has unveiled a plan to raise further the share capital of the NABARD by Rs.500 crore, taking the Reserve Bank's total contribution to Rs.l,OSO crore. These steps would substantially enhance

Report on Trend and Progress of Banking in India, 1996-97
the refinancing capablllty of NABARD. In view of the imperfections in the credit market and the imperative need for funding agriculture, small-scale industry, small business and the poverty alleviation programmes, t he prescription of 40 per cent of net bank credit to the priority sector as well as the two concessional rates of interest for small loans have been retained. The priority sector target of 40 per cent of net bank credit was achieved by December 1 WG, by all banks taken together.
1.4 In recent years, a deliberate policy is being pursued to channelise any shortfall in priority sector lending by banks into rural InFrzlstructure investment through NABARD and Small Industries Development Bank of lndia (SIDBI). Accordingly, from the Rural Infrastructure Development Fund (RIDF I) instituted with NABARD, a sum of Rs. 1,183.12 crore was disbursed during 1996-97 to 18 State Governments as against a sanction of Rs.2,010.05 crore to 23 State Governments. In addition, a sanction of Rs. 2,646.88 crore was extended to 16 State Governments under the newly constituted RlDF II a t NABARD with a corpus of Rs. 2,500 crore. A sum of Rs. 291 crore was disbursed to 12 States till the end of March 1997 under this Fund. The Union Budget 1997-98 has further proposed t o launch RlDF I l l in 1997-98 with a corpus of Rs. 2,500 crore. The Reserve Bank had advised public sector banks to prepare Special Agricultural Credit Plans for the year 1996-97. The disbursements to the agriculture sector under such plans amounted to Rs12,782 crore in 1996-97 as against Rs. 10,172 crore in 1995-96. Three 'in-principle' approvals have been accorded so far by the Reserve Bank for setting up of Local Area Banks (LABS) on the lines of the guidelines established for the purpose in August 1996. The process of revamping the Regional Rural Banks (RRBs) was strengthened further during 1996-97 with fresh initiatives which included liberal branch licensing policy, rationalisation of investment guidelines, and prescription of priority sector target in place of target/non-target group approach from the
year 1997-98. Besides, with the release of budgetary provision of Rs.200 crore, 34 RRBs were taken up for capital restructuring in Phase Ill in addition to the assistance provided to 16 select RRBs during 1994-95 and 1995-96.
3. Financial Sector Reform Measures
lnterest Rate Deregulation
1.5 lnterest rate regime in lndia has undergone a rapid transformation over the years. The structure of interest rates, which was extremely complex, has now been rationalised. Banks are free t o determine interest rates on domestic term deposits of 30 days and above, effective October 22, 1997. The lending rates are also generally free except for export financing, loans upto Rs.25,000 and for loans between Rs.25,000 and Rs.2 lalth. The money market rates have been completely freed. The most significant development, however, is the reactivation of the Bank Rate as an instrument t o transmit signals of Monetary Policy and as a reference rate for influencing the direction of interest rate movement in the economy.
Bank Rate
1.6 Effective April 16, 1997, all interest rates on advances from the Reserve Bank were specifically linked to the Bank Rate. lnterest rate on term deposit of banks between 30 days to one year was also linked to Bank Rate. Following the one percentage point reduction in Bank Rate each in April, June and October 1997, there has been a corresponding reduction in deposit rates and Prime Lending Rates (PLR) of banks. Thus, the Bank Rate has served the function of signalling rate s o far. With the comfortable liquidity position of banks and the need to signal the market for further scope of reduction in interest rates, Bank Rate was further reduced (with effect from October 22, 1997) from 10 per cent per annum to 9 per cent per annum.
Rates on Domestic Term Deposits
1.7 Effective from july 2, 1996, the domain
Banking Developments and Pollcy Perspectives
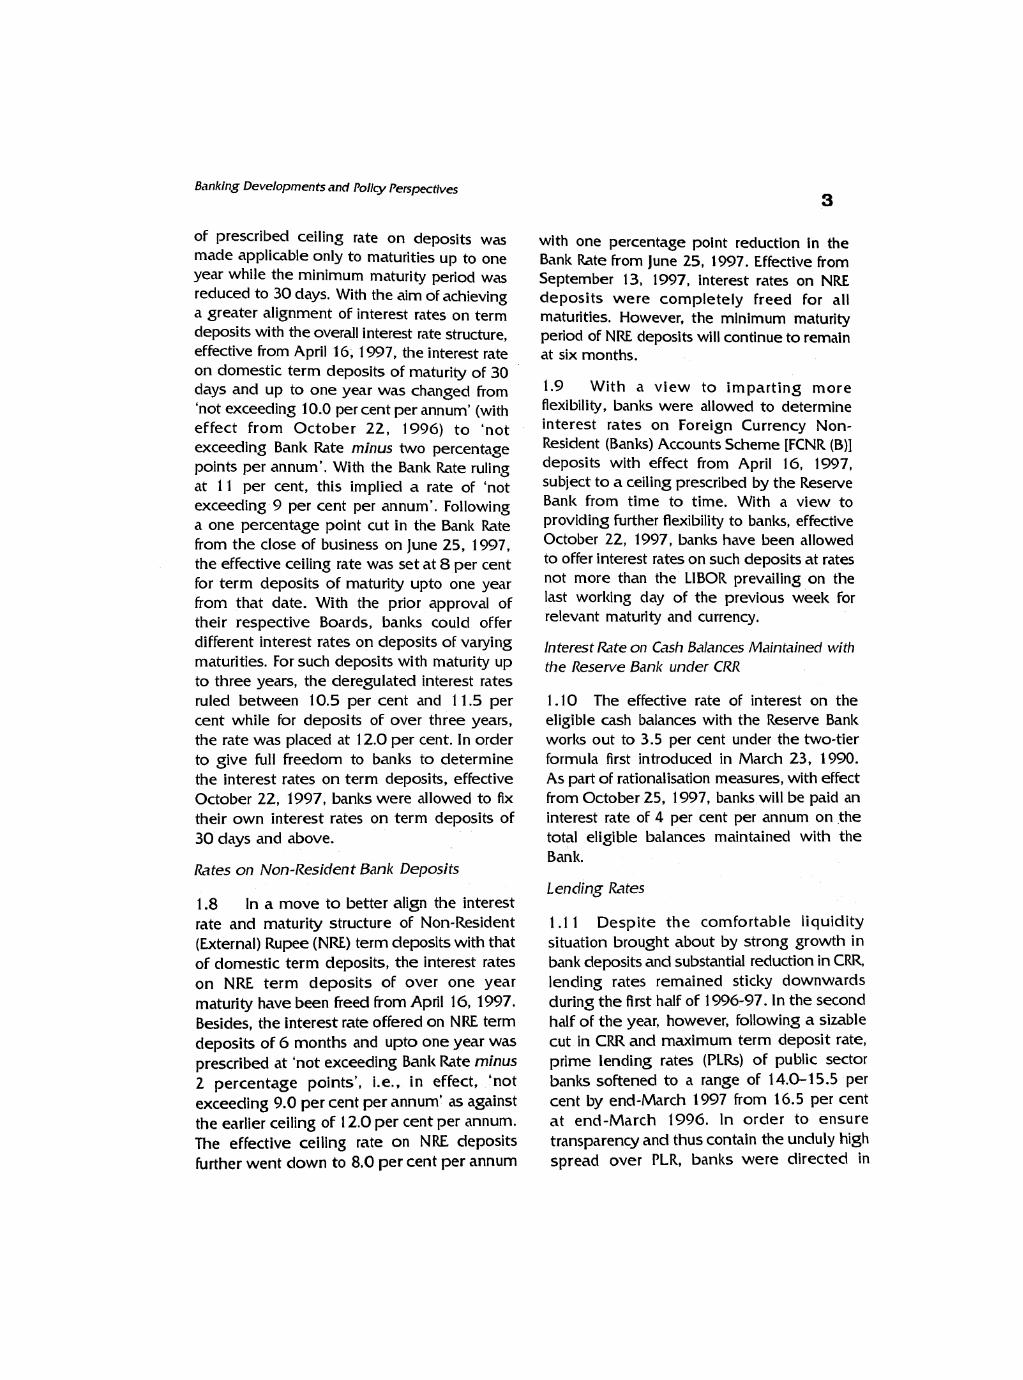
of prescribed ceiling rate on deposits was made applicable only to maturities up to one year while the minimum maturity period was reduced to 30 days. With the aim of achieving a greater alignment of interest rates on term deposits with the overall interest rate structure, effective from April 16, 1997, the interest rate on domestic term deposits of maturity of 30 days and up to one year was changed from 'not exceeding 10.0 per cent per annum' (with effect from October 22, 1996) to 'not exceeding Bank Rate minus two percentage points per annum'. With the Bank Rate ruling at 11 per cent, th is implied a rate of 'not exceeding 9 per cent per annum'. Following a one percentage point cut in the Bank Rate from the close of business on June 25, 1 997, the effective ceiling rate was set at 8 per cent for term deposits of maturity upto one year from that date. With the prior approval of their respective Boards, banlts could offer different interest rates on deposits of varying maturities. For s u c h deposits with maturity up to three years, the deregulated interest rates ruled between 10.5 per cent and 1 1.5 per cent while for deposits of over three years, the rate was placed at 12.0 per cent. In order to give full fieedom to banks to determine the interest rates on term deposits, effective October 22, 1997, banks were allowed to fix their own interest rates on term deposits of 30 days and above.
R;l tes on Non-Residen t Bank Deposits
1.8 In a move to better align the interest rate and maturity structure of Non-Resident (External) Rupee (NRE) term deposits with that of domestic term deposits, t h e interest rates on NRE term deposits of over one year maturity have been freed from April 16, 1997. Besides, the interest rate offered o n NRE term deposits of G months and upto one year was prescribed at 'not exceeding Bank Rate minus 2 percentage points', i.e., in effect, 'not exceeding 9.0 per cent per annum' as against the earlier ceiling of 12.0 per cent per annum. The effective ceiling rate on NRE deposits further went down to 8.0 per cent per annum
with one percentage point reduction in the Bank Rate From June 25, 1997. Effective from September 13, 1997, interest rates on NRE deposits were completely freed for all maturities. However, the minimum maturity period of NRE deposits will continue to remain at six months.
1.9 With a view to imparting more flexibility, banks were allowed to determine interest rates on Foreign Currency Non- Resident (Banks) Accounts Scheme [FCNR (B)] deposits with effect from April 16, 1997, subject to a ceiling prescribed by the Reserve Bank from time to time. With a view to providing further flexibility to banks, effective October 22, 1997, banlts have been allowed to offer interest rates on such deposits at rates not more than the LIBOR prevailing on the last working day of the previous week for relevant maturity and currency.
lnterest Rate on Cash Balances Maintained with the Reserve Bank under CRR
1.10 The effective rate of interest on the eligible cash balances with the Reserve Bank worl<s out to 3.5 per cent under the two-tier formula first introduced in March 23, 1990. As part of rationalisation measures, with effect from October 25, 1997, banks will be paid an interest rate of 4 per cent per annum on t h e total eligible balances maintained with t h e Bank.
Lending Rates
1.1 1 Despite the comfortable liquidity situation brought about by strong growth in bank deposits and substantial reduction in CRR, lending rates remained sticky downwards during t h e first half of 1996-97. In t h e second half of t h e year, however, following a sizable cut in CRR and maximum term deposit rate, prime lending rates (PLRs) of public sector banks softened to a range of 1 4.0- 1 5.5 per cent by end-March 1997 from 16.5 per cent a t end-March 1996. In order to ensure transparency and thus contain the unduly high spread over PLR, banks were directed in

Report on Trend and Progress of banking in Indla, 1996-97
October 1996 to announce the maximum spread over PLR along with the PLR for all advances other than consumer credit. Different PLRs and spreads were allowed as between cash credit and demand loans. The announced spreads over PLRs were placed within a range of 3.0-4.5 percentage points. PSBs generally have lower PLRs and spread compared with Indian private sector and foreign banks. With effect from October 22, 1997, prescription of a fixed lending rate of 1 3.5 per cent for credit limit of over Rs.25,000 and upto Rs.2 lakh has been changed to prescription of a ceiling rate of 'not exceeding 13.5 per cent'.
interest K~ tes on Term Loans of 3 years and Above
1.12 Banks were allowed freedom to fix specific rates for cash credit and loans. Effective October 22, 1997, banks have been permitted to announce, with the approval of their Boards, specific Prime Term Lending Rates (PTLR) for term loans of 3 years and above.
Export Credit
Pre-S/~ipn?en t Rupee Export Credit
1.13. Effective October 22, 1997, the interest
90 days was changed from 1 3.0 per cent per annum to 'not exceeding 13.0 per cent per annum' effective April 17, 1997. Effective September 1 2, 1997, as a measure to boost exports, the interest rate on post-shipment rupee export credit was reduced by one percentage point to 1 1 per cent (1 2 per cent earlier) and for the period beyond 90 days up to six months, the rate was reduced to 13 per cent (14 per cent earlier)'. Effective October 22, 1997, it was decided that banks should charge an interest of 13 per cent per annum only for the period beyond 90 days and not from the date of advance.
Interest Rate on Bank Finance to Housing Finance intermediary Agencies
1.1 5 As part of the process of deregulating interest rates, the stipulation that banks should extend finance to housing finance intermediary agencies for lending to ultimate beneficiaries at 1.5 percentage points below each bank's prime lending rate for credit limits of over Rs.2 lalch was withdrawn with effect from October 22, 1997.
Changes in Statutory Pre-emptions
Cash Reserve Requirements
rate on pre-shipment export credit was 1-16 Consistent with the medium-term reduced one percentage point the objective, the average Cab Reserve Ratio board: ~re-shipment rupee export credit upto (CRR) w a brought down in phases to 10.0
days reduced from per cent to per per cent by January 1997. In effective terms, cent and such credit 180 and the ratio was lower at 9.5 per cent in March
270 days from l5 per cent to l4 per 1997. The need for augmenting the lendable cent. resources of banks prompted the reduction in
Post-Shipment Rupee Export Credit
1.14 As part of a move to give general operational freedom to banks and also taking into consideration the willingness of some banks to extend post-shipment export credit at lower interest rate if export proceeds are realised in shorter periods, the interest rate on post-shipment rupee export credit up to
CRR from 14.0 per cent to 1 3.5 per cent on April 27, 1996 and further to 13.0 per cent o n May 1 1 , 1996. The C M was lowered further to 12.0 per cent with the same objective from July 6,1996. Considering the advantages of rationalisation of the CRR-export refinance trade-off, the CRR was further reduced by one percentage point in two phases of 0.5 percentage point each to 1 1.0
After September 13, 1997, the interest rates charged as a temporary measure, refer to the date of actual advance as against the earlier position when it referred to the date of shipment.

Banking Developments and Policy Pe~pectives
per cent effective from October 26, 1996 and November 9, 1996, respectively. These reductions of CRR freed cash balances and augmented the lendable resources of t h e scheduled commercial banks by about Rs. 13,575 crore during 1996-97 upto November 1 996. Finally, CRR was brought down to 10.0 per cent in two phases of 0.5 percentage point each fiom the fortnights beginning January 4 and 18, 1997, respectively. This measure released additional primary liquidity of Rs. 4,275 crore for the SCBs. Thus, in all, t h e total amount released through CRR cuts amounted to Rs. 1 7,850 crore during t h e fiscal year 1986-97. These measures have significantly strengthened the liquidity position of t h e SCBs. In accordance with t h e stance of Monetary Policy of phased reduction in statutory pre-emption of banks' resources, a 2 percentage point reduction in CRR (in eight phases) was announced on October 21, 1997 with the first reduction effective October 25, 1997. The eight-phase reduction in CRR is expected to release Rs.9,600 crore of liquidity to the banking system.
Removal of Reserve Requirements on Inter- Ban/< Liabilities
1.17 With a view t o facilitating the development of a more realistic rupee yield curve and term money market, inter-bank liabilities were exempted (except for a statutory minimum) from maintenance of CRR of 10 per cent, effective from April 26, 1997, thereby releasing lendable resources to the tune of Rs. 950 crore. As against the earlier system where positive net inter-bank liabilities were required to be part of the NDTL for the purpose of CRR, the present system exempts the inter-bank liabilities from s u c h calculation, provided a minimum CRR of three per cent is maintained on the overall NDTL inclusive of net inter-bank liabilities.
Reserves on Non-Resident Deposits
1'18 In order to bring all t h e liabilities under the scope of reserve requirements, effective kom April 26, 1997, non-resident deposits,
hitherto exempted from maintenance of CRR, were brought under the CRR prescription with a requirement of 10 per cent CRR on the incremental liabilities in respect of FCNR(B), NRE and NRNR deposit schemes over the level outstanding as on April 1 1, 1997.
Statutory Liquidity Ratio
1 . 1 9 With progressive rationalisation of the statutory pre-emption of lendable resources of banks facilitating their allocation on commercial principles, the overall effective Statutory Liquidity Ratio (SLR) came down to 26.7 per cent at t h e end of March 1997 from 28.0 per cent a year ago. The SLR requirement o n outstanding NRE deposits was reduced to 25.0 per cent from 30.0 per cent, with effect from April 13, 1996. Besides, all SCBs (excluding RRBs) were exempted from maintenance of SLR on liabilities to banking system (except for statutory minimum), effective April 26, 1997. Effective October 22, 1997, the multiple prescriptions of SLR were withdrawn in favour of a single SLR which was placed at 25 per cent.
1.20 With a view to enhancing the liquid assets at the disposal of NBFCs, increased liquidity requirement was prescribed in June 1997. Accordingly, Loan and Investment companies which are presently maintaining liquid assets at 5 per cent will be required to maintain 7.5 per cent and 10.0 per cent of their deposits in Government and other approved securities, effective January 1 and April 1 , 1998, respectively. For other NBFCs, t h e liquidity requirement is raised to 12.5 per cent and 15 per cent, respectively of their deposits, effective the above dates. The resultant increase i n liquid assets will strengthen the protection available to the depositors and ensure healthy functioning of the NBFCs. In a bid to keep these liquid assets unencumbered, the Reserve Bank directed that these securities be kept in the custody of a scheduled commercial bank designated by t h e NBFCs for th is purpose.

Report on Trend and Progress of Banking in India, 1996-97
Morley Market Developments
Certiflcc~ te of Deposits
1.21 With a view to widening the money market, the minimum size of issue of Certificate of Deposits (CDs) to a single investor was reduced From Rs. 10 lakh to Rs.5 lakh with effect from October 22, 1997. CDs above Rs.5 lakh will be in multiples of Rs. 1 lakh.
Routing of Tr<~nsactions Through Primary Dealers
1.22 The Monetary and Credit Policy announced on October 2 1 , 1997 also reduced the minimum lending limit in the call money market routed through Primary Dealers from Rs. 10 crore to Rs.5 crore.
Investment by Money Market Mutual Funds
1.23 Money Market Mutual Funds (MMMFs) are required to invest exclusively in call/notice money, Certificate of Deposits (CDs), Commercial Paper (CP), commercial bills arising out of genuine trade/commercial transactions and Treasury bills and dated Government securities having an unexpired maturity upto one year. With a view to providing flexibility for MMMF Schemes, effective October 22, 1997, MMMFs have been allowed to invest in rated corporate bonds and debentures with a residual maturity upto one year, within prescribed prudential limit.
Improving Credit Delivery System
Loan System for Delivery of Ban/< Credit
1.24 As a measure of imparting an element of discipline in the utilisation of bank credit, the percentage of 'loan component' in the working capital credit limit had been enhanced i n stages for borrowers with working capital credit limits of (a) Rs. 10 crore or above and less than Rs. 20 crore and (b) Rs. 20 crore or above. With effect from October 22, 1997, the 'loan component' level has been made uniform a t 80 per cent for the above categories
of borrowers.
Bill finance for Settlement of Dues of SSI Suppliers
1.25 With a view t o ensuring prompt settlement of dues of SSI units and also for encouraging bill culture, banks were advised to ensure that with effect from January 1, 1998, of the total inland credit purchases of the borrowers, not less than 25 per cent should be through bills drawn on them by the concerned sellers.
Bridge Loans
1.26 Banks have been permitted to sanction bridge loans to companies against expected equity flows/issues effective October 22, 1997. As a prudential measure, it has been stipulated that period of such bridge loans should not exceed one year and should be accommodated within the ceiling of 5 per cent of incremental deposits prescribed for individual bank's investment in shares.
Debt Market
Government Securities Market
Primary and Satellite Dealers
1.27 The institutional infrastructure in Government securities market has been strengthened with the system of Primary Dealers (PDs) announced in March 1995 and that of Satellite Dealers (SDs) in December 1996.
1.28 At present six PDs are in operation. With a view to providing incentives to develop t h e secondary market in Government securities, effective July 10, 1 996, the Reserve Bank introduced 'a system of payment of commission t o PDs on their purchases (including devolvement) of Government securit ies th rough subscriptions in all f loatations in t h e primary market. Subsequently, on June 2, 1997, the system of payment of commission was replaced with payment of underwriting fee on underwriting amount offered by PDs on voluntary basis,

Banking Developments and Policy Perspectives 7
through competitive bidding. In order to improve their liquidity position, PDs were allowed to tap the Commercial Paper (CP) market in September 1996. They were also permitted to participate in the call/notice/term money market, both as lenders and borrowers, so as to impart flexibility in the use of their funds. It was also announced that the norm of five per cent of total transactions in Government securities entered into by banks during a year for each of the approved broken would not be applicable to banks dealing through PDs. In April 1 991, certain institutions were given access to the calllmoney market as lenders under specified restrictions including the provision that the transactions should be routed through the Discount and Finance House of lndia (DFHI). With effect from the fortnight beginning April 26, 1997 the facility of routing such transactions was extended to all the Primary Dealers. At the same time, the minimum size of a transaction was reduced from Rs. 20 crore to Rs. 10 crore. This has been further reduced to Rs. 5 crore effective October 22, 1997.
Introduction of 28-day Treasury Bills
1 2 In order to help the cash management requirements of various segments of t h e economy, the Monetary and Credit Policy for the second half of 1997-98 announced t h e introduction of 28-day Treasury Bill on auction.
In troduction o f Uniform Price Auction
1.30 With a view to eliminating the problem of 'winners' curse' and broaden the market participation, the Monetary and Credit Policy for the second half of 1997-98 announced the introduction of uniform price auction method in respect of 91 -day Treasury Bills.
Issue Amounts to be Notified in respect of all Auctions
1.31 The amounts of issue of 91-day Treasury bills and dated securities are presently indicated, while the amounts are not notified In respect of 364-day and 14-day Treasury Bills auctions. The Monetary and Credit Policy
for the second half of 1997-98 announced the introduction of the practice of notifying amounts in the case of all the auctions, including 364-day and 14-day Treasury Bills.
Investments by FIls with 30 per cent Ceiling in Government Dated Securities
1.32 Presently, Foreign Institutional Investors (Flls) in t h e category of 100 per cent debt funds are permitted to invest in Government dated securities. The Monetary and Credit Policy for the second half of 1997-98 announced that Fils registered with SEBI and approved by t h e Reserve Bank will be allowed to invest in Government dated securities within a ceiling of 30 per cent.
Retailing of Government Securities by Banks
1.33 In order to promote the retail segment and to provide greater liquidity to retail investors, it was announced in the Monetary and Credit Policy on October 21, 1997 that banks will be allowed to freely buy and sell Government securities on an outright basis at the prevailing market prices, without any restriction on t h e period between sale and purchase.
Bonds and Private Debt Marltet
Ready Forward Transactions in PSU Bonds and Private Debt Securities
1.34 The Monetary and Credit Policy for the second half of 1997-98 announced that ready forward transactions will be allowed in PSU bonds and private corporate debt securities if they are held in dematerialised form in a depository and t h e transactions are done in recognised Stock Exchanges.
Prudential Regulations and Supervision
Pruden tial Accounting Standards
1.35 As a rationalisation of the existing norms for provisioning of non-performing assets (NPAs), banks were directed that the brrowal accounts need not b e treated as NPA as on the date of balance sheet even though there could be defaults in any two quarters

Report on Trend and Progress of Sanklng In India, 1996-97
earller, provided that the accounts have been regularised before the balance sheet date by repayment of overdue amount through genuine sources. Besides, an account with potential threat to recovery should straightway be classified as a doubtful or loss asset as appropriate, Irrespective of the period for which it has remained a non-performing asset. Banks were required to classirjl advances with balances below Rs.25,000 into performing and non-performing and make a provisioning of 15.0 per cent of the aggregate amount outstanding for the year 1996-97 as against 10.0 per cent in the preceding year. They were Instructed to classify such advances into the usual four asset category with appropriate provisioning from the fiscal year 1998-99. Banks are required to treat advances granted for agricultural purposes as NPAs, where interest/instalment is in arrears for more than two quarters from the due date for repayment, with effect from the accounting year ending March 1998.
1.36 Under the new norms, banks' income from dividend on shares of corporate bodies and units of mutual funds were required to be booked on cash basis. The new private sector banks acquiring Government securities at market related interest rates were required to 'mark-to-market' their entire portfolio of approved securities from the financial year 1996-97 onwards. For others (i.e., excluding new private sector banks) the required 'mark- to-market' proportion was set at 50.0 per cent for the year 1996-97 and further a t 60.0 per cent for 1 997-98.
Write Back of Excess Provision Towards Depreciation on In vestments
1.37 Consequent upon the softening of interest rates in 1996-97 vis-a-vis 1 995-96, and the resultant change in Yield t o Maturity (YTM), the depreciation provided on investments held by banks as at the end of
1995-96 turned out to be in excess of the requirement for t he same for 1996-97. In view of the fact that banks are yet to mark their entire portfolio of investments t o market, the Reserve Bank directed the banks to take such excess provision made towards depreciation in investments held by them to profit and loss account as a credit item and thereafter transfer the sum to Capital Reserve Account by way of 'Appropriation' in profit and loss account . The amount to be transferred to Capital Reserve Account shall be determined net of taxes, if any, and net of transfer t o statutory reserve as applicable to such excess provision.
Banlts ' Access to Capital Market and Capital Adequacy
1.38 Eight nationalised banks which could not attain the prescribed Capital to Risk Assets Ratio (CRAR) of eight per cent by end-March 1996, were given one year extension t o reach the prescribed ratio subject t o certain restrictions, such as, modest growth in risk weighted assets, containment of capital expenditure, branch expansion, etc. However, by end-March 1997, only 2 PSBs viz. UCO Bank and Indian Bank could not attain the prescribed CRAR Four public sector banks were permitted during the year t o raise subordinated debt through private placement for inclusion under Tier I1 capital for capital adequacy purposes2. Besides, th ree nationalised banks raised a sum of Rs. 1,705 crore during the year through public issues of their shares3. The State Bank of lndia (SBI), tapped the Global Depository Receipt (GDR) market with an issue of 2.614 crore GDRs convertible into 5.228 crore equity shares of Rs. lo/- each at a premium of Rs.233 per share. As a result, the equity capital of SBI increased by Rs.52.28 crore with non-resident share a t 19.8 per cent of the paid-up capital.
The amounts permitted to be raised by these banks were as under : Punjab National Bank (Rs. 190 crore), State Bank of Mysore (Rs.70 crore), State Bank of Travancore (Rs.25 crore) and State Bank of Bikaner and jaipur (Rs.40 crore).
Dena Bank (Rs. 180 crore), Bank of Baroda (R5.850 crore) and Bank of lndia (Rs.675 crore).

Banking Developments and Policy Perspectives 9
Deposit Insurance
1.39 A committee was se t up a t the initiative of the Association of Leasing and Finance Service Companies to work out a scheme to safeguard deposit holders' interests in NBFCs. The Committee is expected to submit its report shortly.
Supervision
1.40 As part of the system of integrated supervision of the financial sector, the Board for Financial Supervision (BFS) continued to supervise the All lndia Financial Institutions (Fls) and NBFCs, besides commercial banks.
1.41 The Working Group to Review the System of on-site Supervision Over Banks (Chairman: Shri S. Padmanabhan) in its report submitted in November 1995 had recommended far reaching changes in bank inspections, including targetted appraisals of major portfolio and control system along with periodical full scale statutory inspections, discriminative approach to supervision and inspection by separating sound and problem banks with greater focus on the latter, introduction of a rating methodology for the banks o n the lines of widely adopted CAMEL model and a focussed approach to follow-up on inspection reports and supervisory intervention. According to this Committee, supervisory examination should be directed to assessments of three broad areas - (a) financial condition and performance which should include appraisal of asset quality, solvency and capital adequacy, earning performance and liquidity; (b) management and operating environment which should assess the adequacy and quality of management, decision making process and management control procedures; and (c) regulatory compliance which should include assessment of legal and regulatory directives to all banks, regulatory or supervisory direction specific to a bank and policy prescription.
1.42 The nature and extent of regulation and supervision of the NBFG will be based on three important criteria, viz., the size of
deposits, t h e type of activity, and t h e acceptance or otherwise of public deposits. The main thrust of supervision of NBFCs will be through an appropriate mechanism of off- site monitoring based on returns duly certified by the auditors of the company. Companies with asset size of Rs. 100 crore and above have been asked to furnish an annual return giving the comparative position of their operational data for three years in regard to different items of their balance sheet, profit and loss account and key ratios. The companies which were registered under the earlier scheme and those which will be registered in future, will be required to furnish a half-yearly return o n prudential norms, certified by their auditors. Analysis of these returns could trigger on-site inspections of some of the companies. N B F G with sizable assets a s well as NBFCs whose off-site monitoring throws up signals of unhealthy financial position or non-compliance with the directives/prudentiaI norms, would be inspected periodically. The on-site inspection of NBFCs will be carried out on CAMELS approach i.e., Capital Adequacy, Asset Quality, Management, Earnings, Liquidity and Systems.
Restructuring of Banlts
Revival Pacl~ige for Public Sector Banlcs
1.43 Following t h e consultants' reports on the UCO Bank and the United Bank of lndia, the relevant turnaround packages are being finalised in consultation with the Government of India. In this regard, the UCO Bank has prepared a fresh three year Strategic Revival Plan. The turnaround strategy for the Central Bank of India has been finaiised and t h e Reserve Bank has conveyed its recommendations to the Government of India. It may be noted that a detailed quarterly / monthly monitoring system has been introduced with effect from the quarter ended December 1996 and March 1 997 respectively, for closer monitoring of performance of these

Report on Trend and Progress of Banking In India, 1 !226-97
weak banks. In respect of the Indian Bank, the consultant's final report is under examination. The bank's performance is being monitored on a monthly basis since September 1996. Besides, all the nattonalised banks have submitted documents containing perbrmance obligations and commitments required on their part for 1996-97 as per the discussions held in this regard in MoU meetings with their respective Chief Executives.
Recapitalisation of Public Sector Banl<s
1.44 Towards recapitalisatlon of six public sector banks, t he Government of lndia contributed a sum of Rs. 1,509 crore during the year 1 996-97.4 The Indian Overseas Bank and the Allahabad Bank were permitted by the Government to reduce their paid up capital a s on March 31, 1996 against their accumulated losses to the extent of Rs. 1,000 crore and Rs. 532 crore, respectively. In order to ensure improved earning per share, three nationalised banks were allowed to return to the Government an aggregate equity capital of Rs.504 ~ r o r e . ~
1.45 The State Bank of lndia and the Oriental Bank of Commerce approached the capital market in December 1993 and October 1994 a t an issue price of Rs. 100 and Rs. 60, respectively. During 1996-97, the Dena Bank and the Bank of Baroda issued their scrips at issue prices of Rs. 30 and Rs. 85, respectively. The shares of the State Bank of lndia (SBI), the Bank of Baroda (BOB), and the Bank of lndia (BOI) were some of the most actively traded stocks during 1996-97. Due to the special status of SBI as a key market pivotal, it was one of the most sought after shares in the market.
Transactions in Covernment Dated Securities by Foreign institutional Investors
1.46 In March, 1997, the Reserve Bank specified the manner in which the FlIs ( 100 per cent Debt Funds) were allowed to transact in Government securities. The Flls can invest in Government dated securities including those of Government of India and the State Governments but not in the Treasury Bills issued by the former. Such investments may be made either in the primary market or in the secondary market through the banks authorised by the Reserve Bank to act a s bankers t o Flls. Further, investments in Government dated securities will be allowed only in the form of Subsidiary General Ledger (SGL) Account a n d secondary market transactions by Flls will be permitted only through recognised Indian Stock Exchanges or Over-the-counter with SGL account holders and will be governed by 'Delivery versus Payment' system of the Reserve Bank. It has been announced in the Monetary and Credit Policy for the second half of 1997-98 that Flls with a ceiling of 30 per cent investment in debt instruments will be permitted to invest in Government dated securities within the ceiling of 30 per cent.
Banl<s Allowed Freedom to Invest Foreign Currency Funds
1.47 Effective September 1 1 , 1997, the Reserve Bank has given the bank Boards freedom for laying down norms for investing abroad foreign currency funds held in their boolcs in India without earlier rating stipulations (A1 plus by Standard and Poor and PI by Moody's). Bank Boards can now lay investment guidelines taking into account factors like country risk and fixing of counter party limits.
The mount contributed by the Government of lndia to different banks were as follows: Andhra Bank (Rs. 165 crore), Central Bank of lndia (Rs.500 crore), Punjab and Sind Bank (Rs. 150 crore), UCO Bank (Rs.54 crore), United Bnnk of lndia (Rs.338 crore) and Vijaya Bank (Rs.302 crore).
The amounts returned by the banks were as follows : Bank of Baroda (Rs. 381 crore ). Corporation Bank (Rs. 30 crore) and Bank of India (Rs. 93 crore )
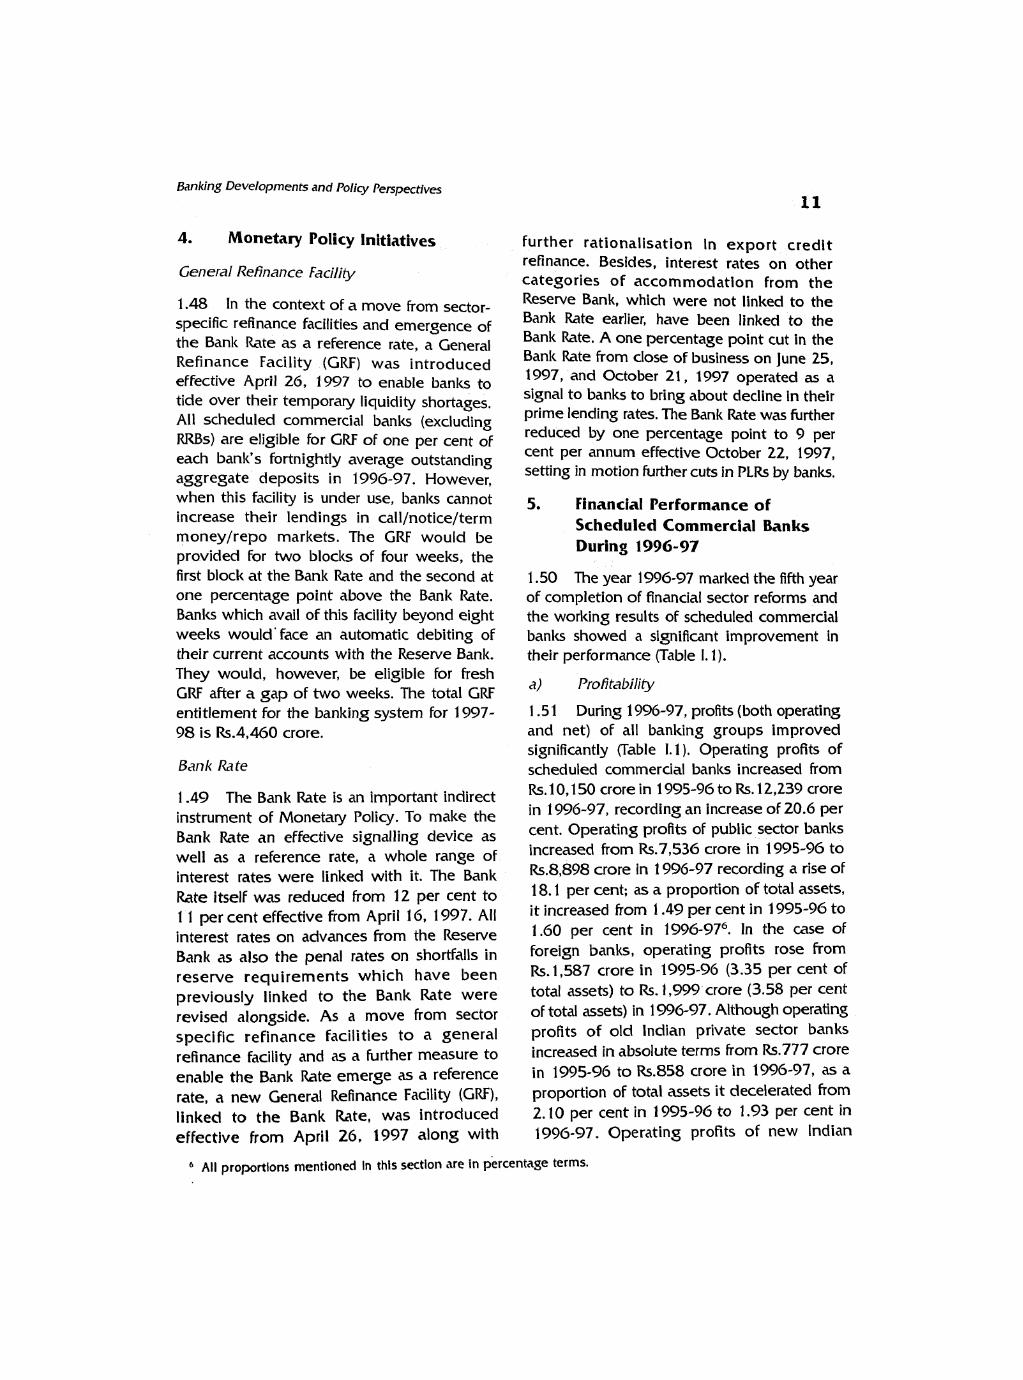
Banking Developments and Policy Perspectives
4. Monetary Policy Initiatives
General Refinance Facility
1.48 In the context of a move from sector- specific refinance facilities and emergence of the Bank Rate as a reference rate, a General Refinance Facility (GRF) was introduced effective April 26, 1997 to enable banks to tide over their temporary liquidity shortages. All scheduled commercial banks (excluding RRBs) are eligible for GRF of one per cent of each bank's fortnightly average outstanding aggregate deposits in 1996-97. However, when this facility is under use, banls cannot increase their lendings in call/notice/term money/repo markets. The GRF would be provided for two blocks of four weeks, the first block at the Bank Rate and the second at one percentage point above the Bank Rate. Banks which avail of this facility beyond eight weeks would'face an automatic debiting of their current accounts with the Reserve Bank. They would, however, be eligible for fresh GRF after a gap of two weeks. The total GRF entitlement for the banking system for 1997- 98 is Rs.4,460 crore.
Ban/< Rate
1.49 The Bank Rate is an important indirect instrument of Monetary Policy. To male the Bank Rate an effective signalling device as well as a reference rate, a whole range of interest rates were linked with it. The Bank Rate itself was reduced from 12 per cent to 1 1 per cent effective from April 16, 1997. All interest rates on advances from the Reserve Bank as also the penal rates on shortfalls in reserve requirements which have been previously linked to t h e Bank Rate were revised alongside. As a move from sector specific refinance facilities to a general refinance facility and as a further measure to enable the Bank Rate emerge as a reference rate, a new General Refinance Facility (GRF), linked to the Bank Rate, was introduced effective from April 26, 1997 along with
further rationalisation in export credit refinance. Besides, interest rates on other categories of accommodation from the Reserve Bank, which were not linked to the Bank Rate earlier, have been linked to the Bank Rate. A one percentage point cut in the Bank Rate from close of business on June 25, 1997, and October 21, 1997 operated as a signal to banks to bring about decline in their prime lending rates. The Bank Rate was further reduced by one percentage point to 9 per cent per annum effective October 22, 1997, setting in motion further cuts in PLRs by banks.
5. Financial Performance of Scheduled Commercial Banks During 1996-97
1 .SO The year 1996-97 marked the fifth year of completion of financial sector reforms and the working results of scheduled commercial banls showed a significant improvement in their performance (Table I. 1).
a) Profitability
1.5 1 During 1996-97, profits (both operating and net) of all banking groups improved significantly (Table I. 1 ). Operating profits of scheduled commercial banlzs increased from Rs. 10, 1 SO crore in 1 995-96 to Rs. 12,239 crore in 1996-97, recording an increase of 20.6 per cent. Operating profits of public sector banks increased from Rs.7,536 crore in 1995-96 to Rs.8,898 crore in 1996-97 recording a rise of 18.1 per cent; as a proportion of total assets, it increased from 1.49 per cent in 1995-96 to 1 .GO per cent in 1996-976. In the case of foreign banks, operating profits rose from Rs. 1,587 crore in 1995-96 (3.35 per cent of total assets) to Rs. 1,999 crore (3.58 per cent of total assets) in 1996-97. Although operating profits of old Indian private sector banks increased in absolute terms from Rs.777 crore in 1995-96 to Rs.858 crore in 1996-97, as a proportion of total assets it decelerated from 2.10 per cent in 1995-96 to 1.93 per cent in 1996-97. Operating profits of new Indian
a All proportions mentioned in this section are in percentage terms.

Report on Trend and Progress of Banking In India, 1996-97
scheduled Commercial Banks - Group-wise : portant Financial Indicators - 1995-96 and 1996-97
Profit (4-7) (5+6) Income Interest ture Expended Operating iL Conti- (3+ 10) Income (8+9+ 10) Expenses ngencies
State Bank Group (8)
1995-96
Natlonallsed Banks (19)
1995-96
Publlc Sector Banks (27)
1995-96
Forelgn Banks in India (39)
1995-96
Old Indian Private Sector Banks (25)
1995-96 776.94 390.80 4,332.02 3,754.69 577.33 3,941.22 2,593.00 962.08 386.14 (2.10) (1.06) (11.71) (10.15) (1.56) (10.65) (7.01) (2.60) (1.04)
1996-97 857.91 409.36 5,401.65 4,744.90 656.75 4,992.29 3,431.19 1,112.55 448.55 (I .93) (0.92) (12.15) ( 10.67) (1.48) (1 1.23) (7.72) (2.50) (1.01)
New Indian Private Sector Banks (9)
Scheduled Comm- erchl Banks (1 00)
1995-9G 10,149.92 939.45 65,057.95 56,082.43 8,975.52 G4,1 18.50 37,319.a 17,588.97 9,210.47 ( 1 -69) (0.16) ( 10.86) (9.36) ( 1.50) ( 10.70) (6.23) (2.94) ( 1.54)
1996-97 12,239.49 4,578.02 76,241.81 66,499.58 9,742.23 71,663.79 44.861.06 19.141.26 7.661.47 ( I .82) (0.68) ( 1 1.33) (9.88) (1.45) ( 10.65) (6.67) (2.85) (1.14)
Note r Figures in brackets are percentages to Total Assets.

Banking Developments and Policy Perspectives
private sector banks increased From Rs.250 crore (2.77 per cent of total assets) in 1995- 9 6 to Rs.484 crore (3.01 per cent of total assets) in 1996-97. Due to write back of depreciation provision reflecting lower yields on Government paper, banks' provisioning requirements regarding 'mark-to-market' proportion of investments in Government securities were generally lower. Consequently, net profits of scheduled commercial banks increased sharply from Rs.939 crore in 1995- 96 to Rs.4,578 crore in 1996-97 showing a rise of as much as 387.31 per cent. As a proportion of total assets, net profits increased from 0.16 per cent in 1995-96 to 0.68 per cent in 1996-97. Among the banking groups, net profit ratio (i.e., net profits to total assets ratio) distinctly improved in the case of public sector banks but decelerated in the case of foreign banks and old Indian private sector banls and new private sector banks during 1996-97. The net profit ratio of public sector banks registered a turnaround during 1996- 97 - from -0.07 per cent in 1995-96 to 0.56 '
per cent in 1996-97. On the other hand, the net profit ratio of old Indian private sector banks decelerated from 1.06 in 1995-96 to 0.92 in 1996-97. Similarly, the net profit ratio of foreign banks decelerated from 1.58 in 1995-96 to 1.41 in 1996-97.
) Spread
1.52 Net interest income (spread) of scheduled banks (i.e., interest income minus interest expended) has shown an increase of 9 basis points From 3.13 in 1995-96 to 3.22 in 1 996-97. In the case of public sector banks, net interest income increased by 8 basis points i.e., from 3.08 in 1995-96 to 3.16 in 1996-97 while for old lndian private sector banks there was a decline of 1 8 basis points, from 3.14 to 2.96 during the same period. In the case of new private sector banks, the increase in net interest income was of the order of 7 basis points, Foreign banks generally have a relatively higher spread. For foreign banks, the increase In net interest income was as high as 35 basis points (kom 3.74 to 4.09).
C) Non- Performins Assets
1.53 The quantum of non-performing assets (NPAs) as a percentage of advances is one of the critical indicators of t h e quality of a bank's loan portfolio and hence of its overall health. In this connection, one has to make a distinction between gross and net NPAs of banks. Net NPA is derived from gross NPA by excluding (i) balance in interest suspense account i.e. interest due but not received, (ii) DICGC/ECGC claim received and kept in suspense account pending adjustment (for final settlement), (iii) part payment received and kept in suspense account, and (iv) total provisions held. Net NPA is t h e concept which is internationally recognised as relevant.
1.54 The net non-performing assets of nationalised banks as a per cent of net advances declined from 10.14 in 1995-96 to 10.07 in 199697. However, in absolute terms, it increased from Rs. 12,935.5 crore in 1995- 96 to Rs. 1 3,902.7 crore in 1 996-97. For public sector banls as a group, the ratio of net non- performing assets to advances increased from 8.90 per cent in 1995-96 to 9.18 per cent in 1996-97 (See Appendix Table I. 1 (A)). Net NPAs of Public Sector Banks increased marginally from Rs. 18,297.5 crore (8.90 per cent) in 1995-96 to Rs.20,284.7 crore (9.18 per cent) in 1996-97. The priority sector advances accounted for 47 per cent of t h e total NPAs and non-priority sector advances for t h e balance. In the case of State Bank of
Table 1.2 A: Frequency Distribution of Net NPAs: Public Sector Banks
(No. of banks)
Net NPAs End-March
1. Upto 10 per cent 2 19 17
2. Above 10 and upto 2 0 per cent 15 6 9
3. Above 20 per cent 10 2 I

24 Report on Trend and Progress of Banking in India, 1996-97
lndla Group, net NPA as a proportion of net advances increased from 6.88 per cent in 1995-96 t o 7.70 per cent in 1996-97. The net NPA ratio of old lndian private sector banks was considerably lower than that of public
Net NPAs End-March sector banks but increased from 4.5 1 per cent in 1995-96 t o 5.99 per cent in 1996-97
Old Indian Prfvate Sector Banks 1, Upto 10 per cent 22 23 2. Above 10 and upto
20 per cent 3 2 3. Above 20 per cent Nil Nil
New Prlvatc Sector Banks 1 . Upto 10 per cent 9 9 2. Above 10 and upto
20 per cent Nil Nil 3. Above 20 per cent Nil Nil
Forelgn Banks In lndla 1. Upto 10 per cent 2. Above 10 and upto
(Appendix Table I. 1 (B)). The new private sector banks had the lowest net NPA ratio of 2.07 per cent in 1996-97. Foreign banks as a group also had a lower net NPA ratio of 2.50 per cent in 1996-97 (0.81 per cent in 1995-96) (Appendix Table I. 1 (C)).
1.55 Out of the 2 7 public sector banks, only one had net NPAs of more than 20 per cent of its net advances in 1996-97 as against 2 such banks in 1995-96 (Table 1.2 A and
30 36* Appendix Table I. 1 (A)). None of the lndian private sector banks - both old and new - had
20 per cent 1 1 net NPAs above 20 per cent whereas two 3. Above 20 per cent Nil foreign banks had net NPAs abo& 20 per
'Out of 36 foreign banks, 16 banks had nll NPA as cent in 1996-97 (Table 1.2 B and Appendix compared with 12 (out of 30) in 1995-96. Tables I.l(B) and I.l(C)).
le 1.3 A : Frequency Distribution of CRAR : Public S
Banks 1 995-96 199697
Below Between Between Above Below Between Between Above 4 per cent 4-8 8- 10 per 10 per 4 per 4-8 per 8-1 0 per 10 per
per cent cent cent cent cent cent cent
1. SBI - - - 1 - - 1 2.SBI Associates - - 6 1 - - 3 4 3. Nationalised Banks 5 3 7 4 2 - 6 1 1
Total 5 3 13 6 2 - 9 16
Table 1.3 B : Frequency Distribution of CRAR : Indian Mate Sector and Foreign Banks
Banks 1996-97
Below 4 Between 4-8 Between 8-1 0 Above 10 per cent per cent per cent per cent
1 2 3 4 S Old Indian Private Sector Banks 3 1 8 - 13 New Private Sector Banks - - CI
Foreign Banks / - - 14 24

Banking Developments and Policy Perspectives
d) Capital to Rislc Weighted Assets Ratio (CRAR)
1.56 Capital adequacy ratio of public sector banks improved from 8.7 per cent in 1995- 96 to 10.0 per cent in 1996-97. Out of the 27 public sector banks, 25 banks (1 9 banks last year), have attained the stipulated 8 per cent capital adequacy requirement. During 1996-97, 16 banks had CRAR exceeding 10 per cent (6 banks last year) while 9 banks' CRAR ranged between 8 to 10 per cent (Tables 1.3A and B and Appendix Table 1.2A). During 1996-97, banks with CRAR less than 4 per cent were only 2 as opposed to 5 last year. The generally favourable development in this area has been facilitated to a considerable extent by large-scale recapitalisation of public sector banks. Among the Indian old private sector banks, 2 banks had capital adequacy ratio below 8 per cent in 1995-96 while all the foreign banks exceeded t h e minimum capital adequacy ratio (Table 1.3 B).
6. Payments and Settlement System
1 -57 Safe and efficient operation of money, capital and foreign exchange markets critically hinges upon the smooth functioning of the payments and settlement system. Continuous adoption and upgradation of technology is essential for this purpose. One of the important recommendations of t h e Saraf Committee on Technology Issues relates to the setting up of a Very Small Aperture Terminal (VSAT) Network to provide reliable communication s e t up for the financial sector. The recommendations of the Committee relating t o the Cheque Clearing and Securities Settlement in the Banking Industry are in different stages of implementation. A Working Group has been constituted to look into the various aspects of replacement/upgradation of the existing cheque processing systems at the four National Clearing Centres (NCC). The set t ing u p of t h e HUB and network management system at the Reserve Bank sponsored lnstitute for Development and Research in Banking Technology (IDRBT) at Hyderabad Is In the Anal stages. The lnstitute
would provide research and consul tancy services o n information technology to the financial sector, in general, and to the banking sector, in particular.
7. Overlapping Functions of Banks and Financial 1 nstltutior~s
1.58 In recent years there is a n increasing convergence in the asset-liability structure of banks and financial institutions. With the drying up of concessional Long-Term Operations (LTO) funds from the Reserve Bank in the early 1990s, Fls have increasingly raised resources at the short end of the deposit market. Besides, they have entered increasingly into worlting capital financing. Commercial banls, on their part, have increasingly moved to term lending paving way for universal banking.
8. Perspectives
Impact of Financial Sector Reforms
1.59 The improved performance of banks during 1996-97 essentially reflects the benefits arising from financial sector reforms. The relatively clean and healthy balance sheets for the year represent t h e advantages reaped I from the removal of external constraints on
-
banks and from 'prudential regulation'. The efforts made for meeting capital adequacy requirements in particular stand as significant achievements. The policy initiatives in t h e form of substantial reduction in statutory pre- emptions (in t h e form of CRR and SLR) and the removal of reserves on inter-bank liabilities (except for a statutory minimum) have considerably increased the lendable resources of banks, thereby extending a downward pressure on the prime lending rates of banks. The reactivation bf the Bank Rate as the focal point of interest rate structure has further triggered reduction in PLR in recent months and has sharpened the potential efficacy of open market operations. Thus, the Bank Rate has so far functioned as a signalling rate and it is expected that In future this rate would become a reference rate.

Report on Trend and Progress of Banklng in India, 1996-97
Interest Rate
1 .GO With abundant liquidity, the interest rates have shown a clear downward movement. This is reflected in the yields of Treasury Bills of all maturities and dated securities. There has also been s o m e realignment of deposit rates along with downward movement of PLRs of banics. The lending rates of banks are at the lowest level since 1988.
1.61 The management of the investment portfolio of the commercial banks will also require greater attention, since the prices of the securltles will be affected with changes in interest rates. Therefore, the maturity pattern of the investment portfolio, and the distrlbution according t o instruments are matters which must receive the attention of banks. Besides, attention needs to be paid to the existing and expected levels of interest rates.
Financial Sounc/ness
1.62 In trying to improve the financial health and credibility of banks, a major step that has been undertaken to introduce internationally accepted prudential norms relating to income recognition, asset classification, provisioning and capital adequacy. While it is recognised that strict prudential norms are extremely important in ensuring t h e soundness and solvency of commercial banks, questions are sometimes raised as to the relevance of the prudential norms and more particularly with those relating to capital adequacy. It is true that the eight per cent norm cannot be operated like a 'one size fits all' formula. This reflects only the minimum and it is for each regulatory authority to prescribe capital ratios for individual banks. The merit of the eight per cent prescription is that it is superior t o a regime w h e r e the re w e r e n o such prescriptions and for countries introducing these norms, the objective has to be to attain this minimum in the initial phase and then make the prescription bank specific. The argument that government banks d o not have to follow prescribed capital adequacy ratios
as public are indifferent t o t h e level of capitalisation in a public sector bank does not recognise the fact that banks are commercial entities and not departments of government. Capital is a cushion against losses. Just because banks are owned by government does not mean that the intrinsic commercial element is to be ignored.
1.63 One criticism of capital adequacy requirements is that banks prefer investments in risk free securities. In several countries where capital adequacy norms w e r e introduced, there was initially some degree of down-sizing of assets. Nevertheless, in the Indian context, the introduction of capital adequacy requirements has not been t h e prime reason for higher investments in government securities. For example, in 1994- 95 and 1995-96, non-food credit expanded by 29.8 per cen t and 22.6 pe r cen t respectively, despite the fact that these were the years when the pressure was exerted to maintain capital adequacy requirement. The reasons for larger investments in government securities in subsequent years must be traced to other reasons. Nevertheless, this ratio does emphasize the need for banks t o have a balanced portfolio between risk-free assets and risk-assets.
Need for Enhancing Credit Off-take
1.64 During 1996-97 significant improvements in returns t o banks have occurred on account of treasury operations rather than lending. The growth in bank credit was sluggish, reflecting in part the deceleration of industrial activity. Against this backdrop, a point was made that banlcs were cautious in respect of fresh lending for fear of creating fresh NPAs. It must, however, be recognised that there is nothing like zero-risk lending (risk avoidance) and t h e banks have t o take appropriate risk through extension of credit which is vital to the growth and stability of the economy. It is essentially for this reason that banks were allowed substantial freedom in regard to credit delivery. It is necessary t o recognise that not all borrowers have access

Banking Developments and Policy Perspectives
to external resources l i ke capital market, external commercial borrowings, and other non-banlz sources. The borrowers with no or limited access to external resources would be adversely affected if bank credit to them is denied or even restricted especially in cases where they have good track record of credit utilisation and repayments.
1.65 In view of low credit off-take for worlzing capital purposes, banks tended to look for opportunities for investment for maintaining profitability. But as of now, investment portfolios of banks are largely dominated by the presence of Government securities which, notwithstanding the presence of Primary Dealers (PDs), do not have active secondary market and retailing. While PDs and the emergence of satellite dealers (SDs) could help retailing of Government securities, it is necessary to take further initiatives in this area, essentially to provide banks with flexibility to switch over from one portfolio/asset to another, and to help improve effectiveness of open market operations as a n instrument of Monetary Policy.
Competition and Autonomy
1.66 Consumers of banking services are getting increasingly agile, enlightened, cost and quality conscious exerting in the process, pressures for effective competition in t h e banking industry. Competition, should not b e construed to mean that banks cannot enter into strategic alliances. In fact, strategic co- operation would give banks a competitive edge over other banks and other financial intermediaries. By forging strategic alliances, without undermining competition, banks would be better enabled to face greater risks on account of deregulation of financial markets and the trend towards globalisation. In this context, it is important that to ensure efkctive competition in a market dominated by public sector banks, they are given greater autonomy in the conduct of their operations. In the process, they could be made genuinely accountable than at present. This issue needs to be part of the agenda of the 'second phase' of banking sector reforms.
1 .G7 The increasing competition among financial intermediaries like banks, Fls, and NBFG has led to an overlap in their activities. Given the increasing convergence of asset- liability structure of banks, Fls and NBFCs, two imperatives need to be given consideration: (i) overlapping forays into each other's liability and asset structure should not lead to asset- liability mismatches; ( i i ) for effective supervision, consolidated supervision of h k s , Fls and NBFCs should be strengthened. The pricing of liabilities and assets is also of critical importance. Banks should possess or acquire the necessary expertise in pricing heterogeneous risks. With increasing globalisation, banks should put in place systems that allow their managements to have both the information and procedures to be aware of their own risk exposures and to be able to modify s u c h exposures. The better the risk information and control system, the more risk a bank can assume prudently, and profitably. Good governance in banks requires comprehensive internal control procedures and policies that are implemented by skilled personnel and monitored by management. The foundation of good institutional governance in banks is a sound business strategy and a competent and responsible management. In this context, it would be essential to give greater managerial autonomy to banks in t h e public sector.
Asset and Ljability Management
1 .G8 In t h e context of t h e changes taking place in the financial markets, risk management is emerging as an important area which needs a great deal of attention. Banks have traditionally concentrated on asset management, treating themselves purely as deposit takers. Funds supply was regarded as a factor beyond their control. Asset management was governed by the principle that liquidity and profitability are opposing considerations. Risks and returns were treated as two inversely related variables influencing t h e composition of assets. The main objective under s u c h a framework was to distribute the assets in such a way that for a given level of liquidity, the return was maximum. This

18 Report on Trend and Progress of Banking In India, 1996-97
approach Is being substituted in a number of banks by a more comprehensive approach of asset-llabillty management which is 'a continuous process of planning, organising and controlling asset and liability volumes, maturities, rates and yields'. The objective is to avoid the mls-match of asset liability characteristics and liability is no longer treated as given. The liability structure can also be modified In tune with the asset structure that is desired. As the kinds of risks and the frequency of occurrence of such risks have increased dramatically, both liabilities and assets are subject to Interest rate risks. The asset quality of loans can be influenced by factors which go beyond the control of the lenders. It is in this context that provisioning for loan losses and need for adequate capital become important. In terms of asset-liability management, portfolio managers look a t t h e variable and fixed components both under assets and liabilities. The most important element in the process of asset-liability management is to build into the analysis of possible future behaviour of variables such as interest rates. Thus, the asset-liability management is a process and it must be practised in an on-going manner. Management must regularly forecast assumptions and develop contingencies t o accommodate changes expected.
1.69 Pricing of risk is an important area, requiring prime attention. Banks have to move away from the relatively unscientific practices of pricing risks based on perception of customers to more scientific practice based on technical assessment of the risks involved while ensuring transparency. Embracing scientific risk management practices will not only improve banks' credit management processes and increase profits, but also enable them t o nurture and develop mutually beneficial relationships with customers.
1 .70 In recent years, financing infrastructure has become a challenge to banks. In view of the fact that financing of infrastructure involves large funds to be committed for long periods of time, banks could face asset-liability mismatches. In order to meet the financing
requirements of Infrastructure and other large investment projects, banks need to develop the necessary expertise.
Payment and Settlement System
1.71 One of the issues that would assume critical importance in future is the efficiency with which the payments system would function. This is especially so if capital inflows are large as in recent years. So far the payments system has been largely confined to the banking sphere. All high value domestic rupee transactions a r e set t led through electronic media and t h e payment and settlement system h a s been quite efficient. However, as the volumes increase and as t h e number of instruments grows, clearing and settlements need to be not only with respect to cheques but also in terms of multiple channels of payments including electronic fund transfers. Settlements have to go beyond the cities in which the clearing systems operate and may need t o assume cross-border dimensions. Inter-city clearing, and settlement of foreign currency cheques would need to be given top priority along with Delivery versus Payment systems with respect t o the transactions effected in equity and debt markets. Full automation will be possible only in the medium term and this objective would be facilitated by the decision of the Reserve Bank's decision to establish VSAT network, and by the eagerness of public sector banks to speed up computerisation of their activities including networking of their major branches for improving cus tomer services and enhancing Management Information Systems (MIS). Success in implementation of effective information technologies in the banks would depend on cooperation of managements and employees and o n training in n e w communication and information methods.
Technology Upgrada tion
1.72 The impact of technology on banking has been spectacular in the industrially advanced countries. Against the background of the growing volume of transactions and the n e e d t o m e e t cus tomer n e e d s

Banking Developments and Policy Perrpecffves
expeditiously, technology upgradation has become indispensable. To strengthen internal controls, to improve accuracy of records and to facilitate provision of new products and services, banks will have to rely increasingly on computer based technologies. Apart from improving t h e functioning of banks at various levels, technology has a key role to play in developing a payments system network through which funds can be transmitted quickly and efficiently. It is expected that VSAT Satellite based network will come into operation soon since much groundwork has already been done by the Reserve Bank and banks.
1.73 With the introduction of new technologies and the increasing exposure to non-traditional activities, t h e risk profiles of banks are bound to change in the coming years, placing pressure on banks to monitor and manage underlying risks. Given the trade- off between risk and returns, it is imperative that banks work to ge t at a n optimum mix of financial products.
Rural Credit and Priority Sector Lending
1.74 Central to the success of any financial development programme is t h e promotion of strong and self-sustaining financial institutions. The institutional credit with a rural network of about 35,000 branches of commercial banks and RRBs and over 92,000 outlets of co- operative credit institutions at the base level, has reduced the role of informal agencies in rural finance. However, the viability and sustenance of these institutions continues to be in question. The co-operative credit system is afflicted by a n excessive reliance o n funds from higher tiers of the cooperative structure, pervasive State control, poor deposit mobilisation and low recovery of loans. Improved credit appraisal, thrust on deposit mobilisation at the base level, restoration of democratic processes and operational diversification should be the constituent elements of any revival plan For efficient rural credit delivery systems. I n a move to improving the health of RRBs, which carry high operating costs, the Reserve Bank has
provided operational freedom through deregulation of their lending rates alongside a capital support of Rs.574 crore by the Government of India to 136 RRBs with an equal commitment from other equity holders. The report of the Committee on Salaries and Allowances of Employees of RRBs (Chairman: Mr. S.C. Mahalik) since submitted in May 1 997 is under examination of the Government of India. Besides, the institutional framework of credit delivery is being improved upon with group lending to non-governmental organisations (NGOs). While these initiatives are useful, an appropriate institutional mechanism for expeditious disposal of legal cases of dues to rural financial institutions has become necessary.
Strengthening of the Supervisory System
1.75 The RBI supervisory strategy now comprises both off-site surveillance and on- site inspections. A detailed off-site surveillance system based on 'prudential supervisory reporting framework on a quarterly basis covering capital adequacy, asset quality, loan concentration, operational results and connected lending has been made operational. In regard to on-site inspection, the focus is now o n the evaluation of the total operations and performance of the banks under t h e CAMELS system, i.e. Capital adequacy, Asset quality, Management, Earnings, Liquidity and internal control Systems. Apart from evaluating asset quality and compliance with prudential norms, focus is now on the effective functioning of the Board, management, earning capacity of banks as also efficacy of internal audit and control systems and risk management systems besides regulatory compliance. The new approach to annual financial inspections has been adopted from t h e cycle of inspections commencing July 1997. An efficient result-oriented on-site inspection system requires an efficient follow- up mechanism without which t h e very objective of inspections will be vitiated. The entire cycle of inspection and follow-up action is now completed within a maximum period of twelve months. Monitorable action plan for rectification of irregularities/deficiencies

20 Report on Trend and Progress of Banking In India, 1996-97
noticed during the inspection wlthin a time frame is drawn up and the progress in implementation pursued with the bank. Thus, the present supervisory system makes a substantial improvement over the earlier system in terms of frequency, coverage and focus as also the tools employed.
1.76 The Reserve Bank has taken a number of measures to improve the transparency and disclosure in the published accounts of banks. From 1996-97, banks are required to disclose under 'Provisions and Contingencies' in the Profit and Loss Account, details of provision for bad and doubtful debts, provision for diminution in the value of investments, and provisions for tax separately instead of showing it as a conglomerate item. Banla are also required to disclose the capital adequacy ratio, as well as percentage of net NPA to net advances. The above inbrmation will also have to be audited. It would also be necessary to have a system of auditing of NBFCs by private Chartered Accountants w h o could b e considered as 'special vehicles' for supervision. External auditors play a vital role in the maintenance of overall soundness of the system. Apart from giving an opinion on 'true and fair' view of the banks' financial position, auditors are also required to verify compliance with regulatory requirements. The responsibilities devolving on auditors have enlarged and it is important that auditors are fully aware of the expectations of the owners of banks and the supervisory authorities.
1.77 The role of the external auditors has been enhanced and enlarged. In the auditing of a bank, the auditors' primary duty is to express an opinion on the financial statement such as the balance sheet and the profit and loss account. Besides, the audit report on the financial statements, auditors of banks are also required to submit what has come to be known as 'Long Form Audit Report'. Auditors are now required to verify compliance with SLR computation and prudential norms and also report serious irregularities to RBI. Further, auditors of nationalised banks should certifj whether the transactions of bank are within the powers of the bank, and whether the returns received are adequate for the purpose of audit.
1.78 Developments during 1996-97 have brought into focus the need for consolidated approach to financial supervision in India. While it is well recognised that frauds could occur in all types of economies - regulated or deregulated, it is imperative that each financial intermediary puts in place a resilient internal control system to detect incipient frauds, and regulatory and supervisory mechanisms are honed up to pick up the early warning signals. Both on-site and off-sitepupervision systems are necessary for capturing such signals. With the January 1997 amendments to the Reserve Bank of India Act, the Reserve Bank has been given powers to regulate NBFCs. Given the total number of NBFCs (around 37,000) which have applied for registration, it is necessary to frame the nature and extent of regulation and supervision of NBFG on the basis of some definitive criteria such as the size of NBFG, the type of activity it performs and whether it accepts public deposits.
1.79 The evolving financial system has given rise to s o m e fundamental supervisory concerns. As the traditional segmentation of the financial system is getting blurred with the emergence of banking g roups a n d conglomerates, a system of consolidated supervision on global as well as group-wise basis would be necessary. Secondly, t h e broadening of the range of banks' activities withip t h e financial sector and of their ownership linkages with others carries the risk of extending the 'safety net' put in place to prevent systemic crisis. One way of addressing this problem consists of enhancement of transparency and standards of disclosure in respect of financial as well prudential information. In this context, co-operation and co-ordination with other regulatory authorities having jurisdiction over certain operations of t h e financial in termediar ies a s s u m e s considerable importance. For sectors with multiple supervisors, e.g. co-operative banking, the role and concerns of each supervisor need to be reviewed and redefined in the light of developments in the financial sector. In the final analysis, the extent of externally imposed controls depends upon the quality of internal controls within t h e supervised enti ties.

DEVELOPMENTS IN COMMERCIAL BANKllNG
The year 1996-97 witnessed a turnaround in t h e financial performance of scheduled commercial banks in t h e sense that operating and net profits increased substantially, both in absolute terms and as proportion of total assets. On the other hand, even with the substantial release of liquidity in the form of reduction in cash reserve ratio (CRR), and consequential softening effect on prime lending r&es (PLRs) and bank deposit rates, there was inadequate pick up in bank credit (See Box 11.1). The policy initiatives in the form of operational freedom for banks to determine their own credit delivery system (as opposed to MPBF) has had only limited effect on credit disbursement, so far.
2.2 The year also saw t h e continuation of the shift From direct to indirect methods of monetary control to indirect ones. The gradual move away from sector-specific refinances to general refinance has facilitated the anchoring of the Bank Rate as t h e Focal point of Monetary Policy. The Bank Rate reduction in April, June and October, 1997, and the consequent softening of PLRs of banks has emphasised the growing inter-linkages of interest rates in money, capital, Government securities and foreign exchange markets (Table 11.1 ). The significant impact of changes in the Bank Rate on short-term yields of Treasury Bills also point to the growing emergence of the Bank Rate as a signalling mechanism.
2.3 The withdrawal of reserve requirements on inter-bank liabilities has opened new vistas
for the development of short-term money market. The policy initiatives in the field of Money Market Mutual Funds (MMMFs) have also started yielding results with MMMFs finally becoming a reality. With banks becoming increasingly involved in term financing, t h e asset-liability matrix of banks and financial institutions has resemblance with the essential elements of universal banking in India.
2. Liability and Asset Structure of Banks
Deposits
2.4 Deposits with scheduled commercial banks recorded a larger increase of Rs.7 1,780 crore (16.5 per cent) during 1996-97 as compared with an increase of Rs.46,960 crore ( 12.1 per cent) in 1995-96 (Table 11.2 and Chart 11.1 ). As in the previous year, much of the increase in aggregate bank deposits was in the form of time deposits. The share of time deposits in incremental deposits came down during the year, but at 86.1 per cent, it still constituted the bulk of incremental deposits. In contrast to 1995-96 wherein 17.7 per cent of the increase in aggregate deposits was on account of high cost Certificate of Deposits (CDs), t h e contribution of CDs in incremental aggregate deposits in 1996-97 turned negative. In fact, excluding CDs, aggregate deposits of scheduled commercial banks recorded a higher increase of Rs.75,962 crore (1 8.2 per cent) in 1996-97 as compared with an increase of Rs.38.661 crore (10.2 per cent) in 1995-96. Similar trends have continued

Report on Trend and Progress of Banking in India, 1996-97
BOX 11.1 : RISK MANAGEMENT IN BANKS Deregulation of financial markets and the increasing globalisation have h3eased t h e range of
activities that banks can undertake and have at the same time exposed the banks to a number of risks. New trading and derivative activities have added newer risks o n to the traditional ones. Banks and their regulators are faced with problems in measuring and controlling the risks inherent to the provision of financial services. Banks would need to do proper risk identification, classify risks and develop n e c e s r y technical and managerial expertise to assume risks. Banks face mainly four major categories of risks: market risk, credit risk, legal risk and operational risk. In addition, there is systemic risk arising due to a serious disruption in the working of a major bank which in n o time could spread to other banks or the whole financial system.
The Bank of Japan has compiled a comprehensive checklist for Risk Management (See Chart A). Chart 1I.A : Checklist of Risk Management
A. Management Policy B. Internal Controls C. ProfitILoss Management and
Banks and regulators have been generally concerned more with credit and market risks and have been able to devise methods to safeguard against these risks. For example, in the U.S. and U.K, computer aided credit management techniques and scoring systems were introduced in 1993. J.P. Morgan's CreditMetrics is one of the first readily available portfolio models for evaluating credit risk. The CreditMetrics approach enables a bank to consolidate credit risk across its entire organisation and provides a statement of value-at-risk (VAN due to credit caused by upgrades, downgrades and defaults. Apart from CreditMetrics, neural network techniques have also been often u t i l i d as powerkl analytical tools to identify and quantifjr risk.
Approaches Regulation of financial markets, especially the risk-taking activity of banks, is necessary to
blic confidence In the banking system. These measures could be classified as preventive rotedive regulation. Preventive regulation includes rules governing capital/llquidily adequaq
issible business activities. The 1988 k l e Capital Accord develop4 credit-rfsk capital which 1s an example of prt?venttve regulation. Protective regulatory measure include
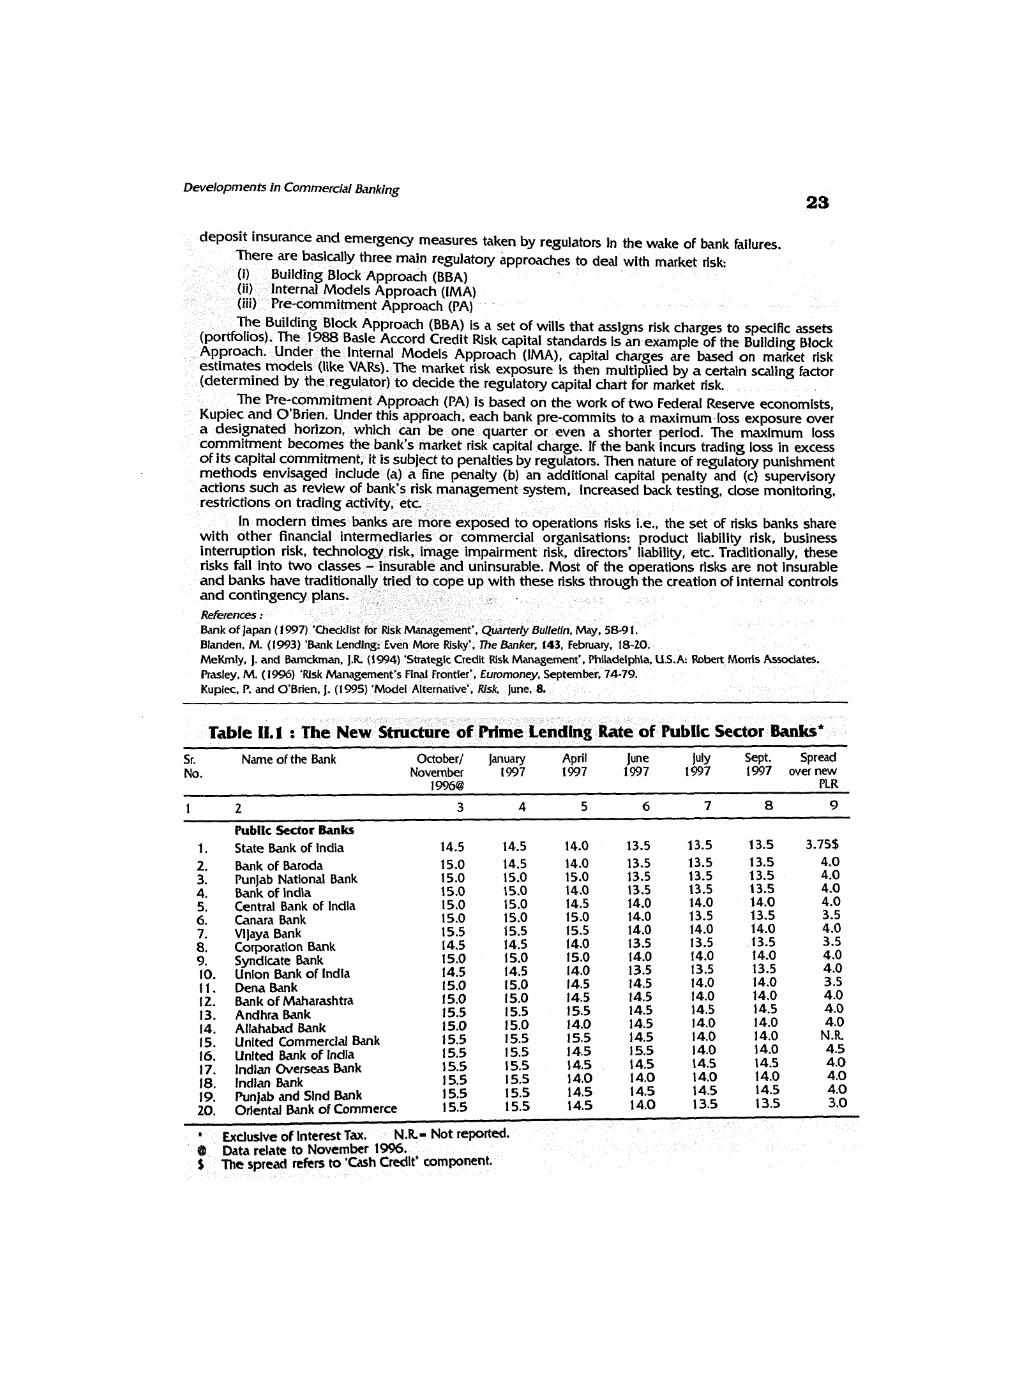
Developments in Commercial Banking
insurance and emergency measures taken by regulators in the wake of bank failures.
ere are basically three main regulatory approaches to deal with market risk: Building Block Approach (BBA) Internal Models Approach (IMA)
) Pre-commitment Approach (PA)
Bank of Japan ( 1 W Blanden, M. (1993) 'Bank Lending: Even More Risky', The Banker, 143, February, 18-20. MeKmly, 1. and Barndunan, 1.R (1994) 'Strategic Credit Risk Management', Philadelphia, U.S.A: Robert Morris Assodates. Prasley, M. (19%) 'Risk Management's Find Frontier'. Euromoney, September, 7479. Kuplec, P. and O'Brien, J. (1995) 'Model Alternative', Risk, June, 8.
Sr. Name of the Bank October/ january April June July Sept. Spread No. November 1997 1997 1997 1997 1997 over new
19%@ PLR
1 2 3 4 5 6 7 8 9
PubIfc Sector Banks 1. State Bank of India 14.5 14.5 14.0 13.5 13.5 13.5 3.75$ 2. Bank of Baroda 15.0 14.5 14.0 13.5 13.5 13.5 4.0 3. Punjab National Bank 15.0 15.0 15.0 13.5 13.5 13.5 4.0 4. Bank of India 15.0 15.0 14.0 13.5 13.5 13.5 4.0 5. Central Bank of India 15.0 15.0 14.5 14.0 14.0 14.0 4.0 6. Canara Bank 15.0 15.0 15.0 14.0 13.5 13.5 3.5 7. Vijaya Bank 15.5 15.5 15.5 14.0 14.0 14.0 4.0 8. Corporation Bank 14.5 14.5 14.0 13.5 13.5 13.5 3.5 9. Syndicate Bank 15.0 15.0 15.0 14.0 14.0 14.0 4.0 10. Union Bank of India 14.5 14.5 14.0 13.5 13.5 13.5 4.0 1 1. Dena Bank 15.0 15.0 14.5 14.5 14.0 14.0 3.5 I 2. Bank of Maharashtra 15.0 15.0 14.5 14.5 14.0 14.0 4.0 13. AndhraBank 15.5 15.5 15.5 14.5 14.5 14.5 4.0 14. Allahabad Bank 15.0 15.0 14.0 14.5 14.0 14.0 4.0 15. United Commercial Bank 15.5 15.5 15.5 14.5 14.0 14.0 N.R 16. United Bank of India 15.5 15.5 14.5 15.5 14.0 14.0 4.5 17. Indian Overseas Bank 15.5 15.5 14.5 14.5 14.5 14.5 4.0 18. Indian Bank 15.5 15.5 14.0 14.0 14.0 14.0 4.0 19. Punjab and Sind Bank 15.5 15.5 14.5 14.5 14.5 14.5 4.0 20. Oriental 6ank of Commerce 15.5 15.5 14.5 14.0 13.5 13.5 3.0
' Exclusive of Interest Tax. N.R= Not reported. 43 Data relate to November 1996. $ The? spread &n to 'Cash Ctdit' COmponent.

Report on Tmnd and kogress of Banklng In indla, 1996-97
Table 11.2 r Important Banking Indicators - Scheduled Commerdal Banks - 1995-96 and 1996-97
(Amounts In Rs. crore)
Varlatlons during Variations during
Items Outstanding as on the flnandal year the period (April-October)
March Mach hkd, October l 1, October, 10 1995-% 1996-97 1996-97 1997-98' 31.1995 29.1996 28,1997 19% 1997'--- Over Over Over Over
March 31 March 29 March 29 March 28
I 2 3 4 5 6 7 8 9 10 13-2) (4-3) (5-3) (6-4)
I. Total Demand and Tlmc LhbltltlesQD 428,254 480,61 3 561,982 509,300 605.1 56 52,359 81,369 28,687 43.174
2. Aggrepte Dcposb (atb) 386,859 433,819 505,599 461,950 543,626 6 9 6 0 71,780 28,131 38,027 (12.1) (16.5) (6.5) (7.5)
(a) Demand acposla 76.903 80,614 90,610 75,482 88.615 3.71 1 9.996 -5,132 -1.995 (4.8) (12.4) (-6.4) (-2.2)
(b) lime Deposits 309,956 353,205 414,989 386,468 455,011 43,249 61,784 33,263 40,022 (14.0) ( 17.5) (9.4) (9.6)
2.1 Certlflcnte of Deposlts 8.017 16,316 12,134 12,846 7,871 8,299 -4,182 -3,470 -4.263 (103.5) (-25.6) (-21.3) (-35.1) - v
(Exdudlng ceitiflwtc of Deposlb) 378.842 417,503 493,465 449,104 535,755 38,661 75,962 31,601 42,290
(10.2) (18.2) (7.6) (8.6) 3. Borrowings from RBI 7,415 4,847 560 989 137 -2,568 -4,287 -3,858 -423
(-34.6) (-88.4) (-79.6) (-75.5)
5. h k Cnd# (atb) 2 1 1.56 1 254,015 278,402 253,878 283,357 42,454 24,387 -137 4.955 (20.1) (9.6) (-0.1) (1.8)
(a) Food Credit 12,275 9,791 7,597 8,377 9,052 -2,484 -2,194 -1,414 1.455 (-20.3) (-22.4) (-14.4) (1 9.2)
(b) N o n - U Credlt 199.286 244,224 270,805 245,501 274,305 44,938 26,581 1,277 3,500 (22.5) (10.9) (0.5) (1.3)
(c) Non-food uedlt utdudlng petroleum credit 198.664 242,7 14 267,430 244,583 273,233 44,050 24,716 1,869 5,803
(22.21 (1 1.0) (0.8) (2.2) 6. Investments (a+b) 149,254 164,782 190,514 177,353 218,334 15,528 25,732 12,571 27,820
(10.4) (15.6) (7.6) (14.6) (a) Government Securltles 1 17.685 132.227 158.890 146,074 187.024 8 14.542 26,663 13,847 28.134
(12.4) (20.2) (10.5) (1 7.7) (b) Other Approved Securltles 31,568 32,555 3 1,624 31,279 31,310 987 -931 -1,276 -314
(3.1) (-2.9) (-3.9) (-1.0) 7. Cash Bnlrnces (a+b) 63,001 53,780 53,195 55,005 57,894 -9,221 -585 1,225 4,699
(-14.6) (-1.1) (2.3) (8.8) (a) Cash in hand 2,972 3.1 13 3.347 2.809 3.448 141 234 -304 101
(4.7) (7.5) (-9.8) (b) Balances with RBI
(3.0) 60.029 50.667 49,848 52.1% 54.446 -9,362 -819 1,529 4.598
(- 15.6) (- 1.6) (3.0) (9.2) Memorandum Items I A. Credit-Deposit Ratio 54.7 58.6 55.1 55.0 52.1 B. Non-food credit (excluding
petroleurn)/Deposit ratlo 51.5 56.2 53.1 52.9 50.3 C. Incremental Credit-Deposit Ratio 65.7 90.4 34.0 -0.5 13.0 D. Reserves-Deposit Ratio 16.3 12.4 10.5 11.9 10.6 E. Investment/Deposit Ratio 38.6 38.0 37.7 38.4 40.2
during the first seven months of the current Bank Credit financial year (i.e. April-October 1 997) - with aggregate deposit growth (Rs.38,027 crore or 7.5 per cent) significantly higher than the increase recorded during the comparable period last year (Rs.28,131 crore or 6.5 per cent) emanating exclusively from the growth in time deposits.
2.5 Bank credit remained sluggish during 199G-97; the expansion in bank credit during 1996-97 was of the order of Rs.24,387 crore (9.6 per cent) which was substantially smaller than the increase of Rs.42,454 crore (20.1 per cent) in 1995-96. Food credit declined by of Rs.2,194 crore (22.4 per cent) in t 996-97

art 11.1 : Growth Rate of Bank 1 Deposits and 10"-Food Credit of Scheduled Commercial ~anks I
Deposits *te I
as compared with a decline in the earlier year Rs.2,484 crore (20.3 per cent). As such, the expansion in non-food credit at Rs.26,581 crore ( 10.9 per cent) in 1 996-97 was sharply lower than that of Rs.44,938 crore (22.5 per cent) in 1995-96. The lower of&ke of non- food credit in the face of a substantial expansion of aggregate bank deposits (Chart 11.1) has meant a sharp dedine in the credit- deposit ratio of banks. I t may be noted that the incremental credit expansion during 1996-97 was low even after making an allowance for the expansion of credit to petroleum companies. Due to burgeoning oil pool account deficit, petroleum companies incredsed their access to banking system in 1906-97. Consquently, during 1996-97, bank credit to petroleum companies increased from Rs. 1,5 10 crore as on March 29, 1996 to Rs.3,375 crore on March 28, 1997. Exduding petroleum credit, the increase in non-krod credit was placed at Rs.24.716 crore (1 1.0 p e r cent) in 199697 which was roughly one- half of the expansion of Rs.44,OSO crore recorded in 1995-96. The subdued expansion In bank crdlt despite the substantid krease In liquldlty to . tun . d Rs.17.850 crore
through the reductlaw in the cash resewe ratlo In 1996-97 has been an area of concern. A malor factor undalying the slugglsh credit growtt.1 was the deceleration in industrial growth: Industrial productlon recorded a lower growth of 6.6 per cent in 1996-97 than that of 1 1.8 per cent in 1995-96. Secondly. the increase in the risk-adjusted yields on Government securities has had the effect of making investments In risk-free Government securities relatively more attractive. The relatively high level of non-performing assets (NPAs) also had a bearing, especially o n weak (narrow) banks to become cautious with regard to lending b r the f e a r of enlargement of NPAs. Narrow banking, however, could alleviate the problem of NPAs to some extent and could help reduce systemic risks and promote the movement towards capital account llberallsation (See Box 11.2 and 11.3 ).
2.6 The major slack in credit expansion was in industry and wholesale trade segment (Table 11.3). During 1996-97, credit to the Industry recorded a lower growth of Rs.9,201 crore (7.4 per cent) as compared with an Increase of Rs.22,627 crore (22.1 per cent) in 1995-96 (Table 11.4). Similarly, bank credit to wholesale trade sector (excluding credit for food procurement) recorded a decline of Rs.47 wore (-0.2 per cent) in 1 996-97 as against an increase of Rs.2,231 crore (6.0 per cent) in the previous year. A'major consolation in t h e uedit situation is t h e increase in credit to priority sector; it Increased by Rs.8,659 crore (43.9 per cent) In 1996-97 as compared with a rise of Rs.9,168 crore (24.5 per cent) in 1995-96, increasing t h e proportion of prfority sector credit to net bank credlt of scheduled commercial banks from 32.1 per cent in March 29, 1996 to 33.3 per cent in March 28, 1 997.
2.7 Among the various industries, credit to engineering and chemical industries recorded declines of the order of Rs.3,233 uore and Rs.1,444 crore respecthre!y in 1996- 97, in contrast to the rise of Rs.4,461 crore and Rs.3,653 uore last year (Table 11.4). Bank credlt to agro-based industries such as cotton

Report on Trend and Progress OF Banking in India, 1596-97
BOX 11.2 r THE 'NARROW BANKS'
The concept of nnanow banksw has been widely discussed and debated in recent times. The Report of the Committee on Capital Account Convertibility (Chairman: Shri S.S. Tarapore), popuiarly referred to as the CAC Report, has rekindled the debate on the relevance of narrow banks in the Indian context. The concept of narrow banking has been suggested as a solution to the problems of high non-performlng assets, etc.
The term 'narrow banks', advocated by Robert E. Litan in 1987, refers to banks that only invest demand deposits in highly marketable liquid assets, such as treasury bills. Therefore, under narrow banking, the production of liquidity and payment of services would be separated from the allocation of credit. Since narrow banks are required to invest their incremental liabilities in zero-risk government securltles, thelr regulatory requirements like capital adequacy are minimal. Hence, it is possible for nanow banks to operate on smaller spreads and still attain competitive returns on equity.
Theoretically, in Diamond-Dybvig type models, runs on banks have been explained in terms of asset-liability mismatches. A solution advocated to such mismatches is the concept of narrow banking. Proponents of narrow banking argue that the highly marketable assets (like government securities) of these banks would provide ready and ample liquidity to meet unforeseen deposit withdrawals, preventing any bank runs. In addition, for banks with high levels of non-performing assets (NPAs), narrow banking could be a viable proposition. Any incremental deposit can be diverted t o riskless securltles, foredosing t h e build-up of any non-performing assets. From a financial perspective, narrow banks, if free from major regulatory stipulations, should be able to offer their depositors a competitive return on their deposit liabilities. As the idea of narrow banking focuses on designing structural safeguards within an integrated financial set up, this could pave the way for financial stability.
The critics of narrow banking concept point to the fact that there is insufficient supply of riskless assets (e.g., treasury bills) to back potential demand for riskless deposits. In addition, increased demand for riskless assets would raise their prices in a narrow banking world if society va assets so highly s o much that these banks might well end up holding less secure paper. have, however, been voiced that narrow banking could leave some credit demands For marginal participants in the credit market, like small borrowers. The Rational E has also pointed that a coherent model-based exp concept of narrow banking has both its pros and co of narrow banking is very much necessary. Rekrences :
Brunt, F. ( 1 995) 'Prudential Regulation in an Integrated Finanda hdential ReguIation of Bank and Secunities Firms: European
Diamond, D. and Dybvig, P. (1983) 'Bank Runs, Deposit Insurance and Liquidity', Journal of
Herring, RJ. and Litan RE. (1995) Finanddl Regoation in the Global Economy. Washington, D.C. The BrooWngs Institution.
Wallace. N. (1 9%) 'Narrow Meets The Diamond-Dybvig Model'. Federal Reserve Bank of Minneapolis Quarterly M e w . Winter, 3-1 3. Wolkon, M.H. (1993) The Evolution of the Financial System and the Possibilities for Reform', in Dymski, G.A. et al (eds.) Transhming the U.S. Financial System: Equity and ufidency fr,r the 21st Centrry. Armonk: New York. Economic Policy Institute. M.E. Sharpe Inc.
and jute textiles, sugar and tea industries as well as g e m s a n d jewellery a n d lea ther industries also recorded declines during 1996- 97. The industries which recorded lower order of credit expansion during 1996-97 include electricity (generation a n d transmission), food processing, paper and paper products, rubber and rubber products and cement. On the other
hand, petroleum industry increased its access to bank credit by Rs. 1,865 crore in 1996-97 as compared with a n increase of Rs.888 crore in 1995-96. This h a s to b e viewed in the background of t h e rising Oil Pool deficit. During t h e current financial year so far, i.e. April-October 10, 1997, deposi t g rowth of scheduled commercial banks continued t o be

Developments in Commercial Banking
BOX 11.3 : CAPITAL CONVERTIBILITY AND COMMERCIAL BANKS IN INDIA
Capital Account Convertibility (CAC) has some far-reaching implications lor the banking sector.
effective Cash Reserve Ratio (CRR) from t h e present 9.3
1997-98 1998-99 1999-2000
1 2 3 4 5
Gross NPAs of the 13.7* 12.0 , 9.0 5.0 banking sector (as a (as of March percentage of total 1997) advances)
advocated that the weak banks (having of these banks should be weakness, their assets as
Implications of CAC
more transparent.
been the expenditure on capital equipment like computers banks to introduce new products and t o Improve proces time and improving accuracy.
relatively higher intermediation cost of around 2.88 per

28 Report on Trend and Progress of Banklng In lndla, 1996-97
cost as a percentage of total expenditure, however, stood a t a high of 27.56 for PSBs for the year 1996-97 as compared with 22.29 lor old Indian private sector banks and 24.76 for foreign banks (Table 2). But a noticeable difference between foreign banks and public sector banks is t h e fact that the bulk of the intermediation cost of foreign banks was In non-labour component namely in computers and technology while that of public sector banks was on account of the wage bill. The wage bill of forelgn banks was nearly one halF of public sector banks. -
~ a b l e 2 : Intermedlatlon Cost of Scheduled Commercld Banks in India - Groun-wise 1 994-95 and 1995-96
Bank Group Intermediation cost as a Intermediation cost as a percentage of Total Assets percentage of Total Expenditure
1995-96 1996-97 1995-96 1 996-97
1 2 3 4 5
1. SBI and Its Associates 3.10 2.94 29.24 27.74 2. Nationalised Banks 2.93 2.85 27.35 27.46 3. Public Sector Banks 2.99 2.88 28.04 27.56 4. Old Indian Private Sector Banks (25) 2.60 2.50 24.4 1 22.29 5. New Private Sector Banks (9) 1.89 1.92 20.5 1 18.31 6. Foreign Banks 2.77 3.01 24.59 24.76
Scheduled Commercial Banks 2.94 2.85 27.43 26.7 1
Note : lntermediatlon cost is defined as other operating expenses excluding interest expenses and provisions and contingencies.
Given the structure of liabilities and assets of banks in India, capital account convertibility throws a number of challenges which banks have to cope with. Firstly, convertibility exposes banks' liabilities and assets to more price and exchange risks and banks may have t o build necessary expertise to manage these risks. Secondly, with the removal of capital controls, banks can supplement their domestic deposit base with borrowings from,~ff-shore markets. The volatility in foreign money and capital markets could be easily transmitted td-lhdian banks' balance sheets, especially so in the case of weak and fragile banks, and could prove contagious. To avoid the risks associated ki th the transmission of volatility of interest rates/exchange rates, adequate asset-liability management systems by banks should be put in place. Besides, technology upgradation in banks should be undertaken t o help build strong risk management systems and management information systems and to pave the way for an efficient payment and settlement mechanism. Thirdly, fluctuations in interest rates are likely to affect the cost of borrowing for emerging markets and alter the relative attractiveness of investing in these markets. Real exchange rate volatility may cause currency and maturity mismatches, creating large losses for bank borrowers. To curb the incipient insolvency leading ultimately to banking crises, a system of vigilant and alert internal control system as well as a comprehensive supervisory system should be evolved. Fourthly, a direct fall-out of CAC will be the increasing
, pressure on the margins of banks arising partly out of greater competition and partly due to the disintermediation process with strong domestic corporate borrowers accessing world markets directly. The resultant pressure on the return on assets of the PSBs is likely to make the banking system vulnerable.
References :
Bank for International Settlements, Annual Reports (Various Issues).
Coldstein. M. and Turner, P. (19%), 'Banking Crlses in Emerging Economics: Origins and Policy Options', Wle, BIS Economlc Pdpen 46.
OLCD (19%) Bank ProRtabtlity - Rnanclal Statements of &vrks - 1985-1994, Paris,
Reserve ~ a n k of India (1997) Report of the Committee on Capital Account ComcrtIbil/ty (Chairman : S. 5. Tatapore),

Developments In COmrnerdal &&ng
strong at Rs.38.027 m e (7.5 per cent) compared with the rise of Rs.28,131 wore (6.5 per cent) in the corresponding peda last year. Food credit increased sharply by Rs. 1,455 crore (19.2 per cent) as cornpard with a decline of Rs. 1,4 14 crore (- 14.4 per cent) in similar period last year, mainly due to relatively large procurement of wheat. Non- food bank credit showed an increase of Rs.3,500 crore (1.3 per cent) during the April- October 10, 1997 as compared with an increase of Rs. 1,277 crore (0.5 per cent) last year. There has been a conspicuous shift in the asset portfolio mix of banks during the past one year and a half. Banks have begun to increasingly place greater emphasis o n investments. Banks have increased the i r investments in bonds/debentures/shares issued by Public Sector Undertakings (BUS) and private corporate sector and commercial paper by Rs. 10,252 crore during the current financial year upto October 10, 1997, as against a lower order of increase of Rs.2,561 crore during the corresponding period of t h e previous year.
Investments
2.8 Notwithstanding t h e substantial reduction in e fk t i ve SLR, banks' investments in Government and other approved securities increased by Rs.25,732 crore (1 5.6 per cent) in 1996-97 as compared with the rise of Rs. 15,528 crore (1 0.4 per cent) in 1995-96 The investment-deposit (I-D) ratio of scheduled commercial banks marginally declined from 38.0 per cent in March 29, 1996 to 37.7 per cent in March 28, 1997 and then increased to 40.2 per cent by October 10, 1937 (Chart 11.2). Some of the weak banks have used investments in Government securities as a part of their strategy on the road to recovery. During the current financial year i.e., April- October 10, 1997, banks' investments rose further by Rs.27.820 crore (14.6 per cent) as compared with the rise of Rs. 1 2,57 1 crore (7.6 per cent) during the corresponding perlod last year.
Ratios of Scheduled Commsnial Banks in
Cash Reserves
2.9 During 1 996-97, t h e cash reserve ratio (CRR) was reduced by 4 percentage points and consequently ksewes (cash in hand and balances with the Reserve Bank) of scheduled commercial banks declined by Rs.585 crore (- 1.1 per cent) on top of a decline of Rs.9,221 crore (- 14.6 per cent) in 1995-96. Reserves as a proportion of bank deposits declined fiom 12.4 per cent and stood at 10.6 per cent in March 29, 19% to 10.5 per cent in March 28, 1997 (Chart 11.2).
Cash Reserves on Inter-Bank Liabilities
2.10 In the recent discussions on market integration, the issue of reserve requirements on inter-bank liabilities (IBL) has become a contentious one. The Sodhani Committee Report of Foreign Exchange Markets in India and the Rakesh Mohan Committee Report on India's Infrastructure had recommended exemption of inter-bank liabilities (IBL) from the purview of the maintenance of cash reserve ratio (CRR). Recognising t h e need for developing an active term money market and

Rcport on Trend and Progress of Bankfng In Indb, 1996-97
Table 11.3 r Sectoral Deployment of Gross Bank Credit by Major Sectors* (Amounts In Rs. crore)
%on Outstanding as on Varlationsdurlng
flnandal Year Aprll-June
March Mvch March i a june 1995% 199b-97 199&97 1997-98' 31,1995 29.1996 28,1997 28, 19% 20, 1997
I 2 3 4 5 6 7 8 9 10 (3-2) (4-3) (5-3) (6-4)
0) GO- llrnk C r d k ( I +2) 196,9215 231,860 249,408 227,193 253,245 34375 17,548 -4,667 3837 1. Public loocf
Frocurcmcnt Crcdlt 12.275 9.791 7,597 11.666 10.075 -2.484 -2.194 1,875 2,478 2. N o n - l d Cross Bank
Credlt (AtB+C+D) 184,710 222,069 241.81 1 215.527 243.1 70 37.359 19,742 -6,542 1,359 (100.0) (100.0) (100.0) (100.0)
(A) Morftykcton 64,161 73,329 81.988 72,874 84,070 9.168 8,659 -455 2,082 (24.5) (43.9) 1-7.0) (1 53.2)
(I) Agriculture 23,983 27.044 30.874 26.858 3 1,169 3,061 3,830 -186 295 (8.2) (19.4) (-2.8) (21.7)
(11) Small s a l e lndustrla
(110 Other hlorlty kctors
(B) Industry (Medlum 1). Luge)
(C) Wholesale Trade (Other than food procurement) of which r
(1) Cotton Corporation of India
(11) Other Trade
(01 Other Sectors of whlch r
( I ) Housing
(11) Consumer durables
(ill) Non-banklng flnandal companies
(iv) Loans to Individuals
(v) Real Estate Loans
(vi) Other non-priority sector personal loans
27,638
12,540
74,672
9.749
354
9,395
36,128
5,299
1,178
N.A.
1,924
1,127
9,883 (7.2) (1.1 ) (- 1 8 (-224.1 )
(vii) Advances against f l e d Deposits N.A. N.A. N.A. N.A. 10,328
(11) Export Credit Ilnciuded under ltem 1(2)] 25,051 29,590 28,588 26.715 28,307 4.539 -1,002 -2,875 -281 (Ill) Met Bank Credit (Including inter-bank parriclption) 192,424 228,198 246,230 223,315 250,4Ql 35,774 18,032 -4,883 4,171
Memorandum Items : A. Priority Sector Credit
as % to NBC 33.3 32.1 33.3 32.6 33.6 B. Agricultural Credit as %
to NBC 12.5 11.9 12.5 12.0 12.4 C Export Cred~t as %
to NBC 13.0 13.0 11.6 120 11.3
Data are Provisional. N.A. Not Available.
Notes : 1 . Data relate to 47 scheduled commercial banks which account for about 90-95 per cent of bank crcdit of all xheduled wmmerdal banks. Cross bank uedit data include bills rediscounted with RBI, IDBf, EXIM Bank, other approved flnandal InsNtutions and Inter- bank yrticlpations. Net bank credit data are excluslve of bills rediscounted with RBI, IDBI. WIM Bnnk and other approved fimclal instltutfons.
1
2. Figures In brackets are proportions to h c r : r e ~ @ non-food gross bank nedlt.
3. The data on prlority sector dlffer horn the Rnal data on prlority sector as presented in Appendix Table 11.1 1.

Developments in Commercial Banking
Table 11.4 : Industry-wise Deployment of Gross Bank Credit'
(Amounts In Rs. crore) Industry Outstanding as o n Variations during
Finandal Year April-June March Mnrch March June June 1995-96 19%-97 1996-97 1997-98
31,1995 29,196 28,1997 28,1996 20,1997
Industry (Total of Small, Medium and Large Scale) 1. Coal 2. Iron and Steel 3. Other Metals and
Metal Products 4. All Engineering
of which : Electronics 5. Electricity (Gen. And Trans.) 6. Cotton Textiles 7. Jute Textiles 8. Other Textiles 9. Sugar 10. Tea 1 1. Food Processing 12. Vegetable Oils (including
Vanaspati) 1 3. Tobacco and
Tobacco Products 14. Paper and Paper Products 15. Rubber and Rubber
Products 16. Chemicals, Dyes, Paints, etc.
of which : i) Fertilisers ii) Petro-chemicals iii) Drugs and Pharma-
ceuticals 17. Cement 18. Leather and Leather
Products 19. Gems and Jewellery 20. Construction 2 1 . Petroleum 22. SAFAUNSB 23. Other Industries Memorandum Item : A. Industrial Credit as
proportion of Net Bank Credit 53.2 54.7 54.5 54.4 53.8
Data are hovlsional.
$ Ships acquired from abroad under new scheme.
Notes r 1 . Data relate to 47 scheduled commerddl banks whi xheduled commercial banks. Gross bank credit data indude bi approved findndal Institutions and Inter-bank participations. Net wlth RBI, IDBI, UClM Bank and other approved flnanci
2. No sign Is Indicated for posltlve variations.

Report on Trend and Progress of Banking in India, 1996-97
the need to have a realistic rupee yield curve, the Monetary and Credit Poilcy of Aprll 15, 1997 exempted inter-bank liabillties from maintenance of CRR, Earlier, each bank's liabilities to the banWng system were allowed to be netted out against its assets with the banklng system. If assets with the banklng system were more than the liabilities, the net inter-bank assets were not allowed to be offset against liabilities to others. With the exemption of inter-bank liabilities from the maintenance OF CRR (subject to a statutory minimum), it Is expected that an active term money market especially with maturities of 15 to 30 days will emerge. This exemption would benefit banks to the extent of Rs.950 crore in 1996-97. r
Export Credit
2.1 1 The total export credit outstanding of scheduled commercial banks as on March 28, 1997 stood at Rs. 30,112 crore forming 10.9 per cent of total outstanding net bank credit (NBC) as against the outstanding export credit of Rs. 31,758 crore or 12.6 per cent of NBC as on March 29,1996, thereby indicating a drop in the aggregate export credit of Rs. 1,646 crore ( 5.2 per cent ) during the year. In the current financial year upto October 10, 1997, aggregate export credit of banks remained a t almost the same level of Rs. 30,111 crore forming 10.6 per cent of net bank credit as compared with Rs. 27,560 crore forming 10.9 per cent of net bank credit in similar period a year ago.
2.1 2 During 1996-97 (April-March), export credit refinance limits of scheduled commercial banks declined significantly by Rs. 7,488 crore (52.9 per cent) h-om Rs. 1 4,142 crore as on March 29,1996 to Rs. 6,654 crore as on March 28, 1997 and further to Rs. 1,936 crore as on October 10, 1997(Appendix Table 11.1 ). The sharp decline in export credit refinance limits was mainly due to the rationalisation measures undertaken by the Reserve Bank from time to time in the context of reduction in CRR.
2.13 The average utilisation of export credit refinance during '1 996-97 was generally low; after attaining a peak of 68.2 per cent during the fortnight ended April 1 2, 1996, it declined steeply to 1.3 per cent during the fortnight ended March 28, 1997 and further to 1 .O per cent in the fortnight ended June 6, 1997. Average utilisation marginally increased to 1.3 per cent during the fortnight enhed October 10, 1997. The low level of utilisation of export credit refinance may be attributed to the easy conditions in the call money market reflecting the comfortable overall liquidity situtation.
Bank Credit to Sic/</ Weal< lndus tries
2.14 There has been a perceptible fall in the number of sicl/weak units financed by banks (from 2,71,206 at end-March 1995 to 2,64,750 at end-March 1996) (Appendix Table 11.2). As a proportion of industrial credit, bank credit locked up in sicl</weak units declined from 1 1 per cent a t end-March 1995 to 10.2 per cent at end-March 1996. The bank credit locked up in small-scale industries and non- SSI sick/weak units also showed a perceptible decline during 1995-96.
Flow of Credit to the Small Scale Industries Sector
2.1 5 The public sector banks' advances t o SSI sector including cottage industries, khadi and village industries, artisans, tiny industries, etc. a t Rs.31,542 crore outstanding as at end- March 1997 constituted 16.6 per cent of the net bank credit as compared with 16.0 per cent a t end March 1996. Banks were directed that village industries, tiny industries and other SSI units, both new as well as the existing ones, having aggregate fund-based working capital limit upto Rs. 2 crore fiom the banking system ( as against the earlier level of Rs. 1 crore) may be provided working capital limits computed on the basis of a minimum of 20.0 per cent of their projected annual turnover.
2.16 During the year 1995-96, public sector banks had operationalised 169 specialised SSI

Developments In Commercial BanWng
branches. Bank. were asked to operationalise Government paper and consequentb their 100 more s~ecialised branches during the year requird provisioning on account of 'mark- 1996-97. As at t h e end of March 1997, to-market' proporHon on their Investment cumulatively~ 353 specialised SSI branches porffolios. Spreads of most of the banking have been operationalised. groups have shown marked Improvement.
Recommendations of the Abld Hussain Committee Report
2.17 An expert committee was set up in 1995 (Chairman: Shri Abid Hussain) t o recommend policy reforms and new policies for the development of small and medium enterprises to make them viable and efficient units in the light of technological changes and international competitiveness. The Committee in its report submitted to the Government of India in January 1997 has recommended several measures/changes encompassing various facets of the SSI sector. Based on the recommendations of the Committee, the limits on investment in plant and machinery in the small scale industries sector have been enhanced from the earlier level of Rs.60 lakh (Rs.75 lakh in the case of export-oriented and ancillary units) to Rs.3 crore and for the tiny
S&edu/ed Commercial Banks
2.1 9 During 1996-97, operating profits of all scheduled commercial banks (SCBs) increased by Rs.2,090 crore (20.6 per cent) i.e. from Rs. l O , l SO crore in 1995-94 to Rs. 12,239 crore in 1 996-97 (Table 11.5). Due to lower provisioning requirements, net profits recorded a higher increase of Rs.3,639 crore (387.3 per cent) in 1996-97. As a proportion to total assets, net profits nearly quadrupled from 0.16 per cent in 1995-96 to 0.68 per cent in 1 996-97 (Chart 11.3).
2.20 The spread (net interest income) of all scheduled commercial banks (SCBs) also increased from 3.13 per cent in 1995-96 to 3.22 per cent in 1 996-97 (Chart 11.4). Among the components of expenditure, interest expenditure has gone up, while intermediation cost (other operating expenses) as a
sector from Rs.5 lakh to Rs.25 lakh. In this k context, it has also been decided that out of Chart 11.3 : Net Profits to Total Assets of the funds available to all segments of the SSI Scheduled Commercial Banks - Bank Group-wise sector, banks should ensure that 40.0 per cent 1995-96 and 19S97 - will be m a d e available for units with investment in plant and machinery upto Rs.5 lakh, 20.0 per cent for units with investment between Rs.5 lakh and Rs.25 lakh and the remaining 40.0 per cent for other SSI units.
3. Working Results of Commercial Banks
2.18 The benefits of financial sector reforms were reflected in the improved working results of scheduled commercial banks in 1996-97. The proflts - both operating and net - recorded substantial improvements in all the banking groups and nm-performing assets have come down considerably. Banks M benefitted from
qS L the relative decl ine In the yields on

Report on Trend and Progress of Banking in India, 19%-97
.. Particulars 1995-96 1996-97
Variation of Column (3) over (2)
Absolute Percentage
A. lncome O+ll) I) Interest lncome
ii) Other Income
B. Expendhre (1+11+111) i) lnterest Expended
ii) Provisions and Contingencies
iii) Other Operating Expenses
of which : Wage Bill
C. Prom i) Operating Profit ii) Netprofit
E. Financial Wos (per cent) $ i) Operating Profit 1.69 1.82 0.13 - ii) Net F'rofit 0.16 0.68 0.52 - iii) Income 10.84 1 1.33 0.47 - iv) Interest l m m e 9.36 9.88 0.52 - V) Other Income 1 .50 1.45 -0.05 - vi) Expenditure 10.70 10.65 -0.05 - vii) Interest Expended 6.23 6.67 0.44 - viii) Other Operating Expenses 2.94 2.85 -0.09 - ix) Wage Bill 2.05 1.92 -0.13 - X) PTovisions and Contingencies 1.54 1.14 -0.40 - xi) Spread (Net interest income) 3.13 3.22 0.09 -
$ sharestother-W.
7- m
proportion of total expenditure and total assets was a sharp increase in wage bill following have m e down during 1996-97. The wage the wage accord with unions which included bill, which is a major component of payments of arrears as well. Intermediation cost, as a proportion to total expenditure and total assets has comet down hMIc Sector Banks
1 s 9 7 - In fact dufing 1995-96. here 2.2 1 The Rnandal results of public sector
corn- 27 subr vstbl, 34 @vat@! sector bank3 (old Md new) and

Developments in Commercial Banking
banks (PSBs) also showed substantial improvements (Table 11.6 and Appendix Table 11.3 (A)). Both operating and net profits as a ratio of total assets increased to 1.6 per cent during 1996-97 (1.49 per cent last year) and 0.56 per cent (-0.07 per cent last year), respectively. Public sector banks as a group, had suffered a considerable loss during 1995-96 due to higher provisioning o n account of 'mark-to-market' of their investment portfolio besides t h e exceptional loss suffered by the Indian Bank. In fact, during 1996-97, provisions and contingencies
0.81 per cent in 199697. The higher net profit ratio of the SBI group was mainly due to lower provisioning requirements - provisions and contingencies which as a proportion to total assets declined from 1.67 per cent in 1995- 96 to 1 -37 per cent in 1996-97. Besides, t h e lower increase in wage bill in 1996-97 contributed to the decline in intermediation cost of the SBI group from 3.10 per cent in 1995-96 to 2.94 per cent in 1996-97. But, its spreads (net interest income) increased from 3.34 per cent to 3.48 per cent in the corres~onding period. However, the spread
recorded a decline of Rs.2,10 1 crore or -26.6 per cent; as a proportion of total assets, it declined from 1.56 per cent in 1995-96 to 1 -04 4-5
per cent in 1996-97. Their intermediation cost (ie., other
of t h e SBI group was 11.4 : Spread of Scheduled I ;a& in India - Bank Group
1995-96 and lm-97
relatively high compared with the
' industry average f o r * 5CBs. Nationalised
banks group's net profit t o total asset ratio increased from (-)0.36 per cent in 1W5-% to
I 0.41 per cent in 1996-
I 97 (Table 11.8), mainly due to lower p r o v i s i o n i n g requirements. The intermediation and wage bill ratios (to total expenditurelassets)
I were similar to those for
operating expenses) as a ratio of total assets also came down by 1 1 basis points, from 2.99 per cent to 2.88 per cent during the period. For public sector banks, nearly three-fourth of their Intermediation ccnt
h sik public sector banks and consists of w q e bill; the I - wage bill of public sector banks as a 1 1996-97 all scheduled
commerdal banks. The spread has shown only
ginal Improvement during 1996-97 2.92 per cent to 2.97 p e r cent) and Jver ttm tfte Industry average.
proportion to total expenditure and total as=& h during 1996-97. Spread has al:
e declined a ma1 3 Improved (from 1995-% to was Ic
tndlx Tables ise data In Pklbr: a1 financial m e
marginally - horn 3.08 per cent lr 3.16 per cent In 1996-97. App 11.3 (A) to (H) present bank-v respect of some of the cruc Indicators fw puMk sector banks.
2.23 During 1-97, four scrips of Public 2.22 A m g the publk setor banks, the kctor ~anks--re actively traded in both the State E M k group had r&thdy high prdlts Bombay Stock Exchange (BSE) and the m d spreads and there have recorded NatloM) Stock Exchange (NSL). All the (our
I- dud- 1-97 fl.ble 11.7). Thus. equity luuer were floated to public with
S8l group's net poll6 to ami luc(r ratlo premium. Tabk 11.9 presents the details of inuervd h-an 0.42 pr a n t in 1995-% m high md IQW pc)r= ~ U O W during 19945-97
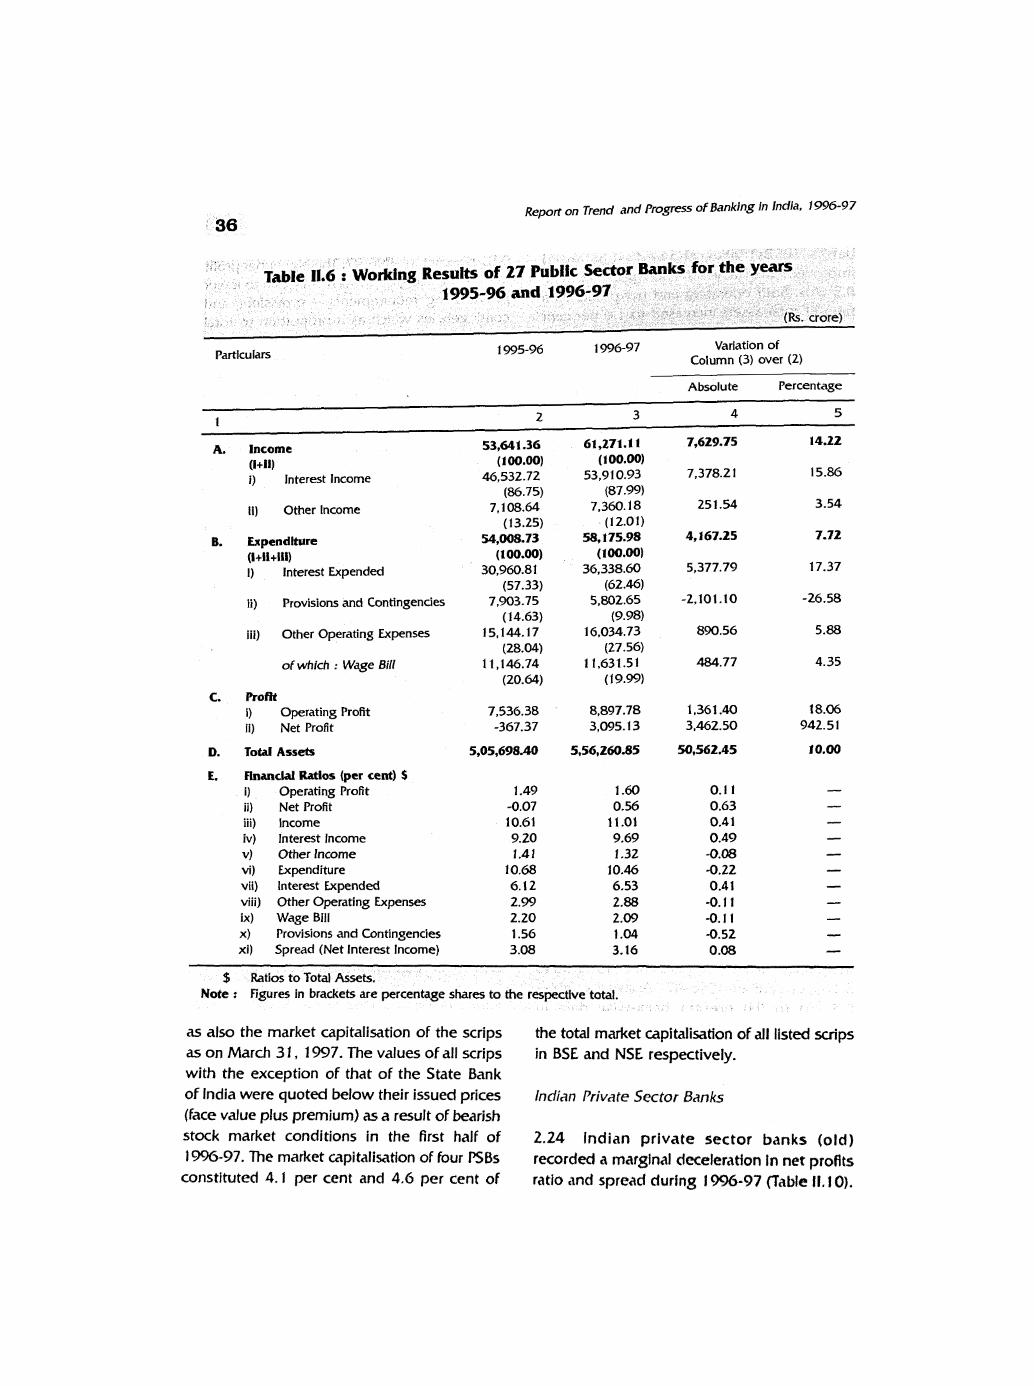
36 Report on Trend and Progress of Banking in India, 19%-97
Particulars 1995-96 1 996-97 Variation of Column (3) over (2)
Absolute Percentage
1 2 3 4 5
A. Income 53,641.36 61,271.1 1 7,629.75 14.22 (i+II) (1 00.00) (lOO.00) i) Interest Income 46,532.72 53,910.93 7,378.21 15-86
(86.75) (87.99) ti) Other Income 7,108.64 7,360.18 25 1.54 3.54
(13.25) (1 2.01) 8. Expendthrre W,008.73 58,175.98 4,167.25 7.72
(1+11+1i1) (1 00.00) (loo.00) I) Interest Expended 30,960.81 36,338.60 5,377.79 17.37
(57.33) (62.46) ii) Provisions and Contingencies 7,903.75 5,802.65 -2,101.10 -26.58
(14.63) (9.98) iii) Other Operating Expenses 15,144.17 16,034.73 890.56 5.88
(28.04) (27.56) of which : Wage Bill 11,146.74 11,631.51 484.77 4.35
(20.64) (1 9.99) C. hof'ft
i) Operating Profit 7,536.38 8,897.78 1.36 1.40 18.06 ii) Net Profit -367.37 3,095.13 3,462.50 942.5 1
D. Total Assets 5,05,698.40 5,56,260.85 M,%2.45 10.00
E. Financial Ratios (per cent) $ i) Operating Profit ii) Net Profit iii) lncome iv) lnterest lncome V) Other lnwme vi) Expenditure vii) lnterest Expended viii) Other Operating Expenses ix) WageBill X) Provisions and Contingencies xi) Spread (Net lnterest Income)
$ Ratios to Total Assets. Note : Figures in brackets are percentage shares to the respective total.
as also the market capitalisation of the scrips the total market capitalisation of dl listed scrips a s on March 3 1 , 1997. The values of all scrips in BSE and NSE respectively. with the exception of that of the State Bank of India were quoted below their issued prices Indian Private Sector Banks (face value plus premium) as a result of bearish stock market conditions in the first half of 2.24 Indian private sector banks (old) 1996-97. The market capitalisation of four PSBs recorded a marginal deceleration in net profits
constituted 4.1 p e r cent and 4.6 per cent of ratio and spread during 1996-97 (Table 11.10).

Developments in Commercial Banking 37
Provisions and contingencies of these banks as a proportion of total assets fell marginally from 1.04 per cent in 1995-96 to 1 .O1 per cent in 1996-97. Consequently, their ratio of net profits to total assets decelerated from 1.06 per cent in 1995-96 to 0.92 per cent in 1996-97 but was far higher than the industry average. The intermediation cost ratio of Indian
97. The share of wage bill in intermediAtion cost of this group was around 60 per cent in 1996-97 (65 per cent in 1995-96). The intermediation cost ratio of old Indian private sector banks was marginally lower than the industry average. Their spread also recorded a deceleration from 3.14 per cent in 1995-96 to 2.96 per cent in 1996-97 and was lower
private sector banls (old) declined from 2.60 than the industry average.
Table 11.7 : Working Results of State Bank of India and 7 Associates for t h e years 1995-96 and 1996-97
(Rs. crore)
Particulars 1995-96 1996-97 Variation of Column (3) over (2)
Absolute Percentage
A. lncome (i+11) i) lnterest lncome
ii) Other Income
6. Expenditure (1+1i+111) i) lnterest Expended
ii) Provisions and Contingencies
iii) Other Operating Expenses
of which : W e e Bill
C. Prom i) Operating Profit ii) Net Profit
E. llnanchl Rndos (per cent) $ I) Operating Profit 2.10 2.18 0.09 ii) Net Profit 0.42 0.8 1 0.39 - iii) Income 1 l .02 1 1.39 0.37
- iv) Interest Income 9.17 9.75 0.58
- V ) Other Income 1.85 1.64 -0.2 1
- vi) Expenditure 10.59 10.58 -0.0 1
- vli) Interest Expended 5.82 6.27 0.45
- v i l i ) Other Operating E x p e ~ 3.10 2.94 -0.16
- i x ) Wdge Bill 2.31 2.13 -0.1 8
- x ) Provisions and Contingcndcs 1.67 1.37 -0.30
- x i ) Sprec-cJ (Net interest Inzame) 3.34 3.m 0.14
7
S &t ics to Total Assea. Note r Dgutcs In br~kcrta ntc pcrcmtage shares to the respctlve total.

Report on Trend and Progress of Banking in India, 196-97
ults of 19 Nationalis
Absolute Percentage
A. lncome (Itli) 1) lnterest lncome
ii) Other lncome
B. Expenditure (1+11+111) i) lnterest Expended
ii) Provisions and Contingencies
iii) Other Operating Expenses
of which : Wage Bill
C. Proflt i) Operating Profit ii) Net Profit
D. TOW Assets
E. Financial Ratios (per cent) $ i) Operating Profit 1.14 1.26 0.13 - i i ) Net Profit -0.36 0.41 0.77 - iii) Income 10.37 10.80 0.43 - iv) Interest Income 9.22 9.66 0.44 V) Other Income 1.15 1.14 -0.0 1 - vi) Expenditure 10.73 10.39 -0.35 - vii) Interest Expended 6.30 6.68 0.39 - viii) Other Operating Expenses 2.93 2.85 -0.08 - ix) Wage Bill 2.14 2.07 -0.07 - x) Provisions and Contingenu'es 1.50 0.85 -0.65 - xi) Spread (Net Interest Income) 2.92 2.97 0.05 -
$ Ratios to Total Assets. Nde : Figures in brackets are percentage shares to the respective total.
had a relatively higher net profits and spread higher provisioning requirements. But their [Appendix Tables 11.4 (A) to (H)]. level of net profit ratio at 1.77 per cent of
New Private Sector Banks 1996-97 was far higher than the industry average of 0.68 per cent. Also, a notable feature of the cost structure of new Indian
2-26 The new private sector banks 'lso private sector banks is the low intermediation
suffered a setback in net profits ratio. but cost ,92 per cent in 1 ~ 6 - 9 7 , The share showed an increase in spread during lW6- of the wage bill in intermediation cost is as 97 able 11. I 1 ). Although their operating 10, 15.5 per cent in 1996-97 (14.4 per profits ratio has gone UP (horn 2.77 Per Cent cent last year). However, the wage bill has in 1995-96 to 3.0 1 per cent In 1996-97), their shown an increw of 95 per cent during 1%- net prolit ratio declined in 1996-97 due to 97. Unlike old Indian private sector banks,

Developments in Commercial Banking 39
Table 11.9 : Performance of Public Sector Bank Scrips in the Stock Market
Sr. Name of the Date of Issue Market Capitalisation' Quoted Price (Rs.) No. Bank Issue Price (Rs. Crore)
High Low
BSE NSE BSE NSE BSE NSE
1. Dena Bank Oct. 96 Rs.30 480.86 483.00 28.50 30.50 23.25 22.85 2. Bank of Baroda Dec. 96 Rs.85 2,664.00 2,716.00 118.50 135.00 79.50 75.50 3. State Bank of Dec. 93 Rs.100 14,370.92 14,689.00 33 1.75 341.95 204.25 202.50
lndia 4. Oriental Bank of Oct. 94 Rs.60 1,294.83 1,328.00 107.25 109.90 57.50 56.00
Commerce
Total 18,810.61 19,216.00
their spread (net interest income), increased 4, Regional Rural Banks (RRBs) from 2.84 per cent in 1995-96 to 2.91 per cent in 1996-97. New private sector banks 2.28 Regional Rural Banks (RRBs), along with
had one of the lowest intermediation ratios' co-operatives and scheduled commercial banks
e.g. operating expenditure to total assets (1.92 constitute the 'multi-agency' approach adopted
per cent in 1996-97) as compared with public in rural financing. RRBs set up since 1975,
sector banks (2.88 per cent), old private sector following the recommendations of the Working
banks (2.50 per cent) and foreign banks (3.01 Group o n Rural Banks (Chairman : M.
per cent). Narasimham) , now form an important segment of the formal financial structure in rural areas.
Foreign Banks
2.27 Foreign banks constituted 8 per cent of total assets in the banking sector in India in 1996-97. Their operating profits increased from Rs. 1,587 crore in 1995-96 to Rs. 1,999 crore in 1996-97 recording an increase of 2 6 per cent . Due t o higher provisioning requirements, however, their net profits ratio declined from 1.58 per cent in 1995-96 to 1.41 per cent in 1996-97 but was far above the industry average (Table 11.12). The intermediation cost of foreign banks in 1996- 97 (3.0 1 per cent) was higher than the industry average. But the share of the wage bill in intermediation cost was only 35 per cent in 1996-97. Foreign banks generally have a hlgher expenditure in technology. Jhe spread of foreign banks recorded an increase from 3.74 per cent in 1995-9(5 t o 4.09 per cent in 1996-97 and was the highest in the banking industry [Appcndlx Tables II,S(A) to (H)].
Working Results
2.29 The efficiency and viability of RRBs has been under considerable strain in recent years. Out of the 196 RRBs, during 1995-96, only 44 recorded profits as compared with 32 in 1994-95 (Table 11.1 3). Overall the net profit as ratio of RRBs in 1995-96 was negative (- 2.23). The spread of RRBs declined from 2.05 in 1994-95 to 1.86 in 1995-96. In fact the spread of loss making RRBs at 1 .OG in 1995- 96 was less than one-third of profit making RRBs (3.66).
Deposit and Credit Growd?
2.30 The a g g r e g a t e depos i t s of RRBs registered a higher growth of Rs.3,602 crore (2G.9 per cent) reaching the level of Rs. 1 6.97 1 crore a s a t the end of March 3997 as compared with a rise of Rs.2.522 crore (23.3 per cen t ) in 1995-96. Similarly, credit expansion a t Rs. 1,254.7 crore ( 1 7.2 per cent)

40 Report on Trend and Progress of Banking in India, 1996-97
Absolute Percentage
1 2 3 4 5
A. Income 4,332.02 5,401.65 1,069.63 24.69
(i+ii) (1 00.00) (1 00.00) i) Interest Income 3,754.69 4,744.90 990.2 1 26.37
(86.67) (87.84) ii) Other Income 577.33 656.75 79.42 13.76
(13.33) (12.16)
B. Expenditure 3,941.22 4,992.29 1,051.07 26.67 (i+ii+iii) (1 00.00) (1 00.00) i) Interest Expended 2,593.00 3,431.19 838.19 32.33
(65.79) (68.73) ii) Provisions and Contingencies 386.14 448.55 62.41 16.16
(9.80) (8.98) iii) Other Operating Expenses 962.08 1.1 12.55 150.47 15.64
(24.4 1 ) (22.29) of which : Wage Bill 629.38 673.36 43.98 6.99
(1 5.97) (1 3.49) C. Profit
i ) Operating Profit 776.94 857.91 80.97 10.42
ii) Net Profit 390.80 409.36 18.56 4.75
D. Total Assets 36,998.33 44,454.24 7,455.91 20.15
E. Financial Ratios (per cent) $ i) Operating Profit ii) Net Profit iii) Income iv) lnterest lncome V) Other lncome vi) Expenditure vii) lnterest Expended viii) Other Operating Expenses ix) Wage Bill x) Provisions and Contingencies xi) Spread (Net lnterest Income)
$ Rntios to Total Assets. Note : Figures in brackets are percentage shares to the respective total.
in 1996-97 was higher than the corresponding priorirlr Secror 'fargcfs figure of ''. v088' crore ( 7'6 per cent) in 2.3 1 As pa* of the endeavour to create a 1ws-96 Fable 14). ll.l which level playing field in respst priority =tor purpose-wise distribution of credit of RRBs credit dispensation, ,,fktive April , ~ 7 , reveals that nearly one-fourth of credit Was of R R B ~ to priority =for have been for retail trade and self-employed while about placed on par with commercial banks a( 40 one-half was directed towards agriculture and per cent of outstdnding advance. Out of this allied activities. overall target of 40 per cent, advances to

Developments in Commercial Banking
of 9 New Indian Private Sector Banks for the years
Particulars 1995-96 1996-97 Variation of Column (3) over (2)
Absolute Percentage
1 2 3 4 5
A. Income 999.60 1,979.59 979.99 98.04 (l+il) (lOO.00) (1 00.00) i) Interest Income 834.98 1,653.50 818.52 98.03
(83.53) (83.53) ii) Other Income 164.62 326.09 161.47 98.08
( 16.47) ( 16.47) B. Expenditure 832.84 1,693.86 86 1 -02 103.73
(l+il+il1) (lOO.00) (1 00.00) i) Interest Expended 578.89 1,185.01 606.1 2 104.70
(69.51 ) (69.96) ii) Provisions and Contingencies 83.12 198.75 1 15.63 142.60
(9.98) (1 1.73) iii) Other Operating Expenses 170.83 310.10 139.27 81.53
(20.51 ) (18.3 1) of which : Wage Bill 24.67 48.02 23.35 94.65
(2.96) (2.83) C. Profit
i ) Operating Profit 249.88 484.48 234.60 93.88 ii) Net Profit 166.76 285.73 1 18.97 69.60
D. Total Assets 9,02.4.7 1 16,112.49 7,087.78 78.51
E. Financial Ratios (per cent) $ i) Operating Profit ii) Net Profit iii) lncome iv) lnterest lncome V) Other lncome vi) Expenditure vii) lnterest Expended viii) Other Operating Expenses ix) Wage Bill x) Provisions and Contingencies xi) Spread (Net lnterest Income)
$ Rntlos to Total Assets. Note t figures in brackets are percentage shares to the respective total.
weaker sections of xxiety should k 25 per liberal branch licensing, rationalisation of cent ( 1 0 per cent of total outstanding guidelines in regard to investment avenues advances). for surplus funds and shift From the Target
Group - Non-Target Group pattern to a prescription of a priority sector target horn
2.32 Measures for revamping the Regional ih, 1997-98. Rural Banks were continud during 1996-97.
w
Further inltintives. during the year, included 2.33 As reported in the last year's Report. a

Report on Trend and Progress of Banking in India, 1996-97
Table 11.12 : Working Results of 39 Foreign Banks in India for the years 1995-96 and 1996-97
(Rs. crore)
Particulars 1995-96 1996-97 Variation of Column (3) over (2)
Absolute Percentage
A. lncome (i+ii) i) lnterest lncome
ii) Other lncome
B. Expenditure (i+ii+iii) i ) lnterest Expended
ii) Provisions and Contingencies
iii) Other Operating Expenses
of which : Wage Bill
C. Profit i) Operating Profit ii) Net Profit
D. Total Assets 47,43046 55,9 10.98 8,480.52 17.88
E. Financial Ratfos (per cent) $ i) Operating Profit ii) Net Profit iii) lncome iv) lnterest lncome V) Other lncome vi) Expenditure vii) lnterest Expended viii) Other Operating Expenses ix) Wage Bill x) Provisions and Contingencies xi) Spread (Net lnterest Income)
$ Ratios to Tot& Assets. Note : Figures in brackets are percentage shares to t h e respective total.
provision of Rs.200 crore was made in the 5. Regional Spread of Banking Union Budget for 1996-97 for capital suppart to RRBs. The amount was released to 34 RRBs 2-34 had k e n given the operational taken up For restructuring in Phase Ill and for freedom to open and relocate branches at semi- providing second dose of assistance to 16 urhn, urban and metropolitan centres 5 u b j ~ t select RRBs our of 102 RRBs which had been to approval of respective Bonrds and ensuring taker1 up For comprehensive restructuring track record of profit in the 1 s t three yean. during 1994-95 and 1995-96. The 1055 mklng banks arc subject to restrlctlons

Developments in Commercial Banking
1994-95 1995-96 Items Loss Profit All RRBs Loss Profit Ali RRBs
Making Making (196) Making Making ( 196) ( 1 64) (32) ( 1 52) (44)
I 2 3 4 5 6 7
A. Income 814.84 41 5.26 1,230.10 926.74 579.63 1,506.37 (i) Interest Income 77 1.54 386.60 1,158.14 867.82 546.86 1,414.68 (ii) Non-interest Income 43.30 28.66 71 .% 58.92 32.77 91.69
B. Expenditure 1,238.06 386.30 1,624.36 1,394.70 537.25 1,931.95 (i) Interest Expended 622.86 228.32 851.18 728.62 332.04 1,060.66 (ii) Provisions and
Contingencies 100.97 15.70 1 16.67 127.72 18.32 146.04 (iii) Other operating
expenses 5 14.23 142.28 656.51 538.36 186.89 725.25 of which : Wage Bill 402.07 112.10 514.17 444.41 159.09 603.50
C. Operating kofIt/loss -322.25 44.66 -277.59 -340.24 60.70 -279.54
D. Net hofhfioss -423.22 28.96 -394.26 -467.96 42.38 -425.58 E. Total Assets 10,811.72 4,125.89 14,937.61 13,185.96 5,864.51 19,050.47 F. Financial Ratios (per cent) $
(i) Operating -2.98 1.08 -1.86 -2.58 1.04 - 1.47 Profit/Loss
(ii) Net Profi t/Loss -3.91 0.70 -2.64 -3.55 0.72 -2.23 (iii) Income 7.54 10.06 8.23 7.03 9.88 7.9 1 (iv) Interest Income 7.14 9.37 7.75 6.58 9.32 7.43 (v) Other Income 0.40 0.69 0.48 0.45 0.56 0.48 (vi) Expenditure 1 1.45 9.36 10.87 10.58 9.16 10.14 (vii) Interest Expended 5.76 5.53 5.70 5.53 5.66 5.57 (viii) Operating Expenses 4.76 3.45 4.40 4.08 3.19 3.81 (ix) Provisions and
Contingencies 0.93 0.38 0.78 0.97 0.31 0.77 (x) Wage Bill 3.72 2.72 3.44 3.37 2.71 3.17 (xi) Spread (Net Interest Income) 1.38 3.84 2.05 1.06 3.66 1.86
6 Ratios to Total Assets.
Note r 19 loss making RRBs In 1994-95 turned into profit making in 1995-96 and 7 profit making RRBs in 1994-95 turned Into loss making units in 1995-96
on opening OF branches. With regard to branches during the next 12 months. This has opening up a branch in rural areas, prior to be forwarded to the Reserve Bank for prior approval of the Reserve BNlk is required sublect approval after taking clearance from the to conditions such as the recommendation from c~r~cerned Board of Directon. the Directorate of Institutional finance of the concerned State Government. Banks falling
2.35 The credit-deposit (CD) ratio of SCBs
under the category of having achieved 8 per (as per sanctions) as on the last Friday of March
cent CRAR dedaring net profit for the last three 997 was lower at per cent as
cons~eutlve years, containing their NPAs within with 6 1.9 per cent in the corresponding period 15 per cent of their total advances and with a 1 f i f Year (Appendix Table 11.7). hlost of the
minimum of b, I M) m r e o m 4 funds have regions showed deceleration in CD ratio during
to prep,lrc a Plan of Acrlon for opening the year.

Table 11.14 z Selected lndlcatots of Reglond Rural Banks (Rs. crore)
U ~ r c h 3 1. March 29, March 28, Variations
ltcrns 1995 1994 I997 1995-96 1996-97
I 2 3 4 5 6 (3-2) (4-3)
(b) Tfme Dcposlfs
4, Other Demand and Time Liabilities* 359.27 435.13 570.3 1 75.86 135.18 (21.12) (3 1.07)
5. Bmk Credit
6. Investments
(a) Government Securities
(b) Other Approved Securities
7. Inter-bank Assets
8, Rcserves (Including Cash with RBI)
Memorandum Items (a) Reserves/Deposit h t i o (Oh) (b) Investment/Deposit Ratio (%) (c) Credit-Deposit Ratio (%)
* Includes Participation Certificates issued to others. Note : Figures in brackets are percentage variations.
Table 11.15 : Purpose-wise Advanc
Purpose Amount (Rs. crore)
March Per cent September Per cent 1996 to Total 1996 t o Total
1 2 3 4 5 1. Short term (crop loan) 1,330 17.6 1,480.38 18.8 2. Term loan for agriculture 1,239 16.4 1,278.29 16.3 3. Allied activities 926 12.3 923.82 11.8 4. Rural artisans, village and cottage
industries 589 7.8 607.28 7.7 5. Retail trade and self-employed etc. 1,839 24.4 1,834.24 23.4 6. Consumption loans 258 3.4 275.84 3.5 7. Other purposes 1,330 17.6 1,41 1.60 18.0 8. Indirect advances 35 0.5 41.21 0.5
Total 7,546 100.0 7,852.66 100.0 Note : Data may not tally with Table 11.14 due to differences in reporting day.
Developments in Commercial Banking
2.36 The total number of branches of SCBs at all-India level increased from 63,105 as on June 30, 1996 to 63,5 13 as on June 30, 1997 (~ppend ix Table 11.6), with northern and southern regions leading in opening of new branches during the period (Appendix Table 11.8). However, the average population per bank branch as on June 30, 1997 remained unchanged at around 1 5,000 (Appendix Table 11.8). Bank group-wise, branches of Indian private sector and foreign banks have shown increase during 1996-97. Of the total branches of banks, 51.9 per cent are located in rural areas (52.3 per cent in 1995-96), and 11.9 per cent in metropolitan centres/port-towns (1 1.7 per cent in 1995-96). The eastern and north-eastern regions continued to remain relatively less banked with the average population per bank branch remaining at substantially higher level than in other regions (Appendix Table 11.8).
6. Money Market Instruments
Certificate of Deposits (CDs )
2.37 Reflecting the easy liquidity conditions in the banking sector, the outstanding amount of Certificate of Deposits (CDs) of scheduled commercial banks declined perceptibly to a level of Rs. 12,134 crore for the fortnight ended March 28, 1997 from Rs. 16,3 1 6 crore for the fortnight ended March 29, 1996 (Appendix Table 11.9). Following the lacl< of demand for funds and general decline in interest rates, the discount rate range o n CDs declined substantially from 12.00 - 22.25 per cent for the fortnight ended March 29, 1996 to 7.00 - 15.75 per cent for the fortnight ended March 28, 1997 and further to 7.30 - 1 2.50 per cent for the fortnight ended September 12, 1997.
2.38 According to the guidelines issued by the Reserve Bank in April 1997, the minimum size for the issue of CD to a single investor was reduced to Rs. 10 lakh (above Rs. 10 lalth in multiples of Rs.5 lakh) from Rs.25 Ial<h and has further been reduced to Rs. 5 lalth (above Rs. 5 lalth in multiples of Rs. 1 lalth) in October 1997.
2.35, The year 199697 saw a revival of the Commercial Paper (CP) market driven by demand from banks which were flush with funds (Appendix Table II.10). The outstanding CP issued by companies increased significantly from a low of Rs.76.3 crore for the fortnight ended March 31, 19% to Rs.646.0 crore for the fortnight ended March 31, 1997. Simultaneously, there was a substantial decline in the typical discount rate hom 20.2 per cent per annum for the fortnight ended March 3 1, 1996 to a range of 1 1.3-12.5 per cent per annum f o r the fortnight ended March 3 1, 1997 in tandem with the decline in short-term interest rates. Further, the total outstanding issue of CP increased sharply to Rs.3,413 crore while the effective discount rate range declined to 7.4 - 12.0 per cent per annum for the fortnight ended October 3 1, 1997. As in the past, banks continued to be the major investors in CP during 1996-97 as well.
2.40 In order to facilitate primary dealers (PDs) to have access to short-term borrowings, the Reserve Bank allowed PDs to issue CPs in September 1996.
2.4 1 Besides, effective October 19, 1996, the amount of CP is permitted to be adjusted out of loan or cash credit or both as per the arrangement between borrower i.e. issuer of CP and the concerned bank. The Reserve Bank in its Monetary and Credit Policy for the first half of 1997-98 effected a reduction in the minimum tenure of CP issued by corporate customers and primary dealers in Government securities from 3 months to 30 days fiom April 1 5, 1997. As a result of these relaxations, the discount rate of CPs showed a sharp decline from April 1997 onwards. Considering the systemic changes in regard to the assessment of working capital finance by banks introduced in the credit policy announced in April 1997, it has been decided, with effect from October 27, 1997, to dispense with t h e requirement of a minimum current ratio of 1.33:1 as part of the eligibility conditions for issue of CP. The matter relating to restoration
Report on Trend and Progress of Banklng In Inclla, 1996-97
of the working capital (fund based) credit limit, deduction of Rs.3,000 under Section 80L of
consequent on repayment of CP has also been the Income Tax Act. Besides there is a reviewed and it has been decided that banks proposal for introduction of a Capital Indexed may henceforth be given full freedom to Bond where the repayment of the principal decide the manner In which it should be done. amount will be indexed to inflation. It was
Maney Market Mutual Furids (MMMFs)
2.42 Subsequent to relaxation of the norms for setting up of MMMFs in December 1995, eight banks/financial institutions/private sector mutual funds were permitted to se t up MMMFs, during the year 1996-97. These are the lDBl Mutual Fund, Unit Trust of India, ABN AMRO Bank, Bank of Madura Ltd., Kothari Pioneer Mutual Fund, ANZ Grindlays Bank, Canara Bank and Deutsche Bank. Three institutions viz., Kothari Pioneer Mutual Fund, UTI and IDBl Mutual Fund have already floated - MMMF schemes in recent months. In October 1997, MMMFs were permitted to invest in rated corporate bonds and debentures with a residual maturity of up to one year.
7. Government Securities Market
2.43 The Government securities market has been emerging as the focal point for the conduct of monetary policy through open market operations in recent years. During the last two years, fiesh initiatives were taken to Further the link between gilt, money, capital and foreign exchange markets and to promote the retailing of Government securities. These include the establishment of a system of Primary Dealers (PDs) and the laying down of guidelines for setting up Satellite Dealers (SDs).
2.44 In the Union Budget 1997-98, some major steps to accelerate the development of the Government securities market were announced. These include: ( i ) withdrawal of the provision for tax deduction a t source (TDS) on payment of interest on Government securities, and (ii) provision for the income earned by way of interest on any security of t h e Central Government o r a S ta te Government to qualify for the additional
decided in April 1997 to issue Treasury Bills of varying maturities. This would facilitate the a s h management requirements of various segments of the economy as well as help form a complete yield curve for aiding the pricing of debt instruments of varying maturities. As part of this process, the Reserve Bank introduced auctioning of 14 day Treasury Bills on regular basis, effecthie June 6, 1997. Furthermore, the decision to allow repos on all Central Government dated securities and Treasury Bills is expected not only to integrate money market, but also to enhance the liquidity in the market.
2.45 The Monetary and Credit Policy for the second half of 1997-98 also announced the following measures t o activate t h e Government securities market. These include: introduction of 28-day Treasury Bill on auction to help cash management requirements of various s egmen t s of t h e economy; introduction of uniform price auction in respect of 91-day Treasury Bill auct ions a s experimental measure; notifying i ssue amounts for all auctions; keeping non- competitive bids outside the notified amount in respect of 91 -day and 14-day Treasury Bill auctions; permission to banks to freely buy and sell Government securities on an outright basis at prevailing market price without any restrictions on the period between sale and purchase in order to promote the retail market segment; and permitting ready forward transactions in respect of PSU bonds and private corporate debt securities which are held in a dematerialised form in a depository and the transactions are done in recognised Stock Exchanges.

Developments in Commercial Banking
Trends In Primary and Seconda~ rationalisation of cash reserve ratio (CRR) vls- Market in Government Securities a-vis export refinance, the refinance facillty to
2.46 Table 11.1 6 presents t h e yields on various Government securities in primary auctions for the last three years. With the containment of inflation in 1996-97, the yields in primary auctions have come down. The average implicit yield at cut-off prices on 91 - day Treasury Bills came down from 12.67 per cent in 1995-96 to 9.67 per cent in 1 996-97. Similarly the yield on 364-day Treasury Bills declined from 12.87 per cent in 1995-96 to 1 1.67 per cent in 1996-97. The 10-year dated security yield also declined horn 14 per cent in 1995-96 t o 13.65 per cent in 1996-97. With the active trading of Government securities in the secondary market among financial intermediaries through Reserve Bank SGL accounts and through various stock exchanges, the turnover in Government securities has increased considerably.
Withdrawal of Refinance Against Government Securities
2.47 With the emergence of a system of Primary Dealers in the Government securities market and the reduction in CRR as also the
scheduled commercial banks against Government securities was found to be redundant and was therefore, withdrawn with effect from July 6, 1996. Though the aggregate limits under the refinance facility amounted to Rs.3,385 crore, due to easy call money rates, the average utilisation of this facility during the fortnight ended June 2 1, 1996 was nil, and hence withdrawal of the facility did not affect adversely the liquidity of banks.
Liquidity in Government Securities Market
2.48 The relatively easy liquidity conditions in 1996-97 facilitated a quicker completion of t h e borrowing programme of the Central Government t h a n in 1995-96 This was also ieflected in the softening of the coupon rates and improved market absorption of Government securities. The early completion of market borrowing programme in 1996-97 partly helped in containing the net issue of ad hoc Treasury Bills within the intra-year limit of Rs.9,000 crore since August 1996. During 1997-98 upto November 3, 1997, the Central Government completed 95 per cent of the gross borrowing programme budgeted at
Table 11.16 : Yields on Government Securities in the Mmaq Market - 1994-95 to 1997-98 (April-October)
Years Maturities
Treasury Bills @ Dated Securities $
14 Days 9 1 Days 364 Days 2 Year 5 Year 10 Year
1 2 3 4 5 6 7
1994-95 - 9.16 10.15 - 12.00 12.35 12.71
1995-9G - 12.67 1 2.87 13.25 13.25 13.75 13.50 13.85 14.00
1996-97 4.95 9.67 1 1.67 13.50 13.75 13.85 1 3.62 13.55 13.65
$ Coupon Rates, @ Average irnpttdt yldd at cut-off prices.

48 Report on Trend and Progress of Banking In India, 1996-97
&.52,963 crore. Open market operations were also activated substantially in 1 996-97 which helped in partly sterilising foreign exchange inflows. With easy liquidity conditions prevailed during the current financial year i.e, upto October 24, 1997, the net sales amounted to Rs.2,072 crore.
2.49 As at end March 1997, the outstanding stock OF Government of lndia dated securities amounted to Rs.2,09,200 crore and Treasury Bills outstanding were placed at Rs.13,941 crore. A year ago, i.e. as at end-March 1996, the outstanding stock Government of lndia dated securities was Rs. 1,70,600 crore and Treasury Bills was &.8,375 crore. The ratio of average monthly turnover of outright transactions to stock worked out to 4.5 per: cent (3.6 per cent last year) and 24.2 per cent ( I . 1 per cent last year), for dated securities and Treasury Bills, respectively.
Routi~?g of Transactiol~s Thro~~gh DFHI
2.50 In April 199 1 , certain institutions were given access to the call/notice money marlcet as lenders under specified restrictions including the provision that the transactions should be routed through the Discount and Finance House of lndia (DFHI). With effect from the fortnight beginning April 26, 1997, the facility of routing such transactions was extended to all the primary dealers. At the same time, the minimum size of a transaction was reduced from Rs.20 crore to Rs. 10 crore. This has been further reduced to Rs. 5 crore on October 2 1, 1 997.
Repos and Reverse Repos
2.51 To serve as an equilibriating force between the money marlcet, and Government Securities marlcet, repo auctions were first introduced in December 1992 in Central Government dated securities. They were, however, suspended in February 1995. Repo auctions were again resumed effective November 4, 1996 and were effectively used for money market interventions.
2.52 With a view to broad-basing the repol
reverse repo market. N part of the Monetary and Credit Policy for the first half of 1997-98, the Reserve Bank announced that non-bank entities holding Subsidiary General Ledger (SGL) Accounts with Reserve Bank of India will be allowed to enter into reverse repo transactions. It was also announced that ready forward transactions will be permitted in respect of all Central Government dated securities besides Treasury B i l l s of all maturities. With this addition, the total volume of eligible securities would increase by Rs. 1,09,400 crore to Rs.2,14,300 crore.
Treasury Bills of Varying Maturities
2.53 Consequent to the Agreement signed between the Government of lndia and the Reserve Banlc on March 26, 1997 , the system of 91 -day tap Treasury Bills and a d hoc Treasury Bills was discontinued fiom April 1, 1997. The outstanding ad hoc Treasury Bills as on March 31, 1997 were funded into special securities, without any specified maturity, at an interest rate of 4.6 per cent per annum, o n April 1 , 1997. The outstanding tap Treasury Bills as on March 3 1 , 1997 were also traded into special securities without any specified maturity, at an interest rate of 4.6 per cent per annum.
2.54 In the context of the discontinuance of 9 1 -day tap Treasury Bills and a d hoc Treasury Bills effective April 1, 1997, it was decided to issue Treasury Bills of varying maturities to facilitate the cash management requirements of various segments of the economy. Accordingly, effective April 1, 1 997, the Government of lndia introduced the scheme of 14-day lntermediate Treasury Bills. These lntermediate Bills will be sold by the Reserve Bank, only to State Governments, foreign Central Banlcs and other specified bodies with whom the Reserve Banlc has an agreement by way of investing in their temporary surplus funds.
Liquidity Support to Primary Dealers (PDs)
2.55 A "Scheme of payment of Underwriting Fee to Primary Dealers" was introduced effective June 2, 1997 instead of commission.

Developments In Commercial Banking
Under the scheme, a minimum of 25 per cent of the notified amount was offered for underwriting by Primary Dealers and this was raised to 50 per cent kern August 8, 1997. In case of issues within notified amount, a minimum of Rs. 100 crore for 91 -day Treasury Bills and Rs.200 crore for 14-day Treasury Bills were offered.
2.56 The Reserve Bank is extending liquidity support in the form of reverse repo facility in Government dated Securities and 91 -day Auction Treasury Bills to PDs. Liquidity support t o PDs in the form of reverse repo was fixed a t Rs. 841 crore for 1996-97. However, the maximum amount availed of by PDs was around Rs.541 crore. During 1997-98, the liquidity support to PDs in the form of reverse repos was fixed around Rs.3,710 crore. The maximum amount availed of by PDs till October 13, 1997 stood around Rs. 1,456 crore. Effective July 10,. 1996, the rate of interest on the liquidity support was reduced by 1 percentage point from 12.5 per cent to 1 1.5 per cent per annum for 91 -day Auction Treasury Bills and fiom 14.0 per cent to 13.0 per cent per annum for Government of lndia da ted securities. The rates were further reduced to 10.5 per cent for 91 -day Treasury Bills and 11.0 per cent per annum for Central Covernment dated securities from December 19, 1 996. Further, in the Monetary and Credit Policy for the first half of 1997-98, the rate for liquidity support to PDs was linked to the Bank Rate and the difference in the rate of interest between dated securities and Treasury Bills was done away with.
Satellite Dealers (SDs)
2.57 Following t h e introduction of a system of Primary Dealers (PDs) in the Government securities market, RBI decided to register Satellite Dealers (SDs) with a view to widening t h e s c o p e for organised dealing a n d distribution arrangements. The SDs, when set up, will form the second tier in trading and distribution of government securities.
RBI Cuidelir~cs fbr Foreijgr~ Insti fut iu~~~ii Investors (Flls) Invesrn~cii t irl L?,? red Government Sccuritics
2.58 Based on the policy announcement of the Government of lndia to permit Foreign Institutional Investors (Fl ls ) to invest in Government dated securities, on January 30, 1997, the Reserve Bank issued the following guidelines for Flls authorised to invest in Government dated securities:
a) For the purpose of FII investment, Government dated Securities would include dated securities of all maturities of both Covernment of lndia and State Governments but would not include Treasury Bills.
b) Investment i n Government da ted securities by Flls may be made either in the primary market at the auction/ floatation or in the secondary market.
c) Investment by Flls in Government dated securities should be undertaken only through designated banks, i.e., any bank in lndia which has been authorised by the Reserve Bank to act as a banker to Foreign Institutional Investors.
d) Investment by Flls will be allowed only in t h e form of Subsidiary General Ledger (SGL) Account through a bank having both SGL Account No. II (Constituents' Account) and Current Account with t h e Reserve Bank.
e) The secondary market transactions by Flls will be permitted through recognised Indian Stock Exchanges or over-the- counter (OTC) with SGL Account holders and will be governed by t h e Delivery versus Payment system. It was further clarified by t h e eserve Bank o n July 26, 1997 that the Flls authorised to invest in Government dated securities as per its guidelines would include only 100 per cent debt fund.

Report on Trend and Progress of Banking In India, 1996-97
V<~/ua tion of' lnvesrrncnt Portbllo of Banks
2,59 Banks are required to classlfy thelr investments in Government and approved securities Into two categories viz., 'permanent' and 'current' investment. While permanent category securitles were permitted to be valued at cost, the current category securities were to be marked to market. As much as 70 per cent of securities were allowed to be kept under the permanent category by banks, till March 1995. This proportion was brought down to 60 per cent for the year ending March 1996 and to 50 per cent for the year ending March 1997 and would further be brought down to 40 per cent for the year ending March 1998 as a part of steady transition to a fully 'mark-to-market' basis of valuation of investments.
Technical Advisory Committee
2.60 A Technical Advisory Committee on Government Securities Market has been constituted by the Reserve Bank to advise on all policy related matters concerning the Government securities market.
8. Rural Credit
2.61 For ensuring overall economic development of the rural sector, it is imperative that timely and adequate institutional credit at affordable cost is made available (See Box 11.4). The NABARD has been playing a crucial role in the development of the rural sector. The Reserve Bank enhanced its General Line of Credit (I and 11) for NABARD from Rs.5,250 crore to Rs.5,500 crore during the year 1 996-97 and further to Rs.5,700 crore during the year 1997-98 with a view to helping NABARD to accelerate the flow of production credit for the rural sector. Simultaneously, the share capital of NABARD was increased by Rs.500 crore to Rs.1,000 crore during 1996-97 with a contribution of Rs.400 crore from the Reserve Bank and Rs. 100 crore from the Government of India. The announcement in the Bank's Monetary and Credit Policy for the first half of 1997-98
indicated a further increase in the share capital of NABARD by Rs.500 crore, taking the share capital to Rs. 1,500 crore. These steps would enable the NABARD to effectively leverage its equity and mobilise additional resources for rural development.
2.62 A steady rise in the flow of credit to agricultural sector has been witnessed. The advances of public sector banks to agriculture increased by Rs.4,66 1 crore to Rs.3 1,O 12 crore as on last Friday of March 1997 (1 6.4 per cent of net bank credit) from Rs.26,351 crore as on last Friday of March 1996 (14.3 per cent of net bank credit). The Reserve Bank had directed PSBs to prepare special agricultural credit plans for the financial year 1996-97. The disbursements to agriculture under this plan during the year were placed at Rs. 12,782 crore as against the projection of Rs. 14,253 crore.
2.63 A consortium of select PSBs was formed with the State Bank of India (SBI) as the leader to provide credit to the tune of Rs. 1,000 crore to Khadi and Village Industries Commission (KVIC). The banks which have not achieved the priority sector lending target of 40 per cent, even after their contribution to the Rural Infrastructural Development Fund (RIDF) - I , have been included in the consortium and have been allotted shares in the consortium on a pro rata basis depending on each bank's priority sector shortfall. The credit provided by banks to KVIC under this scheme will be reckoned as their indirect lending to small scale industries under the priority sector. These loans are provided at 1 .5 per cent below the average prime lending rates of five major banks in the consortium. As at the end of April 1997, Rs.450 crore were disbursed by the consortium under this scheme.
2.64 With a view to catering to the needs of the local people and to providing efficient and competitive financial intermediation services in areas of operation extending over two or three contiguous dlstricts as also to tapping retail savings where the branches of

Developments in Commercial Banking 61
BOX 11.4 : DIRECTED CREDIT - ISSUES RELATING TO RURAL CREDIT
A number of countries - both developed and developing - have intervened extensively in credit allocation, with some of them undertaking nationalisation of major banks as a way of addressing this task. The interest rates charged on directed credits often deviated substantially from rates on non- preferential credit, often involving an implicit subsidy. Subsidies have sometimes been covered by low-cost loans hom international agencies, or by a charge against publlc spending, or by cheap rediscounts from the central bank, or by cross-subsidization through higher rates charged to some borrowers and lower rates paid to depositors. Subsidies when financed by the central bank or charged t o the government budget, have often compromised efforts at monetary or fiscal restraint.
The impact of directed credit on the allocation of resources is not certain. In some countries such as South Korea, directed programme-supported lendings have led to substantial improvement in exports. In many countries, however, directed credit has led to large non-performing loans and adversely affected the efficiency and viability of banks. The ability to borrow at subsidised rates has resulted in adverse incentive structures in the credit markets. Those who borrowed for projects with doubtful viability i.e. high risk could not repay their loans. In other cases borrowers willingly defaulted because they believed creditors would not take legal action against those considered to be in priority sectors. The distorted allocation of resources and the erosion of financial discipline have left intermediaries unprofitable and insolvent.
High performing Asian economies (HPAEs) viz., Japan, Indonesia, Malaysia, Taiwan, China etc., ther developing economies, have also used directed credit programs to target credit directly to
the priority activities. However, Japan and Korea have used mechanisms such as limiting the size of credit subsidies, application of stringent standards to t h e selection and implementation of projects, continuous and effective monitoring of the performance of the borrowers etc., to increase loan repayment rates and the overall success of directed credit. Repayment rates in Korea have often been in excess of 98 per cent. The success of the Korean program has been due to t h e modest interest rate subsidies. But experiences of countries such as Indonesia and Malaysia were disappointing with regard to credit interventions; directed credit programmes in these countries led to high non- performing assets (NPAs) .
A major problem of credit markets and more importantly that of directed credit programmes is t h e 'information asymmetry' and the large agency costs associated with monitoring directed credit programmes. One of the solutions suggested in the literature to reduce 'information asymmetty' and large agency costs associated with directed credit programme is to utilise t h e role of Peer Croups, Non-Governmental Organisations, Self-Help Groups in credit market. A notable success story in this regard is the case of Bangladesh Grameen Bank (BGB), which has been lending largely to small groups of women t o finance small-scale self-employment activities. BCB has been very successful in effectively tackling the problems of adverse selection, moral hazard, and lack of collateral. As of January, 1996 in the case of BGB, the repayment rate was 98 per cent despite t h e interest rate on loans being 20 per cent. The bank's organisation of borrowers into groups with joint liability for loans represents the key innovation whereby t h e borrowers have an incentive to use their information about each other t o screen out those who exhibit undesirable characteristics. The agreement by a group of borrowers to accept liability to repay all the loans of t h e group means that the group acts effectively as a form of social collateral substituting for the traditional physical collateral. Thus the inherent problem of 'asymmetric information ' characterising the directed credit programmes especially in the case of small borrowers, is effectively tackled by the peer monitoring mechanism so crucial for the success of BGB. However, in some cases, peer pressure mechanism may not work effectively, especially if the group is not homogenous and the risk-profile of the group members is not similar.
NGOs are often regarded as particularly well placed to provide targeted credit, b e c a w , by definition, they are not government-related and are therefore likely to be flexible, innovative and socially responsive. NGOs and NGO-based banks may also offer more opportunities for reasonable

Report on Trend and Progress of Snnklng In Indla. 1996-97
and necessary interventions by donor institutions than all the other relevant institutional forms. The most Important aspect of thls flexlbllity is that a formal NGO can easily change its character from belng an lnstltutlon whlch itself provides loans to being an institution whlch owns (or co-owns) a bank that provides its services to the target group. Up to now, this potential of NGOs as Pamers in development has not been tested enough in practice.
The experience of BGB and HPAEs, including East-Asian countries, shows that provision of cheap and subsidised uedlt perse is not the prime requirement of a successful rural credit progmmme. The relief provided to individual borrowers under cheap loan schemes may not be enough to make a dent on rural poverty. The prescription of directed credit at low interest rates through a system of financial repression may not be suitable for sustainable credit delivery. While an element of cross- subsidisation may be built into the priority-sector credit delivery mechanism, the more crucial issue is one of avallabillty of adecluate and timely credit at reasonable interest rates. This in combination with effective end-use of fund at the borrower level will ensure purposeful directed credit programmes and at the same tlme guarantee the vlabllity of rural lending institutions themselves.
Refkrences :
The World Bank (19891, World Development Report, New York: Oxford University Press.
The World Bank (1993) The East Aslan Miracle, Economic Growth and Public Policy, A World Bank Policy Research Report, New York: Oxford University Press.
Montgomery, R (1%) 'DIscipllnlng or Protecting the Poor? Avoiding the Social Costs of Peer Pressure in Micro-Credit Schemes', Joumal of lnternatlonal Development, 8, 289-305.
Schmldt, R H. and Zeitlnger, C. P. (1996) 'Prospects, Problems and Potential of Credit-Granting NGOs', Journal of International Development, 8,24 1-258.
Bernasek, A. and Stanfleld, j. R 'The Grameen Bank as Progressive Institutional Adjustment', Journal o f Economic Issues, 31, 359-366.
commercial banks are insignificant, the Reserve Bank has given 'in principle' approval for setting up Local Area Banks (LABs), one each in Maharashtra, Karnataka and Andhra Pradesh, subject to the proposed banks complying with certain conditions. Such banlts will have to observe overall priority sector lending target at 40 per cent of net bank credit and the sub-target of 10 per cent of net bank credit for lending to wealter sections. Interest rates on advances for LABs stand deregulated as in the case of RRBs.
Rural lnhastrucrural Development Fund (RIDF)
2.65 The Rural Infrastructural Development Fund (RIDF) set up in NABARD for financing rural infrastructure has three types of funds. RIDF-I was created with the objective of giving loans to State Governments and State-owned corporations for expediting the ongoing irrigation projects and other forms of rural infrastructure. Under RIDF-I, all Indian scheduled commercial banks, (excluding
Regional Rural Banks) are required to contribute an amount equivalent to the shortfall in achieving the sub-target of 18 per cent of net bank credit (NBC) to the agriculture sector, subject to a maximum of 1.5 per cent of NBC. The deposits made under RIDF-I are for a period upto five years and carry interest rate of 12.5 per cent and are recltoned as indirect finance to agriculture, under priority sector. As at the end of March 1997, a sum aggregating Rs. 2,010.05 crore has been sanctioned by NABARD to 23 State Governments. Of this, a sum of Rs. 1 ,183 crore has been disbursed to 18 State Governments.
2.66 PSBs, which had not achieved the overall priority sector lending target of 40 per cent of NBC as on the last Friday of March 1996, were required to contribute to RIDF-II on a pro rata basis, depending on their shortfall. Such deposits are for a period of five years and carry interest rate of 1 1.5 per cent per annum. A s at the end of March 1997, loans aggregating Rs. 2,646.88 crore have

Developments in Commercial Banklng
63
been sanctioned by NABARD to 16 State stipulated target of 40 per cent. Their direct Governments, ofwhich a sum of Rs.291 crore credit to agriculture, as proportion of NBC. h a s been disbursed to 12 States. increased to 7.9 per cent in March 1997 from
6.5 per cent in March 1996. Advances to SSI 2d7 in Budget units, as proportion of NBC, were higher at 1997-98, NDF-111 would be launched in 1997-
21. per cent in March , 997, up 8. 98 with a 'Orpus Rs'29500 crore be per cent in March 19% (Appendix Table 11.12). contributed primarily by both public and private sector banks which have not achieved the priority sector lending target of 40 per cent of NBC as on the last reporting Friday of March 1997. This will be supplemented by contribution from those public sector banks having shortfall in agricultural lending on the same reference date on a pro rata basis. Deposits in RIDF Ill will be for a period of 5 years and will carry interest at the rate of 11.5 per cent per annum.
Priority Sector Advances by Public Sector Banlcs
2.68 During 1996-97, t h e priority sector advances of public sector banlts (PSBs)
Priority Sector Advances by Incfiar? Privarc Sectors Bcmiir (New)
2.70 The lndian private sector banks (new) are also required to Fulfil the overall priority sector target (40 per cent) and sub-targets as applicable to other domestic banlts. Their performance in this regard for 1996-97 vis-A- vis 1995-96 given in Appendix Table 11.13 revealed that they have achieved the overall target of 38.3 per cent (Rs.2,623 crore) as on the last Friday of March 1997 as against 27.8 per cent (Rs. 1,223 crore) a year earlier.
Priority Sector Advances by Foreign Bar tits
to k'79'1 crore and 41 '7 2.7 1 The aggregate priority sector advances per cent (target 40 per cent) of the NBC as On by foreign hnlts increased horn Rs,5,41 7 the last March 1997. as against 37'8 crore as on the last Friday of March 1996 (39 per cent as On the Idst March 1996 per cent of NBC) to Rs. 6,129 crore as on the (Appendix Table 11.1 1). Thus, their performance Friday of March , 997 (37, per cent of has exceeded the target 40 NBC). Advances to SSl units increased from cent 'Y 1 '7 Percentage Points during the Rs. 1,s 19 crore (1 1 per cent of NBC) as on period under review. Agricultural advances of the last Friday of March 996 to Rs, ,826
increased by Rs'4'661 crOre from crore (11 .I per cent of NBC) as o n the last Rs.26.351 crore as on the last Friday of March Friday of March 997. The export credit ,,,, 1 996 to Rs.3 1,012 crore a on the last Friday foreign banks was up horn Rs. 4,112 crore of March 1997, forming 16.4 Per cent of net (29.0 per cent of NBC) to ~ s . 4,474 crore bank credit (14.3 per cent last year). Credit (27.0 per cent of NBc) during the same period.
units increased from 29p*2 crore ( I6 in overall terms, priority sector advances of per cent NBC ) at end-March 1996 to foreign banks at 37.1 per ceni of NBC as o n Rc* ,542 crore ( * 6.6 per cent of NBC ) a at the last Friday of March 1997 also exceeded end March 1997. the prescribed minimum of 32.0 per cent.
Priority Sector Advances by lndian Private Sector Banks (Old)
lntegra ted Rural Development Programme (Imp)
2.69 The priority sector advances of all the lndian private sector bank (old) increased to 2.72 During the year 1996-97, banks
k. 6.074 crore as on the last Friday of March assisted 18.89 lakh beneficiaries under t h e
1097 forming 42.5 per cent of NBC from Rs. IRDP scheme (Table 11.17). Of these, 8.82 lakh
5.060 crore or 35.9 per cent of NBC as on belonged to SC/ST categories (46.7 per cent)
t h e last Friday of March 1996. Thus lndian and 6.35 lakh were women (33.6 per cent).
private sector banks (old) also exceeded the During t h e period upto March 1997, a total

Report on Trend and Progress of Banking In Indlii, 1996-97
amount of Rs. 1,952.72 crore and Rs. 1,130.23 crore were disbursed as loans and subsidies, respectively, under the programme.
Recovery ur?der lRDP
2.73 The recovery position under IRDP improved from 31.65 per cent for the year ended March 1996 to 34.20 per cent for the year ended March 1997.
2.74 Keeping In view the recommendations of the expert committee on IRDP (Chairman : Shri D.R Mehta) that the level of per family/ enterprise Investment under JRDP should be enlarged by providing larger credit as also a higher amount of subsidy, the Government of lndia have fixed a total credit target of Rs.2,700 crore in 1997-98 as compared with Rs.2,142.20 crore in 1996-97.
2.75 As regards the procedure t o be adopted under the system of back-end subsidy, the Reserve Bank directed the banks in September 1996 that the subsidy admissible to the borrowers under IRDP would be kept in the Subsidy Reserve Fund Account, borrower-wise, instead of the earlier practice of issuing term deposit receipt in the name of the borrowers. Further, banks will neither offer any interest on subsidy nor will they charge any interest on the subsidy portion of the composite loan amount. The balance in the credit of the Subsidy Reserve Fund Account ill not form part of DTL for purposes of SLR/
Year No. of Total Credit Beneficiaries (Rs. Crore)
(Lakhs)
CRR imposition. The Reserve Bank also directed the banks in September 1996 that Group ventures under IRDP are eligible for a subsidy of Rs. 1.25 lakh or 5 0 per cent of the project cost, whichever is less. The guidelines issued by Government of lndia for group loaning under IRDP have been circulated among banks. Model documents for t he purpose of granting group loans under IRDP were also furnished to the banks in February 1997.
Lead Bc?r?/< Scheme (LBS)
2.76 As on March 31, 1997, 517 districts have been covered under the Lead Bank Scheme (LBS) in the country. During the year 1996-97 (April-March), lead bank responsibility in respect of 5 new districts, which w e r e formed a s a result of reorganisation/bifurcation of some of the existing districts of Tamil Nadu, was assigned to public sector banks.
2.77 Table 11.18 presents an overall picture of Annual Credit Plan of all financial institutions (including SCBs, RRBs and Co-operative banks) under the LBS. The total outlay under the LBS a t Rs.41,404.93 crore for the year 1996-9'7 was higher by Rs. 10,396.30 crore than that in the previous year.
Prime Minister's Rozgar Yojna for Educated Unemployed (PMR Y).
2.78 The Prime Minister's Rozgar Yojna (PMRY) scheme launched in the year 1 993-94 with the aim of providing sustained self- employment in micro-enterprises t o rural and urban unemployed youth, resident in a particular area for more than three years, with family income not exceeding Rs.24,000 per annum, is to be continued during the year 1997-98. During t h e year 1996-97, t h e commercial banks sanctioned Rs. 1,547.98 crore to 2.62 lakh applicants and disbursed Rs. 1,026.57 crore to about 1.83 lakh bonowal accounts under the scheme (Table 11.19).

Developments in Commerdal Banking
66
Table 11.18 : Annual Credit Plan of Financial Institutions under Lead Bank Scheme
(Amounts In k.crore)
Sector 1995-96 1996-97
Target Achievement Percentage of Target Achievement
1 2 3 4 5
Agriculture 8, 19,650.42 19,050.86 96.95 25,442.48 Allied Activities SSI 6,065.66 6,817.36 1 12.39 7,713.13 Services 5,292.55 5,311.22 100.35 8,269.32
Total 3 1,008.63 31 ,I 79.44 100.55 41.404.93
a1 Assistance under PMRY
(Amounts in Rs, crore)
Year
Sanction Disbursements
Target No. of borrowal Amount No. of borrowal Amount accounts , accounts
9 e Prudential and h p i t a l Adequacy remaining maturity of one year should not be Measures included as a part of the Tier I1 Capital. The
instruments are to be subjected to progressive Capital Adequacy Measures discount as they approached maturity. Since
banks were following different standards, the 2'79 The =Overnrnent India infused Reserve Bank issued guidelines in November additional capital equivalent to Rs. 1,509 crore 996 for indicating the rate of discount in six 'SBs during the Year 1996-97 as 'gainst according to maturity pattern of less than 5 R5.850 crore in 1995-96 (in seven banks) with years which form part of ner Capital. a view to strengthening their capital base for Besides, the Rese,.,,e Bank appointed a ach'eving per cent to risk weighted Officerv in December 1996 to darify doubts assets ratio (CRAR). o n interpretation of t h e prudential norms for
P T L I ~ C I I tic2/ ACCOUI~ ting Standards income recognition, asset classification, provisioning and capital adequacy so as to
2.80 Subordinated debt instruments with an maintain uniforrni ty i n the accounting initial maturity of less than Rve years or with a standards adopted by banks.

Report on Tend and Progress of Banking in India, 1996-97
2.81 The Reserve Bank Audit Committee reviewed the existing guidelines on prudential accounting norms of commercial banks to bring about more clarity and uniformity and accordingly banks were advised to adhere to the following guidelines:
(a) Regarding consortium advances banks were advised to classify the borrowal accounts according to each bank's own record of recovery, as against the earlier guidelines that if any member bank of the consortium considers an advance as NPA, all other member banks of consortium should treat the advance as NPA.
(b) In respect of accounts where there are potential threats of recovery owing to erosion in the value of the security or of absence of security or other factors such as frauds, it was prescribed that such accounts be classified as doubtful or loss assets, irrespective of the period For which such accounts have remained NPA.
(c) Prudential norms for agricultural advances were made stringent. Accordingly, interest instalment in arrears for more than two quarters was treated as NPAs as against two seasons of harvest or two half years earlier. The implementation of the guidelines was deferred to the year 1 997-98.
2.82 In April 1997, banks were advised to take excess provision for depreciation on investments held by them to Profit and Loss Account under the head 'Expenditure - Provision and Contingencies' as a credit item and thereafter transfer the sum of Capital Reserve Account by way of appropriation under the head 'Appropriation' in Profit and Loss Account while finalising the Balance Sheet as at March 3 1, 1997. However, the amount to be transferred to Capital Reserve Account shall be determined net of taxes, if any, and net of transfer to statutory reserve as applicable to such excess provision.
Subsequently as per the revised guideline issued in june 1997, the excess provision towards depreciation on investments is to be taken to the Profit and Loss Account under the head 'Expenditure - Provisions and Contingencies' as a credit item and then net profit has to be computed. The excess provision should be transferred to Capital Reserve Account by way of appropriation under the head 'Appropriations' in the Profit and Loss Account.
2.83 Regarding small account advances, i.e. advances with balances of less than Rs.25,000, it was advised in March 1996 to classiiy them into four usual categories viz., standard, su b-standard, doubtful and loss assets and make appropriate provisioning from the accounting year 1996-97. However, banks, which were not able to complete this classification, were given one year extension, i.e. up to March 3 1, 1998 and for the year 1996-97 the provisioning requirement for small advances was raised to 15 per cent of the aggregate outstanding amount.
Booicing of income on Investments in Shares and Bor~ds
2.84 The Reserve Bank advised banks on January 29, 1997 that income from dividend on shares of corporate bodies and units of mutual funds should be booked on cash basis while that from Government securities and bonds and debentures of corporate bodies where interest rates are pre-determined, could be booked on accrual basis, provided interest is serviced regularly. Income from securities of corporate bodies/public sector undertakings of which the payment of interest and repayment of principal have been guaranteed by the Central/State Governments may be booked on accrual basis. Lastly, income from dividend on shares of corporate bodies may be booked on accrual basis provided it has been declared by the corporate body in its Annual General Meeting and the owners' right to receive payment is established.

Developments In Commercial hnk lng
Classification of lnves tmen ts under 'Permanent ' and 'Current' Category
2.85 With a view to moving towards the international practice of marking all investments to market, the 'mark to market' proportion of the approved securities was enhanced to 50 per cent for the accounting year 1996-97 and turns to 60 per cent for 1997-98.
Equity Capital and Subordinated Debt raised by Banks
2.86 All the new private sector banks were advised to 'mark-to-market' their entire portfolio of approved securities under the 'current category' from t h e accounting year 1996-97 onwards. The following nationalised banks which satisfied eligibility norms prescribed by SEBI for public issue of shares were permitted by Government of lndia under Section 3(2B)(C) of the Banking Companies (Acquisition and Transfer of Undertakings) Act, 1970/80 to make public issue of their shares. The amount of equity capital raised was as follows (Table 11.20).
2.87 Besides raising equity capital, the following four public sector banks were permitted to raise subordinated debt through private placement for inclusion under Tier 11 capital for capital adequacy purposes (Table 11. 21).
Sr. Name Size of Public Issue No of theBank Equity Premium Total
1 2 3 4 5
1. Dena Bank 60 1 20 180 2. Bank of Baroda 100 750 850 3, Bank of India 150 525 67 5
Table 11.21 : Subordinated Debt raised by PSBs
Sr. Name of the Amount Amount No. Bank permitted raised
1. Punjab 1 90 1 89.98 National Bank
2. State Bank of 70 75.00 Mysore
3. State Bank of 25 N. A. Travancore
4. State Bank of 40 N.A. Bikaner B Jaipur
Total 325 N. A.
N.A. - Not Available.
Moratorium, Liquida tion and Amalgama tion
2.88 The number of banks under liquidation as on June 30, 1997 was 88. The matter regarding completion of liquidation proceedings is being pursued with the concerned officials/ court liquidators. The two private sector small/weal< banks viz., the Punjab Co-operative Bank Ltd. and the Bari Doab Bank Ltd. were placed under moratorium by an order of the Government of lndia effective from the close of business on September 30, 1996 for a period of three months initially i.e. upto December 3 1, 1996 and subsequently t h e period of moratorium was extended by another three months i.e. upto March 31, 1997. Schemes for their amalgamation with the Oriental Bank of Commerce were drawn up. The banks had filed petitions in t h e court challenging the moratorium imposed on them and the Supreme Court extended the period of moratorium upto April 7, 1997. Effective April 8, 1997 the Punjab Co-operative Bank Ltd., and the Bari Doab Bank Ltd. were amalgamated with the Oriental Bank of Commerce Ltd. with t h e stipulation that
Report o n Trend and Progress of Banking In Indla, 1996-97
payment to creditors and depositors would be from May 8, 1997.
Forelgn Banks In lndicl
2.89 During 1996-97 (july-june), five more new foreign banks opened their maiden branches in Indla. They were Krung Thai Bank public Company Limited, Oversea-Chinese Banking Corporation Ltd., The Commercial Bank of Korea Ltd., Hanil Banlc and sumitom0 Bank. Besides, four foreign banks operating in India, v k Abu Dhabi Commercial Bank Ltd., The Bank of Tokyo-Mitsubishi Ltd., Banqua Nationale d e Paris and The Sakura Banlc Ltd. opened an additional branch each- in Bangalore, Chennai, Ahmedabad and New Delhi, respectively, and Deutsche Bank opened an additional branch each in Calcutta and Chandigarh, while ABN Amro Banlc closed its Zaveri Bazar branch in Mumbai in july 1996. Thus, the number of foreign banks operating in India increased to 4 1 and that of branches to 180 at the end of june 1997 as compared with 36 and 166 respectively, at the end of June 1996 During the year , five foreign banks, viz. Nations Bank, First Union National Bank of North Carolina, Swiss Bank Corporation, Inlcombank and Compagnie Financiere d e Union Europeenne opened their respective representative offices in India. Besides, Chemical Bank (former Manufacturers Hanover "rust Co.) closed its representative office in . Aumbai on account of merger with Chase Manhattan Bank N.A. during the year. The Salcura Bank Ltd.'s representative office in New Delhi was closed after upgradation on November 22, 1996. Effectively, the total number of representative offices increased to 2 8 a t the end of june 1997 h-om 27 at the end of June 1996. During the year ended NIarch 1997, 8 foreign banlcs opened their maiden branches (Table 11.22).
10. Technological Issues
2.90 The banking sector, in general, is in the process of adopt ing state-of-the-art
systems of information technology applications. The MICR cheque processing centres, already in existence a t the four metros, have been extended to nine new centres. Measures have been initiated by the Reserve Bank to set up a Very Small Aperture Terminal (VSAT) Network to provide reliable communication to the financial sector as a whole. In addition, the telecommuniations network is sought to be strengthened through the extensive use of the RBINet/BANKNET. All public sector banks, foreign and private sector banks are connected to the network. To provide extended banking hours to the customers, many banlcs are going in for Shared Payment Network System (SPNS), installation of Automated Teller Machines (ATMs) and Cash Dispensers. As of end-June 1997, 1 3 banis have participated with a total of 38 ATMs. These apart, many banks are providing services like tele-banking and internet banlung services and have become members of the Society For World - wide Inter bank Financial Telecommunications (SWIFT). Such reliance on SWIFT is essential if banks dealing in foreign exchange are to access international markets in a cost-effective manner.
2.91 In addition to the five existing MICR- cheque processing centres at the four metros, viz., Mumbai (Z), New Delhi, Calcutta and Chennai, the process of extension of MICR Clearing to nine new centres has been initiated at Ahmedabad (Bank of Baroda), Amritsar (Oriental Bank of Commerce), Bangalore (Canara Bank), Baroda (State Bank of India), Hyderabad (Bank of India), jaipur, Kanpur and Nagpur (Punjab National Bank), and Pune (Union Bank of India). In t e rms of t h e recommendations of the Committee on Technology Issues Relating t o Payments System and Cheque Clearing in t h e Banking Industry (Chairman : Shri W.S. SaraF), Electronic Clearing Service (ECS) (Credit Clearing) is operationaiised at all the four metropolitan
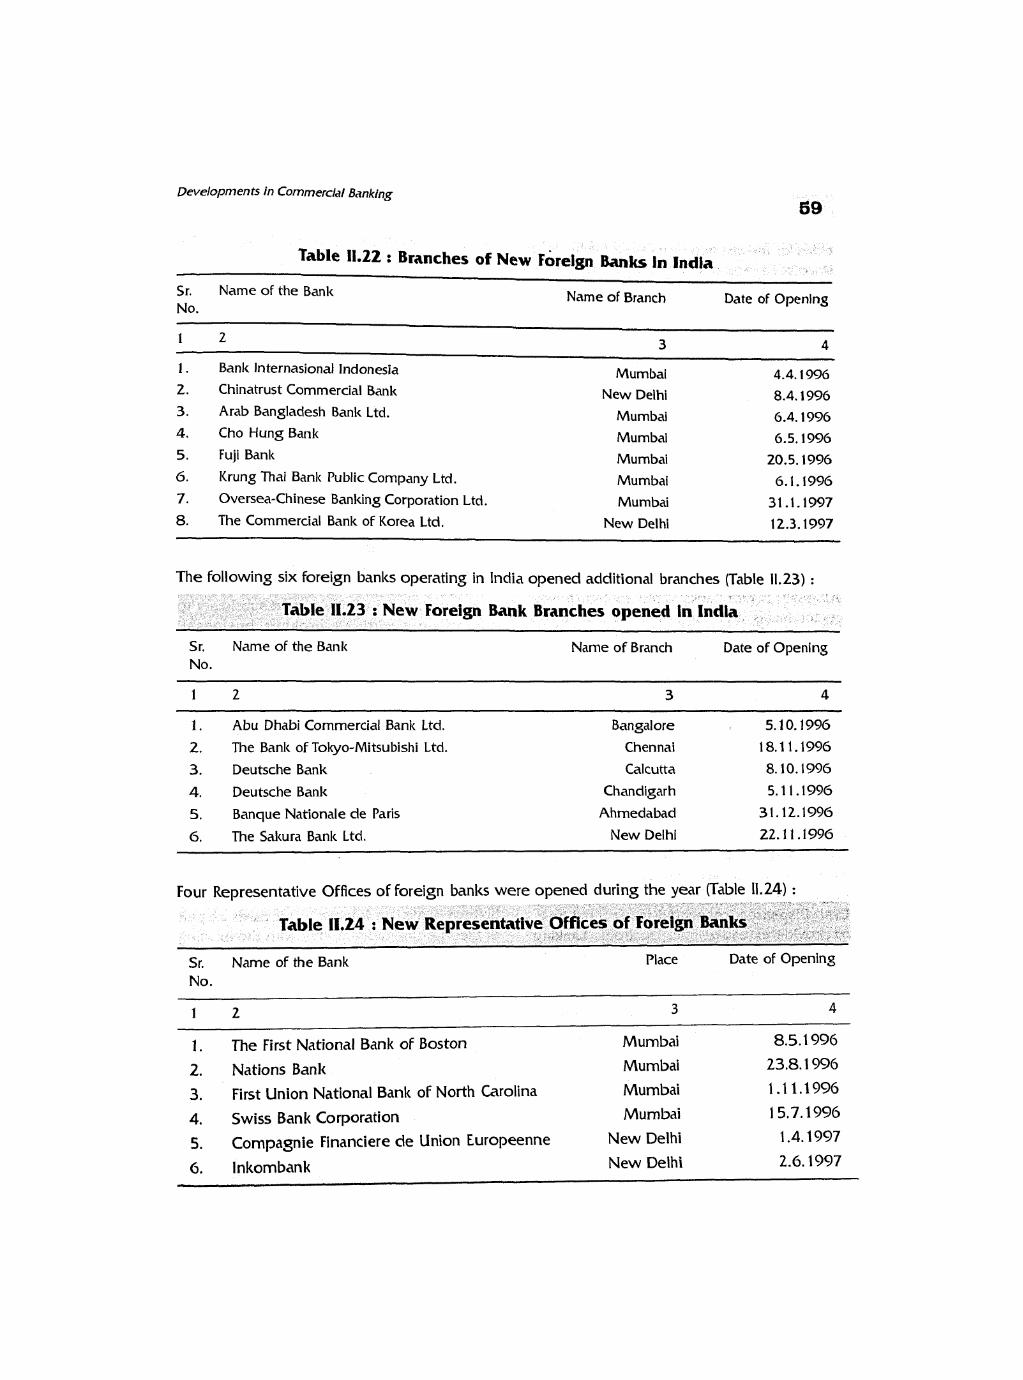
Develo~ments in Commercial Banking
69
Table 11.22 : Branches of New lior
Sr. Name of the Bank Name of Branch Date of Openlng No.
1 2 3 4
1. Bank lnternasional Indonesia Mumbai 4.4. I996
2. Chinatrust Commercial Bank
3. Arab Bangladesh Bank Ltd.
4. Cho Hung Bank
5. Fuji Bank
6. I h n g Thai Bank Public Company Ltd.
7. Oversea-Chinese Banking Corporation Ltd.
New Delhi 8.4.1996
Mumbai 6.4.1996
Mumbai 6.5.1996
Mumbai 20.5.1996
Mumbai 6.1.1996
Mumbai 31.1.1997 8. The Commercial Bank of Korea Ltd. New Delhi 12.3.1997
The following six foreign banks operating in India opened additional branches (Table 11.23) :
Table 11.23 : New Foreign Bank Branches opened in lndla
Sr. Name of the Bank No.
Name of Branch Date of Opening
1 . Abu Dhabi Commercial Bank Ltd.
2. The Bank of Tokyo-Mitsubishi Ltd.
3. Deutsche Bank
4. Deutsche Bank
5. Banque Nationale d e Paris
6. The Saltura Bank Ltd.
Bangalore
Chennai
Calcutta
Chandigarh
Ahmedabad
New Delhi
Four Renresentative Offices of foreign banks were opened during the year (Table 11.24) : - -
Table 11.24 : New Representative Offices of Foreign Banks
Sr. Name of the Bank Place Date of Opening No.
1 2 3 4
1. The First National Bank of Boston Mumbai 8.5.1 996
2. Nations Bank Murnbai 23.8.1 996
3. First Union National Bank of North Carolina Murnbai 1.1 1.1996
4. Swiss Bank Corporation Mumbai 15.7.1996
5. Compagnie Financiere de Union Europeenne New Delhi 1.4.1997
6. Inkombank New Delhi 2.6.1997

Report on Trend and Progress of Banking in India, 1996-97
cltles for the last two years successfully. It has since been extended to four non-MICR centres vjz., Ahmedabad, Bangalore, Hyderabad and Pune as well. In addition, ECS (debit clearing) is in operation In Mumbai and Chennai for coilection of telephone bills. Now, payment of electricity bills to the utility companies in MumbaI is also being brought under the purview of ECS (RAPID) in Mumbai.
Teleco~nrnunic~~ ti017 Network
2.92 At present nineteen offices of the Reserve Bank viz. Mumbai, Delhi, Chennai, Calcutta, Hyderabad, Bangalore, Nagpur, Jammu, Chandigarh, jaipur, Lucknow, Patna, Bhubaneshwar, Guwahati, Bhopal, Ahmedabad, Pune, Thiruvananthapuram and Kochi are connected to the BANKNET/RBINet. All public sector banks, a few foreignlprivate sector banks and some financial institutions are also connected t o the network. The commercial banks under Mumbai regional office have already started reporting the Section ,42(2) data through RBINet. Other Regional Offices of the Reserve Bank are also expected to start transmitting Section 42(2) data shortly.
Shared Payn~en t Network System (5 PNS)
2.93 As a follow up of the recommendations of Rangarajan Committee (1989), the Indian Banks Association (IBA) has sponsored the Shared Payment Network System (SPNS), a large network of ATMs, PoS terminals and Cash Dispensers connected to a central host, to provide extended-hour Electronic Banking Service to the customers in Mumbai. The participating banks in this network issue cards to their customers for transacting on the network. The SPNS will provide the services like deposit/withdmwal of cash, balance enquiry, printing of statement of account, request for cheque book, standing instructions, PoS facilities, etc. The SPNS has been operationalised fiom February 1 , 1997 with participation From 6 banks. As of end-june 1997, 13 banks have participated with a total of 38 ATMs.
1 1, Diversification in Banking
Stock-lnvest Scheme
2.94 Following the detection of serious irregularities in the stock invest scheme, on review and in consultation with the SEBI, a ceiling of Rs.50,000 per individual per capital issue has been prescribed for issue of stock-invests by banks. However, this limit is not applicable to mutual funds.
2.95 The Bank of Baroda and the Punjab National Bank were granted final approval for setting up, respectively, in the money market a BOB Capital Markets Ltd. ( a wholly-owned subsidiary to undertake merchant banking, leasing and hire purchase business) and PNB securities Ltd. ( a wholly-owned subsidiary to undertake securities broking business), respectively.
Scheme for Money Marltet Mutual Funds
2.96 Five banks v k , the ABN Amro Bank, ANZ Grindlays Bank, Canara Bank, Deutsche Bank and the Bank of Madura Ltd. were given approval during the year for setting up money market mutual fund (MMMF).
Credit Card
2.97 With the Dena Bank launching its own credit card business, the number of banks having launched credit cards rose to 12. Sixteen banks are issuing credit cards as part of their tie-up arrangements with the existing banks in the business.
12. Other Issues
Banlting Ombudsmen
2.98 The Banking Ombudsman scheme announced in June 1995 seeks to establish a system of expeditious and lnexpensive resolution of customer complaints in a time- bound and cost-ef fectlve manner. Since the scheme was operationalised in 1995, the Reserve Bank has appointed Ombudsmen at

Developments in Commercial Banking 61
15 centres viz. Ahmedabad, Bangalore, Bhopal, Bhubaneshwar, Calcutta, Chandigarh, ~hennai , Delhi, Guwahati , Hyderabad, jai pur, Kanpur, Mumbai, Patna and ~hiruvananthapuram covering 26 States and 6 Union Territories. As at the end of March 1997, the offices of Banking Ombudsmen received 5,262 complaints o u t of which 2,360 were found to be not maintainable and the number of complaints disposed of stood at 2,253.
Housing Finance by Commercial Banks
2.99 The limit for providing finance by commercial banks for housing under priority sector, has been revised as follows : as direct finance, loans may be given upto Rs. 3 lakh for construction of a new house and upto Rs. 50,000 for repairs to damaged houses for individuals. As indirect finance, assistance may be given to any government agency for construction of houses or for slum clearance and rehabilitation of slum dwellers subject to a ceiling of Rs. 3 lakh per housing unit and to a non-governmental agency approved by the National Housing Bank (NHB) for the purpose of refinance for construction of houses or for slum clearance and rehabilitation of slum dwellers subject to a ceiling of loan component of Rs.3 lakh per housing unit.
Frauds and Robberies
2.100 During the year 1996-97 (July-June), commercial banks reported 2,481 cases of fi-auds involving an amount of Rs.4-49.9 crore. In addition, 14 cases of frauds involving an amount of Rs.29.7 crore were reported in the overseas branches. These cases were followed
up with the banks for necessary remedial measures and fixing staff accountability. The public sector banks took steps towards implementation of most of the recommendations of the committee on fiauds and malpractices (Chairman : A. Ghosh). In a bid to pre-empt the possibility of potential frauds/malpractices, during the year 1996-97 (July-June), 28 cautionary advices were issued by the Resetve Bank to commercial banks/ financial institutions (except Regional Rural Banks) in respect of firms/companies committing serious irregularities in their borrowal accounts. During the above period, public sector banks reported 104 cases of robberies/dacoities involving Rs. 3.75 crore.
2.101 The Reserve Bank set up an 'Advisory Board on Bank Frauds' on February 17, 1 997, under the chairmanship of Shri S.S. Tarapore, former Deputy Governor of the Reserve Bank to advise it on cases referred by the Central Bureau of Investigation (CBI) either directly or through the Ministry of Finance of the Government of India for investigation / and registration of cases against bank offlcers of the rank of General Manager and above. The Board started functioning with effect from March 1, 1997.
Relaxations to Trade and Industry in the State ofjammu and Kashmir
2.102 On account of disturbed conditions prevailing in the State of Jammu and Kashmir, trade and industry in the State have been provided concessions announced by the Reserve Bank from time to time since 1990. The latest extension was granted upto March 31, 1998.

CHAPTER IJI
DEVELOPMENTS IN CO-OPERATIVE BANKING
Overview
The performance of co-operative banking Institutions has shown an overall improvement. Most of the co-operative banking institutions recorded higher growth in deposits and deceleration in credit offtalte. Overdues as a per cent of demand of all co- operative credit institutions showed improvements - either remained more or less stagnant or declined.
3.2. The resource position of the main refinancing agency, viz., the National Bank for Agriculture and Rural Development (NABARD) was enhanced substantially through (a) the deposits under the Rural Infrastructure Development Fund (RIDF) placed by commercial banks, (b) an enhancement of its capital base, (c) issue of tax-free bonds, and (d) acceptance of priority sector deposits from private banks.
2. Progress of Credit Co-operatives
cent of aggregate deposits and 53.5 per cent of total credit of all PCBs (Table 111.1). Nearly 75 per cent of PCBs were located in four States: Gujarat, Karnataka, Maharashtra and Tamil Nadu accounting for 85 per cent of deposits and advances of all PCBs. The deposits of PCBs constitute on an average about 5 per cent of the aggregate deposits of scheduled commercial banks in India during the 1990s.
Policy Changes
3.4 PCBs are subjected to lower statutory pre-emptions (CRR as well as SLR') vis-a-vis scheduled commercial banks. Most of the financial sector reforms implemented in the scheduled commercial banlting segment, were applicable to PCBs as well. PCBs were barred from financing NBFCs other than hire purchase and equipment/leasing companies. However, scheduled PCBs are permitted (effective April 8, 1996) to undertalte the business of hire purchase and equipment leasing as in the case
A, Primary Co-opera five Banks (PCBs) of scheduled commercial banks, and non- scheduled PCBs are also allowed this business
3.3 The Primary (Urban) Co-operative Banks with prior permission of the Reserve Bank. (PCBs) cater primarily to the needs of lower Effective April 26, 1997, the liabilities of and middle income strata of the society. As scheduled PCBs to the banking system have a t the end of March 1997, there were 1,653 been exempted from maintenance of CRR of PCBs including 91 salary earners' banks, and 6 per cent subject to the statutow minimum. - 8 5 mahila banks with a network of 4,964 branches. Out of the 1,653 PCBs, only 1.5 Interest Rate Deregulation
per cent (24) were scheduled PCBs and the 3.5 Since the implementation of financial remaining 98.5 per cent (1,629) were non- sector reforms in 1992-93, interest rates on scheduled PCBs. PCBs, with deposit base of deposits of PCBs were deregulated as in the Rs.50 crore and above, constitute 56.7 per case of scheduled commercial banks.
For PCBs, t he CRR stipulation is 3 per cent of net demand and time Ilabllities (NDTL) while for scheduled PCBs, the ClUT requirement is 6 per cent. For all PCBs, the SLR requirement is 25 per cent of NDTL.

Developments in Co-operative knklng
Table 111.1 : Primary Urban Co-operative Banks - Structure (As at the end of March 1997)
(Amounts In Rs. uore) Sr. ltem PCBs % to PCBs with % to Scheduled % to Total N o . with total deposits total PCBs total f o r all
deposits (3/9) exceeding (5/9) with (7/9) PCBs between Rs. 100 denosits b.50
crore and k. 100
crore
crore of &,100 crore and
above
1. Reporting banks (Nos.) G5 27 22 1,353 2. Owned Funds 580 12.8 489 10.8 1,218 26.8 4,541 3. Deposits 4,275 14.6 3,483 11.9 8,865 30.2 28,313 4. Borrowings 49 7.9 99 16.0 40 6.5 6 18 5. Loans outstanding 2,958 14.4 2,498 12.1 5,563 27.0 20,G 13
Memorandum ltem : Credi t-Deposit Ratio 69.2 71.7 62.8 70.3
Deposit Rates deposits were revised from time to time.2
3.6 With effect from July 2, 1996, interest PCBs were directed to desist from launching
rates o n domestic term deposits with PCBs prize-oriented deposit schemes and paying
for maturity of over one year were freed and brokerage in t h e form of commission/gift/
the minimum period of such deposits was incentives on deposits in any manner. Effective
reduced from 46 days to 30 days. Further, October 22, 1997, the interest rates on
interest rates o n domestic term deposits for domestic term deposits for 30 days and above
30 days and upto one year was fixed at 'not have been totally deregulated.
exceeding 1 1 per cent per annum'. The rate was further lowered to 'not exceeding 10 per cent' effective October 21, 1996. With the anchoring of the Bank Rate as the reference rate, t h e domestic term deposit rate for 30 days and up to one year was fixed at 'not exceeding the Bank Rate minus two percentage points' i.e. 9 per cent with effect from April 16, 1997 and to 'not exceeding the Bank Rate minus two percentage points' i.e., 8 per cent with effect from June 25, 1997. PCBs' NRE term deposits rates of over one year were freed from April 16, 1997. Subsequently, effective September 1 3, 1997, all NRE interest rates were freed subject to the stipulation that the minimum maturity period would continue to be not less than 6 months. PCBs interest rates on FCNR(B)
Please refer to the Annexure for details in changes
Lending Rates
3.7. Effective July 21 , 1995, PCBs' lending rates for all categories of loans were freed, subject to a minimum rate of 13 per cent in contrast to scheduled commercial banks which still continue to have a two tier administered rates of interest for loans upto Rs.25,000 and Rs.25,000 to Rs.2 lalh. PCBs' interest rate o n post-shipment export credit on medium and long-term basis i.e., for period beyond 180 days, was also freed from July 5, 1996. However, effective April 15, 1 997, the interest rate on post-shipment rupee export credit upto 90 days was changed from '1 3 per cent per annum' to 'not exceeding 13 per cent per annum' in order to give general operational freedom to banks and also the

Report on Trend and Progress of Banking In India, 19%-97
fact that some banks were willing to extend such credit at lower Interest cost if export proceeds were reajised in shorter perlods. For post-shipment rupee export credit for the perlod beyond 90 days and upto six months, PCBs were allowed to charge interest at 15 per cent p e r annum only for the period beyond 90 days and not from the date of advance. Subsequently, effective June 26, 1997, interest rate on post-shipment rupee export credit on demand bills for transit period and on usance bills for total perlod upto 90 days was reduced to 'not exceedlng 12 per cent per annum'
annum'. Besides, the interest rate of 13 per cent on usance bills for period beyond 90 days was to be applicable from the date of advance. Effective October 22, 1 997, interest rates on pre-shipment rupee export credit upto 180 days was reduced from ' 13.0 per cent per annum' to ' 12.0 per cent per annum' and on such credit beyond 180 days and upto 270 days, from '15.0 per cent per annum' to ' 14.0 per cent per annum.' Moreover, on a review, it was decided that for post-shipment rupee export credit for period beyond 90 days and upto six months, interest rate of '13.0
and that on usance bills beyond 90 days and per cent per annum' would apply only for the upto six months from the date of shipment period beyond 90 days and not from the date was reduced to '14.0 per cent per annum.' of advance effective October 22, 1997. Further, effective September 13, 1997, interest rates on post-shipment rupee export credit Aggregate Deposits and Advances
were revised. Accordingly, interest rate on post-shipment rupee credit on demand bills for transit period and on usance bills for total perlod upto 90 days was changed to 'not exceeding 1 1 per cent per annum' and that on usance bllls for total period beyond 90 days and upto six months fiom the date of shipment was reduced to '13 per cent per
3.8 During 1-97, the aggregate deposits of PCBs recorded an increase of 21.3 per cent as compared with an increase of 20.2 per cent in the preceding year (Table 111.2 and Chart 111.1 ). Loans outstanding at Rs.20,613 crore at end-March 1997 were higher by 1 5.1 per cent over Rs. 1 7,908 crore at end-March 1996 (21.1 per cent over the level of the previous year).
Table 111.2 : Primary (Urban) Co-operathe Banks
(Amounts in Rs.crore)
S r. l tern As on March 3 1 Variations during No, Financial Year
1994 1995 1996 1997(P) 1994-95 1995-96 1 996-97
1. Total Number of PCBs 1,400 1,431 1,501 1,653
2. Number of Licensed PCBs 1,045 1,107 1,180 1,393
3. Owned Funds 2,723 3,312 3,848 4,541 589 536 693 (21.6) (16.2) (18.0)
4. Deposits 16,769 20,101 24,165 29,313 3,332 4.- 5,148 (19.9) (20.2) (21.3)
5. Borrowings 496 577 758 618 81 181 -140 (16.3) (31.4) (-1 8.5)
6. Loans Outstanding 12,172 14,795 17,908 20,613 2,623 3.1 13 2.705
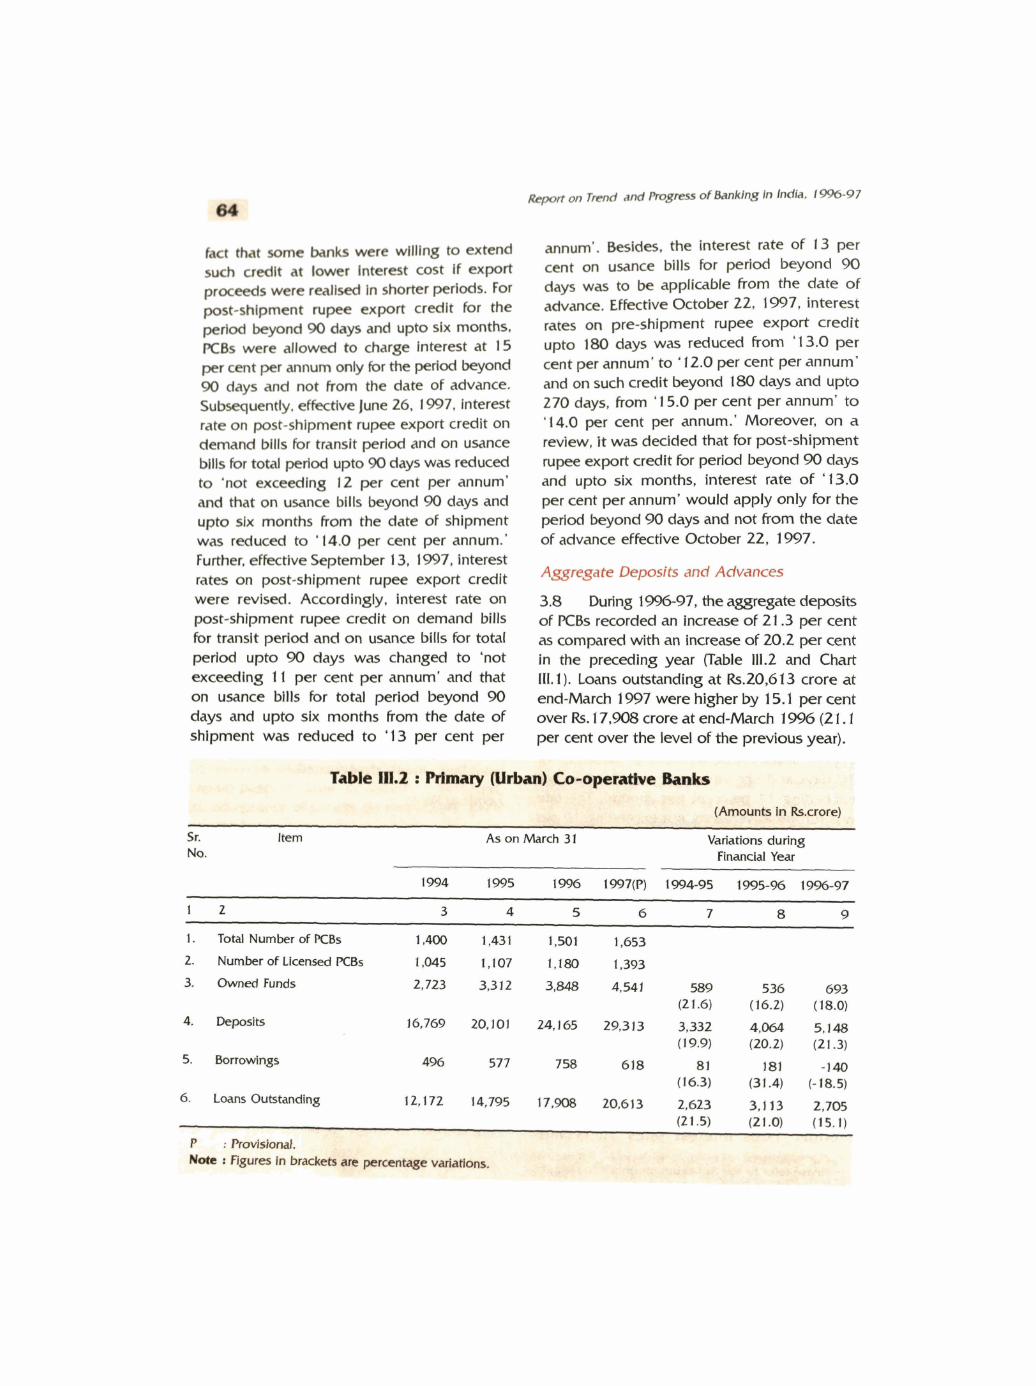
~ ~ c p o r t on T d and R q g r r ~ ~ dBanklng In Indla. 1-97
ad that some banks were wllllng to extend such c d l t at lower intcrc?rt cost If export proceeds were realbcd In shorter p e d d . For post-shipment rupee export credit for the puled kyond 90 days aml upto six months. PCBa were allowed to charge interest at 15 per cent per annum only k r the period beyond 90 days and not from the date of advance. Subsequentty, efkdlve June 26, 1997, interest rate on post-shipment rupee wport credit on demand bills for transit perlod and on usance Mlls for total perlod upto 90 days was reduced to 'not exceeding 12 per cent p e r annum' and that on usance Mlls beyond 90 days and upto slx months from the date of shipment was r e d u d to ' 14.0 per cent per annum.' Further, effccthre Sepkmber 1 3, 1997, interest rates on post-shipment rupee export credit were revised. Accordingly, Interest rate on post-shipment rupee credit on demand bills for transit perlod and on usance bills b r total petfoci upto 90 days was changed to 'not exceeding 11 per cent per annum' and that on usance bills for total perlod beyond 90 days and upto six months from the date of shipment was reduced to '13 p e r cent p e r
annm'. Besides, the Interest rate of 13 per cent on usance bills for period beyond 90 days was to be applicable from the date of actvancc, Efkctive October 22, 1997, interest rates on pre-shipment rupee export credit upto 180 days was reduced fi-om '13.0 per cent per annum' to '1 2.0 per cent per annum' and on such credit beyond 180 days and upto 270 days, from '1 5.0 per cent per annum' to '14.0 per cent per annum.' Moreover, on a revlew, I t was decided that for post-shipment rupee export credit for period beyond 90 days and upto six months, interest rate of '13.0 p e r cent per annum' would apply only for the period beyond 90 days and not from the date of advance effective October 22, 1 997.
A g p g a t e Deposits and Advances
3.8 During 1-97, the aggregate deposits of PCBs recorded an increase of 21.3 per cent as compared with an increase of 20.2 per cent in the preceding year (Table 111.2 and Chart Ill. 1). Loans outstanding at Rs.20,613 crore at end-March 1 997 were higher by 15.1 per cent over Rs. 1 7,908 crore at end-March 1996 (21.1 per cent over the level of the previous year).
Sr. Item As on March 31 Variations during No. Financial Year
1994 1995 1996 1997(P) 3-4-95 1995-% 1994-97
1 2 3 4 5 6 7 8 9
1. Total Number of PCBs 1,400 1,431 1,501 1,653
2. Number of Licensed PCBs
3. Owned Funds
4. Deposits
5. Borrowings
6. Loans Outstanding
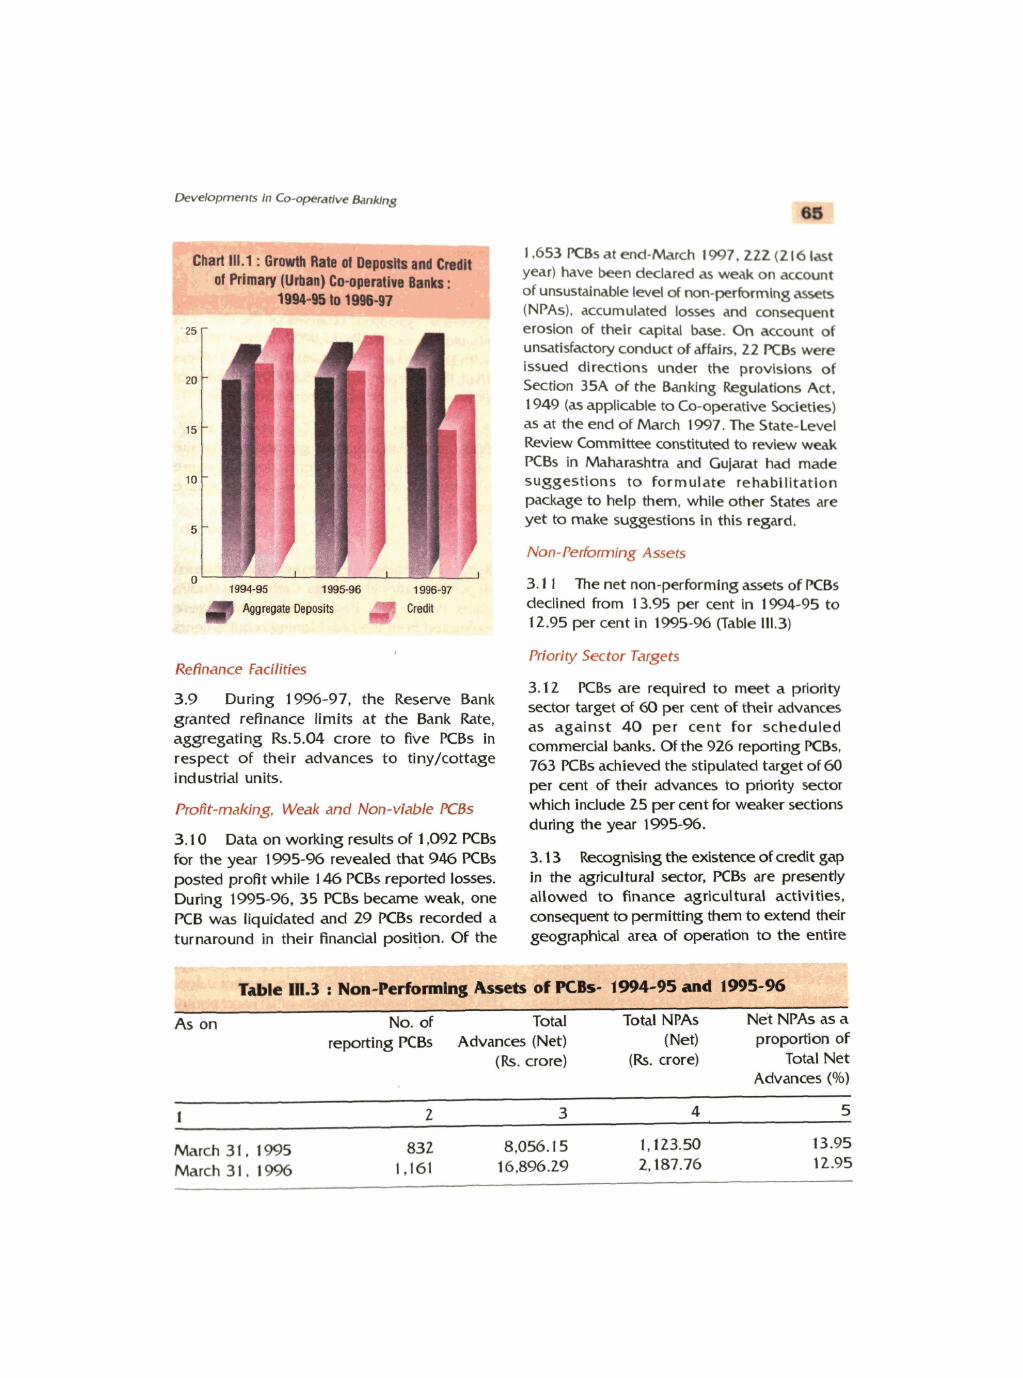
chart 111 9 - Gfawfb Rate (d D e p & s md Cndlt of ty (Wan) Co-operawe :
tBwata~=cS7 -
1,653 PCBs at end-Mach 1997.22Z (216 W year) have been dcdared as weak on account of unsustalnable kvd of rum-pafbrm\ng assets (NPAs), accumulated losses and consequent erosion of their capital base. On acaunt of unsatisfactory conduct of mrs, 22 PCBs were issued directions under the provisions of Section 35A of the Banking Rtgulatlons Act, 1949 (as applicable to Co-operathe Sodeties)
I as at the end of March 1997. The State-Level Review Committee constiMed to revkw weak PCBs in Maharashtra and Gujarat had made suggestions to formulate rehabllltatlon package to help them, while other States are yet to make suggestions in this regard.
Non- Pefirmlng Assets
3.1 1 The net non-performing assets of PCBs declined fiom 1 3.95 per cent In 1-4-95 to
----- 12.95 per cent in 1995-96 (Table 111.3)
Morfty Sector Targets
3.1 2 PCBs are required to meet a priority 39 During 996-979 the Reserve Bank sector target of 60 per cent of their advances granted refinance limits at t h e Bank Rate, as against 40 per cent for scheduled aggregating Rs.5.04 crore to KBs in commercial banks. Of the 926 KBs, respect their advances tin~/cottage 763 PCBs achieved the stipulated target of 60 industrial units. per cent of their advances to priority sector
Mt-making, WWe and Non-viable PlCBs which include 25 per cent for weaker sections during the year 1-5-93.
3.1 0 Data on working results of 1,092 PCBs for the year 1995-% revealed that 946 PCBs 3.13 h p i s i n g the existence of credit gap posted profit while 146 PCBs reported losses. in the agricultural sector, PCBs are presently During 1995-96, 35 PCBs became weak, one allowed to finance agricultural activities, PCB was liquidated and 29 PCBs recorded a consequent to permitting them to extend their turnaround in their financial position. OF the geographical area of operation to the entire
No. o r Total Net NPAs as a reporting PCBs Advances (Net) (Net) proportion of
(Rs. crore) (Rs. crore) Total Net Advances (96)
March 3 1 , 1 995 832 8,056.1 5 1,123.50 13.95 March 3 1 , 1996 1,161 16,896.29 2,187.76 12.95

~cpolt on fm Progrns OiBanktng In India. 1996-97
dCrtrkt of W r e a t l o n , including rural WeiM.
- 3.14 The Reserve Bank has Initiated a series of policy reforms in the last five years pertalnlng to regulatory areas and these are discussed below :
institutions. The PCBs a u l d also subscribe to units of Unit Trust of India.
3.18 Unsecured advances to a single party/ connected group or relatives of the directors should not exceed k.25,000/- In case of PCBs with Demand and Time Liabilities (DTL) of less than k . 1 0 crore, and k.50,000/- in case of PCBs wlth DTL of Rs. 10 crore and above.
- - U
3.19 Further, effective February 4, 1997. 3.15 Consequent on llberalising t h e PCBs' loans and advances granted against the -"Om' and per the Marathe Commlme security of banks' own term deposits were recommendations, the licensing pollcy of new PCBs was Ilberaliscd, setting nslde the earlier
excluded from the purview of 'exposure
pollcy of 'one district one bank'. The criteria ceiling'.
for Issue of licences to PCBs was based on the need for the institution, the potential in the proposed centre for moblllslng deposits and For purveying credit, and ultimately the ability to attain viability standards within a reasonable period of time. As a result, during the period between May 1993 and March 1997, over 41 2 proposals were cleared b r setting up of new PCBs. Similarly, the norms For issue of licences to the existing PCBs have been Iiberallsed. Under the new branch licensing policy for PCBs, over 2,070 licences were Issued for opening of new branches. The Reserve Bnnk has permitted PCBs to extend their areas of operation to the entire district inclusive of rural areas in which they are registered. Well managed PCBs with strong deposit base could, with prior permission, operate from other States also. - a
m i m u m Limit em Sirglc Party &-r%rs
3.16 Effective November 1 , 1996, the ceiling on advances t o a single party against the security of shareqdebentures of joint stock companies was revised upwards from Rs.5 lakh to Rs. 10 lakh, and PCBs were prohibited from sanctioning advances against fixed deposit receipts or other term deposits of other banks.
New A reas of Investment
3.17 Effective April 24, 1994, the Reserve Bank has permitted PCBs to invest in public sector bonds and equity of all India financial
3.20 PCBs advances secured against term deposits, National Savings Certificates, lndira Vikas Pa t ra and Klsan Vikas Patras were exempted from the provisioning requirements for bird and doubtful debts. Further, PCBs were permitted to take into account the amount of interest on the above types of advances on accrual basis, provided adequate margin was available in the accounts. PCBs were advised to value Coe rnmen t and other approved securities at cost and in case the cost price was higher than the face value, the premium should be amortised over t he remaining period of maturity of the security. However, if the cost price w a i less than t h e face value, the difkrence should be Ignored and should not be amortised or taken to income account as the amount represents unrealised gain. For State Government securities and Government- guaranteed securities, the same method of valuation should be applied. PSU bonds should be valued a t lower of the cost or market value. For booking income on units of Lm and equity of all-India financial institutions, as a prudent practice, such income should be booked on cash basis and not on accrual basis. However, income from Government securities/bonds of PSUs and all-India financial institutions where interest rates on the instruments were pre- determined, income should be booked on m a l basis, provided interest is received regularly and is not in arrears.

3.2 1 Reagnising the need for a thorough revamp of the existing audit systems in PCBs, t h e F4smve bankjn the recent past, appointed a Committee under t h e Chairmanship of Shd U.M. Chitale for @viewing t h e audit systems in PCBs and .suggesting appropriate model. The committee bas stronsly recommended
. for induction of p'rokssiona~s to carry out the audit of PCBs as t h e latter are distinctly different from other co-operative iwtitutions.
' me Committee, &ong others, suggested for comrnissiani~g Cfiartered Accountants to carry out statutory aqdit of large sized M?bs with deposits of over Rs.25 crore. The Reserve Bank has accepted the Committee's recomrne&lations and advised the State Governments for its expeditious
r Jmplementation. *
* 3.22 ~ u r i n ~ 1996-97, t h e deserve Bank
I . carried out statutory inspections of 786 PCBs under Section 35 of the Banking Regulation Act, 1949 (as applicable to Co-operative Societies).
3.23 During 1995-96, SCBs' deposits increased by Rs. l ,6 15 crore or 13.7 per cent to Rs. 13,428 crore over the previous year (Chart
' 111.2 and Appendix Table 111.1). Loans d. .. outstanding rose by 25.6 per cent during 1995-
96 which was higher thah 21.4 per cent in 1994-95. Borrowing from RBI/NABARD at ' Rs.7,907 crore was also higher by 38.6 per cent over the preceding year. Overdues to demand remained unchanged at 10 per cent
' in 1995-% (Chart 111.5). During 1995-96, out of the 640 reporting branches of SCBs all over India, 331 made profits while 309 incurred
* losses.
. ' c ccnb.lcbopacldkc mmb
3.24 Deposits of CCBs at Rs.24,397 crore showed an incr- of 17.1 per cent during 1995-96 which was higher than the rise of 14.9 per cent in 1994-95 (Chart 111.3 and
Appendix Table Ill. 1). Loans outstanding at Rs.24,391 crore increased by 18.0 per cent In 1995-96 as against 18.9 per cent in t h e previous year. Overdues as percentage to demand slightly rose to 3 1 per cent in 1 995- 96 From 30 per cent a year earlier (Chart 111.5).
I Chart 111.3 : Growth Rate of Deposits and Credit of Central Co-operative Banks :
p&yis?-;. 1m-94 to 1995-96 w{;&&g~g~ &<*:'-?

&put on T . and R q p s dBanWng In Indla. 1-97
Ofthe 11,514 CCBs branches which reported their worMng results for the year 1995-96, 59.9 per cent (6,895) reported profit while the remalnlng 40.1 per cent (4,6 1 9) incurred losses.
3.25 SLDBs deposits at Rs. 130 crore increased by 9.2 per cent during 1995-96 over Rs. 119 crore in the preceding year. Loans outstanding at Rs.6,880 crore recorded a decline of 1.7 per cent during 1995-96 as against a rlse of 13.9 pe r cent in the previous year. Overdues at 46 per cent of demand in 1-5-96 was also lower than 56 per cent in 1994-95 (Appendix Table Ill. 1 and Chart 111.5).
€0 M ~ ~ u I t u r r l C m f Y S o c l c l r l u
3.26 The number of members of PACSs increased to 96,600 thousands in 1995-96 from 94,200 thousands in the preceding year. Their aggregate deposits at Rs.3,604 crore rose by 23.1 per cent in contrast to a decline of 1.7 per cent witnessed in the preceding year (Chart 111.4 and Appendix Table Ill. 1).
Chart 111.4 : Growth Rate of Deposits and Credit 1 ot Prima. ~ c u i t u m ~ CntW Societies : I
Loans outstanding Increased by Rs. 1,033 core or 7.8 per cent from Rs. 13,2 13 crore in 1 W4- 95 to Rs.14,246 crore In 1995-96. The percentage of overdues to demand declined to 33 per cent in 1995-96; from .41 beicent in the preceding year' (Chart 111.5). Of the 75.698 PA& which reported their working results for the year 1995-96, 50.9 per cent (38,561) made profit while the remaining 37,137 incurred losses.
F. PIImdly Land Development h k s
3.27 Deposits of PLDBs at ~5127 crore * , . in 1995-96 were marginally up from Rs.26 crore last year. Loans outstanding however, showed an increase of 19.7 per cent from Rs.3,382 crore in 1994-95 to Rs.4,049 crore in 1995-96. Overdues to demand rose to 39 per cent from 38 per cent in the preceding year (Appendix Table 111.1 and Chart 111.5).
3 NABARD and the Co-operatfve Sector
3.28 Subsidisation of rural credit has been one of the issues in rural credit in India. Since concessional lending affects the profitability of rural financial institutions, a policy of cross-
Chart IH.5 : Overdues to Demand of
8,-

Developments in co-operative W n g
subsidisation in commercial banks and refinance from the Reserve Bank was put in place simultaneously. In t h e process, a special role was envisaged for the Reserve Bank right from the beginning in terms of refinance to the rural credit structure. The refinance facility was made available to t h e cooperative banking system directly by the Reserve Bank until 1982 and subsequently, this facility has been routed through NABARD after its establishment (see Box 111.1). The General Lines of Credit (GLC) (I and 11) provided to NABARD by the Resenre Bank facilitate t h e refinance of seasonal agricultural operations and off-farm credit. The aggregate limit under the GLC which stood at Rs. 1,300 uore in 1985-86 progressively rose to Rs.3,350 crore in 1991-92 and further to Rs.5,500 crore in 1996-97. It is expected to increase to Rs.5,700 crore in 1997-98. At present, GLC I funds are given to NABARD at 4.5 per cent per annum for seasonal
agricultural operations and at 5.0 per cent under CLC II for &-farm actlvitles. In order to enable NABARD to leverage Its capital for raising more resources, the paid up capltal has been increased from Rs. 100 uore in 199 1 - 92 to Rs. 1,000 crore at present and is proposed to Increase further to Rs.2,000 uore in the next two years. As a consequence, NABARD's refinance for production credit increased fiom Rs.3,104 wore in 1992-93 to Rs.5,725 crore in 1996-97, whlle refinance for investment credit increased from Rs.2.054 crore to Rs.3.390 crore durlng the same period.
&sourres of NABARD
3.29 During 1996-97, there was a turnaround in the resource posltion of NABARD. The net accretion to resources increased from k. 1,6 1 7 crore in 1 995-96 to
-
BOX U1.1- TEE ROLE OF THE, RESERVE BANK IN PROM- RURAI, DEVELOPMEF I 6 1 1 ?'he Reserve Bank, as the central bank of the country, is the kernel of the Indian finandal and monetaq --- Ad system. Apart from pePfwrning the Qadbnal central b W n g and regulatory lunctions fix securing monetary stat-""y, the Bank has over the years taken on an active de-%prr--LdJ and promotional role especially In the
rl are.- -! meetinn the needs oF rural ecomk development. m!y - :- l W w 4 r
A chronological snapshot of the rnuItldimensional activities o e i&serve Gk~n+&kSfS irivohiimeiit , with rural sector actWH- 1~ --ncerned is presented below. C1
bar Event r l April 1931 + -- , .. , **-. ;I---- + R " ' , ' e
W * : I I. -. i April 1935 + Y
The Resew Bank was esWlsfwd as a private shareholders' instltutlo wlth the provlsk>ns of the Reserve Bank of lndia Act, 1934.
lhe Preamble of the Raerve Bank of India Act. 1934 spedfled the' ob)ec& of establishing I
a Rrserve Bank for Indla as the regulation of the issue d bank notes and the keeping of I
reserves 'with a view to securing monetary stabilfty bn British lndia and generally to operate! the curremy and credit system of the country to its advantage'. A sped4 Agddtural Credit Department was set up in the Bank to expand and co- ordinate the credit W W e s for the agricultural &or.
Hljanuary 1949 + Thc Bank entered upon i t s career as a Stakswned imtitutlon 1 .*?t in termqof the Reserve Bank of India (Transkr to Public Ownership) Act, 1948. , .- .. m?-m' v ' a
m i ' = -
"1951 - + A Standing Advkwy Cornmitee on A@- ~ ~ d l t waskt up by the BaFk h r ensuring 4
co-ordlldtlon between the adMties d the co-opmatha credit InstftplWns and the polities . 5 m N&!imai ~ g r k u k d rrrar (- ierm Operatbnsr) Fund was established wlth the ' kuary 19%
W s contJUwtlnn Iw provldlng loans to the State Gwernments and State Co-operathe h k s .
+ Ihe Mtbna l AgWuIturid Credit (StabllIsaWn) fund was xt up to exknd medfum-te w 1 = ~ j m -1 . b t & - t o y . * ~ e - . ' l U - > - ru . - .; I,, .I .-I 4; 4 ~ . 2 q+< -
Report on Trend and Progress of Banklng in India, 1-6-97
+ Vie Agricultural Refinance Corporation [subsequently renamed as the Agrlculturd Refinance and Development Corporation(ARDC)] was set up as a wholly owned subsidlary of the Reserve k k for providing medium and long-term finance for agriculture.
1966 + The co-operative banking system was brought within the statutory supervision and control of the Bank.
+ The College of Agricultural Banklng (formerly known as the Co-operative Bankers Training College) was set up by the Bank in Pune to meet the training needs of the co-operative
' banks.
February I970 + The high powered Agrlcultural Credit Board was set up by rewn Advlsory Committee on Rural and Co-operative Credit.
971 + The Bank promoted the establishment of the Credit Guarantee Corporation of I order to encourage lending to small borrowers.
1972 + The Bank adopted the Differential Rate of Interest (DRI) scheme for ensuring adequate and cheaper credit to the weaker sections.
1974 + The concept of priority sector credit was introduced and public sector banks were asked to extend one-third of their outstanding credit by end-March 1979.
1975 + Regional Rural Banks (RRBs) were created as per the recommendations of the Narasimham Working Group (1975) In the context of disabilities of the co-operatives and weakness of commerdal banks in meeting rural credit demand.
July 1982 + The National Bank for Agriculture and Rural Development (NABARD) was established by + converting ARDC with the Reserve Bank as Its major promoter.
Rs.2.963 crore in 1W6-97. The improvement in the resource position was mainly due to a) significant rise in the deposits under the Rural Infrastructure Development Fund (RIDF) by commercial banks, b) enhancement of its capital, c) issue of tax-free bonds, and d) acceptance of priority sector deposits from private banks. During 1996-97, the RlDF deposits increased to Rs. 1,392 crore from Rs.350 crore in 1995-96 showing a rise of Rs. 1,042 crore. The capital of NABARD was also enhanced by Rs.500 crore to Rs. 1,000 crore in 1996-97 from Rs.500 crore in the previous year. Of the increase of Rs.500 crore of capital, the contributions of the Reserve Bank and Government of India were Rs.400 crore and Rs. 100 crore, respectively. The accretion in reserves and surplus amounted to Rs.542 crore in 1996-97, higher by Rs.36 crore over the previous year. Besides, market borrowings through the issue of bonds and debentures were Rs.200 crore in 1996-97 which includes a tax-free issue of bonds amounting to Rs. 150 crore as compared with Rs.45 crore in 1995-96. Deposits, most of which were priority sector deposits from
private banks, increased by Rs.359 crore in contrast to a negative figure of Rs.U crore in the preceding year. However, repayments to the Government turned out to be Rs.124 crore
Sr. Type of Resource 1995-96 . 1996-97 No.
1 Capital 1 70 500 2 Reserves and Surplus 506 542 3 NRC (LTO) Fund 25 1 45 1 4 NRC (Stabitisation) Fund 2 2 5 Deposits -24 359 6 Bonds and Debentures 45 200 7 Borrowings from Central
Government 65 -124 8 Borrowings from RBI
a) General Line of Credit 444 -22 b) ARDR Scheme, 1990 -1 14 -94
9 Foreign Currency Loans 70 101 10 RlDF Deposits 350 1,042 I I Other Liabilities - 148 6
Total 1,617 2,963
Source : NABARL).

Developments in Co-operative Banking 71
in 1996-97 as compared with a net borrowing of term loans is given in Table 111.5. of Rs.65 crore in 1935-96. The actual utilisation of the GLC horn the Reserve Bank in 1996- Rural Infrastr~ctur~~l Developmer~t Fund (RIDF)
97 was negative (-) Rs'Z2 crore as 'Ompared 3.32 Table 111.6 presents State-wise amount with its utilisation of Rs.444 crore in 1995-96 of sanctions and disbursements under RIDF-I, (Table 111.3A). NDF-II and RIDF-Ill as at end-September 1997.
Refinance from NA BA RD Of the total sanctions of Rs.1,784.28 crore
3.30 The aggregate credit limits sanctioned by NABARD to State Co-operative Banks (SCBs) and State Governments registered an increase of 6.1 per cent while credit outstanding declined by 1.4 per cent during 1996-97 (Table 111.4). The short-term credit limits sanctioned to SCBs rose by 3.6 per cent while the medium-term credit limit increased substantially by 1 34.1 per cent. Though the long-term credit limits sanctioned to the State Governments during 1996-97 remained almost unchanged at the previous year's level of around Rs.100 crore, the outstanding increased by 15.2 per cent.
under RlDF I , disbursements amounted to Rs.1,289.93 crore. The highest disbursement was in Uttar Pradesh (Rs.225.80 crore) followed by Maharashtra (Rs. 1 35.93 crore), Madhya Pradesh (Rs. 133.81 crore) and Gujarat (Rs. 1 11.45 crore). Under NDF 11, sanctions amounted to Rs.2,646.88 crore while disbursements were only Rs.414.05 crore. In disbursements, Maharashtra topped the list with Rs.82.91 crore followed by Uttar Pradesh at Rs.65.90 crore. Under NDF Ill, sanctions amounted to Rs.1,330.3 1 crore with Andhra Pradesh having the highest amount (Rs. 180.46 crore) followed by Uttar Pradesh (Rs. 153.40 crore), Maharashtra (Rs. 139.07 crore), Madhya Pradesh (Rs. 12 1 - 36 crore), Rajasthan
3.31 The interest rate structure of NABARD (Rs. 118.63 crore) and Tamil Nadu (B. 116.69
for refinance and to the ultimate beneficiaries crore)
1995-95 1996-97
Limits Drawals Repay- Out- Limits Drawals Repay- Out- ment standing ment standing
1. State Co-operative Banks a. Short-term 5,837.14 6,193.26 5,807.23 3,505.01 6,049.38 6,287.74 6,409.93 3,382.82
(3.6) (-3.5)
2. W e Governments
Long-term
. . (6.1) (-1.4)
Note : Figures fn brackets are percentage change over previous year. Sou= : NABARD.

Report on Trcnd and Pmsress of Banking In Indla. 19%-97
Table 111.5 r NABARD's Structure of lnterest Rates for Term Loans* (per cent per annum)
Sfze of Loan Rate of Interest to uldmate benefidarfes Rate of interest on refinance
CBs RRBs SCBsI CBs RRBs SCBs/ SLDBs SLDBs
12.0 As determined by As determined by 8.5 6.5 6.5 the RRBs effective SCBs / SLDBs
Aug. 26, 1996 subject to a minimum of 12% (For all loan slabs)
effective October 18, 1994
Above Rs.25,000/- and upto Rs.2 lakh
Above Rs.2 lakh
As determined by CBs effective
October 18. 1994
3% below the rate 12.0 12.0
fixed by CBs
with maturity of three years and above. uled commercial banks. respect of externally aided projects, the rate was fixed as per
respectlve agreement/sanctlon with eFfect from August 1 , 1995. Source : NABARD .
r\,griculturd/ Development Firlance Companies jrl DFCs]
3.33 During 1996-97, three ADFCs have been incorporated in the States of Andhra Pradesh, Karnatalca and Tamil Nadu with an authorised capital of Rs. 20 crore each, with NABARD as the chief promoter to augment credit for commercial or hi-tech export- oriented agriculture and allied activities including infrastructure and support systems. These companies will provide term finance for investment in agriculture and allied activities, working capital assistance for the projects, arrange for syndication of loans/issue of bonds for large-sized projects, rediscount bills of other financial institutions against their loans for agriculture and allied activities, undertake non-fund based facilities to companies involved directly or indirectly in agriculture and allied activities, and render technical support by way of project appraisal relating to agriculture and allied activities.
Development Action Plans (DAPs) and Memoranda of Understandings (MoUs)
3.34 For strengthening the structure and organisation of co-operatives, the process of entering into Memoranda of Understandings (MoUs) by NABARD with the co-operative banks and the concerned State Governments, on the basis of State-specific Development Action Plans (DAPs) continued during 1996- 97. By the end of June 1996, MoUs were signed with 28 State Co-operative Banks, 20 State Co-operative and Agricultural Rural Development Banks (SCARDBs) and 36 1 District entral Co-operative Banks (DCCBs). To review the progress of implementation of the MoUs, Institutional Development Cells (IDCs) were constituted in almost all the banks. The State level and District level Monitoring and Review Committees were also constituted in most States. To enhance the effectiveness of the institutional development measures through MoUs and DAPs further, a system of

Developments in Co-operative h k i n g
Table 111.6 : Sanctions and Dlsbunements under RIDF-1, RID611 and RIDE-Ill (As o n September 30, 1997)
Sr. No .
State RIDF-I RIDF-II RIDF-Ill
Sanctions# Disbursements Sanctions Disbursements Sanctions
Andhra Pradesh Assam Goa Gujarat Haryana Himachal Pradesh Jammu 8. Kashmir Karnataka Kerala Madhya Pradesh Maharashtra Manipur Meghalaya Mizoram Nagaland Orissa Punjab Rajasthan Tamil Nadu Tripura Uttar Pradesh
22. West Bengal 1 13.37 72.64 169.51 15.79
execution of annual MoUs has been introduced for facilitating the refinement of t he financial parameters and other key measures required to be taken on t h e basis of past performance and other developments on a year-to-year basis.
Policy initiatives by NA BARD
3.35 Consequent upon the Reserve Bank's decision to provide GLC-I to NABARD at a fixed interest rate of 5.5 per cent per annum with e fk t from July 1 , 19%. NABARD revised its interest rates on seasonal agricultural
operation (SAO) loans to t h e co-operatives. Effective July 1 , 1996, the rate of interest charged t o SCBs was based on t h e i r percentage of borrowings from NABARD to the short-term (SAO) loans outstanding against PACSs. The interest rate would increase progressively from 5.0 per cent for borrowings of less than 35 per cent of short-term loan outstanding against PACSs to 7.5 per cent for borrowings above 55.0 per cent of short-term loan outstanding against PACSs. However, t h e interest rate o n borrowings of SCBs under the special l ine of credit for financing t h e tribals

Report on Trend and Progress of Banking In Indla, 1996.97
under the Development of Tribal Population (DTP) programme would remain at 5.0 per cent irrespective of the bank's level of borrowings. Similarly, all the co-operative banks in the North Eastern Region would be provided SAO refinance at the rate of 5.0 per cent. As an incentive for deposit mobilisation, a rebate of 0.2 per cent in the interest rate on short-term (SAO) refinance was given to banks which showed impressive performance in deposit mobilisation. Consequent upon the reduction in GLC(I) lending rate with effect from June 27, 1997 sequel to the reduction the Bank Rate from 1 1 per cent to 10 per cent, NABARD has also lowered its Interest rates on refinance to co-operative banks.
of refinance assistance to commercial banks was changed. NABARD's ref nance support to the commercial banks for all purposes was limited to the North Eastern Region, and the States of Bihar and Orissa where the co- operative credit structure is weak. In other States, refinance support was largely extended for SC/ST action plan for non-farm sector and project-based lending. The rate of refinance for project-based lending was reduced from 50 per cent to 40 per cent of the bank loan, except in the North Eastern States.
3.39 The new refinance schemes initiated during 1996-97 include refinance for (a) financing excavators/dumpers/ cranes used for mining under Integrated Loan Scheme, (b)
Interest rates ranging between 4.0 per cent financing units engaged in blending, (6 per cent below Bank Rate) and 6.5 per packaging or repackaging of tea, (c) financing cent (3.5 per cent below Bank Rate) are being light motor vehicles such as cars, jeeps, vans charged in accordance with the level of used for transportation of passengers/goods dependence o~ refinance by banks. in the North Eastern Region, and (d) financing
3.36 To ensure that the sanction of credit limits to co-operative banks is commensurate withJheir sustainable SAO business, recovery performance and resource mobilisation, three criteria were adopted during the year, viz., (a) assessing the lending programme of the banks with reference to their past performance, the implementation of special programmes in their area of operation, the increase in the scales of finance, membership, etc., (b) linking the quantum of credit limit under crop loan to recovery, and (c) regulating the incremental refinance support to SO per cent of the incremental SAO business in respect of DCCBs with more than 60 per cent dependence on refinance support.
3.37 Provision of short-term finance (for both SAO and non-SAO) to RRBs continued to the extent of 50 per cent of their outstanding loans. However, RRBs were advised that, in future, refinance assistance from NABARD would be directly linked, inter alia, to the levels of recovery performance and the availability of surplus resources with them.
3.38 NABARD's policy regarding provision
milk tankers under service sector of Automatic Refinance Facility (AM).
3.40 Based on the recommendations of the Expert Committee on IRDP, the 'back-end' subsidy scheme was introduced b r IRDP loans. Under the new system, the banks would finance the entire amount of the project cost, and the subsidy portion would be kept in the'subsidy Reserve Fund Account'. The beneficiary would be entitled to the subsidy depending upon the proper maintenance of asset/repayment of loan after the expiry of the stipulated 'lock-in-periods'. The lock-in period for different activities would be broadly categorised into 3 types: it would be 3 years, 4 years and 5 years depending on the loan repayment periods of 5 years, 7 years and 10 years, respectively. To enhance the credit flow under IRDP, a scheme for financing a group of 'Below Poverty Line' families was introduced. The number of borrowers in a group might vary from 5 to 15 and they could form a society under the Registration of Society Act or as a Co-operative Society or as a registered company or partnership flrm. The group would be eliglble for a subsidy of Rs. 1.25 lakh or 50 per cent of the project cost, whichever is less.

Developments In Co-operative Banklng 76
3.41 For improving the credit flow to the handloom and handicraft sectors, the co- operative banks and RRBs were advised to accord priority for meeting the credit needs of these sectors, particularly in the identified districts having concentration/ potential for development by making suitable provisions in t h e banks' credit plans.
3.42 Involvement of Self Help Groups (SHGs) and Non-Government Organisations (NGOs) in rural credit delivery marked another innovative and significant step taken during t h e recent years. Based o n the recommendations of the Working Group o n NGOs and SHGs, banks were advised to
consider lending to the SHCls as a normal business activity under the priority sector. In order to review the progress and guide the various credit delivery innovations, NABARD constituted State Level Review and Co- ordination Committee o n Credit Delivery Innovations (SLRCCCDI). During 1996-97 (July- June), 1 6 Nos were sanctioned promotional grant assistance of Rs.40.80 lakh by NABARD for their capacity building, to promote and nurture SHGs, as also to carry out various credit delivery innovations. Support for credit delivery innovations such as, replication of Crameen Bank of Bangladesh model financing, was also continued by NABARD during 1996-97.

FINANCIAL INSTITUTIONS
Overview
The financial system in lndia consists principally of commercial banks, co-operative institutions, the financial institutions (Fls), Non- Bank Financial Companies (NBFCs) and other capital market intermediaries. The commercial banks are relatively old in t h e financial scene, while Fls a r e comparatively newer organizations. The present chapter reviews the major developments relating to the Fls, mutual funds and NBFCs.
4.2 During 1996-97 (April-March), financial assistance sanctioned by all financial institutions1 witnessed a sharp decline. This was due mainly to the drop in sanctions by the major term-lending institutions. While disbursements registered an increase, the increase was lower than that recorded during the previous year.
4.4 Fresh regulatory initiatives w e r e undertaken in the field of NBFCs. Accordingly, under the provisions of the Reserve Bank of lndia (Amendment) Act, 1997, a system of compulsory registration for NBFCs w a s introduced. Norms for classification of NBFCs into various categories are also being revised and refined. These measures have been aimed at promoting a greater degree of financial integration while safeguarding depositors' interest.
4.5 The performance of the mutual funds industry showed signs of modest recovery in the latter half of 1996-97, primarily due to some proactive measures on the part of the Reserve Bank and the Central Government as well a s increased investments by Foreign Institutional Investors (FIIs). The removal of pre-emptions (CRR and SLR) on inter-bank liabilities enunciated in the Monetary and
4.3 F l s are now raising resources a t Credit policy of April 1997 provided further
market-related rates of interest. A noticeable impetus to the development of the short-term
feature of the resource-raising efforts of the money market. The scheme of Money Market
term-lending institutions during the year has Mutual Funds (MMMFs), which was dormant
been the preponderance of private for many years, finally took off due to policy
placements. This is reflective of the fact that initiatives.
these institutions a r e able to mobilise 2. Assets of Financial Institutions resources relatively a t a lower cost under private placements vis-a-vis other methods 4.6 Traditionally, the long-term funds for of fund raising. industrial development in India have been
' All rinancfal Institutions comprise of IDBI: Industrial Development Bank of India; ICICI: Industrial Credit and Investment Corporatjon of India; IFCI: Industrial Finance Corporation of Indla: 1181: lndustrial Investment Bank of India; SIDBI: Small Industries Development Bank of India; RCTC: Risk Capital and Technology Finance Corporation Ltd.; TDICI: Technology Development and information Company of lndia Ltd.; TFCI: Tourlsm Flnance Corporation of India; Un: Unit Trust of India; LIC: Life Insurance Corporation of India; GIC: Insurance Corporation of India; .SFCs: State Financial Corporations; SIDCs: State Industrial Development Corporatlons.

The Anandal system In India consists prlnclpally of commercial banks, co-operative institutions, the financial lnstltutlons (Fls), Non- Bank Financial Companies (NBFG) and other capital market intermediaries. The commercial banks are relatively old in the financial scene, whlle Fls are comparatively newer organizations. The present chapter reviews the major developments relating to the Fls, mutual funds and NBFG.
4.2 During 1-97 (April-March), financial assistance sanctioned by all financial institutions' witnessed a sharp decline. This was due mainly to the drop in sanctions by the major term-lending institutions. While disbursements registered an increase, t h e increase was lower than that recorded during the previous year.
4.4 Fresh regulatory initiatives were undertaken in the field of NBFCs. Accordingly, under the provisions of the Resewe Bank of lndia (Amendment) Act, 1W7, a system of compulsory registration for NBFCs was introduced. Norms for classification of NBFG into various categories are also being revised and refined. These measures have been aimed at promoting a greater degree of financial integration while safeguarding depositors' interest.
4.5 The performance of the mutual funds industry showed signs of modest recovery in the latter half of 1996-97, primarily due to some proactive measures on the part of t h e Reserve Bank and the Central Government as well as increased investments by Foreign Institutional Investors (FIls). The removal of pre-emptions (CRR and SLR) on inter-bank liabilities enunciated in the Monetary and
4.3 FIs are now raising resources at Credit policy of April 1997 provided further
market-related rates of interest. A noticeable impetus to the development of the short-term
feature of the resource-raising efforts of the money market. The scheme of Money Market
term-lending institutions during the year has Mutual Funds (MMMFs), which was dormant
been the preponderance of private for many years, finally took off due to policy - - placements. This is reflective of the fact that these institutions are able to mobilise resources relatively at a lower cost under private placements vis-a-vis other methods of fund raising.
initiatives.
2. Assets of Financial Institutions
4.6 Traditionally, the long-term funds for industrial development in lndia have been
~ l l ffnandal lnstftutkm comprise oF IDBI: Industrial Devebpmmt Bank at India; #XT: kdusMd Crrdit and Investment Corporation of lndia; IFCI: lndwtrlal Fiance Cqmratlon of Wla; IlfW: Industrid 1- Bank of India; SIDBI: Small lndustrks Development Bank of Jndla; KT": Rlsk Capital Md Tdmabgy ftnancc Cwpora#on Ltd.; TDKI: Techndosy Dwdopment and Infwmatlon Company d lndh LW.; T ' : TouiIm R m Corpora- of India; Lm: Unlt Trust of In&; LK: Llfe Insurance Corporation of India; CIC. Gcm~el Inuunc+ Cqwa?&n of India; ,SF(S: State F i m c Y Corjxwdtions; S I W : State IndustrW M o p m a t Capmatbns.
+- . ,,

Finaru/al Institutions
provided by financial institutions (BOX w.1). The aggregate financial assets of banks and financial institutions registered a growth of 12.9 per cent during 1996-97 as compared with 1 1.7 per cent in the preceding year. During the year ended March 1997, financial assets of Fls registered a higher growth of 16.2 per cent as against 12.0 per cent registered during fiscal year 1995-96 [Appendix Table N.1 (A)]. This was in contrast to the trend in growth of financial assets of banks, which experienced a marginal deceleration in its growth rate to 11.0 per cent as compared with 1 1.6 per cent during t h e same period last year. As a result, the s h a r e of financial institutions in aggregate financial assets improved from 35.3 per cent in 1995-96 to 36.4 per cent in 19%-97 (Chart iV. 1). The increase in the financial assets of Fls was due to the significant growth in assets of term-lending institutions (23.4 per cent in 1996-97 on top of a rise of 15.9 per cent in 1 995-96) [Appe ndi Table N. 1 (B)]. Financial assets of investment institutions too recorded a growth of 10.2 per cent in 1996-97 (9.2 per cent during 1995-%).
3. Term Lendlng and Invement lnstltutlonr
4.7 Industrial growth witnessed a significant downturn in 1996-97, wlth overall industrial growth decelerating to 6.6 per cent as compared with a rise of 1 1.8 per cent during 1995-96. The decline was perceptible in all the three segments of the industrial sector viz., Mining and Quarrying, Manufacturing and Electrlcity. This was reflected in t h e working of t h e financial institutions .as well. During the year 1996-97 (April-March), the financial assistance (net of inter-institutional flows) sanctioned by all financial ihstitutions amounted to Rs.56.999.6 crore which was lower by 14.2 per cent over 1995-96. Similarly, their disbursements in 1996-97 amounted to Rs.42,32 1.9 crore, registering a rise of 10.2 per cent over the preceding year (Chart IV.2).
4.8 The deceleration in sanctions was largely on account of t h e All India Development Banks (AIDBs) (viz., IDBI, ICICI,
Chart IV . l : Share of BaWs am RnanGl Indikltians in Fillafteial Ass* -

(per-pcr-w 2
Institution Prime Lendlng ShorC T e r m l ~ l r s m Rate Term Lending RaG
13.5 $ 12.5 $S
I Chart 4 : Term Loans a$ pet teqt % PIU*+W @zie&fq T@l&& cw& 5; &: t.i,.. I
MTLR tNledium Term Len&"& Rate). Applicalote from ~ b e t / N o v e m k r , 1997.
rmaulty wlth Inkrest rate sum to k
c€nlvergenceof#t~tksofiwrksand~wouM r e l k d a ~ ~ ~ e t r r w ~ ~ tn hr3ja fn U.S. 0 Ibr hstamw. the 1933

Report on Trend and Progress of Bdnklng in India, 1 W6-97
IFCI, llBI and SIDBI). Their sanctions declined sharply by 16.1 per cent in 1 %-97 compared with an increase of 13.8 per cent In 1995-96. Disbursements, on t h e other hand, showed a lower growth of 9.1 per cent in 1996-97 as compared with a rise of 18.0 per cent during the previous year. Investment institutions (UTI, LIC and GIC) however, registered increases in both sanctions and disbursements by 9.1 per cent and 12.4 per cent, respectively, in 1996- 97 as compared with a decline of 21.6 per cent in sanctions and a modest 1.1 per cent rise in disbursements, respectively, in the previous year (Appendix Table IV.2).
P;~ttcrn of Sources and Deploy~nent of Funds of Fls
4.9 Sources of funds of Fls fall into two broad categories: (i) internal and (ii) external. Internal sources of funds relate to increase in capital, sale/redemption of past investments, repayments of past borrowings, dividend and interests on investments, etc., while external sources arise primarily from fresh borrowings (both Rupee and Foreign Currency), borrowings by way of bonds and debentures, etc.
4.1 0 Internal sources of funds constituted 42.8 per cent in March 1997, whereas the share of external sources of funding accounted for 44.5 per cent. The share of 'other sources' a t 12.7 per cent comprised the remaining (Appendix Table IV.3).
4.1 1 Deployment of funds can b e categorized under two broad heads: (i) fresh disbursements and (ii) repayment of past borrowings. Fresh deployments represent new loans and advances, investments etc., while repayment of past borrowings include redemption of bonds/debentures issued in the past, repayment of Npee and foreign currency loans etc. During the year ended March 1997, the share of fresh deployments constituted 50.5 per cent of the total funds deployed. Repayments of past borrowings comprised 24.1 per cent whereas 'other deployments' constituted 25.4 per cent, a sizeable portion
of which includes interest payments to the tune of 13.0 per cent (Appendix Table IV.3).
Prime Lending Rates of Fls
4.12 A major objective of t h e ongoing financial sector reforms has been to reduce the external constraints of financial intermediaries, a major component of which was interest rate deregulation. Following a period of relatively low inflation during 1996- 97, sharp reductions in cash reserve ratio (CRR) in stages in 1996-97 and a subsequent reduction in the Bank Rate by 1.0 per cent during April 1997, there has been a significant softening of Prime Lending Rates (PLR) of Fls. The interest rates showed a rising trend between February 1995 and July 1996, when the interest rate of IDBl firmed up from 13.5- 16.5 per cent in October 1994 to 17.0-21.0 per cent in July 1996. Since the announcement of Monetary and Credit policy in October 1996, PLR. have shown a downward drift. Lending rates of ICICI and IFCI, too softened considerably since October 1996, after having stayed firm during t h e period October 1994 to July 1996. The Monetary and Credit policy announcement of October 1996 had made it mandatory for Fls t o announce the maximum spread over the PLR for all advances (other than consumer credit).
4.13 Taking advantage of the downward movement in interest rates following the slack season credit policy announced in April 1997, ICICI introduced a two-tier prime lending rate structure- a Medium Term Prime Lending Rate (MTPLR) and a Long Term Prime Rate (LTPR). The MTPLR was fixed a t 13.5 per cent for loan maturities upto 30 months and LTPR was fixed a t 15.0 per cent for loans exceeding 30 months. A further reduction in the PLR of Fls was triggered off by the reduction in the Bank Rate by 1.0 percentage point, effective june 25, 1997. Consequent upon this reduction, the leading Fls (IDBI, IClCI and IFCI) effected a uniform reduction in their PLR (by 5 0 basis points each) From 15+0 per cent to 14.5 per cent, with spreads in the 2.5-4.0 per cent band. Effective july 23, 1 W7, IClCl introduced
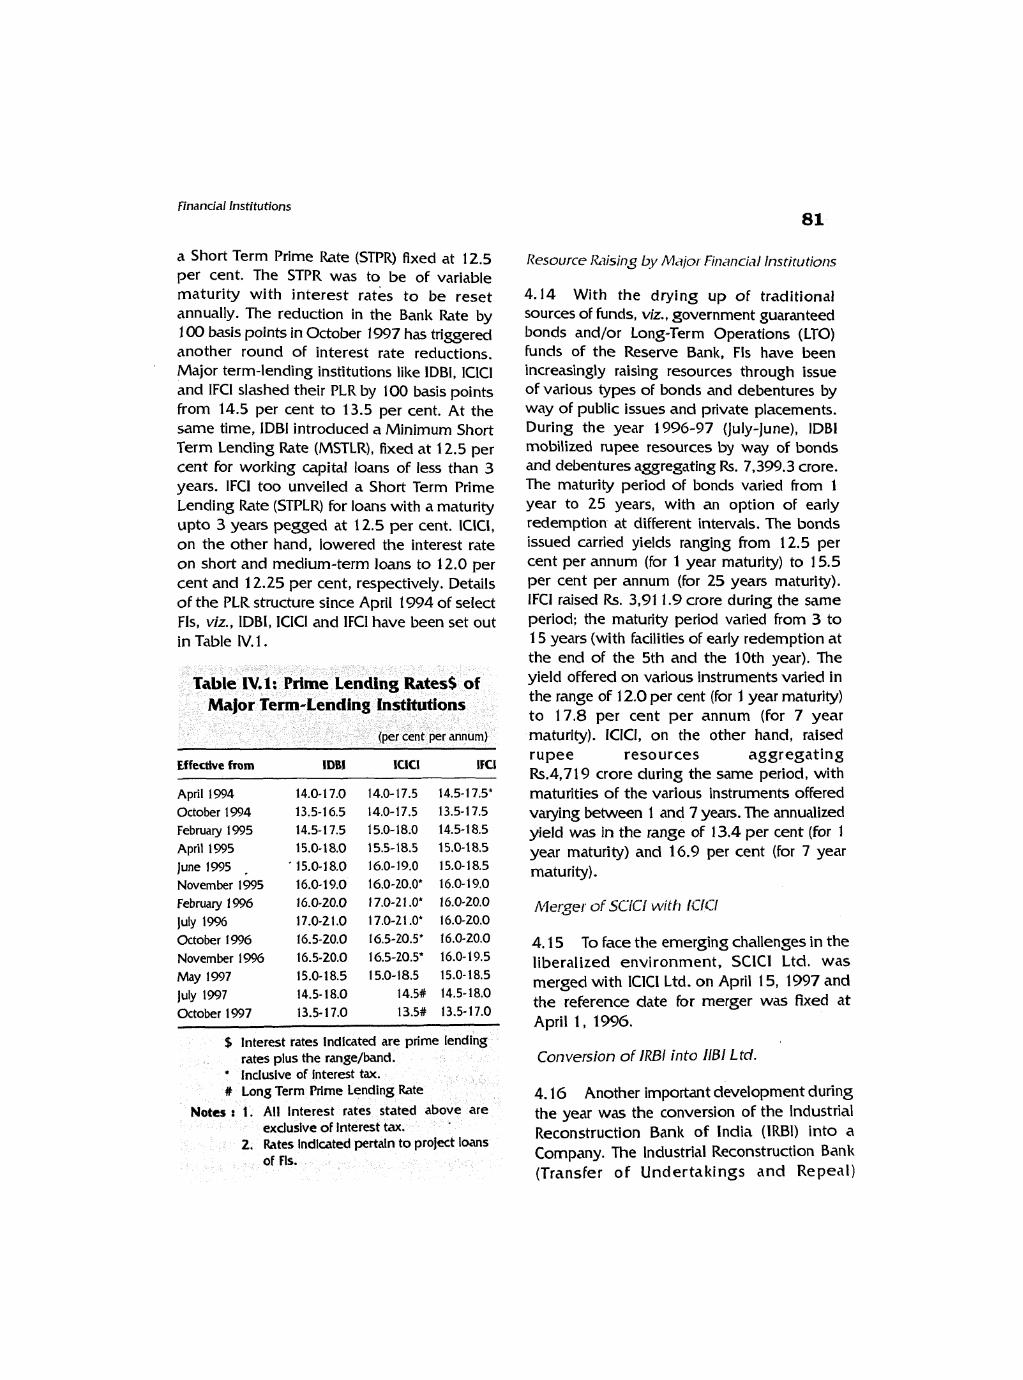
Financial Institutions
a Short Term Prime Ibte (STPR) fixed at 12.5 per cent. The STPR was to be of variable maturity with interest rates t o be reset annually. The reduction in the Bank Rate by 100 basis points in October 1997 has triggered another round of interest rate reductions. Major term-lending institutions like IDBI, IClCl and lFCl slashed their PLR by 100 basis points from 14.5 per cent t o 13.5 per cent. At the same time, IDBI introduced a Minimum Short Term Lending Rate (MSTLR), fixed a t 12.5 per cent for working capital loans of less than 3 years. IFCI too unveiled a Short Term Prime Lending Rate (STPLR) for loans with a maturity upto 3 years pegged at 1 2.5 per cent. ICICI, on the other hand, lowered the interest rate on short and medium-term loans to 12.0 per cent and 12.25 per cent, respectively. Details of the PLR structure since April 1994 of select Fls, viz., IDBI, IClCl and IFCI have been set out in Table IV. 1 .
Effective from IDBJ ICICl lFCl
April 1994 October 1994 February 1995 April 1995 June 1995 . November 1995 February 1996 july 1% October 1996 November 1% May 1997 july 1997 October 1997 -
$ Interest rates indicated are prime lending rates plus the range/band. Inclusive of interest tax.
# Long Term Prime Lending Rate Notes r 1 . All lnterest rates stated above are
closive of interest tax. tes indicated pertaln to project loans
Resource klising by Mc?ior Fi~?anci~~/ I~~sti tut ior~s
4.14 With the drying up of traditional sources of funds, viz., government guaranteed bonds and/or Long-Term Operations (LTO) funds of the Reserve Bank, Fls have been increasingly raising resources through issue of various types of bonds and debentures by way of public issues and private placements. During the year 1996-97 (July-June), lDBl mobilized rupee resources by way of bonds and debentures aggregating Rs. 7,399.3 crore. The maturity period of bonds varied From 1 year to 25 years, with an option of early redemption at different intervals. The bonds issued carried yields ranging from 12.5 per cent per annum (for 1 year maturity) to 15.5 per cent per annum (for 25 years maturity). lFCl raised Rs. 3,91 1.9 crore during the same period; the maturity period varied From 3 to I 5 years (with facilities of early redemption at the end of the 5th and t h e 10th year). The yield offered on various instruments varied in the range of 1 2.0 per cent (for 1 year maturity) t o 17.8 per cent per annum (for 7 year maturity). ICICI, on the other hand, raised rupee resources aggregat ing Rs.4,719 crore during the same period, with maturities of the various instruments offered varying between 1 and 7 years. The annualized ye ld was in the range of 13.4 per cent (for 1 year maturity) and 16.9 per cent (for 7 year maturity).
Merger of SCiCl with ICICl
4.15 To face the emerging challenges in the liberalized environment, SClCl Ltd. was merged with lClCl Ltd. on April 15, 1997 and the reference date for merger was fixed a t April 1 , 1996.
Conversion of IRBl into IlBl Ltd.
4.16 Another important development during the year was the conversion of the Industrial Reconstruction Bank of India (IRBI) into a Company. The Industrial Reconstruction Bank (Transfer of Undertakings and Repeal)
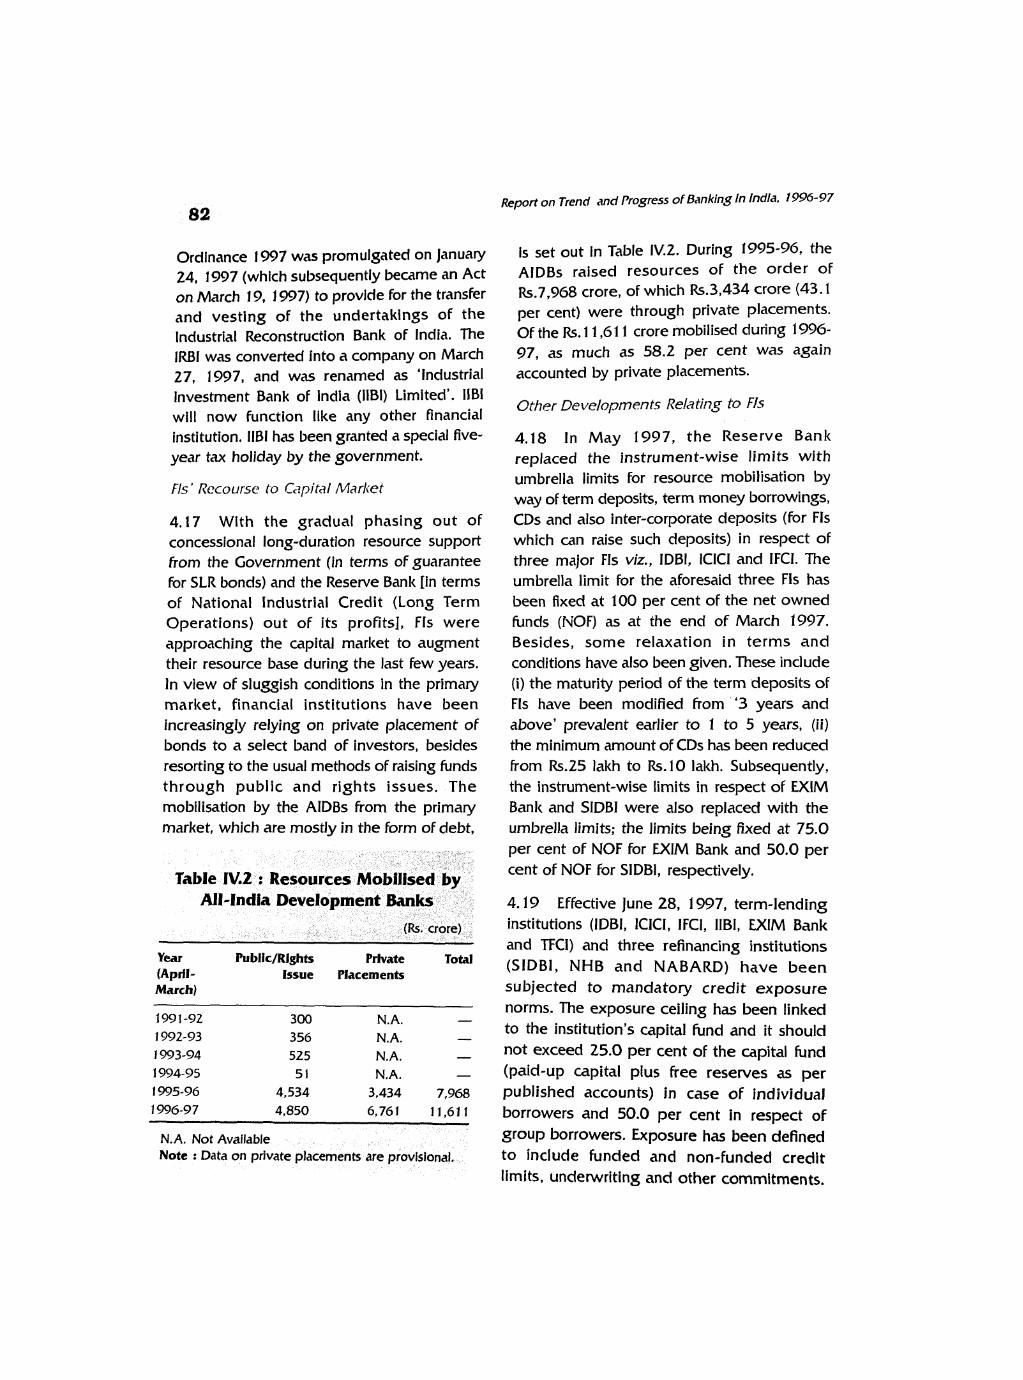
Report on Trend and Progress of Banklng In India, 1996-97
Ordinance 1997 was promulgated on January 24, 1997 (which subsequently became an Act on March 19, 1997) to provide for the transfer and vesting of the undertakings of the lndustrial Reconstruction Bank of India. The lRBl was converted into a company on March 27, 1997, and was renamed as 'Industrial Investment Bank of India (1181) Limited'. IlBl will now function like any other financial institution. llBl has been granted a special five- year tax holiday by the government.
Fls ' Recourse to CC?pjtal Market
4.17 With the gradual phasing out of concessional long-duration resource support from the Government (in terms of guarantee for SLR bonds) and the Reserve Bank [in terms of National lndustrial Credit (Long Term Operations) out of its profits], Fls were approaching the capital market to augment their resource base during the last few years. In view of sluggish conditions in the primary market, financial institutions have been increasingly relying on private placement of bonds to a select band of investors, besides resorting to the usual methods of raising funds through public and rights issues. The mobilisation by the AlDBs from the primary market, which are mostly in the form of debt,
is set out In Table IV.2. During 1995-96, the AlDBs raised resources of the order of Rs.7,968 crore, of which Rs.3,434 crore (43.1 per cent) were through private placements. Of the Rs. 1 1,611 crore mobilised during 196- 97, as much as 58.2 per cent was again accounted by private placements.
Other Developments Relating to Fls
4.18 In May 1997, t h e Reserve Bank replaced the instrument-wise limits with umbrella limits for resource mobilisation by way of term deposits, term money borrowings, CDs and also inter-corporate deposits (for Fls which can raise such deposits) in respect of three major Fls viz., IDBI, lClCl and IFCI. The umbrella limit for the aforesaid three FIs has been fixed at 100 per cent of the net owned funds (WF) as at the end of March 1997. Besides, some relaxation in terms a n d conditions have also been given. These include (i) the maturity period of the term deposits of Fls have been modified from '3 years and above' prevalent earlier to 1 to 5 years, (ii) the minimum amount of CDs has been reduced from Rs.25 lakh to Rs. 10 lakh. Subsequently, the instrument-wise limits in respect of EXIM Bank and SIDBI were also replaced with the umbrella limits; the limits being fixed at 75.0 per cent of NOF for EXIM Bank and 50.0 per cent of NOF for SIDBI, respectively.
4.19 Effective June 28, 1 997, term-lending institutions (IDBI, ICICI, IFCI, IIBI, EXIM Bank and TFCI) and three refinancing institutions
Year Public/Rights Private (April- Issue Placements
(SIDBI, NHB and NABARD) have b e e n
1991-92 300 N. A. 1992-93 356 N. A. - 1993-94 525 N.A. - 1994-95 5 1 N. A. - 1995-96 4,534 3,434 7,98 1996-97 4,850 6,761 11.61 1
N.A, Not Available Note : Data on pmtate
subjected to mandatory credit exposure norms. The exposure ceiling has been linked to the institution's capital Fund and it should not exceed 25.0 per cent of the capital fund (paid-up capital plus free reserves as per published accounts) in case OF Individual borrowers and 50.0 per cent in respect of group borrowers. Exposure has been defined t o include funded and non-funded credit limits, underwriting and other commitments.

Financial Institutions
~ e s i d e s limiting the exposure norms, the term-lending institutions have been asked to consider fixing internal limits for aggregate commitments to specific sectors, e.g., textiles, chemicals, engineering, etc., so that the exposures are evenly spread across various sectors. Till June 1997, such exposure norms were applicable only to commercial banks. Keeping in view the substantial resource requirements for infrastructure projects, credit exposure to group borrowers have been permitted to exceed the norm of 50.0 per cent of the Fl's capital fund by an additional 10.0 per cent (i.e., upto 60.0 per cent) provided that the additional exposure is o n account of infrastructure projects only.
Prudential and Capital Adequacy Measures
4.20 A reference was made in the earlier Reports about the prescription relating to capital adequacy standards, income recognition, asset classification and provisioning of t h e five term-lending institutions introduced in March 1994. These norms, which were later extended to the three refinancing institutions, viz., SIDBI, NABARD and NHB in March 1996 were modified partially in February 1997.
4.21 Fls have now been allowed to treat an asset as non-performing, if interest is 'past due' for more than 180 days and/or the principal is past due more than 365 days. Earlier, an asset was required to be treated as NPA if installments of interest or principal were 'past due' for more than two quarters. With the relaxation in repayment of installment of principal from 2 quarters to 4 quarters, the earlier facility of one time re-schedulement with the approval of t h e Board before downgrading an asset, provided the interest was being paid regularly, was withdrawn. In respect of assets where there are potential -'-
threats of recovery on account of erosion in the value of the security or non-availability of security and existence of other factors (such as, frauds committed by borrowers), the
account is required to b e straight-away classified as doubtFul or loss assets, as appropriate, irrespective of the period for which it has remained as non-performing. In cases where the terms of the loan agreement regarding interest and principal have been renegotiated or rescheduled after commencement of commercial production, the period of satisfactory performance before a n asset is upgraded in respect of rescheduled/renegotiated cases has been reduced from 2 years to 1 year.
4.22 In respect of consortium advances, FIs have been allowed to classify the borrowal account according to their own record of recovery and other aspects having a bearing on the recoverability of advances. Earlier, they were required to adopt the leader's classification and it was incumbent on the part of the lead member to take into account the status of the advance in the books of the other members before classifying an account.
4.23 The norms for valuation of equity investments have also been modified. Fls are now required to bifurcate t h e equity investments into 'current' and 'long-term' categories. The current equity investments, which are intended to be held for not more than one year, are required to be valued at cost or market price (whichever is lower), with diminution in value being charged to the profit and loss account. in respect of long-term investments (which are not current investments), Fls are required to make a distinction between 'temporary' and 'permanent' diminution in value to the satisfaction of their statutory auditors. The permanent diminution is required to be provided for or charged off to the profit and loss account, while the temporary diminution in value is allowed to be ignored.
4.24 The capital adequacy ratio (CAR) of all the term-lending institutions (IDBI, ICICI, IFCI, llBl and DIM Bank) as on March 1997 were well above the stipulated norm of 8.0 per cent. Refinancing institutions, which were

84 Report on Trend and Progress of Banking In Indk, 1996-97
Table IV.3: Prudential Regulatory Framework for Financial Institutions *
1994-95 1995-96 1996-97
I. CapW Adequacy Requtrements (per cent of risk-weighted assets)
11. Non-Performing Assets (a) Overdue Periods (quarters)
(1) Interest (ii) Principal
111. Provlslonlng Requirements (per cent) (a) Sub-standard (b) Doubtful
(1) Secured (11) Unsecured
(c) Loss
IV. Exposure Norms $ (ceiling In terms of percentage of capital funds) ## (I) Individual Borrowers 25 ( i t ) Group Borrowers 50 (60) $$
Effective June 28, 1997. Additional 10 per cent av
e exact provisioning in case of doubtful as
Capital Institution Adequacy
Ratio $
1. 1DBl
2. IClCl 3. lFCl 4: SlDBl
5. IRBl 6. EXlM Bank 7. NABARD
$ As percentage of risk-wejghted assets. * As on March 26, 1997.
required to achieve a CAR of 6.0 per cent by March 1997, had achieved the same in the last year itself (Table IV.3 and Table 1V.A).
4.25 Table IV.4(A) provides the Capital Adequacy Ratio (CAR) of select Financial lnstitutions as on March 3 1, 1997 and Table IV.4 (B) provides the classification of assets of select Financial lnstitutions for the period 1995-96 and 1996-97.
4. Reserve Bank Assistance to Financial institlatjons
4.26 The assistance sanctioned by the Reserve Bank of India to SIDBI, NHB and SFCs aggregated to Rs.1,061.6 crore during the year 196-97 (luly-june). SlDBl was provided with a long-term assistance of Rs.225.O crore

financial Institutions
86
Table IV-4(8) : Asset Classification of Select nnancfal lnstltutions as at the end of March 1996 and 1997.
Total Loan Institution Standard Sub-standard Doubtful Loss Assets$
1% 7 6 1997 1 6 7 1% 1997 1% 1997
1 2 3 4 5 6 7 8 9 10 1 1
IDBl 33,465 38,127 2,368 3,005 1 , 1,360 - - 36,932 42,492 IClCl 15,735 26,350 1,324 1,392 743 851 - - 17,802 28,593 IFCl 10,329 13,625 1,256 1,228 954 985 - - 12,539 15,838 llBl 821 1,090 117 136 271 1 24 - - 1,209 1,350 TFCl 416 568 3 23 3 5 - - 422 5% SlDBl 10,805 1 1,87 1 94 295 - 1 1 - - 10,899 12,177 NABARD 17,359 19,859 212 163 ..28. 33 - - 17,599 20,055 NHB 2,028 NA - N A - NA - NA 2,028 NA
t of provisioning and write-offs. spect of TFCI, SIDBI, NABARD and NHB were prescribed from
by t h e Reserve Bank at an interest rate of 9.5 per cent per annum for 15 years, out of the repayments by IDBI to the NIC (LTO) Fund.l Under Section 17(4A)/(4BB) of the Reserve Bank of India Act, 1934, t h e Reserve Bank sanctioned Rs. 136.6 crore to 16 SFCs during the year 1996-97 (July-June) at the Bank Rate for one year against ad-hoc bonds guaranteed by respective State Governments/Union Territories.
4.27 The outstanding long-term borrowings of IDBI, SIDBI, EXIM Bank and IIBI under NIC (LTO) Fund facility at Rs.5,369.5 crore as at end-June 1897 were lower by 1.3 per cent t han the outstanding as at end-June 1996. The outstanding long-term borrowings of NHB from the NHC(LT0) Fund as on June 30, 1997 stood at Rs.875.0 crore. The outstanding of special medium-term refinance facility extended to IDBI went down to Rs. 120.0 crore at end-June 1997 from Rs.ZOO.0 crore at end- June 1996. However, t h e outstanding
regarding borrowings by SFCs as at June 1997 amounted to Rs.2.0 crore as compared with Rs. 6.7 crore at end-June 1996 (Appendix Table IV.4).
4.28 Under Section 17(4A/(4BB) of the RBI Act, State Financial Corporations (SFCs) are given assistance by t h e Reserve Bank amounting to Rs. 136.6 crore during the year at the Bank Rate against ad-hoc bonds guaranteed by t h e respective State Governments/Union Territories for not less than 24 months. These short-term loan facilities are extended to SFCs subject to repayment of the entire amount by June 25, 1997.
4.29 The National Housing Bank (NHB) had sought an increase of Rs. 50 crore in its share capital, by way of contribution from t h e Reserve Bank of India. The request was agreed to after t h e Government of India issued t h e notification, increasing the authorised capital of NHB fiom Rs.300 crore to Rs.350 crore.
National Housing Bank was sanctioned long-term assistance of Rr. 700 crore out of NHC(LT0) Fund at an interest rate of 8.0 per cent per annum For a period of 20 years.

Report on Trend and Progress of Banking in India, 19%-97
5. Cnfrrdnrdutt Development Flwue Company
4.30 It is being increasingly realized that bottlenecks in infrastructure are emerging as the major hindrance of economic growth. To provide impetus t o infrastructure development, a public limited company under the Companies Act, 195G, named the lnfTastruct&e Development Finance Company (IDFC Ltd.) was established on January 30, 1997, a t Chennai. IDFC received its certificate for commencement of business effective February 13, 1997.
Shareholdlng Pattern
4.31 The authorized capital base of IDFC totalling Rs.5,000 crore comprises of equity capital worth Rs.4,000 crore and unclassified shares aggregating Rs. 1,000 crore. The company initially plans to raise Rs. 1,000 crore as equity capital. The broad structure of shareholding is expected to consist of (i) Government of India and the Reserve Bank,
4.32 The approval of the Central Board of Directors of the Reserve Bank has been obtained in August 1997 authorizing the Reserve Bank to make a contribution of Rs.350 crore towards sub-ordinated debt of IDFC. Accordingly, the Reserve Bank has contributed a sum of Rs. 150 crore towards t h e equity of IDFC Ltd. and a further sum of Rs.350 crore by way of subordinated debt of the company.
4.33 The focus of IDFC would b e to develop expertise in infrastructure financing of five core sectors - power, telecom, ports, roads and urban infrastructure. Towards attaining this objective IDFC plans to ( i ) augment t h e availability of debt and equity funds for infrastructure projects through provision of financial products, (ii) play a proactive, policy- oriented role by interacting with t h e Government, sponsors and other agencies involved in infrastructure development, (iii) broaden t h e spectrum for mobilizing infrastructure finance by tapping both domestic and overseas funds, (iv) act as a source of incremental finance for financial entities
(ii) domestic institutional investors, including involved in infrastructure financing through Fls and. (iii) overseas institutional investors and various mechanisms v k , co-financing, financial multilateral agencies. guarantees, etc. (Box N.2).

BOX N.2 : MODES OF INFRASTRUCTURE FINANCING
Provision of efRdent infrastructure servlces Is lncreaslngly ncognired as a slne qua non of hlgtr and sustainable economic growth. So far, the provision of infrastructure services in India Is largely In the C o v u n m t sector. Budgetary alloation has been the principal source of flnandng capacity additions h Infrastructure. However, with the burgeoning gap between the demand for and supply of Infrast~cture fadUtles in lndla and as budgetary resources to support capacity additions have become scarce, development and fiMRdng of ifi-re sector has been progressively opened up to prhrate/Foreign partidpatlon.
The Expert Group on the Commerdalisation of Infrastructure Projects (Chalrrnan: Dr. Rakesh Mohan), in its report submitted in June 1996, has argued that the total fund requirement of the Infrastructure sector over the next five years is expected to be of the order of Rs. 4,000-4,500 billion. With a major chunk (of about 85 per cent) of the requirements Wing expected to be financed by domestic savings, the balance has to come through innovative approaches to financing of infrastructure projects. Given the long gestatton pedods, the lumphress of infrastructure projects and the relatively high risks assocfated with these projects, various equitaMe fisk-shad~ arrangements in the financing of infrastructure projects can be visualtsed. These can be broadly classified as (I) Concession Approach and, (11) Structured Financing Option.
(4 The Concession Approach In the concession approach, the concessionaire builds the project which Is thereafter granted a franchise
period during which the costs and returns can be recovered. There are various modes of flnandng under thls option, V~Z,
(1) BC?T - Build, Operate and Transfer : The most innovative optlon Is the proposed Rs. 7 crore toll road revenue bands issue, the first of its kind in India by Madhya Pradesh Tolb Ltd. (MPTL) tr, h d Indlh's first private sector road project. MFTL is jointly promoted by Infrastructure Leasing and nnanclal Servlces (IL & .
. r ' FS) and the Nadhya Fradesh State Industrial Dwelopment Carporation (MEIDC).
(u) BOLT - Bugd, Operate, Lease and Transfer : The "Own Your Wagonw scheme, currently In operation In the Indian RalIways, is a variant of BOLT under which a set of wagons, purchased by m a t e partles, is leased to the Wways on fixed rental.
(111) M)i(n - W, Own, Operate and Ttanskr : Th* Rs.4,860 more deyated llgM mH Zrmsit system (ELRE) in Bangdore b ta be nm on a BOOT basis aver a Wyear u>ncesh period', , 9
(hr) BOO - Bdki, Own and Operate : Paradip Port Trust has signed an agreement to construct a Ws.1,W crore floating dry-dcxk at Paradip in Orlissa in collaboration with Standfield of Scotland on a BOO basis.
(vf BOOS - Build, Own, Operate and Sell : These forms of prlvate sponsor partidpation are often much better vis-a-vis traditional Bnancing options, both with regard to nlsk reduction a s well as equitable distfibution of risks. - * - -. -- * - - . w * --
7 'E db I - - . * C - A * . .* (U) ~ r e d R ~ a n c l n g ~ n
Limited reuwrse ihmdng. (I) Non-nacmme fbmdng o Under this option, the debt h.lstrurn&t L S Q X ; ~ by &e d-W ~W
by the project or the coIWeral value of the spe&ied assets fiwmcfd by the 1nstrtYmerrt. In the event d default on the s m n r d instrument, the debt holders' remum wouSd be 1 only and would not txtend to general resenrcs and assets ofthe ca'~kpW.
r first example of S f 0 In Id i a IrrvoIvlng LhFX Hume IndusUe (MaQayStal, ' (MOST) and fvhharashtra Ccwwnancnt.
1 l(t1) Lbml(ad moune ChwuMlng t Undcr this variant, In additlon to profect assetre attaches other a s e t s / m n ~ For JMlWng the instrument to a lenders have llmftcd re?uwrsc to tha assets ofa company s p a d n g a ~ o f t h e m e Z h o d s I s t o ~ e a k a ~ P U l p c n i K V ~ Q S W ) h r h p ~ . S W s h c r v e t t l e ?
bcneflt of spreading the risks arnong Iike-mindod investon. l i k b ~ @ ~ T t m Nigam La. (MFR;IL) and VIM samhar NIP LM. OJSNL) - ttx domeic mi internatid sewice provMur - ape lmtamms in point. Recently, a SW - the IWda Toll W I g e Ccrmpany Umikd (NTBL) h a ~ k t a ~ u g i n c o n n c e # o n ~ t h o t t ~ O f t h e D e l h i - ~ b r i d g c ~ - f . ' , - . - . ;
a In &ter w. I n m m qul ty stmcturlng aften lnvohres G ~ ~ Y w I VdbWcls (CPV). GI% utn ptck up aqulty ev&n In W c sewllcles ~ 4 t h a difk:mt set of pmtmrs.
a .CH.+W fiUIIIJY tfC) is am>Cher hternatlonalty pwvaknt RRandng opthsn for infr-re projects. thls b a whereby a FG company lends Its hlgh cndlt ratlrrg to a dcbt instrument In

Report on Trend and Progress of Banking Iri India, 19%-97
rcturn for a fee (premium). Thus, an FG enablas the h e r of debt to obtaln a credit rating higher than wwld have ken possible on a stand-alone basis. Wlth higher credit ranng, the issuer gets the
. bendlts of lower interest cost and easier marketability due to the Impwed safety perception of the F * -- instrument.
Two kinds of flnamlai Instruments. currently in use in developed countries like U.S.A are Asset-Backed kcurltisatlon (ABS) and Munldpal Bonds :
Asse-brcked Securlttsrlton (ABS) involves conversion c;f loans or receivables of companies into marketable securities. They are secured by the underlying dssets and cany a van'ety of credit
tU w e mhmcements. The essence of the process is that assets of high quality are transferred from their orlglnator to an insolvency remote vehlcle, which raises the funds to purchase the assets on the
sb'zstrength of the quality d the assets. q:. I f
- ILL ' The concept of ABS originated in t h e USA in the early 1980s. It is becoming popular in other countries
dso as an innovative means of raislng funds. In India, the flrst securitisation deal was done in 1991 with the securitisatlon of auto hire-purchase receivables and since then, a number of institutions have evinced interest in ABS. The growlng sophistlcaHon of financial markets is expected to lead to an i n c r e d demand For such Instruments. *
Under ABS, the originator secutitlses a portfolio of assets by selling them to a SW. The SW, in turn, raises funds from the Investors. The funds are then passed on to the originator in payment for the portfoiio. Payments by S W to investors are funded by cash flows from the underlying assets during the life of the transaction. The assets themselves wlll be the security for investments but will generally continue to be managed by the orlglnator who would charge a management fix lor the purpose. *.
L~~ ' , Mddpd Bonds, the other instrument eligible for bond insurance, are raised by rn~nici~al'bodies or I d governments for financing core urban infrastructure facilities like drinking water, sanitary systems, roads, bridges, hlghways, airways, hospitals, etc. The Municipal Bond Market was born in the US in the 1970s when the burden of financing certain lnfsastructure projects was transferred from federal to local governmenfs. This led to municipal bodies turning to the capital market to meet their flnanclng requirements. -
Munklpni Bonds arc of two kinds :
General Obligation Bond : These are secured by the full fafth and credit of the Issuer, which in turn is derived from the taxing powers and revenue generating capabilities of the issuing authority. Revenue Bond : This is project-spedflc and is secured by the revenue streams ( w r fees or senrice charges paid by users) of the urban infrastructure facility it finances, as for Instance, the tolls collected from a
Ew - t w aFw- "Irk - - highway.
CmA m' c I A 4s-4 , Several other methods of external financing, vtz., coIWera&l b d h g (apjdiabie when 'the investment
concessionaire has external accounts), iwestmerrt hwrmnce (from either private market or from official insurers) are also available.
Prospective i - m e develupment in India, it is widely agreed, MU Ifwoke increased public-private cdlaboration, a decIsk m o v m t away from budgetary modes of financing with a conxquent emphasis on cmwmraI&atioa 'lbe &taming of physical inlrastmcture has several unique d m that me& spsdalised treammt. TypkAty, i m e projecb have a 2-3 years cons- period, a gestatton perlod of between
on tcerms c o m m r a t e with the typical long gestaUon and rw-ng rmore, mat projects generate only local currency revenues, which are suxcptibk
to regulatory and other influences. Last, but not the least, infrastwchre projects are subject to forrrlderable project impimmWon risks (inclucllng enlyironmental aim) quite diptknct from the business rbks (e.g., AMndal risks, operating dsks, demand risks, etc.). Thus any fiMndng plan fw infrastructure needs to attempt a separation of project implementation risks from business risks. Besides. for s w a s h ~ l comrner~t ion of infrastructure projects, there has to be an appropriate demarcation and allocation of rtsks among varkKts stakeholders in the proJect on the basis of &lib and competence of eadt party to bear the risk. Innovative and ctiv- f b n d n g techniques should take care of such optimal risk &location. , + h j - A . * - * Rekences - it-? .
Government of India (1 9 W , The lndla M-ic Report - fWky bnp- kw C2vwth and -,d- . - . Is1 PuWkaHons (1 %I. lhc 6 p i L ; d CbWe to Asset Sccurftlsatlw, in AJa, Hong Kong. - 4 v WorM Bank ( 1 9941, World D e v w t fZcport, Wwhhgton D.C.: O M U- Press. , *- ' * Word Institute for DNcIopmmt Ecmmla lbearch (1991 ), Wate invesm#v~t In M-: Fhc tapltal, Study Group Serks Mo. 6. HetsJnki: UnOted Nattom Uniwmlty. &Wry
- -

Flnandal Ins titutlons
i 1 .Table IV.5 : Amounrs mowlsea ~y munu
Mutual Funds 1991 -92 1992-93 1993-94 1994-95 1995-96 # 199697 #
I. Subsidiaries of Banks (1 to 6) 1. SBI MF 2. Canbank MF 3, Indian Bank MF 4. BOI MF 5. PNBMF 6. BOB MF
11. Subsidiaries of Public- Sector Fls (1 to 3) 1 . GIC MF 2. LIC MF 3. IDBl MF
Ill. Unit Trust of India
197.49 370.77 227.23 3 19.68 64.88 1 1.37 229.60 389.20 1 1.38 08.97 116.51 169.25 - - - 187.64 53.42 -
8,685.40 11.057.00 9,297.00 8,611.00 -6,314.00 -3,043.00 (a)
IV. Private Sector MFs - - 1,559.52 1,321.59 181.79 558.28
Total (I+ll+III+N)
# Data we provisional. ;O) ~ - e n k i e d schemes.
(a) Exdude re-investment sates of Rs.7 f 4 crore.
Notcs : 1. Data f o r U11 are net sales with premium. 2. Data for 1991 -92 pertain to the perIod July-fune.
Y 3. Uata exdude amounts mobilised by off-shore funds. . -
Source ; Respe%ve Mutual Fund. - m - H - - - - -- e -5 a m - + .
6. Mutual Funds
New Guidelines b r Mutual Funds
4.34 The Securities and Exchange Board of lndia (SEBI) announced new mutual fund regulations in December 19% replacjng those of 1993. Under the amended regulations, the mutual funds have been allowed to launch specialized schemes in real estate, property, money market instruments and various debt instruments. It also stipulates certain investment valuation norms and accounting practices for the mutual fund schemes.
4.35 The new norms have given considerable flexibility not only in terms of greater freedom and manoeuvrability, but also by rtlpulatlng better disclosures and service
L
standards. At the same time, the scheme of Money Market Mutual Funds (MMMFs) has been made more attractive to investors, by reducing the minimum lock-in period from 46 days to 30 days, effective July 1996. On January 30, 1997, the SEBl Board allowed mutl~al funds to mention indicative returns for regular income schemes with certain disclosure concerning to payment capacity. In its Monetary and Credit Policy of October 1997, t h e Reserve Bank allowed SEBl registered mutual funds to invest in t h e overseas markets subject to certain ceilings. Further, with a view to making the schemes of MMMFs more flexible, the MMMFs were permitted to invest in rated corporate bonds and debentures with a residual maturity of upto one year. Table IV.5 gives the total

Report on T m d and Progmss of Banking In Indla, 1996-97
amount m o b l l i d by various mutual funds from 1 99 1 -92 to 1 996-97 (Chart IV. 3).
T w of MuW Fund Schemes In @eradm
4.36 The growth of mutual funds in lndia has been characterized by the prekrence of fund managers for close-ended schemes. These funds provide liquidity through listing on a recognized stock exchange, more often through a repurchase option after a minimum lock-in period. Open-ended funds, on the other hand, provide liquidity through the continuing facility of buy-back and resale of their units. In terms of their portfolio mix, the extant schemes can be categorized as income schemes, growth schemes, income and growth schemes and tax savings schemes; bulk of t h e schemes being income, growth or income and growth schemes.
New Mutual Fund Schems
4.37 Seven new mutual funds in the private sector launched their maiden schemes during 1996-97 (April-March). With this, the total number of mutual funds (including UTI) stood at 32 as on March 3 1 , 1997. During 1996-97, 24 new schemes were floated by all the mutual funds (excluding UTI) taken together. Out of these, the scheme floated by Kothari Pioneer was t h e first money market mutual fund account scheme launched in India. Two more money market mutual fund schemes were launched subsequently by the Un and lDB1 in April 1997 and June 1997, respectively. With the opening up of t h e Indian debt market to breign investors in June 1997, UTI launched the first offshore debt fund - the India Debt Fund.
Asset Management Committees (AM&) by Unjt Tmst of lndia
4.38 An important development during t h e year was the setting up of Asset Management Committees (AMCs) by UTI viz., Asset Management Committee for the Unit Scheme 1964, Asset Management Committee for Domest ic Equity Schemes a n d Asset M a n a g e m e n t Commit tee for Domestic
income/Debt Scheme. The AMG wili review the investment operations and the risk-return performance of t h e various schemes under its purview. It wili also ensure adherence to the UTi Act, SEBl (Mutual Funds) Guidelines, exposure and asset quality norms and commitments made in the Offer Documents. Each AMC would meet a t least once in two months and review each scheme under its purview a t least once every three months. The AMCs would make such recommendat ions t o t h e Executive Committee/Board of trustees as it may consider necessary.
4.39 The performance of t h e mutual fund industry continued to be subdued. Signs of marginal improvement were discernible in t h e latter half of 1996-97. During 1996-97, t h e funds mobilized by public sector mutual funds (other than UTI) moved down to Rs.174.1 crore from RE.348.1 crore in 1995-96. Private sector mutual funds, on the other hand, improved on their mobilization to Rs.558.3 crore in 1996-97 from Rs. 1 8 1.8 crore in the previous year (Appendix Table N.5). However, the resource mobilization by UTI remained negative in 1996-97 and repurchases of its units exceeded sales value by Rs.3,043 crore on top of a negative mobilization of Rs.6,3 1 4 crore in 1995-96. The available information on seven tax saving schemes (excluding UTI) launched during 1-6-97 indicated that only Rs. 27.1 crore was mobilised under these schemes. It may be mentioned in this context that mutual funds in other countries, notably the U.S have garnered savings of the order of US $2 trillion after having passed through crises of confidence in the mid eighties.
4.40 Non-Banking Financial Companies (NBFCs) undertake a wide spectrum of financial activities ranging from hire purchase and leasing to pure investments. There are broadly eight types of NBFCs (i) equipment leasing companies; ( i i ) hire pu rchase finance companies ; ( i l i ) loan companies; ( iv) investment companies; (v) mutual benefit

financial -Panis (Nidhis); (vi) m i s c ; c l l m on the .mptu~e d dwb Md rrhw non-banking companies (Chit fvnds): (vii) ma-. in pvunac d me powrn a- residuaV non-banking canpanis and, (viii) under RBI Act, 1934, d i m - housing fimnce c o m ~ i a . m e regulated and by me m k h 1966 to Nan- total deposits3 of the 10,194 reporting NBFa ~~m n m u hpanb ~d -- were Rs. 459439.2 crore and k. 1.08.434.3 N o n - n n d d -panles (NBNO) rdung to crore respectively during 1995-96. The #e q m d w b and govemlr\g mr growing importance of NBFG in the overall period, quantum, rate d Interest, in 1973, level of financial assets in the economy is directions were i s d to mallan- ~ a - evident from Chart lv-4- The share of non- Banking Companies (conducting chits and bank deposits (NBD) (in gross finandal assets related business) ar well. Subuquenny. in of household sector) has 1975, NBNFCs were witnessed a significant exempted from the increase from 3.8 per application of the cent in 1989-90 to 13.8 ~oumhold Sector -- ~2 ?~ '3 - Reserve Bank directions per cent in 1995-96. - .- and Instead, were Non- banking companies , $ 8 g 9 ~ brought under the have been performing a regulatory ambit of the vital function in lWomg1 Department of sav i ngs- investment Company Affdrs (DCA). i n t e r m e d i a t i o n , particularly in areas 1W2-93 I d ~ ~ o f where established LegWafWe Framework
1993-94 financial entities are still Prlw to the 1997
not accessible t o Amendment
borrowers at large. 395-96
4.42 The provisions
RqpIetlon of NBFCr of Chapter I11 B of the 1996-97 RBI Act, 1934 conferred
4.41 The scheme of 0 5 10 15 20 25 30 35 40 very limited powers in
regulation of the deposit - Bank Nan-Bank pl Shares & the Reserve Bank. The
acceptance activities of sits neposits Debentures legislative intent was t h e Non-Banking
Y aimed at moderating
Companies was conceived in the sixties not the deposit mobilization of NBFCs and thereby only as a supplement to t h e Monetary and to provide an indirect ~ro-tion to depositors Credit policy but also to provide an indirect by linking the quantum of deposit acceptance protection to the depositors. Accordingly, the to Net Owned Fund4- Thus, the directions were Reserve Bank was vested with certain powers restricted to the liability-side and that too9 to effectively supenrise, control and regulate solely to deposit acceptance activities. It did t h e deposit acceptance activities of these not extend to the assetmside of the "lance institutions. he k u s of the regulation was sheets of NBFCs. Several ex~em/working
. C * ' - .. r - A - 5 - 8 -
In the context d NIKCI, the twn 'deposit' is used to indicakA& c ~ $ d ~ t s E& the public, but also debentures and attw dcbt instruments. IkguIakd deposits denotes deposits whkh is subjected to certain : cdIlngP and o t h e r regulatory restrktfonzi. These Mude, for instance, nonmrt lb le debentures. deposits nctived from shanhddm. Inter-cofpofate deposits etc.
!
, Net Owned Fund ts the i(ggcedc of th pald-up capital .nd (Rc r c s e m s , reduced by the amount d acamukW af kxrs, deferred revenue expenditure and other intangible ~SK~S, if any, and further rsduccd by invcsrmnl, h rhvcr and loM and advances to subridkrles, ampanla In the sama group and other NBEb in mars of 10 per cmt of owned fund.

&port on Trend and Progress: of Banking in India. 1996-97
groups which (hereafter examined the functioning of NBFCs were unanimous about the inadequacy of the legislative framework and recommended for introduction aF suitable legislation not only for ensuring sound and healthy functioning of NBFCs, but also to safeguard the Interests of depositors.
Recom~~~c~~cicl tio17s of Shah Worldng Group
4.43 In the light of these developments, the Reserve Bank appointed in 1992 a Working Croup on Financial Companies (Chairman: Dr. A.C. Shah) to make an In-depth study of the role of NBFCs and to suggest regulatory and control measures to ensure healthy growth of these companies. The Worlting Group, in its report submitted in September 1992, made wide-ranging recommendations for ensuring the functioning of NBFCs on sound lines. Accordingly, the Reserve Bank initiated a series of measures, including, (i) the widening of the definition of regulated deposits to include inter-corporate deposits, deposits from shareholders and directors and borrowings by issue of debentures secured by immovable property, (ii) the introduction of a scheme of registration of NBFCs having Net Owned Fund of Rs. 50 lakh and above, (iii) the issuance of guidelines on prudential norms so as to regulate the asset side of the balance sheet of the NBFCs. These measures relating to the registration and prudential norms could not be given statutory backing a t that time since the provisions of the Reserve Bank of lndia Act, 1934, did not confer it with adequate powers to make them mandatory.
Amendments to the Reserve Bank of lndia Act, 1934
4.44 An Ordinance was issued by the Government in January 1997 effecting comprehensive changes in the provisions of the RBI Act, 1934. This was subsequently replaced by the Reserve Bank of India (Amendment) Act, 1997. The salient features of the amended provisions, based on the recommendations of the Shah Committee,
pertained to the entry point norm of Rs.25 lakh as minimum Net Owned Fund (NOF), (wMch can be raised to Rs.2 crore by the Reserve Bank), compulsory registration with the Bank, maintenance of certain percentage of liquid assets in the form of unencumbered approved securities, creation of reserve Klnd and transfer thereto every year an amount not less than 20.0 per cent of the net profit, determination of policy and issuing of directions by the Bank on prucfentiat norms, ,
prohibition of NBFCs from accepting deposits and file winding up petitions for vidation of directions. Unincorporated bodies have been prohibited from issuing any advertisements for soliciting deposits. The Company Law Board has been empowered t o direct a defaulting NBFC to repay any deposits. Stringent penal provisions have also been included empowering the Bank to impose, inter alia, pecuniary penalty for violation of the provisions of RBI Act.
4.45 Insurance companies, stock brolting companies and stock exchange companies have been granted exemptions h-om certain provisions of the amended Act. Nidhi companies and Chit Fund Companies have also been exempted from certain core stipulations including maintenance of percentage of assets and reserve fund.
4.46 In May 1997, certain malpractices pertaining to a non-banking financial company came t o light. This consequently raised a number of questions including the ones of extending deposit insurance to them and of bringing abou t s t ronger supervisory mechanisms on the NBFCs (Box 1V.3). The Reserve Bank took p r o m p t correct ive measures and the financial sector was resilient enough to withstand it. Such irregularities having systemic ramifications occur in market economies, developed as well as emerging countries every now and then (Box IV.4). In the interest of maintaining financial stability, such problems n e e d t o b e a d d r e s s e d expeditiously so that their adverse impact on the financial system would be mlnimised.

Financjal institutions 93
BOX IV.3 : DEPOSIT INSURANCE
Deposit insurance, as an investor compensation scheme (ICS), guarantees t h e nominal value and iiquidity of deposits upto a certain size. It helps to establish confidence in the safety of saving with flnandal intermediaries. The insurer is an institution, generally government-owned, established for that purpose and funded with premla paid by the institutions whose deposits are insured. Deposit insurance are targeted prlndpaliy at small, unsophisticated depositors who are least able to assess the soundness of a particular financial Intermediary. Table A gives a n idea of the type of investor protection fo r bank-insurance schemes being offered In some of the major countries.
Table A : Deposit Insurance In Selected CounMes 1
90 per cent of protected deposits, up to maximum of 20,000 pounds
Up to 30 per cent of a bank's liable
the Diamond and Dybvig's (1 983) influentlal
, especially those
leaders to act efficient1 attributed partially t o g
could be ensured through
bank failure.
insurance or requiring banks to have would be ineffective in changlng bank
The owner of a deposit faces a very low cost of withdrawal, even a small chance of a loss a n cause a run
Country Level of protection (maximum per depositor)
US Dollar Equivalent
Voluntary or compulsory membership

Report on Trend and Progress of Banking in India, 1996-97
of the fractlon of uninsured deposits Is large. In addition, the government would have had a hard time attending to uninsured clalms of large banks. Explicltiy insuring such deposlts can reduce the cost of a run. However, requiring banks to issue some minimum quantity of uninsured claims may be a good idea, but the requirement Ought to be to Issue long-term claims, such as equity or long-term debt.
ICS has never redly got to grips with the 'moral hazard' problem because the riskiness of particular types of buslness has never been adequately linked with contributions to the compensation fund. This problem could be corrected to some extent by depositor discipline and regulatory discipline. Under the former, banks that took excessive rlsk in their asset portfolio or used too little equity would face market discipline from higher interest rates required by depositors. Under regulatory discipline, after proper measurement of bank risk, regulatory authorities could implement rlsk based insurance pricing. Another approach is to impose risk based capital requirements. Such requirements would raise the cost of risk taking to banks, although their success depends on the abillty to assess properly bank risk exposures. Both risk-based deposit insurance and capital requirements could greatly benefit from the use of market value accounting. The issue of credibility of deposit insurance is very important. Deposit Insurance, If doubted, may not be able to preempt the possibility of a run. Privately provided lnsurance have not been credible sources of confidence to depositors.
In India deposit insurance was introduced in 1962 with the creation of Deposit lnsurance Corporation (DIC) after the aftermath of the collapse of Palai Central Bank in 1960. Later DIC took over the function of Credit Ghwtntee Corporation and was renamed Deposit Insurance and Credit Guarantee Corporation (DICGC). In India DICGC offer deposit and credit guarantee only to the banking system (leaving 10 co-operative banks in Stapes which have not passed the necessary legislation). While deposit insurance is compulsory, credit guarantee is voluntary in nature. In India, the maximum deposit insurance ceiling is Rs.1 lakh. The premium charged on deposit insurance Is 5 paise per annum per Rs. 100 on a half-yearly basis.
The U.S. was one of the countries which introduced deposit insurance following the collapse of banks in ' the 1930s. In U.S. banks pay for deposit insurance contracts, while in countries such as Australia, the insurance
subsidy is paid by the Reserve Bank of Australia. In U.K. deposits accepted by finance companies are covered by deposit insurance. The deposit protection fund under the U.K. Banking Act, 1987, provides partial protection for sterling deposits with the U.K. offices to only 'authorised institutions' and that too in a situation where self-regulatory organisatlon of the finance companies enforcing a code of conduct among members is in existence. All 'authorised institutions' are liable to contribute to the sterling deposit protection fund, whether or not they accept sterling deposits. The Deposit .Protection Board, comprising representatives from both the Bank of England and other contributory Institutions, manages the fund. Monies constituting the fund are placed by the Board in an account with the Bank of England for investment in treasury bills. A depositor other than an authorised institution, is protected to a maximum of 20,000 pounds in respect of the principal amounts of sterling deposits made with the U.K. offices of an institution, excluding secured deposits and deposits with an original maturity of more than five years. If the institution becomes Insolvent, the depositor is liable to be paid out of the fund an amount equal
to 75 per cent of this 'protected' deposits, i.e., a maximum amount of 15,000 pounds per depositor. '
References :
Anderton B. (ed.), (1 995) Current issues in Financial Services, ffoundmllls: Macmillan.
Diamond. D.W. and Dybvig, P.H. (1983) 'Bank Runs. Deposit lnsurance and Liquidity', Journal oFPoliNca/ Economy, 91,401-19.
Diamond. D. W. and. Dybvig. P. H. (19%) 'Banking theory, Deposit lnsurance and Bank Regulation' in Lewis, M. K . (ed.), 'Flnandal Intermediaries ', Vermont : Edward.
Kane. E. ( 1989) 'The 5. d L. insurance Mess: How could it Happen?', Washington D.C.: The Urban Instilute.
Rose. f? S.. Kolari. I. W. and Fraser, D. R (1993) Financial institutions, Understanding and Managing Rnmcial Services, Boston: Itwin.
World Bank (1 989) World Development Report, Washington D.C.: Oxford University Press.

BOX lV.4 : FINANCIAL FRAUDS AND BANKlNG lNSTABlLITY
The most infamous cases of bank failures have been associated with kauds. Early cases of such kauds such as Branco Ambrasiano (Italy. 1982). Johnson Matthey (U.K., 1384) seem trivial compard to the spectacular closure of the U.K. Bank of Credit and Commerce lnternatlonal (BCCI) in 1991. where mismanagement )eWrond the banking system and inflicted losses to the tune of US $ 5-10 billion. Even in sound markets like jhpnn, -5
of forged deposit certificates have caused large losses to the smaller trust banks. Some impoemt episodes of frauds over the last decade are discussed.
1. BCCI episode: The closure of the Bank of Credit and Commerce International (BCCI) has been one of the biggest episode of banking frauds. Despite rapid expansion in the 1970s and 1980s, BCCl had a controversial
ed at US $ 600 mn were uncovered. A t this point, the Bank of England ordered Price out an enquiry into BCCl's affairs. In June 1 9 9 1 , the Price Waterhouse Report led
on to close BCCI. On July 5, 1991. regulators across several countries including the
ings PLC was t h e oldest merchant bank
of the price. However, as more an trades inflicted losses to the tune
4. Credtt Lyonnnls : Credit Lyonnais
directly and pumped in more money wh
1991, ~ooc ly ' s downgraded US $6.9 bill1
the estimated losses fr

98 Report on Trend and Progress of Banking In Indla, 1996-97
shocks, the balance sheets of banks would be considerably weakened since banks' assets are composed mainly of loans to domestic flrms. Likewise, with debts of most dweloping countries belng denominated in Foreign currency, a devaluation of the domestic currency often gives Be to increased indebtedness. With unchanged N Y t value. the asset-liability profile would get distorted in Favour of the latter. The resultant deterioration in banks* equlty capltaJ thereby increases the possiblllty of bank failures. With erosion in equity upital, b a n b often fall to meet capital standards. so that they are compelled to cut down on their lending till such time that they can meet the ~dpltal adequacy norms. We& balance sheets can also arise because the supervisory and regulatory frameworks are not mature enough to restrain excessive risk-taking on the part of the banks. The recent speculatlve attacks on the Thai baht wherein many banks and finance companies were forced $0 insolvency is a case in point. Such speculatlve attacks often gives rise to the 'tequila e k t ' - t h e possibility of panics in countries with poor lundarnentds, whlch, In turn, becomes self-fulfilling.
Two distinct theories have developed to explain the origin of banking panics. The first line of argument, pioneered by Diamond and Dybvlg (1983) stresses the fact that bank contracts, while optimal, might lead t o costly panlcs. The model argues that llquldlty demands of depositors are uncertain. Given that banks assets are relatively less liquld than their Iiabllltles, an equilibrium outcome might emerge wherein depositors withdraw
for government intervention In the form of deposit insurance. tradition have justlfled the usefulness for other policies such as in The other llne of reasoning focuses on the asymmetric lnformatlon other words, with Informational asymmetries, depositors might fl banks. A panic, in such a situation, acts as a monitoring device. If
In the case of India, a number of measure
lance between
Lesxlns from INS', -
Bank for International Settlements 4 1997) The Annual Report, Basle, Switzerland,

Finandal Institutions
Amendnlent lo NBFC (Reserve U a r ~ h ) Directions, 1 977
4.47 Consequent o n the amendment to RBI Act, the liquidity requirement for the NBFCs has been enhanced. Accordingly, loan and investment companies which are presently maintaining liquid assets at 5.0 per cent will be required to maintain 7.5 per cent and 10.0 per cent of their deposits in Government and other approved securities, effective January 1 and April 1, 1998, respectively. For other NBFCs, t h e percentage of assets to be maintained by them as statutory reserves has been increased to 12.5 per cent and 15.0 per cent of their deposits, respectively, effective from the above mentioned dates. Besides, with a view to ensuring that NBFCs can have recourse to such liquid assets in times of emergency, the safe custody of these assets with designated commercial banks has also been prescribed.
Prudential Regulat i~~? and Capital Adequacy Stipulations
4.48 The registered N B F G were required to achieve a minimum capital adequacy norm of 6.0 per cent of their risk-weighted assets by March 3 1, 1995 and 8.0 per cent by March 31, 1996. Keeping in mind the risk profile of NBFCs, the capital adequacy ratio is being proposed to be raised in a phased manner to 10.0 per cent and 12.0 per cent to be achieved by end-March 1 998 and 1999, respectively.
New Guidelit~es for NBFCs
4.49 The Reserve Bank has been entrusted with enhanced powers under the amended legislative framework t o ensure sound functioning of NBFCs. Under the compulsory registration system envisaged as per the amended Act, around 37,500 NBFCs have applied for Certificate of Registration out of which around 9,000 have been found having t h e threshold limit of NOF of Rs. 25 lalh and above. The task of issuing Certificate of Registration is being attended to on a war footing. In terms of t h e provisions of the Act, t h e NBFCs are required to satisfy certain conditions including, (i) the wherewithal to pay its depositors as and when their claims
accrue and its affairs are being conducted in a satisfactory manner, (ii) the management is not prejudicial to the interest of the depositors/public, and, (iii) adequate reserve of capital and earning prospects. To facilitate closer and continuous monitoring of NBFCs, the Reserve Bank has opened 12 additional offices, making a total of 16 offices all over the country . Supervisory Frarneworl< for NBFCs
4.50 A new three-tier supervisory framework has been put in place by the Reserve Bank for monitoring of NBFCs. The nature and extent of supervision of NBFCs, prepared in the backdrop of the provisions of the RBI (Amendment) Act, 1997, and the recommendations of the Khanna Committee (1 995), would be based on three criteria vfz., ( i ) the size of a NBFC, (ii) the type of activity performed, and, ( i i i ) t h e acceptance or otherwise of public deposits. To th i s end, a comprehensive supervisory model based on CAMELS (Capital Adequacy, Asset Qualfty, Management, Earnings, Liquidity and Systems) has been designed. The CAMELS approach re-orients the on-site inspection process towards examining intensively the assets of NBFCs, besides their liabilities. The methodology for conducting on-site inspection under the revised model has already been manualised. Further, a suitable off-site reporting system with emphasis on profitability and balance sheet related parameters has been introduced to exercise intensified surveillance over the NBFCs having assets of Rs. 100 crore and above. Steps have been initiated to resort to extensive use of information technology for scrutiny of all off-site returns to reduce the degree of dependence o n on-site inspection process. However, NBFG whose off-site monitoring throws up signals of unsound financial position would be subject to on-site inspection at periodic intervals. The main focus of the on-site inspection would be towards examination of asset quality, besides adherence to the regulatory stipulations. Apart from these, external auditors will be used as special vehicles : they will be asked to certifL important returns of MBFCs.

Report on Trend and Progress of Banking In Indla, 1996-97
4.51 Ta Impart greater efficacy to this supervisory set-up. representatives of the Reserve Bank and Institute of Chartered Accountants of India (ICAI) have formed a panel to devise a new format of balance sheet to reflect the true position of financial health of NBFCs. As a sequel to this regulatory strengthening, the Department of Supervision (DoS) has been bifurcated into two independent departments wlth effect from July 29, 1997. The Department of Banking Supervision (00s) Is to cater exclusively to supervtslon of banks, the other - Department of Non-Banking Supervision (DNBS), has been entrusted wlth supervision of non-bank financial entitles.
Arr?cr~dr?lcnts to Residuary Non-Bankirlg (Ikserve Bc?r lk) Directions, 1 987
4.52 In order to have greater spread of investment, the Residuary Non-Banking Companies (Reserve Bank) Directions, 1987, was amended on April 30, 1997. This amendment enabled Residuary Non-Banking Companies (RNBG) to invest upto 60.0 per cent of their aggregate deposit liabilities in bonds/ debentures/CommerciaI Paper of a government company, or public sector bank or publjc financial institution or of any corporation constituted by Central/State enactment or in any o ther company incorporated under the Companies Act, 1 956. This is subject to the condition that not more than 10.0 per cent of the aggregate amount of liabilities to the depositors shall be invested in the schemes of the Unit Trust of India. In so far as investment in debentures or bonds or commercial papers of companies incorporated under the Companies Act, 1956 (not being a subsidiary company or holding company or company in the same group) are concerned, it should not be more than 10.0 per cent of the aggregate amount of liabilities to the depositors. Such debentures/bonds should have been rated not less than AA+ (or its equivalent) by any of the four approved credit rating agencies and the commercial papers issued are rated in terms of the directions governing them.
rrcrxd..; in ttlc Crorvd~ of Deposits wit/, Non- Bc~r,1iir7j; Con~pdr~ics Duri t~s the year o?cicd March 3 1 , 1996
4.53 The comparative position of deposits with banks and non-banking companies over the past five years is presented in t h e Appendix Table IV.6. Non-banking companies (NBCs) mobilised fresh deposits to the tune of Rs.46,740.5 crore (18.8 per cent) during 1995-96. As at the end of March 1996, the aggrega te depos i t s of NBCs s t o o d a t Rs.2,95,344.5 crore. Of this, the deposits of 2,336 non-financial companies accounted for 63.2 per cent (Rs. 1,86,909.2 crore), of which the deposits of 9,060 financial companies [including Housing Finance Companies (HFG)] accounted for 33.8 per cent. The aggregate regulated deposits of NBCs as a t the end of March 1996 was Rs.53,480.3 crore recording an increase of Rs. 16,185.1 crore (43.4 per cent) when compared to the position as a t the end of March 1995. Of the aggregate regulated deposits, the financial companies (including HFG) contributed Rs.38,674.5 crore (72.3 per cent). The aggregate deposits of Residuary and Miscellaneous Non-Banking companies increased by Rs.2,576.4 crore, recording a growth of 42.0 per cent as compared with t h e previous year. The regulated deposits of non-banking companies formed 12.7 per cent of the aggrega te deposits of scheduled commercial banks as at the end of March 1996 as against 9.9 per cent as a t end-March 1 995.
Shere Working Group
4.54 Consequent upon the suggestions made by the Supreme Court in its judgement dated January 4, 1996 in the case relating t o Peerless General Finance and lnvestrnent Company Ltd., t h e Reserve Bank in consultation with the Government set u p a Working Group in September 1996 with Smt.K.S. Shere as Chairperson t o examine the issues relating t o creation of a separate instrumentality for regulation and supervision of RNBCs and other NBFCs. The Report of the Committee submitted to the Reserve Bank on September 1, 1997, has been forwarded to the Government for further consideration.

ANNEXURE
PROGRESS OF FINANCIAL SECTOR REFORMS : 1992-93 TO 1996-97
1. Cash Reserve Ratio (CRR) per cent stipulated from May 3, 1991.
a) Domes tic Deposits 1 993 -94
1992-93
i ) The incremental CRR of 10 per cent, imposed from May 3, 1 991 was discontinued (for any increase in net DTL over the level as on April 17 , 1992) and one-third of impounded cash balances maintained under incremental CRR of 10 per cent between May 3, 1991 and up to the level of April 1 7, 1992
i In order to minimlse the fragmentation of CRR, the concession granted to banks of exempting a part of CDs from the maintenance of CRR was withdrawn, and CDs Issued by banks over t h e pre-May 2, 1992 llmlts equivalent to 5 per cent of the fortnightly average outstanding aggregate deposits In 1989-90, were subjected to CRR from April 17. 1993.
released t o the banks in three equal instalments from October 17, November 14 ii) The average CRR was reduced from and December 1 2, 1992. 15 per cent to 1 4 per cent in two phases i.e.,
14.5 per cent from April 17, 1993 and 14 per i i) Certificate of Deposits (CDs) issued by cent from M~~ 15, 1993. banks over the pre-May 2, 1992 limit, (equivalent to 5 per cent of the fortnightly 1994-95 average outstanding aggregate deposits in 1989-90), were exempted from CRR i In view of the enhanced capital inflows
requirements from April 22, 1992. and consequent increase in net foreign currency assets, the average CRR was
iii) The rate of interest payable on eligible increased from 14 per cent to 15 per cent in ca sh balances based on t h e incremental Net three phases: 14.5 per cent, 14.75 per cent Demand and Time Liabilities (NDTL) over the and 15 per cent from lune 1 1, July 9, and level as on March 23, 1 990 was reduced from August 6, 1994, respectively. 5 per cent to 3 per cent per annum with effect from May 2, 1992. ii) In order to curb volatility due to large
fluctuations in the daily cash balances of banks iv) From October 17, 1992, no interest and also to facilitate orderly conditions in t h e was payable on the increase in eligible cash call/notice money market, effective January balances based on NDTL maintained after 7, 1995, banks were advised to maintain a March 23, 1990 both under the average 15 minimum of 8 5 per cent of the CRR per cent CRR and the incremental CRR of 10 requirement on each of the first 13 days of
All references to bank invariably pertain to scheduled commercial banks excluding Regional Rural Banks (RRBs) unless otherwise speclfled.

Progress of Financial Sector Reforms : 1992-93 to 1996-97
the reporting fortnight. failing which banks would not be paid Interest for thatlthose day/ days even though there was no shortfall in the maintenance of CRR on average basis for the fohnight. On the 14th day of the reporting fortnight, however, banks were allowed to maintain less than 85 per cent of the required cash balances to adjust the average of daily balances to the required level.
I) With a view to avoiding hardships to banks owing to Inte~enlng holidays, effective September 30, 1995, banks were required to maintain a mlnlmum level of 85 per cent of the CRR requlrement from the first working day of the reporting fortnight. Banks were allowed to adjust their cash balances on the last working day of the reporting fortnight to the required level. For this purpose, banls should reckon the holidays with reference to the Centre where they have their principal account for maintenance of CRR.
ii) The average CRR was reduced from 1 5 per cent to 1 4.5 per cent with effect from November 1 1, 1 995.
iii) The average CRR was reduced to 14 per cent effective December 9, 1995.
i) With a view to augmenting the lendable resources of banks, the average CRR was further reduced from 14 per cent to 1 3.5 per cent from April 27, 1996 and further to 13 per cent from May 1 1, 1996.
ii) Effective July 6, 1996, the average CRR was reduced to 12 per cent from 13 per cent earlier.
iii) Consistent with the medium-term objectives of reduction in CRR, the average CRR was reduced by two percentage points from 12 per cent to 10 per cent in four phases of 0.5 percentage points each: 11.5 per cent from October 26, 1996, 1 1 per cent from November 9, 1996, 1 0.5 per cent from January
4, 1997, and 10 per cent from January 18, 1997.
iv) Scheduled State Co-operative Banks (SCBs) and RRBs were required to maintain a minimum average CRR of 3 per cent of the NDTL up to December 1996. They were granted further extension of two years i.e. from January 1 , 1997 to December 3 1 , 1998.
i) With a view to facilitating the development of a more realistic rupee yield curve and term money market, banks were exempted from average CRR on inter-bank liabilities from April 26, 1997.
ii) In accordance with the stance of monetary policy of phased reduction in statutory pre-emption of banks' resources, a two percentage point reduction in average CRR in eight phases of 0.25 per cent each was announced on October 21, 1997: 9.75 per cent from October 25, 1997, 9.50 per cent fiom November 22, 1997,9.25 per cent from December 20, 1997, 9 per cent from January 17, 1998; 8.75 per cent from February 14, 1998; 8.50 per cent from February 28, 1 998, 8.25 per cent from March 14, 1998, and 8 per cent from March 28, 1998. However, reduction envisaged in CRR during the months of February and March 1998 would be contingent on the monetary and price situation at that time.
iii) As part of rationalisation measures, effective October 25, 1997, interest paid by the Reserve Bank o n eligible cash balances maintained under CRR of banks was raised to 4 per cent from the effective rate of interest of 3.5 per cent under the two-tier formula a t present.
) Exter17al Deposits
i In view of the large accrual of deposits under FCNR(B) Scheme as also t h e spreads available under the scheme, deposits under

Progress of Financial Sector Refonns : 1992-93 to 1996-97
FCNR(B) Scheme which were exempted from reserve requirement, were brought under CRR stipulation of 7.5 per cent from October 29, 1994.
ii) Effective January 2 1 , 1995, (a) CRR was raised to 15 per cent on FCNR(B) liabilities, and (b) CRR of 7.5 per cent was stipulated on NR(NR) Deposits.
i From August 19, 1 995, CRR of 7.5 per cent was applied to Euro-Issue proceeds deposited with banks in India.
ii) To enable banks to balance the increase in cost of NRE deposits by increasing the return on the deployment of funds and to market NR(NR) deposits more competitively, effective October 28, 1995, t h e incremental NRE liabilities and NR(NR) liabilities over the level as on October 27, 1 995, were exempted fiom maintenance of average C R .
iii) With a view to making the FCNR(B) Scheme more attractive to banks and to enable them to market it more competitively, effective November 25, 1995, the incremental FCNR(B) liabilities over the level as o n November 24, 1995 were exempted fiom CRR.
iv) With a view to enabling banks to better balance the cost of FCNR(B) deposits and the return on the deployment of their funds, effective December 9, 1995, average CRR on outstanding liabilities under FCNR(B) Scheme as on November 24, 1995 was reduced to 7.5 per cent fiom 15 per cent earlier.
v) Taking into account the cost of raising non-resident deposits by banks and t h e return on deployment of these funds, effective January 6, 1996: (a) all the liabilities under FCNR(B) Scheme up to the level as on November 24, 1995, were exempted from CRR OF 7.5 per cent; (b) all t h e liabilities under NNNR) Scheme up to t h e level as on October 27, 1995 were exempted from CRR of 7.5
per cent; and (c) the CRR on outstanding NRE liabilities as o n October 27, 1995 was reduced to 10 per cent.
i From April 13. 1996, all the liabilities under N U scheme up to the level as on October 27, 1995 were exempted from CRR of 10 per cent.
i) With a view to bringing all liabilities to the public under reserve requirements, effective April 26, 1997, a CRR of 1 0 per cent was imposed on the incremental liabilities under FCNR(B) Accounts Scheme, NRE Accounts Scheme and NR(NR) Accounts Scheme over t h e level outstanding as on April 11. 1997.
2. Statutory Liquidity Ratio (SLR)
a) Domestic Deposits
i) In the context of the moderation of the gross fiscal deficit set out in the Union Budget 1992-93, t h e SLR was frozen at 38.5 per cent of the outstanding domestic NDTL as on April 3, 1992 and lower SLR of 30 per cent was made applicable on increase in domestic NDTL over the level as on April 3, 1992.
ii) The SLR on t h e outstanding domestic NDTL as on April 3, 1992 was reduced from 38.5 per cent to 37.75 per cent in three phases, i.e., 38.25 per cent from t h e fortnight beginning January 9, 38 per cent from February 6 , and 37.75 per cent from March 6, 1993.
i) With the further moderation in the gross fiscal deficit in 1993-94, it was decided to reduce the base level SLR o n domestic NDTL as on April 3, 1992 by one percentage point from 37.75 per cent to 36.75 per cent in four steps of 0.25 percentage point each

h p ? s s of flnmclal Sector Refoms : 1992-93 to 1995-97
with the fortnlght beginning August 21, September 18, October 16, and November 13, 1993. The last two phases of reduction in SLR was superceded by the Reserve Bank's October 1993 Monetary and Credit Policy measures.
ii) With a view to moving towards the medium-term objective of reducing the SLR, effective October 16, 1993, the base date for SLR on domestic NDTL was brought forward from April 3, 1 W2 to September 17, 1993 and SLR was flxed at 34.75 per cent. Further, SLR on incremental domestic NDTL over the level as on September 1 7, 1 993 was reduced from 30 per cent to 25 per cent.
I) A s the need for a high SLR was diminished with progressive move to market related rates of interest on Government borrowing, the base level SLR on domestic NDTL as o n September 1 7, 1 993 was reduced from 34.75 per cent to 34.25 per cent effective August 20, 1994, and further to 33.75 per cent effective September 17, 1994. Besides, the base date For SLR on domestic NDTL was brought forward from September 1 7, 1993 to September 30, 1994, and SLR was flxed at 31.5 per cent effective October 29, 1994. However, SLR on incremental domestic NDTL over the level as on September 30, 1994 was kept unchanged at 25 per cent.
1997-98
i) With a view to facilitating the development of a more realistic rupee yield curve and term money market, banks were exempted from maintenance of SLR on inter- bank liabilities from April 26, 1997.
ii) Effective October 22, 1997, the multiple prescriptions of SLR were withdrawn and SLR was further reduced to 25 per cent which is the statutory minimum requirement
applicable on the entire net liabilities.
b) External Deposits
i) In order to rationaiise overall SLR prescription, SLR on outstanding liabilities under the NRE Scheme was reduced from 30 per cent earlier to 25 per cent with efect from April 13, 1996.
3. Deregulation of Interest Rates
a) Lending Rates
i) A s part of a process of progressive rationalisation of the banks' lending rate structure, effective April 22, 1992, the structure was reduced to four categories of loans: 1) up to and inclusive of Rs.7,500, 2) over Rs.7,500 and up to Rs.25,000, 3) over Rs.25,000 and up to Rs.2 lakh, and 4) over Rs.2 lakh [with a minimum lending rate (MLR)] From the earlier six categories of loans.'
ii) With the abatement of inflationary pressures, the MLR for credit limit of over Rs.2 lakh was reduced from 20 per cent to 19 per cent effective March 2, 1992, to 1 8 per cent effective October 9, 1992 and further to 1 7 per cent effective March 1, 1993.
1993-94
i) Effective April 8, 1993, the lending rate structure was further rationalised from four categories earlier into three categories, based on credit size viz., (1) up to Rs.25,000, (2) over Rs.25,000 up to Rs.2 lakh, and (3) above Rs.2 lakh. Loans above Rs.2 lakh were subject to MLR
ii) As the inflationary situation was under reasonable control during first half of 1993- 94, a) MLR was reduced to 16 per cent effective June 24, 1993 and further to 15 per
Under the structure of lending rates introduced on September 22. 1990, there were six lending rates based on credit size viz., (1 ) up to and inclusive of Rs.7,500, (2) over Rs.7,500 and up to Rs.15,000, (3) over Rs. 15,000 and up to Rs.25,000. (4) over Rs.25,000 and up to Rs.50,000, (5) over Rs.50,000 and up to Rs.2 lakh, and (6) over Rs.2 iakh.

Progress of Financial Sector Rehms : 1992-93 to 1996-97
cent effective September 2, 1993. b) MLR o n term loan of 3 years and above was reduced from 15 per cent to 14 per cent effective March 1, 1994, and c) interest rate on term loans of over Rs.25.000 and up to Rs.2 lakh was reduced from 15 per cent to 14 per cent effective March 1 , 1 994.
i) Effective October 18, 1994, a) MLR for credit limits of over Rs. 2 lakh was abolished and banks were free to fix their own Prime Lending Rates (PLR) which would b e the minimum rate charged by banks for credit limits of over Rs.2 lakh uniformly at all branches; b) however, with a view to protecting small borrowers i.e. for loans up to Rs.2 lakhs, the interest rates on t h e first two slabs continued to be administered. The lending rate for credit limits of up to Rs.25,000 was retained at 12 per cent, and the rate for credit limits of over b.25,000 and up to Rs.2 lal& for all advances (including term loans) was prescribed at 13.5 per cent per annum; and c) the stipulation of effective interest rate on bill discounting for borrowers of over Rs.2 lakh, which was a t one percentage point below the lending rate under this category, was withdrawn.
i) Effective June 2 1, 1995, primary (urban) co-operative banks' lending rates for all categories of loans were freed subject to MLR of 13 per cent.
ii) In the context of t h e flexible lending rates effective October 1, 1 995, banks were allowed to fix their own interest rate o n advances of over Rs.2 lakh against domestic term deposits and deposits under NRE Scheme.
iii) With a view to discouraging excessive use of bank credit to finance imports, effective October 3 1 , 1995, outstandings under the Import credit limits were subject to a 15 per cent interest rate surcharge which was further
raised to 25 per cent From February 8, 19%.
i) In the context of developments in the foreign exchange market and the overall monetary and credit situation, the interest rate surcharge on import finance was withdrawn effective July 23, 1996.
ii) In the context of the need for ensuring viability of RRBs and providing greater manoeuvarability and ensuring the flow of adequate and sustainable credit to the rural sector, the lending rates of RRBs were freed, effective August 26, 1996.
iii) In order to ensure that the actual lending rates charged by banks are not sharply higher than their respective PLRs, as also to impart transparency in lending rate structure, and make the PLR credible, on October 19, 1996, ban l s were advised to announce, along with the PLR, the maximum spread over the PLR for all advances other than consumer credit, with t h e approval of their Boards.
iv) With a view to encouraging borrowers to switch over to Loan Delivery System, banks were permitted on February 12, 1997 to prescribe separate PLRs for 'loan component' and 'cash credit component' and separate spreads over t h e respective PLRs with approval of their respective Boards.
i) In view of the recent movements in the interest rates effective October 22, 1997, interest rate for credit limits over Rs.25,000 and up to Rs.2 lakh was stipulated at 'not exceeding 13.5 per cent per annum' instead of the earlier fixed rate of 13.5 per cent per annum.
ii) On October 22, 1997, banks were allowed to fix prime term lending rates (MLR) on term loans of 3 years and above with approval of their Boards.
iii) T o enable larger flow of resources to the housing sector, banks were allowed to

104 Prosre55 of ffnanclal Sector Rebrn~s : 1992-93 to t 9!X-97
charge interest at different rates provided these rates were below PLR as appropriate, In respect of finance to housing finance intermediary agencies.
iv) Effective October 22, 1997, the multiple prescriptions of lending rates linked to loans against FCNR(B)/NR(NR) deposits were dispensed with and banks were given the freedom in relation to uses and rates as available to them in case of advances in general.
6) Export Credit
1) In order to make dollar-denominated export credit scheme more attractive, the rate of interest on refinance under this scheme was reduced from 7.5 per cent to 5.5 per cent per annum with effect from April 22, 1992.
ii) In order to facilitate an environment for promotion of exports, effective October 9, 1992, interest rates on export credit (rupee) provided by banks were reduced by one percentage point across the board. Thus, the basic lending rate on export credit was reduced from 15 per cent to 14 per cent per annum.
iii) Effective March 1, 1993, the interest rates on export credit (rupee) provided by banks were again reduced by one percentage point across-the-board. Thus, the basic lending rate on export credit was reduced to 13 per cent per annum.
i) With a view to easing the burden on the export sector, the Union Budget 1993-94 exempted payment of interest tax on export credit by banks from April 1, 1993 thereby reducing the effective interest rate on export credit by about one-half of one percentage point.
Ii) Following reduction in the MLR for advances of above Rs.2 lakh by one percentage point to 1 6 per cent effective June 24, '1993, the interest rates in respect of usance bills for periods beyond 90 days and up to six months and beyond six months were reduced from 17 per cent to 16 per cent and from 22 per cent to 21 per cent, respectively.
i) Considering the increase in the US dollar LlBOR rate, the interest rate on post- shipment credit denominated in US dollars (PSCFC) was increased from 6.5 per cent to 7.5 per cent per annum effective April 18, 1 995.
ii) With a view to rationalising the interest rates on PSCFC and encouraging a quicker turnaround of credit, interest rate on PSCFC in respect of usance bill for period beyond 90 days and up to six months from the date of shipment was enhanced fiom 7.5 per cent to 9.5 per cent per annum, and the interest rate on export credit, not otherwise specified for PSCFC, which was 9.5 per cent per annum, was freed effective October 3 1 , 1995.
iii) With a view t o facilitate a faster turnover of credit under the PSCFC Scheme, effective January 16, 1996, a rate of interest of 9.5 per cent per annum was prescribed on PSCFC for a total period of up to 90 days as against 7.5 per cent per annum earlier, and for credit of over 90 days banks were given freedom to fix their own interest rates.
iv) With a view to removing the distortion in the effective interest rates on the PSCFC facility that was significantly lower than under Foreign Currency Post-Shipment Credit, t h e PSCFC was terminated effective February 8, 1996.
v) The interest rate on post-shipment export (rupee) credit for over 90 days and up to 180 days was deregulated effective February 8, 1996.
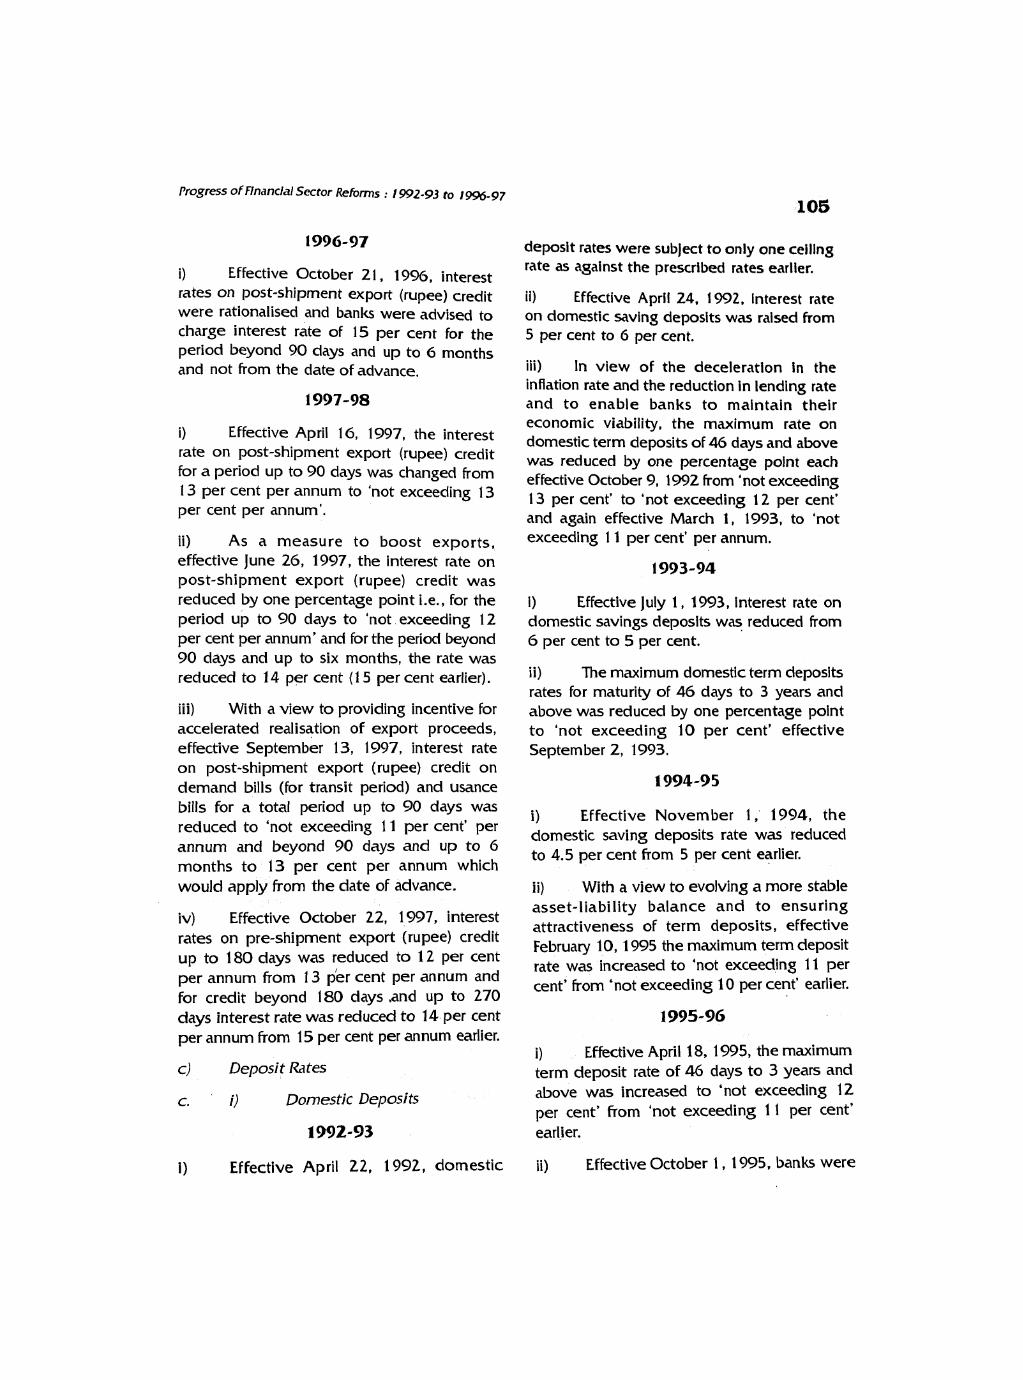
Progress of Financial Sector Relbrms : 1992-93 to 1996-97
106
i) Effective October 2 1 , 1994, interest rates o n post-shipment export (rupee) credit were rationalised and banks were advised to charge interest rate of 15 per cent for the period beyond 90 days and up to 6 months and not from the date of advance.
i) Effective April 16, 1997, the interest rate on post-shipment export (rupee) credit for a period up to 90 days was changed from 13 per cent per annum to 'not exceeding 13 per cent per annum'.
ii) As a measure to boost exports, effective June 26, 1997, t h e interest rate on post-shipment export (rupee) credit was reduced by one percentage point i.e., for the period up to 90 days to 'not exceeding 12 per cent per annum' and for the period beyond 90 days and up to six months, the rate was reduced to 14 per cent (1 5 per cent earlier).
iii) With a view to providing incentive for accelerated realisation of export proceeds, effective September 13, 1997, interest rate o n post-shipment export (rupee) credit on demand bills (for transit period) and usance bills for a total period up to 90 days was reduced to 'not exceeding 11 per cent' per annum and beyond 90 days and up to G months to 13 per cent per annum which would apply from t h e date of advance.
iv) Effective October 22, 1997, interest rates on pre-shipment export (rupee) credit up to 180 days was reduced to 12 per cent per annum from 13 per cent per annum and for credit beyond 180 days and up to 270 days interest rate was reduced to 14 per cent per annum from 15 per cent per annum earlier.
c) Deposit Rates
c. i) Domestic Deposits
1) Effective April 22, 1992, domestic
deposit rates were subject to only one ceiling rate as against the prescribed rates earlier.
i i ) Effective April 24. 1992, interest rate on domestic saving deposits was raised from 5 per cent to G per cent.
iii) In view of the deceleration in the inflation rate and the reduction in lending rate and to enable banks to maintain their economic viability, the maximum rate o n domestic term deposits of 46 days and above was reduced by one percentage point each effective October 9, 1992 from 'not exceeding 13 per cent' to 'not exceeding 12 per cent' and again effective March 1, 1993, to 'not exceeding 1 1 per cent' per annum.
1 Effective July 1 , 1993, interest rate on domestic savings deposits was reduced from 6 per cent to 5 per cent.
ii) The maximum domestic term deposits rates for maturity of 46 days to 3 years and above was reduced by one percentage point to 'not exceeding 10 per cent' effective September 2, 1993.
i Effective November 1, 1994, the domestic saving deposits rate was reduced to 4.5 per cent from 5 per cent earlier.
ii) With a view to evolving a more stable asset-liability balance and to ensuring attractiveness of term deposits, effective February 10, 1995 the maximum term deposit rate was increased to 'not exceeding 1 1 per cent' from 'not exceeding 10 per cent' earlier.
1995-96
i) Effective April 18, 1995, the maximum term deposit rate of 46 days to 3 years and above was increased to 'not exceeding 12 per cent' from 'not exceeding 1 1 per cent' earlier.
ii) Effective October 1, 1995, banks were

106 Progress of Flnanclal Sector Reforms : 1992-93 to 1-6-97
permitted to flx their own interest rates on domestic term deposlts with a maturity of over two years.
1) With a view to providing greater flexibility in determining term deposit rates, effective July 2, 1996, banks were given freedom to flx their own interest rates o n domestic term deposits with a maturity of over one year. Further, to provide some outlet for management of short-term surplus funds, owing to the developments in the money market and the progressive move from the cash credit system to a loan system, the minimum period of term deposits was reduced from 46 days to 30 days and the interest rate on domestic term deposits of 30 days and up to one year was prescribed at 'not exceeding 1 1 per cent per annum'.
ii) Effective October 21, 1996, t h e maximum interest rate on domestic term deposits of banks of maturity between 30 days and one year was reduced to 'not exceeding 10 per cent per annum' from 1 1 per cent earlier.
1) Effective April 1 , 1997, banks were advised that on premature withdrawal of term deposits, the interest should be paid at the rate as applicable to the period for which the deposit remained with bank or a t the contracted rate, whichever is lower, less one per cent penalty for premature withdrawal.
ii) Effective April 16, 1997, the interest rate on domestic term deposits of banks for maturity of 30 days and -up to one year was changed from 'not exceeding 10 per cent' to 'not exceeding Bank Rate minus t w o percentage points per annum'. With Bank Rate at 11 per cent, this meant a rate ' not exceeding 9 per cent per annum'.
iii) Following a one percentage point cut in the Bank Rate on June 25, 1997, the effective ceiling rate was set at 8 per cent for
term deposits of maturity up to one year.
Iv) In order to give full freedom to banks to determine the interest rates on term deposits, effective October 22, 1997, banks were allowed to fix their own interest rates on term deposits of 30 days and over.
c. ii) External Deposits
1) Effective October 9, 1992, the term deposit rates for NRE Accounts for maturity of 46 days to 3 years and above were made subject to a single prescription of 'not exceeding 13 per cent per annum' and the interest rate on saving deposits was raised from 5 per cent to 6 per cent.
i) Term deposit rates on NRE accounts were rationalised in accordance with the domestic deposit rates. Accordingly, effective April 8, 1993, maximum term deposits rate under NRE Scheme was reduced from 'not exceeding 13 per cent' to 'not exceeding 12 per cent', and to 'not exceeding 1 1 per cent' effective October 1 2, 1 993 and further to 'not exceeding 10 per cent' effective May 16, 1994.
ii) A new FCNR(B) Scheme was introduced effective May 1 5, 1993 entailing the commercial banks to provide the exchange rate guarantee to depositors.
i With a stable dollar - rupee rate, effective October 18, 1994, the term deposit rate for NRE Accounts for maturity of G months to 3 years and above was reduced by two percentage points, i.e. from 'not exceeding 10 per cent' to 'not exceeding 8 per cent'.
ii) Effective November 1 , 1994, the saving deposits rate on NRE Accounts was reduced to 4.5 per cent from 5 per cent earlier.

Progress of Financial Sector Reforms : 1992-93 to / 996-97 107
i) With a view to maintaining the differential between the interest rates on domestic term deposits and NRE term deposits, the maximum term deposit rate for NRE accounts of maturity of 6 months to 3 years and above was raised from 8 per cent to 10 per cent effective October 1 , 1995.
ii) With a view to bringing about a better alignment of the maturity structure of domestic term deposits and NRE term deposits, the interest rates o n NRE term deposits of maturity of 6 months to 3 years and above was increased to 12 per cent effective October 31, 1995.
the Reserve Bank from time to time. However, the minimum maturity period of such deposits should not be less than six months.
iii) Effective September' 13, 1997, banks were free to fix their own interest rates on NRE term deposits of G months and over with prior approval of their Boards.
iv) With a view to providing further flexibility to banks, effective October 22, 1997, banks have been allowed to offer interest rates on FCNR(B) deposits at rates not more than the LlBOR prevailing on the last working day of the previous week For the relevant maturity and currency. Accordingly, banks were allowed to offer either fixed or floating rate of
1996-97 interest.
i) With a view to bringing about a better 4. Changes in the Refinance
alignment of the maturity structure of NRE Facilities term deposits with that o n domestic term ) , &xport Credit (Ropee) Refirlance deposits, interest rates on NRE term deposits of over two years were freed effective April 1992-93
i) With a view to bringing about a better alignment of the interest rate structure of term deposits under NRE Accounts with that on domestic term deposits, effective April 16, 1997, a) the interest rates on term deposits under NRE Accounts of over one year were freed, and b) the interest rate offered under NIX term deposits of 6 months and up to one year was prescribed at 'not exceeding Bank Rate minus two percentage point' which worked out to 'not exceeding 9 per cent per annum'. It was further reduced to 'not exceeding 8 per cent per annum' effective June 26, 1997.
ii) Effective April 16, 1997, banks were free to determine interest rates on FCNR(B) deposits subject to a ceiling prescribed by
i) Effective April 22, 1992, 60 per cent of increase in export credit (rupee denominated) over the monthly average level for 1988-89 up to the monthly average level for 1989-90 plus 125 per cent of increase in export credit over the monthly average level for 1989-90 was eligible for refinance. The interest rate o n export credit (rupee) refinance was raised from 9.5 per cent to 11 per cent per annum2.
ii) Effective October 31, 1992, export I
credit (rupee) refinance was provided to the extent of 60 per cent of increase in outstanding export credit eligible for refinance over t h e monthly average level of 1988-89 up to the monthly average level for 1989-90 plus 11 0 per cent (as against 125 per cent earlier) of increase in export credit over the monthly average level for 1989-90.
When pre-shipment and post-shipment export credit interest rates were raised in August and October 1991, the upon refinance rate was not raised so as to enable bank to have some time to phase in the new lending rates on export credlt.

Progress of Flnanclal Sector Reforms : 1992-93 to 1996-97
i ) Effectlve May 15, 1993, export credit (rupee) refinance was provided to the extent of 60 per cent of Increase in outstanding export credit eligible for refinance over the monthly average level of 1988-89 up to the monthly average level of 1989-90 plus 100 per cent of increase in the export credit over the monthly average level for 1989-90 as against 1 10 per cent till then.
Ii) Effective October 30, 1993, the base year was brought forward by one year i.e. from 1989-90 to 1990-9 1 and export credit (rupee) finance was provided to the extent of 60 per cent of increase in outstanding export credit eligible for refinance over the monthly average level of 1989-90 up to the monthly average level of 1990-9 1 plus 100 per cent of increase in export credit over the monthly average level for 1 990-9 1.
i) Effective May 28, 1994, the base year was further brought forward by one year. The export credit (rupee) refinance was provided up to 60 per cent of increase in the outstanding export credit eligible for refinance over the monthly average level for 1990-91 up to the monthly average level for 1991 -92 plus 100 per cent of increase in export credit over the monthly average level of outstanding export credit in 1 99 1 -92.
i) Effective April 29, 1995, banks were provided export credit (rupee) refinance to the extent of 100 per cent of increase in export credit eligible for refinance over the monthly average level of outstanding export credit in 1 992-93.
i) As a part of rationalisation of CRR and of refinance facilities from the Reserve Bank, sector-specific refinance facilities were
rationalised. Thus, the refinance formula for export credit was rationalised effective April 1 3, 1996 whereby banks would be provided export credit refinance to the extent of 45 per cent of the outstanding export credit eligible for refinance (Rupee credit and PSCFC taken together) up to the level of such credit as on February 16, 1996 plus 100 per cent refinance of the increase in such export credit over the outstanding level as on February 16, 1996. The rate of interest on such export credit refinance was fixed at 1 1 per cent per annum.
ii) A s a move towards further rationalisation of CRR and refinance to banks, effective November 9, 1996, 20 per cent of outstanding export credit of banks was made eligible For refinance up to the level of such credit as on February 16, 1996 plus 100 per cent of increase in outstanding export credit for refinance over the level as on February 16, 1996.
i) In the context of introduction of a new General Refinance Facility, effective April 26, 1997, base level export credit refinance limits at 20 per cent of export credit as on February 16, 1996 was withdrawn and banks were entitled for export credit refinance at the Bank Rate to the extent of 100 per cent of the increase in outstanding export credit eligible for refinance over the level of such credit as on February 16, 1996.
b) Export Credit Refinance - Denominated in US Dollars (PSCFC)
i) Under refinance facility against PSCFC (introduced on January 3, 192) banks were eligible for export credit refinance limits equivalent to 133- 1 /3 per cent of such credit provided to exporters. Effective October 3 1 , 1992, the limits were reduced to I20 per cent of such outstanding export credit.

Progress of Financial Sector Reforms : 1992-93 to 1996-97
109
i) Effective May 15, 1993, the export credit refinance limits against PSCFC were further reduced to 100 per cent of such credit provided by banks to exporters as against 120 per cent hitherto.
ii) As the export credit refinance limits against PSCFC showed a phenomenal increase, effective October 30, 1993 the refinance limits against PSCFC were reduced from 100 per cent to 90 per cent of such outstanding export credit.
i) Effective May 28, 1994, the export credit refinance limits against PSCFC were further reduced to 80 per cent of such outstanding export credit provided by banks to exporters.
i) As the refinance limits under PSCFC were very large and needed to be moderated, effective April 29, 1995, the export refinance limits were further reduced to 70 per cent of outstanding export credit provided by banks under PSCFC to exporters as against 80 per cent hitherto. Rate of interest on this refinance facility was raised from 5.5 per cent to 6.5 per cent per annum effective April 18, 1995.
PSCFC Scheme was terminated effective February 8, 1996, However, the refinance limits against eligible MCFC were allowed to continue till the respective due dates.
c) Ciovernment Securities Refinance
i) A new refinance facility, viz., Government Securities Refinance was introduced in October 1992. Under this fadlity, effective October 3 1, 1992, banks were granted refinance to the extent of 0.5 per cent of the fortnightly average outstanding aggregate deposits in 1991-92 against the collateral of dated Government and other approved securities at the rate of 14 per cent per annum.
ii) Overdue PSCFC was made ineligible for refinance with effect from October 31, 1995.
iii) Effective January 16, 1996, banks were made eligible for refinance under the PSCFC Scheme against bills up to 90 days only and ineligible for refinance For bills beyond 90 days and up to 6 months from the date of shipment sanctioned.
iv) With a view to removing t h e distortion in t h e e f k t i v e interest rate on the PSCFC facility which was slgniflcantly lower than under Foreign Currency Post-Shipment Credit.
i) With a view to augmenting resources available under the Government securities refinance facility and imparting liquidity to the excess holdings of Government and other approved securities, effective September 30, 1995, t h e base year for determining t h e refinance limits was brought forward from 1991 -92 to 1994-95. Further, the proportion of refinance was raised toone per centof the fortnightly average outstanding aggregate deposits in 199495. The refinance limit was provided under two separate limits: (a) 0.5 per cent of the fortnightly average outstanding aggregate deposits in 1994-95 against the collateral of Treasury Bills at the rate of 12.5 per cent per annurn, and (b) 0.5 per cent of t h e fortnightly average outstanding aggregate deposits in 1994-95 against t h e collateral of Government dated and other approved securities at the rate of 14 per cent per annum.
i Effective July 6 , 1996, the refinance facility against the collateral of Treasury Bills and Government dated securities and other approved securities was withdrawn.

110 Pfogress of Flnanchl Sector Reforms : 1992-93 to 19%-97
1) In the context of a move from sector- specific refinance facilities to a general refinance facility and also with a view to enabling Bank Rate emerge as a reference rate, effective April 26, 1997, banks were provided General Refinance to tide over temporary liquidity shortages equivalent to one per cent of each bank's Fortnightly average outstanding aggregate deposits in 1 996-97 In two blocks of four weeks each: at Bank Rate for the first block of four weeks, and at Bank Rate plus one percentage point for the second block of four weeks. Banks availing of this facility beyond eight weeks would face automatic debiting of their accounts with the Reserve Bank. Banks can avail of this facility afresh if there is a gap of two weeks during which there is no borrowing under this facility.
5. Bank Rate
1) In order to make the Bank Rate an effective signal rate as well as a reference rate, all interest rates on advances from the Reserve Bank as also the penal rates on shortfalls in reserve requirements which were specifically linked to the Bank Rate were revised. Interest rates on other categories of accommodation from the Reserve Bank as well as term deposit rates up to one year which were not linked to the Bank Rate earlier, were linked to it. Effective from April 16, 1997, the Bank Rate was reduced by one percentage point, i.e. from 12 per cent per annum to 11 per cent per annum so that changes in the Bank Rate reflect the stance of monetary policy.
ii) With a view to aligning the Bank Rate to the changing conditions, effective June 25, 1997, the Bank Rate was hrther reduced from 1 1 per cent per annum to 10 per cent per
annum. Simultaneously, the interest rate on
deposits of maturity of 30 days and up to one year was reduced from 9 per cent to 8 per cent i.e. Bank Rate minus two percentage point. All interest rates on advances from the Reserve Bank such as, Export Credit Refinance and General Refinance to banks which were specincally linked to the Bank Rate, were reduced to 10 per cent from 1 1 per cent per annum earlier.
iii) Effective October 22, 1997, the Bank rate was further reduced by one percentage point to 9 per cent from 10 per cent per annum earlier.
6. Money Market Developments
a) Cali Money Market
i) With a view to facilitating a level playing field, effective June 27, 1995, private sector mutual hnds (approved by SEBI) were allowed to operate only as lenders in the call/ notice money/bill rediscounting market.
1) In April 1997,entities which are able to provide evidence to the Reserve Bank of bulk lendable resources, were extended the facility of routing call/notice money transactions through all the PDs (earlier DFHI only) and the minimum size of operation per transaction was reduced from Rs.20 crore to Rs. 10 crore.
ii) With a view to developing the money market and make it more efficient, a Standing ' ,
Advisory Committee o n Money Market (Chairman : Dr. Y.V. Reddy, Deputy Governor) was set up on April 28, 1997, to advise the Reserve Bank.
iii) In October 1997, the minimum size of operation per transaction for entities which are able to provide evidence to the Reserve Bank of bulk lendable resources was further reduced to Rs.5 crore from Rs. 10 crore earlier.

Progress of Finanddl Sector Reforms : 1 992-93 to 1 9%-97
b) Tern? Money Mar lwt
i) T o provide flexibility to Financial institutions (Fls), in October 1993, select Fls namely, IDBI, ICICI, IRBI, SIDBI, Exirn Bank and NABARD were permitted to borrow from t h e term money market for periods in the maturity range of 3 months to G months, within the stipulated limits for each institution.
i) With a view t o facilitating the development of a more realistic rupee yield curve and term money market, inter-bank liabilities were exempted (except for a statutory minimum) from maintenance of CRR and SLR effective from April 26, 1997.
4 Certificate of Deposits (CD$
i) Effective May 2, 1992, CDs limits of banks were raised to 7 per cent (5 per cent earlier) of the fortnightly average outstanding aggregrate deposits in 1989-90.
ii) Effective October 1 7, 1992, the CDs limits of banks were raised to 10 per cent (7 per cent earlier) of fortnizhtly average outstanding aggregate deposits in 1 989-90.
1993-94
were prescribed for each bank which were equivalent to 10 per cent of the fortnightly average outstanding aggregate depostts in 1991 -92 (Instead of 1989-90 earller).
ii) Effective October 1 6, 1993, bank-wise limits on issue OF CDs were withdrawn.
i) In August 1996, it was clarified that banks were Free to invest In CDs of other banks/Fls and CDs were made freely transferable by endorsement and delivery after 30 days from the date of issue (as against 45 days earlier).
i The minimum size of issue of CDs to a single investor was reduced from Rs.25 lakh to Rs.10 lakh and In multiple of Rs.5 lakh from April 26, 1997.
ii) With a view to widening the money market, the minimum size of issue of CDs to a single investor was Further reduced from Rs.10 Iakh to Rs.5 lakh and in the multiple of Rs.1 lakh with effect from October 22, 1997.
d) Commercial Paper (CPY
1992-93
(i) In May 1992, the following relaxationsS were effected with regard to the issue of CPs:
i Effective April 17, 1993, the new limits (a) the fund baed working capital limit of
Certificate of Deposits (CDs) were Arst introduced in India in 1989. The initial guidelines stipulated that CDs could be issued only by scheduled commercial banks (excluding Ws) in multiples of Rs. 25 lakh subject to the minimum size of Rs. 1 crore. The maturity period was stipulated between 91 days and 1 year.
* CPS were also introduced in 1989. Companies with net worth of Rs. 10 crore and a MPBF of Rs. 25 crore could issue CPs up to a maximum limit of 20 per cent of MPBF. between 91 days and 6 months and could b e issued in mu1 lssue of Rs. 1 uore.
The relaxations in respect of issue of CPs made in May (a) t h e fund based working capital limit of company issu
crore earller; (b) the celling of aggregate amount was raised to 30 per c
per cent earlier); (c) the denomination of Issue of CP was reduced to ds. 5 lakh (Rs. 10 lakh eadier) sub
an lssue to slngle Investor to Rs. 25 lakh (Rs.50 lakh earlier); (d) prlor permlsslon of the Reserve Bank was dispensed with.

ptosress of Flnancfdl Sector Rebrms : 1992-93 to 1996-97
company issulng CPs was Further reduced to Rs. 5 crore instead of Rs. 10 crore earlier;
(b) the ceiling of aggregate amount of CPs was raised to 75 per cent of company's hnd based working capital (from 30 per cent earlier).
( I ) The changes effected from October 18, 1993 with regard to CPs issue are as follows:
(a) The ellglbillty of corporates fo r issue of CPs was lowered to Rs.4 crore of minimum working capital limit (from Rs.5 crore earlier) as also the eligibility criteria of tangible net worth of the company was reduced from Rs.5 crore to Rs.4 crore; (b) CPs could be issued for maturities between 3 months and less than one year (instead of the earlier stipulation of not more than G months); (c) for the purpose of rating the issue of CPs, the Reserve Bank approved CARE as the approved agency, in additlon to CRlSlL and ICRA, effective from October 5, 1993.
I) To impart a measure of independence to CP as a money market instrument, the facility of the stand-by arrangement was abolished in October 1994. Thus, when CPs were issued, banks were required to effect a pro tanto reduction in the cash credit limit and if at a later date, i.e., after issuance of CP, the corporate wished to have a higher cash credit limit, it would have to approach the bank for enhancement of the credit limit.
could be issued by a borrower with MPBF of Rs.20 crore and above has been raised from 75 per cent to 100 per cent of cash credit component.
i) In July 1996, the Reserve Bank has approved DCR - INDIA as an agency for the purpose of rating the issue of CPs.
li) In September 1996, t h e Primary Dealers (authorised by Reserve Bank of India for this purpose) are given access t o short- term borrowings through CPs, by issuing a separate notification.
iii) In November 1996, the extent of CP that can be issued by all eligible corporates has been raised to 100 per cent of the working capital credit limit.
1) In consonance with the minimum term deposit period of 30 days, effective April 15, 1997, the minimum period of maturity of CP was brought down from 3 months to 30 days.
ii) In October 1997, the requirement of minimum current ratio of 1.33: 1 for a company to be eligible for issue of CP has also been dispensed with in the light of the operational freedom given t o banks in the matter of assessment of working capital. Banks are also given freedom to decide the manner in which restoration of the working capital limit should be done.
e) Inter Bani< Participations (IBPs)
i) Consequent to introduction of the Loan System for Delivery of Bank Credit in April 1995, the extent of CP that could be issued
was restricted to 75 per cent of the cash credit component instead of 75 per cent of the working capital (fund based) limit earlier.
ii) In June 1996, the extent of CP that
i 1 Effective October 12, 1 9 9 3 , t h e stipulation relating to the minimum rate of interest of 14 per cent per annum on 1BP with risk-sharing was withdrawn and the issuing banks and the participating banks were free t o determine the rate of Interest on lBPs with risk-sharing.

Prosress of Flnandal Sector Reforms : 1992-93 to 1996.97
fl Rediscounti~~g Con~mercial Bills
1995-96
i) With a view to ensuring that banks resort to rediscounting of commercial bills in accordance with the spirit of this facility, effective April 29, 1995, rediscounting of commercial bills and derivative usance promissory notes were required to be for a minimum period of 15 days.
g) Money Market Mutual Funds (MMMFs)
1995-96
i) With a view to making t h e scheme of MMMFs more flexible and also providing greater liquidity and depth to the money market, the private sector institutions were allowed to set up MMMFs; the ceiling for raising resources and stipulation regarding minimum size of MMMFs was done away with, and the prescription of limits on investments in individual instruments by them were withdrawn effective November 23, 1995. The prudential guidelines that the exposure to CP issued by an individual company should not be more than 3 per cent of the resources mobilised by the MMMF was, however, continued.
1996-97
i) In April 1996, the restriction o n issue of units of MMMFs only to individuals was withdrawn and units could now be issued to corporates and others o n par with all other mutual funds.
ii) With a view to making the scheme of MMMFs more attractive to investors, effective July 3, 1996, the minimum lock-in period was reduced from 46 days to 30 days.
1997-98
1) With a view to providing flexibility for MMMF Schemes, effective October 22, 1997, MMMFs were permitted to invest in rated corporate bonds and debentures with a residual maturity OF up to one year. However, as a prudential measure, the exposure of
MMMFs to CP issued by an individual company should not exceed 3 per cent of the resources of the MMMFs, has been continued though the ceiling now includes bonds and debentures also.
7. Internal Debt Management Policies
i) In order to influence the composition, maturity structure and yield of Government securities, a number of reforms were introduced such as:(a) auctions of 364-day Treasury B i l l s , 9 1 -day Treasury Bills, Government dated securities of varied maturities together with shortening of the maturity period of Government securities; (b) auction of repo for Central Government dated securities to even out short term liquidity in the banking system; and (c) with the auction system, the interest rates on Government securities were fixed at closely market-related.
1 993-94
i) In order to develop an efficient and vibrant secondary market for Government securities, 'Securities Trading Corporation of India' (STCI) was set up and it commenced operations from June 27, 1994.
ii) The maximum maturity period of State Government securities was reduced from 15 years to 1 0 years in 1993-94
iii) The coupon rate on 10-year State Government securities was hiked from 13 per cent in 1992-93 to 13.5 per cent in 1993-94 in order to make these securities attractive.
iv) Effective November 1, 1993, Ways and Means Advances (WMA) limits to State Governments were raised to 84 times and 32 times of their minimum cash balances in case of normal and special advances respectively, to Rs.1,117.2 crore and Rs.425.6 crore, making t h e aggregate limits to Rs. 1,542.8 crore. Also the time limit to clear overdrafts was extended to ten consecutive working days from seven days earlier.
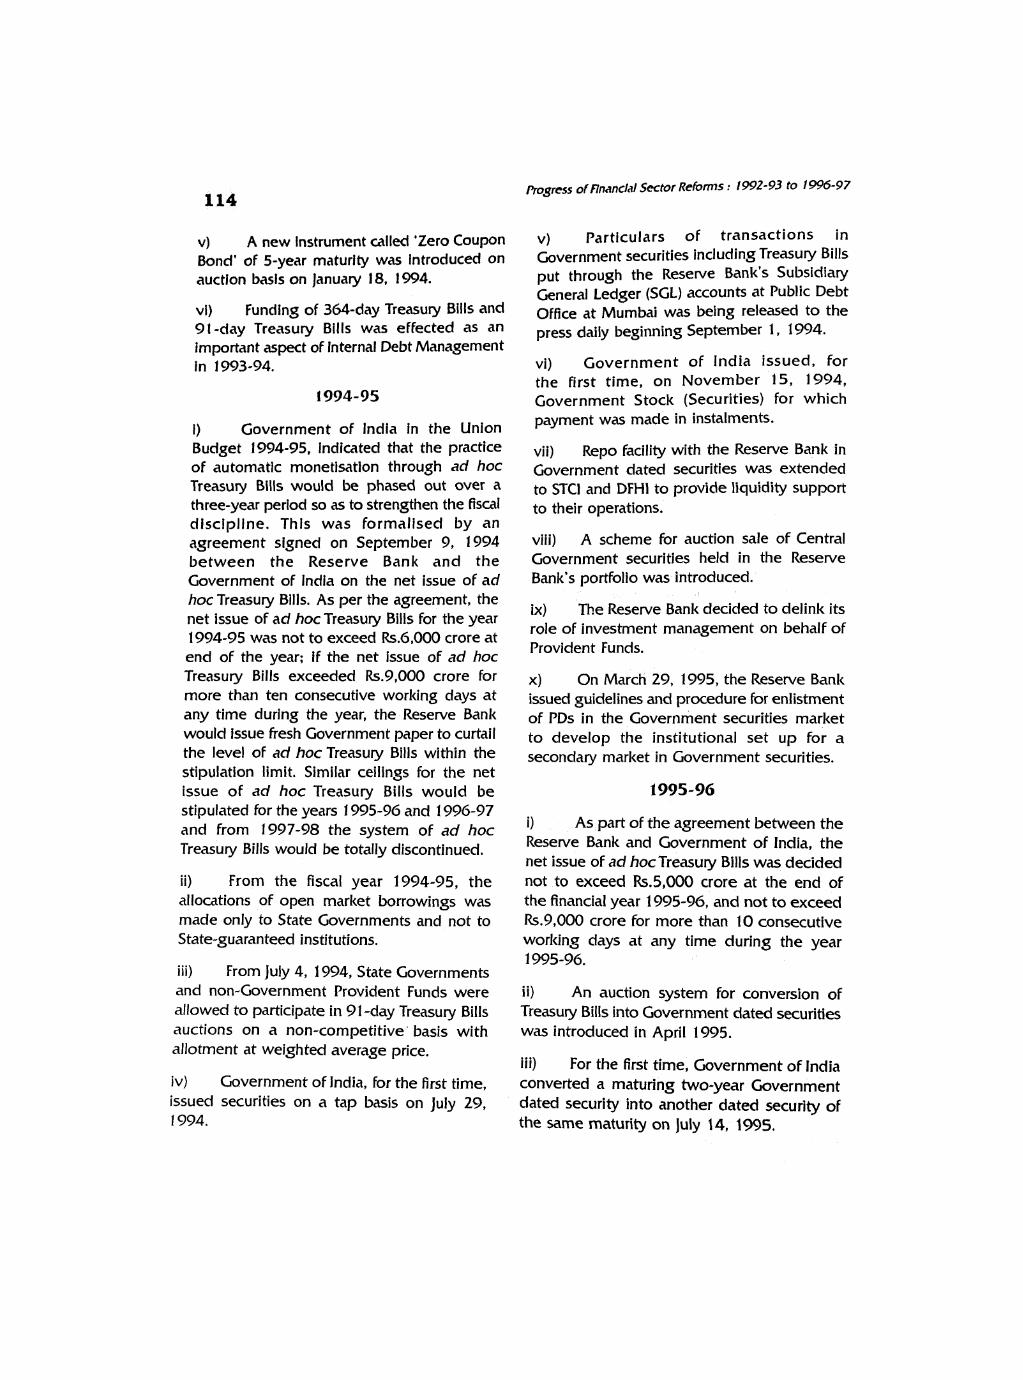
hogress of Flnanclal Sector Reforms : 1992-93 to 1996-97
v) A new instrument called 'Zero Coupon Bond' of 5-year maturity was introduced on auction basls on January 18, 1924.
vl) Funding of 364-day Treasury Bills and 91-day Treasury Bills was effected as an important aspect of Internal Debt Management In 1993-94,
1) Government of India in the Union Budget 1994-95, Indicated that the practice of automatic monetisatlon through ad hoc Treasury Bills would be phased out over a three-year period so as to strengthen the fiscal dlscipllne. Thls was formalised by an agreement signed on September 9, 1994 between the Reserve Bank and the Government of lndla on the net issue of ad hoc Treasury Bills. As per the agreement, the net issue of a d hoc Treasury Bills for the year 1994-95 was not to exceed Rs.G,000 crore at end of the year; if the net issue of ad hoc Treasury Bills exceeded Rs.9,000 crore for more than ten consecutive working days a t any time during the year, the Reserve Bank would issue fresh Government paper to curtail the level of ad hoc Treasury Bills within the stipulation limit. Similar ceilings for the net issue of ad hoc Treasury Bills would be stipulated for the years 1995-96 and 1996-97 and from 1997-98 the system of ad hoc Treasury Bills would be totally discontinued.
ii) From the fiscal year 1994-95, the allocations of open market borrowings was made only to State Governments and not to State-guaranteed institutions.
iii) From July 4, 1994, State Governments and non-Government Provident Funds were allowed to participate in 91 -day Treasury Bills auctions on a non-competitive' basis with allotment at weighted average price.
iv) Government of India, for the first time, issued securities on a tap basis on July 29, 1 994.
v) Particulars of transactions in Government securities including Treasury Bills put through the Reserve Bank's Subsidiary General Ledger (SGL) accounts at Public Debt Office a t Mumbai was being released to the press daily beginning September 1, 1994.
vi) Government of lndia issued, for the first time, on November 15, 1994, Government Stock (Securities) for which payment was made in instalments.
vii) Repo facility with the Reserve Bank in Government dated securities was extended to STCl and DFHI to provide liquidity support to their operations.
vili) A scheme for auction sale of Central Government securities held in the Reserve Bank's portfolio was introduced.
ix) The Reserve Bank decided to delink its role of investment management on behalf of Provident Funds.
x ) On March 29, 1995, the Reserve Bank issued guidelines and procedure for enlistment of PDs in the Government securities market to develop the institutional se t up for a secondary marlcet in Government securities.
i) As part of the agreement between the Reserve Bank and Government of India, the net issue of a d hoc Treasury Bills was decided not to exceed Rs.5,000 crore at the end of the financial year 1995-96, and not t o exceed Rs.9,000 crore for more than 10 consecutive worlcing days a t any time during the year 1995-96.
ii) An auction system for conversion of Treasury Bills into Government dated securities was introduced in April 1995.
iii) For the first time, Government of lndia converted a maturing two-year Government dated security into another dated security of the same maturity on July 14, 1995.

Progress of Financial Sector Rehms : 1992-93 to 19%-97
iv) Delivery versus Payment (DvP) system in Government securities was introduced in Mumbai From July 17, 1995 to synchronize the transfer of securities with the cash payment thereby reducing the settlement risk in securities transactions and also preventing diversion of funds in the case of transactions through SGL.
v) A new instrument combining the features of tap stock and partly-paid stock was introduced on September 1 1, 1995.
vi) A new instrument of Floating Rate Bonds (FRB) was introduced on September 29, 1995.
vii) Effective September 30, 1995, the minimum period for repos in Treasury Bills and Government dated securities was stipulated to be 3 days to ensure that banks resort to repos not as call market instrument but in accordance with the spirit of this facility.
viii) On October 14, 1995, the Reserve Bank reissued Government securities at fixed coupon at benchmark maturity of 2 years at t he rate emerging in auction. Later on, Government securities at fixed coupon at benchmark maturities of 3 years, 5 years and 10 years were issued.
ix) On November 1 3, 1 995, the Reserve Bank granted 'in principle' approval to six PDs, viz., DFHI, STCI, SBI Gilts Ltd., PNB Gilts Ltd., Gilt Securities Trading Corporation Ltd. and ICICl Securities and Finance Company Ltd.
x) The DvP sys tem in Government securities at Mumbai was extended to Treasuly Bills auction from February 14, 1996.
xi) Effective March 1, 1996, DFHI and STCI started functioning as PDs in Government securities to act as market makers out of the six 'in principle' approvals granted o n November 1 3,1995.
xil) On March 25, 1996, the Reserve Bank absorbed Central Government dated securities worth Rs.S,5OO crore on private placement basis.
1) It was decided to continue with the previous year's limits on ad hoc Treasury Bills for fiscal 1996-97 i.e. the net issue not to exceed Rs.5,000 crore at the end of the financial year 1996-97 and not to exceed Rs.9,000 crore for more than ten consecutive working days at any time during the year.
ii) With a view to encouraging schemes of mutual funds dedicated to Government securities and creating a wider investor base for Government securities, the Reserve Bank announced on April 20, 1996, a provision for liquidity support to mutual funds dedicated exclusively to investments in Government securities either by way of outright purchases or reverse repos in Central Government securities up to 20 per cent of outstanding investment.
iii) In addition to DFHl and STCI, four more PDs, viz. SBI Gilts Ltd., PNB Gilts Ltd., Gilt Securities Trading Corporation Ltd. and lClCl Securities and Finance Company Ltd. became operational from June 1, 1996.
iv) The new four PDs mentioned above were permitted to participate in call/notice money market and bills rediscounting scheme both as lenders and borrowers from June 6, 1996.
v) As a part of measures to develop secondary market in Government securities and making the market deep and broad based, the Reserve Bank issued guidelines to banks for retailing of Government securities with non-bank clients on June 8, 1 996.
vi) With a view to providing incentives to PDs to develop the secondary market in Government securities, t h e Reserve Bank decided to pay commission on their primary purchases (including t h e underwriting commitment) of Central Government securities effective July 10, 1996.
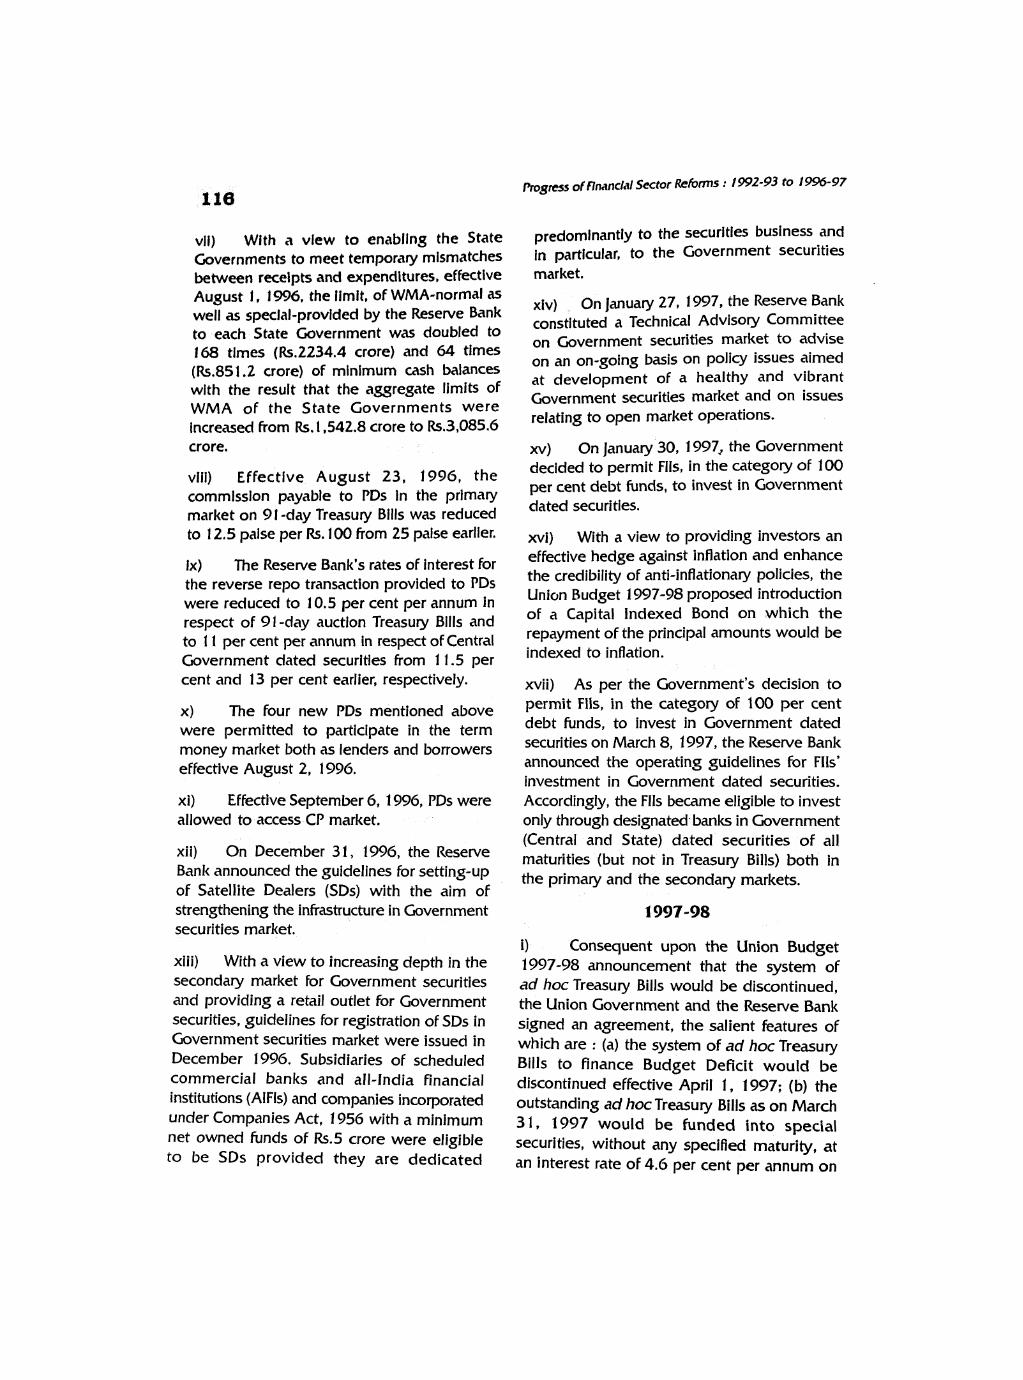
hgfiss of Rnanclal Sector Rehrrns : 1992-93 to 1996-97
vii) With a view to enabling the State predomlnantly to the securities business and
Governments to meet temporary mismatches in particular, to the Government securities between receipts and expendltures, effective market. August 1. 1996, the limit, of WMA-normal as well as speclal-provided by the Reserve Bank to each State Government was doubled to 168 times (Rs.2234.4 crore) and G4 times (Rs.851.2 crore) of minimum cash balances with the result that the aggregate limits of WMA of the State Governments were increased from Rs. 1,542.8 crore to Rs.3,085.6 crore,
vili) Effective August 23, l99G, the commission payable to PDs In the primary market on 9 I -day Treasury Bllls was reduced to 12.5 paise per Rs. 100 from 25 palse earlier.
ix) The Reserve Bank's rates of interest for the reverse repo transaction provided to PDs were reduced to 10.5 per cent per annum in respect of 91 -day auction Treasury Bills and to 1 1 per cent per annum in respect of Central Government dated securities from 1 1 .5 per cent and 13 per cent earlier, respectively.
x ) The four new PDs mentioned above were permitted to participate in the term money market both as lenders and borrowers effective August 2, 1996.
xi) Effective September 6, 1996, PDs were allowed to access CP market.
xii) On December 3 1, 1996, the Reserve Bank announced the guidelines for setting-up of Satellite Dealers (SDs) with the aim of strengthening the infrastructure in Government securities market.
xiii) With a view to increasing depth in the secondary market for Government securities and providing a retail outlet for Government securities, guidelines for registration of SDs in Government securities market were issued in December 1 996. Subsidiaries of scheduled commercial banks and all-India financial institutions (AIFls) and companies incorporated under Companies Act, 1956 with a minimum net owned funds of Rs.5 crore were eligible to be SDs provided they are dedicated
xiv) On January 27, 1 W7, the Reserve Bank constituted a Technicdl Advisory Committee on Government securities market t o advise on an on-going basis on policy issues aimed a t development of a healthy and vibrant Government securities market and on issues relating to open market operations.
xv) On January 30, 1 997, the Government decided to permit Flls, in the category of 100 per cent debt funds, to invest in Government dated securities.
xvi) With a view to providing investors an effective hedge against inflation and enhance t h e credibility of anti-inflationary policies, the Union Rudget 1 997-98 proposed introduction of a Capital Indexed Bond on which t h e repayment of the principal amounts would be indexed to inflation.
xvii) As per the Government's decision to permit Flls, in the category of 100 per cent debt funds, to invest in Government dated securities on March 8, 1997, the Reserve Bank announced the operating guidelines for Flls' investment in Government dated securities. Accordingly, the FIls became eligible to invest only through designated banks in Government (Central and State) dated securities of all maturities (but not in Treasury Bills) both in the primary and the secondary markets.
1997-98
i) Consequent upon the Union Budget 1997-98 announcement that the system of ad hoc Treasury Bills would be discontinued, t h e Union Government and the Reserve Bank signed an agreement, the salient features of which are : (a) the system of ad hoc Treasury Bills t o finance Budget Deficit would be discontinued effective April 1 , 1997; (b) the outstanding ad hoc Treasury Bills as on March 31, 1997 would be funded into special securities, without any specified maturity, a t an interest rate of 4.6 per cent per annum on

progress of Financial Sector Rebrms : 1992-93 to 1996-97
April 1, 1997; (c) the outstanding tap Treasury Bills as on March 3 1 , 1997, would be paid off on maturity with an equivalent creation of special securities without any specified maturity, at an interest rate of 4.6 per cent per annum; (d) from April I , 1997, a scheme of WMAs to the Government by the Reserve Bank would be introduced to accommodate temporary mismatches in Government receipts and payments; (e) the limit and rate of interest on WMAs and the rate of interest on overdraft would be mutually agreed between the Reserve Bank and the Government from time to time; (f) for the year 1997-98, the limit for WMA was fixed at Rs.12,000 crore for the first half of the year (April-September) and Rs.8,000 crore for the second half of the year (October-March); (g) the interest rate on WMA, for any given quarter, for the Government would be 3 per cent less than the rate arrived at by averaging the implicit yield at the cut-off prices of 91 -day Treasury Bills auctions held during the previous quarter, and on overdraft amount beyond the WMA limits, would be the rate on WMA plus 2 per cent; and h) overdraft would not be permissible for periods exceeding 1 0 consecutive working days after March 31, 1999.
ii) In order to provide State Governments, foreign central banks, and special bodies with an alternative arrangement in place of 91 -day tap Treasury Bills for investment of their temporary cash surpluses, effective April 1, 1997, the Government of India introduced the Scheme of 14-day Intermediate Treasury gills. The salient features of the scheme are :
(a) t h e Bills would be sold only to State Governments, foreign central banks, and other specified bodies with whom the Reserve Bank has an agreement for investing their temporary surplus funds; (b) it would be sold on a non- transferable basis for a minimum amount of Rs.1 lakh and in multiples of Rs.1 lakh and would be issued only in book-entry form, i.e., by credit to SGL Account; (c) the Bills would b e repaidlrenewed at par on the expiration
of 14 days from the date of their issue; (d) the discount rate would be set at quarterly intervals such that the effective .yield of this instrument would be equivalent to the interest rate o n WMA chargeable t o Central Government; and (e) the Bills would be rediscounted at 50 basis points higher than the discount rate. On rediscounting, the bills would be extinguished.
iii) In pursuance of the Guidelines for Satellite Dealers issued o n December 31, 1996, the Reserve Bank granted preliminary approval to 16 entities for registration as SDs in the Government securities market on April 7, 1997.
iv) The Reserve Bank's interest rate for liquidity support to PDs was linked to the Bank Rate in respect of Treasury Bills and Central Government dated securities from April 16, 1997
v) In order to activate the repos market so that it serves as an equilibrating force between the money market and the securities market, (a) repo/reverse repo transactions among institutions were extended to all Central Government dated securities; and (b) non-bank holders of SGL Account with the Reserve Bank were allowed entry into reverse repo (but not into repos) transactions with banks/PDs in Treasury Bills of all maturities and all Central Government dated securities.
vi) In order to further activate Treasury Bills market, particularly in the context of the discontinuance of 91 -day tap Treasury Bills and t h e system of a d hoc Treasury Bills, Treasury Bills of various maturities were proposed to be issued to facilitate t h e cash management requirements of various segments of the economy.
vii) Repo/reverse repo transactions were permitted in respect of all Central Government dated securities, besides Treasury Bills of all maturities.
viii) It was decided to issue Treasury Bills of various maturities for facilitating the cash management requirements of various segments of the economy.

Progress of ilnanclal Sector Reforms : 1992-93 to 1996-97
1x1 Effective Aprll 26, 1997, the facility of routing all money transactions was extended to ail the PDs.
x) The Government of India constituted a Monitorlng Group on 'Cash and Debt Management of the Central Government' with representatives from the Government and the Reserve Bank on April 28, 1997.
xi) The Reserve Bank announced a 'Scheme for Payment of Underwriting Fee to PDs whereby a mfnimum of 25 per cent of each issue of Covernment of India dated securities and Treasury Bills would be offered for underwriting by PDs and the underwriting amount and Fee would be determined on the basis of bids submitted and accepted by the Reserve Bank for each Issue, effective June 2, 1997. The Scheme replaces the system of payment of commission to PDs on purchases of Government securities in the primary market, and also the system of fixing commitment percentages For devolvement on each PD.
xii) The Reserve Bank conducted the first auction of 14-day Treasury Bills on June 6, 1997.
xiii) The Monetary and Credit Policy for the second half of t h e year 1997-98 has announced the following measures:
a) effective October 22, 1997, minimum lending limit in the call money market routed through PDs was reduced from Rs. 10 crore to Rs.5 crore; b) in order to promote the retail market segment and to provide greater liquidity to retail investors, effective October 22, 1997, banks were allowed to fieely buy and sell Government securities on an outright basis a t prevailing market prices, without any restriction on the period between sale and purchase, subject to the stipulation that banks should n o t undertake ready forward transactions in Government securities with non-bank clients; c) in order to further help the cash management requirements of various
segments of the economy, the Reserve Bank decided to introduce 28 day Treasury Bill on auction; d) with a view to eliminating the problem of "winners' curse" and broaden the market participation, the Reserve Bank proposed to introduce uniform price auction method in respect of 91 day Treasury Bill auctions, as an experimental measure; e) it has been decided to introduce the practice of notifying amounts in the case of all the auctions, including 364 day and 14-day Treasury Bills. It has been decided that 'non- competitive' bids would be kept outside the notified amount; f) in addition to Flls in the category of 1 00 per cent debt funds, Flls with a ceiling of 30 per cent investment in debt instruments would also be permitted to invest in Government dated securities, within the ceiling of 30 per cent; f) it has been decided that ready forward transactions will be permitted in such of the PSU bonds and private corporate debt securities which are held in dematerialised form in a depository and the transactions are done in recognised stock exchanges; g) the ready forward transactions in PSU bonds a n d private corporate debt securities will be initially permitted among those who operate in ready forward transactions in Government securities.
xiji) On November 18, 1997, the Reserve Bank decided to register nine companies as SDs in the Government securities market, viz., DSP Merrill Lynch, Ceat Financial Services Ltd., Kotak Mahindra Capital Company (Unlimited), Birla Global Finance Co. Ltd., Hoare Govett (India) Securities Ltd., Dil Vikas Finance Ltd., SREI International Securities Ltd., Tower Capital and Securities Pvt. Ltd., and Tata Finance Securities Ltd,, Further, the Reserve Bank granted 'in principle' approval t o two banks, viz., Bank of America and Bank of Madura Ltd. t o b e accredi ted a s SDs in t he Government securities market. The banks would be setting up separate units dedicated to the securities business, in particular, the Government securities market.
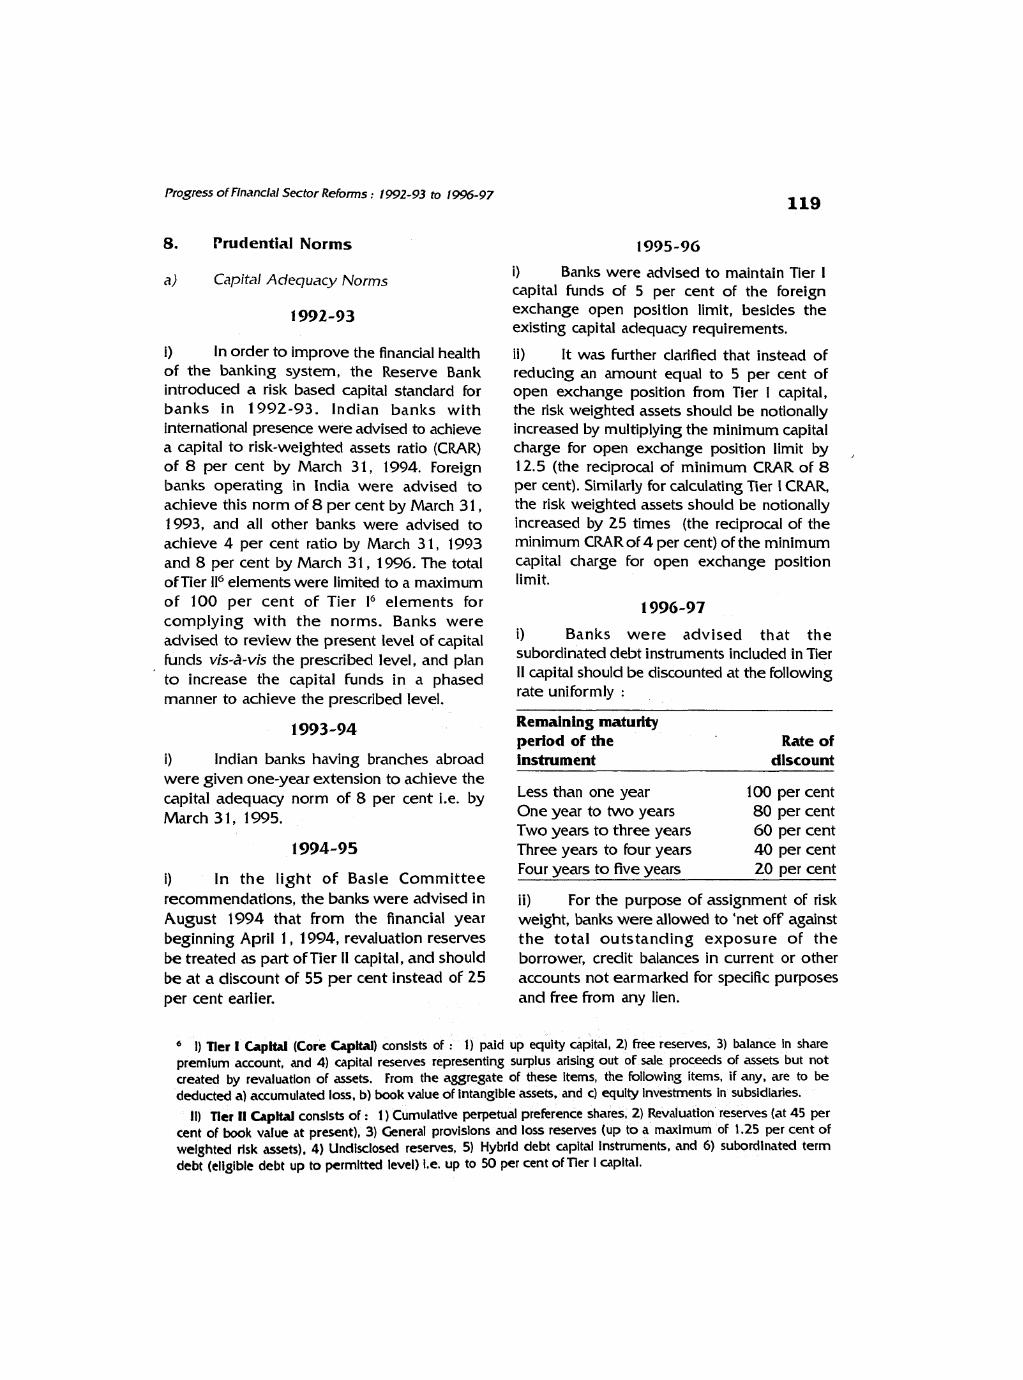
Progress of Flnanclal Sector ReForms : 1992-93 to 19%-97 119
8. Prudential Norms 1095-9G
a) Capital Adequacy Norms
1992-93
1) In order to improve the financial health of the banking system, the Reserve Bank introduced a risk based capital standard for banks in 1992-93. Ind ian banks with international presence were advised to achieve a capital to risk-weighted assets ratio (CRAR) of 8 per cent by March 3 1, 1994. Foreign banks operating in India were advised to achieve this norm of 8 per cent by March 31, 1993, and all other banks were advised to achieve 4 per cent ratio by March 3 1, 1993 and 8 per cent by March 31, 1996. The total of Tier 116 elements were limited to a maximum of 100 per cent of Tier l6 elements for complying with the norms. Banks were advised to review the present level of capital funds vis-a-vis the prescribed level, and plan to increase the capital funds in a phased manner to achieve the prescribed level.
i) Indian banks having branches abroad were given one-year extension to achieve the capital adequacy norm of 8 per cent i.e. by March 3 1, 1995.
i) In the light of Basle Committee recommendations, t h e banks were advised in August 1994 that from the financial year beginning April 1 , 1994, revaluation reserves be treated as part of Tier I1 capital, and should be at a discount of 55 per cent instead of 25 per cent earlier.
i) Banks were advised to maintain Tier I capital funds of 5 per cent of the foreign exchange open position limit, besides the existing capital adequacy requirements.
ii) It was further clarified that instead of reducing a n amount equal to 5 per cent of open exchange position from Tier 1 capital, the risk weighted assets should be notionally increased by multiplying the minimum capital charge for open exchange position limit by , 12.5 (the reciprocal of minimum CRAR of 8 per cent). Similarly for calculating Tier I CRAR, the risk weighted assets should be notionally increased by 25 times (the reciprocal of the minimum CRAR of 4 per cent) of the minimum capital charge for open exchange position limit.
19%-97
i) Banks were advised that the subordinated debt instruments included in Tier I1 capital should be discounted at the following rate uniformly :
Remaining maturity period of the Rate of instrument discount
Less t h a n one year 100 per cent One year to two years 80 per cent Two years to three years 60 per cent Three years to four years 40 per cent Four years to five years 20 per cent
ii) For the purpose of assignment of risk weight, banks were allowed to 'net off against t he total outstanding exposure of the borrower, credit balances in current or other accounts not earmarked for specific purposes and free from any lien.
I) Tier I Capttal (Core Capital) consists of : 1) paid up equity capital, 2) free reserves, 3 ) balance in share premium account, and 4) capital reserves representing Surplus arising out of sale proceeds of assets but not created by revaluation of assets. From the aggregate of these items, the Following items, if any, are to b e deducted a) accumulated loss, b) book value of Intangible assets, and c) equity investments in subsidiaries.
11) Rer I1 Capttal consists of : 1) Cumulative perpetual preference shares, 2) Revaluation reserves (at 45 per cent of book value at present), 3) General provisions and loss reserves (up to a maximum of 1.25 per cent of welghted risk assets), 4) Undisclosed reserves, 5) Hybrid debt capital instnrmenk, and 6) subordinated term debt (eligible debt up to permitted level) 1.e. up to 50 per cent of Tier I capital.

I) The State Bank of lndia (SBI) Act, 1955 was amended by promulgating an Ordinance in October 1993 to enhance the scope of the provlslon for partlal private shareholdlng.
ii) SBI was the first publlc sector bank to access the capital market. SBI raised Rs.2,212 crore in the form of capital and Rs. 1,000 crore through bonds. With this, the shareholding of the Reserve Bank in the equity of SBI declined to 66.32 per cent from 98.20 per cent earlier.
ill) The Government of lndia made a provlslon of Rs,5,700 crore in the Union Budget 1993-94 for recapitalisation of nationallsed banks. Recapitalisation of 19 nationalised banks7 was undertaken on January 1 , 1994 and the recipient banks were required to invest the Government's capital subscription in Government bonds known as '10 per cent Recapitalisation Bonds, 2006'.
1) To enable the nationalised banks to raise capital funds fiom the market by way of public issue of shares, the Banking Companies (Acquisition and Transfer of Undertakings) Acts, 19701 1 980 were amended effective July 15, 1994 permitting the nationalised banks to raise capital up to 49 per cent fiom the public.
ii) For further strengthening the capital base of nationalised banks, a sum of Rs.S,6OO crore was provided in the Union Budget 1994-
95. The Government of lndia released an amount of Rs.3.889.2 1 crore on December 1 , 1994 towards additional share capital (Tier I) for 1 3 nationalised banks8 Again, in February 1995, an amount of Rs.473.33 crore was released to 4 nationalised banks viz. Andhra Bank (Rs.75.72 crore), Bank of Maharashtra (Rs.94.6 1 crore), UCO Bank (Rs.235.56 crore), and United Bank of lndia (Rs.67.44 crore). On March 3 1 , 1995 the Government released an amount of Rs.924.58 crore as Tier I1 capital to six nationalised banks, namely, Allahabad Bank (Rs. 101 .GI crore), Bank of lndia (Rs.348.22 crore), Dena Bank (Rs.72.28 crore), Indian Bank (Rs. 180.94 crore), Indian Overseas Bank (Rs.132.74 crore) and Syndicate Bank (Rs.88.79 crore) by subscribing t o t h e promissory notes issued by these banks as part of World Bank's Financial Sector Development Loan, taking the total share capital released to Rs.5287.12 crore.
iii) Oriental Bank of Commerce was the first nationalised bank to access the capital market by raising a sum of Rs.387.24 crore in October 1994 thereby reducing t h e Government equity share in the bank to 66.5 per cent from 100 per cent.
iv) As banks with cumulative losses were not able to set off their losses against their capital, the Banking Companies (Acquisition and Transfer of Undertakings) Acts, 1 970/ 1 980 were amended in January 1995 enabling banks to reduce their paid-up capital subject to the stipulation that the paid-up capital cannot be reduced at any time to below 25 per cent as on the date of the amendment.
Allahabad Bank (Rs.90 cr Bank (Rs. 150 cro crore), Bank of Maharashtra (Rs.150 crore), Canara Ba Corporation Bank (Rs.45 crore), Dena Bank (Rs.130 cr (Rs.705 crore), Oriental Bank of Commerce (Rs.50 crore). Punjab and Sind Bank (Rs.160 crore) Punjab National Bank (Rs.415 crore), Syndicate Bank (Rs.680 crore), UCO Bank (Rs.535 crore). Union Bank of India (Rs.200 crore), United Bank of lndia (Rs.215 crore) and Vijaya Bank (Rs.65 crore).
* Allahabad Bank (Rs.356.20 crore), Andhra Bank (Rs.108.60 crore), Bank of India (Rs.848.38 crore), Bank of Maharashtra (Rs.239.58 crore), Central Bank of India (Rs.632.46 crore), Dena Bank (Rs.6.11 uore), Indian Bank (Rs.230.96 crore), Indian Overseas Bank (Rs.258.60 crore). Punjab and Sind Bank (Rr.116.03 crore), Syndicate Bank (Rs.278.59 crore), UCO Bank (Rs.279.96 crore), United Bank of lndia (Rs.471.43 crore), and Vljaya Bank (Rs.62.3 1 crore).
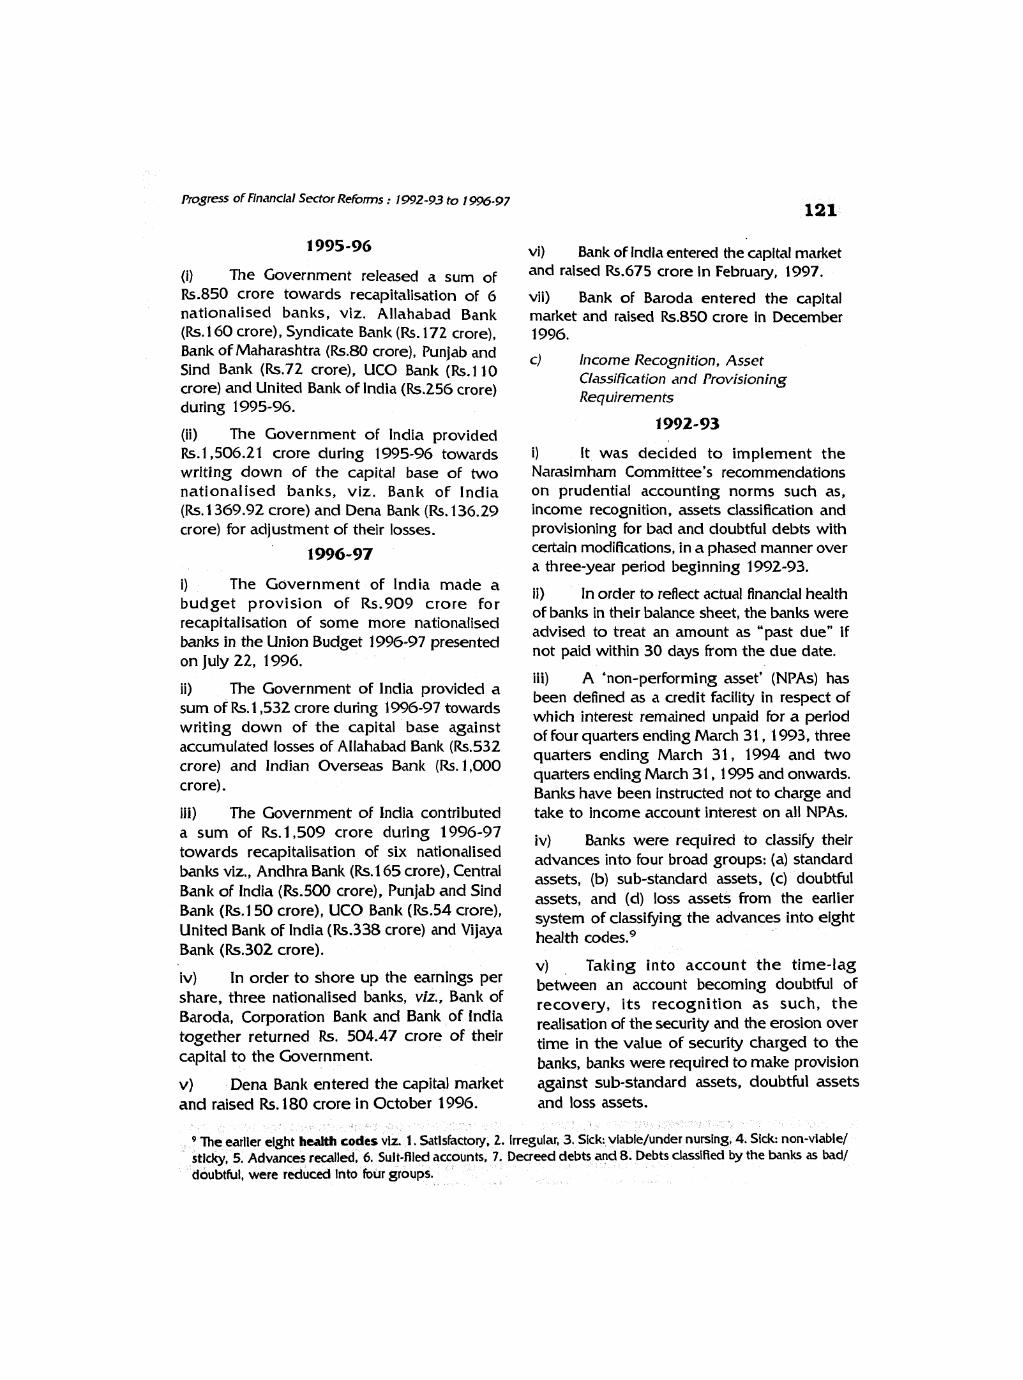
Progress of Financial Sector Rebrms : 1992-93 to 1 9%-97
(i) The Government released a sum of Rs.850 crore towards recapitalisation of 6 nationalised banks, viz. Allahabad Bank (Rs. 160 crore), Syndicate Bank (Rs. 172 crore), Bank of Maharashtra (Rs.80 crore), Punjab and Sind Bank (Rs.72 crore), UCO Bank (Rs.110 crore) and United Bank of lndia (Rs.256 crore) during 1995-96.
(ii) The Government of lndia provided Rs. 1,506.21 crore during 1995-96 towards writing down of the capital base of two nationalised banks, viz. Bank of India (Rs. 1369.92 crore) and Dena Bank (Rs. 136.29 crore) for adjustment of their losses.
i) The Government of India made a budget provision of Rs.909 crore for recapitalisation of some more nationalised banks in the Union Budget 1996-97 presented on luly 22, 1996. -
ii) The Government of India provided a sum of Rs. 1,532 crore during 1996-97 towards writing down of t h e capital base against accumulated losses of Allahabad Bank (Rs.532 crore) and Indian Overseas Bank (Rs. 1,000 crore).
iii) The Government of India contributed a sum of Rs.1,509 crore during 1996-97 towards recapitalisation of six nationalised banks viz., Andhra Bank (Rs.165 crore), Central Bank of India (Rs.500 crore), Punjab and Sind Bank (Rs. 1 50 crore), UCO Bank (Rs.54 crore), United Bank of lndia (Rs.338 crore) and Vijaya Bank (Rs.302 crore).
vi) Bank of lndia entered the capital market and raised Rs.675 crore in February, 1997.
vii) Bank of Baroda entered the citpltal market and raised Rs.850 crore in December 1996.
c) Income Recognition, Asset Classification and Provisioning Requirements
i) It was decided to implement the Narasimham Committee's recommendations on prudential accounting norms such as, income recognition, assets classification and provisioning for bad and doubtful debts with certain modifications, in a phased manner over a three-year period beginning 1992-83.
ii) In order to reflect actual financial health of banks in their balance sheet, the banks were advised to treat an amount as "past due" if not paid within 30 days from t h e due date.
iii) A 'non-performing asset' (NPAs) has been defined as a credit facility in respect of which interest remained unpaid for a period of four quarters ending March 31 , 1993, three quarters ending March 31 , 1994 and two quarters ending March 31 , 1995 and onwards. Banks have been instructed not to charge and take to income account interest on all NPAs.
iv) Banks were required to classijl their advances into four broad groups: (a) standard assets, (b) sub-standard assets, (c) doubtful assets, and (d) loss assets from the earlier system of classifying the advances into eight health codes.g
v) T a k i n g into account t h e time-lag iv) In Order to shore the Per beween an account becoming doubtful of share, three nationalised banks, viz., Bank of recovery, its recognition as such, the Baroda, Corporation Bank and Bank of India realisation of the security and the erosion over together returned Rs. 504.47 crore of their in the of security charged to the capital to the Government. banks, banks were required to make provision v ) Dena Bank entered t h e capital market against sub-standard assets, doubtful assets and raised Rs. 180 crore in October 1996. and loss assets.
Sick: non-viable/ e bank. as bad/
doubtful, were reduced Into four groups.

vl) Regarding accounting standards for Rnal accounts as on March 3 1 , 1W3, together
Investments, banks were advlsed to bifurcate with the hesh provisioning in respect of credit their Investments in approved securities Into facllltles identified as non-performing assets 'permanent* and 'current' Investments. during the year ending March 3 1 , 1994, Permanent Investments are those whlch banks should be made as on that date. Intend to hold till maturity while current investments are those which banks intend to deal in, i.e. buy and sell on a day-to-day basis. The ratio of 'permanent' and 'current' Investment was fixed 70:30 per cent for the year 1992-93. Depreciation in respect of permanent investments need not be provlded but for current investments, depreciation should be fully provlded. if securltles are sold hom 'permaient' category and loss incurred, It should be written off.
vli) Foreign currency assets and llabllities and unmatured spot and forward foreign exchange transactions were required to be revalued on a monthly his ; spot and forward transactions were to be valued at the then prevailing spot and forward foreign exchange rates, respectively.
viii) An informal group consisting of the Reserve Bank and commercial banks was constituted to look into the practical difficulties in Implementing Income recognition and provisioning norms. Based on the suggestions of this Group, some relaxations were introduced with regard to 'past due' status of the account, treatment of non-performing assets of advances granted for agricultural proposes, treatment of loss assets, consortium advances, and phasing of provisioning for NPAs and depreciation in investments for the two accounting years ending March 3 1 , 1 993 and March 3 1 , 1994.
ix) In March 1993, banks were advised to make 100 per cent provision in respect of loss assets, and not less than 30 per cent of the total provisioning needed in .respect of sub-standard and doubtful advances and advances with outstanding balance of less than Rs.25,000 for the year ended March 31, 1993. The balance of 70 per cent provisioning needed in respect of the above categories of advances, not provided for by banks in their
x) From a practial viewpoint, in respect of advances with an outstanding balances of less than Rs.25,000, banks were advised to make aggregate provisioning to the extent of 2.5 per cent of the total outstanding for the year 1992-93, rather than a case by case evaluation of a very large number of small accounts.
i) Banks were advised to make full stipulated provision against NPAs identified during 1993-94 besides, the carried forward provision for 1 992-93.
i i ) In respect of advances with balances of less than Rs.25,000, the provision for the year ended March 31, 1994 was enhanced from 2.5 per cent in 1992-93 to 5 per cent of such advances without reckoning the value of security in any form and the DICGC/ECGC guarantees.
iii) The ratio of 'permanent' and 'current' investment of banla in the approved securities was continued at 70:30 per cent for the year ended March, 1994.
1994-95
i) The provisioning norms were further tightened. The provisioning requirement for advances with balances of less ihan Rs.25,000 was raised from 5 per cent of the aggregate amount outstanding in 1993-94 to 7.5 per cent for the year ending March 3 1, 1995, and further to 10 per cent for the year ending March 3 1 , 1996. Banks, which were in a position to make provisions according to the asset cl&ification norms set out in April 1 W2, were Free to do so. From the year 1996-97, the provisioning requirement for NPAs with balances of less than Rs.25,000 was to be made as per the classification of advances into four groups.

nogress of Financial Sector Rebrms : 1992-93 to 1996-97
ii) The ratio of 'permanent' and 'current' investment of banks in the approved securities was prescribed at 70:30 per cent for the year ended March 1995.
i) As yield to maturity WM) on approved securities was increasing at that time as also t h e need for a rapid transition to a fully marked to market basis of valuation of investments, on June 20, 1995, the Reserve Bank reduced the ratio of 'permanent' and 'current' investment of banks in approved securities to 60:40 for the year ending March 1 996.
ii) On April 3, 1995, banks were advised that interest accrued and credited to income account during the year ended March 1994, which has not been realised in respect of accounts identified as NPAs for the first time during the year ended March 31, 1995, should be reversed or provided for as o n that date.
iii) On April 3, 1 995, banks were advised that in respect of additional facilities sanctioned under the rehabilitation package approved by the Board for Industrial and Financial Reconstruction (BIFR)/term lending institutions, no provision is required to be made for a period of one year from the date of disbursement.
iv) Banks were advised that from t h e year 1995-96 onwards, for arriving at the provision required to be made for doubtful assets, t h e realisable value of the securities should be deducted from the outstanding balance before the ECGC/DIGC guarantee is off-set in respect of advances guaranteed by ECGC/DICGC.
V) Banks were advised that in respect of the capitalisation bonds, depreciation need not b e provided since it represents capital. However, in case t he banks acquire recapitalisation bonds of other banks for investment purposes, the depreciation has to b e provided.
i) The ratio of 'permanent' and 'current' investment of banks in approved securities was further reduced to 50:SO for the year ending March 1997.
ii) On December 24, 1996, banks were granted a n extension of one year 1.e. up to March 31 , 1998, to complete the exercise of classifying accounts with outstanding of less than Rs.25,000/- into the four asset categories. Pending s u c h classification, a provision of 15 per cent of the aggregate amount outstanding was stipulated for such advances for the year 1996-97 from 1 0 per cent for the year ended March 31, 1996.
iii) On January 29, 1997, regarding classification of NPA, it was clarified as under:
a) An advance account should not be classified as NPA based merely on temporary deficiencies s u c h as non-availability of adequate drawing power, balance outstanding exceeding the limit, non-submission of stock statement, the non-renewal of the limits on the due date, etc.; b) if accounts of the borrowers have been regularised before t h e balance sheet date by repayments of overdue amounts from genuine sources, such accounts need not be treated as NPA even if t h e interest/instalments of principal remained past due for any two quarters of the year. Accounts with potential threats of recovery should be straightway classified as doubtful asset or loss asset, as appropriate, irrespective of the period for which they remained as NPA ; and c) in respect of consortium advances, each bank was allowed to classify t h e borrowal accounts according to its record of recovery and factors having a bearing o n the recoverability of the advances, as in the case of multiple banking arrangement.
iv) New private sector banks were advised to 'mark to market' their ent i re investments in approved securities as at the end of March 1997 and thereafter.

hog- olFinandal Sector Rebrms : 1992-93 to 1996-97
V) On january 29, 1997, banks were advised that income from dividend on shares of corporate bodies and unlts of mutual funds should be booked on cash basis. However, if dividend on shares has been declared by the corporate body In Its Annual General Meeting and the owners right to receive payment is established, banks may book income from such dividend on accrual basis.
1997-98
1) On Aprll9, 1997, banks were advised that advances granted for agricultural purposes where Interest/lnstalment remained in arrears for more than two quarters (as against two seasons of harvest or two half years earlier) it should be treated as NPA from the accounting year 1997-98.
ii) On April 9, 1997, banks were advised that any excess provision for depreciation in investments held by banks as at the end of the previous financial year (1 995-96) over the requirement for the same for the current year (1996-97) should be taken to the profit and loss account under the head 'Expenditure - Provisions and Contingencies' as a credit item. Thereafter, an equivalent amount should b e appropriated to 'Capital Reserve' account and shown under 'Reserves and Surplus' in the balance sheet. The excess provision towards depreciation in investments held under 'Reserves and Surplus* would be eligible for inclusion in Tier If capital.
iii) On June 1 2, 1 997, banks were advised that excess provisions towards depreciation on investments should be transferred to Capital Reserve account by way of appropriation under the head 'Appropriation to Profit and Loss Account'.
iv) The ratio of 'permanent' and 'current' investments of banks in the approved securities was prescribed to be 40:GO for the year 1 997-98.
v) Banks were allowed to book income on accrual basis on securities of corporate
bodjes/PSUs in respect of which the payment of interest and repayment of principal were guaranteed by the Central Government or State Governments. Banks might book income from dividend on shares of corporate bodies on accrual basis provided dividend o n shares were declared by the corporate bodies in the Annual General Meeting and the owner's right to receive payment was established.
vi) Banks were advised that the amount to be transferred to 'Capital Reserve' account should be determined net of taxes, if any, and net of transfer to statutory reserves as applicable to such excess provision.
vii) Banks were advised to make the following additional disclosures in the 'Notes on Account* to the balance sheet for the year ended March 3 1 , 1997 : a) percentage of net NPAs to net advances, b) the amounts of provisions made towards NPA, depreciation in the value of investments, and lncome Tax during the year.
viii) Banks were advised to suitably indicate the amount of subordinated debt raised as Tier-Il Capital by way of explanatory notes/ remarks in the balance sheet as well as in Schedule 5 relating to "Other Liabilities and Provisions".
ix) Banks were advised to indicate the gross value of investments in lndia and outside India, the aggregate of provisions for depreciation separately on investments in and outside lndia and arrive at the net value of investments in and outside India, and the total of these should be carried to the Balance Sheet.
ci) Credit Delivery System
i) Banks were advised that for calculation of MPBF only two-thirds of term loan instalment falling due for payment during the next 12 months should be treated as part of current liabilities from January 8, 1993. In April

progress of Financial Sector Refvrms : 1992-93 to 1 1 - 9 7
1993, however, banks were advised that only one-third of s u c h instalment due, should be treated as part of current liabilities.
i) Banks were advised that term loan instalment, falling due for payment during the next 12 months need not be treated as current liabilities for the purpose of the calculation of MPBF.
ii) Banks were given freedom to decide on their own, the levels of holdings of ir* rentory and receivables of various industries while assessing credit requirements of borrowers.
iii) The threshold limit for obligatory consortium lending was raised from Rs.5 crore to Rs.50 crore.
i) From April 17, 1995, a Loan System for Delivery of Bank Credit for worlcing capital purpose was introduced to bring about greater discipline in credit utilisation and to gain better control over credit flows in respect of borrowers with assessed MPBF of Rs.20 crore and above. The 'cash credit component' was restricted to 75 per cent of MPBF while the 'loan component' was fixed at 25 per cent.
ii) With a view to further strengthening t h e discipline in the utilisation of bank credit, effective October 5, 1995, in the case of borrowers with assessed working capital limit of Rs.20 crore and above the 'cash credit component' was reduced to 60 per cent of t h e assessed MPBF fiom 75 per cent and the 'loan component' was raised to 40 per cent from 25 per cent.
iii) In view of the introduction of the Loan System effective April 2 1, 1995, the extent of CP to be issued by a company was restricted to 75 per cent of the 'cash credit component' of t h e working capital limit instead of 75 per cent of the working capital (fund-based) limit as hitherto,
1) In order to further strengthen the discipline in the utilisation of bank credit, effective April 18, 1996, the 'cash credit component' under the 'Loan System for Delivery of Bank Credit' was reduced to 40 per cent of MPBF and the 'loan component' was increased to 60 per cent in case of borrowers with assessed MPBF of Rs. 20 crore and above. Furthermore, the 'Loan System' was extended to borrowers with assessed MPBF of Rs.10 crore to Rs.20 crore with the 'cash credit component' fixed at 60 per cent while the 'loan component' fixed at 40 per cent.
ii) The mandatory requirement of levy of commitment charge on the unutilized portion of the worlcing capital credit limits of Rs.1 crore and above was withdrawn effective July 1, 1996, and banks were advised to evolve their own guidelines for ensuring credit discipline and levy of commitment charge.
iii) The mandatory requirement of levy of additional interest of two percentage points above the cash credit on the portion of the book-debt finance in excess of 75 per cent of the limits sanctioned for financing of inland credit sales to borrowers with fund-based credit limits of Rs.5 crore and above, was withdrawn effective July 1 , 1996.
iv) Borrowers with assessed MPBF of Rs.20 crore and above were permitted to issue CPs to the entire extent of 'cash credit component' i.e. 40 per cent of MPBF as against 75 per cent earlier while for borrowers with assessed MPBF of Rs.10 crore to Rs.20 crore, t h e amount of issuable CP was restricted to 75 per cent of the 'cash credit component'.
V) Effective October 19, 19% 'cash credit component' was further reduced from 40 per cent to 25 per cent for borrowers with assessed MPBF of Rs.20 crore and above. For borrowers with assessed MPBF of k.10 crore to Rs.20 crore, the 'cash credit component' was fixed at 40 per cent while the 'loan component' was fixed at 60 per cent.

Progress of Flnandal Sector Reiorms : 1992-93 to 1996-97
vl) In order to impart greater flexibility to the borrowers, (a) the minimum period of 'loan component' was reduced to six months as against one year earlier with a provision of renewal/roll-over, and (b) 'Bills Ilmit' for inland sales was allowed to be carved out of the 'loan component'. In view of the further reduction In the 'cash credit component', the amount of CPs to be Issued by corporates would not be restricted to the 'cash credit component' of the MPBF.
vii) Effective October 19, 1996, the partlclpatlng banks In a consortium were permitted to frame the ground rules of the consortium arrangement.
i) Effective April 1 5, 1997, for borrowers enjoying working capital credit limit of Rs.20 crore and above from the banking system, the 'loan component' was raised to 80 per cent from 75 per cent earlier. For borrowers with working capital limit of Rs. 10 crore to Rs.20 crore, the 'loan component' was raised to 75 per cent from 60 per cent earlier. Banks, with the approval of their respective Boards, might identify business activities cyclical or seasonal in nature which could be exempted from the Loan System for Delivery of Bank Credit. Further, the minimum period of loan could be fixed by the concerned banks. Consistent with the enhancement in the 'loan component', its spread over various maturities might be decided by banks, subject to roll- over. The borrowers, with the consent of their banks, are permitted to invest their short term/ temporary surplus funds in short term money market instruments like CPs, CDs and in term deposit with bank, etc.
ii) In order to provide greater freedom in assessing the working capital requirements of borrowers, effective April 15, 1997, all instructions relating to MPBF were withdrawn. Banks were advised to evolve their own methods for assessment of working capital requirements of borrowers; banks were given freedom to adopt any of the prevailing
methods such as the turnover method, the cash budget system, the MPBF system with necessary modifications or any other system. However, the loan policy in respect of each broad category of industry is required to be laid down by each bank with the approval of the respective Board.
iii) The mandatory requirement on formation of consortium for borrowal accounts with limit of Rs.50 crore and above from more than one bank has been withdrawn in April 1997.
iv) Effective October 22, 1997, the 'loan component' for borrowers with worlting capital credit limits of Rs. 10 crore to Rs.20 crore was raised to 80 per cent, thereby making uniform level for borrowers with worlting capital credit limits of Rs.20 crore or above.
e) Recovery of Bank Loans and Disclosu~e on Defaulting Borrowers
i) In order to effect speedy recovery of loans, a new Act viz., 'Recovery of Debts Due to Banks and Financial Institutions Act, 1993', for the creation of Special Recovery Tribunals for banks and financial institution was passed by the Parliament on August 10, 1993. The Act came into effect from August 1 7, 1993.
i> In April 1994, the Reserve Bank announced a scheme for disclosure of information regarding defaulting borrowers of banks and Fls with outstandings aggregating Rs. 1 crore and above as o n March 31 and September 30, every year. A list of suit-filed accounts would also be brought out every year.
ii) Debt Recovery Tribunals at Calcutta, Delhi, Bangalore, Jaipur and Ahmedabad and Appellate Tribunal at Mumbai were set up. However, Delhi Hlgh Court quashed the notification of constituting the Tribunal for Delhl region in March 1995.

Progress of Financial Sector Rebrms : 1 WZ-93 to 1996-97
i ) In view of the need to keep NPAs at a low level, on July 28, 1995, the Reserve Bank advised banks to have loan recovery policy including norms for write-off.
ii) On April 21 , 1995, the Supreme Court stayed the operation of the Delhi High Court judgement which had quashed the notification constituting the Debt Recovery Tribunal for Delhi region and admitted special leave petition filed on behalf of the Government. Subsequently, the Supreme Court modified its order on March 18, 1996 directing that the Debts Recovery Tribunals established under the Recovery of Debt due to Banks and Financial Institutions Act, 1993 shall resume their functions. Accordingly, three more Debt Recovery Tribunals at Chennai, Guwahati and Patna were established.
6 Term Lendjng/Brjdge Loan Norms
i ) Banks were permitted to provide term loans t o entrepreneurs/private sector undertakings for technically feasible, financially viable and bankable projects involving creation of infrastructure facilities subject to the terms and conditions and extent of participation governing sanction of term loans. However, banks were not allowed to extend term loans for infrastructure facilities created out of budgetary allocations.
i ) Banks were permitted to extend bridge loans/interim finance against capital issues/ market borrowing (domestic) up to 50 per cent of the amount 'called up' on each occasion without the prior approval of the Reserve Bank. However, sanction of bridge loan against Euro-issue was subject to prior approval of the Reserve Bank.
l i ) Banks' participation in term loans was linked to 'quantum of loan' instead of 'cost of project' and banks were allowed to lend
individually up to Rs.50 crore, and the banking system collectively up to Rs.200 crore for each project, subject to compliance with prudential exposure norms.
i In October 1994, t h e ceiling of Rs.50 crore for each bank for grant of term loans for any project was abolished and the overall limit of Rs.200 crore for the banking system as a whole was raised to Rs.500 crore for a single project.
i In view of the possible misuse and risk attached to the extension of bridge loans/ interim finance by banks and Fls against public issues and/or borrowings from the marl<et, sanction of bridge loans by banlts/Fls to all companies was banned from April 1 7, 1995.
ii) Effective July 25, 1995, banks were advised to scrupulously follow the guidelines in the Accounting Standard (AS7) prescribedl issued by the Institute of Chartered Accountants of India (ICAI) for the construction companies.
iii) In October 1995, banks were allowed to sanction bridge loans against the commitment of financial institutions and/or banks where t h e lending institutions faced with temporary liquidity constraint subject to the compliance of certain conditions.
iv) Effective December 22, 1995, banks were allowed to sanction term finance up to Rs. 1,000 crore for each power generation project, subject to certain terms and conditions.
i) In June 1997, banks were advised to compute their share of the housing finance allocation for the year 1997-98 at 1 -5 per cent of their incremental deposit as on the last reporting Friday of March 1997 over the corresponding figure of the last reporting

Ptosrcss of Hnandal Sector Relbnns : 1992-93 to 1 996-97
Friday of March 19% or the amount of their housing flnance allocation flxed for the year 196-97 whichever is higher, This was the i) Effective September 6, 1996, the limit
minimum housing Flnance dlocation and banks for sanction of advances against shares and
were free to exceed this level depending upon advances to individuals was raised from Rs.5
their resources position. lakh to Rs. 10 lakh.
il) Effective Octokr 22, 1997, banks were permitted to sanctlon bridge loans to companies against expected equity flows/ issues with the stipulation that such bridge loans should not exceed one year period and should be accommodated within the ceiling of 5 per cent of incremental deposits prescribed for banks' investment in shares.
i) Banks' Investment in PSU bonds which was subject to a ceiling of 5 per cent of incremental deposits of the previous year, was withdrawn effective January 25, 1994.
1) In October 1994, standby facility for CP was abolished. Thus when CPS were issued, banks were advised to effect a 'pro tanto' reduction in the cash credit limit.
1 995-96
i) On April 4, 1995, banks were advised to desist from acquiring shares, debentures, etc. in the secondary market.
ii) Effective July 1 7, 1 9 5 , the period for transferring the shares held by banks in their
ti) In October 1996, the prohibition on banks for acquiring shares and debentures of corporate bodies in the secondary market was removed and banks were permitted to purchase shares and debentures in the secondary market within the ceiling of 5 per cent of incremental deposits of the previous year prescribed for investments in corporate shares, debentures and units of mutual funds. However, such purchases (other than inter- bank transactions) should be only through recognized stock exchanges and registered stock brokers.
iii) Effective November 30, 1996, banks were also permitted to purchase PSU bonds in the secondary market (other than inter-bank transactions) provided these bonds have been issued and registered in the name of t h e seller and purchased through recognized stock exchanges and registered stock brokers.
iv) Effective November 30, 1996, the requirement of sanctioning advances exceeding Rs.5 lakh against shares and debentures by the Board/Committee of Directors was withdrawn and banks were given freedom to decide the appropriate levels of authority for sanction of such advances.
1997-98
names against advances for share and stock i ) To enable corporates to meet the brokers held by them as stock-in-trade, was promoters' contribution to the ecluity of new extended to 9 months from a period of more companies in anticipation of raising resources, than 3 months earlier. Besides, the monetary effedive April 15, 1997, banks were limit such advances was raised to Rs.5 to extend loans to corporates against shares lakh from Rs.3 lakh earlier. held by them within the 5 per cent ceiling on iii) Effective February 8, 1 996, investments investment in shares, etc. by banks in the subordinated debt of other
ji) Effective April 15, 1997, banksq bank were made subject to a ceiling of 5 per investment i n preference shares/non- cent as to jnvestment in shares and convertible debentures/bonds of private debentures of corporate bodies.
corporate bodies was excluded from the 5

progress of Financial Sector Rehrms : 1992-93 to 1996-97
per cent ceiling of investment of their incremental deposits of the previous year.
iii) Effective May 28, 1997, investments in units of mutual funds schemes where the corpus is invested exclusively in debt instruments, was excluded from the 5 per cent ceiling of investment. Accordingly, the limit of 5 per cent of incremental deposits of the previous year will be applicable to investments in ordinary shares, including PSU shares and convertible debentures of corporate, and in units of mutual fund schemes, t h e corpus of which is not exclusively invested in corporate debt instruments.
h) Functional A utonomy in Na tionalised Banlcs
i) Effective March 25, 1997, t h e Reserve Bank, in consultation with the Government of India, delegated powers of sanctioning of credit proposals both funded and non-funded to Chairmen and Managing Directors (CMDs)/ Executive Directors (EDs) of all nationalised banks as under :
a) the Board may delegate suitable powers to t h e CMD keeping in view the size and business of the bank subject to a ceiling of Rs.15 crore in the case of banks having advances up to Rs.5,000 crore, and Rs.30 crore in respect of banks having advances beyond Rs.5,000 crore; b) the Board may delegate suitable powers to the CMD in respect of proposals involving write off/waiver, remission, etc. up to Rs. 10 lakh; c) the Board may decide on the extent of powers to be delegated to the CMD in respect of proposals of approval on capital and revenue expenditure and those relating to acquisition and hiring of premises, filing of suits/appeals, defending them, etc . , investments in Government and other approved securities and shares and debentures of companies including underwriting, donations, and any other matter referred to the CMD by the Board; d) after t h e Board takes a view on t h e
delegation of the powers to the CMD, ED may be delegated powers to the extent of 75 per cent of those delegated to the CMD; and e) consequent to the revision in the delegation of powers to CMD and ED, t h e Board may review the powers of other functionaries of t h e b a n k for revision a s considered appropriate.
9. Technological Issues
1993-94
i ) Decks were cleared for further computerisation of banks following agreements with trade union in October 1993.
i A High Power Committee headed by Shri W.S. Saraf, set up to study the technology issues relating to payment and settlement system in the banking industry, submitted its report on December 9, 1994.
i) The Committee (Chairperson : Smt. K.S. Shere) set up in August 1995 by t h e Reserve Bank to study all aspects of Electronic Funds Transfer (EFT) for instituting an Em system in India, submitted its report in January 18, 1 996.
ii) Under the World Bank's Financial Sector Development Project, US $ 150 million was provided for modernisation and institutional development to the parpicipating bank. These banks could obtain loan from this fund for automation and computerisation.
18. Regulatory and Supervisory Issues
a) Supervisory Issues
1993-94
i) In order t o exercise integrated supervision over the credit institutions in the financial system and to ensure implementation of regulations in the areas of credit management, asset classification, income recognition, capital adequacy and treasury operations, proposal to set up a Board for

Progress of Flnanclal Sector Reforms : 1992-93 to 1996-97
Flnanclal Supervlslon (BFS) within the Reserve Bank was taken up in May 1993. Operational support t o BFS came from t h e new Department of Supervision (DoS) set up within the Reserve Bank in December 1993 and started exercising supervision over commercial banks.
I) With various segments of the Financial Sector ge t t ing closely interlinked and integrated, the BFS was constituted on November 16, 1994 under the Chairmanship of Governor of the Reserve Bank with a Deputy Governor as Vice Chairman, Deputy Governors and four members of the Central Board as other members. BFS and the Advisory Council constituted under the RBI (BFS) Regulations, 1994 would each have a term of two years. BFS exercises integrated supervision in relation to commercial banks, all India financial institutions (AIFls) and non-banking financial companies (NBFCs).
i) A Worlting Group set up in February 1995 for reviewing the internal control and inspection/audit system in banlcs (Chairman Shri R. Jilani), submitted its report on September 20, 1 995.
ii) The Working Group to 'Review the System of On-Site Supervision over Banks' headed by Shri S. Padmanabhan, constituted in February 1995, submitted its report on November 8, 1995. The Working Group has recommended far reaching changes in bank inspections, including, inter alia : targeted appraisals of major portfolios and control systems along with periodical full scope statutory inspections, discriminative approach to supervision and inspections by separating sound and problem banks with focus on the latter, introduction of a rating methodology for the banks on the lines of the widely adopted CAMEL model (Capital Adequacy, Assets Quality, Management, Earnings and Liquidity) with suitable modification and a
focussed approach to follow up on inspection reports and for supervisoly interventions.
I>) Private Sector Banks
i) In order t o introduce grea te r competition in the banking system, the Reserve Bank issued guidelines in January 1993 for the establishment of new banks in the private sector.
ii) The important guidelines in respect of the entry of new banks in the private sector apart from the required minimum paid-up capital of Rs.100 crore and the prudential accounting norms and the capital adequacy, etc. are: (a) listing of their shares on stock exchanges, (b) their management set-up, liquidity requirements, etc. to be governed by the provisions of the Reserve Bank of India Act, 1934, and the Banking Regulation Act, 1949, and also the directives, instructions/ guidelines and advice given by the Reserve Bank, (c) observance of directions in regard to priority sector lending with modification allowed in the composition of such lending for an initial period of three years, (d) voting rights of an individual shareholder shall be governed by a ceiling of one per cent of total voting rights as stipulated by the Banking Regulation Act, 1949 (exemption, however, may be granted under Section 53 of the said Act to public financial institutions), (e) the new banks shall not be allowed t o s e t u p a subsidiary or mutual fund for at least three years after its establishment, and (0 the banks shall make use of modern infrastructural facilities to provide good customer service as also institute a high powered customer grievances cell t o handle customer complaints.
i) The Banking Regulation Act, 1949 was amended In February 1994 for raising the ceiling of voting rights of an individual shareholder in a private bank from one per cent to ten per cent.

Progress of Financial Sector Rebrms : 1992-93 to 1996-97
d 994-95 d) Forei~n Bar~lts
i ) Six new private banks, out of 10 banks 1996-97 aproved viz., UTI Bank Ltd., lnduslnd Bank Ltd., lClCl Banking Corporation Ltd., Global Trust Bank Ltd., Centurion Bank Ltd., and HDFC Bank Ltd., commenced banking business during t h e year.
i Four more new private banks viz., Times Bank Ltd., Bank of Punjab Ltd., Development Credit Bank Ltd., (by conversiton of Development Co-operative Bank Ltd.) and IDBI Bank Ltd., became operational during the year, taking the total to ten. Two more 'in principle' approvals were granted during the year.
i New private sector banks were permitted to open rural branches without insisting on t h e recommentations of Directorate of Institutional Finance of respective State Governments. However they should accept the share of Annual Credit Plan if allotted by District Consultative Committee.
4 Local Area Banl<s
i ) The Union Budget 1996-97 presented o n July 22, 1996, proposed setting up of new private local area banks with jurisdiction over two or three contiguous districts.
ii) On August 24, 1996, guidelines were issued for setting up of new private local area banks. A minimum paid-up capital of Rs. 5 crore was stipulated for such banks.
iii) Onjanuary15,1997,theReserveBank granted ' in principle' approval for establishment of three Local Area Banks.
1) During the year 1996-97, six new foreign banks opened their branches in India.They were : Krung Thai Bank PLC, Oversea-Chinese Banking Corporation, Commercial Bank of Korea, Hanil Bank, Surnitomo Bank and Toronto Dominion Bank. With this, total number of foreign banks and their branches in India stood at 42 and 182 respectively.
e) Ban/< Branch Licensing
i) The Reserve Bank's Branch Licensing Policy for 1990-95 was changed in 1992 in response to t h e Naramimham Committee recommendations providing operational autonomy to banks to rationalise their branch network. Banks were permitted to shift their existing branches within the same locality, open certain type of specialised branches, convert the existing non-viable rural branches into satellite offices, spin-off business of a branch, and open extension counter/ controlling officers/administrative units without prior approval of the Reserve Bank.
i i) Banks which attained the stipulated capital adequacy norms and follow the prudential accounting standards were permitted to set up new branch offices/ upgrade the extension counters into full- fledged branches without t h e prior approval of the Reserve Bank.
i In August 1993, banks were allowed to close (with the Reserve Bank approval), one loss making branch at rural centres served by two commercial bank branches (excluding RRBs) by mutual consent. Such proposals should have t h e recommendation of t h e concerned District Consultative Committee and the State Government.

11) In December 1993, RRBs were allowd to relmte thelr loss Incurring branches at new places within their service arealared of operation.
ill) New private sector banks which entered the banking sector In 1994 requlrd to open 25 per cent of their total branches In rural/semi-urban areas.
1) In J u n e 1994, banks which attained capital adequacy ratio of 8 per cent, earned net proflt for three consecutive years, having NPAs not more than 15 per cent of total outstanding loans and a mlnimum owned funds of Rs, I00 crore, were advised to submit to the Reserve Bank a plan of action for opening of new branches or to upgrade exlsting extension counters during the next one year for prior approval.
ii) In June 1994, banks were advised to open at least one specialised Agricultural Finance Branch in each State to adequately deal with high-tech agricultural financing where they are convenors of the respective State Level Bankers' Committee.
i) In line with the Bhandari Committee's recommendation, the branch licensing policy for RRBs was modified in June 1995 as follows: (a) 70 RRBs were freed from the Service Area obligations and were given freedom to relocate their loss making branches preferably within the same block.or convert them into satellite/mobile offices; (b) two loss making branches of the same RRB within five krns. area were permitted to merge; (c) RRBs with Service Area obligations were free to relocate loss-making branches at 'specified centres' within their area subject to the conditions cited above.
ii) During the year ended March 1996, public sector banks have operationalised 136 specialised branches in 85 identified districts and 33 specialised branches in other districts
to cater to the needs of SSI units. With a view to continuing the tempo of opening more speclliseci SSI branches, banks were advised to operationallse 100 more specialised branches.
iii) The banks which fulfil the criteria such as a) CRAR at '8 per cent b) Minimum net owned funds at Rs. 100 crore c) Net profit for 3 consecutive years d) Gross NPA not exceeding 1 5 per cent of total advances were given freedom to open branches.
f ) Priority Sector Lendins
1) Regarding credit delivery to the SSls, the Reserve Bank advised banks a) to step up the credit flow to meet the legitimate requirements of SSI sector in full during the Eighth five-Year Plan, b) to provide worlcing capital limits up to Rs. 100 lakh to SSls, and c) to set up an institutional framework for redressal of grievances of SSI units, as also modified the definition of sick-SSI units so that potentially viable SSI units could be helped in their rehabilitation efforts at an early stage.
ii) Banks were advised to set up State Level Committee for Export Promotion.
iii) In November 1992, it was stipulated that each bank should target to attain a level of export credit of 1 0 per cent of its net credit by the end of June 1 993.
i) Effective April 1993, foreign banks were advised to increase their priority sector advances from 1 5 per cent of their net credit to 32 per cent by March 1994. Within the enhanced target of 32 per cent, two sub- targets of 10 per cent each in respect of advances to (a) small scale industries, and (b) export sector, were fixed.
ii) Government of India redefined SSls with investment in plants and machinery worth up to Rs.60 lakh (Rs.75 lakh in the case of

Progress of flnandal Sector Rebrms : / 992-93 tu 1996-97
ancillary units and export-oriented units). All advances granted to SSIs as per the revised definition were treated as priority sector advances by the Reserve Bank.
i) Banks were advised to consider on merits proposals for term finance/loans in the form of lines of credit to State Industrial Development Corporations (SIDCs) and State Financial Corporations (SFCs) subject to the observance of terms and conditions advised from time to time. The extent of such loans to SSI units would be treated as a part of priority sector lending.
ii) In order to provide purposeful support to the export effort, in cases where letters of credit were opened by the export order holder in favour of sub-suppliers of export orderholders, banks were advised to provide credit to such sub-suppliers within the overall permissible pre-shipment export credit.
i) Banks having a shortfall in achieving the priority sector sub-target of 18 per cent for agriculture were advised to contribute to the Rural Infrastructure Development Fund (RIDF I) with a corpus of Rs.2,000 crore, newly set up at NABARD, an amount equivalent to the shortfall subject to a maximum of 1.5 per cent of the net bank credit which would be treated as priority sector lending.
ii) Banks falling short of achieving t h e priority sector target were advised to provide Rs. 1,000 crore on a consortium basis to the Khadi and Village Industries Commission (KVIC), o n top of lending to t h e Handloom Co-operatives for the purpose of financing viable khadi and village industrial units at 1.5 per cent below the average PLR of five major banlts in t h e consortium which would be reckoned as priority sector lending.
iii) On June 1 3, 1995, weaker sections in the priority sector were redefined as: (a) small and marginal farmers with land holdings of 5
acres and less, landless labourers, tenant fiwmers and share-croppen, (b) artisans In vill?ge and cottage IndusMes where Individual credit requirements do not exceed Rs.25,000, (c) IRDP beneficiaries, (d) Scheduled Castes and Scheduled Tribes, (e) beneficiaries under the DRI and SUME schemes as also those under the Scheme for Liberation and Rehabilitation of Scavengers, and (f) Self-Help Groups under NABARD's pilot projects.
iv) Banks were advised that entire amount of refinance granted by sponsor banks to the RRBs would b e reckoned as priority sector lending.
1996-97
i) On June 10, 1996, banks were advised that credit extended to dealers in drip irrigation/sprinl<ler irrigation systems/ agricultural machinery was eligible to be classified as 'indirect finance to agriculture' under priority sector advances, subject to certain conditions.
ii) As per the Union Budget 1996-97 presented on July 22, 1996, an additional amount of Rs.2,SOO crore was provided for financing rural infrastructure through the RlDF I1 during 1996-97.
iii) In May 1996, the Government of India decided that disbursement of loans under IRDP should be done in a n open manner in the presence of a Committee of Non-Officials.
iv) Effective July 1, 1996, rate of interest payable by NABARD o n deposits in RIDF I was prescribed at 12.5 per cent per annum.
v) On August 1, 1996, banks were advised that all short term advances to traditional plantations (i.e., tea, coffee, rubber and spices) irrespective of the size of holdings would be treated a s direct agricultural advances under priority sector.
vi) The private sector banks falling short of meeting the priority sector lending targets of 40 per cent of net bank credit as on the
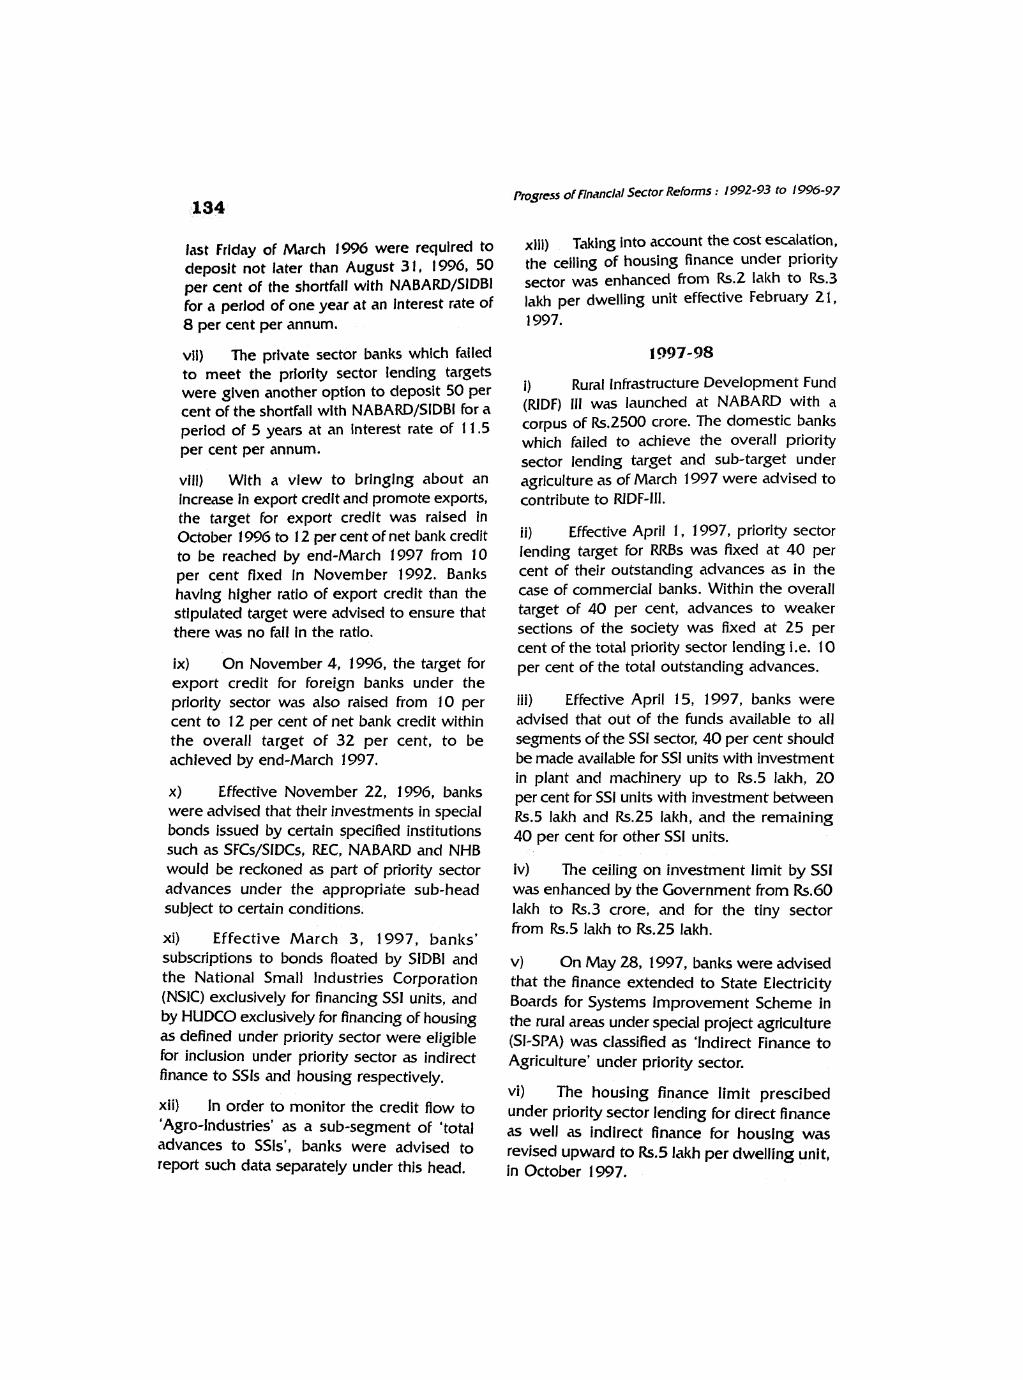
Pmsress of Flnanclal Sector Rehrms : 1992-93 to 19%-97
last Friday of March 1996 were required to deposit not later than August 3 1 , 1996, 50 per cent of the shortfall with NABARD/SIDBi for a perlod of one year at an lnterest rate of 8 per cent per annum.
vii) The private sector banks which failed to meet the priority sector lending targets were given another option to deposit 50 per cent of the shortfall with NABARD/SIDBI for a period of 5 years at an lnterest rate of 11.5 per cent per annum.
vlil) With a view to bringing about an increase in export credit and promote exports, the target for export credit was raised in October 1996 to 12 per cent of net bank credit to be reached by end-March 1997 from 10 per cent fixed In November 1992. Banks having higher ratio of export credit than the stipulated target were advised to ensure that there was no fall in the ratio.
ix) On November 4, 1996, the target for export credit for foreign banks under the priority sector was also raised from 10 per cent to 12 per cent of net bank credit within the overall target of 32 per cent, to b e achieved by end-March 1997.
X ) Effective November 22, 1 996, banks were advised that their investments in special bonds issued by certain specified institutions such as SFG/SlDCs, REC, NABARD and NHB would be recl<oned as part of priority sector advances under the appropriate sub-head subject to certain conditions.
xi) Effective March 3, 1997, banlcs' subscriptions to bonds floated by SIDBl and the National Small Industries Corporation (NSIC) exclusively for financing SSI units, and by HUDCO exclusively for financing of housing as defined under priority sector were eligible for inclusion under priority sector as indirect finance to SSls and housing respectively.
xii) In order to monitor the credit flow to 'Agro-Industries' as a sub-segment of 'total advances to SSls', banks were advised to report such data separately under this head.
xlli) Taking into account the cost escalation, the ceiling of housing finance under priority sector was enhanced from Rs.2 lakh to Rs.3 lakh per dwelling unit effective February 21, 1997.
1) Rural Infrastructure Development Fund (RIDF) Ill was launched at NABARD with a corpus of Rs.2500 crore. The domestic banks which failed to achieve the overall priority sector lending target and sub-target under agriculture as of March 1997 were advised to contribute to RIDF-Ill.
ii) Effective April 1 , 1997, priority sector lending target for RRBs was fixed at 40 per cent of their outstanding advances as in the case of commercial banlcs. Within the overall target of 40 per cent, advances to weaker sections of the society was fixed at 25 per cent of the total priority sector lending i.e. 10 per cent of the total outstanding advances.
iii) Effective April 15, 1997, banks were advised that out of the funds available to all segments of the SSI sector, 40 per cent should be made available for SSI units with investment in plant and machinery up to Rs.5 lakh, 20 per cent for SSI units with investment between Rs.5 lakh and Rs.25 lakh, and the remaining 40 per cent for other SSI units.
iv) The ceiling on investment limit by SSI was enhanced by the Government from Rs.60 lalch to Rs.3 crore, and for the tiny sector from Rs.5 lakh to Rs.25 lakh.
V) On May 28, 1997, banks were advised that the finance extended to State Electricity Boards for Systems Improvement Scheme in the rural areas under special project agriculture (SI-SPA) was classified as 'Indirect Finance to Agriculture' under priority sector.
vi) The housing finance limit prescibed under priority sector lending for direct finance its well as indirect finance for housing was revised upward to Rs.5 lakh per dwelling unit, in October 1997.

Progress of Financial Sector Reforms : 1992-93 to 1996-97
vii) In October 1997, the number of owned vehicles for the purpose of computation of priority sector advances was increased from six to ten in respect of advances to Small Road and Water Transport Operators.
g) Customer Services
i) Customer service in t h e banking sector was perceived as an integral part of the overall financial sector reforms. Accordingly, the Reserve Bank initiated speedy action relating to (a) advancing of working hours, (b) extension of business hours, (c) acceptance of small denomination notes, (d) exchange of soiled and mutilated notes, (e) immediate credit of local cheques up to Rs.5,000, and (9 payment of interest at enhanced rate o n delayed collection of outstation instruments to be credited to cash credit.
i) As a part of implementation of the recommendations of the Goiporia Committee on customer service in banks, the Reserve Bank advised banks to monitor and evaluate the 25 core recommendations of the Committee. Banks' branches were required to send their evaluation reports on a quarterly basis to their controlling offices, which would in turn consolidate them and send a report to their head offices as also to the Reserve Bank at the prescribed intervals (half-yearly).
i) For expeditious and inexpensive resolution of customer complaints against deficiency in banking services, t h e Banlting Ombudsman Scheme (BOS), 1995 was introduced in June 1995. Ten Ombudsmen were appointed, one each a t New Delhi, Mumbai, Bhopal, Bangalore, Chandigarh , Hyderabad, Patna, jaipur, Kanpur and Guwahati.
11) In view of the delay in crediting proceeds of cheques and to improve customer
services, the following steps were prescribed on May 17, 1995 : (a) for local and outstation cheques up to Rs.5,000, h n l ~ were required to provide immediate credit; (b) for local cheques, customers were allowed to use the credited funds latest by the third working day from the date of acceptance of the cheque; and (c) banks were advised to constitute a committee under a General Manager to identify the areas and factors for delays in collection of outstation instruments and take remedial action.
i Standalone ATMs at places other than branches and extension counters were allowed to provide functional facilities such as : (a) PIN changes, (b) requisition for cheque books, (c) statement of accounts, (d) balance enquiry, and (e) inter-account transfer (at same centre).
ii) F o u r Banking Ombudsmen were appointed during 1996-97 at Bhubaneshwar, Chennai, Calcutta and Ahmedabad taking the total number of Banking Ombudsmen in the country to 14.
i) Banks were advised to extend the facility of affording immediate credit up to Rs.5,000 in respect of local cheques to t h e customers who wish to avail of the facility and are prepared to bear charges of Rs.5 per instrument.
ii) With the appointment of the 15th Banking Ombudsman at Thiruvananthapuram in September 1997, all t h e Sates and a Union Territory Administrations in the country have been brought under the purview of the BOS, 1995.
h) Preventing frauds and Malpractices
i) Banks were advised to implement the recommendations of A. Ghosh Committee on frauds and malpractices in banks.

Progress of fln;mcial Sector Rebnns : 1992-93 to 1995-97
1) In order to tighten the monitoring 1994-95 system relating to opening of deposit and
i) As recommended by the Bhandari other accounts and operations therein, effective May 4, 1995, banks were advised
Committee, 49 RRBs were taken up for restructuring and revival during the year.
to devise a system of close watch on new deposit accounts and cash deposits, and wlthdrawats of Rs. 10 lakh and above.
1) Banks were advised to introduce the practice of informing the employer bank whenever an employee of a bank opens an account with a branch other than that of his posting.
1) With a view to taking appropriate remedial action for disposal of complaints expeditiously, banks were advised to review the existing system of handling complaints and fraud cases at the level of their Boards.
i) Bank Restructuring
i) New Bank of India was merged with Punjab National Bank in September 1 993.
i) Bank of Karad Ltd. was taken over by Bank of lndia on July 20, 1994.
1995-96
i) Kashinath Seth Bank Ltd., was amalgamated with State Bank of lndia o n January 1, 1996.
i) Punjab Co-operative Bank Ltd. and Bari Doab Bank Ltd. were amalgamated with Oriental Bank of Commerce with effect from April 8, 1997.
ii) RRBs were allowed to deploy a part of their surplus non-SLR funds in credit portfolios of their sponsor banks and in specified investment avenues like Ull listed schemes, etc.
i Effective September 29, 1995, RRBs were allowed to provide housing loans up to a maximum of Rs. 1 lalth per borrower subject to a ceiling of 5 per cent of the incremental deposit of RRB during the year.
ii) The Basu Committee se t up by NABARD, recommended in December 1995 for selection of 68 RRBs for comprehensive restructuring under phase If.
iii) The Government released a sum of Rs.223.57 crore for capital restructuring of 53 RRBs out of the selected 70 RRBs on February 28, 1996.
iv) An Expert Group under t h e chairmanship of Dr. N.K. Thingalaya was set up to examine the issues concerning the managerial and financial restructuring of RRBs taken up during 1994-95. The Group continued to monitor the progress in this regard on an on-going basis.
V) On September 29, 1995, RIBS were advised to adopt income recognition and asset classification norms from the year 1995-96 and provisioning norms from the year 1996- 97 onwards.
i ) On July 22, 1996, the Union Budget 1996-97 made a provjsion of Rs.200 crore for recapitalisation of 70 RRBs In 1996-97.

Progress of Financial Sector Rebrms : 1992-93 to 1996-97
ii) For ensuring viability and providing them with greater manoeuvarability and ensuring the flow of adequate credit to the rural sector, RRBs' interest rates o n advances were deregulated from August 26, 1996.
iii) RRBs were allowed to invest in shares and debentures of corporates, including buying the same from the secondary market, and units of mutual funds up to 5 per cent of the incremental deposits of the preceding year. No ceiling was prescribed for investment in bonds of PSUs and all lndia financial institutions, provided the exposure norms for investment were satisfied such as, not to exceed 25 per cent of the owned funds of the RRB to a single party or 25 per cent of paid-up s h a r e capital of the company, whichever was less.
iv) RRBs having Service Area obligations were permitted to open further branches at centres with business potential in the areas of their operation on the conditions that n o additional staff was to be recruited by them.
i) Government of India have provided Rs.270 crore in Budget 1997-98 for further recapitalisation of RRBs.
I<) Dividend Declaration by Banks
i) In t h e context of changes envisaged in the holding of equity of public sector banks consequent upon t h e issue of shares to the public, effective May 19, 1995, public sector banks were subjected to prior approval of the Reserve Bank for payment of interim dividend, dividend higher than 25 per cent, and in cases of non-fulfilment of four stipulated conditions: (a) compliance with t h e provisions of Section 15 of the Banking Regulation Act, 1949, (b) proposed dividend being not more than 25 per cent of current year's profit, (c) compliance with the extant regulations on transfer of profits to statutory reserves and setting up of required provisions, and (d) observance of prudential accounting norms and capital
adequacy requirements.
1 1 . Reforms in Co-oper,~tive Banking
Co-opera rive Banks
i) The Reserve Bank liberalised the licensing policy for new primary (urban) co- operative banks (PCBs) greatly; prescribed the entry point viability norms, and advised to follow t h e guidelines relating to their operations; and advised to adopt norms in respect of income recognition, classification of assets, and provisioning on the lines stipulated for commercial banks.
i) The National Go-operative Bank of India (NCBI) was registered on August 5, 1993 as a multi-State co-operative society.
ii) A Co-operative Development Fund was set up by NABARD to help the co-operative banlts to improve managerial systems and sltills.
iii) For the first time, scheduled PCBs were permitted to invest their surplus funds in CDs and CPs of those institutions/corporates with credit rating P 1 /A 1 hrom CRISIL/ICRA.
i) With a view to improving the viability as also to strengthening the credit delivery systems, the co-operative credit institutions were advised to prepare Development Action Plans (DAPs) and enter into Memorandum of Understandings (MoUs) with NABARD and concerned State Governments for their effective implementation.
ii) With a view to maintaining the rural credit flow uninterrupted from SCBs and RRBs, the relaxation in the stipulation that they must recover loans at least 40 per cent of t h e demand for t h e previous year to be eligible for refinance from NABARD, was extended up to June 30, 1996.
iii) Lending and deposit rates OF all co-

Progres of ffnancbl Sector Refbrms : 1992-93 to 1996-97
operative banks, excluding PCBs, were deregulated In October 1994 subject to MLR of 1 2 per cent,
iv) Effective October 18, 1994, MLR for credit Iimlts of over Rs.2 lakh was abolished and PCBs were free to flx their own prime lending rates for such credit limits.
1995-96
flexibility in determining their deposit rates, effective July 2, 1996, PCBs were given freedom to flx lnterest rates on domestic term deposlts of over one year maturity. Also, the minimum maturity period of term deposit was reduced from 46 days to 30 days. lnterest rate on term deposits of 30 days and up to one year, was prescribed at 'not exceeding 1 1 per cent' per annum.
1) Effective june 2 1 , 1995, PCBs1 lending iii) Effective July 19% PCBs were given
rates for all categories of loans were heedom to fix the interest rate on post-
deregulated, subject to MLR of 13 per cent Shipment export credit On medium and long
per annum. term basis for any period beyond 180 days.
il) Effectbe April 24, 1995, PCBs were iv) Effective October 21. 1996, PCBs' allowed to invest their surplus funds in equity/ interest rate on d~mestic term deposits for bonds of all India financial institutions, in maturity of 30 days and UP to 1 Year was addition to their investment in PSU bonds, prescribed at 10 Per cent Per ~ ~ ~ u m . within the ceiling of 10 per cent of their
v) The interest rate surcharge o n import deposits. finance for PCBs was withdrawn from July 23, ill) Effective August 24, 1995, SCBs and 1996. CCBs were permitted to invest 5 per cent of their non-SLR surplus fund according to the vi) In November 1996, PCBs were allowed
discretion of the local management. to invest their surplus funds in the units of UTI up to 5 per cent of their incremental
iv) Effective October 1 , 1995, PCBs' term deposits of the previous year and these deposits rates of over two years, were freed. investments should be within the overall
ceiling of 10 per cent of their deposits for In February 1996' PCBs were investment in the bonds of MUs, companies,
to invest their surplus funds in CDs issued by and of all banks and other financial institutions approved institutions. by the Reserve Bank, subject to hlfilling certain conditions. vii) Consequent to allowing PCBs to extend
vi) All scheduled PCBs were brought under the purview of the provisions of the Banking Ombudsman Scheme, 1 995.
i) In April 1996, scheduled PCBs were allowed to undertake equipment leasing and hire purchase financing activities after complying with certain prudential requirements. Non-scheduled PCBs desiring to undertake the above activities were required to approach the Reserve Bank through the Regional Offices concerned.
ii) With a view to providing banks greater
their area of operation to the entire district of registration, including rural areas in the context of the credit gap in agricultural sector, effective December 1 996, PCBs were permitted to extend direct finance for agricultural activities which would be counted as priority sector advances.
viii) All scheduled and non-scheduled PCBs with deposits of over Rs.50 crore were required to introduce the system of concurrent audit.
ix) The prudential accounting norms viz., income recognition, assets classlflcation and provisioning for bad and doubtful assets, and

progress of Financial Sector Reforms : 1 W2-93 to 19%-97
capital adequacy were applied to SCBS and cCBs from the year 1996-97 in two phaes viz., 1 996-97 and 1 997-98.
x) PCBs were given freedom to determine the quantum of ad hoc limits as also the period of ad hoc limits, based on their commercial judgement and the merit of individual case, provided the aggregate credit limits (inclusive of ad hoc limits) granted by them d o not exceed t h e exposure ceiling prescribed by the Reserve Bank.
t 2. Reforms in Non-Bank IFinancialI Sector
a) Non-Banking Financial Companies ( N B W
i) In order to integrate NBFG within the mainstream of overall financial sector, the Reserve Bank initiated a comprehensive programme of reform of the financial companies. For this purpose, a Committee with Dr. A.C. Shah as a Chairman was appointed to study the NBFCs and submit the report to t h e Reserve Bank.
1 993-94
i) The recommendations. of* the Shah Committee Report on NBFG were accepted and t h e first phase of implementation was initiated.
1994-95
i As per the detailed prudential guidelines issued to NBFG in June 1994, the registered NBFCs were required to achieve a minimum capital adequacy norm of G per cent by March 3 1, 1995 and 8 per cent by March 31, 1996 and also to obtain a minimum credit rating From any one of the three credit rating agencies viz., CRISIL, ICRA and CARE.
i i ) Banks/financial institutions were permitted to extend bridge loans/interim Finance to all companies, including finance companies, against public issues/market borrowing (domestic) up to 7 5 per cent of the amount called-up on each occasion as against 50 per cent prescribed earlier.
iii) In September 1994, banks were advised not to extend bridge loans/lnterlm finance in the form of bridging nature to all categories of NBFG.
iv) In September 1994, the overall limit of bank credit to loan and investment companies and residuary non-banking finandal companies (RNBCs) was reduced to twice t h e net owned fund (NOF) as against three times the NOF hitherto. In respect of credit to equipment leasing and hire purchase companies, the limit of four times the NOF was to continue, provided such borrowers were predominantly engaged in equipment leasing/hire purchase business; other-wise bank credit was restricted to three times the NOF.
v) For better and effective regulation of the NBFCs, certain legislative changes were proposed to the Government of India.
i ) In view of an unduly large increase in credit from banks to NBFCs and the need to moderate their overall limits of borrowings, new overall limits of borrowing for different categories of NBFG were fixed: Bank credit limit to loan and investment companies and RNBCs was reduced to the equivalent of NOF from twice the NOF of the company; for companies having not less than 75 per cent of their assets in equipment leasing and hire purchase and 75 per cent of their gross income h-om these two types of activities as per their last audited balance sheets, the limit was brought down to thrice the NOF, and for other equipment leasing/hire purchase companies, the limit was prescribed at twice the NOF with effect from April 21, 1995.
ii) Board for Financial Supervision (BFS) with the assistance of the Reserve Bank's Department of Supervision started supervising NBFCs from July 1 995.
iii) Maintenance of liquid assets was increased from 10 per cent to 15 per cent of deposit liabilities for the equipment leasing and hire purchase finance companies and
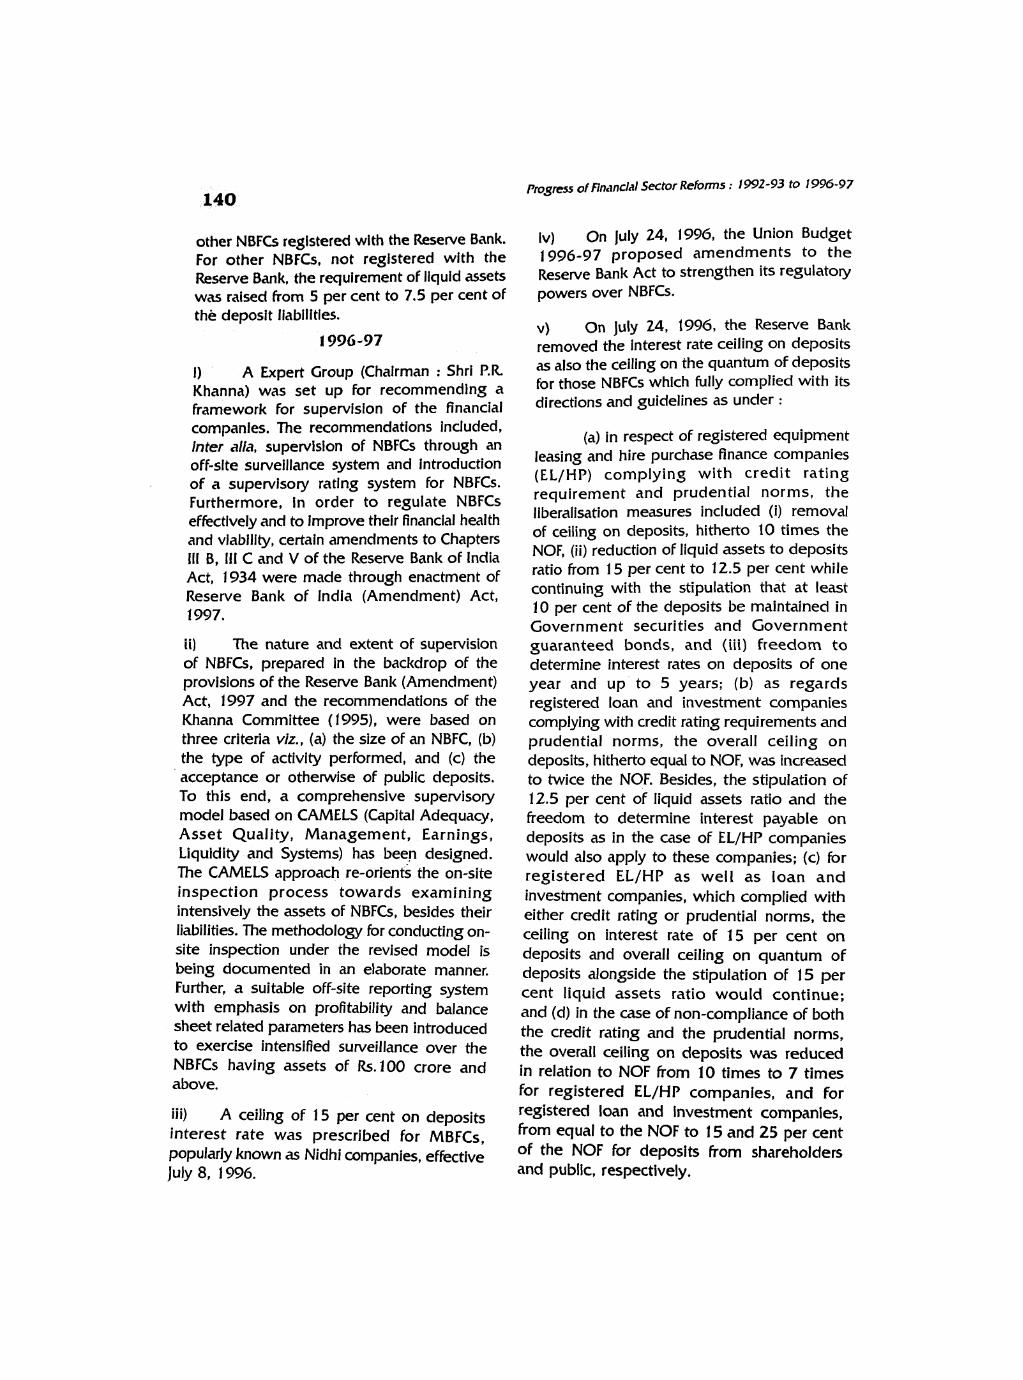
Pmsress of Rn;mdal Sector Retbrms : 1992-93 to 1996-97
other NBFCs registered with the Reserve Bank. Iv) On july 24, 1996, the Union Budget
For other NBFCs, not registered with the 1996-97 proposed anendments to the Reserve Bank, the requirement of liquid assets Reserve Bank Act to strengthen its regulatory
was raised horn 5 per cent to 7.5 per cent of powers over NBFCs. the deposit liabilities.
1996-97 v) On July 24, 1996, the Reserve Bank removed the interest rate ceiling on deposits
1) A Expert Croup (Chairman : Shri P.R as also the ceiling On the quantum of deposits
Khanna) was set up for recommending a for those N B F G which fully complied with its
framework for supervision of the financial directions and guidelines as under :
companies. The recommendations included, inter alia, supervision of NBFCs through an off-site surveillance system and introduction of a supervisory rating system for NBFCs. Furthermore, in order to regulate NBFCs effectively and to improve their financial health and viability, certain amendments to Chapters 111 B, ill C and V of the Reserve Bank of lndia Act, 1934 were made through enactment of Reserve Bank of lndia (Amendment) Act, 1997.
Ii) The nature and extent of supervision of NBFCs, prepared in the backdrop of the provisions of the Reserve Bani< (Amendment) Act, 1997 and the recommendations of the Khanna Committee (1995), were based on three criteria viz., (a) the size of an NBFC, (b) the type of activity performed, and (c) the acceptance or otherwise of public deposits. To this end, a comprehensive supervisory model based on CAMELS (Capital Adequaq, Asset Quality, Management, Earnings, Liquidity and Systems) has been designed. The CAMELS approach re-orients the on-site inspection process towards examining intensively the assets of NBFCs, besides their liabilities. The methodology for conducting on- site inspection under the revised model is being documented in an elaborate manner. Further, a suitable off-site reporting system with emphasis on profitability and balance sheet related parameters has been introduced to exercise intensified surveillance over the NBFG having assets of Rs.100 crore and above.
iii) A ceiling of 15 per cent on deposits interest rate was prescribed for MBFCs, popularly known as Nidhi companies, effective july 8, 1996.
(a) in respect of registered equipment leasing and hire purchase finance companies (EL/HP) complying with credit rating requirement and prudential norms, the liberalisation measures included (i) removal of ceiling on deposits, hitherto 10 times the NOF, (ii) reduction of liquid assets to deposits ratio from 15 per cent to 12.5 per cent while continuing with the stipulation that at least 10 per cent of the deposits be maintained in Government securities and Government guaranteed bonds, and (ii i) freedom to determine interest rates o n deposits of one year and up to 5 years; (b) as regards registered loan and investment companies complying with credit rating requirements and prudential norms, the overall ceiling on deposits, hitherto equal to NOF, was increased to twice the NOF. Besides, the stipulation of 12.5 per cent of liquid assets ratio and the freedom to determine interest payable on deposits as in the case of EL/HP companies would also apply to these companies; (c) for registered EL/HP a s well as loan and investment companies, which complied with either credit rating or prudential norms, t h e ceiling on interest rate of 15 per cent on deposits and overall ceiling on quantum of deposits alongside the stipulation of 15 per cent liquid assets ratio would continue; and (d) in the case of non-compliance of both the credit rating and the prudential norms, the overall ceiling on deposits was reduced in relation to NOF from 10 times to 7 times for registered EL/HP companies, and for registered loan and investment companies, from equal to the NOF to 15 and 25 per cent of the NOF for deposits from shareholders and public, respectively,

Progress of Financial Sector Rehrms : 1 992-93 to 1996-97
i) Effective April 15, 1997, t h e existing overall limits of bank credit to NBFCs having fully complied with the requirements of registration, credit rating and prudential norms, were withdrawn.
ii) Effective May 2, 1997, in terms of the provisions of Section 45 IB of t h e Reserve Bank of lndia Act, 1934, (a) the NBFCs were required to maintain liquid assets equivalent to 10 per cent of their deposit liabilities in the specified approved securities, viz., Government securities and Government guaranteed bonds; unregistered loan and investment companies were required to maintain liquid assets, not less than 5 per cent of their deposit liabilities, in such approved securities; and the RNBCs were also required to continue maintaining liquid assets of not less than 10 per cent of their total deposit liabilities in t h e Government securities and Government guaranteed bonds; (b) the NBFCs were required to maintain t h e prescribed liquid assets on each day of t h e relevant quarter o n the basis of their depositG liabilities outstanding on the last working day of the second preceding quarter. The earlier requirement of NBFCs investing in other specified assets such as, balances with banks and other trustee securities was discontinued; (c) NBFCs were required to submit a return indicating the position of deposits vis-2-vis such investments at the end of every quarter within a period of 15 days of the month succeeding the quarter to which it relates; (d) for t h e failure of NBFCs to maintain t h e required percentage of assets in the specified manner, the Reserve Bank has powers to impose penalty at the rate of 3 per cent per annum above t h e Bank Rate on the amount of shortfall on any day during the quarter, and if the shortfall continues in the subsequent quarterls, a t 5 per cent per annum above t h e Bank Rate on the amount of shortfall for each subsequent quarter during which the default continues.
ill) As a sequel t o t h e regulatory strengthening, t h e Department of Supervision
(DoS) has been bifurcated into two independent departments with effect fiom July 29, 1997: t h e Department of Banking Supervision (DBS) would cater exclusively to supervision of banks, and t h e Department of Non-Banking Supervision (DNBS), has been entrusted with supervision of non-bank financial entities.
vii) Consequent upon the suggestions made by the Supreme Court in its judgement dated January 4, 1996 in the case relating to Peerless General Finance and Investment Company Ltd., t h e Reserve Bank, in consultation with the Government, set up a Worlcing Group in September 1996 under the Chairpersonship of Smt. K.S. Shere to examine, inter alia, t h e issues relating to creation of a separate instrumentality for regulation and supervision of Residuary Non-Banking Companies (RNBCs) and other NBFCs and extention of deposit protection scheme. The Report of the Committee, submitted to the Reserve Bank on September 1,1997, has been sent to t h e Government of lndia for consideration.
b) Term Ler~diny Institutions
i) Term lending institutions viz., IDBI, IFCI, ICICI, IRBl and Exim Bank were advised to achieve a capital adequacy norm of 4 per cent by March 31,1994. Such of the Fls having dealings with agencies abroad were required to achieve a norm of 8 per cent by March 31, 1995 while t h e rest were required to attain 8 per cent norm by March 3 1 , 1 996.
i) The Board for Financial Supervision (BFS) started supervising the all-India financial institution with effect from April 1995.
ii) Effective July 14, 1995, the capital of NABARD which stood at Rs.330 crore at the end of 1 994-95 was increased by Rs. 1 70 crore with equal contribution of Rs.85 crore each from the Reserve Bank and Government of India.

iii) In March 1996, guidellnes In regard to Income recognltion, asset classification and provlsloning were extended to NABARD with certain rnodificatlons, keeping In view the special nature of Its operations.
iv) Under the GLC to NABARD, the Reserve Bank sanctioned an aggregate limit of Rs.4.950 crore in June 1995.
iv) The Reserve Bank's GLC limit t o NABARD was raised to Rs.5,250 crore in January 1996.
NABARD. In order to accelerate the flow of production credit to agriculture, it was further Increased by Rs.200 crore, taking the aggregate limit to Rs.5.700 crore.
it 1) Three Agriculture Development Finance Companies, one each in the States of Andhra Pradesh, Karnataka and Tamil Nadu have been incorporated as public limited companies in February 1997 with an authorised capital of Rs.20 crore each.
c.) /f?s~r~21'lctt Sector
1) On July 22, 199G, the Union Budget 1996-97 proposed: a) to raise the capital of NABARD from Rs.500 crore in 1995-96 to Rs. 1,000 crore in 1996-97 with a contribution of Rs. 100 crore from the Government and Rs.400 crore from the Reserve Bank and to quadruple the capital to Rs.2.000 crore within five years; b) to set up State level Agricultural Development Finance Institutions with NABARD as the chief promoter to promote investment in commercial or high-tech agriculture and allied activities; and c) the establishment of an Infrastructure Development Finance Company (IDFC) with an authorised share capital of Rs.5,000 crore.
ii) For the year 1996-97, the Reserve Bank sanctioned GLC of Rs.5,500 crore, t o
1) The Committee on Reforms in t he lnsurance Sector under the Chairmanship of Shri R.N. Malhotra was se t up to make recommendations on reforms in insurance sector.
I ) The Malhotra Commit tee o n t h e Insurance Sector submitted its report.
i) As announced in the Union Budget 1995-96, a three-member board for t he interim Insurance Regulatory Authority (IRA) was constituted in January 1996.

Report on Trend and Progress of Banking In Indla, 1996-97 143
Appendix Table 1.1 (A) : Net Non-Performing Assets of Public Sector Bank - 1995-96 and 1996-97
Sr. Name of the Bank No.
1995-96 1996-97'
Net NPAs Percentage Net NPAs Percentage (Rs. crore) of Net NPAs (Rs. crore) of Net NPAs
to Net to Net Advances Advances
1 State Bank of India 3,921.27 6.6 1 4,524.57 7.30
2 State Bank of Bikaner 8. Jaipur 154.72 6.1 1 245.34 7.96 3 State Bank of Hyderabad
4 State Bank of lndore
5 State Bank of Mysore
6 State Bank of Patiala
7 State Bank of Saurashtra 103.0 1 5.70 130.15 6.47
8 State Bank of Travancore 257.80 7.38 335.1 1 8.82
Total for SBI Group (1 to 8) 5,362.02
Allahabaci Bank
Andhra Bank
Bank of Baroda
Bank of lndia
Bank of Maharashtra
Canara Bank
Central Bank of lndia
Corporation Bank
Dena Bank
Indian Bank
Indian Overseas Bank
Oriental Bank of Commerce
Punjab 8. Sind Bank
Punjab National Bank
Syndicate Bank
UCO Bank
Union Bank of lndia
United Bank of lndia
Vijaya Bank
Total Natlonniised Banks (9 t o 27) 1 2,935.47
Total for PSBs (1 to 27) 18,297.49
* Provlslonal.

144 Report on Trend and Pmgress of Banking in India, 1 96-g7
Sr. Name of the Bank Net ~ p ~ s percentage Net NPAs Percentage
No. (Rsacrore) of Net NPAs (Rsncrore) of Net WAS to Net t o Net
Advances Advances
1 2 3 4 5 6
1 Bank of Madura Ltd. 47.83 4.80 70.70 6.16 2 Bank of Rajasthan Ltd. 59.92 4.40 132.12 8.82
3 Bareilly Corporation Bank Ltd. 6.44 7.90 5.92 6.56 4 Benares State Bank Ltd. 26.92 17.62 22.04 1 1.30 5 Bharat Overseas Bank Ltd. 6.57 1.65 16.72 3.81 6 Catholic Syrian Bank Ltd. 42.73 5.13 56.04 5.87 7 City Union Bank Ltd. 17.31 4.49 25.27 5.30 8 Dhanalakshmi Bank Ltd. 8.15 1.82 27.15 4.83 9 Development Credit ank Ltd. 22.00 5.24 36.30 5.93 10 Federal Bank Ltd. 87.88 3.94 2 14.38 7.16 1 1 Ganesh Bank of Kurundwad Ltd. 2.34 7.62 3.07 7.06 12 Jammu and Kashmir Bank Ltd. 69.44 5.09 102.09 6.03 13 Karnataka Bank Ltd. 28.08 2.37 45.16 3.1 2 14 Karur Vysya Bank Ltd. 7.10 0.86 1 1.35 1.19 15 Lakshmi Vilas Bank Ltd. 10.81 2.19 28.37 4.66 16 Lord Krishna Bank Ltd. 9.65 3.57 33.52 8.53 17 NainitalBankLtd. 9.08 13.20 7.04 9.48 18 Nedungadi Bank Ltd. 19.71 7.76 25.19 6.94 19 Ratnakar Bank Ltd. 6.75 7.37 8.45 6.87 20 SangliBankLtd. 43.30 10.26 44.20 11.28 21 South Indian Bank Ltd. 50.84 4.94 67.18 5.87 22 SB1 Comm. & Int. Bank Ltd. 14.14 9.25 9.04 6.25 23 Tarnilnad Mercantile Bank Ltd. 23.20 3.33 25.60 3.45
United Western Bank Ltd. 83.39 9.36 92.84 8.63 25 Vysya Bank Ltd. 89.88 3.54 135.52 5.17
25 Old Mate Sector Banks (1 to 25) 793.46 4.5 1 t ,245.28 5.99
26 Lm Bank Ltd. 23.42 3.66 27 lnduslnd Bank Ltd. 40.02 2.07 28 IClCI Banking Corpn. Ltd. 15.33 1.92 29 Global Trust Bank Ltd. 66.85 4.47 30 HDFC Bank Ltd. 1.01 0.18 31 Centurion Bank Ltd. Nil Nil 32 Bank of Punjab Ltd.
4+98 1.36 33 Times Bank Ltd,
4.90 O*@ 34 ID01 Bank ttd.
4.90 0.99 9 New Prh.rtc B;mk

Report on Trend and Progress of Banking in India, 1996-97 145
1995-96 1 996-97 *
Sr. Name of the Bank Net NPAs Percentage Net NPAs Percentage No. (Rs.crore) of Net NPAs (Rs.crore) of Net NPAs
to Net to Net Advances Advances
1 American Express Bank 3.00 0.23 35.00 3.26
2 ANZ Grindlays Bank 9.33 0.26 12.95 0.30
. 3 Abu Dhabi Commercial Bank 5.00 3.78 3.86 1.54
4 ABN AMRO Bank 0.47 0.05 4.83 0.42
5 British Bank of the Middle East 10.62 2.40 28.29 6.46
6 Barclays Bank Nil Nil 9.06 5-10
7 Banque Nationale d e Paris Nil Nil Nil Nil
8 Banque lndosuez 7.41 1.51 20.71 6.75
9 Bank of America -2.25 -0.11 Nil Nil
1 0 Bank of Tokyo-Mitsubishi Ltd. 19.90 1.83 189.77 17.36
1 1 Bank of Bahrain and Kuwait 5.73 3.18 21.21 9.36
1 2 Bank of Nova Scotia 2.00 1.00 32.28 7.46
1 3 Bank of Ceylon Nil Nil 1.55 4.78
15 Chase Manhattan Bank
16 Commerzbank
1 7 Credit Lyonnais Bank
Nil Nil Nil Nil
Nil Nil ' Nil Nil
Nil Nil 2.21 0.43
18 Development Bank of Singapore Nil Nil 2.79 5.6 1
19 Deutxhe Bank Nil Nil 29.90 1.77
20 Dresdner Bank Nil Nil Nil Nil
2 1 Hongkong Bank 10.80 0.5 1 69.60 3.14
22 INC Bank Nil Nil Nil Nil

146 Repoit on Trend and Progress of Banking in India, 1996-517
Appendix Table I. 1 (C): Net Non-Performing Assets of f Foreip Banks in India - 1995-96 and 1996-97 (concld.)
1995-96 1 996-97 *
Sr. Name of the Bank No.
Net NPAs Percentage Net NPAs Percentage (Rs.crore) of Net NPAs (Rs.crore) of Net NPAs
to Net t o Net Advances Advances
24 Oman International Bank 12.49 7.91 11.52 5.33
25 Sanwa Bank 1.02 0.59 0.51 0.22
26 Sakura Bank
27 Standard Chartered Bank
28 Societe Generale 0.62 0.10 25.33 4.53
29 Sonali Bank Nil Nil Nil Nil
30 Siam Commercial Bank
31 State Bank of Mauritius
32 Arab Bangladesh Bank
Nil Nil Nil Nil
4.47 10.35 12.63 30.72
- - Nil Nil
33 Bank Internasional Indonesia - - Nil Nil
34 Chinatrust Commercial Bank - - Nil Nil
35 Cho Hung Bank
36 Fuji Bank
37 Krung Thai Bank Public Co. Ltd.
- - Nil Nil
- - Nil Nil
- - Nil Nil
38 Oversea Chinese Banking Corporation - - Nil Nil
39 Commercial Bank of Korea - - Nil Nil
TOTAL (1 to 39) 182.9 1 0.8 1 670.63 2.50
* Provisional,

Report o n Trend and Progress of Banking in India, 1995-97 147
Appendix Table I.Z(A) : Capital Adequacy Ratio of Public Sector Banks 1995-96 and 1996-97
Sr. No. Name of the Bank 1995-96 1996-97 (As on 3 1.3.96) (As on 31.3.97)
I State Bank of India
2 State Bank of Bikaner and Jaipur
3 State Bank of Hyderabad
4 State Bank of lndore State Bank of Mysore
State Bank of Patiala
State Bank of Saurashtra
State Bank of Travancore
Allahabad Bank
Andhra Bank
Bank of Baroda
Bank of lndia
Bank of Maharashtra
Canara Bank
Central Bank of lndia
Corporation Bank
Dena Bank
Indian Bank Indian Overseas Bank
Oriental Bank of Commerce
Punjab National Bank
Punjab and Sind Bank
Syndicate Bank
Union Bank of lndia
United Bank of lndia
UCO Bank
27 Vijaya Bank
8.81
9.51
12.38
9.40
9.68
5.07
11.19
8.44
8.49
10.38
2.63
1 1.30
8.27
Negative
5.95
16.99
8.23
3.3 1
8.42
9.50
3.50
7.83
Negative

Report on Trend and Progress of Banking in India, 1996-97
Sr. No. Name of the Bank 1995-96 1996-97 (As on 31.3.96) (As on 31.3.97)
OLD PRIVATE SECTOR BANKS
Bank of Madura Ltd. 10.93 Bank of Rajasthan Ltd. 1 1.08 Bareilly Corporation Bank Ltd. 2.84 Benares State Bank Ltd. 3.41 Bharat Overseas Bank Ltd. 10.57 Catholic Syrian Bank Ltd. 2.25 City Union Bank Ltd. 9.26 Development Credit Bank Ltd. 27.35 Dhanalakshmi Bank Ltd. 8.93 Federal Bank Ltd. 8.35 Clanesh Bank of Kurundwad Ltd. 8.14 Jammu & Kashmir Bank Ltd. 13.40 Karnataka Bank Ltd. 12.74 Karur Vysya Bank Ltd. 10.92 Lakshmi Vilas Bank Ltd. 9.80 Lord Krishna Bank Ltd. 7.42 Nainital Bank Ltd. 9.19 Nedungadi Bank Ltd. 4.34 Ratnakar Bank Ltd. 1 1 . 1 1 Sangli Bank Ltd. 6.21 SBI Comm. & International Bank Ltd. 1 1.56 South Indian Bank Ltd. 8.27 Tamilnad Mercantile Bank Ltd. 12.88 United Western Bank Ltd. 10.65
25 Vysya Bank Ltd. 1 1.91 14.21
NEW PRIVATE SECTOR BANKS
Bank of Punjab Ltd. Centurion Bank Ltd. Global Trust Bank Ltd. HDFC Bank Ltd. IClCl Banking Corp. Ltd. iDBl Bank Ltd. lnduslnd Bank Ltd. Times Bank Ltd.
34 Ul l Bank Ltd. 16.22 14.29

Report on Trend and Progress of Banking h India, 1996-97 149
ks in India - 1996-97
Sr. No. Name of the Bank (As on 31.3.97)
Abu Dhabi Commercial Bank Ltd. ABN AMRO Bank Ltd. American Express Bank Ltd. ANZ Grindlays Bank Arab Bangladesh Bank Bank of America NT 8. SA Bank of Ceylon Bank of Tokyo-Mitsubishi Bank of Nova Scotia Bank of Bahrain 8, Kuwait Bank lnternasional Indonesia British Bank of the Middle East Barclays Bank PLC Banque lndosuez Banque Nationale de Paris Citibank N.A. Chinatrust Commercial Bank Cho Hung Bank Chase Manhattan Bank Credit Lyonnais Commerzbank Commercial Bank of Korea Deutsche Bank Development Bank of Singapore Dresdner h k Fuji Bank Hongkong Bank ING Bank Krung Thai Bank Public Co. Ltd. 398.59
MashreqBank 17.25 Oman International Bank SAOG 12.36 Oversea Chinese Banking Corpn. 291 -00
Sanwa Bank Ltd. 24.02 Sakura Bank Ltd. 12.19 Slam Commercial Bank 19.39 Sodete Generale 10.52 Sonnli Bank 13.54 State Bank of Mauritius 107.00 Standard Chartered Bank 8.60

Report on Trend and Progress of Banking in India, 1 W6-97
Appendix Table 11.1 : RBI Accommodation to Scheduled CommercW Banks* (Rs. crore)
As on the Total Export Credit Government General Total
last repor- Refinance Securities Refinance Refinance ting Friday Refinance of
Limit Outstan- Limit Outstan- Limit Outstan- Limit Uutstan- ding ding ding ding
1 2 3 4 5 6 7 8 9 (2+4+6) (3+5+7)
1996
March 14,141.61 4,6m.73 3,385.10 153.98 - - 1 7,526.7 1 4.844.7 1
(33.2) (4.5) (27.6) April 13,723.33 4,845.82 3,385.10 3.54 - - 1 7,108.43 4,849.36
(35.3) (0.1) (28.3)
May 13,373.92 4,393.82 3,385.10 43.00 - - 16,759.02 4.436.82 (32.9) (1 -3) (26.5)
June 13,044.20 2,497.39 3,385.10 0.00 - - 16,429.30 2,497.39
(19.1) (-1 (1 5.2) September 1 1,377.37 1,822.51 - - - - 1 1,377.37 1,822.5 1
( 1 6.0) (1 6.0) December 5,593.30 785.81 - - - - 5,593.30 785.8 1
( 14.0) ( 1 4.0) 1997 March 6,654.40 559.97 - - - - 6,654.40 559.97
(8.4) (8.4) April 7,982.81 226.54 - - - - 7.982.81 226.54
(2.8) (2.8) May 3,279.73 349.64 - - 4,459.93 - 7.739.66 349.64
(10.7) (4.5) june 2,754.75 280.84 - - 4,459.93 1.2 7.214.68 282.07
(10.2) (..) (3.9)
PY 2,254.69 178.34 - - 4,459.93 1.2 6.714.62 1 79.57 (7.9) (..) (2.7)
August 2.144.25 30.68 - - 4,459.93 5.0 6.604.18 35.68
( 1 -4) (0.1) (0.5) September 1,986.27 306.33 - - 4,459.93 - 6,446.20 306.33
(I 5.4) (4.8) October 10 1,936.37 138.1 6 - - 4,459.93 - 6,396.30 138.16
(7.1) (2.2) * Exduding special refinance against shipping loans, duty drawback, etc .. Negflgibie.
Notes : 1. Effeahre horn the fortnight commencing September 30. 1995, two separate limits under the Government securities refinance were granted to banks. This refinance scheme was terminated with effect horn jofy 6, 1996.
2. EFfectRre from the Fortnight commencing April 13, 1996, banks are provided export aedit refinance nst rupee denominated and dollar denominated export credit taken togeffier.
gutes in brackets are praportton of UtiliJatlan to Wnance tirnlts,

Appcndlx Table 11.2 : Vtabllfty Posttion of Sick/Weak industrial Units (Amounts in Rs. crore)
T ~ r c at 551 skk unit$ Non-SSI Slck Units Non-SSI Weak Units Total UnB
Numkr Amount Number Amount Number Amount Number Amount Outstanding Outstanding Outstanding Outstanding
Nbrd, Mafd, March March March March March March March March March March March March March March 1995 1996 1995 1996 1995 19% 1995 1996 1995 1996 1995 1996 1995 1996 1995 1996
5. Units under 10,371 11.026 449 422 442 412 2,674 2,289 68 336 281 10,902 11.506 3.459 2,992 89
nutJlng Pragrmrne
5 as percentage of I 66.7 67.1 75.1 66.4 66.3 66.0 68.5 68.0 57.1 55.3 57.2 54.9 66.6 67.0 68.0 66.3
Note r ngure~ tn bradvts are percentages to total.

)Ir Ot
pp
end
ix Table I
I.3(
A) : Pa
ram
eter
r of t
he
Wo
rkin
g of
Pub
lic S
ecto
r B
anks
- 199
6-97
N
a%
ba
s%
ba% PMa%
a%@
m
m
Tier
l Tie
r ll
pa
pr
pa
Total
to
W. F
unds
tow
. Fun&
to W
. F& to
W. hnds
Vd f
inQ
Az
sar3b
h$&%
hjk
W
12
3
4
5
6
7
8
9
10
11
12
13
14
15
!SAT
E BA
NK O
lOU
P St
ate
Bank
of
Indi
a ....
........
........
....
Stat
e Ba
nk of B
ikan
er &
jaip
ur ...
... .....
.........
Stat
e Ba
nk of H
yder
abad
St
ate
Bank
of
lndo
re ...
........
........
.. St
ate
Bank
of P
atia
la ...
........
........
.. ....
........
... St
ate Bank of S
aura
shtr
a ....
........
... St
ate Bank of T
rava
ncor
e ........
........
....
Stat
e h
k of M
ysor
e N
ATI
ON
AU
SED
BANKS
9 A
llaha
bad
Bank
.......
........
........
......
5.70
4.87
10.57
9.71
1.37
3.05
1.40
0.49
0.51
18.28
6.800
100
28
10
And
hra Bank ...
........
........
........
......
12.05
0.00
12.05
9.89
1.24
3.09
1.10
0.45
0.01
0.15
5.913
1 24
24
1 1
Bank
of
Mah
aras
htra
......
........
.......
8.48
0.58
9.07
9.79
0.9 1
3.67
1.18
0.54
0.57
15.29
5.700
141
28
1 i! G
qxxa
tion
Bank ....
........
........
......
10.65
0.62
11.27
10.16
1.37
3.89
3.02
1.53
1.66
34.49
9.069
I22
t33
13
Central Bank o
f In
dia ....
........
........
. 7.14
2.27
9.41
10.02
1.22
3.21
1.06
0.61
0.65
33.33
6.100
129'
30
14
Syndicate B
ank
........
........
........
.....
5.31
3.49
8.80
9.68
0.95
3.36
0.60
0.4
1 0.43
21.49
* 4.
900
145
20
15
Punj
ab a
nd S
ind Bank ...
........
........
8.10
1.12
9.22
10.33
1.29
2.79
0.80
0.28
0.29
15.99
7,400
100
I6
........
........
........
.....
16
Bank
of
Baro
da
8.10
3.70
11.80
10.34
1.22
3.21
2.06
0.73
0.73
10.88
10,600
123
1 70
........
........
........
........
.. 17
Cana
raBa
nk
9.53
0.64
10.17
9.57
1.28
3.19
1.83
0.41
0.44
7.4
1 7.
990
123
20
18
Indi
anB
ank ....
........
........
........
.......
(418.64
(-)0.17
(-118.81
9.18
1 .27
0.71
1-B.81
(-)2
.28
(-)
- 8,
400
130
(-1
........
........
... 19
Indi
an O
vers
eas Bank
5.62
4.45
10.07
10.37
1.07
2.38
0.72
0.58
0.58
31.48
8,300
1 28
36
20
Punj
ab N
atio
nal B
ank
........
........
....
5.72
3.43
9.15
10.43
1.34
3.47
1.77
0.68
0.7
1 18.99
6,195
1 20
35
21
Uni
ted Bank o
f Ind
ia ....
........
........
. 6.
90
1.30
8.20
8.90
0.86
1.82
(-1
(-1
(-)
- 1
5,800
130
(-
1 22
Den
aBan
k ....
........
........
........
........
8.06
2.75
10.81
10.44
1.13
3.85
2.00
0.75
0.81
1 36
47
21.4
2 6.
991
23
Bank
of I
ndia ....
........
........
........
.....
7.97
2.23
10.25
9.26
1.29
3.00
1.53
0.95
1.01
26.81
8.600
tW
68
........
........
......
24
Uni
on B
ank
of I
ndia
7.67
2.86
10.53
10.28
0.89
3.41
1.52
o.%
1 .01
29.03
8,636
135
70
25
Vija
ya Bank .....
..........
..........
......
8.60
2.90
11.50
9.50
0.80
3.00
0.50
0.20
0.30
18.79
b6
.W U
OL:
100
tO
........
........
........
........
... 26
U
CO
Ban
k 1.
58
1.58
3.16
8.86
0.86
2.15
(-10.49
(-)1.43
(-)I.&
(-139.97
%M
126
(-162
........
.. 27
Orie
ntal
Bank of C
omm
erce
1 7.40
0.10
17.50
10.80
0.90
3.90
2.60
1.60
110
1.60
20.40
10,030
130
Not
es : 1.
(-) I
ndic
ates
neg
ativ
e.
2. Total of T
ier I
and
II m
ay n
ot ta
lly w
ith th
e ov
eral
l Cap
ital A
dequ
acy
Rat
io.
3.
ngu
res
repo
rted
in t
his T
able
(ba
sed
on s
peda
l ret
urns
) may
not
exa
ctly
tally
with
the
six
-yea
r da
ta r
epor
ted
in A
ppen
dix
Tab
les
11.3 (B) t
o 11
.3 (H) w
hich
IS based o
n
publ
ishe
d ba
lanc
e sheets o
f banks.

RepOrl. on Trend and Progress of Banking In India . 1996-97
Appendix Table 11.3 (B) : Financial Ratios of Publlc Sector mks . Performance Indicators . 1991-92 to 1996-97
S r . Name of the Bank Gross hofit/Loss as % to Total Assets No .
91-92 92-93 93-94 94-95 95-% 96-97
1 2 3 4 5 6 7 8
1 . State Bank of India ......................... 2.72 1.84 1.37 1.95 2.10 2.17 ....................... . 2 State Bank of Patiala 4.49 2.16 2.0 1 1.70 2.23 2.26
3 . State Bank of Hyderabad ................ 3.36 2.16 1.89 2.43 2.46 2.43 4 . State Bank of Travancore ................ 1.58 1.53 1.71 1.72 2.07 1.93
........ . 5 State Bank of Bikaner 8, Jaipur 3.01 1.30 1.1 1 1.39 1.71 1.93 ..................... 6 . State Bank of Mysore 1.64 1.17 1.57 1.90 1.91 2.39
7 . State Bank of Saurashtra ................. 2.72 1.85 1.64 2.57 2.00 2.43 8 . State Bank of lndore ....................... 2.48 1.05 1.77 2.25 2.01 2.23
.....
SBl and 7 Associates (I) 2.75 1.82 1.44 1.95 2.10 2.18
Bank of Baroda ............................... Bank of India ................................. Punjab National Bank ......................
.................................... Canara Bank
...................... Central Bank of lndia
........................ Union Bank of India
Indian Overseas Bank ..................... ..................................... lndian Bank
1 7 . Syndicate Bank ............................... 0.49 .1.05 0.03 0.10 0.64 0.56
18 . UCO Bank ..................................... 0.30 -0.91 .1.31 0.28 .0.17 .0.45
19 . Allahabad Bank ............................... 0.93 0.01 0.24 0.29 0.83 1.40
20 . United Bank of India ....................... 0.29 .1.63 - 1.43 .0.94 -0.37 .0.43
2 1 . Oriental Bank of Commerce ........... 2.43 1.19 1.83 2.36 2.62 2.60 22 D e n a Bank .................................... 0.77 0.W 0.73 1.25 1.76 2.00 . 23 Vijaya Bank ..................................... 0.51 0.11 0.84 1 . 16 0.07 0.43 . 24 Bank of Maharashtra ....................... 0.57 .1.15' -0.61 0.39 0.85 1.18 . 25 . Andhra Bank .......................... ..... 0.51 -0.72 -0.33 0.22 0.89 1. 06
26 Punjab & Sind Bank ........................ 0.3 1 .1.83 -0.25 0.92 0.12 0.75 . 27 Corporation Bank 2.1 1 1.51 2.33 2.37 3.13 ............................ 3.02 .
19 Nationnllsed Banks (11) 1.27 0.42 0.72 1.12 1 . 14 1.26
27 Publlc Sector Banks Qb(l) 1.84 0.94 0.99 1-41 1.4 1 ,60
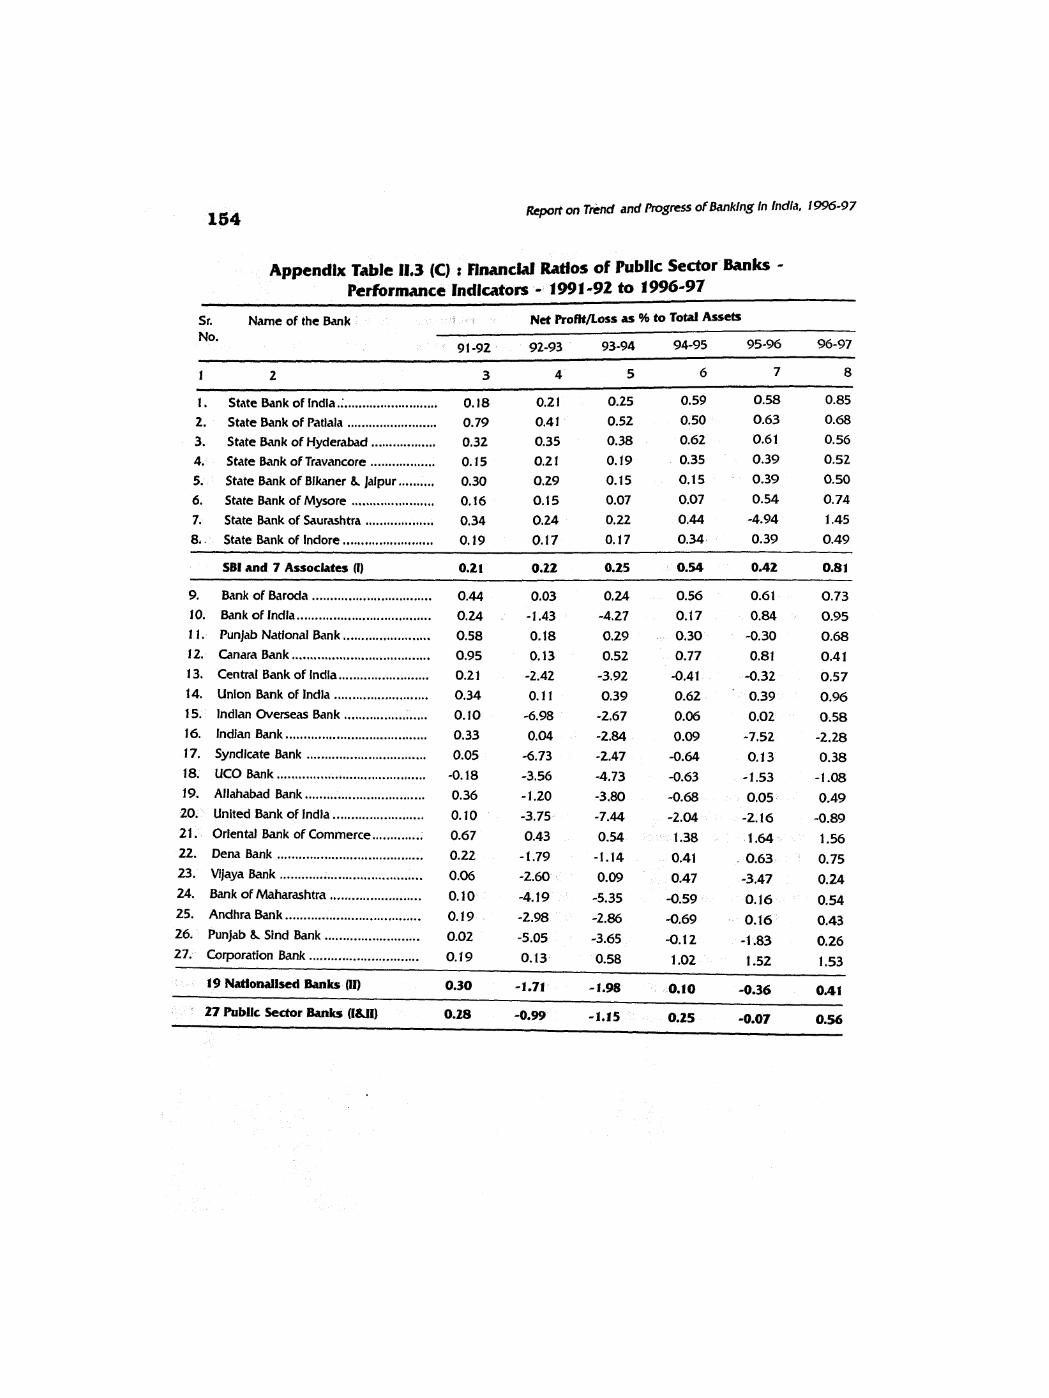
184 Report on Tknd and Progress of Sanklng in India. 1996-97
Appendlx T d l e 11.3 (C) t F imcfa l Ratios of Publlc Sector Banks . Perfbrmance Indicators . 1991 -92 to 1996-97
Sr . Name of the Brink Net Profltfioss as % to Total Assets
No . 91 -92 92-93 93-94 94-95 95-96 96-97
1 2 3 4 5 6 7 8
State Bank of lndla . ;.......................... State Bank of Patiala ........................ State Bank of Hyderahd .................. State Bank of Travancore .................. State Bank of B i k e r 8. jalpur .......... State Bank of Mysore ....................... State Bank of Saurashtra ................... State Bank of lndore ........................ SBI and 7 Associates (I)
. 10 Bank of indla ..................................... 0.24 . 1.43 .4.27 0.17 0.84 0.95
1 1 . Punjab National Bank ........................ 0.58 0.18 0.29 0.30 -0.30 0.68
. 12 Canara Bank ..................................... 0.95 0.13 0.52 0.77 0.81 0.41
13 . Central Bank of India ......................... 0.21 -2.42 -3.92 .0.41 -0.32 0.57 . .......................... 14 Union Bank of lndla 0.34 0.11 0.39 0.62 0.39 0.96
1 5 . Indian Overseas Bank ....................... 0.10 .6.98 .2.67 0.06 0.02 0.58
16 . Indian Bank ....................................... 0.33 0.04 .2.84 0.09 .7.52 .2.28 17 . Syndicate Bank ................................. 0.05 .6.73 .2.47 .0.64 0.13 0.38 18 . UCO Bwk ........................................ .0.18 .3.56 .4.73 -0.63 .1.53 .1.08 19 . Allahabad Bank ................................ 0.36 . 1.20 .3.80 .0.68 0.05 0.49 20 . United Bank of India ......................... 0.10 .3.75 .7.44 -2.04 .2.16 .0.89 21 . Oriental Bank of Commerce .............. 0.67 0.43 0.54 1.38 1.64 1.56 22 . Dena Bank ....................................... 0.22 .1.79 .1.14 0.41 0.63 0.75 23 . Vijaya Bank ....................................... 0.06 .2.60 0.09 0.47 .3.47 0.24
......................... 24 . BankofMaharashtra 0.10 .4.19 .5.35 -0.59 0.16 0.54 25 . Andhra Bank ..................................... 0.19 .2.98 -2.86 -0.69 0.16 0.43 26 . Punjab 8. Sind Bank .......................... 0.02 .5.05 -3.65 -0.1 2 .1.83 0.26 27 . Corporation Bank .............................. 0.1 9 0.13 0.58 1.02 1.52 1.53
19 Natlonalised Banks (11) 0.30 -1.71 - 1.98 0.10 -0.36 0.41
27 Public Sector Banks (I(U1) 0.28 -0.99 -1.15 0.25 -0.07 0.56

Report on Trend and Progress oflhklng in India. 1996-97
Appendix Table 11.3 (D) : Financial Ratios of Publlc Sector Bank+ . Performance lndicatorz . 1991 -92 to 1996-97
Sr . Name of the Bank Interest Income as % to Total AsKb
1 L 3 4 5 6 7 8
1 . ................... State Bank of India 10.03 9.65 8.23 8.73 8.97 9.55 2 . State Bank of Patiah ................. 1 1.53 9.54 9.24 9.09 9.27 10.47 3 . State Bank of Hyderabad ........... 10.52 9.83 8.23 8.94 9.93 10.13 4 . State Bank of Travancore ........... 1 0.04 10.67 9.69 9.82 11.51 1 1.67 5 . State Bank of Bikaner & Jaipur .. 1 1.60 10.52 9.43 8.78 9.21 9.05 6 . State Bank of Mysore ............... 9.98 10.46 9.42 9.43 10.29 1 1.01
............ 7 . State Bank of Saurashtra 13.32 11.11 9.89 9.93 8.54 9.88
8 . ................. State Bank of lndore 1 1.12 10.29 10.21 9.57 10.20 10.87
SBI and 7 Associates (I) 10.20 9.76 8.45 8.85 9.17 9.75
......................... 9 . Bank of Baroda 10.08 9.92 9.34 9.43 10.22 9.99 ............................ . 10 Bank of India 10.18 9.00 7.80 7.76 8.74 9.26
1 1 . Punjab National Bank ................ 10.06 10.14 8.99 8.94 9.90 10.43
12 . Canara Bank ............................. 1 1.13 10.42 9.03 9.17 9.37 9.57
13 . Central Bank of India ................ 9.98 9.55 7.95 8.07 9.28 9.59
.................. 14 . Union Bank of India 10.26 9.86 9.45 9.15 9.67 10.28
15 . Indian Overseas Bank ............... 9.53 8.05 7.47 7.57 8.83 10.37
. .............................. 16 Indian Bank 11.20 10.14 9.47 8.53 8.46 9.18
17 . Syndicate Bank ......................... 10.14 8.56 8.51 8.11 8.79 9.12
18 . UCOBank ............................... 9.04 7.81 8.28 7.79 7.76 . 7.97
19 . Allahabad Bank ........................ 9.92 9.69 9.12 8.49 8.80 9.71
20 . United Bank of India ................. 9.74 8.33 7.40 7.13 7.69 7.90
21 . Oriental Bank of Commerce ...... 10.54 10.45 9.89 9.54 9.75 10.82
22 . Dena Bank ................................ 10.06 9.04 8.88 8.91 9.94 10.44
23 . VijayaBank ............................... 12.51 9.48 8.7 1 7.87 9.26 9.10
24 Bank of Maharashtra ................. 10.26 8.78 8.29 8.22 9.51 9.79 . 25 Andhra Bank 9.52 8.% 8.26 8.75 9.45 9.53 ............................ . 26 Punjab 4% Slnd Bank 9.82 8.37 8.05 8.47 9.04 9.64 .................. .

166 Report on Trend and Progress oFBanWng in India. 1996-97
Appendk Table 11.3 Q r Flnancid Ratios of Publlc Sector Banks . Performance Indicators 1991 -92 to 1996-97
S r . Name of the Bank Interest Expense as % to Total Assets
No . 9 1-92 92-93 93-94 94-95 95-96 96-97
1 2 3 4 5 6 7 8
1 . State Bank of India ................... 6.40 6.69 5.62 5.48 5.69 6.13
2 . State Bank of Patlala ................. 5.59 5.91 5.81 6.76
3 . State Bank of Hyderabad ........... 5.90 6.53 5.38 6.44
4 . State Bank of Travancore ........... 6.75 7.76 7.28 8.49
5 . State Bank of Bikaner & Jaipur .. 6.65 7.38 6.77 5.93 5.67 5.72
6 . State Bank of Mysore ............... 6.10 7.33 6.50 6.13 6.40 6.79
............ 7 . State Bank of Saurashtra 8.44 7.79 6.58 5.85 5.24 6.26
8 . State Bank of lndore ................. 6.65 7.36 6.76 5.67 6.10 6.59
9 . Bank of Baroda .......................... 7.16 ............................ 10 . Bank of India 7.93
1 1 . Punjab National Bank ................ 6.64
12 . Gnara Bank ............................. 6.71 6.97 6.46 5.58 6.03 6.39 13 . Central Bank of India ................ 7.18 7.72 6.50 5.62 6.13 6.42
14 . Union Bank of India .................. 6.45 7.32 6.53 5.84
15 . lndlan Overseas Bank ............... 7.80 7.43 6.41 5.79
16 . Indian Bank .............................. 9.21 8.38 7.69 6.80
17 . Syndicate Bank ......................... 7.12 6.96 6.08 5.37 ................................. 18 . UCOBank 7.11 7.29 7.22 5.60 5.0 6.04
........................ 19 . Allahabad Bank 7.84 8.44 7.17 6.5 1 6.13 6.66 20 . United Bank of India ................. 7.41 7.78 6.83 6.19 5.98 6.28
. ...... 2 1 Oriental Bank of Commerce 6.25 7.62 6.60 5.73 5.95 6.93
. 22 Dena Bank ................................ 6.82 6.80 6.34 5.68 6.30 6.59 23 . Vijaya Bank ............................... 9.32 7.39 6.04 5.26 6.73 6.19 24 . Bank of Maharashtra. ................ 7.22 7.42 6.50 5.57 5.92 6.11 25 . Andhra Bank ............................ 7.02 7.58 " 6.63 6.22 6.42 6.55 26 . Punjab & Slnd Bank .................. 7.14 7.73 6.40 5.93 6.88 7.04 27 . Corporation Bank ...................... 5.81 6.55 5.47 4.27 5.90 6.27
19 Nationallsed Banks (II) 7.3 1 7.4Q 6.46 5.75 6.30 6.68
27 Publlc Sector Banks (IUO 6.96 7.16 6.20 5.69 6.12 6.53

Report on Trend and Progress of Banking In Indla. 1996-97 167
Appendix Table 11.3 (F) : Financial Ratios of Public Sector Banks . Performance Indicators . 1991 -92 to 1996-97
S r . Name of the Bank No .
Net Interest Income (Spread) as % to Total Assets
91 -92 92-93 93-94 94-95 95-96 %-97
1 . State Bank of India ................... 2 . State Bank of Patiala ................. 3. State Bank of Hyderabad ........... 4 . State Bank of Travancore ........... 5 . State Bank of Bikaner 8, jaipur .. 6 . State Bank of Mysore ............... 7 . State Bank of Saurashtra ............ 8 . State Bank of lndore .................
SBI and 7 Assoclates (I) 3.80 3.01 2.68 3.26 3.34 3.48
9 . Bank of Baroda ......................... 2.92 2.76 2.99 3.59 3.68 3.21
............................ 10 . Bank of India 2.25 1.82 2.07 2.59 2.88 3.00
................ 1 1 . Punjab National Bank 3.42 2.86 2.70 2.85 3.27 3.47
12 . Canara Bank ............................. 4.42 3.45 2.57 3.60 3.33 3.19
................ 13 . Central Bank of India 2.80 1.82 1.46 2.46 3.15 3.17
.................. 14 . Union Bank of India 3.81 2.54 2.92 3.32 3.40 3.41
1 5 . Indian Overseas Bank ............... 1.73 0.62 1.05 1.79 2.12 2.38
16 . Indian Bank .............................. 1 -99 1.77 1.78 1.73 0.52 0.71
1 7 . Syndicate Bank ......................... 3.02 1.60 2.42 2.74 3.20 3.17
18 . UCOBank ................................. 1.93 0.51 1.07 2.19 2.17 1.93
19 . Allahabad Bank ........................ 2.09 1.26 1.95 1.99 2.67 3.05
20 . United Bank of India ................. 2.33 0.55 0.57 0.94 1.71 1.62
21 . Oriental Bank of Commerce ...... 4.29 2.83 3.29 3.81 3.80 3.89 22 Dena Bank ................................ 3.24 2.24 2.54 3.23 3.G4 3.85 . 23 . Vijaya Bank ............................ 3.19 2.09 2.67 2.62 2.53 2.91
24 . Bank of Maharashtra ................. 3.04 1.37 1.79 2.65 3.59 3.67
2 5 . Andhra Bank ............................ 2.50 1.38 1.63 2.53 3.03 2.98
26 . Punjab 8. Sind Bank .................. 2.67 0.64 1-65 2.54 2.15 2 .m
27 . Corporation Bank ...................... 3.47 2.84 2.79 2.96 3.74 3.89
19 Nationnllsed Banks (11) 2.86 2.02 2.17 2.73 2.92 2.97
27 Public Sector Banks (1811)

Report on Trend and Progress of Banking In India. 1996-97
Appendix Table 11.3 (G) : FlnancW Ratjos of Public Sector Banks- Performance Indicators . 1991 -92 to 1996-97
S r . Name of the Bank Provfslons as % to Totd Assets
No . 9 1-92 92-93 93-94 94-95 95-96 96-97
1 2 3 4 5 6 7 8
................... 1 . State Bank of India 2.54 1.63 1.13 1.36 1.52 1.32
................. 2 . State Bank of Patiala 3.70 1 -74 1.50 1.20 1.60 1.58
3 . State Bank of Hyderabad ........... 3.04 1.81 1.51 1.81 1.85 1.88
4 . State Bank of Travancore ........... 1.43 1.33 1.52 1.38 I . 68 1.42
5 . State Bank of Bikaner 8, jaipur .. 2.71 1 . 01 0.96 1.24 1.32 1.43
6 . State Bank of Mysore ............... 1.48 1.02 1.50 1.83 1.37 1.65
7 . State Bank of Saurashtra ............ 2.38 1 -62 1.43 2.13 6.94 0.98
8 . State Bank of lndore ................. 2.29 0.88 1.61 1.91 1.63 1.74
SBI and 7 Associates (I) 2.54 1.59 1.19 1.41 1.67 1.37
9 . Bank of Baroda ......................... 1.49 1.39 2.43 1 -92 f . 94 1.33
10 . Bank of India ............................ 1.1 6 1.89 5.08 0.88 0.60 0.58
1 1 . Punfab National Bank ................ 0.84 1.04 1.08 0.82 1.53 1.09
12 . Canara Bank ............................. 2.15 2.13 0.85 1.48 1.28 1.42
13 . Central Bank of India ................ 0.64 2.1 1 3.25 0.85 1.23 0.56
14 . Union Bank of India .................. 1.42 0.57 0.87 1.05 1.12 0.56
15 . Indian Overseas Bank ............... 0.33 6.55 . 3.02 0.41 0.10 0.14
16 . Indian Bank .............................. 0.59 0.72 3.20 0.45 6.27 1.47
18 . UCO Bank ................................. 0.47 2.65 3.43 0.90 1.36 0.63
. ........................ 19 Allahabad Bank 0.57 1.21 4.03 0.97 0.79 0.91
20 . United Bank of India ................. 0.18 2.12 6.01 1.09 1.79 0.4G
21 . Oriental Bank of Commerce ...... 1.76 0.76 1.29 0.99 0.98 1.04
22 . Dena Bank ................................ 0.54 1.85 1.87 0.83 1.14 1.25
23 . Vijaya Bank ............................... 0.45 2.7 1 0.76 0.69 3.54 0.20 24 . Bank of Maharashtra ................. 0.47 3.04 4.74 0.98 0.69 0.64 25 . Andhra Bank ............................ 0.32 2.26 2.53 0.9 1 0.74 0.63
26 . Punjab & Sind Bank .................. 0.29 3.22 3.40 1.04 1.94 0.48
27 . Corporation Bank ...................... 1.92 1.38 1.75 1.35 1.61 1.48
27 Public Sector Banks (1811) 1.57 1.92 2.14 1.16 1.56 1.04

Repod on Trend and Progress of Banking in Indla. 1996-97
ble 11.3 (H) : Financial Ratios of Public Sector Iknks . erformance lndi
S r . Name of the Bank Intermediation Cost as % to Total Assets No .
9 1-92 92-93 93-94 94-95 95-96 96-97
1 2 3 4 5 6 7 8
1 . State Bank of India ................... 2.37 2.56 2.64 2.96 3.09 2.94
2 . State Bank of Patiala ................. 2.32 2.22 2.27 2.57 2.52 2.50 3 . State Bank of Hyderabad ........... 2.78 2.68 2.39 2.72 3.05 2.81
........... 4 . State Bank of Travancore 2.65 2.74 2.41 2.55 2.97 2.84
State Bank of Bikaner 8, Jaipur .. 3.55 3.51 3.27 3.26 3.46 2.97 State Bank of Mysore ............... 3.46 3.43 3.19 3.14 3.82 3.44 State Bank of Saurashtra ............ 3.62 3.40 3.33 3.29 3.08 2.82
Bank of Baroda ......................... 2.17 2.26 2.19 2.50 2.53 2.37
............................ 0 . Bank of lndia 2.1 1 2.35 2.33 2.57 2.72 2.77
................ . Punjab National Bank 2.48 2.44 2.70 2.93 3.21 3.04
....................... . CanaraBank .... 2.85 2.53 2.54 2.78 2.74 2.63
................ . 13 Central Bank of India 2.95 3.04 2.96 3.09 3.40 3.19
.................. . 14 Union Bank of India 3.10 2.94 2.66 2.57 2.80 2.77
............... 1 5 . Indian Overseas Bank 2.70 2.70 2.58 2.30 2.76 2.73
.............................. . 16 Indian Bank 2.34 1 -98 2.57 2.45 2.86 2.80
17 . Syndicate Bank ......................... 3.83 3.61 3.18 3.52 3.47 3.50
18 . UCO Bank ................................. 2.54 2.58 3.07 2.93 3.27 3.16
19 . Allahabad Bank ........................ 2.42 2.42 2.54 2.77 3.04 3.02
20 . United Bank of India ................. 2.90 2.75 2.63 2.73 2.99 2.81
2 1 . Oriental Bank of Commerce ...... 2.53 2.52 2.38 2.49 2.14 2.19 22 . Dena Bank ................................ 3.43 3.07 2.87 3.20 3.07 2.99
23 . Vi jaya Bank ............................... 3.85 3.63 3.12 2.82 3.36 3.26
24 . Bank of Maharashtra ................. 3.34 3.36 3.14 3.1 2 3.73 3.41 25 . Andhra Bank ............................ 2.98 3.03 3.01 3.90 3.23 3.11
26 . Punjab & Slnd Bank .................. 2.48 3.32 2.89 2.62 3.06 3.06
27 Corporation Bank ...................... 2.80 2.65 2.19 1.96 2.20 . 2.24
19 Natlonnltsed Banks fll) 2.69 2.63 2.64 2.76 2.93 2.85
27 Public Sector Banks (Ibll) 2.6 1 2.63 2.65 2.83 2.99 2.88

No.
on
on
pa
pr
Tler 1
P
I Tie
r I1
Total
to W. F
unds
to
W. F
lmds
to W
. Fun
ds
to W
. Fur&
W.
FLndS
Aaet
s%
fmp
kjtc
1
2
3 4
5 6
7 8
9 10
1 f
12
13
14
15
OLD
PR
NA
lE SECTOR
BA
NK
S 1
The
Ben
ares
Sta
te B
ank
Ltd.
......
.....
2.65
0.34
2.99
10.01
2.19
2.49
2 D
evel
opm
ent Credit
Bank
Ltd
. 21.78
1.07
0.23
0.26
16.98
.......
1.69
23.47
9.99
1.94
3.67
2.48
3 Th
e C
atho
lic Syrian
Bank
Ltd
. ....
.....
t .w
0.52
2.51
2.06
17.92
1.77
12.76
1.17
3.03
0.83
4
City
Uni
on B
ank
Ltd.
8.20
1.27
9.47
10.88
0.24
0.25
19,75
........
........
.......
2.01
2.88
2.6
1 1.23
5 Th
e fe
dera
l Ban
k Lt
d. ...
........
........
.. 9.07
0.14
9.22
10.76
1.36
33.12
1.31
2.11
1.36
6
Bhar
at O
vers
eas
Bank
Ltd
. 10.80
0.85
0.94
17.42
........
......
1.71
12.51
9.61
1.06
3.06
1.79
7 T
he K
a~
r
Vys
ya B
ank
Ltd.
12.33
1.06
1.16
21.57
........
......
0.43
12.76
11.35
1.70
3 .%
2.99
1.86
8 Th
e La
kshm
i Vila
s Ba
nk L
td. .
........
.. 10.43
0.2 1
2.08
34.31
10.64
10.91
2.06
3.09
1.69
1.39
1.53
26.65
9
The Ratnakar B
ank
Ltd.
......
........
.....
6.07
3.78
9.85
10.71
0.84
3.67
1.04
0.73
0.83
0.22
10
The
Uni
ted
Wes
tern
Ban
k Lt
d. ...
.....
9.81
0.38
10.19
10.06
2.48
2.81
2.54
0.94
1.03
17.99
t t
The
Sout
h In
dian
Ban
k Lt
d. ...
........
.. 5.34
2.93
8.27
11.80
0.93
2.70
0.92
0.33
0.35
11.82
12
Tam
ilnad
Mer
cant
ile B
ank
Ltd.
.......
. 14.30
1.35
15.65
1 1.68
2.41
4.65
4.19
2.23
0.02
0.35
........
... 13
Th
e D
hana
laks
hmi B
ank
Ltd.
7.59
2.16
9.75
10.23
1.01
2.33
1.35
0.65
0.77
18.15
........
.. 14
SBI C
omm
. a In
ter.
Bank
Ltd
34.23
0.00
34.23
9.48
1.07
1.29
1.08
1.17
1.18
10.12
15
The
Ned
unga
di B
ank
Ltd.
.......
........
1 1.76
0.21
1 1.97
10.97
1.61
3.40
1.25
0.64
0.72
12.29
16
Lord
Kris
hna
Bank
Ltd
. ....
........
.......
5.40
0.00
5.40
1 1.22
1.52
2.49
2.24
0.78
0.94
24.49
1 7
The
Kar
nata
ka B
ank
Ltd.
... .:. .
.,......
.. 1 1.37
0.86
12.23
11.60
1.26
4.1 1
2.90
1.41
1.57
25.43
........
........
.......
18
The
Sang
li Ba
nk L
td.
5.23
2.80
8.03
9.48
1.36
3.05
1.09
0.50
0.52
29.73
........
........
........
I??
T
heV
ysya
Ban
kLtd
14.02
0.19
14.21
10.67
1.68
2.10
1.86
1.09
1.16
15.92
20
The
Gan
esh
Bank
of
Kur
undw
ad L
td.
4.00
4.00
8.00
11.90
1.30
3.63
1.55
0.37
10.97
613.2
........
........
.......
2 1
Bank o
f Mad
ura
Ltd.
12.03
0.16
12.19
10.19
2.15
3.23
2.10
1.06
1.15
33.24
........
......
2.2
The
Ban
k of
Raj
asth
an L
td.
9.47
0.66
10.13
10.72
1.26
2.90
1.54
0.23
0.2.4
4.40
........
23
B
arei
lly C
orpo
ratio
n Ba
nk L
td,
2.95
0.00
2.95
9.37
0.88
2.90
0.15
0.07
0.08
10.13
........
........
........
... 24
N
aIni
taJ
Bank
Ltd
. 8.41
1.45
9.86
10.42
0.49
4.21
1.51
0.25
0.28
17.58
.....
ZT
Th
e~m
u&
Kas
hm
irB
;ulk
Ltd
13
.73
1.85
15.58
9.44
0.70
3.48
2.34
0.59
0.65
15.72
NEW
WA
lE
SECT
OR
BA
NK
S ....
........
........
........
......
26
lfjl
mk
Ltd.
14.06
0.23
14.29
9.54
1.46
2.15
2.01
0.92
1.06
11.65
........
........
........
27
C
entu
rion Bank LM.
27.00
0.00
27.00
8.04
0.75
2.78
2.10
1.20
1.88
13.36
........
28 WU B
anki
ng C
orpo
ratio
n Lt
d.
12.46
0.45
12.91
10.95
2.39
3.68
3.80
2.25
2.73
23.70
........
........
........
. 29
Bank o
f Pun
jab
Ltd.
18.65
0.00
18.65
7.65
2.19
2.55
2.45
2.13
2.95
19.87
9.1
1 1 .00
........
........
.....
10.11
13.46
3.40
2.53
3.92
2.16
2.36
35.25
100
11
100
too
112
13
92
80
110
80
loo
100
loo
1m
100
93
123
36
122
64
100
20
100
200
1 20
6s
100
400
115
28
90
80
100
100
112
22
112
107
65
14
150
100
100
20
110
N A
110
13
97
N.A
.
200
600
1 49
97 1
100
900
100
600
100
1.300
200
200
200
2.90
0 200
300
ZOO
800
to 11.4 (
H) w
hich
is
base
d on
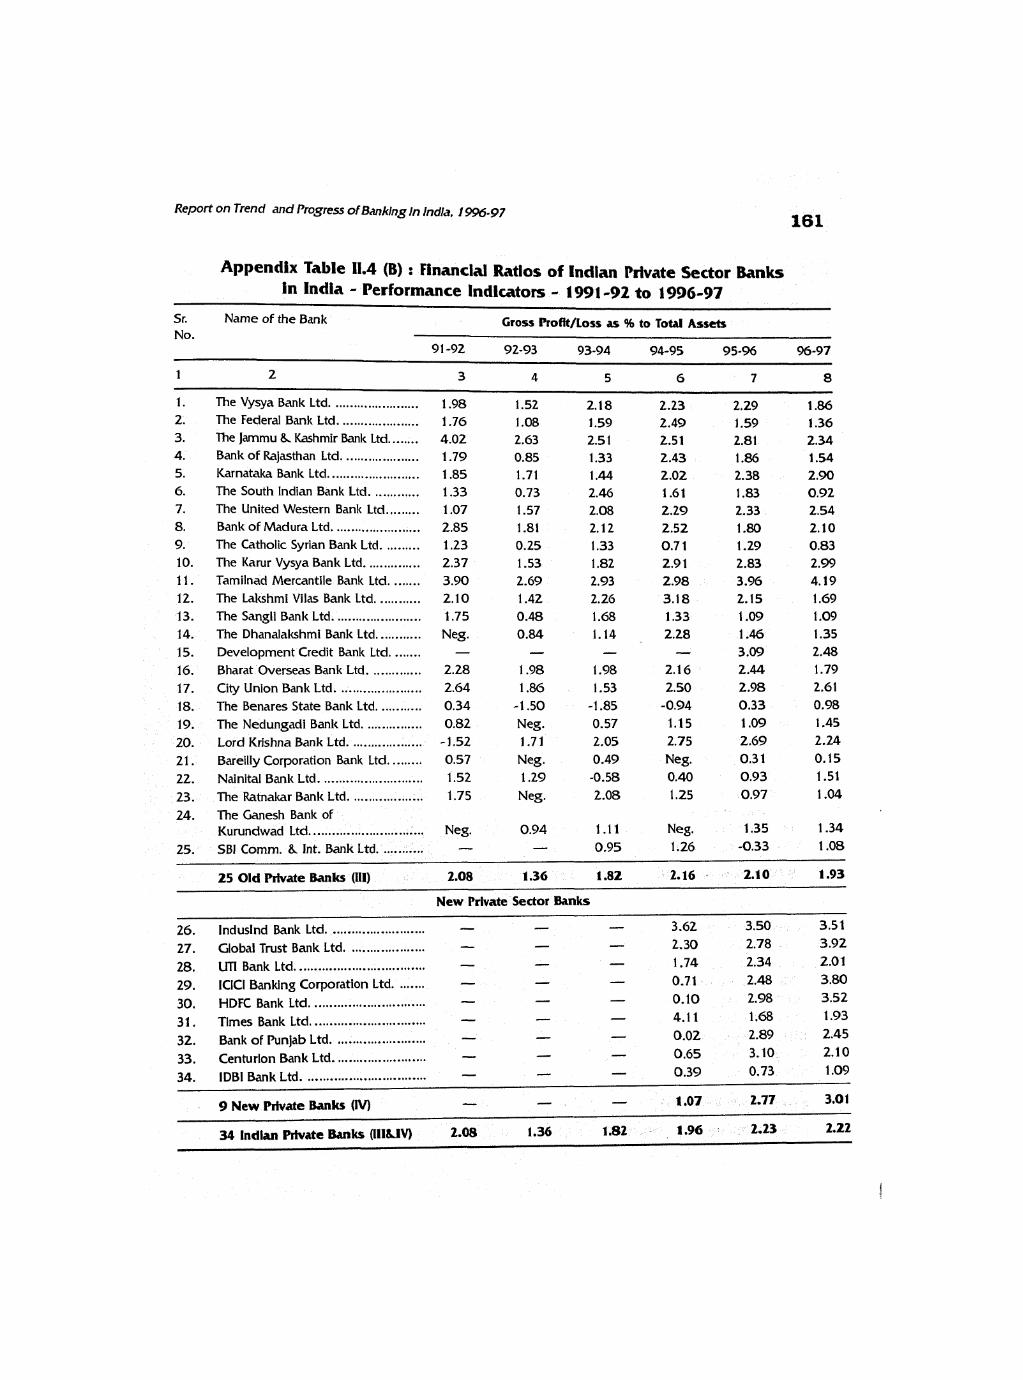
Report on Trend and Progress of Banking In Indla. 19%-97
Appendix Table 11.4 (B) : Financial Ratios of indlan Private Sector Banks in lndia . Performance Indicators . I 991 -92 to 1996-97
S r . Name of the Bank Gross Proflt/Loss as % to Total Asseb No .
91 -92 92-93 93-94 94-95 95-% 96-97
1 2 3 4 5 G 7 8
1 . The Vysya Bank Ltd ........................ 1.98 1.52 2.18 2.23 2.29 1.86
2 . The Federal Bank Ltd ...................... 1.76 1.08 1.59 2.45) 1.59 1.36 3 . The Jammu 8. Kashmir Bank Ltd ........ 4.02 2.63 2.5 1 2.51 2.81 2.34 4 . Bank of Rajasthan Ltd ..................... 1.79 0.85 1.33 2.43 1.86 1.54 5 . Karnataka Bank Ltd ......................... 1.85 1.71 1.44 2.02 2.38 2.90 6 . The South Indian Bank Ltd ............. 1.33 0.73 2.46 1.61 1.83 0.92 7 . The United Western Bank Ltd ......... 1.07 1.57 2.08 2.29 2.33 2.54 8 . Bank of Madura Ltd ........................ 2.85 1.81 2.12 2.52 1.80 2.10 9 . The Catholic Syrian Bank Ltd .......... 1.23 0.25 1.33 0.7 1 1.29 0.83
............... 10 . The Karur Vysya Bank Ltd 2.37 1.53 1.82 2.9 1 2.83 2. 99 1 1 . Tamilnad Mercantile Bank Ltd ........ 3.90 2.69 2.93 2.98 3.96 4.19
............ 12 . The Lakshmi Vilas Bank Ltd 2.10 1.42 2.26 3.18 2.15 1.69 ........................ . 13 The Sangli Bank Ltd 1.75 0.48 1.68 1.33 1 -09 1.09
............ . 14 The Dhanalakshmi Bank Ltd Neg . 0.84 1.14 2.28 1.46 1.35 15 . Development Credit Bank Ltd ........ - - - 3.09 2.48
.............. . 16 Bharat Overseas Bank Ltd 2.28 1.98 1.98 2.1 6 2.44 1.79 ....................... . 17 City Union Bank Ltd 2.64 1.S 1.53 2.50 2.98 2.61
............ . 18 The Benares State Bank Ltd 0.34 -1 . 50 .1.85 .0.94 0.33 0.98 ................ . 19 The Nedungadi Bank Ltd 0.82 Neg . 0.57 1.15 1.09 1.45
..................... . 20 Lord Krjshna Bank Ltd 1.52 1.71 2.05 2.75 2.69 2.24 ......... . 21 Bareilly Corporation Bank Ltd 0.57 Neg . 0.49 Neg . 0.3 1 0.15
............................ . 22 Nainital Bank Ltd 1.52 1.29 .0.58 0.40 0.93 1.51 .................... . 23 The Ratnakar Bank Ltd 1.75 Neg . 2.08 1.25 0.97 1.04
24 . The Ganesh Bank of . ............................... Kurundwad Ltd Neg 0.94 1.11 Neg . 1.35 1.34
25 . SBI Comm . B Int . Bank Ltd ............ - - 0.95 1.26 .0.33 1.08
25 Old Mate Banks (111) 2.08 1.36 1.82 2.16 2.1 0 1.93
New Private Sector Banks
26 lnduslnd Bank Ltd - . . 3.62 3.50 3.51 ........................ . 27 Global Trust Bank Ltd - - - 2.30 2.78 3.92 . ..................... 28 Im Bank Ltd - - - 1.74 2.34 2.01 . ................................... 29 IClCl Banking Corporation Ltd - - - 0.71 2.48 3.80 ........ . 30 HDFC Bank Ltd - - - 0.10 2.98 3.52 . .............................. 31 Times Bank Ltd - - - 4.1 1 1.68 1.93 . ............................... 32 Bank of Punjab Ltd - - 0.02 2.89 2.45 ......................... . 33 Centurion Bank Ltd - - - 0.65 3.10 2.10 ......................... . 34 lDBI Bank Ltd .. - - - 0.39 0.73 1.09 . ....................... .....
9 New Mate Banks M - - 1 . 07 2.77 3.0 1
34 Indian M a t e Banks (IllblV) 2.08 1.36 1.82 1.96 2.23 2.22

Report on Trend and Progress of Banking in India. 1 W6-97
Appendix Table 11.4 (C) : Financial Ratios of Indian Private sector Banks in India . Performance Indicators . 1991-92 to 1996-97
Sr . Name of the Bank N& ~ont/Loss as % to Total Assets No .
91-92 92-93 93-94 94-95 95-96 96-97
I 2 3 4 5 6 7 8
I . The Vysya Bank Ltd ........................ 0.68 0.67 0.76 1 . 64 2.01 1.09 2 . The Federal Bank Ltd ...................... 0.37 0.42 0.66 1.30 1.03 0.85 3 . The jammu & Kashmir Bank Ltd ........ 0.17 0.20 0.53 0.58 0.53 0.59 4 . Bank of Rajasthan Ltd ..................... 0.97 0.4 1 0.84 2.04 1.50 0.23 5 . Karnataka Bank Ltd ......................... 0.76 0.67 0.65 0.80 1.1 1 1.41 6 . The South Indian Bank Ltd ............. 0.62 0.22 0.77 0.85 0.22 0.33 7 . The United Western Bank Ltd ......... 0.34 0.18 0.32 0.63 0.75 0.94 8 . Bank of Madura Ltd ........................ 0.74 0.53 0.30 2.08 0.54 1.06 9 . The Catholic Syrian Bank Ltd .......... 0.51 0.27 0.42 0.35 0.02 0.24 10 . The Karur Vysya Bank Ltd ............... 1.39 0.82 1.16 1.53 2.1 1 1.86 1 1 . Tamllnad Mercantile Bank Ltd ........ 1.03 0.99 1.12 1.35 1.68 2.23 12 . The Lakshml Vilas Bank Ltd ............ 0.84 0.67 . 0.65 1.56 0.90 1.39 13 . The Sangli Bank Ltd ........................ 0.46 0.12 0.26 0.18 0.36 0.50 14 . The Dhanalakshmi Bank Ltd ............ 0.18 0.2 1 0.42 0.84 0.57 0.65 15 . Development Credit Bank Ltd ........ - - - - 2.34 1.77 16 . Bharat Overseas Bank Ltd .............. 0.74 0.12 0.64 0.79 1.17 1.06 17 . City Union Bank Ltd ....................... 0.66 0.62 0.56 1.07 1.32 1.23 18 . The Benares State Bank Ltd ............ 0.0 1 .4.64 -3.45 -1.87 .3.21 0.21 19 . The Nedungadi Bank Ltd ................ 0.60 0.04 0.06 0.42 0.36 0.64 20 . Lord Krishna Bank Ltd .................... - 1 . 1 7 1.73 0.98 1.42 1.54 0.78 2 1 . Bareilly Corporation Bank Ltd ......... 0.02 0.04 -0.64 -0.22 -0.82 0.07 22 . Nainital Bank Ltd ............................ 0.60 0.50 0.15 0.25 0.28 0.25 23 . The Ratnakar Bank Ltd .................... 0.53 0.69 0.59 0.56 0.58 0.73 24 . The Ganesh Bank of
Kurundwad Ltd ............................... 0.97 0.31 0.49 0.29 0.1 9 0.32 25 . SBI Comm . 8. lnt . Bank Ltd ............ - - 0.95 1.26 3.23 1.17
25 Old Private Banks (Ill) 0.57 . 0.34 0.56 1.16 1.06 0.92
New Private Sector Banks
26 . lnduslnd Bank Ltd .......................... - . . 2.38 2.42 2.06 27 . Global Trust Bank Ltd ..................... - - - 1.48 1.82 2.16 28 . Im Bank Ltd ................................... - - - 0.41 0.92 0.92 29. ICICI Banking Corporation Ltd ........ - - - 0.43 1.43 2.25 30 . HDFC Bank Ltd ............................... - - - 0.09 2.04 2.23 31 . Times Bank Ltd ............................... - - - 1.81 1.34 0.93 32 . Bank of Punjab Ltd. ........................ - - - 0.02 2.86 2.13 33 . Centurion Bank Ltd ......................... - - - 0.65 2.88 1.47 34 . lDBl Bank Ltd ................................. - - - 0.24 0.73 0.46
4
9 New Private Bank 0 - - - 0.64 1.85 1.77
34 Indlan Private Bank ( I I I W 6.57 0.34 0.56 1.06 1.21 1.15

Report on Trend and Progress of Banking In Indid. 1996-97
Appendix Table 11-4 (D) : Financial Ratios of Indian m t e actor m k s in India . Performance Indicators . 1991 -92 to 1996-97
Sr . Name of the Bank Interest Income as % t o Total Assets No .
9 1-92 92-93 93-94 94-95 95-96 96-97
1 2 3 4 5 6 7 8
1 . The Vysya Bank Ltd ........................ 8.63 7.48 8.23 7.46 10.67 10.67 ...................... 2 . The Federal Bank Ltd 8.37 9.1 7 8.55 10.08 9.69 10.76
3 . The Jammu & k h m i r Bank Ltd ........ 10.25 9.74 9.54 9.56 9.27 9.44 4 . Bank of Rajasthan Ltd ..................... 9.78 10.1 1 8.92 9.26 9.27 10.72 5 . Karnataka Bank Ltd ......................... 10.64 10.66 9.78 9.88 10.05 11.60 6 . The South Indian Bank Ltd ............. 10.05 9.95 9.99 10.20 1 1.50 11.80 7 . The United Western Bank Ltd ......... 9.89 10.24 9.1 2 8.44 10.01 10.06 8 . Bank of Madura Ltd ........................ 10.57 10.88 9.40 8.13 9.16 10.19 9 . The Catholic Syrian Bank Ltd .......... 10.32 10.25 10. 24 9.89 10.94 12.76 10 . The Karur Vysya Bank Ltd ............... 10.08 10.37 8.10 8.49 1 1.35 11.35 1 1 . Tamilnad Mercantile Bank Ltd ........ 9.86 8.37 8.47 8.93 10.52 1 1.68 12 . The Lakshmi Vilas Bank Ltd ............ 9.56 9.33 8.72 8.37 10.89 10.91
........................ 1 3 . The Sangli Bank Ltd 10.65 9.89 10.10 8.82 9.96 9.48 ............ . 14 The Dhanalakshmi Bank Ltd 9.84 10.04 9.43 9.89 10.10 10.23
1 5 . Development Credit Bank Ltd ........ - - - - 9.68 9.93 .............. . 1 6 Bharat Overseas Bank Ltd 10.1 7 9.91 9.01 9.0 1 10.62 9.61
....................... . 1 7 City Union Bank Ltd 10.1 3 9.63 9.46 9.32 10.35 10.88 . ............ 1 8 The Benares State Bank Ltd 10.14 8.41 8.20 7.14 8.90 9.21
................ . 19 The Nedungadi Bank Ltd 9.84 10.07 10.26 10.34 10.70 11.18 .................... . 20 Lord Krishna Bank Ltd 6.06 8.55 8.72 9.62 10.83 1 1.22
......... . 2 1 Bareilly Corporation Bank Ltd 8.52 7.38 10.29 8.86 9.71 9.26 ............................ . 22 Nainital Bank Ltd 10.61 10.32 9.36 9.50 10.1 1 10.42
.................... . 23 The Ratnakar Bank Ltd 10.53 9.68 11.11 9.7 1 10.70 10.71 24 . The Canesh Bank of
............................... Kurundwad Ltd 13.33 10.16' 10.40 9.52 10.15 10.34 ............ 25 . SBI Comm . S, Int . Bank Ltd - - 2.32 7.76 11.44 9.48
25 Old M a t e Banks (Ill) 9.72 9.39 8.91 8.89 10.15 10.67
New Mate Sector Banks
26 lnduslnd Bank Ltd - - - 6.70 10.14 1 1 -49 .......................... . 27 Global Trust Bank Ltd - - - 3.76 7.73 13.45 ..................... . 28 UTI Rank Ltd - - - 5.17 10.66 9.54 . ....................*...*.......... 29 . IClCI Banking Corporation Ltd ........ - - - 4.34 10.04 10.95 30 HDFC Bank Ltd - - - 0.37 1 1.55 8.91 ............................... . 31 rimes Bank Ltd - - - 4.98 6.01 9.55 . ............................... 32 Bank of Punjab Ltd - - - 0.34 5.99 7.65 ......................... . 33 CentuAon Bank Ltd - - - 1.23 1 1.30 8.04 ......................... . 34 JDBI Bank Ltd - - - Neg . 6.22 5.55 ................................. .
9 New Rfvate h k s 0 - - - 2.33 9.25 10.26
34 Indian Prtvatc Bank QIIW 9.72 9.39 8.9 1 7.67 9.97 10.56

Repon' on Trend and Progress of Banking In India. 1996-97
Appendjx Table 11.4 (E) r Anlnclal Ratios of Indian Prfvate Sector Banks In India . Performance lndlcatorr . 1991-92 to 1996-g7
S r . Name of the Bank Interest Expense as % to Total Assets
No . 9 1 -92 92-93 93-94 94-95 85-96 96-97
1 2 3 4 5 6 7 8
1 . The Vysya Bank Ltd ........................ 5.42 5.56 5.85 5.56 8.49 8.57
2 . The Federal Bank Ltd ...................... 5.1 0 6.92 5.86 6.79 7.26 8.64
3 . The jatrmu & Kashmlr Bank Ltd ........ 4.60 5.60 5.45 5.13 5.22 5.96
4 . Bank of Rajasthan Ltd ..................... 5.79 7.14 5.99 5.55 6.49 7.82 5 . Karnataka Bank Ltd. ........................ 6.94 7.15 6.87 6.24 6.40 7.48
6 . The South Indian Bank Ltd ............. 6.30 7.30 7.10 7.14 7.77 9.10 7 . TheUnltedWesternBankLtd ......... 6.28 7.07 6.08 5.37 6.88 7.25 8 . Bank of Madura Ltd ........................ 5.87 6.95 6.35 5.22 6.54 6.96 9 The Cathollc Syrian Bank Ltd .......... 6.47 7.53 7.01 6.99 7.90 9.73 10 . The Karur Vysya Bank Ltd ............... 5.93 7.16 5.17 5.67 8.00 7.39 1 1 . Tamilnad Mercantile Bank Ltd ........ 4.72 4.93 4.99 5.23 6.19 7.02 12 . The Lakshmi Vilas Bank Ltd ............ 5.36 6.29 5.41 5.43 7.55 7.82 13 . The Sangli Bank Ltd ........................ 6.28 6.86 6.17 5.56 6.16 6.43 14 . The Dhanalakshmi Bank Ltd ............ 6.01 6.69 6.29 6.65 7.01 7.89 15 . Development Credit Bank Ltd ........ - - - - 4.67 6.32 16 . Bharat Overseas Bank Ltd .............. 6.22 6.08 5.33 5.21 6.73 6.56 17 . City Union Bank Ltd ....................... 5.73 6.2 1 6.39 6.06 6.97 8.00 18 . The Benares State Bank Ltd ............ 7.43 7.51 7.67 5.83 6.41 6.92 19 . The Nedungadi Bank Ltd ................ 6.15 7.38 7.41 6.67 6.65 7.57 20 . Lord Krishna Bank Ltd. ................... 4.55 5.13 5.13 5.84 7.09 8.73 2 1 . Bareilly Corporation Bank Ltd ......... 5.68 5.33 6.86 5.91 6.13 6.39 22 . Nainital Bank Ltd ............................ 6.06 6.45 7.02 6.14 5.9 1 6.20 23 . The Ratnakar Bank Ltd .................... 6.14 7.26 6.94 6.29 7.15 7.03 24 . The Ganesh Bank of
Kurundwad Ltd ............................... 6.67 6.35 6.38 7.14 7.41 7.20 25 . SB1 Comm . 8, Int . Bank Ltd ............ - - 0.96 6.22 10.86 8.19
..
25 Old M a t e Banks (111) 5.70 6.48 5.94 5.86 7.01 7.72
New Private Sector Banks
26 . Induslnd Bank Ltd .......................... - . . 4.05 7.12 8.71 27 . ClobalTrustBankLtd ..................... - - . 1.48 6.14 10.93 28 . UTI Bank Ltd ................................... - - - 2.50 8.38 7.39 29 . lClCl Banking Corporation Ltd ........ - - - 2.90 7.34 7.27 30 . HDFC Bank Ltd ............................... - - - 0.14 7.14 4.80
............................... . 31 Times Bank Ltd - - - 0.01 3.49 6.95 32 . Bank of Punjab Ltd . ..............,......... - - - 0.01 1.48 5.10 33 . Centurion f3ank Ltd ......................... - - - 0.17 6.48 5.26 34 . IDBl Bank Ltd ................................. - - - Neg . 0.16 2.M
9 New M a t e Banks (lV) - - - 1.16 6.41 7.35
34 lndlan hhrate Banks (IIILUV) 5.70 6.48 5.94 4.98 6& 7.62

Report on Trend and Progress of Banking In Indla. t 9%-97 166
Appendix Table 11.4 (i) : Financial Ratios of Indian Prtvate Sector h k s in India . Performance Indicators . 1991 -92 to 1996-97
S r . Name of the Bank Net-Interest Income (Spread) as % to Total Assets No .
91-92 92-93 93-94 94-95 95-96 96-97
1 2 3 4 5 G 7 8
1 . The Vysya Bank Ltd ........................ 3.22 1.92 2.38 1 -90 2.18 2.10 2 . The Federal Bank Ltd ...................... 3.28 2.26 2.69 3.28 2.43 2.11 3 . The Jarnmu 8, Kashmir Bank Ltd ........ 5.66 4.14 4.09 4.44 4.05 3.48 4 . Bank of Rajasthan Ltd ..................... 3.99 2.97 2.94 3.70 2.78 2.90 5 . Karnataka Bank Ltd ......................... 3.70 3.50 2.9 1 3.64 3.65 4.11
............. 6 . The South Indian Bank Ltd 3.75 2.65 2.90 3.05 3.73 2.70 7 . The United Western Bank Ltd ......... 3.61 3.18 3.04 3.07 3.13 2.81 8 . Bank of Madura Ltd ........................ 4.70 3.93 3.06 2.91 2.61 3.23
.......... 9 . The Catholic Syrian Bank Ltd 3.85 2.72 3.22 2.90 3.04 3.03 10 . The Karur Vysya Bank Ltd ............... 4.15 3.20 2.92 .3.58 3.35 3.96
........ 1 1 . Tamilnad Mercantile Bank Ltd 5.13 3.44 3.47 3.70 4.33 4.65 ............ 12 . The Lakshmi Vila Bank Ltd 4.20 3.04 3.31 2.94 3.34 3.09
13 . The Sangli Bank Ltd ..................... .,. 4.36 3.03 3.93 3.26 3.80 3.05 . ............ 14 The Dhanalakshmi Bank Ltd 3.83 3.35 3.14 3.23 3.09 2.33
15 . Development Credit Bank Ltd ........ - - - - 5.00 3.67 .............. . 16 Bharat Overseas Bank Ltd 3.94 3.84 3.68 3.80 3.90 3.06
....................... . 17 City Union Bank Ltd 4.41 3.42 3.07 3.26 3.38 2.88 ............ . 18 The Benares State Bank Ltd 2.70 0.90 0.53 -4.89 2.48 2.29
................ . 19 The Nedungadi Bank Ltd 3.69 2.68 2.85 3.68 4.05 3.62 .................... . 20 Lord Krishna Bank Ltd 1.52 3.42 3.59 3.78 3.75 2.49
......... . 21 Bareilly Corporation Bank Ltd 2.84 2.05 3.43 2.95 3.59 2.87 '
............................ . 22 Nainital Bank Ltd 4.55 3.87 2.34 3.36 4.19 4.21 23 . The Ratnakar Bank Ltd .................... 4.39 2.42 4.17 3.43 3.55 3.67 24 . The Ganesh Bank of
............................... Kurundwad Ltd 6.67 3.81 4.02 2.38 2.74 3.14 ............ . . 25 . SBI Comm 8. Int Bank Ltd - - 1.36 1.54 0.58 1.29
25 Old Mate Banks (111) 4.02 2.91 2.97 3.04 3.14 2.96
New Private Sector Banks
28 . UTI Bank Ltd ................................... 29 IClCl &inking Corporation Ltd - - - 1.44 2.70 3.68 ........ . 30 HDFC Bank Ltd - - - 0.23 4.41 4.11 . ............................... 31 TimesBankLtd - - - 4.97 2.52 2.60 . ............................... 32 Bank of Punjab Ltd - - - 0.33 4.51 2.55 ........................ . 33 Centurion Bank Ltd - - - 1.06 4.82 2.78 . ...,..................... 34 IDBl Bank Ltd - - - Neg . 6.05 3.07 . ...............................
9 New Private Banks 0 - - - 1.17 2.84 2.91
34 Indlm Private Banks (IIIm 4.02 2.9 1 2.97 2.69 3.08 2.94

Report on Trend and Progress of Banking In India. 1996-97
No. 9 1 -92 92-93 93-94 94-95 95-96 96-97
1 2 3 4 5 6 7 8
........................ . 1 The Vysya Bank Ltd 1.30 0.83 1.41 0.59 0.28 0.78
2. The Federal Bank Ltd ...................... 1.33 O.G2 0.92 1.18 0.56 0.51
........ . 3 lhe Jammu 8. Knshmlr E!ank Ltd 3.86 2.45 2.00 1.93 2.28 1.75 ..................... . 4 Bank of RaJasthan Ltd 0.81 0.42 0.50 0.37 0.35 1.31
......................... 5 . Karnataka Bank Ltd 1.04 1.04 0.79 1.22 1.27 1.50 ............. . 6 The South Indian Bank Ltd 0.73 0.46 1.67 0.69 I .GO 0.60
......... . 7 The United Western Bank Ltd 0.67 0.39 1.77 1.66 1.58 1.60 ........................ . 8 Bank of Madura Ltd 2.01 1.06 1.88 0.44 1.25 1.04
.......... 9 . The Cathollc Syrian Bank Ltd 0.77 Neg . 0.85 0.39 1.26 0.59 10 . The Karur Vysya Bank Ltd ............... 0.79 0.7 1 0.67 1.37 0.72 1.14 1 1 . Tamilnad Mercantile Bank Ltd ........ 2.87 1.79 1.85 1.61 2.27 1.96 12 . The Lakshmi Vila Bank Ltd ............ 1.40 0.6 1 1.50 1.63 1.25 0.30 13 . The Sangll Bank Ltd ........................ 1.22 0.32 1.40 1.09 0.73 0.60 14 . The Dhanalakshmi Bank Ltd ............ Neg . 0.42 1.14 1.52 0.90 0.70 15 . Development Credit Bank Ltd ........ - - - - 0.75 0.71 16 . Bharat Overseas Bank Ltd .............. 1.66 1.86 1.34 1.37 1.27 0.73 17 . City Union Bank Ltd ....................... 1.76 1.24 1.02 1 '43 1.67 1.39 18 . The Benares State Bank Ltd ............ 0.34 3.00 1.59 0.94 3.54 0.77 19 . The Nedungadi Bank Ltd ................ 0.41 0.34 0.57 0.46 0.73 0.81 20 . Lord Krishna Bank Ltd .................... - Neg . 1.54 1.37 1-15 1.46 21 . Bareilly Corporation Bank Ltd ......... - - 0.98 0.42 1.13 0.08 22 . Nainital Bank Ltd ............................ 1.52 0.65 Neg . 0.15 0.64 1.26 23 . The Ratnakar Bank Ltd .................... 0.88 Neg . 1.39 0.68 0.39 0.31 24 . The Ganesh Bank of
Kurundwad Ltd ............................... Neg . 0.6 1 0.6 1 2.38 1-16 1.02 25 . SBI Comm . 8. Int . Bnnk Ltd ............ - - Neg . Neg . -3.56 -0.09
25 Old Mate Banks (110 1 . 50 1.00 1.26 1 . 00 1.04 1.01
New Private Sector Bnnks
26 . lnduslnd Bank Ltd .......................... - - - 1.25 1.08 1.45 27 . Global Trust Bank Ltd ..................... - - - 0.82 0.96 1.75 28 . UTI Bank Ltd ................................... - - - 1.33 1.42 1. 0!3 29 . IClCl Banking Corporation Ltd ........ - - - 0.27 1.05 1.55
30 . HDFC Bank Ltd ............................... - - - 0.01 0.93 1.29 31 . rimes Bank Ltd ............................... - - - 2.30 0.33 1.00 32 . Bank of Punjab Ltd ......................... - - - Neg . 0.03 0.32 33 . Centurion Bank Ltd. ........................ - - - Neg . 0.2 1 0.63 34 . IDBI Bank Ltd. ................................ - - - 0.16 - 0.63
9 New Mate Bank N) - - - 0.43 0.92 1.23
34 Indian Mate Banks ~III IJV) 1 . M 1.00 1.26 0.90 1.02 1.07

Report on Trend and Progress of Banking in India. 1996-97 167
. Performance Indicators . 1-1-92 to 1996-5)7
Intermediation Cost as % to Total Assets No .
9 1 -92 92-93 93-94 94-95 95-96 96-97
1 2 3 4 5 6 7 8
1 . The Vysya Bank Ltd ........................ 2.43 1.82 1.71 1.33 1.92 1.92 2 . The Federal Bank Ltd ...................... 2.3 1 2.26 1.92 2.29 2.41 2.06 3 . The Jammu 8, Kashmir Bank Ltd ........ 1.96 1.93 2.00 2.47 1.98 1.84 4 . Bank of Rajasthan Ltd ..................... 3.18 3.1 1 2.72 2.59 2.23 2.61 5 . Karnataka Bank Ltd ......................... 3.01 2.88 2.65 2.82 2.42 2.48 6 . The South Indian Bank Ltd ............. 3.63 3.10 2.82 2.88 3.05 2.71 7 . The United Western Bank Ltd ......... 3.21 2.83 2.54 2.37 2.88 2.75 8 . Bank of Madura Ltd ........................ 3.86 4.08 3.64 2.57 3.34 3.28
.......... 9 . The Catholic Syrian Bank Ltd 3.54 3.2 1 2.94 3.06 3.14 3.37 10 . The Karur Vysya Bank Ltd. .............. 3.36 3.08 2.47 2.00 2.86 2.66 1 1 . Tamilnad Mercantile Bank Ltd ........ 3.29 2.99 2.61 2.49 2.62 2.88
............ . 12 The Lakshmi Vilas Bank Ltd 3.73 3.65 3.3 1 2.35 3.53 3.45 . ........................ 13 The Sangli Bank Ltd 3.49 3.51 3.37 3.02 3.M 3.32
............ 14 . The Dhanalakshmi Bank Ltd 4.92 3.77 3.14 2.66 2.47 2.00 15 . Development Credit Bank Ltd ........ - - - - 2.60 3.13
.............. . 16 Bharat Overseas Bank Ltd 2.90 2.90 2.88 2.67 2.91 2.33 ....................... . 17 City Union Bank Ltd 3.08 2.80 3.07 2.27 2.33 2.27
............ . 18 The Benares State Bank Ltd 3.38 3.30 3.1 7 3.20 3.77 3.32 ................ . 19 The Nedungadi Bank Ltd 4.5 1 4.36 4.27 4.14 4.54 3.77
.................... . 20 Lord Krishna Bank Ltd 4.55 3.42 2.56 2.41 2.09 1.77 ......... . 2 1 Bareilly Corporation Bank Ltd 3.41 2.87 3.92 4.22 4.37 3.58
22 . NainitalBankLtd ............................ 3.79 3.23 3.51 3.57 3.80 3.19
.................... . 23 The Ratnakar Bank Ltd 2.63 3.23 2.78 2.66 3.27 3.48 24 . The m e s h Bank of
............................... Kurundwad Ltd 6.67 3.25 3.24 2.38 2.65 2.63 25 . SBI Cornrn . 8. lnt . Bank Ltd ............ - - 0.41 1.13 1.35 1.29
25 Old Private Banks (Ill) 2.98 2.72 2.45 2.33 2.60 2.50
New Private Sector Banks
26 lnduslnd Bank Ltd - - - 1.01 1.46 1.58 .......................... . 27 . Global Trust Bank Ltd ..................... - - 0.83 I . 25 2.01 U1 UTI Bank Ltd - - - 1.25 1.52 1.60 ................................... . 29 ICICI Banking Corporation Ltd - - - 2.68 2.37 2.27 ........ . 30 HDFC Bank Ltd - - - 0.18 2. 79 2.32 ............................... . 3 1 rimes Bank Ltd - - - 1.12 1.60 1.79 ............................... . 32. Bank of Punjab Ltd - - - 0.31 2.67 2.30 ......................... - - - 33 . Centurion Bank Ltd ......................... 0.67 2.90 1.44 - - - 34 . lDB1 Bank Ltd ................................. 1.97 7.38 2.74
9 New Watt Banks (IV) - - - 0.65 1.89 1.92
34 Indm Prhrate Bank (Il lhlV) 2.98 2.72 2.45 2.01 2.46 2.35

8.23
11.91
8.97
10.20
8
Citi
bank
N.A. ....
........
........
........
.....
9.05
0.40
9.45
1 1.27
5.27
69. 485
348
3.65
246
4.42
4.25
0.57
0.60
N.A
77. 100
9 D
redn
er B
ank
........
........
........
.......
9.10
9.10
500
0.00
0.01
0.002
0.003
400
10
Deu
tsch
e Ba
nk
8.93
0.00
0.00
0.00
0.00
44.700
800
0 0.38
........
........
........
.......
9.31
10.60
3.64
5.83
6.42
2.08
1 1
Banq
ue N
atlo
nde
de P
aris
5.57
2.49
18.81
68.000
500
1.20
0 3.24
........
......
8.81
10.28
1.16
5.4 1
4.74
1 . 80
2.05
30.95
42. 100
12
Banq
ue ln
dosu
ez
8.31
0.52
8.83
1 1.87
3.05
1.37
2.69
(.)0.27
(.)0.24
(.)5.21
1.19.800
400
........
........
........
... 90
0
13
Abu
Dha
bi C
omm
ercia
l Ban
k Lt
d ....
6.92
2.55
9.47
10.25
0.82
1.07
0.67
0.3 1
0.37
7.18
77. 400
200
600
~~53
00
14
Socl
ete
Cen
er.d
e 9.59
0.93
10.52
15.45
1.28
3.55
3.38
1.46
400
........
........
........
....
1.35
18.02
1.12.600
400
1.400
15
Oman in
tern
atio
nal Bank
........
........
1 1.75
0.61
12.36
13.87
1.55
4.55
4.25
2.01
2.27
25.23
64.700
200
1.200
16
Bank
of A
mer
ica
........
........
........
....
7.84
0.53
8.37
11.34
1.82
4.57
4.66
1.86
2.16
24.95
70.500
500
3.600
17
Bank
Int
erna
stona
l lnd
ones
ia ...
.......
26.1 7
0.00
26.17
1 1.75
1.25
5.27
2.18
1.17
2.20
11.34
74.400
MO
1.100
18
Ara
b B
angl
ades
h Ba
nk L
td ...
......
..... 122.00
0.00
122.00
4.25
1.47
2.91
0.59
0.49
0.69
1.14
7.900
200
300
19
The
Siam
Com
mer
cial
Ban
k ....
........
19.39
0.00
19.39
7.00
0.86
4.93
4.33
2.13
3.54
11.43
52. M
O
MO
L4Oo
20
Com
men
Bank
........
........
........
......
15.02
0.00
15.28
8.26
2.8 1
4.28
0.37
0.18
0.27
0.70
31. 200
1300
100
2 1
Hon
gkon
g Bank ...
........
........
........
.. 7.86
4.02
1 1.88
10.31
2.43
3.66
3.27
1.53
1.61
21.83
27. 200
200
400
22
San
wa
Bank
......
........
........
........
.....
24.02
0.00
24.02
12.41
(-)2.04
7.04
3.57
1.42
1.54
7.96
95. 532
240
1.199
........
.....
23
Stat
e Bank o
f Mau
ritiu
s Ltd
107.00
0.00
107.00
8.69
1.34
7.51
6.79
3.56
3.76
4.93
I, 717
390
2. 4m
24
The
Saku
ra Bank
Ltd .
........
........
.....
12.19
0.00
12.19
12.20
(-) 1.05
7.79
5.87
2.97
3.30
22.45
91. 600
300
3. 600
25
Am
eric
an E
xpre
ss Bank
Ltd .
........
... 9.63
0.77
10.40
13.75
4.62
4.27
5.07
1.60
1.46
1 I . 97
37.200
300
500
26
Standard Chartered B
ank
........
........
6.70
1 . 90
8.60
9.78
2.57
3.49
1.68
1.26
1.44
17.20
21. 8
00
400
300
........
........
........
.. 27
ABN AMRO B
ank
8.55
0.61
9.16
1 1.05
3.36
4.38
4.5
1 2.08
2.16
2.16
45. 300
400
9.700
........
........
........
........
.......
28
ING Bank
1 1.00
0.00
11.00
8.00
3.00
4.00
4.00
3.00
3.00
30.00
28. 837
923
2. 59
8 29
The
Brit
ish B
ank
of M
iddl
e Ea
st ....
.. 10.20
1.82
12.02
11.41
0.85
1.86
1.73
1.20
1.20
17.18
81. 700
300
800
30
The
Ban
k o
f Tok
yo-M
ihub
ishi. L
td . .
8.88
0.00 '
8.88
13.83
1.06
6.52
6.23
1.38
1.43
16.87
65. 100
300
700
........
........
........
.......
3 1
Bank o
f Cey
lon
48.98
0.00
48.98
7.65
5.70
5.82
8.57
3.18
4.65
8.49
24. 100
200
1.100
........
........
........
.....
32
UIO H
ung Bank
63.00
0.00
63.00
6.62
1.06
6.28
2.85
1.40
2.00
3.00
24. 0
00
700
800
........
........
........
......
33
Cre
dit L
yonn
ais
8.19
0.66
8.86
13.90
4.80
0.75
3.75
1.76
1.77
26.58
1.14.600
XX
) 1.600
34
Dev
elop
men
t Ban
k of
Sin
gapo
re L
td . 26.32
0.10
26.41
13.55
2.58
6.24
4.70
4.47
2.36
6.77
31. 4
00
490
780
........
... 35
C
hlna
hust
Com
mer
cial
Ban
k 84
.09
0.00
84.09
6.3 1
0.19
5.71
0.55
0.14
0.14
0.31
17. 6
00
800
61
... 36
Bank
of
Bahr
ain a
nd K
uwait
B.S
.C
15.66
0.26
16.66
11.08
1.27
1.67
1.45
0.63
0.007
0.07
47.400
100
200
37
The C
omm
erci
al B
ank
of K
orea
LM
. 885.56
0.00
885.56
1.11
0.00
1.1 1
0.53
0.45
0.89
0.90
300
20
270
i Ban
k Lt
d ......
........
........
....
67.25
0.00
67.25
3.69
0.21
3.46
(-)5.27
(-)5.34
(.)5.34
(.)7.86
7.
MO
(-)ZOO
1.55
....
........
........
........
....
1.86
10.06
1.00
7.38
3.32
3.66
48.21
8. 500
6. 600
700
ed in
App
endi
x Ta
bles
11.5
(8)
to 1
1.5 (H) wh
ich is
bas
ed o
n pu
blish
ed b
alanc
e

Report on Trend and Progress of lkmking In Indla. 1996-97 169
Appendix Table 11.5 (B) : nnanciai Ratios of Forelgn Banks In Indla - Performance Indicators - 1 99 1 -92 to 1 996-97
S r. Name of the Bank Gross ProfitlLoss as % to Total Assets No.
1. Citibank N.A. ................................. 4.78 3.10 3.60 4.83 4.35 4.25 2. ANZ Grindlays Bank ....................... 4.75 1.55 1.41 2.27 2.25 2.16 3. Hongkong Bank .............................. 3.97 4.29 3.57 4.26 4.25 3.27 4. StandardCharteredBank ................ 3.24 -7.70 2.99 0.87 2.53 1.68 5. American Express Bank .................. 8.00 4.45 5.46 4.9G 3.1 1 5.07 6. Bank of America N T G A ................ 7.77 6.73 5.45 4.64 3.46 4.66 7. Deutsche Bank AG ......................... 7.26 6.02 6.10 3.57 4.99 6.42 8. The Bank of Tokyo-Mitsubishi ......... 5.65 7.79 7.99 7.69 6.1 1 6.23 9. The British Bank of the
Middle East ................................... 2.71 3.32 2.39 3.94 2.33 1.73 10. Banque lndosuez ............................ 6.06 5.36 1.99 5.09 1.93 2.70 1 1. Credit Lyonnais .............................. 4.25 5.3 1 4.29 5.54 2.6 1 3.75 12. Societe Cenerale ............................. 4.49 6.58 3.95 3.72 1.44 3.38 13. ABN-AMRO Bank N.V. ................... 6.24 6.48 4.48 4.06 3.30 4.51 14. Banque Nationale De Paris ............. 5.18 5.48 9.73 7.45 3.94 4.74 15. MashreqBank psc ........................... 5.68 3.6 1 5.16 5.82 2.19 2.67 16. The Sakura Bank Ltd. ...................... 8.20 7.39 5.27 5.79 5.19 5.87 17. Abu DMi Commercial Bank Ltd. ...... 3.39 3.97 3.19 3.51 4.03 0.68 18. Bank of Bahrain and Kuwait BSC ...... 4.14 3.35 4.7 1 5.46 4.45 1.46 1 9. Oman International Bank SAOG ....... 5.74 4.1 7 5.77 4.93 4.47 4.25 20. The Bank of Nova Scotia ................. 3.63 4.63 5.7 1 3.29 2.58 4.80 21 . Barclays Bank PLC .......................... 5.56 5.45 7.59 3.91 5.39 1.71 22. The Sanwa Bank Ltd. ...................... 7.92 6.77 5.65 3.74 0.69 3.57 23. Dresdner Bank AG .......................... - - -4.64 -0.55
24. Sonali Bank ..................................... 7.14 11.1 1 3.85 7.41 12.45 7 -37 25. INGBank - - -8.98 - 1.06 4.08 ........................................ 26. The Development Bank of
Singapore ....................................... - - -0.53 1.42 4.68 27. State Bank of Mauritius Ltd. - - - -0.68 8.44 6.79 ........... 28. Chase Manhattan Bank - - - - 14.97 -8.M 0.79 ................... 29. Commerzbank AG - - - - -4.58 0.37 ......................... 30. Slam Commercial Bank - - - 0.m 4.33 ................... 3 1 Arab Bangladesh Bank - - - - 2.82 0.59 . .................... - - - 32 Chinatrust Commercial Bank - - 0.55 ...........
- - - - - 33. Fuji Bank Ltd. .................................. -5.28
34. Krung Thai Bank Public CO. Ltd. - - - - - 0.05 ..... - - - - - 35. Cho Hung Bank .............................. 2.85
36. Oversea - Chinese Banking - - - - - Corporation .................................... -6.16 - - - 3.74 8.59 - 37, Bank of Ceylon ............................... - - - - -7.46 2.18 38. Bank Internasional Indonesia .......... - - - - - 39. Commerdal Bank of Korea Ltd. 0.52 ......
39 Forelgn Banks in India (V) 5.06 1.86 3.79 3.93 3.35 3.58
100 Scheduled Commercial Banks (I to V) 2.08 1.03 1.25 1.64 1.69 1.82

170 Report on Trend and Prosres of Banking in Inclla. 19%-97
Appendlx Table 11.5 (C) : Financial Ratios of Foreign Banks in India . Performance Indicators . 1991 -92 to 1996-97
S r . Name of the Bank Net pront/Loss as % to Total Assets
No . 91 -92 92-93 93-94 94-95 95-96 96-97
1 2 3 4 5 6 7 8
................................. 1 . Citibank N.A. 2.1 1 1.22 1.12 2.09 2.02 0.57 ....................... 2 . ANZ Grindlays Bank 1.88 0.54 0.32 1.17 0.77 1.03
.............................. 3 . Hongkong Bank 1.64 1.94 1.69 1.1 1 1.74 1.53 4 . Standard Chartered Bank ................ -5.92 -24.19 1.96 0.34 2.43 0.77 5 . American Express Bank .................. 2.75 1.66 2.78 3.16 1.17 1. $0 6 . Bank of Arnerlca NTgSA ................ 7.39 3.77 2.30 1.95 3.10 4.27 7 . Deutsche Bank AG ........................ 2.74 0.03 2.09 0.75 1.15 2.08 8. The Bank of Tokyo-Mitsubishl ......... 1.55 2.03 3.15 3.62 2.21 1.38 9 . The British Bank of the
Middle East .................................... 1 . 16 1.70 1.48 2.35 1.42 1.20 10 . Banque lndosuez ............................ 2.99 2.51 0.69 2.08 1.20 -0.28 1 1 . Credit Lyonnais .............................. 2.1 7 2.19 1.51 2.16 1.04 1.76 12 . Societe Generale ............................. 1.52 2.41 1.32 1.30 0.56 1.4G 13 . ABN.AMR0BankN.V .................... 3.21 2.90 1.56 1.77 1.43 2.08 14 . Banque Nationale De Paris ............. 2.86 2.10 3.19 2.84 1.39 1.80 1 5 . MashreqBank psc ........................... 0.87 0.11 2.0 1 3.28 1.32 0.52 16 . The Sakura Bank Ltd ....................... 3.18 2.66 2.2 1 2.37 2.43 2.97 1 7 . Abu Dhabi Commerdnl Bank Ltd ....... 1 . 04 1.98 1 . . 59 1 . 05 0.31 18 . B h k of Bahrain and Kuwait BSC ...... 1.66 1.53 1 . . 03 1.60 0.64 1 9 . Oman International Bank SAOG ....... 1.49 0.72 0 . . 55 1.30 2.01 20 . The Bank of Nova Scotia ................. 0.82 1.25 1 . . 57 0.58 -0.77 21 . Barclays Bank PLC .......................... 2.50 1.63 2.37 0.98 2.02 0.18 22 . The Sanwa Bank Ltd, ...................... 2.61 2.41 2.09 1.31 0.16 1.42 23 . Dresdner Bank AG .......................... - - - - -4.64 -0.59 24 . Sonali Bank ..................................... 2.12 1 .GO 1.30 2.67 5.59 3.31 25 . ING Bank ........................................ - - - -9.00 -1.14 2.82
The Development Bank of Singapore .......................... - - - - 0.77 2.36
27 . State Bank of Mauritius Ltd ............ - - - -0.68 5.2 1 3.56 28 . Chase *Manhattan Bank ................... - - - -1 5.01 .8.10 0.48 29 . Commerzbank AC .......................... - - - - -4.60 0.18
Krung Thai Bank Public Co . Ltd ...... - - - - - 0.03
Corporation ....................... - - - - - -6.16
ional Indonesia .......... - - - - -7.46 1.17

Report on Trend and Progress of Banking in Indla, 1996-97
1. Citibank N.A. .................................. 9.72 12.77 9.80 10.14 10.17 1 1.27 2. AN2 Grindlays Bank ....................... 1 1.74 10.70 9.54 8.73 9.42 10.20 3. Hongkong Bank .............................. 10.17 1 1.63 968 9.21 1 0.20 10.31
4. Standard Chartered Bank ................ 13.1 I 8.34 10.02 9.10 ' 11.34 9.78 5. American Express Bank .................. 1 1 .08 12.03 10.66 10.04 12.10 13.75 6. Bank of America NTUA ................ 15.37 15.57 9.99 10.32 10.66 1 1.34 7. Deutsche Bank AG ......................... 1 1.86 13.74 1 1.61 9.88 11.31 10.60 8. The Bank of Tokyo-Mitsubishi ......... 12.44 1 1.96 1 3.04 1 1.68 12.17 13.83 9. The British Bank of the
Middle East .................................... 9.39 11.03 8.96 10.05 10.87 1 1.41 10. Banque lndosuez ........................... 18.18 12.36 6.31 9.40 7.22 1 1.87 1 1 . Credit Lyonnais .............................. 15.36 13.80 9.36 1 1.89 13.26 13.90 12. Societe Cenerale ............................. 1 1.02 13.69 8.39 1 1.47 11.54 15.45 13. ABN-AMRO Bank N.V. ................... 1 1 .61 13.54 8.77 9.89 9.50 1 1.05 14. Banque Nationale D e Paris ............. 14.94 12.75 17.02 16.55 1 1.34 1 0.28 15. MashreqBank psc ........................... 14.77 11.35 10.05 10.09 9.14 14.82 16. The Sakura Bank Ltd. ...................... 1 3.1 1 12.00 8.77 10.42 9.96 1 2.20 17. Abu Dhabi Commercial Bank Ltd. ...... 8.47 9.21 8.19 8.50 12.68 10.24 1 8. Bank of Bahrain and Kuwait BSC ...... 1 3.6 1 1 1.28 10.34 10.57 12.01 11.09 19. Oman International Bank SAOC ....... 13.40 13.31 1 1.85 12.21 12.30 13.87 20. The Bank of Nova Scotia ................. 12.44 13.97 12.22 1 1.34 13.13 11.91 2 1 . Barclays Bank PLC .......................... 29.1 7 19.65 19.94 15.76 20.1 3 12.58
...................... 22. The Sanwa Bank Ltd. 8.91 12.79 10.49 8.44 1 1.67 12.41 23. Dresdner Bank AG - - - - 4.27 .......................... 14.84
..................................... 24. Sonali Bank 7.14 11.11 3.85 7.41 8.86 1.86 25. INGBank - - - 2.47 3.97 8.33 ........................................ 26. The Development
Bank of Singapore - - - 13.55 ........................ 27. State Bank of Mauritius Ltd. - - - 8.69 ........... 28, Chase Manhattan Bank - - - 4.53 ................... 29. Commerzbank AG - - - 8.26 .......................... 30. Slam Commercial Bank - - - 7.00 ................... 31 Arab Bangladesh Bank - - - - 4.57 4.26 . .................... - - - - - 32. Chinamst Commerda Bank ........... 6.3 1
- - - - - 33. Fuji Bank Ltd. .... 3.69 .............................. 34. Krung Thal Bank Public Co. Ltd. - - - - - 1.53 ..... - - - - - 35. Cho Hung Bank 6.63 .............................. 36. Oversea - Chinese - - - - -
Banking Corporation 1.33 ....................... - - - 4.60 7.66 - 37. Bank of Ceylon ............................... - - - 0.10 1 1.75 - 38, Bank internaslonal Indonesia .......... - - - - - 39. CommercialBankofKareaL Ltd....... 1.10
39 toretllpr Banks ln India (V) 11.61 1 1.62 10.04 9.88 10.46 1 1.07
100 Scheduled CommcnW tkurluflbv) 10.27 9.7 1 8.70 8.63 9.36 9.88

Report on Trend and Progress of Baning In India. 1996-97
Sr . Name of the Bank No .
91-92 92-93 93-94 94-95 95-96 96-97
1 2 3 4 5 6 7 8
.................................. 1 . Citibank N.A. 6.46 7.69 5.40 5.43 6.26 6.85 ....................... 2 . ANZ Grindlays Bank 7.75 8.36 6.66 5.66 6.42 6.74
.............................. . 3 Hongkong Bank 6.15 8.03 5.89 5.0 1 5.79 6.65 ................ . 4 Standard Chartered Bank 9.69 9.20 7.92 6.65 5.81 6.29
.................. 5. American Express Bank 5.63 6.40 5.00 4.88 8.34 9.48 ................ 6 . Bank of America N T S A 1 2.93 9.13 5 . a 5.35 6.95 6.76
......................... . 7 Deutsche Bank AG 5.31 8.13 4.70 5.28 6.55 4.76 ......... . 8 The Bank of Tokyo-Mitsubishi 7.75 5.92 6.04 5.17 7.18 7.32
9 . The British Bank of the Middle East .................................... 6.37 7.01- 6.25 6.52 8.02 9.55
............................ . 10 Banque Indosuez 14.02 8.72 3.56 6.26 6.06 10.50 1 1 . Credit Lyonnais .............................. 9.48 7.79 4.27 5.62 11.50 13.15
............................. . 12 Societe Generale 6.53 8.20 3 . N 7.39 9.55 11.90 ................... . 13 ABN-AMRO Bank N.V. 6.67 8.18 4.2 1 6.18 7.18 6.67
............. . 14 Banque Nationale De Paris 8.23 6.2G 6.61 8.10 6.70 4.87 ........................... 15 . MashreqBank psc 9.09 6.98 4.75 5.19 5.17 8.42
16 . The Sakura Bank Ltd ....................... 5.74 4.95 3.69 4.66 4.25 4.41 ....... 1 7 . Abu Dhabi Commercial Bank Ltd 5.08 4.93 4.88 5.70 10.12 9.17 ...... 18 . Bank of Bahrain and Kuwait BSC 7.69 6.13 5.1 1 4.94 6.25 9.41 ....... 1 9 . Oman International Bank SAOG 7.66 8.36 5.65 6.31 7.76 9.31
................. 20 . The Bank of Nova Swtia 9.84 9.62 6.69 8.02 1 1.97 7.60 .......................... 2 1 . Barclays Bank PLC 22.22 13.93 12.87 10.93 15.97 10.34
22 . The Sanwa Bank Ltd ....................... 2.97 6.68 3.73 4.02 7.91 5.38 23 . Dresdner Bank AG .......................... - - - - 3.28 12.23 24 . Sonali Bank ..................................... Neg . Neg . Neg . Neg . 0.85 0.87 25 . ING Bank ........................................ - - - 0.33 4.30 4.43 26 . The Development
Bank of Singapore .......................... - - - Neg . 4.54 7.31 27 . State Bank of Mauritius Ltd ............ - - - 0.14 1.12 1.18 28 . Chase Manhattan Bank ................... - - - 0.73 0.12 0.32 29 . Comrnerrbank AG .......................... - - - - 0.24 3.98 30 . Siam Commercial Bank ................... - - - - 0.18 2.07 31 . Arab Bangladesh Bank .................... - - - - 0.00 1.34 32 . Chinatrust Comrnercfal Bank ........... - - - - - 0.60 33 . Fuji Bank Ltd ................................... - - - - - 0.24 34 . K ~ n g Thai Bank Public Co . Ltd ...... - - - - - - 35 . Cho Hung Bank .............................. - - - - - 0.34 36 . &em-Chinese
Ebnklng Corporation ....................... - - - - - 0.00 37 . EbnkofCeyfon ............................... - - - - 0.76 1.83 38 . Bank Internasim Indonesia .......... - - - - 0.00 6.48 39 . Cummefdaf Bank of Korea Led. ...... - - - - - - - 0.00 -
39 forclam Burlu In fndk (V) 7.70 8.06 Sb2 - 5. 63 6, 72 639 100 Scheduled Commercial
P~
W C I t o V ) 6.M 7.20 6*16 5.63 4.23 6.67

Report on Trend and Progress of Banking in India. 196-97
Table 11.5 (F) : Financial Ratios of Foreign p l n k in India . Performance Indicators . 199 1-92 to 1996-97
Sr . Name of the Bank Net Interest Income (Spread) as % to Total Assets No .
91 -92 92-93 93-94 94-95 95-96 96-97
1 2 3 4 5 6 7 8
5.08 . ................................. 1 Citibank N.A. 3.25 4.39 4.72 3.91 4.42 ....................... 2 . ANZ Grindlays Bank 4.00 2.34 2.87 3.07 3.00 3.46
3 . Hongkong Bank .............................. 4.02 3.61 3.79 4.20 4 . 3.66 4 . Standard Chartered Bank ................ 3.43 -0.86 2.10 2.45 5 . 3.49
.................. 5 . American Express Bank 5.45 5.63 5.66 5.16 3.76 4.27 6 . Bank of America NTgSA ................ 2.44 6.44 4.93 4.97 3.70 4.57 7 . Deutsche Bank AG ......................... 6.55 5.61 6.91 4.60 4.77 5.83 8 . The Bank of Tokyo-Mitsubishi ......... 4.68 6.04 7.00 6.5 1 4.99 6.52 9 . The British Bank of the
Middle East .................................... 3.03 3.39 2.71 3.53 2.84 1.86 10 . Banque lndosuez ............................ 4.1 7 3.64 2.75 3.14 1.17 1.37 1 1 . Credit Lyonnais .............................. 5.88 6.01 5.09 6.28 1.75 0.75 12 . Societe Generaie ............................. 4.49 5.50 4.48 4.08 1.98 3.55
................... 13 . ABN-AMRO Bank N.V. 4.95 5.36 4.56 3.7 1 2.32 4.38 14 . Banque Nationale De Paris ............. 6.71 6.49 10.41 8.45 4.64 5.41 15 . MashreqBank psc ........................... 5.68 4.37 5.30 4.90 3.97 6.40
....................... 16 . The Sakura Bank Ltd 7.38 7 . OG 5.08 5.76 5.71 7.79 ....... . 17 Abu Dhabi Commercial Bank Ltd 3.39 4.28 3.31 2.80 2.57 1.07 ...... . 18 Bank of Bahrain and Kuwait BSC 5.92 5.15 5.24 5.63 5.77 1.67 ....... . 19 Oman International Bank SAOC 5.74 4.95 6.20 5.90 4.54 4.55
................. . 20 The Bank of Nova Scotla 2.59 4.35 5.52 3.33 1.16 4.31 .......................... . 21 Bardays Bank PLC 6.94 5.72 7.08 4.83 4.16 2.24 ....................... 22 . The Sanwa Bank Ltd 5.94 6.1 1 6.75 4.41 3.76 7.03
23 . Drexlner Bank AG .......................... - - - - 0.99 2.61 ..................................... . 24 Sonall Bank 7.1 4 11.11 3.85 7.41 8.0 1 0.99
25 . INGBank ........................................ - - - 2.14 -0.33 3.90 26 . The Development
Bank of Singapore .......................... - - 1.63 2.57 6.24 27 . State Bank of Mauritius Ltd ............ - - - 1.79 9.86 7.51 U) . UMse Manhattan Bank ................... - - 1.82 6.08 4.22 29 Commtrrbdnk AG - - - - 1.63 4.28 .......................... . 30 S i m Cornmerclal Bank - - - - 3.55 4.93 ................... . 31 Arab Bangladesh Bank - - - - 4.57 2.92 .................... . 32 Chtnatrust Commercial Bank - - - - - 5.70 ........... . - - - - - 33 . Fuji Bank Ltd ..................... ........... 3.46 34 K ~ n g W & n k P u b l l c b . L t d - - - - - 1.53 ...... . - - - - - 35 . 00 Hung &urk ............ .................. 6.28 36 . Oversea - Chinese - - - - - &king Corporation ....................... 1.33 - - - - 37 . &k of Ceiylm ............................... 3.84 5.83 38 M k lnternarionitl Indon& - - - - 0.10 5.27 .......... .

Report on Trend and Progress of Banking in In&. 196-97
Appendix Table 11.5 (G) : Financial Ratios of Foreign Banks in India . Performance Indicators . 1991 -92 to 1996-97
S r . Name of the Bank Provisions as % to Total Assets
No . 91-92 92-93 93-94 94-95 95-96 96-97
1 2 3 4 5 6 7 8
.................................. . 1 Citibank N.A. 2.69 1.89 2.48 2.73 2.33 3.69 ....................... . 2 ANZ Grindiays Bank 2.87 1.01 1.09 1.10 1.48 1.13
.............................. . 3 Hongkong Rank 2.26 2.35 1.88 3.15 2.51 1.75 ................ . 4 Standard Chartered Bank 9.17 16.49 1.04 0.54 0.09 0.91
.................. . 5 American Express Bank 5.22 2.80 2.67 1.81 1 -94 3.47 ................ . 6 Bank of America NT8SA 0.38 2.94 3.16 2.68 0.36 0.39
......................... . 7 Deutsche Bank AG 4.42 5.99 4.0 1 2.82 3.84 4.34 ......... . 8 The Bank of Tokyo-Mitsubishi 4.04 5.76 4.84 4.07 3.90 4.85
9 . The British Bank of the Middle East .................................... 1.59 1.61 0.91 1.59 0.9 1 0.52
............................ . 10 Banque lndosuez 2.65 2.85 1.30 3.01 0.73 2.98 .............................. 1 1 . Credit Lyonnais 1.96 3.1 1 2.78 3.38 1.57 1.99 ............................. 12 . Societe Generale 3.27 4.16 2.62 2.42 0.88 1.92
13 . ABN-AMRO Bank N.V. ................... 3.23 3.59 2.92 2.29 1.88 2.44 ............. 14 . Banque Nationale De Paris 2.44 3.38 6.54 4.61 2.55 2.94
1 5 . MashreqBank psc ........................... 5.1 1 3.50 3.15 2.53 0.87 2.15 16 . The Sakura Bank Ltd ....................... 4.92 4.72 3.06 3.42 2.76 2.90
....... . 1 7 Abu Dhabi Commercial Bank Ltd 3.39 1.99 2.07 1.92 2.98 0.37 18 . Bank of Bahrain and Kuwait BSC ...... 2.37 1.82 3.12 3.43 2.85 0.82 1 9 . Oman International Bank SAOG ....... 4.3 1 3.4G 4.94 4.37 3.17 2.24 20 . me Bank of Nova Scotia ................. 2.59 3.38 4.28 2.71 2.00 5.56 21 . Bardays Bank PLC .......................... 2.78 3.83 5.22 2.93 3.37 1.53 22 . The Sanwa Bank Ltd ....................... 4.95 4.37 3.56 2.22 0.53 2.15 23 . Dresdner Bank AC .......................... - - 0.00 0.05 24 . Sonali Bank ..................................... 7.14 Neg . 3.85 3.70 6.85 4.05 25 . INC Bank ........................................ - - 0.02 0.07 1.26 26 . The Development
Bank of Singapore .......................... - - - Neg . 0.65 2.32 27 . State Bank of Mauritius Ltd ............ - - - Neg . 3.23 3.23 28 . Chase Manhattan Bank ................... - - - 0.04 0.05 0.32 29 . Commerzbank AC ........................... - - - - 0.02 0.19 30 . Slam Commerdal Bank ................... - - - - 0.38 2.19 31 . Arab Bangladesh Bank .................... - - - - 0.00 0.00 32 . Chinatrust Commercial Bank ........... - - - - - 0.41 33 . Fuji Bank Ltd ................................... - - - - - 0.06 34 . Krung Thdi Bank Public Go . Ltd ...... - - - - - 0.03 35 . Cho Hung Bank .............................. - - - - - f.44 36 . Oversed - Chinese
Banking Corporation ....................... - - - - - 0.00 37 . BankofCeylon ............................... - - - - 2.02 5.40 38 . Bdnk lnternasloskll lndonesla .......... - - - - 0.00 1.01 39 . Commercial Bank of Korea Ltd ....... - - - - - -. 0.08
39 roretgn &nks in bdlr M 3.50 - 4.74 228 t 2 7 1.77 ZI17 100 khcdaled CommercW llurkrfltoQ 1.71 2.1 t 2.10 1.22 1.54 1 , 14

Report on Trend and Progress of Banking in India. 199697
s of Foreign Banks In lndla .
91-92 92-93 93-94 94-95 95-96 96-97
1 2 3 4 5 6 7 8
.................................. 1 . Citibank N.A. 1.85 4.39 3.56 3.27 3.28 3.82 2 . ANZ Grindlays Bank ....................... 2.67 2.23 2.5 1 2.82 2.74 3.25 3 . Hongkong Bank .............................. 2.56 2.74 2.90 2.97 2.72 2.81 4 . Standard Chartered Bank ................ 2.31 I . 64 3.17 4.24 5.1 5 4.38 5 . American Express Bank .................. 3.44 3.69 2.45 2.75 3.09 3.82 6 . Bank of America N T U A ................ 1.96 3.03 3.01 ' 2.35 2.25 1.73 7 . Deutxhe Bank AC ......................... 3.19 2.42 3.13 8 . The Bank of Tokyo-Mitsubishi ......... 1.29 1.23 1.22 9 . The British Bank of the
Middle East .................................... 0.96 0.59 0.88 10 . Banque lndosuez ............................ 1.89 2.22 1.31 0.99 1.73 1 1 . Credit Lyonnais ............................ 1.31 1.23 1.43 1.40 1.80 12 . SocieteCenerale ............................. 1.22 1.28 0.80 0.92 1.07 1.45 13 . ABN-AMRO Bank N.V. ................... 1.94 2.81 1.97 2.04 1.92 3.23 14 . Banque Nationale De Paris ............. 4.57 3.37 2.64 2.66 2.27 1.83 15 . MashreqBank p x ........................... 1.70 1.52 1.14 1.03 1.07 2.85 16 . The Sakura Bank Ltd ....................... 1.64 0.97 0.64 0.59 0.54 0.87 1 7 . Abu Dhabi Cornmerdal Bank Ltd ....... 1.69 0.88 0.85 0.91 1.18 1.22 18 . Bank of Bahrain and Kuwait BSC ...... 1.78 1.42 1.32 1.61 1.62 1.49 19 . Oman International Bank SAOG ....... 1.91 1.97 2.30 2.11 2.22 1.85
................. . 20 The Bank of Nova Scotia 1.04 1.04 1.31 2.06 1.59 1.64 . .......................... 2 1 Barclays Bank PLC 2.78 1.89 1.61 2.57 3.43 3.72 . ....................... 22 The Sanwa Bank Ltd 1 -98 1.70 1.48 1.20 1.35 1.42
23 . Dresdner Bank AG .......................... - - - 5.50 5.24 ..................................... . 24 Sonali Bank 7.14 11.1 1 3.85 3.70 3.93 3.65
25 . ING Bank ...........................:............ - - - 1.47 2.15 2.68 26 . The Development
Bank of Singapore ........................ - - - 2.16 2.36 4.12 ............ 27 . State Bank of Mauritius Ltd - - - 2.71 2.57 2.06
................... 2 8 . Chase Manhattan h k - - - 16.28 21.55 8.38 29. Commenbank AG .......................... - - - - 6.77 6.72 30 . Slam Commercial Bank ................... - - - - 3.07 1.46 31 . Arab bgladesh Bank .................... - - - - 1.75 3.80 32 Chlmtrust Commerdnl W k ........... - - - - . - 5.34
- - - - - 33 . Fuji&>nkLtd ............................... .... 8.94 ...... . 34 . Knrng ihdl Bank Publlc Co Ltd - - - - - 2.16
- - - - - 35 . Hung Bank ........................ ...... 4.49 36 . Ovcsea -Chinese - - - - - &king Corporation ....................... 7.54 - - - - 37 . Bank of Ceylon ............................... 3.39 2.94 38. Bank tnterwiona) 1 ndone~ia - - - - 7.56 4.34 .......... 39. Cornmttcfal Bank of Korea Ltd - - - - - 0.58 .......
39 tmtgn Wks tn fndk 09 2.26 2.70 2.66 2.73 2.77 3. 0 1

176 Rcport on Trend and Progress of Sanklng In Indla. 1996-97
Appendix Table 11.6 r Bank Group-wise/Population Group-wise ~istribution of ornmercinl Bank Branches In Indla
No. of Branches as on
Bank Group No. of As on June 30, 1996 @ As on June 30, 1997 @
Banks#
Rural Seml- Urban Metropo- Total Rural Seml- Urban Metropo- Total urban lltan urban litan
State Bank of India 1 4,145 2,403 1.333 926 8.807 4,130 2,405 1,337 931 8,803 (47.1) (27.3) (15.1) (10.5) (100.0) (46.9) (27.3) (1 5.2) (10.6) (100.0)
Assaclate BNlk of SBI 7 1,375 1,455 682 583 4,095 1,386 1,485 716 605 4,192 (33.6) (35.5) (16.7) (14.2) (100.0) (33.1) (35.4) (1 7.1) (14.4) (100.0)
Natlonallsed Banks 19 13,897 6,451 5,839 5,050 31,237 13,902 6,491 5,915 5,090 31,398 (44.5) (20.7) (18.7) (16.2) (100.0) (44.3) (20.7) (18.8) (16.2) (100.0)
Indian Prlvate Bank 35 1,138 1,523 974 692 4,327 1,137 1,549 1,022 765 4,473 (26.3) (35.2) (22.5) (16.0) (100.0) (25.4) (34.6) (22.8) (17.1) (100.0)
Forelgn Banks In India 41 0 3 15 148 1 66 0 3 17 159 1 79 (-1 (1.8) (9.0) (89.2) (100.0) (-1 (I .7) (9.5) (88.8) (100.0)
Non-Scheduled Banks 3 3 2 2 1 8 3 2 2 2 9 (37.5) (25.0) (25.0) (12.5) (1 00.0) (33.3) (22.2) (22.2) (22.2) (1 00.0)
Regional Rural Banks 196 12,442 1,749 271 3 14,465 12,423 1,759 274 3 14,459 (86.0) (12.1) (1.9) ( ) (100.0) (85.9) (12.2) (1.9) . (I 00.0)
Total 302 33,000 13,586 951 16 7,403 63,105 32,981 13,694 9,283 7,555 63,513 (52.3) (21.5) 114.4) (1 1.7) (100.0) (51.9) (21.6) (14.6) (1 1.9) (100.0)
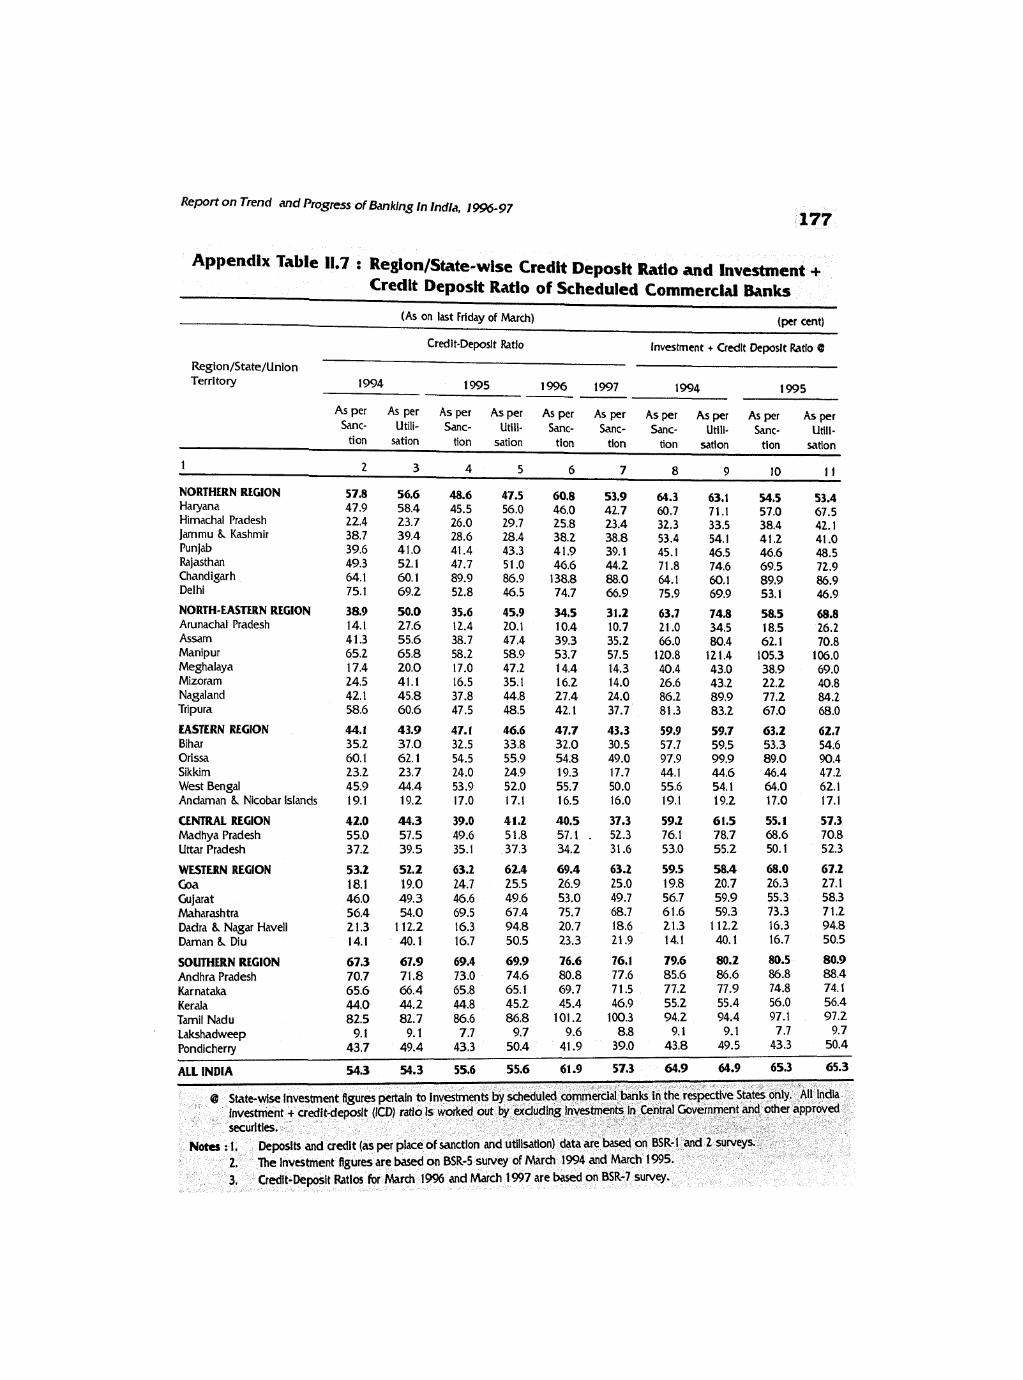
Report on Trend and Progress of Sanklng In India, 1996-97
Appendix Table 11.7 : Region/State-wise Credit Deposlt Ratlo and Investment + Credit Deposit Ratio of Scheduled CommercM Banks
(As on last Friday of March) (per cent)
Credit-Deposit Ratio Investment t Credlt Deposlt Ratio 4D
Region/State/Union Territory 1994 1995 1996 1997 1994 1995 --
As per As per As per As per As per As per As per As per As per As per Sane- Utili- Sanc- Utili- Sanc- Sane- ~anc- utili- Sane- ~ ~ 1 1 .
tion sation tion sation tion tion tion satlon tion sation
1 2 3 4 5 6 7 8 9 10 1 1
NORTHERN REGION 57.8 56.6 48.6 47.5 60.8 53.9 64.3 63.1 54.5 Haryana
53.4 47.9 58.4 45.5 56.0 46.0 42.7 60.7 71.1 57.0 67.5
Himachal Pradesh 22.4 23.7 26.0 29.7 25.8 23.4 32.3 33.5 38.4 42.1 Jammu &. Kashmir 38.7 39.4 28.6 28.4 38.2 38.8 53.4 54.1 41.2 41 .O Punjab 39.6 41.0 41.4 43.3 41.9 39.1 45.1 46.5 46.6 48.5 Rajasthan 49.3 52.1 47.7 51.0 46.6 44.2 71.8 74.6 69.5 72.9 Chandigarh 64.1 60.1 89.9 86.9 138.8 88.0 64.1 60.1 89.9 86.9 Delhi 75.1 69.2 52.8 46.5 74.7 66.9 75.9 69.9 53.1 46.9 NORTH-EASTERN REGION 38.9 50.0 35.6 45.9 34.5 31.2 63.7 74.8 58.5 68.8 Arunachal Pradesh 14.1 27.6 12.4 20.1 10.4 10.7 21.0 34,5 18.5 26.2 Assam 41.3 55.6 38.7 47.4 39.3 35.2 66.0 80.4 62.1 70.8 Manipur 65.2 65.8 58.2 58.9 53.7 57.5 120.8 121.4 105.3 106.0 Meghaiaya 17.4 20.0 17.0 47.2 14.4 14.3 40.4 43.0 38.9 69.0 Mizoram 24.5 41.1 16.5 35.1 16.2 14.0 26.6 43.2 22.2 40.8 Nagaland 42.1 45.8 37.8 44.8 27.4 24.0 86.2 89.9 77.2 84.2 Tripura 58.6 60.6 47.5 48.5 42.1 37.7 81.3 83.2 67.0 68.0
EASTERN REGION 44.1 43.9 47.1 46.6 47.7 43.3 59.9 59.7 63.2 62.7 Bihar 35.2 37.0 32.5 33.8 32.0 30.5 57.7 59.5 53.3 54.6 Orissa 60.1 62.1 54.5 55.9 54.8 49.0 97.9 99.9 89.0 90.4 Sikkim 23.2 23.7 24.0 24.9 19.3 17.7 44.1 44.6 46.4 47.2 West Bengal 45.9 44.4 53.9 52.0 55.7 50.0 55.6 54.1 64.0 62.1 Andaman &. Nicobar Islands 1 9.1 19.2 17.0 17.1 16.5 16.0 19.1 19.2 17.0 17.1
CENTRAL REGION 42.0 44.3 39.0 41.2 40.5 37.3 59.2 61.5 55.1 57.3 Madhya Pradesh 55.0 57.5 49.6 51.8 57.1. 52.3 76.1 78.7 68.6 70.8 Uttar Pradesh 37.2 39.5 35.1 37.3 34.2 31.6 53.0 55.2 50.1 52.3
WESTERN REGION 53.2 52.2 63.2 62.4 69.4 63.2 59.5 58.4 68.0 67.2 Goa 18.1 19.0 24.7 25.5 26.9 25.0 19.8 20.7 26.3 27.1 Gujarat 46.0 49.3 46.6 49.6 53.0 49.7 56.7 59.9 55.3 58.3 Maharashtra 56.4 54.0 69.5 67.4 75.7 68.7 61.6 59.3 73.3 71.2 Dadra & Nagar Haveli 21.3 112.2 16.3 94.8 20.7 18.6 21.3 112.2 16.3 94.8 Daman &. Diu 14.1 40.1 16.7 50.5 23.3 21.9 14.1 40.1 16.7 50.5
SOUTHERN REGION 67.3 67.9 69.4 69.9 76.6 76.1 79.6 80.2 80.5 80.9 Andhra Pradesh 70.7 71.8 73.0 74.6 80.8 77.6 85.6 86.6 86.8 88.4 Kar nataka 65.6 66.4 65.8 65.1 69.7 71.5 77.2 77.9 74.8 74.1 Kerala 44.0 44.2 44.8 45.2 45.4 46.9 55.2 55.4 56.0 56.4 Tamil Nadu 82.5 82.7 S.6 86.8 101.2 100.3 94.2 94.4 97.1 97.2 Lakshadweep 9.1 9.1 7.7 9.7 9.6 8.8 9.1 9.1 7.7 9.7 Pondicherry 43.7 49.4 43.3 50.4 41.9 39.0 43.8 49.5 43.3 50.4
ALL INDIA 54.3 54.3 55.6 55.6 61.9 573 64.9 64.9 65.3 65.3
@ State-wise Investment figures pertain to investments by scheduled commercial banks in the respective States only. All India investment + uedlt-deposit (ICD) ratio is worked out by excluding investments in Central Government and other approved securities.
Noto : 1. Deposits and credit (as per place of sanction and utllisatlon) data are based on BSR-1 and 2 surveys. 2. l he Investment flgures are based on BSR-5 survey of March 1994 and March 1995.
3. Credit-Deposit Ratios for March 1996 and March 1997 are based on BSR-7 survey.

Report on Trend and Progress of Banking in India, 1996-97
Appendlx Table 11.8 : Region/State/Union Territory-wise Distribution of Commercial Bank Branches
Sr. Region/State/ Number of Branchces Number of branches opened during Average population No. Union Territory as on June 30 (in '000) per bank
branch as a t the end of
1969 1996 7 july 95 of which: july 96 of which: June june june to at un- to at un- 1969 1996 1997
June 96 banked June 97 banked centres centres
1 2 3 4 5 6 7 8 9 10 1 1 12
1. NORTHERN REGION Haryana Himachal Pradesh Jammu R Kashmir Punjab hjasthan Chandigarh Delhi
2. NORTH-EASTERN REGION Arunachal Pradesh Assam Manipur Meghalaya Miwram Nagaland Tripura
3. EASTERN REGION Bihar Orissa Sikkirn West Bengal Andarnan L3. Nicobar Islands
4. CENTRALREGION Madhya hadesh Uttar Pradesh
5. WlESTERNRECION h+ Gujarat Maharashtra Dadra & Naga Havell Darnan &. Diu
6. SOUTHERN REGION Andhra Pradesh Karnataka Kerala Tamil Nadu Lakshadweep Pondicheny
A U Ih'DfA
+ Inclucks 'Darnan and Diu' for 1969 dau QP hduding tht bran&& of norr-ldwdukd h k s .
NOhCIr1. A ~ 7 a g e ~ ~ p e r b a n k b r ~ f o r ~ 1 9 6 9 b b d j e d o n 1 9 6 9 m ( d - ~ p o p r ~ S h n i v & t i l f o t j v n c l ~ u d ~ 1997 iue bared on estlrnared mu-year popuhtkn of rclpetttvc yean received torn &@strat Ckmri & G!nsus Cwuniubner. CrrM.dlnctk
2. Bank brandrr, atdude adrnlnlstraWe d M .

Report on Trend and Progress of Banking in India, 196-97
Total Rate of
1995 1996
March
April
May
June
July
Aug
Sept
Oct
Nov
Dec
Feb
Mar
A P ~
m y
Eqw
luty
A%!
Jm
Feb
March
April
May
June
July
A'Jg
Sept
oct
Nov
Dec

180 Report on Trend and Progress o f Banking in India, 1996-97
Appendix Table 11.10 : Commercial Paper * (Amounts in Rs. crore)
Fortnight Total Rate of Fortnight Total Rate of Ended Outstanding Discount Ended Outstanding Discount
(Per cent)@ (Per cent)@
1996 1997
March 31 76.3 20.2 Jan 15 536.5 1 1.1 - 12.8 April 15 71.3 - 3 1 407.5 1 1.3 - 12.8
30 72.8 18.1 - 20.3 Feb 15 432.5 10.0 - 14.1
May 15 99.3 16.5 - 18.9 28 531.5 11.3 - 12.5
3 1 221 .O 16.1 - 18.6 March 15 585.5 1 1.5 - 12.3
June 15 221 .O 15.8 - 16.3 3 1 646.0 11.3-12.5
30 236.0 16.2 - 20.9 April 15 702.0 1 1.3 - 12.5
3 1 2 18.0 12.6 - 19.0 May 15 977.0 7.7 - 12.3
Aug 15 265.5 12.9 - 15.0 3 1 1,049.5 8.5 - 11.1
Sep 15 349.5 12.8 - 14.1 30 1,515.0 8.2 - 11.5
30 371.5 13.0 - 14.8 July 15 1,923.3 8.0 - 12.5
Oct 15 31 3.0 12.4 - 13.5 3 1 2,084.8 7.3 - 12.0
3 1 232.5 13.0 - 13.8 Aug 15 2,305.3 7.8 - 14.2
NOV 15 367.5 1 1.6 - 14.0 3 1 2,783.0 7.3 - 12.8 30 422.5 11.5 - f3.0 Sept 15 3,158.5 8.3 - 9.5
Dec 15 51 7.5 11.5 - 13.5 30 3.41 2.5 8.5 - 10.5
3 1 3.41 3.0 7.4 - 12.0 " Issued at face value by companies. @ Typical effective discount rate range per annum on issues during the fortnight. - No issue durfng the fortnight.
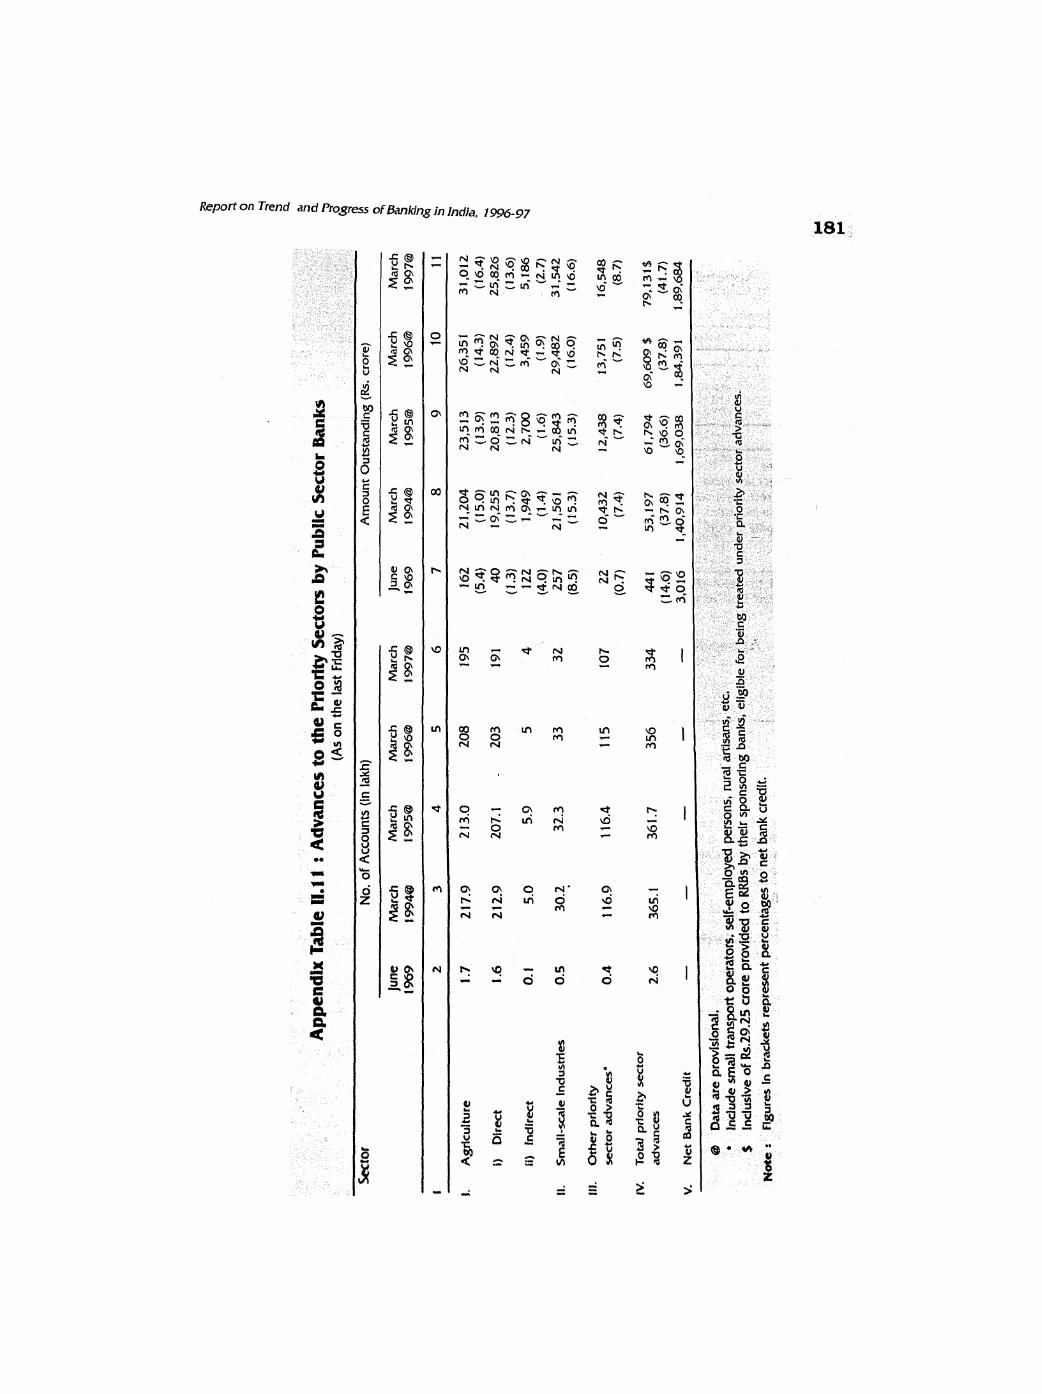
ppcn
dlx Table
11.1
1 : A
dvan
ces
to th
e P
rior
ity S
ecto
rs b
y P
ublic
Sec
tor Banks
As on
the
last
Frld
jum
M
arch
M
arch
M
arch
Ju
ne
Mar
ch
Mar
ch
Mar
ch
Mar
ch
Mar
ch
1 969
199W
1995@
1996@
1997@
1969
1 99-
1995@
1 9
96@
1W
7@
I.
Agr
icul
ture
1.
7 2
17.9
2
13.0
i)
Dir
ect
1.6
21 2
.9
207.
1 -
if)
fndi
rect
0.
1 5.
0 5.
5)
It.
Sm
all
-xale
Indu
stri
es
0.5
30
.2
32.3
Ifl.
Oth
er p
riorit
y se
cto
r ad
van
ces*
0.
4 1 1
6.9
1 16.
4
N.
To
tal
pri
ori
ty s
ecto
r advances
2.6
365.
1 36
1.7
356
334
44 1
53,1
97
61,7
94
69,6
09$
79,1
31$
(14.
6)
(37.8
) (3
6.6
) (3
7.8
) (4
1.7
) 6
1 40 9
14
1,6
9,0
38
l,W
,391
1.8
9.6
84
@
Dat
a are
prov
isi
Incl
ude
smal
l t
No
tt:
ng
ure
s in
b

&port on Trend and Progress of Banking In India, 1996-97
Appendix Table 11.12 r Actvances to the hlority Sectors by Indlan Mate Sector h k s (Old) (As on the last Friday)
(Amounts in Rs. crore)
March 1995 March 1996 March 1997 @
Sector Amount Percentage Amount Percentage Amount Percentage to Net bank to Net bank to Net bank
credit credit credit
1 2 3 4 5 6 7
I. Agriculture 816 6.0 1,130 8.0 1,465 10.2 I) Direct advances 722 5.3 91 2 G.5 1,130 7.9 11) Indirect advances 94 0.7 2 18 1.5 335 2.3
11. Small-xaie Industries 2,150 15.8 2,574 18.3 3,009 21.1 Ill. Other priority sectors 1.098 8.1 1,356 9.6 1,600 11.2
Total (ltlltllt) 4,OGQ 30.0 5,060 35.9 6,074 42.5
@ Data for 4 private sector banks vlz., Barl Doab Bank, Punjab Co-op. Bank, Jam Dhanalakshrnl Bank relate t o September 1996.
Indian Private S
March 1996 March 1997
Sector Amount Percentage Amount Percentage to Net bank
credit to Net bank
credit
I. Agriculture 11. Small-scale industries Ill. Other priority sectors
Total (]+I1 +Ill) 1,223 27.8 2,623 38.3
March 1996 March 1997
Sector Amount Percentage Amount Percentage to Net bank t o Net bank
credit credit 1 2 3 4 5
I. Export Credit 4,112 29.0 4,474 27.0 11. Small-xnle Industries 1,519 11.0 1,826 11.1
Total Priority Scdor Advances 5,417 39.0 6,129 37.1

Repod on Trend and Progress of atnkirlg In Indla, 19%-97
Appendlx Table Ill. 1: Progress of Co-operathe Credtt Movement in India
(Amounts In Rs.crorc)
Type of Institution Item 1993-94 1994-95 1995-961 1 2 3 4 5 State Co-operative Number Banks (SCBs)
28 Owned Funds
28 1,721
L8
Deposits 1.949 2.458
11.697 11.813 Borrowing from RBI / NABARD
13,428 4.673 5.705
Working Capital 7.907
18,129 21.232 Loans Issued
25.619 20.509
Loans Outstanding 22,062 27,038
10,887 13.212 16.594 Loans Overdue 808 1,140 1.132 Oh of overdues to: (i) Loans Outstanding 7.4 8.6 6.8 (ii) Demand 1 1 10 10
Central Co-operathe Number 36 1 h n k s (CCBs)
362 Owned Funds
363 2,699 3,300 3.610
Deposits 18.129 20.827 24,397 Borrowing from RBI / NABARD 7,242 8.781 10,041 Working Capital 29.364 34.696 41.589 Loans Issued 17,946 23.987 25,791 Loans Outstanding 17.39 1 20,679 24.39 1 Loans Overdue 4,550 5.099 4.835 % of overdues to: (i) Loans Outstanding 26.2 24.7 19.8 (ii) Demand 33 30 3 1
State/Central Land Number 20 20 1W Development Banks Owned Funds 906 1,110 1.038 (SLDBs) Deposits I 1 5 119 130
Borrowings 6.448 7,267 7.156 Working Capital 7,099 8,018 9.072 Loans Issued 1,398 1,604 1,744 Loans Outstanding 6,150 7.002 6.880 Loans Overdue 846 84 1 912 % of overdues to: ( i ) Loans Outstanding 13.8 12.0 13.3 (ii) Demand 53 56 46
Primary Agricultural Number ('000) 91 9 1 93 Credit Societies (PACSs) Membership ('000) 94,200 94,200 96,600
Owned Funds 2,543 2,806 2.91 2 Deposits 2,979 2,928 3,604 Borrowings 9,641 10.822 11,171 Working Capital 14,089 15,809 21,291 Loans Issued 9,479 9.987 1 1,023 Loans Outstanding 12.122 13,213 14,246 Loans Overdue 3,160 3,635 4,455 010 of overdues to: (i) Lonns Outstanding 26.1 27.5 31.3 (ii) Demand 42 41 33
Number 732 732 733 Membership ('000) 7.299 5.353 . 5,864 Owned Funds 295 456 527 Deposits 13 26 27 Borrowings 2.942 3,533 4,141 Working Capital 3.552 4.188 4,810 Loans Issued 718 949 1,165 Loans Outstanding 2.873 3.382 4,049 Loans Overdue 460 430 558 % of overdues to: (1) Loans Outstanding 16.0 12.7 13.8 (ii) Demand 43 38 39
PHmary Land Development Banks (PLDBs)
Primary (Urban) Co- Number 1.400 1.43 1 1,501 operative Banks (PCBs) Owned Funds 2,723 3.31 2 3,848
Deposits 16,769 20.101 24,165 496 577 758

Appendlx Table IV.I(A) 8 Fhaiu~ckI A s & of Banks and flnrnclal institutions (Rs. crore)
InstltuHoru 1981 1990 1991 1992 1993 1994 1995 1996 P 1997 p
2. Non-Scheduled Comn~erci~~l Banks" * 9 60 77 86 91 93 65 2 2
3. State Co-opentlve bank' 2,356 9,076 10,0% 11,927 13,383 15,011 17,683 19,502 22,786
4. All-India term-lending Institutions# 6,143 44,942 52,054 65,185 73,650 80,995 91,750 1,06,302 1,31,149
5. State Level Instltuions @ 1,733 7,893 10,048 11,523 12,576 13,229 14,178 15,712 19,204
6. investment Institutions $ 8,534 47,694 58,566 78,699 92,146 1,15,762 1,37,057 1,49,674 1,64,871
7. Other lnstitutlons $# 240 1,650 1,987 2,354 2,899 3,833 5,127 6,176 7,728
Ill. Aggregate ( I t 11) 63,637 3,07,692 3,55,441 4,29,676 4,94,254 5,87,330 7,03,952 7,86,516 8,87,741 (1 5.5) (20.9) (1 5.0) (18.8) ( I 9.9) (1 1 7 (12.9)
IV. Percentage Share
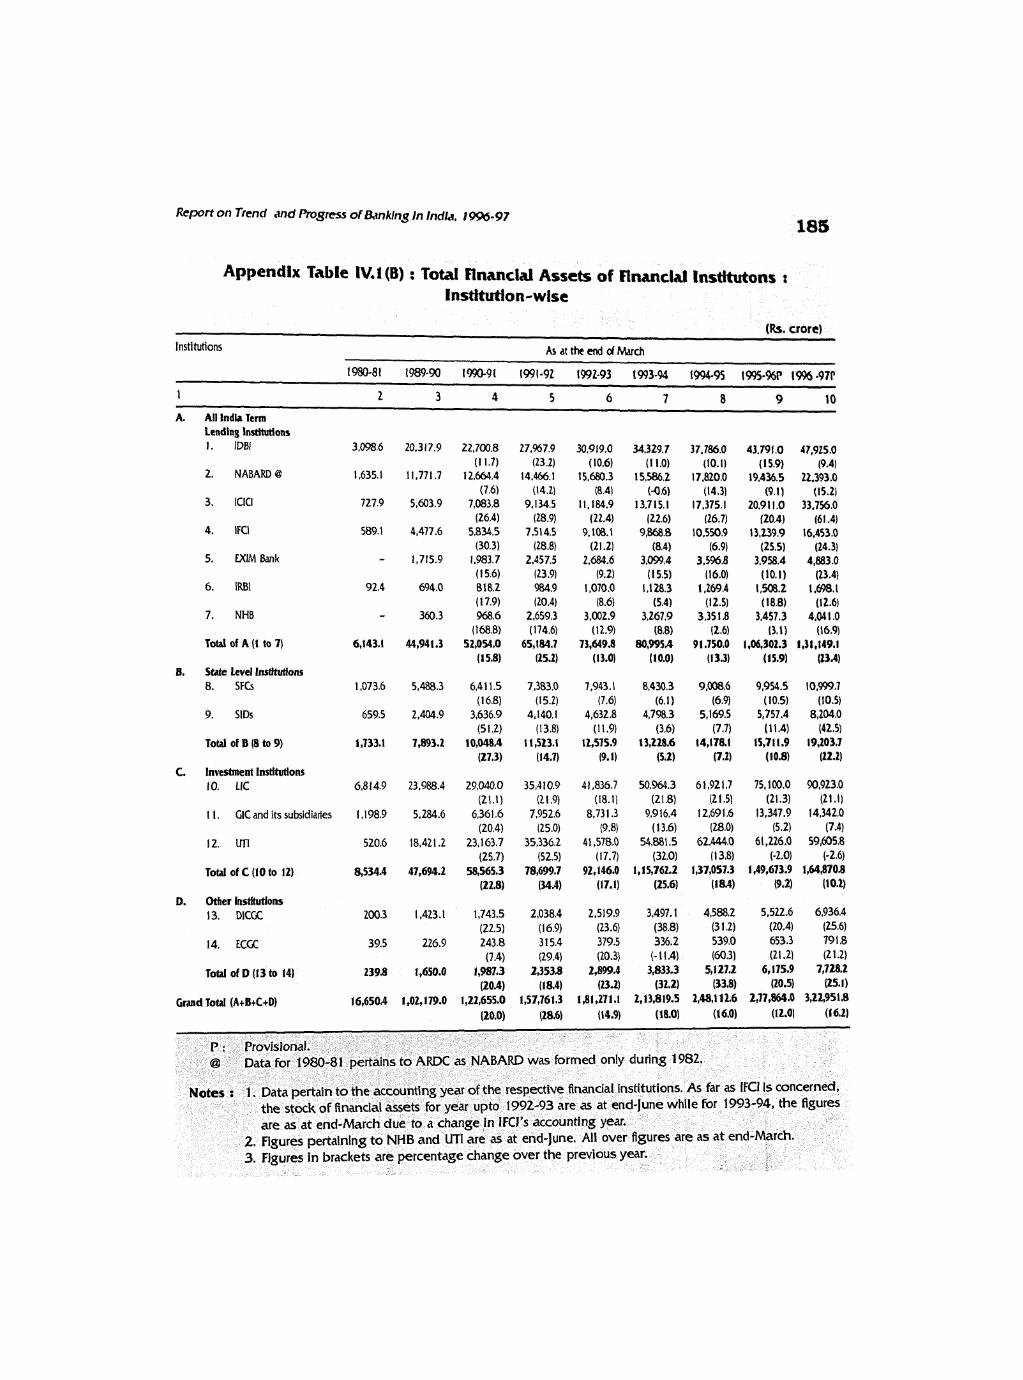
Report on Trend and Regress ofBanklng in India. 1996-97 18s
Appendix Table 1V.1 (B) : Total Flnanctal Assets of nnandd [nsttmns t Instfhrtton-wlse
(k. fforc) Institutions AsatttnenddMarch
1980-81 1989-90 1990-91 1991-92 1592-93 1993-94 1994-95 1995-9619 1%-97P
1 2 3 4 5 6 7 8 9 10 A. Ail lndh Term
Lending lnstitutlons 1. lDBl 3,098.6 20,317.9 22,700.8 27,967.9 30.919.0 34,329.7 37.786.0 43.791.0 47,925.0
(1 1.7) (23.2) (10.6) (1 1.0) (10.1) (15.9) (9.4) 2. NABARD @ 1,635.1 11,771.7 12,664.4 14.466.1 15.680.3 15.586.2 17.820.0 19.436.5 U.393.0
(7.6) (14.2) (8.4) (-0.6) (14.3) (9.1) (15.2) 3. lClCl 727.9 5.603.9 7,083.8 9.134.5 11,180.9 13.715.1 17.375.1 20,911.0 33,726.0
(26.4) (28.9) (22.4) (22.6) (26.7) (20.4) (61.4) 4. lFCl 589.1 4,477.6 5,834.5 7,514.5 9.108.1 9.868.8 10,5509 13,239.9 16,453.0
(30.3) (28.81 (21.2) (8.4) (6.9) (25.5) (24.3) 5. EXIM Bank - 1,715.9 1,983.7 2,457.5 2.684.6 3,099.4 3,596.8 3,958.4 4,883.0
(1 5.6) (23.9) (9.21 (1 5.5) (16.0) (10.1) (23.4) 6. IRBl 92.4 694.0 818.2 984.9 1,070.0 1,128.3 1,269.4 I,U)8.2 1,698.1
(1 7.9) (20.4) (8.6) (5.4) (12.5) (18.8) (12.6) 7. NHB - 360.3 968.6 2,659.3 3,002.9 3,267.9 3,351.8 3,457.3 4,041.0
(168.8) (174.6) (12.9) (8.8) (2.6) l3.l) (16.9) Total of A (1 to 7) 6,143.1 44,941.3 52,054.0 65,184.7 73,649.8 80,995.4 91.750.0 1,06,302.3 1,31,149.1
(1 5.8) (25.2) (13.0) (1 0.0) (13.3) (15.9) (23.4) B. State Level lnstftutlons
8. SFCs 1,073.6 5,488.3 6,411.5 7,383.0 7,943.1 8,430.3 9,008.6 9,954.5 10,999.7 (1 6.8) (15.2) (7.6) (6.1) (6.9) (10.5) (10.5)
9. SlDs 659.5 2,404.9 3,636.9 4,140.1 4,632.8 4,798.3 5,169.5 5,757.4 8,204.0 (5 1.2) (13.8) (1 1.9) (3.6) (7.7) (1 1.4) (42.5)
Total of B (8 to 9) 1,733.1 7,893.2 10,048A 11,523.1 12,575.9 13,228.6 14,1711 15,711.9 19,203,7 (27.3) (14.7) (9.1) (5.2) (7.2) (10.8) (22.2)
C. Investment InstfMlons 10. LIC 6,814.9 23,988.4 29,040.0 35,410.9 41,836.7 50,964.3 61,921.7 75,100.0 90,923.0
(21.1) (21.9) (18.11 (21.8) (21.5) (21.3) (21.1) 11. GICanditssubsidiaries 1,198.9 5,284.6 6,361.6 7,952.6 8,731.3 9,916.4 12,691.6 13,247.9 14,342.0
(20.4) (25.0) (9.8) (13.6) (28.0) (5.2) (7.4) 12. UTI 520.6 18,421.2 23,163.7 35,336.2 41,578.0 54,881.5 62,444.0 61,226.0 59,605.8
(25.7) (52.5) (17.7) (32.0) (1 3.8) (-2.0) (-2.6)
Total of C (10 to 12) 8,5344 47,694.2 58,565.3 78,699.7 92,146.0 1,15,762.2 197,057.3 1 49,673.9 1,@J708 (22.8) (34 A) (17.1) (25.6) (l8A) (9.2) (10.2)
D. Other lnstltutfons 13. DlCGC 200.3 1,423.1 1,743.5 2,038.4 2,519.9 3,497.1 4,588.2 5,522.6 6,936.4
(22.5) (16.9) (23.6) (38.8) (3 1.2) (20.4) (25.6) 14. ECGC 39.5 226.9 243.8 3 15.4 379.5 336.2 539.0 653.3 791.8
(7.4) (29.4) (20.3) -1 .4) (60.3) (21.2) (21.2)
Total of D (1 3 to 14) 2398 1,650.0 1,987.3 2,353.8 2,8994 3,833.3 5,1273 6,175.9 7,728.2 (20.4) (18.4) (23.2) (32.2) (33.8) (20.5) (25.1 )
Grand Total (AtBtCtD) 16,6504 1,02,179.0 1,22,655.0 1,57,7613 1,81,271.1 2,13,819.5 2,48,112.6 2~7,864.0 3,22,951+8 (20.0) (28.6) (14.9) (18.0) (16.0) (12.01 (1 6.2)
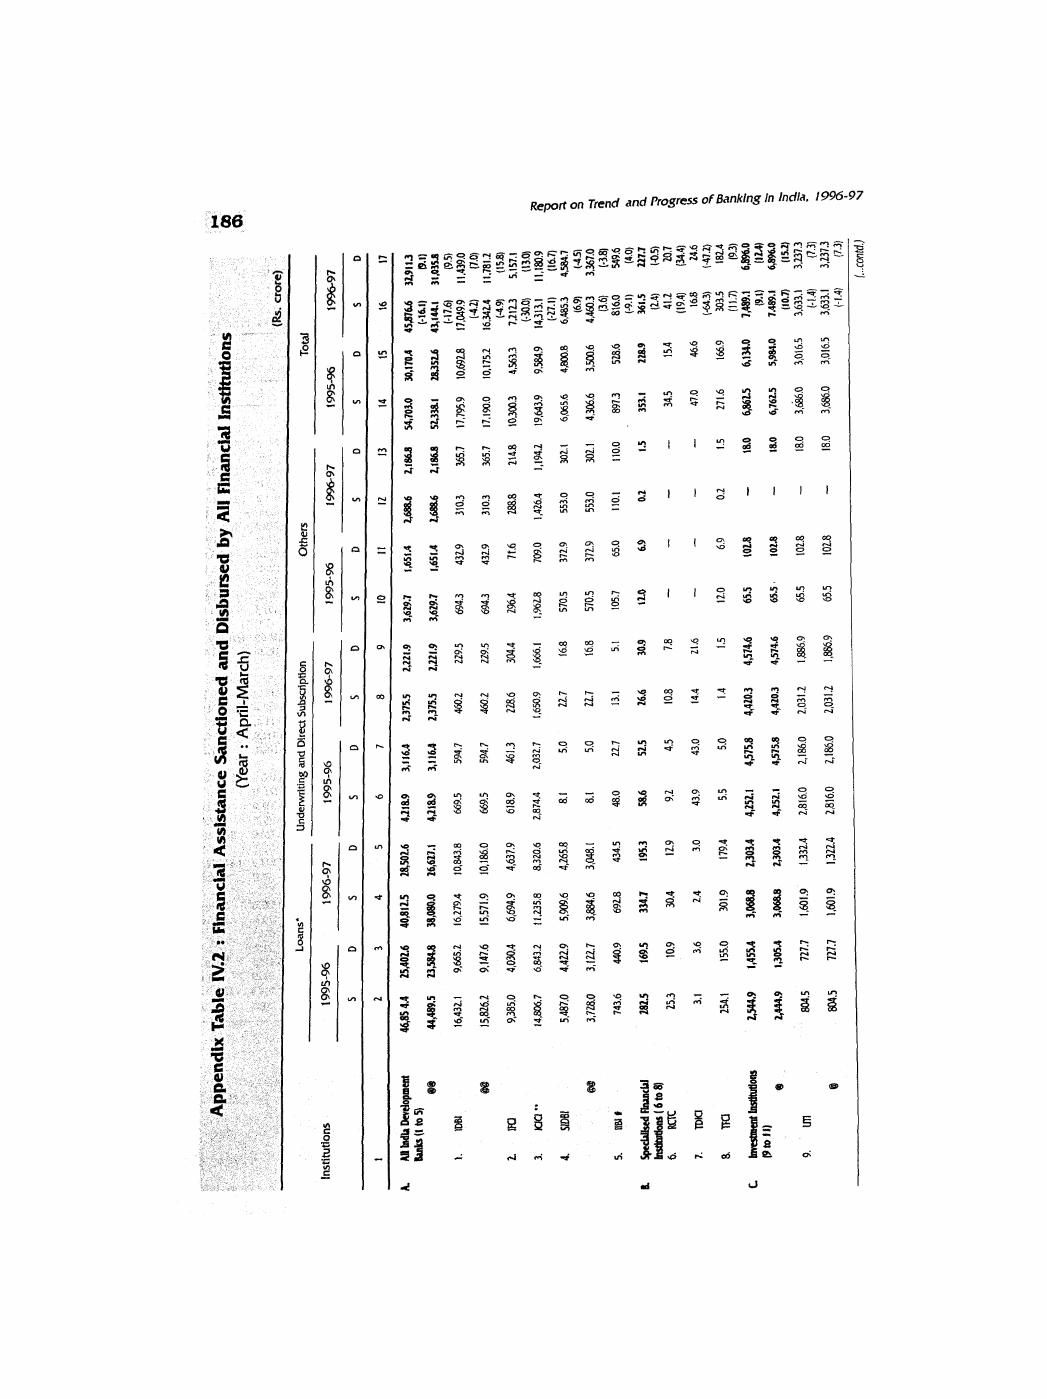
Loans*
Und
erw
ritin
g and
Dir
ect S
ubxr
iptio
n O
ther
s To
tal
Inst
itutio
ns
1995
-%
1996
-97
1995-9
6
1996-9
7
1995
-96
1996
-97
1995-9
6
1 996
-97
A. M
I&
Deve
lopm
ent
4.4
2540
2.6
4031
2.5
2450
2.6
4,21
89
3,11
6-4
2375
.5
2221
.9
3,629
.7 1.6
51.4
2,688.
6 2,tW
54
,703.0
30
,170A
42
876.
6 32
.911
3 W
(Ito
9
@a
(-161
) (0.
1) 44
,489.5
23
,584
8 38
1080
10
2616
27.1
4,21
89
3,11
6.4
2,375
.5 2,2
21.9
3,629
.7 1,
65fA
2,6
88.6
2,18
68
52,3
381
W5
U
4114
4.1
3lP3
5.8
ka I.. .
con t
d,)
\r
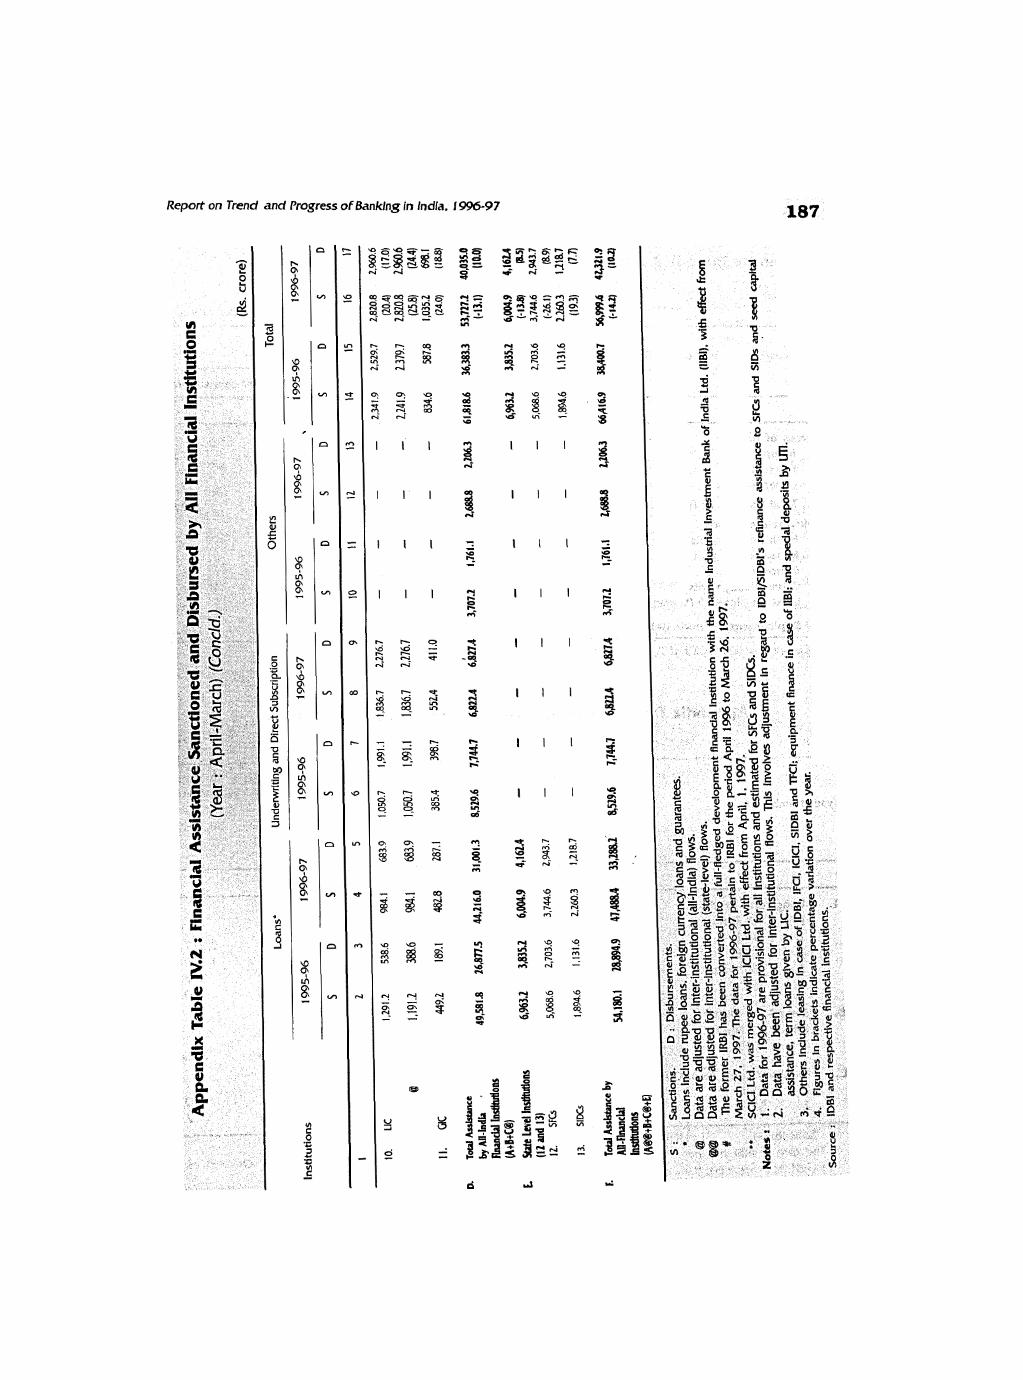
Report on Trend and Progress of Banking In India. 1 996-97 187

188 Report on Trend and Progress of Banking in India, 1996-97
Sources/Deployrnent of Funds ( April-March)
Amount Per cent to total
Sources of Funds (i) Internal (ii) External (iii) Other Sources
TOW Sources of Funds (i+il+iii)
Deployment of Funds (i) Fresh Deployments (ii) Repayment of past
Borrowings (iii) Other Deployments
of which : Interest Payments
Total Dedovment of Funds (i+ii+lii) 90,5!54 100.0
(July-June) Period Rate of Amount (Years) Interest outstanding
Type of Assistance 1995-96 1996-97 (per cent as on fune per annum) 30, 1997
S U s U
A. Long Term Credft [NIC (LTO) Fund] 1 . IDBl - - - - 15 - 2.5 17.7 2. SlDBI 224.0 224.0 225.0 225.0 15 9.5 1,829.8 3. EXIM Bank - - - - 15 9 852.0 4. IIBI* - - - - 15 8 170.0
B. Long Term Credit INHC(LT0) Fund] 1 . NHB - - 700.0 700.0 20 8 875.0

Report on Trend and Progress of Banking in India. 1 %-97
Public Sector Mutual Funds Private Grand Sector Total
Year Subsidiaries Subsidiaries Sub-Total Unit Total Mutual (April- of Banks of Financial (2+3) Trust of (4+5) Funds March) Institutions India
Notes

190 Report on Trend and Progress of BanWng in India, 1996-97
Deposits with Non-Banking Companies (NBC) Rate of change (per cent)
Year Scheduled No. of Exempted Regulated Total SCBs Total NBC Regulated (End-March) Commercial Reporting Borrowings Deposits Deposits' Deposits Deposits
Banks (SCBs) Companies as per cent of
of SCBs Deposit
rnments, Local Authorities,