Value Stream Mapping for Internal Logistics using Process ...
236
TECHNISCHE UNIVERSITÄT MÜNCHEN Fakultät für Maschinenwesen Value Stream Mapping for Internal Logistics using Process Mining Dino Nikolaus Gustaf Knoll Vollständiger Abdruck der von der Fakultät für Maschinenwesen der Technischen Universität München zur Erlangung des akademischen Grades eines Doktor-Ingenieurs (Dr.-Ing.) genehmigten Dissertation. Vorsitzender: Prof. Dr.-Ing. Michael F. Zäh Prüfer der Dissertation: 1. Prof. Dr.-Ing. Gunther Reinhart 2. Prof. Dr.-Ing. Johannes Fottner Die Dissertation wurde am 17.03.2021 bei der Technischen Universität München ein- gereicht und durch die Fakultät für Maschinenwesen am 24.08.2021 angenommen.
-
Upload
khangminh22 -
Category
Documents
-
view
2 -
download
0
Transcript of Value Stream Mapping for Internal Logistics using Process ...
TECHNISCHE UNIVERSITÄT MÜNCHEN
Fakultät für Maschinenwesen
Value Stream Mapping for Internal Logistics using Process Mining
Dino Nikolaus Gustaf Knoll
Vollständiger Abdruck der von der Fakultät für Maschinenwesen der TechnischenUniversität München zur Erlangung des akademischen Grades eines
Doktor-Ingenieurs (Dr.-Ing.)
genehmigten Dissertation.
Vorsitzender: Prof. Dr.-Ing. Michael F. Zäh
Prüfer der Dissertation: 1. Prof. Dr.-Ing. Gunther Reinhart2. Prof. Dr.-Ing. Johannes Fottner
Die Dissertation wurde am 17.03.2021 bei der Technischen Universität München ein-gereicht und durch die Fakultät für Maschinenwesen am 24.08.2021 angenommen.

Editors’ Preface
Production engineering is crucial for the advancement of our industrial society becausethe performance of manufacturing companies depends heavily on the equipment andresources employed, the production processes applied, and the established manufactu-ring organization. A company’s full potential for corporate success can only be takenadvantage of by optimizing the interaction between humans, operational structures, andtechnologies. Being able to remain competitive while balancing the varying and oftenconflicting priorities of complexity, cost, time, and quality requires constant thought,adaptation, and the development of new manufacturing structures. Thus, there is anessential need to reduce the complexity of products, manufacturing processes, and sys-tems. Yet, at the same time, it is also vital to gain a better understanding and commandof these aspects.
The objective of the research activities at the Institute for Machine Tools and IndustrialManagement (iwb) is to continuously improve product development and manufacturingplanning systems, manufacturing processes and production facilities. A company’sorganizational, manufacturing, and work structures, as well as the underlying systemsfor order processing, are developed under strict consideration of employee-relatedrequirements and sustainability issues. Although an increasing degree of automationis unavoidable, labor will remain an important component in production processes.Thus, questions concerning the optimization of human involvement in all planning anddevelopment processes are of utmost importance.
The volumes published in this book series reflect and report the results from the researchconducted at iwb. Research areas covered span from the design and developmentof manufacturing systems to the application of technologies in manufacturing andassembly. The management and operation of manufacturing systems, quality assurance,availability, and autonomy are overarching topics, which affect all areas of our research.In this series, the latest results and insights from our application-oriented researchare published. This will foster an improvement in the transfer of knowledge betweenuniversities and towards a wide industrial sector.
Gunther Reinhart Michael Zäh
III

Acknowledgments
This project would not have been possible alone. I wish to thank all the people whosupported me and enabled me to complete this doctoral thesis.
I am deeply grateful to Professor Dr.-Ing. Gunther Reinhart for supervising my doctoralthesis, supporting my research project and providing the research environment at the iwb.I am very thankful to Professor Stephen C. Graves for hosting me at the MassachusettsInstitute of Technology (MIT). Our weekly discussions always allowed me to reflectupon previous work and to further develop my research. I also thank Professor Dr.-Ing.Michael F. Zäh for taking over as chair of the examination committee and ProfessorDr.-Ing. Johannes Fottner for being part of the examination committee.
The research project included the Bayerische Motorenwerke (BMW) AG, which allowedme to provide valuable insights into the automotive industry. I would like to thankMarco Prüglmeier for his personal support and for enabling all the necessary activitiesat BMW, as well as all other contributing project members.
I would like to pay my special thanks to Jonas, Christian, Josef, Severin, Benedikt,Felix, Harald, Andi, Michi, Julia, Achim, and all my other colleagues at the iwb. Theknowledge and personality that you showed during projects and discussions was alwaysvaluable and fun, and made working here special. I would also like to thank Norman andRafael for sharing your interdisciplinary expertise, and Max, Christian, Charlotte, Julian,Robert, Philipp, Lorena, Quirin, Raffaela, and all other students for your contributionsto this research project.
On a personal note, I want to thank my mother Ulrike and the rest of my family, and myclose friends for being part of my personal development. Most of all, I want to thankyou, Sonja. You always supported me when necessary and distracted me wheneverpossible. Without you, it would not have been possible.
V

Abstract
Pen-and-paper-based value stream mapping is the established tool for recording pro-cesses, identifying waste, and deriving recommendations for action. Today, however, itsapplication in the manufacturing and logistics industry requires a high level of effort andis challenging due to product and process complexity and issues involving dynamics.
Process mining is a relatively young research discipline that helps to utilize event datato discover, analyze, and improve processes. Process mining connects business processmodeling and analysis with data mining. Nowadays, the day-to-day business of internallogistics is based on information systems, which create a vast amount of event data.
Therefore, the overarching objective of the thesis is to enable an effective and efficientapplication of value stream mapping in internal logistics using process mining. Themain contribution of this thesis is the integration of the research streams of value streammapping and process mining.
The main results include an internal logistics ontology and algorithms for data prepro-cessing and mining the value streams. Six process mining techniques create a holisticview of each value stream and a comprehensive picture of all value streams. A method-ology for an industrial application and guidelines for event data validation and theanalysis according to lean production theory in internal logistics are proposed to ensurea practical benefit to the work.
The industrial application includes three case studies that demonstrate the feasibility,effectiveness, and efficiency of the approach in practice. The findings are used toevaluate and reflect the strengths and limitations of the approach.
VII

Glossary
Concept drift The change of a process between the beginning and the end of an eventlog (BOSE et al. 2011, p. 391).
Data mining Data mining is a process that aims to generate knowledge from data andpresent the findings in ways that are useful to the user. Data mining includesdiscovering non-trivial patterns, relations, and trends. (SCHUH et al. 2019, p. 876)
Event log An event log is a collection of events of operational data (cf. VAN DER
AALST 2016).
Internal logistics Internal logistics refers to the receipt of parts, warehousing (e.g., stor-ing, sequencing), and line feeding through to line-side presentation (cf. BOYSEN
et al. 2015; NEGRI et al. 2017; SALI & SAHIN 2016).
Lean production Lean production is an integrated socio-technical system whose mainobjectives are eliminating waste and increasing efficiency by concurrently addingvalue to the customer and reducing lead times (based on JONES & WOMACK
1997; OHNO 1988; REINHART 2017; SHAH & WARD 2007).
Mixed-model assembly line In a mixed-model assembly line production, “varyingmodels are manufactured on the same production system, the production pro-cesses of which are similar enough so that setup times are not present or negligi-ble.” (BOYSEN et al. 2007, p. 678)
Ontology An ontology is an explicit specification of a conceptualization (GRUBER
1995, p. 1).
Practical guideline A piece of information that suggests how something should bedone and that is related to experience, real situations, or actions rather than ideas(based on Cambridge Dictionary 2014).
IX
Glossary
Process A process is a set of specific and ordered activities across time and place, witha beginning and an end, intended to reach a specific goal (cf. DAVENPORT 1992;HAMMER & CHAMPY 1993).
Process mining “The idea of process mining is to discover, monitor and improve realprocesses by extracting knowledge from event logs.” (VAN DER AALST et al.2012, p. 172)
Reference process A main process that consists of a unique set of standardized activi-ties (based on DÖRNHÖFER et al. 2016; ROZINAT et al. 2007).
Value stream A value stream is all the activities, both value-added and non-value-added, currently required to bring a product through the main flows (ROTHER &SHOOK 1999, p. 1).
Value stream mapping Value stream mapping is a pencil and paper tool that helps youto see and understand the flow of material and information as a product makes itsway through the value stream (ROTHER & SHOOK 1999, p. 2).
X
Contents
Abstract VII
Glossary IX
1 Introduction 11.1 Initial situation . . . . . . . . . . . . . . . . . . . . . . . . . . . . . . 1
1.2 Motivation . . . . . . . . . . . . . . . . . . . . . . . . . . . . . . . . 3
1.3 Objectives of the thesis . . . . . . . . . . . . . . . . . . . . . . . . . 6
1.4 Research methods and environment . . . . . . . . . . . . . . . . . . . 7
1.4.1 Research Questions (RQs) . . . . . . . . . . . . . . . . . . . 7
1.4.2 Adapting the Design Research Methodology (DRM) . . . . . . 7
1.4.3 Research scope and environment . . . . . . . . . . . . . . . . 9
1.5 Structure of the thesis . . . . . . . . . . . . . . . . . . . . . . . . . . 10
2 Fundamentals 132.1 Internal logistics . . . . . . . . . . . . . . . . . . . . . . . . . . . . . 13
2.1.1 Objectives, scope, and processes . . . . . . . . . . . . . . . . 13
2.1.2 From lean production to lean logistics . . . . . . . . . . . . . 15
2.1.3 Information systems . . . . . . . . . . . . . . . . . . . . . . . 17
2.2 Learning to see: Value stream mapping . . . . . . . . . . . . . . . . . 18
2.3 Process mining . . . . . . . . . . . . . . . . . . . . . . . . . . . . . 19
2.3.1 Objectives, types, and perspectives . . . . . . . . . . . . . . . 19
2.3.2 From event logs to process models . . . . . . . . . . . . . . . 22
2.3.3 Advanced concepts and methodologies . . . . . . . . . . . . . 26
3 Literature review 313.1 Systematic review approach . . . . . . . . . . . . . . . . . . . . . . . 31
3.2 Process mining in logistics . . . . . . . . . . . . . . . . . . . . . . . 34
3.2.1 Internal logistics . . . . . . . . . . . . . . . . . . . . . . . . . 34
XI
Contents
3.2.2 Infrastructure logistics . . . . . . . . . . . . . . . . . . . . . . 37
3.2.3 Other industries . . . . . . . . . . . . . . . . . . . . . . . . . 40
3.2.4 Cross-analysis of the methodological context . . . . . . . . . . 41
3.2.5 Conclusion . . . . . . . . . . . . . . . . . . . . . . . . . . . 46
3.3 Process mining in manufacturing . . . . . . . . . . . . . . . . . . . . 46
3.3.1 Capital goods . . . . . . . . . . . . . . . . . . . . . . . . . . 47
3.3.2 Semiconductors . . . . . . . . . . . . . . . . . . . . . . . . . 48
3.3.3 Consumer durables . . . . . . . . . . . . . . . . . . . . . . . 49
3.3.4 Other industries . . . . . . . . . . . . . . . . . . . . . . . . . 50
3.3.5 Cross-analysis of the methodological context . . . . . . . . . . 53
3.3.6 Conclusion . . . . . . . . . . . . . . . . . . . . . . . . . . . 56
3.4 Summary and research opportunities . . . . . . . . . . . . . . . . . . 57
4 Conceptual design of the approach 634.1 Requirements . . . . . . . . . . . . . . . . . . . . . . . . . . . . . . 63
4.2 Assumptions . . . . . . . . . . . . . . . . . . . . . . . . . . . . . . . 65
4.3 Overview . . . . . . . . . . . . . . . . . . . . . . . . . . . . . . . . 66
4.4 Methodology for the industrial application . . . . . . . . . . . . . . . 68
4.4.1 Planning and data extraction . . . . . . . . . . . . . . . . . . 68
4.4.2 Data preprocessing . . . . . . . . . . . . . . . . . . . . . . . 70
4.4.3 Mining . . . . . . . . . . . . . . . . . . . . . . . . . . . . . 72
4.4.4 Analysis and evaluation . . . . . . . . . . . . . . . . . . . . . 76
5 Detailed design of the approach 795.1 Planning and data extraction . . . . . . . . . . . . . . . . . . . . . . . 79
5.1.1 Internal logistics ontology for process mining . . . . . . . . . 79
5.1.2 Practical guideline for event data validation in internal logistics 89
5.2 Data preprocessing . . . . . . . . . . . . . . . . . . . . . . . . . . . 95
5.2.1 Creating event logs . . . . . . . . . . . . . . . . . . . . . . . 96
5.2.2 Enriching event logs . . . . . . . . . . . . . . . . . . . . . . . 99
5.2.3 Filtering event logs . . . . . . . . . . . . . . . . . . . . . . . 102
5.3 Mining . . . . . . . . . . . . . . . . . . . . . . . . . . . . . . . . . . 105
5.3.1 Process discovery . . . . . . . . . . . . . . . . . . . . . . . . 107
5.3.2 Conformance checking . . . . . . . . . . . . . . . . . . . . . 109
5.3.3 Activity mapping . . . . . . . . . . . . . . . . . . . . . . . . 111
5.3.4 Inventory profiling . . . . . . . . . . . . . . . . . . . . . . . 113
XII
Contents
5.3.5 Performance analysis . . . . . . . . . . . . . . . . . . . . . . 1175.3.6 Clustering . . . . . . . . . . . . . . . . . . . . . . . . . . . . 120
5.4 Analysis and evaluation . . . . . . . . . . . . . . . . . . . . . . . . . 1225.4.1 Literature-based development of the analysis . . . . . . . . . . 1225.4.2 Reference model of the analysis . . . . . . . . . . . . . . . . . 1245.4.3 Practical guidelines for the analysis . . . . . . . . . . . . . . . 126
6 Application and evaluation 1356.1 Industrial application . . . . . . . . . . . . . . . . . . . . . . . . . . 135
6.1.1 Industrial environment . . . . . . . . . . . . . . . . . . . . . 1356.1.2 Implementing the concept . . . . . . . . . . . . . . . . . . . . 1366.1.3 Case Study I: Analyzing deviations of reference processes . . . 1396.1.4 Case Study II: Demand-based process leveling . . . . . . . . . 1456.1.5 Case Study III: Analyzing the inventory . . . . . . . . . . . . 147
6.2 Evaluation of the approach . . . . . . . . . . . . . . . . . . . . . . . 1526.2.1 Fulfillment of requirements . . . . . . . . . . . . . . . . . . . 1526.2.2 Cost-benefit calculation . . . . . . . . . . . . . . . . . . . . . 1546.2.3 Limitations . . . . . . . . . . . . . . . . . . . . . . . . . . . 157
7 Conclusion 1597.1 Summary . . . . . . . . . . . . . . . . . . . . . . . . . . . . . . . . 1597.2 Future research . . . . . . . . . . . . . . . . . . . . . . . . . . . . . 161
References 163
Appendix 191A.1 Fundamentals . . . . . . . . . . . . . . . . . . . . . . . . . . . . . . 191
A.1.1 Analysis of eight Warehouse Management Systems (WMS) . . 191A.2 Detailed design of the approach . . . . . . . . . . . . . . . . . . . . . 192
A.2.1 Planning and data extraction . . . . . . . . . . . . . . . . . . 192A.2.2 Data preprocessing . . . . . . . . . . . . . . . . . . . . . . . 193A.2.3 Mining . . . . . . . . . . . . . . . . . . . . . . . . . . . . . 195A.2.4 Analysis and evaluation . . . . . . . . . . . . . . . . . . . . . 197
A.3 Application and evaluation . . . . . . . . . . . . . . . . . . . . . . . 200A.3.1 Industrial environment . . . . . . . . . . . . . . . . . . . . . 200A.3.2 Case Study I: Analyzing deviations of reference processes . . . 200A.3.3 Case Study II: Demand-based process leveling . . . . . . . . . 201
XIII
Contents
A.3.4 Case Study III: Analyzing the inventory . . . . . . . . . . . . 203A.3.5 Underlying assumptions of the cost-benefit calculation . . . . . 207
A.4 Software used . . . . . . . . . . . . . . . . . . . . . . . . . . . . . . 209A.5 Theses supervised . . . . . . . . . . . . . . . . . . . . . . . . . . . . 210A.6 Publication list . . . . . . . . . . . . . . . . . . . . . . . . . . . . . . 210
List of Figures XIII
List of Tables XVII
List of Abbreviations XIX
List of Symbols XXI
XIV
1 Introduction
1.1 Initial situation
Over the last decades, lean production has become the de facto standard for productionand manufacturing systems (PSOMAS & ANTONY 2019; REINHART 2017). Leanproduction is well accepted both in academia and in industry because it results insuperior performance and can provide a competitive advantage (SHAH & WARD 2007,p. 785). Invented in Japan, the Toyota Production System (TPS) is based on the two maincomponents of just-in-time (JIT) and autonomation (OHNO 1988). The primary goal ofthe TPS is to eliminate waste, increase efficiency, and subsequently reduce costs (OHNO
1988). In 1990, WOMACK et al. (1990) evolved TPS with a benchmark study of lean
production compared to mass production. The comprehensive study covers both thetechnical and the work system perspective and highlights the advantages of using lessof everything: e.g., space, human effort, and inventory (WOMACK et al. 1990, p. 13).Further development has introduced lean thinking with five key principles: specifyvalue, identify the value stream, flow, pull, and pursue perfection (JONES & WOMACK
1997). In addition to this major work, many studies on lean production address manyaspects, such as the technical and human perspective or the philosophical and practicalorientation (e.g., HOLWEG 2007; PETTERSEN 2009; PSOMAS & ANTONY 2019; SHAH
& WARD 2003, 2007). Hence, the definition presented in the following is a reflectionupon discussions between the author, researchers, and industry experts.
Definition. Lean production is an integrated socio-technical system whose mainobjectives are eliminating waste and increasing efficiency by concurrently addingvalue to the customer and reducing lead times (based on JONES & WOMACK
1997; OHNO 1988; REINHART 2017; SHAH & WARD 2007).
These days, the understanding of production also includes related processes, includinglogistics (SPATH 2010), and recent developments (e.g., lean logistics) have adapted leanthinking (e.g., GÜNTHNER & BOPPERT 2013; JONES et al. 1997).
1
1 Introduction
Value stream mapping is a pen-and-paper tool to map the current value stream andsee waste within the process (ROTHER & SHOOK 1999). ROTHER & SHOOK (1999,p. 1) define a value stream as “all the actions (both value-added and non-value-added)currently required to bring a product through the main flows essential to every product:(1) the production flow from raw material into the arms of the customer [...]”.
In practice, value stream mapping is frequently used for creating transparency, analyzing,and improving a variety of processes in the manufacturing industry; the automotiveindustry is the main application (SHOU et al. 2017, p. 3909). If existing methods ofprocess analysis for internal logistics1 are compared, value stream mapping has beenproven to be the most suitable (W. BAUER et al. 2014, p. 483) and most frequently usedtool (GÜNTHNER & SCHNEIDER 2011, p. 44). The literature review of SHOU et al.(2017), including 91 articles in the manufacturing industry, highlights the strengths ofvalue stream mapping: improvements on inventory and lead times are the top benefitswith average achievements of 70% and 56%, respectively. FORNO et al. (2014) reviewedthe main difficulties of value stream mapping in 57 articles, and both reviews revealthat the application presents difficulties in practice. Based on the findings of FORNO
et al. (2014) and SHOU et al. (2017) and the study of SPATH (2010) about valuestream mapping with 304 manufacturing companies, the following limitations havebeen identified:
• Missing support for product and process complexity. Today, products containhundreds of parts and sub-assemblies that follow different paths and processes.Then, value stream mapping can be seriously challenging or can even breakdown (BRAGLIA et al. 2006; FORNO et al. 2014). In the comprehensive study,manufacturing companies most frequently reported that value stream mapping islimited if the production requires many product variants and if product groupsrequire different processes (SPATH 2010, p. 68).
• Missing support to capture dynamics. As value stream mapping is a static pen-and-paper tool, the accuracy level and the ability to capture dynamics are limited(FORNO et al. 2014; Y.-H. LIAN & VAN LANDEGHEM 2007). If processes arenot stable or change frequently, the current state map of the value stream onlyprovides a limited snapshot or is obsolete (FORNO et al. 2014; SPATH 2010). In
1 Internal logistics refers to the receipt of parts, warehousing (e.g. storing, sequencing) and line feeding throughto line side presentation (cf. BOYSEN et al. 2015; NEGRI et al. 2017; SALI & SAHIN 2016).
2
1.2 Motivation
particular, time and quantity data measurements are impractical (FORNO et al.2014, p. 781). Additionally, many companies fail to apply value stream mappingcontinuously and in the same frequency as often as products and processes change(FORNO et al. 2014). However, continuous monitoring for several months isrequired to see the effects of changes and improvements (HINES et al. 1998,p. 243).
• High manual effort. The high level of effort involved in collecting the data andthe time spent on constructing the current state map are frequently reported asthe costliest stages (FORNO et al. 2014; SHOU et al. 2017). This cost preventsthe continuous application of value stream mapping (FORNO et al. 2014, p. 787).The cost, in combination with an increasing product and process complexity, andprocess invisibility, can prevent practitioners from collecting sufficient data bydirect observation (FORNO et al. 2014; SHOU et al. 2017).
KNOLL et al. (2019b, p. 130) demonstrate that these existing limitations are evenmore challenging for internal logistics in the context of high product and processcomplexity, as well as dynamics. In contrast to manufacturing, the value streams canbe highly individual for each product variant and sub-assembly: supplier, materialflow and inventories, and customer demand. Further on, a wide variety of processtypes (e.g., warehousing, JIT), activities (e.g., transport, pick), and resources (e.g.,storage, supermarkets) exist. Consequently, value stream mapping for every part and itsindividual value stream is not technically and economically applicable.
1.2 Motivation
In the age of Industrie 4.0, massive amounts of data are created during manufacturingand logistics operations. This operational data can be used to understand, analyze, andimprove processes in the context of complex production and manufacturing systems(i.e., BAUERNHANSEL et al. 2016; REINHART 2017). For that purpose, data mining hasbeen successfully established in the manufacturing industry within the last decade (e.g.,KÖKSAL et al. 2011; SCHUH et al. 2019).
The relatively young research discipline of process mining has evolved as a subset ofdata mining. Process mining connects data mining with business process modelingand analysis (VAN DER AALST et al. 2012, p. 172). Process mining uses algorithms to
3
1 Introduction
create process models based on operational event data (VAN DER AALST et al. 2012).Consequently, creating process models is highly automated and scales to cover bothprocess complexity and time-dependent dynamics. Today, process mining has gainedsignificant importance when analyzing business processes in domains such as healthcareor IT (DAKIC et al. 2018; ROJAS et al. 2016).
Definition. “The idea of process mining is to discover, monitor and improve realprocesses (i.e., not assumed processes) by extracting knowledge from event logsreadily available in today’s (information) systems.” (VAN DER AALST et al. 2012,p. 172)
In theory, process mining can support lean production (VAN DER AALST 2016). “Whatthese approaches have in common is that processes are ‘put under a microscope’ to seewhether further improvements are possible. Clearly, process mining can help to analyzedeviations and inefficiencies.” (VAN DER AALST 2016, p. 48) For instance, VAN DER
AALST (2016, p. 48) illustrates that the “process discovery can be used to eliminate allnon-value-added activities and reduce waste.” In contrast, the application of processmining in the domain of manufacturing and logistics is rarely reported (DAKIC et al.2018; KNOLL et al. 2019c; VAN CRUCHTEN & WEIGAND 2018). The literature reviewof DAKIC et al. (2018) shows that only 8% of the publications focus on manufacturing,and 3% focus on logistics (DAKIC et al. 2018, p. 871).
In general, a process mining project can be separated into four stages (adapted from ECK
et al. 2015; VAN DER AALST et al. 2012). Different challenges have been identified forthe application in internal logistics in each stage:
• Planning and data extraction. Any process mining project starts with planning:defining objectives and questions and extracting event data from informationsystems. This requires an understanding of the domain and the data. (VAN DER
AALST et al. 2012, p. 177) Data extraction can be challenging in the contextof complex and heterogeneous information systems, such as manufacturing andlogistics (BECKER et al. 2017; WESTKÄMPER et al. 2013). Particularly, thisstep requires combining domain knowledge (e.g., lean production) with technicalknowledge about information systems, underlying data tables, and attributes.Further on, the vocabulary used differs radically. (CALVANESE et al. 2016) Inthe context of process mining, domain ontologies have been proven to providesupport for this step (CALVANESE et al. 2016; INGVALDSEN & GULLA 2008).
4
1.2 Motivation
• Data preprocessing. Standardized event logs are required to apply process mining.However, “the step to collect the event log used as input for process mining isfar from trivial” (VAN DER AALST & WEIJTERS 2004, p. 238) and “sometimessignificant efforts are needed to correlate events belonging to the same processinstance.” (VAN DER AALST et al. 2012, p. 177) Numerous data tables must bemerged to correlate event logs, and attributes must be located in each data table(INGVALDSEN & GULLA 2008). Algorithms that correlate operational data of thematerial flow and can scale to the high volume of data are required to perform thisstep in the context of logistics (KNOLL et al. 2019b, p. 427). For example, fivemillion transfer orders are processed monthly, on average, in internal logistics inthe automotive industry (KNOLL et al. 2017).
• Mining. A variety of process mining techniques, concepts, and methodologiescan be applied in a process mining project (VAN DER AALST 2016). Innumer-able algorithms for process discovery and conformance checking are frequentlycombined with other techniques (e.g., clustering). However, “[...] there are noprocess discovery techniques that produce overarching models able to relate andanalyze different groups and process variants.” (VAN DER AALST 2013, p. 3)Furthermore, most work “[...] has been concerned with the general concept ofprocess mining, with little focus on domains.” (YAHYA et al. 2016, p. 383)Further tailoring to the process characteristics is required to apply process min-ing to logistics: selecting algorithms and advanced techniques to cover productand process complexity and integrating domain-specific characteristics such asinventory or handling costs (KNOLL et al. 2019c).
• Analysis and evaluation. The challenge is to exploit event data meaningfullyusing event logs and process mining techniques (VAN DER AALST et al. 2012,p. 174). Therefore, “the diagnostic [analysis step] should be simple, accurate, andsuggestive for the next, more detailed step in the analysis.” (GRAVES 1981, p. 664)However, a plethora of technical concepts requires support for practitioners, whichis currently lacking (Y. WANG et al. 2014a, pp. 196–197). In particular, thisrequires linking process mining with practical outcomes for the logistics domain,such as established types of waste according to lean production. Further on,product and process complexity and dynamics require effectively handling thecomplexity of the analysis. For example, to identify wasteful value streams oractivities (KNOLL et al. 2019c).
5
1 Introduction
1.3 Objectives of the thesis
The evidence for lean production and value stream mapping has been successfullydemonstrated across the manufacturing and logistics industry (SHAH & WARD 2007;SHOU et al. 2017). However, value stream mapping is not complete because of thegap between theory and practice (SHOU et al. 2017, p. 3921). There is still a need forimprovements in handling both product and process complexity, capturing the processdynamics and deviations from reality, and reducing the high level of manual effort whencreating the current state map (cf. FORNO et al. 2014; SHOU et al. 2017).
Recent developments in data mining introduce process mining techniques “[...] todiscover, monitor and improve real processes (i.e., not assumed processes) by extractingknowledge from event logs readily available in today’s (information) systems” (VAN
DER AALST et al. 2012, p. 172). Theory states that process mining can support leanproduction objectives and reduce waste (VAN DER AALST 2016, p. 48).
Motivated by existing shortcomings and recent developments in the field of processmining, the thesis contributes to the state of the art and the application in industrialpractice. The overarching goal is to enable an effective and efficient application of value
stream mapping in internal logistics using process mining. Therefore, three supportingobjectives are defined:
O1. Supporting the planning and data preparation.
The tasks of identifying, extracting, and preprocessing data must be adapted tointernal logistics to support planning and data preparation.
O2. Mapping the value stream using process mining.
Adapting and tailoring existing process mining techniques and concepts for valuestream mapping are required to holistically map the value stream using processmining. Later, missing aspects must be developed, if required.
O3. Supporting the analysis according to lean production theory.
Practical guidelines for analyzing value streams using process mining in thecontext of product and process complexity must be developed to support processimprovement.
6
1.4 Research methods and environment
1.4 Research methods and environment
Established research methods have been used in the research project to achieve the mainobjective and the three subgoals. The following section briefly describes the methodsin the context of the research project: (1) formulating the Research Questions (RQs),(2) adapting the Design Research Methodology (DRM), and (3) specifying the researchscope and environment.
1.4.1 Research Questions (RQs)
Three RQs provide guidance (cf. RQ1, RQ2, and RQ3) to further specify the objectivesindependently of the research domain:
RQ1. Which data is required, and how must that data be prepared for value streammapping for internal logistics using process mining?
RQ2. Which process mining methods, concepts, and algorithms are capable of ex-tracting and characterizing process models while capturing product and processcomplexity?
RQ3. Which steps are required to enable a systematic analysis according to lean pro-duction theory?
1.4.2 Adapting the Design Research Methodology (DRM)
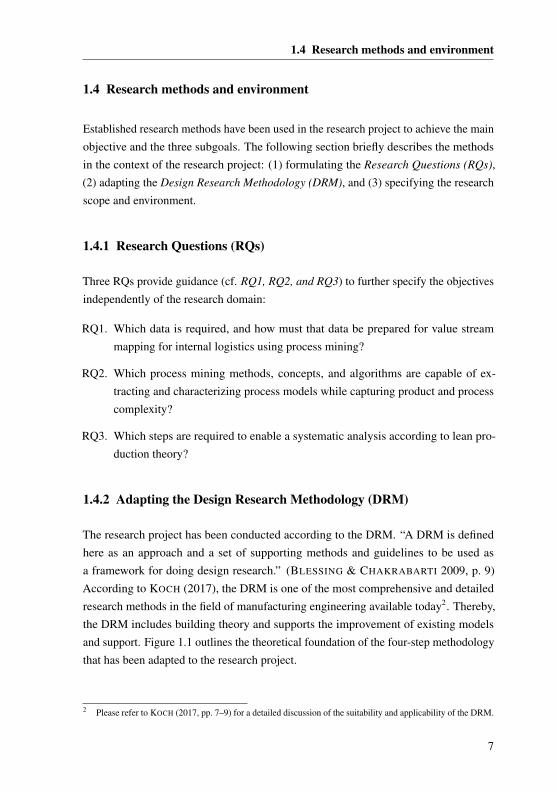
The research project has been conducted according to the DRM. “A DRM is definedhere as an approach and a set of supporting methods and guidelines to be used asa framework for doing design research.” (BLESSING & CHAKRABARTI 2009, p. 9)According to KOCH (2017), the DRM is one of the most comprehensive and detailedresearch methods in the field of manufacturing engineering available today2. Thereby,the DRM includes building theory and supports the improvement of existing modelsand support. Figure 1.1 outlines the theoretical foundation of the four-step methodologythat has been adapted to the research project.
2 Please refer to KOCH (2017, pp. 7–9) for a detailed discussion of the suitability and applicability of the DRM.
7
1 Introduction
Basic means Main outcomes
Research Clarification
Descriptive Study I
Prescriptive Study
Descriptive Study II
Stage
Legend
Input / output
Main relation between stages
Design Research Methodology
Literatureanalysis
Understanding
Support
Evaluation
Empirical dataanalysis
Assumptionsexperiencessynthesis
Empirical dataanalysis
Goals
Possible iterations
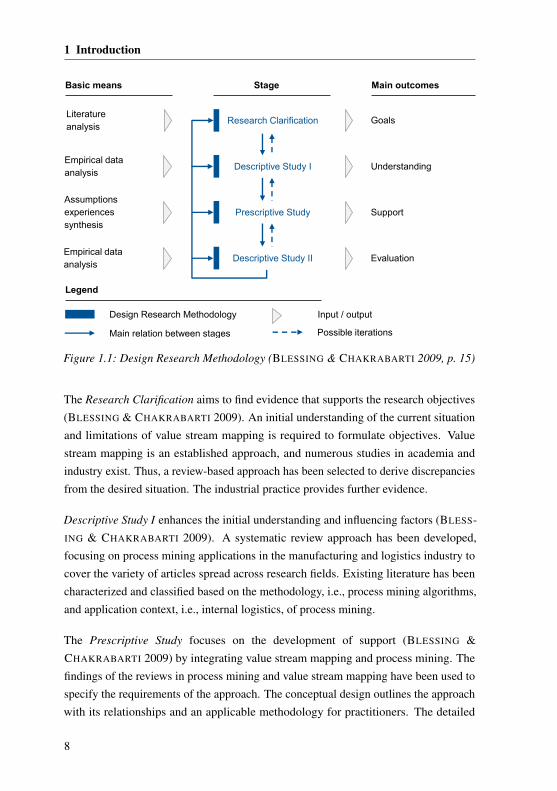
Figure 1.1: Design Research Methodology (BLESSING & CHAKRABARTI 2009, p. 15)
The Research Clarification aims to find evidence that supports the research objectives(BLESSING & CHAKRABARTI 2009). An initial understanding of the current situationand limitations of value stream mapping is required to formulate objectives. Valuestream mapping is an established approach, and numerous studies in academia andindustry exist. Thus, a review-based approach has been selected to derive discrepanciesfrom the desired situation. The industrial practice provides further evidence.
Descriptive Study I enhances the initial understanding and influencing factors (BLESS-ING & CHAKRABARTI 2009). A systematic review approach has been developed,focusing on process mining applications in the manufacturing and logistics industry tocover the variety of articles spread across research fields. Existing literature has beencharacterized and classified based on the methodology, i.e., process mining algorithms,and application context, i.e., internal logistics, of process mining.
The Prescriptive Study focuses on the development of support (BLESSING &CHAKRABARTI 2009) by integrating value stream mapping and process mining. Thefindings of the reviews in process mining and value stream mapping have been used tospecify the requirements of the approach. The conceptual design outlines the approachwith its relationships and an applicable methodology for practitioners. The detailed
8
1.4 Research methods and environment
design focuses on developing and specifying the concept based on process mining andlean production theory.
Descriptive Study II focuses on the impact and if the desired support can be achieved(BLESSING & CHAKRABARTI 2009). The concept has been implemented in industry,and three case studies have been conducted to evaluate the support. The evaluationincludes the fulfillment of requirements, a cost-benefit calculation, and a discussion oflimitations.
If required, further specifications of the research methods (e.g., the review approach)are provided in each chapter of the thesis.
1.4.3 Research scope and environment
Research scope
The scope of the thesis is value stream mapping for internal logistics supplying amixed-model assembly line production. Internal logistics refers to the receipt of parts,warehousing (e.g., storing, sequencing), and line feeding through to line-side presenta-tion (BOYSEN et al. 2015; NEGRI et al. 2017; SALI & SAHIN 2016). In a mixed-modelassembly line production, varying models are manufactured on the same productionsystem with similar production processes (BOYSEN et al. 2007, p. 678). Hence, thefollowing limitations exist:
• Technical tool perspective of lean production. Lean production provides anumbrella for a variety of practices, techniques, and tools. The thesis focuses onthe technical perspective of the value stream mapping tool. Lean practices andtechniques must be established before or when applying the tool.
• Value stream design. Because of the identified shortcomings of pen-and-paper-based value stream mapping, the scope of the work is set on the current stateand the analysis of the value stream (e.g., types of waste). The step of valuestream design to create an improved state of the value stream can be supportedby previous work (e.g., DURCHHOLZ 2014) and is not part of this thesis.
• Performance measurement system. Various performance metrics, also referredto as key performance indicators, are recorded when mapping and analyzingvalue streams. These metrics can be used to characterize waste, e.g., waste
9
1 Introduction
of inventory. However, many articles have been published on performancemeasurement, and literature indicates the company-specific nature of these metrics(e.g., GUNASEKARAN & KOBU 2007). Thus, only an initial set of performancemetrics can be provided in the thesis.
Research environment
The research project was conducted at the Institute for Machine Tools and IndustrialManagement (iwb), Technical University of Munich (TUM). The research projectincluded the Bayerische Motorenwerke (BMW) AG and, therefore, provides valuableinsights into the automotive industry. Findings have been discussed and evaluated withmore than 20 logistics experts. Later, this research project benefited from the researchcooperation with the MIT Sloan School of Management, MIT. Professor Stephen C.Graves contributed to the development of the inventory profiling algorithm and theanalysis of inventory.
1.5 Structure of the thesis
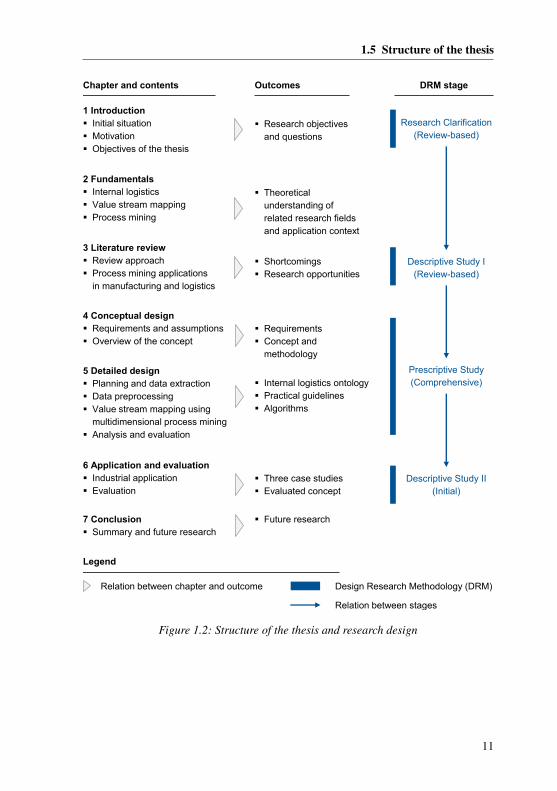
The remainder of the thesis is organized as follows (cf. Figure 1.2). Chapter 1 describesthe initial situation and motivation and derives the objectives of the thesis. Chapter 2provides the theoretical understanding of related research fields and the application con-text of internal logistics, value stream mapping, and process mining theory. Chapter 3proposes a review approach to derive a representative overview of existing literature.Applications of process mining in the fields of manufacturing and logistics are crit-ically reviewed and related to value stream mapping. Chapter 4 addresses existingshortcomings of value stream mapping and process mining and integrates both researchfields. The concept includes a methodology for an industrial application and relatesfour main research modules. The methodology for the industrial application consists offour consecutive steps and enables value stream mapping for internal logistics usingprocess mining. Chapter 5 describes the theoretical development and the research resultsof the four main research modules. Chapter 6 describes how the proposed concept isapplied in an industrial application. In addition, the fulfillment of the requirements, thecost-benefit calculation, and existing limitations are critically discussed to evaluate theconcept. Chapter 7 concludes the thesis and provides an outlook for future researchactivities.
10
1.5 Structure of the thesis
Chapter and contents DRM stage
Research Clarification(Review-based)
Descriptive Study I(Review-based)
Prescriptive Study(Comprehensive)
Descriptive Study II(Initial)
Outcomes
Legend
Relation between chapter and outcome
Relation between stages
Design Research Methodology (DRM)
1 Introduction� Initial situation� Motivation� Objectives of the thesis
� Research objectives and questions
2 Fundamentals� Internal logistics� Value stream mapping� Process mining
� Theoretical understanding of related research fields and application context
3 Literature review� Review approach� Process mining applications
in manufacturing and logistics
� Shortcomings� Research opportunities
4 Conceptual design� Requirements and assumptions� Overview of the concept
� Requirements� Concept and
methodology
6 Application and evaluation� Industrial application� Evaluation
� Three case studies� Evaluated concept
7 Conclusion� Summary and future research
� Future research
5 Detailed design� Planning and data extraction� Data preprocessing� Value stream mapping using
multidimensional process mining� Analysis and evaluation
� Internal logistics ontology� Practical guidelines� Algorithms
Figure 1.2: Structure of the thesis and research design
11

2 Fundamentals
This chapter outlines fundamental aspects of internal logistics (cf. Section 2.1) andvalue stream mapping (cf. Section 2.2). After an introduction about the objectives,types and perspectives of process mining, and fundamental and advanced concepts andmethodologies of process mining are proposed (cf. Section 2.3).
2.1 Internal logistics
2.1.1 Objectives, scope, and processes
Consumers and companies need products and materials at times and places other thanwhen and where those products and materials are produced. Therefore, “logistics has tomanage physical goods in space and time in order to execute orders.” (GUDEHUS &KOTZAB 2012, p. 4) The term logistics has been widely discussed, and many definitionsaddress various aspects (cf. RUTNER & LANGLEY 2000; SCHUH & V. STICH 2013).
Objectives
Logistics ensures the availability of the right product, in the right quantity and theright condition, at the right place, at the right time, for the right customer, at the rightcost (RUTNER & LANGLEY 2000, p. 73). A refinement of the Seven R’s of Logistics
introduces a variety of logistics performance dimensions like on-time delivery andcustomer satisfaction, flexibility, low loss and damage, and cost efficiency (CHOW et al.1994). In a nutshell, these dimensions can be simplified to effectiveness and efficiency.Efficiency is doing things right, and effectiveness is doing the right thing (CHOW et al.1994, p. 23). Non-value-added activities can be evaluated in terms of effectiveness andefficiency. Consequently, logistics is a process that creates value (RUTNER & LANGLEY
2000, p. 73).
13
2 Fundamentals
“A logistics value-added service either provides additional service(s) or exceeds cus-tomer service requirements that further reduce the supply chain costs or increase thepartners’ profits and gains competitive advantage in the marketplace.” (RUTNER &LANGLEY 2000, p. 79)
Scope
Logistics can be classified into procurement logistics, internal logistics, and distribution
logistics. Here, internal logistics, also referred to as intra-logistics, or in-house logistics,connects the receiving areas, internal sources and destinations, and the shipping docksof the same site or plant. (GUDEHUS & KOTZAB 2012, p. 7)
Definition. Internal logistics refers to the receipt of parts, warehousing (e.g., stor-ing, sequencing), and line feeding through to line-side presentation (cf. BOYSEN
et al. 2015; NEGRI et al. 2017; SALI & SAHIN 2016).
Processes
Numerous definitions exist for the term “process” (cf. LINDSAY et al. 2003). A populardefinition says a process is a “set of partially ordered activities intended to reach a goal”(HAMMER & CHAMPY 1993, p. 39). More precisely, DAVENPORT (1992) defines aprocess as a “specific ordering of work activities across time and place, with a beginning,an end, and clearly identified inputs and outputs: a structure for action” (DAVENPORT
1992, p. 5).
Definition. A process is a set of specific and ordered activities across timeand place, with a beginning and an end, intended to reach a specific goal (cf.DAVENPORT 1992; HAMMER & CHAMPY 1993).
Many types of logistics processes exist. Inbound logistics, outbound logistics, reverselogistics, or disposal logistics can be differentiated according to the direction of materialflows (GUDEHUS & KOTZAB 2012). Inbound logistics refers to the call order, transportlogistics, receipt of parts, storing parts, sequencing of parts, delivery to line, and line-sidepresentation (BOYSEN et al. 2015, p. 109).
Definition. A logistics process is a process that consists of material and informa-tion flow activities (cf. ARNOLD et al. 2010; GÜNTHNER & BOPPERT 2013).
14
2.1 Internal logistics
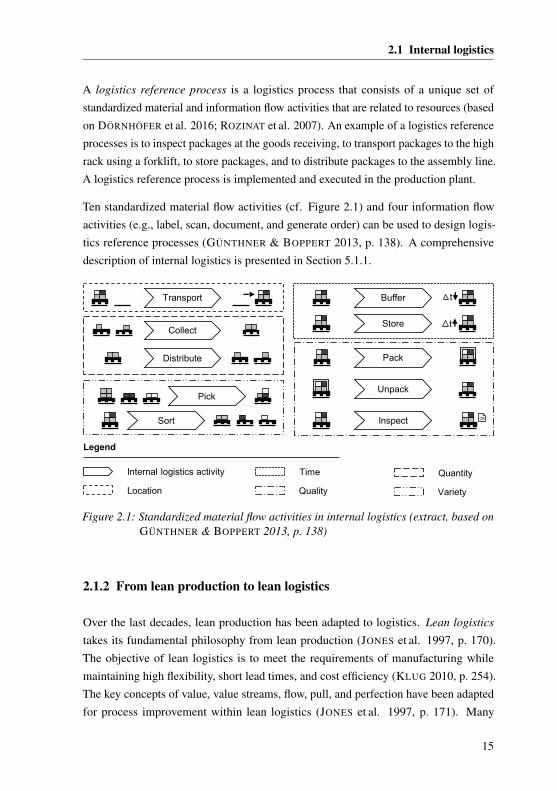
A logistics reference process is a logistics process that consists of a unique set ofstandardized material and information flow activities that are related to resources (basedon DÖRNHÖFER et al. 2016; ROZINAT et al. 2007). An example of a logistics referenceprocesses is to inspect packages at the goods receiving, to transport packages to the highrack using a forklift, to store packages, and to distribute packages to the assembly line.A logistics reference process is implemented and executed in the production plant.
Ten standardized material flow activities (cf. Figure 2.1) and four information flowactivities (e.g., label, scan, document, and generate order) can be used to design logis-tics reference processes (GÜNTHNER & BOPPERT 2013, p. 138). A comprehensivedescription of internal logistics is presented in Section 5.1.1.
Transport Buffer t
StoreCollect
Distribute
Pick
Sort Inspect OK
Legend
Internal logistics activity
Location
Time
Quality
Quantity
Variety
t
Pack
Unpack
Figure 2.1: Standardized material flow activities in internal logistics (extract, based onGÜNTHNER & BOPPERT 2013, p. 138)
2.1.2 From lean production to lean logistics
Over the last decades, lean production has been adapted to logistics. Lean logistics
takes its fundamental philosophy from lean production (JONES et al. 1997, p. 170).The objective of lean logistics is to meet the requirements of manufacturing whilemaintaining high flexibility, short lead times, and cost efficiency (KLUG 2010, p. 254).The key concepts of value, value streams, flow, pull, and perfection have been adaptedfor process improvement within lean logistics (JONES et al. 1997, p. 171). Many
15
2 Fundamentals
extensions have been developed, for example, to standardize processes or to improveprocess stability (cf. GÜNTHNER & BOPPERT 2013; KLUG 2010).
In lean logistics, the main principle is the understanding of adding value and reducingwaste (cf. DÖRNHÖFER 2016; JONES et al. 1997). Generally speaking, waste isany activity that consumes resources but creates no value (JONES & WOMACK 1997,p. 1148). Consequently, “eliminating waste must be a business’ first objective” (OHNO
1988, p. 129). JONES et al. (1997, p. 154) claim that it is easy to see the steps thatadd value, but it is much more difficult to see waste in logistics. Some activities inlogistics can be seen as adding value while others, e.g., storage, additional transport, orquality issues, are seen as waste (DÖRNHÖFER et al. 2016, p. 14). Similarly, GOLDSBY
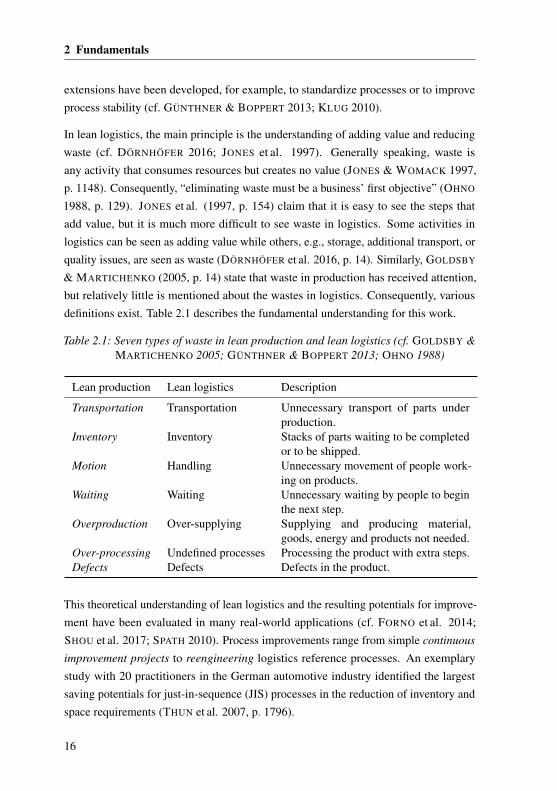
& MARTICHENKO (2005, p. 14) state that waste in production has received attention,but relatively little is mentioned about the wastes in logistics. Consequently, variousdefinitions exist. Table 2.1 describes the fundamental understanding for this work.
Table 2.1: Seven types of waste in lean production and lean logistics (cf. GOLDSBY &MARTICHENKO 2005; GÜNTHNER & BOPPERT 2013; OHNO 1988)
Lean production Lean logistics Description
Transportation Transportation Unnecessary transport of parts underproduction.
Inventory Inventory Stacks of parts waiting to be completedor to be shipped.
Motion Handling Unnecessary movement of people work-ing on products.
Waiting Waiting Unnecessary waiting by people to beginthe next step.
Overproduction Over-supplying Supplying and producing material,goods, energy and products not needed.
Over-processing Undefined processes Processing the product with extra steps.Defects Defects Defects in the product.
This theoretical understanding of lean logistics and the resulting potentials for improve-ment have been evaluated in many real-world applications (cf. FORNO et al. 2014;SHOU et al. 2017; SPATH 2010). Process improvements range from simple continuous
improvement projects to reengineering logistics reference processes. An exemplarystudy with 20 practitioners in the German automotive industry identified the largestsaving potentials for just-in-sequence (JIS) processes in the reduction of inventory andspace requirements (THUN et al. 2007, p. 1796).
16
2.1 Internal logistics
2.1.3 Information systems
Nowadays, internal logistics cannot operate without information systems due to per-formance requirements and involving complexity (TEN HOMPEL & SCHMIDT 2010,p. 2). J. BAUER (2014, p. 8) concludes that manually operating internal logistics couldnot keep up with the needs of the plant. Organizations use Warehouse ManagementSystems (WMS) to cope with performance requirements (RAMAA et al. 2012, p. 975).
Definition. A WMS primarily controls the movement and storage of materialswithin a warehouse (cf. RAMAA et al. 2012; TEN HOMPEL & SCHMIDT 2010).
WMS have extended their scope to support many aspects of internal logistics, includingprocurement, receiving incoming goods, and picking and sequencing of goods (SCHUH
& V. STICH 2013, p. 276). A WMS creates transfer orders based on the productionorders to supply production with the right amount of material. Subsequently, a transferorder integrates the (digital) information flow with the physical material flow (SCHUH
& V. STICH 2013, pp. 276–277).
Definition. A transfer order triggers the process and activities that transformthe state of the unit load and stores related activity occurrences (cf. LIBERT et al.2010; SCHUH & V. STICH 2013; TEN HOMPEL & SCHMIDT 2010).
In practice, a WMS can be a standalone system or integrated into an Enterprise ResourcePlanning (ERP) system (RAMAA et al. 2012, p. 976). Numerous WMS solutionsare available on the market (TEN HOMPEL & SCHMIDT 2010, p. 255). Due to theimportance of transfer orders for this work, the data models of eight WMS are analyzedto ensure the availability of transfer orders.
The analysis covers four commercial WMS (e.g., SAP R3 ERP WM) and four opensource WMS (e.g., openWMS) and confirms that every WMS uses transfer orders. Eachtransfer order is stored in the database and holds information about the logistics process.In particular, (1) the part (e.g., variant of a part or sub-assembly and quantity), (2) thelocation (source and destination), and (3) time of occurrence are recorded. Notably, theanalysis shows that the number of data tables (and columns) varies among these WMS(cf. Appendix A.1.1).
17
2 Fundamentals
2.2 Learning to see: Value stream mapping
“A value stream is all the actions (both value-added and non-value-added) currentlyrequired to bring a product through the main flows essential to every product: (1) theproduction flow from raw material into the arms of the customer [...].” (ROTHER &SHOOK 1999, p. 1) ROTHER & SHOOK (1999, p. 1) conclude that the value streamfocuses on “the big picture, not just individual processes, and improving the whole, notjust optimizing the parts.” Thus, mapping a value stream includes (sub-)processes, databoxes (metrics), inventory, and associated information (cf. ROTHER & SHOOK 1999).
Definition. “Value stream mapping is a pencil and paper tool that helps you tosee and understand the flow of material and information as a product makes itsway through the value stream.” (ROTHER & SHOOK 1999, p. 2)
Nowadays, value stream mapping has become a popular method for lean production(SHOU et al. 2017, p. 3906) and is used “to identify value-adding activities and thoseconsidered wasteful of materials and the flow of information” (FORNO et al. 2014,p. 779). Benefits relate to the broad view of the entire flow and waste, the simpleand standardized presentation, and making decisions more visible to monitor previouschanges and improvements (FORNO et al. 2014, pp. 779–780).
Firstly, value stream mapping starts with the selection of a product family. Secondly, thecurrent state map of the production situation is recorded. Here, value stream mappingfocuses on the actual pathways and does not rely on standard times or information.ERLACH (2010, p. 31) emphasizes that transparency on the actual state is elementary.Thirdly, waste and potential for improvement are identified to develop the future state.Fourthly, the future state is achieved1. (cf. ROTHER & SHOOK 1999)
Value stream mapping has been proven to be the most suitable (W. BAUER et al. 2014,p. 483) and most frequently used tool (GÜNTHNER & SCHNEIDER 2011, p. 44) forrecording, analyzing, and improving processes in internal logistics. DÖRNHÖFER (2016,p. 22) concludes that “transparency about processes and inventory is the key to identifywaste and potential for improvement”.
1 Please refer to ROTHER & SHOOK (1999) and ERLACH (2010) for further concepts and practical guidelines.
18
2.3 Process mining
2.3 Process mining
This section introduces process mining. Objectives, types, perspectives (cf. Sec-tion 2.3.1), fundamental concepts (cf. Section 2.3.2), and advanced concepts andmethodologies (cf. Section 2.3.3) are briefly discussed.
2.3.1 Objectives, types, and perspectives
Process mining is a relatively young research discipline that bridges the gap between datamining, on the one hand, and business process modeling and analysis, on the other hand.In the field of data mining, established techniques, including classification, clustering,and regression, are widely adapted to solve specific learning tasks. However, most datamining techniques are not process-centric. (VAN DER AALST et al. 2012, p. 172) Incontrast, modeling, analyzing, and improving business processes are common tasks inthe field of business process management and operations management. According toVAN DER AALST (2016, p. 56), “making a good model is an art rather than a science”.Typical errors are related to models that (1) describe an idealized version of reality, (2)use the wrong level of abstraction, and (3) are unable to capture human behavior (VAN
DER AALST 2016, p. 56).
Objectives of process mining
Over the last decade, event data have become available, and process mining techniqueshave been developed. According to the IEEE Task Force on Process Mining, the“challenge is to exploit event data in a meaningful way [...]. Process mining aims to doexactly that.” (VAN DER AALST et al. 2012, p. 174)
Definition. “The idea of process mining is to discover, monitor and improve realprocesses (i.e., not assumed processes) by extracting knowledge from event logsreadily available in today’s (information) systems.” (VAN DER AALST et al. 2012,p. 172)
According to VAN DER AALST (2016, p. 32), “the digital universe and the physicaluniverse become more and more aligned.” Today’s information systems log enormousamounts of event data, including the manufacturing and logistics domain (cf. REINHART
2017; VAN DER AALST 2016). Therefore, the overarching objective of process mining
19
2 Fundamentals
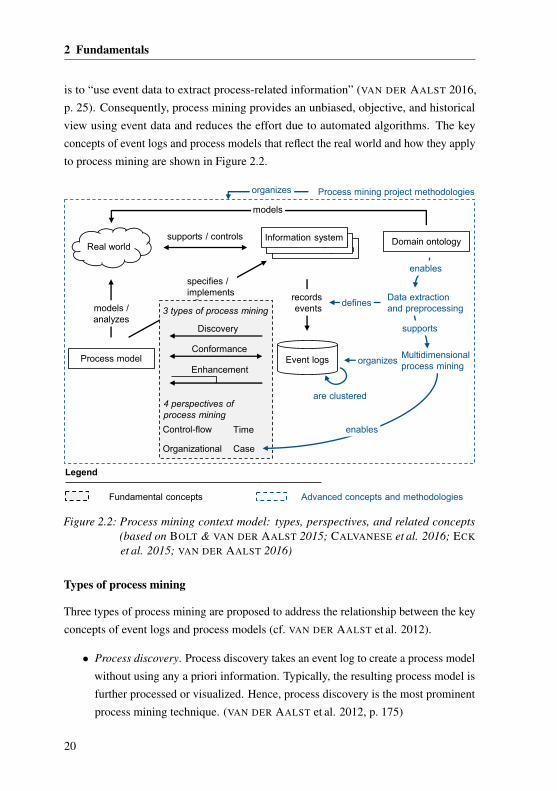
is to “use event data to extract process-related information” (VAN DER AALST 2016,p. 25). Consequently, process mining provides an unbiased, objective, and historicalview using event data and reduces the effort due to automated algorithms. The keyconcepts of event logs and process models that reflect the real world and how they applyto process mining are shown in Figure 2.2.
specifies / implements
Information systemInformation system
Discovery
Conformance
Enhancement
Control-flow Time
Organizational Case
Data extraction and preprocessing
Multidimensional process mining
enables
Process mining project methodologies
organizes
defines
supports / controlsReal world
Information system
records events
Process model
models / analyzes
organizes
supports
Domain ontology
3 types of process mining
4 perspectives of process mining
enables
models
Legend
Fundamental concepts Advanced concepts and methodologies
Event logs
are clustered
Figure 2.2: Process mining context model: types, perspectives, and related concepts(based on BOLT & VAN DER AALST 2015; CALVANESE et al. 2016; ECK
et al. 2015; VAN DER AALST 2016)
Types of process mining
Three types of process mining are proposed to address the relationship between the keyconcepts of event logs and process models (cf. VAN DER AALST et al. 2012).
• Process discovery. Process discovery takes an event log to create a process modelwithout using any a priori information. Typically, the resulting process model isfurther processed or visualized. Hence, process discovery is the most prominentprocess mining technique. (VAN DER AALST et al. 2012, p. 175)
20
2.3 Process mining
• Conformance checking. Conformance checking compares and measures thealignment between a model and an event log and verifies if the model conformsto reality (VAN DER AALST et al. 2012, p. 175).
• Enhancement. The idea of enhancement is to extend or improve an existingprocess model using information about real-world behavior recorded in the eventlog (VAN DER AALST et al. 2012, p. 175).
Perspectives of process mining
The three types of process mining cover four fundamental perspectives of a process,which have been discussed extensively in the literature (VAN DER AALST 2016, p. 34).
• Control-flow perspective. The control-flow perspective focuses on the occurrenceand ordering of activities. The goal of mining the control-flow is to find a goodcharacterization of all possible paths. The result is typically expressed as aPetri net. Consequently, the control-flow perspective constitutes the foundationof process mining and is usually the starting point for a process analysis. (cf.MANNHARDT 2018; VAN DER AALST 2016)
• Time perspective. The time perspective is concerned with the timing and fre-quency of events. The time perspective can be used, for instance, to discoverbottlenecks and extend a process model. (VAN DER AALST et al. 2012, p. 176)
• Organizational perspective. The organizational perspective, also referred to asresource perspective, focuses on the information about resources hidden in theevent log, e.g., actors (VAN DER AALST et al. 2012, p. 176).
• Case perspective. The case perspective, also referred to as the data or informationperspective, focuses on attributes of events or cases. Attributes such as cost areproposed to enhance the analysis. (VAN DER AALST et al. 2012, p. 176)
The three types of process mining connect the key concepts of event logs andprocess models. In contrast, the four process mining perspectives focus on thedifferent aspects of a process, most dominantly the control-flow perspective.
21
2 Fundamentals
2.3.2 From event logs to process models
This section focuses on the fundamental concepts of process mining. Event logs, processdiscovery algorithms, and process models are presented.
Event logs
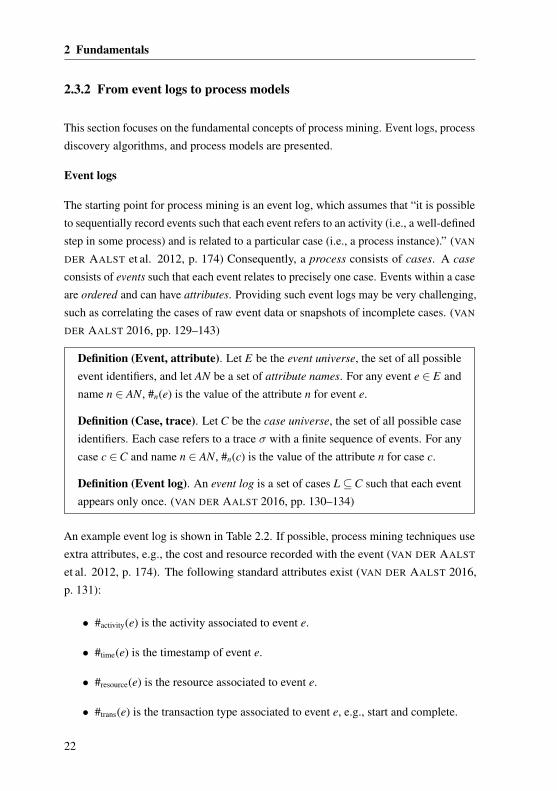
The starting point for process mining is an event log, which assumes that “it is possibleto sequentially record events such that each event refers to an activity (i.e., a well-definedstep in some process) and is related to a particular case (i.e., a process instance).” (VAN
DER AALST et al. 2012, p. 174) Consequently, a process consists of cases. A case
consists of events such that each event relates to precisely one case. Events within a caseare ordered and can have attributes. Providing such event logs may be very challenging,such as correlating the cases of raw event data or snapshots of incomplete cases. (VAN
DER AALST 2016, pp. 129–143)
Definition (Event, attribute). Let E be the event universe, the set of all possibleevent identifiers, and let AN be a set of attribute names. For any event e ∈ E andname n ∈ AN, #n(e) is the value of the attribute n for event e.
Definition (Case, trace). Let C be the case universe, the set of all possible caseidentifiers. Each case refers to a trace σ with a finite sequence of events. For anycase c ∈C and name n ∈ AN, #n(c) is the value of the attribute n for case c.
Definition (Event log). An event log is a set of cases L⊆C such that each eventappears only once. (VAN DER AALST 2016, pp. 130–134)
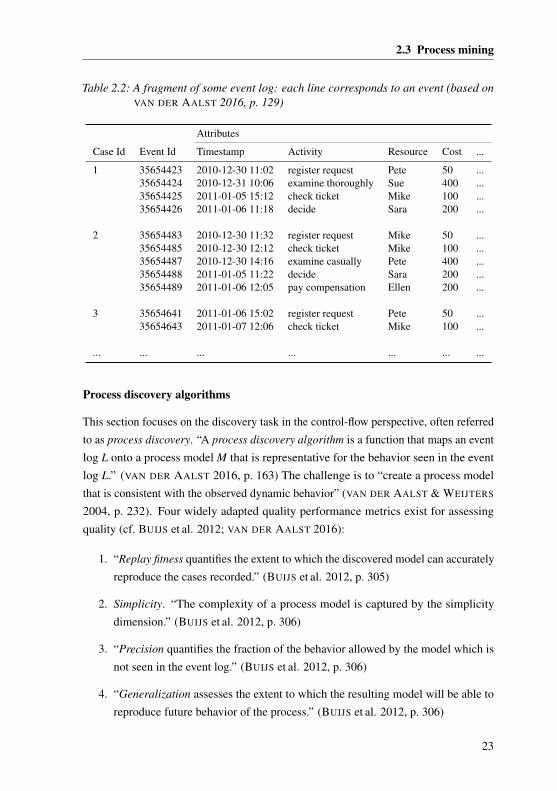
An example event log is shown in Table 2.2. If possible, process mining techniques useextra attributes, e.g., the cost and resource recorded with the event (VAN DER AALST
et al. 2012, p. 174). The following standard attributes exist (VAN DER AALST 2016,p. 131):
• #activity(e) is the activity associated to event e.
• #time(e) is the timestamp of event e.
• #resource(e) is the resource associated to event e.
• #trans(e) is the transaction type associated to event e, e.g., start and complete.
22
2.3 Process mining
Table 2.2: A fragment of some event log: each line corresponds to an event (based onVAN DER AALST 2016, p. 129)
Attributes
Case Id Event Id Timestamp Activity Resource Cost ...
1 35654423 2010-12-30 11:02 register request Pete 50 ...35654424 2010-12-31 10:06 examine thoroughly Sue 400 ...35654425 2011-01-05 15:12 check ticket Mike 100 ...35654426 2011-01-06 11:18 decide Sara 200 ...
2 35654483 2010-12-30 11:32 register request Mike 50 ...35654485 2010-12-30 12:12 check ticket Mike 100 ...35654487 2010-12-30 14:16 examine casually Pete 400 ...35654488 2011-01-05 11:22 decide Sara 200 ...35654489 2011-01-06 12:05 pay compensation Ellen 200 ...
3 35654641 2011-01-06 15:02 register request Pete 50 ...35654643 2011-01-07 12:06 check ticket Mike 100 ...
... ... ... ... ... ... ...
Process discovery algorithms
This section focuses on the discovery task in the control-flow perspective, often referredto as process discovery. “A process discovery algorithm is a function that maps an eventlog L onto a process model M that is representative for the behavior seen in the eventlog L.” (VAN DER AALST 2016, p. 163) The challenge is to “create a process modelthat is consistent with the observed dynamic behavior” (VAN DER AALST & WEIJTERS
2004, p. 232). Four widely adapted quality performance metrics exist for assessingquality (cf. BUIJS et al. 2012; VAN DER AALST 2016):
1. “Replay fitness quantifies the extent to which the discovered model can accuratelyreproduce the cases recorded.” (BUIJS et al. 2012, p. 305)
2. Simplicity. “The complexity of a process model is captured by the simplicitydimension.” (BUIJS et al. 2012, p. 306)
3. “Precision quantifies the fraction of the behavior allowed by the model which isnot seen in the event log.” (BUIJS et al. 2012, p. 306)
4. “Generalization assesses the extent to which the resulting model will be able toreproduce future behavior of the process.” (BUIJS et al. 2012, p. 306)
23
2 Fundamentals
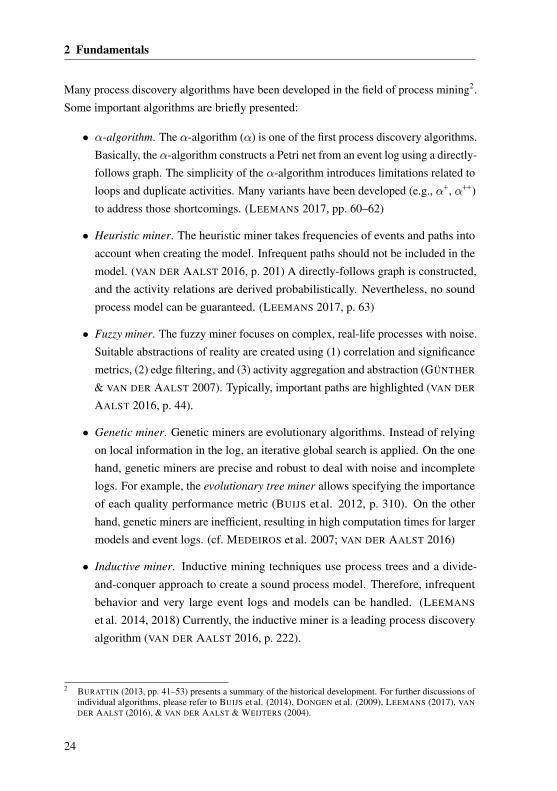
Many process discovery algorithms have been developed in the field of process mining2.Some important algorithms are briefly presented:
• α-algorithm. The α-algorithm (α) is one of the first process discovery algorithms.Basically, the α-algorithm constructs a Petri net from an event log using a directly-follows graph. The simplicity of the α-algorithm introduces limitations related toloops and duplicate activities. Many variants have been developed (e.g., α+, α++)to address those shortcomings. (LEEMANS 2017, pp. 60–62)
• Heuristic miner. The heuristic miner takes frequencies of events and paths intoaccount when creating the model. Infrequent paths should not be included in themodel. (VAN DER AALST 2016, p. 201) A directly-follows graph is constructed,and the activity relations are derived probabilistically. Nevertheless, no soundprocess model can be guaranteed. (LEEMANS 2017, p. 63)
• Fuzzy miner. The fuzzy miner focuses on complex, real-life processes with noise.Suitable abstractions of reality are created using (1) correlation and significancemetrics, (2) edge filtering, and (3) activity aggregation and abstraction (GÜNTHER
& VAN DER AALST 2007). Typically, important paths are highlighted (VAN DER
AALST 2016, p. 44).
• Genetic miner. Genetic miners are evolutionary algorithms. Instead of relyingon local information in the log, an iterative global search is applied. On the onehand, genetic miners are precise and robust to deal with noise and incompletelogs. For example, the evolutionary tree miner allows specifying the importanceof each quality performance metric (BUIJS et al. 2012, p. 310). On the otherhand, genetic miners are inefficient, resulting in high computation times for largermodels and event logs. (cf. MEDEIROS et al. 2007; VAN DER AALST 2016)
• Inductive miner. Inductive mining techniques use process trees and a divide-and-conquer approach to create a sound process model. Therefore, infrequentbehavior and very large event logs and models can be handled. (LEEMANS
et al. 2014, 2018) Currently, the inductive miner is a leading process discoveryalgorithm (VAN DER AALST 2016, p. 222).
2 BURATTIN (2013, pp. 41–53) presents a summary of the historical development. For further discussions ofindividual algorithms, please refer to BUIJS et al. (2014), DONGEN et al. (2009), LEEMANS (2017), VANDER AALST (2016), & VAN DER AALST & WEIJTERS (2004).
24
2.3 Process mining
Process models
Process discovery algorithms create process models in various perspective, semantic, andabstraction levels. A plethora of process model notations with different characteristicsexist in industry and academia. (cf. BUIJS et al. 2012; VAN DER AALST 2016) Twoimportant notations for process mining are briefly explained3.
• Petri nets. A Petri net is a directed graph consisting of places and transitions.Petri nets are a simple and executable graphical notation. WorkFlow-nets (WF-
net) are a subset of Petri nets that require a dedicated source (start) and sink (end)of the process. (VAN DER AALST 2016, pp. 59–65)
• Business Process Modeling Notation (BPMN). In 2011, the Object Management
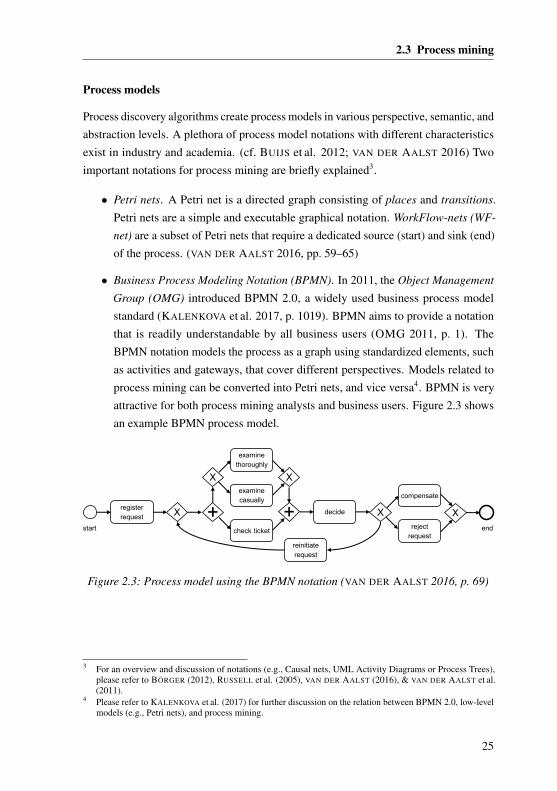
Group (OMG) introduced BPMN 2.0, a widely used business process modelstandard (KALENKOVA et al. 2017, p. 1019). BPMN aims to provide a notationthat is readily understandable by all business users (OMG 2011, p. 1). TheBPMN notation models the process as a graph using standardized elements, suchas activities and gateways, that cover different perspectives. Models related toprocess mining can be converted into Petri nets, and vice versa4. BPMN is veryattractive for both process mining analysts and business users. Figure 2.3 showsan example BPMN process model.
register request
start
X +check ticket end
examine casually
examine thoroughly
decide
X X
+ X Xreject
request
compensate
reinitiate request
Figure 2.3: Process model using the BPMN notation (VAN DER AALST 2016, p. 69)
3 For an overview and discussion of notations (e.g., Causal nets, UML Activity Diagrams or Process Trees),please refer to BÖRGER (2012), RUSSELL et al. (2005), VAN DER AALST (2016), & VAN DER AALST et al.(2011).
4 Please refer to KALENKOVA et al. (2017) for further discussion on the relation between BPMN 2.0, low-levelmodels (e.g., Petri nets), and process mining.
25
2 Fundamentals
2.3.3 Advanced concepts and methodologies
Firstly, multidimensional process mining and trace clustering are introduced. Secondly,methodologies are presented that demonstrate the applicability of process mining.
Multidimensional process mining
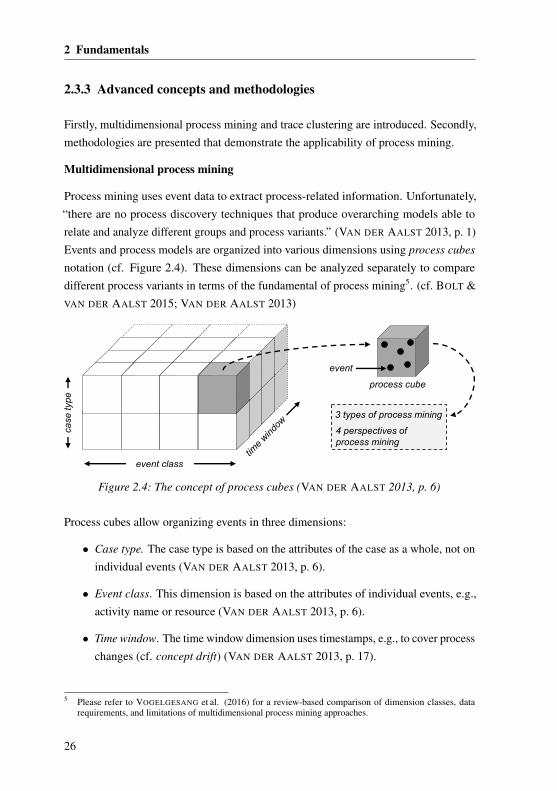
Process mining uses event data to extract process-related information. Unfortunately,“there are no process discovery techniques that produce overarching models able torelate and analyze different groups and process variants.” (VAN DER AALST 2013, p. 1)Events and process models are organized into various dimensions using process cubes
notation (cf. Figure 2.4). These dimensions can be analyzed separately to comparedifferent process variants in terms of the fundamental of process mining5. (cf. BOLT &VAN DER AALST 2015; VAN DER AALST 2013)
case
type
event class
process cube
event
3 types of process mining
4 perspectives of process mining
Figure 2.4: The concept of process cubes (VAN DER AALST 2013, p. 6)
Process cubes allow organizing events in three dimensions:
• Case type. The case type is based on the attributes of the case as a whole, not onindividual events (VAN DER AALST 2013, p. 6).
• Event class. This dimension is based on the attributes of individual events, e.g.,activity name or resource (VAN DER AALST 2013, p. 6).
• Time window. The time window dimension uses timestamps, e.g., to cover processchanges (cf. concept drift) (VAN DER AALST 2013, p. 17).
5 Please refer to VOGELGESANG et al. (2016) for a review-based comparison of dimension classes, datarequirements, and limitations of multidimensional process mining approaches.
26
2.3 Process mining
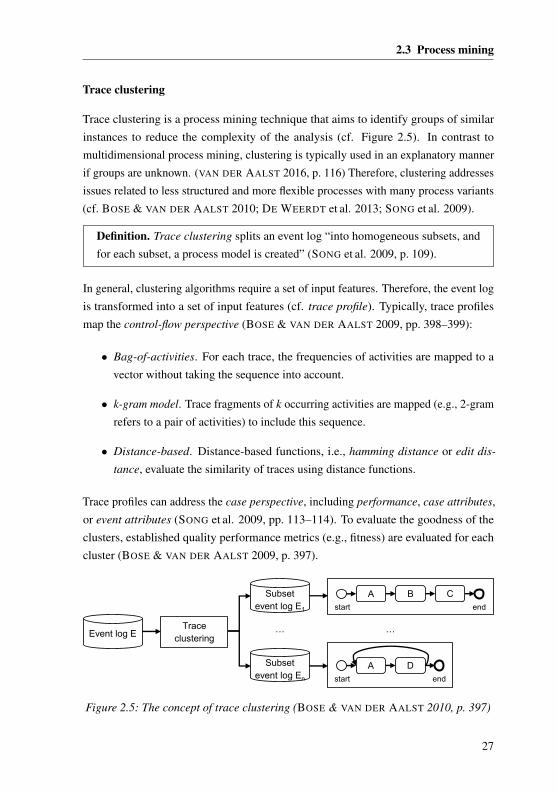
Trace clustering
Trace clustering is a process mining technique that aims to identify groups of similarinstances to reduce the complexity of the analysis (cf. Figure 2.5). In contrast tomultidimensional process mining, clustering is typically used in an explanatory mannerif groups are unknown. (VAN DER AALST 2016, p. 116) Therefore, clustering addressesissues related to less structured and more flexible processes with many process variants(cf. BOSE & VAN DER AALST 2010; DE WEERDT et al. 2013; SONG et al. 2009).
Definition. Trace clustering splits an event log “into homogeneous subsets, andfor each subset, a process model is created” (SONG et al. 2009, p. 109).
In general, clustering algorithms require a set of input features. Therefore, the event logis transformed into a set of input features (cf. trace profile). Typically, trace profilesmap the control-flow perspective (BOSE & VAN DER AALST 2009, pp. 398–399):
• Bag-of-activities. For each trace, the frequencies of activities are mapped to avector without taking the sequence into account.
• k-gram model. Trace fragments of k occurring activities are mapped (e.g., 2-gramrefers to a pair of activities) to include this sequence.
• Distance-based. Distance-based functions, i.e., hamming distance or edit dis-
tance, evaluate the similarity of traces using distance functions.
Trace profiles can address the case perspective, including performance, case attributes,or event attributes (SONG et al. 2009, pp. 113–114). To evaluate the goodness of theclusters, established quality performance metrics (e.g., fitness) are evaluated for eachcluster (BOSE & VAN DER AALST 2009, p. 397).
Event log E
Subset event log E1
…
Subset event log En
…Trace clustering
Astart
B Cend
Astart
Dend
Figure 2.5: The concept of trace clustering (BOSE & VAN DER AALST 2010, p. 397)
27
2 Fundamentals
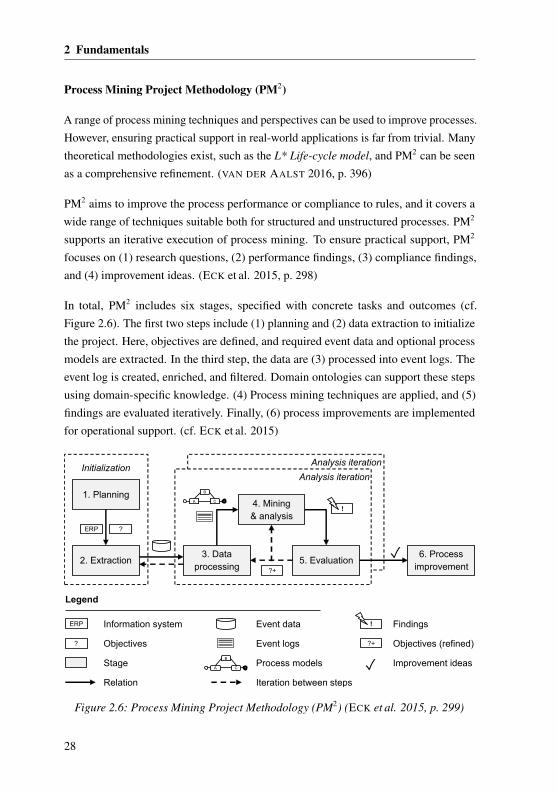
Process Mining Project Methodology (PM2)
A range of process mining techniques and perspectives can be used to improve processes.However, ensuring practical support in real-world applications is far from trivial. Manytheoretical methodologies exist, such as the L* Life-cycle model, and PM2 can be seenas a comprehensive refinement. (VAN DER AALST 2016, p. 396)
PM2 aims to improve the process performance or compliance to rules, and it covers awide range of techniques suitable both for structured and unstructured processes. PM2
supports an iterative execution of process mining. To ensure practical support, PM2
focuses on (1) research questions, (2) performance findings, (3) compliance findings,and (4) improvement ideas. (ECK et al. 2015, p. 298)
In total, PM2 includes six stages, specified with concrete tasks and outcomes (cf.Figure 2.6). The first two steps include (1) planning and (2) data extraction to initializethe project. Here, objectives are defined, and required event data and optional processmodels are extracted. In the third step, the data are (3) processed into event logs. Theevent log is created, enriched, and filtered. Domain ontologies can support these stepsusing domain-specific knowledge. (4) Process mining techniques are applied, and (5)findings are evaluated iteratively. Finally, (6) process improvements are implementedfor operational support. (cf. ECK et al. 2015)
ERP
Analysis iteration
Analysis iteration
1. Planning
2. Extraction3. Data
processing
4. Mining & analysis
5. Evaluation6. Process
improvement
Initialization
?
ERP
A
B
C
?+
✓
!
Legend
Information system
Objectives
Event data
? Event logs
A
B
CProcess models
!
?+
✓
Findings
Objectives (refined)
Improvement ideasStage
Iteration between stepsRelation
Figure 2.6: Process Mining Project Methodology (PM2) (ECK et al. 2015, p. 299)
28
2.3 Process mining
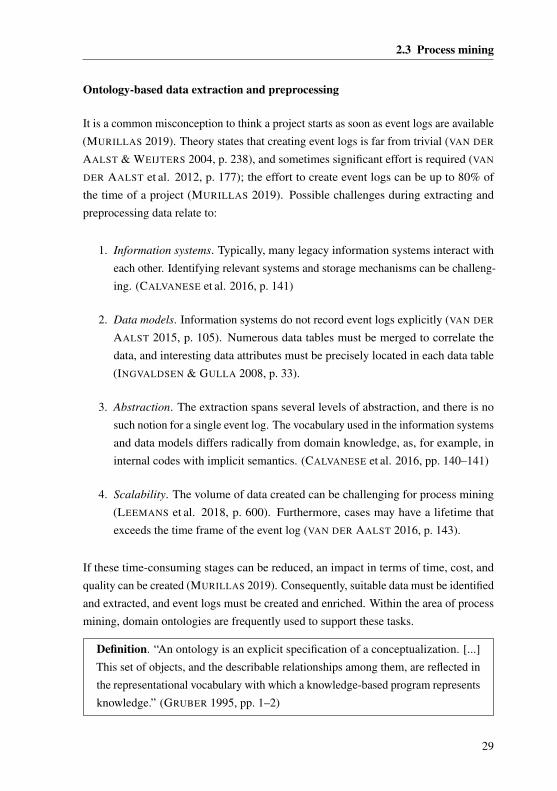
Ontology-based data extraction and preprocessing
It is a common misconception to think a project starts as soon as event logs are available(MURILLAS 2019). Theory states that creating event logs is far from trivial (VAN DER
AALST & WEIJTERS 2004, p. 238), and sometimes significant effort is required (VAN
DER AALST et al. 2012, p. 177); the effort to create event logs can be up to 80% ofthe time of a project (MURILLAS 2019). Possible challenges during extracting andpreprocessing data relate to:
1. Information systems. Typically, many legacy information systems interact witheach other. Identifying relevant systems and storage mechanisms can be challeng-ing. (CALVANESE et al. 2016, p. 141)
2. Data models. Information systems do not record event logs explicitly (VAN DER
AALST 2015, p. 105). Numerous data tables must be merged to correlate thedata, and interesting data attributes must be precisely located in each data table(INGVALDSEN & GULLA 2008, p. 33).
3. Abstraction. The extraction spans several levels of abstraction, and there is nosuch notion for a single event log. The vocabulary used in the information systemsand data models differs radically from domain knowledge, as, for example, ininternal codes with implicit semantics. (CALVANESE et al. 2016, pp. 140–141)
4. Scalability. The volume of data created can be challenging for process mining(LEEMANS et al. 2018, p. 600). Furthermore, cases may have a lifetime thatexceeds the time frame of the event log (VAN DER AALST 2016, p. 143).
If these time-consuming stages can be reduced, an impact in terms of time, cost, andquality can be created (MURILLAS 2019). Consequently, suitable data must be identifiedand extracted, and event logs must be created and enriched. Within the area of processmining, domain ontologies are frequently used to support these tasks.
Definition. “An ontology is an explicit specification of a conceptualization. [...]This set of objects, and the describable relationships among them, are reflected inthe representational vocabulary with which a knowledge-based program representsknowledge.” (GRUBER 1995, pp. 1–2)
29
2 Fundamentals
Firstly, a set of relevant objects and properties enable efficient identification of necessaryinformation systems, data tables, and columns (CALVANESE et al. 2016; INGVALDSEN
& GULLA 2008). Secondly, domain ontologies include existing relationships betweenobjects so that complex models can be flattened to an event log (INGVALDSEN &GULLA 2008). Although events and attributes are difficult to generalize, event logscan be enriched with concepts from domain ontologies to enhance the interpretation ofresults (JAREEVONGPIBOON & JANECEK 2013, p. 460).
Many concepts that use ontologies for data extraction and preprocessing refer to threestages (e.g., CALVANESE et al. 2016; INGVALDSEN & GULLA 2008; JAREEVONGPI-BOON & JANECEK 2013; VAN DER AALST 2015):
1. Ontology specification. Create a shared understanding of domain-specific classes,object properties (relations), and data properties (attributes).
2. Data extraction. Identify application-specific information systems and underlyingdata models, including data tables and columns.
3. Data processing. Correlate events to cases and, subsequently, event logs. Enrichdomain-specific attributes at the event, case, or event log level.
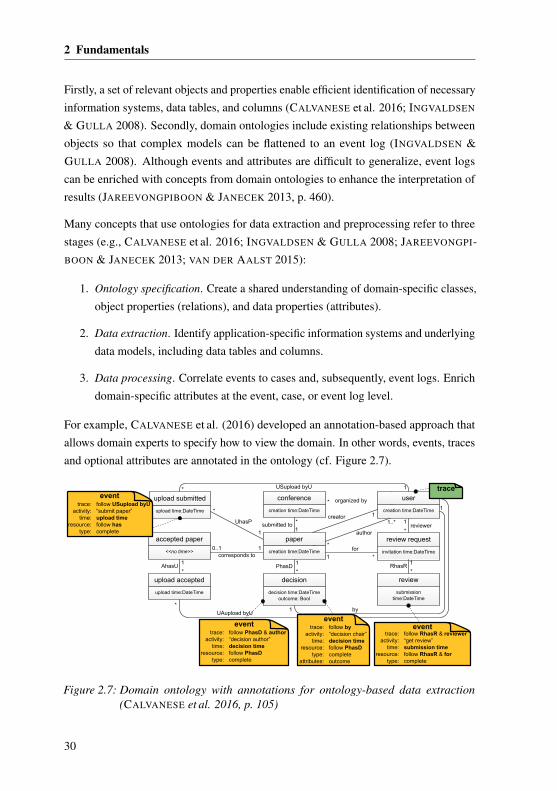
For example, CALVANESE et al. (2016) developed an annotation-based approach thatallows domain experts to specify how to view the domain. In other words, events, tracesand optional attributes are annotated in the ontology (cf. Figure 2.7).
conference
creation time:DateTime
review request
invitation time:DateTime
review
submission time:DateTime
decision
decision time:DateTimeoutcome: Bool
upload time:DateTime
upload accepted
upload time:DateTime
submitted to1
* organized by
accepted paper
<<no time>>
*reviewer
1
1
10..1corresponds to
*
UhasP
1
*AhasU
1*1
for
author
1..*
*
by
1USupload byU
creator 1*
1*
UAupload byU
1
*
upload submitted
paper
creation time:DateTime
user
creation time:DateTime
*PhasD
1
*RhasR
1
1
eventtrace:
activity:time:
resource:type:
follow PhasD & author“decision author”decision timefollow PhasDcomplete
eventtrace:
activity:time:
resource:type:
attributes:
follow by“decision chair”decision timefollow PhasDcompleteoutcome
eventtrace:
activity:time:
resource:type:
follow RhasR & reviewer“get review”submission timefollow RhasR & forcomplete
eventtrace:
activity:time:
resource:type:
follow USupload byU“submit paper”upload timefollow hascomplete
trace
Figure 2.7: Domain ontology with annotations for ontology-based data extraction(CALVANESE et al. 2016, p. 105)
30
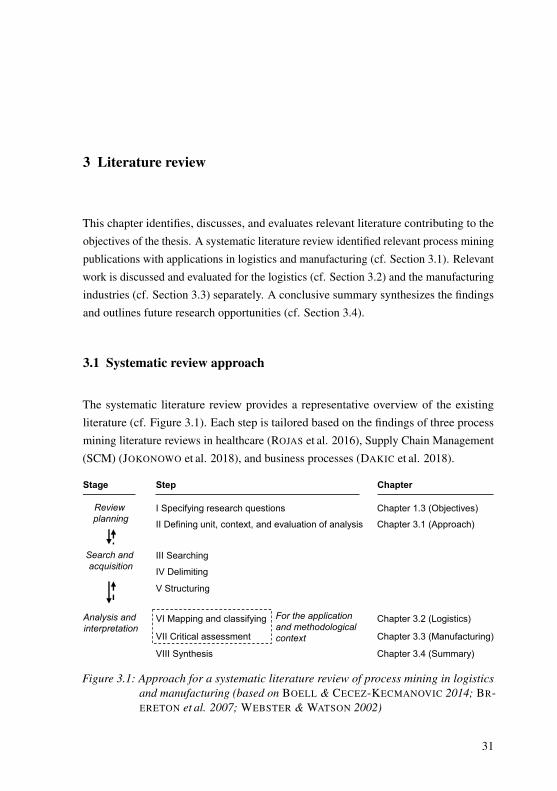
3 Literature review
This chapter identifies, discusses, and evaluates relevant literature contributing to theobjectives of the thesis. A systematic literature review identified relevant process miningpublications with applications in logistics and manufacturing (cf. Section 3.1). Relevantwork is discussed and evaluated for the logistics (cf. Section 3.2) and the manufacturingindustries (cf. Section 3.3) separately. A conclusive summary synthesizes the findingsand outlines future research opportunities (cf. Section 3.4).
3.1 Systematic review approach
The systematic literature review provides a representative overview of the existingliterature (cf. Figure 3.1). Each step is tailored based on the findings of three processmining literature reviews in healthcare (ROJAS et al. 2016), Supply Chain Management(SCM) (JOKONOWO et al. 2018), and business processes (DAKIC et al. 2018).
Review planning
Search and acquisition
Analysis and interpretation
III Searching
IV Delimiting
V Structuring
I Specifying research questions
II Defining unit, context, and evaluation of analysis
VI Mapping and classifying
VII Critical assessment
VIII Synthesis
Chapter 1.3 (Objectives)
Chapter 3.1 (Approach)
Chapter 3.4 (Summary)
Chapter 3.2 (Logistics)
Chapter 3.3 (Manufacturing)
Stage Step Chapter
For the application and methodologicalcontext
Figure 3.1: Approach for a systematic literature review of process mining in logisticsand manufacturing (based on BOELL & CECEZ-KECMANOVIC 2014; BR-ERETON et al. 2007; WEBSTER & WATSON 2002)
31
3 Literature review
Unit of analysis
The literature review includes relevant literature in the fields of logistics and manufac-turing to enable value stream mapping for internal logistics using process mining (cf.Section 1.3). Integrating manufacturing allows a broad view of related applications andsupports the identification of further research opportunities.
Classification and evaluation context
A concept-centric classification context can be formulated in terms of the addressedproblem (problem context) or the applied methodology (methodological context). Inpractice, various process mining techniques and perspectives are combined. A review ofthe SCM literature shows that a “high number of the papers aim to indirectly contributeto all other types of process mining [than data preparation].” (JOKONOWO et al. 2018,p. 3633) DAKIC et al. (2018, p. 870) reported that 94% of the publications analyzethe control-flow perspective, and 63% address the case/time perspective. In contrast,the problem context provides support for the practical application of process mining.For instance, a literature review in healthcare uses the process type to classify differenthospital processes: “That way, process mining techniques and algorithms can be appliedcorrectly and appropriately.” (ROJAS et al. 2016, p. 228). However, a variety ofprocesses with different characteristics exist in logistics and manufacturing. Thus, theproblem context must be refined to the targeted industry to classify similar processes.
Consequently, the evaluation of the work is based on the problem context and a cross-analysis of the methodological context. The main findings are discussed in terms ofthe process types and the four stages of a process mining project: planning and dataextraction, data preprocessing, mining, and analysis and evaluation.
Searching the publications
The publications were collected using the three scientific databases Scopus R©, Web of
Science and Google Scholar. A keyword search for “process mining” AND (logistics
OR manufacturing OR production) was performed for each database. After an initialscreening, the search was extended by specific terms such as RFID or warehousing. Intotal, after removing duplicates, 207 publications were considered.1
1 The articles of KNOLL et al. (2017), REINHART et al. (2017), and KNOLL et al. (2019c) were excluded fromthe review.
32
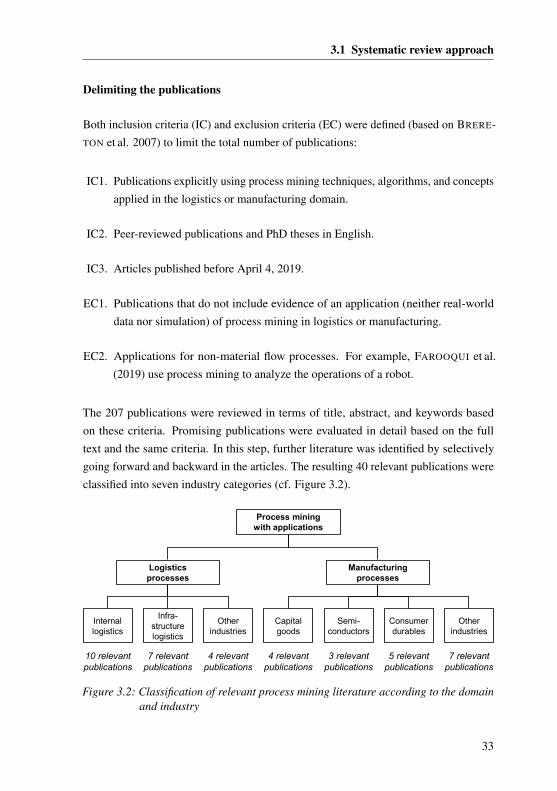
3.1 Systematic review approach
Delimiting the publications
Both inclusion criteria (IC) and exclusion criteria (EC) were defined (based on BRERE-TON et al. 2007) to limit the total number of publications:
IC1. Publications explicitly using process mining techniques, algorithms, and conceptsapplied in the logistics or manufacturing domain.
IC2. Peer-reviewed publications and PhD theses in English.
IC3. Articles published before April 4, 2019.
EC1. Publications that do not include evidence of an application (neither real-worlddata nor simulation) of process mining in logistics or manufacturing.
EC2. Applications for non-material flow processes. For example, FAROOQUI et al.(2019) use process mining to analyze the operations of a robot.
The 207 publications were reviewed in terms of title, abstract, and keywords basedon these criteria. Promising publications were evaluated in detail based on the fulltext and the same criteria. In this step, further literature was identified by selectivelygoing forward and backward in the articles. The resulting 40 relevant publications wereclassified into seven industry categories (cf. Figure 3.2).
Process miningwith applications
Logistics processes
Manufacturing processes
Internal logistics
Infra-structure logistics
Other industries
Capital goods
Semi-conductors
Consumer durables
Other industries
10 relevantpublications
7 relevantpublications
4 relevantpublications
4 relevantpublications
3 relevantpublications
5 relevantpublications
7 relevantpublications
Figure 3.2: Classification of relevant process mining literature according to the domainand industry
33
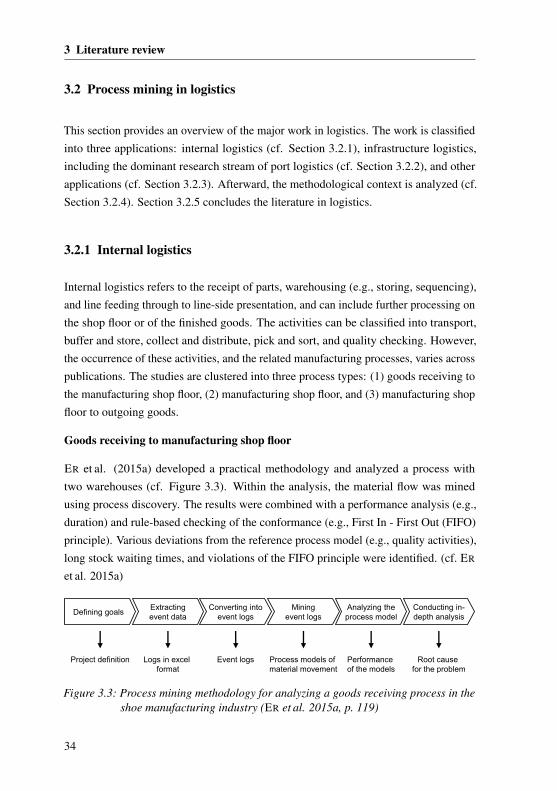
3 Literature review
3.2 Process mining in logistics
This section provides an overview of the major work in logistics. The work is classifiedinto three applications: internal logistics (cf. Section 3.2.1), infrastructure logistics,including the dominant research stream of port logistics (cf. Section 3.2.2), and otherapplications (cf. Section 3.2.3). Afterward, the methodological context is analyzed (cf.Section 3.2.4). Section 3.2.5 concludes the literature in logistics.
3.2.1 Internal logistics
Internal logistics refers to the receipt of parts, warehousing (e.g., storing, sequencing),and line feeding through to line-side presentation, and can include further processing onthe shop floor or of the finished goods. The activities can be classified into transport,buffer and store, collect and distribute, pick and sort, and quality checking. However,the occurrence of these activities, and the related manufacturing processes, varies acrosspublications. The studies are clustered into three process types: (1) goods receiving tothe manufacturing shop floor, (2) manufacturing shop floor, and (3) manufacturing shopfloor to outgoing goods.
Goods receiving to manufacturing shop floor
ER et al. (2015a) developed a practical methodology and analyzed a process withtwo warehouses (cf. Figure 3.3). Within the analysis, the material flow was minedusing process discovery. The results were combined with a performance analysis (e.g.,duration) and rule-based checking of the conformance (e.g., First In - First Out (FIFO)principle). Various deviations from the reference process model (e.g., quality activities),long stock waiting times, and violations of the FIFO principle were identified. (cf. ER
et al. 2015a)
Project definition
Defining goalsExtracting event data
Converting into event logs
Mining event logs
Analyzing the process model
Conducting in-depth analysis
Logs in excel format
Event logs Process models of material movement
Performance of the models
Root cause for the problem
Figure 3.3: Process mining methodology for analyzing a goods receiving process in theshoe manufacturing industry (ER et al. 2015a, p. 119)
34
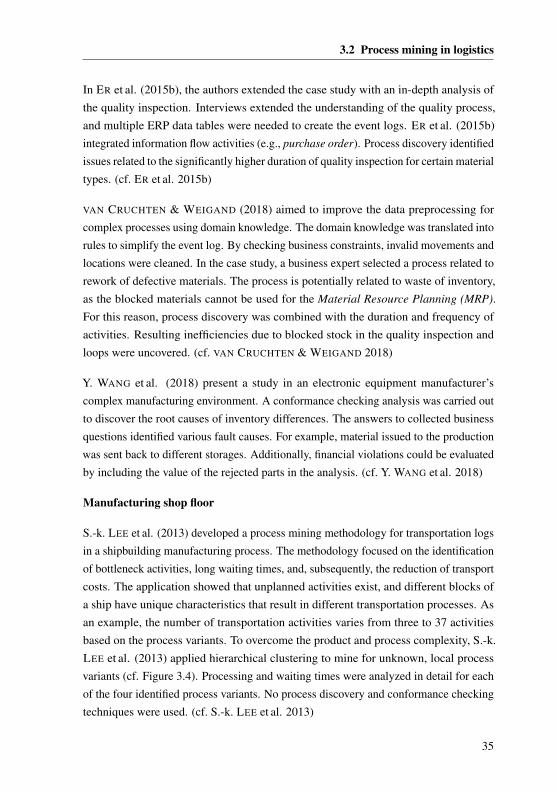
3.2 Process mining in logistics
In ER et al. (2015b), the authors extended the case study with an in-depth analysis ofthe quality inspection. Interviews extended the understanding of the quality process,and multiple ERP data tables were needed to create the event logs. ER et al. (2015b)integrated information flow activities (e.g., purchase order). Process discovery identifiedissues related to the significantly higher duration of quality inspection for certain materialtypes. (cf. ER et al. 2015b)
VAN CRUCHTEN & WEIGAND (2018) aimed to improve the data preprocessing forcomplex processes using domain knowledge. The domain knowledge was translated intorules to simplify the event log. By checking business constraints, invalid movements andlocations were cleaned. In the case study, a business expert selected a process related torework of defective materials. The process is potentially related to waste of inventory,as the blocked materials cannot be used for the Material Resource Planning (MRP).For this reason, process discovery was combined with the duration and frequency ofactivities. Resulting inefficiencies due to blocked stock in the quality inspection andloops were uncovered. (cf. VAN CRUCHTEN & WEIGAND 2018)
Y. WANG et al. (2018) present a study in an electronic equipment manufacturer’scomplex manufacturing environment. A conformance checking analysis was carried outto discover the root causes of inventory differences. The answers to collected businessquestions identified various fault causes. For example, material issued to the productionwas sent back to different storages. Additionally, financial violations could be evaluatedby including the value of the rejected parts in the analysis. (cf. Y. WANG et al. 2018)
Manufacturing shop floor
S.-k. LEE et al. (2013) developed a process mining methodology for transportation logsin a shipbuilding manufacturing process. The methodology focused on the identificationof bottleneck activities, long waiting times, and, subsequently, the reduction of transportcosts. The application showed that unplanned activities exist, and different blocks ofa ship have unique characteristics that result in different transportation processes. Asan example, the number of transportation activities varies from three to 37 activitiesbased on the process variants. To overcome the product and process complexity, S.-k.LEE et al. (2013) applied hierarchical clustering to mine for unknown, local processvariants (cf. Figure 3.4). Processing and waiting times were analyzed in detail for eachof the four identified process variants. No process discovery and conformance checkingtechniques were used. (cf. S.-k. LEE et al. 2013)
35
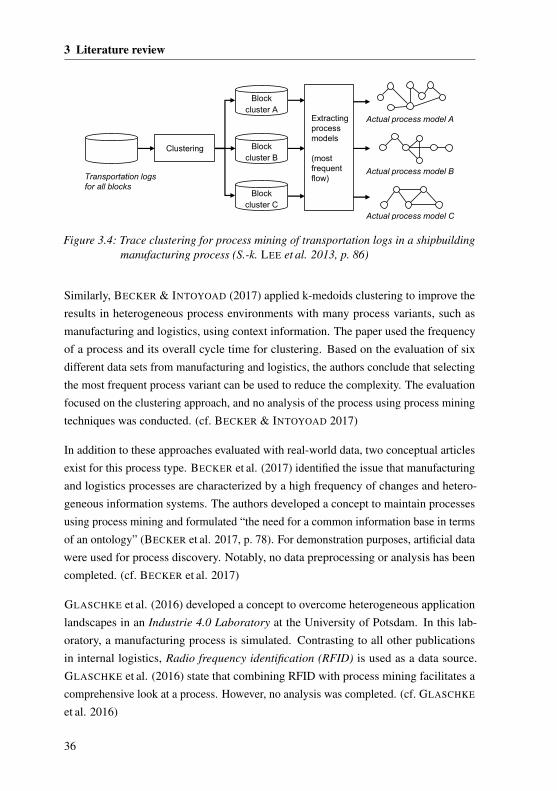
3 Literature review
Block cluster A
Block cluster C
Actual process model A
Clustering
Transportation logs for all blocks
Block cluster B
Actual process model B
Actual process model C
Extracting process models
(most frequent flow)
Figure 3.4: Trace clustering for process mining of transportation logs in a shipbuildingmanufacturing process (S.-k. LEE et al. 2013, p. 86)
Similarly, BECKER & INTOYOAD (2017) applied k-medoids clustering to improve theresults in heterogeneous process environments with many process variants, such asmanufacturing and logistics, using context information. The paper used the frequencyof a process and its overall cycle time for clustering. Based on the evaluation of sixdifferent data sets from manufacturing and logistics, the authors conclude that selectingthe most frequent process variant can be used to reduce the complexity. The evaluationfocused on the clustering approach, and no analysis of the process using process miningtechniques was conducted. (cf. BECKER & INTOYOAD 2017)
In addition to these approaches evaluated with real-world data, two conceptual articlesexist for this process type. BECKER et al. (2017) identified the issue that manufacturingand logistics processes are characterized by a high frequency of changes and hetero-geneous information systems. The authors developed a concept to maintain processesusing process mining and formulated “the need for a common information base in termsof an ontology” (BECKER et al. 2017, p. 78). For demonstration purposes, artificial datawere used for process discovery. Notably, no data preprocessing or analysis has beencompleted. (cf. BECKER et al. 2017)
GLASCHKE et al. (2016) developed a concept to overcome heterogeneous applicationlandscapes in an Industrie 4.0 Laboratory at the University of Potsdam. In this lab-oratory, a manufacturing process is simulated. Contrasting to all other publicationsin internal logistics, Radio frequency identification (RFID) is used as a data source.GLASCHKE et al. (2016) state that combining RFID with process mining facilitates acomprehensive look at a process. However, no analysis was completed. (cf. GLASCHKE
et al. 2016)
36
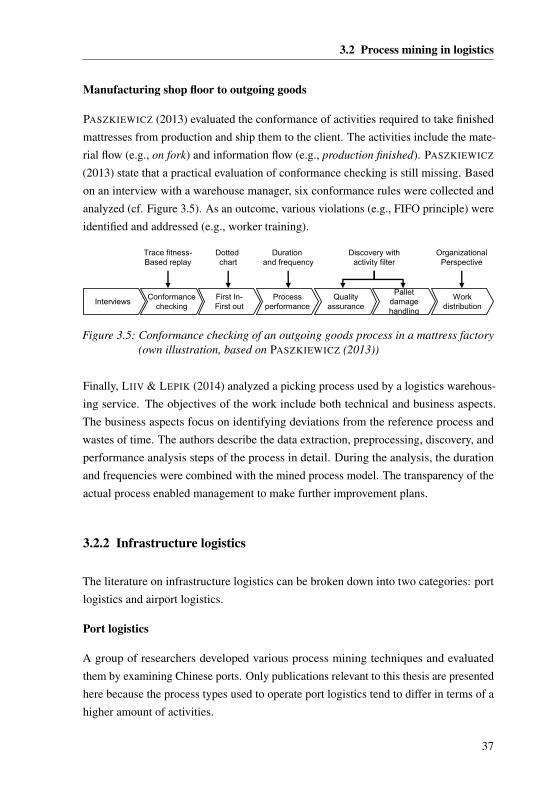
3.2 Process mining in logistics
Manufacturing shop floor to outgoing goods
PASZKIEWICZ (2013) evaluated the conformance of activities required to take finishedmattresses from production and ship them to the client. The activities include the mate-rial flow (e.g., on fork) and information flow (e.g., production finished). PASZKIEWICZ
(2013) state that a practical evaluation of conformance checking is still missing. Basedon an interview with a warehouse manager, six conformance rules were collected andanalyzed (cf. Figure 3.5). As an outcome, various violations (e.g., FIFO principle) wereidentified and addressed (e.g., worker training).
Trace fitness-Based replay
Dotted chart
Duration and frequency
Discovery with activity filter
OrganizationalPerspective
InterviewsConformance
checkingFirst In-First out
Process performance
Quality assurance
Pallet damage handling
Work distribution
Figure 3.5: Conformance checking of an outgoing goods process in a mattress factory(own illustration, based on PASZKIEWICZ (2013))
Finally, LIIV & LEPIK (2014) analyzed a picking process used by a logistics warehous-ing service. The objectives of the work include both technical and business aspects.The business aspects focus on identifying deviations from the reference process andwastes of time. The authors describe the data extraction, preprocessing, discovery, andperformance analysis steps of the process in detail. During the analysis, the durationand frequencies were combined with the mined process model. The transparency of theactual process enabled management to make further improvement plans.
3.2.2 Infrastructure logistics
The literature on infrastructure logistics can be broken down into two categories: portlogistics and airport logistics.
Port logistics
A group of researchers developed various process mining techniques and evaluatedthem by examining Chinese ports. Only publications relevant to this thesis are presentedhere because the process types used to operate port logistics tend to differ in terms of ahigher amount of activities.
37
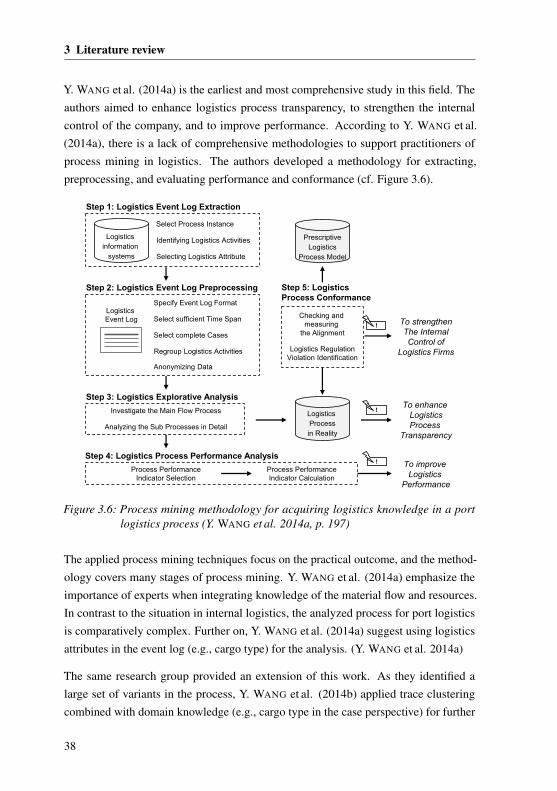
3 Literature review
Y. WANG et al. (2014a) is the earliest and most comprehensive study in this field. Theauthors aimed to enhance logistics process transparency, to strengthen the internalcontrol of the company, and to improve performance. According to Y. WANG et al.(2014a), there is a lack of comprehensive methodologies to support practitioners ofprocess mining in logistics. The authors developed a methodology for extracting,preprocessing, and evaluating performance and conformance (cf. Figure 3.6).
Step 1: Logistics Event Log Extraction
Step 2: Logistics Event Log Preprocessing
Step 3: Logistics Explorative Analysis
Step 4: Logistics Process Performance Analysis
Logistics information
systems
LogisticsEvent Log
Logistics Processin Reality
PrescriptiveLogistics
Process Model
Step 5: Logistics Process Conformance
To improve Logistics
Performance
To enhance LogisticsProcess
Transparency
To strengthenThe InternalControl of
Logistics Firms
Select Process Instance
Identifying Logistics Activities
Selecting Logistics Attribute
Specify Event Log Format
Select sufficient Time Span
Select complete Cases
Regroup Logistics Activities
Anonymizing Data
Investigate the Main Flow Process
Analyzing the Sub Processes in Detail
Process PerformanceIndicator Selection
Process PerformanceIndicator Calculation
Checking and measuring
the Alignment
Logistics RegulationViolation Identification
!
!
!
Figure 3.6: Process mining methodology for acquiring logistics knowledge in a portlogistics process (Y. WANG et al. 2014a, p. 197)
The applied process mining techniques focus on the practical outcome, and the method-ology covers many stages of process mining. Y. WANG et al. (2014a) emphasize theimportance of experts when integrating knowledge of the material flow and resources.In contrast to the situation in internal logistics, the analyzed process for port logisticsis comparatively complex. Further on, Y. WANG et al. (2014a) suggest using logisticsattributes in the event log (e.g., cargo type) for the analysis. (Y. WANG et al. 2014a)
The same research group provided an extension of this work. As they identified alarge set of variants in the process, Y. WANG et al. (2014b) applied trace clusteringcombined with domain knowledge (e.g., cargo type in the case perspective) for further
38
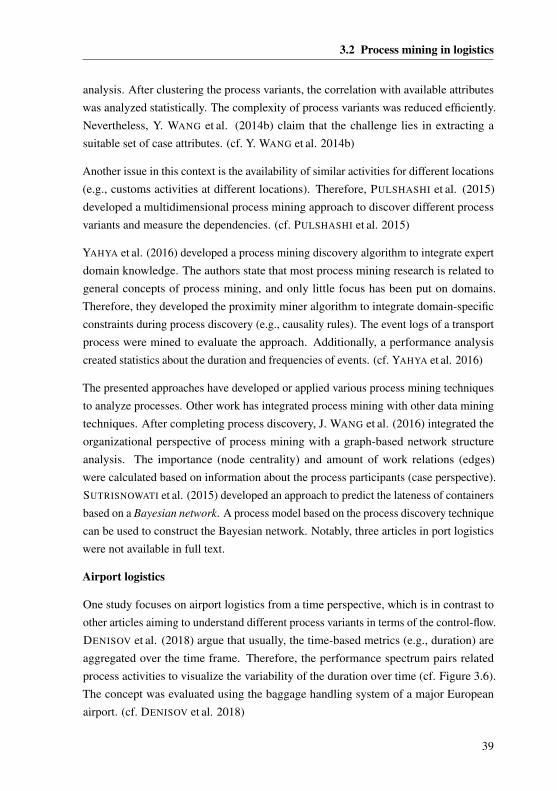
3.2 Process mining in logistics
analysis. After clustering the process variants, the correlation with available attributeswas analyzed statistically. The complexity of process variants was reduced efficiently.Nevertheless, Y. WANG et al. (2014b) claim that the challenge lies in extracting asuitable set of case attributes. (cf. Y. WANG et al. 2014b)
Another issue in this context is the availability of similar activities for different locations(e.g., customs activities at different locations). Therefore, PULSHASHI et al. (2015)developed a multidimensional process mining approach to discover different processvariants and measure the dependencies. (cf. PULSHASHI et al. 2015)
YAHYA et al. (2016) developed a process mining discovery algorithm to integrate expertdomain knowledge. The authors state that most process mining research is related togeneral concepts of process mining, and only little focus has been put on domains.Therefore, they developed the proximity miner algorithm to integrate domain-specificconstraints during process discovery (e.g., causality rules). The event logs of a transportprocess were mined to evaluate the approach. Additionally, a performance analysiscreated statistics about the duration and frequencies of events. (cf. YAHYA et al. 2016)
The presented approaches have developed or applied various process mining techniquesto analyze processes. Other work has integrated process mining with other data miningtechniques. After completing process discovery, J. WANG et al. (2016) integrated theorganizational perspective of process mining with a graph-based network structureanalysis. The importance (node centrality) and amount of work relations (edges)were calculated based on information about the process participants (case perspective).SUTRISNOWATI et al. (2015) developed an approach to predict the lateness of containersbased on a Bayesian network. A process model based on the process discovery techniquecan be used to construct the Bayesian network. Notably, three articles in port logisticswere not available in full text.
Airport logistics
One study focuses on airport logistics from a time perspective, which is in contrast toother articles aiming to understand different process variants in terms of the control-flow.DENISOV et al. (2018) argue that usually, the time-based metrics (e.g., duration) areaggregated over the time frame. Therefore, the performance spectrum pairs relatedprocess activities to visualize the variability of the duration over time (cf. Figure 3.6).The concept was evaluated using the baggage handling system of a major Europeanairport. (cf. DENISOV et al. 2018)
39
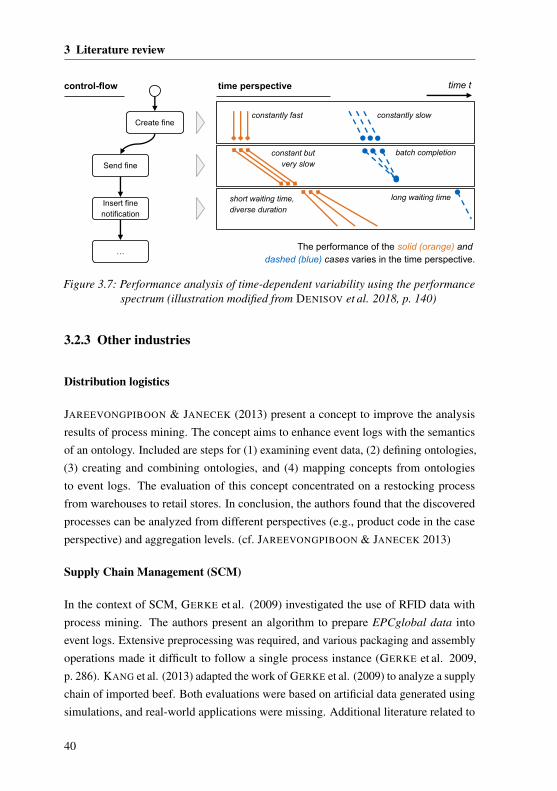
3 Literature review
constant butvery slow
constantly fast
short waiting time,diverse duration
time t
constantly slow
batch completion
long waiting time
Create fine
…
Send fine
Insert fine notification
The performance of the solid (orange) and dashed (blue) cases varies in the time perspective.
control-flow time perspective
Figure 3.7: Performance analysis of time-dependent variability using the performancespectrum (illustration modified from DENISOV et al. 2018, p. 140)
3.2.3 Other industries
Distribution logistics
JAREEVONGPIBOON & JANECEK (2013) present a concept to improve the analysisresults of process mining. The concept aims to enhance event logs with the semanticsof an ontology. Included are steps for (1) examining event data, (2) defining ontologies,(3) creating and combining ontologies, and (4) mapping concepts from ontologiesto event logs. The evaluation of this concept concentrated on a restocking processfrom warehouses to retail stores. In conclusion, the authors found that the discoveredprocesses can be analyzed from different perspectives (e.g., product code in the caseperspective) and aggregation levels. (cf. JAREEVONGPIBOON & JANECEK 2013)
Supply Chain Management (SCM)
In the context of SCM, GERKE et al. (2009) investigated the use of RFID data withprocess mining. The authors present an algorithm to prepare EPCglobal data intoevent logs. Extensive preprocessing was required, and various packaging and assemblyoperations made it difficult to follow a single process instance (GERKE et al. 2009,p. 286). KANG et al. (2013) adapted the work of GERKE et al. (2009) to analyze a supplychain of imported beef. Both evaluations were based on artificial data generated usingsimulations, and real-world applications were missing. Additional literature related to
40
3.2 Process mining in logistics
SCM focuses on the cross-organizational perspective and is discussed in a literaturereview (cf. JOKONOWO et al. 2018).
Healthcare
Process mining is used to track the material flow of physical equipment, medicalpersonnel and patients in healthcare using RFID data (ZHOU & PIRAMUTHU 2010a,b).A review of healthcare-related literature provides a broad overview (cf. ROJAS et al.2016).
The articles in the review support the conclusion that process mining can be applied toanalyze RFID data of material flow activities. The publications outline the challengesand steps required for preprocessing RFID data into event logs for process mining.However, no case study with a detailed process analysis exists. The feasibility ofanalyzing RFID data has been presented in the context of big data applications. ZHONG
et al. (2015) processed RFID data within data warehouses to create a logistics trajectory.Later, ZHONG et al. (2016) developed a visualization concept and ZHONG et al. (2017)integrated physical resources. Notably, no process mining techniques were used.
3.2.4 Cross-analysis of the methodological context
Process mining has been applied and evaluated in different logistics industry sectors.The methodological context provides further insights across all publications in logistics.The literature review has identified two main types of research: articles related tothe design and evaluation of concepts (conceptual work) and articles focusing on thepractical application (case study). The characteristics of the methodological contextvary depending on the research type.
Process types
Essentially, two generic types of processes exist: lasagna processes and spaghetti
processes. Lasagna processes are well-structured and relatively simple, with a lownumber of activities. Spaghetti processes are unstructured and complex. Differentprocess mining techniques can be applied to each process type. Theory claims that bothtypes exist in the transportation industry. (VAN DER AALST 2016, p. 401)
The literature review confirms these theoretical findings as the number of activitiesanalyzed in internal logistics varies from four to ten activities per process. If the
41
3 Literature review
activities are related to one or more locations such as storages, the complexity usuallyincreases (cf. VAN CRUCHTEN & WEIGAND 2018; Y. WANG et al. 2018). Multiplepublications have reported that many processes exist, either as process variants (e.g.,BECKER & INTOYOAD 2017; S.-k. LEE et al. 2013) or as processes preselected bylogistics experts (e.g., PASZKIEWICZ 2013; VAN CRUCHTEN & WEIGAND 2018). Ininfrastructure logistics for ports, by contrast, the number of activities ranges from ten to37 activities, in addition to multiple process variants. Airport logistics may have up to850 activities (DENISOV et al. 2018). The number of activities per process, events, andcases is reported to be high. For example, PASZKIEWICZ (2013) reported 87,660 casesand 554,745 events in a mattress factory, and VAN CRUCHTEN & WEIGAND (2018)analyzed a process with 4.2 million events in one year.
Planning and data extraction
Any process mining project starts with planning the objectives and questions and thenextracting event data from information systems (VAN DER AALST et al. 2012, p. 177).
Conceptual work can be characterized by less-practical objectives and, typically, noanalysis questions (i.e., BECKER & INTOYOAD 2017; Y. WANG et al. 2014b). Theevaluation aims to verify that the concept (e.g., clustering techniques) can be applied. Incontrast, the case studies have defined objectives and questions. However, the objectivesand the processes selected for analysis are determined by the process expert’s choice(e.g., ER et al. 2015a; PASZKIEWICZ 2013).
Due to the fact of heterogeneous information systems, the picture of event data is alsosparse and fragmented. Except for S.-k. LEE et al. (2013), all publications with real-world data rely on transactional information systems (i.e., WMS or ERP). S.-k. LEE
et al. (2013) refers to a manually recorded transportation history. Usually, multiple datatables, sometimes even across systems, must be extracted. ER et al. (2015b) claimsthat obtaining an event log is one of the main challenges. According to Y. WANG et al.(2014a), the identification of additional attributes is an important challenge in event logextraction and requires domain knowledge.
The concept of ontology-based data extraction and preprocessing is proposed to ad-dress this issue. BECKER et al. (2017) argue that upper ontologies should be used.JAREEVONGPIBOON & JANECEK (2013), on the other hand, state that event logsshould be enriched using domain ontologies. Remarkably, only JAREEVONGPIBOON &JANECEK (2013) evaluated an ontology-based approach in distribution logistics.
42
3.2 Process mining in logistics
Data preprocessing
Event data must be preprocessed into standardized event logs to apply process mining.Unfortunately, “the step to collect the event log used as input for process mining is farfrom trivial.” (VAN DER AALST & WEIJTERS 2004, p. 238)
No strict distinction is made between the two steps because preprocessing may requirean iterative step back to data extraction. However, the literature review revealed thatpreprocessing requires significant effort. For internal logistics, the majority of publica-tions have explicitly described several steps related to filtering, renaming, merging, andenhancing to create usable event logs. VAN CRUCHTEN & WEIGAND (2018) developeda methodology for preprocessing for this purpose. LIIV & LEPIK (2014) reported that90% of the project time (200 hours) was spent on data preprocessing. These challengeshave rarely been reported in port logistics. Interestingly, in the context of SCM, GERKE
et al. (2009) state that the case identifier must be reconstructed first, and the shift ofstates (e.g., from pallet to package) results in difficult relationships.
In conclusion, the preprocessed event logs can be characterized as follows. The case idvaries but is always related to a traceable object (e.g., pallet or cargo id). The majorityof event logs contain a start event and end event. The additional attributes are far fromstandard and vary across the papers. However, in more than one case, part-specificattributes (e.g., supplier), locations, and resources (e.g., workers) have been used.
Mining: Techniques, concepts, and methodologies
A variety of process mining techniques, concepts, and methodologies can be appliedduring a process mining project (cf. VAN DER AALST 2016).
The literature review in logistics confirms the findings in healthcare, SCM, and generalbusiness processes (cf. DAKIC et al. 2018; JOKONOWO et al. 2018; ROJAS et al. 2016).The most dominant technique employed on real-world data is the process discovery ofthe control-flow (13 publications). Typically, this is the starting point of the analysis.Closely related is the application of performance analysis (12 publications). Mostfrequently, the duration (also referred to as lead time) and the frequency of cases areanalyzed (time perspective). Applications of conformance checking (six papers) andautomated conformance checking (three papers) are described less frequently.
Advanced concepts have been developed and evaluated in addition to these frequentlyapplied process mining techniques. Most importantly, different types of clustering
43
3 Literature review
techniques are used. For example, trace clustering (i.e., S.-k. LEE et al. 2013) is extendedby domain knowledge of case attributes (i.e., Y. WANG et al. 2014b) or case-specificcontext information (i.e., BECKER & INTOYOAD 2017). In addition, domain knowledgeis integrated into a process discovery algorithm using constraint rules (YAHYA et al.2016). Less frequently, process mining is combined with advanced algorithms forinter-dependency (PULSHASHI et al. 2015), Bayesian networks (SUTRISNOWATI et al.2015), or network analysis (J. WANG et al. 2016). Notably, case studies rarely reusethese techniques.
Analysis and evaluation
The challenge is to exploit event data meaningfully using event logs and process miningtechniques (VAN DER AALST et al. 2012, p. 174).
Again, differences can be identified based on the research type. Conceptual workmostly focuses on a particular aspect when developing and evaluating the concept(e.g., clustering traces). The analysis of the process and the evaluation of the practicalimplications are mostly out of scope.
Case studies, in contrast, typically analyze processes holistically using multiple perspec-tives. Then, based on the objectives and questions, sufficient process mining techniquesare used to achieve the results. The control-flow perspective is used most frequently. Ininternal logistics, process discovery is used to manually check non-value-added activi-ties, i.e., quality or rework (cf. ER et al. 2015a; PASZKIEWICZ 2013). The control-flowperspective is often extended by the time perspective (frequency and waiting and pro-cessing time). Later, the metrics are used in an aggregated form (e.g., average duration),which is also referred to as performance analysis, or in a detailed analysis of cases usingthe dotted chart (ER et al. 2015a; PASZKIEWICZ 2013). Bottleneck analysis is used toidentify long-running storage or quality-related activities. In contrast, the organizationalperspective is rarely used in internal logistics.
After identifying deviations (“What happened?”), only a few publications have con-ducted an in-depth analysis (“Why does it happen?”). In the case perspective, processvariants (e.g., quality-based cases) are linked with attributes (e.g., suppliers). Interviewsare used to understand or verify the root causes (ER et al. 2015a). Notably, in timeperspective, several publications refer to inventory as the root cause. However, noneof the publications used process mining to analyze the inventory. Table 3.1 shows anoverview of the literature.
44
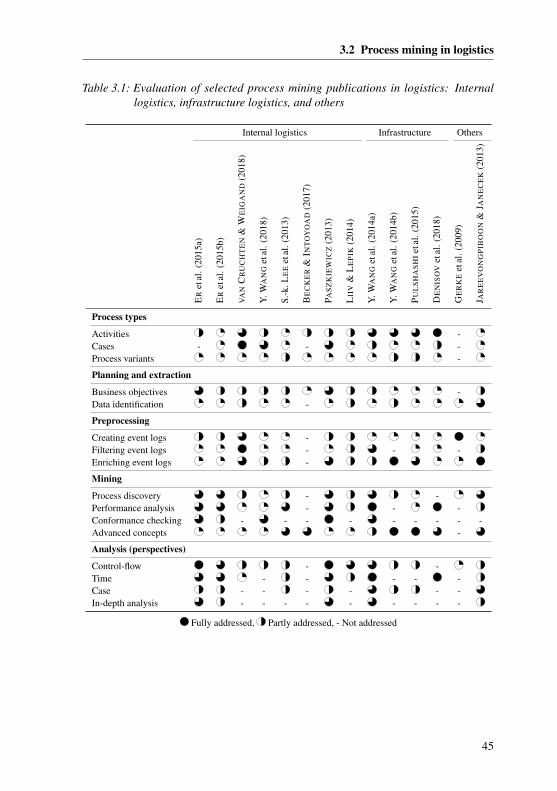
3.2 Process mining in logistics
Table 3.1: Evaluation of selected process mining publications in logistics: Internallogistics, infrastructure logistics, and others
Internal logistics Infrastructure Others
ER
etal
.(20
15a)
ER
etal
.(20
15b)
VA
NC
RU
CH
TE
N&
WE
IGA
ND
(201
8)
Y.W
AN
Get
al.(
2018
)
S.-k
.LE
Eet
al.(
2013
)
BE
CK
ER
&IN
TO
YO
AD
(201
7)
PAS
ZK
IEW
ICZ
(201
3)
LII
V&
LE
PIK
(201
4)
Y.W
AN
Get
al.(
2014
a)
Y.W
AN
Get
al.(
2014
b)
PU
LS
HA
SH
Iet
al.(
2015
)
DE
NIS
OV
etal
.(20
18)
GE
RK
Eet
al.(
2009
)
JAR
EE
VO
NG
PIB
OO
N&
JAN
EC
EK
(201
3)
Process types
Activities -Cases - - -Process variants -
Planning and extraction
Business objectives -Data identification -
Preprocessing
Creating event logs -Filtering event logs - - -Enriching event logs -
Mining
Process discovery - -Performance analysis - - -Conformance checking - - - - - - - - -Advanced concepts -
Analysis (perspectives)
Control-flow - -Time - - - - -Case - - - - - -In-depth analysis - - - - - - - - -
Fully addressed, Partly addressed, - Not addressed
45
3 Literature review
3.2.5 Conclusion
The literature review in logistics covers applications in internal logistics, infrastructurelogistics, and other sectors. Based on the application, both simple processes withtwo warehouses (e.g., goods receiving and storage in internal logistics) and complexprocesses (e.g., port logistics) have been analyzed with process mining techniques.
The methodological context varies depending on the type of research. Conceptualliterature usually does not define precise business objectives or analysis questions butproposes advanced concepts (e.g., clustering or ontologies). Case studies, in contrast,use experts to define precise objectives. Independent of the research type, the step of dataextraction and preprocessing is highly time-consuming and challenging. Preparation ofevent logs is especially difficult. No ontology has been developed and applied for thecontext of internal logistics.
Different process mining techniques have been applied to different process types. Com-plex processes in port logistics mainly require advanced concepts of clustering to reducethe complexity of process variants. However, process discovery of the control-flow andperformance analysis from the time perspective have been applied frequently. Confor-mance checking has been applied infrequently to identify deviations in the control-flowfor simple process types. Differences between the research types also exist for analysisand evaluation. Case studies mainly try to answer the analysis questions, includingin-depth analyses and evaluations with experts, using a variety of standard processmining techniques. Conceptual work aims to evaluate the applicability of the concept,but the practical benefit or evaluation with experts is mostly out of scope.
3.3 Process mining in manufacturing
This section provides an overview of the literature using process mining in manufactu-ring processes. Work in manufacturing is more fragmented than work in logistics. Thepublications can be categorized in terms of the industry: capital goods (cf. Section 3.3.1),semiconductors (cf. Section 3.3.2), consumer durables (cf. Section 3.3.3), and otherindustries (cf. Section 3.3.4). Afterward, the methodological context is discussed inSection 3.3.5, and the results of the review are summarized in Section 3.3.6.
46
3.3 Process mining in manufacturing
3.3.1 Capital goods
Multiple articles have analyzed manufacturing processes in the shipbuilding industry asan example of capital goods. One case study reported on electrical equipment.
Shipbuilding
D. LEE et al. (2013) applied process mining to the assembly of ship blocks. Theprocess is characterized by a multitude of process variants depending on the blocks tobe manufactured. Therefore, hierarchical clustering was used based on (1) the activities,(2) the resources (workshops), and (3) a hybrid approach. The authors discovered aprocess model for each cluster to evaluate the results. D. LEE et al. (2013) concludedthat the clusters represent reality more precisely than the planned models.
J. PARK et al. (2014) evaluated the performance of assembly in a shipbuilding blockprocess. Again, the process variants compounded the analysis of discrepancies betweenthe actual and the planned processing times. Therefore, J. PARK et al. (2014) developeda framework that utilizes k-means clustering to evaluate the performance of each processvariant individually (cf. Figure 3.8). The authors conducted 30 interviews with experts toidentify and prioritize performance metrics. Afterward, the authors identified inefficientblocks with unexpected deviations (e.g., waiting in the stockyard).
M. PARK et al. (2015) contribute a conceptual approach for a workload and delayanalysis. The approach includes the degree of workload (cf. resource perspective) andthe delay of activities (cf. time perspective).
Electrical equipment
Like ship block manufacturing, MEINCHEIM et al. (2017) state that the productionof industrial control panels is highly customized and difficult to understand. Whileprocess discovery provided a holistic view of the process and showed unknown loopsof activities, specific issues were still hidden. For this reason, MEINCHEIM et al.(2017) applied trace clustering. First, the authors clustered individual process variantsto identify performance issues. The authors were faced with 170 process variants,and prioritization of the most frequent variant was required. The in-depth analysishighlighted that individual process variants could be characterized by different leadtimes. Bottleneck analysis was used to determine root causes and uncovered unnecessarywaiting due to an unbalanced allocation of resources. (cf. MEINCHEIM et al. 2017)
47
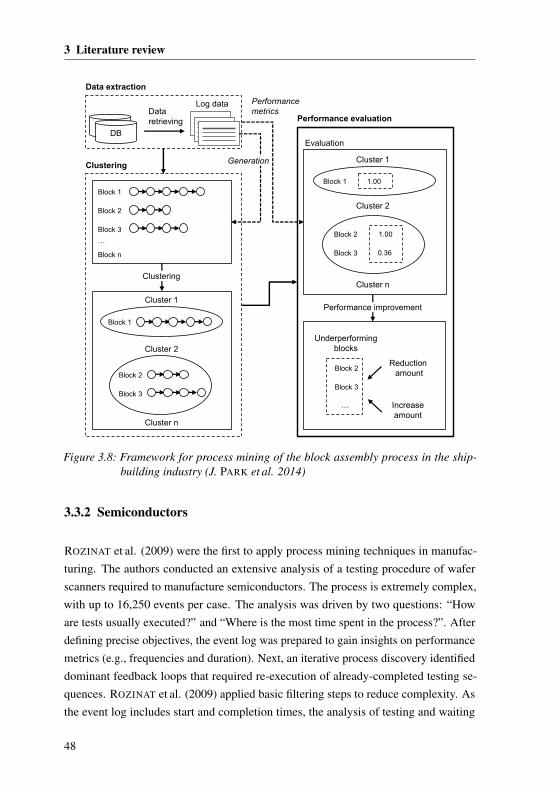
3 Literature review
DBDB
Data retrieving
Log data
Block 1
Block 2
Block 3
…
Block n
Block 1
Block 2
Block 3
Clustering
Clustering
Data extraction
Performance evaluation
Block 1
Block 2
Block 3
1.00
1.00
0.36
Cluster 1
Cluster 2
Cluster 2
Cluster 1
Cluster n
Cluster n
Performance improvement
Evaluation
Block 2
Block 3
…
Underperformingblocks
Reduction amount
Increaseamount
Generation
Performancemetrics
Figure 3.8: Framework for process mining of the block assembly process in the ship-building industry (J. PARK et al. 2014)
3.3.2 Semiconductors
ROZINAT et al. (2009) were the first to apply process mining techniques in manufac-turing. The authors conducted an extensive analysis of a testing procedure of waferscanners required to manufacture semiconductors. The process is extremely complex,with up to 16,250 events per case. The analysis was driven by two questions: “Howare tests usually executed?” and “Where is the most time spent in the process?”. Afterdefining precise objectives, the event log was prepared to gain insights on performancemetrics (e.g., frequencies and duration). Next, an iterative process discovery identifieddominant feedback loops that required re-execution of already-completed testing se-quences. ROZINAT et al. (2009) applied basic filtering steps to reduce complexity. Asthe event log includes start and completion times, the analysis of testing and waiting
48
3.3 Process mining in manufacturing
times identified different patterns for individual activities. ROZINAT et al. (2009) statedthat frequently applying process mining can enable a continuous improvement process.(cf. ROZINAT et al. 2009)
HSIAO et al. (2016) analyzed a chip probing process. However, in contrast to ROZINAT
et al. (2009), the process was structured and comparatively simple (23 activities). HSIAO
et al. (2016) developed a concept to predict the next activities using Naive Bayes models.The total costs were predicted in combination with activity-based costing, and the eventlog was annotated with cost information (cf. HSIAO et al. 2016). Additionally, VIALE
et al. (2011) proposed a concept to align partial sequences of event logs with expertmodels. The authors stated that this concept is beneficial if many process variantsexist. In contrast to conformance checking, the self-defined concept does not provide aquantified alignment. No results on real-world data were presented. (cf. VIALE et al.2011)
In contrast to ROZINAT et al. (2009), HSIAO et al. (2016) and VIALE et al. (2011) didnot analyze the process to identify potential for improvement. Neither process discoverynor conformance checking was applied.
3.3.3 Consumer durables
This section presents applications of process mining, focusing on textiles and householddurables manufacturing processes.
Textiles
SAAD (2018) analyzed a textiles manufacturing process. The author reported that morethan three months were required to extract and preprocess the data. Then, a processdiscovery and a performance analysis of bottlenecks were completed for different pro-cess variants. Although the process is comparatively simple (14 activities), a clusteringtechnique with Markov Chains was applied to identify clusters. Afterward, similaranalysis steps were repeated for selected clusters. However, no details about practicaloutcomes and improvement potentials were provided. (cf. SAAD 2018)
SATITCHAROENMUANG et al. (2018) applied process mining to delayed customerorders in a garment production process. To begin, the authors completed 25 interviewsand recorded the paper-based documentation. The analysis focused on the control-flow
49
3 Literature review
and time perspective and showed that several activities were skipped. The authorsconcluded that the study is aligned with lean production theory as waste of time wasreduced in each step. (cf. SATITCHAROENMUANG et al. 2018)
TU & SONG (2016) developed a method to analyze and predict the costs of a jeansmanufacturing process. They utilized activity-based costing to enhance the costs of anactivity. The work in progress and costs of events were used to predict the remainingtime and total costs. This step was repeated for each trace to calculate statistical costranges. However, in contrast to HSIAO et al. (2016), no probabilities based on Naive
Bayes were included. Critically, the authors did not report on practical implications. (cf.TU & SONG 2016)
Household durables
MUSIC & ROJEC (2012) analyzed a door side panel manufacturing process in a furniturefactory. During the data extraction and preprocessing steps, additional attributes wereintegrated into the event log. An analysis of case frequencies identified that 98% of thecases were similar and simple. Consequently, cases with a long duration were removed.An initial process discovery determined that further classification of sub-groups wasrequired. Suitable groups of products were identified based on an iterative exploration ofadditional attributes. Finally, the process model was extended with the time perspective.MUSIC & ROJEC (2012) reported that differences among product groups were notvisible in the data directly due to the high number of different parts. However, theauthors did not report practical implications or potential for improvements. (cf. MUSIC
& ROJEC 2012)
BETTACCHI et al. (2016) completed a benchmark of five different process discoveryalgorithms in a coffee machine manufacturing process. During the preparation, theevent logs were organized by product specifications (individual coffee machines). BET-TACCHI et al. (2016) identified only a few non-standard traces explained by incorrectmanagement, repair or replacements of defective components, and special customization.(cf. BETTACCHI et al. 2016)
3.3.4 Other industries
Two publications in the automotive industry and further unspecified processes or indus-tries are discussed in this section.
50
3.3 Process mining in manufacturing
Automotive industry
DIŠEK et al. (2017) present a case study focusing on data preprocessing in the automo-tive industry. The authors state that the processes are operated by many informationsystems, and significant effort is required for preprocessing data to apply process min-ing. DIŠEK et al. (2017) selected a transmission manufacturing process and technicallydescribed the data extraction and preprocessing steps. One month of effort was requiredto complete these steps. Notably, no methodological procedure is provided (e.g., datarequirements). (cf. DIŠEK et al. 2017)
In the context of sustainability management, JO et al. (2014) developed a concept forimproving a component manufacturing process. The authors integrated process miningto derive the current state and combined the results with simulation. In the evaluation,process mining was able to detect defective parts related to one specific machine. Nofurther analysis of the process was reported. (cf. JO et al. 2014)
Unspecified processes, industries, or multiple case studies
YANO et al. (2013) developed an approach for data preprocessing and process analysisin the context of complex information systems. They developed a search algorithmto identify relations between database tables. Three patterns were used to identifyexceptional cases: (1) direct repetition of the same activity, (2) going back to previousactivities (loops), and (3) identifying violations of predefined business rules. Then,process discovery was used to investigate the exceptions. The evaluation was conductedon a manufacturing process with more than 70 activities. Interestingly, 60% of the caseswere exceptional and related to a preparation and a testing procedure. Neither the threerules were evaluated nor were practical implications discussed in detail. (cf. YANO et al.2013)
NATSCHLÄGER et al. (2017) developed a methodology to apply process mining inthe manufacturing industry (cf. Figure 3.9). The authors highlighted the role ofmanufacturing experts and the required understanding of the production (e.g., plantvisit). The methodology covers both the control-flow and time perspective. For example,infrequent paths and unexpected endings and absolute duration and standard deviationsare considered. In the evaluation, two case studies on manufacturing processes werecompleted: a production with 21 different processes and 45.8 million events and asimple environment with two processes. Notably, neither the steps of methodology northe results and practical implications were discussed. (cf. NATSCHLÄGER et al. 2017)
51
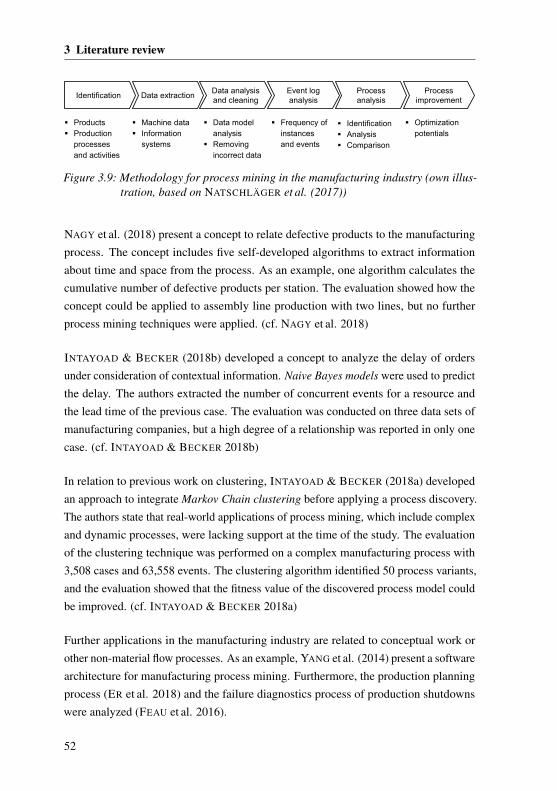
3 Literature review
Identification Data extractionData analysis and cleaning
Event log analysis
Process analysis
Process improvement
� Products� Production
processes and activities
� Machine data� Information
systems
� Data modelanalysis
� Removing incorrect data
� Frequency of instances and events
� Identification� Analysis� Comparison
� Optimization potentials
Figure 3.9: Methodology for process mining in the manufacturing industry (own illus-tration, based on NATSCHLÄGER et al. (2017))
NAGY et al. (2018) present a concept to relate defective products to the manufacturingprocess. The concept includes five self-developed algorithms to extract informationabout time and space from the process. As an example, one algorithm calculates thecumulative number of defective products per station. The evaluation showed how theconcept could be applied to assembly line production with two lines, but no furtherprocess mining techniques were applied. (cf. NAGY et al. 2018)
INTAYOAD & BECKER (2018b) developed a concept to analyze the delay of ordersunder consideration of contextual information. Naive Bayes models were used to predictthe delay. The authors extracted the number of concurrent events for a resource andthe lead time of the previous case. The evaluation was conducted on three data sets ofmanufacturing companies, but a high degree of a relationship was reported in only onecase. (cf. INTAYOAD & BECKER 2018b)
In relation to previous work on clustering, INTAYOAD & BECKER (2018a) developedan approach to integrate Markov Chain clustering before applying a process discovery.The authors state that real-world applications of process mining, which include complexand dynamic processes, were lacking support at the time of the study. The evaluationof the clustering technique was performed on a complex manufacturing process with3,508 cases and 63,558 events. The clustering algorithm identified 50 process variants,and the evaluation showed that the fitness value of the discovered process model couldbe improved. (cf. INTAYOAD & BECKER 2018a)
Further applications in the manufacturing industry are related to conceptual work orother non-material flow processes. As an example, YANG et al. (2014) present a softwarearchitecture for manufacturing process mining. Furthermore, the production planningprocess (ER et al. 2018) and the failure diagnostics process of production shutdownswere analyzed (FEAU et al. 2016).
52
3.3 Process mining in manufacturing
3.3.5 Cross-analysis of the methodological context
Similar to the findings in the methodological context in logistics, the literature reviewon manufacturing reveals further aspects of the methodological context. Again, themain findings are discussed in terms of process types, planning and data extraction, datapreprocessing, process mining techniques and analysis and evaluation.
Process types
Compared to logistics, the manufacturing process types are less structured (and morespaghetti-like) in terms of activities, events, and especially, the number of processvariants. Most publications emphasize that different product and part variants requiredifferent operations or sequences of operations and, consequently, activities. This fact isdriven by the product and process complexity of the production system.
For example, in the shipbuilding industry, ship blocks are manufactured in a workshopproduction. Each of the 250 different blocks has a unique structure and requires differentoperations (J. PARK et al. 2014). In the semiconductor industry, processes are evenmore complex as they are characterized by the repetition of individual activities oreven complete sequences of testing procedures. For example, ROZINAT et al. (2009)report up to 16,250 events per case, and VIALE et al. (2011) state that 1,000 differentmanufacturing processes with more than 50 modifications per week exist.
In contrast, the manufacturing process of coffee machines in the consumer durablesindustry is organized into two sub-assemblies and six assembly lines with five stationseach, and the process includes six activities (BETTACCHI et al. 2016).
Planning and data extraction
Similar to case studies in logistics, case studies in manufacturing provide a reasonableexplanation of the process and objectives. However, analysis questions are less frequentin the manufacturing industry. These studies aim to understand specific characteristics(e.g., lead times) that are not visible due to product and process complexity (e.g., J. PARK
et al. 2014; ROZINAT et al. 2009). In this stage, the identification of manufacturingprocesses and products has required process experts (e.g., NATSCHLÄGER et al. 2017)and has been supported by interviews (e.g., J. PARK et al. 2014).
In contrast, conceptual literature mostly simplifies the tasks of planning and dataextraction. Here, the focus is set on the evaluation of the developed approach and
53
3 Literature review
practical results and implications are rarely discussed. However, some case studies alsoneglect to discuss practical results (e.g., MUSIC & ROJEC 2012).
Typically, Manufacturing Execution Systems (MES) are used for data extraction. Theseinformation systems and the underlying databases are complex; they record massiveamounts of data, and extracting all data is impractical. Furthermore, these systems donot record prepared event logs. (e.g., DIŠEK et al. 2017; J. PARK et al. 2014; YANO
et al. 2013) Based on a valid process understanding and in combination with experts,relevant data can be extracted (e.g., NATSCHLÄGER et al. 2017; J. PARK et al. 2014).Nevertheless, the majority of publications do not report how the data is extracted, and ifthey do, they do not propose ontologies to systematically extract data.
Data preprocessing
The step of data preprocessing to create event logs in the manufacturing industry iscomparatively simple. A few authors reported that cleaning of incorrect or incompletedata was required (e.g., DIŠEK et al. 2017; M. PARK et al. 2015). MEINCHEIM et al.(2017) stated that the cleaning had already been completed by the business analysts.
If reported, the order number was used as the case identifier. A few publications usedan application-specific case identifier such as the ship block (e.g., J. PARK et al. 2014).Usually, no effort was reported for this step and, for instance, JO et al. (2014) stated thatthe MES already provided all the necessary information. Two notable exceptions exist.YANO et al. (2013) developed an algorithm to correlate events across multiple tables ofan ERP system to create a case identifier. DIŠEK et al. (2017) reported that mergingthree information systems into one database took one month of effort.
Consequently, the event logs are simple, and only a few publications proposed additionalattributes. Most publications referred to a complete start and end timestamp as well asthe resources (e.g., machine). In contrast, additional attributes about the product (e.g.,material) or the process (e.g., shift schedule) were rarely integrated (e.g., J. PARK et al.2014). In addition, two approaches used activity-based costing to annotate each activitywith costs (HSIAO et al. 2016; TU & SONG 2016).
Mining: Techniques, concepts, and methodologies
Process discovery and performance analysis are most frequently applied. Aside fromconceptual work, almost every case study applied the process discovery technique. Incombination with the process discovery, the performance analysis has been used to
54
3.3 Process mining in manufacturing
calculate statistics about frequencies (e.g., case frequencies) and time metrics (e.g.,waiting, lead times). To identify relevant performance metrics, M. PARK et al. (2015)carried out an extensive survey with 30 experts and TU & SONG (2016) used thecost-annotated event logs to calculate the costs of each case.
Conformance checking with predefined models is rarely used in the manufacturingindustry (e.g., D. LEE et al. 2013; NATSCHLÄGER et al. 2017). To partially evaluatethe conformance, VIALE et al. (2011) aligned sequences of the event logs with expertmodels and YANO et al. (2013) suggested specifying business rules to identify deviations.However, both approaches have not been evaluated. Additionally, further metrics arederived from pattern extraction. As an example, YANO et al. (2013) proposed rules tocalculate repetitions, loops, and violations of business rules. Other patterns are relatedto defective parts and machines (e.g., NAGY et al. 2018).
Many researchers combine process mining techniques with advanced concepts in themanufacturing industry. Clustering is suitable when many process variants exist (e.g.,MEINCHEIM et al. 2017; J. PARK et al. 2014). The clustering techniques use traceinformation, case attributes (e.g., resource), or contextual information (e.g., concurrentactivities on the same resource) (e.g., INTAYOAD & BECKER 2018b; D. LEE et al. 2013).Furthermore, two approaches aim to predict future states of processes (e.g., times orcosts) (HSIAO et al. 2016; TU & SONG 2016) and JO et al. (2014) combine processmining with simulation.
Analysis and evaluation
The literature review in the manufacturing industry shows differences between thetwo research types. Conceptual literature without practical objectives rarely analyzesprocesses in detail. Typically, clustering is applied at the beginning to derive clustersthat can be analyzed afterward. In contrast, case studies focus on the analysis withsimple techniques. Basic statistics of the processes are often analyzed first to supportthe process understanding (e.g., MUSIC & ROJEC 2012; ROZINAT et al. 2009). Basedon this, further iterative analysis steps, such as filtering, are combined with processdiscovery in the control-flow perspective. In particular, the frequencies of processvariants are used for decision making. However, no explicit recommendations are madeabout removing exceptions (MUSIC & ROJEC 2012) or analyzing exceptions in detailto discover new knowledge (YANO et al. 2013). Other case studies emphasize theimportance of experts for analysis and evaluation (e.g., ROZINAT et al. 2009).
55
3 Literature review
The control-flow and time perspective are dominant in analysis. As conformancechecking has rarely been applied, most deviations have been derived manually usingprocess discovery. For example, ROZINAT et al. (2009) manually identified loops ofrepeating activities and idle times. If applied, conformance checking is used to evaluatethe performance of the clustering technique (D. LEE et al. 2013). For both researchtypes, the time perspective (i.e., waiting times or processing times) has been analyzedmore often (e.g., MEINCHEIM et al. 2017; J. PARK et al. 2014). In the case perspective,derived clusters are mainly used for segmentation. Also, product-related attributes of theevent log are used to manually build groups (MUSIC & ROJEC 2012). Cost informationis rarely analyzed, even though it may exist in the event log (e.g., TU & SONG 2016).An overview of relevant articles is provided in Table 3.2.
3.3.6 Conclusion
The literature review in the manufacturing industry identified a variety of applications fordifferent production systems (e.g., workshop and assembly line production). Complexprocesses with numerous activities and low structures are dominant. Case studies focuson creating a process understanding of different process variants. Usually, simple eventlogs are created using MES, and no significant effort is reported.
However, the complexity of processes and process variants shows that the analysis mustbe structured because no technique provides overarching results. Therefore, both simpleand iterative “trial-and-error” filtering techniques, and advanced concepts of clustering,can be used to derive different clusters. This approach is often combined with processdiscovery and performance analysis. In contrast, conformance checking is only appliedinfrequently. Furthermore, existing domain knowledge about predefined processes ormanufacturing operations is rarely integrated.
Again, the analysis strongly depends on the type of research. Both top-down andin-depth analyses have been conducted. These approaches are non-exclusive: theperformance of the time perspective can be combined with the control-flow of theprocess variants to analyze different clusters in detail. Case studies emphasize theimportance of process understanding and expert knowledge to derive improvementpotentials.
56
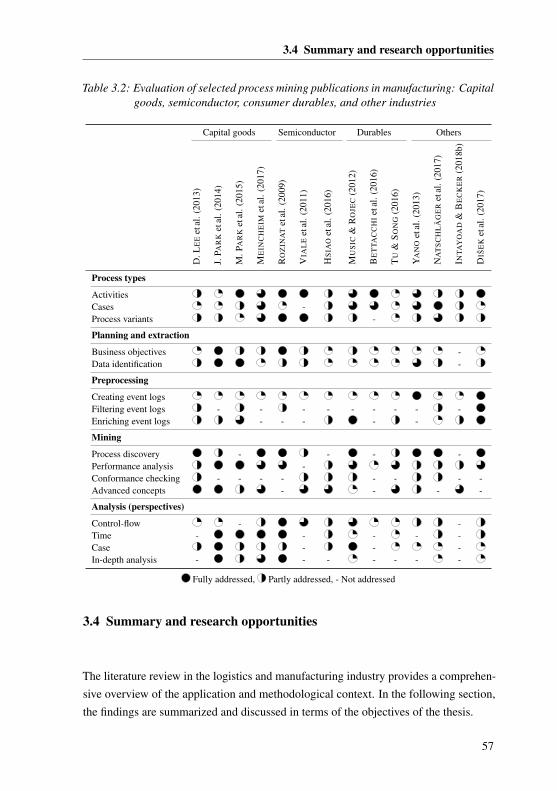
3.4 Summary and research opportunities
Table 3.2: Evaluation of selected process mining publications in manufacturing: Capitalgoods, semiconductor, consumer durables, and other industries
Capital goods Semiconductor Durables Others
D.L
EE
etal
.(20
13)
J.PA
RK
etal
.(20
14)
M.P
AR
Ket
al.(
2015
)
ME
INC
HE
IMet
al.(
2017
)
RO
ZIN
AT
etal
.(20
09)
VIA
LE
etal
.(20
11)
HS
IAO
etal
.(20
16)
MU
SIC
&R
OJE
C(2
012)
BE
TTA
CC
HI
etal
.(20
16)
TU
&S
ON
G(2
016)
YA
NO
etal
.(20
13)
NA
TS
CH
LÄ
GE
Ret
al.(
2017
)
INTA
YO
AD
&B
EC
KE
R(2
018b
)
DIŠ
EK
etal
.(20
17)
Process types
ActivitiesCases -Process variants -
Planning and extraction
Business objectives -Data identification -
Preprocessing
Creating event logsFiltering event logs - - - - - - - - -Enriching event logs - - - - -
Mining
Process discovery - - - -Performance analysis -Conformance checking - - - - - - - -Advanced concepts - - - -
Analysis (perspectives)
Control-flow - -Time - - - - -Case - - -In-depth analysis - - - - - - -
Fully addressed, Partly addressed, - Not addressed
3.4 Summary and research opportunities
The literature review in the logistics and manufacturing industry provides a comprehen-sive overview of the application and methodological context. In the following section,the findings are summarized and discussed in terms of the objectives of the thesis.
57
3 Literature review
Generally speaking, the literature review shows that process mining is capable of creat-ing transparency and supporting the analysis of processes in logistics and manufacturing.Both process mining and value stream mapping reveal the current state of a process andidentify potential for improvement. However, process mining provides support to coverprocess complexity and dynamics. Process mining addresses dynamics by creatingprecise and sound process models of material and information flow activities based onhistorical event data. Furthermore, complex processes with many activities, events, andprocess variants can be successfully discovered and analyzed.
From an application viewpoint, no work in internal logistics in the context of a mixed-model assembly line production exists. The effects of product and process complexityand dynamics are mostly neglected in publications about internal logistics. The follow-ing research opportunities would provide support for the objectives of the thesis and itsresearch questions in the context of internal logistics.
O1. Supporting the planning and data preparation
Theory states that any process mining project starts with planning: defining objectivesand questions and extracting event data from information systems (VAN DER AALST
et al. 2012, p. 177). The literature review shows that this step is often neglected. Only afew publications have defined precise objectives and analysis questions. If reported, thepractical benefit of the objectives and expected outcomes mostly remain unclear.
Notably, even though lean production is the de facto standard, none of the publicationsutilize lean production theory to derive objectives and analysis questions. However,reported objectives and findings are partially aligned with lean production theory (e.g.,reduction of waiting times). Nevertheless, the planning is highly application-specificand relies on the expert’s choice (e.g., selection of the process).
Research opportunity. Supporting the definition of objectives and analysisquestions in a process mining project based on lean production theory.
Process mining theory states that data extraction can be challenging. Therefore, the con-cept of ontology-based data extraction and preprocessing is proposed (cf. Section 2.3.3).The literature review confirms previous findings about complex and heterogeneousinformation systems in manufacturing and, in particular, in logistics. Two conceptsaddress this challenge by using ontologies for data extraction and enrichment. However,no domain ontology for internal logistics has been developed or evaluated.
58
3.4 Summary and research opportunities
The step of data identification and standardization is rarely reported in the articles. Mostpublications focus on the technical perspective (e.g., database tables). The articlesshow that a variety of technical and domain-specific terminology is used. Systematicidentification of relevant objects, object properties, and their relations can be enabledusing ontologies but has not been applied yet.
Research opportunity. Developing a domain ontology for internal logistics tosupport the identification, extraction, and standardization of data.
In the field of process mining, a variety of data imperfection patterns exist (e.g., SURIADI
et al. 2017). However, process mining applications in manufacturing and logistics rarelyfocus on data validation. In contrast, value stream mapping is applied on the shop floor,e.g., by manually recording processes or conducting interviews with workers. Therefore,existing event data must be validated on the shop floor to enable value stream mappingusing process mining.
Research opportunity. Developing a practical guideline for event data validationin internal logistics.
Process mining theory claims that significant effort may be required to correlate eventsbelonging to the same process instance (VAN DER AALST et al. 2012). The literaturereview confirms this fact. Several publications in the field of logistics have reportedsignificant effort to create event logs based on transactional ERP systems. None of thepublications covers product complexity while preprocessing. Additionally, literature inthe field of SCM identified challenges caused by logistics operations that can modifythe state (e.g., a split of a pallet shifts the case identifier). These challenges have not yetbeen solved for internal logistics.
From a lean production perspective, the holistic view of a value stream contains all theactivities from the supplier to the customer, including the supplier, the material flow(e.g., logistics operations), inventories, and customer demand. Furthermore, underlyingresources (e.g., packaging) are also required. However, most publications in processmining do not enrich event logs with these attributes.
Research opportunity. Providing algorithms for creating and enriching eventlogs for internal logistics to enable a holistic value stream perspective.
59
3 Literature review
O2. Mapping the value stream using process mining
Many process mining techniques, algorithms, and concepts exist in the field of processmining theory (cf. Section 2.3). The literature review elucidates that process discoveryand performance analysis are frequently applied in the field of manufacturing andlogistics using existing process discovery algorithms. These algorithms are capableof creating process models that cover process complexity and dynamics. Performanceanalysis is mostly used to calculate frequencies and time measurements. Less frequently,conformance checking is applied to measure the alignment between the planned processmodel and the actual behavior. In addition, a wide range of advanced concepts (e.g.,trace clustering) has been developed.
However, the practical value of deriving process improvements is rarely reported, andexisting domain knowledge is mostly neglected. Again, the product complexity and theholistic perspective of value streams are not covered. In particular, no work has beendone on inventory profiles (e.g., saw tooth diagram) in the field of process mining.
Research opportunity. Combining state-of-the-art process mining techniqueswith logistics domain knowledge to cover product and process complexity anddynamics to provide a holistic view of the value stream.
O3. Supporting the analysis according to lean production theory
The challenge is to exploit event data meaningfully using event logs and process miningtechniques (VAN DER AALST et al. 2012). The literature review confirms this challenge.If objectives and analysis questions are not defined, the analysis of the process tends to beless detailed, lacking an in-depth evaluation from a practical perspective. Subsequently,the practical support for process improvement is missing. Furthermore, as the analysisis not aligned with lean production theory, a systematic identification of waste is lacking.In practice, the analysis depends on the experts’ abilities to align process mining withdomain knowledge.
From a manufacturing perspective, process mining theory is often technical, and thelanguage differs from the manufacturing and logistics domain. Consequently, no supportis provided for (1) when to apply which process mining technique, (2) which practicalsupport (e.g., types of waste) can be created, and (3) which potential issues (e.g., lessonslearned) must be considered.
60
3.4 Summary and research opportunities
The literature review also shows that different process types, objectives, and analysisquestions require different process mining techniques and, subsequently, affect theanalysis. Therefore, an iterative analysis is required rather than a sequential, step-by-step procedure. These challenges are strengthened in the context of product andprocess complexity as well as dynamics. An effective analysis can be impossible when asystem has dozens of individual value streams with their own characteristics. Therefore,different perspectives (e.g., control-flow, time) are required.
Finally, even though process mining theory claims that the practical evaluation andoperational support is a necessary step of process mining, the literature review revealsthat this step is often neglected. Practical outcomes in terms of process improvements orthe existence of practical constraints are rarely integrated or discussed. Both conceptualwork and case studies tend to see process mining as a singular project instead of acontinuous tool. Time-dependent analyses and effects are often neglected, even thoughtheoretical concepts could provide support.
Research opportunity. Providing practical support to systematically analyzevalue streams (e.g., types of waste) using process mining techniques in the contextof product and process complexity and dynamics.
61

4 Conceptual design of the approach
As a first major part of the prescriptive study (cf. Section 1.4), this section compromisesthe conceptual design of the approach. The overarching goal of the thesis is to enable
an effective and efficient application of value stream mapping in internal logistics
using process mining (cf. Section 1.3). Therefore, the research streams of value streammapping and process mining are integrated in terms of (1) requirements (cf. Section 4.1),(2) assumptions (cf. Section 4.2), and (3) concept (cf. Section 4.3). In Section 4.4, themethodology for the industrial application is presented.
4.1 Requirements
Requirements of value stream mapping
R1. Creating a holistic view of the value stream using process mining. The goals ofvalue stream mapping are to observe the flow across the whole value stream andto identify the waste within the process (cf. ROTHER & SHOOK 1999). Whenenabling value stream mapping using process mining, these goals should be seenas an overarching objective. Suitable process mining techniques (e.g., processdiscovery) must be selected and tailored to internal logistics or developed (e.g.,inventory profiling) if required.
R2. Scaling to cover product and process complexity. Today, products contain hun-dreds of parts that follow different paths and processes. In this case, value streammapping can be seriously challenging or can even break down (cf. BRAGLIA
et al. 2006; FORNO et al. 2014). In industry, product and process variety is themost frequently reported challenge (SPATH 2010, p. 68). For internal logistics,each product variant has its own value stream: i.e., customer demands, materialflows, inventories, and suppliers (KNOLL et al. 2019c). Consequently, to providesupport, the approach must scale to cover product and process complexity.
63
4 Conceptual design of the approach
R3. Capturing dynamics. The static paper-and-pencil tool does not capture dynamics.If processes are not stable or frequently change, the current state map providesonly a limited snapshot or is obsolete (cf. FORNO et al. 2014; SPATH 2010). Inparticular, time and quantity data measurements are impractical (FORNO et al.2014, p. 781). Consequently, the approach must capture time-dependent dynamicsand enable continuous recording of value streams.
R4. Reducing manual effort. The time spent collecting the data and constructing thecurrent state map is frequently reported as the costliest stage (cf. FORNO et al.2014; SHOU et al. 2017). The approach must reduce this manual effort by the useof process mining.
Requirements of process mining
R5. Supporting the planning stage according to lean production theory. Processmining theory identified that defining concrete objectives and analysis questionsis important for a successful process mining project (ECK et al. 2015, p. 300).Meanwhile, the literature review reveals that this step is often neglected. There-fore, the approach must support the definition of objectives and analysis questionsaccording to lean production theory.
R6. Providing a domain ontology for internal logistics. In the context of heteroge-neous information systems data extraction can be challenging. To overcome thesechallenges, process mining theory and applications in the field of logistics suggestsupporting the data extraction and preprocessing using a domain ontology. Theconcept must support the data identification, extraction, and standardization ofthe taxonomy using an internal logistics ontology.
R7. Providing algorithms for creating and enriching event logs for internal logistics.Process mining theory claims that many information systems do not record eventlogs explicitly. The literature review confirms this challenge for internal logistics.To mine for value streams using process mining, algorithms for creating eventlogs that can scale to cover the product and process complexity and dynamicsmust be provided. Event logs must be enriched by attributes identified using theontology to enable a holistic view of the value stream.
R8. Supporting the analysis according to lean production theory. The challenge is toexploit event data meaningfully using event logs and process mining techniques.
64
4.2 Assumptions
Therefore, “the diagnostic should be simple, accurate, and suggestive for thenext, more detailed step in the analysis” (GRAVES 1981, p. 664). Process miningmust be linked with lean production to provide practical support. Subsequently,practical guidelines must be developed to systematically analyze value streams(e.g., types of waste) in internal logistics. This requires considering differentperspectives and iterations.
4.2 Assumptions
This section briefly describes the underlying assumptions of the concept. This isessential to set the scope and outline the strengths and existing limitations.
A1. Lean production and lean logistics. It is assumed that the existing production andinternal logistics systems are designed according to lean production principles.In particular, logistics must be operated based on predefined and standardizedlogistics processes (cf. logistics reference process) and activities.
A2. Product and process complexity and dynamics. It is assumed that the approachwill be applied in suitable application scenarios in which existing limitations ofvalue stream mapping are significant. In the case that there is no product andprocess complexity or dynamics in the logistics system, value stream mappingwithout process mining might be more economical.
A3. Data availability. It is assumed that the physical logistics processes are operatedby information systems and that these information systems create event dataduring the operation of logistics. If the process is not operated by informationsystems, the methodology cannot be applied.
A4. Data reliability. It is assumed that the logistics processes and activities createreliable data, that no activities record data infrequently, and that the master data(e.g., supplier specification) is reliable.
A5. Interdisciplinary project team. It is assumed that the required competencies androles are available. According to ECK et al. (2015), members of process miningproject teams should have different backgrounds. Logistics experts (business
experts) and process analysts are frequently required. The logistics management(business owners) and software engineers must be available for specific tasks.
65
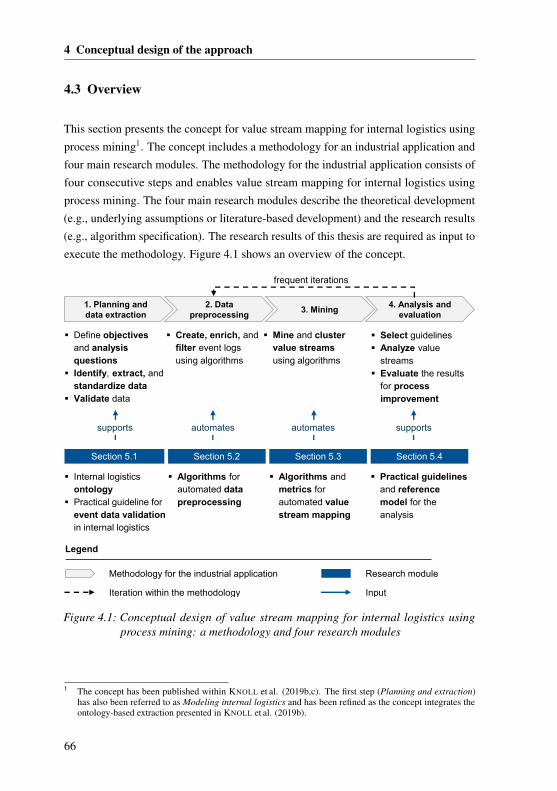
4 Conceptual design of the approach
4.3 Overview
This section presents the concept for value stream mapping for internal logistics usingprocess mining1. The concept includes a methodology for an industrial application andfour main research modules. The methodology for the industrial application consists offour consecutive steps and enables value stream mapping for internal logistics usingprocess mining. The four main research modules describe the theoretical development(e.g., underlying assumptions or literature-based development) and the research results(e.g., algorithm specification). The research results of this thesis are required as input toexecute the methodology. Figure 4.1 shows an overview of the concept.
1. Planning and data extraction
2. Data preprocessing
3. Mining4. Analysis and
evaluation
� Define objectives and analysis questions
� Identify, extract, andstandardize data
� Validate data
� Create, enrich, and filter event logs using algorithms
� Mine and cluster value streams using algorithms
� Select guidelines� Analyze value
streams� Evaluate the results
for process improvement
frequent iterations
Section 5.1 Section 5.2 Section 5.3 Section 5.4
� Internal logistics ontology
� Practical guideline for event data validation in internal logistics
� Algorithms for automated datapreprocessing
� Algorithms and metrics for automated value stream mapping
� Practical guidelines and reference model for the analysis
supports automates automates supports
Legend
Methodology for the industrial application
Iteration within the methodology Input
Research module
Figure 4.1: Conceptual design of value stream mapping for internal logistics usingprocess mining: a methodology and four research modules
1 The concept has been published within KNOLL et al. (2019b,c). The first step (Planning and extraction)has also been referred to as Modeling internal logistics and has been refined as the concept integrates theontology-based extraction presented in KNOLL et al. (2019b).
66
4.3 Overview
Methodology for the industrial application
The methodology for practitioners aligns and integrates the research results to enablevalue stream mapping for internal logistics. Thereby, the methodology adapts PM2,which is a generic process mining methodology that covers the necessary steps of aprocess mining project (cf. Section 2.3.3).
The first step covers planning and data extraction to ensure that objectives and analysisquestions are defined and that data is extracted and validated. These manual tasksare supported by the internal logistics ontology and the practical guideline for eventdata validation. In the second step, the extracted data is processed into enriched eventlogs. Then, in the third step, the enriched event logs are used to mine and cluster valuestreams. The second and third steps are performed automatically for each value streamusing algorithms. An initial understanding of data preprocessing and mining is requiredto implement the algorithms in practice. The fourth step focuses on the analysis andevaluation of the results for process improvement. Further support is provided by thepractical guidelines for the analysis that integrate process mining with lean productiontheory. Iterations are possible during the analysis. In Section 4.4, the methodology andits relationship to each research result are presented.
Main research modules
The four main research modules describe the theoretical development and researchresults.
• Section 5.1 describes the literature-based development of the internal logisticsontology and the practical guideline for event data validation in internal logistics.
• Section 5.2 describes the development of three algorithms used for preprocessingthe raw data into enriched event logs for process mining.
• Section 5.3 describes six process mining techniques used for mining and clus-tering value streams, including the adaption of existing techniques to internallogistics (e.g., multidimensional process mining or process discovery) and thedevelopment of new techniques (e.g., inventory profiling).
• Section 5.4 describes the literature-based development of eight practical guide-lines and the reference model for the analysis, each focusing on the integration ofprocess mining and lean production theory.
67
4 Conceptual design of the approach
4.4 Methodology for the industrial application
4.4.1 Planning and data extraction
The first step of the methodology aims (1) to define objectives and analysis questions,(2) to identify, extract and standardize data, and (3) to validate data. The outcome of thisstep is a set of standardized and validated data that is required for data preprocessing.
Defining objectives and analysis questions
Any process mining project starts with defining objectives and analysis questions.According to ECK et al. (2015, p. 231), “various case studies showed the importanceof defining concrete research questions for a successful process mining project.” Incontrast, Chapter 3 shows that this step is often neglected when applying process miningin the manufacturing and logistics industry. In particular, if no concrete objectives andanalysis questions exist, the practical benefit and impact remain unclear.
The overarching objective can be derived by lean production theory: eliminate wasteand increase efficiency to improve processes (cf. OHNO 1988). In the field of internallogistics, a variety of application-specific objectives can be addressed, for instance, toreduce lead times by eliminating inventory in a block storage. Therefore, the seventypes of waste found in any process (cf. Section 2.1.2) can be used to define objectivesand analysis questions. This task is driven by both the logistics expert and management.The practical benefit must be evaluated for each analysis question. An ideal businesscase scenario can be calculated to support this application-specific step. As an outcome,a set of prioritized analysis questions is defined and documented.
Identifying, extracting, and standardizing the data using the ontology
Data extraction can be challenging in complex and heterogeneous information systems,such as manufacturing and logistics. In practice, numerous information systems withtechnical data models consisting of dozens of data tables, attributes, and relationshipsexist. Domain ontologies can be used to identify, extract, and standardize data forprocess mining (cf. Section 2.3.3). In contrast to technical data requirements, a domainontology provides a shared understanding of relevant classes and object properties(relationships) and data properties (attributes). Consequently, ontologies reduce the timeto extract the required data.
68
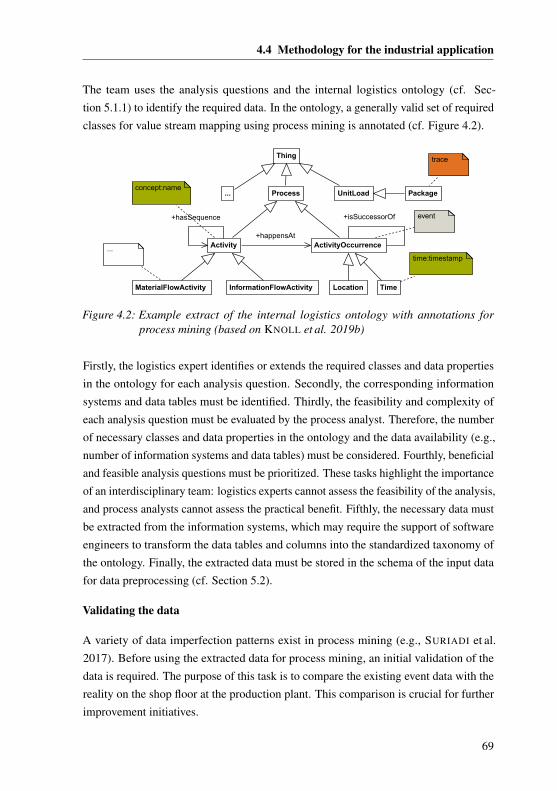
4.4 Methodology for the industrial application
The team uses the analysis questions and the internal logistics ontology (cf. Sec-tion 5.1.1) to identify the required data. In the ontology, a generally valid set of requiredclasses for value stream mapping using process mining is annotated (cf. Figure 4.2).
Process
Activity ActivityOccurrence
TimeLocationMaterialFlowActivity InformationFlowActivity
Thing
+happensAt
+isSuccessorOf+hasSequence
UnitLoad...
time:timestamp
concept:name
trace
event
Package
...
Figure 4.2: Example extract of the internal logistics ontology with annotations forprocess mining (based on KNOLL et al. 2019b)
Firstly, the logistics expert identifies or extends the required classes and data propertiesin the ontology for each analysis question. Secondly, the corresponding informationsystems and data tables must be identified. Thirdly, the feasibility and complexity ofeach analysis question must be evaluated by the process analyst. Therefore, the numberof necessary classes and data properties in the ontology and the data availability (e.g.,number of information systems and data tables) must be considered. Fourthly, beneficialand feasible analysis questions must be prioritized. These tasks highlight the importanceof an interdisciplinary team: logistics experts cannot assess the feasibility of the analysis,and process analysts cannot assess the practical benefit. Fifthly, the necessary data mustbe extracted from the information systems, which may require the support of softwareengineers to transform the data tables and columns into the standardized taxonomy ofthe ontology. Finally, the extracted data must be stored in the schema of the input datafor data preprocessing (cf. Section 5.2).
Validating the data
A variety of data imperfection patterns exist in process mining (e.g., SURIADI et al.2017). Before using the extracted data for process mining, an initial validation of thedata is required. The purpose of this task is to compare the existing event data with thereality on the shop floor at the production plant. This comparison is crucial for furtherimprovement initiatives.
69
4 Conceptual design of the approach
To validate the data on the shop floor, the logistics expert and the process analyst usethe practical guideline for event data validation in internal logistics (cf. Section 5.1.2).During the data validation, the initial understanding of the application will be enhanced.Subsequently, the feasibility of the analysis questions can be re-evaluated. If theextracted data cannot be used to answer the analysis questions, an iterative step back tothe extraction or the definition of objectives and analysis questions is required.
As an outcome, beneficial and feasible analysis questions are selected, and required datais extracted, standardized, and validated. Furthermore, the interdisciplinary team hasgained a shared understanding of internal logistics.
4.4.2 Data preprocessing
The second step of the methodology preprocesses the extracted data into enriched eventlogs. Algorithms are applied (1) to create event logs, (2) to enrich event logs, and (3) tofilter event logs. The outcome of this step is an event log for each part-specific valuestream that is ready to use for mining.
Creating event logs
According to VAN DER AALST et al. (2012, p. 174), “all process mining techniquesassume that it is possible to sequentially record events such that each event refers toan activity (i.e., a well-defined step in some process) and is related to a particular case(i.e., a process instance)”. However, process mining theory states that creating eventlogs is far from trivial, and sometimes significant effort is required (cf. Section 2.3.3).While business processes are controlled by workflow systems, internal logistics doesnot record high-quality event logs explicitly. Instead, to operate internal logistics, aWMS creates transfer orders that integrate the material and information flow to supplyproduction (cf. Section 2.1.3). Each transfer order holds information about the logisticsprocess, including (1) the part (e.g., variant of a part, or sub-assembly and quantity),(2) the location (source and destination), and (3) time of occurrence are recorded. (cf.KNOLL et al. 2019c)
The transfer orders are processed and transformed using a Breadth-First Search (BFS)
algorithm to create the event logs. The algorithm connects individual transfer ordersbelonging to a specific package (e.g., batch number), reflecting the material flow withinthe process from goods receiving through to assembly. The algorithm also covers
70
4.4 Methodology for the industrial application
logistics operations, in particular, the shift from a pallet to packages, and repeats thisprocedure for each package of a part-specific value stream. An event log is created foreach part-specific value stream separately that contains a set of cases (packages). (cf.KNOLL et al. 2019c)
For an industrial application, the software engineer must implement Algorithm 1 (cf.Section 5.2.1) once in a software environment.
Enriching event logs
So far, the event logs contain basic information about cases, activities (e.g., movementsbetween storage locations), and timestamps. However, they do not provide any furtherprocess context, which is needed to correlate specific process and event characteristics(e.g., resources) with a specific behavior (LEONI et al. 2014, p. 252). Using theExtensible Event Stream (XES)2, the de facto standard for event logs, attributes canbe enriched using the extracted data. Using the internal logistics ontology for dataextraction ensures that relevant context information is available and can be enriched.
For an industrial application, the software engineer must implement Algorithm 2 (cf.Section 5.2.2) once in a software environment.
Filtering event logs
Filtering the event log aims to create the correct view and to reduce complexity (ECK
et al. 2015). Filtering removes irrelevant events, cases, or attributes from the event log.Depending on the scope of the analysis, filtering can be done iteratively.
To apply filtering, the team specifies a list of attributes with allowed or forbiddenvalues. This list of key-value pairs 〈δ1,k,v, ...,δn,k,v〉 is used as an input for the algorithm.For example, product components, suppliers, time frames, or personalized attributes(e.g., names) can be filtered. For an industrial application, the software engineer mustimplement Algorithm 3 (cf. Section 5.2.3) once in a software environment.
An outcome of this step is an enriched and filtered event log for each part-specific valuestream (cf. Figure 4.3).
2 In the XES standard, the following nomenclature for data storage is used: trace refers to case identifier,concept:name refers to the activity and time:timestamp refers to the timestamp. For consistency in the thesis,the terms of a case, activity and timestamp are used.
71
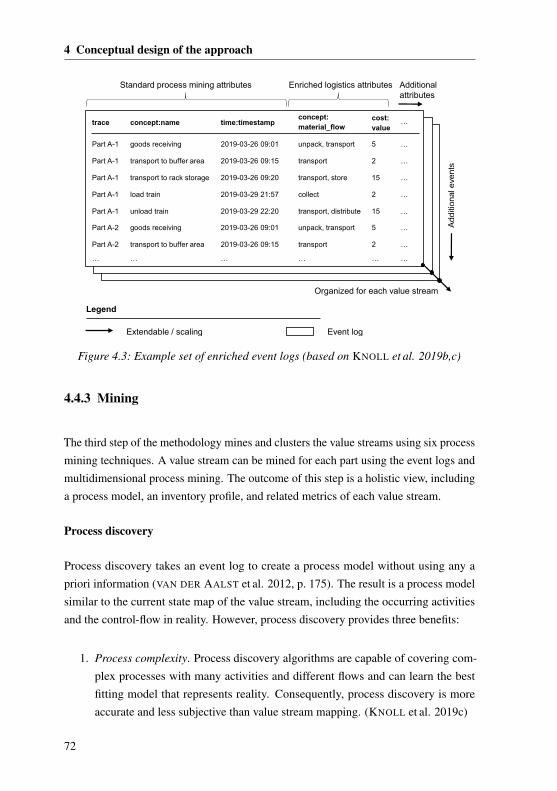
4 Conceptual design of the approach
Legend
Extendable / scaling Event log
Standard process mining attributes Enriched logistics attributes Additional attributes
Add
ition
al e
vent
s
Organized for each value stream
trace concept:name time:timestampcost:value
…concept:material_flow
Part A-1 goods receiving 2019-03-26 09:01 unpack, transport 5 …
Part A-1 transport to buffer area 2019-03-26 09:15 transport 2 …
Part A-1 transport to rack storage 2019-03-26 09:20 transport, store 15 …
Part A-1 load train 2019-03-29 21:57 collect 2 …
Part A-1 unload train 2019-03-29 22:20 transport, distribute 15 …
Part A-2 goods receiving 2019-03-26 09:01 unpack, transport 5 …
Part A-2 transport to buffer area 2019-03-26 09:15 transport 2 …
… … … … … …
Figure 4.3: Example set of enriched event logs (based on KNOLL et al. 2019b,c)
4.4.3 Mining
The third step of the methodology mines and clusters the value streams using six processmining techniques. A value stream can be mined for each part using the event logs andmultidimensional process mining. The outcome of this step is a holistic view, includinga process model, an inventory profile, and related metrics of each value stream.
Process discovery
Process discovery takes an event log to create a process model without using any apriori information (VAN DER AALST et al. 2012, p. 175). The result is a process modelsimilar to the current state map of the value stream, including the occurring activitiesand the control-flow in reality. However, process discovery provides three benefits:
1. Process complexity. Process discovery algorithms are capable of covering com-plex processes with many activities and different flows and can learn the bestfitting model that represents reality. Consequently, process discovery is moreaccurate and less subjective than value stream mapping. (KNOLL et al. 2019c)
72
4.4 Methodology for the industrial application
2. Dynamics. Process discovery algorithms take the event log of a specific timeframe. Therefore, process discovery enables long-term observation and clearlyshows temporal stages (e.g., changes in the process). In contrast, filtering enablesan iterative analysis of specific time frames. (KNOLL et al. 2019c)
3. Manual effort. The process discovery algorithms create the process model auto-matically. Because they only rely on ad hoc filtering of the event log, the manualeffort is significantly lower. (KNOLL et al. 2019c)
Process discovery is the most frequently used process mining technique (cf. Chapter 3),and numerous algorithms exist (cf. Section 2.3.2). This research module covers theselection of suitable process discovery algorithms (cf. Section 5.3.1).
For an industrial application, the software engineer must implement the inductive mineralgorithm (cf. Section 2.3.2) once in a software environment.
Conformance checking
Conformance checking evaluates if reality, as recorded in the event log, conforms tothe model, and vice versa (VAN DER AALST et al. 2012, p. 175). Similar to processdiscovery, conformance checking focuses on the control-flow of the process. The resultis a quantified alignment between the process model and the event log. Deviations ofvalue streams can be measured using reference process models. The algorithm evaluatesall reference process models for each value stream to capture dynamics (e.g., conceptdrifts of processes). This procedure identifies and selects the best fitting process modeland its alignment. (cf. KNOLL et al. 2019c)
For an industrial application, the software engineer must implement Algorithm 4 (cf.Section 5.3.2) once in a software environment.
Activity mapping
Activity mapping evaluates material and information flow activities independently ofreference processes and value streams. Here, both the average and variance waitingand processing times and frequencies of individual events are aggregated statistically.This aggregation enables evaluation of the stability of activities, and value-added andnon-value-added activities can be identified. (cf. KNOLL et al. 2019c)
For an industrial application, the software engineer must implement the Algorithm 5 (cf.Section 5.3.3) once in a software environment.
73
4 Conceptual design of the approach
Inventory profiling
Inventory profiling creates the actual inventory profile of a value stream based on theevent log. Like process discovery, the inventory profile is created without any a prioriinformation. Therefore, the algorithm mines the inventory levels, the demand, and thedeliveries. The inventory profile algorithm can identify both absolute quantities andpackages (inventory on a case level) to cover the product complexity and variety. Withthe resulting inventory profile, the conformance of the actual behavior can be comparedwith the inventory control policy.
For an industrial application, the team must define the time-interval k (e.g., daily level).However, k can be adjusted depending on the analysis questions. The software engineermust implement Algorithm 6 (cf. Section 5.3.4) once in a software environment.
Performance analysis
Performance analysis provides an aggregated view of all value streams by aggregatingthe event log and the results of other process mining techniques statistically. In contrastto process discovery and conformance checking, performance analysis is more domain-specific than a process mining standard. An initial set of metrics can be proposed,but the performance measurement and its metrics always depend on the nature of theproduction system.
• Non-financial efficiency metrics include the lead time, inventory aggregated toaverage, and variance values. The metrics are normalized on the case level ortime level (e.g., demand per day) or provided as absolute numbers.
• Non-financial effectiveness metrics include the conformance checking resultand the non-value-added activities of value streams. Example quality-relatedactivities may be summarized depending on the activity categories. The metricsare presented in absolute numbers and normalized numbers on the case level.
• Financial cost metrics include the activities (e.g., transportation, handling) andthe inventory as the main cost drivers. Activity-based costing and inventorycosting are applied to determine the costs.
For an industrial application, the logistics expert and the process analyst must tailorthe proposed metrics (cf. Section 5.3.5) to the objectives and analysis questions. Thesoftware engineer must implement the metrics once in a software environment.
74
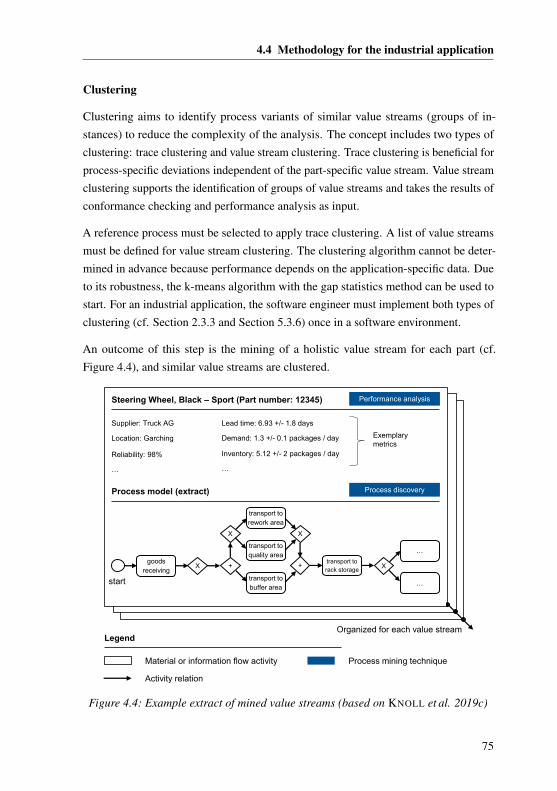
4.4 Methodology for the industrial application
Clustering
Clustering aims to identify process variants of similar value streams (groups of in-stances) to reduce the complexity of the analysis. The concept includes two types ofclustering: trace clustering and value stream clustering. Trace clustering is beneficial forprocess-specific deviations independent of the part-specific value stream. Value streamclustering supports the identification of groups of value streams and takes the results ofconformance checking and performance analysis as input.
A reference process must be selected to apply trace clustering. A list of value streamsmust be defined for value stream clustering. The clustering algorithm cannot be deter-mined in advance because performance depends on the application-specific data. Dueto its robustness, the k-means algorithm with the gap statistics method can be used tostart. For an industrial application, the software engineer must implement both types ofclustering (cf. Section 2.3.3 and Section 5.3.6) once in a software environment.
An outcome of this step is the mining of a holistic value stream for each part (cf.Figure 4.4), and similar value streams are clustered.
Organized for each value streamLegend
Material or information flow activity
Activity relation
Process mining technique
Steering Wheel, Black – Sport (Part number: 12345)
Supplier: Truck AG
Location: Garching
Reliability: 98%
…
Lead time: 6.93 +/- 1.8 days
Demand: 1.3 +/- 0.1 packages / day
Inventory: 5.12 +/- 2 packages / day
…
Process model (extract)
Exemplarymetrics
Performance analysis
Process discovery
goods receiving
start
X +
transport to buffer area
transport to quality area
transport to rework area
transport to rack storage
X X
+ X
…
…
Figure 4.4: Example extract of mined value streams (based on KNOLL et al. 2019c)
75
4 Conceptual design of the approach
4.4.4 Analysis and evaluation
The fourth step focuses on the analysis and evaluation of the results for process improve-ment. This step includes (1) selecting practical guidelines, (2) analyzing value streamsaccording to the guidelines, and (3) evaluating the results for process improvement. Theoutcome of this step is a set of concrete and evaluated improvement ideas.
Selecting practical guidelines for the analysis
Analysis becomes increasingly challenging as product and process complexity anddynamics increase. However, due to the application-specific objectives and analysisquestions, no prescriptive step-by-step analysis is possible3.
To support the analysis, (1) eight practical guidelines and (2) a reference model for theanalysis are presented in Section 5.4. Both focus on the integration of process miningwith lean production theory and the main objective of eliminating waste.
Each practical guideline provides an analysis objective, a link to lean production (e.g.,types of waste), the process mining technique(s), the analysis description, potentialissues and lessons learned, and the relation to other practical guidelines. Because of themodular and iterative character of the analysis, the reference model for the analysis ismodeled as an Activity-based Design Structure Matrix (DSM)4. In the Activity-basedDSM, the relation between the rows and the columns indicates the flow. Accordingto BROWNING (2001), reading down a column reveals input sources, while readingacross a row indicates output sinks. In the reference model for the analysis, the rowsand columns reflect the practical guidelines, and the relation specifies the flow. Forexample, Filtering “reduces the complexity (for the)” process discovery.
The logistics expert and the process analyst simulate the analysis in the reversed directionto select guidelines. If possible, the team selects the type(s) of waste based on theobjectives and analysis questions. Then, the team selects the relevant guideline(s)by reading across the row(s). For each selected guideline, the team scans down thecolumn(s) to identify further relations, then scans the related guideline(s) in the row.
3 Please refer to Section 5.4 for a detailed discussion of this aspect.4 A DSM is a square matrix with identical row and column labels that displays the relations between the ele-
ments. The Activity-based DSM is used to model processes or activity networks based on their dependencies(BROWNING 2001, pp. 292–293).
76
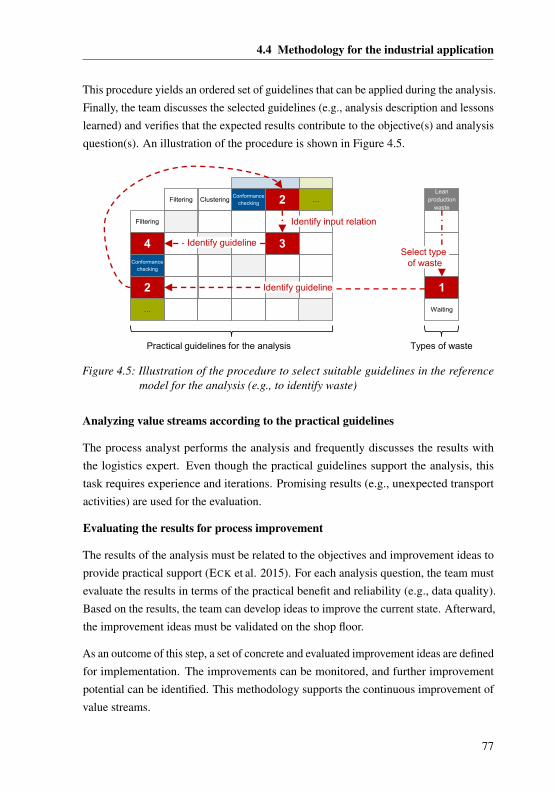
4.4 Methodology for the industrial application
This procedure yields an ordered set of guidelines that can be applied during the analysis.Finally, the team discusses the selected guidelines (e.g., analysis description and lessonslearned) and verifies that the expected results contribute to the objective(s) and analysisquestion(s). An illustration of the procedure is shown in Figure 4.5.
Filtering
Filtering ClusteringConformance
checking 2 …Lean
production waste
4 3Conformance
checking
2 1
… Waiting
Identify guideline
Identify input relation
Identify guideline
Practical guidelines for the analysis Types of waste
Select type of waste
Figure 4.5: Illustration of the procedure to select suitable guidelines in the referencemodel for the analysis (e.g., to identify waste)
Analyzing value streams according to the practical guidelines
The process analyst performs the analysis and frequently discusses the results withthe logistics expert. Even though the practical guidelines support the analysis, thistask requires experience and iterations. Promising results (e.g., unexpected transportactivities) are used for the evaluation.
Evaluating the results for process improvement
The results of the analysis must be related to the objectives and improvement ideas toprovide practical support (ECK et al. 2015). For each analysis question, the team mustevaluate the results in terms of the practical benefit and reliability (e.g., data quality).Based on the results, the team can develop ideas to improve the current state. Afterward,the improvement ideas must be validated on the shop floor.
As an outcome of this step, a set of concrete and evaluated improvement ideas are definedfor implementation. The improvements can be monitored, and further improvementpotential can be identified. This methodology supports the continuous improvement ofvalue streams.
77

5 Detailed design of the approach
5.1 Planning and data extraction
5.1.1 Internal logistics ontology for process mining
This section describes the internal logistics ontology that is used for data extraction.Firstly, the literature-based development of the ontology is described in Section 5.1.1.1.Secondly, an overview of developed ontology is provided in Section 5.1.1.2. Thirdly,the classes are explained in detail (cf. Sections 5.1.1.3 to 5.1.1.7).
5.1.1.1 Literature-based development of the internal logistics ontology
The Ontology Development Guide by NOY & MCGUINNESS (2001) is used (cf. Ap-pendix A.2.1.1) to develop the internal logistics ontology in this thesis.
Step 1: Determining the domain and scope
The objectives of the thesis (cf. Section 1.3) and ontology-based data preprocessing(cf. Section 2.3.3) are matched to determine the domain and scope. The ontologymust create a shared understanding of the process perspective of internal logistics, andrequired concepts of process mining (e.g., case identifier) must be annotated. In addition,related attributes to enrich the event logs (e.g., costs) must be defined. Four competencyquestions are defined to support this step (KNOLL et al. 2019b):
• Which logistics activities are related to the material flow and information flow?
• Which resources and actors are required to fulfill these activities?
• How can the transition of objects be described regarding the time and location?
• Which specifications are required to characterize parts and processes?
79
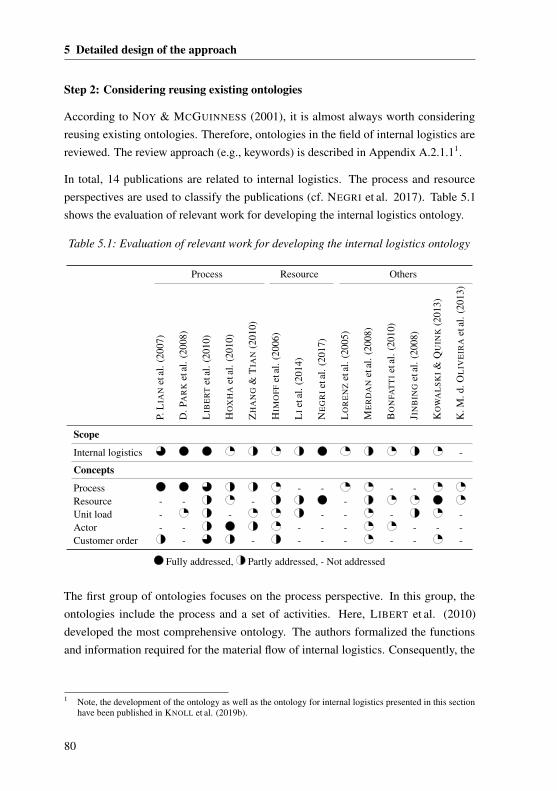
5 Detailed design of the approach
Step 2: Considering reusing existing ontologies
According to NOY & MCGUINNESS (2001), it is almost always worth consideringreusing existing ontologies. Therefore, ontologies in the field of internal logistics arereviewed. The review approach (e.g., keywords) is described in Appendix A.2.1.11.
In total, 14 publications are related to internal logistics. The process and resourceperspectives are used to classify the publications (cf. NEGRI et al. 2017). Table 5.1shows the evaluation of relevant work for developing the internal logistics ontology.
Table 5.1: Evaluation of relevant work for developing the internal logistics ontology
Process Resource Others
P.L
IAN
etal
.(20
07)
D.P
AR
Ket
al.(
2008
)
LIB
ER
Tet
al.(
2010
)
HO
XH
Aet
al.(
2010
)
ZH
AN
G&
TIA
N(2
010)
HIM
OFF
etal
.(20
06)
LI
etal
.(20
14)
NE
GR
Iet
al.(
2017
)
LO
RE
NZ
etal
.(20
05)
ME
RD
AN
etal
.(20
08)
BO
NFA
TT
Iet
al.(
2010
)
JIN
BIN
Get
al.(
2008
)
KO
WA
LS
KI
&Q
UIN
K(2
013)
K.M
.d.O
LIV
EIR
Aet
al.(
2013
)
Scope
Internal logistics -
Concepts
Process - - - -Resource - - - -Unit load - - - - - -Actor - - - - - - - -Customer order - - - - - - - -
Fully addressed, Partly addressed, - Not addressed
The first group of ontologies focuses on the process perspective. In this group, theontologies include the process and a set of activities. Here, LIBERT et al. (2010)developed the most comprehensive ontology. The authors formalized the functionsand information required for the material flow of internal logistics. Consequently, the
1 Note, the development of the ontology as well as the ontology for internal logistics presented in this sectionhave been published in KNOLL et al. (2019b).
80
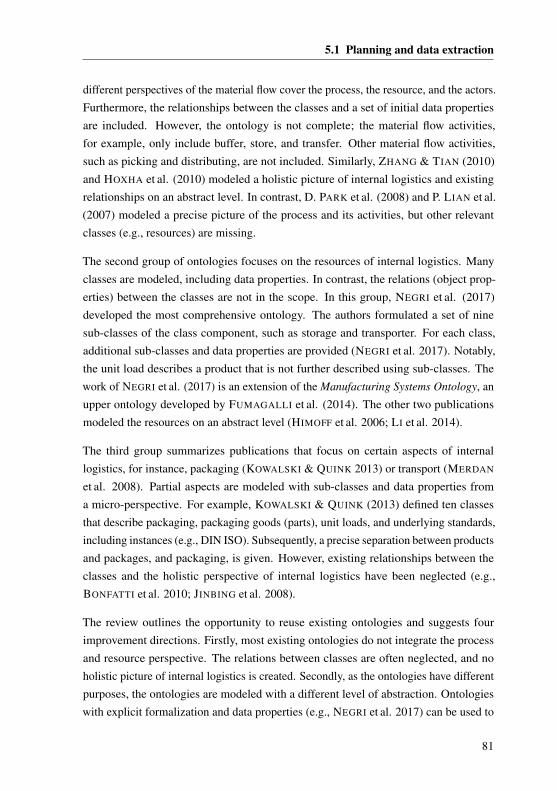
5.1 Planning and data extraction
different perspectives of the material flow cover the process, the resource, and the actors.Furthermore, the relationships between the classes and a set of initial data propertiesare included. However, the ontology is not complete; the material flow activities,for example, only include buffer, store, and transfer. Other material flow activities,such as picking and distributing, are not included. Similarly, ZHANG & TIAN (2010)and HOXHA et al. (2010) modeled a holistic picture of internal logistics and existingrelationships on an abstract level. In contrast, D. PARK et al. (2008) and P. LIAN et al.(2007) modeled a precise picture of the process and its activities, but other relevantclasses (e.g., resources) are missing.
The second group of ontologies focuses on the resources of internal logistics. Manyclasses are modeled, including data properties. In contrast, the relations (object prop-erties) between the classes are not in the scope. In this group, NEGRI et al. (2017)developed the most comprehensive ontology. The authors formulated a set of ninesub-classes of the class component, such as storage and transporter. For each class,additional sub-classes and data properties are provided (NEGRI et al. 2017). Notably,the unit load describes a product that is not further described using sub-classes. Thework of NEGRI et al. (2017) is an extension of the Manufacturing Systems Ontology, anupper ontology developed by FUMAGALLI et al. (2014). The other two publicationsmodeled the resources on an abstract level (HIMOFF et al. 2006; LI et al. 2014).
The third group summarizes publications that focus on certain aspects of internallogistics, for instance, packaging (KOWALSKI & QUINK 2013) or transport (MERDAN
et al. 2008). Partial aspects are modeled with sub-classes and data properties froma micro-perspective. For example, KOWALSKI & QUINK (2013) defined ten classesthat describe packaging, packaging goods (parts), unit loads, and underlying standards,including instances (e.g., DIN ISO). Subsequently, a precise separation between productsand packages, and packaging, is given. However, existing relationships between theclasses and the holistic perspective of internal logistics have been neglected (e.g.,BONFATTI et al. 2010; JINBING et al. 2008).
The review outlines the opportunity to reuse existing ontologies and suggests fourimprovement directions. Firstly, most existing ontologies do not integrate the processand resource perspective. The relations between classes are often neglected, and noholistic picture of internal logistics is created. Secondly, as the ontologies have differentpurposes, the ontologies are modeled with a different level of abstraction. Ontologieswith explicit formalization and data properties (e.g., NEGRI et al. 2017) can be used to
81
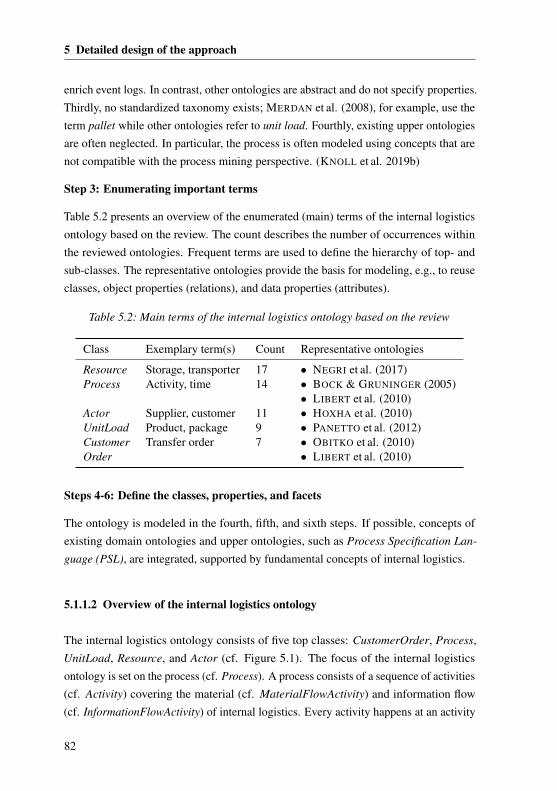
5 Detailed design of the approach
enrich event logs. In contrast, other ontologies are abstract and do not specify properties.Thirdly, no standardized taxonomy exists; MERDAN et al. (2008), for example, use theterm pallet while other ontologies refer to unit load. Fourthly, existing upper ontologiesare often neglected. In particular, the process is often modeled using concepts that arenot compatible with the process mining perspective. (KNOLL et al. 2019b)
Step 3: Enumerating important terms
Table 5.2 presents an overview of the enumerated (main) terms of the internal logisticsontology based on the review. The count describes the number of occurrences withinthe reviewed ontologies. Frequent terms are used to define the hierarchy of top- andsub-classes. The representative ontologies provide the basis for modeling, e.g., to reuseclasses, object properties (relations), and data properties (attributes).
Table 5.2: Main terms of the internal logistics ontology based on the review
Class Exemplary term(s) Count Representative ontologies
Resource Storage, transporter 17 • NEGRI et al. (2017)Process Activity, time 14 • BOCK & GRUNINGER (2005)
• LIBERT et al. (2010)Actor Supplier, customer 11 • HOXHA et al. (2010)UnitLoad Product, package 9 • PANETTO et al. (2012)Customer Transfer order 7 • OBITKO et al. (2010)Order • LIBERT et al. (2010)
Steps 4-6: Define the classes, properties, and facets
The ontology is modeled in the fourth, fifth, and sixth steps. If possible, concepts ofexisting domain ontologies and upper ontologies, such as Process Specification Lan-
guage (PSL), are integrated, supported by fundamental concepts of internal logistics.
5.1.1.2 Overview of the internal logistics ontology
The internal logistics ontology consists of five top classes: CustomerOrder, Process,UnitLoad, Resource, and Actor (cf. Figure 5.1). The focus of the internal logisticsontology is set on the process (cf. Process). A process consists of a sequence of activities(cf. Activity) covering the material (cf. MaterialFlowActivity) and information flow(cf. InformationFlowActivity) of internal logistics. Every activity happens at an activity
82
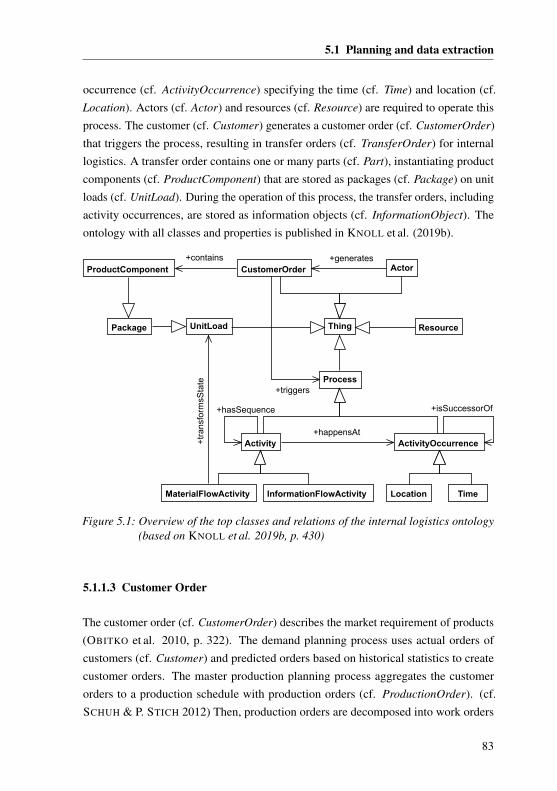
5.1 Planning and data extraction
occurrence (cf. ActivityOccurrence) specifying the time (cf. Time) and location (cf.Location). Actors (cf. Actor) and resources (cf. Resource) are required to operate thisprocess. The customer (cf. Customer) generates a customer order (cf. CustomerOrder)that triggers the process, resulting in transfer orders (cf. TransferOrder) for internallogistics. A transfer order contains one or many parts (cf. Part), instantiating productcomponents (cf. ProductComponent) that are stored as packages (cf. Package) on unitloads (cf. UnitLoad). During the operation of this process, the transfer orders, includingactivity occurrences, are stored as information objects (cf. InformationObject). Theontology with all classes and properties is published in KNOLL et al. (2019b).
Process
ThingUnitLoad
ActorCustomerOrder
Resource
ProductComponent
Package
+contains
ActivityOccurrenceActivity
Location TimeInformationFlowActivityMaterialFlowActivity
+happensAt
+transformsState
+isSuccessorOf+hasSequence
+generates
+triggers
Figure 5.1: Overview of the top classes and relations of the internal logistics ontology(based on KNOLL et al. 2019b, p. 430)
5.1.1.3 Customer Order
The customer order (cf. CustomerOrder) describes the market requirement of products(OBITKO et al. 2010, p. 322). The demand planning process uses actual orders ofcustomers (cf. Customer) and predicted orders based on historical statistics to createcustomer orders. The master production planning process aggregates the customerorders to a production schedule with production orders (cf. ProductionOrder). (cf.SCHUH & P. STICH 2012) Then, production orders are decomposed into work orders
83
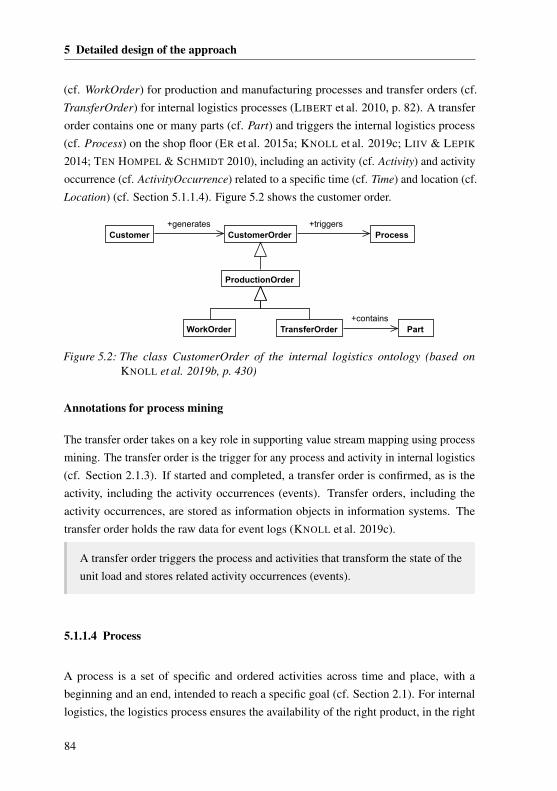
5 Detailed design of the approach
(cf. WorkOrder) for production and manufacturing processes and transfer orders (cf.TransferOrder) for internal logistics processes (LIBERT et al. 2010, p. 82). A transferorder contains one or many parts (cf. Part) and triggers the internal logistics process(cf. Process) on the shop floor (ER et al. 2015a; KNOLL et al. 2019c; LIIV & LEPIK
2014; TEN HOMPEL & SCHMIDT 2010), including an activity (cf. Activity) and activityoccurrence (cf. ActivityOccurrence) related to a specific time (cf. Time) and location (cf.Location) (cf. Section 5.1.1.4). Figure 5.2 shows the customer order.
TransferOrder Part
Process
+contains
+triggersCustomerOrder
ProductionOrder
WorkOrder
Customer+generates
Figure 5.2: The class CustomerOrder of the internal logistics ontology (based onKNOLL et al. 2019b, p. 430)
Annotations for process mining
The transfer order takes on a key role in supporting value stream mapping using processmining. The transfer order is the trigger for any process and activity in internal logistics(cf. Section 2.1.3). If started and completed, a transfer order is confirmed, as is theactivity, including the activity occurrences (events). Transfer orders, including theactivity occurrences, are stored as information objects in information systems. Thetransfer order holds the raw data for event logs (KNOLL et al. 2019c).
A transfer order triggers the process and activities that transform the state of theunit load and stores related activity occurrences (events).
5.1.1.4 Process
A process is a set of specific and ordered activities across time and place, with abeginning and an end, intended to reach a specific goal (cf. Section 2.1). For internallogistics, the logistics process ensures the availability of the right product, in the right
84
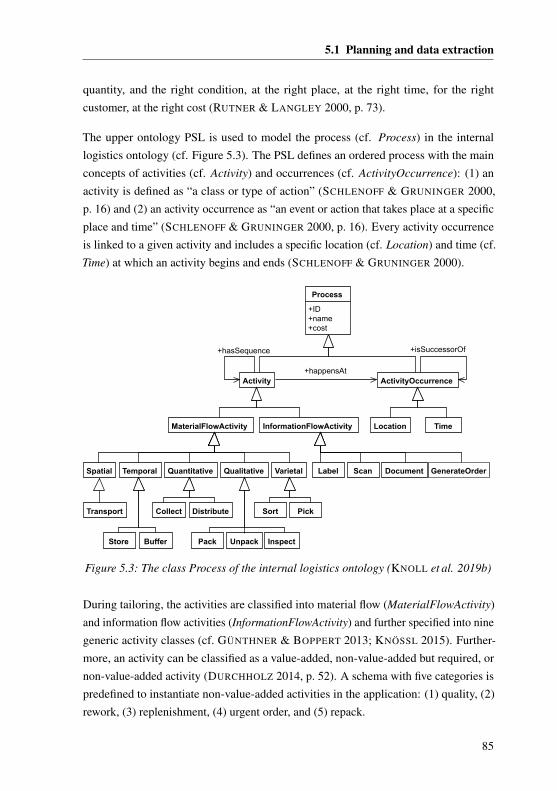
5.1 Planning and data extraction
quantity, and the right condition, at the right place, at the right time, for the rightcustomer, at the right cost (RUTNER & LANGLEY 2000, p. 73).
The upper ontology PSL is used to model the process (cf. Process) in the internallogistics ontology (cf. Figure 5.3). The PSL defines an ordered process with the mainconcepts of activities (cf. Activity) and occurrences (cf. ActivityOccurrence): (1) anactivity is defined as “a class or type of action” (SCHLENOFF & GRUNINGER 2000,p. 16) and (2) an activity occurrence as “an event or action that takes place at a specificplace and time” (SCHLENOFF & GRUNINGER 2000, p. 16). Every activity occurrenceis linked to a given activity and includes a specific location (cf. Location) and time (cf.Time) at which an activity begins and ends (SCHLENOFF & GRUNINGER 2000).
ActivityOccurrenceActivity
Location TimeInformationFlowActivityMaterialFlowActivity
+happensAt
+isSuccessorOf+hasSequence
Label Scan GenerateOrderDocumentSpatial Temporal Quantitative Qualitative Varietal
Transport
Store Buffer
Collect Distribute
Pack Unpack Inspect
Sort Pick
Process
+ID+name+cost
Figure 5.3: The class Process of the internal logistics ontology (KNOLL et al. 2019b)
During tailoring, the activities are classified into material flow (MaterialFlowActivity)and information flow activities (InformationFlowActivity) and further specified into ninegeneric activity classes (cf. GÜNTHNER & BOPPERT 2013; KNÖSSL 2015). Further-more, an activity can be classified as a value-added, non-value-added but required, ornon-value-added activity (DURCHHOLZ 2014, p. 52). A schema with five categories ispredefined to instantiate non-value-added activities in the application: (1) quality, (2)rework, (3) replenishment, (4) urgent order, and (5) repack.
85
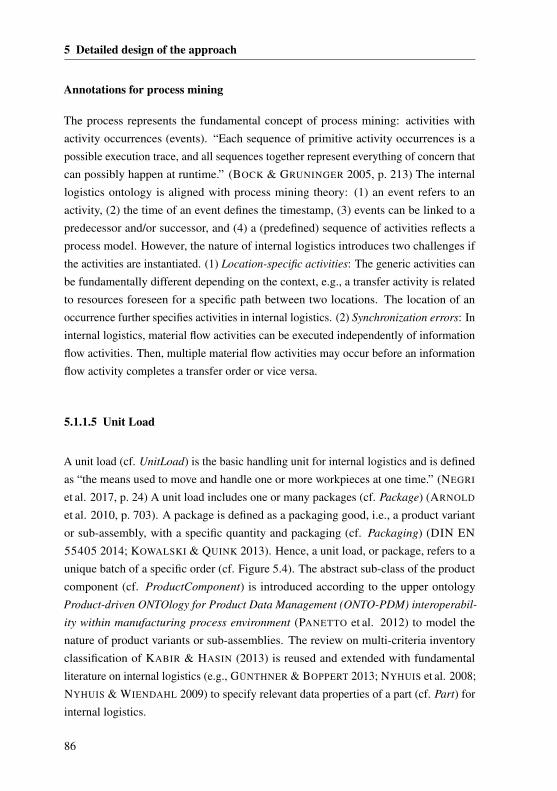
5 Detailed design of the approach
Annotations for process mining
The process represents the fundamental concept of process mining: activities withactivity occurrences (events). “Each sequence of primitive activity occurrences is apossible execution trace, and all sequences together represent everything of concern thatcan possibly happen at runtime.” (BOCK & GRUNINGER 2005, p. 213) The internallogistics ontology is aligned with process mining theory: (1) an event refers to anactivity, (2) the time of an event defines the timestamp, (3) events can be linked to apredecessor and/or successor, and (4) a (predefined) sequence of activities reflects aprocess model. However, the nature of internal logistics introduces two challenges ifthe activities are instantiated. (1) Location-specific activities: The generic activities canbe fundamentally different depending on the context, e.g., a transfer activity is relatedto resources foreseen for a specific path between two locations. The location of anoccurrence further specifies activities in internal logistics. (2) Synchronization errors: Ininternal logistics, material flow activities can be executed independently of informationflow activities. Then, multiple material flow activities may occur before an informationflow activity completes a transfer order or vice versa.
5.1.1.5 Unit Load
A unit load (cf. UnitLoad) is the basic handling unit for internal logistics and is definedas “the means used to move and handle one or more workpieces at one time.” (NEGRI
et al. 2017, p. 24) A unit load includes one or many packages (cf. Package) (ARNOLD
et al. 2010, p. 703). A package is defined as a packaging good, i.e., a product variantor sub-assembly, with a specific quantity and packaging (cf. Packaging) (DIN EN55405 2014; KOWALSKI & QUINK 2013). Hence, a unit load, or package, refers to aunique batch of a specific order (cf. Figure 5.4). The abstract sub-class of the productcomponent (cf. ProductComponent) is introduced according to the upper ontologyProduct-driven ONTOlogy for Product Data Management (ONTO-PDM) interoperabil-
ity within manufacturing process environment (PANETTO et al. 2012) to model thenature of product variants or sub-assemblies. The review on multi-criteria inventoryclassification of KABIR & HASIN (2013) is reused and extended with fundamentalliterature on internal logistics (e.g., GÜNTHNER & BOPPERT 2013; NYHUIS et al. 2008;NYHUIS & WIENDAHL 2009) to specify relevant data properties of a part (cf. Part) forinternal logistics.
86
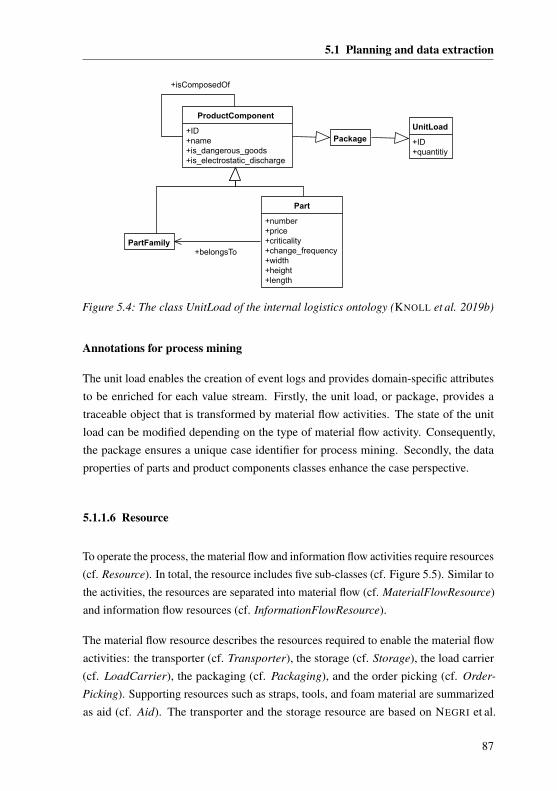
5.1 Planning and data extraction
UnitLoad
+ID+quantitiy
Package
Part
+number+price+criticality+change_frequency+width+height+length
PartFamily
ProductComponent
+ID+name+is_dangerous_goods+is_electrostatic_discharge
+isComposedOf
+belongsTo
Figure 5.4: The class UnitLoad of the internal logistics ontology (KNOLL et al. 2019b)
Annotations for process mining
The unit load enables the creation of event logs and provides domain-specific attributesto be enriched for each value stream. Firstly, the unit load, or package, provides atraceable object that is transformed by material flow activities. The state of the unitload can be modified depending on the type of material flow activity. Consequently,the package ensures a unique case identifier for process mining. Secondly, the dataproperties of parts and product components classes enhance the case perspective.
5.1.1.6 Resource
To operate the process, the material flow and information flow activities require resources(cf. Resource). In total, the resource includes five sub-classes (cf. Figure 5.5). Similar tothe activities, the resources are separated into material flow (cf. MaterialFlowResource)and information flow resources (cf. InformationFlowResource).
The material flow resource describes the resources required to enable the material flowactivities: the transporter (cf. Transporter), the storage (cf. Storage), the load carrier(cf. LoadCarrier), the packaging (cf. Packaging), and the order picking (cf. Order-
Picking). Supporting resources such as straps, tools, and foam material are summarizedas aid (cf. Aid). The transporter and the storage resource are based on NEGRI et al.
87
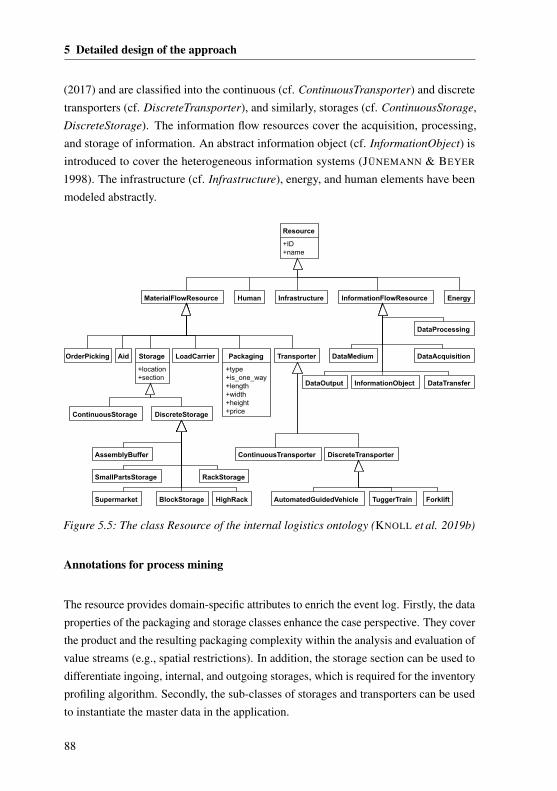
5 Detailed design of the approach
(2017) and are classified into the continuous (cf. ContinuousTransporter) and discretetransporters (cf. DiscreteTransporter), and similarly, storages (cf. ContinuousStorage,DiscreteStorage). The information flow resources cover the acquisition, processing,and storage of information. An abstract information object (cf. InformationObject) isintroduced to cover the heterogeneous information systems (JÜNEMANN & BEYER
1998). The infrastructure (cf. Infrastructure), energy, and human elements have beenmodeled abstractly.
Resource
+ID+name
MaterialFlowResource InformationFlowResource
TransporterStorage
+location+section
OrderPicking LoadCarrier Packaging
+type+is_one_way+length+width+height+price
Aid
HighRack
ContinuousStorage DiscreteStorage
BlockStorage
SmallPartsStorage RackStorage
Supermarket
AssemblyBuffer ContinuousTransporter DiscreteTransporter
TuggerTrain ForkliftAutomatedGuidedVehicle
DataMedium
Human Infrastructure Energy
DataAcquisition
DataOutput DataTransferInformationObject
DataProcessing
Figure 5.5: The class Resource of the internal logistics ontology (KNOLL et al. 2019b)
Annotations for process mining
The resource provides domain-specific attributes to enrich the event log. Firstly, the dataproperties of the packaging and storage classes enhance the case perspective. They coverthe product and the resulting packaging complexity within the analysis and evaluation ofvalue streams (e.g., spatial restrictions). In addition, the storage section can be used todifferentiate ingoing, internal, and outgoing storages, which is required for the inventoryprofiling algorithm. Secondly, the sub-classes of storages and transporters can be usedto instantiate the master data in the application.
88
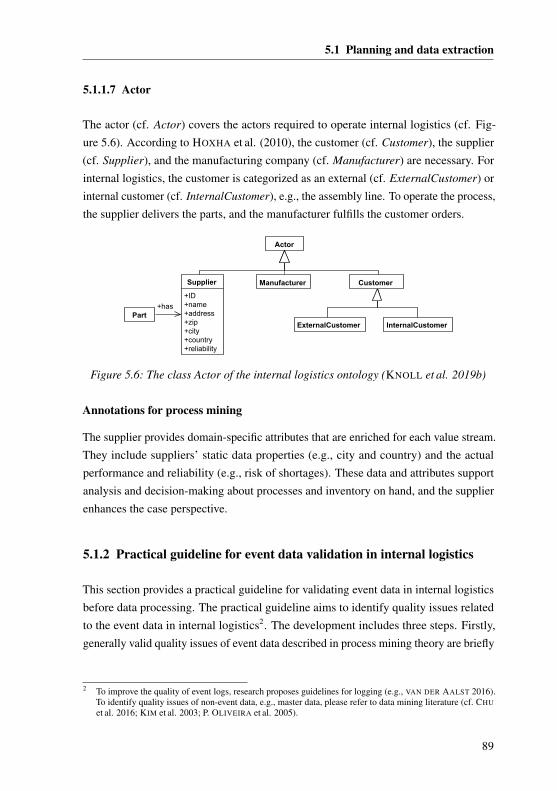
5.1 Planning and data extraction
5.1.1.7 Actor
The actor (cf. Actor) covers the actors required to operate internal logistics (cf. Fig-ure 5.6). According to HOXHA et al. (2010), the customer (cf. Customer), the supplier(cf. Supplier), and the manufacturing company (cf. Manufacturer) are necessary. Forinternal logistics, the customer is categorized as an external (cf. ExternalCustomer) orinternal customer (cf. InternalCustomer), e.g., the assembly line. To operate the process,the supplier delivers the parts, and the manufacturer fulfills the customer orders.
ExternalCustomer
Actor
InternalCustomer
Supplier
+ID+name+address+zip+city+country+reliability
CustomerManufacturer
Part+has
Figure 5.6: The class Actor of the internal logistics ontology (KNOLL et al. 2019b)
Annotations for process mining
The supplier provides domain-specific attributes that are enriched for each value stream.They include suppliers’ static data properties (e.g., city and country) and the actualperformance and reliability (e.g., risk of shortages). These data and attributes supportanalysis and decision-making about processes and inventory on hand, and the supplierenhances the case perspective.
5.1.2 Practical guideline for event data validation in internal logistics
This section provides a practical guideline for validating event data in internal logisticsbefore data processing. The practical guideline aims to identify quality issues relatedto the event data in internal logistics2. The development includes three steps. Firstly,generally valid quality issues of event data described in process mining theory are briefly
2 To improve the quality of event logs, research proposes guidelines for logging (e.g., VAN DER AALST 2016).To identify quality issues of non-event data, e.g., master data, please refer to data mining literature (cf. CHUet al. 2016; KIM et al. 2003; P. OLIVEIRA et al. 2005).
89
5 Detailed design of the approach
presented. Secondly, domain-specific data quality issues within internal logistics (e.g.,case studies) are evaluated. Thirdly, the practical guideline is formulated.
Related work on quality issues of event data
According to VAN DER AALST et al. (2012, p. 179), the resulting quality of processmining depends on the quality of the input event data. Therefore, the authors definefour criteria to judge the quality of event logs: trustworthy, complete, semantics, andsafe. Then, VAN DER AALST et al. (2012) derive five maturity levels of event logs anddiscuss them with practical examples (e.g., types of information systems).
In contrast to these five rough maturity levels, BOSE et al. (2013) provide a comprehen-sive quality classification framework for event logs. The authors define four categoriesto assess the quality of the event log: missing data, incorrect data, imprecise data, andirrelevant data. In combination with process characteristics, BOSE et al. (2013) derive27 classes of quality issues. Timestamps, for instance, can be missing completely or beincorrect (e.g., the difference between the event in reality and the documentation in theinformation system). Many authors use this framework to assess the quality of eventlogs in process mining in different domains, such as healthcare (e.g., ALHARBI et al.2017; ALVAREZ et al. 2018; ROJAS et al. 2017).
In between the range of five maturity levels and 27 precise classes of quality issues,a variety of research on the quality of event logs exist (cf. review of SURIADI et al.2017). Even though an overlap between quality issues and dimensions of event logsexist, less attention is spent on the raw event data extracted from information systems.To address this issue, SURIADI et al. (2017) adapted the work of BOSE et al. (2013)to develop 11 data imperfection patterns that have been evaluated in a user study with15 researchers and five practitioners. Recent work focuses on initial approaches forautomatically detecting imperfection patterns using algorithms (e.g., ANDREWS et al.2018).
Evaluation of quality issues of event data in internal logistics
The domain-specific quality issues of event data within internal logistics are derivedfrom the 11 data imperfection patterns (SURIADI et al. 2017). The characteristics oftransfer orders (cf. Section 5.1.1.3) and the findings of the case studies are discussedand evaluated for each data imperfection pattern (cf. Chapter 3).
90
5.1 Planning and data extraction
1. Form-based Event Capture. This pattern states that single events overwriteall data associated with an updated timestamp (SURIADI et al. 2017, p. 140).In internal logistics, a transfer order contains one or many parts that triggerindividual activities. For example, depending on the resources, parts can bedelivered separately (e.g., tugger train) or as a whole unit load (e.g., forklift).Therefore, this pattern must be checked in the application.
2. Scattered Event. Scattered events describe additional events (e.g., different lifecycles) that can be extracted from the event data (SURIADI et al. 2017, p. 140).This pattern received the second-highest importance rating in the user study ofSURIADI et al. (2017). In internal logistics, a transfer order includes a start and acompletion timestamp. Thus, two different events can be derived. The majorityof case studies report two timestamps. However, exceptions, including only onetimestamp, exist (e.g., ER et al. 2015b). This pattern must be integrated into thedata preprocessing and checked in the application.
3. Elusive Case. Elusive cases occur if events are not explicitly linked to theirrespective case identifiers (SURIADI et al. 2017, p. 140). SURIADI et al. (2017)showed that this pattern received the highest importance rating of all patterns. Ininternal logistics, transfer orders do not include a case identifier. Therefore, thecase identifier must be constructed during data preprocessing.
4. Scattered Case. A scattered case includes missing activities that can be retrievedfrom different information systems (SURIADI et al. 2017, p. 141). The literaturereview highlighted heterogeneous information systems in logistics (cf. Chapter 3).This imperfection pattern can occur in the application depending on the materialand information flow of the physical logistics process. Internal logistics offers anadditional challenge because material flow activities can be executed without anyinformation flow. None of the case studies reported this pattern explicitly.
5. Collateral Events. Here, multiple events refer to one particular process step, e.g.,trivial low-level activities that do not contribute much to the analysis (SURIADI
et al. 2017, p. 142). For internal logistics, again, this pattern can occur dependingon the material and information flow and the related resources. An automatedconveyor line, for example, might trigger multiple events for controlling andmonitoring the equipment. This situation implies that the number of activitiesand events does not necessarily correlate with the physical process or effort.
91
5 Detailed design of the approach
6. Synonymous Labels. This pattern refers to labels that are syntactically differentbut semantically similar, e.g., the same real-world activity with different labels(SURIADI et al. 2017, p. 144). The case studies in internal logistics did notidentify this pattern explicitly (cf. Chapter 3). However, this pattern occursfrequently if multiple information systems are merged (SURIADI et al. 2017,p. 144). In that case, the pattern must be checked within the application.
7. Homonymous Labels. Here, an activity is repeated multiple times, and the in-terpretation of the activity differs across the occurrences (SURIADI et al. 2017,p. 144). For internal logistics, this pattern has not been reported as the standard-ized activities refer to the (same) material flow activity. However, the processcomplexity (process types) identified in the literature review is comparativelylow (cf. Chapter 3). The activity occurrence (event) must be enriched with thelocation to address process complexity (cf. Section 5.1.1.4).
8. Polluted Label. A polluted label refers to activities that are structurally the samebut tailored to the event, for example, by appending event-specific informationto the label (SURIADI et al. 2017, p. 143). For internal logistics, the literaturereview identified standardized activities that are predefined in the informationsystem. However, this pattern can occur in the application.
9. Unanchored Event. An unanchored event refers to different formats of values thatare not compatible with each other (SURIADI et al. 2017, p. 139). Many cleaningsteps during the data preprocessing have been reported to address these issues ininternal logistics. However, the prevalence of this pattern heavily depends on theapplication scenario, e.g., if multiple information systems must be merged.
10. Inadvertent Time Travel Description. Here, the events are recorded with anerroneous timestamp that is caused by manual data entry failures (SURIADI et al.2017, p. 138). For internal logistics, this pattern is not relevant as the transferorders are created using an information system (e.g., WMS or ERP). Furthermore,no case study has reported on this specific pattern (cf. Chapter 3).
11. Distorted Label. This pattern refers to labels that have strong similarities but donot exactly match, caused by manual data entry failures, for instance (SURIADI
et al. 2017, p. 143). For internal logistics, this pattern is not relevant as the eventdata is created using transfer orders.
92
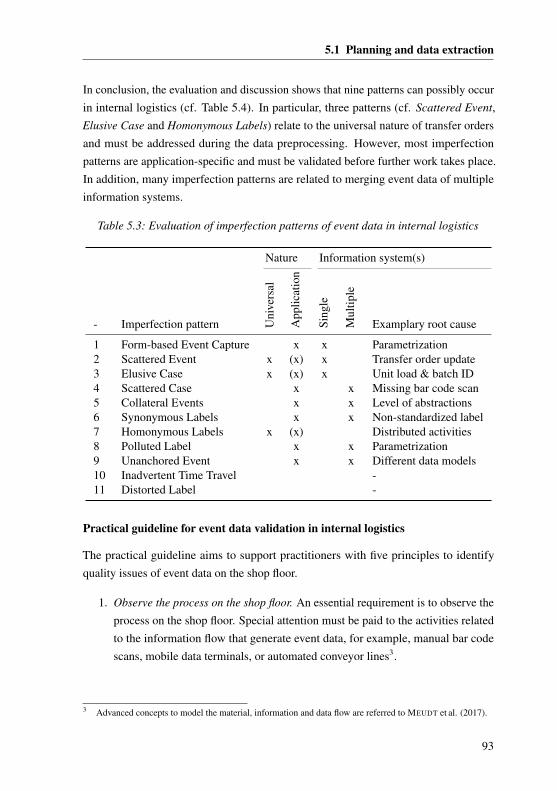
5.1 Planning and data extraction
In conclusion, the evaluation and discussion shows that nine patterns can possibly occurin internal logistics (cf. Table 5.4). In particular, three patterns (cf. Scattered Event,Elusive Case and Homonymous Labels) relate to the universal nature of transfer ordersand must be addressed during the data preprocessing. However, most imperfectionpatterns are application-specific and must be validated before further work takes place.In addition, many imperfection patterns are related to merging event data of multipleinformation systems.
Table 5.3: Evaluation of imperfection patterns of event data in internal logistics
Nature Information system(s)
- Imperfection pattern Uni
vers
al
App
licat
ion
Sing
le
Mul
tiple
Examplary root cause
1 Form-based Event Capture x x Parametrization2 Scattered Event x (x) x Transfer order update3 Elusive Case x (x) x Unit load & batch ID4 Scattered Case x x Missing bar code scan5 Collateral Events x x Level of abstractions6 Synonymous Labels x x Non-standardized label7 Homonymous Labels x (x) Distributed activities8 Polluted Label x x Parametrization9 Unanchored Event x x Different data models10 Inadvertent Time Travel -11 Distorted Label -
Practical guideline for event data validation in internal logistics
The practical guideline aims to support practitioners with five principles to identifyquality issues of event data on the shop floor.
1. Observe the process on the shop floor. An essential requirement is to observe theprocess on the shop floor. Special attention must be paid to the activities relatedto the information flow that generate event data, for example, manual bar codescans, mobile data terminals, or automated conveyor lines3.
3 Advanced concepts to model the material, information and data flow are referred to MEUDT et al. (2017).
93
5 Detailed design of the approach
2. Record your own data for each process. Along with observation, sample datamust be recorded for each reference process and activity. For instance, theactual processing times of activities can be compared to the measured durationof activities. If the effort is too high, the main processes and activities (e.g.,frequencies) must be prioritized.
3. Talk to people who execute the process every day. Interviews with workers onthe shop floor are required to validate the data quality and potential weaknessesof the processes. In particular, the validation requires understanding when thedata is generated in the process. For example, is the bar code confirmation scanexecuted at every step or only at the end of each shift?
4. Compare the findings with existing documentation. Findings made on the shopfloor must be compared to the existing documentation. The existing documenta-tion of internal logistics, i.e., reference processes and activities, and informationtechnology, i.e., underlying information systems and data models, must be ana-lyzed. The latter is very important as multiple imperfection patterns are caused bythe heterogeneity of information systems. For each deviation, further interviewsare required to derive the root causes and to understand the actual behavior.
5. Compare the findings with the event data. Finally, the findings made and recordedon the shop floor must be compared with the extracted event data. Here, the ninerelevant imperfection patterns must be checked based on the findings.
94
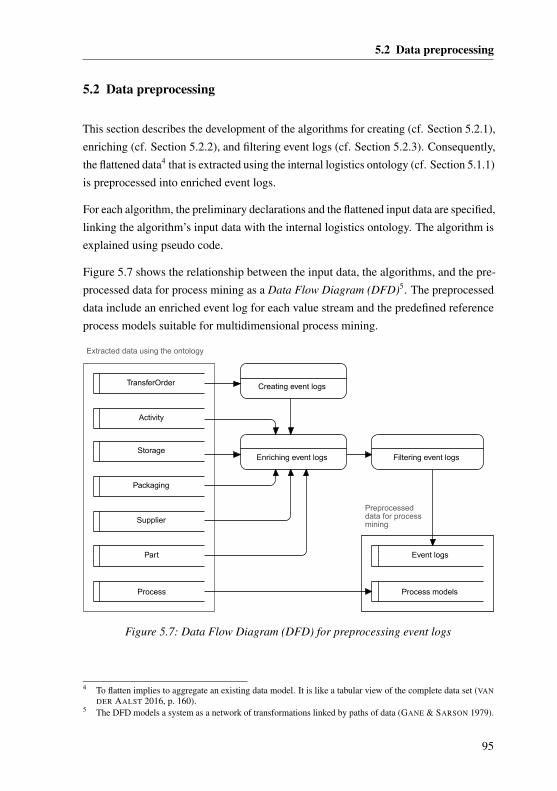
5.2 Data preprocessing
5.2 Data preprocessing
This section describes the development of the algorithms for creating (cf. Section 5.2.1),enriching (cf. Section 5.2.2), and filtering event logs (cf. Section 5.2.3). Consequently,the flattened data4 that is extracted using the internal logistics ontology (cf. Section 5.1.1)is preprocessed into enriched event logs.
For each algorithm, the preliminary declarations and the flattened input data are specified,linking the algorithm’s input data with the internal logistics ontology. The algorithm isexplained using pseudo code.
Figure 5.7 shows the relationship between the input data, the algorithms, and the pre-processed data for process mining as a Data Flow Diagram (DFD)5. The preprocesseddata include an enriched event log for each value stream and the predefined referenceprocess models suitable for multidimensional process mining.
TransferOrder
Activity
Creating event logs
Enriching event logs Filtering event logsStorage
Event logsPart
Packaging
Supplier
Extracted data using the ontology
Process Process models
Preprocesseddata for processmining
Figure 5.7: Data Flow Diagram (DFD) for preprocessing event logs
4 To flatten implies to aggregate an existing data model. It is like a tabular view of the complete data set (VANDER AALST 2016, p. 160).
5 The DFD models a system as a network of transformations linked by paths of data (GANE & SARSON 1979).
95
5 Detailed design of the approach
5.2.1 Creating event logs
Enabling process mining requires event logs with a case identifier, an activity, and atimestamp (cf. Section 2.3.2). In contrast, internal logistics does not record an event logexplicitly; hence, the event log must be created (cf. KNOLL et al. 2019c).
Preliminary declarations
In internal logistics, the unit load consists of one or many packages that reflect thematerial flow from goods receipt through to assembly. The unit load provides the basisfor the case identifier in internal logistics. Due to the nature of internal logistics, avariety of material flow activities exist. These activities can change the state of theunit load, potentially affecting the composition of the unit load (cf. Section 5.1.1.2).Consequently, the package is used as the traceable object to correlate the event log. Anevent log is provided for each value stream to adapt multidimensional process miningfor internal logistics. (cf. KNOLL et al. 2019c)
Definition. Let the case identifier of the event log L be the smallest unit load of asingle package for one part (KNOLL et al. 2019c, p. 134).
A transfer order triggers the process and activities that transform the state of the unitload and stores related activity occurrences (events). Both a defined start and completionexist, each with a specific time and location. Consequently, an activity is a class or typeof action triggering a collection of material and information flow activities between aspecified source and destination location (cf. Section 5.1.1.4).
Definition. Let the activity of the event log L be the transformation of a unitload triggering a collection of material and information flow activities between aspecified source and destination location (based on KNOLL et al. 2019c).
The time of the activity occurrence (events) is used to specify the timestamp for processmining (cf. Section 5.1.1.4). As every transfer order stores the activity occurrences, boththe start and end timestamp can be mapped to the standard transactional life-cycle modelof process mining: start and complete. Further activity occurrences can be extracted ifthey are available, e.g., the schedule event. (VAN DER AALST 2016, p. 131)
Definition. Let the timestamp of the event log L be the specific timestamp thatthe event takes place (based on KNOLL et al. 2019c).
96
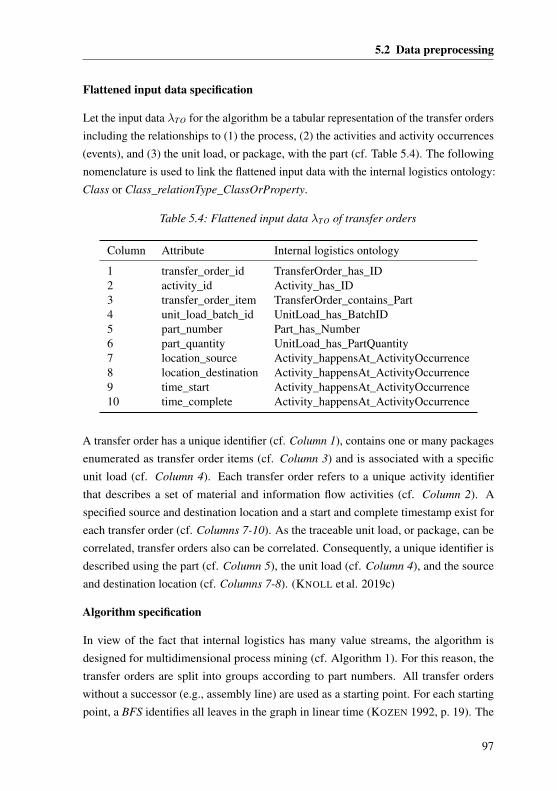
5.2 Data preprocessing
Flattened input data specification
Let the input data λTO for the algorithm be a tabular representation of the transfer ordersincluding the relationships to (1) the process, (2) the activities and activity occurrences(events), and (3) the unit load, or package, with the part (cf. Table 5.4). The followingnomenclature is used to link the flattened input data with the internal logistics ontology:Class or Class_relationType_ClassOrProperty.
Table 5.4: Flattened input data λTO of transfer orders
Column Attribute Internal logistics ontology
1 transfer_order_id TransferOrder_has_ID2 activity_id Activity_has_ID3 transfer_order_item TransferOrder_contains_Part4 unit_load_batch_id UnitLoad_has_BatchID5 part_number Part_has_Number6 part_quantity UnitLoad_has_PartQuantity7 location_source Activity_happensAt_ActivityOccurrence8 location_destination Activity_happensAt_ActivityOccurrence9 time_start Activity_happensAt_ActivityOccurrence10 time_complete Activity_happensAt_ActivityOccurrence
A transfer order has a unique identifier (cf. Column 1), contains one or many packagesenumerated as transfer order items (cf. Column 3) and is associated with a specificunit load (cf. Column 4). Each transfer order refers to a unique activity identifierthat describes a set of material and information flow activities (cf. Column 2). Aspecified source and destination location and a start and complete timestamp exist foreach transfer order (cf. Columns 7-10). As the traceable unit load, or package, can becorrelated, transfer orders also can be correlated. Consequently, a unique identifier isdescribed using the part (cf. Column 5), the unit load (cf. Column 4), and the sourceand destination location (cf. Columns 7-8). (KNOLL et al. 2019c)
Algorithm specification
In view of the fact that internal logistics has many value streams, the algorithm isdesigned for multidimensional process mining (cf. Algorithm 1). For this reason, thetransfer orders are split into groups according to part numbers. All transfer orderswithout a successor (e.g., assembly line) are used as a starting point. For each startingpoint, a BFS identifies all leaves in the graph in linear time (KOZEN 1992, p. 19). The
97
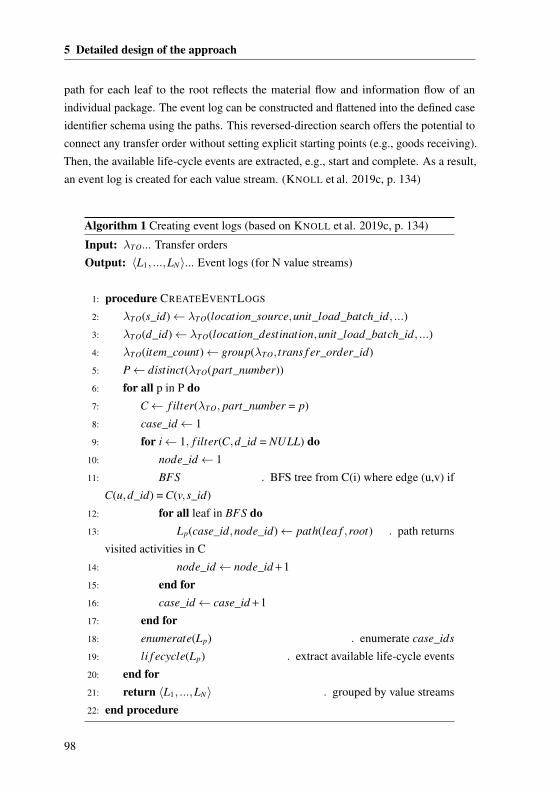
5 Detailed design of the approach
path for each leaf to the root reflects the material flow and information flow of anindividual package. The event log can be constructed and flattened into the defined caseidentifier schema using the paths. This reversed-direction search offers the potential toconnect any transfer order without setting explicit starting points (e.g., goods receiving).Then, the available life-cycle events are extracted, e.g., start and complete. As a result,an event log is created for each value stream. (KNOLL et al. 2019c, p. 134)
Algorithm 1 Creating event logs (based on KNOLL et al. 2019c, p. 134)
Input: λTO... Transfer ordersOutput: 〈L1, ...,LN〉... Event logs (for N value streams)
1: procedure CREATEEVENTLOGS
2: λTO(s_id)← λTO(location_source,unit_load_batch_id, ...)3: λTO(d_id)← λTO(location_destination,unit_load_batch_id, ...)4: λTO(item_count)← group(λTO, trans f er_order_id)5: P← distinct(λTO(part_number))6: for all p in P do7: C← f ilter(λTO, part_number = p)8: case_id← 19: for i← 1, f ilter(C,d_id = NULL) do
10: node_id← 111: BFS . BFS tree from C(i) where edge (u,v) if
C(u,d_id) = C(v,s_id)12: for all leaf in BFS do13: Lp(case_id,node_id)← path(lea f ,root) . path returns
visited activities in C14: node_id← node_id + 115: end for16: case_id← case_id + 117: end for18: enumerate(Lp) . enumerate case_ids
19: li f ecycle(Lp) . extract available life-cycle events20: end for21: return 〈L1, ...,LN〉 . grouped by value streams22: end procedure
98
5.2 Data preprocessing
5.2.2 Enriching event logs
An event log L can be enriched by creating or computing additional attributes (basedon the event log itself) or by attributes derived using external (data) sources using theinternal logistics ontology (cf. ECK et al. 2015; KNOLL et al. 2019b).
Preliminary declarations
Enriching event logs always depends on the objectives and analysis questions in theapplication. Presented attributes are not always required and must be further extendedon request. Three steps are required to extend the attributes. Firstly, the internal logisticsontology must be extended, including classes, object properties, and data properties.The object properties specify the relationship within internal logistics, the underlyinginformation systems, and the event log. Secondly, the input data, including an attributeto merge the event log, must be specified. This ensures that the attribute is given both inthe event log and in the information system. Thirdly, the algorithm must be extendedbased on the updated input data.
Flattened input data specification
To specify the input data, a generic set of attributes for the enrichment is clusteredaccording to the top classes of the ontology.
Process. Let the input data λA for the algorithm be a tabular representation of theactivity (cf. Table 5.5). The unique activity (cf. Column 1) can be enriched by a name(cf. Column 2), e.g., to include source and destination location. The material flow(cf. Column 3) and information flow (cf. Column 4) attribute represent the collectionof the activities required on the shop floor, reflecting the sub-classes of an activity(cf. MaterialFlowActivity, InformationFlowActivity). The proposed classification (e.g.,rework) is used to differentiate between value-added, non-value-added but required, andnon-value-added activities (cf. Section 5.1.1.4).
The cost value (cf. Column 6) and the currency are specified (cf. Column 7), e.g.,monetary or non-monetary effort, to evaluate an activity’s effort. For the assessment ofthe cost value, Activity-based Costing (ABC) or time-driven ABC can be used (VAN
DER AALST 2016, p. 86). As a transfer order contains one or multiple packages, theeffort must be split and allocated to each individual package. The enumerated numberof packages is used for this purpose.
99
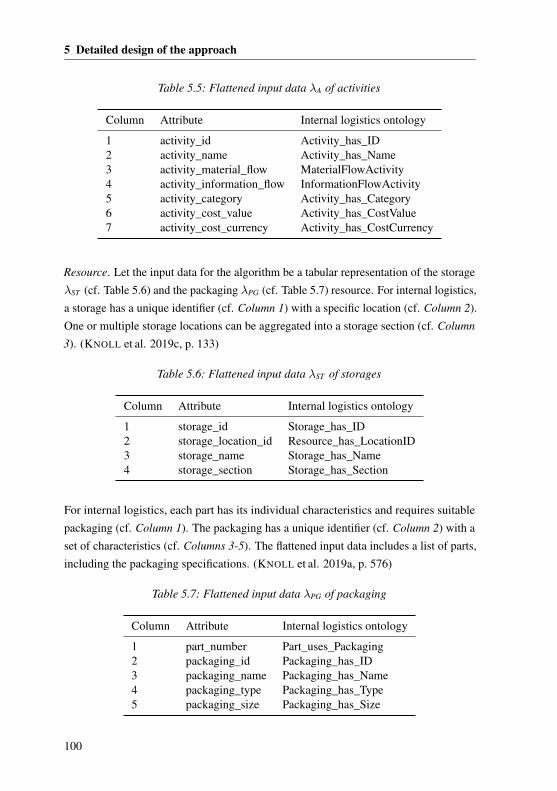
5 Detailed design of the approach
Table 5.5: Flattened input data λA of activities
Column Attribute Internal logistics ontology
1 activity_id Activity_has_ID2 activity_name Activity_has_Name3 activity_material_flow MaterialFlowActivity4 activity_information_flow InformationFlowActivity5 activity_category Activity_has_Category6 activity_cost_value Activity_has_CostValue7 activity_cost_currency Activity_has_CostCurrency
Resource. Let the input data for the algorithm be a tabular representation of the storageλST (cf. Table 5.6) and the packaging λPG (cf. Table 5.7) resource. For internal logistics,a storage has a unique identifier (cf. Column 1) with a specific location (cf. Column 2).One or multiple storage locations can be aggregated into a storage section (cf. Column
3). (KNOLL et al. 2019c, p. 133)
Table 5.6: Flattened input data λST of storages
Column Attribute Internal logistics ontology
1 storage_id Storage_has_ID2 storage_location_id Resource_has_LocationID3 storage_name Storage_has_Name4 storage_section Storage_has_Section
For internal logistics, each part has its individual characteristics and requires suitablepackaging (cf. Column 1). The packaging has a unique identifier (cf. Column 2) with aset of characteristics (cf. Columns 3-5). The flattened input data includes a list of parts,including the packaging specifications. (KNOLL et al. 2019a, p. 576)
Table 5.7: Flattened input data λPG of packaging
Column Attribute Internal logistics ontology
1 part_number Part_uses_Packaging2 packaging_id Packaging_has_ID3 packaging_name Packaging_has_Name4 packaging_type Packaging_has_Type5 packaging_size Packaging_has_Size
100
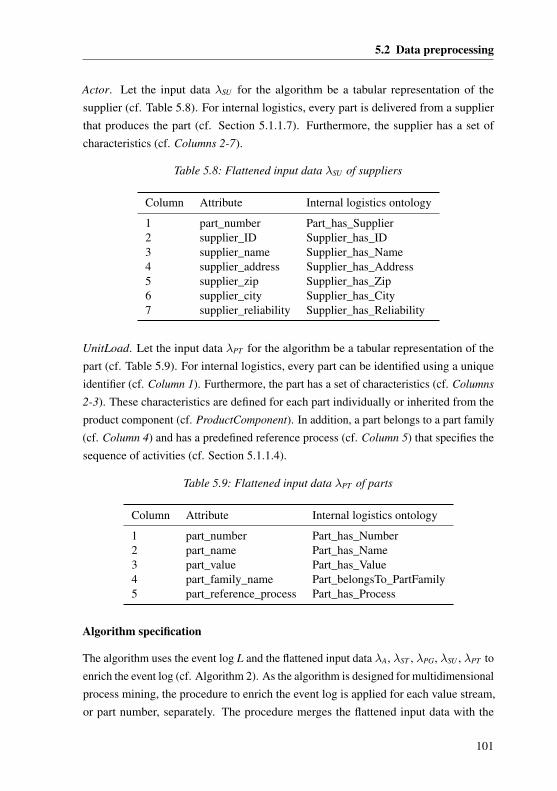
5.2 Data preprocessing
Actor. Let the input data λSU for the algorithm be a tabular representation of thesupplier (cf. Table 5.8). For internal logistics, every part is delivered from a supplierthat produces the part (cf. Section 5.1.1.7). Furthermore, the supplier has a set ofcharacteristics (cf. Columns 2-7).
Table 5.8: Flattened input data λSU of suppliers
Column Attribute Internal logistics ontology
1 part_number Part_has_Supplier2 supplier_ID Supplier_has_ID3 supplier_name Supplier_has_Name4 supplier_address Supplier_has_Address5 supplier_zip Supplier_has_Zip6 supplier_city Supplier_has_City7 supplier_reliability Supplier_has_Reliability
UnitLoad. Let the input data λPT for the algorithm be a tabular representation of thepart (cf. Table 5.9). For internal logistics, every part can be identified using a uniqueidentifier (cf. Column 1). Furthermore, the part has a set of characteristics (cf. Columns
2-3). These characteristics are defined for each part individually or inherited from theproduct component (cf. ProductComponent). In addition, a part belongs to a part family(cf. Column 4) and has a predefined reference process (cf. Column 5) that specifies thesequence of activities (cf. Section 5.1.1.4).
Table 5.9: Flattened input data λPT of parts
Column Attribute Internal logistics ontology
1 part_number Part_has_Number2 part_name Part_has_Name3 part_value Part_has_Value4 part_family_name Part_belongsTo_PartFamily5 part_reference_process Part_has_Process
Algorithm specification
The algorithm uses the event log L and the flattened input data λA, λST , λPG, λSU , λPT toenrich the event log (cf. Algorithm 2). As the algorithm is designed for multidimensionalprocess mining, the procedure to enrich the event log is applied for each value stream,or part number, separately. The procedure merges the flattened input data with the
101
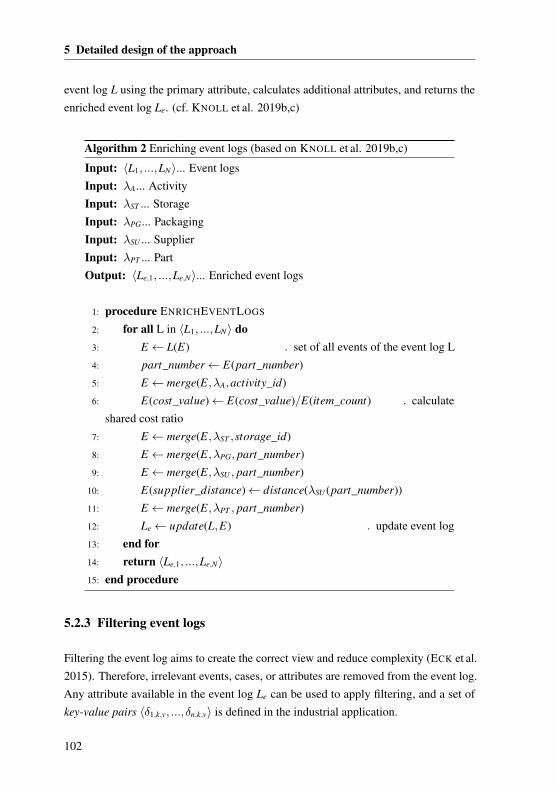
5 Detailed design of the approach
event log L using the primary attribute, calculates additional attributes, and returns theenriched event log Le. (cf. KNOLL et al. 2019b,c)
Algorithm 2 Enriching event logs (based on KNOLL et al. 2019b,c)
Input: 〈L1, ...,LN〉... Event logsInput: λA... ActivityInput: λST ... StorageInput: λPG... PackagingInput: λSU ... SupplierInput: λPT ... PartOutput: 〈Le,1, ...,Le,N〉... Enriched event logs
1: procedure ENRICHEVENTLOGS
2: for all L in 〈L1, ...,LN〉 do3: E← L(E) . set of all events of the event log L4: part_number← E(part_number)5: E← merge(E,λA,activity_id)6: E(cost_value)← E(cost_value)/E(item_count) . calculate
shared cost ratio7: E← merge(E,λST ,storage_id)8: E← merge(E,λPG, part_number)9: E← merge(E,λSU , part_number)
10: E(supplier_distance)← distance(λSU (part_number))11: E← merge(E,λPT , part_number)12: Le← update(L,E) . update event log13: end for14: return 〈Le,1, ...,Le,N〉15: end procedure
5.2.3 Filtering event logs
Filtering the event log aims to create the correct view and reduce complexity (ECK et al.2015). Therefore, irrelevant events, cases, or attributes are removed from the event log.Any attribute available in the event log Le can be used to apply filtering, and a set ofkey-value pairs 〈δ1,k,v, ...,δn,k,v〉 is defined in the industrial application.
102
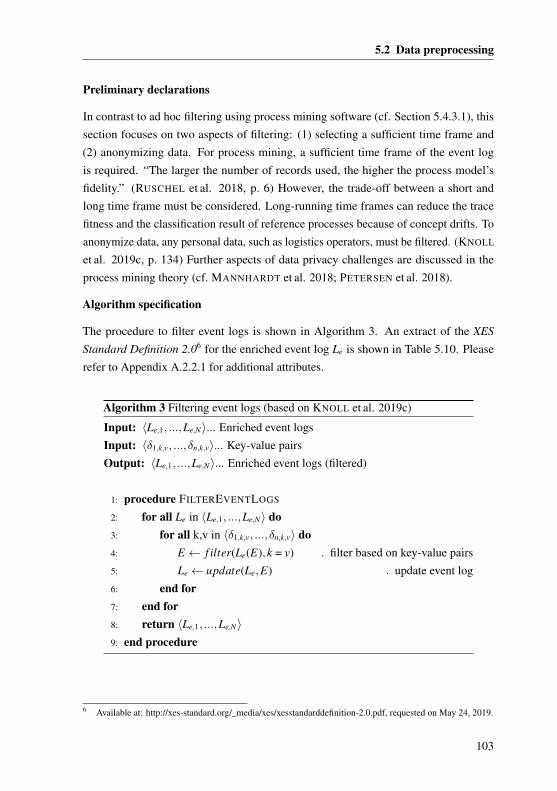
5.2 Data preprocessing
Preliminary declarations
In contrast to ad hoc filtering using process mining software (cf. Section 5.4.3.1), thissection focuses on two aspects of filtering: (1) selecting a sufficient time frame and(2) anonymizing data. For process mining, a sufficient time frame of the event logis required. “The larger the number of records used, the higher the process model’sfidelity.” (RUSCHEL et al. 2018, p. 6) However, the trade-off between a short andlong time frame must be considered. Long-running time frames can reduce the tracefitness and the classification result of reference processes because of concept drifts. Toanonymize data, any personal data, such as logistics operators, must be filtered. (KNOLL
et al. 2019c, p. 134) Further aspects of data privacy challenges are discussed in theprocess mining theory (cf. MANNHARDT et al. 2018; PETERSEN et al. 2018).
Algorithm specification
The procedure to filter event logs is shown in Algorithm 3. An extract of the XES
Standard Definition 2.06 for the enriched event log Le is shown in Table 5.10. Pleaserefer to Appendix A.2.2.1 for additional attributes.
Algorithm 3 Filtering event logs (based on KNOLL et al. 2019c)
Input: 〈Le,1, ...,Le,N〉... Enriched event logsInput: 〈δ1,k,v, ...,δn,k,v〉... Key-value pairsOutput: 〈Le,1, ...,Le,N〉... Enriched event logs (filtered)
1: procedure FILTEREVENTLOGS
2: for all Le in 〈Le,1, ...,Le,N〉 do3: for all k,v in 〈δ1,k,v, ...,δn,k,v〉 do4: E← f ilter(Le(E),k = v) . filter based on key-value pairs5: Le← update(Le,E) . update event log6: end for7: end for8: return 〈Le,1, ...,Le,N〉9: end procedure
6 Available at: http://xes-standard.org/_media/xes/xesstandarddefinition-2.0.pdf, requested on May 24, 2019.
103
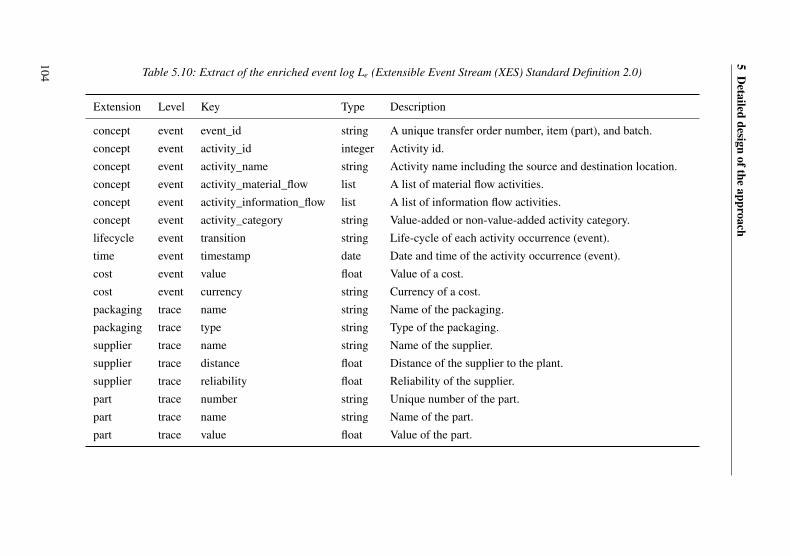
5D
etaileddesign
oftheapproach
Table 5.10: Extract of the enriched event log Le (Extensible Event Stream (XES) Standard Definition 2.0)
Extension Level Key Type Description
concept event event_id string A unique transfer order number, item (part), and batch.concept event activity_id integer Activity id.concept event activity_name string Activity name including the source and destination location.concept event activity_material_flow list A list of material flow activities.concept event activity_information_flow list A list of information flow activities.concept event activity_category string Value-added or non-value-added activity category.lifecycle event transition string Life-cycle of each activity occurrence (event).time event timestamp date Date and time of the activity occurrence (event).cost event value float Value of a cost.cost event currency string Currency of a cost.packaging trace name string Name of the packaging.packaging trace type string Type of the packaging.supplier trace name string Name of the supplier.supplier trace distance float Distance of the supplier to the plant.supplier trace reliability float Reliability of the supplier.part trace number string Unique number of the part.part trace name string Name of the part.part trace value float Value of the part.
104
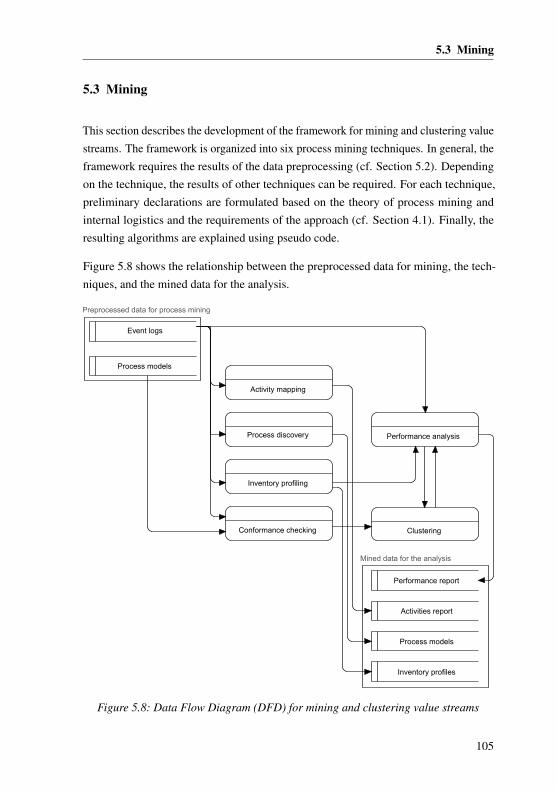
5.3 Mining
5.3 Mining
This section describes the development of the framework for mining and clustering valuestreams. The framework is organized into six process mining techniques. In general, theframework requires the results of the data preprocessing (cf. Section 5.2). Dependingon the technique, the results of other techniques can be required. For each technique,preliminary declarations are formulated based on the theory of process mining andinternal logistics and the requirements of the approach (cf. Section 4.1). Finally, theresulting algorithms are explained using pseudo code.
Figure 5.8 shows the relationship between the preprocessed data for mining, the tech-niques, and the mined data for the analysis.
Process discovery
Event logs
Process models
Preprocessed data for process mining
Conformance checking
Inventory profiling
Performance analysis
Clustering
Activity mapping
Performance report
Process models
Activities report
Mined data for the analysis
Inventory profiles
Figure 5.8: Data Flow Diagram (DFD) for mining and clustering value streams
105
5 Detailed design of the approach
Different process mining techniques, characterized by different maturity levels (cf.Chapter 3), are required to contribute to the overarching goal of the thesis (cf. Sec-tion 1.3). Firstly, this work contributes to the literature by adapting multidimensionalprocess mining (cf. Section 2.3.3) to mine each value stream separately. Secondly, thiswork contributes the following outcomes to the literature:
1. Process discovery is the most frequently used process mining technique (cf. Chap-ter 3), and numerous process discovery algorithms with different characteristicsexist (cf. Section 2.3.2). Section 5.3.1 contributes a literature-based evaluationand selection of process discovery algorithms in the context of internal logisticsto the literature.
2. Conformance checking is another elementary process mining technique (cf. Sec-tion 2.3.2). However, conformance checking typically evaluates one event logwith one process model. Section 5.3.2 contributes to the literature by developingan algorithm to align and classify part-specific event logs with multiple (reference)process models.
3. Activity mapping is a pen-and-paper-based method of lean production introducedby JONES et al. (1997). Section 5.3.3 contributes to the literature by developingan algorithm and selecting metrics to characterize activities.
4. Inventory profiling. Process mining has not been used to analyze inventoryprofiles (cf. Chapter 3). Section 5.3.4 contributes to the literature by developingan algorithm for inventory profiling.
5. Performance analysis is another frequently used process mining technique (cf.Chapter 3). In contrast to process discovery and conformance checking, theperformance analysis is rather domain-specific than a process mining standard.Section 5.3.5 contributes a literature-based selection of performance metrics tothe literature.
6. Clustering is an advanced process mining technique (cf. Section 2.3.3), and manyapplications in the field of logistics and manufacturing have been reported (cf.Chapter 3). Section 5.3.6 contributes to the literature by specifying relevant inputfeatures for value stream clustering.
106
5.3 Mining
5.3.1 Process discovery
Within process discovery, the process model is derived from the event log without any apriori information about the process (KNOLL et al. 2019c, p. 135).
Preliminary declarations
Process discovery of the control-flow is similar to drawing the current state map invalue stream mapping. Both approaches focus on the actual behavior of the process, itsactivities, and their ordering. Consequently, the current state map can be created usingprocess discovery to identify potential for improvement. (cf. KNOLL et al. 2019c)
Practical benefit. Process discovery enables an in-depth analysis of the valuestream, including both value-added and non-value-added activities and theirordering.
From the perspective of value stream mapping, the first step is to choose a part family(ROTHER & SHOOK 1999). In contrast to manufacturing, value streams in internal logis-tics can be highly individual for each product variant and sub-assembly (cf. Chapter 1).Process discovery implements multidimensional process mining to create a processmodel for each value stream individually (KNOLL et al. 2019c, p. 135).
Evaluating and selecting process discovery algorithms
Much progress in developing new algorithms has been made in the field of processmining. However, according to VAN DER AALST & WEIJTERS (2004, p. 239), “there isa strong relation between the mining algorithm and the type of problems that can besuccessfully handled by that algorithm.”
Quality performance metrics7 are used (cf. Section 2.3.2) to evaluate and select suit-able process discovery algorithms. For instance, DONGEN et al. (2009) discuss thecommon assumptions and shortcomings of the algorithms in five categories. Advancedapproaches use regression models to evaluate, compare, and rank algorithms (J. WANG
et al. 2013) or include the dimensions of the event log to the benchmark (WEBER et al.
7 An overview of existing metrics in the field of process mining can be found at ROZINAT et al. (2007, p. 9).For further discussions of individual algorithms, please refer to BUIJS et al. (2014), DONGEN et al. (2009),LEEMANS (2017), VAN DER AALST (2016), & VAN DER AALST & WEIJTERS (2004).
107
5 Detailed design of the approach
2013). However, according to J. WANG et al. (2013), no widely accepted standard tobenchmark algorithms exists.
The review of process mining applications in manufacturing and logistics extendsprocess mining theory (cf. Chapter 3). Based on this work, existing process types arecharacterized, and applied process discovery algorithms are evaluated. Firstly, the cross-analysis of the methodological context in both fields shows a wide range of processtypes. In internal logistics, analyzed processes include up to ten activities. Furthermore,the product and process complexity result in up to 4.2 million events in one year. Incontrast, process types in the manufacturing industry are more complex, including upto 16,250 events per case. Secondly, the case study articles report about numerousalgorithms. Most frequently, the heuristic miner is applied. Other publications includethe fuzzy miner, the inductive miner, or self-defined algorithms. MEINCHEIM et al.(2017), for example, applied the inductive miner due to its flexibility and scalability. Thisfragmented picture can be confirmed for both the manufacturing and logistics industries.An exception is BETTACCHI et al. (2016), who completed a benchmark analysis of fiveprocess discovery algorithms in the context of the manufacturing industry. To assess thealgorithms, BETTACCHI et al. (2016) extended the four quality dimensions of BUIJS
et al. (2014) with complexity metrics, e.g., the number of nodes. BETTACCHI et al.(2016) concluded that the inductive miner and the evolutionary tree miner are the mostsuitable algorithms, and the low computation time of the inductive miner is superior.
The cross-analysis of the review provides three findings. Firstly, a variety of discoveryalgorithms can be applied for various process types. Secondly, less attention is spent onthe selection and evaluation of algorithms. Thirdly, BETTACCHI et al. (2016) propose theinductive miner due to the highest fitness and precision values and high performance.
Consequently, the cross-analysis confirms the findings of process mining theory. Ingeneral, no algorithm is suitable for every process type. However, the inductive minerdemonstrated its suitability within multiple studies. Due to its robustness and ability tohandle large, incomplete event logs with much infrequent behavior (VAN DER AALST
2016, p. 222), the inductive miner is recommended for process discovery in internallogistics (KNOLL et al. 2019c). If required, advanced approaches can be applied tobenchmark different algorithms. An example of a value stream mined using processdiscovery is presented in the industrial application (cf. Figure 6.3).
108
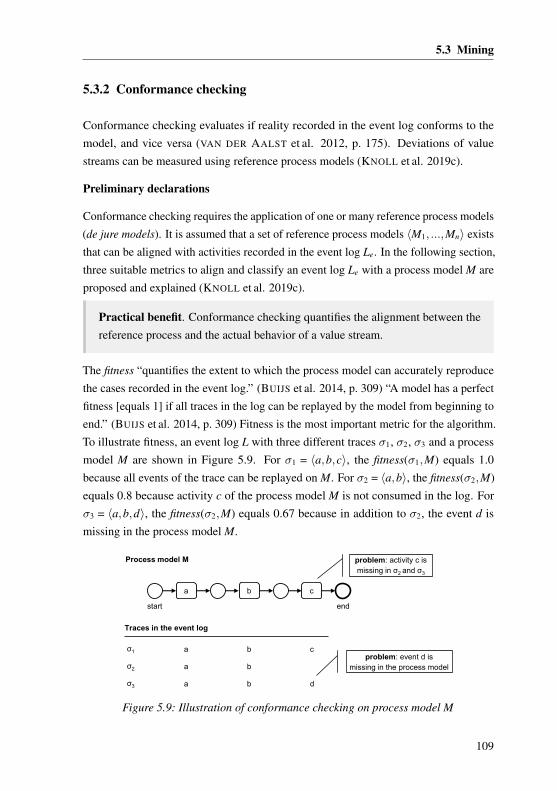
5.3 Mining
5.3.2 Conformance checking
Conformance checking evaluates if reality recorded in the event log conforms to themodel, and vice versa (VAN DER AALST et al. 2012, p. 175). Deviations of valuestreams can be measured using reference process models (KNOLL et al. 2019c).
Preliminary declarations
Conformance checking requires the application of one or many reference process models(de jure models). It is assumed that a set of reference process models 〈M1, ...,Mn〉 existsthat can be aligned with activities recorded in the event log Le. In the following section,three suitable metrics to align and classify an event log Le with a process model M areproposed and explained (KNOLL et al. 2019c).
Practical benefit. Conformance checking quantifies the alignment between thereference process and the actual behavior of a value stream.
The fitness “quantifies the extent to which the process model can accurately reproducethe cases recorded in the event log.” (BUIJS et al. 2014, p. 309) “A model has a perfectfitness [equals 1] if all traces in the log can be replayed by the model from beginning toend.” (BUIJS et al. 2014, p. 309) Fitness is the most important metric for the algorithm.To illustrate fitness, an event log L with three different traces σ1, σ2, σ3 and a processmodel M are shown in Figure 5.9. For σ1 = 〈a,b,c〉, the fitness(σ1,M) equals 1.0because all events of the trace can be replayed on M. For σ2 = 〈a,b〉, the fitness(σ2,M)equals 0.8 because activity c of the process model M is not consumed in the log. Forσ3 = 〈a,b,d〉, the fitness(σ2,M) equals 0.67 because in addition to σ2, the event d ismissing in the process model M.
a b c
endstart
problem: activity c ismissing in σ2 and σ3
σ1 a b c
σ2 a b
σ3 a b d
problem: event d ismissing in the process model
Traces in the event log
Process model M
Figure 5.9: Illustration of conformance checking on process model M
109
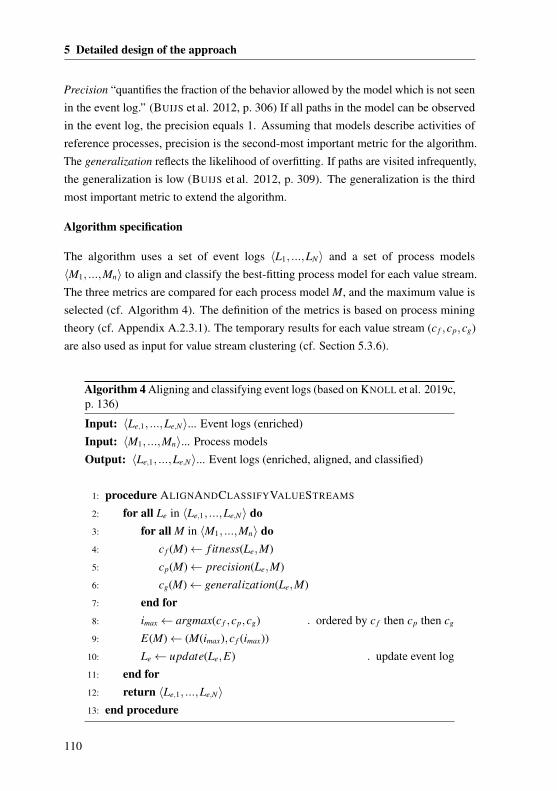
5 Detailed design of the approach
Precision “quantifies the fraction of the behavior allowed by the model which is not seenin the event log.” (BUIJS et al. 2012, p. 306) If all paths in the model can be observedin the event log, the precision equals 1. Assuming that models describe activities ofreference processes, precision is the second-most important metric for the algorithm.The generalization reflects the likelihood of overfitting. If paths are visited infrequently,the generalization is low (BUIJS et al. 2012, p. 309). The generalization is the thirdmost important metric to extend the algorithm.
Algorithm specification
The algorithm uses a set of event logs 〈L1, ...,LN〉 and a set of process models〈M1, ...,Mn〉 to align and classify the best-fitting process model for each value stream.The three metrics are compared for each process model M, and the maximum value isselected (cf. Algorithm 4). The definition of the metrics is based on process miningtheory (cf. Appendix A.2.3.1). The temporary results for each value stream (c f ,cp,cg)are also used as input for value stream clustering (cf. Section 5.3.6).
Algorithm 4 Aligning and classifying event logs (based on KNOLL et al. 2019c,p. 136)
Input: 〈Le,1, ...,Le,N〉... Event logs (enriched)Input: 〈M1, ...,Mn〉... Process modelsOutput: 〈Le,1, ...,Le,N〉... Event logs (enriched, aligned, and classified)
1: procedure ALIGNANDCLASSIFYVALUESTREAMS
2: for all Le in 〈Le,1, ...,Le,N〉 do3: for all M in 〈M1, ...,Mn〉 do4: c f (M)← f itness(Le,M)5: cp(M)← precision(Le,M)6: cg(M)← generalization(Le,M)7: end for8: imax← argmax(c f ,cp,cg) . ordered by c f then cp then cg
9: E(M)← (M(imax),c f (imax))10: Le← update(Le,E) . update event log11: end for12: return 〈Le,1, ...,Le,N〉13: end procedure
110
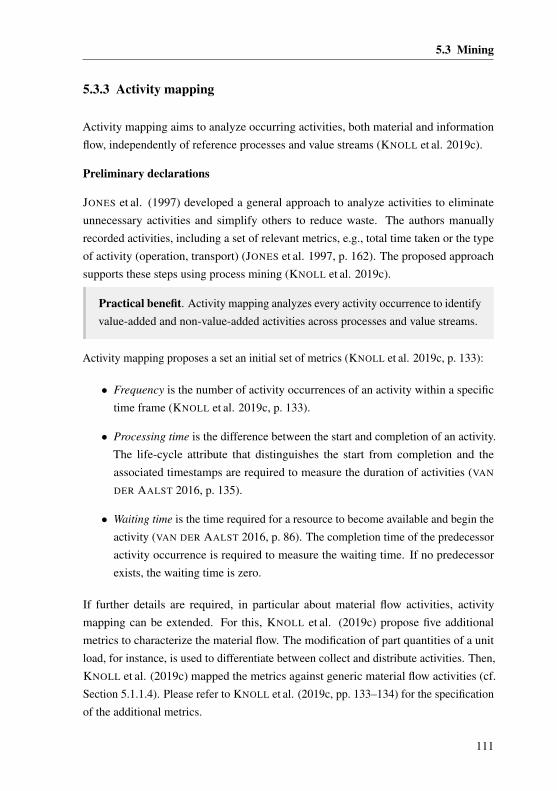
5.3 Mining
5.3.3 Activity mapping
Activity mapping aims to analyze occurring activities, both material and informationflow, independently of reference processes and value streams (KNOLL et al. 2019c).
Preliminary declarations
JONES et al. (1997) developed a general approach to analyze activities to eliminateunnecessary activities and simplify others to reduce waste. The authors manuallyrecorded activities, including a set of relevant metrics, e.g., total time taken or the typeof activity (operation, transport) (JONES et al. 1997, p. 162). The proposed approachsupports these steps using process mining (KNOLL et al. 2019c).
Practical benefit. Activity mapping analyzes every activity occurrence to identifyvalue-added and non-value-added activities across processes and value streams.
Activity mapping proposes a set an initial set of metrics (KNOLL et al. 2019c, p. 133):
• Frequency is the number of activity occurrences of an activity within a specifictime frame (KNOLL et al. 2019c, p. 133).
• Processing time is the difference between the start and completion of an activity.The life-cycle attribute that distinguishes the start from completion and theassociated timestamps are required to measure the duration of activities (VAN
DER AALST 2016, p. 135).
• Waiting time is the time required for a resource to become available and begin theactivity (VAN DER AALST 2016, p. 86). The completion time of the predecessoractivity occurrence is required to measure the waiting time. If no predecessorexists, the waiting time is zero.
If further details are required, in particular about material flow activities, activitymapping can be extended. For this, KNOLL et al. (2019c) propose five additionalmetrics to characterize the material flow. The modification of part quantities of a unitload, for instance, is used to differentiate between collect and distribute activities. Then,KNOLL et al. (2019c) mapped the metrics against generic material flow activities (cf.Section 5.1.1.4). Please refer to KNOLL et al. (2019c, pp. 133–134) for the specificationof the additional metrics.
111
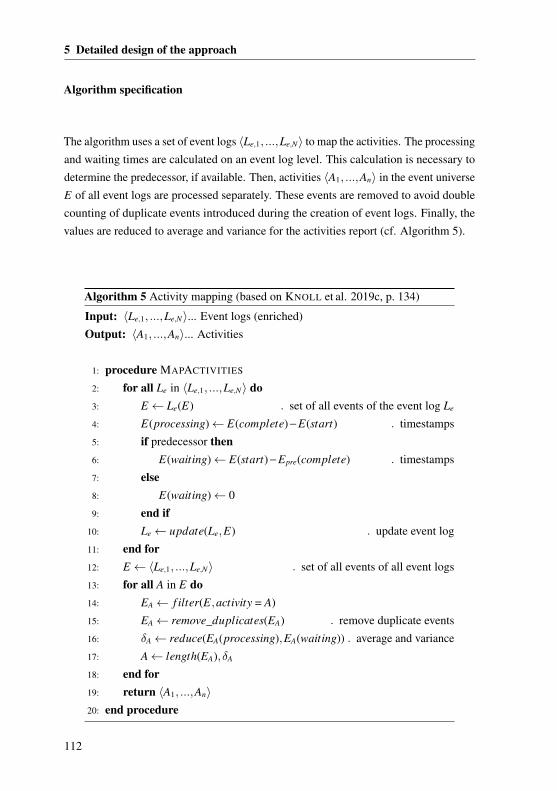
5 Detailed design of the approach
Algorithm specification
The algorithm uses a set of event logs 〈Le,1, ...,Le,N〉 to map the activities. The processingand waiting times are calculated on an event log level. This calculation is necessary todetermine the predecessor, if available. Then, activities 〈A1, ...,An〉 in the event universeE of all event logs are processed separately. These events are removed to avoid doublecounting of duplicate events introduced during the creation of event logs. Finally, thevalues are reduced to average and variance for the activities report (cf. Algorithm 5).
Algorithm 5 Activity mapping (based on KNOLL et al. 2019c, p. 134)
Input: 〈Le,1, ...,Le,N〉... Event logs (enriched)Output: 〈A1, ...,An〉... Activities
1: procedure MAPACTIVITIES
2: for all Le in 〈Le,1, ...,Le,N〉 do3: E← Le(E) . set of all events of the event log Le
4: E(processing)← E(complete) − E(start) . timestamps5: if predecessor then6: E(waiting)← E(start) − Epre(complete) . timestamps7: else8: E(waiting)← 09: end if
10: Le← update(Le,E) . update event log11: end for12: E← 〈Le,1, ...,Le,N〉 . set of all events of all event logs13: for all A in E do14: EA← f ilter(E,activity = A)15: EA← remove_duplicates(EA) . remove duplicate events16: δA← reduce(EA(processing),EA(waiting)) . average and variance17: A← length(EA),δA
18: end for19: return 〈A1, ...,An〉20: end procedure
112
5.3 Mining
5.3.4 Inventory profiling
Inventory profiling creates the actual inventory profile of a value stream based on theevent log. Like process discovery, the actual behavior of the inventory is modeledwithout any a priori information.
Preliminary declarations
Many inventory models designed to reduce inventory have been established in theoryand industry. What they have in common is modeling the inventory history for eachpart over time (e.g., NYHUIS & WIENDAHL 2009). In industry, where thousands ofparts have individual value streams (cf. Chapter 1), modeling the actual inventory (i.e.,not assumed inventory) can be challenging. The proposed approach aims to create theinventory profile of a value stream based on the event log.
Practical benefit. Inventory profiling enables an in-depth analysis of the actualinventory history over time.
It is assumed that any activity available in the event log can be classified into (1) agoods receiving activity that increases the inventory, (2) an internal logistics activity notaffecting the inventory, and (3) an outgoing goods activity that decreases the inventory.Furthermore, any event includes the actual part quantity (cf. Section 5.1.1.4).
It is assumed that an event log with a fixed time window exists, and events outside thetime window can occur (cf. Section 2.3). Then, the event log can be discretized in k time-intervals δt1, ...,δtk. To determine k, the first and last event and the required precision(e.g., 1 day) are used. Thereupon, the cases can be classified into four scenarios:
1. Missing goods receiving activity. The start event of a case is not available. It isassumed that the case (package) entered the logistics system before the start date.
2. Complete case. The start and end event of a case are available. It is assumed thatthe complete case is observed within the event log.
3. Missing outgoing goods activity. The end event of a case is not available. It isassumed that the case (package) remains in the logistics system.
4. Hidden case. The scenario that both the start and end events are outside the timeframe, before or after, is not considered.
113
5 Detailed design of the approach
The part quantities or cases in the event log can be used to create the inventory profile.
• Quantity level. This perspective uses relative inventory movements: quantities ofincoming goods are added, and quantities of outgoing goods are subtracted. Whilethe computation is simple, the absolute level of inventory remains unknown.
• Case level. This perspective evaluates the number of active cases for eachdiscretization step. A case is active as long as the case is not completed by anend event. The absolute measurement of inventory levels can be enabled.
The inventory profile uses the case level. However, three limitations remain:
• Discretization error. In general, a case is active for the complete time-intervalδt, e.g., from 00:00 to 23:59 for δt = 1day. This error exists for all k resultingin δt larger than the precision of the timestamp (e.g., 1 second). However, thediscretizing event logs simplify the procedure and (process) model (TSAI et al.2010, p. 57). Therefore, a simplification is implemented: a case is active for δt ofthe goods receiving activity and inactive for δt of the outgoing goods activity.
• Hidden cases. If no start and end events exist, no active case can be createdartificially, even if a package might be on stock. Using a sufficient time frame(e.g., several months) and evaluating value streams with few events in detail isrecommended.
• Simplified logistics system. Inventory profiling aggregates multiple storage lo-cations to one logistics system. This aggregation helps to assess the requiredinventory, but process-related restrictions must be considered (e.g., requiredbuffers that introduce additional inventory).
Algorithm specification
The algorithm uses a set of event logs 〈Le,1, ...,Le,N〉 to create the inventory profile IP
for each value stream (cf. Algorithm 6). Firstly, the quantity statement is calculated foreach unit load received at goods receiving. For internal logistics, the state of the unitload can be modified by material flow activities, e.g., splitting a unit load into smallerpackages (cf. Section 5.2.1). Consequently, active cases can include different sizes (e.g.,pallet and package). Therefore, all cases must be normalized to the smallest unit load ofa single package. Secondly, artificial cases are created for the remaining quantities tonormalize cases. An artificial case includes a start and an end event. The start is inherited
114
5.3 Mining
from the event related to the goods receiving activity, and the end event is set to the endof the event log. Subsequently, every case in the event log reflects the smallest unit loadof a single package. Thirdly, to address incomplete cases, artificial events are created tocomplete cases. An artificial start event (cf. Scenario 1) or an end event (cf. Scenario 3)is created for each incomplete case. Scenario 2 does not require further modifications.Subsequently, every case in the event log is complete. Fourthly, the actual inventory
profile is calculated. The event log is transformed into an empty matrix where: (1) therows reflect the total number of cases, and (2) the columns reflect the k time-intervals.For each case, the matrix elements of the discretized start event δtstart and end eventδtend−1 are set to 1, including the range between the events. Finally, the inventory profileIP is the column sum for each δt1, ...,δtk. Algorithms to create the demand profile DP
and goods receiving profile RP are shown in the Appendix A.2.3.2.
115
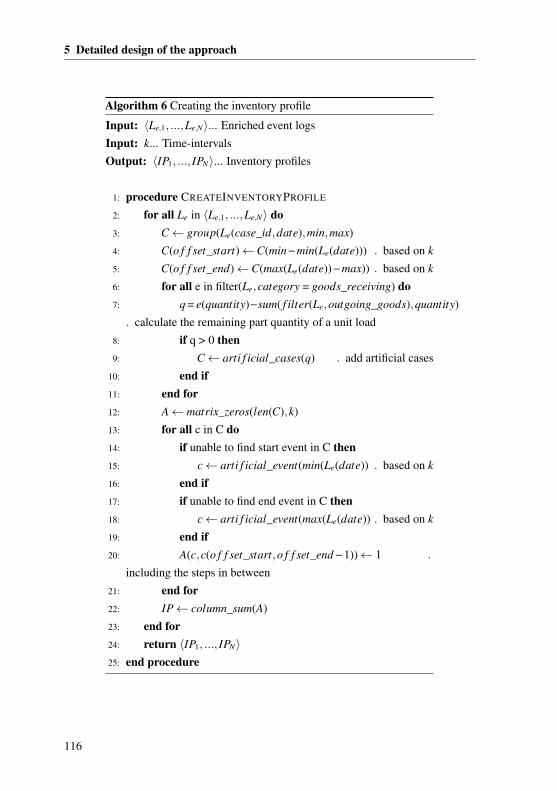
5 Detailed design of the approach
Algorithm 6 Creating the inventory profile
Input: 〈Le,1, ...,Le,N〉... Enriched event logsInput: k... Time-intervalsOutput: 〈IP1, ..., IPN〉... Inventory profiles
1: procedure CREATEINVENTORYPROFILE
2: for all Le in 〈Le,1, ...,Le,N〉 do3: C← group(Le(case_id,date),min,max)4: C(o f f set_start)←C(min − min(Le(date))) . based on k
5: C(o f f set_end)←C(max(Le(date)) − max)) . based on k
6: for all e in filter(Le,category = goods_receiving) do7: q = e(quantity)−sum( f ilter(Le,outgoing_goods),quantity)
. calculate the remaining part quantity of a unit load8: if q > 0 then9: C← arti f icial_cases(q) . add artificial cases
10: end if11: end for12: A← matrix_zeros(len(C),k)13: for all c in C do14: if unable to find start event in C then15: c← arti f icial_event(min(Le(date)) . based on k
16: end if17: if unable to find end event in C then18: c← arti f icial_event(max(Le(date)) . based on k
19: end if20: A(c,c(o f f set_start,o f f set_end − 1))← 1 .
including the steps in between21: end for22: IP← column_sum(A)23: end for24: return 〈IP1, ..., IPN〉25: end procedure
116
5.3 Mining
5.3.5 Performance analysis
Performance analysis provides a holistic view of all value streams. The event log andthe results of other process mining techniques are aggregated statistically.
Preliminary declarations
Performance measurement is the process of quantifying the efficiency and effectivenessof action using metrics (NEELY et al. 1995, p. 80). Measurement is important to identifysuccess, whether the customer needs are met, to identify problems and waste, to ensurefact-based decisions, and that improvements actually happen (PARKER 2000, p. 63).
Practical benefit. Performance analysis uses the results of process mining tech-niques to create an aggregated and holistic picture of all value streams.
Process mining applications in manufacturing and logistics demonstrate the benefitsof performance analysis. However, the extent of the analysis and the set of metrics isfar from standard (cf. Chapter 3). In contrast, value stream mapping provides a set offrequently applied metrics (ROMERO & ARCE 2017; SHOU et al. 2017). Furthermore,performance metrics have been extensively discussed in the literature (e.g., CAPLICE
& SHEFFI 1994; GUNASEKARAN & KOBU 2007). These research streams are brieflydiscussed and summarized to propose an initial set of metrics (cf. Table 5.11).
The literature review of SHOU et al. (2017) identified 36 metrics frequently used whenapplying value stream mapping. Most frequently, the cycle time, lead time, and inventoryare applied. In general, 19 of the 36 metrics relate to production efficiency. The reviewof ROMERO & ARCE (2017, p. 1078) confirms these findings and highlights the leadtime. Further metrics related to internal logistics include the processing time, waitingtime, transportation, and rework and defects (non-value-added activities). Second most,financial metrics are used, e.g., the non-value-added cost. These metrics focus on theprocess and day-to-day perspective. (SHOU et al. 2017, p. 3911)
The literature review of GUNASEKARAN & KOBU (2007) identified 27 key performancemetrics and the authors conclude that there is no shortage of performance metrics. Timeand productivity dimensions have significant weight. “While financial performancemeasures are important for strategic decisions, day-to-day control of manufacturing anddistribution operations is better handled with non-financial measures.” (GUNASEKARAN
& KOBU 2007, p. 2828) A study with 121 manufacturing executives confirms the
117
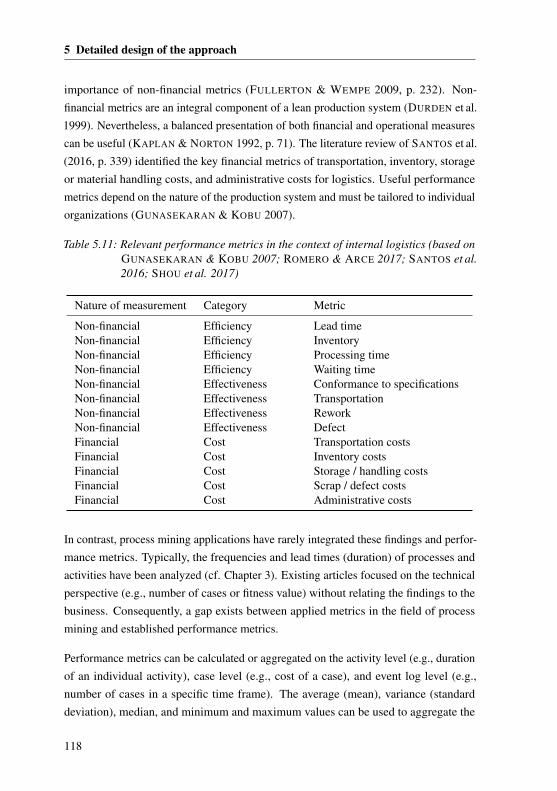
5 Detailed design of the approach
importance of non-financial metrics (FULLERTON & WEMPE 2009, p. 232). Non-financial metrics are an integral component of a lean production system (DURDEN et al.1999). Nevertheless, a balanced presentation of both financial and operational measurescan be useful (KAPLAN & NORTON 1992, p. 71). The literature review of SANTOS et al.(2016, p. 339) identified the key financial metrics of transportation, inventory, storageor material handling costs, and administrative costs for logistics. Useful performancemetrics depend on the nature of the production system and must be tailored to individualorganizations (GUNASEKARAN & KOBU 2007).
Table 5.11: Relevant performance metrics in the context of internal logistics (based onGUNASEKARAN & KOBU 2007; ROMERO & ARCE 2017; SANTOS et al.2016; SHOU et al. 2017)
Nature of measurement Category Metric
Non-financial Efficiency Lead timeNon-financial Efficiency InventoryNon-financial Efficiency Processing timeNon-financial Efficiency Waiting timeNon-financial Effectiveness Conformance to specificationsNon-financial Effectiveness TransportationNon-financial Effectiveness ReworkNon-financial Effectiveness DefectFinancial Cost Transportation costsFinancial Cost Inventory costsFinancial Cost Storage / handling costsFinancial Cost Scrap / defect costsFinancial Cost Administrative costs
In contrast, process mining applications have rarely integrated these findings and perfor-mance metrics. Typically, the frequencies and lead times (duration) of processes andactivities have been analyzed (cf. Chapter 3). Existing articles focused on the technicalperspective (e.g., number of cases or fitness value) without relating the findings to thebusiness. Consequently, a gap exists between applied metrics in the field of processmining and established performance metrics.
Performance metrics can be calculated or aggregated on the activity level (e.g., durationof an individual activity), case level (e.g., cost of a case), and event log level (e.g.,number of cases in a specific time frame). The average (mean), variance (standarddeviation), median, and minimum and maximum values can be used to aggregate the
118
5.3 Mining
metrics. Performance metrics can also be absolute (e.g., number of cases) or relative(e.g., ratio of quality activities).
Non-financial efficiency metrics
• The lead time (duration) is the total time from the creation of the case to itscompletion (VAN DER AALST 2016, p. 86). The lead time is collected for eachcase and aggregated on the event log level for each value stream.
• The processing time of a case is the sum of the processing times for all activities(cf. Section 5.3.3). The processing time is collected for each case and aggregatedon the event log level for each value stream.
• The waiting time of a case is the sum of the waiting times for all activities (cf.Section 5.3.3). Thus, the waiting time is collected for each case and aggregatedon the event log level for each value stream.
• Demand is the number of cases within a normalized time-interval (e.g., one day).The demand is calculated for each time-interval and aggregated (e.g., mean) foreach value stream. (KNOLL et al. 2019c, p. 135)
• Delivery (frequency) is the number of cases entering the system within a nor-malized time-interval (e.g., one week). Similar to the demand, the deliveries aresummarized on the event log level for each value stream.
• Inventory. The number of active cases reflects the inventory on stock. In general,inventory can be separated into cycle-stock and safety stock. To evaluate thesafety stock, absolute inventory, and relative inventory metrics, i.e., range on thedelivery day to cover the upcoming demand, are used. To evaluate the cycle-stock,the ordered quantities Q can be compared to JIT (Q = 1), which results in wasteof Q/2 − 1/2. The inventory metrics are collected for each time-interval andaggregated on the event log level for each value stream.
Non-financial effectiveness metrics
• Conformance checking. The (highest) trace fitness is used to measure deviationsfrom the reference process (cf. Section 5.3.2). If required, the fitness related toother reference processes can be evaluated, e.g., to separate concept drifts fromsystematic failures. Then the trace fitness is provided for each value stream.
119
5 Detailed design of the approach
• Non-value-added activities. The activity categories are used to determine the rootcauses of deviations. Relative and absolute activity occurrences can be calculatedfor each case in each activity category. Then the metrics are aggregated for eachactivity category and on the event log level for each value stream.
Financial cost metrics
• Activity costs. The activity costs reflect the effort to complete an activity. ABC ortime-driven ABC can be used to assess the costs (cf. Section 5.2.2).
• Inventory costs. The inventory costs reflect all costs to hold the inventory, e.g.,the capital costs or storage space costs.
5.3.6 Clustering
Clustering aims to identify groups of similar instances to reduce the complexity of theanalysis. In this section, value stream clustering is proposed to identify groups of valuestreams, e.g., those with high costs due to rework activities.
Preliminary declaration
Value stream clustering is a domain-specific extension that covers product and processcomplexity. It is assumed that this complexity prevents analysis of each value streamseparately, e.g., performing process discovery.
Practical benefit. Clustering provides support for the analysis to identify system-atic issues related to both (reference) processes and value streams.
The review identified a variety of modifications of trace clustering (cf. Chapter 3),including the time perspective (e.g., cycle time), the organizational perspective (e.g.,workshop resources), or the case perspective (e.g., cargo types). These modificationsdemonstrate the benefits of domain-specific characteristics for clustering in the fieldof manufacturing and logistics. Value stream clustering aims to identify domain-specific groups of value streams in internal logistics. Therefore, value stream clusteringmaintains the relationships of value streams and event logs.
120
5.3 Mining
Definition. Let a value stream profile be a set of features 〈 f1, ..., fn〉 that maps thecharacteristics of a value stream.
It is assumed that the results of performance analysis provide a set of suitable metricsto create value stream profiles. Hence, the proposed metrics are discussed in terms ofvalue stream clustering.
• Non-financial efficiency metrics. Lead time, demand, and inventory can be usedto separate value streams. Those established metrics of value stream mapping pro-vide a set of initial metrics. Additional metrics can be specified in the application,such as minimum, average, and maximum inventory.
• Non-financial effectiveness metrics. Conformance checking and non-value-addedactivities are both suitable for separating value streams. Conformance checkingfindings for the three quality performance metrics are used (cf. Section 5.3.2)for value stream clustering. Notably, multiple values of each metric (top-n)can be integrated, e.g., the highest three fitness values (top-3 fitness). Then,different types of deviations can be separated (e.g., systematic failures fromconcept drifts). Relative occurrences of non-value-added activities are used toseparate the underlying root causes (e.g., to derive a rework cluster).
• Financial cost metrics. The financial cost metrics provide an extension to bothefficiency and effectiveness metrics. If combined, the economic impact of devia-tions can be used to focus on costly clusters.
In any case, clustering algorithms require comparable features, so normalization ofthe input features 〈 f1, ..., fn〉 is required. On the one hand, this affects dynamics overtime, e.g., normalize the total quantity in a specific period to a quantity per day. On theother hand, absolute values must be normalized to relative values, e.g., the maximum isreduced to 1.
Algorithm specification
Numerous clustering algorithms exist in the data mining field. The k-means algorithmis frequently used because of its robustness and simplicity. Many methods can beused (e.g., elbow method or gap statistics) to determine the number of clusters. (cf.KODINARIYA & MAKWANA 2013) A set of value stream profiles is created and used asinput features for the clustering algorithm.
121
5 Detailed design of the approach
5.4 Analysis and evaluation
This section describes the reference model and the eight practical guidelines that supportthe analysis (cf. Section 4.4.4). Firstly, the literature-based development of the analysisis described in Section 5.4.1. Secondly, the reference model for the analysis is presentedin Section 5.4.2. Thirdly, the eight practical guidelines for the analysis are explained indetail (cf. Section 5.4.3).
5.4.1 Literature-based development of the analysis
The literature-based development of the analysis is conducted in four steps. Firstly, thepreliminary declarations outline how support can be provided. Secondly, the referencemodel for the analysis is developed. Thirdly, a generic set of properties to model theguidelines is defined. Fourthly, the eight guidelines are modeled in detail.
Step 1: Outlining preliminary declarations
The analysis is problem-, objective-, and application-specific. The scope may be intro-duced by what it is not and how practical support can be provided. Firstly, the analysisalways depends on the analysis questions and objectives (e.g., types of waste); it shouldnot be a prescriptive, step-by-step procedure. The practical guidelines must be looselycoupled and can be iteratively combined or skipped. Secondly, the analysis cannot becomplete. The reference model for the analysis must be set up initially and must becapable of evolving over time as new information is acquired. Thirdly, the analysis doesnot aim to identify the most wasteful value streams (e.g., accumulating different types ofwaste) but instead aims to identify the potential for process improvement. Assuming thatdifferent types of waste are introduced by different causes, the guidelines must addressdifferent types of waste and causes separately. In conclusion, the analysis cannot be tooprescriptive and must be flexible and extendable.
The review reveals research opportunities (cf. Section 3.4). In general, the integrationof process mining (e.g., techniques) and lean production theory (e.g., types of waste) isrequired. In addition, the synthesis of lessons learned (e.g., potential issues) increasessupport. Standardizing the practical guidelines with reusable properties (e.g., objectives)helps to ensure that the analysis will be beneficial.
122
5.4 Analysis and evaluation
Practical benefit. The reference model and the practical guidelines for theanalysis provide support by integrating process mining with lean productiontheory and the main objective of eliminating waste.
Step 2: Developing the reference model for the analysis
Relevant articles were selected based on the evaluation in the review (cf. Chapter 3) todevelop the reference model for the analysis. The steps suggested in the articles wereextracted, mapped, and clustered into practical guidelines for the analysis. Theoreticalprocess mining perspectives were used as main categories (e.g., time perspective) toguide this procedure, and the variety of analysis steps was reduced according to theiradded value and frequencies of occurrence. The mapping of 12 resulting articles to theguidelines can be found in Appendix A.2.4.1. Next, the established types of waste weremapped to the practical guidelines based on the case studies, process mining theory,and logical reasoning. The relationships between the practical guidelines were definedto complete the reference model. The reference model is defined as an Activity-basedDSM that can be extended at any time to ensure flexibility. The reference model for theanalysis consists of eight practical guidelines and is presented in Section 5.4.2.
Step 3: Defining a generic set of guideline properties
Before the practical guidelines for the analysis are modeled in detail, generic guidelineproperties are defined. The initial set of six properties provides the structure for eachpractical guideline in Section 5.4.3. This initial set can be extended depending on therequirements in the application, for example, by adding organizational properties.
• Objective: “What is the objective of the guideline?” The objective propertyensures that every analysis has a clear objective that provides a practical benefit.A generic formulation should be preferred, e.g., identify value streams withoversized inventories, to ensure the re-usability of a practical guideline.
• Lean production: “How is the guideline related to lean production?” Thelean production property links the practical guideline to lean production theory.Consequently, the property extends the objective with established types of waste(e.g., waste of inventory). Based on this property, application-specific analysisquestions can be mapped to the practical guidelines.
123
5 Detailed design of the approach
• Process mining: “Which process mining perspectives, techniques, and metrics are
applied?” The process mining property links the practical guideline to processmining theory. This includes the process mining perspective (e.g., control-flow),techniques (e.g., conformance checking), and metrics (e.g., trace fitness). Asidefrom the control-flow and time perspective, the case perspective enhances theunderstanding of any analysis, at least in theory. Therefore, the case perspectivewill not be specified in detail. Please refer to the internal logistics ontology (cf.Section 5.1.1).
• Description: “Which steps are performed during the analysis?” The descriptionproperty specifies instructions about steps that can be conducted during theanalysis. In particular, this includes top-down prioritization rules according tometrics (e.g., first quartile of the trace fitness) or an in-depth analysis (e.g., adiscovered process model of a specific value stream). The description propertyhelps to ensure the analysis is standardized and repeatable.
• Potential issues: “Which potential issues should be taken into account?” Thisproperty addresses potential issues of the practical guideline and the analysis andreflects lessons learned and issues from previous case studies.
• Continue with: “What are the next steps?” This property proposes the next stepsafter completing the analysis using the practical guideline. In addition to thereference model, this property focuses on evaluating the findings, for instance,with further validation steps on the shop floor.
Step 4: Modeling the practical guidelines for the analysis
Twelve articles and personal experiences of the author of this thesis were used to modelthe eight practical guidelines in detail. The practical guidelines developed for theanalysis are presented in Section 5.4.3.
5.4.2 Reference model of the analysis
The reference model for the analysis consists of eight practical guidelines. The rows andcolumns reflect the practical guidelines, and the relation specifies the flow: Practical
guideline “type of relation” Practical guideline (cf. Figure 5.10). For instance, Filtering
“reduces the complexity (for the)” process discovery.
124
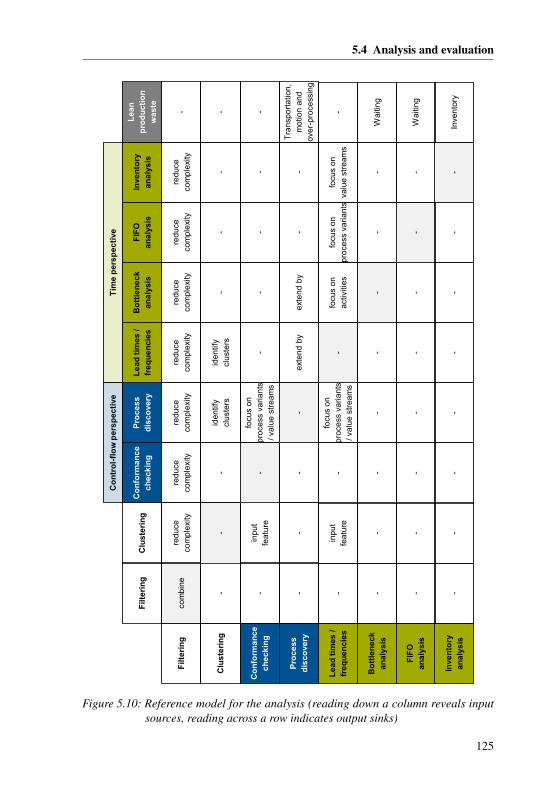
5.4 Analysis and evaluation
Filt
eri
ng
Co
ntr
ol-
flo
w p
ers
pec
tive
Tim
e p
ers
pe
cti
ve
com
bin
ere
du
ce
com
plex
ityre
du
ce
com
plex
ityre
du
ce
com
plex
ityre
du
ce
com
plex
ityre
du
ce
com
plex
ityre
du
ce
com
plex
ityre
du
ce
com
plex
ity-
Filt
eri
ng
Clu
ste
rin
gC
on
form
an
ce
c
he
ck
ing
Pro
ce
ss
dis
co
very
Le
ad
tim
es
/ fr
eq
ue
nc
ies
Bo
ttle
ne
ck
a
na
lys
isF
IFO
a
na
lys
isIn
ven
tory
a
na
lys
is
Le
an
p
rod
uc
tio
n
wa
ste
Clu
ste
rin
g-
--
ide
ntify
cl
ust
ers
ide
ntify
cl
ust
ers
--
--
Co
nfo
rma
nc
e
ch
ec
kin
g-
inp
ut
fea
ture
-fo
cus
on
p
roce
ss v
ari
an
ts
/ va
lue
str
ea
ms
--
--
-
Pro
cess
d
isc
ove
ry-
--
-e
xte
nd
by
ext
en
d b
y-
-T
ran
spo
rta
tion
, m
otio
n a
nd
ove
r-p
roce
ssin
g
Le
ad
tim
es
/ fr
eq
ue
nc
ies
-in
put
fe
atu
re-
focu
s o
n
pro
cess
va
ria
nts
/ va
lue
str
ea
ms
-fo
cus
on
a
ctiv
itie
sfo
cus
on
p
roce
ss v
ari
an
tsfo
cus
on
va
lue
stre
am
s-
Bo
ttle
ne
ck
a
na
lys
is-
--
--
--
-W
aitin
g
FIF
O
an
aly
sis
--
--
--
--
Wa
iting
Inve
nto
ry
an
aly
sis
--
--
--
--
Inve
nto
ry
Figure 5.10: Reference model for the analysis (reading down a column reveals inputsources, reading across a row indicates output sinks)
125
5 Detailed design of the approach
5.4.3 Practical guidelines for the analysis
This section describes the eight practical guidelines for the analysis. Each practicalguideline provides an analysis objective, the link to lean production, the process miningtechnique(s), the analysis description, potential issues and lessons learned, and therelation to other practical guidelines (cf. Section 5.4.1).
5.4.3.1 Filtering
Objective. Including or excluding value streams based on the control-flow (e.g., activ-ity), time (e.g., duration), and case perspective (e.g., attribute).
Lean production. Not related to lean production.
Process mining. Filtering (control-flow perspective, time perspective, case perspective)or process discovery (noise filter).
Description. Once an event log is created, it is typically filtered, which is an iterativeprocess (VAN DER AALST 2016, p. 128). Filtering can be applied during preprocessingor ad hoc in the process mining software (VAN DER AALST 2016). Filtering can beapplied multiple times and for each process mining perspective.
In the case perspective, enriched attributes in the event log are used to filter value streams:for internal logistics, different reference processes or clusters (e.g., KNOLL et al. 2019c;S.-k. LEE et al. 2013; Y. WANG et al. 2014a,b), storages (e.g., VAN CRUCHTEN &WEIGAND 2018; Y. WANG et al. 2018), and part-specific or supplier-specific attributes(e.g., ER et al. 2015a,b). Depending on the analysis questions, application-specificattributes can be extended in the internal logistics ontology, enriched into the event log,and then used for filtering.
In the control-flow perspective, either activity-independent filtering, i.e., to removenoise, or activity-based filtering, i.e., a process must contain a specific activity, can beapplied (e.g., ER et al. 2015b; PASZKIEWICZ 2013). A refinement of the activity-basedfiltering is to remove incomplete cases that do not contain both start and end activity(e.g., LIIV & LEPIK 2014; Y. WANG et al. 2014a).
In the time perspective, cases are usually filtered using lead times and frequencies(e.g., ER et al. 2015a; KNOLL et al. 2019c). The statistics of the event log are used to
126
5.4 Analysis and evaluation
separate main flows from infrequent variants or high lead times from low lead times.Additionally, the time frame of the event log (e.g., a certain period of the year) can befiltered (e.g., Y. WANG et al. 2014a).
Potential issues. Filtering is a simple technique to reduce the complexity of the analysis.However, a priori understanding of the value streams and related attributes is required.Furthermore, removing complete cases can hide specific problems.
Continue with. Any practical guideline.
5.4.3.2 Clustering
Objective. Find process variants of similar value streams (groups of instances) usingclustering algorithms (based on VAN DER AALST 2016).
Lean production. Not related to lean production.
Process mining. Trace clustering and value stream clustering.
Description. Depending on the analysis question, either trace clustering or value streamclustering is suitable. Trace clustering uses cases without the context of the value streamto identify process-specific deviations that are independent of individual value streams.Frequent error patterns during the process execution can be identified independentlyof the value stream. In contrast, value stream clustering maintains the context of thevalue stream to identify value-stream specific deviations. For instance, value streamswith unnecessary transports caused by quality defects can be clustered.
Both clustering types can be applied for the control-flow and the time perspective. Inthe control-flow perspective, the activities are used to discover different process variants(S.-k. LEE et al. 2013; Y. WANG et al. 2014a,b). In the time perspective, the frequencyor cycle-time can be used (BECKER & INTOYOAD 2017). Typically, the time perspectiveextends the control-flow perspective. For value stream clustering, in particular, thefrequencies of activity categories utilize domain-specific characteristics.
Potential issues. Clustering is an advanced technique that requires expert knowledge.Typically, several iterations can be required to determine the number of clusters andsuitable perspectives, or input features. Statistical methods, the gap statistic method,for instance, can be used to derive the number of clusters (TIBSHIRANI et al. 2001).
127
5 Detailed design of the approach
Alternatively, work on trace clustering suggested maximizing the quality performancemetrics to determine an optimal number of clusters (BOSE & VAN DER AALST 2009,2010). Depending on the heterogeneity of the value streams, clustering should begin byfocusing either on the control-flow or time perspective.
Continue with. Process discovery or lead times/frequencies (for each process vari-ant).
5.4.3.3 Conformance checking (for each process variant)
Objective. Quantify and diagnose deviations by comparing the reality with the processmodel (e.g., reference process) (VAN DER AALST et al. 2012, p. 175).
Lean production. Not related to lean production.
Process mining. Conformance checking (trace fitness metric). In the case of multipleprocess variants, use the trace fitness metric for each value stream, grouped by theprocess variant in a box plot (e.g., in a box plot diagram).
Description. Conformance checking evaluates if reality, as recorded in the event log,conforms to the model, and vice versa (VAN DER AALST et al. 2012, p. 175). Thealignment of the control-flow (e.g., skipped or additional activities) is measured as thetrace fitness value using process models. Subsequently, this technique can be used toprioritize value streams but does not explain the root causes. If multiple process variants(e.g., reference processes) exist, the trace fitness is calculated for each value stream (cf.Section 5.3.2) and grouped by the process variant. Different process variants can becompared to systematically prioritize value streams when they are visualized in a boxplot.
In general, a trace fitness of 1.0 represents a perfect alignment without any deviation.Therefore, a low trace fitness indicates a potential waste of unnecessary movement,transportation, and over-processing. If applied to multiple process variants, a lowmedian value of a variant indicates process variability and instability. A short boxplot indicates a systematic issue in the process, and a tall box plot indicates unstableprocesses (or part-specific issues of value streams). In contrast, a high median value(close to 1.0) indicates a high degree of standardization. (cf. KNOLL et al. 2019c)
128
5.4 Analysis and evaluation
Economic attributes (e.g., costs) of the process variants can be added to enhance theconformance checking. Consequently, individual value streams or process variants (e.g.,reference processes) can be prioritized for a detailed analysis.
Potential issues. A process model is required (e.g., reference process) to apply confor-mance checking. In general, incomplete cases reduce trace fitness because activities areskipped. The trace fitness can only be used to compare value streams to each other rela-tively and not absolutely. Furthermore, in the case of a low number of cases in a valuestream, the effect is strengthened. A threshold of a minimum of three cases for eachvalue stream can be defined to overcome this potential issue. Another potential issueis concept drift, e.g., a manufacturing change that results in a change of the referenceprocess within the time frame of the event log.
Continue with. Process discovery of value streams or process variants with a low(median) trace fitness. In the case of a tall box plot (high variance), trace clustering canbe useful to identify different patterns.
5.4.3.4 Process discovery
Objective. Create a process model of the material and information flow of valuestream(s) without a priori information (KNOLL et al. 2019c; VAN DER AALST 2016).
Lean production. Waste of unnecessary movement, transportation, and over-processing. If combined with the time perspective: waste of waiting and (possibly)inventory.
Process mining. Process discovery, extended with the time perspective (frequencies,processing, and waiting times).
Description. A process discovery algorithm derives a process model based on theevent log such that the model is “representative” for the behavior seen in the event log(VAN DER AALST 2016, p. 163). Process discovery can be used to identify and explaindeviations and completes the conformance checking. In the case studies, the focusof process discovery is either set on the main flow and its efficiency or on infrequentand exceptional behavior. In both cases, the extension of the time perspective (e.g.,frequencies or duration) is required.
129
5 Detailed design of the approach
The case studies reported three different patterns of unnecessary movement, transporta-tion, and over-processing. Firstly, multiple executions of the same activity (non-value-added activities). Examples are a re-location in storage or sending material backwardand forward between different storages (e.g., KNOLL et al. 2019c; S.-k. LEE et al. 2013;PASZKIEWICZ 2013; VAN CRUCHTEN & WEIGAND 2018; Y. WANG et al. 2014b).Secondly, the case studies highlight additional, non-value-added activities. Most often,additional quality activities were uncovered in the process discovery (e.g., ER et al.2015a,b; KNOLL et al. 2019c; PASZKIEWICZ 2013). Also, rework, damaged palletsand unknown activities were identified (KNOLL et al. 2019c; PASZKIEWICZ 2013; VAN
CRUCHTEN & WEIGAND 2018). Thirdly, missing activities at the beginning or end orskipped activities are reported: for instance, a scheduled quality check is missing (ER
et al. 2015b; PASZKIEWICZ 2013) or skipped storage activities caused by urgent orders(KNOLL et al. 2019c).
Potential issues. If not combined with filtering, the product and process complexitycan result in a complex process model that is difficult to analyze. The importance ofinfrequent process variants can be overestimated: use the time perspective to focus onthe main paths (frequency) or costly paths. Process discovery algorithms remove noise(e.g., infrequent behavior) to create a representative process model. Iteration may berequired (e.g., threshold parameters).
Continue with. Lead times/frequencies (for each process variant), bottleneck analysis,or verification (e.g., interview, shop floor).
5.4.3.5 Lead times and frequencies (for each process variant)
Objective. Identify and prioritize inefficient process variants or part-specific valuestreams with high and/or unexpected lead times.
Lean production. Not related to lean production.
Process mining. Activity mapping or performance analysis. In the case of multipleprocess variants: lead time for each value stream, grouped by the process variant orfrequency (e.g., in a box plot diagram).
Description. The lead times and frequencies can be used to identify and prioritizeinefficiencies, either in process variants or part-specific value streams. Therefore, actual
130
5.4 Analysis and evaluation
lead times (e.g., mean) are compared to reference values, e.g., predefined standards(PASZKIEWICZ 2013). In total, three patterns of inefficiencies were identified.
Most frequently, process-specific deviations for process variants were identified (e.g.,ER et al. 2015b; KNOLL et al. 2019c; VAN CRUCHTEN & WEIGAND 2018). In thiscase, waiting or processing times are independent of individual value streams. ER et al.(2015b), for example, compared the aggregated lead time (mean) of three differentprocess variants. To address the product complexity, KNOLL et al. (2019c) developedan approach to compare different process variants using box plots. Based on the leadtimes of individual value streams, the distribution within a process variant can be usedfor the analysis. The bottleneck analysis can be used to identify and prioritize activitieswith unexpected waiting or processing times.
In contrast, PASZKIEWICZ (2013) identified part-specific root causes (e.g., high storagetimes caused by inventory). These inefficiencies are independent of the process variant.The category of the exceptional activity (e.g., storage) can be used to determine furtheranalysis steps, such as an inventory analysis (NYHUIS et al. 2008).
Frequencies (demand), in combination with underlying process costs, can introduceinefficiencies and measurable deviations in lead times. For example, processing valuestreams with high demands using costly processes are different from processing valuestreams with low demands that use cost-efficient processes. The enriched cost informa-tion can be used for process leveling.
Potential issues. If not combined with frequencies, infrequent process variants withoutimpact might be prioritized for further analysis steps (ER et al. 2015b). In particular,time-dependent characteristics (e.g., customer demand) can introduce concept drifts.Therefore, a normalization step can be useful when integrating frequencies (e.g., demandper day). Furthermore, leveling requires integrating the physical constraints of thelogistics system, e.g., storage, packages, and part characteristics.
Continue with. Process discovery, bottleneck analysis, or inventory analysis.
5.4.3.6 Bottleneck analysis
Objective. Identify bottleneck activities or variance of processing or waiting times inthe process.
131
5 Detailed design of the approach
Lean production. Waste of waiting (before an activity or during the execution).
Process mining. Process discovery (with the time perspective) or activity mapping.
Description. The bottleneck analysis can be used to detect and analyze processingtimes of activities or waiting times between activities (VAN DER AALST 2016, p. 292).Activities that represent a process bottleneck should be addressed first. If available,reference values (e.g., planned processing times) can be used for prioritization. Forexample, ER et al. (2015b) analyzed the processing times of blocked stock or qualityactivities. In contrast, ER et al. (2015a) analyzed the waiting time between the materialrequest and the beginning of the picking activity.
The starting point of the bottleneck analysis is the mean duration. The variance of thewaiting and processing times can also be analyzed. Therefore, activity mapping can beused to compare simple statistics (e.g., variance or maximum) of different activities.An advanced technique is the performance spectrum that covers time-dependent dy-namics and non-static behavior (DENISOV et al. 2018). Notably, the activity mappingtechnique is independent of the process variant and can be used to address the processcomplexity.
Potential issues. If an activity only captures a start or complete event, the waiting timecannot be differentiated from the processing times. Another issue is neglecting thematerial flow activity: for instance, storage activities with high duration can be causedby individual value streams and are not necessarily bottlenecks of the process variant.Furthermore, depending on the process complexity, not every process variant or activitycan be analyzed individually. Activity mapping can be used to prioritize activities witha high frequency (e.g., activities shared across multiple process variants).
Continue with. Verification (e.g., interview, shop floor).
5.4.3.7 FIFO analysis
Objective. Identify violations of the FIFO rule.
Lean production. Waste of waiting.
Process mining. Dotted chart visualization of the event log, including the start and endevent of each case.
132
5.4 Analysis and evaluation
Description. The dotted chart provides a holistic view for each case of the process fromthe time perspective. Each event, or at least the start and end events, is visualized asa dot and aligned with the case (VAN DER AALST 2016, p. 278). Based on the dottedchart diagram, deviations of the FIFO rule can be identified. ER et al. (2015a) used theFIFO analysis to analyze batches in the storage that must be taken out first. In contrast,PASZKIEWICZ (2013) analyzed the shipping activities of finished products using thedotted chart.
Potential issues. The performance spectrum can be used in the case of a highly dynamicsystem with numerous cases (DENISOV et al. 2018).
Continue with. Verification (e.g., interview, shop floor).
5.4.3.8 Inventory analysis
Objective. Identify value streams with oversized inventories caused by cycle-stock orsafety stock.
Lean production. Waste of inventory.
Process mining. Performance analysis and/or inventory profiling.
Description. The inventory analysis is a detailed analysis of a part-specific value stream.In general, the inventory analysis can be used to compare if the reality confirms theexpected inventory or to question if the planned inventory is required or oversized.Depending on the application, the inventory can be measured in demand-independentmetrics (e.g., 30 days of storage time) or relative metrics depending on the demand (e.g.,three days of inventory range).
Filtering techniques must be applied in advance to reduce the complexity of valuestreams. Both cycle-stock and safety stock can be identified separately using theperformance analysis inventory metrics. This step is essential as the cycle-stock andsafety stock depend on a variety of inventory parameters and can occur independently.
To identify waste of inventory caused by cycle-stock, the average cycle-stock can becompared to a JIT concept, which has a lot size of one and, subsequently, no cycle-stock. The minimum order quantity can be decreased, and the delivery frequency canbe increased to reduce the cycle-stock waste. The inventory on hand on the delivery
133
5 Detailed design of the approach
day must be considered to identify waste of inventory caused by safety stock. Again,comparing the safety stock to a JIT concept, the optimum safety stock on the deliveryday is zero. Then, related inventory control parameters (e.g., minimum stock) can beevaluated and reduced. Notably, in both cases, the economic effects of the inventory mustbe considered (KLUG 2010, p. 50). Potentially increasing order costs must be comparedto the cost savings (e.g., inventory holding and inventory space), for example.
Potential issues. Both part-specific characteristics and internal and external constraintsand risks must be considered when evaluating the inventory. According to BOYSEN
et al. (2015, p. 110), “determining minimum and maximum stock levels, order sizes,and/or review periods in all its potential varieties is widely investigated in inventorytheory.” These variables can include demand, replenishment time, criticality, value,and package size (e.g., BABAI et al. 2015; HORENBEEK et al. 2013; KABIR & HASIN
2013). Furthermore, the variance (e.g., demand) or risks (e.g., forecasting errors, delays)can influence the actual inventory (e.g., BAKER 2007; KAPUSCINSKI et al. 2004; LUTZ
et al. 2003).
Continue with. Verification (e.g., interview, shop floor).
134
6 Application and evaluation
This section focuses on the evaluation of the approach. The proposed approach hasbeen applied in three case studies in an industrial environment. The findings and resultsof the application are outlined in Section 6.1. To complete the Descriptive Study II
(cf. Section 1.4), a generally valid evaluation addresses (1) the fulfillment of therequirements (cf. Section 6.2.1), (2) a cost-benefit calculation (cf. Section 6.2.2), and(3) existing limitations (cf. Section 6.2.3).
6.1 Industrial application
6.1.1 Industrial environment
The concept was applied at a production plant of a German automotive manufacturer in2017 and 2018. The three case studies focus on the internal logistics of a mixed-modelassembly line, processing parts from the goods receiving to the line.
Characterizing the internal logistics system
The internal logistics system is characterized by a high product and process complexity.Due to the fact that multiple products are assembled on the line, more than 10,000 partnumbers with individual value streams exist (KNOLL et al. 2019c). Furthermore, internallogistics provides a variety of different reference processes (e.g., JIT or warehousing). Intotal, more than 30 internal logistics reference processes exist (KNOLL et al. 2019c). Tooperate internal logistics, the information system of the company, an ERP system witha WMS module, takes on a key role. Transfer orders trigger material and informationflow activities across a variety of resources (e.g., storage).
Within the last two decades, the management of the company put great effort intoestablishing a lean production and logistics system: e.g., standardizing processes, reduc-ing inventories, and establishing continuous improvement principles. These initiatives
135
6 Application and evaluation
resulted in a lean internal logistics system. According to the logistics experts, valuestream mapping is limited due to the product and process complexity.
Setting up the case studies
An interdisciplinary project team consisting of experts from the logistics and informationtechnology department was created to conduct the case studies. The team includedmanagement, process mining analysts, and logistics and information system experts. Ingeneral, the case studies were executed by the process mining analysts, and additionalroles were integrated on demand. In total, 17,865,792 transfer orders were recorded bythe information system within three months, spread across 13,083 part numbers1. Forreasons of data privacy protection, there are three restrictions. Firstly, the total numberof more than 30 logistics reference processes are sampled to 15 reference processes.Secondly, the part numbers are sampled to 5,000 parts. Thirdly, sensitive labels such asparts, storages, packages, and suppliers are anonymized. No comprehensive conclusionabout the company can be made.
6.1.2 Implementing the concept
The concept must be implemented to enable the industrial application. The implementa-tion requires the three steps of (1) planning and data extraction, (2) data preprocessing,and (3) mining (cf. Chapter 4). Afterward, three different case studies focusing onwaste analysis and evaluation were conducted separately. Experience gained during thethree case studies has been used to continuously improve the concept.
Step 1: Planning and data extraction
The first step of the concept aims to define objectives and analysis questions, to identify,extract and standardize data, and to validate data (cf. Section 4.4.1). The interdisci-plinary project team conducted multiple workshops to define the objectives and analysisquestions. Existing problems within operations and potential improvements were dis-cussed. By iterating the analysis questions, three case studies were prioritized. A precise
1 The reported results in this thesis are based on the sample of the internal logistics system. Decisions madeduring the case studies rely on the holistic picture, e.g., different time frames.
136
6.1 Industrial application
description of the case studies and the underlying analysis questions are provided foreach case separately.2
• Case Study I: Analyzing deviations of reference processes. Identify and character-ize systematic deviations of reference processes, e.g., quality issues.
• Case Study II: Demand-based process leveling. Identify inefficient processing ofvalue streams based on the customer demand for product variants.
• Case Study III: Analyzing the inventory. Identify value streams with waste ofinventory levels that can be reduced.
The internal logistics ontology was used as a fundamental source for identifying, ex-tracting, and standardizing the data (cf. Section 5.1.1). The team identified the requiredclasses and properties in the application-specific information systems. In total, theteam identified four relevant information systems with multiple tables. The informationtechnology department completed the extraction of the event data (transfer orders). Twoapplication-specific attributes were required: activity categories and activity duration toprovide the required input data for preprocessing. Occurring activities (events) wereidentified using activity mapping and prioritized by the event frequency to classifythe activity category (cf. Section 5.3.3). The team classified activities with at least100 events3. The remaining 526 activities, or 0.01% of all events, were classified asunclassified. Existing planning department reference data were used to complete theactivity duration. Master data (e.g., packaging) were extracted using end-user reports,and the data were standardized using the taxonomy of the ontology. The practicalguideline for event data validation was used to validate the data (cf. Section 5.1.2).
1. Observe the process on the shop floor. Based on multiple visits on the shop floor,existing material and information flow activities were uncovered, and the datacreation was captured. Most of the time, mobile bar code scanners and terminals(e.g., tugger train) were identified as data creation points.
2. Record your own data for each process. Fifteen different storage locationswere prioritized based on the case studies. The activities were observed anddocumented for each location (e.g., part, location, and time). At no time was
2 The workshops and iterations were completed within 2017 and 2018.3 This includes transfer orders from April 1, 2018 to October 15, 2018.
137
6 Application and evaluation
any personalized information recorded. This step showed that the start and endtimestamp of activities was not always documented with a separate bar code scan.However, the completion of a transfer order was always documented.
3. Talk to people who execute the process every day. In the third step, logisticsoperators were interviewed. The interviews confirmed the fact that only thecompletion of an activity is reliable. However, the logistics operators confirmedthat all material flow activities are triggered by transfer orders, except the pickingactivities of parts in the supermarket (separate information system).
4. Compare the findings with existing documentation. Additional documentationwas considered to extend the understanding gained on the shop floor. In particular,the documentation of reference processes, storage locations, and layouts of theproduction plant provided significant value. Furthermore, invisible activitieswithin the storages (e.g., automated conveyor lines) were uncovered.
5. Compare the findings with the event data. The recorded data were compared to theevent data extracted from the information systems, and the imperfection patternswere compared with the event data. In total, three imperfection patterns wereidentified: (1) scattered event (e.g., only one reliable timestamp), (2) scatteredcase (e.g., picking in the supermarket), and (3) collateral events (e.g., low-levelactivities of the automated conveyor lines).
Furthermore, the inventory of five value streams was validated by manually counting thepackages. The product-related master data (e.g., product) were not further validated.
Step 2: Data preprocessing
The second step of the concept aims to preprocess the extracted data into enrichedevent logs suitable for multidimensional process mining. This requires (1) creatingevent logs, (2) enriching event logs, and (3) filtering event logs (cf. Section 4.4.2). Thealgorithms used to preprocess the extracted event data were implemented in Python4.Due to the standardized taxonomy of the extracted data, this step only required minoradjustments. As the transfer orders did not include the start timestamp, the event logscould only provide the completion event of the standard transactional life-cycle model.
4 Python is an open source language suited for code that is often “fast enough to be immediately useful butalso flexible enough to be sped up with additional extensions.” (OLIPHANT 2007, p. 10)
138
6.1 Industrial application
The extracted data (e.g., product) were integrated into the event logs to enrich the eventlogs, and the event logs were filtered to the internal logistics of the assembly line. Dueto privacy reasons, any personalized data had already been removed during the dataextraction. The outcome of this step is enriched event logs stored for each value streamindividually.
Step 3: Mining
The third step mines and clusters the value streams using process mining techniques(cf. Section 4.4.3). This process required an initial tailoring of the six process miningtechniques to the requirements of the case studies, selecting metrics for the performanceanalysis. Here, standardized lean metrics were used (cf. Section 5.3.5). The five otherprocess mining techniques required minor adjustments, e.g., to select the precisionδt = 1 day for inventory profiling. A complete list of the parameters can be found in theAppendix A.3.1. The concept was implemented in Python and Java, which was requiredby the ProM framework5 to reuse the process discovery and conformance checkingalgorithms. As an outcome, all results, i.e., process models, are created automaticallyfor each value stream.
6.1.3 Case Study I: Analyzing deviations of reference processes
Case Study I aims to identify and characterize systematic deviations of referenceprocesses, e.g., quality issues. The team set the objective to quantify deviations ofthe process and to understand the underlying root causes. Based on the assumptionthat reference processes are aligned with lean logistics theory, any deviation, such asadditional activities, is wasteful. Subsequently, Case Study I refers to the waste ofunnecessary transportation, over-processing, and motion. To support the objective, theteam defined two analysis questions:
• Are the value streams processed according to the reference processes in reality,and if not, which reference processes show frequent deviations?
• What are the underlying root causes of frequent deviations?
5 ProM is a framework for process mining in research that is sufficiently flexible and open to reuse code duringthe implementation of new process mining ideas (DONGEN et al. 2005, p. 444).
139
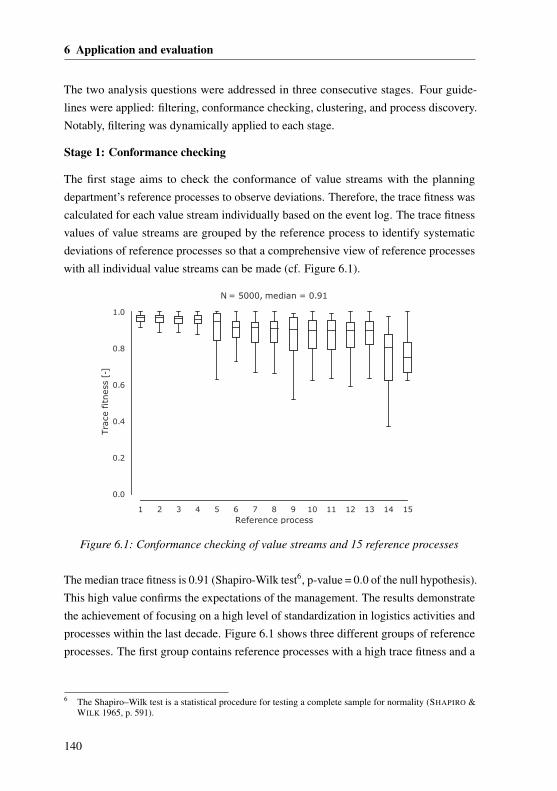
6 Application and evaluation
The two analysis questions were addressed in three consecutive stages. Four guide-lines were applied: filtering, conformance checking, clustering, and process discovery.Notably, filtering was dynamically applied to each stage.
Stage 1: Conformance checking
The first stage aims to check the conformance of value streams with the planningdepartment’s reference processes to observe deviations. Therefore, the trace fitness wascalculated for each value stream individually based on the event log. The trace fitnessvalues of value streams are grouped by the reference process to identify systematicdeviations of reference processes so that a comprehensive view of reference processeswith all individual value streams can be made (cf. Figure 6.1).
1 2 3 4 5 6 7 8 9 10 11 12 13 14 15Reference process
0.0
0.2
0.4
0.6
0.8
1.0
Tra
ce fitness
[-]
N = 5000, median = 0.91
Figure 6.1: Conformance checking of value streams and 15 reference processes
The median trace fitness is 0.91 (Shapiro-Wilk test6, p-value = 0.0 of the null hypothesis).This high value confirms the expectations of the management. The results demonstratethe achievement of focusing on a high level of standardization in logistics activities andprocesses within the last decade. Figure 6.1 shows three different groups of referenceprocesses. The first group contains reference processes with a high trace fitness and a
6 The Shapiro–Wilk test is a statistical procedure for testing a complete sample for normality (SHAPIRO &WILK 1965, p. 591).
140
6.1 Industrial application
short box plot (cf. Reference process 1-4). The short box plot supports the conclusionthat the individual value streams are executed similarly. Also, the second group can becharacterized by a high trace fitness (cf. Reference process 5-13). In contrast to the firstgroup, the box plot is comparatively tall. The distribution within the second group has alarger variance, indicating more process deviations. Consequently, the value streamswithin the first and second quartile must be analyzed in detail using process discovery.If product and process complexity do not allow this step, value stream clustering canbe applied to separate and cluster value streams (cf. Section 5.4.3.2). The third groupshows a low median value for trace fitness (cf. Reference process 14-15). An overalllower alignment with the reference processes can be identified by comparing the thirdgroup with the other two groups. These reference processes and the root causes for thesystematic deviations must be investigated holistically. It can be concluded that tracefitness varies depending on the reference process model. In addition to these tendencies,individual value streams with a low trace fitness can be identified for further analysisacross all reference processes. Nevertheless, the total number of value streams within areference process has to be considered.
Stage 2: Value stream clustering
The second stage aims to understand the root causes of the deviations of referenceprocesses. Reference process 13 has been selected for this thesis due to (1) the lowestmedian trace fitness in the second group and (2) the existing product complexity,including 238 value streams. Value stream clustering in the control-flow perspectiveproposes to separate the root causes based on the activity categories (e.g., quality orrework). For the application, the relative occurrence of cases of an activity category andthe trace fitness values were selected as input for clustering. In addition to the maximumtrace fitness (most likely reference process), the second and third highest trace fitnessvalues were also used for clustering to separate systematic deviations from deviationsintroduced by concept drifts (cf. Section 5.3.6). The gap statistic method was used todetermine the number of clusters. Then, K-means clustering was applied, and the resultswere visualized using t-SNE7 (cf. Figure 6.2).
To understand the result, the six clusters are characterized in Table 6.1. The tracefitness (maximum) is aggregated to the median value of the cluster, and the duration is
7 t-distributed Stochastic Neighbor Embedding is a nonlinear dimensional reduction technique for visualizingthe resulting similarity data (MAATEN & HINTON 2008). Notably, the results are dimensionless.
141
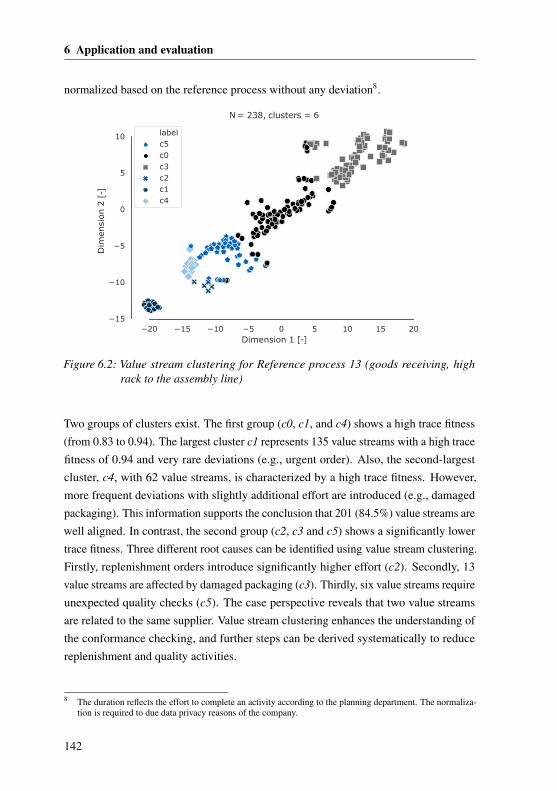
6 Application and evaluation
normalized based on the reference process without any deviation8.
20 15 10 5 0 5 10 15 20Dimension 1 [-]
15
10
5
0
5
10
Dim
ensi
on 2
[-]
N = 238, clusters = 6
labelc5c0c3c2c1c4
Figure 6.2: Value stream clustering for Reference process 13 (goods receiving, highrack to the assembly line)
Two groups of clusters exist. The first group (c0, c1, and c4) shows a high trace fitness(from 0.83 to 0.94). The largest cluster c1 represents 135 value streams with a high tracefitness of 0.94 and very rare deviations (e.g., urgent order). Also, the second-largestcluster, c4, with 62 value streams, is characterized by a high trace fitness. However,more frequent deviations with slightly additional effort are introduced (e.g., damagedpackaging). This information supports the conclusion that 201 (84.5%) value streams arewell aligned. In contrast, the second group (c2, c3 and c5) shows a significantly lowertrace fitness. Three different root causes can be identified using value stream clustering.Firstly, replenishment orders introduce significantly higher effort (c2). Secondly, 13value streams are affected by damaged packaging (c3). Thirdly, six value streams requireunexpected quality checks (c5). The case perspective reveals that two value streamsare related to the same supplier. Value stream clustering enhances the understanding ofthe conformance checking, and further steps can be derived systematically to reducereplenishment and quality activities.
8 The duration reflects the effort to complete an activity according to the planning department. The normaliza-tion is required to due data privacy reasons of the company.
142
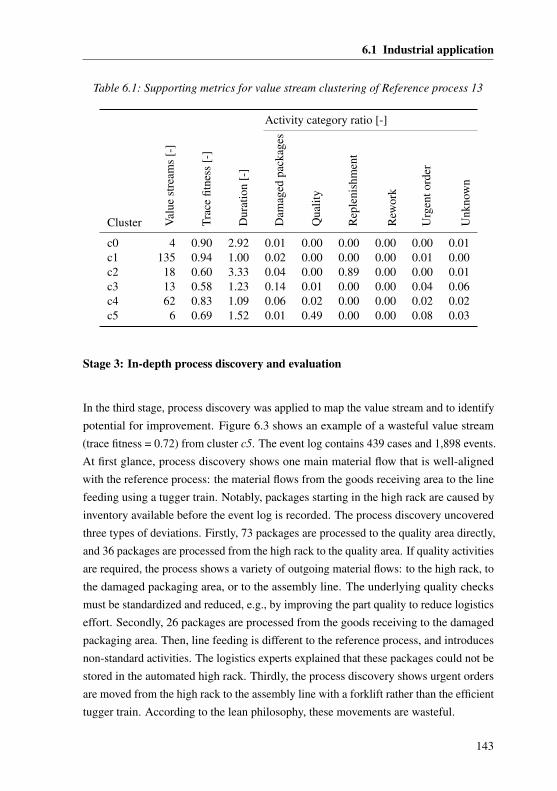
6.1 Industrial application
Table 6.1: Supporting metrics for value stream clustering of Reference process 13
Activity category ratio [-]
Cluster Val
uest
ream
s[-
]
Trac
efit
ness
[-]
Dur
atio
n[-
]
Dam
aged
pack
ages
Qua
lity
Rep
leni
shm
ent
Rew
ork
Urg
ento
rder
Unk
now
n
c0 4 0.90 2.92 0.01 0.00 0.00 0.00 0.00 0.01c1 135 0.94 1.00 0.02 0.00 0.00 0.00 0.01 0.00c2 18 0.60 3.33 0.04 0.00 0.89 0.00 0.00 0.01c3 13 0.58 1.23 0.14 0.01 0.00 0.00 0.04 0.06c4 62 0.83 1.09 0.06 0.02 0.00 0.00 0.02 0.02c5 6 0.69 1.52 0.01 0.49 0.00 0.00 0.08 0.03
Stage 3: In-depth process discovery and evaluation
In the third stage, process discovery was applied to map the value stream and to identifypotential for improvement. Figure 6.3 shows an example of a wasteful value stream(trace fitness = 0.72) from cluster c5. The event log contains 439 cases and 1,898 events.At first glance, process discovery shows one main material flow that is well-alignedwith the reference process: the material flows from the goods receiving area to the linefeeding using a tugger train. Notably, packages starting in the high rack are caused byinventory available before the event log is recorded. The process discovery uncoveredthree types of deviations. Firstly, 73 packages are processed to the quality area directly,and 36 packages are processed from the high rack to the quality area. If quality activitiesare required, the process shows a variety of outgoing material flows: to the high rack, tothe damaged packaging area, or to the assembly line. The underlying quality checksmust be standardized and reduced, e.g., by improving the part quality to reduce logisticseffort. Secondly, 26 packages are processed from the goods receiving to the damagedpackaging area. Then, line feeding is different to the reference process, and introducesnon-standard activities. The logistics experts explained that these packages could not bestored in the automated high rack. Thirdly, the process discovery shows urgent ordersare moved from the high rack to the assembly line with a forklift rather than the efficienttugger train. According to the lean philosophy, these movements are wasteful.
143
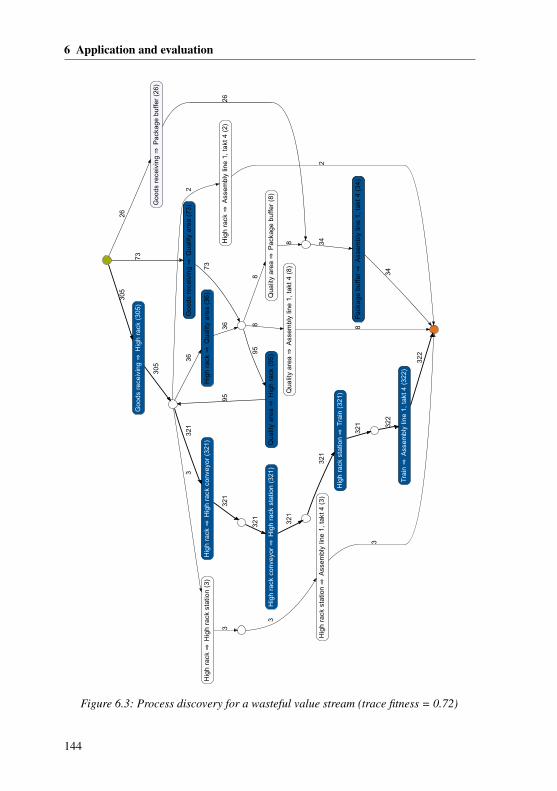
6 Application and evaluation
Go
od
s re
ceiv
ing⇒
Pa
cka
ge
bu
ffe
r (2
6)
26
Hig
h ra
ck s
tatio
n ⇒
Tra
in (
321
)
32
1
Tra
in ⇒
Ass
em
bly
lin
e 1
, ta
kt 4
(3
22)
32
2
Hig
h ra
ck s
tatio
n ⇒
Ass
em
bly
line
1,
takt
4 (
3)
3
Qu
alit
y a
rea
⇒P
ack
age
bu
ffe
r (8
)
8Hig
h ra
ck ⇒
Ass
em
bly
lin
e 1
, ta
kt 4
(2)
2
Hig
h ra
ck ⇒
Qu
alit
y a
rea
(3
6)
36
Hig
h ra
ck c
on
veyo
r ⇒
Hig
h r
ack
sta
tion
(3
21)
32
1Q
ua
lity
are
a ⇒
Ass
em
bly
lin
e 1
, ta
kt 4
(8)
8
Hig
h ra
ck ⇒
Hig
h r
ack
co
nve
yor
(32
1)
32
1
Pa
cka
ge
buff
er ⇒
Ass
em
bly
lin
e 1
, ta
kt 4
(34
)
34
Qu
alit
y a
rea
⇒H
igh
ra
ck (
95
)
95
Go
od
s re
ceiv
ing
⇒H
igh
ra
ck (
30
5)
30
5
Hig
h ra
ck ⇒
Hig
h r
ack
sta
tion
(3
)
3
Go
od
s re
ceiv
ing
⇒Q
ualit
y a
rea
(7
3)
73
34
23
63
21
3
3
26
30
5
73
88
95
32
1
32
2
32
1
Figure 6.3: Process discovery for a wasteful value stream (trace fitness = 0.72)
144
6.1 Industrial application
6.1.4 Case Study II: Demand-based process leveling
Case Study II aims to identify inefficient processing of value streams based on thecustomer demand for product variants. The team set the objective to identify individualvalue streams that can be leveled between costly, e.g., requiring multiple handlingactivities, and cost-efficient, e.g., direct line feeding, processes. The value streams areplanned based on the demand forecast. However, the logistics experts acknowledgedthat customer demand is dynamically changing over time. Not every individual valuestream can be analyzed and evaluated continuously to identify the potential for im-provement. Subsequently, Case Study II refers to waste of unnecessary transportation,over-processing, and motion. To support the objective, the team defined two analysisquestions:
• Which value streams can be characterized by high demand in a costly process?
• Which value streams show a low or medium demand in a cost-efficient process?
The two analysis questions were addressed in two consecutive stages. Firstly, suitablereference processes and related value streams were selected for a detailed analysis. Sec-ondly, value streams were analyzed using process discovery and case perspective. Thesesteps were supported by three different guidelines: filtering, lead times and frequencies(for each process variant), and process discovery. Notably, the case perspective (e.g.,packaging) is required for decision-making.
Stage 1: Filtering & lead times and frequencies (for each process variant)
In the first stage, suitable reference processes and value streams were selected. Compar-ing the approach with pen-and-paper-based value stream mapping, the logistics expertsused (1) the additional attributes (e.g., packaging), (2) the actual reference process andthe required effort, and (3) statistically representative metrics (e.g., average demandover three months) for the selection. The logistics experts suggested focusing on ref-erence processes with small loading carriers (N = 4,417 value streams). To cover theproduct complexity, the demand is compared on the level of packages per day withina value stream. In contrast, comparing the quantity per day, which is available in theERP system, would not reflect the logistics effort for each package. The demand ofpackages per day was calculated for each value stream and grouped by the referenceprocesses. Within the case study, the box plot was selected because of its ability tocompare multiple reference processes (cf. Figure 6.4).
145
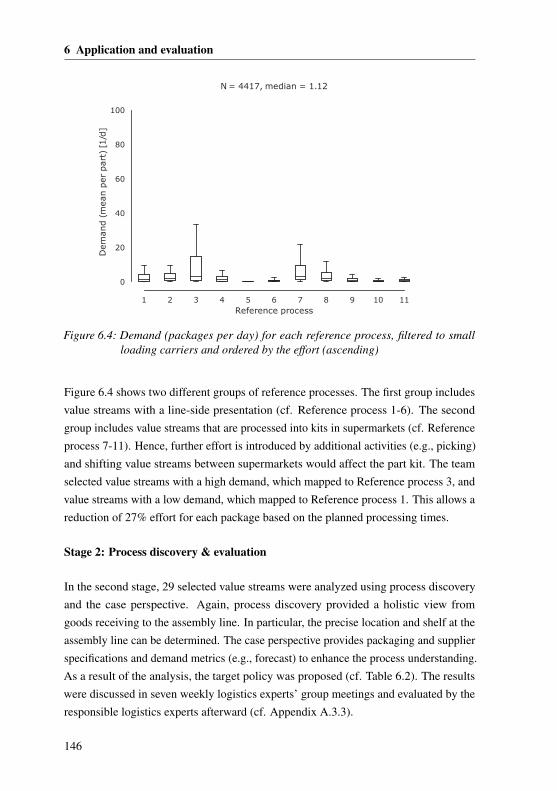
6 Application and evaluation
1 2 3 4 5 6 7 8 9 10 11Reference process
0
20
40
60
80
100D
em
and (
mean p
er
part
) [1
/d]
N = 4417, median = 1.12
Figure 6.4: Demand (packages per day) for each reference process, filtered to smallloading carriers and ordered by the effort (ascending)
Figure 6.4 shows two different groups of reference processes. The first group includesvalue streams with a line-side presentation (cf. Reference process 1-6). The secondgroup includes value streams that are processed into kits in supermarkets (cf. Referenceprocess 7-11). Hence, further effort is introduced by additional activities (e.g., picking)and shifting value streams between supermarkets would affect the part kit. The teamselected value streams with a high demand, which mapped to Reference process 3, andvalue streams with a low demand, which mapped to Reference process 1. This allows areduction of 27% effort for each package based on the planned processing times.
Stage 2: Process discovery & evaluation
In the second stage, 29 selected value streams were analyzed using process discoveryand the case perspective. Again, process discovery provided a holistic view fromgoods receiving to the assembly line. In particular, the precise location and shelf at theassembly line can be determined. The case perspective provides packaging and supplierspecifications and demand metrics (e.g., forecast) to enhance the process understanding.As a result of the analysis, the target policy was proposed (cf. Table 6.2). The resultswere discussed in seven weekly logistics experts’ group meetings and evaluated by theresponsible logistics experts afterward (cf. Appendix A.3.3).
146
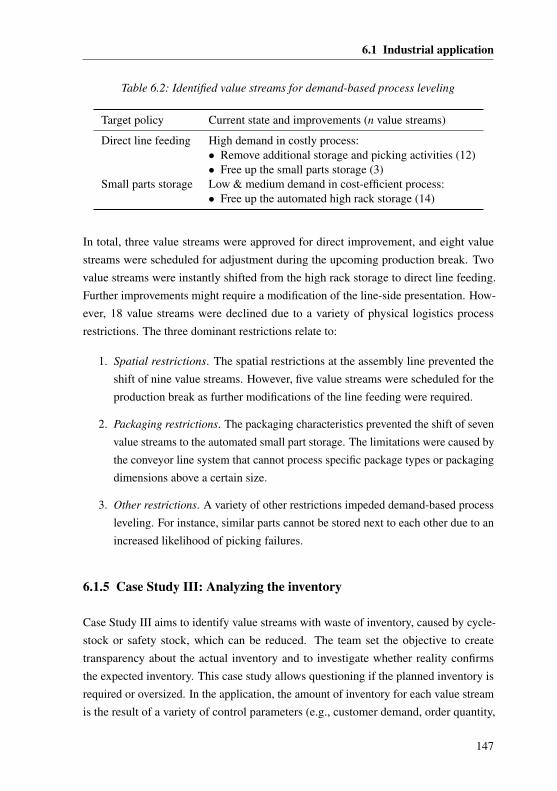
6.1 Industrial application
Table 6.2: Identified value streams for demand-based process leveling
Target policy Current state and improvements (n value streams)
Direct line feeding High demand in costly process:• Remove additional storage and picking activities (12)• Free up the small parts storage (3)
Small parts storage Low & medium demand in cost-efficient process:• Free up the automated high rack storage (14)
In total, three value streams were approved for direct improvement, and eight valuestreams were scheduled for adjustment during the upcoming production break. Twovalue streams were instantly shifted from the high rack storage to direct line feeding.Further improvements might require a modification of the line-side presentation. How-ever, 18 value streams were declined due to a variety of physical logistics processrestrictions. The three dominant restrictions relate to:
1. Spatial restrictions. The spatial restrictions at the assembly line prevented theshift of nine value streams. However, five value streams were scheduled for theproduction break as further modifications of the line feeding were required.
2. Packaging restrictions. The packaging characteristics prevented the shift of sevenvalue streams to the automated small part storage. The limitations were caused bythe conveyor line system that cannot process specific package types or packagingdimensions above a certain size.
3. Other restrictions. A variety of other restrictions impeded demand-based processleveling. For instance, similar parts cannot be stored next to each other due to anincreased likelihood of picking failures.
6.1.5 Case Study III: Analyzing the inventory
Case Study III aims to identify value streams with waste of inventory, caused by cycle-stock or safety stock, which can be reduced. The team set the objective to createtransparency about the actual inventory and to investigate whether reality confirmsthe expected inventory. This case study allows questioning if the planned inventory isrequired or oversized. In the application, the amount of inventory for each value streamis the result of a variety of control parameters (e.g., customer demand, order quantity,
147
6 Application and evaluation
and frequency) that can be set in the ERP system. Aside from the product complexity,dynamics, i.e., multiple deliveries per week and fluctuation in demand, prevent valuestream mapping without process mining. Subsequently, Case Study III provides supportfor continuous monitoring and reducing the amount of inventory. The team defined twoanalysis questions:
• Which value streams introduce waste of cycle-stock or safety stock?
• What are the root causes, and can the inventory be reduced?
The two analysis questions were addressed in two consecutive stages. Firstly, valuestreams with waste of inventory caused by cycle-stock or safety stock were identified.Secondly, inventory profiles of wasteful value streams were analyzed and enhanced bythe case perspective to enable decision-making. These steps were supported by twoguidelines: filtering and inventory analysis.
Stage 1: Filtering
In the first stage, filtering provides an approach for reducing complexity. The logisticsexperts specified that the analysis should focus on value streams with suppliers fromEurope. Otherwise, the risk of supply shortages could offset the benefits. The valuestreams were filtered based on the case perspective. The cycle-stock and safety stockmust be identified separately using performance analysis (cycle-stock and safety stockinventory metrics) to reduce waste of inventory. The cycle-stock refers to the inventorycaused by orders (e.g., frequency), and the safety stock defines the minimum inventoryand the risk of supply shortages on the delivery day (cf. Section 5.3.5).
To cover the product complexity, 100 value streams with small loading carriers and largeloading carriers each were analyzed separately9. An extract of the sample is shown inTable 6.3, please refer to the Appendix (cf. Table A.4 and Table A.5) for statistics. Thedemand (mean) and the inventory (mean) were calculated on the case level (packages),and the mean lead time includes the storage time. The sample highlights the productcomplexity: the demand of packages per day, the inventory, and the lead time vary acrossthe value streams. Uncovering the actual inventory characteristics using performanceanalysis provided a formerly unknown holistic picture of all value streams.
9 For each loading carrier, half the value streams were selected based on the inventory metrics and the otherhalf were sampled randomly. The results do not represent the population.
148
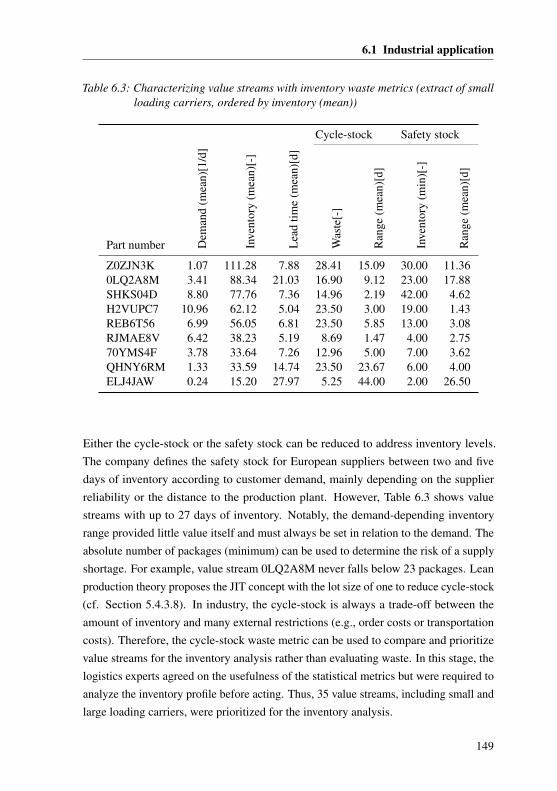
6.1 Industrial application
Table 6.3: Characterizing value streams with inventory waste metrics (extract of smallloading carriers, ordered by inventory (mean))
Cycle-stock Safety stock
Part number Dem
and
(mea
n)[1
/d]
Inve
ntor
y(m
ean)
[-]
Lea
dtim
e(m
ean)
[d]
Was
te[-
]
Ran
ge(m
ean)
[d]
Inve
ntor
y(m
in)[
-]
Ran
ge(m
ean)
[d]
Z0ZJN3K 1.07 111.28 7.88 28.41 15.09 30.00 11.360LQ2A8M 3.41 88.34 21.03 16.90 9.12 23.00 17.88SHKS04D 8.80 77.76 7.36 14.96 2.19 42.00 4.62H2VUPC7 10.96 62.12 5.04 23.50 3.00 19.00 1.43REB6T56 6.99 56.05 6.81 23.50 5.85 13.00 3.08RJMAE8V 6.42 38.23 5.19 8.69 1.47 4.00 2.7570YMS4F 3.78 33.64 7.26 12.96 5.00 7.00 3.62QHNY6RM 1.33 33.59 14.74 23.50 23.67 6.00 4.00ELJ4JAW 0.24 15.20 27.97 5.25 44.00 2.00 26.50
Either the cycle-stock or the safety stock can be reduced to address inventory levels.The company defines the safety stock for European suppliers between two and fivedays of inventory according to customer demand, mainly depending on the supplierreliability or the distance to the production plant. However, Table 6.3 shows valuestreams with up to 27 days of inventory. Notably, the demand-depending inventoryrange provided little value itself and must always be set in relation to the demand. Theabsolute number of packages (minimum) can be used to determine the risk of a supplyshortage. For example, value stream 0LQ2A8M never falls below 23 packages. Leanproduction theory proposes the JIT concept with the lot size of one to reduce cycle-stock(cf. Section 5.4.3.8). In industry, the cycle-stock is always a trade-off between theamount of inventory and many external restrictions (e.g., order costs or transportationcosts). Therefore, the cycle-stock waste metric can be used to compare and prioritizevalue streams for the inventory analysis rather than evaluating waste. In this stage, thelogistics experts agreed on the usefulness of the statistical metrics but were required toanalyze the inventory profile before acting. Thus, 35 value streams, including small andlarge loading carriers, were prioritized for the inventory analysis.
149
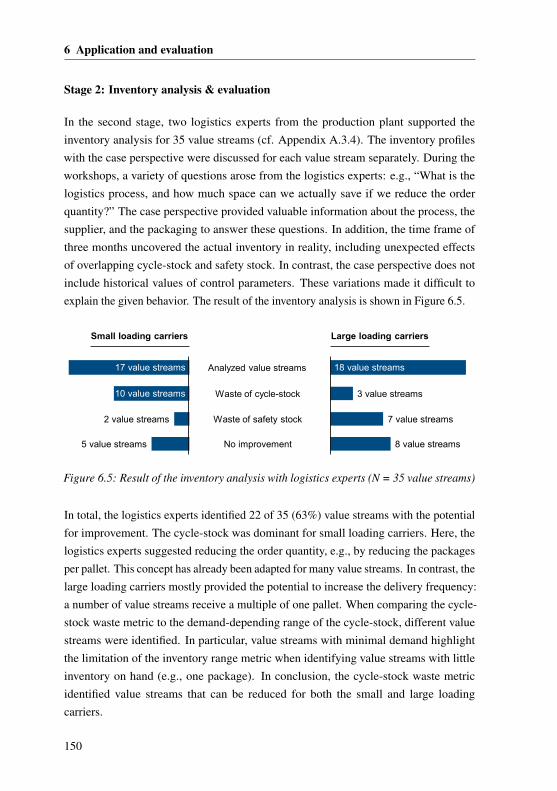
6 Application and evaluation
Stage 2: Inventory analysis & evaluation
In the second stage, two logistics experts from the production plant supported theinventory analysis for 35 value streams (cf. Appendix A.3.4). The inventory profileswith the case perspective were discussed for each value stream separately. During theworkshops, a variety of questions arose from the logistics experts: e.g., “What is thelogistics process, and how much space can we actually save if we reduce the orderquantity?” The case perspective provided valuable information about the process, thesupplier, and the packaging to answer these questions. In addition, the time frame ofthree months uncovered the actual inventory in reality, including unexpected effectsof overlapping cycle-stock and safety stock. In contrast, the case perspective does notinclude historical values of control parameters. These variations made it difficult toexplain the given behavior. The result of the inventory analysis is shown in Figure 6.5.
Small loading carriers Large loading carriers
18 value streamsAnalyzed value streams17 value streams
Waste of safety stock2 value streams 7 value streams
Waste of cycle-stock 3 value streams10 value streams
No improvement 8 value streams5 value streams
Figure 6.5: Result of the inventory analysis with logistics experts (N = 35 value streams)
In total, the logistics experts identified 22 of 35 (63%) value streams with the potentialfor improvement. The cycle-stock was dominant for small loading carriers. Here, thelogistics experts suggested reducing the order quantity, e.g., by reducing the packagesper pallet. This concept has already been adapted for many value streams. In contrast, thelarge loading carriers mostly provided the potential to increase the delivery frequency:a number of value streams receive a multiple of one pallet. When comparing the cycle-stock waste metric to the demand-depending range of the cycle-stock, different valuestreams were identified. In particular, value streams with minimal demand highlightthe limitation of the inventory range metric when identifying value streams with littleinventory on hand (e.g., one package). In conclusion, the cycle-stock waste metricidentified value streams that can be reduced for both the small and large loadingcarriers.
150
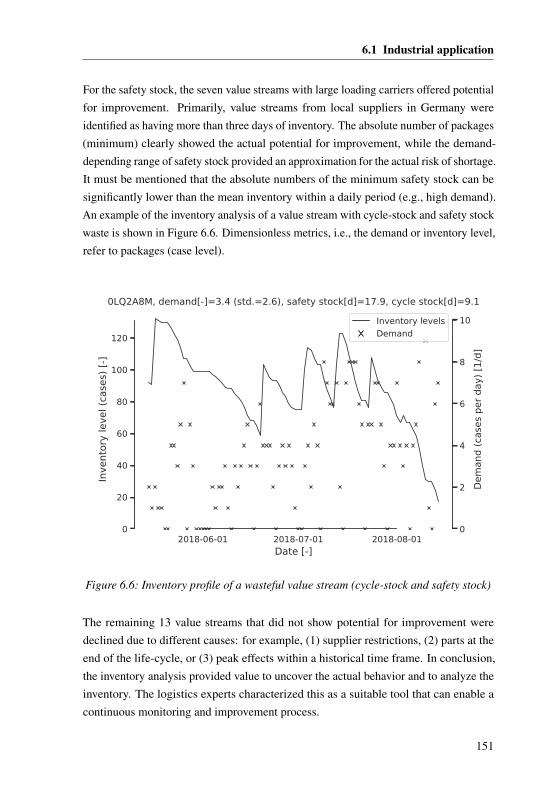
6.1 Industrial application
For the safety stock, the seven value streams with large loading carriers offered potentialfor improvement. Primarily, value streams from local suppliers in Germany wereidentified as having more than three days of inventory. The absolute number of packages(minimum) clearly showed the actual potential for improvement, while the demand-depending range of safety stock provided an approximation for the actual risk of shortage.It must be mentioned that the absolute numbers of the minimum safety stock can besignificantly lower than the mean inventory within a daily period (e.g., high demand).An example of the inventory analysis of a value stream with cycle-stock and safety stockwaste is shown in Figure 6.6. Dimensionless metrics, i.e., the demand or inventory level,refer to packages (case level).
2018-06-01 2018-07-01 2018-08-01Date [-]
0
20
40
60
80
100
120
Inve
ntor
y le
vel (
case
s) [-
]
0LQ2A8M, demand[-]=3.4 (std.=2.6), safety stock[d]=17.9, cycle stock[d]=9.1
0
2
4
6
8
10
Dem
and
(cas
es p
er d
ay) [
1/d]
Inventory levelsDemand
Figure 6.6: Inventory profile of a wasteful value stream (cycle-stock and safety stock)
The remaining 13 value streams that did not show potential for improvement weredeclined due to different causes: for example, (1) supplier restrictions, (2) parts at theend of the life-cycle, or (3) peak effects within a historical time frame. In conclusion,the inventory analysis provided value to uncover the actual behavior and to analyze theinventory. The logistics experts characterized this as a suitable tool that can enable acontinuous monitoring and improvement process.
151
6 Application and evaluation
6.2 Evaluation of the approach
This section aims to identify whether the approach provides the expected impact. There-fore, the approach is evaluated with respect to the fulfillment of the eight requirementsspecified in the conceptual design (cf. Section 4.1). Because of its central role foran industrial application, the requirement to reduce manual effort (cf. R4) is assessedwithin a cost-benefit calculation (cf. Section 6.2.2). Both theoretical and practicalexisting limitations are critically discussed (cf. Section 6.2.3).
6.2.1 Fulfillment of requirements
Value stream mapping
R1. Creating a holistic view of the value stream using process mining. A holistic viewof the value stream includes the process, data boxes, inventory, and associatedspecifications (ROTHER & SHOOK 1999). Hence, the approach supports creatinga holistic view in these dimensions. The value stream, including the material andinformation flow of internal logistics, can be observed from the goods receivingup to the assembly line using process discovery. In addition, extensible databoxes are provided using performance analysis and process discovery in the timeperspective. Similarly, the algorithm developed to mine for the actual inventoryprofile fulfills the inventory dimension. Associated specifications about thesupplier, the product, and the customer (assembly line) are provided to completethe holistic view. The steps to create a holistic view and to identify waste areprovided in an applicable methodology (cf. R5-R8).
R2. Scaling to cover product and process complexity. The application must be able toaddress the product and process complexity in terms of both technical feasibilityand usability. Firstly, multidimensional process mining is tailored to internallogistics. The value stream-specific event logs (e.g., definition of cases) andalgorithms create a holistic view for each value stream. Secondly, the conceptallows horizontal scalability independent of the number of products and processes.Thirdly, the algorithms can be applied for complex processes with thousandsof events, shifting the complexity to the analysis itself. Here, eight practicalguidelines provide support for the analysis and to identify waste (cf. R8).
152
6.2 Evaluation of the approach
R3. Capturing dynamics. The static pen-and-paper-based value stream mapping tooldoes not capture dynamics; only a limited snapshot is recorded on the shopfloor. In contrast, the proposed approach takes advantage of the ground truthof occurring events, as shown in the event logs. Hence, the proposed approachprovides a reliable view of dynamic reality, covering fluctuation in demand andinventory and unobservable activities that do not create value. In addition tothe ground truth itself, the flexibility of the proposed approach (e.g., filtering)supports reconstructing any time and perspective, if required.
Process mining
R5. Supporting the planning stage according to lean production theory. Processmining theory identified that defining concrete objectives and analysis questionsis important for a successful process mining project (ECK et al. 2015). Theconcept includes a generic process mining methodology, and the planning stageis tailored to internal logistics. This tailoring includes (1) an interdisciplinaryproject team with lean experts and the management and (2) the alignment ofobjectives and analysis questions with lean production theory. The establishedtypes of waste can be used to identify suitable guidelines for the analysis andovercome the challenges of application-specific objectives.
R6. Providing a domain ontology for internal logistics. An internal logistics ontologywas developed using the methodology of NOY & MCGUINNESS (2001) to supportdata identification, extraction, and standardization. A literature review of 42relevant publications presenting ontologies in the manufacturing and logisticsdomain was used to enumerate important terms and to define the objects and(data) properties and hierarchy. In particular, this step was aligned with themain purpose of process mining: focusing on the material and information flowof internal logistics. Further extensions, including relations, were iterativelydocumented.
R7. Providing algorithms for creating and enriching event logs for internal logistics.Standardized event logs are required to apply process mining techniques. Firstly,the approach includes an algorithm to create event logs for internal logistics,including the characteristics of domain-specific activities (e.g., de-palletizing unitloads). Secondly, the concept specifies domain-specific attributes to enrich theevent log. Standardized data can be provided using the internal logistics ontology
153
6 Application and evaluation
for this. The algorithms are organized to process each value stream individuallyand scale to cover the product and process complexity (cf. R2).
R8. Supporting the analysis according to lean production theory. The eight practicalguidelines enable an iterative analysis according to lean production theory. Aseach practical guideline integrates lean production with process mining tech-niques, a goal-oriented answer for each analysis question can be supported.Furthermore, the extendable guidelines with standardized properties providelessons learned from other case studies to handle product and process complexity,to provide potential outcomes, and to avoid common pitfalls. Nevertheless, theanalysis remains challenging and requires the interdisciplinary project team.
6.2.2 Cost-benefit calculation
The evidence for lean production and the benefits of value stream mapping have beensuccessfully demonstrated across the manufacturing and logistics industry (cf. Chap-ter 1). In addition, an industrial application with three case studies and the fulfillmentof requirements highlights the effectiveness of the process mining-based approach toaddress existing shortcomings (cf. Section 6.2.1).
A cost-benefit calculation will be discussed in detail (cf. R4: Reducing manual effort).The three case studies in the industrial application confirmed the benefits in terms ofreduced transportation and inventory. However, the three case studies do not allow agenerally valid statement about resulting benefits. The cost-benefit calculation focuseson the break-even analysis of pen-and-paper-based and process mining-based valuestream mapping in the industrial application.
Cost structure
The cost structure of pen-and-paper-based and process mining-based value streammapping is required for a break-even analysis. The cost structure covers the initial effortand continuous efforts and includes the working days of the interdisciplinary team (cf.Table 6.4). The experiences gained and discussed with practitioners in the industrialapplication, student assistants, and estimations of the author were used to quantify theeffort of the two approaches.
154
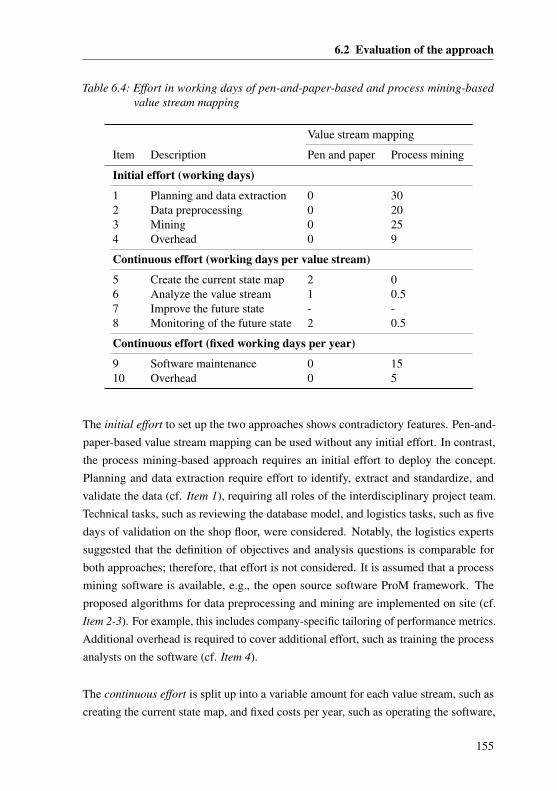
6.2 Evaluation of the approach
Table 6.4: Effort in working days of pen-and-paper-based and process mining-basedvalue stream mapping
Value stream mapping
Item Description Pen and paper Process mining
Initial effort (working days)
1 Planning and data extraction 0 302 Data preprocessing 0 203 Mining 0 254 Overhead 0 9
Continuous effort (working days per value stream)
5 Create the current state map 2 06 Analyze the value stream 1 0.57 Improve the future state - -8 Monitoring of the future state 2 0.5
Continuous effort (fixed working days per year)
9 Software maintenance 0 1510 Overhead 0 5
The initial effort to set up the two approaches shows contradictory features. Pen-and-paper-based value stream mapping can be used without any initial effort. In contrast,the process mining-based approach requires an initial effort to deploy the concept.Planning and data extraction require effort to identify, extract and standardize, andvalidate the data (cf. Item 1), requiring all roles of the interdisciplinary project team.Technical tasks, such as reviewing the database model, and logistics tasks, such as fivedays of validation on the shop floor, were considered. Notably, the logistics expertssuggested that the definition of objectives and analysis questions is comparable forboth approaches; therefore, that effort is not considered. It is assumed that a processmining software is available, e.g., the open source software ProM framework. Theproposed algorithms for data preprocessing and mining are implemented on site (cf.Item 2-3). For example, this includes company-specific tailoring of performance metrics.Additional overhead is required to cover additional effort, such as training the processanalysts on the software (cf. Item 4).
The continuous effort is split up into a variable amount for each value stream, such ascreating the current state map, and fixed costs per year, such as operating the software,
155
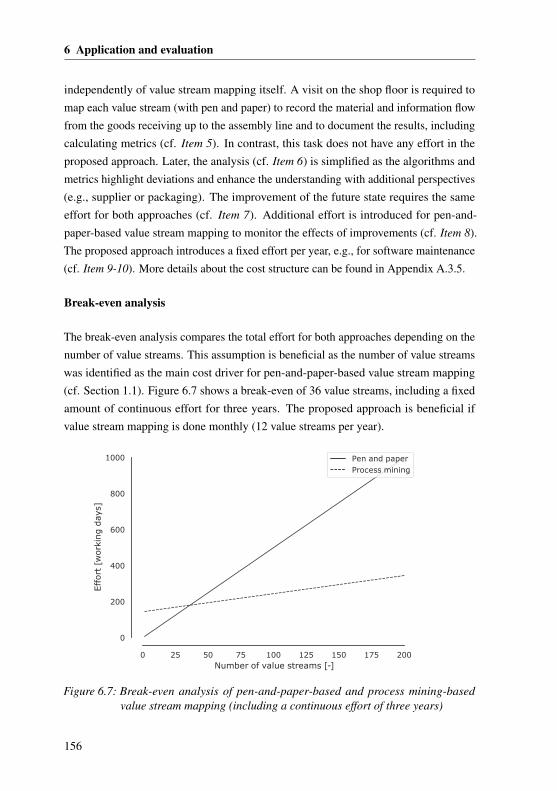
6 Application and evaluation
independently of value stream mapping itself. A visit on the shop floor is required tomap each value stream (with pen and paper) to record the material and information flowfrom the goods receiving up to the assembly line and to document the results, includingcalculating metrics (cf. Item 5). In contrast, this task does not have any effort in theproposed approach. Later, the analysis (cf. Item 6) is simplified as the algorithms andmetrics highlight deviations and enhance the understanding with additional perspectives(e.g., supplier or packaging). The improvement of the future state requires the sameeffort for both approaches (cf. Item 7). Additional effort is introduced for pen-and-paper-based value stream mapping to monitor the effects of improvements (cf. Item 8).The proposed approach introduces a fixed effort per year, e.g., for software maintenance(cf. Item 9-10). More details about the cost structure can be found in Appendix A.3.5.
Break-even analysis
The break-even analysis compares the total effort for both approaches depending on thenumber of value streams. This assumption is beneficial as the number of value streamswas identified as the main cost driver for pen-and-paper-based value stream mapping(cf. Section 1.1). Figure 6.7 shows a break-even of 36 value streams, including a fixedamount of continuous effort for three years. The proposed approach is beneficial ifvalue stream mapping is done monthly (12 value streams per year).
0 25 50 75 100 125 150 175 200Number of value streams [-]
0
200
400
600
800
1000
Effort
[w
ork
ing d
ays
]
Pen and paperProcess mining
Figure 6.7: Break-even analysis of pen-and-paper-based and process mining-basedvalue stream mapping (including a continuous effort of three years)
156
6.2 Evaluation of the approach
6.2.3 Limitations
The underlying assumptions of the approach were defined in the conceptual design (cf.Section 4.2) to specify the validity range. Possible limitations occur if the assumptionscannot be validated or if simplifications are required. In the following section, possiblelimitations are theoretically discussed against the assumptions. In addition, the generallimitations of the evaluation approach are critically reflected.
L1. Lean production and lean logistics. The approach is only valid if the system isdesigned and operated according to lean philosophy. A common understandingof objectives (e.g., short lead times), principles (e.g., continuous improvement),and the reduction of waste (e.g., inventories) is necessary. Otherwise, the leanphilosophy must be established first. Standardized material and information flowactivities are essential; otherwise, no improvements for the future state can bederived using the recorded value stream. However, this limitation also exists forstatic pen-and-paper-based value stream mapping.
L2. Product and process complexity and dynamics. The approach is an extensionof pen-and-paper-based value stream mapping and only suitable if existing chal-lenges of value stream mapping are significant. The case studies demonstratedthe capability to create transparency about a logistics system with product andprocess complexity and dynamics. However, the challenges of value streammapping are shifted from the mapping to the analysis of the value stream. Eventhough the approach includes eight practical guidelines to support the analysis,this step remains challenging. While the approach demonstrates its value, furthereffort is introduced, and a cost-benefit calculation between the approach and thepen-and-paper-based value stream mapping is necessary. Without any productand process complexity or dynamics, the effort exceeds the benefits.
L3. Data availability. The approach utilizes event data created within the materialand information flow, based on the assumption that event data is created andrecorded. If the logistics processes are not operated by information systems or donot create event data, the approach cannot be applied. However, if the logisticssystem can be operated without information systems, existing product and processcomplexity is comparatively low, and pen-and-paper-based value stream mappingmight be suitable (cf. L2).
157
6 Application and evaluation
L4. Data reliability. The approach assumes that the data is reliable. The event datarepresent the actual behavior in reality by recording events frequently and storingevents without exceptions. Although the imperfection patterns, such as differentinformation systems, can be identified during the data validation step, furthereffort might be required to fix the issues and to ensure data reliability.
L5. Interdisciplinary project team. The approach requires an interdisciplinary projectteam, including logistics experts and process analysts. In contrast to pen-and-paper-based value stream mapping, additional IT competencies are required. Thisaffects the logistics experts, who understand where data is created, and processanalysts familiar with the process mining software who must be trained.
The nature of the evaluation approach, an application evaluation, introduces additionallimitations to the identified limitations of the proposed concept. An application evalua-tion aims to identify whether support can be provided for the task for which it is intended(BLESSING & CHAKRABARTI 2009, p. 37). The application evaluation focuses on theidentified shortcomings of pen-and-paper-based value stream mapping. While the threecase studies confirm the benefits in terms of effectiveness and efficiency, the outcomesdo not allow a generally valid statement that equal benefits for each value stream, casestudy, or manufacturing company can be achieved.
The cost-benefit calculation focuses on the break-even analysis to overcome theselimitations. Nevertheless, the underlying cost structure of the two approaches is basedon the author’s estimations. The estimated effort depends on the available skills androles, resources, and information systems in the industrial application. This limitationis lessened in this case because the three case studies were carried out within oneproduction plant of one manufacturing company. Thus, individual experiences anddecisions of the interdisciplinary project team also affected the estimation.
158
7 Conclusion
7.1 Summary
Pen-and-paper-based value stream mapping is the established tool for recording pro-cesses, identifying waste, and deriving recommendations for action. Today, however, itsapplication in the manufacturing and logistics industry requires a high level of effort andis challenging due to product and process complexity and issues involving dynamics.
Process mining is a relatively young research discipline that helps to utilize event datato discover, analyze, and improve processes. Process mining connects business processmodeling and analysis with data mining. Today, the day-to-day business of internallogistics is based on information systems that create a vast amount of event data.
Therefore, the overarching objective of the thesis is to enable an effective and efficientapplication of value stream mapping in internal logistics using process mining. Thethesis contributes (cf. Research Contributions (RCs)) to the synthesis of the researchstreams of value stream mapping and process mining (cf. Research Questions (RQs)).
RQ1. Which data is required, and how must that data be prepared for value stream
mapping for internal logistics using process mining?
RC1. Process mining theory proposes ontology-based data extraction and prepro-cessing. Therefore, an internal logistics ontology for process mining hasbeen developed using a systematic review approach. The ontology includesthe main classes, object properties, and data properties of internal logistics.
RC2. Many data quality issues have been reported in the field of process mining.A practical guideline to validate the data has been developed to close thegap between event data, processes, and activities on the shop floor.
159
7 Conclusion
RC3. Process mining requires event logs as input. Algorithms that create, enrich,and filter event logs for each value stream have been developed to preparethe event data of internal logistics for value stream mapping.
RQ2. Which process mining methods, concepts, and algorithms are capable of ex-
tracting and characterizing process models while capturing product and process
complexity?
RC4. Many algorithms, techniques, and concepts exist in process mining theory.Existing literature on process mining, with applications in manufacturingand logistics, has been reviewed systematically and evaluated in terms ofsupport for the thesis.
RC5. The process discovery and conformance checking techniques have beentailored to provide a holistic view of each value stream. As process miningdoes not cover the inventory perspective of value stream mapping, analgorithm for inventory profiling using event logs has been developed.
RC6. Performance analysis, activity mapping, and clustering have been tailoredto provide a comprehensive picture of all value streams so that a systematicanalysis in the context of product and process complexity can be madepossible.
RQ3. Which steps are required to enable a systematic analysis according to lean
production theory?
RC7. Eight practical guidelines that enable a systematic and iterative analysishave been developed and organized using an Activity-based DSM. Theseguidelines integrate lean production theory (e.g., types of waste) and processmining (e.g., techniques and perspectives). Existing findings of processmining applications in manufacturing and logistics have been integratedusing a review-based approach.
RC8. A methodology for practitioners has been developed to apply the developedconcepts for value stream mapping using process mining. The methodologyfocuses on the practical outcomes according to lean production theory.
160
7.2 Future research
The concept has been implemented in industry, and three case studies have been con-ducted to evaluate the practical benefit. The findings have been used to evaluate thestrengths and limitations of the approach.
7.2 Future research
This thesis concludes with an outline of three potential directions for future research: (1)extending the approach, (2) evaluating the concept in other applications and domains,and (3) linking the concepts to other research streams.
Extending the approach
Planning and data extraction. The research stream of value stream mapping canprovide further support for defining objectives and analysis questions. For example,by reviewing case studies or carrying out a survey with manufacturing companies,frequently used objectives and analysis questions can be extracted, linked to processmining, and integrated as a set of best practices. Data extraction and validation canbe further supported by integrating algorithms to check data failure patterns (VAN
CRUCHTEN & WEIGAND 2018, p. 3). Further research can also improve the dataavailability itself by specifying how and which data must be created and recorded onthe shop floor. For instance, when integrating mobile devices or replacing forklifts withautonomous transport robots, process mining requirements can be included.
Data preprocessing. The proposed approach focuses on event data (transfer orders)created by the WMS. Today, promising concepts have been developed that use theRFID data available in internal logistics (e.g., GERKE et al. 2009; ZHONG et al. 2016).This direction can be used to improve the precision of value stream mapping.
Mining. The developed approach covers time-dependent dynamics using the event logsand allows a manual analysis of different time frames. However, process mining theoryproposes concepts to detect concept drifts automatically. Then, time-dependent patternsacross multiple value streams (e.g., increasing inventory) can be identified. Duringmining, further support can be provided by integrating additional domain-specificcharacteristics, e.g., waste types, into process discovery algorithms (cf. YAHYA et al.2016). Another promising research direction is the prediction of future states. Bayesian
161
7 Conclusion
networks, for example, could be used to predict the lateness of line feeding activities toavoid production shutdowns (cf. SUTRISNOWATI et al. 2015).
Analysis and evaluation. The proposed approach includes eight practical guidelines tosupport the analysis with the main objective of eliminating waste. Here, future researchactivities can focus on further principles of lean production theory: e.g., synchronizingthe takt time, or developing continuous flow or supermarket pull systems. Also, theanalysis could be enhanced using advanced visualization techniques. For example,process analysts can be guided during the analysis by highlighting critical wastes inthe process model. Recent literature on process mining proposes other data miningapproaches to correlate various features, such as attributes. For example, clusteringcan be combined with decision trees or frequent itemset mining to identify the mostdominant attributes for each cluster (e.g., LEONI et al. 2016; SYAMSIYAH et al. 2017).
Evaluating the approach in other applications and domains
For now, the approach has been implemented in an industrial application, and threecase studies have been conducted. However, further evaluation in internal logisticswith different objectives and analysis questions, teams, or information systems must becompleted. The approach, for example, can be applied in different companies or in along-term study. Then, a cross-case analysis can provide further insights about strengthsand limitations.
Aside from internal logistics, the approach must be tailored to manufacturing pro-cesses, (1) providing a manufacturing ontology for process mining, (2) extracting andpreprocessing data from manufacturing processes (e.g., MES or MRP), (3) and tailor-ing the concept of value stream mapping and the analysis for manufacturing-specificrequirements.
Adapting the techniques to other research streams
The concepts of the thesis can support related research streams, such as performancemeasurement, simulation, or operations research. These research streams requireaccurate and valid input data. Here, the manual effort can be reduced, and the qualitycan be improved if event logs and process mining techniques are applied.
162
References
ALHARBI et al. 2017Alharbi, A.; Bulpitt, A.; Johnson, O.: Improving Pattern Detection in HealthcareProcess Mining Using an Interval-Based Event Selection Method. In: Business
Process Management Forum. Ed. by J. Carmona; G. Engels; A. Kumar. Cham:Springer. 2017, pp. 88–105.
ALVAREZ et al. 2018Alvarez, C.; Rojas, E.; Arias, M.; Munoz-Gama, J.; Sepúlveda, M.; Herskovic, V.;Capurro, D.: Discovering role interaction models in the Emergency Room usingProcess Mining. Journal of Biomedical Informatics 78 (2018), pp. 60–77.
ANDREWS et al. 2018Andrews, R.; Suriadi, S.; Ouyang, C.; Poppe, E.: Towards event log querying fordata quality: Let’s start with detecting log imperfections. In: 26th International
Conferece on Cooperative Information Systems (CoopIS 2018). Ed. by H. Panetto;C. Debruyne; H. Proper; C. Ardagna; D. Roman; R. Meersman. Valletta, Malta:Springer. 2018, pp. 116–134.
ARNOLD et al. 2010Arnold, D.; Isermann, H.; Kuhn, A.; Tempelmeier, H.; Furmans, K.: Handbuch
Logistik. Berlin Heidelberg: Springer. 2010.
BABAI et al. 2015Babai, M.; Ladhari, T.; Lajili, I.: On the inventory performance of multi-criteriaclassification methods: empirical investigation. International Journal of Production
Research 53 (2015) 1, pp. 279–290.
163
References
BAKER 2007Baker, P.: An exploratory framework of the role of inventory and warehousing ininternational supply chains. The International Journal of Logistics Management 18(2007) 1, pp. 64–80.
J. BAUER 2014Bauer, J.: Produktionslogistik/Produktionssteuerung kompakt. Wiesbaden: Springer.2014.
W. BAUER et al. 2014Bauer, W.; Ganschar, O.; Gerlach, S.: Development of a Method for Visualizationand Evaluation of Production Logistics in a Multi-variant Production. Procedia
CIRP 17 (2014), pp. 481–486.
BAUERNHANSEL et al. 2016Bauernhansel, T.; Krüger, J.; Reinhart, G.; Schuh, G.: WGP-Standpunkt Industrie
4.0. Tech. rep. Wissenschaftliche Gesellschaft für Produktionstechnik WGP e.V.2016.
BECKER & INTOYOAD 2017Becker, T.; Intoyoad, W.: Context Aware Process Mining in Logistics. Procedia
CIRP 63 (2017), pp. 557–562.
BECKER et al. 2017Becker, T.; Lütjen, M.; Porzel, R.: Process Maintenance of Heterogeneous LogisticSystems - A Process Mining Approach. In: Dynamics in Logistics. Ed. by M. Freitag;H. Kotzab; J. Pannek. Cham: Springer. 2017, pp. 77–86.
BETTACCHI et al. 2016Bettacchi, A.; Polzonetti, A.; Re, B.: Understanding Production Chain BusinessProcess Using Process Mining: A Case Study in the Manufacturing Scenario. In:Advanced Information Systems Engineering Workshops. Ed. by J. Krogstie; H.Mouratidis; J. Su. Cham: Springer. 2016, pp. 193–203.
BLESSING & CHAKRABARTI 2009Blessing, L.; Chakrabarti, A.: DRM, a Design Research Methodology. London:Springer. 2009.
164
References
BOCK & GRUNINGER 2005Bock, C.; Gruninger, M.: PSL: A semantic domain for flow models. Software &
Systems Modeling 4 (2005) 2, pp. 209–231.
BOELL & CECEZ-KECMANOVIC 2014Boell, S. K.; Cecez-Kecmanovic, D.: A hermeneutic approach for conductingliterature reviews and literature searches. Communications of the Association for
Information Systems 34 (2014) 1, pp. 257–286.
BOLT & VAN DER AALST 2015Bolt, A.; van der Aalst, W.: Multidimensional Process Mining Using Process Cubes.In: Enterprise, Business-Process and Information Systems Modeling. Ed. by K.Gaaloul; R. Schmidt; S. Nurcan; S. Guerreiro; Q. Ma. Cham: Springer. 2015,pp. 102–116.
BONFATTI et al. 2010Bonfatti, F.; Monari, P. D.; Martinelli, L.: Proposal for a Logistic Domain Ontology.In: 2010 IST-Africa. 2010, pp. 1–8.
BÖRGER 2012Börger, E.: Approaches to modeling business processes: a critical analysis of BPMN,workflow patterns and YAWL. Software & Systems Modeling 11 (2012) 3, pp. 305–318.
BOSE & VAN DER AALST 2009Bose, J.; van der Aalst, W.: Context Aware Trace Clustering: Towards ImprovingProcess Mining Results. In: Proceedings of the 2009 SIAM International Conference
on Data Mining. Ed. by K. W. Chid Apte Haesun Park; M. J. Zaki. 2009, pp. 397–408.
BOSE & VAN DER AALST 2010Bose, J.; van der Aalst, W.: Trace Clustering Based on Conserved Patterns: TowardsAchieving Better Process Models. In: Business Process Management Workshops.Ed. by S. Rinderle-Ma; S. Sadiq; F. Leymann. Berlin Heidelberg: Springer. 2010,pp. 170–181.
165
References
BOSE et al. 2011Bose, J.; van der Aalst, W.; Žliobaite, I.; Pechenizkiy, M.: Handling Concept Driftin Process Mining. In: Advanced Information Systems Engineering. Ed. by H.Mouratidis; C. Rolland. Berlin Heidelberg: Springer. 2011, pp. 391–405.
BOSE et al. 2013Bose, J.; Mans, R. S.; van der Aalst, W.: Wanna improve process mining results? In:2013 IEEE Symposium on Computational Intelligence and Data Mining (CIDM).2013, pp. 127–134.
BOYSEN et al. 2007Boysen, N.; Fliedner, M.; Scholl, A.: A classification of assembly line balancingproblems. European Journal of Operational Research 183 (2007) 2, pp. 674–693.
BOYSEN et al. 2015Boysen, N.; Emde, S.; Hoeck, M.; Kauderer, M.: Part logistics in the automotiveindustry: Decision problems, literature review and research agenda. European
Journal of Operational Research 242 (2015) 1, pp. 107–120.
BRAGLIA et al. 2006Braglia, M.; Carmignani, G.; Zammori, F.: A new value stream mapping approachfor complex production systems. International Journal of Production Research 44(2006) 18-19, pp. 3929–3952.
BRERETON et al. 2007Brereton, P.; Kitchenham, B. A.; Budgen, D.; Turner, M.; Khalil, M.: Lessons fromapplying the systematic literature review process within the software engineeringdomain. Journal of Systems and Software 80 (2007) 4, pp. 571–583.
BROWNING 2001Browning, T. R.: Applying the design structure matrix to system decompositionand integration problems: a review and new directions. IEEE Transactions on
Engineering Management 48 (2001) 3, pp. 292–306.
BUIJS et al. 2012Buijs, J.; Dongen, B. F. van; van der Aalst, W.: On the Role of Fitness, Precision,Generalization and Simplicity in Process Discovery. In: On the Move to Meaningful
166

References
Internet Systems: OTM 2012. Ed. by R. Meersman; H. Panetto; T. Dillon; S. Rinderle-Ma; P. Dadam; X. Zhou; S. Pearson; A. Ferscha; S. Bergamaschi; I. F. Cruz. BerlinHeidelberg: Springer. 2012, pp. 305–322.
BUIJS et al. 2014Buijs, J.; Van Dongen, B. F.; van der Aalst, W.: Quality Dimensions in ProcessDiscovery: The Importance of Fitness, Precision, Generalization and Simplicity.International Journal of Cooperative Information Systems 23 (2014) 01, pp. 1–40.
BURATTIN 2013Burattin, A.: Applicability of Process Mining Techniques in Business Environments.PhD thesis. Universita di Bologna. 2013.
CALVANESE et al. 2016Calvanese, D.; Montali, M.; Syamsiyah, A.; van der Aalst, W.: Ontology-DrivenExtraction of Event Logs from Relational Databases. In: Business Process Man-
agement Workshops. Ed. by M. Reichert; H. A. Reijers. Cham: Springer. 2016,pp. 140–153.
Cambridge Dictionary 2014Cambridge Dictionary (2014). Cambridge University Press. 2014.
CAPLICE & SHEFFI 1994Caplice, C.; Sheffi, Y.: A Review and Evaluation of Logistics Metrics. The Interna-
tional Journal of Logistics Management 5 (1994) 2, pp. 11–28.
CHOW et al. 1994Chow, G.; Heaver, T. D.; Henriksson, L. E.: Logistics Performance: Definition andMeasurement. International Journal of Physical Distribution & Logistics Manage-
ment 24 (1994) 1, pp. 17–28.
CHU et al. 2016Chu, X.; Ilyas, I. F.; Krishnan, S.; Wang, J.: Data Cleaning: Overview and EmergingChallenges. In: Proceedings of the 2016 International Conference on Management
of Data. San Francisco, California: ACM. 2016, pp. 2201–2206.
DAKIC et al. 2018Dakic, D.; Stefanovic, D.; Cosic, I.; Lolic, T.; Medojevic, M.: Business Process
167
References
Mining Application: A Literature Review. In: Annals of DAAAM and Proceedings
of the International DAAAM Symposium 29. 2018, pp. 866–875.
DAVENPORT 1992Davenport, T. H.: Process Innovation: Reengineering Work through Information
Technology. Cambridge, Massachusetts: Harvard Business Review Press. 1992.
DE WEERDT et al. 2013De Weerdt, J.; vanden Broucke, S.; Vanthienen, J.; Baesens, B.: Active TraceClustering for Improved Process Discovery. IEEE Transactions on Knowledge and
Data Engineering 25 (2013) 12, pp. 2708–2720.
DENISOV et al. 2018Denisov, V.; Fahland, D.; van der Aalst, W.: Unbiased, Fine-Grained Descriptionof Processes Performance from Event Data. In: Business Process Management.Ed. by M. Weske; M. Montali; I. Weber; J. vom Brocke. Cham: Springer. 2018,pp. 139–157.
DIN EN 55405 2014DIN EN 55405: Packaging - Terminology - Terms and definitions; Amendment A1.Norm.
DIŠEK et al. 2017Dišek, M.; Šperka, R.; Kolesár, J.: Conversion of Real Data from Production Processof Automotive Company for Process Mining Analysis. In: Agent and Multi-Agent
Systems: Technology and Applications. Ed. by G. Jezic; M. Kusek; Y.-H. J. Chen-Burger; R. J. Howlett; L. C. Jain. Cham: Springer. 2017, pp. 223–233.
DONGEN et al. 2005Dongen, B. F. van; Medeiros, A. K. A. de; Verbeek, H. M. W.; Weijters, A. J. M. M.;van der Aalst, W.: The ProM Framework: A New Era in Process Mining ToolSupport. In: Applications and Theory of Petri Nets 2005. Ed. by G. Ciardo; P.Darondeau. Berlin Heidelberg: Springer. 2005, pp. 444–454.
DONGEN et al. 2009Dongen, B. F. van; Alves de Medeiros, A. K.; Wen, L.: “Process Mining: Overviewand Outlook of Petri Net Discovery Algorithms”. In: Transactions on Petri Nets
168
References
and Other Models of Concurrency II: Special Issue on Concurrency in Process-
Aware Information Systems. Ed. by K. Jensen; W. van der Aalst. Berlin Heidelberg:Springer. 2009, pp. 225–242.
DÖRNHÖFER 2016Dörnhöfer, M.: Entwicklung eines modularen Kennzahlensystems für die Automo-billogistik im Kontext der schlanken Logistik. PhD thesis. Technical University ofMunich. 2016.
DÖRNHÖFER et al. 2016Dörnhöfer, M.; Schröder, F.; Günthner, W. A.: Logistics performance measurementsystem for the automotive industry. Logistics Research 9 (2016) 1, pp. 2–26.
DURCHHOLZ 2014Durchholz, J.: Vorgehen zur Planung eines schlanken Logistikprozesses - Wert-stromdesign für die Logistik -. PhD thesis. Technical University of Munich. 2014.
DURDEN et al. 1999Durden, C. H.; Hassel, L. G.; Upton, D. R.: Cost Accounting and PerformanceMeasurement in a Just-in-Time Production Environment. Asia Pacific Journal of
Management 16 (1999) 1, pp. 111–125.
ECK et al. 2015Eck, M. L. van; Lu, X.; Leemans, S.; van der Aalst, W.: PM2: A Process MiningProject Methodology. In: Advanced Information Systems Engineering. Ed. by J.Zdravkovic; M. Kirikova; P. Johannesson. Cham: Springer. 2015, pp. 297–313.
ER et al. 2015aEr, M.; Astuti, H. M.; Wardhani, I. R. K.: Material Movement Analysis for Ware-house Business Process Improvement with Process Mining: A Case Study. In: Asia
Pacific Business Process Management. Ed. by J. Bae; S. Suriadi; L. Wen. Cham:Springer. 2015, pp. 115–127.
ER et al. 2015bEr, M.; Astuti, H. M.; Pramitasari, D.: Modeling and Analysis of Incoming RawMaterials Business Process: A Process Mining Approach. International Journal of
Computer and Communication Engineering 4 (2015) 3, pp. 196–203.
169
References
ER et al. 2018Er, M.; Arsad, N.; Astuti, H.; Kusumawardani, R.; Utami, R.: Analysis of productionplanning in a global manufacturing company with process mining. Journal of
Enterprise Information Management 31 (2018) 2, pp. 317–337.
ERLACH 2010Erlach, K.: Wertstromdesign. Berlin Heidelberg: Springer. 2010.
FAROOQUI et al. 2019Farooqui, A.; Bengtsson, K.; Falkman, P.; Fabian, M.: From factory floor to processmodels: A data gathering approach to generate, transform, and visualize manufactu-ring processes. CIRP Journal of Manufacturing Science and Technology 24 (2019),pp. 6–16.
FEAU et al. 2016Feau, B.; Schaller, C.; Moliner, M.: A Method to Build a Production Process Modelprior to a Process Mining Approach. In: INTELLI 2016, The Fifth International
Conference on Intelligent Systems and Applications. 2016, pp. 129–132.
FORNO et al. 2014Forno, A. J. D.; Pereira, F. A.; Forcellini, F. A.; Kipper, L. M.: Value StreamMapping: a study about the problems and challenges found in the literature from thepast 15 years about application of Lean tools. International Journal of Advanced
Manufacturing Technology 72 (2014) 5, pp. 779–790.
FULLERTON & WEMPE 2009Fullerton, R. R.; Wempe, W. F.: Lean manufacturing, non-financial performancemeasures, and financial performance. International Journal of Operations and
Production Management 29 (2009) 3, pp. 214–240.
FUMAGALLI et al. 2014Fumagalli, L.; Pala, S.; Garetti, M.; Negri, E.: Ontology-Based Modeling of Man-ufacturing and Logistics Systems for a New MES Architecture. In: Advances in
Production Management Systems. Innovative and Knowledge-Based Production
Management in a Global-Local World. Ed. by B. Grabot; B. Vallespir; S. Gomes;A. Bouras; D. Kiritsis. Berlin Heidelberg: Springer. 2014, pp. 192–200.
170
References
GANE & SARSON 1979Gane, C. P.; Sarson, T.: Structured Systems Analysis: Tools and Techniques. PrenticeHall. 1979.
GERKE et al. 2009Gerke, K.; Claus, A.; Mendling, J.: Process mining of RFID-based supply chains.In: 2009 IEEE Conference on Commerce and Enterprise Computing. Vienna: IEEE.2009, pp. 285–292.
GLASCHKE et al. 2016Glaschke, C.; Gronau, N.; Bender, B.: Cross-System Process Mining using RFIDTechnology. In: Proceedings of the Sixth International Symposium on Business
Modeling and Software Design. INSTICC. SciTePress. 2016, pp. 179–186.
GOLDSBY & MARTICHENKO 2005Goldsby, T.; Martichenko, R.: Lean Six Sigma Logistics. Boca Raton, Florida: J.Ross Publishing. 2005.
GRAVES 1981Graves, S. C.: A Review of Production Scheduling. Operations Research 29 (1981)4, pp. 646–675.
GRUBER 1995Gruber, T. R.: Toward principles for the design of ontologies used for knowledgesharing? International Journal of Human-Computer Studies 43 (1995) 5, pp. 907–928.
GUDEHUS & KOTZAB 2012Gudehus, T.; Kotzab, H.: Comprehensive Logistics. Berlin Heidelberg: Springer.2012.
GUNASEKARAN & KOBU 2007Gunasekaran, A.; Kobu, B.: Performance measures and metrics in logistics and sup-ply chain management: A review of recent literature (1995-2004) for research andapplications. International Journal of Production Research 45 (2007) 12, pp. 2819–2840.
171
References
GÜNTHER & VAN DER AALST 2007Günther, C. W.; van der Aalst, W.: Fuzzy Mining - Adaptive Process SimplificationBased on Multi-perspective Metrics. In: Business Process Management. Ed. by G.Alonso; P. Dadam; M. Rosemann. Berlin Heidelberg: Springer. 2007, pp. 328–343.
GÜNTHNER & SCHNEIDER 2011Günthner, W.; Schneider, O.: Methode zur einfachen Aufnahme und intuitiven Visu-
alisierung innerbetrieblicher logistischer Prozesse. Tech. rep. Technical Universityof Munich. 2011.
GÜNTHNER & BOPPERT 2013Günthner, W.; Boppert, J.: Lean Logistics. Berlin Heidelberg: Springer. 2013.
HAMMER & CHAMPY 1993Hammer, M.; Champy, J.: Reengineering the Corporation: Manifesto for Business
Revolution. HarperBusiness. 1993.
HIMOFF et al. 2006Himoff, J.; Rzevski, G.; Skobelev, P.: Magenta Technology Multi-agent Logisticsi-Scheduler for Road Transportation. In: Proceedings of the Fifth International
Joint Conference on Autonomous Agents and Multiagent Systems. AAMAS ’06.Hakodate, Japan: ACM. 2006, pp. 1514–1521.
HINES et al. 1998Hines, P.; Rich, N.; Esain, A.: Creating a lean supplier network: a distributionindustry case. European Journal of Purchasing & Supply Management 4 (1998) 4,pp. 235–246.
HOLWEG 2007Holweg, M.: The genealogy of lean production. Journal of Operations Management
25 (2007) 2, pp. 420–437.
HORENBEEK et al. 2013Horenbeek, A. V.; Buré, J.; Cattrysse, D.; Pintelon, L.; Vansteenwegen, P.: Jointmaintenance and inventory optimization systems: A review. International Journal
of Production Economics 143 (2013) 2, pp. 499–508.
172
References
HOXHA et al. 2010Hoxha, J.; Scheuermann, A.; Bloehdorn, S.: An Approach to Formal and SemanticRepresentation of Logistics Services. In: Proceedings of the Workshop on Artificial
Intelligence and Logistics (AILog) at the 19th European Conference on Artificial
Intelligence (ECAI 2010). Ed. by K. Schill. 2010, pp. 73–78.
HSIAO et al. 2016Hsiao, B.; Shu, L.; Young, M.; Yang, H.-C.: Using Process Mining to Measure theExpected Costs of Business Processes. In: PACIS 2016 Proceedings. 2016.
INGVALDSEN & GULLA 2008Ingvaldsen, J. E.; Gulla, J. A.: Preprocessing Support for Large Scale ProcessMining of SAP Transactions. In: Business Process Management Workshops. Ed.by A. ter Hofstede; B. Benatallah; H.-Y. Paik. Berlin Heidelberg: Springer. 2008,pp. 30–41.
INTAYOAD & BECKER 2018aIntayoad, W.; Becker, T.: Applying Process Mining in Manufacturing and Logisticfor Large Transaction Data. In: Dynamics in Logistics. Ed. by M. Freitag; H. Kotzab;J. Pannek. Cham: Springer. 2018, pp. 378–388.
INTAYOAD & BECKER 2018bIntayoad, W.; Becker, T.: Exploring the Relationship between Business Processesand Contextual Information in Manufacturing and Logistics Based on Event Logs.Procedia CIRP 72 (2018), pp. 557–562.
JAREEVONGPIBOON & JANECEK 2013Jareevongpiboon, W.; Janecek, P.: Ontological approach to enhance results of busi-ness process mining and analysis. Business Process Management Journal 19 (2013)3, pp. 459–476.
JINBING et al. 2008Jinbing, H.; Youna, W.; Ying, J.: Logistics decision-making support system basedon ontology. In: 2008, pp. 309–312.
JO et al. 2014Jo, H.; Noh, S. D.; Cho, Y.: An agile operations management system for green
173
References
factory. International Journal of Precision Engineering and Manufacturing-Green
Technology 1 (2014) 2, pp. 131–143.
JOKONOWO et al. 2018Jokonowo, B.; Claes, J.; Sarno, R.; Rochimah, S.: Process mining in supply chains:A systematic literature review. International Journal of Electrical and Computer
Engineering 8 (2018) 6, pp. 4626–4636.
JONES et al. 1997Jones, D.; Hines, P.; Rich, N.: Lean logistics. International Journal of Physical
Distribution & Logistics Management 27 (1997) 3/4, pp. 153–173.
JONES & WOMACK 1997Jones, D.; Womack, J.: Lean Thinking-Banish Waste and Create Wealth in yourCorporation. Journal of the Operational Research Society 48 (1997), pp. 1144–1150.
JÜNEMANN & BEYER 1998Jünemann, R.; Beyer, A.: Steuerung von Materialfluß- und Logistiksystemen:
Informations- und Steuerungssysteme, Automatisierungstechnik. Berlin Heidelberg:Springer. 1998.
KABIR & HASIN 2013Kabir, G.; Hasin, A.: Multi-criteria inventory classification through integration offuzzy analytic hierarchy process and artificial neural network. International Journal
of Industrial and Systems Engineering 14 (2013) 1, pp. 74–103.
KALENKOVA et al. 2017Kalenkova, A.; van der Aalst, W.; Lomazova, I. A.; Rubin, V. A.: Process miningusing BPMN: relating event logs and process models. Software & Systems Modeling
16 (2017) 4, pp. 1019–1048.
KANG et al. 2013Kang, Y. S.; Lee, K.; Lee, Y. H.; Chung, K. Y.: RFID-based supply chain processmining for imported beef. Korean Journal for Food Science of Animal Resources 33(2013) 4, pp. 463–473.
174
References
KAPLAN & NORTON 1992Kaplan, R. S.; Norton, D. P.: The Balanced Scorecard-Measures that Drive Perfor-mance. Harvard Business Review (1992), pp. 71–79.
KAPUSCINSKI et al. 2004Kapuscinski, R.; Zhang, R. Q.; Carbonneau, P.; Moore, R.; Reeves, B.: InventoryDecisions in Dell’s Supply Chain. INFORMS Journal on Applied Analytics 34(2004) 3, pp. 191–205.
KIM et al. 2003Kim, W.; Choi, B. J.; Hong, E. K.; Kim, S. K.; Lee, D.: A Taxonomy of Dirty Data.Data Mining and Knowledge Discovery 7 (2003) 1, pp. 81–99.
KLUG 2010Klug, F.: Logistikmanagement in der Automobilindustrie. Berlin Heidelberg:Springer. 2010.
KNOLL et al. 2017Knoll, D.; Prüglmeier, M.; Reinhart, G.: Materialflussanalyse mit ERP-Transportaufträgen. wt Werkstattstechnik online 3 (2017), pp. 129–133.
KNOLL et al. 2019aKnoll, D.; Neumeier, D.; Prüglmeier, M.; Reinhart, G.: An automated packagingplanning approach using machine learning. Procedia CIRP 81 (2019), pp. 576–581.
KNOLL et al. 2019bKnoll, D.; Waldmann, J.; Reinhart, G.: Developing an internal logistics ontologyfor process mining. Procedia CIRP 79 (2019), pp. 427–432.
KNOLL et al. 2019cKnoll, D.; Reinhart, G.; Prüglmeier, M.: Enabling value stream mapping for internallogistics using multidimensional process mining. Expert Systems with Applications
124 (2019), pp. 130–142.
KNÖSSL 2015Knössl, T.: Gestaltung schlanker Prozessschnittstellen in automobilen Logistikket-ten. PhD thesis. Technical University of Munich. 2015.
175
References
KOCH 2017Koch, J.: Manufacturing Change Management – a Process-Based Approach forthe Management of Manufacturing Changes. PhD thesis. Technical University ofMunich. 2017.
KODINARIYA & MAKWANA 2013Kodinariya, T. M.; Makwana, P. R.: Review on determining number of Clusterin K-Means Clustering. International Journal of Advance Research in Computer
Science and Management Studies 1 (2013) 6, pp. 2321–7782.
KÖKSAL et al. 2011Köksal, G.; Batmaz, I.; Testik, M. C.: A review of data mining applications forquality improvement in manufacturing industry. Expert Systems with Applications
38 (2011), pp. 13448–13467.
KOWALSKI & QUINK 2013Kowalski, M.; Quink, N.: Erstellung einer Ontologie zum Themenkomplex Verpack-
ungen in der Logistik mithilfe des Ontologie-Editors Protégé. Tech. rep. UniversitätDuisburg-Essen. 2013.
KOZEN 1992Kozen, D.: “Depth-First and Breadth-First Search”. In: The Design and Analysis of
Algorithms. New York, NY: Springer. 1992, pp. 19–24.
D. LEE et al. 2013Lee, D.; Park, J.; Pulshashi, I. R.; Bae, H.: Clustering and Operation Analysisfor Assembly Blocks Using Process Mining in Shipbuilding Industry. In: Asia
Pacific Business Process Management. AP-BPM 2013. Lecture Notes in Business
Information Processing. Ed. by M. Song; M. Wynn; L. J. Cham: Springer. 2013,pp. 67–80.
S.-k. LEE et al. 2013Lee, S.-k.; Kim, B.; Huh, M.; Cho, S.; Park, S.; Lee, D.: Mining transportation logsfor understanding the after-assembly block manufacturing process in the shipbuild-ing industry. Expert Systems with Applications 40 (2013), pp. 83–95.
176
References
LEEMANS 2017Leemans, S.: Robust process mining with guarantees. PhD thesis. Technische Uni-versiteit Eindhoven. 2017.
LEEMANS et al. 2014Leemans, S.; Fahland, D.; van der Aalst, W.: Discovering Block-Structured ProcessModels from Incomplete Event Logs. In: Application and Theory of Petri Nets and
Concurrency. Ed. by G. Ciardo; E. Kindler. Cham: Springer. 2014, pp. 91–110.
LEEMANS et al. 2018Leemans, S.; Fahland, D.; van der Aalst, W.: Scalable process discovery and confor-mance checking. Software & Systems Modeling 17 (2018) 2, pp. 599–631.
LEONI et al. 2014Leoni, M. de; van der Aalst, W.; Dees, M.: A General Framework for CorrelatingBusiness Process Characteristics. In: Business Process Management. Ed. by S.Sadiq; P. Soffer; H. Völzer. Cham: Springer. 2014, pp. 250–266.
LEONI et al. 2016Leoni, M. de; van der Aalst, W.; Dees, M.: A general process mining frameworkfor correlating, predicting and clustering dynamic behavior based on event logs.Information Systems 56 (2016), pp. 235–257.
LI et al. 2014Li, D.; Xue, X.; Ding, S.; Li, C.: OWL 2 Based Validation and Modeling of LogisticDomain Ontology. International Journal of Artificial Intelligence and Applications
for Smart Devices 2 (2014) 2, pp. 1–8.
P. LIAN et al. 2007Lian, P.; Park, D.; Kwon, H.: Design of Logistics Ontology for Semantic Repre-senting of Situation in Logistics. In: Second Workshop on Digital Media and its
Application in Museum Heritages (DMAMH 2007). 2007, pp. 432–437.
Y.-H. LIAN & VAN LANDEGHEM 2007Lian, Y.-H.; Van Landeghem, H.: Analysing the effects of Lean manufacturingusing a value stream mapping-based simulation generator. International Journal of
Production Research 45 (2007) 13, pp. 3037–3058.
177
References
LIBERT et al. 2010Libert, S.; Chisu, R.; Keutner, K.: “Eine Ontologie für das Internet der Dinge”. In:Internet der Dinge in der Intralogistik. Ed. by W. Günthner; M. Ten Hompel. BerlinHeidelberg: Springer. 2010, pp. 79–93.
LIIV & LEPIK 2014Liiv, I.; Lepik, O.: Business Process Mining in Warehouses: a Case Study. In:Proceedings of the 11th International Baltic Conference. 2014, pp. 387–394.
LINDSAY et al. 2003Lindsay, A.; Downs, D.; Lunn, K.: Business processes—attempts to find a definition.Information and Software Technology 45 (2003) 15, pp. 1015–1019.
LORENZ et al. 2005Lorenz, B.; Ohlbach, H. J.; Yang, L.: Ontology of Transportation Networks. Tech.rep. REWERSE. 2005.
LUTZ et al. 2003Lutz, S.; Löedding, H.; Wiendahl, H. P.: Logistics-oriented inventory analysis.International Journal of Production Economics 85 (2003) 2, pp. 217–231.
MAATEN & HINTON 2008Maaten, L. van der; Hinton, G.: Visualizing data using t-SNE. Journal of Machine
Learning Research 9 (2008), pp. 2579–2605.
MANNHARDT 2018Mannhardt, F.: Multi-perspective process mining. PhD thesis. Technische Univer-siteit Eindhoven. 2018.
MANNHARDT et al. 2018Mannhardt, F.; Petersen, S. A.; Oliveira, M.: Privacy Challenges for Process Miningin Human-Centered Industrial Environments. In: IEEE. 2018, pp. 64–71.
MEDEIROS et al. 2007Medeiros, A. K. A. de; Weijters, A. J. M. M.; van der Aalst, W.: Genetic processmining: an experimental evaluation. Data Mining and Knowledge Discovery 14(2007) 2, pp. 245–304.
178
References
MEINCHEIM et al. 2017Meincheim, A.; S. Garcia, C. d.; Nievola, J. C.; Scalabrin, E. E.: Combining ProcessMining with Trace Clustering: Manufacturing Shop Floor Process - An Applied Case.In: 2017 IEEE 29th International Conference on Tools with Artificial Intelligence
(ICTAI). 2017, pp. 498–505.
MERDAN et al. 2008Merdan, M.; Koppensteiner, G.; Hegny, I.; Favre-Bulle, B.: Application of an ontol-ogy in a transport domain. In: 2008 IEEE International Conference on Industrial
Technology. 2008, pp. 1–6.
MEUDT et al. 2017Meudt, T.; Metternich, J.; Abele, E.: Value stream mapping 4.0: Holistic exam-ination of value stream and information logistics in production. CIRP Annals -
Manufacturing Technology 66 (2017) 1, pp. 413–416.
MURILLAS 2019Murillas, G. L. D.: Process Mining on databases. PhD thesis. Technische UniversiteitEindhoven. 2019.
MUSIC & ROJEC 2012Music, G.; Rojec, P.: Process Mining of Production Management Data for Improve-ment of Production Planning and Manufacturing Execution. In: 24th European
Modeling and Simulation Symposium, EMSS 2012. 2012, pp. 483–488.
NAGY et al. 2018Nagy, Z.; Werner-stark, Á.; Dulai, T.: An Industrial Application Using ProcessMining to Reduce the Number of Faulty Products. In: New Trends in Databases and
Information Systems. ADBIS 2018. Communications in Computer and Information
Science. Ed. by A. Benczúr; B. Thalheim; T. Horváth; S. Chiusano; T. Cerquitelli;C. Sidló; P. Z. Revesz. 2018, pp. 352–363.
NATSCHLÄGER et al. 2017Natschläger, C.; Kossak, F.; Lettner, C.; Geist, V.; Denkmayr, A.; Käferböck, B.: APractical Approach for Process Mining in Production Processes. In: Innovations in
Enterprise Information Systems Management and Engineering. Ed. by F. Piazolo;V. Geist; L. Brehm; R. Schmidt. Cham: Springer. 2017, pp. 87–95.
179
References
NEELY et al. 1995Neely, A.; Gregory, M.; Platts, K.: Performance Measurement System Design: ALiterature Review. International Journal of Operations & Production Management
15 (1995) 4, pp. 80–116.
NEGRI et al. 2017Negri, E.; Perotti, S.; Fumagalli, L.; Marchet, G.; Garetti, M.: Modelling internallogistics systems through ontologies. Computers in Industry 88 (2017), pp. 19–34.
NOY & MCGUINNESS 2001Noy, N.; McGuinness, D. L.: Ontology Development 101: A Guide to Creating Your
First Ontology. Tech. rep. Stanford Knowledge Systems Laboratory. 2001.
NYHUIS et al. 2008Nyhuis, P.; Schmidt, M.; Wriggers, F. S.: Reduction of capital tie up for assemblyprocesses. CIRP Annals - Manufacturing Technology 57 (2008) 1, pp. 481–484.
NYHUIS & WIENDAHL 2009Nyhuis, P.; Wiendahl, H. P.: Fundamentals of production logistics: Theory, tools
and applications. Berlin Heidelberg: Springer. 2009.
OBITKO et al. 2010Obitko, M.; Vrba, P.; Marík, V.; Radakovic, M.; Kadera, P.: Applications of seman-tics in agent-based manufacturing systems. Informatica (Ljubljana) 34 (2010) 3,pp. 315–330.
OHNO 1988Ohno, T.: Toyota production system: beyond large-scale production. Portland, Ore-gon: Productivity Press. 1988.
OLIPHANT 2007Oliphant, T. E.: Python for Scientific Computing. Computing in Science Engineering
9 (2007) 3, pp. 10–20.
K. M. d. OLIVEIRA et al. 2013Oliveira, K. M. de; Bacha, F.; Mnasser, H.; Abed, M.: Transportation ontologydefinition and application for the content personalization of user interfaces. Expert
Systems with Applications 40 (2013), pp. 3145–3159.
180
References
P. OLIVEIRA et al. 2005Oliveira, P.; Rodrigues, F.; Henriques, P.: A formal definition of data quality prob-lems. In: Proceedings of the 2005 International Conference on Information Quality.2005.
OMG 2011OMG: Business Process Model and Notation (BPMN). Version 2.0. Tech. rep. ObjectManagement Group (OMG). 2011.
PANETTO et al. 2012Panetto, H.; Dassisti, M.; Tursi, A.: ONTO-PDM: Product-driven ONTOlogy forProduct Data Management interoperability within manufacturing process environ-ment. Advanced Engineering Informatics 26 (2012) 2, pp. 334–348.
D. PARK et al. 2008Park, D.; Lee, G.; Kwon, H.: Ontological Approach to Integration of Event-CentricLogistics Information into EPC Network. In: 2008 IEEE International Workshop on
Semantic Computing and Applications. 2008, pp. 1–8.
J. PARK et al. 2014Park, J.; Lee, D.; Zhu, J.: An integrated approach for ship block manufacturingprocess performance evaluation: Case from a Korean shipbuilding company. Inter-
national Journal of Production Economics 156 (2014), pp. 214–222.
M. PARK et al. 2015Park, M.; Song, M.; Baek, T. H.; Son, S.; Ha, S. J.; Cho, S. W.: Workload and DelayAnalysis in Manufacturing Process Using Process Mining. In: Asia Pacific Business
Process Management. Ed. by J. Bae; S. Suriadi; L. Wen. Cham: Springer. 2015,pp. 138–151.
PARKER 2000Parker, C.: Performance measurement. Work Study 49 (2000) 2, pp. 63–66.
PASZKIEWICZ 2013Paszkiewicz, Z.: Process mining techniques in conformance testing of inventoryprocesses: An industrial application. In: International Conference on Business
Information Systems. 2013, pp. 302–313.
181
References
PETERSEN et al. 2018Petersen, S. A.; Mannhardt, F.; Oliveira, M.; Torvatn, H.: A Framework to Navi-gate the Privacy Trade-offs for Human-Centred Manufacturing. In: Collaborative
Networks of Cognitive Systems. Ed. by L. M. Camarinha-Matos; H. Afsarmanesh;Y. Rezgui. Cham: Springer. 2018, pp. 85–97.
PETTERSEN 2009Pettersen, J.: Defining lean production: Some conceptual and practical issues. TQM
Journal 21 (2009) 2, pp. 127–142.
PSOMAS & ANTONY 2019Psomas, E.; Antony, J.: Research gaps in Lean manufacturing: a systematic literaturereview. International Journal of Quality and Reliability Management 36 (2019) 5,pp. 815–839.
PULSHASHI et al. 2015Pulshashi, I. R.; Bae, H.; Sutrisnowati, R. A.; Yahya, B. N.; Park, S.: Slice andConnect: Tri-Dimensional Process Discovery with Case Study of Port LogisticsProcess. Procedia Computer Science 72 (2015), pp. 461–468.
RAMAA et al. 2012Ramaa, A.; Subramanya, K.; Rangaswamy, T.: Impact of Warehouse ManagementSystem in a Supply Chain. International Journal of Computer Applications 54(2012) 1, pp. 14–20.
REINHART 2017Reinhart, G., ed. (2017): Handbuch Industrie 4.0. München: Carl Hanser. 2017.
REINHART et al. 2017Reinhart, G.; Knoll, D.; Teschemacher, U.; Lux, G.; Schnell, J.; Endres, F.; Distel,F.; Seidel, C.; Berger, C.; Klöber-Koch, J.; Pielmeier, J.; Braunreuther, S.: Anwen-dungsfeld Automobilindustrie. In: Handbuch Industrie 4.0. Ed. by G. Reinhart.München: Carl Hanser. 2017.
ROJAS et al. 2016Rojas, E.; Munoz-Gama, J.; Sepúlveda, M.; Capurro, D.: Process mining in health-
182
References
care: A literature review. Journal of Biomedical Informatics 61 (2016), pp. 224–236.
ROJAS et al. 2017Rojas, E.; Sepúlveda, M.; Munoz-Gama, J.; Capurro, D.; Traver, V.; Fernandez-Llatas, C.: Question-Driven Methodology for Analyzing Emergency Room Pro-cesses Using Process Mining. Applied Sciences 7 (2017) 3, pp. 1–29.
ROMERO & ARCE 2017Romero, L. F.; Arce, A.: Applying Value Stream Mapping in Manufacturing: ASystematic Literature Review. IFAC-PapersOnLine 50 (2017) 1, pp. 1075–1086.
ROTHER & SHOOK 1999Rother, M.; Shook, J.: Learning to See: Value Stream Mapping to Add Value and
Eliminate Muda. Cambridge, Massachusetts: Lean Enterprise Institute. 1999.
ROZINAT et al. 2007Rozinat, A.; Alves De Medeiros, A.; Günther, C.; Weijters, A.; van der Aalst, W.:Towards an evaluation framework for process mining algorithms. BPM reports.Eindhoven: BPMcenter.org. 2007.
ROZINAT et al. 2009Rozinat, A.; Jong, I. de; Gunther, C.; van der Aalst, W.: Process Mining Applied tothe Test Process of Wafer Scanners in ASML. IEEE Transactions on Systems, Man,
and Cybernetics, Part C (Applications and Reviews) 39 (2009) 4, pp. 474–479.
RUSCHEL et al. 2018Ruschel, E.; Santos, E. A. P.; Loures, E. D. F. R.: Establishment of maintenanceinspection intervals: an application of process mining techniques in manufacturing.Journal of Intelligent Manufacturing (2018), pp. 1–20.
RUSSELL et al. 2005Russell, N.; Hofstede, A. H. M. ter; Edmond, D.; van der Aalst, W.: Workflow DataPatterns: Identification, Representation and Tool Support. In: Conceptual Modeling
- ER 2005. Ed. by L. Delcambre; C. Kop; H. C. Mayr; J. Mylopoulos; O. Pastor.Berlin Heidelberg: Springer. 2005, pp. 353–368.
183
References
RUTNER & LANGLEY 2000Rutner, S. M.; Langley, C. J.: Logistics Value: Definition, Process and Measurement.The International Journal of Logistics Management 11 (2000) 2, pp. 73–82.
SAAD 2018Saad, H.: An Integrated Framework of Data Mining and Process Mining to Charac-terize Quality and Production Processes. PhD thesis. Tripoli University. 2018.
SALI & SAHIN 2016Sali, M.; Sahin, E.: Line feeding optimization for Just in Time assembly lines:An application to the automotive industry. International Journal of Production
Economics 174 (2016), pp. 54–67.
SANTOS et al. 2016Santos, T. F. D.; Gonçalves, A. T. P.; Leite, M. S. A.: Logistics cost management:insights on tools and operations. International Journal of Logistics Systems and
Management 23 (2016) 2, pp. 171–188.
SATITCHAROENMUANG et al. 2018Satitcharoenmuang, C.; Porouhan, P.; Nammakhunt, A.; Saguansakiyotin, N.; Prem-chaiswadi, W.: Benchmarking efficiency of children’s garment production processusing alpha and ILP replayer techniques. In: International Conference on ICT and
Knowledge Engineering. 2018, pp. 1–7.
SCHLENOFF & GRUNINGER 2000Schlenoff, C.; Gruninger, M.: The Process Specification Language (PSL) Overview
and Version 1.0 Specification. Tech. rep. National Institute of Standards & Technol-ogy. 2000, pp. 1–83.
SCHUH & P. STICH 2012Schuh, G.; Stich, P.: Produktionsplanung und -steuerung 1. Berlin Heidelberg:Springer. 2012.
SCHUH & V. STICH 2013Schuh, G.; Stich, V.: Logistikmanagement. Berlin Heidelberg: Springer. 2013.
SCHUH et al. 2019Schuh, G.; Reinhart, G.; Prote, J. P.; Sauermann, F.; Horsthofer, J.; Oppolzer,
184
References
F.; Knoll, D.: Data mining definitions and applications for the management ofproduction complexity. Procedia CIRP 81 (2019), pp. 874–879.
SHAH & WARD 2003Shah, R.; Ward, P. T.: Lean manufacturing: Context, practice bundles, and perfor-mance. Journal of Operations Management 21 (2003) 2, pp. 129–149.
SHAH & WARD 2007Shah, R.; Ward, P. T.: Defining and developing measures of lean production. Journal
of Operations Management 25 (2007) 4, pp. 785–805.
SHAPIRO & WILK 1965Shapiro, S. S.; Wilk, M. B.: An Analysis of Variance Test for Normality (CompleteSamples). Biometrika 52 (1965) 3/4, pp. 591–611.
SHOU et al. 2017Shou, W.; Wang, J.; Wu, P.; Wang, X.; Chong, H.-Y.: A cross-sector review onthe use of value stream mapping. International Journal of Production Research 55(2017) 13, pp. 3906–3928.
SONG et al. 2009Song, M.; Günther, C. W.; van der Aalst, W.: Trace Clustering in Process Mining.In: Business Process Management Workshops. Ed. by D. Ardagna; M. Mecella;J. Yang. Berlin Heidelberg: Springer. 2009, pp. 109–120.
SPATH 2010Spath, D.: Wertschöpfung steigern. Stuttgart: Fraunhofer Verlag. 2010.
SURIADI et al. 2017Suriadi, S.; Andrews, R.; Hofstede, A. H. ter; Wynn, M. T.: Event log imperfectionpatterns for process mining: Towards a systematic approach to cleaning event logs.Information Systems 64 (2017), pp. 132–150.
SUTRISNOWATI et al. 2015Sutrisnowati, R. A.; Bae, H.; Song, M.: Bayesian network construction from eventlog for lateness analysis in port logistics. Computers and Industrial Engineering 89(2015), pp. 53–66.
185
References
SYAMSIYAH et al. 2017Syamsiyah, A.; Bolt, A.; Cheng, L.; Hompes, B. F. A.; Jagadeesh Chandra Bose,R. P.; Dongen, B. F. van; van der Aalst, W.: Business Process Comparison: AMethodology and Case Study. In: Business Information Systems. Ed. by W.Abramowicz. Cham: Springer. 2017, pp. 253–267.
TEN HOMPEL & SCHMIDT 2010Ten Hompel, M.; Schmidt, T.: Warehouse Management: Organisation und Steuerung
von Lager- und Kommissioniersystemen. Berlin Heidelberg: Springer. 2010.
THUN et al. 2007Thun, J.; Marble, R. P.; Silveira-Camargos, V.: A conceptual framework and em-pirical results of the risk and potential of just in sequence - a study of the Germanautomotive industry. Journal of Operations and Logistics 1 (2007) 2, pp. 1789–1798.
TIBSHIRANI et al. 2001Tibshirani, R.; Walther, G.; Hastie, T.: Estimating the number of clusters in a dataset via the gap statistic. Journal of the Royal Statistical Society. Series B: Statistical
Methodology 63 (2001) 2, pp. 411–423.
TSAI et al. 2010Tsai, C. Y.; Jen, H.; Chen, Y. C.: Time-interval process model discovery andvalidation-a genetic process mining approach. Applied Intelligence 33 (2010) 1,pp. 54–66.
TU & SONG 2016Tu, T. B. H.; Song, M.: Analysis and Prediction Cost of Manufacturing ProcessBased on Process Mining. In: 2016 International Conference on Industrial Engi-
neering, Management Science and Application (ICIMSA). 2016, pp. 1–5.
VAN CRUCHTEN & WEIGAND 2018van Cruchten, R.; Weigand, H.: Process mining in logistics: The need for rule-baseddata abstraction. In: 2018 12th International Conference on Research Challenges in
Information Science (RCIS). 2018, pp. 1–9.
186
References
VAN DER AALST 2013Van der Aalst, W.: Process Cubes: Slicing, Dicing, Rolling Up and Drilling DownEvent Data for Process Mining. Asia Pacific Business Process Management 159(2013), pp. 1–22.
VAN DER AALST 2015van der Aalst, W.: “BPM - Driving Innovation in a Digital World”. In: BPM -
Driving Innovation in a Digital World. Ed. by J. vom Brocke; T. Schmiedel. Cham:Springer. 2015. Chap. Extracting Event Data from Databases to Unleash ProcessMining, pp. 105–128.
VAN DER AALST 2016van der Aalst, W.: Process Mining. Berlin Heidelberg: Springer. 2016.
VAN DER AALST & WEIJTERS 2004van der Aalst, W.; Weijters, A. J. M. M.: Process mining: A research agenda.Computers in Industry 53 (2004) 3, pp. 231–244.
VAN DER AALST et al. 2011van der Aalst, W.; Adriansyah, A.; Dongen, B. van: Causal Nets: A ModelingLanguage Tailored towards Process Discovery. In: CONCUR 2011 – Concurrency
Theory. Ed. by J.-P. Katoen; B. König. Berlin Heidelberg: Springer. 2011, pp. 28–42.
VAN DER AALST et al. 2012van der Aalst, W.; Adriansyah, A.; De Medeiros, A. K. A.; Arcieri, F.; Baier, T.;Blickle, T.; Bose, J. C.; Van Den Brand, P.; Brandtjen, R.; Buijs, J.; Burattin,A.; Carmona, J.; Castellanos, M.; Claes, J.; Cook, J.; Costantini, N.; Curbera, F.;Damiani, E.; De Leoni, M.; Delias, P.; Van Dongen, B. F.; Dumas, M.; Dustdar, S.;Fahland, D.; Ferreira, D. R.; Gaaloul, W.; Van Geffen, F.; Goel, S.; Günther, C.;Guzzo, A.; Harmon, P.; Ter Hofstede, A.; Hoogland, J.; Ingvaldsen, J. E.; Kato, K.;Kuhn, R.; Kumar, A.; La Rosa, M.; Maggi, F.; Malerba, D.; Mans, R. S.; Manuel, A.;McCreesh, M.; Mello, P.; Mendling, J.; Montali, M.; Motahari-Nezhad, H. R.; ZurMuehlen, M.; Munoz-Gama, J.; Pontieri, L.; Ribeiro, J.; Rozinat, A.; Seguel Pérez,H.; Seguel Pérez, R.; Sepúlveda, M.; Sinur, J.; Soffer, P.; Song, M.; Sperduti, A.;Stilo, G.; Stoel, C.; Swenson, K.; Talamo, M.; Tan, W.; Turner, C.; Vanthienen, J.;Varvaressos, G.; Verbeek, E.; Verdonk, M.; Vigo, R.; Wang, J.; Weber, B.; Weidlich,
187
References
M.; Weijters, T.; Wen, L.; Westergaard, M.; Wynn, M.: Process Mining Manifesto.In: Lecture Notes in Business Information Processing. 2012, pp. 169–194.
VIALE et al. 2011Viale, P.; Frydman, C.; Pinaton, J.: New methodology for modeling large scale man-ufacturing process: Using process mining methods and experts’ knowledge. In: 2011
9th IEEE/ACS International Conference on Computer Systems and Applications
(AICCSA). 2011, pp. 84–89.
VOGELGESANG et al. 2016Vogelgesang, T.; Kaes, G.; Rinderle-Ma, S.; Appelrath, H.-J.: MultidimensionalProcess Mining: Questions, Requirements, and Limitations. In: CAISE 2016 Forum.2016, pp. 169–176.
J. WANG et al. 2013Wang, J.; Wong, R. K.; Ding, J.; Guo, Q.; Wen, L.: Efficient Selection of ProcessMining Algorithms. IEEE Transactions on Services Computing 6 (2013) 4, pp. 484–496.
J. WANG et al. 2016Wang, J.; Zhu, B.; Wang, Y.; Huang, L.: Mining organizational behaviors in col-laborative logistics chain: An empirical study in a port. In: 2016 International
Conference on Logistics, Informatics and Service Sciences (LISS). 2016, pp. 1–5.
Y. WANG et al. 2014aWang, Y.; Caron, F.; Vanthienen, J.; Huang, L.; Guo, Y.: Acquiring logistics pro-cess intelligence: Methodology and an application for a Chinese bulk port. Expert
Systems with Applications 41 (2014), pp. 195–209.
Y. WANG et al. 2014bWang, Y.; Caron, F.; Vanthienen, J.; Huang, L.; Guo, Y.: Investigating ServiceBehavior Variance in Port Logistics from a Process Perspective. In: Business Process
Management Workshops. Ed. by N. Lohmann; M. Song; P. Wohed. Cham: Springer.2014, pp. 318–329.
Y. WANG et al. 2018Wang, Y.; Hulstijn, J.; Tan, Y.-h.: Towards Smart Manufacturing: Compliance
188
References
Monitoring for Computational Auditing. In: Proceedings of the 26th European
Conference on Information Systems (ECIS 2018). 2018.
WEBER et al. 2013Weber, P.; Bordbar, B.; Tino, P.: A framework for the analysis of process miningalgorithms. IEEE Transactions on Systems, Man, and Cybernetics Part A:Systems
and Humans 43 (2013) 2, pp. 303–317.
WEBSTER & WATSON 2002Webster, J.; Watson, R. T.: Analyzing the Past to Prepare for the Future: Writing aLiterature Review. MIS Quarterly 26 (2002) 2, pp. xiii–xxiii.
WESTKÄMPER et al. 2013Westkämper, E.; Spath, D.; Constantinescu, C.; Lentes, J.: Digitale Produktion.Berlin Heidelberg: Springer. 2013.
WOMACK et al. 1990Womack, J.; Jones, D.; Roos, D.: The machine that changed the world. WestviewPress Inc. 1990.
YAHYA et al. 2016Yahya, B. N.; Song, M.; Bae, H.; Sul, S. ook; Wu, J. Z.: Domain-driven actionableprocess model discovery. Computers and Industrial Engineering 99 (2016), pp. 382–400.
YANG et al. 2014Yang, H.; Park, M.; Cho, M.; Song, M.; Kim, S.: A system architecture for manufac-turing process analysis based on big data and process mining techniques. In: 2014
IEEE International Conference on Big Data. 2014, pp. 1024–1029.
YANO et al. 2013Yano, K.; Nomura, Y.; Kanai, T.: A Practical Approach to Automated BusinessProcess Discovery. In: 2013 17th IEEE International Enterprise Distributed Object
Computing Conference Workshops. 2013, pp. 53–62.
ZHANG & TIAN 2010Zhang, X. K.; Tian, T.: Logistics Domain Ontology Model and Its Application. In:
189
References
Progress in Measurement and Testing. Advanced Materials Research. Trans TechPublications Ltd. 2010, pp. 1403–1408.
ZHONG et al. 2015Zhong, R. Y.; Huang, G. Q.; Lan, S.; Dai, Q. Y.; Chen, X.; Zhang, T.: A big dataapproach for logistics trajectory discovery from RFID-enabled production data.International Journal of Production Economics 165 (2015), pp. 260–272.
ZHONG et al. 2016Zhong, R. Y.; Lan, S.; Xu, C.; Dai, Q.; Huang, G. Q.: Visualization of RFID-enabledshopfloor logistics Big Data in Cloud Manufacturing. International Journal of
Advanced Manufacturing Technology 84 (2016) 1-4, pp. 5–16.
ZHONG et al. 2017Zhong, R. Y.; Xu, C.; Chen, C.; Huang, G. Q.: Big Data Analytics for PhysicalInternet-based intelligent manufacturing shop floors. International Journal of Pro-
duction Research 55 (2017) 9, pp. 2610–2621.
ZHOU & PIRAMUTHU 2010aZhou, W.; Piramuthu, S.: Framework, strategy and evaluation of health care pro-cesses with RFID. Decision Support Systems 50 (2010) 1, pp. 222–233.
ZHOU & PIRAMUTHU 2010bZhou, W.; Piramuthu, S.: Healthcare Process Mining with RFID. In: Business
Process Management Workshops. Ed. by S. Rinderle-Ma; S. Sadiq; F. Leymann.Berlin Heidelberg: Springer. 2010, pp. 405–411.
190
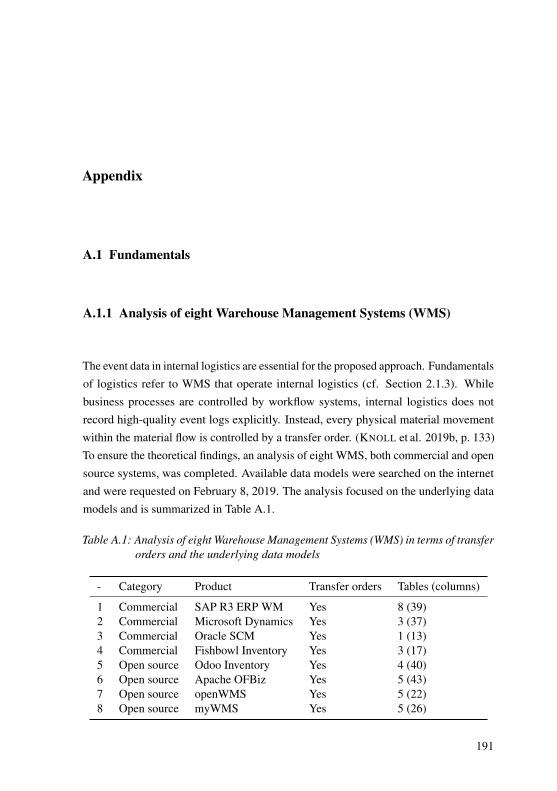
Appendix
A.1 Fundamentals
A.1.1 Analysis of eight Warehouse Management Systems (WMS)
The event data in internal logistics are essential for the proposed approach. Fundamentalsof logistics refer to WMS that operate internal logistics (cf. Section 2.1.3). Whilebusiness processes are controlled by workflow systems, internal logistics does notrecord high-quality event logs explicitly. Instead, every physical material movementwithin the material flow is controlled by a transfer order. (KNOLL et al. 2019b, p. 133)To ensure the theoretical findings, an analysis of eight WMS, both commercial and opensource systems, was completed. Available data models were searched on the internetand were requested on February 8, 2019. The analysis focused on the underlying datamodels and is summarized in Table A.1.
Table A.1: Analysis of eight Warehouse Management Systems (WMS) in terms of transferorders and the underlying data models
- Category Product Transfer orders Tables (columns)
1 Commercial SAP R3 ERP WM Yes 8 (39)2 Commercial Microsoft Dynamics Yes 3 (37)3 Commercial Oracle SCM Yes 1 (13)4 Commercial Fishbowl Inventory Yes 3 (17)5 Open source Odoo Inventory Yes 4 (40)6 Open source Apache OFBiz Yes 5 (43)7 Open source openWMS Yes 5 (22)8 Open source myWMS Yes 5 (26)
191
Appendix
A.2 Detailed design of the approach
A.2.1 Planning and data extraction
A.2.1.1 Literature-based development of the internal logistics ontology
This section provides further details about the literature-based development of theinternal logistics ontology. The Ontology Development Guide by NOY & MCGUINNESS
(2001) has been used in this thesis. The Ontology Development Guide consists of sevensteps and is often used for developing ontologies.
Step 1: Determining the domain and scope
In the first step, the domain and scope of the ontology are defined. The ontology mustsupport the ontology-based data extraction and preprocessing in the field of processmining (cf. Section 2.3.3). The ontology must create a shared understanding of theprocess perspective of internal logistics and required concepts (e.g., case identifier) thatmust be annotated. In addition, related attributes to enrich the event logs (e.g., costs)must be defined.
Step 2: Considering reusing existing ontologies (a systematic review)
In the second step, reusing existing ontologies is considered, as the work of NEGRI et al.(2017) provides evidence that relevant ontologies exist. NEGRI et al. (2017) recentlycarried out a literature review of ontologies related to internal logistics. The purpose ofthe review of NEGRI et al. (2017) is to develop an internal logistics ontology focusingon the resource perspective. The systematic review builds on the findings of NEGRI
et al. (2017) and provides an overview of work that focuses on the process perspectiveof internal logistics. Similar to Chapter 3, the literature review approach consists ofthree stages and eight steps. Based on the objectives of the thesis, the literature reviewprovides support for RQ1 (cf. Section 1.3). The unit of the analysis is specified asontologies in the area of internal logistics. The articles are classified and evaluated interms of the coverage of the main concepts of internal logistics.
The work of NEGRI et al. (2017) is extended to collect the articles by a keyword searchfor ontology AND (“internal logistics” OR “production logistics”), which found 45articles published before April 10, 2018. Further literature was identified by selectivelygoing forward and backward in the articles (e.g., three upper ontologies or articles
192
A.2 Detailed design of the approach
available in German). Articles that did not provide support for the process perspectiveof internal logistics or enriching event logs were excluded to limit the number ofpublications. For example, 24 articles focus on the inter-organizational perspective oflogistics. After excluding these articles and removing duplicates, 42 relevant articleswere reviewed in detail. Fourteen articles were compared and (partially) reused formerging or extending existing concepts in support of the development of the internallogistics ontology. (cf. KNOLL et al. 2019a)
Step 3: Enumerating important terms
In the third step, important terms are enumerated based on the frequency of theiroccurrence in the literature.
Step 4-6: Define the classes, properties, and facets
The ontology is modeled in the fourth, fifth, and sixth steps (cf. Section 5.1.1.2). Ifpossible, concepts of existing domain ontologies and upper ontologies, i.e., PSL, wereintegrated.
The PROMPT methodology has been selected to merge ontologies, based on the re-view of KALFOGLOU & SCHORLEMMER (2003). PROMPT is designed to integrateformalized ontologies (NOY & MUSEN 2003) and maintain classes, object, and dataproperties. Annotations for process mining were extended to complete the modeling.
Step 7: Create instances
In this context, the last step of creating instances is skipped as instances are stored ininformation systems (JAREEVONGPIBOON & JANECEK 2013).
A.2.2 Data preprocessing
A.2.2.1 Further specification of the enriched event log
The algorithms to create, enrich and filter event logs were developed in Section 5.2).An extract of the enriched event log Le (XES Standard Definition 2.0) is shown inTable 5.10. Table A.2 completes the extract of the enriched event log Le with additionalattributes.
193
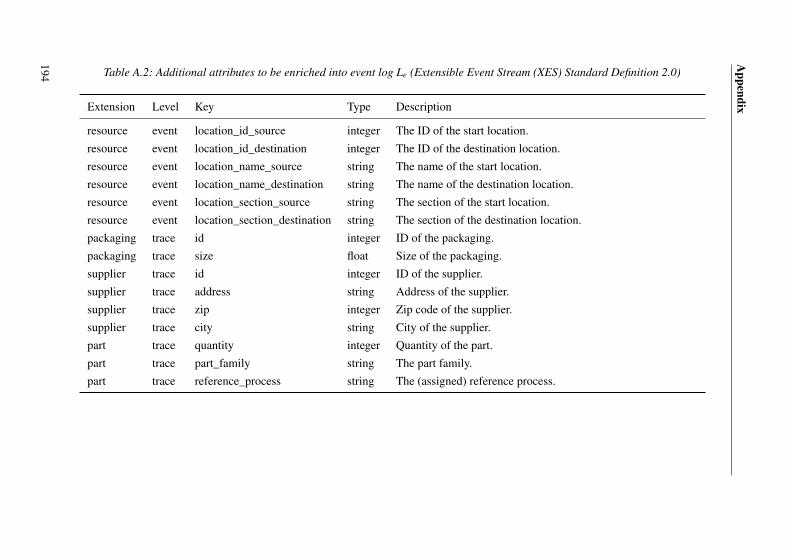
Appendix
Table A.2: Additional attributes to be enriched into event log Le (Extensible Event Stream (XES) Standard Definition 2.0)
Extension Level Key Type Description
resource event location_id_source integer The ID of the start location.resource event location_id_destination integer The ID of the destination location.resource event location_name_source string The name of the start location.resource event location_name_destination string The name of the destination location.resource event location_section_source string The section of the start location.resource event location_section_destination string The section of the destination location.packaging trace id integer ID of the packaging.packaging trace size float Size of the packaging.supplier trace id integer ID of the supplier.supplier trace address string Address of the supplier.supplier trace zip integer Zip code of the supplier.supplier trace city string City of the supplier.part trace quantity integer Quantity of the part.part trace part_family string The part family.part trace reference_process string The (assigned) reference process.
194
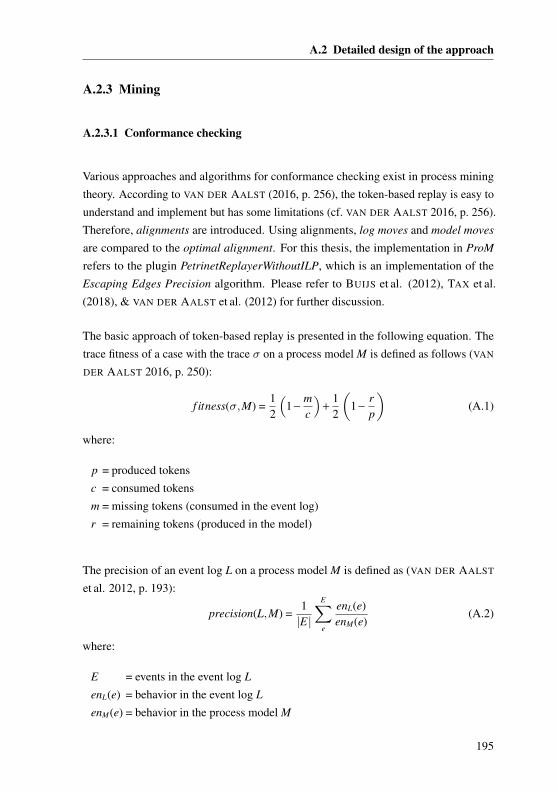
A.2 Detailed design of the approach
A.2.3 Mining
A.2.3.1 Conformance checking
Various approaches and algorithms for conformance checking exist in process miningtheory. According to VAN DER AALST (2016, p. 256), the token-based replay is easy tounderstand and implement but has some limitations (cf. VAN DER AALST 2016, p. 256).Therefore, alignments are introduced. Using alignments, log moves and model moves
are compared to the optimal alignment. For this thesis, the implementation in ProM
refers to the plugin PetrinetReplayerWithoutILP, which is an implementation of theEscaping Edges Precision algorithm. Please refer to BUIJS et al. (2012), TAX et al.(2018), & VAN DER AALST et al. (2012) for further discussion.
The basic approach of token-based replay is presented in the following equation. Thetrace fitness of a case with the trace σ on a process model M is defined as follows (VAN
DER AALST 2016, p. 250):
f itness(σ,M) =12
(1 −
mc
)+
12
(1 −
rp
)(A.1)
where:
p = produced tokensc = consumed tokensm = missing tokens (consumed in the event log)r = remaining tokens (produced in the model)
The precision of an event log L on a process model M is defined as (VAN DER AALST
et al. 2012, p. 193):
precision(L,M) =1|E|
E∑e
enL(e)enM(e)
(A.2)
where:
E = events in the event log L
enL(e) = behavior in the event log L
enM(e) = behavior in the process model M
195
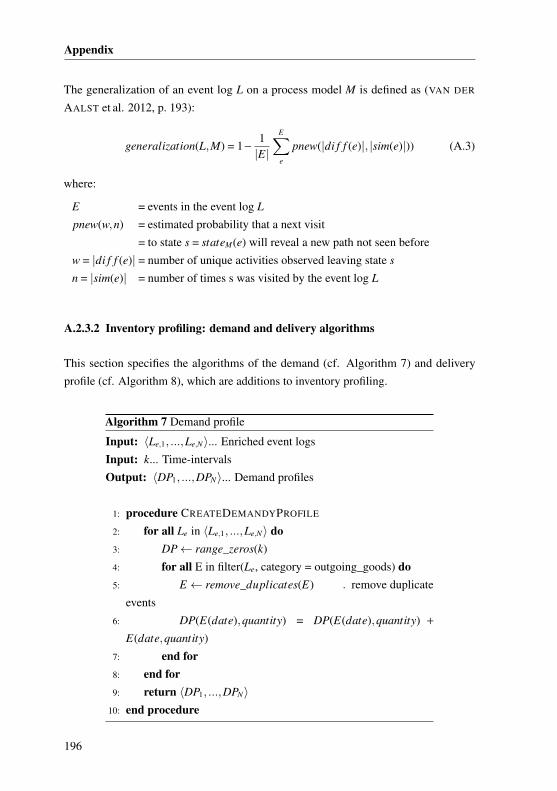
Appendix
The generalization of an event log L on a process model M is defined as (VAN DER
AALST et al. 2012, p. 193):
generalization(L,M) = 1 −1|E|
E∑e
pnew(|di f f (e)|, |sim(e)|)) (A.3)
where:
E = events in the event log L
pnew(w,n) = estimated probability that a next visit= to state s = stateM(e) will reveal a new path not seen before
w = |di f f (e)| = number of unique activities observed leaving state s
n = |sim(e)| = number of times s was visited by the event log L
A.2.3.2 Inventory profiling: demand and delivery algorithms
This section specifies the algorithms of the demand (cf. Algorithm 7) and deliveryprofile (cf. Algorithm 8), which are additions to inventory profiling.
Algorithm 7 Demand profile
Input: 〈Le,1, ...,Le,N〉... Enriched event logsInput: k... Time-intervalsOutput: 〈DP1, ...,DPN〉... Demand profiles
1: procedure CREATEDEMANDYPROFILE
2: for all Le in 〈Le,1, ...,Le,N〉 do3: DP← range_zeros(k)4: for all E in filter(Le, category = outgoing_goods) do5: E← remove_duplicates(E) . remove duplicate
events6: DP(E(date),quantity) = DP(E(date),quantity) +
E(date,quantity)7: end for8: end for9: return 〈DP1, ...,DPN〉
10: end procedure
196
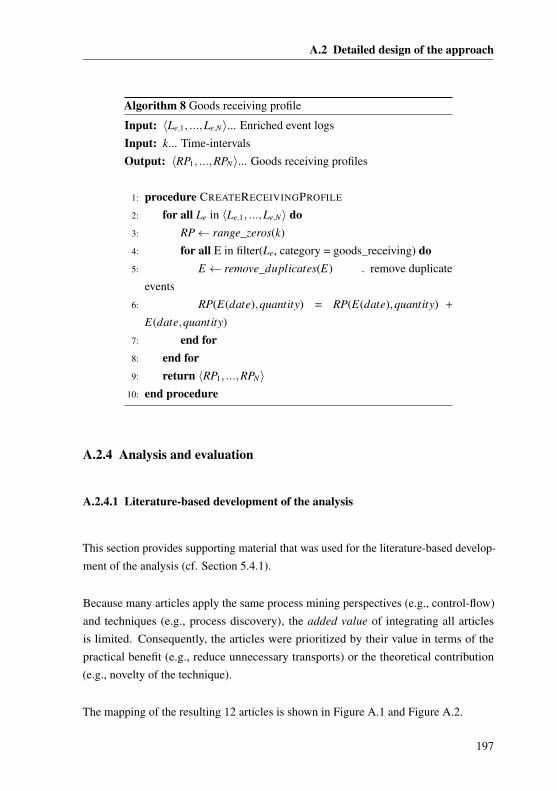
A.2 Detailed design of the approach
Algorithm 8 Goods receiving profile
Input: 〈Le,1, ...,Le,N〉... Enriched event logsInput: k... Time-intervalsOutput: 〈RP1, ...,RPN〉... Goods receiving profiles
1: procedure CREATERECEIVINGPROFILE
2: for all Le in 〈Le,1, ...,Le,N〉 do3: RP← range_zeros(k)4: for all E in filter(Le, category = goods_receiving) do5: E← remove_duplicates(E) . remove duplicate
events6: RP(E(date),quantity) = RP(E(date),quantity) +
E(date,quantity)7: end for8: end for9: return 〈RP1, ...,RPN〉
10: end procedure
A.2.4 Analysis and evaluation
A.2.4.1 Literature-based development of the analysis
This section provides supporting material that was used for the literature-based develop-ment of the analysis (cf. Section 5.4.1).
Because many articles apply the same process mining perspectives (e.g., control-flow)and techniques (e.g., process discovery), the added value of integrating all articlesis limited. Consequently, the articles were prioritized by their value in terms of thepractical benefit (e.g., reduce unnecessary transports) or the theoretical contribution(e.g., novelty of the technique).
The mapping of the resulting 12 articles is shown in Figure A.1 and Figure A.2.
197
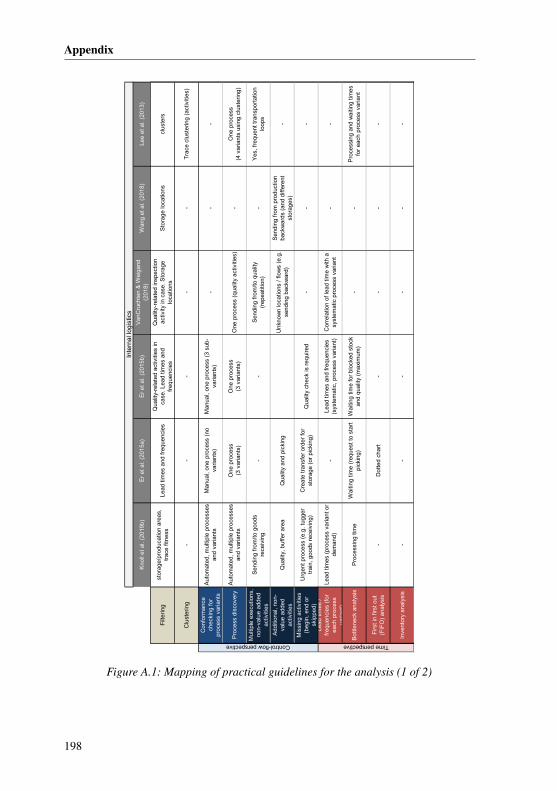
Appendix
Kno
ll et
al.
(201
9b)
Er
et a
l. (2
015a
)E
r et
al.
(201
5b)
Van
Cru
chte
n &
Wei
gand
(2
018)
Wan
g et
al.
(201
8)Le
e et
al.
(201
3)
Filt
erin
gst
orag
e/pr
oduc
atio
n ar
eas,
tr
ace
fitne
ssLe
ad t
imes
and
fre
quen
cies
Qua
lity-
rela
ted
activ
ities
in
case
. Le
ad t
imes
and
fr
eque
ncie
s
Qua
lity-
rela
ted
insp
ectio
n ac
tivity
in c
ase.
Sto
rage
lo
catio
nsS
tora
ge lo
catio
nscl
uste
rs
Clu
ster
ing
--
--
-T
race
clu
ster
ing
(act
iviti
es)
Con
form
ance
ch
ecki
ng f
or
proc
ess
varia
nts
Aut
omat
ed,
mul
tiple
pro
cess
es
and
varia
nts
Man
ual,
one
proc
ess
(no
varia
nts)
Man
ual,
one
proc
ess
(3 s
ub-
varia
nts)
--
-
Pro
cess
dis
cove
ryA
utom
ated
, m
ultip
le p
roce
sses
an
d va
riant
sO
ne p
roce
ss
(3 v
aria
nts)
One
pro
cess
(3
var
iant
s)O
ne p
roce
ss (
qual
ity a
ctiv
ities
)-
One
pro
cess
(4
var
iant
s us
ing
clus
terin
g)
Mul
tiple
exe
cutio
ns,
non-
valu
e ad
ded
activ
ities
Sen
ding
fro
m/t
o go
ods
rece
ivin
g-
-S
endi
ng f
rom
/to
qual
ity
(rep
eatit
ion)
-Y
es,
freq
uent
tra
nspo
rtat
ion
loop
s
Add
ition
al,
non-
valu
e ad
ded
activ
ities
Qua
lity,
buf
fer
area
Qua
lity
and
pick
ing
Unk
now
n lo
catio
ns /
flo
ws
(e.g
. se
ndin
g ba
ckw
ard)
Sen
ding
fro
m p
rodu
ctio
n ba
ckw
ards
(an
d di
ffer
ent
stor
ages
)-
Mis
sing
act
iviti
es
(beg
in,
end
or
skip
ped)
Urg
ent
proc
ess
(e.g
. tu
gger
tr
ain,
goo
ds r
ecei
ving
)C
reat
e tr
ansf
er o
rder
for
st
orag
e (o
r pi
ckin
g)Q
ualit
y ch
eck
is r
equi
red
--
-
Lead
tim
es /
fr
eque
ncie
s (f
or
each
pro
cess
va
riant
)
Lead
tim
es (
proc
ess
varia
nt o
r de
man
d)-
Lead
tim
es a
nd f
requ
enci
es
(sys
tem
atic
, pr
oces
s va
riant
)C
orre
latio
n of
lead
tim
e w
ith a
sy
stem
atic
pro
cess
var
iant
--
Bot
tlene
ck a
naly
sis
Pro
cess
ing
time
Wai
ting
time
(req
uest
to
star
t pi
ckin
g)W
aitin
g tim
e fo
r bl
ocke
d st
ock
and
qual
ity (
max
imum
)-
-P
roce
ssin
g an
d w
aitin
g tim
es
for
each
pro
cess
var
iant
Firs
t in
firs
t ou
t (F
IFO
) an
alys
is-
Dot
ted
char
t-
--
-
Inve
ntor
y an
alys
is-
--
--
-
Control-flow perspective Time perspective
Inte
rnal
logi
stic
s
Figure A.1: Mapping of practical guidelines for the analysis (1 of 2)
198
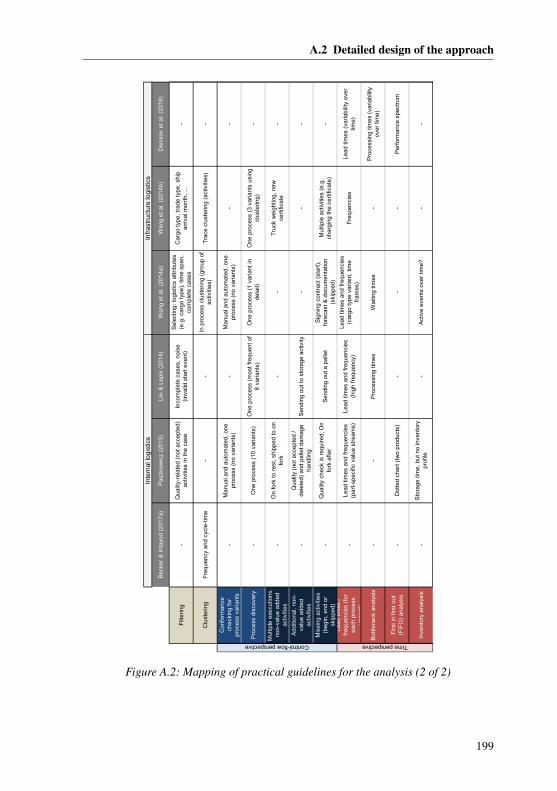
A.2 Detailed design of the approach
Bec
ker
& I
ntay
od (
2017
a)P
aszk
iew
icz
(201
3)Li
iv &
Lep
ik (
2014
)W
ang
et a
l. (2
014a
)W
ang
et a
l. (2
014b
)D
enis
ov e
t al
. (2
018)
Filt
erin
g-
Qua
lity-
rela
ted
(not
acc
epte
d)
activ
ities
in t
he c
ase
Inco
mpl
ete
case
s, n
oise
(in
valid
sta
rt e
vent
)
Sel
ectin
g: lo
gist
ics
attr
ibut
es
(e.g
. ca
rgo
type
), t
ime
span
, co
mpl
ete
case
s
Car
go t
ype,
tra
de t
ype,
shi
p ar
rival
mon
th,
…-
Clu
ster
ing
Fre
quen
cy a
nd c
ycle
-tim
e-
-In
pro
cess
clu
ster
ing
(gro
up o
f ac
tiviti
es)
Tra
ce c
lust
erin
g (a
ctiv
ities
)-
Con
form
ance
ch
ecki
ng f
or
proc
ess
varia
nts
-M
anua
l and
aut
omat
ed,
one
proc
ess
(no
varia
nts)
-M
anua
l and
aut
omat
ed,
one
proc
ess
(no
varia
nts)
--
Pro
cess
dis
cove
ry-
One
pro
cess
(10
var
iant
s)O
ne p
roce
ss (
mos
t fr
eque
nt o
f 8
varia
nts)
One
pro
cess
(1
varia
nt in
de
tail)
One
pro
cess
(3
varia
nts
usin
g cl
uste
ring)
-
Mul
tiple
exe
cutio
ns,
non-
valu
e ad
ded
activ
ities
-O
n fo
rk t
o re
st,
ship
ped
to o
n fo
rk-
-T
ruck
wei
ghtin
g, n
ew
cert
ifica
te-
Add
ition
al,
non-
valu
e ad
ded
activ
ities
-Q
ualit
y (n
ot a
ccep
ted
/ de
lete
d) a
nd p
alle
t da
mag
e ha
ndlin
gS
endi
ng o
ut t
o st
orag
e ac
tivity
--
-
Mis
sing
act
iviti
es
(beg
in,
end
or
skip
ped)
-Q
ualit
y ch
eck
is r
equi
red,
On
fork
aft
er
Sen
ding
out
a p
alle
tS
igni
ng c
ontr
act
(sta
rt),
fo
reca
st &
doc
umen
tatio
n (s
kipp
ed)
Mul
tiple
act
iviti
es (
e.g.
ch
argi
ng t
he c
ertif
icat
e)-
Lead
tim
es /
fr
eque
ncie
s (f
or
each
pro
cess
va
riant
)
-Le
ad t
imes
and
fre
quen
cies
(p
art-
spec
ific
valu
e st
ream
s)Le
ad t
imes
and
fre
quen
cies
(h
igh
freq
uenc
y)
Lead
tim
es a
nd f
requ
enci
es
(car
go t
ype
varia
nt,
time
fram
es)
Fre
quen
cies
Lead
tim
es (
varia
bilit
y ov
er
time)
Bot
tlene
ck a
naly
sis
--
Pro
cess
ing
times
Wai
ting
times
-P
roce
ssin
g tim
es (
varia
bilit
y ov
er t
ime)
Firs
t in
firs
t ou
t (F
IFO
) an
alys
is-
Dot
ted
char
t (t
wo
prod
ucts
)-
--
Per
form
ance
spe
ctru
m
Inve
ntor
y an
alys
is-
Sto
rage
tim
e, b
ut n
o in
vent
ory
prof
ile-
Act
ive
even
ts o
ver
time?
--
Control-flow perspective Time perspectiveIn
fras
truc
ture
logi
stic
sIn
tern
al lo
gist
ics
Figure A.2: Mapping of practical guidelines for the analysis (2 of 2)
199
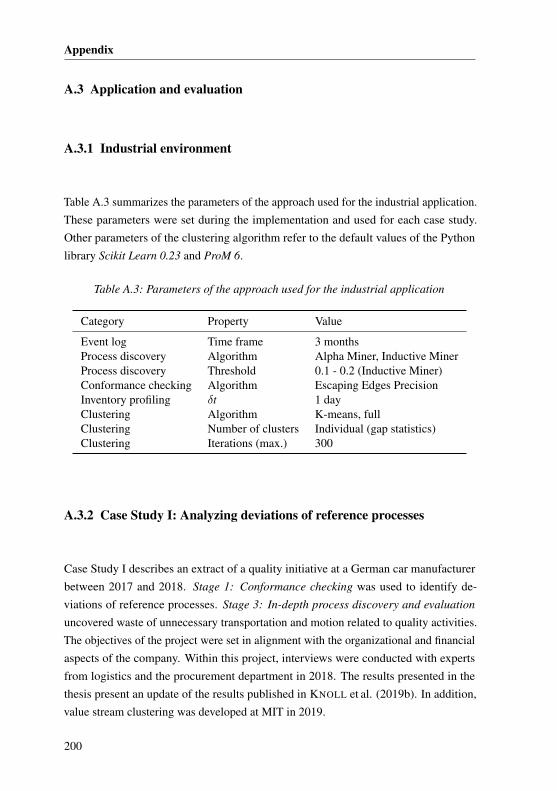
Appendix
A.3 Application and evaluation
A.3.1 Industrial environment
Table A.3 summarizes the parameters of the approach used for the industrial application.These parameters were set during the implementation and used for each case study.Other parameters of the clustering algorithm refer to the default values of the Pythonlibrary Scikit Learn 0.23 and ProM 6.
Table A.3: Parameters of the approach used for the industrial application
Category Property Value
Event log Time frame 3 monthsProcess discovery Algorithm Alpha Miner, Inductive MinerProcess discovery Threshold 0.1 - 0.2 (Inductive Miner)Conformance checking Algorithm Escaping Edges PrecisionInventory profiling δt 1 dayClustering Algorithm K-means, fullClustering Number of clusters Individual (gap statistics)Clustering Iterations (max.) 300
A.3.2 Case Study I: Analyzing deviations of reference processes
Case Study I describes an extract of a quality initiative at a German car manufacturerbetween 2017 and 2018. Stage 1: Conformance checking was used to identify de-viations of reference processes. Stage 3: In-depth process discovery and evaluation
uncovered waste of unnecessary transportation and motion related to quality activities.The objectives of the project were set in alignment with the organizational and financialaspects of the company. Within this project, interviews were conducted with expertsfrom logistics and the procurement department in 2018. The results presented in thethesis present an update of the results published in KNOLL et al. (2019b). In addition,value stream clustering was developed at MIT in 2019.
200
A.3 Application and evaluation
A.3.3 Case Study II: Demand-based process leveling
This section provides a summary of the seven 15-minute group workshops conducted dur-ing a weekly meeting of the logistics experts. The notes were captured and anonymizedduring the workshops and were supported by the student thesis of Raffaela Rill.
Workshop 1 (December 11, 2018)
Roles: Logistics experts (e.g., process improvements and quality) and data analysts.
Participants: Group of three to five logistics experts and two data analysts.
Findings: Discussion of the proposed value streams:
• Focus on two different reference processes within the same assembly line hall.The majority of parts are handled and stored within these storage areas, which iswhy they are under inspection within the logistics planning department.
• High demand is defined as more than 20-25 packages per day (two shifts). Amedium demand is defined as 10-15 packages per day (two shifts). A low demandis defined as less than two packages per day (two shifts). However, no cleardistinction is made, and this definition is only used for an initial classification.
• The demand forecast of the value streams should be included due to the dynamics.
• Critical parts refer to a low demand and a high inventory.
Workshop 2 (January 15, 2019)
Roles: Logistics experts (e.g., process improvements and quality) and data analysts.
Participants: Group of three to five logistics experts and two data analysts.
Findings: Discussion of the proposed value streams:
• The automated small part storage is restricted to a maximum of two packagesper part and hour. Value streams with high demand cannot be processed in thisstorage/reference process.
• Direct line feeding should be the target for value streams with high demand.Complementary value streams should be evaluated for a medium demand.
201
Appendix
• In the case of a direct line feeding policy, the analysis should focus on valuestreams with one distinct line delivery location. Parts with multiple locations areout of scope.
Workshop 3 (January 22, 2019)
Roles: Logistics experts (e.g., process improvements and quality) and data analysts.
Participants: Group of three to five logistics experts and two data analysts.
Findings: Discussion of the proposed value streams:
• Confirmation of one value stream that was proposed as direct line feeding.
• Re-scheduling of one value stream for the production break.
• One value stream was not considered for improvement because the employeeresponsible for that stream had special workspace requirements and modificationsbecause of a disability.
Workshop 4 (February 05, 2019)
Roles: Logistics experts (e.g., process improvements and quality) and data analysts.
Participants: Group of three to five logistics experts and two data analysts.
Findings: Discussion of the proposed value streams:
• Confirmation of one value stream that was proposed as direct line feeding.
• Two value streams were impeded due to packaging restrictions. According tothe experts, a change of packaging bins is not practical. Two other value streamswere declined because of spatial restrictions and another because of risks relatedto picking failures.
Workshop 5 (February 19, 2019)
Roles: Logistics experts (e.g., process improvements and quality) and data analysts.
Participants: Group of three to five logistics experts and two data analysts.
Findings: Discussion of the proposed value streams:
202
A.3 Application and evaluation
• Two value streams were declined because of spatial restrictions (too many racks).Another value stream was declined because of packaging restrictions.
Workshop 6 (March 3, 2019)
Roles: Logistics experts (e.g., process improvements and quality) and data analysts.
Participants: Group of three to five logistics experts and two data analysts.
Findings: Discussion of the proposed value streams:
• Four value streams were declined because of risks related to picking failures.
• Four other value streams were declined because the packaging bins were eithertoo high or are not compliant with the company’s standard.
Workshop 7 (March 13, 2019)
Roles: Logistics experts (e.g., process improvements and quality) and data analysts.
Participants: Group of three to five logistics experts and two data analysts.
Findings: Discussion of the proposed value streams:
• One value stream was approved for direct line feeding.
• Another value stream was shifted to the automatic storage system.
A.3.4 Case Study III: Analyzing the inventory
This section provides a summary of six 30–90-minute workshops. The notes werecaptured and anonymized during the workshops and were supported by the studentthesis of Quirin Bachmeier.
Workshop 1 (September 27, 2018)
Roles: Logistics experts (procurement/inbound) and data analysts.
Participants: Group of two logistics experts and one data analyst.
Findings:
203
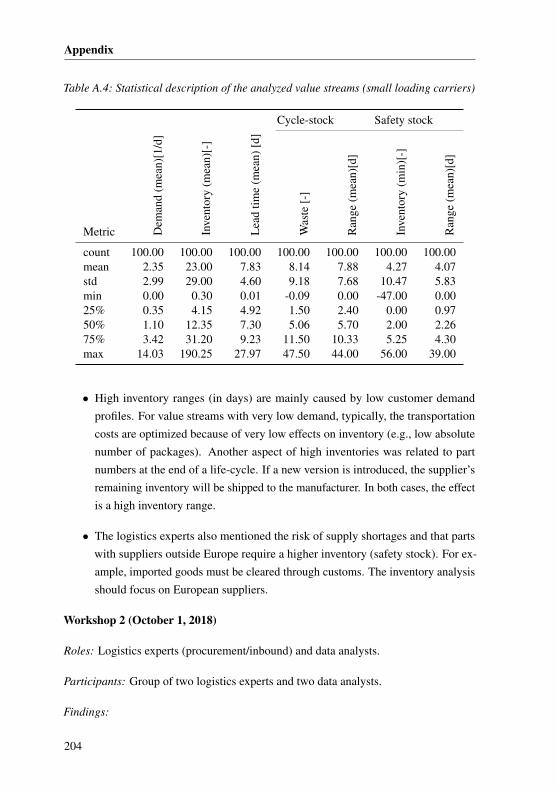
Appendix
Table A.4: Statistical description of the analyzed value streams (small loading carriers)
Cycle-stock Safety stock
Metric Dem
and
(mea
n)[1
/d]
Inve
ntor
y(m
ean)
[-]
Lea
dtim
e(m
ean)
[d]
Was
te[-
]
Ran
ge(m
ean)
[d]
Inve
ntor
y(m
in)[
-]
Ran
ge(m
ean)
[d]
count 100.00 100.00 100.00 100.00 100.00 100.00 100.00mean 2.35 23.00 7.83 8.14 7.88 4.27 4.07std 2.99 29.00 4.60 9.18 7.68 10.47 5.83min 0.00 0.30 0.01 -0.09 0.00 -47.00 0.0025% 0.35 4.15 4.92 1.50 2.40 0.00 0.9750% 1.10 12.35 7.30 5.06 5.70 2.00 2.2675% 3.42 31.20 9.23 11.50 10.33 5.25 4.30max 14.03 190.25 27.97 47.50 44.00 56.00 39.00
• High inventory ranges (in days) are mainly caused by low customer demandprofiles. For value streams with very low demand, typically, the transportationcosts are optimized because of very low effects on inventory (e.g., low absolutenumber of packages). Another aspect of high inventories was related to partnumbers at the end of a life-cycle. If a new version is introduced, the supplier’sremaining inventory will be shipped to the manufacturer. In both cases, the effectis a high inventory range.
• The logistics experts also mentioned the risk of supply shortages and that partswith suppliers outside Europe require a higher inventory (safety stock). For ex-ample, imported goods must be cleared through customs. The inventory analysisshould focus on European suppliers.
Workshop 2 (October 1, 2018)
Roles: Logistics experts (procurement/inbound) and data analysts.
Participants: Group of two logistics experts and two data analysts.
Findings:
204
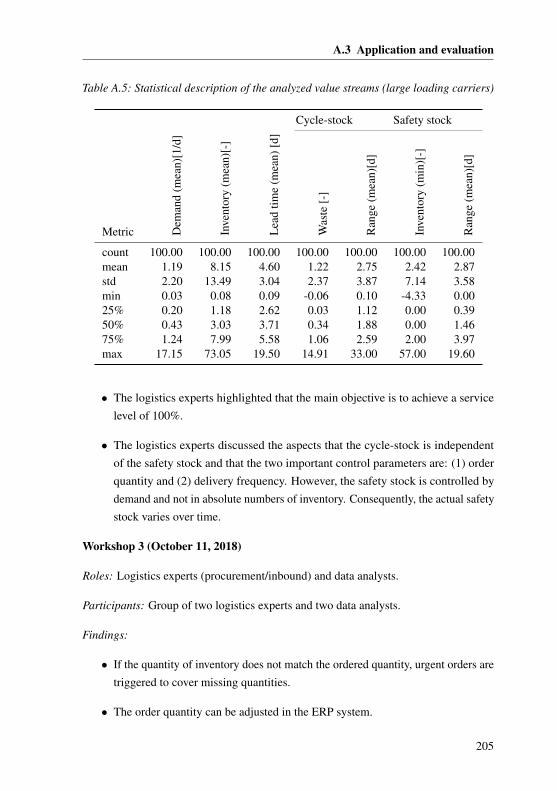
A.3 Application and evaluation
Table A.5: Statistical description of the analyzed value streams (large loading carriers)
Cycle-stock Safety stock
Metric Dem
and
(mea
n)[1
/d]
Inve
ntor
y(m
ean)
[-]
Lea
dtim
e(m
ean)
[d]
Was
te[-
]
Ran
ge(m
ean)
[d]
Inve
ntor
y(m
in)[
-]
Ran
ge(m
ean)
[d]
count 100.00 100.00 100.00 100.00 100.00 100.00 100.00mean 1.19 8.15 4.60 1.22 2.75 2.42 2.87std 2.20 13.49 3.04 2.37 3.87 7.14 3.58min 0.03 0.08 0.09 -0.06 0.10 -4.33 0.0025% 0.20 1.18 2.62 0.03 1.12 0.00 0.3950% 0.43 3.03 3.71 0.34 1.88 0.00 1.4675% 1.24 7.99 5.58 1.06 2.59 2.00 3.97max 17.15 73.05 19.50 14.91 33.00 57.00 19.60
• The logistics experts highlighted that the main objective is to achieve a servicelevel of 100%.
• The logistics experts discussed the aspects that the cycle-stock is independentof the safety stock and that the two important control parameters are: (1) orderquantity and (2) delivery frequency. However, the safety stock is controlled bydemand and not in absolute numbers of inventory. Consequently, the actual safetystock varies over time.
Workshop 3 (October 11, 2018)
Roles: Logistics experts (procurement/inbound) and data analysts.
Participants: Group of two logistics experts and two data analysts.
Findings:
• If the quantity of inventory does not match the ordered quantity, urgent orders aretriggered to cover missing quantities.
• The order quantity can be adjusted in the ERP system.
205
Appendix
Workshop 4 (October 16, 2018)
Roles: Logistics experts (procurement/inbound) and data analysts.
Participants: Group of two logistics experts and one data analyst.
Findings:
• Fluctuation in demand is common due to different production schedules orseasonal effects. However, the production schedule is frozen within a reasonabletime frame that is longer than the replenishment time. The demand can beassumed as deterministic.
• The target value of the safety stock inventory in days depends on the supplier.Variables include the distance between the supplier and the production plant.The logistics experts stated that the goods are not instantly transferred into andstored in the warehouse, and additional buffers of inventory may be required,depending on the logistics reference process. Furthermore, quality issues requirea sufficient time span to check and subsequently block incoming goods or to reactto defective products. The procurement/inbound experts do not consider the valueof the goods.
• Regular orders are scheduled for a specific date but do not include a specific timeon that date. Therefore, the delivery time is unknown and can vary. Furthermore,critical dates exist that can require additional orders or quantities (e.g., publicholidays).
• For the assessment of waste of inventory, the absolute number of loading carriersmust be considered.
Workshop 5 (October 19, 2018)
Roles: Logistics experts (procurement / inbound) and data analysts.
Participants: Group of two logistics experts and data analyst.
Findings:
• The most common inventory control parameters are the inventory range of thesafety stock, the order quantity, and the delivery frequency. The absolute safetystock is rarely used.
206
A.3 Application and evaluation
• The order quantity can be set to a multiple of the small loading carriers on thepallet. However, this provides only value if the packages are stored separately,rather than on the pallet.
Workshop 6 (October 23, 2018)
Roles: Logistics experts (procurement / inbound) and data analysts.
Participants: Group of two logistics experts and two data analysts.
Findings:
• Waste of safety stock can be immediately reduced without restrictions. In contrast,the cycle-stock typically requires evaluating further aspects, for example, thenumber of deliveries per day and time.
A.3.5 Underlying assumptions of the cost-benefit calculation
The proposed cost structure of the cost-benefit calculation includes a variety of as-sumptions about the industrial application. The assumptions about the initial effort andcontinuous effort are outlined in this section.
Initial effort
The set-up requires the deployment of the developed approach.
• Planning and data extraction. The logistics experts stated that the definitionof objectives and analysis questions is comparable for both approaches. Subse-quently, the effort is not considered. For the data extraction, it is assumed thatthe ERP is available and can be accessed by the team. The effort for identifying,extracting, and standardizing the data equals 20 working days. Existing ERPreports are used. This assumption is based on the personal estimation of theauthor and the reported effort in the literature (cf. Chapter 3). It is assumed thatfive working days of validation, for example, conducting interviews on the shopfloor, are required to validate the data. Further on, five working days are requiredto evaluate the data consistency (e.g., outlier detection). Therefore, the effort tovalidate the data equals ten working days.
207
Appendix
• Data preprocessing. This step requires the implementation of the algorithmsby the software engineer. The team discusses critical attributes to specify theattributes for filtering. The effort to set-up data preprocessing equals 20 workingdays.
• Mining. This step requires the implementation of the algorithms by the softwareengineer. It is assumed that a process mining software, such as the open sourceframework ProM, is available. Existing software implementations can be used(e.g., the inductive miner for process discovery). The team implements suitablemetrics based on the requirements of the company. The effort to set-up miningequals 25 working days.
• Overhead. Unpredictable tasks can be required depending on the company-specific environment (e.g., existing skills of the people). Nine working days areincluded to cover any additional effort.
Continuous effort
The continuous effort depends on the variable amount (per value stream):
• Create the current state map. A visit to the shop floor is required to map eachvalue stream with pen and paper. This step records the material and informationflow from the goods receiving up to the assembly line, visiting at least twodifferent locations at the production plant. All activities of the value stream areobserved once. The performance metrics must be calculated, and the recordedvalue stream map must be drawn, to validate the results. The effort equals twoworking days for each value stream.
• Analyze the value stream. Both approaches require effort for the analysis. How-ever, the process and product complexity and dynamics can be covered usingprocess mining. Enriched attributes (e.g., supplier specification) are included. Incontrast, the analysis step of pen-and-paper-based value stream mapping requiresfurther interviews or data collection on the shop floor. The additional effort incomparison to process mining equals 0.5 working days for each value stream.
• Monitoring of the future state. Monitoring the future state requires creatingor updating the current state map and comparing the different states over time.Notably, comparing the different states is required for both approaches. The
208
A.4 Software used
additional effort in comparison to process mining equals 1.5 working days foreach value stream.
In contrast to pen-and-paper-based value stream mapping, the proposed approachintroduces fixed costs per year:
• Software maintenance. The software maintenance covers any effort requiredduring operations, such as implementing additional performance metrics or re-freshing the data. The effort for software maintenance equals 15 working days.
• Overhead. Any additional effort is covered by five working days.
A.4 Software used
• Camuda BPMN.io. BPMN process modeling tool, including a visualization ofthe business process. Available at: https://bpmn.io/
• Fluxicon Disco. Process mining software for professionals and academia. Avail-able at: https://fluxicon.com/disco/
• Java stack. The software development sack for Java includes many open sourceand commercial libraries. In this thesis, the primary libraries applied are theProM 6 stack and the Spring framework.
• LaTeX stack. The documentation of the thesis is written in LATEX. The opensource tool Sublime Text 3 was used as an editor. The tool is available athttps://www.sublimetext.com
• Microsoft Office R©. A commercial set of office tools that support various ap-plications. Work on this thesis used MS Excel R©and MS PowerPoint R©mostoften.
• ProM 6. Process mining software for academia. Available at: http://www.promtools.org
• Python stack. The software development stack for Python includes numerousopen source libraries. The libraries used the most often are Docker, Pandas,PySpark, Numpy, Multithreading, Pyodbc and Jupyter.
209
Appendix
A.5 Theses supervised
Between 2015 and 2019, the author extensively supervised and guided 19 students at theInstitute for Machine Tools and Industrial Management (iwb). The students completedtheir master’s theses, bachelor’s theses, or semester projects in the fields of processmining, value stream mapping, logistics, logistics planning, packaging planning, andchange management in a strong collaboration with the author. In particular, the authorsupervised the research clarification, objectives, research questions, approach, activities,and content. Discussions with the students and selected parts of the results contributedto this work (cf. Table A.6). The author expresses his great thanks to all students fortheir great support.
A.6 Publication list
Preliminary results related to this thesis have been presented at conferences and pub-lished in conference proceedings or journal publications. These publications are listedin the following.
KNOLL et al. 2016Knoll, D.; Prüglmeier, M.; Reinhart, G.: Predicting Future Inbound Logistics Pro-cesses using Machine Learning. Procedia CIRP 52 (2016), pp. 145–150.
KNOLL et al. 2017Knoll, D.; Prüglmeier, M.; Reinhart, G.: Materialflussanalyse mit ERP-Transportaufträgen. wt Werkstattstechnik online 3 (2017), pp. 129–133.
KNOLL et al. 2019aKnoll, D.; Neumeier, D.; Prüglmeier, M.; Reinhart, G.: An automated packagingplanning approach using machine learning. Procedia CIRP 81 (2019), pp. 576–581.
KNOLL et al. 2019bKnoll, D.; Waldmann, J.; Reinhart, G.: Developing an internal logistics ontologyfor process mining. Procedia CIRP 79 (2019), pp. 427–432.
210
A.6 Publication list
KNOLL et al. 2019cKnoll, D.; Reinhart, G.; Prüglmeier, M.: Enabling value stream mapping for internallogistics using multidimensional process mining. Expert Systems with Applications
124 (2019), pp. 130–142.
REINHART et al. 2017Reinhart, G.; Knoll, D.; Teschemacher, U.; Lux, G.; Schnell, J.; Endres, F.; Distel,F.; Seidel, C.; Berger, C.; Klöber-Koch, J.; Pielmeier, J.; Braunreuther, S.: Anwen-dungsfeld Automobilindustrie. In: Handbuch Industrie 4.0. Ed. by G. Reinhart.München: Carl Hanser. 2017.
SCHUH et al. 2019Schuh, G.; Reinhart, G.; Prote, J. P.; Sauermann, F.; Horsthofer, J.; Oppolzer,F.; Knoll, D.: Data mining definitions and applications for the management ofproduction complexity. Procedia CIRP 81 (2019), pp. 874–879.
211
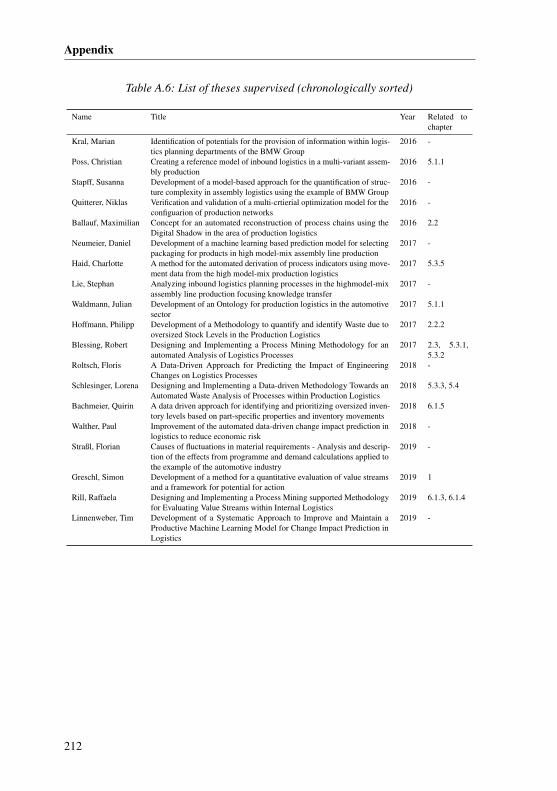
Appendix
Table A.6: List of theses supervised (chronologically sorted)
Name Title Year Related tochapter
Kral, Marian Identification of potentials for the provision of information within logis-tics planning departments of the BMW Group
2016 -
Poss, Christian Creating a reference model of inbound logistics in a multi-variant assem-bly production
2016 5.1.1
Stapff, Susanna Development of a model-based approach for the quantification of struc-ture complexity in assembly logistics using the example of BMW Group
2016 -
Quitterer, Niklas Verification and validation of a multi-crtierial optimization model for theconfiguarion of production networks
2016 -
Ballauf, Maximilian Concept for an automated reconstruction of process chains using theDigital Shadow in the area of production logistics
2016 2.2
Neumeier, Daniel Development of a machine learning based prediction model for selectingpackaging for products in high model-mix assembly line production
2017 -
Haid, Charlotte A method for the automated derivation of process indicators using move-ment data from the high model-mix production logistics
2017 5.3.5
Lie, Stephan Analyzing inbound logistics planning processes in the highmodel-mixassembly line production focusing knowledge transfer
2017 -
Waldmann, Julian Development of an Ontology for production logistics in the automotivesector
2017 5.1.1
Hoffmann, Philipp Development of a Methodology to quantify and identify Waste due tooversized Stock Levels in the Production Logistics
2017 2.2.2
Blessing, Robert Designing and Implementing a Process Mining Methodology for anautomated Analysis of Logistics Processes
2017 2.3, 5.3.1,5.3.2
Roltsch, Floris A Data-Driven Approach for Predicting the Impact of EngineeringChanges on Logistics Processes
2018 -
Schlesinger, Lorena Designing and Implementing a Data-driven Methodology Towards anAutomated Waste Analysis of Processes within Production Logistics
2018 5.3.3, 5.4
Bachmeier, Quirin A data driven approach for identifying and prioritizing oversized inven-tory levels based on part-specific properties and inventory movements
2018 6.1.5
Walther, Paul Improvement of the automated data-driven change impact prediction inlogistics to reduce economic risk
2018 -
Straßl, Florian Causes of fluctuations in material requirements - Analysis and descrip-tion of the effects from programme and demand calculations applied tothe example of the automotive industry
2019 -
Greschl, Simon Development of a method for a quantitative evaluation of value streamsand a framework for potential for action
2019 1
Rill, Raffaela Designing and Implementing a Process Mining supported Methodologyfor Evaluating Value Streams within Internal Logistics
2019 6.1.3, 6.1.4
Linnenweber, Tim Development of a Systematic Approach to Improve and Maintain aProductive Machine Learning Model for Change Impact Prediction inLogistics
2019 -
212
List of Figures
1.1 Design Research Methodology (BLESSING & CHAKRABARTI 2009,p. 15) . . . . . . . . . . . . . . . . . . . . . . . . . . . . . . . . . . 8
1.2 Structure of the thesis and research design . . . . . . . . . . . . . . . 11
2.1 Standardized material flow activities in internal logistics (extract, basedon GÜNTHNER & BOPPERT 2013, p. 138) . . . . . . . . . . . . . . . 15
2.2 Process mining context model: types, perspectives, and related concepts(based on BOLT & VAN DER AALST 2015; CALVANESE et al. 2016;ECK et al. 2015; VAN DER AALST 2016) . . . . . . . . . . . . . . . . 20
2.3 Process model using the BPMN notation (VAN DER AALST 2016, p. 69) 252.4 The concept of process cubes (VAN DER AALST 2013, p. 6) . . . . . . 262.5 The concept of trace clustering (BOSE & VAN DER AALST 2010, p. 397) 272.6 Process Mining Project Methodology (PM2) (ECK et al. 2015, p. 299) . 282.7 Domain ontology with annotations for ontology-based data extraction
(CALVANESE et al. 2016, p. 105) . . . . . . . . . . . . . . . . . . . . 30
3.1 Approach for a systematic literature review of process mining in lo-gistics and manufacturing (based on BOELL & CECEZ-KECMANOVIC
2014; BRERETON et al. 2007; WEBSTER & WATSON 2002) . . . . . . 313.2 Classification of relevant process mining literature according to the
domain and industry . . . . . . . . . . . . . . . . . . . . . . . . . . . 333.3 Process mining methodology for analyzing a goods receiving process
in the shoe manufacturing industry (ER et al. 2015a, p. 119) . . . . . . 343.4 Trace clustering for process mining of transportation logs in a ship-
building manufacturing process (S.-k. LEE et al. 2013, p. 86) . . . . . . 363.5 Conformance checking of an outgoing goods process in a mattress
factory (own illustration, based on PASZKIEWICZ (2013)) . . . . . . . 373.6 Process mining methodology for acquiring logistics knowledge in a port
logistics process (Y. WANG et al. 2014a, p. 197) . . . . . . . . . . . . 38
XIII
List of Figures
3.7 Performance analysis of time-dependent variability using the perfor-mance spectrum (illustration modified from DENISOV et al. 2018, p. 140) 40
3.8 Framework for process mining of the block assembly process in theshipbuilding industry (J. PARK et al. 2014) . . . . . . . . . . . . . . . 48
3.9 Methodology for process mining in the manufacturing industry (ownillustration, based on NATSCHLÄGER et al. (2017)) . . . . . . . . . . . 52
4.1 Conceptual design of value stream mapping for internal logistics usingprocess mining: a methodology and four research modules . . . . . . . 66
4.2 Example extract of the internal logistics ontology with annotations forprocess mining (based on KNOLL et al. 2019b) . . . . . . . . . . . . . 69
4.3 Example set of enriched event logs (based on KNOLL et al. 2019b,c) . . 72
4.4 Example extract of mined value streams (based on KNOLL et al. 2019c) 75
4.5 Illustration of the procedure to select suitable guidelines in the referencemodel for the analysis (e.g., to identify waste) . . . . . . . . . . . . . 77
5.1 Overview of the top classes and relations of the internal logistics ontol-ogy (based on KNOLL et al. 2019b, p. 430) . . . . . . . . . . . . . . . 83
5.2 The class CustomerOrder of the internal logistics ontology (based onKNOLL et al. 2019b, p. 430) . . . . . . . . . . . . . . . . . . . . . . . 84
5.3 The class Process of the internal logistics ontology (KNOLL et al. 2019b) 85
5.4 The class UnitLoad of the internal logistics ontology (KNOLL et al.2019b) . . . . . . . . . . . . . . . . . . . . . . . . . . . . . . . . . . 87
5.5 The class Resource of the internal logistics ontology (KNOLL et al. 2019b) 88
5.6 The class Actor of the internal logistics ontology (KNOLL et al. 2019b) 89
5.7 Data Flow Diagram (DFD) for preprocessing event logs . . . . . . . . 95
5.8 Data Flow Diagram (DFD) for mining and clustering value streams . . 105
5.9 Illustration of conformance checking on process model M . . . . . . . 109
5.10 Reference model for the analysis (reading down a column reveals inputsources, reading across a row indicates output sinks) . . . . . . . . . . 125
6.1 Conformance checking of value streams and 15 reference processes . . 140
6.2 Value stream clustering for Reference process 13 (goods receiving, highrack to the assembly line) . . . . . . . . . . . . . . . . . . . . . . . . 142
6.3 Process discovery for a wasteful value stream (trace fitness = 0.72) . . . 144
XIV
List of Figures
6.4 Demand (packages per day) for each reference process, filtered to smallloading carriers and ordered by the effort (ascending) . . . . . . . . . . 146
6.5 Result of the inventory analysis with logistics experts (N = 35 valuestreams) . . . . . . . . . . . . . . . . . . . . . . . . . . . . . . . . . 150
6.6 Inventory profile of a wasteful value stream (cycle-stock and safety stock)1516.7 Break-even analysis of pen-and-paper-based and process mining-based
value stream mapping (including a continuous effort of three years) . . 156
A.1 Mapping of practical guidelines for the analysis (1 of 2) . . . . . . . . 198A.2 Mapping of practical guidelines for the analysis (2 of 2) . . . . . . . . 199
XV

List of Tables
2.1 Seven types of waste in lean production and lean logistics (cf. GOLDSBY
& MARTICHENKO 2005; GÜNTHNER & BOPPERT 2013; OHNO 1988) 162.2 A fragment of some event log: each line corresponds to an event (based
on VAN DER AALST 2016, p. 129) . . . . . . . . . . . . . . . . . . . 23
3.1 Evaluation of selected process mining publications in logistics: Internallogistics, infrastructure logistics, and others . . . . . . . . . . . . . . . 45
3.2 Evaluation of selected process mining publications in manufacturing:Capital goods, semiconductor, consumer durables, and other industries 57
5.1 Evaluation of relevant work for developing the internal logistics ontology 805.2 Main terms of the internal logistics ontology based on the review . . . 825.3 Evaluation of imperfection patterns of event data in internal logistics . . 935.4 Flattened input data λTO of transfer orders . . . . . . . . . . . . . . . 975.5 Flattened input data λA of activities . . . . . . . . . . . . . . . . . . . 1005.6 Flattened input data λST of storages . . . . . . . . . . . . . . . . . . . 1005.7 Flattened input data λPG of packaging . . . . . . . . . . . . . . . . . . 1005.8 Flattened input data λSU of suppliers . . . . . . . . . . . . . . . . . . 1015.9 Flattened input data λPT of parts . . . . . . . . . . . . . . . . . . . . . 1015.10 Extract of the enriched event log Le (Extensible Event Stream (XES)
Standard Definition 2.0) . . . . . . . . . . . . . . . . . . . . . . . . . 1045.11 Relevant performance metrics in the context of internal logistics (based
on GUNASEKARAN & KOBU 2007; ROMERO & ARCE 2017; SANTOS
et al. 2016; SHOU et al. 2017) . . . . . . . . . . . . . . . . . . . . . . 118
6.1 Supporting metrics for value stream clustering of Reference process 13 1436.2 Identified value streams for demand-based process leveling . . . . . . . 1476.3 Characterizing value streams with inventory waste metrics (extract of
small loading carriers, ordered by inventory (mean)) . . . . . . . . . . 149
XVII
List of Tables
6.4 Effort in working days of pen-and-paper-based and process mining-based value stream mapping . . . . . . . . . . . . . . . . . . . . . . . 155
A.1 Analysis of eight Warehouse Management Systems (WMS) in terms oftransfer orders and the underlying data models . . . . . . . . . . . . . 191
A.2 Additional attributes to be enriched into event log Le (Extensible EventStream (XES) Standard Definition 2.0) . . . . . . . . . . . . . . . . . 194
A.3 Parameters of the approach used for the industrial application . . . . . 200A.4 Statistical description of the analyzed value streams (small loading
carriers) . . . . . . . . . . . . . . . . . . . . . . . . . . . . . . . . . 204A.5 Statistical description of the analyzed value streams (large loading carriers)205A.6 List of theses supervised (chronologically sorted) . . . . . . . . . . . . 212
XVIII
List of Abbreviations
ABC Activity-based CostingBFS Breadth-First SearchBPMN Business Process Modeling NotationDFD Data Flow DiagramDRM Design Research MethodologyDSM Design Structure MatrixERP Enterprise Resource PlanningFIFO First In - First OutJIT just-in-timeJIS just-in-sequenceMIT Massachusetts Institute of TechnologyMES Manufacturing Execution SystemMRP Material Resource PlanningONTO-PDM Product-driven ONTOlogy for Product Data ManagementRFID Radio frequency identificationRC Research ContributionRQ Research QuestionPM2 Process Mining Project MethodologyPSL Process Specification LanguageSCM Supply Chain ManagementTPS Toyota Production SystemTUM Technical University of MunichWMS Warehouse Management SystemXES Extensible Event Stream
XIX

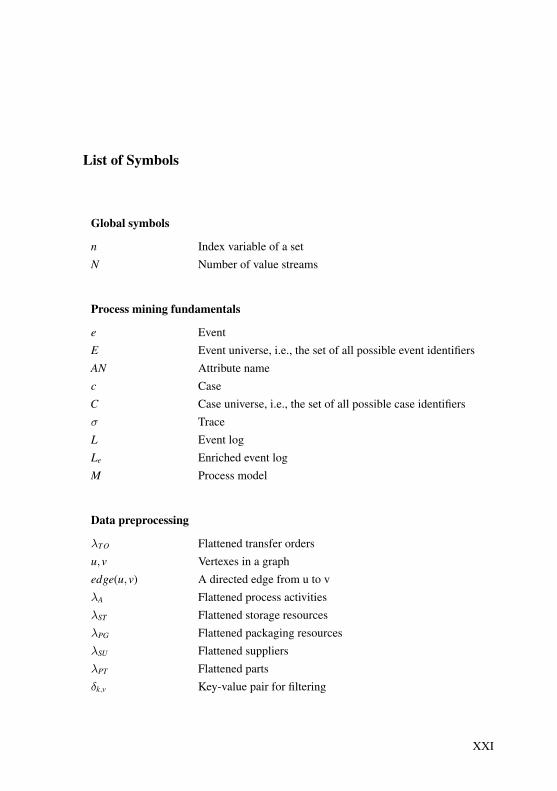
List of Symbols
Global symbols
n Index variable of a setN Number of value streams
Process mining fundamentals
e EventE Event universe, i.e., the set of all possible event identifiersAN Attribute namec CaseC Case universe, i.e., the set of all possible case identifiersσ TraceL Event logLe Enriched event logM Process model
Data preprocessing
λTO Flattened transfer ordersu,v Vertexes in a graphedge(u,v) A directed edge from u to vλA Flattened process activitiesλST Flattened storage resourcesλPG Flattened packaging resourcesλSU Flattened suppliersλPT Flattened partsδk,v Key-value pair for filtering
XXI

List of Symbols
Mining
IP Inventory profileDP Demand profileGP Goods receiving profileδt Time-intervalk Number of time-intervals δt
f Feature
XXII