Logistics Operations and Management
486
-
Upload
khangminh22 -
Category
Documents
-
view
1 -
download
0
Transcript of Logistics Operations and Management


Logistics Operations and Management

This page intentionally left blank

Logistics Operations andManagementConcepts and Models
Reza Zanjirani FarahaniInformatics and Operations ManagementKingston Business SchoolKingston University, Kingston HillKingston Upon Thames, Surrey KT2 7LB
Shabnam RezapourIndustrial Engineering Department,Urmia University of Technology, Urmia, Iran
Laleh KardarDepartment of Industrial Engineering, University of Houston,Houston, TX, USA
AMSTERDAM � BOSTON � HEIDELBERG � LONDON � NEW YORK � OXFORD
PARIS � SAN DIEGO � SAN FRANCISCO � SINGAPORE � SYDNEY � TOKYO

Elsevier
32 Jamestown Road London NW1 7BY
225 Wyman Street, Waltham, MA 02451, USA
First edition 2011
Copyright r 2011 Elsevier Inc. All rights reserved
No part of this publication may be reproduced or transmitted in any form or by any
means, electronic or mechanical, including photocopying, recording, or any information
storage and retrieval system, without permission in writing from the publisher. Details on
how to seek permission, further information about the Publisher’s permissions policies
and our arrangement with organizations such as the Copyright Clearance Center and the
Copyright Licensing Agency, can be found at our website: www.elsevier.com/permissions
This book and the individual contributions contained in it are protected under copyright by
the Publisher (other than as may be noted herein).
Notices
Knowledge and best practice in this field are constantly changing. As new research and
experience broaden our understanding, changes in research methods, professional practices,
or medical treatment may become necessary.
Practitioners and researchers must always rely on their own experience and knowledge in
evaluating and using any information, methods, compounds, or experiments described
herein. In using such information or methods they should be mindful of their own safety and
the safety of others, including parties for whom they have a professional responsibility.
To the fullest extent of the law, neither the Publisher nor the authors, contributors, or editors,
assume any liability for any injury and/or damage to persons or property as a matter of
products liability, negligence or otherwise, or from any use or operation of any methods,
products, instructions, or ideas contained in the material herein.
British Library Cataloguing-in-Publication Data
A catalogue record for this book is available from the British Library
Library of Congress Cataloging-in-Publication Data
A catalog record for this book is available from the Library of Congress
ISBN: 978-0-12-385202-1
For information on all Elsevier publications
visit our website at www.elsevierdirect.com
This book has been manufactured using Print On Demand technology. Each copy is
produced to order and is limited to black ink. The online version of this book will show
color figures where appropriate.

Contents
List of Contributors xv
Part I Introduction 1
1 Overview 3
Reza Zanjirani Farahani, Shabnam Rezapour, and Laleh Kardar
1.1 History 3
1.2 Definition of Logistics 31.2.1 Why Is Logistics Important? 4
1.3 Evolution of Logistics Over Time 4
1.4 Other Logistical Books 5
1.5 The Focus of This Book 5
1.6 Organization 6
1.7 Audiences 8
2 Physical Flows 11
Hannan Sadjady
2.1 The Transportation System 13
2.1.1 Transport Modes and Their Characteristics 13
2.1.2 Other Transport Options 21
2.2 Physical Nature of the Product 24
2.2.1 Volume-to-Weight Ratio 24
2.2.2 Value-to-Weight Ratio 242.3 Channels of Distribution 26
2.3.1 Distribution Channels and Their Types 26
2.3.2 Physical Distribution Channel 27
2.4 Warehousing and Storage 30
2.4.1 Warehousing Functions 31
2.4.2 Packaging and Unit Loads 33
2.4.3 Storage and Handling Systems 34
Part II Strategic Issues 41
3 Logistics Strategic Decisions 43
Maryam SteadieSeifi
3.1 Strategy 43
3.2 Strategic Planning 44

3.3 Logistics 45
3.3.1 Logistics Differences to Supply Chain 453.4 Logistics Decisions 46
3.4.1 Operational Decisions 46
3.4.2 Tactical Decisions 46
3.4.3 Strategic Decisions 47
3.5 Logistics Planning 47
3.6 Logistics Strategic Decisions 48
3.6.1 Customer Service 48
3.6.2 Logistics Network Design 493.6.3 Outsourcing versus Vertical Integration 50
3.7 Tools of Strategic Decision Making 51
3.8 Logistics Strategic Flexibility 52
3.9 Summary 52
4 Logistics Philosophies 55
Zahra Rouhollahi
4.1 Lean Logistics 55
4.1.1 Japanese Philosophy 55
4.1.2 Just-in-Time Philosophy 56
4.1.3 Lean Principles 58
4.1.4 Lean Warehousing: Cross Docking 59
4.2 Agile Logistics 62
4.2.1 Agile versus Lean 63
4.2.2 Quick Response 644.2.3 Vendor-Managed Inventory 66
5 Logistics Parties 71
Seyed-Alireza Seyed-Alagheband
5.1 Third-Party Logistics: An Overview 72
5.1.1 Why 3PLs? 72
5.1.2 Definition 735.1.3 Emergence of 3PLs 74
5.1.4 Activities of 3PLs 74
5.1.5 Advantages and Disadvantages of 3PL 75
5.1.6 Types of 3PLs 76
5.1.7 2009 3PLs: Results and Findings of the Fourteenth
Annual Study 77
5.2 New Generations of Logistics Parties 78
5.2.1 Fourth-Party Logistics 785.2.2 Fifth-Party Logistics 80
5.2.3 Future Trends 81
5.2.4 Logistics Vendors 81
5.3 3PLs: Theories and Conceptualizations 83
5.3.1 Outsourcing Decision 83
vi Contents

5.3.2 Selecting the Right 3PL 84
5.3.3 Purchasing 3PL Services 855.3.4 Strategic Behavior of 3PLs 86
5.3.5 Theoretical Models 87
5.3.6 A Framework for the Development of an Effective 3PL 88
5.4 Concluding Remarks 90
6 Logistics Future Trends 93
Amir Zakery
6.1 Main Influencing Issues 93
6.1.1 Globalization 93
6.1.2 Information Technology 95
6.1.3 New Technologies 96
6.2 Future Trends in Some Logistics Sectors 97
6.2.1 Future Trends for Inventory Management 98
6.2.2 Global Transportation Issues 99
6.2.3 Future Trends for Warehousing 1006.3 Future Trends in Technical Reports 101
6.3.1 Future Trends of Logistics in the United Kingdom 101
6.3.2 Thinner Margins in the Industry: A Chance to Improve for
Shippers 102
6.3.3 Third-Party Logistics Maturing Quickly 103
6.3.4 Strategic Shift Toward Redesigning Logistics Networks 103
6.3.5 Need for Broader Range of Logistics Services 103
6.3.6 Five Influencing Factors in the Future of
European Logistics 103
6.3.7 Five Trends Supporting Logistics Success in China 104
Part III Tactical and Operational Issues 107
7 Transportation 109
Zohreh Khooban
7.1 Basic Aspects in Transportation Systems 109
7.1.1 The Role of Transportation in Logistics 109
7.1.2 Transportation Participants 110
7.1.3 Delivery Frequency System 111
7.1.4 Long-Haul Consolidated Freight Transportation 113
7.2 Classification of Transportation Problems 114
7.2.1 Planning Levels 115
7.2.2 Variants of the Standard of TPs 1167.2.3 Carrier Decision-Making Problems 119
7.2.4 Shipper Decision-Making Problems 122
7.3 Case Study: An Application of Cost Analyses for Different
Transportation Modes in Turkey 124
viiContents

8 The Vehicle-Routing Problem 127
Farzaneh Daneshzand
8.1 Definitions and Applications 127
8.2 Basic VRP Variants 127
8.2.1 The Capacitated VRP 128
8.2.2 Distance-Constrained and Capacitated VRP 130
8.2.3 VRP with Time Windows 131
8.2.4 VRP with Backhauls 132
8.2.5 VRP with Pickup and Delivery 134
8.3 Solution Techniques for Basic VRP Variants 1368.4 Other Variants of VRP 137
8.4.1 Open VRP 137
8.4.2 Multidepot VRP 138
8.4.3 Mix Fleet VRP 138
8.4.4 Split-Delivery VRP 139
8.4.5 Periodic VRP 141
8.4.6 Stochastic VRP 142
8.4.7 Fuzzy VRP 1438.5 Case Studies 143
8.5.1 The Product Distribution of a Dairy and Construction
Company 143
8.5.2 The Collection of Urban Recyclable Waste 145
9 Packaging and Material Handling 155
Mahsa Parvini
9.1 Material Handling 1559.1.1 History 155
9.1.2 Definition 155
9.1.3 MH Principles 157
9.1.4 MH Equipment 158
9.1.5 Unit-Load Design 160
9.1.6 Designing MH Systems 161
9.1.7 MH Costs 164
9.1.8 MH System Models 1669.2 Packaging 169
9.2.1 History 169
9.2.2 Definition 169
9.2.3 Functions of Packaging 169
9.2.4 Packaging Operations 171
9.2.5 Packaging Equipment 171
9.2.6 Labeling 172
9.2.7 Protection Packaging 1749.2.8 Packaging for Distribution Efficiency 175
9.2.9 Packaging Costs 176
9.2.10 Packaging Models 177
9.3 Case Study 177
viii Contents

10 Storage, Warehousing, and Inventory Management 181
Maryam Abbasi
10.1 The Reasons for Storage Inventory 181
10.2 The Role of Distribution Centers and Warehouses in Logistics 181
10.3 Warehouse Location 182
10.4 Warehouse Design 183
10.4.1 Size of Warehouse 183
10.4.2 Storage Policies 183
10.5 Types of Warehouses 184
10.6 Warehouse Components 18510.7 Warehouse Tasks and Activities 186
10.7.1 Material Flow in Warehouse 186
10.7.2 Order Picking 186
10.8 Inventory Management 188
10.8.1 Types of Inventory 188
10.8.2 Costs of Inventory 188
10.8.3 Inventory Control 189
10.9 Virtual Warehouses 195
11 Customer Service 199
Samira Fallah
11.1 Customer-Service Definition 199
11.1.1 Customer Service as an Organizational Activity 199
11.1.2 Customer Service as a Process 199
11.1.3 Customer Service from the Customer’s Side 19911.1.4 How Experts Define Customer Service? 200
11.1.5 Defining Customer Service in Logistics Context 200
11.2 What Is Behind the Growing Importance of Customer Service? 200
11.2.1 Customer Service: The Intangible Part of a Product 200
11.2.2 Costs of Attracting New Customers 201
11.2.3 Customer Service, Customer Satisfaction, and Loyalty 201
11.2.4 Customers as a Means of Marketing 201
11.2.5 Customer Service and Organization Excellence 20211.2.6 Customer Service and Staff Job Satisfaction 202
11.3 Customer-Service Elements 202
11.3.1 Pretransaction Elements 203
11.3.2 Transaction Elements 203
11.3.3 Post transaction Elements 204
11.4 Order-Cycle Time 204
11.4.1 Order Preparation and Transmittal 205
11.4.2 Order Processing 20511.4.3 Order Picking and Packing 206
11.4.4 Order Transportation and Delivery 206
11.5 Developing a Policy for Customer Service 206
11.5.1 Important Points 206
ixContents

11.5.2 Steps for Developing Customer-Service Policy 207
11.5.3 A Case Study on Customer Segmentation Based on
Customer-Service Elements 209
11.5.4 Setting Customer-Service Level 212
11.6 Measuring Customer-Service Performance 215
Part IV Special Areas and Philosophies 219
12 Logistics System: Information and Communication Technology 221
Shokoofeh Asadi
12.1 The Importance of Information in Logistics 221
12.2 Logistic Information System 222
12.2.1 Information Flow 222
12.2.2 A LISs’ Functionality Levels 223
12.2.3 Role of Information in Logistics System Operation
and Performance 224
12.2.4 LIS Structure 227
12.2.5 System Modules 230
12.2.6 LIS Characteristics 232
12.3 Logistics Information and Communication Technology 233
12.3.1 Data-Handling Hardware (Data Collection and
Data Identification) 234
12.3.2 Positioning 23712.3.3 Communication, Networks, and Data Exchange 238
12.4 Conclusion 244
13 Reverse Logistics 247
Masoomeh Jamshidi
13.1 The Literature on RL 248
13.1.1 General Summaries and Basic RL Concepts 24813.1.2 Research on Quantitative Approaches 249
13.1.3 Studies of Logistical Topics 250
13.1.4 Company Profiles 250
13.1.5 RL Applications 251
13.2 Review of Various Aspects of RL 251
13.2.1 Driving Forces Behind RL 251
13.2.2 Reasons for Return 252
13.2.3 Types and Characteristics of Returned Products 25213.2.4 RL Processes 254
13.2.5 RL Actors 255
13.3 Information Technology for RL 256
13.4 RL and Vehicle Routing 256
x Contents

13.5 Quantitative Models for RL 257
13.5.1 Reverse Distribution 25713.5.2 Inventory Control Systems with Return Flows 260
13.5.3 Production Planning with Reuse 263
13.6 Classification of Product Recovery Networks 263
14 Retail Logistics 267
Hamid Afshari and Fatemeh Hajipouran Benam
14.1 Overview 267
14.1.1 Introduction 267
14.1.2 Retail Strategy 268
14.1.3 Goods and Service Retailing 269
14.1.4 Factors That Affect International Retailing 269
14.1.5 Information Flow in a Retail Distribution Channel 270
14.1.6 The World’s Top Retailers 271
14.2 Typology 27114.2.1 Introduction 271
14.2.2 Ownership Institution 272
14.2.3 Store-Based Strategy Mix Institution 273
14.2.4 Nonstore-Based Institution 275
14.2.5 Types of Locations 275
14.3 Techniques 276
14.3.1 Location and Site Evaluation 276
14.3.2 Human Resource Management 28214.3.3 Pricing in Retailing 283
14.3.4 Customer Satisfaction in Retailing 284
14.3.5 World Retail Congress 284
14.4 Future Trends 284
14.5 Case Study 285
14.5.1 History of Russian Retail Chains 285
14.5.2 Conventional Food Retailing with a Spotlight on
Differentiation 286
15 Humanitarian Logistics Planning in Disaster Relief Operations 291
Ehsan Nikbakhsh and Reza Zanjirani Farahani
15.1 Introduction 291
15.2 Disasters 292
15.2.1 Classification of Disasters 29215.2.2 Effects of Disasters on Nations 294
15.3 Disaster Management System Cycle 296
15.3.1 Mitigation 297
15.3.2 Preparedness 297
xiContents

15.3.3 Response 299
15.3.4 Recovery 29915.4 Humanitarian Logistics 299
15.4.1 Humanitarian Logistics Systems Versus
Commercial Supply Chains 300
15.4.2 Humanitarian Logistics Chain Structure 301
15.4.3 Required Items and Equipments in
Humanitarian Logistics 302
15.5 Humanitarian Logistics Problems 303
15.5.1 Location Models 30415.5.2 Transportation and Distribution Models 307
15.5.3 Inventory Models 310
15.5.4 Integrated Logistics Models 312
15.6 Coordination of Humanitarian Logistics Systems 315
15.6.1 Supply Chain Coordination 316
15.6.2 Important Factors in Coordinating Humanitarian
Logistics Operations 316
15.6.3 Humanitarian Coordination Mechanisms 31815.7 Performance Measurement of Humanitarian Logistics Systems 319
15.8 Case Studies and Learned Lessons 322
15.8.1 The Yogyakarta Earthquake, 2006 322
15.8.2 Hurricane Katrina, 2005 323
15.8.3 Asian Tsunami, 2004 324
15.9 Conclusion 325
16 Freight-Transportation Externalities 333
Fatemeh Ranaiefar and Amelia Regan
16.1 Introduction 333
16.2 Freight-Transportation Trends and Costs 334
16.3 Over-the-Road Freight-Transportation Externalities 336
16.3.1 Air Pollution 338
16.3.2 Global Climate Change 34116.3.3 Noise Pollution 342
16.3.4 Congestion 344
16.3.5 Accidents 344
16.3.6 Construction and Maintenance 346
16.4 Policies to Reduce Externalities 346
16.4.1 Urban Freight Strategies 347
16.4.2 Vehicle-Technology Improvements 348
16.4.3 Intelligent Transportation Systems 34816.4.4 Pricing Strategies 350
16.4.5 Intermodal Transportation 352
16.4.6 Strategies to Reduce Empty Travel 353
16.5 Conclusion 354
xii Contents

17 Robust Optimization of Uncertain Logistics Networks 359
Sara Hosseini and Wout Dullaert
17.1 A Literature Review on RO 360
17.2 Optimization Under Uncertainty 361
17.2.1 Uncertainties in the Logistics Networks 361
17.2.2 Optimization Approaches Under Uncertainties 362
17.2.3 Robust Optimization 362
17.3 RO of Logistics Networks 364
17.3.1 A Variability Formation of RO for the General
Logistics Problem 36417.3.2 A Regret Formation of RO for the Logistic Center
Location and Allocation 366
17.3.3 A Min-Max Formation of RO for Road Networks 368
17.4 Challenges of RO 369
18 Integration in Logistics Planning and Optimization 371
Behnam Fahimnia, Reza Molaei, and Mohammad Hassan Ebrahimi
18.1 Logistics Planning and Optimization Problem 371
18.2 Significance of Integrated LP 373
18.2.1 Profitability 373
18.2.2 Quicker Response to Market Changes 373
18.3 Issues in Integrated LP 373
18.4 An Integrated LP Model 374
18.4.1 Key Performance Indicators 375
18.4.2 Assumptions 37518.4.3 Parameters and Decision Variables 376
18.4.4 Objective Function and Model Constraints 377
18.5 Optimization Tools and Techniques 380
18.5.1 Mathematical Techniques 380
18.5.2 Heuristic Techniques 381
18.5.3 Simulation Modeling 382
18.5.4 Genetic Algorithms 382
18.6 A Case Study 38318.6.1 Case Problem 383
18.6.2 Optimization Procedure 384
18.6.3 Results Achieved 385
19 Optimization in Natural Gas Network Planning 393
Maryam Hamedi, Reza Zanjirani Farahani, and
Gholamreza Esmaeilian
19.1 Introduction 393
19.1.1 Natural Gas Network Modeling 393
19.1.2 Natural Gas Network Introducing 394
19.2 Natural Gas Network Problems 398
19.2.1 Formulating 398
xiiiContents

19.2.2 Optimization 399
19.2.3 Model Characteristics 40319.2.4 Types of Methods 405
19.3 Survey on Application of Optimization 408
19.3.1 Subnetworks 408
19.3.2 Main Problems 410
19.3.3 Mathematical Models Classifications 412
19.4 Case Studies 416
19.4.1 Case 1: Optimization of Planning in the Natural Gas
Supply Chain 41719.4.2 Case 2: Optimization of a Multiobjective Natural Gas
Production Planning 417
19.5 Conclusions and Directions for Further Research 418
20 Risk Management in Gas Networks: A Survey 421
Reza Zanjirani Farahani, Mohammad Bakhshayeshi Baygi, and
Seyyed Mostafa Mousavi
20.1 Structure of Gas Networks 421
20.2 The Vulnerabilities and Risks of Gas Networks 423
20.2.1 Why Is Risk Investigation Important? 423
20.2.2 What Are the Vulnerabilities and Risks of
Gas Networks? 424
20.3 How to Manage Risks in Gas Networks? 430
20.3.1 Valuating Key Asset and Estimating Losses 431
20.3.2 Identifying and Describing Vulnerabilities and Threats 43120.3.3 Performing Risk Assessments 433
20.3.4 Developing Applicable Risk-Abatement Options 435
20.3.5 Analyzing Options to Select Cost-Effective Ones 436
20.3.6 Implementing Chosen Activities 437
21 Modeling the Energy Freight-Transportation Network 441
Mohsen Rajabi
21.1 Introduction 441
21.1.1 Energy in the World 441
21.1.2 The Importance of Energy Around the World 442
21.1.3 Energy Freight Transportation 444
21.2 Energy Freight-Transportation Network 449
21.2.1 Application of Energy Freight-Transportation Models 449
21.2.2 Energy Freight-Transportation Network 450
21.2.3 Classifications of Energy Freight-Transportation Networks 45121.2.4 Introducing the Energy Freight-Transportation Network
Models 453
21.3 Case Studies 461
21.3.1 Case: A Pricing Mechanism for Determining the
Transportation Rates 461
21.4 Conclusions and Directions for Further Research 464
xiv Contents

List of Contributors
Maryam Abbasi
Department of Industrial Engineering,
Amirkabir University of Technology,
Tehran, Iran
Hamid Afshari
Iran Khodro Industrial Group (IKCO),
Iran
Shokoofeh Asadi
Industrial Engineering Department,
Amirkabir University of Technology,
Tehran, Iran
Mohammad Bakhshayeshi Baygi
Mechanical and Industrial
Engineering Department,
University of Concordia,
Montreal, Canada
Fatemeh Hajipouran Benam
Iran Khodro Industrial Group (IKCO),
Iran
Farzaneh Daneshzand
Department of Industrial Engineering,
Amirkabir University of Technology,
Tehran, Iran
Wout Dullaert
Institute of Transport and Maritime
Management Antwerp,
University of Antwerp, Belgium and
Antwerp Maritime Academy,
Antwerp, Belgium
Mohammad Hassan Ebrahimi
Terminal Management System
Department,
InfoTech International Company,
Tehran, Iran
Gholamreza Esmaeilian
Department of Mechanical and
Manufacturing Engineering, University
Putra Malaysia, Serdang, Selangor,
Malaysia and Department of Industrial
Engineering, Payam Noor Universiti, Iran
Behnam Fahimnia
School of Management, Division of
Business, University of South
Australia, Adelaide, Australia
Samira FallahDepartment of Industrial Engineering,
Amirkabir University of Technology,
Tehran, Iran
Reza Zanjirani Farahani
Department of Informatics and
Operations Management,
Kingston Business School,
Kingston University, Kingston Hill,
Kingston Upon Thames,
Surrey KT2 7LB
Maryam Hamedi
Department of Mechanical and
Manufacturing Engineering,
University Putra Malaysia,
Serdang, Selangor, Malaysia

Sara Hosseini
Petrochemical Industries
Development Management Co.,
Tehran, Iran
Masoomeh Jamshidi
Industrial Engineering Department,
Amirkabir University of Technology,
Tehran, Iran
Laleh Kardar
Department of Industrial Engineering,
University of Houston,
Houston, TX, USA
Zohreh Khooban
Department of Industrial Engineering,
Amirkabir University of Technology,
Tehran, Iran
Reza Molaei
Department of Technology
Development,
Iran Broadcasting Services (IRIB),
Tehran, Iran
Seyyed Mostafa Mousavi
Centre for Complexity Science,
University of Warwick,
Coventry, UK
Ehsan Nikbakhsh
Department of Industrial Engineering,
Faculty of Engineering, Tarbiat
Modares University,
Tehran, Iran
Mahsa Parvini
Faculty of Industrial Engineering,
Amirkabir University,
Tehran, Iran
Mohsen Rajabi
Department of Industrial Management,
Faculty of Management,
Tehran University, Tehran, Iran
Fatemeh Ranaiefar
Institute of Transportation Studies,
University of California,
Irvine, CA, USA
Amelia Regan
Computer Science and Institute of
Transportation Studies, University
of California, Irvine, CA, USA
Shabnam Rezapour
Industrial Engineering Department,
Urmia University of Technology,
Urmia, Iran
Zahra Rouhollahi
Department of Industrial Engineering,
Amirkabir University of Technology,
Tehran, Iran
Hannan SadjadyDepartment of Industrial Engineering,
Amirkabir University of Technology,
Tehran, Iran
Seyed-Alireza Seyed-Alagheband
Department of Industrial Engineering,
Amirkabir University of Technology,
Tehran, Iran
Maryam SteadieSeifi
Department of Industrial Engineering,
Amirkabir University of Technology,
Tehran, Iran
Amir Zakery
Department of Industrial Engineering,
Amirkabir University of Technology,
Tehran, Iran
xvi List of Contributors

Part I
Introduction

This page intentionally left blank

1 Overview
Reza Zanjirani Farahani1, Shabnam Rezapour2 and
Laleh Kardar3
1Department of Informatics and Operations Management, Kingston BusinessSchool, Kingston University, Kingston Hill, Kingston Upon Thames, SurreyKT2 7LB2Industrial Engineering Department, Urmia University of Technology, Urmia,Iran3Department of Industrial Engineering, University of Houston, Houston, TX, USA
1.1 History
Many people believe that logistics is a word, but from a semantics point of view its
origin was from ancient Greek and meant the “science of computation.” In fact, it is
originally from combat environments and not from business or academia. It seems
the ancient Greeks referred the word logistikos to military officers who were expert
in calculating the military needs for expeditions in war. As a science, it seems the
first book written on logistics was by Antoine-Henri Jomini (1779�1869), a general
in the French army and later in the Russian service, titled Summary of the Art of War
(1838). The book was on the Napoleonic art of war [1,2].
1.2 Definition of Logistics
Jomini defined logistics as “the practical art of moving armies” and included a vast
range of functions involved in moving and sustaining military forces: planning,
administration, supply, billeting and encampments, bridge and road building, and
even reconnaissance and intelligence insofar as they were related to maneuvers off
the battlefield [1].
What is logistics? This section is an adoption of the first chapter in Farahani et al.
(2009b) [3]. Many different definitions for logistics can be found. The most well
known are the following: (a) “Logistics is . . . the management of all activities which
facilitate movement and the co-ordination of supply and demand in the creation of
time and place utility” [8]. (b) “Logistics management is . . . the planning, imple-
mentation and control of the efficient, effective forward and reverse flow and stor-
age of goods, services and related information between the point of origin and the
point of consumption in order to meet customer requirements” (CSCMP 2006) [7]
Logistics Operations and Management. DOI: 10.1016/B978-0-12-385202-1.00001-3
© 2011 Elsevier Inc. All rights reserved.

(c) “Logistics is. . . the positioning of resources at the right time, in the right place,
at the right cost, at the right quality” (Chartered Institute of Logistics and Transport,
UK, 2005) [7]. (d) “In civil organizations, logistics’ issues are encountered in firms
producing and distributing physical goods” [4]. (e) “Logistics is that part of the
supply chain process that plans, implements, and controls the efficient, effective for-
ward and reverse flow and storage of goods, services, and related information
between the point of origin and the point of consumption in order to meet customers’
requirements” (Council of Logistics Management 2003) [7].
1.2.1 Why Is Logistics Important?
In each country, a huge amount of money is spent annually in logistical activities.
For instance, in 2003 US logistical activity costs were 8.5% of the country’s GDP.
Given that the US GDP in 2003 was approximately $12,400 billion, the logistical
activity cost was approximately $1054 billion (Seventeenth Annual State of
Logistics Report of USA 2006)! [9].
1.3 Evolution of Logistics Over Time
Logistics has an ancient history. A quick look back can be enlightening. Its history
dates to the wars of the Greek and Roman empires in which the military officials
called logistiks were responsible for supplying and distributing needed resources
and services. Providing them had an important and essential role in the outcomes
of these wars. These logistiks also worked to damage the stores of their enemies
while defending their own. This gradually guided the development of current logis-
tics systems.
Logistics systems developed extensively during World War II (1939�1945).
Throughout this war, the United States and its allies’ armies were more efficient
than Germany’s. German army stores were damaged extensively, but Germany
could not impose the same destruction on its enemies’ stores. The US army could
supply whatever was needed by its forces at the right time, at the right place, and
in the most economical way. From that time, several new and advanced military
logistic techniques started to take off. Gradually, logistics started to evolve as an
art and science.
Today, experts in logistics perform their duties based on their skills, experi-
ences, and knowledge. In modern industries, the task of logistics managers is to
provide appropriate and efficient logistics systems. They guarantee that the right
goods will be delivered to the right customers, at the right time, at the right place,
and in the most economical way.
Although logistics is a dilemma for many companies, logistical science can
bring some relief to them. In today’s business environment, logistics is a competi-
tive strategy for the companies that can help them meet the expectations of their
customers. Logistics helps members of supply chains integrate in an efficient way.
4 Logistics Operations and Management

Logistics does not consist of one single component but involves a group of various
activities and disciplines such as purchasing, planning, coordinating, warehousing,
distributing, and customer service [5].
1.4 Other Logistical Books
As noted earlier, logistics was traditionally used in the military environments.
Therefore, it is rational that the first books explicitly or implicitly relevant to logis-
tics were combat oriented. The oldest one was Jomini’s Summary of the Art of War
(1838). Another and more recent example was the book coauthored by Lieutenant
General William Gus Pagonis, the director of logistics during the 1991 Gulf War,
and Jeffrey Cruikshank, Moving Mountains [6].
Nowadays logistics is being used in business environments as widely as in wars,
and we can find different books recently written by researchers in academia.
However, although many books talk about logistical processes individually—such
as transportation, warehousing, distribution, vehicle routing problems (VRPs), and
packaging—few comprehensive books encompass all of the logistical processes.
Two examples of complete books that are basically applicable to private organiza-
tions are those by Riopel et al. (2005) and Ghiani et al. (2004) [4].
Sometimes, we can see cooperation between logistical areas among several pri-
vate organizations, governmental organizations, and also militants. For example, in
case of a natural disaster such as an earthquake, tsunami, or hurricane or typhoon,
all of these organizations will be involved. Integration and coordination of materi-
als, information, and financial flows between two or more private organizations
can promote a traditional logistical system to become an advanced supply chain.
To see a book in this area, interested readers can refer to [3].
1.5 The Focus of This Book
The question that might arise is, what is specifically different about this book? We
explicitly highlight the following issues as the main point of this book.
� We have worked to include updated sources such as journal papers, conference proceed-
ings, books, and Internet sources, so you may see references from recent years.� Many of the references highlight some of the logistical processes such as the VRP and
transportation. We have tried to equally cover all of the main logistics processes and thus
have allocated separate chapters to each.� There are two main classifications in a book such as this: (1) qualitative concepts and (2)
quantitative models. We have tried to view both equally. Of course, we believe different
topics need different degrees of focus. For instance, when talking about information and
communication technology in logistical systems, most texts look at these areas from qual-
itative angles whereas the VRP is viewed mainly in quantitative terms. However, aside
from the nature of a chapter, by default we have considered the importance of quantita-
tive models and qualitative concepts at the same time.
5Overview

� We are covering some topics in logistics that are not predominant in most large and private
enterprises, for instance, disaster logistics and retail logistics. Moreover, some approaches
and modeling concepts such as robustness and risk are highlighted in separate chapters.� Then last but not the least, some chapters such as those covering logistical parties, logisti-
cal philosophies, and logistical future trends will interest readers and are not found in
other sources.
1.6 Organization
This book is organized in 4 parts and 21 chapters such that the reader can study each
chapter not only independently but also as part of a whole. If someone wants to
study the book more deeply, our suggestion is observing the strategy in Figure 1.1.
Part I, Introduction, has two chapters. Chapter 1 (Overview) and Chapter 2,
Physical Flows, which looks at the physical entities of a logistical system, includ-
ing fixed and static components and moving entities. To do this, the author focuses
on transportation modes, including land, air, water, and pipeline as well as ware-
housing systems. This chapter also summarizes intermodal, multimodal, and mate-
rial-handling equipment.
Part II, Strategic Issues, includes four chapters. Chapter 3, Logistics Strategic
Decisions, covers the strategic decisions that should be made in a logistical system
such as network design, outsourcing, and integration. It also includes the objectives
of making a strategic decision and informs interested readers on how to do that.
Chapter 4, Logistical Philosophies, introduces different approaches to logistics and
3
1 4
5
6
7
8
9
2
10
11
12
16
17
18
13
14
15
19
20
21
PART I:
Introduction
PART II:
StrategicIssues
PART III:
Tacticland
OperationalIssues
PART IV:
Sepcial Areasand
Philosophies
Figure 1.1 Sequencing the chapters dependently.
6 Logistics Operations and Management

their advantages and disadvantages. These philosophies are mainly lean logistics,
cross docking, just-in-time, agile logistical quick response, efficient consumer
response, vendor-managed inventory (VMI). Chapter 5, Logistical Parties, exam-
ines definitions, activities, advantages, disadvantages, and types of first-, second-,
third-, fourth-, and fifth-party logistical providers. Finally, Chapter 6, Logistics
Future Trends, introduces the main future trends of logistics and considers emerg-
ing technologies, trends, new strategies in industries, and recent technical reports
and surveys, and it predicts logistical future focusing, especially on globalization,
information technology (IT) and e-commerce, and new technologies.
Part III, Tactical and Operational Issues, includes five chapters. Chapter 7,
Transportation, discusses how transportation systems move materials between facil-
ities using different vehicles and equipment. In this chapter, we talk about the basic
aspects of these systems and the classification of transportation problems.
Chapter 8, Vehicle Routing Problems, includes different methods of product
distribution between customers. The chapter is dedicated to introducing brief infor-
mation of the most studied kinds of VRPs. Chapter 9, Packaging and Material
Handling, discusses the movement, storage, control, and protection of materials,
goods, and products throughout the process of manufacturing, distribution, con-
sumption, and disposal. The focus is on methods, mechanical equipment, systems,
and related controls used to achieve these functions. Chapter 10, Storage,
Warehousing, and Inventory Management, examines the process of coordinating
incoming goods, the subsequent storage and tracking of these goods, and, finally,
the distribution of the goods to their proper destinations.
Chapter 11, Customer Service, is about order management, customer service,
and the reasons for their importance. Then the elements of customer service are
introduced with an emphasis on order cycle time. Given the importance of deter-
mining proper service levels in logical cost, the steps for developing proper service
levels based on current frameworks are the next to be introduced.
Part IV, Special Areas and Philosophies, includes 10 chapters. In Chapter 12,
Logistics System: Information and Communication Technology, the role of informa-
tion in logistical systems is reviewed briefly and the effects of IT on a company’s
logistical operations are discussed. In Chapter 13, Reverse Logistics, we propose a
comprehensive investigation into reverse logistics and related subjects. After introduc-
ing the subject and providing a literature review, we try to answer the following ques-
tions: Why and how are things returned? What kind of returns take place? Chapter 14,
Retail Logistics, explains the essential concepts of retailing and then demonstrates
different types of retailing and some of the more common and applicable techniques.
In Chapter 15, Humanitarian Logistics Planning in Disaster Relief Operations, classifi-
cations of different types of disasters and their effects on human lives are given. After
introducing the concept of the disaster-management system cycle, humanitarian logis-
tics and their characteristics and main stages are discussed. Then mathematical model-
ing of the required relief logistical decisions and their optimization solution
techniques are discussed. Next, concepts of coordination and performance measure-
ment in the context of humanitarian logistics are talked about. In Chapter 16, Freight
Transportation Externalities, we begin by investigating different types of freight
7Overview

transportation externalities with a focus on road transportation. The results of related
studies in the United States and Europe are presented and compared, although consis-
tent comparison is challenging because of the differences in the times and locations of
various studies as well as variable currency exchange rates and basic assumptions
such as the statistical value of life. Later we present practical policies that have been
introduced to reduce these externalities in the United States and other parts of the
world. Chapter 17, Robust Optimization of Uncertain Logistics Networks, discusses
the first literature review of this topic and then an optimization method under uncer-
tainty and robust optimization of logistical networks are investigated. Chapter 18,
Integration in Logistics Planning and Optimization, identifies the key issues in this
area and then formulates a complex integrated logistical planning model. Following a
discussion on the available tools and techniques for optimizing complex large-scale
logistics planning problems, genetic algorithms are chosen to optimize the proposed
integrated model. A medium-size case study is finally presented to demonstrate the
capability of the developed optimization model in achieving the global optimal
solution.
Chapter 19, Optimization in Natural Gas Network Planning, presents a survey on
the role of optimization methods and operation research techniques in different fields
of natural gas network planning. These fields have received more attention from
researchers because of their enormous effects on reducing costs. To make a good com-
parison between what has been done and what should be improved on in the future,
model characteristics and solution methods are discussed, and the application of math-
ematical models to the most important problems of this field has been highlighted. To
present the efficiency of developed models in the real world, two case studies are pre-
sented. In Chapter 20, Risk Management in Gas Networks, after presenting an intro-
duction to gas networks, we explain the vulnerability and resulted risks in the gas
industry. Then we present a six-step process to manage and control the risks in gas
networks. Chapter 21, Modeling the Energy Freight Transportation Network, presents
the importance of energy around the world and the main energy freight transportation
planning and management issues, describing the associated literature such as levels of
planning and briefly reviewing the components such as networks. Modes of transport-
ing energy are then discussed. Afterward, the chapter continues with a detailed expla-
nation of the components of energy transportation network, the ones on which the
models are based. The components are followed by the energy freight transportation
models, which attempt to analyze real cases in order to solve real problems.
1.7 Audiences
The target audience of this book is composed of professionals and researchers
working in various fields such as management, industrial engineering, applied
operations search, and business at all levels, particularly undergraduates in their
final year of study and graduate students. Specific courses for which our book is
written can be logistics, logistics planning, and logistics systems; supply chain
8 Logistics Operations and Management

management; inventory management; business management; operations manage-
ment, and information technology.
The book can also be used by professionals and practitioners of different organi-
zations. Some topics—such as transportation, VRP, packaging and material han-
dling, storage, warehousing and inventory management, order management, and
customer services—are applicable to most of the enterprises, whereas others—such
as reverse logistics, retail logistics, and logistics planning in case of disasters—are
applicable to certain organizations or particular circumstances.
Acknowledgments
We would like to thank our friend Dr. Wout Dullaert (Associate Professor) from the Institute
of Transport and Maritime Management Antwerp (ITMMA), University of Antwerp,
Belgium, and also Dr. Dong-Wook Song (Reader) from the Logistics Research Centre,
Heriot-Watt University, Edinburgh, in the United Kingdom, for their valuable comments on
the organization of this book.
We would also like to express our appreciation to Dr. Anita Koch at Elsevier for her
invaluable assistance in connecting us to the right place. In this right place, our contact per-
sons were Ms. Lisa Tickner (our publisher at Serials and Elsevier Insights) and Ms. Joanne
Tracy (Vice President, Editorial Director, Science). Managing typesetting was done by Paul
Prasad Chandramohan, who is the Development Editor and Sujatha Thirugnana Sambandam,
who is the Senior Project Manager of our book and are based in the Chennai office, India.
When Lisa was busy, Ms. Zoe Kruze (Associate Acquisitions Editor) on Serials at Elsevier
was helpful in following up when necessary. Then last but not least, Este Johnson who edited
some of the chapters.
References
[1] Available from: http://www.britannica.com/EBchecked/topic/346423/logistics.
[2] Available from: http://en.wikipedia.org/wiki/Antoine-Henri_Jomini.
[3] R.Z. Farahani, N. Asgari, H. Davarzani (Eds.), Supply Chain and Logistics in National,
International and Governmental Environmental, Physica-Verlag, Heidelberg, 2009.
[4] G. Ghiani, G. Laporte, R. Musmanno, Introduction to Logistic Systems Planning and
Control, Wiley, Chichester, 2004.
[5] Available from: http://www.bestlogisticsguide.com/logistics-history.html.
[6] W.G. Pagonis, J.L. Cruikshank, Moving Mountains: Lessons in Leadership and Logistics
from the Gulf War, Harvard Business School Press, Boston, 1992.
[7] D. Riopel, A. Langevin, J.F. Campbell, The network of logistics decisions, chapter pub-
lished in: A. Langevin, D. Riopel (Eds.), Logistics Systems: Definition and
Optimization, Springer, New York, 2005.
[8] J.L. Heskett, A.N. Glaskowsky, R.M. Ivie, Business Logistics�Physical Distribution and
Materials Management, Ronald Press, New York, 1973.
[9] Available from: http://www.inboundlogistics.com/articles/trends/trends0706.shtml.
9Overview

This page intentionally left blank

2 Physical Flows
Hannan Sadjady
Department of Industrial Engineering, Amirkabir University of Technology,Tehran, Iran
The objective of logistics process is to get the right quantity and quality of materials
(or services) to the right place at the right time, for the right client, and at the right
price. As customers, many people tend to neglect the direct or indirect effects of
logistics on almost every sphere of their lives until one of these “rights” goes wrong.
The logistics concept was introduced as a response to the increasing necessity of an
integrated system, which plans and coordinates the materials flow from the source
of supply to the point of consumption instead of managing theses flows as series of
independent tasks. The Council of Supply Chain Management Professionals
(CSCMP) defines the logistics management as follows:
Logistics management is that part of supply chain management that plans, imple-
ments, and controls the efficient, effective forward and reverses flow and storage
of goods, services and related information between the point of origin and the point
of consumption in order to meet customers’ requirements. [1]
The entire process of logistics, which deals with the moving of materials into,
through, and out of a firm, can be divided into three parts: (1) inbound logistics,
which represents the movement and storage of materials received from suppliers;
(2) materials management, which covers the storage and flows of materials within
a firm; and (3) outbound logistics or physical distribution, which describes the
movement and storage of products from the final production point to the customer
[2]. These terms as well as some of the other associated logistics terminologies are
indicated in Figure 2.1.
As Figure 2.1 illustrates, logistics is concerned with two types of flow: physical
flow and information flow. It is common to consider physical flow as the forward
flow throughout the logistics network, the main direction of which is from the point
of origin to the point of consumption. Also, the information flow is considered to
be backward, so its main direction is from downstream to upstream elements.
However, in practical terms, the directions of physical and information flows are
not one way. Materials and information flow from both upstream and downstream.
In regard to physical flow, the backward flow of product is referred to as reverse
Logistics Operations and Management. DOI: 10.1016/B978-0-12-385202-1.00002-5
© 2011 Elsevier Inc. All rights reserved.

logistics. It is the flow of returned goods and used products as well as salvage,
scrap disposal, and returnable packaging back through the system.
In this chapter, the emphasis is on the physical flows (also known as material or
inventory flows). Information flows are discussed in Chapter 12.
Physical flows involve the entire process and activities of logistics systems;
however, to explore the concept of physical flows systematically, the major compo-
nents of logistics systems can be categorized into five functional areas, based on
Ailawadi and Singh [4]:
� Network design� Information� Transportation� Inventory� Warehousing, material handling, and packaging1
Considering these functional areas, physical flow is more involved with the
transportation and warehousing, material handling, and packaging. These two func-
tional areas are discussed in Sections 2.1 and 2.4, respectively. Also, the physical
1 For further information about the logistics functional areas, see reference [4], pp. 11�16.
Raw materialcomponents
Packaging items
Product sourcing
Productionprocess Packaging
Warehouse
Depots
Distributioncenters
Inventory
Finishedgoods
UnitizationSub
assemblyWork-in-process
Imported materials
Bought-in parts
Key:
Information
Transport
Reverse
End
use
rs
Supply Materials managements Distribution
CustomersLogisticsSuppliers
Supply chain
Supply side
Upstream
Demand side
Downstream
Inbound Outbound
Figure 2.1 Logistics flows and some of the different logistics terminologies [3].
12 Logistics Operations and Management

nature of the product is investigated in Section 2.2, followed by some explanations
about distribution channels in Section 2.3.
2.1 The Transportation System
Transportation accounts for between one-third and two-thirds of total logistics costs;
for most firms, it is the most important single element of logistics costs [5]. Firms
and their products’ markets are often separated geographically. Transportation
increases the time and place utility of products by delivering them at the right time
and to the right place where they are needed. By doing so, the customers’ level of
satisfaction increases, which is a key factor for successful marketing.
A comprehensive discussion of transportation is beyond the scope of this text, so
we focus here on essential issues of transportation systems, which are more related
to the physical flows of materials.
2.1.1 Transport Modes and Their Characteristics
Various options for moving products from one place to another are called transpor-
tation modes. Road, rail, air, water, and pipelines are considered the five basic
modes of transportation by most sources (see, e.g., [2,4�8]). In addition, digital or
electronic transport is referred to as the sixth mode of transportation in some texts
(see, e.g., [9]). Any one or more of these six distinct modes could be selected to
deliver products to customers (Figure 2.2). However, all transport modes may not
be applicable or feasible options for all markets and products.
Road
Road transport—also known as highway, truck, and motor carriage—steadily
increased its share of transportation. Throughout the 1960s, road transport became
the dominant form of freight transport in the United States, replacing rail carriage
[10], and it now accounts for 39.8% of total cargo ton-miles, which is more than
68% of actual tonnage [11].
The key advantages of road transport over other transportation modes are its flexi-
bility and versatility. Trucks are flexible because they offer door-to-door services
without any loading or unloading between origin and destination. Trucks’ versatility
Road Rail Air Water
Transportation modes
Pipeline Digital
Figure 2.2 Basic modes of transportation.
13Physical Flows

is made possible by having the widest range of vehicle types, enabling them to trans-
port products of almost any size and weight over any distance [10].
Road transport also offers reliable and fast service to the customers. The loss
and damage ratios for road transport are slightly higher than for the air shipment,
but are too far lower than for the rail carriage. Road transport generally offers fas-
ter service than railroads, especially for small shipments (less than truckload, or
LTL).2 For large shipments (truckload, or TL), they compete directly with each
other on journeys longer than 500 miles. However, for shipments larger than
100,000 pounds, rail is the dominant mode. Also, as motor carriers are more effi-
cient in terminal, pickup, and delivery operations, they compete with air carriers,
for both TL and LTL shipments that are transported 500 miles or less [7].
In regard to economic aspects, road transport has relatively small fixed cost,
because it operates on publicly maintained networks of high-speed and often toll-
free roads. However, the variable cost per kilometer is high because of fuel, tires,
maintenance, and, especially, labor costs (a separate driver and cleaner are required
for each vehicle) [4]. Road transport is best suited for small shipments and high-
value products, moving short distances. Legislative control and driver fatigue are
some problems of motor carriers’ long journeys [6].
Rail
Rail carriage accounts for 37.1% of total freight ton-miles (more than 14% of
actual tonnage) in the United States [11], which places railroads after motor car-
riers as the second dominant mode of transportation. However, in some countries
such as the People’s Republic of China, the countries of the former Yugoslavia,
and Austria, rail remains the dominant transportation mode [10].
Although rail service is available in almost every major city around the world,
the railroad network is not as extensive as the road networks in most countries.
Thus, rail system lacks the flexibility and versatility of the road transport. Indeed,
rail carriers offer terminal-to-terminal service rather than the door-to-door service
provided by motor carriers. Therefore, railroads, like water, pipelines, and air trans-
port, need to be integrated with trucks to provide door-to-door services. Also, rail-
roads offer less-frequent services compared to motor carriers.
Rail transportation is relatively slow and quite unreliable, as the loss and damage
ratios of rail transport for many shipments are higher than other modes. As a result,
the railroad is a slow mover of both raw materials (e.g., coal, lumber, and chemicals)
and low-value finished goods (e.g., tinned food, paper, and wood products) [8].
Railroads have high fixed costs and relatively low variable costs. Expensive
equipment, multishipment trains, multiproduct switching yards and terminals, and
right-of-way maintenance result in high fixed costs [4,5]. However, the variable
costs are low, especially for long hauls, so rail carriage generally costs less than
motor and air transport on a weight basis. It would be explained later in this chapter,
2 Less than truckload: Any quantity of freight weighing less than the amount required for the application
of a truckload rate.
14 Logistics Operations and Management

that is how we might combine the economy of rail or water movement with truck
flexibility, thus using trailer-on-flatcar (TOFC) or container-on-flatcar (COFC) ser-
vices (see Section 2.1.2).
Air
Air carriers transport only around 0.1% of ton-mile traffic in the United States
[11]. Although airfreight offers the shortest time in transit (especially over long dis-
tances) of any transport mode, most shippers consider air transport as a premium
emergency service because of its higher costs. However, the high cost of air trans-
port may be traded off with inventory and warehousing reductions or justified in
some situations: (1) for high-value products, (2) for perishables, (3) in limited mar-
keting periods, and (4) in an emergency [4].
The portion of total product costs dedicated to transportation is an important
issue for most shippers. The high price of airfright consumes a greater portion of
low-valued products’ total costs, so it is not economically justifiable for these
items. This could be why air carriers usually handle high-value items.
Total transit time (from pickup at the vendor to delivery to the customer) is
important to shippers and the customers. From this point of view, well-managed
surface carriers can compete favorably with air carriers, especially on short and
medium hauls. Even though air carriers provide rapid time in transit from terminal
to terminal, they may spend too much time on the ground (e.g., for pickup, deliv-
ery, delays and congestions, and waiting for scheduled aircraft departures) [10].
Loss and damage ratios resulting from transportation by air are considered lower
than the other modes. The classic study by Lewis et al. [12] shows that the ratio of
claim costs to freight revenue was only about 60% of those for road and rail.
Airline companies generally own neither airways nor airports. Air spaces and air
terminals are usually developed and maintained with public funds, so fixed air-
freight costs (including aircraft purchases, specialized handling systems, and cargo
containers) are lower than rail, water, and pipeline. Air-transport variable expenses
are extremely high because of fuel, maintenance, and the labor intensity of both in-
flight and ground crew [4]. Variable costs are reduced by the length of journey
because takeoffs and landings are the most inefficient phases of aircraft operation.
Moreover, increasing shipment sizes reduces the variable operating cost per ton-
mile. Hence, variable costs are influenced by both distance and shipment size [5].
Water
Water carriage—as the oldest mode of transportation—accounts for 5% of total
freight ton-miles (around 3.3% of actual tonnage) in the United States [11].
Sampson et al. [13] describe the nature and characteristics of water carriage as
follows:
Water carriage by nature is particularly suited for movements of heavy, bulky,
low-value-per-unit commodities that can be loaded and unloaded efficiently by
mechanical means in situations where speed is not of primary importance, where
15Physical Flows

the commodities shipped are not particularly susceptible to shipping damage or
theft, and where accompanying land movements are unnecessary.
As already mentioned, the majority of commodities transported by water are
semiprocessed and raw materials; thus, water transportation competes primarily
with rail and pipeline. Water carriage can be broken into the following distinct cat-
egories [10]:
1. Inland waterways (such as rivers and canals)
2. Lakes
3. Coastal and intercoastal oceans
4. International deep sea
Water transportation service is limited in scope, mainly for two reasons: its lim-
ited range of operation and speed. Water service is confined to waterway systems;
thus, unless the origin and the destination of movement are located on waterways,
it needs to be supplemented by another transportation mode (rail or motor carrier).
In addition, the average speed of water carriage is less than rail transport, and the
availability and dependability of its service are greatly influenced by weather [4,5].
Containers3 are used for many domestic and most international water shipments.
Moving freight in containers on containerized ships affects the intermodal transfer
by reducing handling time and shortening total transit time. It also reduces staffing
needs and allows shippers to take advantage of volume shipping rates. Finally, con-
tainers reduce loss and damage [5,7]. For all these reasons, high-value commodities
(especially those in foreign shipments) are shipped in containers and containerized
ships.
Loss and damage costs for water carriage are lower in comparison with other
transportation modes because damage is not much of a concern with low-valued
bulk commodities. Also, because large inventories are often maintained by buyers,
losses from delays are not serious. For high-valued products, claims are much
higher: approximately 4% of ocean-ship revenues. Most damages are caused by
rough handling during loading and unloading operations, so substantial packaging
is needed to protect goods [5].
Regardless of the limitations inherent in water transportation, water is the least
expensive mode for transporting high-bulk, low-value freights. The fixed cost of water
carriage is mainly found in terminal facilities and transport equipment. Although water
carriers have to develop and operate their own terminals, rights-of-way and harbors
are developed and maintained publicly. This moderates water-transport fixed costs,
putting the mode between rail and motor carriages. Water-transport variable costs,
including waterway charges and transport equipment operation costs, are very
low. Because of the high fixed cost and low line-haul costs of water carriage, its
3 Containers are standardized boxes that are typically 8 feet high, 8 feet wide, and of various lengths
(usually 10, 20, and 40 feet). The freight is handled as a unit in containers, which are easily transferred
as units to other transportation modes [5].
16 Logistics Operations and Management

costs per ton-mile decrease significantly as the distance and shipment size
increase [4,5].
Pipeline
Pipeline systems were mainly developed for transporting large volumes of pro-
ducts, often over long distances. Pipelines tend to be product specific, which means
they are used for only one particular type of product throughout their design life
[6]. A limited number of products can be transported by pipelines, including natural
gas, crude oil, refined petroleum products, chemicals, water, and slurry products.4
Although product movement through pipelines is very slow (only 3 to 4 miles
per hour), their effective speed is much greater than the other modes because they
operate 24 hours a day, 7 days a week. For transit time, pipeline service is the most
dependable of all modes because of the following factors: [10]
� Pumping equipment is highly reliable, so losses and damage because of pipeline leaks or
breaks are extremely rare.� Climatic conditions have minimal effects on products moving in pipelines, so weather is
not a significant factor.� Pipelines are not labor intensive, so strikes or employee absences have little effect on
their operations.� Computers are used to monitor and control the flows of products within the pipelines.
Losses and damage costs from transporting by pipeline systems are low because
(1) liquid and gases are not subject to damage to the same degree as manufactured
products, and (2) there are fewer types of danger throughout a pipeline operation [5].
Pipelines have the highest fixed cost and the lowest variable cost among trans-
portation modes. High fixed costs result from right-of-way, construction, and
requirements for control station and pumping capacity. To spread these high capital
costs, and to be competitive with other modes, pipelines must operate at high
volumes. The variable costs are extremely low and mainly include the power for
moving products, because, as noted, pipelines are not labor intensive [4].
Digital
Digital or electronic transport is the fastest mode of transportation. Besides its high
speed, digital transport is cost efficient and benefits from its high accessibility and
flexibility. However, only a limited range of products can be shipped by this mode,
including electric energy, data, and products such as texts, pictures, music, movies,
and software, all of which are composed of data [9].
Most logistics references do not cite digital transport as a transportation mode
because of its limited product options. However, someday, technology may allow
4 “Slurry systems involve grinding the solid material to certain particle size, mixing it with water to
form a fluid, muddy substance, pumping that substance trough a pipeline, and then decanting the water
and removing it, leaving the solid material.” [2]
17Physical Flows

us to convert matter to energy, transport it to desired destination, and convert it
back to matter again.
Any one or more of the six above-mentioned transportation modes can be a viable
option for a company or individual who wants to move products from one point to
another. Shippers take several factors into account in selecting the proper transporta-
tion modes. The company and its customers’ needs, the characteristics of the transpor-
tation modes, and the nature of traffic are the main factors that should be considered
in the modal choice. Table 2.1 summarizes the general and service characteristics of
the six transportation modes, based on references [7,14].
In addition to the six basic modes of transportation, several intermodal combina-
tions are available to shippers. Such combinations can lead to transportation services
with cost and service characteristics that rank between those of the single modes. In
fact, intermodalism combines the cost and service advantages of two or more trans-
portation modes. Deveci et al. [15] quoted the definition of intermodal transport
from reference [16] as follows: “The movement of goods in one and the same load-
ing unit or vehicle that uses successively several modes of transport without han-
dling of the goods themselves in changing modes.”
If we exclude digital or electronic transport, which has a very low intermodal
capability, we have 10 possible intermodal service combinations: (1) rail�road, (2)
rail�water, (3) rail�air, (4) rail�pipeline, (5) road�air, (6) road�water, (7)
road�pipeline, (8) water�air, (9) water�pipeline, and (10) air�pipeline. These are
combinations in theory, but in practice only a few of them turn out to be conve-
nient. The most frequent combined intermodal services are rail�road (“piggy-
back”), road�water (“fishyback”), and road�air (“birdyback”). Road�water
combinations are gradually gaining acceptance, especially for international ship-
ments of high-valued products. However, only rail�road combinations have seen
widespread use throughout the world [5,8]. The more popular combinations that we
have explored in this section are:
1. Trailer on flatcar (TOFC)
2. Container on flatcar (COFC)
3. Roadrailers
Piggyback (TOFC/COFC)
Transporting a motor carrier trailer on a rail flatcar is referred to as TOFC service.
It is also possible to transport only the container on a flatcar to omit the deadweight
of understructures and wheels. Such combination is referred to as COFC service.
Although these two services are technically different, they are both referred to as
piggyback service by most logistics executives [10]. In piggyback service, first
terminal-to-terminal transportation is achieved by placing truck trailers or contain-
ers on railroad flatcars and transporting them over longer distances than trucks nor-
mally haul. Temporary axles can be employed under the containers so they can be
distributed via trucks or tractors. Finally, to achieve point-to-point distribution, the
pickup and delivery functions are performed by motor carriers at the terminal
facilities.
18 Logistics Operations and Management

Table 2.1 Characteristics of Transportation Modes
Road Rail Air Water Pipeline Digital
General characteristics
Product options Very broad Broad Narrow Broad Very narrow Very narrow
Predominant
traffic
All types Low-moderate
value, moderate-high
density
High value, low-
moderate density
Low value,
high
density
Low value, high
density
All types of data
Market coverage Point to point Terminal to terminal Terminal to
terminal
Terminal to
terminal
Terminal to
terminal
Point to point
(computer to
computer)
Average length of
haul
Short to long Medium to long Medium to long Medium to
long
Medium to long Short to long
Capacity Low Moderate Low Very high Very high Moderate
Service characteristics
Cost Moderate Low High Low Low Very low
Speed (time in
transit)
Moderate Slow Fast Very slow Very slow Very fast
Availability High Moderate Moderate Low Low Very high
Delivery time
consistency
High Moderate High Low-
moderate
High High
Loss and damage Low Moderate-high Low Low-
moderate
Low Very low
Flexibility High Moderate Low-moderate Low Low High
Intermodal
capability
Very high Very high Moderate Very high Very low Very low
19
Physical
Flows

Piggyback service combines the convenience and flexibility of short-haul truck-
ing and the long-haul economy of rail transportation. The cost of this combination
is less than for trucking alone and has permitted truck movement to expand its eco-
nomical range. Likewise, rail carriage has been allowed through this combination
to share in some traffic that normally would move by truck alone. Moreover, this
combination brings door-to-door service convenience to shippers over long dis-
tances at reasonable rates. The above-mentioned features can interpret why piggy-
back service is the most popular intermodal combination [5].
Stock and Lambert [7] mentioned the partnership between the Burlington
Northern Santa Fe (BNSF) Railroad and J. B. Hunt Transportation Services as an
interesting example of intermodalism. This partnership, which began in late 1989,
combined a large railroad company with a national TL motor carrier. As a result,
door-to-door intermodal services between California and the Midwest are now
available to shippers.
Roadrailers
Roadrailer, also called trailertrain, is an innovative intermodal concept that was
first introduced in the late 1970s. Although roadrailers appear similar to conven-
tional truck trailers, they have both rubber truck tires and steel rail wheels, thus
providing a combination of rail and motor transport in a single piece of equipment
(Figure 2.3). The trailers are shipped in the normal way via tractor over highways.
By changing wheels for rail movement, the trailer rides directly on the railroad
instead of being placed on a flatcar.
1. Trailer on flatcar (TOFC)
2. Trailer and tractor on flatcar
3. Container on flatcar (COFC)
4. Roadrailer
Figure 2.3 Selected forms of
intermodal combination [10].
20 Logistics Operations and Management

In comparison with piggyback service, the main advantage of roadrailers is that
rail flatcars are not required. Moreover, the required time for switching between
highway and rail wheels is less than loading or unloading the trailer from the flat-
car. The major disadvantage of this intermodal form is the additional weight of rail
wheels, which reduces fuel efficiency and leads to higher costs for the highway
portion of the shipment. As a direct result of high operation and equipment costs,
the use of roadrailers is limited [10].
2.1.2 Other Transport Options
In addition to the options previously explained, there exist other important entities
in transportation systems. These entities, whether unimodal or multimodal in scope,
include nonoperating third parties that provide various services to shippers. The
major alternatives are:
1. Freight forwarders
2. Shippers’ associations
3. Intermodal marketing companies
4. Brokers
5. Small package carriers
6. Third-party logistics service providers
Freight Forwarders
Freight forwarders or forwarding agents are agencies that organize the freight
shipments of other companies or individuals. They often do not own transport
equipment except for pickup and delivery operations. Freight forwarders purchase
long-distance transport services from truck, rail, air, and water carriers. Then they
consolidate numerous small shipments of different shippers into large shipments.
After transporting the bulk load through one or more of the basic modes to a desti-
nation, they split the load into the original smaller quantities. The transportation
cost per pound of small shipments is higher than that of the large shipments. The
difference between the large and small shipments’ rates offsets the operating costs
of these companies. This is why forwarding agents offer lower rates to the shippers
than they can obtain directly from the carriers. Moreover, these companies can also
provide more complete and faster services to the shippers.
Freight forwarders can be classified as surface or air forwarders, based on the
transportation modes they use. Also, a forwarding agent can be considered as an
international forwarder if it is specialized in shipments to other countries or as a
domestic forwarder if it specializes in shipments within the country [5,7].
Shippers’ Association or Cooperative
A shippers’ association is a nonprofit transportation membership cooperative that
organizes the domestic or international shipments for member companies. These
associations consolidate the small shipments of their members into vehicle-load
21Physical Flows

freight so that small and medium shippers can also benefit from the economies of
scale. They contract with motor, rail, air, and water carriers to physically move
their members’ cargo, benefiting both shippers and carriers. Shippers take advan-
tage of the lower rates, and the carriers benefit from better equipment utilization,
as well as the economies of large and often long-distance shipments. Shippers’
associations are not classified as common carriers, and in the United States the
Interstate Commerce Commission (ICC) has never had jurisdiction over them [10].
Intermodal Marketing Companies
Shippers’ agents or intermodal marketing companies (IMCs) are important intermo-
dal links between shippers and carriers. These agencies are much like shippers’ asso-
ciations in their operations, but they offer specialized TOFC or COFC services to
shippers. They purchase large quantities of piggyback services at discount rates and
then resell the available services in smaller quantities to the shippers. Similar to ship-
pers’ associations, these companies are not licensed by the ICC, and their importance
is increasing as the use of intermodal transportation is growing in today’s world [7].
Brokers
Brokers are the intermediaries that organize the transportation of products for ship-
pers, consignees, and carriers and charge a fee to do so. Besides providing timely
information about rates, routes, and capabilities to bring shippers and carriers
together, brokers also provide other services such as rate negotiation, billing, and
tracking. These agents are subject to the same regulations that apply to carriers,
and they are all licensed by the ICC.
Brokers help shippers, especially those with no traffic department or minimal
traffic support, to negotiate rates, supervise their shipments, and perform what they
may not be able to carry out because of resource constraints. Brokers can also help
carriers find business or obtain back hauls and return loads that increase their effi-
ciency as they transport “full” equipments rather than “empty” ones [5,10].
Small Package Carriers
Small-shipment delivery services can be important transportation options for many
shippers. Electronics firms and cosmetic companies, as well as book distributors
and catalog merchandisers, are examples of these shippers. Well-known small
package carriers include the US Postal Service’s parcel post, United Parcel Service
(UPS), and air-express companies.
Parcel post is a delivery service provided to companies that ship small packages.
Low cost and wide geographical coverage are the competitive advantages of parcel
post because it offers both surface and air services, domestically and internation-
ally. Size and weight limitations, transit time variations, and relatively high loss
and damage ratios are the main disadvantages of this service. Another disadvantage
of this service is its inconvenience to shippers, because packages must be paid for
in advance and deposited at a postal facility [7].
22 Logistics Operations and Management

UPS is a private package-delivery company. It transports small packages, so it
competes directly with parcel post for shipping small parcels, especially in the
United States. The primary business of UPS is the time-definite delivery of docu-
ments and packages internationally. UPS has extended its services in three main seg-
ments: domestic package services in the United States, international package
services, and supply-chain and freight services. UPS’s advantages include its low
cost and low time-in-transit variability, as well as its wide geographical coverage.
The disadvantages of UPS include specific size and weight limitations and inconve-
nience because small shippers must deposit their parcels at a UPS facility. However,
UPS provides pickup for larger shippers [10].
Since its inception in 1973, the air-express industry has expanded significantly,
mainly because of its high levels of customer service. Because these companies can
offer overnight or second-day delivery services nationally or internationally, they
are valuable shipping options for those shippers who need to transport their products
quickly. Federal Express (FedEx), UPS, Airborne, and Emery are some of the most
well-known examples of the air-express industry. Substantial revenues and consider-
able profits of these companies illustrate the importance of rapid-transit services
with high consistency to the shippers [10].
Third-Party Logistics Service Providers
Nowadays, more companies are outsourcing their logistics functions to third-party
logistics service providers, as the emphasis on supply-chain management has
increased. Third-party logistics providers, commonly referred to as 3PLs, provide
their clients with several logistics services, such as freight forwarding, packaging,
transportation, and inventory management, as well as warehousing and cross dock-
ing. Because these services are bundled together by 3PLs, most companies consider
these service providers as one-stop outsourcing solutions that can do the jobs more
efficiently, allowing the companies to focus on their core business.
Third-party options can lead to cost reductions and customer-service improve-
ments, especially for those small and mid-sized companies that cannot afford to
develop their own distribution networks. Instead, they outsource their product distribu-
tion to 3PL providers so they can compete in today’s global market. The cost savings
gained through this channel is mainly because of reduced transportation charges. In
addition to cost saving in transportation, fixed capital investments and labor and oper-
ating costs are reduced through this option. Moreover, these companies may benefit
from the available cash previously tied up in inventory [17]. It should be mentioned
that the ultimate objective of outsourcing logistics functions must be enhancing cus-
tomer satisfaction through the improvement of delivery systems. However, often too
much attention is paid to cost reduction and in making logistics alliances, rather than
in improving delivery performance and customer satisfaction [18].
Freight forwarders, shippers’ associations, shippers’ agents, brokers, small-
package carriers, and 3PL companies are all viable transport alternatives for a ship-
per in the same way as the six basic transportation modes and the intermodal
combinations. The optimal combination of shipping options should be determined
23Physical Flows

by a company’s logistics executive. This decision depends on several issues,
including the master production schedule, customer-service objectives, the existing
physical facility network, and standards and regulations [19]. Another substantial
issue in determining the right modal choice or combination of transport alternatives
for a company is the product characteristics or the physical nature of the product,
which is explored in the following section.
2.2 Physical Nature of the Product
A product’s physical nature substantially affects almost every aspect of logistics and dis-
tribution systems, including packaging, material handling, storage, and transportation.
In fact, both the structure and the cost of a distribution system for a given product are
directly affected by the product’s particular characteristics. These characteristics can be
classified into four main categories, based on [3]:
� Volume-to-weight ratio� Value-to-weight ratio� Substitutability� Special characteristics
2.2.1 Volume-to-Weight Ratio
Both the volume and weight characteristics of a product significantly affect distri-
bution costs. Products with low volume-to-weight ratios tend to fully utilize the
weight-constrained capacities of road freight vehicles, handling equipment, and
storage space. Therefore, distribution systems deal with these kinds of products,
including dense products such as sheet steel and books, more efficiently. In con-
trast, high-ratio products, such as many food items, paper tissues, and feathers, use
up a lot of space, which results in underutilized distribution components, raising
both transportation and storage costs [20].
In general, storage rates are volume based and value based, but transportation
rates are more dependent on the type of transportation mode. For example, water
carriers normally charge the same price for 1 ton as for 1 cubic meter, but 1 ton
costs the same as 6 cubic meters for airfreight. Hence, the transportation of heavy
products by air is relatively more expensive. However, in most cases, overall distri-
bution costs (including transportation and storage costs) tend to decrease as the vol-
ume-to-weight ratio decreases. To avoid abnormally low rates, carriers and
warehouses often stipulate a minimum charge for the transportation and storage of
very light or very heavy products, respectively [3,21].
2.2.2 Value-to-Weight Ratio
This ratio shows the value per unit weight of a given product. High-value, low-weight
products, such as electronic equipments and jewelry, have greater potential for
24 Logistics Operations and Management

absorbing the distribution costs because the relative transport cost of these products to
their overall value is not significant. Therefore, criteria other than price play a signifi-
cant role in determining the proper distribution system for high-value products. In con-
trast, only inexpensive transport alternatives can be viable shipping options for
products with low value-to-weight ratios, including ore, coal, and food. However, the
storage and inventory holding costs for products with high value-to-weight ratios tend
to be high in comparison with low ratio products because the capital tied up in the
stock is higher, and more expensive and secure warehousing is required [3,20].
Substitutability
The degree to which a given product can be substituted by an alternative from
another source is referred to as its substitutability. Highly substitutable products,
such as soft drinks and junk food, are those that customers would readily substitute
with another brand or type of products if the initially desired products are not avail-
able. The distribution system should ensure the availability of these products at all
times, otherwise the sale would be lost. This could be achieved through maintain-
ing high inventory levels to decrease the stock-out probability or by using efficient
and reliable transportation modes for on-time replenishments. Both of the preced-
ing options are high cost because they would raise the average inventory level and
enforce a transport system with higher costs, respectively. However, for products
with low substitutability degrees, less-expensive distribution systems with lower
average inventory levels and slower transportation modes can be used [3,21].
Special Characteristics
Certain other characteristics of products imply a degree of risk in their distribution.
These characteristics, including fragility, perishability, hazard and contamination
potential, time constraints, and extreme value, pose some requirements and restric-
tions on a distribution system. Therefore, a special transport, storage, and handling
system is required to minimize this risk or even satisfy the legal obligations, which
means the company will incur extra charges, as it is the case with any form of spe-
cialization. Examples of these specifications could be packaging requirements of
fragile products, necessary inventory controls, and refrigerated storage and trans-
portation facilities for perishable products, as well as special packaging and strin-
gent regulations (such as controlled temperature, restricted stacking height, and
isolation from other products) for contaminant and hazardous products. Moreover,
time-constrained products, such as foods, newspapers, and seasonal and fashion
goods, have significant implications for distribution systems and often require fast
and expensive transportation modes to meet their time deadlines. Finally, extremely
valuable products, or small items that are vulnerable to theft, require special stock
control and distribution systems with high security [3,20,21].
Many different product characteristics significantly affect almost every logistics
function; some of them have been explained in this section. Because these logistics
functions are interrelated, the requirements and restrictions imposed by these
25Physical Flows

characteristics often lead to complicated alternatives. These alternatives vary in
cost and service attributes and should be thoroughly evaluated by logistics execu-
tives for determining an appropriate distribution system.
2.3 Channels of Distribution
2.3.1 Distribution Channels and Their Types
Another crucial, and often challenging, decision that should be taken by logistics
executives is determining a product’s distribution channels—the alternative ways
or path through which a product reaches its market. In contrast to some decisions,
such as advertising and promotion programs, which can be readily changed by
companies, distribution channel decisions tend to be hard to change because they
usually involve long-term and often strong commitments to intermediaries, includ-
ing brokers, wholesalers, and retailers. Therefore, in determining distribution chan-
nels, many different factors of today’s and tomorrow’s business environment
should be taken into account by companies [18]. In general, there exist two types
of distribution channels: physical and trading or transaction.
As the name suggests, a physical distribution channel deals with the physical
aspects of a product distribution, including all the methods, means, and entities
through which the product is distributed from the supplier’s or manufacturer’s
outlet to the end user. In fact, products are physically transferred through these
channels, reaching their desired destination, which could be a factory outlet, a
retail store, or even a customer’s house. However, trading or transaction channels
are concerned with the nonphysical aspects of distributing products from their
point of origin to their point of consumption. When a product transfers through
distribution channels, the ownership of the product is transferred along with its
physical movement. The sequence of negotiation and the exchange of product’s
ownership are the distribution aspects that the trading or transaction channel is
concerned with [3].
Manufacturing firms face the same questions for both the physical and transac-
tion channels: Do they transfer and sell their products directly to end users? Should
intermediaries participate in the product distribution? Although intermediaries add
a markup to the product cost, they provide several benefits to both producers and
customers, three of which are specialized distribution functions, improved product
assortment, and increased transactional efficiency [22].
Intermediaries benefit from their great expertise in distribution functions,
so they can perform distribution activities more efficiently than producers, allowing
them to concentrate on their core businesses. Also, intermediaries can provide
distribution services more economically than individual manufacturers because
they handle large-sized shipments and benefit from larger economies of scale.
Intermediaries provide a second benefit by converting the assortments of pro-
ducts made by manufacturers into the assortments demanded from consumers.
Producers tend to generate narrow assortments of goods (similar types of products)
26 Logistics Operations and Management

in large quantities, whereas consumers typically want broad assortments of pro-
ducts (different types of products) in small quantities. Therefore, intermediaries
take the supply of many different producers in large quantities and then break them
down into smaller quantities of wider assortments demanded by consumers [18].
Transactional efficiency is the third benefit provided by intermediaries.
Figure 2.4 shows how using intermediaries can improve the efficiency of a distribu-
tion channel by reducing the number of trading links. As illustrated in the figure,
when producers use direct marketing to reach their customers (in the absence of
intermediaries), the number of contact lines equals the number of producers multi-
plied by the number of customers. The number of these trading links can be
reduced by adding an intermediary (an agent or broker, a wholesaler, or a retailer)
between producers and customers. In this case, the number of contact lines is calcu-
lated by adding the number of producers and customers. Hence, the presence of
intermediaries can eliminate the duplicate efforts of both producers and customers
and increase the efficiency of distribution systems [18,22].
2.3.2 Physical Distribution Channel
There exist several alternative distribution channels that can be used separately or in
combination with each other to bring a product or group of products to the end user.
Distribution channels contain different numbers of intermediary levels that are
referred to as the length of those channels. Each member of a distribution channel
that has an impact on transferring the product and its ownership to the ultimate user
is considered to be a channel level [18]. Therefore, both the producer and the con-
sumer are members of every distribution channel. Figure 2.5 shows the main alterna-
tive channels of distribution, based on references [3,8,23]. The physical transference
of products between channel members is illustrated by the hand-shaped icons in the
Number of trading links withoutintermediaries P ∗ C = 2 ∗ 4 = 8
Number of trading links with anintermediary P + C = 2 + 4 = 6
P
P = Producer I = Intermediary C = Customer
C
C
C
C
P
C
C
C
I
C
P
P
Figure 2.4 Distribution systems with and without intermediaries.
27Physical Flows

figure. Although these channels are mainly for consumer products, industrial mar-
keting channels are quite the same and will be explained later in this section.
Producer Direct to Consumer
The direct-marketing channel is the simplest and shortest distribution channel, and
it has no intermediary levels (channel 1). This channel can be a part of direct-
selling marketing strategy, which consists of a producer selling directly to the final
consumer. Products that are customized for specific customers and those ordered
through catalog or newspaper advertising are examples of goods commonly distrib-
uted through this channel. Also, customers who now shop from home, thanks to the
Internet, are other users of this channel. Moreover, products composed of data,
such as text, software, music, and films, can be directly distributed from computer
to computer [3].
Producer to Retailer to Consumer
In contrast to channel 1, the remaining channels in Figure 2.5 contain one or more
intermediary levels, which are referred to as indirect-marketing channels. In channel
P1
2
3
4
P = Producer, B = Broker, W = Wholesaler, R = Retailer, C = Customer
Pa
b
c
a
b
P
P
P
P
Pc
Pd B
P B W R C
R C
R C
R CW
W R C
R C
R C
R C
C
DC
DC
3PL
Figure 2.5 Alternative distribution channels.
28 Logistics Operations and Management

2a, producers deliver their own goods directly to large retail stores, which then sell
these products to end users. In general, this channel is suitable for manufacturer dis-
tributing their products in TL size. Channel 2b is quite similar to channel 2a, but pro-
ducers deliver their own products in large shipments to distribution centers, which
could be one central distribution center (CDC) or a number of regional distribution
centers (RDCs). The products are then broken down into smaller orders that are
transported to retailers on the manufacturers’ own means. The only difference
between channels 2b and 2c is that in the latter products from several suppliers are
delivered to distribution centers run by retail organizations. The different types of
products are consolidated in these centers and then delivered to retail stores in full
truck loads, using the retailers’ own vehicles or those of third-party providers.
Channel 3 has two intermediary levels. These intermediaries are retailers along
with wholesalers in channels 3a and 3b, and third-party distribution service provi-
ders and brokers in channels 3c and 3d, respectively.
Producer to Wholesaler to Retailer to Consumer
The use of wholesalers as intermediaries is popular whenever the limited lines and
financial resources of some small manufacturers would not allow them to distribute
their products on their own; therefore, they rely on wholesalers’ specialized distri-
bution services, which supply a great number of retailers. Channel 3a is also
suitable for those small retailers that cannot afford to buy large quantities of pro-
ducts. Wholesalers use their own delivery vehicles and distribution centers, and
they benefit from the price advantage of buying bulk shipments from suppliers.
Channel 3b illustrates the concept of cash-and-carry organizations. In contrast to
traditional wholesaling, this channel consists of several small retailers that are col-
lecting their own demands from wholesalers. As the order quantities of small retai-
lers and shops are very small, producers, suppliers, and even wholesalers do not
deliver their demands directly to their stores; as a result, the use of cash-and-carry
organizations tends to increase nowadays.
Producer via 3PL or Broker to Retailer to Consumer
Third-party distribution service providers and brokers are the other intermediaries sup-
plying manufacturers’ products to retail stores. The use of 3PL providers has increased
as the distribution of products became more expensive and more complicated. The con-
stantly changing legislation and restrictive rules and regulations on product distribution
can justify the growing need for third-party distribution service providers, companies
that are experts in distribution and warehousing, as well as other logistics functions.
Although most of the 3PLs provide general distribution services, there are companies
offering services for special types of products such as small parcels carriers that
provide “specialist” services for products in the form of small parcels (see channel 3c).
Brokers or agents are independent intermediaries that bring buyers and sellers
together. Brokers are not often fully concerned with physical distribution of pro-
ducts, and they never take title to goods. They are more concerned with products’
29Physical Flows

marketing, and thus they may be considered as trading or transaction channels
sometimes (see channel 3).
Producer via Broker to Wholesaler to Retailer to Consumer
Channel 4 represents a physical distribution channel with three intermediaries. This
channel is similar to previous channels except that producers are represented by
brokers who deliver their products through wholesalers. In general, a broker may
represent either a manufacturer or a wholesaler by searching markets for its goods
or by seeking supply source for its orders.
Distribution channels with more than three intermediary levels can be imagined,
though they are not common channels. As the number of intermediary levels
increases, the channel becomes more complex and the producer’s control over the
product flows decreases. The distribution channels illustrated in Figure 2.5 are the
main alternatives of consumer marketing channels; however, distribution channels for
industrial goods have quite the same structures as explained in the following section.
Business-to-Business Channels
The first industrial distribution channel a business marketer can use is the direct-
marketing channel, which is quite similar to channel 1, except the final consumer
is replaced with a business customer. Most industrial goods such as raw materials,
equipment, and component parts are sold through this business channel. There is
no need for wholesalers or other intermediaries in this channel because the goods
are sold in large quantities. In the case of small accessories, producers sell their
products to wholesalers or industrial distributors, which in turn sell them to busi-
ness customers. Brokers and sales agents are also common intermediaries in indus-
trial marketing channels. Often small producers are represented by independent
intermediaries called manufacturers’ representatives to market their products to
large wholesalers or to final business customers [18,23].
Any one or more of the above-mentioned alternative distribution channels might
be used by manufacturers to make their products available to final customers. An
individual producer may choose different marketing channels with respect to its
different types of products or customers.
2.4 Warehousing and Storage
Another important logistics functional area, which is strongly related to physical
flow, is warehousing. In contrast to transportation, which primarily takes place on
network arcs, warehousing and product storage mainly take place at nodal points.
Warehousing, storage, and material-handling activities, which are often referred to
as “transportation at zero miles per hour,” take around 20% of total logistics distri-
bution costs; therefore, they compel logistics executives to give them serious con-
sideration [5].
30 Logistics Operations and Management

Because demand for products cannot be predicted with certainty and they cannot
be supplied immediately, storing inventories is inevitable. Companies store inven-
tories to reduce their overall logistics costs and to reach higher levels of customer
service through better coordination between supply and demand. Therefore, ware-
housing has become an important part of companies’ logistics systems, which
stores goods at and between the origin and destination points and provides the man-
agement with information about the status, disposition, and condition of invento-
ries. These inventories may belong to different phases of the logistics process and
can be categorized into three groups [7]:
1. Physical supply (raw materials, components, and parts)
2. Physical distribution (finished goods)
3. Goods in process (constitute small portion of total inventories)
This section is intended to provide a concise introduction to some of the basic
warehousing functions, which will be explored broadly later in Chapter 10. It con-
tinues with a brief discussion about packaging and unit loads, as well as the han-
dling systems. These issues are also investigated in more detail in Chapter 9.
2.4.1 Warehousing Functions
Warehousing plays a critical role in logistics systems, providing the desired cus-
tomer-service levels in combination with other logistics activities. A wide variety
of operations and tasks are performed in warehousing; these can be categorized
under three basic functions [10]:
1. Movement (material handling)
2. Storage (inventory holding)
3. Information transfer
Traditionally, the storage function was considered as the primary role of ware-
houses because they were perceived as places for long-term storage of products.
However, today’s organizations try to improve their inventory turns and move
orders more quickly through supply-chain networks; therefore, nowadays, long-
term storage role of warehouses has diminished, and their movement function has
received more attention.
Movement
The movement or material-handling function is represented by four primary
activities.
� Receiving and put away: This activity includes unloading goods from the transportation
equipment as well as verifying their count and specifications against order records,
inspecting them for damage, and updating warehouse inventory records. Receiving also
includes sorting and classification of products and prepackaging bulk shipments into
smaller ones before moving them to their warehouse storage location. Finally, the physi-
cal movements of products to storage areas, locations for specialized services (such as
31Physical Flows

consolidation areas), and outbound shipment places are referred to as pass-away activities
[5,24].� Order filling or order picking: This is a fundamental movement activity in warehousing
and involves identifying and retrieving products from storage areas according to customer
orders. Order filling also includes accumulating, regrouping, and packaging the products
into customers’ desired assortments. Moreover, generating packing slips or delivery lists
may also take place at this point [7,24]. Order-picking activities are time consuming and
labor intensive. A study in the United Kingdom revealed that around 63% of warehouse
operating costs are the result of order picking [25].� Cross docking: In this process, receiving products from one source are occasionally con-
solidated with products from other sources with the same destination and immediately
sent to customers, without moving to long-term storage. A pure cross-docking operation
only organizes the transfer of materials from inbound receiving dock to the outbound
dock, eliminating nonvalue-adding activities such as put away, storage, and order filling.
In practice, however, there might be some delay, and the items may remain in the facility
between 1 and 3 days [26,27].� Shipping: This activity involves physically moving and loading assembled orders onto
transportation carriers, checking the content and sequence of orders, and updating inven-
tory records. It may also include sorting and packaging the products for specific custo-
mers or bracing and packing the items to prevent them from damage.
Storage
The storage function of warehouses is simply about the inventory accumulation
over a period of time. The storage of inventory may take place in different loca-
tions and for different lengths of time in warehouses, depending on the storage pur-
pose. In general, four primary storage functions have significant impacts on the
storage facilities’ design and structure: holding, consolidation, break-bulk, and mix-
ing.5 Warehouses may be designed to satisfy one or more of these functions, and
their layout and structure will vary based on their emphasis on performing these
storage functions.
The storage of inventory in warehouses can be categorized into two main
groups, according to the length of storage time: temporary or short-term storage
and semipermanent or long-term storage. In temporary storage, only products
required for basic inventory replenishment are stored. The amount of temporary
inventory required to be stored in warehouses is determined based on the extent of
variability in lead time and demand. Also, the design of logistics systems may
affect the inventory extent. The emphasis of temporary storage is on the movement
function of warehousing, and pure cross docking tends to use only this kind of stor-
age. However, semipermanent or long-term storage includes the storage of products
in excess of that necessary for basic replenishment. Semipermanent storage is justi-
fied in some common situations, including [7]:
1. Seasonal or erratic demand
2. Conditioning of products (e.g., fruits and meats)
5 These functions are broadly explored in reference [5], pp. 472�477.
32 Logistics Operations and Management

3. Special deals (e.g., quantity discounts)
4. Speculation or forward buying
Information Transfer
Precise and timely information is a must for managers to administer the warehous-
ing operation; therefore, they attach great importance to the information-transfer
function. This function takes place concurrently with the other warehousing
functions—movement and storage—and provides the warehouse manager with
information on the inventory and throughput levels,6 locations where products
stored, as well as inbound and outbound shipments. These types of information
along with the data on space utilization, customer and personnel information, and
other pertinent information are essential for ensuring a successful warehousing oper-
ation. Recognizing the crucial importance of these types of information, companies
are continually improving the speed and accuracy of their information-transfer func-
tion by using computerized and modern processes such as bar coding their products,
and using the Internet or electronic data interchange (EDI) systems for transferring
their information [7].
2.4.2 Packaging and Unit Loads
Almost all the products flowing through logistics networks are packaged, mainly to
promote or protect the product. The former goal is achieved by one type of packag-
ing referred to as interior or consumer packaging. This packaging is brightly col-
ored and contains marketing and promotional materials. Although the exterior or
industrial packaging is the plain box or pallet that includes basic information about
the item for organizations, it is designed to protect the product and make its han-
dling easier. In general, the main reasons for packaging goods can be summarized
as follows [3,27]:
� To protect or preserve items� To identify the product and provide basic information� To facilitate the handling and storage of products� To improve the product appearance, and assist in promoting, marketing, and
advertising it
Products may also be packed at different levels. Primary or elementary packag-
ing creates the smallest handling unit of any system, enclosing the product directly
and keeping it unchanged throughout the logistics network. Secondary or com-
pounded packaging is created by bundling a number of primary packages together.
Finally, similar to secondary packaging, outer packaging takes place to make the
handling of products easier. These packages disappear after the products are
unpacked at destination points [28]. Customers may order the products at any of
these levels, and the logistics and distribution systems must satisfy their demand
cost-effectively. Therefore, the concept of load unitization—storing and handling
6 The amount of material moving through a warehouse.
33Physical Flows

goods in standard modules—has become a fundamental issue in today’s supply-
chain networks. Moving standard unit loads is much easier than moving a variety
of products with different sizes and shapes. Thus, smaller logistics units are col-
lected and bundled together to form standard unit loads. Determining the optimal
type and size of unit loads decreases both the products movement rates and their
loading and unloading times. It also brings the chance of using standard handling
and storage equipment to the company, so that it can be set up to work efficiently
and be optimally utilized [3,27]. Different types of unit loads are designed
for application in three basic areas of supply networks: manufacturing, storage, and
distribution [29]. Small containers (such as tote bins), intermediate bulk containers
(IBCs), dollies, roll-cages, and cage and box pallets are examples of the most fre-
quently used storage-unit loads (see references [3,24] for more details). However,
the most commonly used storage-unit load is probably the wooden pallet. Wooden
pallets are intended to be made to standard sizes; however, the existence of differ-
ent standards (e.g., in the United States, the United Kingdom, and continental
Europe) caused international movements to encounter some problems. Moreover,
these pallets may also be made of metal or plastic, and they can be two- or four-
way, open- or close-boarded, and single- or double-sided. Because these pallets are
the most significant unit loads in warehousing, specific storage and handling sys-
tems are designed for them; these are explored later in this section. Systems for
nonpalletized loads are examined in the concluding section of this chapter.
2.4.3 Storage and Handling Systems
Storage and handling systems fall into two main categories: palletized and nonpal-
letized. Some of the most common examples of the various types of storage and
handling equipment available for these two systems are introduced in this section.
Palletized Storage and Handling Systems
As mentioned earlier, the most frequently used unit load in warehouses is the
wooden pallet. Wooden pallets are popular mainly because they allow the use of
standard storage and handling equipment, regardless of the size and characteristics
of the goods on the pallet. Products in these types of systems either arrive on pal-
lets or are palletized at the receiving areas, so they can benefit from the conve-
nient-size load for their movement and storage.
Pallet Movement
There exists a wide variety of equipment for horizontal movement of pallets in
warehouses. The most regular types include the following:
� Pallet trucks generally fall into two types: hand pallet trucks and powered pallet trucks.
Hand pallet trucks are manually operated trucks with two forks and a steering unit. The
forks enter into the pallet slots and then can be raised slightly by a hand-operated hydrau-
lic pump or by using a mechanical system of levers until the load is lifted off the floor,
ready for transportation. Powered pallet trucks are similar to hand pallet trucks, except
34 Logistics Operations and Management

they are electrically powered. They can be pedestrian- or rider-controlled, depending on
their design. These types of trucks are faster than hand pallet trucks, and they are more
suitable for moving greater loads over longer distances and more frequently [30,31].� Tow and platform trucks are suited for horizontal movements of loads over long dis-
tances, and they can be manually operated or battery powered. Using a tug towing several
trailers can reduce the number of required journeys in warehouses. In situations where
fumes or oil spillage may not be a hazard to operators or cause contamination of pro-
ducts, diesel tow trucks can also be used [30].� Conveyors are devices suited for continuously transporting material, especially where unit
loads are uniform and the path and rate of their movements tend to remain unchanged.
Thus, conveyors are used mainly in cases where the frequent movement of material
between specific points is required and the flow volume would justify the conveyors’
fixed costs. Conveyors may be driven using some source of power (traction conveyors) or
without power—for example, as with gravity roller conveyors known as tractionless con-
veyors. The latter is suitable for short distances, while the former is suited for longer and
more controlled movement of material [30].� Automated guided vehicles (AGVs) are driverless battery-powered vehicles controlled by
computer. They are mainly used for material movement between determined points and
in cooperation with other handling systems such as conveyors. They are programmable
devices, and a variety of means may be used for their guidance such as underfloor wires
or magnets, optical guidance through painted lines or strips, or, more recently, by laser-
guided systems. AGVs benefit from obstacle detectors, so when there is an obstacle (e.g.,
a person or a truck) in their way, they stop [3,31].
These types of equipment are mainly used to move material horizontally.
However, as today’s warehousing usually involves with stacking, some lifting
mechanism should be applied to place the pallets into their storage positions. We
describe stacking equipment for palletized loads in the following section, but note
that many of these lifting trucks are also commonly used for horizontal movement
around the warehouse.
Pallet Stacking
To utilize the warehouse space more efficiently nowadays, pallet stacking methods
are employed in most warehouses. Pallets are placed on top of each other or, more
commonly, they are placed in storage racks by means of equipment capable of lift-
ing pallets or loads. Again, a wide range of stacking equipment and lifting trucks
exist that may also be used to horizontally move goods around the warehouse.
Some of the more common types are as follows:
� Counterbalanced forklift trucks (CB truks) carry their loads outside the chassis area and
forward of the front wheels so that they can accommodate a great range of loads.
Because a lack of counterbalance would produce a turning moment that would tend to tip
the truck forward, all the truck’s heavy components such as the engine and battery are
located at the rear of the machine. A counterbalance weight also is built there to balance
the overturning movement. Counterbalanced trucks are one of the most common devices
used in warehousing because they are general purpose machines that can handle many
different types of loads with the aid of various auxiliary attachments. CB trucks are robust
and flexible, and they are available off the shelf from many different suppliers and in a
35Physical Flows

large range of capacities, ranging from 1 ton to about 45 tons. However, because they are
large and heavy trucks, wide aisles of about 3.5 meters or more are required for their
operation. Therefore, although counterbalanced trucks are great “yard trucks” for loading
and unloading the vehicles, they are less suitable for indoor warehousing activities [3,30].� Pallet stackers are quite similar to pallet trucks, except they have a greater range of lift-
ing motion and can do more than just lift a pallet high enough to move it. A wide range
of pallet stackers are available from simple pedestrian or so-called walkie stackers to
stand-on and ride-on types. To store or retrieve pallets from racks, the truck legs are
straddled around the bottom pallet or driven into the space under it. Unlike counterba-
lanced trucks, pallet stacker trucks are fairly lightweight, and they can operate even in
90-degree turning aisles of 2 meters or less. The maximum capacity of these trucks is
usually up to around 2 tons, and their lift height limitation is about 6 meters [3,24].� Reach trucks are one of the most popular types of material-handling devices, lighter and
smaller than the counterbalanced trucks. They carry their load within their wheelbase, so
they can maneuver and operate in relatively smaller areas. In fact, typical models of reach
trucks can handle standard pallets in aisles of between 2.7 and 3 meters. To place loads into
or to retrieve them from storage racks, the truck turns 90 degrees facing the load location; a
mast with a pantograph or scissors mechanism is then used to reach the storage rack to
place or retrieve the load. Then the mast is retracted into the area enclosed by the wheels;
hence, when the truck travels, the load rests on the outrigger arms. Therefore, unlike CB
trucks, no counterbalance weight is required and the truck length can be reduced. However,
to support the load when the mast is extended beyond the outrigger arms, the counterbal-
ance of the truck is used. Modern reach trucks are available with lift heights of up to 11.8
meters, and their capacities typically range from 1 ton up to 3.5 tons [30,32].� Turret trucks provide greater stacking height (up to 12 meters or so), but they also require
greater investment cost. Turret trucks are suitable for narrow aisles and confined spaces.
In fact, they can operate in aisles of between 1.5 and 2 meters. The rotating forks and
mast allow the pallets to be picked up and retrieved from either side of the storage aisle.
The truck itself does not rotate during the storage or retrieval, so their bodies should be
longer to increase their counterbalance capabilities.� Specialist pallet stacking equipment exists in a wide range of equipment for specific types
of storage and handling systems. These include narrow-aisle trucks, which have minimum
aisle width requirement; double-reach trucks with telescopic forks that allow two pallets
to be handled from the same side of an aisle; and stacker cranes, which are commonly
used in automated storage and retrieval systems (AS/RSs).7
Nonpalletized Storage and Handling Systems
There are many types of products that cannot be palletized because of their special
characteristics. Being too large, too long, or even too small or having some han-
dling limitations such as being lifted from the top, many types of products are not
suitable for palletization. Some electronic items, nut and bolts, steel bars, drums,
paper reels, hanging garments, and carpets are examples. This section introduces
some of the equipment and devices that are commonly applied in various storage
and handling systems of these items.
7 Further details about these devices, along with the appropriate storage systems are described in the
chapter 15 of reference [3].
36 Logistics Operations and Management

Truck Attachments
A wide range of attachments are available for fitting to forklift trucks so that they
can handle goods that cannot be touched by forks. These truck attachments enable
additional degrees of movement for handling unit loads. However, the extra weight
of these attachments should be considered in calculating the payload capacity of
trucks and in determining the weight that can safely be carried by the truck. Some
of the most common types follow:
� Clamp attachments can be used instead of forks to handle loads such as cardboard boxes,
cartons and bales, drums, kegs, paper reels, and similar materials. They consist of shaped
or flat side arms that are powered by a truck’s hydraulic system. The side-arm pressure is
adjustable, but the clamps often exert severe pressure on loads, so they must have enough
strength to resist such pressure [3,30].� Rotating head attachments are suitable for situations in which the orientation of loads
needs to be changed. A common example is newsprint reels, which are stored with their
axes vertical, even though they are presented horizontally to printing machines [3].� Load push�pull devices are alternatives to forks, by which materials are positioned on slip
sheets. Slip sheets take up little space in warehouses or shipping containers, and they avoid
the cost of one-way pallets. Also, such devices enable nonpalletized loads to be pulled on to
a platen, so they can be lifted, moved, and placed effectively as if they were a pallet load.
The major drawback of this type of material handling is its longer operation time [30].� Drum-handling equipment are devices for handling drums or barrels. There are several
types of forklift truck attachments, including cradle attachments, horizontal carry attach-
ments, vertical carry attachments, and drum tines. These attachments are used to lift a
number of horizontally or vertically oriented drums at one time.� Booms are available in various types. They replace the truck forks for handling rolled
items, such as carpet rolls, steel coils, and horizontal reels.
Cranes
The typical application of cranes in warehousing is for handling very heavy loads,
such as metal bars, or for relatively lighter loads that are just too heavy to be han-
dled manually. Cranes can provide movement of loads only in limited and predeter-
mined areas. Some of the more commonly used types are as follows.
� Bridge cranes or overhead traveling cranes consist of a hoist mounted on a bridge made
up of one or more horizontal girders that are supported at each end by carriages that
travel along a pair of parallel runways that are installed at right angles to the bridge. The
hoist moves along the bridge, while the bridge itself travels along the runway, so that the
working area is fully covered [31].� Gantry cranes consist of hoists fitted in a traverse trolley that can move horizontally
along the bridge section and supporting columns or legs at each end of the bridge. These
legs may run on ground rails, or they may be supported on wheels that allow the whole
crane to traverse. Therefore, mobile gantry cranes are also suitable for outdoor
applications.� Jib cranes are lifting devices that travel along a horizontal boom—a pivoted arm called
the jib—that is mounted on a pillar or on a wall. These types of crane are relatively inex-
pensive and can handle loads within the arc defined by the radial jib [3,31].
37Physical Flows

� Stacker cranes have a forklift-type mechanism and are usually used in automated storage
and retrieval systems (AS/RSs). The crane traverses on a track in the warehouse aisles,
and the fork can then be lowered or raised to any levels of storage racks on either side of
the aisle. The fork can then be extended into the rack to store or retrieve products.
Typical types of crane are electrically powered, and they may be used with a
wide range of attachments for specific purposes. Different types of hooks, magnets,
and mechanical clamps are common examples of these attachments.
Conveyors
As mentioned previously, conveyors are widely used in warehousing to move both
palletized and nonpalletized loads over fixed routes. They may also be used to sort
or accumulate products (short-term buffering) or as an integral part of packaging
and order-picking operations. In general, two types of conveyer exist: nonpowered
or gravity conveyers and powered conveyors.
In comparison to powered conveyors, gravity conveyors are more basic and less
costly. They are normally used to move loads weighing up to several tons over short
distances. The major types of gravity conveyors include the following [31,32].
� Spiral chute conveyors are normally used to convey goods between floors or to link two
handling devices. They may have double or triple spiral runways for sorting and transfer-
ring items to different levels.� Wheel conveyors are constructed of a series of skate wheels mounted on a shaft or com-
mon axle. The spacing of the wheels and the slope for gravity movement depend on the
type and weight of the loads being transported. Wheel conveyors are commonly used for
vehicle loading and unloading, and they are more economical than roller conveyors for
light-duty applications.� Gravity roller conveyors are an alternative to skate-wheel conveyors for heavy-duty
applications. Roller conveyors can handle items with a rigid riding surface, and their
slope depends on the load weight.
Powered conveyors are normally used for moving heavier loads over longer dis-
tances. Some of the more frequently used types include the following:
� Live roller conveyors comprise a series of rollers, and they are suitable for moving heavy
goods or loads with irregular shapes and sharp corners. To provide accumulation, rollers
can be disengaged using force-sensitive transmission features. Powered roller conveyors
can move loads horizontally and up 5- to 7-degree slopes [31,32].� Belt conveyors comprise a continuous belt running on supporting rollers that provides
complete support under the loads being transported. They are generally used for moving
light and medium weight loads, and they provide considerable control over their orienta-
tion and placement. Belt conveyors are suitable for paths with inclines or declines, and
they can move loads with unusual shapes and configurations; however, no accumulation
is provided [3,32].� Slat conveyors consist of separately spaced slats, and they are generally used for heavy
loads with abrasive surfaces that may damage the belt. They can provide control over the
orientation and placement of the load [31,32].
38 Logistics Operations and Management

� Chain conveyors carry loads directly on one or more endless chains. They are primarily
used to move heavy loads or to transfer loads between sections of roller conveyors [3,31].� Trolleys conveyors consist of chains or cable suspended from equally spaced trolleys run-
ning in a closed loop path. Overhead trolley conveyors can handle loads up to several
tons, and they are commonly used in systems with fixed path and paced flow [31].
Automated Guided Vehicles
Automated guided vehicles are introduced briefly under the section “Palletized
storage and handling systems”. In addition to palletized loads, AGVs may be used
for moving nonpalletized loads, especially large and heavy loads, including paper
reels and automobile bodies. There exists a wide range of AGV types, and they can
be guided using physical guide path (such as wire, tape, paint), or by nonphysical
guide path (software). Changing vehicle path in latter method is easier, because the
path is not physically fixed; however, absolute position estimates (e.g., from lasers)
are required in those methods [3,32].
References
[1] Council of Supply Chain Management Professionals. Supply chain management defini-
tions [online]. http://cscmp.org/aboutcscmp/definitions.asp, 2000 (cited 14.11.10).
[2] J.C. Johnson, D.F. Wood, D.L. Wardlow, P.R. Murphy, Contemporary Logistics, sev-
enth ed., Prentice Hall, Upper Saddle River, NJ, 1999, pp. 1�21.
[3] A. Rushton, P. Crouche, P. Baker, The Handbook of Logistics and Distribution
Management, third ed., Kogan Page, London, 2006.
[4] S.C. Ailawadi, R. Singh, Logistics Management, Prentice Hall of India, New Delhi,
2005.
[5] R.H. Ballou, Business Logistics/Supply Chain Management: Planning, Organizing, and
Controlling the Supply Chain, fifth ed., Pearson-Prentice Hall, Upper Saddle River, NJ,
2004.
[6] A. West, Managing Distribution and Change: The Total Distribution Concept, John
Wiley & Sons, New York, 1989, pp. 181�195.
[7] J.R. Stock, D.M. Lambert, Strategic Logistics Management, fourth ed., Irwin McGraw-
Hill, New York, 2001.
[8] G. Ghiani, G. Laporte, R. Musmanno, Introduction to Logistics Systems Planning and
Control, John Wiley & Sons, NJ, 2004, pp. 6�20.
[9] M. Hugos, Essentials of Supply Chain Management, John Wiley & Sons, Hoboken, NJ,
2003, pp. 1�15.
[10] D.M. Lambert, J.R. Stock, Strategic Logistics Management, third ed., Irwin,
Homewood, IL, 1993.
[11] U.S. Department of Transportation, Research and Innovative Technology Admini-
stration, Bureau of Transportation Statistics, and U.S. Census Bureau. 2007 Commodity
Flow Survey; Transportation Commodity Flow Survey, preliminary [online]. http://
www.census.gov/compendia/statab/2010/tables/10s1036.pdf, 2008 (cited 14.11.10).
39Physical Flows

[12] H.T. Lewis, J.W. Culliton, J.D. Steel, The Role of Air Freight in Physical Distribution,
Division of Research, Graduate School of Business Administration, Harvard
University, Boston, MA, 1956, p. 82.
[13] R.J. Sampson, M.T. Farris, D.L. Shrock, Domestic Transportation: Practice, Theory,
and Policy, fifth ed., Houghton Mifflin, Boston, MA, 1985, pp. 68�85.
[14] KnowThis LLC. Principles of marketing tutorials [online]. http://www.knowthis.com/
principles-of-marketing-tutorials/managing-product-movement/modes-of-transportation-
comparison, 1998 (cited 14.11.10).
[15] D.A. Deveci, A.G. Cerit, O. Tuna, Determinants of intermodal transport and Turkey’s
transport infrastructure, in: METU International Conference in Economics VI. Ankara,
Turkey, September 11�14, 2002.[16] Institute of Logistics, Understanding European Intermodal Transport—A User’s Guide,
Guideline No. 4, Institute of Logistics, Corby, UK, 1994.
[17] M. Yan, H. Yu, Logistics solutions for company A’s Latin American market. Research
project, Simon Fraser University, Faculty of Business Administration, 2004, pp. 62�73.
[18] P. Kotler, G. Armstrong, J. Saunders, V. Wong, Principles of Marketing, second
European ed., Prentice Hall Europe, London, 1999, pp. 894�907.
[19] D. Riopel, A. Langevin, J.F. Campbell, The network of logistics decisions, in:
A. Langevin, D. Riopel (Eds.), Logistics Systems: Design and Optimization, Springer,
New York, 2005, pp. 12�17.
[20] M. Browne, J. Allen, Logistics of food transport, in: R. Heap, M. Kierstan, G. Ford
(Eds.), Food Transportation, Blackie Academic & Professional, London, 1998,
pp. 22�25.
[21] R.G. Kasilingam, Logistics and Transportation: Design and Planning, first ed.,
Springer, London, 1999, pp. 24�26.
[22] A.C. McKinnon, Physical Distribution Systems, first ed., Routledge, London and New
York, 1989, pp. 26�30.
[23] L.E. Boone, D.E. Kurtz, H.F. MacKenzie, K. Snow, Contemporary Marketing, second
Canadian ed., Nelson Education Ltd, Toronto, ON, Canada, 2010, pp. 390�395.
[24] J.A. Tompkins, J.A. White, Y.A. Bozer, J.M.A. Tanchoco, Facilities Planning, fourth
ed., John Wiley & Sons, Hoboken, NJ, 2010.
[25] J. Drury, Towards More Efficient Order Picking, IMM Monograph No. 1, The Institute
of Materials Management, Cranfield, 1988.
[26] J.K. Higginson, J.H. Bookbinder, Distribution centers in supply chain operations, in:
A. Langevin, D. Riopel (Eds.), Logistics Systems: Design and Optimization, Springer,
New York, 2005, pp. 71�78.
[27] D. Waters, Logistics: An Introduction to Supply Chain Management, Palgrave
Macmillan, New York, 2003, pp. 283�290.
[28] T. Gudehus, H. Kotzab, Comprehensive Logistics, first ed., Springer-Verlag, Berlin,
2009, pp. 342�344.
[29] J.M.A. Tanchoco, Material Flow Systems in Manufacturing, first ed., Chapman & Hall
publication, London, 1994, pp. 107�109.
[30] K.C. Arora, V. Shinde, Aspects of Materials Handling, first ed., Laxmi Publications,
New Delhi, 2007, pp. 146�170.
[31] K. Bagadia, Definitions and classifications, in: R.A. Kulwiec (Ed.), Materials Handling
Handbook, second ed., John Wiley & Sons, New York, 1985, pp. 103�110.
[32] C. Hiregoudar, B.R. Reddy, Facility Planning and Layout Design, first ed., Technical
Publications Pune, Pune, Maharashtra, 2007, pp. 31�56.
40 Logistics Operations and Management

Part II
Strategic Issues

This page intentionally left blank

3 Logistics Strategic Decisions
Maryam SteadieSeifi
Department of Industrial Engineering, Amirkabir University of Technology,Tehran, Iran
3.1 Strategy
Strategy originates from the Greek word strategos (“general” of the army), but its
contemporary definition refers to a plan for achieving chosen objectives. Therefore,
strategy as planning and positioning is the traditional definition of strategy [1].
In other words, strategies are the directional, focused efforts that establish a con-
sistent and planned approach for a business organization. In fact, strategies are the
human management decisions that are made with partial information—assumptions
about conditions, interactions, attitudes, behaviors, and actions and reactions in the
environment—by a company in advance.
Strategies are commonly agreed to be complex but not completely deliberate, to
involve different thought processes (conceptual and analytical), to address both
content and process, to concern both the organization and its environment, and to
affect the overall welfare of the organization. Strategies as explained by Hines exist
on four different levels [1].
1. Corporate strategy: By establishing this strategy, a firm creates the structure of its organi-
zation and its business interests, as well as the share of its portfolio in those businesses.
The company’s goals define how to develop such infrastructure.
2. Business strategy: This level of strategy determines the type of products or services that
the organization wants to offer. Also, business strategy determines what each business
unit needs to do and where to do it in order to reach the business objectives at the corpo-
rate level.
3. Operational strategy: This strategy is about how to achieve business objectives set at the
corporate and business levels by extensive planning of available resources, processes,
products, technologies used, and so on. This strategy also consists of setting certain mar-
ket policies in order to achieve the organization’s long-term competitive strategy.
4. Competitive strategy: These strategies tell a company how to meet its customers’ desir-
able demands as defined by cost, quality, reliability, and so on. In a competitive,
customer-driven market, an organization cannot ignore necessary competitive strategies.
Figure 3.1 shows the hierarchies of strategies. As the figure shows, developing
strategies must consider the other strategies.
Logistics Operations and Management. DOI: 10.1016/B978-0-12-385202-1.00003-7
© 2011 Elsevier Inc. All rights reserved.

While planning the business process, corporate strategy and objectives are iden-
tified, and a specific competitive strategy is determined [2].
A strategic study includes two phases: (1) reviewing external environment and
(2) analyzing internal factors. External environment is the study of economic cli-
mate, political climate and regulations, technological developments, and evaluation
of primary competitors, especially service and logistics industries. It is done usually
by a political, economic, sociocultural, and technological (PEST) analysis. As for
analyzing internal factors, a logistics business should typically perform a strengths,
weaknesses, opportunities, and threats (SWOT) analysis to review its position
within the relevant market, its potential demand, and its offered services in compar-
ison to its competitors and to determine its overall corporate or business strategy.
“Logistics is a part of a firm’s corporate strategy” [3].
Competitive strategy is also an important part of a company’s plans. It affects the
whole configuration of the company’s logistics strategy: the extent of globalization,
the type of adopted competitive positioning, and the degree to which the supply
chain is integrated [2].
3.2 Strategic Planning
As noted in Section 3.1, strategies are used to determine how to get to chosen
objectives. Therefore, strategic planning is the process of identifying those long-
term goals (objectives) and the necessary steps to achieve those goals over a long-
term horizon. Strategic planning incorporates the concerns and future expectations
of major stockholders [4].
In the previous section, we defined the levels of strategies. Strategic planning is
to set these strategies for the next 3�5 years and to create a plan to reach the objec-
tives defined in those strategies. Different analyses such as SWOT and PEST help
managers identify future paths and directions.
But what are objectives? They are planned outcomes that are as specific as possi-
ble, measurable, achievable, relevant to a company’s mission, and timed [1]. Setting
objectives is a systematic process that involves human judgment and decision making.
Corporatestrategy
Businessstrategy
Competitivestrategy
Operationalstrategy
Figure 3.1 Hierarchies of strategies.
44 Logistics Operations and Management

What is the difference between strategic planning and strategic management?
[1] Planning is important, but if the managers want to move the organization to its
desired destination, then managing the plan is equally important and required.
3.3 Logistics
We will not define logistics again in this section, but let us review some of the
definitions. In its modern form, the concept of logistics dates back to the second
half of the twentieth century [2].
Logistics is the entire process of planning, implementing, and controlling the
efficient flow and storage of materials and products, services, information, energy,
people, and other resources that move into, through, and out of a firm (in both the
public and private sectors) from the point of origin to the point of consumption and
with the purpose of meeting customer requirements [3].
According to Rushton et al., “Logistics is . . . the positioning of resource at the
right time, in the right place, at the right cost, at the right quality, while optimizing
a given performance measure and satisfying a given set of constraints” [2].
Logistics profoundly affects living standards. A late food delivery to a store, an
article of clothing in limited sizes and colors, and an expensive piece of furniture
are tangible examples of logistics problems.
A logistics system based on its definition and nature includes the following [2]:
1. Storage, warehousing, and material handling
2. Packaging and unitization
3. Inventory
4. Transport
5. Information and control
The logistics planning department of a firm includes highly professional people.
The department’s management has a highly complex and challenging position in
planning and controlling the system.
These definitions look at logistics as a part, section, or unit in a business, but
keep in mind that there are logistics organization in most supply chains. These
organizations do not include logistics as a part of their business, because logistics
becomes their business, therefore all their strategies are about logistics, unlike the
former where logistics strategy is a part of their competitive, business or opera-
tional strategies. You should distinguish the concept of logistics from supply chain,
although many recent publications have used them as one concept. The following
section tries to find the difference between them.
3.3.1 Logistics Differences to Supply Chain
We defined logistics and mentioned its importance. It is now generally agreed that
for better planning and to realize the real benefits of logistics, its logic should be
extended upstream to suppliers and downstream to final customers [5].
45Logistics Strategic Decisions

In managing a supply chain, factors such as partnership and the degree of link-
age and coordination between chain entities are considered. Rushton et al. [2] men-
tion four differences between classic logistics and supply-chain management:
1. From systematic point of view, the supply chain is viewed as a whole rather than as a
series of distinguished elements such as procurement, manufacturing, and distribution.
Moreover, both suppliers and end users are included in the planning process.
2. Supply-chain management is a highly strategic planning process, based on strategic deci-
sions rather than operational ones.
3. Supply-chain management has another view of inventory. Instead of bulking large inven-
tories in a traditional way as a safety stock for each entity in a chain, supply-chain man-
agement uses inventory as a last resort to balance the integrated flow of product through
the chain.
4. In a supply chain, it is crucial to construct an integrated information system in which all
entities have access to information on demand and stock levels. If a supply chain was
going to be the sum of entities, not their integration, this flow of information would not
have existed, while it is a necessity for the success of the chain.
Despite efforts to define the difference between the concepts of logistics and
supply chain, most businesses now try to move their logistics into a supply chain—
or, perhaps a better term, a demand chain. Therefore, most of the literature of logis-
tics is changing.
3.4 Logistics Decisions
Logistics is a part of a firm’s corporate strategy, but planning a logistics system
has its own definitions, components, rules, and so on.
According to the planning horizon, logistics decisions are traditionally classified
as strategic, tactical, and operational [6]. Logistics decisions are generally made
hierarchically, in an iterative manner from the strategic to the tactical and the oper-
ational (Figure 3.2). But because this chapter is about logistics strategic decision
making and planning, we describe these three logistics decisions in reverse order.
3.4.1 Operational Decisions
Operational decisions are made in real time on a daily or weekly basis, so their
scope is narrow. Decisions such as vehicle loading or dispatching, shipment, and
warehouse routines are among the many types of operational decisions. These kinds
of decisions are based on lots of detailed data and usually made by supervisors.
3.4.2 Tactical Decisions
Tactical decisions are made on a longer-term basis, whether monthly, quarterly, or
even annually. Production planning, transportation planning, and resource planning
46 Logistics Operations and Management

are the best known types of logistics tactical decisions. These decisions are often
made by middle managers or logistics engineers and often with disaggregated data.
3.4.3 Strategic Decisions
As mentioned earlier in this chapter, strategic decisions are business objectives and
mission statements, as well as marketing and customer-service strategies. Therefore,
they are long-term kinds of decisions made over one or more years. These decisions
are made by executive administrators, top managers, and stockholders. The data at
hand for such decisions are often imprecise, incomplete, and need forecasts.
Strategic decisions are made to optimize three main objectives [6]:
1. Capital reduction (the level of investment, which depends on owned equipment and
inventories)
2. Cost reduction (the total cost of transportation and storage)
3. Service-level improvement (customer satisfaction and order cycle time)
According to Stock and Lambert, “Strategic plans provide direction and control
for tactical plans and daily operations” [4].
3.5 Logistics Planning
Logistics planning for any business is based on the three levels of decisions
described in the previous section. Logistics planning starts from strategic decision
making and hierarchically covers tactical and operational decisions. Remember that
the scope and structure of logistics planning can change from one business to
another based on its nature and size, and the strategies it uses. Factors such as the
time frame, resources required, and level of managerial responsibilities affect this
difference. For example, distribution planning may be a part of the strategic deci-
sion making of one firm but be a tactical plan in another firm. What is clear is that
these decisions overlap and are interrelated.
An appropriate strategic logistics plan consists of an overview of logistics strat-
egy in general terms and its relationship to the other functions, the relationship
between logistics objectives and cost and services for both products and customers,
a description of necessary individual unit strategies such as warehousing strategy,
forecasting of all required resources such as labor, and the role of logistics strategy
in corporate profits and customer-service performance [4].
Strategic Tactical Operational
Figure 3.2 How logistics decisions are
interrelated.
47Logistics Strategic Decisions

As Stock and Lambert [4] note, the key inputs in developing an effective logis-
tics plan are the following.
1. Marketing inputs: knowledge of products, pricing programs, sales programs and forecasts,
and customer-service policies
2. Manufacturing inputs: manufacturing capabilities and locations
3. Purchasing inputs: new sources, materials, services, and technologies
4. Financial inputs: the source of the cost data and the availability of capital
5. Logistics inputs: location of current logistics facilities
Finally, as discussed in Ballou [7], strategic decisions determine what our distri-
bution system should be, tactical decisions are how the distribution system can be
utilized, and operational decisions implement action—“Let’s get the goods out.” In
the managerial hierarchy of a logistics system, strategic decisions are made by top
managers, tactical decisions are made by middle managers, and operational ones
are made by supervisory personnel.
A logistics plan is about implementing the logistics strategy, so this strategy
should be translatable to both tactical aims and operational actions. An organization
will not achieve its goals with a badly designed strategy or an inappropriate execu-
tion plan.
3.6 Logistics Strategic Decisions
As discussed in the previous section, depending on the type of business, logistics
decision groupings are diverse. However, all of these decision categorizations com-
prise the following three basic types of strategic decisions:
1. Customer service
2. Logistics network design
3. Outsourcing versus vertical integration
The following sections describe each of these logistics strategic decisions.
3.6.1 Customer Service
Customer service is the first and foremost class of logistics strategic decisions. As
defined earlier, logistics involves delivering the right product to the right customer
at the right place, at the right time, and with the right cost and quality. Therefore,
customer service is the output of logistics.
Traditionally, businesses have determined their customer service based on what
their customers want rather than what they really need. Identifying the customer’s
need is the primary step in establishing a logistics system.
Two basic factors require a trade-off: cost and level of service. It is almost
impossible to provide a customer-service plan that has an optimal cost�service bal-
ance [2]. Some businesses prefer a cost-minimization strategy, and some prefer a
service-maximization strategy. In the former strategy, the company delivers the
48 Logistics Operations and Management

same product but at a cheaper cost, whereas in the later strategy the company pro-
vides products or services that no other competitors can give. Deciding on which to
choose depends on the type of business, the products it offers, and the market it
competes. These two approaches are usually discussed and compared as lean and
agile strategies.
Competitive strategies help an organization understand its competitors and the
market in which it competes, so it can audit them and find existing gaps and oppor-
tunities available to close gaps in customer requirements.
In general, a customer-service plan is divided into three phases [2]: pretransac-
tion, transaction, and posttransaction.
The purpose of defining customer-service strategies is to provide customers with
the services they need. This is usually done by defining the perfect order concept.
Christopher [8] has defined three elements for the perfect order: on time, in full,
and error free.
Also, it is important to determine the necessary customer-service standard so that
the performance can be measured and compared to the desired defined strategies.
3.6.2 Logistics Network Design
To achieve corporate strategies, an organization must ensure that its structure and
flow of materials and information are appropriate. Therefore, logistics network (or,
in some references, logistics channel) design is divided into two groups: the physi-
cal facility (PF) network and the communication and information (C&I) network
[9]. These decisions are critical because the largest part of invested capital belongs
to them. Rushton et al. [2] have also included process and organizational designs in
their logistics strategy, but in this section we only take a look at physical and infor-
mation network strategies.
Physical Facility Network
Keep in mind that the physical facility location of logistics is not similar to the one
in supply-chain management. Physical facility location is about determining the
number, size, location, and necessary equipment of new facilities together with
alteration of existed ones. In many facility location decisions, allocation decisions
are now also included. The usual objective of such decision problems is minimizing
total system costs, but some businesses, particularly those in public sectors, con-
sider maximizing the service level or even balancing both objectives.
Facility location decisions are clearly made at the start of a business, but Ghiani
et al. [6] say that these decisions should not be made only at the start but also with
a long-term view in mind; system changes should also be reconsidered as business
proceeds. The reasons are obvious: When facilities are located, products are allo-
cated to retailers but when the demand trends change, so should the system.
Location problems are classified based on the following criteria [6]:
1. Time horizon (single period vs. multiperiod)
2. Facility typology (single type vs. multitype)
49Logistics Strategic Decisions

3. Hierarchy (single level vs. multilevel)
4. Material flow (single commodity vs. multicommodity)
5. Interaction among facilities (with interactions vs. without interactions)
6. Dominant material flow (single echelon vs. multi-echelon)
7. Demand divisibility (divisible vs. indivisible)
8. Influence of transportation on location decisions (location problems vs. location-routing
problems)
9. Retail location (with competition vs. without competition)
The complexity of physical facility location problems has attracted lots of
research, and many mathematical models have been developed. Single-facility
location problem is one of the most basic problems of this kind. Some other famous
mathematical models are median location problems, center location problems,
covering problems, and hub location problems [10].
Communication and Information Network
The importance of an integrated communication and information system to success
makes planning for such system a part of strategic decisions. These decisions are
about the establishment and maintenance of an effective communication system
and planning for information sharing throughout the system. Centralizing or distrib-
uting the information, the technology used for such system, integration of the infor-
mation flow (such as the use of enterprise resource planning, or ERP, systems),
standardization of hardware, software, development environment, vendors, and the
role of e-commerce are some of most important decisions made in this category
[8].
Designing an integrated information and communication system means building
an information-sharing system as well as programming an interorganizational col-
laborative planning procedure [11].
3.6.3 Outsourcing versus Vertical Integration
Decisions related to outsourcing bring greater flexibility, lower investment risk,
improved cash flow, and lower potential labor costs. Instead, the business might
lose control over its process, might have long lead times or shortages, or choose
the wrong supplier. Outsourcing decisions determine which functions should be
outsourced, as well as the nature and extent of outsourcing agreements [12].
In contrast, decisions on vertical integration (also known as insourcing) have
higher control over inputs, higher visibility over the process, and so on. However,
more integration requires higher volume and higher investment, and there is less
flexibility in using equipment. Vertical integration decisions include the nature of
the integration, its direction (downward toward customers or upward toward suppli-
ers), and its extent (which activities, parts, or components should be included).
When a firm is unable to build an item (especially a routine one) or is uncertain
about the volume required and suppliers offer favorable costs or have specialized
research on the job, then outsourcing the job to a third party seems the best choice.
50 Logistics Operations and Management

Insourcing is preferred when the firm wants to integrate plant operations, needs
to have direct control over production and quality, desires some secrecy, lacks reli-
able suppliers, or has items or production technology that is strategic to the firm
[12].
Since 1980, many firms have realized that they cannot do it all, so they have
made use of outsourcing so that they can avoid parts or activities that do not have
any prime competency and value for their business.
3.7 Tools of Strategic Decision Making
There are lots of tools for strategic decision making. The most applicable ones can
be classified into the following categories [6]:
1. Benchmarking: In management science, benchmarking is about comparing the perfor-
mance of a logistics system to a best-practice standard (e.g., a successful logistics firm).
Another use of benchmarking, as mentioned previously, is auditing the performance of
the competitors in the market and finding their gaps in serving customers.
2. Optimization programming: Like many decision-making problems, most logistics strate-
gic problems can be cast as mathematical problems. Unfortunately, these optimization
problems are among nondeterministic polynomial-time hard (NP-hard) problems, which
has resulted in the development of fast heuristic algorithms. These algorithms are
intended to search the solution space for good but not necessarily the best solutions. Tabu
search, genetic algorithm, and simulated annealing are some of the most famous
algorithms.
3. Continuous approximation: This method can be used whenever customers are so numer-
ous that demand can be seen as a continuous spatial function. Approximation often yields
closed-form solutions, and it can be used as a simple heuristic.
4. Simulation: Simulation evaluates the behavior of the system or a particular configuration
under different alternative conditions. With each simulation run, these conditions are set
one by one, and the results show the probable reaction of the system to these scenarios.
This tool comes really handy for strategic decision making because managers can evalu-
ate their strategies before spending capital, building facilities, and establishing their logis-
tics system.
5. Forecasting: Forecasting is an attempt to determine in advance the most likely outcome
of an uncertain variable. Logistics requirements to be predicted include customer
demands, raw material prices, labor costs, and lead times. There are long-term, medium-
term, and short-term forecasts. Medium- and long-term demand forecasts are hardly ever
left to the logistician. More frequently, this forecasting task is assigned to marketing man-
agers who try to influence the demand. However, the logistician will often produce short-
term demand forecasts. Because in most cases customers are geographically dispersed, it
is worth estimating not only when but also where demand volume will occur. Forecasting
approaches can be classified into two main categories: qualitative and quantitative meth-
ods. Qualitative methods are most likely surveys, market research, the Delphi method,
and sales-force assessment. Quantitative methods are casual methods (regression, econo-
metric models, input�output models, life-cycle analysis, computer simulation models,
and neural networks) based on past and current data and time-series extrapolation (ele-
mentary techniques, moving averages, exponential smoothing techniques, decomposition
51Logistics Strategic Decisions

approaches, and the Box�Jenkins method). The proper choice of method is based on the
type of information available.
These are not the only tools available. As discussed earlier in this chapter, tools
such as SWOT and PEST analyses are two other applicable tools that help man-
agers in their strategic decision-making process. Each category and its tools are
taught as academic courses in universities. Students of industrial engineering, man-
agement engineering, systems engineering, operations research, and management
programs learn to use these tools for various problems and projects. Many books
also describe and comprehensively explain these tools.
3.8 Logistics Strategic Flexibility
Logistics strategic decisions are usually made over 3�5 years, but this does not
mean that strategic decision making is a one-time job.
In the current uncertain and rapidly changing business climate, managers must
monitor these changes and prepare their organization to respond and even take
advantage of them. If managers do not act proactively, then they must constantly
react to these changes and may not be able to push their organizations forward
[13]. We call this proactive ability strategic flexibility.
Abrahamsson et al. [14] call such a logistics system a logistics platform to show
its systematic integrity. Logistics platforms have a dynamic ability to reoptimize a
system faster and more efficiently than those of competitors.
One of the most important aspects of strategic flexibility is logistics flexibility
toward the market. Logistics managers should have a complete knowledge of the
life cycle of a product and the role of market changes in the life cycle so that they
can respond to changes and decide when to abandon or improve the product. Some
organizations have the strategy of not limiting the businesses to one market, so
changes in one market do not affect their whole profit package.
Strategic flexibility needs to be evaluated and measured in terms of three major
dimensions: speed of change, cost of change, and amount of change.
One approach toward a flexible logistics system is to develop differently config-
ured logistics structures. It is now commonly accepted that one particular strategy
is limited and cannot cover all possible scenarios.
In conclusion, logistics platforms nowadays are not optimized for cost minimi-
zation like other types of logistics systems. Instead, they are optimized for high
strategic flexibility [12].
3.9 Summary
In this chapter, we glimpsed strategy and strategic planning in a business and
described different types of strategies and the place of logistics among business
52 Logistics Operations and Management

strategies. Then we defined three levels of logistics strategic decisions; because the
concept of the chapter was the strategic types of these decisions, we introduced
three primary strategic decision categories. Many references have illustrated vari-
ous categorizations, but we believe that all strategic decisions can be classified into
these three: customer care, logistics network design, and outsourcing versus vertical
integration. Next, we introduced important tools of strategic decision making for
logistics systems in brief. Finally, at the end of the chapter, we brought up logistics
strategic flexibility and compared it to typical strategic goals of a logistics system.
To briefly summarize, first steps of a logistics system management, like every
other type of businesses, are logistics strategic decisions. From here we find out
about our customers and their needs, determine our logistics hard and soft infra-
structures, and, last but not least, specify whether or not to outsource our logistics
functions.
References
[1] T. Hines, Supply Chain Strategies: Customer-Driven and Customer-Focused, Elsevier,
Oxford, 2006.
[2] A. Rushton, P. Croucher, P. Baker, The Handbook of Logistics and Distribution
Management, Kogan Page, London, 2006.
[3] J.C. Johnson, D.F. Wood, D.L. Wardlow, P.R. Murphy, Contemporary Logistics,
Prentice Hall, New Jersey, 1999.
[4] J.R. Stock, D.M. Lambert, Strategic Logistics Management, McGraw Hill, New York,
2001.
[5] D. Waters, Global Logistics and Distribution Planning—Strategies for Management,
Kogan Page Limited, London, 2003.
[6] G. Ghiani, G. Laporte, R. Musmanno, Introduction to Logistics Systems Planning and
Control, John Wiley & Sons Ltd., West Sussex, 2004.
[7] R.H. Ballou, Basic Business Logistics, Prentice Hall Int. Inc., NJ, 1987.
[8] M. Christopher, Logistics and Customer Value, in Book: Logistics and Supply Chain
Management—Creating Value Adding Networks, Prentice Hall, London, 2005,
pp. 43�80.[9] A. Langevin, D. Riopel, Logistics Systems: Design and Optimization, Springer, New
York, 2005.
[10] R.Z. Farahani, M. Hekmatfar, Facility Location: Concepts, Models, Algorithms and
Case Studies, Physica-Verlag, Berlin, 2009.
[11] S.C. Kulp, E. Ofek, J. Whitaker, Supply chain coordination: how companies leverage
information flows to generate value, in: T.P. Harrison, H.L. Lee, J.J. Neal (Eds.), The
Practice of Supply Chain Management, Springer, New York, 2004, pp. 91�108.[12] R. Monczka, R.J. Trent, R.B. Handfield, Purchasing and Supply Chain Management,
International Thomson Publishing, OH, 1998.
[13] D.M. Lambert, J.R. Stock, L.M. Ellram, Fundamentals of Logistics Management,
McGraw Hill, New York, 1998.
[14] M. Abrahamsson, N. Aldin, F. Stahre, Logistics platforms for improved strategic flexi-
bility, Int. J. Logist. Res. Appl. 6(3) (2003) 85�106.
53Logistics Strategic Decisions

This page intentionally left blank

4 Logistics Philosophies
Zahra Rouhollahi
Department of Industrial Engineering, Amirkabir University of Technology,Tehran, Iran
4.1 Lean Logistics
Waste is the basic concept of lean philosophy. Lean philosophy uses a number of
simple concepts and tools to eliminate waste in all supply-chain activities. Lean
manufacturing was introduced and implemented in the manufacturing area in the
book The Machine That Changed the World by Womack et al. [1] in 1990. In this
book, the models the Japanese were using in their car industry was conceptualized
by a group of MIT researchers. Since then, lean concepts and tools have been
adjusted and used in other areas such as transportation and warehousing.
True lean achievement requires major changes and improvement in a company.
In manufacturing processes, changes cover all activities from design to actual
manufacturing. Generally, in logistics, both the inbound and outbound sides require
changes [2].
Before we discuss lean philosophy, let us look at other philosophies that pre-
ceded and led to the foundation of lean philosophy.
4.1.1 Japanese Philosophy
One of the most important philosophies that was accepted for many years is the
just-in-case philosophy. For many years, suppliers held extra inventory as safety
stock in case products were needed. The Japanese believed that holding inventory
kept management away from seeing manufacturing process problems such as bot-
tlenecks and quality problems. They argued that keeping extra inventory is like the
water of a deep lake. With deep water, a captain is not worried about hazardous
rocks below the surface of the lake (Figure 4.1)[3]. To confront these rocks (prob-
lems) and find a solution, the first step is inventory reduction. With this belief, the
Japanese developed the kanban concept (which is also known as the Toyota prod-
uction system, or TPS) that started in assembly-type operations. The philosophy of
kanban is that parts and materials should be supplied right at the moment they are
needed in the production process [4].
In fact, kanban is a pull system, which means that parts needed for production
must only be pulled through the chain in response to demand from the end customer.
Logistics Operations and Management. DOI: 10.1016/B978-0-12-385202-1.00004-9
© 2011 Elsevier Inc. All rights reserved.

In contrast, in the conventional push system, production is done according to sched-
ules and available resources such as people, material, and machines regardless of
whether or not the next step needs them at the time. In the kanban system, the aim is
to meet demands right at the time they are ordered and not before. In assembly lines,
stages up the chain provide needed parts. By reducing the kanban quantity (i.e., the
amount demanded from each workstation) bottlenecks gradually become apparent
[3]. The kanban quantity is then reduced gradually until all of the bottlenecks are
revealed and removed. The aim of kanban is to reduce inventory to its minimal
amount at every stage to achieve a balanced supply chain.
4.1.2 Just-in-Time Philosophy
Just-in-time (JIT) systems are the extension of kanban and link purchasing,
manufacturing, and logistics [4]. The primary goals of JIT are inventory reduction,
product quality, and customer-service improvement and production-efficiency maxi-
mization. In JIT systems, the main focus is on achieving continuous improvement of
the process and the quality of the product and service. This is achieved by reducing
inefficient and unproductive time in the production process.
JIT changes many of the principles in a firm. For example, instead of concen-
trating on cost, quality is considered more. ‘Many suppliers’ thinking is replaced
by ‘few suppliers with long-term open relationship’ thinking. In fact, in JIT think-
ing, higher-quality customer service is more important than cost, which is the main
issue in conventional systems.
In JIT systems, material control is based on the view that a process should oper-
ate only on a demand signal from the customer, the pull system noted earlier.
Implementing JIT has several benefits that primarily fall into four general areas
[5]: inventory turnover improvement, customer-service improvement, warehouse-
space reduction, and response-time improvement.
Unreliablesuppliers
Volatiledemand
BottlenecksInaccurateforcasts
Qualityproblem
Figure 4.1 Hidden problems as a result of holding extra inventory [3].
56 Logistics Operations and Management

Lean Manufacturing
As a term, lean manufacturing was first used by Womack et al. in their book The
Machine That Changed the World in 1990. The book is about the techniques and
concepts developed by Taiichi Ohno at Toyota. The goal of lean manufacturing is
reducing “waste” with the goal of total elimination. According to Russell and
Taylor [6], waste is “anything other than the minimum amount of equipment, mate-
rials, parts, space, and time that are essential to add value to the product.”
Lean methods target eight types of waste [7]:
1. Defects: money and time wasted for finding and fixing mistakes and defects
2. Over-production: making products faster, sooner, and more than needed
3. Waiting: time lost because of people, material, or machines waiting
4. not using the talent of our people: not using experiences and skills of those who know
the processes very well
5. Transportation: movement of people, materials, products, and information
6. Inventory: raw materials, works in process (WIP), and finished goods more than the one
piece required for production
7. Motion: Any people and machines movements that add no value to the product or service.
8. Over-processing: Tightening tolerances or using better materials than what are necessary.
These wastes can be seen in all logistics activities such as distribution and ware-
housing. In other words, waste is anything that adds no value to a product or service.
Sometimes, more than 90% of a firm’s overall activities are non-value added [8].
In lean manufacturing, paradigms change from conventional “batch and queue” to
“one-piece flow” [9]. In fact, lean manufacturing combines best features of both mass
production and craft production, which means it intends to reduce cost and improve
quality while increasing diversity of production [1,10]. Lean manufacturing leads to
improved product quality and production levels; reduced cycle time, WIP, inventories,
and tool investment; improved on-time delivery and net income; better space, machine,
and labor utilization; decreased costs; and quicker inventory investment [10].
Lean Manufacturing Tools
Various methods and tools are developed for lean implementation. We briefly
describe the following five core lean methods: the kaizen rapid-improvement process,
5S, total productive maintenance (TPM), cellular manufacturing, and Six Sigma.
Kaizen means continuous improvement in Japanese. The kaizen rapid-improve-
ment process is the foundation of lean manufacturing. It holds that by applying
small but incremental changes routinely over a long period of time, a firm can real-
ize considerable improvements. Kaizen involves workers from all levels of an orga-
nization in addressing a specific process and identifying waste in this process.
After finding possible wastes, the team tries to find solutions to eliminate them and
then quickly apply chosen solutions, often within 3 days. After implementing
improvements, periodic events ensure that this improvement is sustained over time.
Standing for sort, set in order, shine, standardize, and sustain, 5S tries to reduce
waste and optimize productivity by maintaining an orderly workplace [11]. Sort
57Logistics Philosophies

means removing every nonessential item from the workplace. Set in order implies
that everything should have a specific place and should always be in the place
unless it is being used. Shine means cleaning the plant and equipments.
Standardize is the process of making people accustomed to the first three S’s, and
sustain means keeping 5S operating over time. The 5S philosophy encourages
workers to maintain their workplace in good condition and ultimately leads reduced
waste, downtime, and in-process inventory. The 5S implementation can also signif-
icantly reduce the space required for operations [12].
TPM reaches effective equipment operation by involving all workers in all
departments. The most important concept of TPM is autonomous maintenance,
which trains workers to be in charge of and take care of their own equipment and
machines. TPM tries to eliminate breakdowns, the time spent on equipment setup
or adjustment, and lost time in equipment stoppages and to minimize defects,
reworks, and yield losses [10].
Cellular manufacturing is the actual practice of the pull system. The ideal cell is
basically a pull system in which one piece is pulled by each machine as it needs
the piece for manufacturing [11]. All of the machines needed for a process are
gathered as a group into one cell. Using cellular manufacturing offers different
advantages such as reduced WIP between machinery, low lead time to customers,
reduced waste, and more flexibility. In a cell, when a defect occurs, only one prod-
uct is defective, and it can be immediately caught. As soon as a defective part is
seen, the operator starts repairing it, which leads to reduced scrap. In addition,
using cells can shorten lead times. For example, if a customer’s order is less than
the usual company batch, the order can be delivered the moment it has been com-
pleted. In conventional manufacturing, however, the customer must wait until the
company batch is completed before the order is shipped.
Developed by Motorola in the 1990s, Six Sigma uses statistical quality-control
techniques and data-analysis methods. Six Sigma uses a set of methods that analyze
processes systematically and reduce their variations, ultimately leading to continu-
ous improvement. At the Six Sigma quality level, there will be about 3.4 defects
per million, which signifies high quality and low variability of process [13].
4.1.3 Lean Principles
Five principles are basic pillars in the lean philosophy [14,15]:
1. Identifying customer value
2. Managing the value stream
3. Developing a flow production
4. Using pull techniques
5. Striving to perfection
Identifying Customer Value
Value is an important and meaningful term in the lean context, meaning something
that is worth paying for in a customer’s point of view [14]. Therefore, the first step
58 Logistics Operations and Management

in specifying this value is demonstrating a product’s capabilities and its offered
price.
Managing the Value Stream
Once value is identified, all required steps that create this value must be specified.
Wherever possible, steps that do not add value must be eliminated.
Making Value-Adding Steps Flow
Making steps flow means specifying steps so that there is no waiting time, down-
time, or other general waste within or between the steps.
Using Pull Techniques
Fulfilling customer needs means supplying a product or service only when the cus-
tomer wants it. The following types of waste are eliminated by using pull techni-
ques: Designs that are out of date before the product is completed, finished goods,
inventories, and leftovers that no one wants.
Striving to Perfection
By repeatedly implementing these four steps, perfect value is ultimately created
and there is no waste.
Using these principles is key in making an activity lean. These principles are
also called lean thinking. With this thinking, any tiny change may lead to waste. A
good example is changing the placement of a waste bin in a plant. After awhile
workers get used to the placement of the bin and blindly throw their wastes in it
without searching for it. When the bin’s place is changed, however, workers have
to find the bin first, which is time consuming, even if it is just a few seconds. In
lean thinking, these seconds are waste. The ultimate goal is to eliminate them.
4.1.4 Lean Warehousing: Cross Docking
Warehousing has four major tasks: receiving, storage, order picking, and distribu-
tion. Among these four tasks, storage and order picking are the most costly.
Storage requires inventory holding (one of the eight kinds of wastes), and order
picking needs a lot of labor work hours (which is mentioned as motion in different
kinds of wastes). To eliminate these wastes and produce a lean warehouse, the
cross-docking concept was developed. A cross dock is just like a warehouse in
which only receiving and delivering freight is being done.
Shipments will be transferred directly from incoming trucks to outgoing ones
without any long-term storage. These loads are delivered to receiving doors, sorted,
consolidated with other products for each destination, and loaded onto outgoing
trucks at shipping doors. The whole process is done in less than 24 hours in a typi-
cal cross dock.
59Logistics Philosophies

Companies such as American Freightways, Yellow Transport, and Old
Dominion Freight Lines operate hundreds of cross docks in North America. Some
retailers such as WalMart and Home Depot also operate cross docks.
Cross docks also function as a place to consolidate loads and thus reduce trans-
portation costs. As illustrated in Figure 4.2, suppose two suppliers serve four custo-
mers. Direct-shipment suppliers may undertake extra costs as a result of a less than
truckload (LTL) for each customer. Using a cross dock as a consolidation center
reduces the number of LTLs and sends more truckloads (TLs) to retailers, substan-
tially reducing transportation costs.
Types of Cross Docking
Napolitano [16] classifies the different types of cross docks as follows.
� A manufacturing cross dock is used to receive and consolidate supplies.� A distributor cross dock consolidates products from different suppliers and delivers them
to customers.� A transportation cross dock consolidating LTLs from different suppliers to reach eco-
nomic shipments.� A retail cross dock receives, sorts, and sends products to different retail stores.
Cross docks can also be divided based on assigned or unassigned information:
predistribution and postdistribution[17]. In a predistribution cross dock, the desti-
nations are already determined and their orders are prepared by vendors for direct
shipment. In this kind of cross dock, shipments that are already price tagged or
labeled are transferred directly into outgoing trucks. In postdistribution operations,
the cross dock must assign freights to each destination to make them ready for
shipping by price tagging, labeling, and so on, which means higher labor costs and
more floor space for the distributor.
Cross docks can also be classified based on the method of freight staging.
According to Yang et al. [18], there are single-stage, two-stage, and free-stage
LTL
LTL LTL
LTL
LTL LTL LTL LT
L
Customer
CustomerCustomer
Customer
Supplier #2
Supplier #1
(A)
Customer
Cross dock
Customer
CustomerCustomer
Supplier #2
Supplier #1
LTL
LTL
TL
TLTL
TL
(B)
Figure 4.2 Direct shipment versus cross docking: (A) direct shipment and (B) cross dock as
a consolidation center.
60 Logistics Operations and Management

methods. In a single-stage method, one staging lane is devoted to each receiving or
shipping door, and shipments are placed into these staging lanes. In a two-stage
method, the shipments are unloaded in receiving doors and put directly in a receiv-
ing door’s stage lines. In the center of the cross dock, shipments are resorted and
repacked into the staging lines of the shipping doors. In a free-staging cross dock,
there are no lanes or queues in which freights are placed and pulled to shipping
doors. Instead, near the receiving or shipping doors, freights are resorted and
repacked. Figure 4.3 depicts a two-stage cross dock [19].
Product Selection
Generally, products that can easily be handled with low variance and high volume
are the most suitable for cross docking [17].
For supply and demand to be matched, demand for shipments must be certain or
at least have low variance. If demand has high variance, then cross docking is not
suitable.
As cross docking needs frequent shipments that force expenses to system,
demand for shipments must be high enough to justify extra expenses.
Shipping
Sorting
Receiving
Figure 4.3 Two-stage cross-dock structure [19].
61Logistics Philosophies

Cross-Dock Design
There are two important parameters in cross-dock design: size and shape. The first
decision is the number of doors. Generally, doors are devoted to one of the two fol-
lowing types of trailers [20]:
� Incoming (receiving), from which freight must be unloaded� Outgoing (shipping), in which freight must be loaded
Typically, once the number of destinations of a cross dock is known, the
number of outgoing doors needed is easily determined. The number of doors
required for each destination depends on its freight flow. Destinations with a
higher flow may need more than one door. The number of shipping doors thus
equals the number of destinations the cross dock serves multiplied by their
needed doors.
To determine the number of receiving doors needed, more issues must be
addressed. In some retail cross docks, extra operations such as packaging, pricing,
or labeling need the same number of doors in each side of the cross dock, with
receiving doors devoted to one side and shipping doors to the other. For distribu-
tors’ cross docks, which generally do no value-added processing and are just a
place to consolidate freights, the number of receiving doors can be estimated by
Little’s law: unloading mean time multiplied by trailer throughput [21]. Unloading
is relatively easier than loading. “A good rule of thumb is that it takes twice as
much work to load a trailer as it does to unload it” [20]. To achieve a smooth flow
without bottlenecks, there could be either twice as many outgoing doors as incom-
ing doors or more assigned workers to load each trailer.
The next important factor is cross-dock shape. According to Bartholdi and Gue
[21], most cross docks are I shaped like a long rectangle, but there are also cross docks
in other shapes such as an L (as in Yellow Transportation, Chicago Ridge, IL), a U
(as in Consolidated Freightways, Portland, OR), a T (American Freightways, Atlanta,
GA), an H (Central Freight, Dallas, TX), and an E. Bartholdi and Gue also showed
that design has an important impact on cross-dock costs. I shapes were best for cross
docks with fewer than 150 doors, T shapes for cross docks with 150�250 doors, and
H shapes for more than 250 doors.
The shape of a cross dock also depends on many issues such as the shape of the
land on which the cross dock will be placed, the patterns of freight flows, and the
material-handling systems within the facility [20].
In addition to the shape of cross dock, the location of cross dock and how it is
related to its connections have a considerable effect on its success.
4.2 Agile Logistics
According to Christopher and Towill, “Agility is a business-wide capability that
embraces organizational structures, information systems, logistics processes and, in
particular, mindsets” [22].
62 Logistics Operations and Management

The European Agile Forum (2000) defined agility as follows: “Agility is the
ability of an enterprise to change and reconfigure the internal and external parts of
the enterprise—strategies, organization, technologies, people, partners, suppliers,
distributors, and even customers in response to change unpredictable events and
uncertainty in the business environment.”
Flexibility is the pivot characteristic of an agile organization [23]. In fact, agile
philosophy is the extension of a flexible manufacturing system (FMS) in broader
business frameworks. FMSs are systems in which scheduling, routing, controlling,
and so on are mostly done by computers in order to achieve high levels of flexibil-
ity in response to market changes.
4.2.1 Agile versus Lean
Agility is different from leanness, and these two concepts should not be confused.
Lean means containing little or even no fat, but agile means nimble. As mentioned
before, lean focuses on eliminating waste. In fact, “it deals with doing more with
less” [22], whereas agile is the ability to adapt to market changes and to keep
track.
According to Naylor et al. [24], agility means “using market knowledge and a
virtual corporation to exploit profitable opportunities in a volatile marketplace.”
They defined leanness as “developing a value stream to eliminate all kinds of
wastes, including time, and to enable a level schedule.”
Mason-Jones et al. [25] differentiated leanness and agility by means of two
important concepts: market qualifier and market winner. To enter a competitive
market, it is important and also necessary to understand what baselines—market
qualifiers—this market has. The criterion for being a winner in this market is called
the market winner. As you can see in Table 4.1, lean philosophy is most promising
when the market winner is cost, but agile is appropriate when service level is the
market winner.
Lean and agile have many different attributes. Agile is stronger when a market
is volatile, dealing with a high variety of products with short life cycles. To apply
lean, a market should be predictable and have a smaller variety of products with
long life cycles. Table 4.2 compares agile and lean with their distinguishing attri-
butes [25].
Table 4.1 Market Qualifier and Market Winner for Agile and Lean Supply [25]
Market Qualifiers Market Winners
Lean Supply Quality Cost
Lead time
Service level
Agile Supply Quality Service level
Cost
Lead time
63Logistics Philosophies

In another comparison, Christopher [23] compares lean and agile from the points
of view of volume and variety (Figure 4.4). According to him, agility works well in
less-predictable environments with unstable demand and high variety. Needless to
say, it is vital to be fast (or agile) in such environment in response to demand. An
example of this environment is the fashion industry. The volume of fashion goods is
low, but the variability is high. Lean is best in predictable environments with high
volume and low diversity. Routine goods such as groceries and household stuff are
good examples of merchandise when the lean philosophy is preferred.
4.2.2 Quick Response
McMichael et al. [26] define quick response (QR) as “a customer-driven business
strategy of cooperative planning by supply-chain partners to ensure that the right
goods are in the right place at the right time, using IT and flexible manufacturing
to eliminate inefficiencies from the entire supply chain.”
As a strategy in the retail sector, QR uses a number of tactics to improve inven-
tory management and efficiency as well as speed inventory flow [4]. The funda-
mental idea of QR is that to exploit the advantages of markets that are time
based, it is necessary to develop systems that are responsive and fast [3]. Reducing
inventory levels and lead times and increasing the accuracy of forecasting are the
Table.4.2 Comparison of Lean and Agile by Their Distinguishing Attributes [25]
Distinguishing Attributes Lean Supply Agile Supply
Typical products Commodities Fashion goods
Marketplace demand Predictable Volatile
Product variety Low High
Product life cycle Long Short
Customer drivers Cost Availability
Profit margin Low High
Dominant costs Physical costs Marketability costs
Stock-out penalties Long-term contractual Immediate and volatile
Purchasing policy Buy goods Assign capacity
Information enrichment Highly desirable Obligatory
Forecasting mechanism Algorithmic Consultative
Hi
Lo
Agile
Lean
Lo
Var
iabi
lity
VolumeHi
Figure 4.4 Comparison of lean and agile based on
variety and volume [23].
64 Logistics Operations and Management

main purposes of QR [27]. This strategy is suitable for highly engineered products
and can be used by firms that produce large amounts of variable products [28].
For Christopher, “The logic behind QR is that demand must be captured in as
close to real time as possible and as close to the final consumer as possible” [3],
which is the most reliable information for the next logistics responses and deci-
sions. Whole decisions are made directly based on this information.
One of the most important things that made QR possible is the development of
information technology. In fact, QR keeps information instead of inventory. QR
uses information technologies such as electronic data interchange (EDI), bar cod-
ing, electronic point of sale (EPOS), and laser scanners to quickly track customer
sales. This information will be really helpful for manufacturers who are in charge
of production scheduling and delivery. If there is a good response time by using a
cross dock instead of a warehouse, then implementing QR can lead to inventory
reduction.
Implementation of QR can benefit both suppliers and retailers. Giunipero et al.
[29] cite cost reduction, reduced stock inventory, stock-turnover increases, and cus-
tomer-service improvement as retailers benefits. Predictable production cycles, fre-
quent orders, reduced costs, and closer relationships with retailers are supplier
benefits. QR advantages are most significant in environments where a high level of
service is targeted. Applying QR has a high fixed cost (because of the required
information technologies), the increment of cost is low when service level
improves. Figure 4.5 depicts this concept [3].
As shown, in lower levels of service, cost of implementing QR is high as a
result of high-level information technology. However, by improving service level,
the increment of QR cost is lower than keeping inventory. When the strategy of a
market is to keep extra inventory in order to have a better service level, the amount
of stored inventory must be higher, so its cost increases exponentially. After a cer-
tain level of service, QR cost is much lower than keeping inventory. It shows that,
as a strategy of agile philosophy, QR concentrates on service level more than any
other parameter. Whenever service level is an important key factor in a market, QR
is an appropriate strategy.
Fashion and apparel industries have widely used QR. This strategy is appropriate
in these fields because in these industries high service levels are demanded and
inventory holding is not a suitable solution because of storage costs. Consider a
hypothetical chain of fashion stores. Each of several thousand stores in the chain
tracks consumer preferences daily using its point-of-sale data, which indicate
Cos
t
Service level
InventoryQR
Figure 4.5 QR versus traditional inventory-based
systems [3].
65Logistics Philosophies

orders. Based on the information gathered, orders will be sent by satellite links to
suppliers around the world. These orders will be consolidated in one place, and
ultimately goods are flown back to the chain’s distribution center. The consolida-
tion center may even be on another continent, with shipments done by planes or
ships. At the distribution center, the goods are price marked and restored for imme-
diate delivery to the retail stores. All of this process will take place in 4�6 weeks,
a time period that cannot be achieved in conventional systems.
Efficient Consumer Response
Development of the QR strategy in the fashion industry encouraged the develop-
ment of the efficient consumer response (ECR) strategy, which has the same con-
cepts as QR in the grocery industry [27]. The Europe Executive Board expresses
the ECR as “working together to fulfill consumer wishes better, faster, and at less
cost.” ECR emphasizes cooperation between distributors and manufacturers, and its
goal is to create a customer-driven system with high levels of consumer satisfaction
and low levels of costs [30].
The main purpose of ECR is to provide efficient replenishment that is achieved
by reducing stock holdings, making stock ranges more practical by indicating the
dimensions of goods, improving space allocation, and introducing new products
effectively [31].
According to Casper (1994), ECR includes the following strategies:
� EDI usage between suppliers and manufacturers, manufacturers and distributors, and dis-
tributors and customers� Use of more accurate bar coding system and better exploitation of point-of-sale data� Mutual close relationship between manufacturers, distributors, suppliers, and customers� Continuous inventory replenishment� Improved product management and development
ECR concepts and its implementation benefits have been known since the early
1990s [31,32], but it is not as widespread as expected. Although many firms in the
grocery sector are using ECR-related concepts, most of them are not applying the
total ECR concept, either not considering certain elements or only partly imple-
menting them [33].
Barriers of implementing ECR are mostly organizational [30]. Haben [34]
argues that these organizational obstacles could be both cultural and functional. He
believes that traditional top-down organizations in which every function is operated
separately, and measurement systems which assess efficiency of parts individually
without attention to whole system, are the major impediments of ECR implementa-
tion and building trust between different parts.
4.2.3 Vendor-Managed Inventory
Vendor-managed inventory (VMI), also called co-managed inventory (CMI), is an
agreement in which monitoring, planning, and managing inventory is done by the
66 Logistics Operations and Management

supplier in exchange with real-time information. In fact in VMI, retailer provides
vendor with real time point of sale data and instead vendor takes the responsibility
of monitoring, holding and managing inventory for retailer.
VMI was first implemented in the 1980s by WalMart and Procter & Gamble
[35]; after that, many other companies from different industries used it. VMI’s
most important features are short replenishment lead times and frequent and punc-
tual deliveries that optimize production and transport scheduling [36].
In traditional systems, customers place orders on their suppliers. Although this
seems logical, significant inadequacies magnified the need for efficient systems.
Conventional systems are mostly based on forecasting because suppliers have
no advance warning of orders; as a result, a supplier must carry unnecessary safety
stocks. However, the supplier often encounters unforeseen orders, which leads to
frequent changes of their production and distribution schedules [3]. Thus, custo-
mer’s real-time information substitutes for orders; instead, the supplier takes the
responsibility for monitoring and managing the customer’s inventory.
VMI system has benefits for both supplier and customer. Benefits for customers
are higher product availability and service level and diminished stock-out risk,
while inventory levels and monitoring and managing costs are reduced significantly
[35,37].
As suppliers have access to demand and inventory data, planning and scheduling
of production, distribution, and replenishment can be done better [38], and ulti-
mately the potential for stock outs is significantly reduced. VMI can also lead to
the appropriate use of production capacity [35] and a reduction in the bullwhip
effect [39,40].
References
[1] J. Womack, D.T. Jones, D. Roos, The Machine That Changed the World, Macmillan,
New York, 1990.
[2] A.S. Sohal, Developing a lean production organization: an Australian case study, Int. J.
Oper. Prod. Man. 16 (1996) 91�102.
[3] M. Christopher, Logistics and Supply Chain Management: Strategies for Reducing Cost
and Implementing Service, second ed., Financial Times Prentice Hall, Harlow, 1998.
[4] D.M. Lambert, L.M. Ellram, J.R. Stock, Fundamentals of Logistics Management,
McGraw-Hill, Boston, MA, 1998.
[5] R.C. Lieb, R.A. Miller, Why U.S. companies are embracing JIT, Traffic Manage.
(1990, November) 30�39.
[6] R.S. Russell, B.W. Taylor, Operations Management, second ed., Prentice-Hall, Upper
Saddle River, NJ, 1999.
[7] B.K. Brashaw, J. McCony, Lean manufacturing concepts applied to logging businesses,
in Logger Conference, Minnesota Logger Education Program, 2007.
[8] S. Caulkin, Waste not, want not, The Observer September 8(Sunday) (2002).
[9] Ross & Associates Environmental Consulting. Lean manufacturing and the environ-
ment. Available online at: http://www.epa.gov/lean/leanreport.pdf, 2009.
67Logistics Philosophies

[10] S.J. Pavnaskar, J.K. Gershenson, A.B. Jambekar, Classification scheme for lean
manufacturing tools, Int. J. Prod. Res. 41 (2003) 3075�3090.
[11] B. Carreira, Lean Manufacturing That Works: Powerful Tools for Dramatically
Reducing Waste and Maximizing Profits, AMACOM, USA, 2004.
[12] US Environmental Protection Agency Official Website. Lean report. Available online
at: http://www.epa.gov/lean/thinking/tpm.htm, 2009.
[13] M.L. George, D. Rowlands, M. Price, J. Maxey, The Lean Six Sigma Pocket Tool
Book: A Quick Reference Guide to 100 Tools for Improving Quality and Speed,
McGraw-Hill, New York, 2005.
[14] J. Womack, D. Jones, Lean Thinking: Banish Waste and Create Wealth in Your
Corporation, Simon & Schuster, UK, 1996.
[15] B. Kollberg, J.J. Dahlgaard, P. Brehmer, Measuring lean initiatives in health care ser-
vices: issues and findings, Int. J. Prod. Perform. Manag. 56 (2007) 7�24.
[16] M. Napolitano, Making the move to Cross Docking, Warehousing Education and
Research Council, Illinois, US, 2000.
[17] K.R. Gue, Cross Docking: Just-In-Time for Distribution, Teaching Notes-Naval
Postgraduate School, Monterey, CA, 2001.
[18] K.K. Yang, J. Balakrishnan, C.H. Cheng, An analysis of factors affecting cross docking
operations, J. Bus. Logist. Available online at: http://findarticles.com/p/articles/mi_qa
3705/is_201001/ai_n53508826/, 2010.
[19] J.J. Bartholdi, K.R. Gue, K. Kang, Staging freight in a cross dock, in: Proc.
International Conference on Industrial Engineering and Production Management, May,
Quebec City, Canada, 2001.
[20] J.J. Bartholdi, S.T. Hackman, Warehouse and Distribution Science, Available online
at: http://www2.isye.gatech.edu/Bjjb/wh/book/xdock/xdoc.html, 2006.
[21] J.J. Bartholdi, K.R. Gue, The best shape for a cross dock, Transport. Sci. 38 (2004)
235�244.
[22] M. Christopher, D.R. Towill, Supply chain migration from lean and functional to agile
and customized, Supply Chain Manag. 5 (2000) 206�213.
[23] M. Christopher, The agile supply chain competing in volatile markets, Ind. Market.
Manag. 29 (2000) 37�44.
[24] J.B. Naylor, M.M. Naim, D. Berry, Leagility: interfacing the lean and agile manufactur-
ing paradigm in the total supply chain, Int. J. Prod. Econ. 62 (1997) 107�118.
[25] R. Mason-Jones, J.B. Naylor, D.R. Towill, Engineering the leagile supply chain, Int. J.
Agile Manag. Syst. 2 (2000) 54�61.
[26] H. McMichael, D. Mackay, G. Altman, Quick response in the Australian TCF industry:
a case study of supplier response, Int. J. Phys. Dist. Log. Manag. 30 (2000) 611�626.
[27] G. Birtwistle, C.M. Moore, S.S. Fiorito, Apparel quick response systems: the manufac-
turer perspective, Int. J. Log. Res. Appl. 9 (2006) 157�168.
[28] R. Suri, Quick response manufacturing: a competitive strategy for the 21st century, in:
POLCA Implementation Workshop, 2002.
[29] L.C. Giunipero, S.S. Fiorito, D.H. Pearcy, D. Dandeo, The impact of vendor incentives
on quick response, Int. Rev. Retail Distrib. Consum. Res. 11 (2001) 359�376.
[30] Kurt Salmon Associates, Inc., Efficient Consumer Response: Enhancing Consumer
Value in the Grocery Industry, Food Marketing Institute, Washington, DC, 1993.
[31] J. Fernie, Quick response: an international perspective, Int. J. Retail Distrib. Manag. 24
(1994) 1�12.
68 Logistics Operations and Management

[32] Kurt Salmon Associates, Efficient Consumer Response: Enhancing Consumer Value in
the Grocery Industry, The research department of Food Marketing Institute,
Washington, 1993.
[33] J. Aastrup, H. Koztab, D.B. Grant, C. Teller, M.A Bjerre, Model for structuring effi-
cient consumer response measures, Int. J. Retail. Distrib. Manag. 36 (2008) 590�606.
[34] T.J. Haben, Food industry innovation: efficient consumer response, Agribusiness 14
(1998) 235�245.
[35] M.A. Waller, M.E. Johnson, T. Davis, Vendor-managed inventory in the retail supply
chain, J. Bus. Logist. 20(1) (1999) 183�203.
[36] A. De Toni, E. Zamolo, From a traditional replenishment system to vendor-managed
inventory: a case study from the household electrical appliances sector, Int. J. Prod.
Econ. 96 (2004) 63�79.
[37] D.D. Achabal, S.H. McIntyre, S.A. Smith, K. Kalyanam, A decision support system for
vendor managed inventory, J. Retail. 76 (2000) 430�454.
[38] S. Cetinkaya, C.Y. Lee, Stock replenishment and shipment for vendor managed inven-
tory systems, Manag. Sci. 46 (2000) 217�232.
[39] H. Lee, V. Padmanabhan, S. Whang, The bullwhip effect in supply chains, Sloan
Manag. Rev. 38 (1997) 93�102.
[40] S.M. Disney, D.R. Towill, Vendor-managed inventory (VMI) and bullwhip reduction in
a two level supply chain, Int. J. Oper. Prod. Man. 23 (2003) 625�651.
69Logistics Philosophies

This page intentionally left blank

5 Logistics Parties
Seyed-Alireza Seyed-Alagheband
Department of Industrial Engineering, Amirkabir University of Technology,Tehran, Iran
Logistics outsourcing has attracted the attention of lots of industrialists in recent
years. As a result, having long-term relationships with logistics parties seems to
find its undeniable place in today’s growing extent of outsourcing affairs. Third-
party logistics (3PL), in particular, has received substantial attention from logistics
experts, leading to a great deal of research in this area. Furthermore, improved ver-
sions of logistics parties, especially fourth parties, are growing with high speed.
Because of its importance, this chapter is dedicated to the introduction and general
implications of logistics parties.
Logistics is basically the concept of how to deal with the movement and storage
of materials or products that results in the highest consumer satisfaction [1]. The
modern form of logistics concept dates back to the second half of the twentieth
century. During the past several years, this field has obtained greater importance
and has been theoretically and practically extended.
The logistics evolution requires that decision makers have a comprehensive and
updated vision on the concept. The decision environment has become extensively
complex with factors such as new management strategies and business models,
global markets and sourcing, information technology (IT), new trends of customer
satisfaction, and new transport-service options.
In most developed economies, the costs of logistics management are steadily
growing, indicating an increasing proportion of the gross national product. Logistics
costs have become an important part of the value of products, and logistics manage-
ment is regarded as an important role in the international competitive market [2].
Logistics outsourcing is one of the issues that a firm has to consider about the
efficiency and benefit outsourcing brings to the company. The decision to out-
source logistics activities brings about the use of other companies to handle logis-
tics affairs such as transportation and warehousing.
Logistics outsourcing is not a new trend. In the 1950s and 1960s, transportation
and warehousing were commonly outsourced. This outsourcing was a pure com-
modity purchase, and logistics as an activity was rarely a part of a company’s busi-
ness strategy. By the 1970s, as companies began to emphasize cost reduction and
improved productivity, they started to look for multicompetency providers for out-
sourcing. The long-term relationship became more common, and service providers
Logistics Operations and Management. DOI: 10.1016/B978-0-12-385202-1.00005-0
© 2011 Elsevier Inc. All rights reserved.

began to set up dedicated facilities for some of their clients. Those service provi-
ders are called 3PLs. In the early 1980s, companies began to emphasize supply-
chain optimization, but it was mostly restricted to isolated operations within their
own organizations. Businesses focused on coordinating the movement of products
within their facilities, integrating their financial system, ordering systems, and
developing in-house inventory management. As a result, the range of services
offered by logistics service providers (LSPs) also increased [3].
In the 1990s, by the advent of Internet and the emergence of global sourcing, logis-
tics industry introduced a new generation of LSPs called fourth- and fifth-party logis-
tics (4PLs and 5PLs). Today, virtual logistics departments, called zero-party logistics,
are able to handle most or all of the logistics activities using an integrated information
chain between buyers and carriers. Figure 5.1 demonstrates types of logistics parties.
Looking at the growth trend of logistics parties demonstrates the increasing atten-
tion and investments of firms on logistics outsourcing. Therefore, this chapter sup-
ports the decision to choose logistics activities to outsource, select suitable parties
for partnership, and cooperate with logistics parties.
This chapter is organized as follows. Section 5.1 provides an overview and
applications on the concept of 3PLs. In Section 5.2, new generations of logistics
parties, including 4PL and 5PL, are investigated. Section 5.3 provides an in-depth
study on the concept of 3PLs. Section 5.4 offers concluding remarks.
5.1 Third-Party Logistics: An Overview
5.1.1 Why 3PLs?
3PLs emerged in the early 1990s when LSPs started offering consolidated services
and an increasing number of customers entered into longer business contracts with
5PL
4PL
3PL
2PL
1PL
E-business
Management of allparties of the supplychain in conjunctionwith e-business
Management of thewhole supply chain
Management ofcomplex service chains
Operating of logisticsby the own buyer
Operating of logisticsby the producer
Supply chainmanagement
Forwarding/contractlogistics
Buyer
Producer
Figure 5.1 Types of logistics parties.
72 Logistics Operations and Management

the LSPs. The total logistics market in 2003 in the United States was $910 billion,
and the 3PL market was around $65 billion. The 3PL market has been increasing
for the last 10 years at a rate of more than 20%. A survey of 221 US companies
reported that 78% of them are using 3PLs for logistics services and spending 49%
of their logistics expenditure on outsourcing [3].
The 3PL business is developing as a result of the increasing demand of
advanced logistics services, including globalization, lead-time reductions, customer
orientation, and outsourcing. Therefore, the role of logistics providers is changing
both in content and in complexity and brings about the development of new logis-
tics providers who offer various services to their customers [4].
The growth rate of 3PL industry and the increasing interest in outsourcing logistics
activities illustrates the growing importance of the 3PL role in the industry, thus mak-
ing it an interesting research field for further investigation and development.
5.1.2 Definition
Terms such as logistics outsourcing, logistics alliances, third-party logistics, con-
tract logistics, and contract distribution have been used to describe the organiza-
tional practice of contracting out part of or all logistics activities that were
previously performed in-house [5]. Unfortunately, no single consistent definition
for the 3PL concept can be found in the 3PL literature. In some cases, 3PL is used
as a label for traditional outsourcing of transportation or warehousing; in other
cases, the term is used to account for the outsourcing of a wider logistics process.
In 1992, Lieb defined 3PL in the following sentences: “Third-party logistics are
external companies which perform logistics functions that have traditionally been
performed within an organization. The functions performed by the third party can
encompass the entire logistics process or selected activities within that process”
[6]. This definition suggests that all logistics activities that were previously per-
formed in a firm can be performed in an external organization. In such broad defi-
nitions, however, some terms and conditions such as the type of logistics activities
are not mentioned.
Narrower definitions express functional or interorganizational features of the
logistics outsourcing. For example, in 1999, Berglund et al. [7] suggested the fol-
lowing definition:
Third-party logistics are activities carried out by a logistics service provider per-
forming at least management and execution of transportation and warehousing. In
addition, other activities like inventory management, information related activities,
value added activities, or supply chain management can be managed by the logis-
tics service provider. The contract is also required to include management, analyti-
cal or design details, and the length of the cooperation should be at least one year.
Such narrower definitions appear to draw a line between 3PL and the traditional
outsourcing of logistics functions, providing more distinctive features for 3PLs
including the provision of a broader range of services, a long-term duration, the
customization of the logistics solution, and a fair sharing of benefits and risks [8].
73Logistics Parties

5.1.3 Emergence of 3PLs
According to a survey conducted by Berglund et al. in 1999 [7], there are three
waves of entrants into the 3PL market. The first wave dates back to the 1980s or
even earlier with the emergence of what are called traditional LSPs. Companies
such as ASG in Sweden and Frans Maas in the Netherlands are examples of tradi-
tional 3PLs. The 3PL activities of these companies have emerged from a tradition-
ally strong position in either transportation or warehousing.
The second wave dates from the early 1990s when a number of network players,
mainly parcel and express companies such as DHL, TNT, and UPS, started their
3PL activities. Usually, the 3PL activities of these companies are based on their
worldwide air-express networks and their experience with expedited freight.
The third wave dates from the late 1990s. Currently, a number of players enter-
ing the 3PL market can be seen from areas such as IT, management consultancy,
and financial services. These players are working together with players from the
first and second waves. In most cases, several shippers and providers are involved.
Whereas the first and second wave entrants base their strength on traditional
logistics activities such as transportation, warehousing, or running a scheduled net-
work, these new players build on very different skills such as IT, consultancy, or
financial expertise. In other words, there is a gradual shift from asset-based players
to skill- or systems-based players [7].
5.1.4 Activities of 3PLs
3PLs services can be relatively limited or comprise a fully integrated set of logis-
tics activities. A 3PL can perform the following activities: transportation, ware-
housing, freight consolidation and distribution, product marking, labeling and
packaging, inventory management, traffic management and fleet operations, freight
payments and auditing, cross docking, product returns, order management, packag-
ing, reverse logistics, carrier selection, rate negotiation, and logistics information
systems [9].
Detailed 3PL activities, including global functions, include the following [10]:
� Planning functions
� Location selection
� Supplier selection
� Supplier contracting
� Scheduling� Equipment functions
� Selection
� Allocation
� Sequencing
� Positioning
� Inventory control
� Ordering
� Repair
74 Logistics Operations and Management

� Terminal functions
� Gate checks
� Location control� Handling functions
� Pickup
� Consolidation
� Distribution
� Expediting
� Diversion
� Transloading� Administrative functions
� Order management
� Document preparation
� Customs clearance
� Invoicing
� Inventory management
� Performance evaluation
� Information services
� Communications� Warehousing functions
� Receiving
� Inventory control
� Reshipment� Pre/Post production
� Sequencing
� Assorting
� Packaging
� Postponement
� Marking� Transportation functions
� Modal coordination
� Line-haul services
� Tracking and tracing
According to a survey conducted by Aghazadeh in 2003, users in 2000 relied most
heavily on third parties for warehousing management (56%), transportation services
(49%), and shipment consolidation (43%). The use of traditional logistics services
offered by 3PLs has remained relatively stable in recent years; however, there is an
emerging interest from manufacturers for nontraditional applications of 3PLs [1].
5.1.5 Advantages and Disadvantages of 3PL
Firms interested in outsourcing their logistics activities should be familiar with the
pros and cons of establishing relationships with 3PLs.
The 3PL can effectuate a great degree of efficiency by exploiting economies of
scale among others. Capacity can be better utilized because the peaks and drops in
transport quantities offered by different clients can be counterbalanced and because
backhauls are often available. A 3PL can invest in specific know-how because
75Logistics Parties

logistics management is its core activity. The 3PL can improve the quality and
flexibility of service and thus improve customer service [2].
By outsourcing logistics activities, firms can reduce the amount of capital
investments. Some firms spend much on physical distribution centers or informa-
tion networks, which also involves financial risks. 3PL providers can spread such
risks by outsourcing to subcontractors.
Other advantages of partnership with 3PLs include expanded ranges of service, bar-
gaining power, faster learning, networking with other providers, knowledge of various
kinds, faster implementation of new systems, improved customer satisfaction, restruc-
turing of supply chains, reduced investment base, and smoother production [4].
Despite the numerous advantages of using 3PL, there are some disadvantages as
well. For instance, it is not easy to establish a reliable and cost-effective partnership
between the shipper and the 3PL provider. To establish reliable partnership, efforts
should be made in two directions: 3PL provider selection and contract signing [11].
If a manufacturer contracts out logistics activities, it runs the risk of losing
expertise in logistics. In addition, manufacturers contracting out their logistics
activities are often worried about the protection of company information because
they have to share confidential data [2].
In a comprehensive manner, using 3PL services will lead an organization to the
following:
� Save time� Share responsibility� Reengineer distribution networks� Focus on core competencies� Exploit external logistical expertise� Reduction in inventory levels, order cycle times, and lead times� Economies of scale and scope� Improved efficiency, service, and flexibility
The following list, however, shows some possible disadvantages of cooperation
with 3PLs:
� Poor searching efforts� Poor coordination efforts� Poor information sharing� Loss of control� Poor service performance� Inadequate provider expertise� Inadequate employee quality� Loss of customer feedback
5.1.6 Types of 3PLs
Firms have to investigate and choose the compatible and appropriate types of 3PLs
before they start a long-term relationship with them. Here a classification for 3PLs
is provided.
76 Logistics Operations and Management

In terms of customer adaptation, 3PLs are classified as follows [4]:
� Standard 3PL providers are the most basic form of 3PL provider. They perform the most
basic functions of logistics such as picking and packing, warehousing, and distribution.� Service developers offer advanced value-added services to their customers such as tracking
and tracing, cross docking, specific packaging, and providing a unique security system.� Customer adapters provide services at the request of the customer and take thorough con-
trol of the company’s logistics activities. The 3PL providers improve logistics services,
but do not develop a new service. The customer base for this type of 3PL provider is typi-
cally quite small.� Customer developers are the highest level of 3PL provider, integrating themselves with
customers and taking over entire logistics function. These providers will have few
customers, but they will perform extensive and detailed tasks for them.
Third-party logistics providers can also be classified to asset-based and non-
asset�based 3PLs. Asset-based 3PLs own some assets, especially transport-related
assets such as trucks and warehouses; however, non-asset�based 3PLs do not own
assets, and they usually work with subcontractors. This type of 3PL may possess
only desks, computers, and freight industry expertise [11].
5.1.7 2009 3PLs: Results and Findings of the Fourteenth Annual Study
About the Study
The 3PL study has annually documented the growth and evolution of the 3PL
industry. The 2009 3PL study includes three directions of research: a web-based
survey, workshops with shippers leveraging survey content and the Capgemini
Accelerated Solutions Environment (CASE), and interviews with industry execu-
tives. Respondents represent a broad range of industries and are predominantly
from North America, Europe, Pacific Asia, and Latin America, in addition to other
locations throughout the world such as South Africa and the Middle East.
Key Findings
According to the responses from 3PLs and shippers, key factors responsible for the suc-
cess of relationships include openness, transparency, good communication, the ability to
create personal relationships on an operational level, the flexibility of 3PLs to accom-
modate customers’ needs, and the ability to achieve cost and service objectives.
The major findings of 2009’s 3PL study are presented in five tracks: state of the
3PL market, economic volatility, IT capability gap, supply-chain orchestration, and
strategic assessment.
Current state of the 3PL market: Relatively small percentages of shipper respon-
dents (30%) and 3PL respondents (25%) think of the willingness of 3PLs and ship-
pers to share risk as a success factor. However, several of the leaders interviewed
and industry executives participating in the workshops and ASE sessions view the
willingness to share risk as an important attribute of a successful relationship. In
addition, shippers predict that the percentage of logistics budgets they devote to
outsourcing will increase in the future.
77Logistics Parties

Economic volatility: Unpredictable demand is the most difficult challenge to
managing and operating a supply chain in an economic downturn, according to
71% of the survey respondents. For example, many consumers turn to private label
goods as their confidence declines, but that trend typically reverses itself if analysts
report good numbers.
IT capability gap: 3PL respondents report they are increasingly offering their IT
platforms on a subscription basis as a part of their service contracts. IT services
most likely to be sold this way are transportation management, warehouse and dis-
tribution center management, and visibility and customer-order management. An
average of 10% of the 3PLs responding indicate that they offer all of these services
today on a subscription basis.
Supply-chain orchestration: Nearly 60% of shipper respondents feel this is the
time to reevaluate their relationships with their 3PLs and possibly drive these rela-
tionships deeper. A significant 19% are unsure, perhaps indicating they are some-
what confused by what the current environment means for their businesses and
3PL relationships.
Strategic assessment: Newer concepts and technologies are emerging to help
both 3PLs and shippers cope with this new slower-growth world. One of them is to
create horizontal, cross-company supply chains refereed by neutral third parties.
This innovation is based on the concept that by clustering specific logistics activi-
ties and consolidating supply chains, significant economies of scale can be
achieved in terms of efficiency (logistics cost), effectiveness (customer service),
and environmental sustainability [12].
5.2 New Generations of Logistics Parties
Through the usage of 3PL providers, a firm can outsource some of its so-called tra-
ditional logistics activities to other organizations. But to ensure that the entire
logistics activities are being handled in a suitable manner, a more coherent system
has to be implemented. To reach this goal, it is necessary to use new versions of
logistics parties.
This section provides information on new generations of logistics parties and
their differences with 3PLs. In Section 5.2.1, 4PLs is explained in details. Newer
versions of logistics parties and their features, including 5PLs, are presented in
Section 5.2.2. Successful examples of businesses working as logistics parties are
also introduced in Section 5.2.3.
5.2.1 Fourth-Party Logistics
Definition
The terms fourth-party logistics (4PLs) and lead logistics provider (LLP) were intro-
duced in 1996 by Bob Evans of Arthur Anderson (now Accenture) and are defined
as follows: “A 4PL is an integrator that assembles the resources, capabilities, and
78 Logistics Operations and Management

technology of its own organization and other organizations to design, build, and run
comprehensive supply chain solutions” [3].
Fourth-party logistics is one of the significant evolutions in supply-chain man-
agement. The convergence of technology and the rapid acceleration of e-capabilities
have heightened the need for an overarching integrator for supply-chain spanning
activities. 4PL is the shared sourcing of supply-chain spanning activity with a client
and selected teaming partner under the direction of a 4PL integrator [13].
4PL is advertised as a refinement on the concept of 3PL, a firm that provides
outsourced or 3PL services to companies for part or sometimes all of their supply-
chain management functions. A 4PL uses a 3PL to supply services to customers,
owning only computer systems and intellectual capital. The 3PL and 4PL relation
can best be described by Figure 5.2.
What Is the Difference?
It has been argued that a 4PL is nothing but a non-asset�based 3PL. In fact, there
is confusion in theory and practice about the use of the term 4PL [3]. It has been
argued that any LSP that offers multiple services can be categorized under the term
3PL and a new term is not needed for this type of LSPs.
Client
3PL provider
IT serviceprovider
3PL provider
4PL
Client
ClientInsourcing1970–1980
Outsourcing1980–1990
4PL1990–2010
Internal logisticsoperations
Figure 5.2 Evolution in supply-chain outsourcing [13].
79Logistics Parties

To draw a line between 3PL and 4PL, the differences have to be clarified.
According to the Council of Logistics Management, a 4PL differs from a 3PL in
the following ways [3]:
1. A 4PL organization is often a separate entity established as a joint venture or long-term
contract between a primary client and multiple LSPs.
2. A 4PL organization acts as a single interface between the client and multiple LSPs.
3. All aspects (ideally) of the client’s supply chain are managed by the 4PL organization.
4. It is possible for a major 3PL provider to form a 4PL organization within its existing
structure.
Two Key Distinctions of 4PL
Two key distinctions make the concept of 4PL apart from other 3PL outsourcing
options:
1. A 4PL presents a comprehensive supply-chain solution.
2. A 4PL delivers value through the ability to have an impact on the entire supply chain.
In the former case, a 4PL has to deliver comprehensive supply-chain solutions
focusing on all elements of supply-chain management in order to respond effec-
tively to the numerous and complex needs of today’s organizations. In the later
case, a 4PL can impact and integrate the entire supply chain through the key dri-
vers of shareholder value: increased revenue, operating-cost reduction, working-
capital reduction, and fixed-capital reduction [13].
Operating Models of 4PL
Although 4PL solutions are usually customized for the needs of a particular client,
the following models show how a 4PL generally works [13].
� 4PL�3PL partnership: In this model, a 4PL and 3PL work together to market supply-
chain solutions that fulfill the needs of both organizations.� Solution integrator: In this model, the 4PL operates and manages a comprehensive
supply-chain solution for a single client. This type of 4PL provider uses its resources,
capabilities, and technology and also the services of other LSPs to provide a comprehen-
sive supply-chain solution for a single organization.� Industry innovator: In this model, a 4PL organization develops and runs a supply-chain
solution for multiple industry players with special focus on synchronization and
collaboration.
5.2.2 Fifth-Party Logistics
5PL is a new concept in outsourcing. It is the management of all parties of the sup-
ply chain in conjunction with e-business. 5PLs uses an e-logistics network focusing
on global operations [14].
5PL is the discipline that bridges the gaps left between 3PL providers and 4PL
providers. Where 4PLs attempt to provide supply-chain solutions with their own
optimization software and the capabilities of 3PL resources, 5PLs use the buyer’s
80 Logistics Operations and Management

(first party’s) existing technology and infrastructure to optimize the supply chain
by transforming into a virtual organization [15].
5.2.3 Future Trends
Since the enhancement of the new generations of logistics parties, organizations
are looking forward to shape their logistics departments into a virtual format.
Therefore, in a more developed way, they would use the disciplines of zero-party
logistics.
Zero-party logistics is the elimination of 3PL and 4PL organizations using 5PL
disciplines to transform a company into a virtual organization. In other words, the
traditional logistics departments become nothing more than an integrated informa-
tion chain between buyers and carriers; all planning is performed using either a
company’s own resources or 5PL services [15].
More recently, the concept of seventh-party logistics (7PL) has emerged, result-
ing from hybridizing the 3PL domain with the concept of 4PL. In fact, it is the
effective fusion of physical and process expertise of 3PLs with the enhanced
knowledge-based macrostrategic consulting and IT capabilities of 4PLs [16].
Although newer versions of logistics parties are not yet deeply investigated and
applied, they are expected to grow and be familiarized in the near future. Of
course, it requires that organizations, which are interested in outsourcing their
logistics activities, get more familiar with the concept of logistics parties, espe-
cially third and fourth parties, so that they establish a well-organized framework
for application of more recent and complex types of LSPs.
5.2.4 Logistics Vendors
In this section, some of the successful LSPs are introduced. These vendors are
shown to have considerable global market share and high annual revenue. The
selected vendors for this detailed study are United Parcel Service, Penske
Logistics, and Deloitte. The selection was based on the extent of services provided
by each vendor.
United Parcel Service
United Parcel Service (UPS) was found in 1907 in Seattle, WA, USA. It is now
one of the world’s largest package-delivery companies, delivering more than 15
million packages a day to 6.1 million customers in more than 200 countries and ter-
ritories around the world. Growing into a $49.7-billion corporation, UPS employs
approximately 425,300 staff, with 358,400 in the United States and 67,300 in other
parts of the world.
UPS’s network is based on a hub-and-spoke model. UPS uses centers that are
the point of entry for parcels and send the parcels to one or more to hubs where
parcels are sorted and forwarded to their destinations.
81Logistics Parties

Major domestic competitors include the US Postal Service (USPS) and Federal
Express (FedEx). In addition, UPS competes with a variety of international opera-
tors, including DHL, TNT NV, Royal Mail, Japan Post, and many other regional
carriers, national postal services, and air-cargo handlers.
UPS has expanded its operations to include logistics and other transportation-
related activities. UPS’s key supply-chain solution includes logistics and dis-
tribution, transportation and freight, freight forwarding, consulting services, and
industry solutions [17].
Penske Logistics
Penske Logistics is a wholly owned subsidiary of Penske Truck Leasing, which
was founded in 1969. In 1988, General Electric became a limited partner in Penske
Truck Leasing with Penske Corporation. Penske Logistics became a division of
Penske Truck Leasing in 1995 with the acquisition of Lease Way Logistics.
As a 3PL, Penske Logistics provides the following solutions:
� Supply-chain management� Transportation� Distribution center management� International transportation management
Case Study: Ford Motor Company
Ford Motor Company has worked with Penske on several Six Sigma initiatives.
Penske’s team of associates worked closely with Ford to organize operations and
create a more centralized logistics network. In addition, Penske implemented
accountability procedures and advanced logistics management technologies to gain
more visibility of the overall supply network [18].
Deloitte
Deloitte Touche Tohmatsu (also branded as Deloitte) is one of the largest profes-
sional service organizations in the world. According to the organization’s 2008
information, Deloitte has approximately 165,000 staff at work in 140 countries,
delivering several services through its member firms.
Deloitte member firms offer services in the following functions:
� Audit and enterprise risk services� Consulting in the areas of enterprise applications, technology integration, strategy and
operations, human capital, and short-term outsourcing� Financial advisory in the areas of dispute, personal and commercial bankruptcy, forensics,
and valuation� Tax and other services
As a 4PL organization, Deloitte serves various clients in financial services, con-
sumer and industrial products, energy and resources, health care and life sciences,
public sector, technology, telecommunications, and other industries [19].
82 Logistics Operations and Management

5.3 3PLs: Theories and Conceptualizations
This section provides an in-depth investigation on the main issues of 3PLs. Some
of the issues are common for other parties as well. Most of the research was
descriptive in nature, simply describing trends in the industry.
5.3.1 Outsourcing Decision
The decision to outsource (or not) logistics activities depends on a multitude of
variables [5]. When making an outsourcing decision, the following four categories
of considerations can be distinguished [2].
1. Economic considerations. When a company keeps its logistics activities in-house, invest-
ments have to be made. If outsourcing logistics activities yield a higher return on invest-
ment than the investment mentioned earlier and if finance means are scarce, it can be
advisable to contract out logistics management activities.
2. Market issues
� Demand fluctuations. Most of the time, decreasing demand for one product cannot be
compensated by rising demand for another product; the result is instabilities in logis-
tics activities (i.e., capacity utilization of transport). If the peaks cannot be dealt with
deploying flexible manpower, then it may be advisable to contract out logistics activi-
ties. A service provider usually serves several clients, enabling the counterbalance of a
drop in one client’s business with a peak in another’s, particularly if the clients come
from different trades.
� Commerce and flexibility. In many cases, companies keep their logistics management in-
house in order to maintain direct customer contact and to be able to respond to changing
customer desires in a flexible manner, whereas a service provider, for reasons of
efficiency, wishes to minimize deviations from schedule. Therefore, before a do-or-buy
decision, the company has to select a priority between flexibility and efficiency.
3. Availability of personnel and equipment. A company carrying out logistics activities in-
house bears the responsibility for personnel matters such as recruitment, selection, and
training. Furthermore, sufficient equipment must be available to make any necessary
repairs. Outsourcing logistics management can be quite a relief for a company and allows
one to cut overhead, however, at the cost of loss of control on personnel and equipment.
4. Supplier dependence. If a company carries out logistics activities in-house, it can take
action rapidly in cases of wrong deliveries and damage. If logistics has been contracted
out, rapid reactions could be obstructed by the necessary consultations with the service
provider and by any agreements made.
Rao and Young (1994) provided five key factors as interacting drivers in the
decision of shippers to either utilize logistics parties or retain logistics activities
in-house [10]:
1. Centrality of the logistics functions to core competency
2. Risk liability and control
3. Operating cost/service trade-offs
4. Information and communications systems
5. Market relationships
83Logistics Parties

Figure 5.3 is one example of an appropriate climate for outsourcing.
While considering outsourcing logistics activities, companies have to proceed
systematically to make a straightforward decision. By describing and prioritizing
activities, products, markets, and conditions, it can be decided which activities can
be or must be outsourced for which product and market combinations and under
which conditions [2].
5.3.2 Selecting the Right 3PL
Before purchasing 3PL services, the client has to select from existing 3PL provi-
ders. As a result, it should first assign a selection criterion in order to choose the
appropriate 3PL. Some of the criteria can be expressed as follows [2]:
� A service provider’s quality could be judged based on experiences using it as a 3PL. In
most cases, the service quality is even more important for the shipper than the service
cost.� The throughput rate and delivery reliability of the goods can be decisive. The 3PL must
have a high degree of flexibility in place, time, volume, quantity, and product.� The 3PL’s willingness and skillfulness at having discussions with the shipper on the regu-
lar basis is of great importance. These discussions include agreements about liability, sup-
plementary to standard transport liability for errors, negligence, and carelessness.� A 3PL must also have a cost-control system with a clearly and logically composed tariff
structure. It must be prepared to clearly state which performances and actions are covered
in the tariff. The financial strength of the 3PL is an important factor for selecting the
appropriate 3PL.
For the initial screening of candidate service providers, qualitative factors such
as supplier reputation, references from clients, and response to information requests
can be useful [20].
Function isnot central
Centrality
Informationtechnology
Cost andservice
Marketrelations
Risk andcontrol
Poorcapability
Criticalneed
Largebenefits
No uniquerisk
Favorableclimate foroutsourcing
Figure 5.3 Key factors influencing outsourcing of logistics functions [10].
84 Logistics Operations and Management

IT, services, performance metrics, and intangibles are other factors that can be used
to evaluate a 3PL provider. The intangible factors include questions on the business
growth of the prospective 3PL to make sure it will be conducting business for some
time, including financial stability, strong profitability, experience with similar compa-
nies, and global scope [9]. Table 5.1 provides the factors to consider when selecting a
3PL and their relative considerations from the customers of 3PL services.
There are also models for 3PL selection that are further introduced in Section 5.3.5.
5.3.3 Purchasing 3PL Services
The previous section identified criteria for selecting a suitable 3PL. This comple-
mentary section provides a framework for the purchasing process of 3PL services.
In general, a buying process contains the following steps [20]:
1. Identification of the need to outsource logistics
2. Development of feasible alternatives
3. Evaluation of candidates and selection of the supplier
4. Implementation of services
5. Ongoing service evaluation
Purchasing Framework
Andersson and Norrman (2002) provided an extensive framework for the purchas-
ing process. The proposed framework is composed of the following phases [22]:
� Define or specify the service: Identify what to define, who to define, and the nature of
the factor.� Understand the volume of services bought.
Table 5.1 Factors Considered in 3PL Provider Selection [21]
Factors Consideration (%)
Price of 3PL services 87
Quality of tactical, operational services 87
Expected capability to improve service levels 67
Range of available, value-added services 62
Capable ITs 61
Expected ease of doing business 57
Availability of strategic logistics services 54
Global capabilities 51
Knowledge and advice on supply-chain innovations and improvements 44
Cultural and strategic fit with 3PL provider 42
Ability to deliver end-to-end solutions across supply-chain processes
and regions
40
Coverage and experience in emerging markets 35
3PL vision and investment strategy 33
85Logistics Parties

� Simplify and standardize: It is important for purchasing strategies such as reducing sup-
plier base or buying a more standardized service.� Market survey: It is normal when developing a bigger supplier base, especially if the
strategy is to find the best price.� Request for information (RFI).� Request for proposal (RFP): This is sent to providers qualified from the screening pro-
cess. An RFP for 3PLs, in addition to price issues and various performance factors, may
include other provider characteristics such as cultural compatibility, financial issues, flex-
ibility in meeting new requirements, and information-system capabilities.� Negotiations.� Contracting.
Contracting
Contracting is one of the challenging issues in the purchasing process. Contract
could be used as a safeguard to minimize risks of building the cooperation; it is
also regarded as an encyclopedia to describe how a logistics system is developed—
i.e., include definitions of processes, activities, roles and responsibilities, incen-
tives, and penalties [22]. Typical 3PL contract includes typical contract terms (e.g.,
cooperation length), costs per activity, service description, bonus payment for the
best performance, penalty clauses for service failures, risks and insurance costs and
contract-termination clauses [5].
There are two fundamentally opposing views on the existence of contracts: (1)
Signing formal contracts is essential for defining and managing 3PL roles and rela-
tions; (2) detailed contracts can be regarded as an indication of lack of trust [5].
According to a survey carried out by Van Laarhoven et al. in 2000, written con-
tracts, formalizing the partnership between shipper and provider, are found in
almost 75% of partnerships. In addition, in just more than half the cases, the activi-
ties that are part of the partnership are specified in details. This percentage is down
from 63%, meaning that providers have more flexibility in shaping the logistics
activities. The inclusion of penalty clauses for providers can be seen in 40% of the
contracts, up from 27% [23].
There are also a few models for the calculation and analysis of main contract
features. For example, Chen et al. (2001) provided a framework for analyzing three
forms of third-party warehousing contracts with space commitments and adjust-
ment options [24].
5.3.4 Strategic Behavior of 3PLs
A survey conducted by Berglund et al. in 1999 indicates that a reasonably clear dif-
ferentiation of strategies in the TPL industry exists. This strategic segmentation is
found by segmenting the providers along the following two dimensions [7].
1. Providers that offer a specific service—e.g., distribution of spare parts (service providers)—
versus providers that cover a complete range of services and offer their customers logistics
solutions (solution providers).
86 Logistics Operations and Management

2. Providers that carry out traditional transportation and warehousing activities only versus
providers that offer additional activities such as value-added services.
From the survey results, it can be implied that a provider should be aware of
two major issues in terms of strategic positioning. The first strategic choice that
has to be made is the step from the forwarder, provider of transportation services,
and so on to the provider of logistics services or solutions. The second choice is
what type of logistics provider one aspires to be.
The choice of the strategy to be either service or solution has important conse-
quences for TPL providers. For example, service providers should focus their IT
efforts on developing a high-quality focused system that supports their services,
whereas solution providers should have more versatile systems that can be adapted
flexibly to meet the requirements of their customers’ information systems. Also, when
approaching their customers, providers should take notice of the fact that shippers will
choose service providers when they consider logistics to be a core activity and solution
providers when they do not. Finally, there are differences in skills sets required; for
example, solution providers will need to develop subcontracting skills, as well as ana-
lytical and logistics design skills, to a much larger extent than service providers [7].
In 2005, Carbone and Stone investigated the strategic behavior of 20 leading
European 3PLs between 1998 and 2004. The survey results show that the changing
business environment caused 3PLs to alter their strategic behavior by offering dif-
ferent portfolios of services. The strategic behavior reveals substantial convergence,
with the major 3PLs moving toward horizontal integration and business diversifica-
tion, mostly by mergers and acquisitions (M&A). In addition, vertical strategic alli-
ances between customer and logistics provider, as well as horizontal strategic
alliances between logistics providers, have also been adopted [25].
5.3.5 Theoretical Models
Most of the 3PL research falls into the empirical category, suggesting an empirical
and more practitioner-oriented focus on 3PL. In the 3PL literature, a few theoretical
and quantitative models focus on the operational optimization and evaluation of
3PL performance. Here some of these models are presented.
There are several models for selection of the right 3PL. Jharkharia and Shankar
(2007) provided an analytic network process (ANP) decision model for the selec-
tion of LSPs [26]. A similar vein for the selection of third-party reverse logistics
providers is presented in the work by Meade and Sarkis (2006) [27]. Bottani and
Rizzi (2006) used a multi-attribute approach based on the technique for order pref-
erence by similarity to ideal solution (TOPSIS) technique and the fuzzy set theory
for the selection and ranking of the most suitable 3PL service provider [28].
The analytic hierarchy process (AHP) is also a popular technique for selecting
appropriate 3PLs. For instance, Gol and Catay (2007) provided an empirical
instance using AHP approach for the selection of a 3PL provider to restructure an
automotive company’s supply chain for export parts. In this case, several criteria
were considered with respect to the general company considerations, quality,
87Logistics Parties

capabilities, client relationships, and labor relations, and then simple pairwise com-
parison judgments were used to develop overall priorities for ranking the 3PL pro-
viders. The performances of 3PL providers were evaluated using utility curves,
ratings, and step functions with respect to each criterion [29].
3PLs companies that fail to sustain their economies of scale and the subsequent
price leverage may not survive in today’s competitive 3PL market. Therefore, the
operational efficiency of 3PL providers dictates their competitiveness or survival.
One way of improving the operational efficiency of 3PLs in terms of financial per-
formance is to emulate best-practice firms that can be identified by setting a reliable
financial-performance standard. Benchmarking seems to be the most effective way
of setting a reliable financial standard and then measuring the operational efficiency
of the 3PL because 3PL needs to measure its financial performance relative to its
competitors. Min and Joo (2006) proposed a data envelopment analysis (DEA) to
measure the operational efficiency of 3PLs relative to prior periods and their compe-
titors and also help 3PLs identify potential sources of inefficiency and provide useful
hindsight for the continuous improvement of operational efficiency [30].
To enhance the efficiency of warehousing operations in a 3PL, Hamdan and
Rogers (2007) developed a new warehouse efficiency model using DEA to evaluate
a set of homogeneous warehouses operated by a 3PL company [31]. Other factors
improve 3PL operational performance. For example, Brah and Lim (2006) revealed
that total quality management (TQM) technology plays important and complement-
ing roles in improving the performance of logistics companies. Their analysis
showed that both high-technology logistics firms and high-technology TQM ones
perform significantly better than their low-technology peers [32].
3PL providers should have a striking distribution system to efficiently deal with
various clients’ service requirements. The system includes filling their customers’
orders, keeping the products deliveries up to speed and reducing inventory in a
dynamic and uncertain business environment. Ko et al. (2006) proposed a hybrid
optimization and simulation approach to design a distribution network for 3PLs,
considering the performance of the warehouses. They developed a genetic algo-
rithm for the optimization model to determine dynamic distribution network struc-
tures, and then, they applied a simulation model to be able to consider the
uncertainty in clients’ demands and order-picking time [33]. Ko and Evans (2007)
also presented a mathematical model for the design of a dynamic integrated distri-
bution network to consider the integrated aspect of optimizing the forward and
reverse network simultaneously [34].
5.3.6 A Framework for the Development of an Effective 3PL
To be considered as a 3PL, a logistics company should have the underlying infra-
structure of a 3PL provider. In 2003, Gunasekaran and Ngai provided a framework
for developing an efficient 3PL system. This framework is composed of five major
dimensions [14]:
1. Strategic planning
2. Inventory management
88 Logistics Operations and Management

3. Transportation
4. Capacity planning
5. Information technology
This framework is founded for the transformation of small logistics companies
to 3PLs and provides managers with a straightforward approach to improve the
quality of their logistics activities to the 3PL level. Table 5.2 lists some of the
major underlying activities in each dimension and their corresponding strategies or
techniques and technologies.
Table 5.2 A Framework for Transforming a Small Logistics Company into
a Comprehensive 3PL Company [14]
Function Activities Strategies/Techniques Technologies
Strategic
planning
Corporate and business
strategy development,
resource management,
budgeting, product
and service selection,
market-segment
analysis
Forming strategic
alliances, outsourcing,
forecasting demand,
aggregate planning,
selecting criteria for
partnership, gaining
the support of top
management,
improving
continuously, getting
government support
Groupware, shared
information systems,
Internet and EDI,
ERP
Inventory
management
Forecasting, location
analysis, network
consulting, slotting
and layout design,
order management
Demand pull system,
just-in-time, Kanban,
material requirements
planning, supply-
chain management
MRPII, EDI, ERP,
WWW, online
purchasing
Transportation
planning
Shipping, forwarding,
De(consolidation),
contract delivery,
freight bill payment,
load tendering and
brokering
Outsourcing, forming
strategic alliances,
optimizing routing
and scheduling,
capacity management,
total productive
maintenance
Groupware, Internet,
E-mail, intranet,
extranet, linear
programming
Capacity
planning
Capacity of
transportation
vehicles, warehouse
capacity, human
resources, material-
handling equipment
Make or buy decisions,
planning aggregate
capacity, minimizing
costs, maximizing
capacity
Linear programming,
waiting-line models,
scheduling
optimization,
MRPII, CRP, ERP
Information
management
Performance measures
and metrics, data
collection, data
processing, data
reporting
Groupware, IT/IS,
shareware, data
mining, data
warehousing, Intranet,
extranet
EDI, e-commerce,
Internet, AI and
expert systems, ERP
89Logistics Parties

5.4 Concluding Remarks
The increasing demand by a broad range of firms to outsource logistics functions
has led to an increasingly developing market for logistics. This demand has resulted
in considerable attention and more investigations in the important concept of logis-
tics parties.
The 3PL industry is still growing. Among the priorities currently facing 3PL pro-
viders are regional expansion, broadening services to meet the needs of current and
future customers, integrating information technologies, and developing relationships
with customers and other business firms. Although most of the research on logistics
parties is dedicated to 3PLs, the research on 3PLs is mostly descriptive. Therefore, it
is suitable to work on the theoretical aspects of 3PLs more extensively.
Organizational and technological changes, linked with globalization and information
technology developments, shows that 3PL is a sector undergoing constant changes,
making it necessary to study this interesting sector more theoretically [5].
However, there are also arguments that the 3PL industry has reached the mature
stage of its life cycle after two decades of evolution [30]. Now it is time for other
parties to grow in both theoretical and practical directions. Although rapidly devel-
oping, it is surprising to see that little research has been done on other types of
logistics parties. All the 3PL issues, including selection, behavioral aspects, and
operational issues, may be considered as research topics for newer generations of
logistics parties. Finally, it is necessary to investigate these topics more deeply in
order to appropriately utilize the talents and capabilities of parties and streamline a
more integrated, cost-effective supply chain.
References
[1] S.M. Aghazadeh, How to choose an effective third party logistics provider, Manag.
Res. News 26(7) (2003) 50�58.
[2] D.A. Van Damme, M.J. Van Amstel, Outsourcing logistics management activities, Int.
J. Log. Manag. 7(2) (1996) 85�95.
[3] M. Ranjan, R. Tonui, Third party logistics: an analysis of the feasibility and contexts of
strategic relationships, M.S. Thesis, Massachusetts Institute of Technology, 2004.
[4] S. Hertz, M. Alfredsson, Strategic development of third party logistics providers, Ind.
Market. Manag. 32(2) (2003) 139�149.
[5] K. Selviaridis, M. Spring, Third party logistics: a literature review and research agenda,
Int. J. Log. Manag. 18(1) (2007) 125�150.
[6] R.C. Lieb, The use of third-party logistics services by large American manufacturers,
J. Bus. Logist. 13(2) (1992) 29�42.
[7] M. Berglund, P. Van Laarhoven, G. Sharman, S. Wandel, Third-party logistics: Is there
a future? Int. J. Log. Manag. 10(1) (1999) 59�70.
[8] A. Marasco, Third-party logistics: a literature review, Int. J. Prod. Econ. 113(1) (2008)
127�147.
[9] G. Vaidyanathan, A framework for evaluating third-party logistics, Commun. ACM 48
(1) (2005) 89�94.
90 Logistics Operations and Management

[10] K. Rao, R.R. Young, Global supply chains: factors influencing outsourcing of logistics
functions, Int. J. Phys. Distrib. Logist. Manag. 24(6) (1994) 11�19.
[11] T. Nemoto, K. Tezuka, Advantage of third party logistics in supply chain management.
Available online at: http://hermes-ir.lib.hit-u.ac.jp/rs/bitstream/10086/16053/1/070cm
WP_72.pdf, 2004.
[12] T. Nemoto, K. Tezuka, Third-party logistics: results and findings of the 14th annual
study. Available online at: http://www.3plstudy.com, 2009.
[13] D.N. Bauknight, J.R. Miller, Fourth party logistics: the evolution of supply chain out-
sourcing. Available online at: www.npeters.com/studium/4pl_present.pdf, 1999.
[14] A. Gunasekaran, Ngai EWT. The successful management of a small logistics company,
Int. J. Oper. Prod. Manag. 33(9) (2003) 825�842.
[15] Available from: http://www.theabrahamgroup.com
[16] YCH Group, 7PLt: The definitive supply chain revolution. White Paper Version 1.2,
2002.
[17] Available from: http://www.ups.com
[18] Available from: http://www.penskelogistics.com
[19] Available from: http://en.wikipedia.org/wiki/Deloitte
[20] H.L. Sink, C.J. Langley, A managerial framework for the acquisition of third-party
logistics services, J. Bus. Logist. 18(2) (1997) 163�189.
[21] H.L. Sink, C.J. Langley, Third-party logistics: results and findings of the 12th annual
study. Available online at: http://www.3plstudy.com, 2007.
[22] D. Andersson, A. Norrman, Procurement of logistics services—minutes work or a mul-
ti-year project? Eur. J. Purch. Suppl. Manag. 8(1) (2002) 3�14.
[23] P. Van Laarhoven, M. Berglund, M. Peters, Third-party logistics in Europe—five years
later, Int. J. Phys. Distrib. Logist. Manag. 30(5) (2000) 425�442.
[24] F.Y. Chen, S.H. Hum, J. Sun, Analysis of third-party warehousing contracts with com-
mitments, Eur. J. Oper. Res. 131(3) (2001) 603�610.
[25] V. Carbone, M.A. Stone, Growth and relational strategies used by the European logis-
tics service providers: rationale and outcomes, Transport. Res. E. 41(6) (2005)
495�510.
[26] S. Jharkharia, R. Shankar, Selection of logistics service provider: an analytic network
process (ANP) approach, Int. J. Manag. Sci. 35(3) (2007) 274�289.
[27] L. Meade, J. Sarkis, A conceptual model for selecting and evaluating third-party
reverse logistics providers, Supply Chain Manag. 7(5) (2002) 283�295.
[28] E. Bottani, A. Rizzi, A fuzzy TOPSIS methodology to support outsourcing of logistics
services, Supply Chain Manag. 11(4) (2006) 294�308.
[29] H. Gol, B. Catay, Third-party logistics provider selection: insights from a Turkish auto-
motive company, Supply Chain Manag. 12(6) (2007) 379�384.
[30] H. Min, S.J. Joo, Benchmarking the operational efficiency of third party logistics provi-
ders using data envelopment analysis, Supply Chain Manag. 11(3) (2006) 259�265.
[31] A. Hamdan, K.J. (Jamie) Rogers, Evaluating the efficiency of 3PL logistics operations,
Int. J. Prod. Econ. 113(1) (2008) 234�244.
[32] S.A. Brah, H.Y. Lim, The effects of technology and TQM on the performance of logis-
tics companies, Int. J. Phys. Distrib. Logist. Manag. 36(3) (2006) 192�209.
[33] H.J. Ko, C.S. Ko, T. Kim, A hybrid optimization/simulation approach for a distribution
network design of 3PLS, Comput. Ind. Eng. 50(4) (2006) 440�449.
[34] H.J. Ko, G.W. Evans, A genetic algorithm-based heuristic for the dynamic integrated
forward/reverse logistics network for 3PLs, Comput. Oper. Res. 34(2) (2007) 346�366.
91Logistics Parties

This page intentionally left blank

6 Logistics Future Trends
Amir Zakery
Department of Industrial Engineering, Amirkabir University of Technology,Tehran, Iran
6.1 Main Influencing Issues
6.1.1 Globalization
“Globalization represents the cross-national functional integration and coordination
of spatially dispersed economic activities” [1]. An increasing range of economic
sectors are turning to globalization as a norm. So it results to complex harmoniza-
tion process in coordinating of production and supply worldwide. This complexity
is a result of differences in cultures, economic systems, government regulations,
and also so many international rules and agreements.
The environment of business decisions is becoming fundamentally altered by
globalization, which amplifies the competition between companies, so corporate
decisions have to be increasingly made in this new context. Firms have to respond
strategically in order to stay competitive in this situation [1].
Chatterjee and Tsai [1] have identified two primary drivers of globalization in
recent times: (1) lowering of trade barriers including tariff and nontariff barriers
and (2) considerable reduction in transportation and communication costs. These
two factors have accelerated the pervasion of globalization.
The first driver explains lowered trade barriers. Trade barriers were eliminated
with the free-trade regime executed by the United States, and related regulations
were represented by the General Agreement on Tariffs and Trade (GATT) and the
World Trade Organization (WTO). As a result, the flow of goods and products
across different countries accelerated rapidly in most parts of the world.
According to Chatterjee and Tsai [1], technological change in the transportation
and IT sectors make up the second driver. They emphasize that the combined
effects of changes in transportation and the complementary information technolo-
gies (ITs) are visible in a different range of facilities, including traditional transpor-
tation services with more speed and reliability and lower costs, as well as the
introduction of new classes of transportation services.
Chatterjee and Tsai mention that land and water transportation costs have
decreased steadily in the years since World War II. But to explain the role of tech-
nology in declining costs, Chatterjee and Tsai [1] believe that the IT effect on
Logistics Operations and Management. DOI: 10.1016/B978-0-12-385202-1.00006-2
© 2011 Elsevier Inc. All rights reserved.

logistics’ managerial and coordination functions is more influential than IT in
increasing the optimal use of transportation facilities. Obviously, a lack of coordi-
nation between effective factors decreases overall efficiency and imposes different
costs on the system. In supply-chain partnerships, information sharing between
supply-chain members is frequently suggested as a remedy to improve collabora-
tion. These technological improvements permit the coordination of globally dis-
persed sets of economic activities.
According to Kleindorfer and Visvikis [2], globalization was the major factor
leading to the growth of logistics in the past decade. Smith [3] referred to trade as a
fundamental factor driving economic growth. Trade means that the most cost-
effective sources for product design and manufacture can be linked to end markets. It
seems that in today’s business world this logic has turned into the dominant theme.
In the new framework of trade policy, business has the best opportunity to grow,
and logistics has become the primary “glue” for integrating the networks of interme-
diate and final production and service providers associated with globalization [2].
Although global trading is increasing, the nature of firms is also changing. They
are shifting from being national firms to becoming international and global cor-
porations. Becoming transnational means corporations face a more complex busi-
ness environment, although they are encouraged strongly to form collaborative
agreements with potential partners: suppliers, costumers, competitors, and allies.
Such agreements create a network of complex business relationships. These organi-
zational relationships have become a necessary component of globalization [4].
Different kinds of collaborations have been studied in the literature. Lemoine
and Dagnæs [4], for example, studied the dynamics of a successful network of
European logistics providers. Their study illustrates some major points: the com-
plex and powerful links created between members, how they conduct their business
and organize spatially to benefit from becoming global, and how firms control the
transportation market and the required infrastructure. The case provides an explana-
tion of how globalization can be attained using different organizational models and
resource combinations.
In recent years, companies have tended to extend their domestic business logis-
tics to global logistics (GLs) because of their international markets and customers.
GLs cannot succeed without suitable strategies. GL strategies have more complex-
ity and so are more difficult to develop compared with domestic logistics strategies,
according to Sheu [5]. The author presents several reasons for the complexity of
global strategies. Coordination of information and money flow is one important
source of complexity in an international scenario. Different transfer prices,
exchange rates, trade barriers, and labor costs are the other factors discussed [5].
On the other side, Sheu emphasizes that the globalization of logistical activities
results in more complex business operations because international companies face
more sources of uncertainty relative to domestic logistics. Greater shipment dis-
tances and longer lead times are examples of growing risks of operating globally
[5]. These factors make current mathematical models that are used extensively for
the design of domestic supply chains inappropriate, necessitating remodeling for
newer arrangements.
94 Logistics Operations and Management

As globalization matures, the number of companies operating in the global mar-
ketplace increases. Companies should take a broader perspective when operating in
international scale. Before this, although some companies had a presence across a
wide geographic area, their main operation was based on local or regional sourcing,
manufacturing, inventorying, and distribution. But now international companies are
truly global, with an organizational structure and strategy that represents a global
business [6].
Typical attributes of global marketplace according to Rushton et al. include [6]
inventory centralization, information centralization, and global branding, sourcing,
and production.
However, global companies are capable of providing for local requirements and
regional markets—e.g., electronic standards for electrical goods. It means that the
transnational scope of global corporations does not mean neglecting of local cus-
tomized products and services.
It seems that service companies face more demanding situations. Rushton et al.
emphasize that logistics networks and operations, in order to service global mar-
kets, become far more expansive with extra complexity.
Globalization causes different changes in the logistics industry. Rushton et al.
find the following implications for logistics globalization [6]:
� Supply lead times are extended.� Transition times are extended and subject to uncertainty.� There are multiple break-bulk and consolidation alternatives.� There are multiple freight mode and consequently different cost alternatives.� Production postponement is deployed.
It is obvious from above that there is a direct conflict between globalization and
the move to the just-in-time (JIT) operations as a new strategy in some companies.
In global companies, there is a tendency toward increasing order lead times and
inventory levels because of the distances involved and the complexity of logistics.
In companies moving to the JIT philosophy, the situation is reversed and there is a
desire to reduce lead times and inventory as much as possible [6]. The solution is
sought for trade-offs between order and inventory costs versus costs imposed by
uncertainty in products’ deliveries.
6.1.2 Information Technology
Many researchers have discussed IT as a means creating logistics competitiveness
(e.g., [7,8]). IT in recent years has influenced the atmosphere of many economic
activities, and its power is increasing because of both increasing capability
and simultaneous decreasing cost. Reviewing recent publications and the overall
situation of logistics reveals that IT and its derivatives in commerce, such as
e-commerce, are the greatest influencing factors in today’s logistics.
Closs et al. [7] identified two main streams in the literature for IT role in logis-
tics competence. They suggest that information is a valuable logistics resource and
also a means of achieving competitive advantage.
95Logistics Future Trends

IT has encouraged several facilities in logistics business. For example, e-commerce
development is a major factor in the growth of the distributive industry. However,
Ghiani et al. [9] believe the rate of expansion and the extent of development of e-com-
merce remain uncertain. E-commerce causes a more complex organization of the
whole logistics system that is called e-logistics. The new logistics organization should
be capable of managing small and medium-sized shipments to a large number of cus-
tomers in different areas (Table 6.1). As we see, IT has changed the way corporations
run their business, and so changing traditional logistics system into an electronic-
logistics system must be considered by logistics service providers [9].
A major role of IT through all businesses is supporting flexibility, which is nec-
essary across the value chain in order to meet customer needs efficiently.
Production phases, including product development, manufacturing, logistics, and
distribution activities, should support flexibility.
Closs and Swink [8] suggest that flexible logistics programs are strongly interrelated
with all performance dimensions. They focus on the “information connectivity” con-
cept and introduce its facilitator role. Information connectivity mediates between flexi-
ble logistics and two main competencies of a firm, including asset productivity and
delivery competence. They explain that information connectivity fully mediates the
relationship between flexible logistics programs and asset productivity, and it partially
mediates the relationship between flexible logistics programs and delivery competence.
IT is the initiator and also background for many information- and knowledge-
sharing systems for supply-chain collaborations. Knowledge-sharing systems are
deployed within and between organizations extensively today. These systems pro-
vide the structural (organizational), cultural, and electronic infrastructure require-
ments of sharing the right knowledge between the right people at the right time
who need it. Electronic infrastructure mainly refers to IT facilities and capabilities,
though IT provides an important and mostly unique infrastructure for knowledge-
sharing systems. Other new technologies relevant to logistics management such as
radio frequency identification (RFID) and global positioning system (GPS) are also
dependent on IT. New technologies are discussed in the next section.
6.1.3 New Technologies
Emerging technologies are another influential trend in today’s logistics. Today’s
forward-looking enterprises are dynamic and have collaborations with business
Table 6.1 Traditional and E-Logistics Characteristics [9]
Traditional Logistics E-Logistics
Types of load High volumes Parcels
Customer Known Unknown
Average order value ($) .1000 ,100
Destinations Concentrated Highly scattered
Demand trend Regular Lumpy
96 Logistics Operations and Management

stakeholders such as suppliers, customers, and some competitors. They use modern
technologies and share information and knowledge in an effort to create a collabora-
tive supply chain. Such a dynamic and collaborative supply chain is capable of com-
peting if not leading a special industry. Today, managing supply-chain activities is
supported by different kinds of information flows within and between parties.
Examples such as material requirements planning (MRP), manufacturing resource
planning (MRPII), and enterprise resource planning (ERP) are new information sys-
tem developments in IT, improving logistics and supply-chain management [10].
In recent years, advanced technologies such as RFID, wireless and mobile tech-
nology, and GPS have been applied extensively in logistics systems especially in
retail sectors. At the same time, they have also resulted in mixed performances in a
supply chain because of large data input, analysis, and reporting in short intervals.
Ketikidis et al. [10] point to the following advantages: tracking product logistics is
much easier, information processing is done more efficiently, security is improved,
and counterfeit reports are reduced. Fast-track ordering, improved customer rela-
tionships, and better control of supplies are other rewards. However, Ketikidis
et al. emphasize that advantages have been reported more often in more-developed
countries because the required infrastructure is provided there.
Electronic data interchange (EDI) has been used widely to transfer information
between suppliers and customers in a supply chain. Bar coding is still extensively
utilized to track products. Such long-established technologies as EDI and bar cod-
ing, although they provide lower capabilities, are not as expensive as RFID when
we consider how quickly they can be implemented at any level in a supply chain.
The reader standard and compatibility with suppliers’ systems seems to be a con-
straint for RFID-integrated application in a supply chain, although RFID setup and
utilization costs are decreasing [10].
Smith argued that RFID should be viewed not only as a technological innovation
but also as a transformational event. It is supposed that the use of RFID-based tech-
nology by some leading and progressive enterprise (e.g., WalMart) should revolu-
tionize and popularize inventory-tracking methods with other enterprises [11].
Like some other emergent technologies, RFID technology raises some worries
from a security perspective. Kelly and Erickson [12] examined this problem and
concluded that RFID technology provides enormous economic benefits for both
business and consumers, while potentially being one of the most invasive surveil-
lance technologies to threaten consumer privacy. However, most believe RFID’s
smart technology advantages in counteracting theft are larger than any possible
threats to consumer privacy. Nonetheless, methods to resolve the security anxieties
of end users should be followed to minimize the disadvantages of monitoring tech-
nologies such as RFID.
6.2 Future Trends in Some Logistics Sectors
Studying recently emerging issues in different sectors of the logistics industry is
another method for studying trends in future logistics. Impacts of emerging
97Logistics Future Trends

concepts, methods, and technologies have brought changes in different sectors of
the logistics industry. Major changes that are expected to become more influential
over time form trends. For this purpose, three important sectors in logistics—
including inventory management, transportation management, and warehousing—
have been studied from the viewpoint of recent changes, today’s global issues, and
new strategies. This section mainly refers to Ailawadi and Santish’s book Logistics
Management [13].
6.2.1 Future Trends for Inventory Management
The global marketplace, higher product variety, shorter product life cycles, poor
forecast accuracy, demand for more customized yet financially manageable pro-
ducts, and premium customer service are increasing logistics and supply-chain com-
plexity. Along with these challenges, supply-chain inventory strategies are evolving
to find new methods to meet customers’ needs in new situations and also to benefit
from new opportunities arising in the changing environment. For example, operating
with minimal inventories while still meeting customer expectations is one key
dimension of new inventory strategies [13], which are referred to as JIT strategies.
Postponement
Ailawadi and Santish [13] define postponement strategies as those that “combat
increasing fulfillment costs associated with both geographically dispersed markets
and the expansion of product variety.” Postponement is conceptually based on
delaying production and delivery costs until cost fulfillment is necessary.
Geographic and product form postponements are increasingly applied in global
supply chains.
Geographic postponement proposes to hold inventory centrally and to delay its
commitment to target market areas as long as possible, often until customer orders
are received. A simple example is accumulating spare parts inventories from
regional warehouses into a central distribution center. However, there is a trade-off
between holding inventory centrally and increasing delivery lead times. Central
inventorying reduces inventory costs but increases the probability of damaging the
level of customer service. Today, leading third-party logistics providers such as
FedEx and UPS, with the aim of electronic order processing, provide distribution
services that offer the advantages of geographic postponement and a premium
delivery service [13].
The other form of postponement is product form postponement. It proposes to
delay production of final goods with various appearances and functions as late as
possible—until a customer’s needs are known. Stocking products in their more
generic form allow them to be inventoried in their least expensive and most flexible
forms. The final manufacturing or assembly steps will be performed as soon as a
customer’s exact orders are known [13].
There are good examples for product form postponement such as stocking only
white dishwashers including color panels instead of producing different colored
98 Logistics Operations and Management

dishwashers. Customers will select and insert their favorite color panels, so there is
no need to stock different colored machines.
Quick Response
Quick response (QR) depends entirely on shortening manufacturing and distribution
lead times of specific products. It acquires initial real data about market needs first
and then begins the production phase. Supply chains thus should plan to enter a
seasonal sales period with a small initial inventory distributed to retailers, monitor
early sales patterns, generate a renewed demand distribution, and then choose the
replenishment method. In this way, the manufacturer or supplier receives early
sales data and utilizes them to update production schedules to better match output
with demand [13].
Vendor-Managed Inventory
When logistics is studied between two or more companies, the concept of coordina-
tion becomes very crucial. Lack of coordination between partners occurs when they
have incomplete or incorrect information such as what happens in the bullwhip
effect. Lack of coordination between effective factors decreases overall efficiency
and imposes different costs on the system.
One method gaining popularity for coordinating inventory decisions is vendor-
managed inventory (VMI). This collaborative initiative authorizes suppliers to
manage the buyer’s inventory of stock-keeping units. It operationally integrates
suppliers and buyers by using ITs. Buyers can share real-time information of sales
and inventory with suppliers, and suppliers can then use this information to plan
production and delivery decisions and set their inventory levels at the buyer’s ware-
houses [14].
6.2.2 Global Transportation Issues
Today, transportation is an important part of the logistics system, and efficient sup-
ply chains rely on fast, responsive, and dependable transportation. For example,
consider the following points expected in future US freight transportation [15]:
� The demand for freight transportation will nearly double by 2035. It will press the capac-
ity of the nation’s transportation system.� There will be new pressures on freight carriers to deliver goods reliably and cost-effec-
tively because business will move to create on-demand supply chains and replenish what
customers consume as soon as it is sold.� Businesses trade relationships with suppliers and customers will be more global, so trans-
portation will become more necessary.� Business will become more dependent on carefully timed and reliable freight transporta-
tion because of more intensive connectivity between members of the supply chain. When
the freight transportation system fails to satisfy commitments, hundreds of members
(including shippers, carriers, and worldwide markets) are affected.
99Logistics Future Trends

Ailawadi and Santish identify two key global issues that may lengthen transit
times, create more frequent and unpredictable delays, and consequently raise trans-
portation costs: capacity constraints and increased transportation security [13].
Transportation Capacity Issues
Capacity constraints arise when demand for transportation exceeds a transport sys-
tem’s ability to meet demand efficiently, which results in a higher cost or a lower
service level [13]. Transportation capacity constraints, particularly at domestic
points of entry, now afflict several areas in the world as the practice of global
sourcing increases.
Transportation capacity issues are complex because of the multiple dimensions
and the integrated nature of transportation systems. In addition, the public sector
has a very large and multifaceted impact on transportation capacity. The following
are among the ways to address capacity problems, according to Ailawadi and
Santish [13]:
� Existing transportation capacity can be used more efficiently through improved govern-
ment pricing of transportation infrastructure (e.g., congestion tolls or peak and off-peak
pricing differentials).� Social regulations such as those addressing safety, labor, environment, and energy should
be optimized (e.g., balanced social and economic objectives) in order to better use the
existing transportation capacity.� Technology plays a major role in alleviating capacity constraints. Two important exam-
ples are equipment and shipment tracking and the use of intelligent transportation systems
(ITSs) for road traffic management.
In addition, the US Chamber of Commerce [15] emphasizes the integration of
various modes into cohesive and efficient national and global networks to improve
the efficacy of the transportation system, although it needs planning and funding
for intermodal transportation and forms a broader geographic perspective.
Transportation Security Issues
The heightened security efforts and military actions undertaken after the terrorist
attacks on the United States in 2001 have posed a potential disruption to the
smooth flow of freight and have added to the congestion of transportation networks
at critical points [13]. In addition, intensified security requirements in special situa-
tions have imposed huge costs on transportation.
6.2.3 Future Trends for Warehousing
Many researchers used to believe we should anticipate the demise of the warehouse
because it was considered to be only a simple repository for goods. It was supposed
that all companies would plan to eliminate inventory, so warehouses could not pos-
sibly play much of a role in future global supply-chain network. But as Rankin
et al. [16] point out, the warehouse is still alive, playing key roles in traditional
100 Logistics Operations and Management

supply-chain networks as well as assuming a pivotal place in most e-commerce
operations.
Rankin et al. believe we will witness a wider variety of warehouse types in the
future, including (1) long and narrow warehouses with multiple dock doors to support
cross-docking operations and (2) high and properly designed warehouses ready to
accommodate automated storage and automated retrieval systems. Other segments of
inventory management will engage in satisfying small orders of individual items
required in the e-business environment. This large number of small-sized demands
will present a challenging task. Warehouses will have a strategic and important role in
controlling total supply-chain cost and in meeting service requirements in a dynamic
environment [16].
As stated before, postponement strategies are being used more because of the
emphasis put on responding to individual consumer needs in today’s business atmo-
sphere. Consequently, postponement results in significant savings in inventory,
transportation, and reduced inventories of obsolete products. As a result, borders
between warehousing, assembly, and retail operations are disappearing. Thus, the
warehouse will be the place where final assembly, blending, labeling, and packag-
ing, in addition to traditional stocking, will be done. Advantages for allocating this
role to warehouses are closeness to markets, low labor cost, and effective systems
for managing the processes of assembly, labeling, and packaging [16].
Finally, Ailawadi and Santish [13] predict the warehouse will play an important role
in bringing manufacturers together to collaborate in creating consolidated shipments to
major markets. Also, new technologies such as RFID will facilitate the movement and
location of goods in the warehouse as soon as they become commercially viable.
6.3 Future Trends in Technical Reports
Technical reports and surveys are good resources for investigating recent changes and
possible future trends in different parts of business and industry. As a living and growing
subject between practitioners and industrial communities, logistics has been the focus of
many technical reports. In this section, we present seven reports about recent and future
trends in the logistics industry that were found through Internet searches (mostly from
the Proquest database at http://www.proquest.com). Some focus on a specific region or
country or on special issues of logistics, and others are more general in nature.
6.3.1 Future Trends of Logistics in the United Kingdom
In its logistics information sector, which contains an overview of UK logistics in
2005, the National Guidance Research Forum identifies the main drivers of change
and accordingly lists future trends in logistics, including the following [17]:
� Globalization is affecting not only production, procurement and distribution, e-logistics
and e-transport but also companies’ outsourced activities.
101Logistics Future Trends

� New technologies, including product monitoring and IT-based information systems,
mostly favor large companies because of their expense. Monitoring the flow of stock is
facilitated, so handling and processing of goods will speed up as a result of improvements
in technology. E-commerce and direct sales require QR systems that are capable of deliv-
ering goods within very short timescales, and better IT systems will bring this capability.� The development of e-commerce, including the choice of home shopping using the
Internet, is a major driver of the distribution industry.� National and European concerns over environmental issues will continue to intensify, and
required laws and regulations will be passed. We will probably see an increase in demand
for rail transportation.� An urgent need for qualified managers has been observed in both rail and waterborne
freight. Demands for expansion, privatization, and deregulation, together with increasing
customer expectations, environmental standards, and safety levels, will all affect the
transportation industry.
6.3.2 Thinner Margins in the Industry: A Chance to Improve for Shippers
The report State of the Industry—Logistics by Datamonitor predicts that not all
of the companies active in the logistics sector will survive in the medium term and
as the market consolidates, although the top companies have experienced revenue
increases in recent years [18]. Companies can only survive if they have a good
understanding of their own capabilities and can plan to meet market situations.
Therefore, they should be proactive rather than reactive in identifying and exploit-
ing market opportunities.
According to Datamonitor’s report, 3PLs can exploit several trends that seem to have
significant impacts on the logistics industry. Technology will play an increasingly impor-
tant role. Online tracking with RFID eventually will be offered as a standard transporta-
tion service for all products. The GLs landscape is subject to change. China will still
have the opportunity to be the main manufacturing region in the world, and there will be
a shift in geographic focus (i.e., market share) from other areas toward China.
Environmental concerns have rapidly risen up, requiring 3PLs to move toward green
supply-chain options [18]. It is worth emphasizing the importance of green logistics here.
Green Logistics
Because of recent challenges and obstacles in environmental issues, companies’
responsibilities about the environmental impacts of their own activities have grown,
and increasing attention is being given to developing environmental-management
strategies and plans for logistics in the supply chain [19]. The legal concept that
“polluters should pay for pollution” is accepted in many parts of the world, and
related procedures and regulations are under development and implementation.
Like other sectors, the logistics industry has seen an increase in environmental con-
cerns, and green logistics is a proper answer to this concern. Green logistics
requirements may increase costs in some parts because some natural resources that
had been utilized freely and without limits—for instance, pollution absorption—
should be paid for in these new arrangements.
102 Logistics Operations and Management

6.3.3 Third-Party Logistics Maturing Quickly
Richard Armstrong’s sixth annual “Trends in 3PL/Customer Relationships” survey
found that in 2006, for the first time, more than 50% of the lowest quintile of
Fortune 500 companies used 3PLs to organize logistics [20]. This figure was 25%
in 2001. Passing this milestone shows that the adoption of logistics outsourcing has
now gone beyond leading companies and has been undertaken by a large propor-
tion of companies. This confirms that the important psychological and performance
barriers of logistics outsourcing are disappearing.
6.3.4 Strategic Shift Toward Redesigning Logistics Networks
According to the results of the survey in the Fifteenth Annual Masters of Logistics
Survey, faced with rising transportation costs and continued service problems, ship-
pers have begun thinking about redesigning distribution networks (33% of respon-
dents) and forming multicompany collaborations to share transportation capacities
(20%). The results also indicate that the optimization of networks is addressed on a
broad scale rather than controlling costs for just one mode [21].
6.3.5 Need for Broader Range of Logistics Services
The model for providing logistics services will have to undergo major changes,
according to a 2006 report from IBM Business Consulting Services in order to
keep up with customers’ evolving needs. This is natural: As logistics customers
outsource more, they will look for a broader range of services and demand greater
reliability and lower total cost.
The report predicts that a limited number of logistics providers—about 5%—
will reinvent themselves in the face of these changes. They will offer end-to-end
supply-chain integration and business process capabilities from the supplier man-
agement side up to the customer services side. IBM predicts that the future logistics
provider will be more global, concentrated, segmented around customer type, and
universally better at execution [22].
6.3.6 Five Influencing Factors in the Future of European Logistics
In another report in 2006, Datamonitor discussed the main shaping factors of future
European logistics. It predicted that outsourced logistics’ share of the European
market in coming years will increase because of beneficial trade conditions and
cost-reduction pressures. However, it is emphasized that the favorable environment
for logistics outsourcing will not necessarily mean that 3PLs will automatically
benefit. So the report introduces five key driving factors in the logistics industry:
globalization, legislation, technology, consolidation, and alliances. These factors
will help determine the success of providers and clients in the future [23].
103Logistics Future Trends

6.3.7 Five Trends Supporting Logistics Success in China
By entering into the WTO, China agreed to open its markets and services to global
competition. One of these is logistics. The road to high-performance logistics in
China is not so smooth, and there are obstacles that should be considered. A man-
aging partner of the Accenture Supply Chain Management practice in a 2006
report, counts five trends supporting logistics success in China useful for compa-
nies aiming to enter China’s logistics market, as below [24].
1. Rapid growth: Although today’s logistics indicators are not satisfactory compared to
developed countries, China’s logistics and distribution sector is growing rapidly. Wang
et al. [25] mention that, the average annual growth rate of the China’s logistics industry
has been 22.2% between 1992 and 2004.
2. Consolidation of a rather fragmented market: Among the country’s 18,000 logistics ser-
vices companies, none of them offers nationwide distribution services currently (at 2006).
Another guiding indicator is the largest market share possessed by a single company.
This indicator is not more than 2% of the logistics market at 2006 in china. However,
consolidation is expected to be happening soon, because of competitive pressures,
increased service levels, and the growth of transportation to outlying destinations.
3. Expanding markets for 3PLs: Although the concept of outsourcing logistics functions
dates back to recent years for Chinese companies, many multinational companies are
accelerating outsourcing of logistics services to third parties. A report by a market analyst
in 2003 predicts an annual growing rate of 25% for logistics outsourcing in China through
the next decade.
4. Greater control of downstream distribution: More companies are imitating successful
multinational companies. They are supported by strong and modern distribution networks.
Guangdong Honda Automobile Co. Ltd. is a good example.
5. Alliances result in competitive advantages: The top companies in China plan to build
competitive national distribution networks that target specific markets. Obviously, this
trend is a driver force for establishing new alliances and joint ventures (JVs).
References
[1] L. Chatterjee, C. Tsai, Transportation Logistics in Global Value and Supply Chains,
Center for Transportation Studies, Boston University, Boston, MA, pp. 1�17.
[2] P.R. Kleindorfer, I. Visvikis, Integration of Financial and Physical Networks in Global
Logistics, Risk Management and Decision Processes Center, University of
Pennsylvania, Pennsylvania, PA, 2007, pp. 1�25.
[3] A. Smith, Wealth of Nations, Prometheus Books, New York, 1776, republished in
1991.
[4] W. Lemoine, L. Dagnæs, Globalization and networking organization of European freight
forwarding and logistics providers, 2nd International Conference on Co-operation &
Competition, Approaches to the Organization of the Future, Vaxjo University, Sweden,
2002.
[5] J-B. Sheu, A hybrid fuzzy-based approach for identifying global logistics strategies,
Transport. Res. E 40 (2004) 39�61.
104 Logistics Operations and Management

[6] A. Rushton, P. Croucher, P. Baker, The Handbook of Logistics and Distribution
Management, third ed., KOGAN PAGE, London, UK, 2006.
[7] D.J. Closs, T.J. Goldsby, S.R. Clinton, Information technology influences on world
class logistics capability, Int. J. Phys. Distrib. Logist. Manag. 27(1) (1997) 4�17.
[8] D.J. Closs, M. Swink, The role of information connectivity in making flexible logistics
programs successful, Int. J. Phys. Distrib. Logist. Manag. 35(4) (2005) 258�277.
[9] G. Ghiani, G. Laporte, R. Musmanno, Introduction to Logistics Planning and Control,
John Wiley, London, UK, 2004, pp. 180�195.
[10] P.H. Ketikidis, S.C.L. Koh, N. Dimitriadisa, A. Gunasekarand, M. Kehajovae, The use
of information systems for logistics and supply chain management in South East
Europe: current status and future direction, Omega 36 (2008) 592�599.
[11] A.D. Smith, Exploring radio frequency identification technology and its impact on busi-
ness systems, Inform. Manag. Comput. Secur. 13 (2005) 16�28.
[12] E.P. Kelly, G.S. Erickson, RFID tags: commercial applications v. privacy rights, Ind.
Manag. Data Syst. 105 (2005) 703�713.
[13] S.C. Ailawadi, Logistics Management, Prentice Hall, India, 2006.
[14] Y.T. Yao, P.E. Evers, M. Dresner, Supply chain integration in vendor-managed inven-
tory, Decis. Support Syst. 43 (2007) 663�674.
[15] Cambridge Systematics, Inc., Boston Logistics Group, Inc., Alan E. Pisarski, The
Transportation Challenge: Moving the US Economy, National Chamber Foundation,
Available online at: http://www.uschamber.com/reports/transportation-challenge, 2008.
[16] S.R. Rankin, T. Rogers, D. Tompkins, J. Lancioni, R. Delp, Paul, Tomorrow is here,
warehousing management. Available online at: http://www.allbusiness.com/technology/
software-services-applications-internet-social/7802056-1.html, 2000.
[17] S.R. Rankin, T. Rogers, D. Tompkins, J. Lancioni, R. Delp, Paul, Future trends for
logistics. Available online at: http://www.guidance-research.org/future-trends/logistics/
info, 2005.
[18] S.R. Rankin, T. Rogers, D. Tompkins, J. Lancioni, R. Delp, Paul. Datamonitor: 2008 set to be
a challenging year for the logistics industry. Available online at: http://proquest.umi.com/
pqdweb?id51431584171&sid51&Fmt53&clientId546428&RQT5309&VName5PQD,
2008.
[19] B.M. Beamon, Designing the green supply chain, Logist. Inform. Manag. 12(4) (1999)
332�342.
[20] W. Hoffman, 3PLs maturing fast. Available online at: http://proquest.umi.com/pqdweb?
did51168054231&sid52&Fmt53clientId546428&RQT5309&VName5PQD, 2006.
[21] J.A. Cooke, 15th Annual Masters of Logistics Survey: Strategy Shift. Available online at:
http://proquest.umi.com/pqdweb?did51131491221&sid52&Fmt53&clientId546428&
RQT5309&VName5PQD, 2006.
[22] J.A. Cooke, Outsourced logistics trends creates buyer/seller needs gap. Available online
at:http://findarticles.com/p/articles/mi_hb4372/is200605/ai_n18926532, 2006.
[23] J.A. Cooke, A Datamonitor report: five factors that will shape the future of European logis-
tics, product code: BFCO0008. Available online at: www.datamonitor.com/Products/Free/
Brief/BFCO0008/010BFCO0008.pdf, 2006.
[24] P.M. Byrne, Five trends support logistics success in China. Available online at: http://
www.logisticsmgmt.com/article/CA6343713.html, 2006.
[25] Q. Wang, K. Zantow, F. Lai, X. Wang, Strategic postures of third-party logistics provi-
ders, in Mainland China, Int. J. Phys. Distrib. Logist. Manag. 36 (2006) 793.
105Logistics Future Trends

This page intentionally left blank

Part III
Tactical and Operational Issues

This page intentionally left blank

7 Transportation
Zohreh Khooban*
Department of Industrial Engineering, Amirkabir University of Technology,Tehran, Iran
7.1 Basic Aspects in Transportation Systems
Transportation systems move goods between origins and destinations using vehicles
and equipment such as trucks, tractors, trailers, crews, pallets, containers, cars, and
trains. Transportation represents the major role and most important element in
logistics because of its considerable cost [1].
A transportation system is an organization that designs, arranges, sets up, and
schedules freight-transportation orders during a given and limited time period with
technical restrictions at the lowest possible cost [2].
7.1.1 The Role of Transportation in Logistics
Transportation often accounts for between one-third and two-thirds of total logistics
costs—i.e., between 9% and 10% of the gross national product for the Europe
economy and also between 10% and 20% of a product’s price, so transportation’s
importance and key role is undeniable. Transportation is essential for moving any
shipment in a logistic system such as raw materials from sources to manufacturer,
semifinished products between plants, and final goods to retailers and customers.
These days, with the growth of science and technology, increasing consumption
and global commerce highlight the role of transportation in all processes. There is
a high level of competition between manufacturers and also transportation holders
in the quality of their customer services. Other critical competitive factors are
reducing lead times, delays, and whole transportation costs, as well as increasing
efficiency, reliability, safety, and reactivity in their service systems [3].
Distribution Channels
A few manufacturers sell their products directly to end users. For most of them,
bringing products to end users may be a complex process that needs sales agents or
brokers who get goods from producers and distribute them to retailers. At the end
*E-mail: [email protected]
Logistics Operations and Management. DOI: 10.1016/B978-0-12-385202-1.00007-4
© 2011 Elsevier Inc. All rights reserved.

of process, end users get their needs met by retailers. In this way, the cost of
products may increase because of the existence of intermediaries in the product dis-
tribution process, but from a general point of view, comparing to manufacturers,
intermediaries profit users by decreasing the transportation unit cost.
The path followed by a shipment from producer to customer is called the distri-
bution channel. Distribution channels can be classified into four groups. In the first
group, the channel has no intermediaries, so manufacturers send their products to
end users directly. Some kinds of products such as cosmetics and encyclopedias
sold door to door and handicrafts sold at local market are brought to the end user
in this way through distribution channel 1. In the second distribution channel, retai-
lers play intermediary roles (e.g., retailers in the tire industry buy from manufac-
turers and then resell products to their customers).
When manufacturers sell their products only in large quantities and retailers are
not able to purchase these large quantities, wholesalers play the role of intermedi-
ary between manufacturers and retailers. Channel 3 is typical in the food industry.
Channel 4 is as the same as channel 3, except that a producer contracts with a broker
or sales agent who sells products to wholesalers (e.g., in the clothing industry) [1].
Figure 7.1 illustrates these four distribution channels.
7.1.2 Transportation Participants
The three basic participants in a transportation system are the shipper, the carrier,
and government.
Shipper
One of the best ways to transport freight is to use shipper services. Shippers can
move freights from origin to destination at the lowest cost and during a specified
time period. The shipper ensures many transportation services such as particular
pickup and delivery times, accurate and timely exchange of invoicing and infor-
mation, zero loss and damage, and specified transit times. Some Shippers are pro-
ducers of goods, this is while some others are just intermediary firms (brokers)
which attribute demand to supply [4].
Channel 1
Channel 2
Channel 3
Channel 4
Producer Broker Wholesaler Retailer End-user
Figure 7.1 Channels of distribution [1].
110 Logistics Operations and Management

Carrier
Carriers tender transportation services. Railways, shipping lines, trucking compa-
nies, intermodal container services, and postal services are different kinds of car-
riers. Generally, carriers are classified into three main classes: common carriers,
private carriers, and contract carriers. Depending on its market, any manufacturer or
distributor can choose from these three choices to transport goods and products.
The best-known common carriers are public airlines, motor carriers, cruise ships,
bus lines, railroads, and other freight companies. Common carriers’ routes are defined
and published in advance, and rate tables and time schedules for transporting people
and goods require the approval of regulators (the government in most countries).
A common carrier is a business that offers its transportation services to the gen-
eral public under license or the authority provided by a regulator. A common car-
rier holds itself out to provide transportation services to the general public without
discrimination for “public convenience and necessity.”
The significant problem in using common carriers is that the numbers of custo-
mers cannot be predicted in advance all the time. To get around this problem, firms
may have special, private carriers to deliver their own products to end users, mak-
ing shipments more predictable. For example, the Wingman’s grocery store chain
owns and operates its own private fleet of vehicles to deliver produce and goods to
company stores; private carriers have an advantage over other carriers because of
their flexibility and economy.
A contract carrier, on the other hand, is a kind of for-hire carrier agent that serves a
limited number of shippers under specific contractual arrangements. According to con-
tract, they provide a specified transportation service at specified cost; contract carriers
are the same as private carriers except they do not hold serve the general public and in
most instances have contract rates that are lower than those of common carriers.
Government
In most countries, public transportation systems and facilities such as rail facili-
ties, roads, and ports are planned, constructed, and operated by governments.
Governments also control the shipment of certain items (e.g., hazardous and
poisonous products) and tax the transportation industry.
Governments have traditionally been more involved in the practices of carriers
than in most other commercial enterprises; their regulations include restricting car-
riers to certain markets and regulating prices they can charge.
7.1.3 Delivery Frequency System
In an economic view, carriers must plan the frequency of service between any two
points. Finding the best delivery frequency can decrease investment in equipment and
facilities. Delivery frequency systems can be chosen between three approaches; they
are customized transportation, consolidation transportation, and frequent operation [5].
111Transportation

Customized Transportation
In the customized transportation approach, truckload (TL) vehicles with a driver or
driving team are dedicated to a specific customer. This transportation team starts its
delivery trip when a customer asks for service. The truck is sent to the customer’s
origin site to begin loading. Then it moves to the customer’s specified destina-
tion to unload. When driving team finish their tour, call the carrier’s dispatcher
to ask for next assignment if there is one. Otherwise the team should wait for
next location. The customized delivery system creates a dynamic environment
for TL carriers because most of transportation specifications related to customers
(such as demand frequently, travel times, waiting delays at customer sites, and
waiting delays of TL team until future assignment) are uncertain.
In these conditions, carriers should attempt to use their on-hand resources such
as crews, fleets, vehicles, and trailers in the best possible way. To achieve this aim,
developing the well-organized resource management and allocation plans should be
the core of the carriers’ management procedure in responding to the maximum
demands of transportation [4].
Consolidation of Transportation
In the freight-transportation and logistics environment, there are many different
ways to save transportation costs. One way is to consolidate transportation. In this
way, it is possible to take advantage of economies of scale in transportation by
substituting large shipments for small ones. Zhou et al. have delineated three gen-
eral policies for transporting goods by vehicles. (i) the quantity policy, according to
which the maximum capacity of a vehicle should be used by carrying the maximum
number of freight quantity. (ii) the time policy, according to which the time of
delivery is the most important factor and shouldn’t exceed a preplaned time limits.
(iii) the quantity and time policy, according to which both capacity and time are
critical factors, so a vehicle is sent either when the delivery time limit arrives or
when the freight quantity reaches to its maximum bound [6].
Consolidating freight is a way to cover these policies. It means consolidating
demands from several points until a transporting vehicle is full. This on-demand
approach has many benefits for carriers because the investment in vehicle capacity
is much lower than the customized approach; as a result, lower unit transportation
costs and high-capacity use are achieved. This approach may, however, be quite
undesirable for customers with time-sensitive delivery requirements or who have
high-value goods with high associated inventory, security, and holding costs [4].
Carriers must have accurate scheduling in order to plan their services and satisfy
the expectations of the largest possible number of customers in the fewest number
or series of routes. They must be able to group several services in a schedule and
indicate departure and arrival times for stops along the route. To achieve this, car-
riers should adjust service-related characteristics such as routes, the capacities and
types of vehicles and convoys, and intermediary stops and locations of different
customers’ origins and destinations. Carriers who use this system in the best
112 Logistics Operations and Management

possible way are ensured that their transport services are performed in a rational,
efficient, and profitable way. In this system, carriers plan rules and policies that
affect the whole system [4].
Consolidation of small shipments can occur in three ways. First, small shipments
that must be transported over long distances or even short ones can be combined,
just as when large shipments are transported over long distances (facility consolida-
tion). Second, several small shipments can be replaced by a single large shipment
by using an adjusted forward or backward shipment schedule (temporal consolida-
tion). Third, when there are many pickup and delivery points, using a vehicle on a
multistop route can serve less than truckload (LTL) pickup and deliveries associ-
ated with different locations (multistop consolidation) [1].
Frequent Operation
Another alternative for delivery services is frequent operations in which carriers
provide fixed schedules that match their customers’ shipping requirements. In this
fixed schedule, delivery services are organized in advance—e.g., once a day or
twice a week. In this approach, unpredictable numbers of customers in each service
period cause uncertainty in shipping requirements. To cover the most possible
demands, carriers need a higher-capacity investment (as compared to consolidating
transport). However, predictability of operation schedules and the accuracy of
anticipated shipping arrival dates are among the advantages of frequent service [5].
7.1.4 Long-Haul Consolidated Freight Transportation [4]
Freight-transportation operations over long distances and between terminals and
cities may be performed by rail, truck, ship, and so on or any combination of these
modes. The structure of long-haul consolidation transportation system consists of a
whole network with terminals and related links. Consolidated carriers perform
transportation services by using many kinds of trucks: railcars, trailers, containers,
and ships, among others. Terminals with different designs and sizes play very criti-
cal roles in freight-transportation networks. They may be concentrated in specific
operations, given service for only a particular kind of shipment, or presented an
entire set of transportation services for any kind of shipment.
The following is a brief look at rail-transportation networks and LTL networks.
Differences between these two types of networks are described in the following
sections.
Railway Transportation Network
A railway network is made of single or double track lines that connect several dif-
ferent train yards together. When a customer calls for a service, an appropriate
number of railcars at the nearest main yard are chosen, inspected, and transported
to the freight pickup point. Loaded cars return to the origin yard to be ordered,
grouped, consolidated, and assembled into blocks. A block contains a group of
113Transportation

railcars that are considered a single unit with the same origin but perhaps different
final destinations. Using blocks in train transportation systems has many economic
advantages such as full train loads and the management of longer car strings in
yards.
During the long-haul transportation trip, the train may travel on single-track
lines, so it is common to meet trains traveling in the opposite direction. In this situ-
ation, the train with the higher priority passes first. The train may be stopped in
middle train yards where cars and engines are regularly inspected and blocks are
separated from one train and put on another. At the final yard, the first blocks are
detached from the train and disassembled. Then cars are inspected, put in order,
and moved to their final destination to be unloaded. Once a car finishes its delivery
trip, it may move to a new pickup point and then be assembled in a new block or it
may wait empty for a future assignment.
Managing the main yard’s operations is the most complex activity in a long-
haul railway transportation system.
LTL Transportation Network
In an LTL network, small vehicles pick up local traffic at origin points and deliver
it to end-of-line terminals. Then local traffic from different parts of the network are
grouped and consolidated into larger batches before they begin their long-haul
journey. Breakbulks are terminals where arrivals from several origin points are
gathered, unloaded, ordered, and consolidated for the rest of the long-haul transport
[4]. Breakbulks in LTL networks are the same as main yards in rail-transportation
systems. LTL carriers usually have their own terminals, but they use public
transportation networks.
Railway and LTL System Differences
The structure of LTL transportation network basically is the same as a rail-
transportation network but in simpler scale and with more flexibility in choosing
ways to move materials to their destinations. Whereas rail-transportation links are
limited, trucks may use any available link of the road and highway network while
obeying weight regulations [4]. In LTL systems, terminal operations are generally
simple. But in railway systems, more complicated consolidation operations are
managed through grouping and consolidation of railcars into blocks and then into
trains [7].
7.2 Classification of Transportation Problems
A lot of decision making problems in a logistic system are directly or indirectly
related to transportation activities. In addition to standard transportation problems,
handling a transportation system creates and develops many other decision making
problems [1].
114 Logistics Operations and Management

Freight transportation plans as decision making problems involve many different
variables and constraints. Some of them can be applied for all transportation sys-
tems, whereas others are only relevant to specific modes or particular ways of sys-
tem operation. For example, the vehicle and drivers scheduling problem is a
common decision problem through which there is a least-cost allocation of vehicles
and drivers over time. In this way, some constraints such as rules and guidelines on
vehicle maintenance and crew rests may be satisfied.
7.2.1 Planning Levels [4]
Transportation systems are among the most complex organizations and involve
many components such as human and material resources, complex connections,
and balances between decision variables and management policies that directly or
indirectly affect different components of the system. To decrease this complexity,
researchers have provided a general classification for transportation problems with
three planning levels: strategic (long term), tactical (medium term), and operational
(short term).
Strategic (Long Term) Planning
Strategic planning involves decisions at the highest level of management and
requires long-term investment. Strategic decisions develop general policies and
extensively structure the functional strategies of the system. Any physical changes
or development in whole network such as locating main facilities (e.g., hubs and
terminals) are examples of strategic decision planning. Strategic planning takes
place in international, national, and regional transportation systems.
Tactical (Medium Term) Planning
Tactical planning needs medium term investment and is not as critical as strategic
planning. This class contains a well-organized allocation and operation of resources
to improve system performance. Examples of this category are decision making in
the design of service networks, service schedules, repositioning fleets, and traffic
routing. Most carriers’ decision making is at this level.
Operational (Short Term) Planning
Operational planning is short term and urgent decision making performed by local
management, yard masters, and dispatchers. Decisions at this level do not need
large investments. The completion and adjustment of schedules for services, crews,
maintenance activities, and routing and dispatching of vehicles and crews are
examples of this level.
In the next part, we introduce variants of standard transportation problems and
then several important transportation problems, some of which are shipper decision
problems and some of which are carrier decision problems.
115Transportation

7.2.2 Variants of the Standard of TPs
The time-minimization transportation problem (TMTP) minimizes the time to
transport goods from m origins to n destination under some constraint of available
sources and requested destinations. Such problems especially arise when perishable
goods are transported or when it is required to transport essential items such as
food and ammunition in the shortest possible time in a war scenario.
The fundamental difference between the cost-minimization transportation prob-
lem (CMTP) and TMTP is that the cost of transportation depends on the quantity
of commodity being transported but the time involved is independent of this factor.
Many different objective function may be considered for a transportation prob-
lem such as minimization of transportation costs, minimization of labor turnover,
minimization of risk to a firm or the environment, and minimization of deteriora-
tion of perishable goods [8].
Time Minimizing Solid Transportation Problem
The cost minimizing solid transportation problem (CMSTP) is [8]:
Minimize
z5Xni5 1
Xmj5 1
Xpk5 1
cijkxijk ð7:1Þ
subject to
Xnj5 1
xijk 5 ajk;Xmj5 1
xijk 5 bkiXpk5 1
xijk 5 eij ð7:2Þ
Xmj5 1
ajk 5Xpi5 1
bki;Xpk5 1
bki; 5Xmj5 1
eij;Xni5 1
eij 5Xpk5 1
ajk ð7:3Þ
Xmj5 1
Xpk5 1
ajk 5Xpk5 1
Xni5 1
bki 5Xni5 1
Xmj5 1
eij; xij $ 0 ð7:4Þ
where
i is the number of origin points providing type k of goods,
j is the number of destinations,
xijk is the number of type k sent from the ith origin to the jth destination,
cijk is the cost of transporting the unit item of the kth from the ith supply point to the jth
destination,
ajk is the requirement at the jth destination of type k of goods,
bki is the availability of type k of goods at the ith supply point,
eij is the total quantity of goods to be sent from the ith supply point to the jth destination.
116 Logistics Operations and Management

The TMTP form of this problem is as given below.
Minimize
½Maxtijk : xijk . 0� ð7:5Þ
subject to Equations (7.2�7.4), where tijk is the time of transportation type k of
goods from the ith source to the jth destination.
It is assumed that all carriers start simultaneously. The convexity of objective
function has been demonstrated in CMSTPs but not in TMTPs.
Pricing of Bottlenecks at Optimal Time in a Transportation Problem
The conventional transportation problem deals with minimizing the cost of trans-
porting a homogeneous product from various supply points to a number of desti-
nations without caring for the time of transportation. By increasing the bottleneck
at time T, we can have a less-cost transportation schedule. However, a commis-
sioning of the project is influenced by the bottleneck. Thus, the larger bottleneck
has to be valued by comparing its compact on the functioning of the project with
the saving in transportation cost. Assuming that the impact of the bottleneck
flow on the functioning of the project is known, a convergent iterative procedure
was proposed by Malhotra and Puri [9] which finds all various efficient pairs at
time T.
MinimizeXiAI
XjAJ
cijxij ð7:6Þ
subject to the following constraints:
XjAJ
xij 5 ai;ai . 0;iAI;XiAI
xij 5 bj;bj . 0; jAJ
xij $ 0; iAI; jAJ
9>>>=>>>;
ð7:7Þ
where
i denotes the index set of supply points,
j the index set of destination,
xij the number of the product transported from the ith supply point to the jth destination,
cij the unit cost of transportation on the (i,j)th route.
Minimize
XiAI
XjAJ
c0ijxij ð7:8Þ
117Transportation

subject to Equation (7.7), where c0ij is different for different values of tij.
c0ij 5
1 if tij 5 T
0 if tij , T
N if tij . T
8<: ð7:9Þ
Bi-Criteria Transportation Problem
A bi-criteria transportation problem is a kind of problem with two linear objectives
that are the minimization of the total transportation cost and minimization of the
total deterioration of goods during transportation [10]. The mathematical model of
problem is formulated as below.
Minimize z5 (z1,z2)
z1 5XiAI
XjAJ
cijxij ð7:10Þ
z2 5XiAI
XjAJ
dijxij ð7:11Þ
subject to
XjAJ
xij 5 ai; ai . 0; iAI
XiAI
xij 5 bj; bj . 0; jAJ
xij $ 0; ði;jÞAI3 J
9>>>>=>>>>;
ð7:12Þ
where
i denotes the index set of supply points,
j is the index set of destination,
xij is the number of the product transported from the ith supply point to the jth
destination,
cij is the unit cost of transportation on (i,j)th route,
dij is the cost of deterioration of a unit while transporting from i to j,
aij is the availability of the product at the ith supply point,
bj is the demand at the destination j.
Observing that the nondominated set in the decision space has the larger number
of extreme points compared with the extreme points of the nondominated set in the
criteria space, Aneja and Nair [10] also have developed an algorithm to determine
the efficient extreme points in the criteria space. They have solved the same trans-
portation problem again and again but with unlike objectives. In continual iterations,
the objective function is the positive weighted average of the two linear objectives
under consideration.
118 Logistics Operations and Management

7.2.3 Carrier Decision-Making Problems
A carrier decision-making problem is a problem whose objective function is
defined in the same direction of maximization of a carrier’s profits. Some of the
carrier decision-making problems are crew-assignment problems, vehicle allocation
and scheduling problems, terminal design problems, allocation and operation pro-
blems, freight-traffic assignment problems, service network design problems, and
fleet-composition problems [1].
As mentioned before, most of a carrier’s decision-making problems belong to
the tactical level.
Dynamic Driver Assignment Problem
The first carrier decision-making problem introduced here is the dynamic driver
assignment problem (DDAP) that arises in TL trucking. Crews are assigned to
vehicles in order to support the planned operations [11].
In this problem, a fully loaded vehicle is assigned to a driver in a scheduled
operation. It may take several days for a vehicle to be fully loaded because the cus-
tomer’s demands are not known in advance and are received randomly. Here each
driver is supposed to be assigned to just one demand at one time [1].
The DDAP is formulated as a minimum-cost problem during which, the cost of
driver’s assignments (for empty moving from waiting location to pick-up point) is
minimized. It is assumed that n drivers are waiting for assignment to fully loaded
vehicles. Let the set of drivers be shown by D5 {1, . . ., n} and the set of ready
fully loaded vehicles by V5 {1, . . ., m}. If the maximum number of D and V are
not equal (n 6¼ m), the extra number is compensated by is compensated by a
dummy value 0. Once n,m, a dummy driver 0 is added to D, whereas if m, n, a
dummy load 0 is added to V. In this case (m, n), the DDAP is formulated as
follows.
Minimize
XiAD
XjAL
cijxij ð7:13Þ
subject to
XiAD
xij 5 1; jAL\ 0f gXjAL
xij 5 1; iAD
xijA 0;1f g; iAD; jAL
ð7:14Þ
where
cij is the predefined cost for driver i who drives vehicle j,
xij is a binary variable equal to 1 if driver i is assigned to vehicle j and 0 otherwise.
119Transportation

There are also many other known problems in the crew-scheduling management
category, such as optimizing the scheduling of terminal employees or the quantity
of the reserve crew [12].
Fleet-Composition Problem
Carriers always try to decrease the investment in their own crew. In other words,
paying attention to the variety of demands over a year, they avoid having their own
maximum number of vehicles needed in peak periods during a year. They usually
have a base number of their own vehicles to answer their usual demands, and they
hire additional required vehicles in peak periods. In this way, carriers can save
money by creating a balance point at which the total cost of their own and hired
vehicles are minimized. For this problem, similarity of vehicles is an assumption
[1].
Let a year include n time periods; the number of own vehicles is shown by v. If
i5 {1, . . ., n} is the set of time periods, then vi is the number of needed vehicles
during the time period t. The main variable m is the number of time periods per
year in which carriers need to hire vehicles (vi. v). There are two types of costs
for carriers’ own vehicles during a time period: fixed cost (cf) and variable cost
(cv), respectively, while ch is the cost of a hired vehicle in the same time period.
This problem is formulated in a simple minimization model without any constraint
as follows.
Minimize
ciðvÞ5 cfðvÞ1 cvminðvi;vÞ1 chðvi 2 vÞ ð7:15ÞTo find the annual cost, we just need to add up the costs of different periods of
a year. The formulation is changed in Equation (7.16).
Minimize
Xni5 1
ciðvÞ5Xni5 1
cf ðvÞ1Xni5 1
cvminðvi;vÞ1X
i5 vi . v
chðvi 2 vÞ ð7:16Þ
Let Cf be the annual fixed cost, while Cv and Ch are the annual variable costs
for own and hired vehicles, respectively. Now we can formulate this problem in a
simpler form in Equation (7.17).
Minimize
CðvÞ5 nCfv1Cv
Xni5 1
minðvi;vÞ1Ch
Xi:vt . v
ðvi 2 vÞ ð7:17Þ
Because this transportation cost problem has a simple linear formulation without
any constraint, the optimal annual cost is found by setting the derivation of c(v)
120 Logistics Operations and Management

(with regard to v) equal to 0 (Equation 7.18). Derivative of c(v) is found in the fol-
lowing equation, so the best value of m is obtained in Equation (7.19).
nCf 1Cvm2Chm5 0 ð7:18Þ
Figure 7.2 demonstrates the variety of demands over the year. Minimum annual
cost is obtained when the area below and above the line vt5 v be equal. This condi-
tion is achieved if the Equation (7.18) is satisfied.
m5 nCf
Ch 2Cv
ð7:19Þ
Vehicle Allocation and Scheduling Problem
Carriers can best use their vehicles by applying an optimum allocated schedule to
respond the maximum number of demands. A vehicle-allocation problem is a kind
of carrier’s decision problem formulated as a minimum-cost flow problem in which
carriers decide which demand should be responded to and which one should be
rejected, which vehicle should be moved to a new pickup point, and which one
should wait for a future assignment [1].
In this problem, it is supposed that all demands have been known in advance
and all vehicles are the same in type, size, and capacity. Let t5 {1, . . ., T} be the
set of time periods assumed to divide the planning horizon and N be the set of
demand pickup or delivery points. For this problem, there are several parameters:
dijt, iAN, jAN, t5 1, . . ., T, is an available demand delivered from pickup point i
to destination j during time period t; τij, iAN, jAN is the travel time from point i to
point j; cij, iAN, jAN, is the cost of moving an empty vehicle from pickup point i
to point j; pij, iAN, jAN, is the profit obtained by delivering a shipment from origin
i to destination j; and mit, iAN, t5 1, . . ., T, is the available number of vehicles
ready to be moved from point i in time period t.
vt
t
Hiredvehicles
Ownedvehicles
Figure 7.2 Fleet compositions
when demand varies over the
year [1].
121Transportation

There are two types of decision variables in this problem: xijt, iAN, jAN,
t5 1, . . ., T, denotes the number of vehicles starting their delivery services from
origin i and ending at destination j in time period t; and yijt, iAN, jAN, t5 1, . . .,T, indicating the number of vehicles moving empty from point i to point j at time
period t. This minimum-cost flow problem can be formulated as a maximum-
profit problem.
Maximize
XTt5 1
XiAN
XjAN;j 6¼i
ðpijxijt 2 cijyijtÞ ð7:20Þ
subject to
XjAN
ðxijt 1 yijtÞ2X
kAN;k 6¼i:t. τki
xkiðt2 τkiÞ 1 ykiðt2 τkiÞ� �
2 yiit 2 1
5mit; iAV ; tAf1; . . . ;Tg ð7:21Þ
xijt # dijt; iAN; jAN; tA 1; . . . ;Tf g ð7:22Þ
xijt $ 0; iAN; jAN; tA 1; . . . ;Tf g ð7:23Þ
yijt $ 0; iAN; jAN; tA 1; . . . ;Tf g ð7:24Þ
where the objective function (Equation 7.20) is the total profit over the whole plan-
ning horizon derived by revenues minus costs.
Constraint (7.21) confirms that the number of entered vehicles at point i during
time period t must equal the exact value mit. Constraint (7.22) states that the num-
ber of vehicles moved from point i to point j in time period t should not be more
than the number of demands between these points during this period. Regarding
this, dijt2 xijt represent loads should be rejected.
7.2.4 Shipper Decision-Making Problems
A shipper decision-making problem is a problem with an objective function defined
in the same direction as the maximization of a shipper’s profits. Some of the ship-
per decision-making problems are transportation mode selection, a shipment con-
solidation and dispatching problem, a commodities load planning and packing
problem, and a carrier-type decision problem [1].
Shipment Consolidation and Dispatching
Shipment consolidation and dispatching problem is a kind of shipper decision-
making problem often faced by producers (if they do their delivery activities them-
selves) and contracted shippers. The manufacturer or shipper has to choose the best
122 Logistics Operations and Management

way for timely delivery of orders to customers during a time horizon divided by T
periods. They should find the most suitable transportation mode for each shipment.
They also should choose the best design for consolidation of shipments and esti-
mate the start time of dispatching. In this way, any related scheduling critical factor
should be considered [1].
Shipment consolidation and dispatching problem is formulated as a minimiza-
tion model. Herein there are several parameters for each vehicle i: a destination
diAN, a weight wi$ 0, a ready time ri (the period in which vehicle i is ready for
delivery), and a deadline ki (the period in which vehicle i should be reached to des-
tination di).
A shipper may use LTL carriers or hire one-way truck trips. For rented trucks,
consider a set of route R with the following characteristics: Sr is the set of cessa-
tions during route r; fr is the fixed cost for using route r; qr is the available capacity
of route r. Let τir, iAI, rAR, be the number of time periods taken to deliver ship-
ment i on route r. By using LTL carriers, gi is the cost of delivery for shipment i,
and τ0i is the number of time periods this delivery takes.
This problem has three kinds of binary variables: (1) xirt, iAI, rAR, t5 1, . . ., T,is equal to 1 if shipment i starts its delivery trip on time period t during route r and
0 otherwise; (2) yrt, rAR, t5 1, . . ., T, is equal to 1 if route r is used in time period
t and 0 otherwise; and (3) wi is equal to 1 if shipment i is delivered by LTL carriers
and 0 otherwise (this variable is definable only when ri1 τ0i , ki).
Minimize
XrAR
XTt5 1
fryrt 1XiAI
giwi ð7:25Þ
subject to
Xi:ri # t# di 2 τir ;siASr
wixirt # qryrtrAR; t5 1; . . .; T ð7:26Þ
Xr:siASr
Xt:ri # t# ki 2 τir
xirt 1wi 5 1 iAI ð7:27Þ
xirtA 0;1f g; iAI; rAR; t5 1; . . .; T ð7:28Þ
yrtA 0;1f g; rAR; t5 1; . . .; T ð7:29Þ
wiA 0;1f g; iAI ð7:30Þ
In objective function (Equation 7.25), the total cost for delivering shipments is
minimized. Constraint (7.26) states that for each route r and time period t5 1, . . .,T, if LTL carriers are used, the total weight carried on route r during time period t
should not be more than capacity qr. Constraints (7.27) confirm that delivery of
123Transportation

each shipment should be assigned to only one of transportation operators (LTL car-
riers or rented trucks).
7.3 Case Study: An Application of Cost Analyses forDifferent Transportation Modes in Turkey
In this study, a cost analysis is conducted and costs are compared by using data
concerning Turkey for different modes of transportation to calculate the transporta-
tion cost of a unit of cargo for each mode. Therefore, current data for investment
costs, operational and maintenance costs, and fuel and external costs for each trans-
portation mode are collected for the proposed cost-analysis method. In this study,
different modes of truck, rail, and ship are compared with each other [13].
Studies and data on external cost estimations of different transportation modes
on country basis are not satisfactory. Therefore, taking into consideration the avail-
able data for Turkey and the results of different international analyses such as those
carried out by [14�18], estimations are made for the specific external cost data for
different transportation modes.
Standard vehicle types that can be suitably used in this country are selected for
different transportation modes. The selected vehicles are a general cargo ship with
a capacity of 3300 deadweight tonnage for the seaway, a freight train with a capac-
ity of 700 tons for the railroad, and a truck with a capacity of 20 tons for the road.
The mathematical formulation for calculating the transportation cost of a unit of
cargo derived in this research is:
UT 5
Pnt5 1
CkðtÞ1CfðtÞ1CmðtÞ1CexðtÞPnt5 1
YsðtÞð7:31Þ
where
Ck(t) denotes the investment cost per unit of cargo or passenger,
Cf(t) is the fuel and lubricant costs per unit of cargo or passenger,
Cm(t) is the operational and maintenance costs per unit of cargo or passenger,
Cex(t) is the external costs per unit of cargo or passenger,
Ys(t) is the number of annual cargoes and passengers or the number of cars that can be
carried in a ferry,
UT is the total cargo or passenger cost per unit.
Results of the Study
The total cost of a unit of cargo in sea transportation consists of 26% investment
cost, 32% fuel cost, 35% operational and maintenance cost, and 7% external cost.
These percentages for railroad transportation are 22% for investment, 46% for fuel,
124 Logistics Operations and Management

30% for operations and maintenance, and 2% for external costs. For road transpor-
tation, these values are 14%, 60%, 17%, and 9%, respectively.
An analysis of the figures for sea transportation revealed the following points: It
is considered that a fullness ratio of 60% is the lower limit for sea-cargo transporta-
tion, which may change according to route lengths. Thus, the fleet size and the
optimal vessel capacity can be determined by taking into consideration the annual
cargo potential on a given sea transportation route.
By looking at the figures for road transportation, we can conclude that a fullness
ratio of 80% was chosen as the lower limit for road-cargo transportation.
Determining the fleet size for this mode of transportation based on this fullness
ratio may provide an important reduction in transport costs. The proportion of
road-cargo transport costs to sea-cargo transport costs is 7. This ratio changes a lit-
tle with route length.
The evaluation of the figures for railroad transportation reveals that if the route
length becomes greater than 350 kilometers, railroad transportation becomes more
economical than road transport. Within the range of 350�1000 kilometers, the eco-
nomic advantage of the railroad transportation changes between 0% and 20%. This
advantage does not change with the fullness ratio.
References
[1] G. Ghiani, G. Laporte, R. Musmanno (Eds.), Introduction to Logistics Systems
Planning and Control, John Wiley & Sons, New York, 2004.
[2] T. Gudehus, K. Herbert (Eds.), Comprehensive Logistics, Springer, Berlin Heidelberg,
2009.
[3] A. Hoff, H. Andersson, M. Christiansen, G. Hasle, A. Løkketangen, Industrial aspects
and literature survey: fleet composition and routing, Comput. Oper. Res. 37 (2010)
2041�2061.
[4] T.G. Crainic, W.H. Randolph, Long-haul freight transportation, in: W.H. Randolph
(Ed.), Hand Book of Transportation Science, second ed., Kluwer Academic publishers,
New York, 2003.
[5] G.D Taylor (Ed.), Logistics Engineering Handbook, Taylor & Francis, London and
New York, 2008.
[6] G. Zhou, Y.V. Hui, L. Liang, Strategic alliance in freight consolidation, Transp. Res.
Part E. 47 (2011) 18�29.
[7] C. Barnhart, G. Laporte (Eds.), Handbook in Operation Research and Management
Science, vol. 14, Elsevier, Amsterdam, 2007, p. 783.
[8] R. Malhotra, S.S Lalitha, P. Gupta, A. Mehra, R. Sonia, Combinatorial Optimization:
Some Aspects, Narosa, India, 2007.
[9] R. Malhotra, M.C Puri, Pricing of bottlenecks at optimal time in a transportation prob-
lem, in: N.K. Jaiswal (Ed.), Scientific Management of Transport Systems, North
Holland Publishing Company, Amsterdam, 1981, pp. 254�261.
[10] Y.P. Aneja, K.P.K. Nair, Bi-criteria transportation problem, Manag. Sci. 25 (1979)
73�78.
125Transportation

[11] C. Barnhart, E.L. Johnson, G.N. Nemhauser, P. Vance, Airline crew scheduling,
in: W.H. Randolph (Ed.), Hand Book of Transportation Science, second ed., Kluwer
Academic publishers, New York, 2003.
[12] Y. Nobert, J. Roy, Freight handling personnel scheduling at air cargo terminals,
Transport. Sci. (1998) 32295�32301.
[13] B. Sahin, H. Yilmaza, Y. Usta, A.F. Gunerib, B. Gulsunb, An approach for analyzing
transportation costs and a case study, Eur. J. Oper. Res. 193 (2007) 1�11.
[14] D.J. Forkenbrock, External costs of intercity truck freight transportation, Transp. Res
Part A. 33 (1999) 505�526.
[15] D.J. Forkenbrock, Comparison of external costs of rail and truck freight transportation,
Transp. Res Part A. 35 (2001) 321�337.
[16] M. Beuthe, F. Degrandsart, J.F. Geerts, B. Jourquin, External costs of the Belgian inter
urban freight traffic: a network analysis of their internalization, Transp. Res Part E. 7
(2002) 285�301.
[17] E. Quinet (Ed.), Internalising the Social Costs of Transport, OECD/ECMT, Paris, 1994,
Chapter 2.
[18] E. Quinet, A meta-analysis of western European external costs estimates, Transport.
Transp. Res Part D. 9 (2004) 465�476.
126 Logistics Operations and Management

8 The Vehicle-Routing Problem
Farzaneh Daneshzand
Department of Industrial Engineering, Amirkabir University of Technology,Tehran, Iran
In brief, the solution of vehicle-routing problem (VRP) determines a set of routes
that starts and ends at its own depot, each performed by a single vehicle in a way
that minimizes the global transportation cost and fulfills the demands of the custo-
mers and operational constraints (Figure 8.1) [1].
8.1 Definitions and Applications
The pioneers of the VRP were Dantzig and Ramser [1]. They proposed the first
mathematical programming formulation and algorithmic approach of VRP in a
real-world application in 1959. A few years later, Clark and Wright [2] improved
the Dantzig�Ramser approach by proposing a heuristic. Following these two
papers, many researchers studied algorithms and models for different versions of
the VRP.
Researchers are interested in studying the VRP for two reasons: its practical rele-
vance and its difficulty. Lenstra and Rinnooy Kan [3] have analyzed the complexity
of the VRP and concluded that practically all of the VRP problems are nondetermin-
istic polynomial-time hard (NP-hard).
VRP has many applications in real-world cases. Some applications are solid-
waste collection, street cleaning, school bus routing, routing of salespeople and
maintenance units, transportation of handicapped people, and so forth.
8.2 Basic VRP Variants
Fundamental components of the VRP are road network, customers, depots, vehi-
cles, and drivers. To make different versions of VRP, different constraints and
situations can be imposed on each component, and each of them can be supposed
to achieve particular objectives [4].
Basic variants are capacitated VRP (CVRP), distance-constrained and capacitated
VRP (DCVRP), VRP with time window (VRPTW), VRP with backhauls (VRPB),
VRP with pickup and delivery (VRPPD), and any combination of these variants.
Logistics Operations and Management. DOI: 10.1016/B978-0-12-385202-1.00008-6
© 2011 Elsevier Inc. All rights reserved.

Other VRP variants that have been studied recently in the literature are open VRP
(OVRP), multidepot VRP (MDVRP), mix fleet VRP (MFVRP), split-delivery VRP
(SDVRP), periodic VRP (PVRP), stochastic VRP (SVRP), and fuzzy VRP (VRPF).
In the following sections, we will discuss these variants and their most important
formulations.
8.2.1 The Capacitated VRP
The basic version of VRP is CVRP. In this problem, each vehicle has a capacity
that is known in advance, so loading the vehicle more than its capacity is not
allowed. There are two versions of CVRP: ACVRP, when the cost matrix is asym-
metric, and SCVRP, when the cost matrix is symmetric.
The integer linear programming formulation of ACVRP proposed by Toth and
Vigo [4] is presented as follows.
Model Assumptions
� The demands are deterministic.� The demands may not be split.� The vehicles are identical.� The vehicles are based at a single central depot.� The capacity restrictions for the vehicles are imposed.
Model Inputs
G5 (V, A): A complete graph
V5 {0, . . ., n}: The vertex set
A: The arc set
dj: The demand of each customer (d05 0)
cij: The nonnegative travel cost spent to go from vertex i to vertex j
SDV: The customer set
d(S)5P
di: The total demand of the set
K: The number of identical vehicles
C: The capacity of each vehicle
Kmin, r(S): The minimum number of vehicles needed to serve all customers
Depot
Figure 8.1 The scheme of the VRP [2].
128 Logistics Operations and Management

Model Output
xij5 1 if arc (i, j)AA belongs to the optimal solution and 0 otherwise.
Objective Function and Its Constraints
minXiAV
XjAV
cijxij ð8:1Þ
XjAV
xij 5 1 ’iAV=f0g ð8:2Þ
XjAV
xij 5 1 ’iAV=f0g ð8:3Þ
XiAV
xi0 5K ð8:4Þ
XjAV
x0j 5K ð8:5Þ
Xi=2S
XjAS
xij $ rðsÞ ’SDV=f0g; S 6¼ φ ð8:6Þ
xij 5 f0; 1g ’i; jAV ð8:7Þ
Equations (8.2) and (8.3) are indegree and outdegree constraints, respectively.
Constraints (8.4) and (8.5) impose the degree requirement for the depot vertex.
Inequalities (Eqn (8.6)) are called capacity cut constraints (CCCs), and they impose
vehicle capacity requirements while ensuring the connectivity of the solution. In
fact, they stipulate that each cut (V/S, S) defined by a customer set S is crossed by
a number of arcs not smaller than r(S).
An alternative formulation may be obtained by transferring the CCCs into sub-
tour elimination constraints (SECs):
XiAS
XjAS
xij # Sj j2 rðSÞ ð8:8Þ
129The Vehicle-Routing Problem

This constraint indicates that at least r(S) arcs leave each customer set S. Both
families of constraints (8.6) and (8.8) grow exponentially with n. It means that it is
practically impossible to solve the linear programming relaxation of the problem
directly (Eqns (8.1�8.7)). A possible way to solve these problems is to consider
only some of these constraints and to add the remaining ones only if needed.
8.2.2 Distance-Constrained and Capacitated VRP
The DCVRP is a variant of CVRP on which both vehicle capacity and maximum
distance constraints are imposed. In such problems, each tour length should not
exceed the quantity known before. The symmetric DCVRP model of Laporte et al.
[5] is presented as follows.
Model Assumptions (Other Than Assumptions of CVRP)
� Distance restrictions are imposed.
Model Inputs (Other Than Inputs of CVRP)
r0(S): Given a subset S of customer vertices, the quantity r0(S) represents the mini-
mum number of vehicles needed to serve all the customers in S.
Model Output
xij5 1 if arc (i, j)AA belongs to the optimal solution and 0 otherwise.
Objective Function andits Constraints
minX
iAV=fng
Xj.i
cijxij ð8:9Þ
Xh, i
xhi 1Xj. i
xij 5 2 ’iAV=f0g ð8:10Þ
XjAV=f0g
x0j 5 2K ð8:11Þ
XiAS
Xj. i
jAS
xij # Sj j2 r0ðSÞ ’SDV=f0g; S 6¼ φ ð8:12Þ
xijAf0; 1g ’i; jAV=f0g; i, j ð8:13Þ
x0jAf0; 1; 2g ’iAV=f0g ð8:14Þ
130 Logistics Operations and Management

Constraints (8.10) and (8.11) are the degree constraints. Inequality (Eqn (8.12))
is an SEC that imposes the connectivity of solution, the vehicle capacity, and the
maximum route length requirements by forcing a sufficient number of edges to
leave each subset of vertices.
8.2.3 VRP with Time Windows
The VRPTW is the extension of CVRP where the service at each customer must start
within a specified time window and the vehicle must remain at the customer’s location
during service. The model of Toth and Vigo [4] for VRPTW is presented here.
Model Assumptions (Other Than Assumptions of CVRP)
� For each customer i, the service starts within the time window, [ai, bi], and the vehicle
stops for si time instants.
Model Inputs (Other Than Inputs of CVRP)
E: The earliest possible departure from the depot
L: The latest possible arrival at the depot
[a0, b0]5 [an11, bn11]5 [E, L]: The time window associated with node 0, n1 1
Δ1 (i): The vertices that are directly reachable from i, the forward start of i
Δ2 (i): The vertices from which i is directly reachable, the backward start of i
Si: The service time for customer i
tij: The travel time for each arc (i, j)AA
wik: The start of service at node i when serviced by vehicle k.
Model Outputs
xijk5 1 if arc (i, j) is used by vehicle k, (i, j)AA, kAK.
Note that the depot is presented by two nodes: 0, n1 1.
Objective Function and its Constraints
minXkAK
Xði;jÞAA
cijxijk ð8:15Þ
XkAK
XjAr1 ðiÞ
xijk 5 1 ’iAN ð8:16Þ
XjAr1 ð0Þ
x0jk 5 1 ’kAK ð8:17Þ
XiAr2 ðjÞ
xijk 2X
iAr1 ðjÞxjik 5 0 ’kAK; jAN ð8:18Þ
131The Vehicle-Routing Problem

XiAr2 ðn11Þ
xi;n1 1;k 5 1 ’kAK ð8:19Þ
xijkðwik 1 Si 1 tij 2wikÞ# 0 ’kAK; ði; jÞAA ð8:20Þ
aiX
jAr1 ðiÞxijk #wik # bi
XjAr1 ðiÞ
xijk ’kAK; iAN ð8:21Þ
E#wik # L ’kAK; iAf0; n1 1g ð8:22Þ
XiAN
diX
jAr1 ðiÞxijk #C ’kAK ð8:23Þ
xijk $ 0 ’kAK; ði; jÞAA ð8:24Þ
xijkAf0; 1g ’kAK; ði; jÞAA ð8:25Þ
The objective function (Eqn (8.15)) expresses the total cost. Constraint (8.16)
restricts the assignment of each customer to exactly one vehicle route. Constraints
(8.17�8.19) characterize the flow on the path to be followed by vehicle k.
Constraints (8.20�8.23) guarantee schedule feasibility according to time and
capacity considerations, respectively, and the last constraint imposes binary condi-
tions on flow variables.
8.2.4 VRP with Backhauls
In VRPB, customers can demand or return some commodities. In fact, it is an
extension of the CVRP in which the customers are partitioned into two subsets:
line-haul and back-haul customers. Each line-haul customer requires a given quan-
tity to be delivered while a given quantity of products must be picked up from
back-haul customers.
This kind of mixed distribution causes a significant saving in transportation
costs, because one is able to visit back-haul customers while delivering the pro-
ducts to the line-haul customers. The assumption is that on each route, all deliveries
are made before any pickups [6].
Here, we present the formulation of Toth and Vigo [4] for VRPB as an asym-
metric problem.
132 Logistics Operations and Management

Model Assumptions (Other Than Assumptions of CVRP)
� The sum of demands of the line-haul and back-haul vertices visited by a circuit does not
exceed separately the vehicle capacity, C.� In each circuit, the line-haul vertices precede the back-haul vertices, if any.
Model Inputs (Other Than Inputs of CVRP)
L5 {1, . . ., n}: Line-haul customer subset
B5 {n1 1, . . ., n1m}: Back-haul customer subset
F5 L,B
Cij: The nonnegative cost associated with each arc (i, j)ЄA
L05 L,{0}
B05B,{0}
G5 ðV ;AÞ: A directed graph obtained from G by defining V 5V
A5 ðA1,A2,A3Þ
A15 {(i, j)ЄA: iЄ L0, jЄ L}
A25 {(i, j)ЄA: iЄB, jЄB0}
A35 {(i, j)ЄA: iЄ L, jЄB0}
Model Outputs
xij5 1 if and only if arc (i, j) is in the optimal solution and 0 otherwise.
Objective Function and Its Constraints
minXði;jÞAA
cijxij ð8:26Þ
XiAr2
j
xij 5 1 ’jAV=f0g ð8:27Þ
XiAr1
i
xij 5 1 ’iAV=f0g ð8:28Þ
XiAr2
0
xi0 5K ð8:29Þ
XiAr1
0
x0j 5K ð8:30Þ
133The Vehicle-Routing Problem

XjAS
XiAr2
j=S
xij $ rðSÞ ’SAF ð8:31Þ
XiAS
XiAr1
j=S
xij $ rðSÞ ’SAF ð8:32Þ
xijAf0; 1g ’ði; jÞAA ð8:33Þ
The objective function minimizes the total cost. Equations (8.27�8.30) impose
indegree and outdegree constraints for the customer and the depot vertices, respec-
tively. Constraints (8.31) and (8.32) are CCCs and impose the connectivity and the
capacity constraints. Because of the degree constraints, for any given S, the left-
hand side of Eqns (8.31) and (8.32) are equal. Hence, if constraint (8.31) is
imposed, constraint (8.32) is redundant and vice versa.
8.2.5 VRP with Pickup and Delivery
In VRPPD, the vehicles have two sets of tasks, one delivering goods to customers
and the other picking goods up at customer locations.
In the VRPPD, a heterogeneous vehicle fleet must satisfy a set of transportation
requests. Each request is defined by a pickup point, a corresponding delivery point,
and a demand to be transported between these locations.
VRPPD can be formulated as a mixed-integer linear programming model. The
integer linear model proposed by Hoff, Gribkovskaia, Laporte, and Lokketangen is
presented [7].
Model Assumptions (Other Than Assumptions of CVRP)
� There are n customers; i represents two vertices i and n1 i. It means that vertex i is used
to perform a delivery, and vertex i1 n is used to perform a pickup.� pi5 di1n for i5 1, 2, . . . n� Visiting i, i1 n in succession by the same vehicle is, in fact, making a simultaneous
pickup and delivery operation at customer i. Otherwise, the two operations are performed
separately by the same vehicle or by two different vehicles.
Model Inputs (Other Than Inputs of CVRP)
The extended cost matrix C5 ðcijÞð2n11Þð2n11Þ
cij 5
cij if i# n and j# n
ci2n;j if i$ n1 1 and j# n; j 6¼ i2 n
ci;j2n if i# n; j$ n1 1; i 6¼ j2 n
ci2n; j2n if i$ n1 1; j$ n1 1
0 if j5 i2 n or i5 j2 n
8>>>><>>>>:
134 Logistics Operations and Management

uik: An upper bound on the total pickup demand accumulated in vehicle k on
leaving vertex i (i5 0, 1, . . . , 2n; k5 1, . . . ,m)vik: An upper bound on the total delivery demand remaining in vehicle k on
leaving vertex i
qij: The distance between customer i and j
di: The demand of customer i
pi: The supply of customer i
D: The maximum distance that the vehicles may cover in a tour
C: The maximum capacity of a vehicle.
Model Outputs
xijk: 1 if vehicle k travels directly from vertex i to vertex j (i, j5 0, . . . , 2n, i 6¼ j,
k5 1, 2, . . ., m) and 0 otherwise.
Yik: 1 if vehicle k performs a delivery at vertex i (i5 1, 2, . . . , n, k5 1, 2, . . . , m).Zik is 1 if vehicle k performs a pickup at vertex i (i5 11 n, . . . , 2n, k5 1, 2, . . . , m).
Objective Function and its Constraints
minXmk51
X2ni50
X2nj50
cijxijk ð8:34Þ
X2nj50
xojk 5 1 k5 1; 2; . . . ;m ð8:35Þ
X2nj50
xijk 5X2nj50
xijik ði5 0; . . . ; 2n; k5 1; 2 . . . ;mÞ ð8:36Þ
Xmk51
X2nj50
xijk 5 1 ði5 0; . . . ; 2nÞ ð8:37Þ
u0k 5 0 ðk5 1; 2; . . . ;mÞ ð8:38Þ
v0k 5Xni51
diyik ðk5 1; 2; :::;mÞ ð8:39Þ
0# uik 1 vik #Qk ði5 0; . . . ; 2n; k5 1; 2; . . . ;mÞ ð8:40Þ
135The Vehicle-Routing Problem

ujk$uik1pjzjk2 ð12xijkÞQk ði50; . . . ; 2n; j51; . . . ; 2n; k51;2; . . . ; mÞð8:41Þ
vjk$vik2djyjk2ð12xijkÞQk ði50; ...; 2n; j51; ...; 2n; k51;2; ...;mÞð8:42Þ
xijk # yik 1 zik ði5 1; . . . ; 2n; j5 0; . . . ; 2n; k5 1; 2; . . . ;mÞ ð8:43Þ
xijkAf0; 1g ði; j5 0; . . . ; 2n; i 6¼ j; k5 1; . . . ;mÞ ð8:44Þ
yijkAf0; 1g ði5 1; . . . ; n; k5 1; . . . ;mÞ ð8:45Þ
zikAf0; 1g ði5 n1 1; . . . ; 2n; k5 1; 2; . . . ;mÞ ð8:46Þ
Constraint (8.35) implies that m vehicles leave the depot. Constraint (8.36)
ensures that the incoming flow at each customer vertex is equal to the outgoing
flow and that the same vehicle enters and leaves the vertex. Constraint (8.37)
means that each vertex is visited exactly once, and constraints (8.38) and (8.39) are
used to initialize the pickup and delivery demands in the vehicles. Constraint (8.40)
guarantees that the vehicle load never exceeds the vehicle capacity. Inequalities
(Eqns (8.41 and 8.42)) control the upper bounds on the amounts of pickup and
delivery demands in the vehicle on leaving each vertex. These constraints are, in
fact, SECs. Constraint (8.43) states that if a vehicle performs no delivery and no
pickup at vertex i, then it does not travel along any arc (i, j). Because constraint
(8.37) forces each vertex to be visited by exactly one vehicle, there necessarily
exists an index k, for which both sides of Eqn (8.43) will be equal to 1.
Constraints (8.38�8.42) ensure that the uik and vik variables are nonnegative.
8.3 Solution Techniques for Basic VRP Variants
Different solving methods were proposed for VRP variants, including exact algo-
rithms, heuristics, and metaheuristics. When n (the number of vertices) increases,
connectivity or CCC causes a dramatic increase in computation time and the exact
algorithms will not be effective.
Exact approaches for the CVRP are mainly branch-and-bound and branch-and-cut
algorithms and set-covering-based solution methods. Lots of heuristics and metaheur-
istics were proposed for solving the CVRP. Some of them are simulated annealing,
deterministic annealing, Tabu search, genetic algorithms, ant algorithms, and neural
networks. A good reference for studying CVRP and DCVRP is Laporte [8].
Exact algorithms used for VRPTW are mostly branch-and-bound and
branch-and-cut. Also, heuristics and metaheuristics have led the way in generating
136 Logistics Operations and Management

near-optimal solutions and are much faster than exact algorithms. A comprehensive
literature review on VRPTW can be found in Cordeau et al. [9].
Like other variants of VRP, VRPB is known to be NP-hard in the strong sense,
and many heuristic algorithms were proposed for the approximate solution of the
problem with symmetric or Euclidean cost matrices. Some exact algorithms are
set-covering-based and branch-and-bound algorithms.
Based on classical procedures such as insertion methods, edge and vertex
exchanges, and customer relocations, heuristic algorithms were developed for
VRPPD. Some metaheuristic algorithms and optimization-based approaches such
as Benders’ decomposition, dynamic programming, polyhedral approach, and col-
umn generation were proposed. For more information about solving methods, refer
to Berbeglia et al. [10] and Parragh et al. [11] parts 1 and 2 for classification of dif-
ferent exact, heuristic, and metaheuristic methods.
8.4 Other Variants of VRP
8.4.1 Open VRP
One of the variants of VRP is the OVRP. The important feature of the OVRP is
that the vehicles are not obliged to return to the depot.
This kind of problem appears for the companies that do not own a vehicle
fleet at all or a vehicle fleet that is inadequate to the demand of all customers.
Therefore, the company is obliged to contract all or part of the product distribution
to external couriers. The hired vehicles will be assigned to routes and do not have
to return to the company’s distribution center (depot).
The problem solution will provide the company with the minimum number of
vehicles that must be hired in order to serve the customers and the set of routes
that minimizes the traveling cost. Furthermore, in the situation in which the com-
pany has its own vehicle fleet and customer demand varies significantly over time,
the solution will provide the proper combination of owned and hired vehicles [12].
A practical example of this kind of problem is the delivery and collection of mail
in which, after delivery, the vehicles start collecting new mail and return it to the sort-
ing office. Air-courier companies also have to determine such routes for fast and
efficient service.
The elimination of vehicle return to the depot, which is a constraint in the VRP,
does not actually lead to an easier and less complex problem in the OVRP [13], yet
OVRP remains NP-hard. Because of its resolution, it is necessary to find the best
Hamiltonian path for each set of customers assigned to a vehicle [14]. Therefore,
any exact algorithm for solving the OVRP will certainly have the inefficiency of
the exact algorithms for the VRP.
The OVRP received very little attention from the early 1980s to the late
1990s. However, since 2000, several researches have used Tabu search, deter-
ministic annealing, and large neighborhood search to solve the OVRP with some
success [12].
137The Vehicle-Routing Problem

Li et al. [15] provided an extensive review of the literature on OVRP until 2007.
Other studies in this area are reported in Table 8.1.
8.4.2 Multidepot VRP
In classical VRP, there is only one depot and all vehicles start and end their routes
in that depot. In the MDVRP, more than one depot exists. In this problem, every
customer is visited by a vehicle based at one of the several depots.
The MDVRP can be viewed as a clustering problem, in the sense that the output is
a set of vehicle schedules clustered by depot. Therefore, the MDVRP can be solved in
two stages: first, customers must be allocated (assigned) to depots; second, customers
assigned to the same depot must be linked together through routes. Ideally, it is more
efficient to deal with the two steps simultaneously. When faced with larger problems,
however, a reasonable approach would be to divide the problem into as many subpro-
blems as there are depots and to solve each subproblem separately [21].
Crevier et al. [22] summarized the works on VRP with multiple depots from
1969 to 2002. Other papers since that period are listed in Table 8.2.
MDVRP with interdepot routes is an extension of the MDVRP in which depots
can act as intermediate replenishment facilities along the route of a vehicle. This
problem is referred to as the VRP with intermediate facilities (VRP-IF). In a distri-
bution system, these facilities are warehouses; in a collection system, these facili-
ties represent the sites where the vehicles are unloaded.
There are two common points among these proposed methodologies. First, the
MDVRP was decomposed; second, the subproblems were solved sequentially and
iteratively.
8.4.3 Mix Fleet VRP
MFVRP is a different kind of VRP that differs from the classical one in that it
deals with a heterogeneous fleet of vehicles having various capacities and fixed
and variable costs. The routing cost is the sum of the fixed and variable cost
wherein the variable cost is in proportion to the travel distance.
Table 8.1 OVRP Literature
Author(s) Year Type Algorithm
Repoussis et al. [16] 2007 OVRPTW
Letchford et al. [17] 2007 COVRP Branch-and-cut algorithm
Aksen et al. [18] 2007 COVRPTW Modified Clarke�Wright parallel savings
algorithm, a nearest insertion
algorithm, and a Tabu search heuristic
Fleszar et al. [19] 2008 OVRPTW,
DCOVRP
Variable neighborhood search algorithm
Derigs and Reuter [20] 2008 OVRP Attribute-based hill climber
COVRP, capacitated OVRP; OVRPTW, OVRP with time window; COVRPTW, capacitated OVRP with time window;DCOVRP, distance-constrained OVRP.
138 Logistics Operations and Management

There are three kinds of MFVRP in the literature. Introduced by Golden et al. in 1984
[34], the first one uses the same value for the variable costs regardless of the vehicle type
and has an unlimited number of vehicles of each type. It is regarded as the vehicle fleet
mix (VFM), the fleet size and mixed VRP, and the fleet size and composition VRP.
The second type, proposed by Salhi et al. [31], considers different variable costs
dependent on the vehicle type and also has an unlimited number of vehicles of
each type. It is the heterogeneous VRP (HVRP), VFM with variable unit running
costs, and MFVRP.
Taillard [32] introduced the last type that differs from the second type in which
there are restrictions on the number of available different vehicles of each type.
Because of the complexity of the MFVRP, some attempts have been made to
formulate it using mixed-integer linear programming, but no exact algorithm for
MFVRP has ever been developed [33].
Here, the literature of MFVRP is categorized in Table 8.3.
8.4.4 Split-Delivery VRP
SDVRP is a relaxation of the VRP in which the same customer can be served by
different vehicles if it reduces overall costs. This problem was first introduced by
Table 8.2 MDVRP Literature
Author(s) Year Type Algorithm
Giosa et al. [21] 2002 MDVRPTW Designing six heuristics for assigning
customers to depots and the same
VRP heuristic for each depot
Angelelli and Speranza [23] 2002 VRP-IF A Tabu search-based algorithm
Wasner and Zapfel [24] 2004 MDLRP for
planning
parcel service
Heuristic based on local search
Polacek et al. [25] 2004 MDVRPTW Variable neighborhood search
Nagi and Salhi [26] 2005 VRPPD,
MDVRPPD
Several heuristic methods for VRPPD
can be modified to tackle
MDVRPPD
Ho et al. [27] 2008 MDVRP Hybrid genetic algorithm
Crevier et al. [22] 2007 MDVRP with
interdepot
routes
Heuristic combining adaptive
memory principle, Tabu search for
solution of subproblems, and
integer programming
Chunyu and Xiaobo [28] 2009 MDVRPB Hybrid genetic algorithm
Yu et al. [29] 2010 MDVRP Ant colony metaheuristic
Sombuntham and
Kachitvichayanukul [30]
2010 MDVRPPD in
time window
Particle swarm optimization
algorithm
MDVRP, multidepot VRP; MDVRPPD, MDVRP with pickup and delivery; MDVRPTW, MDVRP with time window;MDLRP, multidepot location routing problem; MDVRPB, multidepot VRP with backhauls.
139The Vehicle-Routing Problem

Dror and Trudeau [52]. They proved that split deliveries result in savings, both in
the total distance traveled and the number of vehicles utilized.
An example in Gendreau et al. [53] shows that when the number of demand
points goes to 1N, the ratio of the optimal value of the SDVRP over that of the
corresponding CVRP approaches 1/2. These savings are more significant when
Table 8.3 MFVRP Literature
Author(s) Year Type Algorithm
Golden et al. [34] 1984 FSMVRP Saving heuristic based on
Clarke�Wright method, two-step
procedures
Gheysens et al. [35] 1984 FSMVRP Penalty function approach
Gheysens et al. [36] 1986 FSMVRP Two-stage method
Salhi et al. [31] 1992 VFM Route perturbation (RPERT)
procedure for different variable
costs
Salhi and Rand [37] 1993 FSMVRP Extension of RPERT procedure
Rochat and Semet [38] 1994 Heterogeneous
fixed fleet
Tabu search
Osman and Salhi [39] 1996 VFM Modified version of RPERT, called
MRPERT, allowing search process
to restart several times to produce
several solutions
Taillard [32] 1999 VFM Heuristic column-generation method
Liu and Shen [40] 1999 FSMVRPTW Insertion-based savings heuristics
Renaud and Boctor [41] 2002 FSMVRP Sweep-based algorithm
Wassan and Osman [33] 2002 FSMVRPTW New variants of Tabu search mixed
with reactive Tabu search concepts,
variable neighborhoods, special
data-memory structures, and
hashing functions
Dullaert et al. [42] 2002 MFVRPTW Sequential insertion heuristic for the FM
Tarantilis et al. [43] 2004 HFM Backtracking adaptative threshold
accepting
Dell’Amico et al. [44] 2006 FSMVRPTW Constructive insertion heuristic and
metaheuristics algorithm
Belfiore and Favero [45] 2007 FSMVRPTW Scatter search approach
Braysy et al. [46] 2008 FSMVRPTW Multirestart deterministic annealing
metaheuristic
Lee et al. [47] 2008 VFM Tabu search and set partitioning
Brandao [48] 2009 VFM Deterministic Tabu search algorithm
Braysy et al. [49] 2009 FSMVRPTW Three-phase metaheuristic
Liu et al. [50] 2009 FSMVRP Genetic algorithm-based heuristic
Repoussis and Tarantilis [51] 2009 FSMVRP Adaptive memory programming
solution approach
FSMVRP, fleet size and mixed VRP; VFM, vehicle fleet mix; FSMVRPTW, FSMVRP with time window.
140 Logistics Operations and Management

average customer demand is more than 10% of the vehicle capacity [54]. Ho and
Haugland [55] gave a survey on SDVRP up to 2002. Other works since then are
reported in Table 8.4.
8.4.5 Periodic VRP
In the PVRP, a set of customers has to be visited on a given time horizon one or
more times. Different customers usually require different numbers of visits in that
certain time horizon. PVRP with service choice (PVRP-SC) is a variant of the
PVRP in which the visit frequency to nodes is a decision variable of the model.
This can result in more efficient vehicle tours or greater service benefit to
customers [70].
Solving the problem requires assigning a visiting schedule to each customer. For
each day of the time horizon, the routes of the vehicles must be defined in such a
way that all customers whose assigned schedules include that day are served.
Table 8.4 SDVRP Literature
Author(s) Year Type Algorithm
Song et al. [56] 2002 SDVRP
(newspaper
logistic
problem)
Ho et al. [55] 2004 VRPSDTW Tabu search
Archetti et al. [57] 2006 SDVRP Tabu search
Gendreau et al. [58] 2006 SDVRTW
Lee et al. [59] 2006 SDVRP (split
pickups)
Exact algorithm based on shortest
path
Campos et al. [60] 2007 SDVRP Scatter search
Chen et al. [61] 2007 SDVRP Heuristic combining mixed-integer
program and record-to-record
travel algorithm
Nakao and Nagamochi [62] 2007 SDVRP Dynamic programming
Archetti et al. [63] 2008 SDVRP Method based on Tabu search and
using integer programming
Suthikarnnarunai [64] 2008 SDVFM Sweep heuristic method
Derings et al. [65] 2009 SDVRP Local search-based metaheuristic
Bolduc et al. [66] 2010 SDVRP Tabu search
Aleman et al. [67] 2010 SDVRP Adaptive memory algorithm
Moreno et al. [68] 2010 SDVRP Proposing an algorithm to obtain
lower bounds
Gulczynski et al. [69] 2010 SDVRP-MDA Heuristic applying modified
Clarke�Wright saving algorithm
SDVRPTW, SDVRP with time window; SDVFM, split-delivery vehicle fleet mix; SDVRP-MDA, SDVRP withminimum delivery amounts.The split-pickup VRP is the same as SDVRP, but products have to be picked up from suppliers.
141The Vehicle-Routing Problem

Therefore, a VRP has to be solved for each day of the planning horizon. In such a
case, the choice of the visiting schedules and the definition of the routes are two
interrelated problems. This feature is essential in some applications such as waste-
collection problems in which each customer has to be served in a given period
(e.g., twice a week).
Published papers on this subject from 1974 to 2005 are reported in
Hemmelmayr et al. [71], and the summary of other works since then are reviewed
briefly in Table 8.5.
8.4.6 Stochastic VRP
The deterministic CVRP has been widely studied in the literature. In the classic
definition of VRP, the associated parameters such as cost, customer demands, and
vehicle travel times are deterministic. SVRPs arise when some elements of the
problem are random.
Common types are the following:
� In the VRP with stochastic demands (VRPSD), each customer’s demand is assumed to
follow a given probability distribution instead of having a single known value. The actual
customer demand is known only on arrival at the customer’s location.� In the VRP with stochastic travel time, the matrix of travel time is not deterministic.� In the VRP with stochastic customers, the set of customers is not known with certainty
and each customer has a probability of being present.� In the VRP with stochastic service time, the service time of each customer is not
deterministic.
Table 8.5 PVRP Literature
Author(s) Year Type Algorithm
Delgado et al. [72] 2005 Minimizing labor
requirements in
a PVRP
Two-level heuristic
Francis and Smilowitz [70] 2005 PVRP-SC Continuous approximation model
Belanger et al. [73] 2006 PVRPTW Nonlinear integer multicommodity
network flow formulation and new
branch-and-bound strategies in
branch and price
Alegre et al. [74] 2007 PVRP (pickups) Scatter search
Alonso et al. [75] 2008 Site-dependent
multitrip PVRP
Tabu-based algorithm
Pirkwieser and Raidl [76] 2008 PVRPTW Variable neighborhood search
Pirkwieser and Raidl [77] 2009 PVRPTW Column-generation method
Pirkwieser and Raidl [78] 2009 PVRPTW Integer linear programming solver
with variable neighborhood search
MDPVRP, multidepot PVRP.In site-dependent multitrip PVRP, a vehicle can have multiple trips during the day and they are site-dependent—i.e.,not every vehicle can visit every customer.
142 Logistics Operations and Management

SVRPs differ from their deterministic ones in several aspects. Solution method-
ologies are more intricate and combine the characteristics of stochastic and integer
programs. SVRPs are often computationally intractable; therefore, only relatively
small instances can be solved to optimality, and good heuristics are hard to
design and assess [79]. SVRPs can be cast within the framework of stochastic
programming.
SVRPs are usually modeled using mixed- or pure-integer stochastic programs or
as Markov decision processes. All known exact algorithms belong to the first
category.
Tillman in 1969 [80] addressed the CVRPSD for the first time. He considered a
multidepot variant of the CVRP with Poisson-distributed demands. The model con-
sidered a cost trade-off between exceeding the vehicle capacity and finishing the
route with excess capacity [81].
The published papers covering all kinds of SVRP are categorized in Table 8.6
by specifying the parameters that have been assumed stochastic.
8.4.7 Fuzzy VRP
There is widespread evidence that the exact values of the mean demands, travel
times, numbers and locations of customers, and so on that follow probability distri-
butions are very difficult to obtain. In some new systems, it is also hard to describe
the parameters of the problem as random variables because of insufficient data to
analyze the distribution. Using methods from fuzzy sets theory makes it possible to
successfully model problems that contain an element of uncertainty, subjectivity,
ambiguity, and vagueness.
Fuzzy logic was used by Teodorovic and Pavkovic [130] in VRP when the
demands were uncertain. The model was based on the heuristic sweeping algo-
rithm, rules of fuzzy arithmetic, and fuzzy logic.
Cheng and Gen [131] introduced the concept of fuzzy die-time in the vehicle-
routing and scheduling context. They represented the fuzzy time window in two
types: the tolerable interval of service time and the desirable time for service.
Usual approaches consider the tolerable interval of service time without minding
customers’ desired time. Their fuzzy approach can handle both kinds of customers’
preferences simultaneously. Table 8.7 categorizes the papers on VRPF.
8.5 Case Studies
8.5.1 The Product Distribution of a Dairy and Construction Company
Distribution of materials is a challenging problem faced by major industrial and
construction companies. Therefore, there are a lot of case studies that apply VRP
methods to solve such real problems. One of them is the case studied by Tarantilis
and Kiranoudis [140] in which they investigated two real-life distribution problems
faced by a dairy and by a construction company.
143The Vehicle-Routing Problem

Table 8.6 VRPSD Literature
Author(s) Year Type Author(s) Year Type
Tillman [80] 1969 MDVRPSD Golden and Stewart
[82]
1978 VRPSD
Golden and Yee [83] 1979 VRPSD Yee and Golden
[84]
1980 VRPSD
Stewart and Golden
[85]
1980 VRPSD Stewart [86] 1981 VRPSD
Bodin et al. [87] 1983 VRPSD Stewart and Golden
[88]
1983 VRPSD
Jezequel [89] 1985 VRPSD, VRPSC,
VRPSDC
Dror and Trudeau
[90]
1986 VRPSD
Jaillet [91] 1987 VRPSD, VRPSC,
VRPSDC
Bertsimas [92] 1988 VRPSD,
VRPSC
Jaillet and Odoni [93] 1988 VRPSD, VRPSC,
VRPSDC
Laporte et al. [94] 1989 VRPSD
Waters [95] 1989 VRPSD VRPSC Dror et al. [96] 1989 VRPSD
Laporte and
Louveaux [97]
1990 VRPSD Bertsimas et al.
[98]
1990 VRPSD
Bastian and Rinnooy
Kan [99]
1992 VRPSD Benton and Rosset
[100]
1992 VRPSCD
Dror [101] 1992 VRPSD, VRPSC Laporte et al. [102] 1992 VRPSD
Trudeau and Dror
[103]
1992 VRPSCD Bertsimas [104] 1992 VRPSD,
VRPSCD
Dror et al. [105] 1993 VRPSD Bouzdiene-Ayari
et al. [106]
1993 SDVRPSD
Laporte and
Louveaux [107]
1993 VRPSD Gendreau et al. [79] 1995 VRPSD,
VRPSCD
Gendreau et al. [58] 1996 VRPSD, VRPSCD Secomandi [108] 1998 VRPSD
Hjorring and Holt
[109]
1999 VRPSD Yang et al. [110] 2000 SVRP
Secomandi [111] 2001 VRPSD Laporte et al. [112] 2002 CVRPSD
Markovic et al. [113] 2005 VRPSD Chepuri et al. [114] 2005 VRPSD
Dessouky et al. [115] 2006 VRPSD Novoa et al. [116] 2006 VRPSD
Ak and Erera [117] 2007 VRPSD Tan et al. [118] 2007 VRPSD
Haugland et al. [119] 2007 VRPSD Sungur et al. [120] 2008 CVRPSD
Jula et al. [121] 2008 SVRPT Shen et al. [122] 2009 VRPSDT
Christiansen and
Lysgaard [123]
2009 VRPSD Secomandi and
Margot [124]
2009 VRPSD
Novoa and Storer
[125]
2009 VRPSD Li et al. [126] 2010 VRPSTST
Smith et al. [127] 2010 VRPSD Rei et al. [128] 2010 VRPSD
Mendoza et al. [129] 2010 VRPSD
MDVRPSD, multidepot VRPSD; VRPSC, VRP with stochastic customers; VRPSDC, VRP with stochastic demand andcustomer; VRPSTST, VRP stochastic travel time and service time.
144 Logistics Operations and Management

The first case study considers a central warehouse of a dairy company that hosts
a heterogeneous fleet of vehicles and stores perishable foods. The foods have to be
delivered to a set of customers through daily deliveries. The distance between each
pair of customers and also the central warehouse and each customer’s location is
known. After deliveries, each vehicle route ends at the central warehouse.
The second actual case study considers a distribution center of a concrete com-
pany in which a heterogeneous fleet of concrete-mixer trucks load ready-to-pour
concrete for delivery to a set of construction sites. Every construction site requires
a specific type of concrete-mixer truck of different capacity that can carry different
blends of concrete. Concrete-mixer trucks return to the distribution center after
unloading the demands.
Tarantilis and Kiranoudis [140] formulated these problems as HVRP with differ-
ent fixed and variable cost for each vehicle and solved them by a heuristic based
on adaptive memory. Computational outcome on the first case results in substan-
tially improving on the current practice of the company by using 24 vehicles
instead of 27 and saving at least 28.23% of the total duration of the trips. The same
results are attained for the next case: the number of concrete-mixer trucks reduces
from 13 to 10 and a 49.66% saving in total duration of trips.
8.5.2 The Collection of Urban Recyclable Waste
The next case is about the collection of recyclable waste in Portugal’s central
coastal region. There are two central depots in which the waste of 1642 distinct
Table 8.7 FVRP Literature
Author(s) Year Type Algorithm
Cheng and Gen [131] 1995 VRPFTW Genetic algorithm
Teodorovic and
Pavkovic [130]
1996 VRPFD Heuristic sweeping algorithm, rules of fuzzy
arithmetic and fuzzy logic
Werners and Drawe
[132]
2003 VRPF Fuzzy modeling based on mixed-integer linear
programming
Kuo et al. [133] 2004 VRPFT Ant colony optimization
Sheng et al. [134] 2005 FVRP Compares fuzzy measure method with other
programming methods
He and Xu [135] 2005 VRPFD Genetic algorithm
Zheng and Liu [136] 2006 VRPFT Fuzzy simulation, genetic algorithm
Lin [137] 2008 VRPFTW Genetic algorithm (multiobjective)
Erbao and Mingyong
[138]
2009 VRPFD Stochastic simulation
Erbao and Mingyong
[139]
2010 OVRPFD Stochastic simulation
VRPFTW, VRPF with fuzzy time window; VRPFD, VRP with fuzzy demand; VRPFT, VRP with fuzzy travel time;OVRPFD, OVRP with fuzzy demand.
145The Vehicle-Routing Problem

collection sites is unloaded by five vehicles. Three types of waste must be carried
separately. Because 70% of the operational cost is dedicated to the transportation,
creating the best collection routes minimizes the total distance of vehicles with the
restrictions in the vehicle’s capacity and route duration that must be managed in
one work shift.
The problem is modeled as a PVRP and develops routes for every day of each
month. This model is repeated in each month with 20 workdays and two work
shifts in each day. It is noted that because the vehicles are busy about half the time
with the exit and return trips to depots, a single route is created in one shift.
The problem is solved in three phases using heuristic algorithms. For each zone
and for each work shift of each day, the decision variables are the type of waste,
the sites, and the routes in which the waste must be collected [141].
References
[1] G.B. Dantzig, J.H. Ramser, The truck dispatching problem, Manag. Sci. 6 (1959)
80�91.
[2] G. Clark, J.V. Wright, Scheduling of vehicles from a central depot to a number of
delivery points, Oper. Res. 12 (1964) 568�581.
[3] J.K. Lenstra, A.H.G. Rinnooy Kan, Complexity of vehicle and scheduling problems,
Networks 11 (2) (1981) 221�227.
[4] P. Toth, D. Vigo, The vehicle routing problem, SIAM Monographs on Discrete
Mathematics and Applications, Philadelphia, 2002.
[5] G. Laporte, Y. Nobert, M. Desrochers, Optimal routing under capacity and distance
restrictions, Oper. Res. 33 (1985) 1050�1073.
[6] P. Toth, D. Vigo, A heuristic algorithm for the symmetric and asymmetric vehicle rout-
ing problems with backhauls, Eur. J. Oper. Res. 113 (1999) 528�543.
[7] A. Hoff, I. Gribkovskaia, G. Laporte, A. Lokketangen, Lasso solution strategies for the
vehicle routing problem with pickups and deliveries, Eur. J. Oper. Res. 192 (3) (2007)
755�766.
[8] G. Laporte, The vehicle routing problem: an overview of exact and approximate algo-
rithms, Eur. J. Oper. Res. 59 (1992) 345�358.
[9] G.F. Cordeau, G. Laporte, A. Mercier, A unified Tabu search heuristic for vehicle rout-
ing problems with time windows, J. Oper. Res. Soc. 52 (2001) 928�936.
[10] G. Berbeglia, J.F. Cordeau, I. Gribkovskaia, G. Laporte, Static pickup and delivery pro-
blems: a classification scheme and survey, J. Spanish Soc. Stat. Oper. Res. 15 (2007)
1�31.
[11] S.N. Parragh, K.F. Doerner, R.F. Hartl, A survey on pickup and delivery problems.
Part I: transportation between customers and depot, J. Betriebswirtschaft 58 (1) (2008)
21�51.
[12] D. Sariklis, S. Powell, A heuristic method for the open vehicle routing problem,
J. Oper. Res. Soc. 51 (5) (2000) 564�573.
[13] J. Brandao, A Tabu search algorithm for the open vehicle routing problem, Eur. J.
Oper. Res. 157 (2004) 552�564.
[14] M. Syslo, N. Deo, J. Kowaklik, Discrete Optimization Algorithms with Pascal
Programs, Prentice Hall, Englewood Cliffs, NJ, 1983.
146 Logistics Operations and Management

[15] F. Li, B. Golden, E. Wasil, The open vehicle routing problem: algorithms, large scale
test problems, and computational results, Comput. Oper. Res. 34 (10) (2007)
2918�2930.
[16] P.P. Repoussis, C.D. Tarantilis, G. Ioannou, The open vehicle routing problem with
time windows, J. Oper. Res. Soc. 58 (3) (2007) 355�367.
[17] A.N. Letchford, J. Lysgaard, R.W. Eglese, A branch and cut algorithm for the capaci-
tated open vehicle routing problem, J. Oper. Res. Soc. 58 (12) (2007) 1642�1651.
[18] D. Aksen, Z. Ozyurt, N. Aras, The open vehicle routing problem with driver nodes and
time deadlines, J. Oper. Res. 132 (2007) 760�768.
[19] K. Fleszar, I.H. Osman, K.S. Hindi, A variable neighborhood search algorithm for the
open vehicle routing problem, Eur. J. Oper. Res. 195 (3) (2009) 803�809.
[20] U. Derigs, K. Reuter, A simple and efficient tabu search heuristic for solving the open
vehicle routing problem, J. Oper. Res. Soc. 60 (12) (2008) 1658�1669.
[21] I.D. Giosa, I.L. Tansini, I.O. Viera, New assignment algorithms for the multi-depot
vehicle routing problem, J. Oper. Res. Soc. 53 (2002) 977�984.
[22] B. Crevier, J.F. Cordeau, G. Laporte, The multi-depot vehicle routing problem with
inter-depot routes, Eur. J. Oper. Res. 176 (2) (2007) 756�773.
[23] E. Angelelli, M.G. Speranza, The periodic vehicle routing problem with intermediate
facilities, Eur. J. Oper. Res. 137 (2002) 233�247.
[24] M. Wasner, G. Zapfel, An integrated multi-depot hub-location vehicle routing model
for network planning of parcel service, Int. J. Prod. Econ. 90 (2004) 403�419.
[25] M. Polacek, R.F. Hartl, K.F. Doerner, M. Reimann, A variable neighborhood search for
the multi depot vehicle routing problem with time windows, J. Heurist. 10 (2004)
613�627.
[26] G. Nagi, S. Salhi, Heuristic algorithms for the single and multiple depot vehicle routing
problems with pickups and deliveries, Eur. J. Oper. Res. 162 (2005) 126�141.
[27] W. Ho, G.T.S. Ho, P. Ji, H.C.W. Lau, A hybrid genetic algorithm for the multi-depot
vehicle routing problem, Eng. Appl. Artif. Intell. 21 (4) (2008) 548�557.
[28] R. Chunyu, W. Xiaobo, Study on improved hybrid genetic algorithm for multi-depot
vehicle routing problem with backhauls, AICI 2 (2009) 347�350.
[29] B. Yu, Z.Z. Yang, J.X. Xie, A parallel improved ant colony optimization for multi-
depot vehicle routing problem, J. Oper. Res. Soc. 62 (1) (2011) 183�188.
[30] P. Sombuntham, V. Kachitvichayanukul, A particle swarm optimization algorithm for
multi-depot vehicle routing problem with pickup and delivery requests, Lecture Notes
in Engineering and Computer Science 2182 (2010) 1998�2003.
[31] S. Salhi, M. Sari, D. Saidi, N. Touati, Adaptation of some vehicle fleet mix heuristics,
Omega 20 (1992) 653�660.
[32] E.D. Taillard, A heuristic column generation method for the heterogeneous fleet VRP,
RAIRO Oper. Res. 33 (1999) 1�14.
[33] N.A. Wassan, I.H. Osman, Tabu search variants for the mix fleet vehicle routing prob-
lem, J. Oper. Res. Soc. 53 (2002) 768�782.
[34] B. Golden, S. Assad, L. Levy, F. Gheysens, The fleet size and mix vehicle routing
problem, Comput. Oper. Res. 11 (1) (1984) 49�66.
[35] F. Gheysens, B. Golden, A. Assad, A comparison of techniques for solving the fleet
size and mix vehicle routing problems, OR Spectrum 6 (1984) 207�216.
[36] F. Gheysens, B. Golden, A. Assad, A new heuristic for determining fleet size and com-
position, Math. Program. 42 (1986) 234�242.
[37] S. Salhi, G.K. Rand, Incorporating vehicle routing into the vehicle fleet composition
problem, Eur. J. Oper. Res. 66 (1993) 313�330.
147The Vehicle-Routing Problem

[38] Y. Rochat, F. Semet, A tabu search approach for delivering pet food and flour in
Switzerland, J. Oper. Res. Soc. 45 (1994) 1233�1246.
[39] I. Osman, S. Salhi, Local search strategies for the vehicle fleet mix problem, in:
V.J. Rayward-Smith, I.H. Osman, C.R. Reeves, G.D. Smith (Eds.), Modern Heuristic
Search Methods, Wiley, New York, 1996, pp. 131�153.
[40] F.H. Liu, S.Y. Shen, The fleet size and mix vehicle routing problem with time win-
dows, J. Oper. Res. 50 (7) (1999) 721�732.
[41] J. Renaud, F. Boctor, A sweep-based algorithm for the fleet size and mix vehicle rout-
ing problem, Eur. J. Oper. Res. 140 (2002) 618�628.
[42] W. Dullaert, G.K. Janssens, K. Sorensen, B. Vernimmen, New heuristics for the fleet
size and mix vehicle routing problem with time windows, J. Oper. Res. Soc. 53 (2002)
1232�1238.
[43] C.D. Tarantilis, D. Diakoulaki, C.T. Kiranoudis, Combination of geographical informa-
tion system and efficient routing algorithms for real life distribution operations, Eur. J.
Oper. Res. 152 (2004) 437�453.
[44] Monaci M. Dell’Amico, C. Pagani, D. Vigo, Heuristic approaches for the fleet size
and mix vehicle routing problem with time windows, Transport. Sci. 4 (2006)
516�526.
[45] P. Belfiore, L. Favero, Scatter search for the fleet size and mix vehicle routing problem
with time windows, Cent. Eur. J. Oper. Res. 15 (4) (2007) 351.
[46] O. Braysy, W. Dullaert, G. Hasle, D. Mester, M. Gendreau, An effective multi-restart
deterministic annealing metaheuristic for the fleet size and mix vehicle routing problem
with time windows, Transport. Sci. 42 (3) (2008) 371�386.
[47] Y.H. Lee, J.I. Kim, K.H. Kang, K.H. Kim, A heuristic for vehicle fleet mix problem
using tabu search and set partitioning, J. Oper. Res. Soc. 59 (6) (2008) 833�841.
[48] J. Brandao, A deterministic tabu search algorithm for the fleet size and mix vehicle
routing problem, Eur. J. Oper. Res. 195 (3) (2009) 716�728.
[49] O. Braysy, P.P. Porkka, W. Dullaert, P.P. Repoussis, C.D. Tarantilis, A well-scalable
metaheuristic for the fleet size and mix vehicle routing problem with time windows,
Expert Syst. Appl. 36 (4) (2009) 8460�8475.
[50] S. Liu, M. Haung, H. Ma, An effective genetic algorithm for the fleet size and mix
vehicle routing problems, Transport. Res. E Logist. Transport. Rev. 45 (2009)
434�445.
[51] P.P. Repoussis, C.D. Tarantilis, Solving the fleet size and mix vehicle routing problem
with time windows via adaptive memory programming, Transport. Res. C Emerg.
Tech. 8 (5) (2009) 695�712.
[52] M. Dror, P. Trudeau, Savings by split delivery routing, Transport. Sci. 23 (1989)
141�145.
[53] M. Gendreau, M. Feillet, P. Dejax, C. Gueguen, Vehicle routing with time windows
and split deliveries, Technical Paper 2006�851, Laboratoire d’Informatique
d’Avignon, 2006.
[54] M. Jin, K. Liu, R.O. Bowden, A two-stage algorithm with valid inequalities for the split
delivery vehicle routing problem, Int. J. Prod. Econ. 105 (2007) 228�242.
[55] S.C. Ho, D. Haugland, A Tabu search heuristic for the vehicle routing problem with
time windows and split deliveries, Oper. Res. 31 (2004) 1947�1964.
[56] S. Song, K. Lee, G. Kim, A practical approach to solving a newspaper logistic problem
using a digital map, Comput. Ind. Eng. 43 (2002) 315�330.
[57] C. Archetti, A. Hertz, M.G. Speranza, A Tabu search algorithm for the split delivery
vehicle routing problem, Transport. Sci. 40 (2006) 64�73.
148 Logistics Operations and Management

[58] M. Gendreau, G. Laporte, R. Seguin, Stochastic vehicle routing, Eur. J. Oper. Res.
88 (1) (1996) 3�12.
[59] C.G. Lee, M. Epelman, C.C. White, A shortest path approach to the multiple-vehicle
routing with split picks-up, Transport. Res. B Meth. 40 (2006) 265�284.
[60] V. Campos, A. Corberan, E. Mota, A scatter search algorithm for the split delivery
vehicle routing problem, in: C. Cotta, J van Hemert (Eds.), Evolutionary Computation
in Combinatorial Optimization, Lecture Notes in Computer Science, 4446, Springer,
Berlin, 2007, pp. 121�129.
[61] S. Chen, B. Golden, E. Wasil, The split delivery vehicle routing problem: applications,
algorithms, test problems and computational results, Networks 49 (2007) 318�328.
[62] Y. Nakao, H. Nagamochi, A DP-based heuristic algorithm for the discrete split delivery
vehicle routing problem, J. Adv. Mech. Des. Syst. Manuf. 1 (2) (2007) 217�226.
[63] C. Archetti, M.W.P. Savelsbergh, M.G. Speranza, An optimization-based heuristic for
the split delivery vehicle routing problem, Transport. Sci. 42 (2008) 22�31.
[64] N. Suthikarnnarunai, A sweep algorithm for the mix fleet vehicle routing problem,
Proceedings of the International Multi Conference of Engineers and Computer
Scientists, Hong Kong, 2008.
[65] U. Derings, B. Li, U. Vogel, Local search-based metaheuristics for the split delivery
vehicle routing problem, J. Oper. Res. Soc. 61 (9) (2009) 1356�1364.
[66] M.C. Bolduc, G. Laporte, J. Renaud, F.F. Boctor, A Tabu search heuristic for the split
delivery vehicle routing problem with production and demand calendars, Eur. J. Oper.
Res. 202 (2010) 122�130.
[67] R.F. Aleman, X. Zhang, R.R. Hill, An adaptive memory algorithm for the split delivery
vehicle routing problem, J. Heurist. 16 (2010) 441�473.
[68] L. Moreno, M.P. Aragao, E. Uchoa, Improved lower bounds for the split delivery vehi-
cle routing problem, Oper. Res. Lett. 38 (4) (2010) 302�306.
[69] D. Gulczynski, B. Golden, E. Wasil, The split delivery vehicle routing problem with
minimum delivery amounts, Transport. Res. E Logist. Transport. Rev. 46 (2010)
612�626.
[70] P. Francis, K. Smilowitz, Modeling techniques for periodic vehicle routing problems,
Transport. Res. B 40(10) (2006) 872�884.
[71] V.C. Hemmelmayr, K.F. Doerner, R.F. Hartl, A variable neighborhood search heuristic
for periodic routing problems, Eur. J. Oper. Res. 195 (3) (2009) 791�802.
[72] C. Delgado, M. Laguna, J. Pacheco, Minimizing labor requirements in a periodic vehi-
cle loading problem, Comput. Optim. Appl. 32 (3) (2005) 299�320.
[73] N. Belanger, G. Desaulniers, F. Soumis, J. Desrosiers, Periodic airline fleet assignment
with time windows, spacing constraints, and time dependent revenues, Eur. J. Oper.
Res. 175 (3) (2006) 1754�1766.
[74] J. Alegre, M. Laguna, J. Pacheco, Optimizing the periodic pick-up of raw materials for
a manufacturer of auto parts, Eur. J. Oper. Res. 179 (2007) 736�746.
[75] F. Alonso, M.J. Alvarez, J.E. Beasley, A tabu search algorithm for the periodic vehicle
routing problem with multiple vehicle trips and accessibility restrictions, J. Oper. Res.
Soc. 59 (2008) 963�976.
[76] S. Pirkwieser, G.R. Raidl, A variable neighborhood search for the periodic vehicle rout-
ing problem with time windows, Proceedings of the 9th EU/Meeting on Metaheuristics
for Logistics and Vehicle Routing, Troyes, France, 2008.
[77] S. Pirkwieser, G.R. Raidl, A column generation approach for the periodic vehicle rout-
ing problem with time windows, Proceedings of the International Network
Optimization Conference, Pisa, Italy, 2009.
149The Vehicle-Routing Problem

[78] S. Pirkwieser, R. Gunther, Boosting a variable neighborhood search for the periodic
vehicle routing problem with time windows by ILP techniques, Proceedings of the 8th
Metaheuristic International Conference (MIC 2009), Hamburg, Germany, 2009.
[79] M. Gendreau, G. Laporte, R. Segiun, An exact algorithm for the vehicle routing prob-
lem with stochastic demands and customers, Transport. Sci. 29 (1995) 143�155.
[80] F.A. Tillman, The multiple terminal delivery problem with probabilistic demands,
Transport. Sci. 3 (1969) 192�204.
[81] C.H. Christiansen, J. Lysgaard, A branch-and-price algorithm for the capacitated vehi-
cle routing problem with stochastic demands, Oper. Res. Lett. 35 (2009) 773�781.
[82] B.L. Golden, W.R. Stewart Jr., Vehicle routing with probabilistic demands, in:
D. Hogben, D. Fife (Eds.), Computer Science and Statistics: Tenth Annual Symposium
on the Interface, NBS Special Publication 503, National Bureau of Standards,
Washington, DC, 1978.
[83] B.L. Golden, J.R. Yee, A framework for probabilistic vehicle routing, Am. Inst. Ind.
Eng. Trans. 11 (1979) 109�112.
[84] J.R. Yee, B.L. Golden, A note on determining operating strategies for probabilistic
vehicle routing, Nav. Res. Logist. Q. 27 (1980) 159�163.
[85] W.R. Stewart Jr., B.L. Golden, A chance-constrained approach to the stochastic vehicle
routing problem, in: G. Boseman, J. Vora, Proceedings of 1980 Northeast AIDS
Conference, Philadelphia, 1980, pp. 33�35.
[86] W.R. Stewart, New algorithms for deterministic and stochastic vehicle routing pro-
blems, Ph.D. Thesis, Report No. 81-009, University of Maryland at College Park, MD,
1981.
[87] L.D. Bodin, B.L. Golden, A.A. Assad, M.O. Ball, Routing and scheduling of vehicles
and crews: the state of the art, Comput. Oper. Res. 10 (1983) 69�211.
[88] W.R. Stewart, B.L. Golden, Stochastic vehicle routing: a comprehensive approach, Eur.
J. Oper. Res. 14 (1983) 371�385.
[89] A. Jezequel, Probabilistic vehicle routing problems, M.Sc. Dissertation, Department of
Civil Engineering, Massachusetts Institute of Technology, Cambridge, MA, 1985.
[90] M. Dror, P. Trudeau, Stochastic vehicle routing with modified savings algorithm, Eur.
J. Oper. Res. 23 (1986) 228�235.
[91] P. Jaillet, Stochastic routing problems, in: G. Andreatta, F. Mason, P. Serafini (Eds.),
Stochastics in Combinatorial Optimization, World Scientific, New Jersey, 1987.
[92] D.J. Bertsimas, Probabilistic combinatorial optimization problems. Ph.D. Thesis,
Report No. 193, Operations Research Center, Massachusetts Institute of Technology,
Cambridge, MA, 1988.
[93] P. Jaillet, A.R. Odoni, The probabilistic vehicle routing problem, in: B.L. Golden, A.A.
Assad (Eds.), Vehicle Routing: Methods and Studies, North-Holland, Amsterdam, 1988.
[94] G. Laporte, F.V. Louveattx, H. Mercure, Models and exact solutions for a class of sto-
chastic location-routing problems, Eur. J. Oper. Res. 39 (1989) 71�78.
[95] C.D.J. Waters, Vehicle-scheduling problems with uncertainty and omitted customers,
J. Oper. Res. Soc. 40 (1989) 1099�1108.
[96] M. Dror, G. Laporte, P. Trudeau, Vehicle routing with stochastic demands: properties
and solution frameworks, Transport. Sci. 23 (1989) 166�176.
[97] G. Laporte, F.V. Louveaux, Formulations and bounds for the stochastic capacitated
vehicle routing problem with uncertain supplies, Economic Decision-Making: Games,
Econometrics and Optimization. Contribution in Honour of Dreze JH, in: J. Gabzewicz,
J.F. Richard, L. Wolsey (Eds.), Elsevier Science, North Holland, Amsterdam, 1990,
pp. 443�455.
150 Logistics Operations and Management

[98] D.J. Bertsimas, P. Jaillet, A.R. Odoni, A priori optimization, Oper. Res. 38 (1990)
1019�1033.
[99] C. Bastian, A.H.G. Rinnooy Kan, The stochastic vehicle routing problem revisited,
Eur. J. Oper. Res. 56 (1992) 407�412.
[100] W.C. Benton, M.D. Rossetti, The vehicle scheduling problem with intermittent cus-
tomer demands, Comput. Oper. Res. 19 (1992) 521�531.
[101] M. Dror, Vehicle routing with uncertain demands: stochastic programming and its cor-
responding TSP solution, Eur. J. Oper. Res. 64 (1992) 432�441.
[102] G. Laporte, F.V. Louveaux, H. Mercure, The vehicle routing problem with stochastic
travel times, Transport. Sci. 26 (1992) 161�170.
[103] P. Trudeau, M. Dror, Stochastic inventory routing: route design with stock outs and
route failure, Transport. Sci. 26 (1992) 171�184.
[104] D.J. Bertsimas, A vehicle routing problem with stochastic demand, Oper. Res.
40 (1992) 574�585.
[105] M. Dror, G. Laporte, F.V. Louveaux, Vehicle routing with stochastic demands and
restricted failures, Math. Method Oper. Res. 37 (3) (1993) 273�283.
[106] B. Bouzaiene-Ayari, M. Dror, G. Laporte, Vehicle routing with stochastic demands
and split deliveries, Found. Comput. Decision Sci. 18 (1993) 63�69.
[107] G. Laporte, F.V. Louveaux, The integer L-shaped method for stochastic integer pro-
grams with complete recourse, Oper. Res. Lett. 13 (1993) 133�142.
[108] N. Secomandi, Exact and heuristic dynamic programming algorithms for the vehicle
routing problem with stochastic demands. Ph.D. thesis, Department of Decision and
Information Sciences, University of Houston, Houston, TX, 1998.
[109] C. Hjorring, J. Holt, New optimality cuts for a single-vehicle stochastic routing prob-
lem, Ann. Oper. Res. 86 (1999) 569�584.
[110] W. Yang, K. Mathur, R.H. Ballou, Stochastic vehicle routing problem with restocking,
Transport. Sci. 34(1) (2000) 99�112.
[111] N. Secomandi, A rollout policy for the vehicle routing problem with stochastic
demands, Oper. Res. 49(5) (2001) 796�802.
[112] G. Laporte, F. Louveaux, L.V. Hamme, An integer L-shaped algorithm for the
capacitated vehicle routing problem with stochastic demands, Oper. Res. 50 (2002)
415�423.
[113] H. Markovic, I. Cavar, T. Caric, Using data mining to forecast uncertain demands in
stochastic vehicle routing problem, 13th International Symposium on Electronics in
Transport (ISEP), Slovenia, 2005, pp. 1�6.
[114] K. Chepuri, T. Homem de Mello, Solving the vehicle routing problem with stochastic
demands using the cross entropy method, Ann. Oper. Res. 134 (2005) 153�181.
[115] M. Dessouky, F. Ordonez, H. Jia, Z. Shen, Rapid distribution of medical supplies, Int.
Ser. Oper. Res. Manag. Sci. 91 (2006) 309�338.
[116] C. Novoa, R. Berger, J. Linderoth, R. Storer, A Set-Partitioning-Based Model for the
Stochastic Vehicle Routing Problem, Technical Report 06T-008, Industrial and
Systems Engineering, Lehigh University, Bethlehem, PA, 2006.
[117] A. Ak, A.L. Erera, A paired-vehicle recourse strategy for the vehicle-routing problem
with stochastic demands, Transport. Sci. 41(2) (2007) 222�237.
[118] K.C. Tan, C.Y. Cheong, C.K. Goh, Solving multi objective vehicle routing problem
with stochastic demand via evolutionary computation, Eur. J. Oper. Res. 177 (2007)
813�839.
[119] D. Haugland, S.C. Ho, G. Laporte, Designing delivery districts for the vehicle routing
problem with stochastic demands, Eur. J. Oper. Res. 180 (2007) 997�1010.
151The Vehicle-Routing Problem

[120] F. Sungur, F. Ordonez, M.M. Dessouky, A robust optimization approach for the
capacitated vehicle routing problem with demand uncertainty, Inst. Ind. Eng. Trans.
40 (5) (2008) 509�523.
[121] H. Jula, M.M. Dessouky, P. Ioannou, Truck route planning in non-stationary stochastic
networks with time-windows at customer locations, IEEE Trans. Intell. Transport
Syst. 9 (2008) 97�110.
[122] Z. Shen, F. Ordonez, M.M. Dessouky, The stochastic vehicle routing problem for min-
imum unmet demand, Optim. Appl. 30 (4) (2009) 349�371.
[123] C.H. Christiansen, J. Lysgaard, A branch-and-price algorithm for the capacitated vehi-
cle routing problem with stochastic demands, Oper. Res. Lett. 35 (2009) 773�781.
[124] N. Secomandi, F. Margot, Reoptimization approaches for the vehicle-routing problem
with stochastic demands, Oper. Res. 57 (1) (2009) 214�230.
[125] C. Novoa, R. Storer, An approximate dynamic programming approach for the vehicle
routing problem with stochastic demands, Eur. J. Oper. Res. 196 (2009) 509�515.
[126] X. Li, P. Tian, S.C.H. Leung, Vehicle routing problems with time windows and sto-
chastic travel and service times: models and algorithm, Int. J. Prod. Econ. 125 (2010)
137�145.
[127] S.L. Smith, M. Pavone, F. Bullo, E. Frazzoli, Dynamic vehicle routing with priority
classes of stochastic demands, SIAM J. Contr. Optim. 48 (5) (2010) 3224�3245.
[128] W. Rei, M. Gendreau, P. Soriano, A hybrid Monte Carlo local branching algorithm
for the single vehicle routing problem with stochastic demands, Transport. Sci. 44 (1)
(2010) 136�146.
[129] J.E. Mendoza, B. Castanier, C. Gueret, A.L. Medaglia, N. Velasco, A memetic algo-
rithm for the multi-compartment vehicle routing problem with stochastic demands,
Comput. Oper. Res. 37 (2010) 1886�1898.
[130] C. Teodorovic, G. Pavkovic, The fuzzy set theory approach to the vehicle routing
problem when demand at nodes is uncertain, Fuzzy Sets Syst. 3 (1996) 307�317.
[131] R. Cheng, M. Gen, Vehicle routing problem with fuzzy due-time using genetic algo-
rithms, J. Fuzzy Theory Sys. 7(5) (1995) 1050�1061.
[132] B. Werners, M. Drawe, Capacitated vehicle routing problem with fuzzy demand,
Studies Fuzziness Soft Comput. 126 (2003) 317�336.
[133] R.J. Kue, C.Y. Chiu, Y.J. Lin, Integration of fuzzy theory and ant algorithm for vehi-
cle routing problem with time window, Proceedings of the IEEE Annual Meeting of
the Fuzzy Information[C] 2, 2004, pp. 925�930.
[134] H.M. Sheng, J.C. Wang, H.H. Haung, D.C. Yen, Fuzzy measure on vehicle routing
problem of hospital materials, Expert Syst. Appl. 30(2) (2005) 367�377.
[135] Y. He, J. Xu, A class of random fuzzy programming model and its application to vehi-
cle routing problem, World J. Model. Simulation 1 (2005) 3�11.
[136] Y.S. Zheng, B.D. Liu, Fuzzy vehicle routing model with credibility measure and its
hybrid intelligent algorithm, Appl. Math. Comput. 176 (2006) 673�683.
[137] J.J. Lin, A GA-based multi-objective decision making for optimal vehicle transporta-
tion, J. Inf. Sci. Eng. 24 (2008) 237�260.
[138] C. Erbao, L. Mingyong, A hybrid differential evolution algorithm to vehicle routing
problem with fuzzy demands, J. Comput. Appl. Math. 231 (2009) 302�310.
[139] C. Erbao, L. Mingyong, The open vehicle routing problem with fuzzy demands,
Expert Syst. Appl. 37 (2010) 2405�2411.
152 Logistics Operations and Management

[140] C.D. Tarantilis, C.T. Kiranoudis, A flexible adaptive memory-based algorithm for
real-life transportation operations: two case studies from dairy and construction sector,
Eur. J. Oper. Res. 179 (2007) 806�822.
[141] J. Teixeira, A.P. Antunes, J.P. de Sousa, Recyclable waste collection planning—a case
study, Eur. J. Oper. Res. 158 (2004) 543�554.
153The Vehicle-Routing Problem

This page intentionally left blank

9 Packaging and Material Handling
Mahsa Parvini
Faculty of Industrial Engineering, Amirkabir University, Tehran, Iran
Learning Objectives in Material Handling and Packaging
� To learn material-handling (MH) principles� To identify MH equipment� To know the utilization of unit loads role in MH� To know the MH designing systems process� To identify the functions performed by packaging� To identify labeling importance� To know how packaging affects logistics activities
9.1 Material Handling
9.1.1 History
MH is not a new subject. Human beings who first inhabited Earth were faced with
the problem of moving things. They needed to transport both themselves and the
materials they needed for their existence.
History has recorded continual progress in MH. Probably one of the greatest
achievements in the ancient world was the construction of the pre-Inca temple near
Cuzco, Peru. Stones weighing as much as 20 tons were quarried at the bottom of a val-
ley and moved more than 2000 feet up to the temple site. In 1913, the Ford Motor
Company instituted the first mechanized progressive-assembly line. World War II
stimulated the implementation of MH mechanization. Companies that had government
cost-plus contracts were encouraged to make capital expenditures for MH equipment.
Progress in current modern facilities is evident in the use of both mechanized
and automated MH equipment to provide desired efficiencies [1].
9.1.2 Definition
One idea of how the concepts of material management, physical distribution man-
agement, and business logistics are related is that they overlap in MH, which can
be described as the systematic physical movement of materials. The areas of
Logistics Operations and Management. DOI: 10.1016/B978-0-12-385202-1.00009-8
© 2011 Elsevier Inc. All rights reserved.

overlap present management with its most serious MH problems. The most impor-
tant areas that are influenced by MH are shown in Figure 9.1.
The following are some of the definitions of MH.
1. In Ballou’s definition, MH is physically moving objects or goods in small quantities over
relatively short distances [3].
2. The way materials and products are handled physically is the subject of MH movement.
To this point, the emphasis has been on the movement of products that are packaged in
customer-sized boxes [4].
3. For Magad and Amos, MH is the art and science of moving, storing, protecting, and con-
trolling materials [1].
4. MH means providing the right amount of the right material, in the right condition, at the
right place, in the right position, in the right sequence, for the right cost by the right
methods [5].
The first definition conveys the fact that MH is a physical movement between
short distances. It is an activity that takes place in warehouses, production facilities,
and retail stores and also between transportation modes, so it must be repeated
many times [6]. In the second definition, the emphasis is on the concept of building
blocks: MH is moving products as building blocks such as boxes, bottles, and
cans [4].
The first and second definitions regard MH as a science that studies the move-
ment of physical materials, whereas the third and fourth definitions consider MH
also to be an art. The third definition conveys the fact that the MH design process
is both a science and an art, and that MH function involves moving, storing, pro-
tecting, and controlling materials. It is a science-based discipline involving many
areas of engineering, so engineering design methods must be applied. Thus, MH
Purchase
Distribution
Marketing
Materialsmanagement
Materials handling
Business logistics
Physicaldistribution
management
Figure 9.1 The movement of goods [2].
156 Logistics Operations and Management

design process involves defining the problem, collecting and analyzing data, gener-
ating alternative solutions, evaluating alternatives, selecting and implementing pre-
ferred alternatives, and performing periodic reviews. It is an art because MH
systems cannot be explicitly designed based solely on scientific formulas or mathe-
matical models. As mentioned in the fourth definition, MH requires knowledge and
appreciation of right and wrong, which is based on significant practical experience
in the field [6].
The fourth definition exactly explains the abstract of the MH functions. The
right amount refers to the problem of how much material is needed. The right
material refers to the fact that an accurate identification system is needed. The
right condition is the state in which the customer desires to receive the material.
The right sequence of activities affects the efficiency of a manufacturing or distri-
bution operation in MH. The right place addresses both transportation and storage.
The right time means on-time delivery. The right cost does not mean the lowest
cost. Minimizing cost is solely the wrong objective in MH system design. The
more appropriate goal is to design the most efficient MH systems at the most
reasonable costs [6].
9.1.3 MH Principles
No mathematical model can provide extensive solutions to overall MH problems.
Applying experience is an important key in managing the MH processes. MH prin-
ciples are the essence of practical experience. Condensed from decades of expert
MH experience, these principles provide guidance and perspective to those who
design MH systems.
These are some of the MH principles that have been developed by the College
Industry Council on Material Handling Education after designing and testing MH
systems through rigorous engineering analysis. Some of the principles are the
results of Eastman’s experiences in practice [4]. The principles are more important
when laying out the intended design or when troubleshooting to discover why a
system is not performing well. The principles are as follows [1].
� Orientation principle: Look at the entire system and study it first to learn how it operates.
Identify the system components and their relationships. Also, look at relationships to
other systems to find physical limitations.� Planning principle: Prepare a plan to meet the basic requirements. In a reasonable form,
an MH plan identifies the material (what), the moves (when and where), and the method
(how and who).� Systems principle: Integrate the handling, packaging, and storage activities that make up
a coordinated system.� Unit-load principle: Pick up products as a unit.� Space utilization principle: Optimize the utilization of all space.� Standardization principle: Standardize the methods and equipment employed. Reduce
customization.� Ergonomic principle: Adapt working conditions to workers’ needs and abilities.
157Packaging and Material Handling

� Energy principle: Reduce energy consumption by the MH activities.� Ecology principle: Minimize adverse effects on the environment when selecting MH sys-
tem components.� Mechanization principle: Use machines, where they can be justified, to replace human
effort.� Flexibility principle: Use methods and components that can work with reasonable toler-
ance and can perform a variety of tasks.� Simplification principle: Change handling procedures by eliminating, decreasing, or com-
bining unnecessary movements or equipment.� Gravity principle: Rely on gravity to move materials easily wherever possible.� Safety principle: Provide safe MH system components to handle the entire system.� Computerization principle: Use computers to operate both individual pieces of equipment
and massive supply chains spread across several continents.� Systems flow principle: Integrate data flow with the physical material flow in handling to
make a coordinated system.� Layout principle: Organize an operation sequence and equipment layout for all variable
system solutions.� Cost principle: Recognize that all MH alternatives have associated costs and that these
costs must be carefully considered as the system is devised. Investment proposals must be
presented to top management for approval.� Maintenance principle: Schedule a plan for maintenance on MH equipment.� Obsolescence principle: Establish a long-term and economical program to replace obso-
lete equipment and methods, paying special consideration to after-tax life-cycle costs.� Automation principle: Apply electronics and computer-based systems to operate and con-
trol the entire system activities.� The team-solution principle: Collaborate with MH team members to devise the best
system.� The just-in-time principle: Hold products that are not moved until needed.� Minimum travel principle: Systems should be set up so that loads move the shortest
distances.� Using the right equipment: Use equipment that is needed for MH.� Designing capacity for present and future: Consider the development of MH systems in
future system design.� Developing technological assessments: Prepare assessments that make operations simple
with using technological facilitates.� Using the systematical approach: Consider the components and their relationships as an
integrated system to unify them and increase efficiency.
9.1.4 MH Equipment
MH equipment and systems often represent a major capital expenditure for an orga-
nization to set up. The decisions related to the MH can affect many aspects of the
organization operations.
Equipment analysis is an important part of analyzing an MH system. A reason-
able solution often requires more than one individual piece of equipment. The vari-
ous pieces of equipment that comprise an integrated system are needed. Materials
management personnel who are involved in developing solutions must become
acquainted with the diverse types of MH equipments and their applications [2].
158 Logistics Operations and Management

The following are some of the criteria for selecting MH equipment.
� Cost� Reliability and maintainability� Service facilities� Operating characteristics� Safety and environmental characteristics� Compatibility and the system’s concepts
MH equipment is classified as continuous (e.g., conveyors), discontinuous (e.g.,
cranes and industrial trucks), or potential movement (e.g., unit-load equipment, pal-
lets, and containers) [2].
In some studies such as Stock and Lambert’s research on logistics management
issues, automation is the classification base in the first level. In another point of
view, applications are used for the classification base [6]. This list includes almost
all MH equipment as follows.
1. Containers and unitizing equipment
A. Containers
1. Pallets
2. Skids and skid boxes
3. Tote pans
B. Unitizers
1. Stretch wrap
2. Palletizers
2. Material-transport equipment
A. Conveyors
1. Chute conveyor
2. Belt conveyor
3. Roller conveyor
4. Wheel conveyor
5. Slat conveyor
6. Chain conveyor
7. Tow-line conveyor
8. Trolley conveyor
9. Power and free conveyor
10. Cart-on-truck conveyor
11. Storing conveyor
B. Industrial vehicles
1. Walking
2. Riding
3. Automated
� Automated guided vehicles
� Automated electrified monorail
� Sorting transfer vehicles
C. Monorails, hoists, and cranes
1. Monorail
2. Hoist
3. Cranes
159Packaging and Material Handling

3. Storage and retrieval equipment
A. Unit-load storage and retrieval
1. Unit-load storage equipment
� Pallet-stacking frame
� Single deep selective rack
� Drive-in rack
� Mobile rack
2. Unit-load retrieval equipment
� Walkie stacker
� Counterbalance lift truck
� Narrow-aisle vehicle
� Automated storage (AS) retrieval machines
B. Small-load storage and retrieval
1. Operator-to-stock storage equipment
� Bin shelving
� Modular storage drawers
2. Operator-to-stock retrieval equipment
� Picking cart
� Order-picker truck
3. Stock-to-operator equipment
� Carousels
� Vertical lift module
� Automated dispenser
4. Automatic data-collection and communication equipment
A. Automatic identification and recognition
1. Bar coding
2. Optical character recognition
3. Magnetic strip
4. Machine vision
B. Automatic paperless communication
1. Radiofrequency data terminal
2. Voice headset
3. Light and computer aids
4. Smart card
9.1.5 Unit-Load Design
Baily and Framer define a unit load as a standardized combination of a number of
items into an integrated one that can be handled as a single item. Reasonable rea-
sons for designing unit loading include making the MH easier, reducing costs, and
increasing transportation security. The elementary principle behind the unit load is
making smaller units more convenient, economical, and easier to handle, transport,
and store [2].
Unit load is an extension of the building-block concept to large quantities.
Based on that concept, unit loading involves securing boxes to a pallet; the boxes
or containers secured to a pallet are a unit load. The term unitization describes this
kind of handling [3].
160 Logistics Operations and Management

The high cost of manual labor has made the individual handling of small
packages and items prohibitively expensive. If a number of items can be handled
as a unit, then MH costs are reduced by moving larger loads, which eliminates
unloading and reloading, cuts travel time, uses space more efficiently, reduces
inventories, and facilitates shipping, transport, and receiving [6].
The size and type of unit load depend on a whole range of factors, the most
important being the goods or materials to be handled; the size, weight, strength,
and shape of intermediate packs; the type of storage required; the type of transport
required; the type of handling equipment that may be available; and the quantities
of goods and materials to be handled [2].
The unit load has several advantages. First, it adds protection to the cargo
because the pallets are secured by straps, shrink-wrapping, or some other bonding
device. Second, because removing a single package or its contents is difficult, pil-
ferage is discouraged. Third, the unit load enables mechanical devices to be substi-
tuted for hand labor. Many machines have been devised that can quickly build up
or tear down a pallet load of materials. Robots can be used when more sophisti-
cated integrated movements are needed for loading or unloading. Ballou [3] pre-
sented an example of robot-assisted palletizing and depalletizing in the printing
industry in which bundles of printed pages must be stacked in a specified order.
Unit-Load Criteria
Two important limits that help determine the unit-load design are those for size
and weight. The unit-load size must be standardized so it can be handled easily and
economically with modern equipment. Some unit loads may be bigger or smaller to
meet other criteria and/or product characteristics.
The weight of the unit load must be kept within the capacities of the MH equip-
ment and the storage facilities. Unit loads of some high-density materials such as
steel, flour, and stone are smaller than optimal size in order to keep the unit-load
weight within limits [3].
The unit load calls for a standard base or container. Among the possibilities are:
� Pallets� Stillages� Skids� Slip sheets� Containers� Self-contained cartons� Intermediate bulk containers
9.1.6 Designing MH Systems
Design is the most important step in operating an MH system that will accomplish
its objectives. From a variety of possible alternatives, the designer selects one set
that will result in an efficient and economic system.
161Packaging and Material Handling

The design process is not a well-defined algorithm that the designer can follow
through to a successful outcome. It is both a procedure and an art based on empiri-
cal experience, engineering knowledge, and ingenuity.
The MH systems design process involves the following six-step engineering
design process [5]:
1. Define the problem and identify the system scope and objectives of the MH system.
2. Identify the requirements and analyze them for moving, protecting, and controlling
materials.
3. Generate alternative designs for satisfying the MH system requirements.
4. Evaluate alternative MH system designs.
5. Select the preferred design for moving, protecting, and controlling materials.
6. Implement the selected design, including selecting suppliers and equipment, training per-
sonnel, installing equipment, and periodically auditing system performance.
Problem Definition
MH problems must be first identified clearly so that a solution can be achieved.
Existing operations should be reviewed, beginning with receiving activities and
continuing all the way to final shipment.
The problem may arise from a critical incident, management’s perception that
improvement is needed, competitive pressures, or even other parts of company
such as warehouses.
The objectives of MH systems are the end results that the system is expected to
accomplish. As Stock and Lambert mentioned in their research, a typical objective
is cost reduction. Others may be better customer service, greater space productivity,
increased efficiency, or decreased accidents and damages. Those criteria which
measure the extent to which the systems design is expected to meet the
objectives [6].
Analyzing the Requirements
The next step is to analyze the problem and related information gathered so far
based on the problem definition. The designer reviews what has been learned and
what there is to work with. A major result of this analysis is limiting the number of
alternatives to be investigated based on the objectives that are identified in the pre-
vious step. Careful selection of the most promising choices to investigate is the key
to efficient use of engineering resources and to a successful design outcome.
Another outcome is determining any additional data that must be collected and any
additional changes that must be made in the problem statement, objectives, and
constraints [6].
Analytical techniques can provide valuable information for the design and deci-
sion-making process in this step. Some of these techniques are as follows [1].
From�to chart: A from�to chart is a matrix used to summarize information regarding
material movement between related predefined nodes. It can be used to prepare material
162 Logistics Operations and Management

flow patterns, compare alternative, identify bottlenecks, and determine candidates for
mechanization and automation.
Flow-process chart: The flow-process chart is a step-by-step record of activities per-
formed to accomplish a task. The flow-process chart is useful for analysis and for deter-
mining improvements, such as combining operations, eliminating unnecessary handling,
simplifying a method, or changing a sequence or routing.
Flow diagram: The flow diagram is a graphical outline of the steps in a process similar
to a flow-process chart. It is valuable for obtaining a macroperspective on the entire
activity.
Product quantity (PQ) chart: The PQ chart is a graphical record of various products,
parts, or materials produced or used for a particular time period. Quantities should be
related to standard unit loads.
Simulation and waiting line analysis: These two analytical techniques help designers to
simplify the problem analysis.
Developing Alternatives
To help develop alternative MH system designs, the MH system equation may be
useful. The equation gives the key for identifying solutions to MH problems. It
determines three important system components: What defines the type of materials
moved, where and when identify the place and time requirements, and how and
who point to the MH methods. These questions all lead us to the system.
The MH system equation is given by [7]:
Materials1Moves1Methods5 System
Evaluating Alternatives
The objective of this step is to determine the value of alternative MH systems so
that the designer can find the optimum solution. Economic analysis is an obligation
for determining the best solution to a problem. It is also important in preparing a
justification of capital expenditures for consideration and approval by upper man-
agement. Basic methods of cost comparison are discussed below.
Payback period: The most commonly used method for economic analysis—payback
period—is the easiest method to compute and understand. It computes the time period
required for estimated project savings to equal the investment. A serious shortcoming is
the assumption that one alternative is better than another because it pays for itself more
rapidly.
Return on investment (ROI): Unlike the payback period method, the ROI method takes
into consideration the equipment’s useful life. Normally, it relates net profit after taxes
and depreciation to the total investment, thus indicating what each alternative will earn
with respect to the investment.
Discounted cash flow (DCF): DCF computes the total present worth of cash flow over
the project’s life, using an interest rate equal to the company’s minimum required rate of
ROI. This method considers the present value of money after interest payments have
been added to it over a period of time. Basically, it finds the interest rate that discounts
future earning of the project alternative down to a present value equal to the project cost.
163Packaging and Material Handling

Some noneconomic factors can help the designer evaluate alternatives:
� Capacity� Ability to handle the product� Maintainability� Reliability� Damage and safety� Compatibility� Installation and lead time
Selecting the Preferred Design
In this step, all of the design alternatives that were evaluated in the previous steps
are compared with each other, and the one that satisfies the objective is selected. If
the MH system follows more than one objective, then the multicriteria decision
methods will help the designer select the right alternative that will satisfy the
majority of objectives.
Implementing the System
Implementation means to give practical effect to and ensure actual fulfillment by
concrete measures. In this step, the approved MH project is implemented into a
physical operating system which moves materials. The effectiveness with which
implementation is carried out will determine the degree of success attained by the
MH system.
This step includes the following tasks.
Organize for implementation: The quality of the design, the smoothness of installation,
and the efficiency of the resulting system all depend on good organization and competent
personnel.
Determine roles in implementation: The MH system designer works with many other
departments and individuals in the design and installation of an MH system. Some of
these have the authority to require changes in design and operation. Others may be spe-
cialists who can furnish valuable advice on some facets of the system design. The system
designer must be able to work with all those involved to secure the best results.
Determine the implementation procedure: After the MH system design has been
approved, the system designer has to coordinate carrying out the plan and installing the
system. This requires considerable efforts, good technical abilities, and personnel skills.
Train personnel: It is not a necessary part of project implementation to train operating
and maintenance personnel in new methods and equipment, but this may be a major effort
as in a factory introducing new developed equipment for the first time. On the other
hand, little new training may be required if the system is similar to existing ones [6].
9.1.7 MH Costs
MH represents a major portion of total costs for almost every type of business.
Depending on the nature of industry and the type of facility, MH may include
10�80% of total costs. MH adds cost, but not value; hence, companies try to
164 Logistics Operations and Management

reduce their MH costs. Reducing their total MH costs allows a profit-oriented busi-
ness to maintain a competitive edge over its competition.
To control MH costs, an analyst should review possible cost-reduction projects
in order to identify general sources of potential savings. According to Magad and
Amos [1], the majority of MH costs is related to space, labor, inventory, equip-
ment, and waste. These factors and their effects on costs are explained as follows.
Space: Improvement in space unitization can reduce costs. One of the most effective
options is to make use of air right or cube space. For instance, by increasing the storage
height from 12 to 16 feet, one company increased its space unitization by 33%.
Labor: Automated and mechanized systems can considerably reduce labor costs. For
example, the US Postal Service installed automatic mail-handling and -processing equip-
ment to reduce labor costs and to improve flow. It reduced the error rate from 4% to 1%
and increased letter sorting from 600 to 35,000 letters per hour.
Inventory: One objective of most businesses is to minimize inventories, because inventory
reduction offers tremendous cost-reduction opportunities. Storing inventories increases
holding cost for the company. Material-management programs that have been instituted
to accomplish this objective include kanban, just-in-time, and material requirement plan-
ning (MRP). For example, the Schwitzer Turbochargers company implemented an MRP
system that called for the installation of two AS and automated retrieval (AR) systems.
The equipment was justified by a 30% inventory reduction.
Equipment: Developments in MH equipment can reduce costs. Numerous illustrations
can be found in the transportation industry. For example, in cargo ship loading and
unloading, every day a ship is in port means increased costs for the operating company,
so it is critical that loading and unloading be performed expeditiously. Container ships,
which are designed to transport containers that hold large amount of materials, are being
used because they can be loaded and unloaded in record time.
Waste: Optimized materials management systems require good-quality materials.
Concentrated efforts to eliminate the waste of damaged materials through best handling
techniques and personnel-training programs will reduce costs by decreasing damage to
materials.
Estimating MH Cost
Studies show that MH in a typical industrial firm accounts for 25% of all employ-
ees, 55% of all factory space, and 87% of production time. Another study shows
that as much as 60% of total production cost refers to MH costs. In another point
of view, 20�30% of direct labor costs and 50�70% of indirect labor costs refer to
MH costs, so MH is one activity where many improvements can be achieved,
resulting in significant cost saving.
Logistics-related costs are dynamic and do not readily fit with traditional
accounting methods. The accounting difficulties become more pronounced when
management tries to determine costs for a particular operation or a particular cus-
tomer or to evaluate, outsource, or gain shared opportunities [8]. As an element of
logistics, MH is no exception. Estimating the cost of MH alternatives and compo-
nents is not a trivial task. At one end of the spectrum is a “rough-cut” method that
uses standard data and rules of thumb. As an example of the use of rules-of-thumb
165Packaging and Material Handling

data, one can get a reasonably accurate estimate of the purchase cost of specifying
several walkie pallet jacks by using the unit cost of each walkie pallet jack. Use
rules of thumb with caution.
At the other end of the MH cost-estimation spectrum is the use of detailed cost-
estimation models based on engineering information. For instance, to estimate a
MH equipment cost, a cost model must be presented based on different equipment
size and alternative components.
For the design of more accurate MH systems, the interactions among the various
components of the MH system design must be verified. More systematic appro-
aches such as simulation analysis are needed to perform these verifications [5].
9.1.8 MH System Models
The importance of material-handling system selection (MHSS) and facility design
in terms of production is widely recognized. Various approaches to the problem
have been developed. However, the complexity of the involved issues in develop-
ing mathematical modeling-based approaches increase difficulties.
Attempts have been made to optimize the material flow system design but
not the overall manufacturing operations. It is necessary to improve overall
manufacturing operations and to integrate material flow design in the manufactur-
ing system.
In recent years, there have been efforts to integrate MHSS problems.
Chittratanawat and Noble [9] presented an integrated model for solving both MH
and operation allocation (OA) problems. The integrated model was formulated as a
nonlinear mixed-integer program. The model simultaneously determined the facil-
ity locations, pickup and dropoff points, and equipment. The approach integrated
many of the significant factors in the facilities design while minimizing the overall
facility design costs [10]. Then Paulo [11] and Paulo et al. [12] presented a 0�1
integer-programming formulation consisting of OA and MHSS submodels. The
objective of the MHSS submodel was to maximize the compatibility between the
MH equipment and the part types, as well as the ability of the MH equipment to
perform the required tasks.
Lashkari [13] presented an integrated model of OA and MH selection in cellular
manufacturing systems based on the work reported by Paulo and Paulo et al.
In this section, we will consider the mathematical model modified and extended
by Lashkari as an example of mathematical models that were recently studied.
MHSS Mathematical Model
The 0�1 integer-programming model of MHSS is explained in the following. In
this model, the decision variables were modified to include the index p.
Consider the set of n part types and the set of m machines as in the OA model.
A part type i can be described in terms of five key product variables—complexity,
precision, lot or batch size, diversity, and mass or linear dimension—that define
166 Logistics Operations and Management

the choices of manufacturing technology associated with its conception; these are
labeled by indices t5 1 . . . 5.h: operation, h5 1 . . . H.h: suboperation, h5 1 . . . H.hh: operation and suboperation combination, as e5 1 . . . E.Yhhejs(ip): 0�1 decision variable, Yhhejs(ip)5 1 if (hh) requires MH equipment e
at machine j where manufacturing operation s of (ip) is performed.
The objective is to generate the “most compatible” MH selection for a given
mix of part types and MH requirements. Thus, the objective function is to maxi-
mize the following index, which represents the overall compatibility of the MH
equipment and the part types:
XE
e51
XH
h51
XH
h51Whhe
Xn
i51Cei
XPðiÞp51
XSðipÞs51
XjAJips
AsjðipÞαhhsjipYhhejsðipÞ
where
Cei 5 12
PT5 5t5 1 Wet 2 Wit
�� ��5T
The parameter Cei is a measure of the compatibility of a piece of equipment and
a part type, and it is experimentally constructed to evaluate a value between 0
and 1, where 0 indicates incompatibility and 1 indicates complete compatibility.
The three rating factors (Whhe, Wet, and Wit) are largely subjective and represent
an attempt to capture the relationships between the ability of MH equipment to
perform various MH operations and the part types and their technological
characteristics.
αhhsjip5 1 if operation s of (ip), to be performed at machine j, requires (hh), and
0 otherwise.
The following constraint sets are needed to ensure that the respective conditions
are met.
1. Only one type of MH equipment is chosen to perform (hh), associated with operation s of
(ip) at machine j:XeAEips
YhhejsðipÞ5AsjðipÞαhhsjip ’ s;ðipÞ;j;h;h
2. The selection of a piece of MH equipment e may depend on the prior selection of another
piece of MH equipment e. This set of constraints is provided to allow precedence rela-
tionships that may exist in the assignment of MH equipment:
De #De ’ e;e
where De5 1 if a piece of equipment e has been chosen and 0 otherwise, and similarly
for De.
167Packaging and Material Handling

3. If a piece of MH equipment is chosen, then at least one (hh) must be assigned to that
equipment:
Xn
i5 1
XH
h5 1
XH
h5 1
XPðiÞp5 1
XSðipÞs5 1
XjAJips
AsjðipÞαhhsjipYhhejsðipÞ$De ’ e
4. The total time for all the jobs assigned to a piece of MH equipment does not exceed the
time available on it. It is given by:
Xn
i51diXH
h51
XH
h51
XPðiÞp51
XSðipÞs51
XjAJips
thheAsjðipÞαhhsjipYhhejsðipÞ#TeDe ’ e
where thhe is the time required by MH equipment e to perform (hh), and Te is the time
available on the MH equipment e.
Assembling the above, we get the following complete statement of our 0�1
integer-programming model of the MHSS, which is designated as P(MHSS):
MaximizeXE
e5 1
XH
h5 1
XH
h5 1
Whhe
Xn
i5 1Cei
XPðiÞp5 1
XSðipÞs5 1
XjAJips
AsjðipÞαhhsjipYhhejsðipÞ
where
Cei 5 12
PT 5 5t5 1 Wet 2 Wit
�� ��5T
Subject to
XeAEips
YhhejsðipÞ5AsjðipÞαhhsjip ’ s;ðipÞ; j;h;h
De #De ’ e;e
Xn
i5 1
XH
h5 1
XH
h5 1
XPðiÞp5 1
XSðipÞs5 1
XjAJips
AsjðipÞαhhsjipYhhejsðipÞ$De ’ e
Xn
i51diXH
h51
XH
h51
XPðiÞp51
XSðipÞs51
XjAJips
thheAsjðipÞαhhsjipYhhejsðipÞ#TeDe ’ e
½YhhXejsðipÞ;De;De�A 0;1f g ’ i;p;s;j;h;hAJips
168 Logistics Operations and Management

The assignments determined by the model (i.e., the Yhhejs(ip)) are then summa-
rized in the matrix Bsje(ip) where an element {bsje(ip)} is equal to 1 if operation s
of (ip) is performed at machine j using MH equipment e to transport the part to the
next machine, and 0 otherwise. The matrix B provides the necessary information
about the assignment of the MH equipment to perform various operations of (ip) so
as to enable P(OA) to compute the MH costs in its objective function. At the same
time, it reduces the choices of MH equipment in the set Eips as iterations continue.
The matrix Bsje(ip) forms the feedback link between P(MHSS) and P(OA), thus
completing the loop.
9.2 Packaging
9.2.1 History
Iron and tin-plated steel were used to make cans in the early nineteenth century.
Paperboard cartons and fiberboard boxes were first presented in the late nineteenth
century [14].
Packaging advances in the early twentieth century included Bakelite closures on
bottles, transparent cellophane overwraps and panels on cartons, and increased pro-
cessing efficiency, much of it helping to improve food safety. As additional materi-
als such as aluminum and several types of plastic were developed, they were
incorporated into packages to improve performance and functionality [15].
9.2.2 Definition
Packaging is an important warehousing and material-management concern, one that
is closely tied to warehouse efficiency and effectiveness. An appropriate packaging
increases service, decreases cost, and makes for better handling. Good packaging can
have a positive impact on layout, design, and overall warehouse productivity [7].
Packaging has also been defined as the science, art, and technology of enclosing
products for distribution, storage, sale, and use. Packaging also refers to the process
of design, evaluation, and production of packages [15].
9.2.3 Functions of Packaging
In terms of the different requirements to which packaging are subjected, Garcıa-
Arca et al. [16] associate packaging with three large functions: marketing, logistics,
and environmental.
In its marketing function, the package presents customers with information
about the product and promotes the product through the use of color and shape.
The central purpose of the environmental function is to optimize packaging
while minimizing packaging waste wherever appropriate and to reuse or recycle.
169Packaging and Material Handling

The logistics perspective focuses on two aspects. First, it provides protection for
the product. Second, it is an instrument for improved distribution efficiency
Figure 9.2.
More specially, packaging performs the following functions.
1. Containment: Products must be contained before they can be moved from one place to
another to protect them.
2. Apportionment: Make the large output of manufacturing into smaller quantities of
greater use to customers. It results in manageable, desirable, and consumer-sized
productions.
3. Convenience: Packages can have features that add convenience in distribution, handling,
display, sale, opening, reclosing, use, and reuse.
4. Information transmission: Packages and labels communicate how to use, transport, recy-
cle, or dispose of a package or product. With pharmaceuticals, food, medical, and chem-
ical products, some types of information are required by the governments.
5. Portion control: Partitioning large package or bulk commodity into packages makes for
more suitable sizes for individual households and aids inventory controls.
6. Unitization: To unitize primary packages into secondary packages, the secondary
packages are unitized into a container that is loaded with several pallets. This decreases
the number of times a product must be handled.
7. Physical protection: The package protects the enclosed object from physical items,
shock, vibration, compression, and temperature, among other forces.
8. The barrier protection: Keeping the contents clean, fresh, and safe for the intended shelf
life is a main function. Some packages contain desiccants or oxygen absorbers to help
extend shelf life. Modified atmospheres or controlled atmospheres are also maintained
in some food packages.
9. Security: Packaging can play an important role in reducing the security risks of ship-
ment. Packages can be made with improved tamper resistance to deter tampering and
also can have tamper-evident features to help indicate tampering. Packages can be
ContainmentSecondaryfunction
Basicfunction
Mechanicalhazard
Chemicalhazard
Environmentalhazard
Reclosability
Carrying
Dispensingfacilities
OpenabilityLabeling
Hold product Quality
Compatability
Constraints
Protection andpreservation
Identification andinformation
Containment
Functions ofpackaging
Userconvenience
Figure 9.2 Functions of packaging [15].
170 Logistics Operations and Management

engineered to help reduce the risks of package pilferage: some package constructions
are more resistant to pilferage, and some have pilfered indicating seals. Packages may
include authentication seals to help indicate that the package and its contents are not
counterfeit. Packages can also include antitheft devices, such as dye packs, radiofre-
quency identification (RFID) tags, or electronic article surveillance tags, that can be
activated or detected by devices at exit points and that require specialized tools to deac-
tivate. Using packaging in this way is a means of loss prevention.
10. Marketing: Encouraging potential customers to prepare the product by means of labels
and packages is the exact meaning of marketing function. Marketing communications
and graphic design are applied to the surface of the package and the point-of-sale display.
9.2.4 Packaging Operations
It is clear that a packaging function includes the basic packaging operations of fold-
ing, inserting, wrapping, sealing, and labeling. The procedure is as follows. The pack-
aging is first folded from its collapsed form and then the product is inserted into the
folded package, which is then wrapped with a packaging sheet before it is sealed by
tape. Finally, identification labels such as bar codes are either stuck or printed on.
9.2.5 Packaging Equipment
Using the proper packaging equipment is so important in accomplishing the pack-
aging functions at lowest possible costs. Equipment for this purpose may be
defined as any device or contrivance that assists in the accomplishment of a task
[15].
In the broadcast sense, two classes of packaging equipment are employed: first,
equipment to fabricate packaging materials and containers; second, equipment
employed by the user to utilize packaging materials and containers. Under certain
conditions, users may find it economical to incorporate in their operations, com-
plete or partial, packaging material or container fabrication equipment. In these
instances, users perform the function of packaging suppliers.
Packaging equipment employed by the user is often designed for a specific
material or container; as such, it cannot be isolated in the discussion of a particular
packaging practice. Therefore, many of the aids utilized in such operations as clo-
sure forming, reinforcing, bundling, and easy opening have been in conjunction
with a particular material or container type.
For simplicity, packaging equipment is best classified by function. The follow-
ing items represent the major functions that can be performed by packaging
equipment:
1. Forming and assembly
2. Filling, loading, and overwrapping
3. Weighing and counting
4. Closing and sealing
5. Bundling, unitizing, and reinforcing
6. Identifying
7. Miscellaneous
171Packaging and Material Handling

9.2.6 Labeling
After the material is being packaged, it is placed into a box and enclosed by the
cover. At this point, it becomes necessary to identify and label the box. Package
labeling is any type of communication such as written, electronic, or graphic on
the packaging-associated label. Whether words or code numbers are used depends
on the nature of the product and its vulnerability to pilferage. Retroflexed labels
that can be ready by optical scanners may also be applied.
Labeling of consumer packages and products such as bottles, cans, and folding
cartons is frequently an integral part of the filling, packing, closing, and weighing
operations. Labels are affixed by specialized high-speed, fully automatic equip-
ment, and the principal considerations are machine performance, economy, and
appearance [15].
The choice of color and typography in labeling often is very important in cus-
tomer acceptance, use, and response. Indeed, the success or failure of a packaged
product can be attributed to the manner and style in which it is identified [17].
Labeling Regulations
Many regulations govern the labeling of customer-size packages, including the
labeling of weight, specific contents, and instructions for use. Today, many of these
must also be placed outside the larger cartons because some retail outlets sell in
carton lots, and buyers do not see the consumer packages until they reach home.
For instance, most countries have some laws governing food labeling. These are
spread over many reforms and parliamentary acts, making the subject complex.
Nevertheless, the following general laws should be implicit for any food product.1
Name: This must also inform the customer the nature of the product. It may also be nec-
essary to attach a description to the product name. However, certain generic names must
be used only for their conventional uses—for example, muesli, coffee, and prawns.
Ingredients: All ingredients of the food product must be stated under the heading
“Ingredients” and must be stated in descending order of weight. Moreover, certain ingre-
dients such as preservatives must be identified as such by the label “Preservatives,” a spe-
cific name (e.g., sodium nitrite), and the corresponding European registration number
colloquially known as an E number (e.g., “E250”).
Nutritional information: Although it is not a legal requirement to declare nutritional infor-
mation on a product, if the manufacturer makes the claim that the product is “low in
sugar,” then it must be supported with nutritional information (normally in tabulated
form). However, it is recommended to declare nutritional information because consumers
more than ever are investigating this information before making a purchase.
Medical or nutritional claims: Medical and nutritional claims are tightly regulated; some
are allowed only under certain conditions and others are not authorized at all. For exam-
ple, presenting claims that the food product can treat, prevent or cure diseases, or other
“adverse conditions” are prohibited. Claiming that a food is reduced in fat or rich in vita-
mins requires the food to meet compulsory standards and grades; in addition, the terms
must be used in the form specified in regulations.
1 Refer to http://en.wikipedia.org/wiki/Food_labeling_regulations
172 Logistics Operations and Management

Storage conditions: If there are any particular storage conditions for the product to main-
tain its shelf life, these must be pointed out. However, as a rule it is recommended to
always describe the necessary storage conditions for a food product.
Date tagging: There are two types of date tagging:� A use by date must be followed by a day or month (or both) that the product must be
consumed by.� A best before date is used to indicate when the product’s optimal quality will begin to
degrade: this includes when the food becomes stale, begins to taste “off,” or decays,
rots, or goes moldy.
Business name and address: In addition to the business name and address, it is necessary
to indicate the manufacturer or packager if it is independent of the main business and the
seller is established within the European Union.
Place of origin: The food is required to specify its place of origin, especially if the name
or trademark is misleading—for example, if a product called “English Brie Cheese” is
produced in France.
Instruction for use: This is only necessary if it is not obvious how to use or prepare the
product, in which case the consumer’s own initiative must be used.
Presentation: The label must be legible and easy to read. It must also be written in
English although the manufacturer may also include other languages.
Lot mark or batch code: It must be possible to identify individual batches with a lot mark
or batch code. The code must be prefixed with the letter L if it cannot be distinguished
from other codes although the date mark can be used as a lot mark. Manufacturers must
bear in mind that the smaller the size of a batch, the smaller the financial consequences
in case of a product recall.
Sectioning: All of the following must be in the same field of vision:� Product name� Date mark� Weight� Quantity� Alcohol strength (if applicable)
Standard specification: Indicate the level of the product’s standards compliance in
manufacturing and packaging.
Bear in mind that there are many other laws and European regulations for differ-
ent types of food products.
Labeling Techniques
Label materials: Labels are available in both cut and roll-stock forms. An advan-
tage of roll-stock labels is that there is less chance of a wild label occurring in the
roll. The rolls can also be easily and automatically inspected offline by a user to
double-check the label printer’s own quality control. Both forms generally are
made from paper, foil, film, or laminate structure. For special applications, they
can also be made from paperboard, fabrics, synthetic substrates, and even metals.
Label-application equipment: The equipment selected for the application of
labels is influenced by the type of label backing, the type and size of container to
which the label is to be affixed, and production or shipping requirements.
173Packaging and Material Handling

The methods used for various label backing previously recorded are as follows
[15].
1. Plain-back labels are used with high-speed labeling machines when economy is of utmost
importance. Spot or lap gluing is accomplished on this equipment with minimum glue
consumption. Frequently, portions of shipping documents that run through electronic
data-processing equipment later become ungummed shipping labels.
2. Gummed labels are more expensive than plain labels but require only simple moistening
for application. The application of gummed shipping labels is usually a manual operation.
Gummed labels for product identification can be applied with semi- or fully automatic
equipment.
3. Pressure-sensitive labels will adhere to nearly any type of smooth surface and do not
require moistening or gluing for application. The labels are adhered to a low-release
backing paper; removal of the label from the backing sheet can be accomplished manu-
ally or by machine.
4. Heat-seal-coated labels require a heating element to activate the thermoplastic adhesive.
Pressure of the label on the desired surface can be accomplished manually or by mechani-
cal means.
To compare cut and roll-stock label systems, see Table 9.1.
9.2.7 Protection Packaging
A protective package should perform the following functions [6]:
1. Enclose the materials, both to protect them and to protect other items from their effects.
2. Restrain them from undesired movements within the container when the container is in
transit.
3. Separate the contents to prevent undesired contact, such as through the use of corrugated
fiberboard partitions used in the shipment of glassware.
4. Protect the contents from outside vibrations and shocks.
5. Support the weight of identical containers that will be stacked above it as part of the
building-blocks concept.
Table 9.1 Comparison of Labeling Systemsa
Label Type
Characteristics Plain,
Cut
Heat-Seal,
Cut
Plain,
Roll
Heat-Seal,
Roll
P-S
Roll
Ease of operation E D C B A
Changeover time E D C B A
Cost of equipment A A B C A
Cost of labels A B A C C
Quality of printing A�B A�B B A�B A�B
Ease of code marking A B A B B
Servicing from supplies E E B A A
Avoidance of label mix-ups E E A A A
aA is best; E is poorest.
174 Logistics Operations and Management

6. Position the contents to provide maximum protection.
7. Provide for fairly uniform weight distribution within the package because most equip-
ment for the automatic handling of packages is designed for packages that have evenly
distributed weights.
8. Provide enough exterior surface area that identification and shipping labels can be
applied along with specific instructions such as this side up or keep refrigerated.
9. Be tamper-proof to the extent that the evidence of tampering can be noticed.
10. Be safe in the sense that the package itself (both in conjunction with the product carried
and after it has been unpacked) presents no hazards to customers or others.
9.2.8 Packaging for Distribution Efficiency
Packaging is an important factor in logistics, and its role and purpose are widely
discussed in the literature. The purpose of packaging can be summarized into four
main areas: information displays, improved materials handling, improved customer
service, and quality security [18].
These are some of the most important concerns to the logistician in packaging
design:
� Handling and storage� Strength, size, and configuration� Unitization� Containerization� Identification
As described, packaging is a significant factor in logistics, and it affects logistics
in three important domains: MH, transportation, and customer service.
Packaging Effects on Materials Handling
Packaging has an important impact on the MH function. Good packaging can have
positive impact on materials handling and vice versa. Poor packaging such as seen
with oversized packages can inhibit the MH operation. If the package is not
designed properly, the logistical system’s efficiency will decline. The ability to dis-
play and provide information is an important advantage of packaging. Information
can relieve the MH operations because the information on the package allows
warehouse personnel to locate and quantify the products easily. The size and pro-
tection of products directly affect MH as well as quality. The size aspect influences
the utilization of a warehouse. Size also affects the quantity of products that can be
moved at the same time. The level of protection that the package provides enables
different transportation alternatives. A package must not only protect the product
from physical damage but also be required to support the weight of products
stacked above it.
Efficient MH can improve a warehouse’s ability to provide customer service in
terms of quick and accurate response to customer demands. Efficient MH could
also reduce cost by consuming fewer resources such as forklift time, manual labor,
and warehouse space [18].
175Packaging and Material Handling

Packaging Effects on Transportation
Another logistical activity that is greatly affected by packaging is transportation
because packaging affects the volume of a product. Transportation provides place
utility to a product and also time utility in some aspects [19]. Transportation in this
sense concerns the movement of products from the focal firm to the customer.
From a packaging perspective, the most important factors that affect transporta-
tion costs are volume, stowability, and handling because these factors are highly
influenced by a product’s physical characteristics.
Packaging Effects on Customer Service
Customer service is a logistical activity that is also affected by packaging.
Customer service has various meanings throughout an organization, so it is impor-
tant to consider these aspects.
Customer service can be viewed as something that is provided by a firm to the
buyer who is purchasing a product.
Packaging is an important factor in providing customer service. For example, a
packaging solution might be good for the firm, but the customer might not be able
to handle the package at its premises, and then customer service is lost. This adds
to the interrelationship between packaging and logistical activities.
9.2.9 Packaging Costs
Packaging costs account for a significant portion of a product’s manufactured cost,
so it is important for companies to minimize these costs [20].
The three major components of packaging costs are labor, equipment, and mate-
rials. Packaging is generally considered as the process of placing the enclosed item
into a shipping container, so the labor costs involved to accomplish either or both
of these operations is influenced by the materials, methods, and equipment of the
specific packaging system.
About 9% of the cost of any product is likely to be the cost of its packaging;
about 90% of this cost of packaging may be attributed to factors other than the
packaging material itself. The manufacture, use, and disposal of packaging
accounts for about 60% of total production costs or between 15% and 50% of the
selling price of a product.
However, the impact of packaging costs is often not considered or measured by
logisticians. They often found that the handling of packaging items strongly
impacts the overall logistics cost.
In Table 9.2, different packaging consequences are presented that create require-
ments for trade-offs between the logistic activities: materials handling, customer
service, communications, and transportation [19]. From this, we can see that pack-
aging is closely related to logistics activities [7].
As presented by Lambert et al. [19], the issue is improving the advantages
of the chosen packaging solution while minimizing the disadvantages. This
176 Logistics Operations and Management

emphasizes the importance of understanding the effects that packaging has on the
logistical activities and their internal interrelation in order to find the right balance
between them.
9.2.10 Packaging Models
Traditional packaging is usually considered as a cost-driven center rather than a
value-added component throughout the manufacturing and distribution processes. If
we reconsider the packaging design in a systematic approach, it is easy to develop
more cost-effective solutions for manufacturing processing that can support han-
dling and distribution as well as provide product protection [21].
Chan et al. [21] have introduced a systematic approach to packaging logistics.
In this approach, they believe that logistics considerations cannot fully dominate
the design of packaging. They should be weighted along with marketing and prod-
uct design to work out the best possible compromise by taking all factors into con-
sideration. Modern packaging needs to compromise between all packaging
functions and consider the role of the packaging in a systematic way. As a result,
the roles of packaging would be both a cost-driven center and a value-added pro-
cess in the logistics system.
Chan et al. [21] suggest six important steps in explaining the methodology for
systematic approach in packaging.
Step 1: Identify the possible package flow route and the packaging level.
Step 2: Integrate packaging logistics in the product type stage.
Step 3: Create a preliminary package design.
Step 4: Establish information flow among all parties.
Step 5: Redesign the packaging system.
Step 6: Use value-chain model to evaluate the finalized chosen package.
9.3 Case Study
In this section, challenges in the packaging of microelectromechanical systems
(MEMS) are explained [22].
Table 9.2 Packaging Consequences [6]
Packaging Consequences Trade-Offs
Increased package information Decreases order-filling times
Decreases tracking of lost shipments
Increased package protection Decreases damage in transport
Increases weight
Decreases cube utilization from larger dimensions
Increases product value
Increased standardization Decreases MH
Decreases customer customization
177Packaging and Material Handling

MEMS are made of mechanical devices and mechanical components that can be
as small as a few microns. They can be mechanical interconnects of microsystems,
and they can also receive signals from one physical domain and send them to
another, such as mechanical to electrical, electrical to mechanical, and electrical
to chemical. These devices are broadly categorized as either sensors or actuators.
MEMS sensors are devices such as pressure sensors, accelerometers, and gyro-
meters that perceive an aspect of their environment and produce a corresponding
output signal. Actuators are devices that are given a specific input signal on which
Table 9.3 Current Packaging Parameters, Challenges, and Suggested Possible Solutions
for MEMS
Packaging
Parameters
Challenges Possible Solutions
Release etch
and dry
Washing away parts during
release
Freeze drying, coating, or
processes that reduce surface
tensionMust release parts individually
after dicing Use dimples
Develop a dicing
Laser sawing
Dicing and
cleaving
Eliminating contamination caused
by cooling fluid and
particulates during wafer
sawing
Release dice after dicing
Cleave wafers
Laser sawing
Wafer level encapsulation
Die handling Damages top die’s face contact
region
Fixtures that hold MEMS dice by
sides rather than top face, such
as collects that fit existing pick-
and-place equipment
Stress Abating performance degradation
and resonant frequency shifts
Low modulus
Low creep die attach material
Curling of thin film layers Annealing
Misalignment of device features Die attach materials with CTE
similar to that of silicon
Outgassing Corrosion Low outgassing epoxies
Outgassing of organic solvents
from polymeric die attach
materials
Low modulus solders
New die attach materials
Removal of outgassing vapor
Testing Applying nonelectric stimuli
to devices
Electrical test structures to mimic
nonelectrical functions
Testing moving device features
before release
Inability to release parts before
dicing
Modify (where possible) wafer-
scale probers to do nonelectrical
tests
Cost-effective, high-throughput,
and parallel-packaged device-
test systems
178 Logistics Operations and Management

to act and a specific motion or action is produced. Other examples of MEMS actua-
tors are microengines, microlocks, and discriminators.
MEMS packaging is quite different from conventional integrated circuit (IC)
packaging. Whereas many MEMS devices must interface with the environment to
perform their intended functions, the package must be able to facilitate access with
the environment while protecting the enclosed devices. The package must also not
interface with or impede the action of the MEMS device. The incomplete attach-
ment material should be low stress and low outgassing while also minimizing stress
relaxation over time, which can lead to scale-factor shifts in sensor devices. The
fabrication process used in creating the devices must be compatible with each other
and not damage the devices. Many devices are specific in application, requiring
custom packages that are not commercially available. Devices may also need media
compatible packages that can protect the devices from harsh environments in which
the MEMS device may operate. Current packaging parameters, challenges, and sug-
gested possible solutions for MEMS are shown in Table 9.3.
References
[1] E.L. Magad, J.M. Amos, Total Materials Management, Chapman & Hall, New York,
1995.
[2] P. Baily, D. Framer, Material Management Handbook, Grower Publishing, England,
1988.
[3] R.H. Ballou, Business Logistics Management, third ed., Prentice Hall, New York,
1992.
[4] R.M. Eastman, Material Handlings, Marcel Dekker, Inc., New York, 1987.
[5] J.A. Tompkins, J.A. White, Y.A. Bozer, E.H. Frazelle, J.M.A. Tanchoco, J. Trevino,
Facilities Planning, John Wiley & Sons, New York, 2003.
[6] J.R. Stock, D.M. Lambert, Strategic Logistics Management, fourth ed., McGraw-Hill,
Singapore, 2001.
[7] Satich C. Ailawadi, Rakesh Sing, Logistics Management, Prentice Hall of India, New
Delhi, 2006.
[8] A. West, Managing Distribution and Change: The Total Distribution Concept, John
Wiley & Sons, New York, 1992.
[9] S. Chittratanawat, J.S. Noble, An integrated approach for facility layout, P/D location
and material handling system design, Int. J. Prod. Res. 37 (1999) 683�706.
[10] S.G. Lee, S.W. Lye, Design for manual packaging, School of Mechanical and
Production Engineering, Nanyang Technological University, Republic of Singapore,
Emerald J. 33(2) (2003) 163�189.
[11] J. Paulo, A Mathematical Model of Operation Allocation and Material Handling
System Selection Problem Manufacturing System, M.A.Sc. Thesis, Department of
Industrial and Manufacturing Systems Engineering, University of Windsor, Canada,
2002.
[12] J. Paulo, R.S. Lashkari, S.P. Dutta, Operation allocation and material handling system
selection problem manufacturing system: a sequential modeling approach, Int. J. Prod.
Res. 40 (2002) 7�35.
179Packaging and Material Handling

[13] R.S. Lashkari, Towards an integrated model of operation allocation and material han-
dling selection in cellular manufacturing systems, Int. J. Prod. Econ. 87(2) (2004)
115�139.
[14] W. Soroka, Fundamentals of Packaging Technology, Institute of Packaging
Professionals, Naperville, IL, 2002. ISBN 1-930268-25-4 http://en.wikipedia.org/wiki/
Special:BookSources/1930268254.
[15] F. Albert Paine, The Packaging User’s Handbook, Springer, Blackie Academic and
Professional, New York, 1991 (published by authority of the Institute of Packaging).
[16] J. Garcıa-Arca, J.C. Prado-Prado, Antonio-Garcia-Lorenzo, Logistics improvement
through packaging rationalization: a practical experience, J. Packag. Technol. Sci. 19
(2006) 303�308.
[17] W.F. Friedman, J.J. Kipnees, Industrial Packaging, John Wiley & Sons, New York,
1960.
[18] Hanlon J.F., Kelsey R.J., & Forcinio H.E., Handbook of Package Engineering, third
ed., CRC Press, London, 1998.
[19] D.M. Lambert, JR Stock, L.M. Ellarm, Fundamental of Logistics Management,
McGraw-Hill, Boston, 1998.
[20] J. Hassel, T. Leek, Packaging Effects on Logistics Activities: A Study at ROL
International, Jonkoping International Business School, Jonkoping, 2006.
[21] F.T.S. Chan, H.K. Chan, K.L. Choy, A systematic approach to manufacturing packag-
ing logistics, Int. J. Adv. Manuf. Technol. 29(9�10) (2006) 1088�1101.
[22] A.P. Malshe, C. O’Neal, S.B. Singh, W.D. Brown, W.P. Eaton, W.M. Miller,
Challenges in the packaging of MEMS, Int. J. Microcircuits Electron. Packag. 22(3)
(1999) Third Quarter (ISSN 1063-1674) 2�4.
180 Logistics Operations and Management

10Storage, Warehousing, andInventory Management
Maryam Abbasi
Department of Industrial Engineering, Amirkabir Universityof Technology, Tehran, Iran
10.1 The Reasons for Storage Inventory
The costs of capital, warehousing, protection, deterioration, loss, insurance, package,
and administration make stocks expensive [2]. “Inventories can absorb 25�40% of
logistics costs and represent a significant proportion of the total assets of an organi-
zation” [3], but we keep inventory for the following reasons.
� To protect a firm against unexpected changes in customer demand and lead time and
improve customer service [4].� To take advantage of economics of scale when purchasing, transportation, and manufactur-
ing in large volumes by reducing the cost per unit [4].� To balance supply and demand when they are not equivalent in a same time. Sometimes
demand is higher than the available supply (e.g., products that have a seasonal demand)
and vice versa. Keeping inventory thus helps to answer demand as needed [5].� To hedge against contingencies such as labor strikes, fires, and flood. In such situations,
inventory guarantees normal supply for some period of time [3].� To eliminate manufacturing bottlenecks, in this situation work in process goods should be
kept in order to eliminate bottlenecks and increase productivity.� To hedge against price changes in situations when prices change unexpectedly (most of
the time increase) and keeping raw material is economical [1].
10.2 The Role of Distribution Centers and Warehousesin Logistics
The general reasons for installing distribution centers and warehouses are as follows.
Storage of goods: The basic function of warehouses is to store goods for the
time they will be needed.
As part of production process: In many cases, a production process needs a
period of time (without any operation) to complete a product—e.g., the production
of cheese and wine. Thus, warehouses can keep such products as a part of their pro-
duction process [5].
Logistics Operations and Management. DOI: 10.1016/B978-0-12-385202-1.00010-4
© 2011 Elsevier Inc. All rights reserved.

Returned goods center: In reverse logistics, the handling of returned goods
becomes important, so warehouses can act as a place to accumulate and make deci-
sions about returned goods [7].
Consolidation: When customers order a number of products from different places
and want them to be delivered together, a warehouse can receive the requested pro-
ducts from their separate origins and deliver them altogether to the customer [1].
Breakbulk: Breakbulk warehouses divide large receiving shipments in bulk from
manufacturers into small less than truckload (LTL) shipments and send them to the
customers [4].
Postponement: Warehouse can also be used as a place to postpone the production
process. In these cases, a warehouse is capable of doing light manufacturing activi-
ties such as labeling, marking, and packaging. In-process goods are kept in these
warehouses until a demand with special characteristics such as mark or package
occurs; the requested activities will be done in the warehouse and finished goods
will be ready to satisfy the demand [8].
Cross docking: In some cases, a warehouses act as a cross-docking point.
Inventory does not stay in more than 12 hours. However, these warehouses receive
inventory, transfer it to vehicles, and deliver to retailers. This system leads to
reduction of inventory costs and lead times by decreasing storage time [9].
Transshipment: Transshipment is the process of transferring goods from one
vehicle to another as necessary [9].
Product-fulfillment center: Fulfillment centers are distribution centers or ware-
houses that connect directly with final consumers. The following are some of the
differences between product-fulfillment centers and other warehouses:
� Higher levels of customer service are available because of direct connects with final
customers.� More orders of smaller size are possible; these are almost always received electronically.� Fulfillment centers typically must receive customer payments, often by major credit card;
some also create customer invoices and handle banking for their clients.� Returns from customers are more than that in the other warehouses.� Computerized information systems and task automation are increasingly critical, and the
transportation function (especially residential delivery) is more complex [10].
10.3 Warehouse Location
After a need for storage space has been demonstrated, the warehouse location should
be determined. Facility location has a long-term impact on supply chains, so it is a
strategic decision in supply-chain design [11].
According to Chopra and Meindl [11], there are many factors that help decision
makers to choose a place for warehouse; the following factors are some of them:
� Land configuration and developing costs� Building construction costs� Community and local government attitude toward the warehouse
182 Logistics Operations and Management

� Availability and access to transportation services� Potential for expansion� Hazards of the site (fire, theft, flood, etc.)� Local labor quantity, labor rates, and climate� Traffic congestion around the site� Advertising value of the site� Taxes relative to the site and operation of the warehouse [11].
Facility location decision is typically made at two levels [3]:
1. With respect to the location of all existing warehouses, where should be located a new
one to balance transportation costs, inventory costs, order processing costs, etc.
2. After determination of general geographic region, it should be determined whether the
warehouse is to be located on this side of town or that, or in this industrial part or that.
10.4 Warehouse Design
10.4.1 Size of Warehouse
When the location of warehouse is specified, the next decision is to determine the
size of the building that is needed. Determination of warehouse size is affected by
the following factors:
� Customer-service levels� Size of market(s) served� Number of products marketed� Size of the product(s)� Material-handling system used� Throughput rate (i.e., inventory turnover)� Production lead time� Economics of scale� Stock layout� Aisle requirements� Office area in warehouse� Types of racks and shelves used� Level and pattern of demand� Storage policy [4]
10.4.2 Storage Policies
Three policies are followed to assign products to storage areas: randomized, dedi-
cated, and class based [12]. Under a randomized storage policy, there are no restric-
tions on where items can be stored in the storage area, so any item can be placed
anywhere. Under the dedicated storage policy, items can only be stored in their
own special areas. Under class-based storage policy, items are divided into some
classes, and each class is assigned to one storage area. Indeed, in the class-based
storage policy, when there is only one class for all items, we have a randomized
183Storage, Warehousing, and Inventory Management

storage policy; when there is one class for each item, we have class-based storage
policy. The best selection among different storage policies depends on the costs of
order picking and warehouse space. Dedicated or random policy is selected when
the order-picking costs or space costs are important. However, if both of costs
(order picking and warehouse space costs) simultaneously are important, the best
solution is class-based storage policy [13].
The cube-per-order index (COI) is one criterion used to assign product classes to
storage locations. The COI of an item is defined as the ratio of the item’s storage-
space requirement (cube) to its popularity (number of storage and retrieval requests
for the items). One procedure used to assign product classes to storage locations in
a class-based storage policy is as follows [14]:
1. Calculate the COI for all items: ratio of an item’s storage-space requirement (cube) to the
number of storage and retrieval (S/R) transactions for that item.
2. Sort the items in a nondecreasing order by their COIs.
3. Allocate the first item in the list to the storage spaces that are nearest to the input�output
(I/O) point and so on.
Pareto’s law is another way to assign product classes to storage locations. This
law divides all items into three classes: A, B, and C. Class A includes the 20% of
items that 80% of the S/R activity is directed at. Class B includes the 30% of items
with 15% of the S/R activity. Class C includes 50% of items with 5% of the S/R
activity. Items of class A must be stored closest to the I/O point, class B next clos-
est, and class C the farthest away [14].
10.5 Types of Warehouses
Warehouses may vary from one to another, but there are many ways to classify
them [1].
� By stage in the supply chain: Warehouses may hold raw materials, works in progress, or
finished goods.� By geographic area: A regional warehouse may cover a number of countries, and a
national warehouse will cover just one country.� By product type: Storage may be devoted to individual products of classes of products—
e.g., electrical parts, perishable foods, and hazard materials.� By function: Warehouses may hold inventory, postponement materials, or breakbulk.� By area: Size may be important—e.g., warehouses with less than 100 square meters or
more than 1000 square meters.� By systems: With respect to the level of automation (equipment and methods used for order
picking or storage and retrieval of items), warehouse systems are divided into three types:
1. In manual warehousing systems (picker-to-product systems), order pickers ride in
vehicles (like elevators) in a storage area and pick the required items. The vehicles
used in manual warehousing vary from completely manual to fully automated, but
they are all applied to picking products.
2. In automated warehousing systems (product-to-picker systems), machines and tools
are used to facilitate order picking—e.g., a storage carousel that rotates around a
184 Logistics Operations and Management

closed loop and delivers requested stock-keeping units (SKUs) to the order picker
(horizontal carousel or vertical carousel).
3. In automatic warehousing systems, the level of automation is higher than in automated
systems. Human order pickers are replaced by robots. Automatic warehouses perform
order picking of small- and medium-sized items and shape (e.g., compact disks or
pharmaceuticals) [15].� By ownership
1. Firms sometimes use private warehouses that they own or occupy on long-term leases
[16]. These warehouses are always used by firms that are stable and have enough
stock to fill them. The most important aspect of private warehouses is that they
involve large capital investments. The many advantages of private warehouses include
the following [5]:
� They have lower stock-keeping costs than hired warehouses, particularly when
their capacity is used most of the time.
� They have higher service levels and more control over their operations.
� They have a higher degree of flexibility than rented warehouses.
� They have specialized personnel and equipment when needed to handle special
products.
� The warehouse space can be used for other applications when the storage space is
no longer needed.
2. Public warehouses are rented by firms that cannot justify the initial investment in pri-
vate warehouses or that prefer to outsource warehouse operations. This type of ware-
houses has the following advantages.
� They require no capital investment.
� Space can be rented as much as needed [16].
There are many types of public warehouses.
� General merchandise warehouses are used to keep any kind of product and are used by
different firms [6].
� Temperature-controlled warehouses are used to keep products and materials that must be
kept at controlled temperatures such as perishable foods or some chemical materials [6].
� Bulk storage warehouses are used to keep unpacked products and materials in high vol-
ume (bulk goods) such as oil [3].
� Bonded warehouses are “licensed by the government to store goods prior to payment of
taxes or duties. This helps to reduce the inventory value of the firm considerably” [3].
� Special commodity warehouses are used to keep agricultural products such as grains,
wool, and cotton [4].
1. Contract warehouses are “the other type of nonowned warehousing, a partnership
arrangement between the user and provider of the warehousing service such as transporta-
tion, inventory control, order processing, customer service, and returns” [6].
10.6 Warehouse Components
Space, equipment, and people are the three components of warehousing.
Equipment consists of material-handling devices, racks, conveyors, and all of
the hardware and software used to make a warehouse function and that may differ
185Storage, Warehousing, and Inventory Management

from one warehouse to another (depending on warehouse nature and design).
People are another important component in warehousing; it is their performance
that makes the difference between high- and low-quality warehousing. Warehouse
space is another component that differs in location, size, and design [17].
10.7 Warehouse Tasks and Activities
10.7.1 Material Flow in Warehouse
There are many steps in warehouses from receiving goods until their delivery to
customers, including the following.
� Receiving: Goods are unloaded from shipment vehicles and delivered to the warehouse
personnel.� Inspection and quality control: After receiving, goods should be verified by inspection
and quality control (usually randomly checked).� Preparation for transportation to the storage area: Specific tasks such as product labeling
may be done here.� Put away: Goods are transported to the storage area.� Order picking: Goods are retrieved when orders are received.� Aggregation of SKUs: Sometime orders with multiple SKUs are combined for shipment.� Preparation for transportation to shipping area: Items are readied for delivery, for exam-
ple, with packaging.� Transportation of goods to the shipping area: Ready-to-ship orders are made available
for shipment to customers [18].
Warehouses also may have the following tasks:
� Inventory tracking� Cross docking� Packaging� Light assembly, blending, filling, and outfitting� Labeling and shrink wrapping� Breakbulk and consolidation� Postponement� Transportation� Import and export services� Tracing, customer service, and billing� Carrier monitoring� Site location� Real estate management� Network analysis� Systems development [19]
10.7.2 Order Picking
Order picking is one of the most important activities in warehouses because of its
direct effects on customer-service level and warehouse costs [1].
186 Logistics Operations and Management

A study in the United Kingdom [20] demonstrated that more than 60% of all
operating costs of warehouses are related to order picking (Figure 10.1).
Order-Picking Methods
� In discreet picking, a single order is filled.� In batch picking, a group of orders are filled by one order picker.� In zone picking, each order picker is in charge of a specific zone of the warehouse
and selects items that are in that zone. All order pickers do their work until the order is
completed [4].� In wave picking, orders may be released in waves (e.g., hourly or each morning or after-
noon). This helps to control the flow of goods and replenishment, picking, packing, mar-
shalling, and dispatching. Wave timing is tied to the schedules of outgoing vehicles [1].
Principles for Better Order Picking
The following are among the many ways to improve order picking and make it
more efficient [21].
1. Apply Pareto’s law: According to this law, about 80% of storage and retrieval activities are
dedicated to 20% of different SKUs (in cube or value). Some 15% of activities are dedicated
to 30% of the SKUs types, and 5% of them are dedicated to 50% of remaining SKUs types.
If the more popular products are grouped together, order-picking time will be reduced.
2. Use a clear and easy-to-read picking document: A clear document helps order pickers
to do their job more effective. Instructions that are written in a clear font and have infor-
mation about the products that are required and their quantity will help an order picker
fill the order in the shortest possible time and with minimal numbers of errors.
3. Maintain an effective stock-location system: A location system strongly affects order-
picking efficiency, so using the proper system is important.
4. Eliminate and combine order-picking tasks: Combining tasks reduces the time required
for order picking. For example, pickers can read documents when they travel among
areas or put sorted items in their packages simultaneously.
5. Pick a group of orders to reduce total travel time: If the number of orders increases, an
order picker can pick more items in one tour, decreasing task time.
6. Dedicate specific locations: Put items that have the highest I/O rates in the most accessible
locations.
7. Group high-probability items: Locate similar items or items that are often ordered
together in the same place or in places that are close together.
Labor0%
20%
10%
60%
80%
100%
Capital Support Total
Shipping
Picking
Storage
Receiving
Figure 10.1 Warehousing
cost by activity [18].
187Storage, Warehousing, and Inventory Management

8. Balance activities and locations: Keep picking activities and picking locations balanced
to reduce congestion.
9. Keep order pickers responsible: By keeping order pickers accountable for their time and
effort, extra labor in the form of checkers can be avoided.
10. Designing proper vehicles: the time of order picking activities like sorting and packag-
ing or mankind errors can be reduced by designing proper vehicles.
11. Reduce counting errors: Electronic weigh scales are accurate and can enhance produc-
tivity, especially for very small items.
12. Eliminate paperwork from the order-picking activities: Paperwork is one of the major
sources of inaccuracies and productivity loss in order picking. New technologies such as
radio-frequency data communication and voice I/O can be used instead of paper to
reduce errors.
10.8 Inventory Management
Inventories are raw materials, work in process, and finished goods that companies
keep for different reasons such as saving time, to meet economic objectives, and as
a buffer against uncertainties.
The basic element of customer service for all logistics is inventory availability,
and generally the most expensive logistics cost is inventory. Effective inventory
management decreases carrying cost and increases customer satisfaction at the
same time [22].
10.8.1 Types of Inventory
The following are among the many types of inventory that can be warehoused.
� Cycle stock is inventory, i.e., highly predictable in its turnover and need to be replenished [6].� Safety stock is inventory, i.e., concerned with short-range variations in either demand or
replenishment. It protects against the uncertainty of demand and lead time.� Transit inventory or pipeline inventory is composed of products that are in transit between
producer and purchaser locations and are not ready to use or be sold. This stock is equal
to the expected demand over the lead time (the time between issuing an order and
receiving it) [23].� Speculative stock is inventory kept in case of material shortages, price increases, or unex-
pected changes in demand rather than to satisfy current demand [4].� Seasonal stock is one form of speculative stock that is held for anticipated demand for a
specific time period—e.g., increasing chocolate demand on Valentine’s Day.� Dead stock is inventory for which there is no longer demand. These inventories impose
tax costs on a firm, so they should be moved out as appropriate.
10.8.2 Costs of Inventory
Inventory costs are a major logistics costs and thus a key factor in decision making
about inventory management. The three main categories are holding costs, procure-
ment costs, and shortage costs.
188 Logistics Operations and Management

Inventory Holding Costs
This type of cost is incurred when products are stored for some period of time. It
includes the following elements:
� An opportunity (capital) cost represents “the return on investment the firm would have
realized if money had been invested in a more profitable economic activity instead of
inventory. This cost is generally estimated on the basis of a standard banking interest
rate” [24].� Inventory service costs include costs of tax and insurance.� Risk cost is the result of pilferage, deterioration of stock, damage, and stock obsolescence.� Storage-space costs.
Procurement Costs
The costs of orders from vendors include the following:
� Order forms� Postage� Telecommunication� Authorization� Purchase-order planning� Purchase-order entry time� Purchase-order processing time� Purchase-order inspection time� Purchase-order follow-up time� Purchasing management� Office space� Office supplies� Purchase-order entry systems� Tracking and expediting� Setup costs to prepare or change over a machine for a specific item’s production run [22].
Shortage Costs
A shortage cost is a penalty that accrues when (1) stock cannot satisfy demand
(lost profit because of lost sales) and (2) the desired product is not in stock and the
customer must wait to receive it.
10.8.3 Inventory Control
Inventory control is the set of activities that coordinate purchasing, manufacturing,
and distribution to maximize the availability of raw materials for manufacturing or
the availability of finished goods for customers [25].
There are three basic questions for inventory control [2]:
1. What items should we keep in stock? Warehouse managers should evaluate the advan-
tages and disadvantages of keeping an item in a warehouse before they add it to the
inventory. Only add an item if it provides clear benefits.
189Storage, Warehousing, and Inventory Management

2. When should we place an order? This question can be answered in three ways:
First, determine a fixed interval time and then place an order of a product in the
needed quantity at each interval. In this approach, order quantity may vary from one
time period to another (a fixed time period).
Second, monitor the stock level continuously. When it falls to a specific level, place
an order with a fixed size. In this approach, the time periods between two orders may
vary (a fixed-order quantity, FOQ).
Third, with respect to known demand over a specific time period, enough stock should
be ordered. In this approach, both time period and order quantity depend on demand
and may vary.
3. How much should we order? Different costs are mentioned above for keeping an inven-
tory. If order size is large and the time period between ordering is long, the cost of order-
ing and inventory shipment decreases, but inventory holding costs increase. If order size
is small and the time period is short, then inventory holding costs decrease but two other
costs increase. There should be a trade-off between these costs.
Inventory Control in Certain Conditions
Economic order quantity (EOQ). The classic EOQ introduced by Ford W. Harris in
1915 is a simple model that illustrates the trade-offs between ordering and storage
costs.
The model has the following assumptions:
� There is a known, continuous, and constant demand.� Costs are known and constant.� Shortages are not permitted.� The lead time between placing and receiving orders is zero, and replenishment time can
be ignored.
To represent a model, we use the following notations:
U 5 the unit cost of the item
R 5 reorder cost for the item
H 5 holding cost of one unit of the item in stock for one period of time
Q 5 order quantity, which is always a fixed order size
T 5 cycle time, the time between two consecutive replenishments
D 5 demand of the item that should be supplied in a given time period
Economic order quantity ðEOQÞ5ffiffiffiffiffiffiffiffiffiffiffiffiffiffiffiffiffiffiffiffi23D3R
H
rð10:1Þ
Variable cost of EOQ ðVCEOQÞ5ffiffiffiffiffiffiffiffiffiffiffiffiffiffiffiffiffiffiffiffiffiffiffiffiffiffiffiffiffiffi23D3R3H
pð10:2Þ
Total cost of EOQ ðTCEOQÞ5 ðU3 SÞ1 ðVCEOQÞ ð10:3Þ
In this model, optimal order quantity is achieved at the point inventory ordering
cost per unit of time (RD/Q) equals inventory holding cost per unit of time (HQ/2).
190 Logistics Operations and Management

Optimum Order Quantity When Shortages (Back Order) Are Allowed
In this model, we will eliminate the third assumption of the EOQ model. Thus,
shortages (back orders) are allowed in the model. For this reason, SC and S repre-
sent shortage (back-ordered items) cost and quantity of back orders, respectively.
Qopt 5
ffiffiffiffiffiffiffiffiffiffiffiffiffiffiffiffiffiffiffiffiffiffiffiffiffiffiffiffiffiffiffiffiffiffiffiffiffiffiffiffiffiffiffiffi23R3D3 ðH1 SCÞ
H3 SC
rð10:4Þ
Sopt 5
ffiffiffiffiffiffiffiffiffiffiffiffiffiffiffiffiffiffiffiffiffiffiffiffiffiffiffiffiffiffi23R3HD
SC3 ðH1 SCÞ
sð10:5Þ
Optimum Order Quantity When the Rate of Replenishment Is Finite
In the EOQ model, the replenishment is instantaneous, and the replenishment rate
will be finite. For this reason, P describes the production rate, so the replenishment
rate will be (P � D) (Figure 10.2).
Qopt 5
ffiffiffiffiffiffiffiffiffiffiffiffiffiffiffiffiffiffiffiffi23R3D
H
r3
ffiffiffiffiffiffiffiffiffiffiffiffiP
P2D
rð10:6Þ
PTopt 5Qopt=P ð10:7Þ
Optimum Order Quantity with Price Discount
In the previous discussion, the models cited did not consider price discounts. In the
real world, however, for many reasons (such as reductions in shipment cost) there
is a price discount with respect to order size, so it is economical to order large
quantities.
The two main types of discounts are based on (1) lot size, which are discounts
based on the quantities ordered in a single lot (which is appropriate when there is a
Q
DP DT TTime
Stock
P–D
Figure 10.2 Optimal order quantity with finite replenishment rate.
191Storage, Warehousing, and Inventory Management

competitive market and price is fixed); and (2) volume, or discounts based on the
total quantity purchased over a given period (which is appropriate when customer
demand increases and price decreases) (Figure 10.3) [11].
In the next model, a supplier offers a reduced price on all units for orders above
a certain size (Table 10.1).
In this model, the most economical order quantity for each range should be cal-
culated. (If other costs depend on unit costs such as holding costs, there are I Qi;
elsewhere, there is one Q.)
Qi 5
ffiffiffiffiffiffiffiffiffiffiffiffiffiffiffiffiffiffiffiffi23R3D
Hi
rð10:8Þ
There are three cases for Qi:
� qi�1 # Qi , qi (valid range)� Qi , qi�1
� Qi $ qi
After finding the valid range, the total cost of Qi that is in the valid range and
all break points at the left of the valid range should be calculated. The quantity that
has lowest cost is the optimal order quantity [24].
Discount types
Lot size based Volume based
All unit quantitydiscount
Marginal unit quantitydiscount
Figure 10.3 Types of discount [11].
Table 10.1 Reduction in Unit Cost by an Increase in Order Quantity [24]
Unit Cost Order Quantity
U1 0 # Q , q1U2 q1 # Q , q2^ ^UI qI�1 # Q , qI
192 Logistics Operations and Management

Lead Time
Lead time (LT) is the “period between placing a replenishment order and the time
it is actually received” [26].
In previous models, lead time was assumed to be zero, but this assumption is
not true. Lead time occurs for many reasons such as time needed for order prepara-
tion before sending items to a supplier, the time needed for a supplier to process
the order and prepare the delivery, the time to get materials delivered from suppli-
ers, and the time to process the delivery—i.e., the total time between receiving a
delivery and getting the materials available for use.
If demand does not change with time, then it is not economical to keep inven-
tory from one cycle to the next. For this reason, each order should be timed to
arrive as existing stock runs out. The reorder level—the inventory stock level of an
item that triggers a reorder—can then be defined [25].
If lead time , cycle time, then
Reorder level5LT3D ð10:9Þ
If lead time $ cycle time and between n and n 1 1 cycle lengths, then
Reorder level5 ðLT3DÞ � ðn3QoptÞ ð10:10Þ
Inventory Management in Uncertain Conditions
The basic assumption of previous models is determinant demand, lead time, and
their related variables, but there is always some uncertainty in them. An uncertain
parameter is one that does not have an exact quantity but its probability distribution
is known [2].
One method used for inventory control under uncertain conditions is the FOQ
method. In this model, the EOQ will be ordered whenever demand drops the inven-
tory level to the reorder level. Lead-time demand is a key factor in this model; the
variations outside of lead time are not so important because they are compensated
for by changing the time period. If demand outside the lead time is higher than
expected, then we reach the reorder level sooner than expected. If demand inside
the lead time is higher than expected, then it is too late to make adjustments, and
there will be shortages. As mentioned earlier in inventory management, both
demand and lead time uncertainty are important (Figure 10.4).
Another method is the fixed-order interval (FOI) method. FOI methods allow
for uncertainty by placing orders of varying size at fixed time intervals. If demand
is constant, then these two approaches are identical, so differences only appear
when uncertainty is entered into the model. The FOI model considers the uncer-
tainty in lead time 1 order interval [4] (Figure 10.5).
193Storage, Warehousing, and Inventory Management

Service Level or Product Availability
Product availability is the ability of a firm to fill a customer’s order from available
inventory. The following are among the several ways to measure product
availability:
� The product fill rate is defined as the fraction of demand that is satisfied from stock.� The order fill rate is defined as the fraction of orders that are filled from stock.� The cycle service level is the fraction of replenishment cycles that end with no shortage [22].
Safety Stock
Safety stock is stock that is kept because of uncertainties of demand, lead time, or
both. The required service level determines the quantity of safety stock kept (a
higher service level needs more safety stock). For example, if the demand is higher
or lead time is longer than expected, then safety stock will compensate for these
variations [16].
Because we know that excess inventory increases holding costs, the important
question becomes, how much inventory for safety stock should we hold?
Stock level
TimeShortage
Reorderlevel
Ordersize
LT
Figure 10.4 FOQ method.
Stock level
Order interval Order interval ShortageTime
Figure 10.5 FOI method.
194 Logistics Operations and Management

Safety Stock in the FOQ Method
In this method, as previously discussed, the important issue is lead-time demand. If
demand has a normal distribution with mean ðDÞ per unit time and standard devia-
tion (σD), and lead time has normal distribution with mean ðLTÞ and standard devi-
ation (σLT), then the lead-time demand has a normal distribution with a mean
ðD3LTÞ and standard deviation
ffiffiffiffiffiffiffiffiffiffiffiffiffiffiffiffiffiffiffiffiffiffiffiffiffiffiffiffiffiffiffiffiffiffiffiffiffiffiffiffiffiLT3σ2
D 3D23 σ2
LT
q� �.
Safety stock5Z3
ffiffiffiffiffiffiffiffiffiffiffiffiffiffiffiffiffiffiffiffiffiffiffiffiffiffiffiffiffiffiffiffiffiffiffiffiffiffiffiffiffiLT3σ2
D 3D23 σ2
LT
qð10:11Þ
Z is the number of standard deviations from the mean that correspond to the
specified service level.
Safety Stock in the FOI Method
In this method, safety stock compensates the uncertainty of a LT plus next order
interval [25].
If demand over T 1 LT is normally distributed with mean ðT 1LTÞ3D and
standard deviation σ3ffiffiffiffiffiffiffiffiffiffiffiffiffiffiffiffiffiffiðT 1LTÞ
p, then
Safety stock5 Z3σ3ffiffiffiffiffiffiffiffiffiffiffiffiffiffiffiffiffiffiðT1LTÞ
pð10:12Þ
10.9 Virtual Warehouses
The virtual warehouse (VW) is a business model that tries to reduce costs and pro-
vide high-quality customer service. This concept first appeared in 1995 [27].
According to Fung et al., “The VW is a state of real-time global visibility for
logistic assets such as inventory and vehicles” [28]. The key factors to achieve VW
are information technologies and real time decision algorithms which provide oper-
ating efficiencies and global inventory visibility. Some substantial gains which vir-
tual warehouses provide are: online material visibility for customer [27] service,
precise control of transportation and data analysis capabilities for any users capable
of accessing the virtual databases. Based on the conventional concept of VW,
Figure 10.5 illustrates main elements of the VW approach. The figure shows the
basic elements (information technologies and real-time decision) which are needed
for efficient operation and inventory visibility [28] (Figure 10.6).
Conceptually, there are two levels in a VW: data level and algorithm level.
Hardware and software constitute the data level of VWs that support real-time
algorithms. The following technologies and systems at the data level are essential
for real-time data acquisition in mobile applications:
� Standard interfaces and integrated databases� Wireless communications
195Storage, Warehousing, and Inventory Management

� Global positioning� Geographic information� Automatic identification
The algorithm level is the functional level of VWs. At this level, real-time algo-
rithms are used to filter and process data for operational decision making [29].
References
[1] A. Rushton, P.H. Crouche, P. Baker, The Handbook of Logistics and Distribution
Management, third ed., Kogan Page Limited, London and Philadelphia, 2006.
[2] D. Water, Inventory Control and Management, second ed., John Wiley & Sons,
England, 2003.
[3] R.H. Ballou, Business Logistics Management, third ed., Prentice Hall, London, 1992.
[4] J.R. Stock, D.M. Lambert, Strategic Logistics Management, fourth ed., McGraw-Hill,
Singapore, 2001.
[5] R.H. Ballou, Business Logistics/Supply Chain Management: Planning, Organizing, and
Controlling the Supply Chain, fifth ed., Pearson/Prentice Hall, Upper Saddle River, N.J.,
2004.
[6] S.C. Ailawadi, Logistics Management, Prentice-Hall of India, Delhi, 2006.
[7] P. Baker, M. Canessa, Warehouse design: a structured approach, Eur. J. Oper. Res. 193
(2009) 425�436.
[8] J. Li, T.C.E. Cheng, S.H. Wang, Analysis of postponement strategy for perishable items
by EOQ-based models, Int. J. Prod. Econ. 107 (2007) 31�38.
[9] C.F. Daganzo, Logistics Systems Analysis, fourth ed., Springer-Verlag, Heidelberg, 2005.
[10] A. Langevin, D. Riopel (Eds.), Logistics Systems: Design and Optimization, Springer,
USA, 2005.
[11] S. Chopra, P. Meindl, Supply Chain Management Strategy, Planning, and Operation,
Prentice-Hall, Inc., Upper Saddle River, NJ, 2001.
[12] W.H. Hausman, L.B. Schwarz, S.C. Graves, Optimal storage assignment in automatic
warehousing systems, Manag. Sci. 22(6) (1976) 629�638.
[13] V. Reddy Muppani, A.G. Kumar, Efficient formation of storage classes for warehouse
storage location assignment: a simulated annealing approach, Int. J. Manage. Sci. 36
(2008) 609�618.
[14] S.S. Heragu, Facilities Design, PWS Publishing Company, Boston, MA, 1997.
Virtual warehouse
Single location
Efficient operating Inventory visibility
Information technologies
Real-time decision Algorithms
Figure 10.6 Virtual warehousing concept
chart [28].
196 Logistics Operations and Management

[15] J.P. Van den berg, A literature survey on planning and control of warehousing systems,
IIE Trans. 31 (1999) 751�762.
[16] J.C. Johnson, D.F. Wood, D. Wardlow, P.R. Murphy, Contemporary Logistics, seventh
ed., Prentice Hall, 1999.
[17] K.B. Ackerman, The changing role of warehousing, Warehousing Forum (1993) 8.
[18] J.P. Van den berg, W.H.M. Zijm, Models for warehouse management: classification
and examples, Int. J. Prod. Econ. 59 (1999) 519�528.
[19] A. Maltz, The Changing Role of Warehousing, Warehouse Education and Research
Council, 1998.
[20] J. Drury, Towards more efficient order picking, The Institute of Materials Management,
Cranfield, UK, 1988, IMM Monograph No. 1.
[21] J.A. Tompkins, J.A. White, Y.A. Bozer, E.H. Frazelle, J.M.A. Tanchoco, J. Trevino,
Facilities Planning, second ed., Wiley, New York, 2003.
[22] D. Blanchard, Supply Chain Management: Best Practices, John Wiley & Sons,
New Jersey, 2007.
[23] J.A. Muckstadt, S. Amar., Principles of Inventory Management When You Are Down
to Four Order More, Springer Science1Business Media, New York, 2010.
[24] G. Ghiani, G. Laporte, R. Musmanno, Introduction to Logistics Systems Planning and
Control, John Wiley & Sons, Chichester, 2004.
[25] T. Wild, Best Practice in Inventory Management, second ed., Elsevier Science, Oxford,
UK, 2002.
[26] C. Mercado (Ed.), Hands-on Inventory Management, Taylor & Francis Group, New
York and London, 2008.
[27] D.E. Stuart, J. Owen, T.L. Landers, Establishing the virtual warehouse, Manuf. Sci.
Eng. 2(2) (1995).
[28] S.H. Fung, C.F. Cheung, W.B. Lee, S.K. Kwok, A virtual warehouse system for pro-
duction logistics, Production Planning & Control: the management of operations 16(6)
(2005) 597�606.
[29] T.L. Landers, M.H. Cole, B. Walker, R.W. Kirk, The virtual warehousing concept,
Trans. Res. 36 (2000) 115�125.
197Storage, Warehousing, and Inventory Management

This page intentionally left blank

11Customer Service
Samira Fallah
Department of Industrial Engineering, Amirkabir University ofTechnology, Tehran, Iran
11.1 Customer-Service Definition
Customer service is a wide concept that varies from organization to organization;
any organization has its own policy and view toward customer service [1].
Moreover, it means different things to the parties associated with any business
transaction. This broadness of definition makes it difficult to achieve consensus.
Alternative explanations of customer service will be discussed in this section.
11.1.1 Customer Service as an Organizational Activity
Customer service can be considered to be a set of functions or activities taking
place in the customer-service department of an organization with the aim of dealing
with customers and satisfying their demands, including complaints, claims han-
dling, and billing [2,3].
11.1.2 Customer Service as a Process
Another perspective considers service as a process that takes place between a seller,
a buyer, and sometimes a third party that creates something of long- or short-term
value for the parties. Thus, from this viewpoint, customer service can be defined as
a process to effectively provide considerable added value for the whole supply
chain [4].
11.1.3 Customer Service from the Customer’s Side
Moreover, customer service can be viewed from the customer’s side and be defined
as providing customers with services that meets and, in some cases, exceeds their
needs and expectations [5].
Logistics Operations and Management. DOI: 10.1016/B978-0-12-385202-1.00011-6
© 2011 Elsevier Inc. All rights reserved.

11.1.4 How Experts Define Customer Service?
To gain deeper insight into the customer-service concept, we review some defini-
tions from logistics experts.
Christopher [4] defines it as the “transaction of all those factors that affect the
process of making products and services available to the buyer.” Johnson et al. [6]
put forward quite another definition: “The collection of activities performed in
filling orders and keeping customers happy, creating in the customer’s mind the
perception of an organization that is easy to do business with.”
11.1.5 Defining Customer Service in Logistics Context
Along with the foregoing definitions, another one is more common and applicable
in the context of logistics. This definition, known as the seven R’s, views customer
service as the output of overall logistics processes and emphasizes seven aspects as
prerequisites for delivering satisfactory services to customers. It defines customer
service as providing the right customer with the right product at the right place,
right time, and right cost in the right condition and right quantity. This definition
can be applied to all industries [7,8].
11.2 What Is Behind the Growing Importance ofCustomer Service?
The importance of customer service has grown recently, and everyday more organi-
zations understand the significance of satisfying their customers through delivering
good services [9]. Considering how influential customer service can be to any orga-
nization’s profitability, taking it into account has become a must today. Customer
service should not be considered just a tactical method, but a strategic value [10].
This requires changes in an organization’s beliefs and culture because organizations
and particularly finance departments usually view customer service as a costly
function that wastes resources, whereas the strategic view of customer service con-
siders it a competitive tool for gaining market share and differentiation.
What are the reasons for the emerging attention to customer service? What is its
magic power? This section discusses some of the main reasons for customer ser-
vice’s growing importance as a strategic and competitive issue.
11.2.1 Customer Service: The Intangible Part of a Product
Today, in different markets around the world, methods of competition between
organizations have changed and the “power of brands has declined” [4]. The point
is that with impressive advances in technology, each group of products and services
has several or many alternatives that are similar in quality. Thus, no organization
200 Logistics Operations and Management

can be ensured of keeping its current customers just by offering high-quality prod-
ucts; it needs to find more competitive methods.
One suitable approach for any firm to remain competitive is to pay more atten-
tion to customer service [11]. Today, the tangible product is not separable from the
intangibles of customer service, and not only the product itself should be techni-
cally competitive in creating value for customers but also the other service-related
issues such as delivery, reliability, ease of ordering, and availability of products
must be considered as distinctive differentiators. Hence, an organization’s inability
to provide satisfactory services to fulfill customers’ requirements may result in dis-
pleased and lost customers [4,7,12].
Moreover, it is less possible for competitors to imitate the improvement in the
area of customer service than in technological or in price reduction aspects [6].
Thus, it can be a strong differentiator for any organization in maintaining
competitiveness.
11.2.2 Costs of Attracting New Customers
Attracting new customers is a difficult and costly process. In the first transactions
with new customers, firms usually have to offer considerable discounts. The prod-
uct should have a particular distinctive feature to encourage customers to buy it,
and it should have a reasonable quality in order not to be damaged during usage.
Providing all these elements is costly [13].
Generally, attracting a new customer is 5 times more costly than keeping exist-
ing ones satisfied and pleased. This rate can increase as much as 20 times [10,14].
As a result, it is more logical for organizations to keep their current customers by
providing satisfactory services than spending more to find new ones.
11.2.3 Customer Service, Customer Satisfaction, and Loyalty
Customer service can have a considerable impact on the profitability of an organi-
zation. Good service increases customer satisfaction, which leads to customer loy-
alty [15]. A loyal customer is the one who continues to purchase from a specific
firm even though the same services or products are available and can easily be pro-
vided by other organizations. Regular purchases increase a firm’s profitability [16].
11.2.4 Customers as a Means of Marketing
Satisfied and loyal customers are precious assets for any organization, and dissatis-
fied ones can pose a threat. Besides the direct impact that satisfied customers can
have on a firm’s revenue, they can also indirectly affect profitability. Satisfied cus-
tomers can decrease the costs of marketing because they usually can act as sale
staff [10]. A pleased customer will tell three people about a firm’s services, but a
dissatisfied one will dissuade 20 [17]!
201Customer Service

With the advances in communication technology and the increasing use of the
Internet worldwide, this rate gets worse. Studies have revealed that about 12% of
online customers will tell their “buddy list” about their dissatisfaction with a firm’s
services, which includes an average of almost 60 people [10]. Indeed, satisfied cus-
tomers can be considered as a means of marketing, and it has been shown that cur-
rent customers provide as much as 65% of a firm’s business [18].
Most organizations use marketing policies to introduce their products, and
they mostly focus on traditional features of marketing [4]. Basically, marketing
can be considered as the management of the four Ps: product, price, promotion,
and place [19]. Most often the major focus and emphasis have been placed on the
first three aspects and the fourth one, place, described as physical distribution,
has usually been overlooked [4]. However, place can be looked at as a firm’s
customer-service policy. Hence, customer service is the output of an organiza-
tion’s logistics system and can be considered as an interface between logistics
and marketing [8,20].
11.2.5 Customer Service and Organization Excellence
Customer service could indirectly affect a firm’s excellence as well. When the
services of an organization meet customers’ expectations, they are satisfied.
Customer satisfaction creates commitment and loyalty that, in higher levels, may
lead to the phenomenon known as owner customers [13]. Owner customers are
interested in being more involved in firm’s processes especially in designing
new products and improving organizational services. In this respect, an organiza-
tion manages to achieve the goal of excellence models such as European
Foundation for Quality Management (EFQM) in customer involvement and
creating innovation chains.
11.2.6 Customer Service and Staff Job Satisfaction
As previously mentioned, being responsive to customers’ requirements creates sat-
isfaction and fewer customer arguments and complaints. This brings peace and less
stress for a firm’s personnel and provides them with the opportunity to save time
because they have to spend less time dealing with angry customers.
11.3 Customer-Service Elements
Customer service involves a number of activities referred to as customer-service
elements. According to a study sponsored by the National Council of Physical
Distribution Management, customer-service elements can be categorized into three
groups as follows [18]:
1. Pretransaction elements
2. Transaction elements
3. Posttransaction elements
202 Logistics Operations and Management

11.3.1 Pretransaction Elements
Pretransaction elements are not directly related to logistics activities and are more
concerned with management and organizational issues and policies [4,21]. These
elements tend to create a culture and climate for providing customers with a satis-
fying customer-service system [18]. To have a suitable customer-service system,
first it is necessary to prepare a written customer-service policy statement that clari-
fies service standards and the overall mechanism of measuring and controlling the
customer-service system [22]. This statement is important from both internal and
external perspectives. Internally, it reinforces service commitment within different
levels of the organization, especially managers [1]. From the customers’ point of
view, it provides valuable information about a firm’s service levels. Customers
should be informed of determined service standards in order to know to what extent
they could expect services. This information eliminates complaints and dissatisfac-
tions that might occur because of “unrealistic expectations” [8]. Other pretransac-
tion elements are related to the structure of an organization. It is important to have
a structure that facilitates cooperation and information flow among departments
and personnel in charge of customer-service processes. In addition, the responsibil-
ity of each person should be specifically defined, and customers should be able to
access responsible individuals easily [21].
Moreover, the system should always be prepared to deal with unexpected events
such as natural disasters, labor strikes, and lack of raw materials. It also should
have the flexibility to respond to specific customer requests [4,8,18,21].
Besides, it is important to involve customers with service processes and develop
a good and strong rapport with them [18]. Providing customers with technical
information through manuals and seminars may also facilitate the achievement of
this goal [8].
11.3.2 Transaction Elements
Transaction elements are directly related to distribution and logistics processes [4].
This category of elements includes dealing with customer orders and filling them
promptly and with acceptable accuracy. Some of these elements include:
� The availability of stock [18].� Providing customers with accurate and on-time, order-related information such as status
of inventories, actual shipping dates [4,7,8].� Providing customers with a convenient and accurate ordering process [8,21].� Selecting the appropriate transportation mode.� Focusing on order-cycle elements [8,18,21].
Order cycle is one of the major elements during transaction process, so each
stage of it should be focused and managed in an effective way. From customers’
point of view, order-cycle time is the interval between when they place orders and
when products or services are delivered to them.
� Substituting ordered products [8,21].
203Customer Service

During a stock out, an organization can substitute ordered products with others
of the same quality but with some differences such as size. In this way, the organi-
zation can satisfy customers and increase its service level. Keep in mind, however,
that this process needs good communication with customers to ensure it meets their
specific needs.
11.3.3 Post transaction Elements
Post transaction elements follow the transaction and delivery of products and are
relevant to the “consumption” of products [7]. The main goal of these elements is
to provide supporting actions [4]. Among these are the following:
� Installation, warranty, alteration, repairs, and availability of spares [4,8].� Dealing with customer complaints and claims [21].� Invoicing accuracy and procedure [7].� The possibility of temporarily replacing the products [21].� Product tracking [21].
Firms should have the ability of recalling products that are defective or are rec-
ognized to be potentially dangerous to users.
� The policy and procedure for handling returns [6,22]:
A customer may return a delivered product for several reasons: damage sus-
tained during transportation, an order-filling error made by the seller, or an error in
ordering made by the customer. Therefore, each seller should have a policy to deal
with returns and should determine an appropriate procedure for handling them and
responding to customers accurately and rapidly.
� Special Services [13]:
In some cases, the seller can provide customers with special and value-adding
services such as diagnostic monitoring and preventive maintenance. It is a differen-
tiation, especially for organizations that provide expensive facilities. By this proce-
dure, some delays in customer organization’s processes would be prevented and
considerable money and time would be saved.
11.4 Order-Cycle Time
Customers experience a firm’s services most frequently when they order a product
or service. How a firm handles the customer’s order may have a considerable effect
on overall customer satisfaction. Having a convenient and accurate ordering pro-
cess with consistent and reliable order-cycle time is a key factor in this regard.
Order-cycle time can be defined from both the seller’s and the buyer’s perspec-
tives.1 From a seller’s point of view, order cycle is the interval between receiving a
1 Order-cycle time from a customer point of view was discussed in Section 11.3.
204 Logistics Operations and Management

customer’s order and when the product is received. All activities that take place
between the order receipt and the time a warehouse is notified to fill it is called
order management [6].
In fact, managing an order is equivalent to managing each of the following
stages of order cycle, which consists of the following steps [6,18]:
� Order preparation and transmittal� Order processing� Order picking and packing� Order transportation and delivery
In the following sections, these stages will be discussed in more detail.
11.4.1 Order Preparation and Transmittal [6,18,21]
The first step for ensuring a suitable response to customer orders is being prepared
to receive them in a timely manner and to develop appropriate plans that prevent
being overloaded by orders at one time, which usually makes them very difficult to
fulfill—for instance, offering discounts to customers who place their orders on spe-
cific times.
Being prepared to receive customer orders by applying suitable policies, the
next step is to arrange appropriate ordering channels to transmit orders smoothly.
Order-transmittal time depends directly on the method used to place and send the
orders. There are several solutions for it, from traditional paper-based ones to
phone calls, fax machines, ordering via email, websites, and the use of radio.
Thanks to technological advances in recent years, new channels such as electronic
data interchange (EDI), scanners, and bar codes have been created. These channels
can communicate the point-of-sale information directly to a firm, which leads to
more accurate and rapid placement of orders.
11.4.2 Order Processing [6,8,18,21,23]
Order processing is a key stage in order cycle, and its speed and accuracy have sig-
nificant effects on the whole order-cycle time. It involves different operations such
as the following.
When an order is placed by a customer and transmitted through the predeter-
mined channel, it should first be checked for completion and clearance, and then
related information should be communicated to the warehouse and the availability
of the requested items should be checked. If the ordered items are available in the
demanded quantities, then they are picked, assembled, and prepared for shipment.
In cases in which the requested items are not available, the customer should be
notified as soon as possible via a communication channel such as phone, fax, or
e-mail. Communications with customers must be kept to know their decisions,
whether they accept substitute products, whether they wish to wait until requested
items are available, or whether they want to cancel the order.
205Customer Service

Other tasks such as checking customer credit, preparing necessary documents
for shipping, updating inventory status, and invoicing should also be accomplished.
Order-processing activities are highly dependent on how information flows
between related departments. Having an automated, integrated system that connects
associated departments such as sales, accounting, marketing, warehouse, produc-
tion, and transportation and synchronizes the information between them would
greatly affect accurate and consistent responses to customers, which helps to guar-
antee customer satisfaction. Order-processing operations benefit mostly from infor-
mation and communication technology. Traditionally, order processing used to take
as much as 70% of order-cycle time, but today’s time has been markedly reduced
with the help of advanced technologies such as EDI.
11.4.3 Order Picking and Packing [6,18]
When an order is transmitted to a warehouse, the picking and packing process
begins. First, an order-packing list that indicates which items should be picked is
prepared and given to a warehouse employee. Computer-based systems are used
for order-picking operations, which informs warehouse employees about ordered
items, their quantities, and where in the warehouse they can be found. Picked items
must be checked to ensure accuracy as well as the necessity of packaging processes
before they are passed onto the shipping department. In cases of stock out, ware-
house employees should notify the department in charge of handling orders to
notify customers.
11.4.4 Order Transportation and Delivery
The final stage of any order cycle begins with loading ordered items on carriers,
and the stage finishes when customer receives the desired products [6,18].
11.5 Developing a Policy for Customer Service
11.5.1 Important Points
Customer-service elements have a significant effect on a firm’s sales and benefits;
therefore, establishing a precise and detailed policy for serving customers is a key
to success for any organization.
When setting a policy with respect to customer service, consider the following
points in this section.
Customers Should Define the Proper Service Levels
Customer-service policy must be focused on customers. Traditionally, most organi-
zations tend to set service levels based on management judgments and experiences,
206 Logistics Operations and Management

results of past activities, and some norms of associated industry. This approach,
however, usually leads to unreliable service levels because in most cases there are
differences between what a firm and its management consider about their services
and what the customer actually experiences and perceives. In contrast, an appropri-
ate and applicable customer-service program is based on customers’ requirements,
viewpoints, needs, and a thorough understanding of the market [6,21].
Customers Are Not the Same
It should be remembered that every single customer has their own needs and expec-
tations, none of which are the same. Moreover, they do not provide equal benefits
to the organization. It is exactly the same for a firm’s products. Some are more
beneficial than others [21]. As a result, in setting policies for customer service, a
firm should not assign the same service levels to all customers and products;
instead, it should apply some grouping and segmentation based on the differences.
Increasing Service Levels Are Costly
It is important to remember that any service level has its own cost. As the level of
services increases, the associated costs also rise [18]. Consequently, in setting
customer-service levels, the trade-off between revenue from services and the cost
of establishing them should be considered. The purpose of any organization should
be to minimize the overall costs of its logistics system while providing a logical
and satisfying level of service.
In addition, a firm’s customer-service policy should be definite and clear.
Following an organized and structured approach will achieve this. The following
section introduces the steps for developing an appropriate policy.
11.5.2 Steps for Developing Customer-Service Policy
Determining Major Elements of Customer Service from the Customer’s Pointof View
The first step in setting any service policy is identifying which service elements are
important to a customer when dealing with a firm. For developing such list, besides
surveying the current literature and research on major elements, interviews with an
appropriate sample of customers may reveal the various concerns of different
groups. In this way, relevant elements are derived from customers’ viewpoints
[4,11,21].
Identifying the Relative Importance of the Major Service Elements
When the list of key service elements is derived, the next step is to determine the
elements’ relative importance and priority. An appropriate questionnaire can be
designed that captures the key elements and asks a sample of customers to weigh
each element based on how important they consider that element to be when
207Customer Service

dealing with the firm. The scale of ranking can be optional. In this step, customers’
priorities in service elements are recognized. One important point is asking respon-
dents to ascribe the real weight to each element rather than rating them all as high
priority. The designed questionnaire can be sent to the customers in several ways—
for example, by e-mail, fax, mail, and through face-to-face interviews [4,7].
Determining Customer Evaluations of Current Service Levels and Firm’sCompetitiveness [6,7,16]
Identifying the elements thought to be important to customers by itself will not set
a proper policy. Managers need a broader view of the firm’s current situation in
providing services and its position compared to other rivals. To get this informa-
tion, they require customers’ judgments. And for collecting customer’s viewpoints,
again, a questionnaire is useful. This questionnaire would include the list of main
elements that respondents should weigh based on their perception of the firm’s cur-
rent performance; in addition, it should have an extra section for rating each of the
firm’s rivals in every major element.
Knowing how customers evaluate other competitors in delivering services is
important because the results may show that high-level services are provided, but it
is not a competitive advantage for that organization if it is not higher than its rivals.
On the other hand, in an industry where the level of service provided by most orga-
nizations is not very high and customers evaluate the services of the whole industry
poorly, then a firm with low-level services may not suffer much and does not need
to provide costly high-level services.
Analyzing the results of this survey would provide beneficial information for
managers. On the one hand, it shows the areas of improvement in which the firm
performs below customers’ expectations; on the other hand, managers can recog-
nize areas in which the firm meets or even exceeds customers’ demands. In addi-
tion, this survey helps the firm evaluate its competitors, identify their strengths and
weaknesses in key elements, and appraise its own competitiveness.
Identifying Different Segments of Customer Service
A firm’s customers consist of different groups, each with distinctive needs and
expectations. They may be from different parts of the country or even from outside
national borders and need different packaging methods, distinct modes of transpor-
tation, and so on. Thus, they mostly require distinct service levels, so providing the
same services for all groups is neither economical nor feasible [24]. It is a fact that
customers are not the same; some provide the firm with more profit than others.
Some are much more beneficial than others; therefore, they require more attention
and higher service levels [25].
As a result, it is necessary for any firm to identify different groups of its custo-
mers and set the service levels for each class based on its expectations and profit-
ability. This gives rise to the need for customer segmentation. Each segment
208 Logistics Operations and Management

represents a group of customers with similar needs, preferences, and behaviors2
that are different from others3 [26].
Cluster analysis is the most widely used method for customer segmentation. It
involves a collection of statistical methods and techniques for grouping objects
based on their similar characteristics. If two respondents weigh the elements simi-
larly, then they would be in the same group [4].
Analyzing Service Requirements for Each Segment and Defining ServicePackages
With the identified segments and valuable data from previous steps, a firm can ana-
lyze the real requirements of each segment and define proper service packages with
the appropriate associated levels.
11.5.3 A Case Study on Customer Segmentation Based onCustomer-Service Elements [11]
The importance of market segmentation for a firm’s profitability and the effectiveness
of its marketing strategy are well discussed in marketing literature. Sharma and
Lambert [11] conducted market segmentation for a manufacturer in a high-technology
industry based on customer-service elements. One major step in segmentation is
selecting an appropriate base to make logical differentiations. In their paper on
customer segmentation, Sharma and Lambert [11] declared that a proper base should
have certain characteristics: It must be easily translatable to application and be ana-
lyzed without complexity. They see customer service as a suitable base for industrial
marketing segmentation.
Figure 11.1 gives an overall view of the methodology that Sharma and Lambert
[11] incorporated for conducting market segmentation.
The Taken Steps
Identifying Key Service ElementsIn addition to studying the current literature, to identify relevant elements of cus-
tomer service and the marketing mix, the researchers carried out interviews with
30 buyers and asked them to express which elements were important to them when
dealing with suppliers. The participants were selected from different sizes, loca-
tions, and types of industry to develop a thorough picture of relevant elements that
encompassed different requirements and viewpoints.
In this step, 48 major service elements were derived. Among them were the
following:
� Order-filling accuracy� Availability of order-status information
2 Maximum homogeneity.3 Minimum heterogeneity.
209Customer Service

� Consistency in lead times� Supplier’s ability to consolidate orders� Being able to select delivery carriers� Location of supplier warehouse� Locating a supplier’s order-processing personnel in the customer’s area� Computerized order entry� Supplier’s ability to meet specific service-level requirements
Determining the Relative Importance of ElementsHaving the distinguished elements, the next step was to evaluate their significance.
To this end, a questionnaire comprising the key elements was sent to 775 firms,
from which 246 filled questionnaires were received.
Data AnalysisAt first, for ease of representation, factor analysis was used to group 48 customer
elements into more understandable dimensions. The result was five main groups:
1. Information system capabilities
2. Availability of product
3. Various logistics services
4. Lead times
5. Order servicing
Figure 11.1 The methodology used to conduct market segmentation.
210 Logistics Operations and Management

Then the scores of respondents to different dimensions were cluster analyzed,
and two main segments based on the overall attitude toward customer service were
defined. In this step, customers who had the same opinion about the importance of
customer service were placed in group A. This group consisted of 128 respondents.
Group B, the other 118 respondents, believed that customer service is not a critical
factor (Table 11.1).
After recognizing different segments, the researchers continued their studies and
interpretations of derived groups to discover other differences between them, in
addition to collecting more information about the characteristics of each group.
This was necessary in order to better understand the organization’s characteristics
and set the most appropriate marketing strategy for each group.
Further analysis showed that the segments had a different attitude toward all
marketing mixes. The firms in group A were more sensitive than group B toward
these elements. Organizations in group A were smaller than in B, but their service
requirements were higher. In addition, the proportion of purchases in group A was
more than in group B (Table 11.2).
Managerial Implications
In this research, a marketing segmentation was conducted based on customer-
service elements. The analyses of gathered data showed two main segments with
different viewpoints about the importance of customer service while doing transac-
tions with the organization. In group A, there were small firms with high-rate
purchases that expected higher service levels. The firms in group B had fewer
Table 11.1 Two Identified Segments
Group A Group B
Final cluster centers: Customer-service
importance
0.7317 �0.5958
Number of cases 128 118
Table 11.2 Attitudes of Segments Toward Marketing Mix
Segment A Segment B
Products Product quality 0.28 �0.20
Range of products 0.41 �0.43
Innovative products 0.31 �0.27
Promotion Sales support 0.31 �0.36
Mass media and direct mailing 0.50 �0.44
General assistance 0.25 �0.23
Promotional activities 0.14 �0.13
Price Price sensitivity 0.52 �0.44
211Customer Service

transactions with the organization, and their expectations of customer service
were lower.
With the gathered information, the management of the firm could set the appro-
priate marketing policy for different customers. For group A, the organization
needed to provide more appropriate service levels. The marketing policy for this
group should be intensive marketing in customer service. This requires closer con-
nection with customers to achieve deeper understanding of their needs and require-
ments and to set service levels.
For customers in segment B, the firm needs to conduct a two-stage marketing pol-
icy. In stage one, the customer firm needs to be convinced that it needs to be more
sensitive about customer service; this can be achieved by explaining and showing the
benefits of good customer service. In stage two, the organization should convince
customers that its services are more effective and of higher quality than its rivals.
11.5.4 Setting Customer-Service Level
As mentioned previously, providing customer service is a mixed blessing. On the
one hand, high-level services increase customer satisfaction, which leads to high
profitability; on the other hand, it is costly because each level of customer service
needs to allocate different resources and therefore has a certain amount of cost [18]
(Figure 11.2).
Hence, it is important to strike a balance between cost and profitability of cus-
tomer-service levels [7]. There are different approaches for defining optimal
service level from experience-based methods to more scientific and mathematical
approaches. In the following section, a sample model for defining optimal customer
service will be introduced.
A Sample Model for Defining Cost-Effective Customer-Service Level [27]
Determining a cost-effective customer-service level that simultaneously considers
profits and associated costs is a major concern. In most cases, it is unclear to an
organization which service level will satisfy customers and what amount of inven-
tory is required to accomplish that.
212 Logistics Operations and Management
Service level
Cos
t of s
ervi
ces
Figure 11.2 The relationship between service levels and their
associated cost [4].

According to Jeffery et al. [27] in logistics and supply-chain literature, there are
a wide range of models for determining service level and the appropriate invest-
ment in inventory, each of which considers different variables and constraints and
has its own advantages and disadvantages.
Related models in this area have different approaches for determining the proper
service levels, including the following:
� Minimizing inventory or cost while considering service levels as a constraint.� Maximizing service levels while cost or inventory is a constraint.� Determining the relative importance of cost and service levels by using the weights cho-
sen by a decision maker.� Using stochastic programming.
According to Jeffery et al. [27], most of the current models are not suitable for
today’s complex market and supply networks. In most cases, certain simplifying
assumptions are applied that make them invalid in practice. First, most of the mod-
els consider demand as stationary, whereas in practice it is not always the case.
Second, in most cases, the models determine arbitrary service levels and do not
base them on product characteristics.
Jeffery et al. [27] developed a model to determine proper service levels with
their associated amount of inventory. The process was carried out in two main
steps. First, the researchers used logistic regression to determine how delivery per-
formance, the dependent variable, related to three independent variables: order lead
time, errors in forecast, and variation in demand.
Second, to understand the financial effects of these variables, the researchers
developed a cost equation. Intel Corporation was used for a case study, and two
product families consisting of 18 different products were studied. Over 1 year,
5000 data points were collected, each representing one order.
Step 1: Logistic Regression ModelingBy means of logistic regression, two groups of models were developed: planning
models and insight models.
Planning models were developed to model the relationship between delivery per-
formance (a binary dependent variable) and inventory and for use in future model
development. The purpose of the insight models was to understand other factors’
impacts on the relationship between delivery performance and inventory. The plan-
ning models were developed for each individual product in addition to an aggregate
model for both groups, whereas insight models were developed for each group of
products.
The result of each planning and insight models was a binary variable. The vari-
able is 1 if the order was on time or early, and a value of 0 shows a late order.
The aim of the two modeling groups was determining the weeks of inventory
(WOI) value while providing appropriate service levels for customers (Tables 11.3
and 11.4).
213Customer Service

Step 2: Modeling the Cost EquationAfter developing equations that relate customer-service level and inventory, a cost
equation was developed to derive the cost associated with a given service level:
CðSLÞ5 inventoryunits
period3 inventory holding
cost
unit
1 expected lost salesunits
period3 profit margin=unit ð11:1Þ
Inventory holding costs include warehousing costs, the decrease in the value of
products from the time they are manufactured until they are sold, the opportunity
cost of investing in inventory, and the scrapping of obsolete products.
The cost of lost orders was determined by asking customers to indicate their
reactions to stock outs. Interviews revealed that 80% of customers would wait for
the desired product or accept a substitute from the same manufacturer; the other
20% would buy the desired product from a competitor.
The developed cost equation is shown in Table 11.5.
Table 11.3 Variable Codes
Code Value Formula
Xn1 WOI (weeks) On-hand inventory/(demand for forecast
for next 13 weeks/13)
Xn2 Forecast error abs ((Forecasted demand – Actual demand)/Actual
demand)
Xn3 Order lead time Requested delivery date – Order placed date
Xn4 Coefficient of variation of
demand
s of demand for product i/m of demand
for product i
Table 11.4 The Insight Models
Product Group Model
1 Y15 0.80683X11
1 Y15 0.3893X112 1.1953 log(X12)
1 Y15 0.0213X112 0.0573 log(X13)
1 Y15 0.2883X112 1.6383 log(X14)
2 Y25 0.67053X21
2 Y25 0.6393X212 1.0533 log(X22)
2 Y25 0.0283X212 0.2793 log(X23)
2 Y25 0.2743X212 1.8153 log(X24)
214 Logistics Operations and Management

The inventory holding cost of customers was determined to be:
IHCit 5Hit Pi aveðWOIitÞFit ð11:2Þ
Considering Eqn (11.2), the overall cost equation is:
CðSLitÞ5 IHCit 5Hit Pi aveðWOIitÞFit 1 0:2ð12 SLitÞDitðRi 2 PiÞ ð11:3Þ
Step 3: Determining Proper Service Levels and WOIAfter developing the above equations for inventory and cost, some plots were gener-
ated that show cost and different service levels at various levels of WOI for each of
18 different products. The plots were used to determine the minimum cost�inventory
service level. Figure 11.3 shows the plot for one of the products.
Examining the plot reveals that the proper service level for this product is
93.8%. This level is achieved by holding 3.6 WOI; the associated cost for this level
of service is 1%.
Similar evaluation was carried out for all 18 products. The proper service levels
derived were between 88.1% and 99%, and the associated week of inventory for
achieving this level was about 3.6�6.5. The result of this model was different for
all 18 products because of the differences between their profitability and costs. But
overall, the derived potential cost savings for the desired service levels ranged
from trivial amounts to 42% for some products.
11.6 Measuring Customer-Service Performance
Having an adequate and competitive customer-service policy does not ensure a
firm’s success in fulfilling customer satisfaction while maintaining profitability.
Rather, it is necessary to regularly monitor and control it to assess the extent to
Table 11.5 The Notations of Cost Equation
t Period index
i Product index
SLit Service level (percent of orders delivered when requested) for product i in
period t
WOIit Units of inventory of product i held during period t divided by weekly
forecasted demand
Fit Average weekly forecast for product i during period t (units)
Dit Average weekly demand for product i during period t (units)
Pi Variable production cost for product i
Ri Revenue for one unit of product i
Hit Inventory holding cost as a percent of variable production cost for product i in
period t
215Customer Service

which policy objectives are accomplished and which areas need more improve-
ments besides comparing current performance with the past and with other compet-
itors [28].
Put in another way, managers need to conduct regular performance measurement
because the ability to measure is the ability to control, and this measurement pro-
vides them with valuable information on how well a firm is performing in connec-
tion with customer service and to what extent it meets customer requirements
[6,28].
Measuring the performance of an action means to quantify its effectiveness and
efficiency [29]. This process should be based on predefined metrics and standards
[7]. Therefore, determining these measures is a major concern. Most often firms
tend to measure the aspects of services that are more accessible and easier to
measure, or sometimes they use regular metrics that have been used in previous
evaluations or the ones which more support the manager’s viewpoints. This inaccu-
rate definition may cause problem because measuring performance based on these
metrics does not give managers a real picture of the firm’s current situation in pro-
viding customer service and the areas of underperformance that may lead to cus-
tomer displeasure and further profit loss. The appropriate metrics must be defined
based on what customers recognize as important factors. For determining them, a
close connection and communication with customers is vital [6,28].
Moreover, a proper measure generally must have certain characteristics: it must
be objective, measurable, and easily understandable by the relevant people. In addi-
tion, it must have a current emphasis and not just focus on previous performance; it
also must allow the firm to conduct comparisons over time. Finally, defined metrics
should have minimal overlap with each other to ensure they are measuring different
aspects of a system [28].
1
0.95
0.90
0.85
0.80
0.75
0.70
0.651.0 2.0 3.0 4.0 5.0 6.0 7.0 8.0
Weeks of inventory
Ser
vice
leve
l
Cos
t
Figure 11.3 Relationship between inventory, customer-service level, and cost for product 1.
216 Logistics Operations and Management

In logistics and supply-chain management literature, different service elements
are suggested as appropriate metrics for measuring performance. These can be cate-
gorized similar to those service elements in the three groups of pretransaction,
transaction, and posttransaction metrics [4,18,21,28]:
1. Pretransaction metrics
Stock availability
2. Transaction metrics
Convenience of ordering process
Consistency of order-cycle time
Rate of order filling
Availability of order-status information
Frequency of delivery
Reliability of deliveries
Status of back orders
Availability of special equipments
Delays in shipping
Cost of delivery
Percentage of on-time deliveries
3. Posttransaction metrics
Procedure of claims
Technical support
Accuracy of invoices
Replacing products
Besides these elements, order-cycle time is the variable that most often can be
referred to as a single and appropriate metric for assessing customer service
because its associated steps are among the most important service elements from
customers’ viewpoints [18].
The important point is that measuring a firm’s performance in the area of cus-
tomer service is not useful unless some analyses and interpretations are conducted
on the findings. This allows management to discover the areas of underperformance
and plan for corrective action.
References
[1] W.G. Donaldson, Manufacturers need to show greater commitment to customer service,
Ind. Market. Manage. 24 (1995) 421�430.
[2] Lim Don, C.P. Prashant, EDI in strategic supply chain: impact on customer service, Int.
J. Inform. Manage. 21 (2001) 193�211.
[3] Lee, S.H., Demand Management and Customer Support, IEMS Research Center. http://
www.iems.co.kr/CPL/lecture/part4/6.%20Order%20Management%20&%20Customer%
20Support.pdf
[4] M. Christopher, Logistics and Supply Chain Management: Creating Value-Adding
Networks, third ed., Pearson Education Limited, Great Britain, 2005.
[5] A customer service definition from the customer’s point of view. www.customer-
servicepoint.com/customer-service-definition.html.
217Customer Service

[6] C.J. Johnson, F.D. Wood, D. Wardlow, R.P. Murphy, Contemporary Logistics, seventh ed.,
Prentice-Hall International, Upper Saddle River, NJ, 1998.
[7] A. Rushton, P. Croucher, P. Baker, The Handbook of Logistics and Distribution
Management, third ed., Kogan Page Limited, Great Britain, 2006.
[8] D. Lambert, R.J. Stock, M.L. Ellram, Fundamentals of Logistics Management, first ed.,
Irwin McGraw-Hill, Boston, MA, 1998.
[9] E. Bottani, A. Rizzi, Strategic management of logistics service: a fuzzy QFD approach,
Int. J. Prod. Econ. 103 (2006) 585�599.
[10] A.J. Goodman, Strategic Customer Service: Managing the Customer Experience to
Increase Positive Word of Mouth, Build Loyalty, and Maximize Profits, first ed.,
AMACOM, New York, 2009.
[11] A. Sharma, M.D. Lambert, Segmentation of markets based on customer service, Int. J.
Phys. Distrib. Logist. Manage. 24 (1994) 50�58.
[12] J.M. Kyj, Customer service as a competitive tool, Ind. Market. Manage. 16 (1987)
225�230.
[13] S. Kaplan, R.P.D. Norton, Strategy Maps: Converting Intangible Assets into Tangible
Outcomes, Harvard Business School Publishing, Boston, MA, 2004.
[14] P. Kotler, K. Keller, Marketing Management, thirteenth ed., Prentice Hall, Upper
Saddle River, NJ, 2008.
[15] J. Mentzer, B.M. Myers, Cheung Mee-Shew, Global market segmentation for logostics
services, Ind. Market. Manage. 33 (2004) 15�20.
[16] L. Fogli, Customer Service Delivery: Research and Best Practices, first ed., John Wiley &
Sons, San Francisco, CA, 2006.
[17] S. Chowdhury, Power of Six Sigma, Dearborn Trade, Chicago, IL, 2001.
[18] R.H. Ballou, Business Logistics/Supply Chain Management, fifth ed., Prentice Hall,
Upper Saddle River, NJ, 2004.
[19] Gerald J. Tellis, Modelling marketing mix, The Handbook of Marketing Research,
SAGE Publications, Thousand Oks, CA, 2006, 506�522.
[20] D. Waters, Global Logistics: New Directions in Supply Chain Management, fifth ed.,
Kogan Page Limited, London, 2007.
[21] J. Stock, D. Lambert, Strategic Logistics Management, fourth ed., Irwin McGraw-Hill,
Boston, MA, 2001.
[22] A.J. Tompkins, D.J. Smith, Warehouse Management Handbook, second ed., Tompkin
Press, Raleigh, NC, 1998.
[23] G. Ghiani, G. Laporte, R. Musmanno, Introduction to Logistics System Planning and
Control, John Wiley & Sons, Chichester, England, 2004.
[24] William. R. Dillon, Soumen Mukherjee, A guide to the design and execution of seg-
mentation studies, The Handbook of Marketing Research, SAGE Publications,
Thousand Oks, California, 2006, 523�545.
[25] J.H. Lee, S.C. Park, Intelligent profitable customers segmentation system based on
business intelligence tools, Expert Syst. Appl. 29 (2005) 145�152.
[26] S. Dibb, Market segmentation: strategies for success, Market. Intell. Plann. 16 (1998)
394�406.
[27] M.M. Jeffery, J.R. Butler, C.L. Malone, Determining a cost-effective customer service
level, Supply Chain Manage. An Int. J. 13 (2008) 225�232.
[28] D. Waters, Logistics an Introduction to Supplychain Management, first ed., Palgrave
Macmillan, Houndmills, Basingstoke, 2003.
[29] A. Gunasekaran, B. Kobu, Performance measures and metrics in logistics and supply
chain management: a review of recent literature (1995�2004) for research and applica-
tions, Int. J. Prod. Res. 45 (2007) 2819�2840.
218 Logistics Operations and Management

Part IV
Special Areas and Philosophies

This page intentionally left blank

12Logistics System: Informationand Communication Technology
Shokoofeh Asadi
Industrial Engineering Department, Amirkabir University of Technology,Tehran, Iran
The main purpose of this chapter is to describe how information and communica-
tion technology has affected the logistics system in organizations. At the first sec-
tion, the role of information in a Logistics system is briefly described. Then, in the
second part, after reviewing the concept of information flow in logistics system,
some important concepts in Logistics Information Systems (LIS) such as its func-
tionality levels, key roles of LIS in company operations and its structure and the
main modules are explained. The third section is assigned to some significant infor-
mation and communication technologies which have been appeared in Logistics
systems recently such as RFID, Bar-coding, EDI and etc. Finally, results of a survey
which is conducted by “eyefortransport institute” are mentioned to evaluate the real
word companies’ situation in using state of art technologies in Logistics systems.
12.1 The Importance of Information in Logistics
In recent years, the role and importance of logistics has increased significantly in
companies and become a key element of corporate strategies. Nowadays, logistics
has been identified as an important element of corporate strategy that potentially
can lead to customers’ value creation, cost savings, enforced discipline in market-
ing efforts, and increased flexibility in production [1]. The emergence of new tech-
nologies leads to a change in the practice and significance of logistics management
and emphasizes its role in strategic function of companies [2].
By involving new technologies in logistics operations, the role of logistics in
organizations changed from only a supportive function to a value-added function,
and companies can achieve better customer service and higher cost savings so that
they can compete in global markets.
IT affects the organization in two ways: it improves the current logistics functions
of organization, and it changes the structure of logistics operations (e.g., by eliminat-
ing distributors and making contact with customers directly by using IT solutions).
Information and communication systems and technologies can play different
roles in supply-chain and logistics management. These systems and technologies
Logistics Operations and Management. DOI: 10.1016/B978-0-12-385202-1.00012-8
© 2011 Elsevier Inc. All rights reserved.

can be applied to data gathering and analyses, support decision makers, control and
monitor supply-chain operations, use information for forecasting, and facilitate the
communication between supply-chain members.
12.2 Logistic Information System
12.2.1 Information Flow
There are three flows in the logistics function: material flow, information flow, and
financial flow. According to Hammant [3], logistics is as much about the manage-
ment and movement of information as it is about the management and movement
of physical goods.
Information can be seen as the lifeblood of a logistics and distribution system.
Nowadays, the effectiveness and accuracy of distribution systems depend on the
transfer of information. To achieve this, developing an appropriate corporate strat-
egy for information requirements in a company is important [4].
Introna [5] demonstrates that the logistical systems and information and commu-
nication systems work parallel, as long as the logistics system has converted mate-
rials into products, through the creation of value for customers, the information and
communication systems convert data into information, in order to facilitate mana-
gerial decision making.
The information flow in a logistics system is as important as material flow, and
information is considered as a key source in logistics system. When the complexity
of logistics systems and channels increases and more members become involve, the
role of information flow in the logistics system becomes more significant.
As Chibba and Horte suggest [6], information flow in logistics system can be
divided into two separate categories based on their relation with physical material
flow. The first category is the information that is directly connected to the physical
material flow such as order, delivery, and replacement information. This type of
information is represented by (F) and is necessary for production and other opera-
tions of the logistics system [7].
The second category is the information (2F) that is indirectly related to the
physical material flow. It is not necessary for doing daily operations of logistics
system such as processing information about customers’ satisfaction and demands
and market trends.
In a logistics system, different types of activities and internal or external processes
generate data. In the next step, generated data are converted into information. This
information can be in different formats such as oral, textual, or paper based [8]. To
use this information for a specific purpose such as decision making, it should be con-
verted to knowledge. Converting information to knowledge is done through analysis.
So the major purpose for collecting, retaining, and manipulating data within a
firm is to make decisions ranging from the strategic to the operational and to facili-
tate a business’s transactions [9]. Figure 12.1 shows the process of converting data
to a decision.
222 Logistics Operations and Management

12.2.2 A LISs’ Functionality Levels
An information system represents an integration of data, supporting equipment, and
personnel and problem-solving methods that are used to assist the logistician in
planning and operations [10].
According to Lambert et al. [11], an LIS is a computer-based information system
that coordinates and manages all logistics management activities. Such an LIS must
be capable of transferring information between the source and demand points [11].
This section reviews three concepts about LIS: functionality levels, information
requirements, and structure. As shown in Figure 12.2, however, LIS has four levels
of functionality: transaction system, management control, tactical planning and
control and decision analyses, and strategic planning [12,13].
Transaction System
This level includes the most frequent activities in logistics management such as
order inquiries and receiving, order processing, stock status checks, bill-of-lading
preparation, and transportation-rate lookups. Such interactions may be repeated
many times each hour, so the speed of the information flow is highly important.
Operative personnel such as order-processing and transportation-rate clerks are typ-
ical users at this level.
Management Control
The emphasis at this level is on performance measurement and reporting. The main
users of this level of the information system are first-line supervisors. For example,
Activities Data Analysis Information Knowledge Decision
Figure 12.1 Process from activities to decision making [6].
Top
man
agem
ent
Mid
dle
man
agem
ent
Sup
ervi
sory
leve
lO
pera
tive
leve
l
Transaction processingInquiry response
Operational planning, decisionmaking and control
Tactical planning anddecision making
Strategic andpolicy planningand decision
making
Figure 12.2 Pyramid of LIS functionality levels [12] & [14].
223Logistics System: Information and Communication Technology

warehouse supervisors need information about space, inventory, and labor to con-
trol them, or a truck-fleet manager must have the necessary information about peo-
ple, equipment, and spare parts to schedule deliveries. The interval of generating
this information is daily, and the information is presented in report format.
Tactical Planning and Control and Decision Analyses
Tactical planning and control is an extension of management at the supervisory
level. Its interval is less than 1 year but not as often as every day. Evaluation of
inventory-control limits, planning for suppliers improvement, carrier selection,
vehicle routing and scheduling, planning warehouse layout, and planning for sea-
sonal space and transportation needs are examples of tactical planning and control
problems. The users of this information system level are middle managers such as
warehouse managers and transportation managers. At this level, the planning is a
kind of decision making.
Strategic Planning
The strategic planning is the extension of the decision analysis that is more abstract,
less structured, and more long-term in focus. At the strategic-planning level, the
goals, policies, and objectives of logistics system are established, and the main deci-
sions on the overall logistical structure and resource distribution are taken. At this
level, there is no need for high-speed information transfer, and the information sys-
tem is interrogated infrequently. So off-line systems with manual procedures are
enough for this level of planning. Examples of this level of planning include:
� Strategic alliances with other value-chain members� Identification and development of company capabilities and opportunities� Improvement of services according to customer opinions
12.2.3 Role of Information in Logistics System Operationand Performance
Information acts as the glue in logistics functions, holding the system together and
coordinating all components of logistics operations. As shown in Figure 12.3, logis-
tical information has two major components: (1) planning and coordination and (2)
operations [13].
Planning and Coordination
The primary drivers of supply-chain operations are strategic objectives derived
from marketing and financial goals. These initiatives detail the nature and location
of customers that supply-chain operations seek to match to planned products
and services. This will include customer bases, breadth of products and services,
and promotions. The financial aspect of strategic plans details resources that are
required to support inventory, receivables, facilities, equipment, and capacity.
224 Logistics Operations and Management

Capacity constraints identify manufacturing and market-distribution limitations,
barriers, or bottlenecks. It also helps identify when specific manufacturing or distri-
bution work should be outsourced. The output of capacity constraint planning is
time-phased objectives that detail and schedule facility utilization, financial
resources, and human requirements. For each product, capacity plans determine the
where, when, and how much for production, storage, and movement.
Using inputs from forecasting, promotional scheduling, customer orders, and
inventory status, logistic requirements identify the specific work facilities, equip-
ment, and labor forces required to support the strategic plan. Logistics requirements
must be integrated with both capacity constraints and manufacturing requirements
to achieve the best performance.
Inventory deployment interfaces with inventory management between planning and
coordination and operations, as shown in Figure 12.3. The deployment plan details the
timing of where inventory will be positioned to efficiently move inventory through
the supply chain. From an information perspective, deployment specifies the what,
where, and when for the logistics processes. From an optional viewpoint, inventory
management is performed on a day-to-day basis.
In production situations, manufacturing requirements determine planned sche-
dules. The traditional deliverable is a statement of time-phased inventory require-
ments that is used to drive master production scheduling (MPS) and manufacturing
requirement planning (MRP). In situations characterized by a high degree of
responsiveness, an advanced planning system is more commonly used to time-
phase manufacturing. MPS defines weekly or daily production and machine
schedules, whereas MRP coordinates the purchase and arrival of material and com-
ponents to support the manufacturing plan.
Procurement requirements represent a time-sequenced schedule of material
and components needed to support manufacturing requirements. In retailing and
Planning/Coordination
Strategicobjectives
Manufacturingrequirements
Procurementrequirements
ProcurementTransportationand shipping
Distributionoperations
Orderassignment
Inventorydeployment
Inventorymanagement
Forecasting
Operations
Orderprocessing
Logisticsrequirements
Capacityconstraints
Figure 12.3 Logistics information requirements [14].
225Logistics System: Information and Communication Technology

wholesaling establishment, purchasing determines inbound merchandise. In
manufacturing situations, procurement arranges for arrival of material and compo-
nent parts from suppliers. Regardless of the business situation, purchasing informa-
tion is used to coordinate decisions concerning supplier qualifications, degree of
desired speculation, third-party arrangements, and feasibility to long-term
contracting.
Forecasting is the prediction of the future using historical data, current informa-
tion, and planning goals and assumptions. Logistical forecasting generally has
short-term specification; typical forecast horizons are from 30 to 90 days. The fore-
cast challenge is to quantify expected sales for specific products.
Operations
A second purpose of accurate and timely information is to facilitate logistical
operations. To satisfy supply-chain requirements, logistics must receive, process,
and ship inventory.
Order processing refers to the exchange of requirements information between
supply-chain members involved in product distribution. The primary activity of
order management is accurate entry and qualification of customer orders. IT such
as mail, phone, fax, and electronic data interchange (EDI) has radically changed
the traditional process of order management.
Order assignment identifies inventory and organizational responsibility to satisfy
customer requirements. Allocation may take place in real time—i.e., immediately
or in a batch mode, which means that orders are grouped for periodic processing
such as during a day or shift. The traditional approach has been to assign responsi-
bility or planned manufacturing to customers according to predetermined priorities.
In technology-rich order-processing systems, two-way communication linkages can
be maintained with customers to generate a negotiated order that satisfies custo-
mers within the constraints of planned logistical operations.
Distribution operations involve information that facilitates and coordinates work
within logistics facilities. LIS functions in distribution operations contain physical
activities such as product receiving, material handling, storage, and order selection.
Inventory management is related to information that is necessary for implement-
ing the logistic plan. The main function of inventory management is managing and
deploying inventory according to planned requirements. The work of inventory
management is to distribute resources in a way that ensures that the overall logisti-
cal system performs as planned.
Transportation and shipping information directs inventory movement. The
activities in transportation and shipping include shipment planning and scheduling,
shipment consolidation, shipment notification, transport documentation generation,
and carrier management. The activities ensure efficient transport resource use as
well as effective carrier management. In distribution operations, it is important to
consolidate orders so as to fully utilize transportation capacity. It is also necessary
to ensure that the required transportation equipment is available when needed.
226 Logistics Operations and Management

Finally, because ownership transfer often results from transportation, supporting
transaction documentation is required.
Procurement is concerned with the information necessary to complete purchase-
order preparation, modification, and release while ensuring overall supplier compli-
ance. In many ways, the information related to procurement is similar to that
involved in order processing.
The overall purpose of operational information is to facilitate integrated man-
agement to market distribution, manufacturing support, and procurement opera-
tions. Planning and coordination identify and prioritize required work and identify
operational information needed to perform the day-to-day logistics.
12.2.4 LIS Structure
The LISs have three main components [10,12]: input, database, and output.
The structure of the LIS is shown in Figure 12.4.
Input
The input phase is a collection of data sources and data-transfer methods and
means for making appropriate data available to the computing portion of the sys-
tem. The LIS data can be obtained from many sources and in many forms, particu-
larly from the following sources.
Customers: Customer data are captured during their sales activities, order
entries, and deliveries. The obtained data are useful for forecasting, planning, and
operating decisions. Freight bills, purchase orders, and invoices are typical sources
Customerdata
Managementdata
Exceptionreports
Actionreports
Result ofanalysis
Statusreports
Prepareddocuments
Database
Computerfile
Manualrecords
Dataretrieval
Dataanalysis
Dataprocessing
Summaryreports
Publishedinformation
Companyrecords
Inpu
tD
ata
base
man
agem
ent
Out
put
Figure 12.4 Basic structures of the LIS [9,10,12].
227Logistics System: Information and Communication Technology

for this type of data. The primary source of information in logistics system is sales
order because it contains basic data about customer and demanded items. Typical
data from the customers are customer locations, their demands, weight and value of
demanded items, date of order and date of shipping, shipment size, packaging,
transportation mode, and so on.
Company records: Much valuable information can be obtained directly from a
company’s internal records. Accounting reports, status reports, internal and external
study reports, and various operating reports are examples of this type of informa-
tion source.
Company data are often an untapped source of excellent data. However, such
data are neither located at a single point within the company nor are organized in
any meaningful way for logistics decision making.
Published data: Professional journals, trade magazine, and government reports
are some sources of this type of data. This type of data is more generalized than
internally generated data.
Management predictions: Predictions of future sales level, action of competition,
availability of purchased materials are just a few of the examples of information
that are judgmental.
These types of data are maintained in the minds of company personnel, not in
company files, computer records, or libraries. Company personnel such as man-
agers, internal consultants and planners, and activity specialists are close to data
sources and become good sources themselves. Also, clerks who receive customer
feedback are valuable sources of such data.
Database Management
The most important component of an information system is the converting module
in which data are converted to information and information is converted to useful
knowledge for decision making. Database management contains three main func-
tions: data selection, analysis method selection, and basic data-processing proce-
dure to implement.
The maintenance of data in a database depends on the answers to these four
questions:
1. How critical is the information to the decisions the logistician must make in a particular
firm?
2. How rapidly does the information need to be retrieved?
3. How frequently is the information to be accessed?
4. How much effort is required to manipulate the information into the form needed?
Because logistical decisions vary in their frequency and in how rapidly required
information for them must be made available, storage and retrieval methods should
reflect these needs. Generally, the more accessible the information, the more costly
the storage and retrieval. Therefore, computer storage and electronic retrieval
and display can be justified for the most frequent planning and storage problems.
Demand forecasting, inventory control, freight-bill preparation, shipment scheduling,
228 Logistics Operations and Management

and cost-report preparation are just a few of the daily, weekly, or monthly logistics
management activities.
Activities such as warehouse location, facility layout, and material-handling
equipment review require information at approximately yearly intervals. Computer
storage is not usually economical. Most of the information is retained in company
files as records.
Finally, infrequent planning-and-control activities such as private-warehouse
construction and private-transportation equipment review usually do not justify
maintaining information in a ready form. Rather, information in its raw form can
be generated from primary data sources.
This three-tiered or ABC approach to information-storage requirements is a
good approximation method for ranking and identifying how information and data
should be stored, if at all. This then becomes a basis for deciding what types of
storage capacity are needed and how much.
Data retrieval refers to the capacity of recalling data from a database in essen-
tially its raw form or in only slightly modified form.
Data processing is one of the most popular features of the information system.
Data-processing activities are relatively simple and straightforward conversions of
data in files to more useful forms such as preparing transport bills of lading.
Processing data into information is a very basic function of the information system.
Data processing usually contains simple operations on data such as sorting and
summarizing, coding, and arithmetic manipulations that convert data to useful
information for logistics decision making and reporting.
Data analysis is the most sophisticated and newest use made of the information
system. The system may contain any number of mathematical and statistical models.
Such models provide information that is useful in dealing with some of the most dif-
ficult planning and control problems. These models use the database or the output of
data-processing steps to find trends and forecast future level of activities and other
information that is useful for planning.
Output
The output of an information system is the interface with the user of system. The
outputs in LIS cab are grouped in three types: reports, prepared documents, and
results of data analysis from mathematical and statistical models.
� Reports
� Summary reports of financial and performance indicators refer to information on
which the logistician may take action. They do not in themselves initiate action.
Inventory-level reports are of this type.
� Status reports of current activities are special-purpose reports that help the logistics
operation run smoothly. Information reports on the date of order receipt and date
shipped are examples.
� Exception reports that compare actual performance with goals are special reports that,
for example, report on unplanned events such as when transportation costs as a percent
of sales exceed a preplanned ratio.
229Logistics System: Information and Communication Technology

� Reports that initiate actions are commands sent out by the LIS to perform some activ-
ity. Examples are stock-replenishment orders, truck-routing schedules, and order-
picking list. These reports are based on management rules that are incorporated into
the computer-based information system.� Prepared documents are common and printable documents such as shipment documents
and freight bills.� Results of data analysis from mathematical and statistical models for instance, demand
forecasting is one of the most useful and important outputs can be obtained from data
analysis.
12.2.5 System Modules
The LIS should be comprehensive and capable enough to allow for communication
not only between functional areas of a firm (marketing, production, finance, logis-
tics, and so on) but also between members of the supply chain (vendors and custo-
mers) [9]. According to Frazelle [14], LIS modules can be listed as follows:
� Customer response system (CRS)� Inventory management system (IMS)� Supply management system (SMS)� Transportation management system (TMS)� Warehouse management system (WMS)
The CRS and SMS can be seen as part of the order management system (OMS),
and ordinarily WMS contains the IMS module. So LIS has three main modules:
OMS, WMS, and TMS.
The Order Management System
The OMS is the first point of logistics system contact with customers by managing
order receiving and placement. It is the front-end system of the LIS. The OMS are
closely related to WMS for checking product availability. The customer-ordered
items may be available from inventories or may be seen in the production sche-
dules. This provides information about the location of the product in the supply net-
work, quantity available, and possibly the estimated time for delivery. After
checking product availability and accepting the delivery time by the customers, the
next step is credit checking. In this step, the OMS communicate with the financial
information system to check a customer’s credit status. Once the order is accepted,
the OMS will allocate the product to the customer order, assign it to a production
location, decrement inventory, and prepare an invoice when shipping has been
confirmed.
The OMS dose not stand in isolation from the firm’s other information systems.
If the customer is to be served effectively, then information must be shared.
It should be noted that although the discussion has focused on the orders being
received by a firm, there is a similar OMS for the purchase orders placed by the
company (sometimes called the SMS). Whereas in a customer-based OMS a firm’s
customer data are important, in a purchase-based OMS the focus is on the
230 Logistics Operations and Management

company’s vendors’ data such as their delivery-performance ratings, costs and
terms of sale, capabilities, availabilities, and financial strength [9].
The ways customer orders can be placed vary from completely manual to auto-
matic when a customer’s computer directly connects to the seller’s system without
human involvement. There are clear trade-offs in each situation between cost and
information quality. In automatic order placement, the speed and accuracy of the
process increases. However, initial costs are more than manual orders because of
the need for system facilities.
Automating the order-processing function has many advantages for companies.
The first one is improving customer services through increases in speed and accu-
racy. For example, by increasing the speed of the order-placement process, the
order-cycle time can be reduced, which means that customers do not need to hold
so much safety stock. In this case, when a customer order is received, the system is
able to inform customers immediately about the order status, including item avail-
ability, shipping dates, and credit availability. If the order is allocated from inven-
tory, the inventory levels are updated automatically; if the item is not in stock,
then, according to production planning, the estimated delivery date is provided
to customers. Another benefit to a firm is avoiding human interference in order-
handling functions because these activities are now largely computerized.
Automation also has financial benefits such as generating customer invoices on the
same day as shipments, which accelerates cash flow. Finally, there are fewer billing
errors and clerical mistakes [15].
The Warehouse Management System
In some LISs, the WMS may contain the OMS or it may be two separate modules
within the LIS. The significant point is that WMS and OMS must be related
because the sales department should know about product availability. The WMS is
an information subsystem that focuses on the management of product flow and
storage [9]. The WMS normally gets information such as purchase orders and cus-
tomer orders from the company’s main transaction system such as an enterprise
resource planning (ERP) or legacy system. Information such as goods received and
dispatched and inventory levels are then fed back. The WMS has itself a wide
range of modules that may or may not be applicable for a specific purpose. The
key elements can be identified as follows [5]:
� Receiving� Put away� Inventory management� Order processing and retrieving� Shipment preparation
All of these elements will appear in the WMS of a typical distribution ware-
house, but some may not be present in warehouses used primarily for long-term
storage or those with very high turnover.
231Logistics System: Information and Communication Technology

The Transportation Management System
The TMS focuses on a firm’s inbound and outbound transportation. Like the WMS,
it shares information with other LIS components such as order content, quantity,
weight and cube, delivery date, and vendor shipping schedules. The function of
TMS as a part of LIS is planning and controlling a firm’s inbound and outbound
transportation activities. This involves the following:
� Mode selection� Freight consolidation� Routing and scheduling shipments� Fleet management
� Maintenance scheduling
� Vehicle parts control
� Fleet administration
� Fleet costing
� Tachograph analysis� Claims processing� Tracking shipment� Freight-bill payment and auditing.
12.2.6 LIS Characteristics
The characteristics that should be concerned in designing and evaluating of LISs
are as follows [5].
Availability
The rapid availability of information is absolutely necessary in responding to custo-
mers and in improving management decisions. Customers frequently need quick
access to inventory and order-status information regardless of managerial, cus-
tomer, or product-order location. Many times it calls for decentralized logistics
operations so that the information system can access information updated from
anywhere.
Accuracy
Logistics information must accurately reflect both current status and periodic activ-
ity for customer orders and inventory levels. Accuracy is defined as the degree to
which LIS reports match actual physical counts or status. Increased information
accuracy reduces inventory requirements.
Timelines
Timelines refers to the delay between the occurrence of an activity and the recogni-
tion of that activity in the information system. Timely information reduces
232 Logistics Operations and Management

uncertainty and identifies problems, thus reducing inventory requirements and
increasing decision accuracy.
Exception-Based LISs
Sometimes LISs require reviews to be done manually particularly when decisions
require judgment on the part of user. The central issue is identifying these excep-
tion situations that require management attention and decision making. LISs should
be strongly exception oriented and utilized to identify decisions that require man-
agement attention, particularly for very large orders, products with little or no
inventory, delayed shipments, and declining operating productivity.
Flexibility
An LIS must be flexible in meeting the needs of both system users and customers.
It must be able to provide data tailored to meet the requirement of a specific
customer.
Appropriate Format
Logistics reports and screens must contain the right information in the right struc-
ture and sequence.
12.3 Logistics Information and Communication Technology
As technology costs decline and usage becomes easier, logistics managers are man-
aging information electronically at lower logistics expense with increased coordina-
tion results in enhanced services by offering better information and services to
customers [13].
Advances in information systems are transforming the way logistics is managed.
Automating the order-processing function leads to better customer service and the
storage of more information for later analysis. The growing use of decision-support
systems (DSSs) in logistics is helping managers to improve both their decision-
making and forecasting capabilities. EDI is another technology that is used for
transferring information in an efficient, secure, and lower-cost way than manual
systems. Finally, technological advances in various types of hardware will continue
to enhance the quality of information available to managers, improve customer ser-
vice, and lower response times [15].
Nowadays, IT is mentioned as an opportunity to change the structure of logistics
system in a firm. IT applications in logistics [16] can be listed as follows:
� Data collection: optical scanning, electronic-pen notepads, voice recognition, and robotics� Identification: bar codes, radio frequency(RF) tags and antennas, smart cards and mag-
netic strips, and vision systems� Positional systems (GPS-MPSGIS-Navigator)
233Logistics System: Information and Communication Technology

� Communication networks and data exchange (EDI-XML-Internet-Satellite-LAN-
WAN-EPOS)� Data storage: data marts and data warehouses� Software: DSSs, artificial intelligence, general software, and LIS modules
12.3.1 Data-Handling Hardware (Data Collection and DataIdentification)
So many different IT technologies exist to make accurate capture, storage, and dis-
tribution of information within supply chains as streamlined as the supply chains
themselves. Many of these systems are about the initial capture of data. The follow-
ing describes some of the most popular techniques.
Bar Codes
Bar coding is the best-known technique used in warehousing. A bar code is a read-
able label that contains bars that represent specific numbers and letters. Bar coding
is used widely in warehousing because it is a fast and accurate technology. Bar
codes are used to identify goods and their locations. The use of bar codes can speed
up operations significantly. Problems can occur if bar codes are defaced or if the
labels fall off in transit.
Bar coding facilitates the tracking of goods moving through the logistics system,
especially in warehousing operations such as goods receiving, stock checking, find-
ing storage locations, and dispatching. Generally, we can say bar-code systems are
used to identify logistics system elements such as the identification of goods, con-
tainers, documents, production, location, and equipment. The advantages of using
bar-coding technology are its price, speed, and reliability. This technology has dis-
advantages, too; for example, the labels that are used may be damaged by scuffing,
and they may not save a large amount of information, just a few digits of data,
such as a product code or a pallet identification code.
Two-dimensional bar codes are available. As the name suggests, these are
scanned in two directions simultaneously: horizontally and vertically. They can
hold hundreds of numbers or characters, but their use is not widespread because
special scanners are required at each stage in the supply chain and common
standards are not fully established. They are, however, used in closed-loop situa-
tions [5].
Each bar-coding system has three main components: bar-code label, bar-code
readers, and bar-code printers [17].
Bar-Code Readers
Although bar codes themselves have changed little since their introduction, the
devices used to read them and transmit data onward certainly have. The kind of mod-
ern scanning equipment used within warehouses to confirm the movements of pallets,
cases, or individual products, for instance, almost invariably uses radio communi-
cations to ensure that a central WMS is updated as soon as a scan is carried out.
234 Logistics Operations and Management

Bar codes are read by both contact and noncontact scanners. Contact scanners
must contact the bar code. They can be portable or stationary and typically come in
the form of a wand or light pen. The wand or pen is manually passed across the
bar code.
Noncontact readers may be handheld or stationary and include fixed-beam scan-
ners, moving-beam scanners, and charged couple device scanners.
Suppliers have introduced omnidirectional scanners for industrial applications
that are capable of reading bar codes passing through a large view field at high
speeds, regardless of the orientation of the bar code. These scanners are commonly
used in high-speed sorting systems [17].
Optical Character Recognition
Optical character recognition (OCR) technology uses labels that can be read by
both machines and humans. It is appropriate in applications such as document han-
dling and interrogation, and text scanning [5].
Radio Frequency Identification
Radio frequency identification (RFID) technology is a new data-capture capability
that allows every individual item (each separate can of beans on a pallet, for
instance) to be uniquely identified, something bar codes could never practically do.
RFID is being applied increasingly in supply chains to track unit loads
(e.g., roll-cage pallets and tote bins), for carton identification (e.g., in trials by food
retailers and parcel carriers), and for security and other purposes at the item level
(e.g., for high-value goods). As the name RFID suggests, the mechanism uses radio
waves. Normally, such a system has the following four components:
1. A tag is attached to the goods or container that contains a microchip and an antenna.
So-called active tags also contain a battery.
2. An antenna transfers data via the tag.
3. A reader reads the data received by the antenna.
4. A host station contains the application software and relays the data to the server or
middleware.
RFID is a rapidly developing technology that allows objects to be tagged with a
device that contains a memory chip. The chip has a read-and-write facility that is
currently executed using a variety of radio frequencies.
One advantage of RFID over bar codes is that the information contained in the
tag can be updated or changed altogether. The tags are less vulnerable to damage,
unlike bar-code labels, and not easily defaced. Another advantage is that the tags
may be read from a distance and in some cases do not require line-of-sight visibil-
ity. RFID tags also can be read through packing materials but not through metal. A
mixed pallet of different products may be read simultaneously by one scanner, thus
reducing processing time significantly. RFID tags may be used to track many dif-
ferent types of assets, including people and animals.
235Logistics System: Information and Communication Technology

Active tags tend to be used for high-value units (e.g., car chassis in assembly
plants or ISO containers). However, passive tags are used in supply chains more
than active tags. These tags do not use batteries, and their power is supplied by
incoming signals, so they can be used in ranges between approximately 1 and
4 meters because they need very strong signals to provide the power. Passive tags
could not save power. Although they were expensive at first, nowadays their pro-
gressively lower costs is an advantage. There remain shortages in the RFID concept
and technology in such areas as standards, technical feasibility, operational robust-
ness, financial business cases, and, in some instances, civil liberties [5].
Of all the new technologies, RFID arguably holds the most promise, but the fact
that RFID tags cost many times more than bar codes has put off many potential
users up to now. Tag prices, however, are only part of the equation, and many
firms are now beginning to concentrate more on the overall business case. The
time, labor, and potential errors associated with carrying out numerous manual
scans of a bar code on its journey through a particular process or part of the supply
chain, for example, can all be done away with using RFID because RFID tags are
automatically read whenever they are in proximity to a reader. The total number of
possible reads for a product through a system makes the cost lower and lower over
time, making the technology more economical.
Magnetic Stripes and Optical Cards
Magnetic stripes commonly appear on the back of credit and bank cards. They are
used to store a large quantity of information in a small space. The magnetic stripe
is readable even through dirt or grease. Data contained in the stripe can be changed.
The stripes must be read by physical contact, however, thus eliminating them from
high-speed sorting applications. Magnetic stripes systems are generally more
expensive than bar-code systems. In warehousing, magnetic stripes are used on
smart cards in a variety of paperless applications. Smart cards are now used in
logistics to capture information ranging from employee identification to the con-
tents of a trailer load of material to the composition of an order-picking tour [5].
Vision Systems
Vision system cameras take pictures of objects and codes and send the pictures to a
computer for interpretation. Vision systems “read” at moderate speeds with excel-
lent accuracy, at least for limited environments. Obviously, these systems do not
require contact with the object or code. However, the accuracy of a read is highly
dependent on the quality of light. Vision systems are becoming less costly but are
still relatively expensive.
A large mail-order operator recently installed a vision system at receiving. The
system is located above a telescoping conveyor used to convey inbound cartoons
from a trailer into the warehouse. The system recognizes those inbound cartons
that do not have bar codes, reads the product and vendor number on the carton, and
directs a bar-code printer to print and apply the appropriate bar-code label [17].
236 Logistics Operations and Management

Error Rates
Some years ago, the US Department of Defense published the following informa-
tion about error rates in different data-capturing methods:
Written entry 25,000 in 3 million
Keyboard entry 10,000 in 3 million
OCR 100 in 3 million
Bar code (code 39) 1 in 3 million
Transponders (RFID tags) 1 in 30 million
Although these data are experimental, they illustrate the increasing accuracy of
this IT.
12.3.2 Positioning
The geographical information system (GIS) and global positioning system (GPS)
are well-known technologies ordinarily used in transportation and distributions.
GPS is a satellite-based navigation system, and GIS is used to capture, store, ana-
lyze, manage, and present data that are spatially referenced (linked to location).
Applications of these technologies include the following:
� In vehicle-tracking systems, a vehicle’s geographic position can be monitored using GPS.
This can provide a variety of different benefits, from improved vehicle, load, and driver
security to better customer service with the provision of accurate delivery times to lower
costs through reduced waiting and standing time because exact vehicle arrival times are
available.� Trailer tracking allows vehicles and their loads to be monitored in real time using satellite
GPS technology. This can be particularly beneficial for the security of vehicles, drivers,
and loads, many of which are of high value. Trailers can be tracked automatically, and
so-called red flags can be issued if there is any divergence from set routes. In addition,
these systems can be used for consignment tracking to provide service information con-
cerning delivery times and load-temperature tracking for refrigerated vehicles so that
crucial temperature changes can be monitored and recorded, an essential requirement for
some food chains and some pharmaceutical products.� In-cab and mobile terminals enable paperless invoicing and proof of delivery. These are
used by parcels and home-delivery operators, based on electronic signature recognition,
and also by fuel companies for the immediate invoicing of deliveries where quantities
may be variable.� On-board navigation systems are common in many private cars, but they are also used in
many commercial vehicles. They can provide driver guidance to postal codes and
addresses, which is very beneficial for multidrop delivery operations in which final cus-
tomer locations may be new or unfamiliar. They can result in significant savings in time,
fuel consumption, and redelivery, greatly improving customer service.� Linked with on-board navigation systems are traffic-information systems. These provide
real-time warnings of traffic congestion and road accidents, allowing drivers to avoid
these problem areas and considerably reduce delays and their associated additional costs.
237Logistics System: Information and Communication Technology

In tandem with routing and scheduling software, this information can be used to enable
the immediate rescheduling of deliveries and the rerouting of vehicles.
Understandably, these systems can be expensive, but for many large fleets and
operations the cost savings and improved service make compelling cases for their
adoption.
12.3.3 Communication, Networks, and Data Exchange
Electronic Data Interchange
EDI is the interorganizational computer-to-computer exchange of business docu-
mentation in a standard machine-processable format. EDI tries to omit additional
human intervention in data processing in the receiving computer.
In supply chains, EDI is used to exchange essential business information, espe-
cially between partners that have a long-term trading relationship. For example,
some multiple retailers will supply electronic point-of-sale (EPOS) data directly to
suppliers, which in turn triggers replenishment of the item sold. As a consequence
of this type of strong link, suppliers will be able to build a historical sales pattern
that will aid their own demand-forecasting activities. In this context, EDI has many
benefits. It is providing timely information about customers’ sales, it is highly
accurate, and it is very efficient because it does not require staff to manually collate
information. EDI is used to send invoices, bills of lading, confirmations of dis-
patch, shipping details, and any other information that linked organizations choose
to exchange [5].
To engage in EDI, business partners must add three components to their existing
computer systems: EDI standards, EDI translation software, and some sort of trans-
mission capability. To illustrate the underlying concept, Emmelhainz [18] provides
the analogy of an American dealing by mail with a trading partner in Germany. For
a successful communication, the partners should be able to write a letter in a gener-
ally accepted business format and be able to translate it from English to German
and use a transmission method such as a mail service (Figure 12.5).
If we simulate the condition, EDI standards play the role of the format, EDI
software provides the translation, and either direct-link or value-added networks
are utilized for transmission.
One of the biggest constraints affecting EDI growth is the lack of a single EDI
standard or language. The United Nations/EDI for Administration, Commerce, and
Transport (UN/EDIFACT) is the international standard of EDI software, whereas
the most common format of EDI standard in North America is the American
National Standard Institute’s ANSI ASC X12. Also, certain industry-specific stan-
dards have been developed according to specific needs of certain industries. Two
of the most common are Caro Interchange Message Procedure (CARGO-IMP) in
aviation, developed by the International Air Transport Association, and
Transportation Date Coordinating Committee (TDCC), which was the first devel-
oped standard in the transportation era [15].
238 Logistics Operations and Management

EDI transactions can be categorized into the following four main areas:
1. Interactive, query-response transactions are related to customers and contain operations
such as ticket reservations by customers in airlines and order-status checking.
2. Trade data interchange covers the interactions between supply-chain members, such as
purchase orders, delivery notifications, and invoices.
3. Electronic funds transfer is about the supply chain and banking system interactions such
as payment against invoices.
4. Technical data interchange is about technical data transfer such as with engineering and
design data.
Using EDI, a totally paperless supply chain can be achieved because EDI estab-
lishes connections between manufacturers, suppliers, retailers, customers, and
banks, its most important benefit. Using EDI can facilitate coordination between
supply chains and improve planning, production, and communications within. The
other benefits of using EDI can be improving internal effectiveness and efficiency,
saving time and resources, and thus reducing administrative costs. Other advan-
tages of using EDI are as follows:
� Increased internal productivity through faster information transmission as well as reduced
information entry redundancy.� Better accuracy by reducing the number of times and the numbers of individuals involved
in data entry.� Improved channel relationships.� Increased external productivity.� Increased ability to compete internationally.
Decreased operation cost through reduced labor, paper-based transactions mate-
rials, and tools and telephone and fax communications.
Electronic Point of Sale
Now a common sight in most large retail stores in the developed world, EPOS has
revolutionized the process of paying for goods. Equipment includes scanning
Business format
Translation capability
Mail services
EDI standards EDI software Network
Figure 12.5 EDI components.
239Logistics System: Information and Communication Technology

equipment, electronic scales, and credit card readers. Goods marked with a bar
code are scanned by a reader, which in turn recognizes the goods. It notes the item,
tallies the price, and records the transaction. In some cases, this system also triggers
replenishment of the sold item. One major advantage of an EPOS system is that it
provides an instant record of transactions at the point of sale. Thus, replenishment
of products can be coordinated in real time to ensure that stock outs in the retail
store are minimized. Another advantage of this system is that it has speeded up the
process of dealing with customers when large numbers of items are purchased. It
reduces errors by being preprogrammed with selling prices, and it avoids staff
having to add purchase prices mentally.
Many retailers offer loyalty card systems that reward customers with small dis-
counts for continuing to shop with a given retailer. The advantage to the retailer is
that loyalty cards with customers’ personal details are linked to their actual pur-
chases; this allows the retailer to obtain vital marketing information about these
customers [5].
Radio Frequency Data Communications
RF technology is used for two-way information exchange and is applicable in small
areas such as warehouses and distribution centers. These facilities communicate
and receive messages on a prescribed RF via strategically located antenna and a
host computer interface unit. The applications provide the following:
� Real-time communication with material handlers such as forklift drivers and order
selections.� Updated instructions and priorities for forklift drivers on a real-time basis.� Two-way communication of warehouse selection instructions, warehouse cycle count ver-
ification, and label printing to guide package movement.
Synthesized Voice
The use of a synthesized voice is increasingly popular in warehouse operations. In
stationary systems, a synthesized voice is used to direct a stationary warehouse
operator. In mobile-based systems, warehouse operators wear a headset with an
attached microphone. Via synthesized voice, the WMS talks to the operator through
a series of transactions.
The advantages of voice-based systems include hands-free operations; the opera-
tor’s eyes are free from terminals or displays, and the system functions whether or
not the operator is literate. Another advantage is the ease with which the system is
programmed. A simple Windows-based software package is used to construct all
necessary transaction conversations [17].
Satellite Communications
Many freight carrier companies are using modern technology to provide improved
customer service through better shipment tracking. Satellite communication pre-
sents the latest technology to be integrated into tracing and tracking systems. In
240 Logistics Operations and Management

just-in-time systems, where uncertainties in shipment arrivals can cause serious
consequences for production operations, navigational satellites are being used to
identify the exact location of truckload shipments as they move through the distri-
bution pipeline [10].
Satellite communication is a powerful tool and channel for fast and high-volume
information movement around the world. The applications allow the following:
� Communication between drivers and dispatchers by using dishes on the tops of vehicles.� Dispatchers to use up-to-date information regarding location and delivery for redirecting
trucks in response to need or traffic congestion.� Retail chain headquarters to obtain daily sales information quickly and use that informa-
tion to activate store replenishment and to gather useful input information for identifying
local sales pattern [13].
Networks
A local area network (LAN) is a network of personal computers (PCs) that use
phone lines or cables to communicate and share resources such as storage and prin-
ters. A LAN is restricted to a relatively small geographical location such as an
office or warehouse. Wide area networks operate across a wider geography. Client/
server architecture uses the decentralized processing power of PCs to provide LIS
operating flexibility. A server is a large computer that allows common data to be
shared by a number of users. Client implies network to PCs that access and mani-
pulate data in different ways to provide extensive flexibility [13].
E-Commerce
Using the Internet for business-to-business and business-to-consumers relations is
common and popular in companies. Many of the transactions and relations between
companies and their customers or partners are through these emerging technologies.
In logistics system, web-based solutions and the use of the Internet affect relations
with both customers and vendors. The following are examples of web-based solu-
tions in logistics [17]:
� Web-based customer response
� Online ordering
� Online customer services
� Online auctions
� Web-based returns processing
� Online presentation of product information
� Proactive order status reporting via web or e-mail� Web-based inventory management� Web-based supply
� Vendor selection from web sites
� Alternate sources of material
� E-procurement
� Online catalog for products
� Electronic bidding
241Logistics System: Information and Communication Technology

� Electronic funds transfer
� Collaborative planning, forecasting, and replenishment� Web-based warehouse management� Web-based transportation management
� Online bidding, booking, and tracking
� Online freight payment
Survey
Knowing the status of real-world companies in using IT technologies in supply-
chain and logistics management is critical for both managers and researchers.
According to this demand, the “eyefortransport institute” [16] conducted a
“Technology in Transportation and Logistics” survey at the Seventh Annual North
American Technology Forum (April 25 and 26, 2005, in Chicago). Three main dis-
cussion questions were posed in this survey:
1. To what degree was a company working with a selection of technologies?� To what degree were a company’s selection of technology capabilities and services
customer driven?� What were the most important motivating factors when deciding to upgrade technol-
ogy capabilities and customer offerings?
In the first question, each company was asked to rate the degree to which it was
working with various technology applications and IT solutions: from “Not
To what degree is your company working with the following technology solutions
Figure 12.6 Following technology solutions in logistics [17].
242 Logistics Operations and Management

interested at this time” to “Interested, but with no plans to invest,” “Planning to
invest,” and “Already investing in.” As shown in Figure 12.6, the top three techno-
logies that companies were already investing in were (1) enhancing their IT sys-
tems, (2) improving portal technology, and (3) forecasting and event management.
TMS, wireless applications in fleet and yard management are coming next. On
the other hand, the top three technologies in which companies were not then inter-
ested were Bluetooth and Zigbee, voice recognition, and ERP systems.
The second question the survey posed was, to what degree were various technol-
ogy investments customer driven? This issue is very important in measuring return
on investment (ROI) and determining long- and short-term benefits. The top one,
the same as for the first question, was “enhancing IT systems.” WMS and TMS
came in second and third, respectively.
As shown in Figure 12.7, RFID’s prospects are interesting. Although only 17%
said their customers were demanding it, more than 50% indicated that their
To what degree are your technology capabilities customer-driven
Figure 12.7 Degree of customer-driven in logistics technologies [16].
243Logistics System: Information and Communication Technology

customers were very interested. This could indicate how RFID might become
the most popular technology in the near future, one that many companies aim to
invest in.
The third and final question was about the motivating factors for upgrading tech-
nology capabilities. As shown in Figure 12.8, the most important driver in this case
was improvements in operational efficiencies. The next two were improvements to
customer services and direct customer requests. Achieving ROI was surprisingly
low on the list, with only 63% claiming it as a significant motivator.
12.4 Conclusion
Changing roles of information in logistics systems and emerging new technologies
in this area are transforming the way logistics is being managed or, in some cases,
is dramatically changing the structure of logistics systems.
By using new technologies in logistics, competing in global environments is
possible, and improvements can be realized in customer services and delivery
times, the key elements in logistics systems.
Technological advances in information areas facilitate decision making because
the real-time and accurate data and information are available. Also, the emergence
of new hardware, supportive software, and networks is helping to improve such
logistics functions as warehouse management, transportation management, and
order processing.
Figure 12.8 Most important motivating factors for upgrading technological capabilities [16].
244 Logistics Operations and Management

References
[1] C.M. Gustin, Examination of 10-year trends in logistics information systems. Industrial
Engineering 25(12) (1993), 34�39.
[2] Kengpol and Tuominen, 2006. A framework for group decision support systems: an
application in the evaluation of information technology for logistics firms. International
Journal of Production Economics. v101. 159�171.
[3] Je Hammant, Information technology trends in logistics: the pressure to invest in tech-
nology is high and will increase, Logist. Inform. Manag. 8(6) (1995) 32�37.
[4] A. Rushton, P.H. Croucher, P. Baker, Handbook of Logistics and Distribution
Management, The Chartered Institute of Logistics and Transport, London, 2006.
[5] Lucas D. Introna, The Impact of Information Technology on Logistics, International
Journal of Physical Distribution & Logistics Management, 21(5) (1991), 32�37.
[6] Chibba, A., Horte, S-A (2003), Supply chain performance a meta analysis, paper
presented at 1st joint EurOMA/POMS conference, Como, Italy.
[7] A. Chibba, Jo. Rundquist, Mapping flows—An analysis of the information flows within
the integrated supply chain, Paper presented at 16th annual NOFOMA conference,
Linkoping, 2004, p.6.
[8] Xian-zhong Xu, G. Roland Kaye, Building market intelligence systems for environment
scanning, Logistics Information Management, 8(2) (1995), 22�29.
[9] R. Ballou, Business Logistics/Supply Chain Management Planning, Organizing and
Controlling the Supply Chain, Pearson Education, New York, 2004.
[10] R. Ballou, Business Logistics Management, Prentice Hall, 1992.
[11] Lambert, Douglas M, James R Stock, and Lisa M Ellram. Business Logistics/Supply
Chain Management. Boston: Irwin/McGraw-Hill, 1998.
[12] R. Ballou, Basic Business Logistics: Transportation, Materials Management, Physical
Distribution, Prentice Hall, New York, 1987.
[13] R. Singh, S. Ailawadi, Logistics Management, Prentice Hall of India, New Delhi, 2006.
[14] Frazelle Ed., Supply Chain Strategy: The Logistics of Supply Chain Management.
McGraw-Hill, New York, 2001.
[15] eLOGMAR-M Chinese, European Forum on e logistics, Shenzhen, P.R. China, 2006.
[16] Seventh Annual eyefortransport North American Technology Forum, 2005 Technology
in Transportation and Logistics Survey Results, Hyatt Regency McCormick Place,
Chicago, 2005.
[17] N.K. Gourdin, Logistics Management: A Global Perspective: a Competitive Advantage
for the New Millennium, Blackwell Publishing, Oxford, 2005.
[18] M.A. Emmelhainz, Electronic Data Interchange: A Total Management Guide, Van
Nostrand Reinhold, New York, 1990.
245Logistics System: Information and Communication Technology

This page intentionally left blank

13Reverse Logistics
Masoomeh Jamshidi
Industrial Engineering Department, Amirkabir University of Technology,Tehran, Iran
In addition to increased environmental concerns and severe environmental laws,
reverse logistics (RL) has received increasing attention during this period. There
are several explanations for RL in the related literature. For example, the Council
of Logistics Management (CLM) defines RL as the “term often used to refer to the
role of logistics in recycling, waste disposal, and management of hazardous materi-
als; a broader perspective includes a relating to logistics activities carried out in
source reduction, recycling, substitution, reuse of materials, and disposal” [1].
The European Working Group on Reverse Logistics, RevLog (1998), has pre-
sented the following definition of RL: “The process of planning, implementing and
controlling flows of raw materials, in process inventory, and finished goods, from a
manufacturing, distribution, or use point to a point of recovery or point of proper
disposal” [1].
Difference Between Waste Management and RL [2]
Waste management is about efficiently collecting and processing waste (products
for which there is no new use). RL is concerned with products that have some
value to be recovered as a new one.
Difference Between Green Logistics and RL [2]
RL is concerned with recapturing the value of goods at their destination, whereas
green logistics (ecological logistics) can be defined as understanding and reducing
the ecological impact of logistics. It encompasses measuring the environmental
effects of particular transportation modes, decreasing the usage of energy and mate-
rials in logistics activities, and following the guidelines of ISO 14000.
In fact, green logistics considers environmental aspects to all logistics manners
and especially on forward logistics. Environmentally mindful manufacturing is
more than just manufacturing for forward logistics. It is manufacturing that is con-
cerned with the environmental effects of products until the ends of their lives.
Differences Between Forward and Reverse Logistics [3]
In forward logistics:
1. Prediction is relatively straightforward.
2. Transportation is one to many.
Logistics Operations and Management. DOI: 10.1016/B978-0-12-385202-1.00013-X
© 2011 Elsevier Inc. All rights reserved.

3. Product quality, packaging, and pricing are relatively uniform.
4. Destination, routing, and disposition options are clear.
5. There is a standardized channel.
6. Accounting systems closely monitor forward distribution expenses.
7. Inventory management is congruous.
8. Product life cycle is controlled.
9. Transactions between parties is straightforward.
10. Real-time data is easily available to track product.
11. There are clear marketing methods.
In RL:
1. Prediction is more difficult.
2. Transportation is many to one.
3. Product quality and packaging are not uniform.
4. Disposition and destinations and routing are unclear.
5. Deviation based in channel.
6. Many items determine pricing.
7. Measuring reverse expenses usually is impossible.
8. Inventory management is not congruous.
9. Estimation of product life cycle is more difficult.
10. Extra discussion brings about complexity in transactions.
11. Process is invisible.
12. Complexity in marketing.
13.1 The Literature on RL
Dowlatshahi [4] defines five categories of RL literature: (1) general summaries and
basic RL concepts, (2) research on quantitative approaches, (3) studies of logistical
topics, (4) company profiles, and (5) RL applications.
13.1.1 General Summaries and Basic RL Concepts
General summaries and explorations of basic concepts in research logistics include
Rogers and Tibben-Lembke (1999), and De Brito and Dekker (2004) [1,2].
Genchev [5] examined returns handling at WCC (wholesale computer company)
and described the company’s successful RL program turnaround. Zoeteman et al.
[6] showed the need and potential for high-level recovery practices on a regional
basis. They presented quantitative estimates of current and future e-waste flows
between global regions that generate and process waste and analyzed their driving
forces. Janse et al. [7] developed a theoretically and empirically grounded diagnos-
tic tool for assessing a consumer electronics company’s RL practices and identified
potential for RL improvement from a business perspective.
248 Logistics Operations and Management

13.1.2 Research on Quantitative Approaches
Studies of various features of and improvements in RL systems can be found in
Fleischmann et al. [8,9] and Minner [10].
Krumwiede and Sheu [11] presented a decision-making model for RL to guide
the process of assessing the feasibility of RL for third-party providers. Hu et al.
[12] presented an RL system with multiple time steps and multitype hazardous
wastes with the objective of minimizing total operating costs. Kleber et al. [13]
described a recovery problem with continuous time and dynamic framework that
multiple demand streams and a single return is considered for different product var-
iants or qualities. A heuristic construction procedure is suggested. Horvath et al.
[14] offer a Markov chain approach to modeling the risks, expectations, and poten-
tial shocks associated with the cash flows of retail RL activities. Listes and Dekker
[15] presented an approach based on stochastic programming in which a determin-
istic location model for producing recovery network design may be extended to
explicitly account for uncertainties. In the same year, Ravi et al. [16] proposed a
decision model based on the analytic network process (ANP).
The problem related to RL options for end-of-life (EOL) computers in a hierarchi-
cal form and links the dimensions, determinants and enablers of the RL with options
available to the decision maker. Min et al. [17] presented a nonlinear mixed-integer
programming model for RL problems and suggested a genetic algorithm to solve the
problem. The model and its solution explicitly consider trade-offs between inventory
cost savings and freight rate discounts because of consolidation and transshipment.
Schultmann et al. [18] presented an RL tasks model within closed-loop supply chains.
They used a Tabu search (TS) algorithm to solve it. Min and Ko [19] proposed a
mixed-integer programming model for RL problems that consider the location and
allocation of repair facilities for third-party logistic companies (3PLs). A genetic
algorithm is suggested to solve the problem. Sheu [20] proposed a coordinated
reverse logistics (CRL) management system for treating multiple hazardous wastes in
a given region. A linear multiobjective analytical model is formulated with the objec-
tive of simultaneously minimizing the corresponding risks and the total cost of RL.
Pati et al. [21] formulated a framework and model to assist in determining facility
locations, routes, and flows of different varieties of recyclable wastepaper. Du and
Evans [22] developed a dual-objective MIP (mixed-integer programming) optimization
model for the RL network problem; its objective is to minimize total cost and maxi-
mize customer satisfaction. To solve the problem, they used a combination of three
algorithms: scatter search, constraint method, and dual simplex method. Sheu [23] for-
mulated a linear multiobjective optimization model to optimize the operations of both
nuclear power generation and the corresponding induced waste RL. Saen [24] proposed
a model for selecting 3PL providers in the presence of multiple dual-role factors.
Fonseca et al. [25] proposed a comprehensive model for RL planning in which
they considered many real-world features such as the existence of several facility
echelons, multiple commodities, choices of technology, and stochastics associated
with transportation costs and waste generation. Moreover, they presented a two-stage
249Reverse Logistics

stochastic dual-objective mixed-integer programming formulation in which strate-
gic decisions are considered in the first stage and tactical and operational decisions
in the second. Pishvaee et al. [26] proposed a mixed-integer linear programming
(MILP) model for multistage RL networks that minimize fixed opening and trans-
portation costs. To find the near-optimal solution, they applied a simulated anneal-
ing (SA) algorithm with particular neighborhood search mechanisms. Sasikumar
et al. [27] designed a multiechelon RL network for product recovery to maximize
the profit of remanufacturing operations. The model resented is validated through
the example of a tire-retreading business operating in secondary markets.
13.1.3 Studies of Logistical Topics
Particular topics such as distribution, warehousing, and transportation are addressed
in Jahre [28] and Pohlen and Farris [29].
Dethloff [30] proposed a vehicle-routing problem (VRP) with simultaneous
delivery and pickup and then studied this problem relationship with other VRPs.
Dobos [31] presented a minimization model to minimize the sum of the quadratic
deviation from described inventory levels in stores and from described operations
(e.g., rates of manufacturing, remanufacturing, and disposal). Optimal policies for
inventory in an RL system are found with a specific structure. The maximum prin-
ciple of Pontryagin is applied to solve the problem. Chen et al. [32] addressed the
RLRFE (reverse logistic recycling flow equilibrium) problem as a flow equilibrium
problem from a systemwide policy-making perspective, focusing particularly on
equilibria in situations in which market price and recycling channel flows are cou-
pled interactions and input�output recycled material flows at each agent are not
balanced. They propose a three-loop nested diagonalization method in which asym-
metric link interactions are gradually relaxed to achieve the equilibrium solution.
Kara et al. [33] presented a simulation model of an RL network. The simulation
was tested by using an EOL white goods collection process; it is useful also for
simulating the collection of other EOL products. Efendigil et al. [34] presented a
two-phase model based on artificial neural networks and fuzzy logic for choosing
the best 3PLs for RL. Mutha and Pokharel [35] presented a mathematical model
for RL network design. In their model, returned products are consolidated in a
warehouse and then sent to reprocessing center for dismantling and inspection.
Lee and Chan [36] proposed an RL system based on radio-frequency identifica-
tion (RFID) technology to demonstrate the benefits of using a computational intelli-
gence technique and RFID to form an integrated model to optimize the coverage of
product returns.
13.1.4 Company Profiles
Company profiles that illustrate the critical role of some manufacturing technolo-
gies in RL accomplishments can be found, for example, in Thierry et al. [37].
Kim et al. [38] proposed a mathematical model and general framework for a rema-
nufacturing system.
250 Logistics Operations and Management
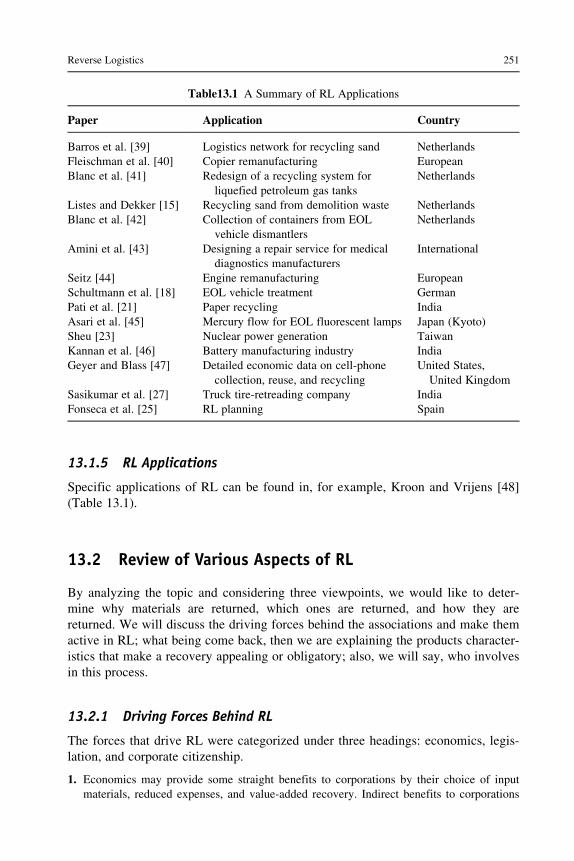
13.1.5 RL Applications
Specific applications of RL can be found in, for example, Kroon and Vrijens [48]
(Table 13.1).
13.2 Review of Various Aspects of RL
By analyzing the topic and considering three viewpoints, we would like to deter-
mine why materials are returned, which ones are returned, and how they are
returned. We will discuss the driving forces behind the associations and make them
active in RL; what being come back, then we are explaining the products character-
istics that make a recovery appealing or obligatory; also, we will say, who involves
in this process.
13.2.1 Driving Forces Behind RL
The forces that drive RL were categorized under three headings: economics, legis-
lation, and corporate citizenship.
1. Economics may provide some straight benefits to corporations by their choice of input
materials, reduced expenses, and value-added recovery. Indirect benefits to corporations
Table13.1 A Summary of RL Applications
Paper Application Country
Barros et al. [39] Logistics network for recycling sand Netherlands
Fleischman et al. [40] Copier remanufacturing European
Blanc et al. [41] Redesign of a recycling system for
liquefied petroleum gas tanks
Netherlands
Listes and Dekker [15] Recycling sand from demolition waste Netherlands
Blanc et al. [42] Collection of containers from EOL
vehicle dismantlers
Netherlands
Amini et al. [43] Designing a repair service for medical
diagnostics manufacturers
International
Seitz [44] Engine remanufacturing European
Schultmann et al. [18] EOL vehicle treatment German
Pati et al. [21] Paper recycling India
Asari et al. [45] Mercury flow for EOL fluorescent lamps Japan (Kyoto)
Sheu [23] Nuclear power generation Taiwan
Kannan et al. [46] Battery manufacturing industry India
Geyer and Blass [47] Detailed economic data on cell-phone
collection, reuse, and recycling
United States,
United Kingdom
Sasikumar et al. [27] Truck tire-retreading company India
Fonseca et al. [25] RL planning Spain
251Reverse Logistics

include anticipating and impeding legislation, protecting markets, fostering a green
image, and improving supplier�customer relations.
2. Legislation: in a series of laws, a company is obliged to recover its goods or accept its
returning.
3. Corporate citizenship constitutes a set of values that force a corporation to behave respon-
sibly in RL.
13.2.2 Reasons for Return [1]
According to the usual supply-chain hierarchy, returns can be classified as coming
from manufacturing, distribution, or customers.
Manufacturing Returns
Manufacturing returns are products that are recovered during production. These
include the following:
� Surplus raw materials� Quality-control returns� Production leftovers and by-products
Distribution Returns
After goods are produced in a factory and moved into distribution, some products
return to production, including the following:
� Product recalls because of safety or health problems.� Business-to-business commercial returns from buyers because of contractual options that
allow the return of products because of damaged deliveries or unsellable products.� Store adjustments, including outdated products.� Functional returns or materials used as carriers to move products in distribution such as
pallets.
Customer Returns
Customers return products for the following reasons.
Reimbursement guarantees allow customers to change their mind regarding
unmet product needs.
Warranty returns allow the return of products because of problems discovered
during usage.
End-of-use returns include products such as bottles that cannot be used again
but which are returnable.
EOL returns are products that are at the end of their economic or physical life.
13.2.3 Types and Characteristics of Returned Products [49]
The characteristics of returned products are very important. Three relevant aspects
are composition, use pattern, and deterioration.
252 Logistics Operations and Management

Composition
Elements of composition that are of concern to the manufacturer of a returned
product include the following:
� Ease of disassembly: like removing some small piece of old electronic devices, which can
be reused.� Homogeneity of constituent elements is concerned with products that contain dangerous
material that must be removed before they can be recycled (e.g., batteries).� Ease of transportation is concerned with the specific transport of certain products. These
products need separate distribution systems to avoid contamination from old products.
Use Pattern
Patterns of use can be divided into two issues: place of use and length and intensity
of use.
� For place of use, if a product is applied in various usages and different places, its correc-
tion operation will be more difficult. As a result, the collection difficulty is directly
related to the number of use place.� If the length and intensity of use is short, then the item can be reused without the
recovery.
Product Types
We can categorize product types as follows:
1. Food
2. Civil objects
3. Consumer products
4. Industrial facilities
5. Transportation facilities
6. Items for packaging and distribution
7. Oil and chemical products
8. Pharmaceuticals
9. Army equipment
All of these products take different place and have different processes for their
recovery following their different aspect.
Deterioration
At the end of a product’s use, how much functionality remains with the product in
whole or in part strongly determines the recovery option. These aspects have sev-
eral important roles.
� Through inherent deterioration, some products are consumed completely during their use
(e.g., gasoline), or they lose their useful life quickly (e.g., batteries).� Fixability is how easily a product can be improved or refurbished to a better condition
(e.g., rechargeable batteries are easily restored).
253Reverse Logistics

� Homogeneity of deterioration is a measure of whether all parts of a product age equally
or not. This option directly affects the method of recovery.� Economic deterioration is a measure of a product’s economic functionality—that is, as it
expires will it become obsolete?
13.2.4 RL Processes
The main reverse logistic processes are (1) collection; (2) inspection, selection, and
sorting; (3) reprocessing (including repair, refurbishing, remanufacturing, retrieval,
recycling, and incineration) or direct recovery; and (4) redistribution. Further defi-
nitions follow (Figure 13.1):
In collection, used products are moved to a place for some specific treatment [49].
In inspection and separation, products are inspected and separated by both their reusabil-
ity and how they can be reused. Inspection and separation include activities such as disas-
sembly, shredding, sorting, testing, and storage.
Reuse determines whether products still have enough quality and are in good enough con-
dition that they can be used again. Examples are reusable bottles, containers, and most
rented facilities [50].
In reprocessing, a used product is converted into a usable product. This can happen at dif-
ferent levels: material (recycling), component (remanufacturing), product (repair), selec-
tive part (retrieval), module (refurbishing), and energy (incineration).
In recycling, product forms are changed into more basic forms such as scrap metal, glass,
plastic, and paper [8].
Collection
IncinerationDisposal
Selection
Reuse
Retrieval
Refurbishing
Recycling
Repair
Redistribution
Returned products
Remanufac-turing
Figure 13.1 Product flow in reverse logistics.
254 Logistics Operations and Management

In remanufacturing, a product in whole or in part is used to create a new and usable product.
Some of these activities include cleaning, disassembly, replacement, and reassembly [50].
In repairing, broken products have some aspect of their life cycles restored, possibly with
a loss of quality [8].
Refurbishing refers to upgrading a product.
In incineration, products are burned and the released energy is captured.
In disposal, useless products that cannot be reused because of technical or economical
reasons are discarded.
In recovery, used material is captured, repaired, and remanufactured, a process that adds
value [8].
In redistribution, products are distributed to different markets. This step consists of stor-
age, sales, and transportation [50].
13.2.5 RL Actors [1]
Many participants have different roles in RL, such as the supply-chain players
(e.g., manufacturers, suppliers, wholesalers, and retailers), specialized reverse-
chain actors (e.g., jobbers and recycling specialists), and players who are opportunis-
tic (e.g., charity organizations) (Figure 13.2). There are many actors with different
objectives that may compete. For example, a manufacturer that wants to prevent job-
bers from reselling its products at lower prices may do recycling itself.
Third-Party Providers and RL [34]
Many companies are outsourcing most or all of their logistics activities to 3PL ser-
vice providers, including RL activities such as transportation, warehousing, and
material disposal. These service providers execute RL activities better and at a
Product Collector Processor
Customer
Responsible Organizer
Info
StateOEM
FoundationWholesaler/retailer
...Financial transactions
OEMJobber
...
Municipality Jobber
3rd partiesLSP….
Redistributor
Figure 13.2 Actors in reverse logistics [34].
255Reverse Logistics

lower cost. These outsourced suppliers control reverse flows and perform key
value-added services such as remanufacturing, repackaging, and refurbishing.
Choosing the best specialist who offers the most benefits in the market for the low-
est price is a critical time-consuming and complex decision that requires assessing
multiple decision-making criteria. In this case, the new literature offers many meth-
ods for choosing suppliers (partners):
� Matrix or weight approaches� Mathematical programming methods� Probabilistic approaches� Artificial intelligent techniques� Integrated approaches
In RL management, a few studies have used such decision-making techniques as
fuzzy methods to consider clear and unclear criteria, human judgments, priorities,
and trade-offs between criteria and goals.
13.3 Information Technology for RL [3]
One of the biggest duties in the proposing of RL activities is controlling the natural
uncertainty in the systems included in products recovery and reuse, where the used
products compared to the raw materials, are less standardized and homogeneous.
The new technology has an important role with this uncertainty, for example when
some estimates for returning merchandise guess that online-driven products realize
return rates in excess of 30%, the historical rate is about 5%. By suggesting
the efficiencies of web technology and e-commerce, we have the following four
directions:
1. Proactive minimization of returns: In this case, databases help decrease the number of
returned products just because of misunderstanding without any fault.
2. Minimization of returns’ uncertainty: In this case, a system registers the number of return-
ing products and determines when, where, and why they are being returned.
3. Returns and 3PL operators: Increasingly, 3PL offers Web-enabled applications with real-
time access to data across customers reverse-supply chains.
4. Consolidating returns channels: Exploiting the Web, in order to make a central stream,
the original equipment manufacturers (OEMs) mix their channels. Today, the electronic
marketplaces have the most popular model for e-commerce for RL that are used for both
new products and second-hand ones. So for offering the used pieces or remanufactured
equipment, there are some sites which used the Web. There is also a Web-based paradigm
that includes collection, selection, reuse, and redistribution.
13.4 RL and Vehicle Routing [30]
At the strategic level, decisions about which activity, where the activity is done,
and who does the activity must be made for the RL system. On the medium-term
256 Logistics Operations and Management

level, the relationship between forward and reverse channels and the redistribution
system’s operator have to be determined. On the operational level, depending on
the forward and reverse relationships, different variants of the popular and exten-
sively studied VRP occur with other planning problems. A separate basic VRP
should be solved for each channel if independent forward and reverse channels are
selected.
In many distribution or redistribution systems, operating the forward and reverse
channels separately may result in use of inessential vehicle. By combining pickups
at customer locations and deliveries within the same vehicle routes, this problem
can be avoided. In many practical applications, the customers would like simulta-
neous pickup and delivery because of environmentally motivated distribution or
redistribution systems. They may not accept pickup and delivery separately, to do
the handling effort just once. This latter situation may be called a VRP with simul-
taneous delivery and pickup (VRPSDP). As law forces corporations to take respon-
sibility for the age of their products, they become increasingly interested in gaining
control over entire life cycles in order to enhance the quality of recovered products.
Consequently, it is attractive to lease items and periodically exchange them. Also
planning for such exchanges is a VRPSDP. For the effective collection of used pro-
ducts and the delivery of reusable products, effective vehicle routes have to be
determined.
13.5 Quantitative Models for RL [8]
Quantitative models are divided into distribution planning, inventory control, and
production planning. In this section, the basic models in these related areas are pre-
sented after an introduction to reverse distribution. For more information, refer to
the related references.
13.5.1 Reverse Distribution
The packaging and collecting and following the transportation of used products are
reverse distribution. Reverse distribution can occur in a separate reverse channel,
through the original forward channel, or through a combination of the reverse and
forward approaches. A key topic in reverse distribution systems is whether and how
forward and reverse channels can be combined. Considerable system uncertainty
and a many-to-few network structure are special aspects of reverse distribution. To
set up an effective reverse distribution channel, the following must be considered.
� Who are the actors? An actor can be a member of the forward channel or a specialized
party. This is a very important constraint on the potential integration of reverse and for-
ward distribution.� What is the relationship between the forward and the reverse distribution channel?
Recycling is often defined the open-loop systems which in this case the product do not
return to their main producer and are used in other industries. The combination
257Reverse Logistics

possibilities of forward and reverse distribution are scant in both channels as the different
actors. Remanufacturing and reuse are often described as closed-loop systems into which
packed products are returned to their original producers.
Reverse distribution can either take place directly through the main network or
through specialized logistical suppliers. Because delivery and pickup can be han-
dled differently, the combination of forward and reverse distributions at the routing
level can be more difficult, even if the same actors are included.
Mixed-Integer Location Models for the Design of RL Networks [26]
The most widespread modeling approach to logistics network design problems in
various contexts is concerned with facility location models based on MILP.
Multistage network is considered for this problem which includes customer, col-
lection and inspection centers, factories for recovering or new production, and dis-
posal centers. Two proclivity for the collected goods is considered: recovery (for
certain parts of the collected goods) and disposal. Figure 13.3 shows the general
structure of this network.
Sets
I5 potential plant locations for collection/inspection
J5 fixed recovery locations
K5 fixed disposal locations
L5 fixed customer locations
Variables
Yi 51 if a collection=inspection center is open at location i
0 otherwise
�
Customer
Collection/inspectioncenter
Disposal
Recovery center
Returns flow
Figure 13.3 Recovery network design [26].
258 Logistics Operations and Management

Xli5 number of returns from customer l to collection or inspection center i
Zij5 number of recordable items transferred from collection or inspection center i to
recovery center j
Wik5 number of scrapped items transferred from collection or inspection center i to dis-
posal center k
Costs
cfli5 transportation cost for a unit of returned items from customer center l to collection
or inspection center i
csij5 transportation cost for a unit of recordable items from collection or inspection cen-
ter i to recovery centers j
ctik5 transportation cost for a unit of scrapped item from collection or inspection center i
to disposal centers k
cafi5 capacity of the collection or inspection centers i
casj5 capacity of the recovery centers j
catk5 capacity of the disposal centers k
Parameters
d5 average percentage of disposed items
rl5 number of returned items from customer l
ri5 fixed cost to set up collection or inspection centers i
The objective function and its related constraints are as follows:
minXiAI
fi Yi 1XIAL
XiAI
cfliXli 1XiAI
XjAJ
csijZij 1XiAI
XjAJ
ctikWik ð13:1Þ
subject to
XjAJ
Xli 5 rl ’ lAL ð13:2Þ
XjAJ
Zij 5 ð12 dÞXlAL
Xli ’ iAI ð13:3Þ
XkAK
Wik 5 dXlAL
Xli ’ iAI ð13:4Þ
XlAL
Xli # Yicafi ’ iAI ð13:5Þ
XlAL
Zij # casj ’ jAJ ð13:6Þ
259Reverse Logistics

XlAL
Wik # catk ’ kAK ð13:7Þ
YiAf0; 1g ’ iAI ð13:8Þ
0#Xli; Zij; Wik ’ iAI; jAJ; kAK; lAL ð13:9Þ
In this formulation, inequality (13.2) shows logical constraints that ensure that
total returns and customer demand will be considered. Inequalities (13.3) and
(13.4) ensure there are balanced flows at a collection or inspection center.
Inequality (13.5) ensures that the returned items are transferred to a collection or
inspection centers provide that the centers are built up and is assured the capacity
constraint. Inequalities (13.6) and (13.7) ensure the balance flow and capacity con-
straint. Finally, inequalities (13.8) and (13.9) are the usual facility opening
conditions.
13.5.2 Inventory Control Systems with Return Flows
The inventory management objective is controlling the external ingredient orders
and the internal ingredient recovery process, for supporting a needed service level
and minimizing the variable and fixed cost. There are two folds following the
returns flow’s effects. One side is that overhauling an old product is cheaper than
producing the new one. The other side increasing the uncertainty, which can lead
to higher safety stock levels, cause to reliable planning becomes more difficult.
The process of recovery, in reuse system might vanish with the returned products
which enter to the usable inventory directly.
The other system’s input parameters which require to be described externally for
system are the predicting of future returns and an appropriate economic valuation
of the returned items. Three essential aspects differs from those in traditional
inventory control systems. First, as the return flow results the level of inventory
between new item replenishments, is no longer necessarily reducing but can rise
also. Second, for satisfying demands impose, external orders and recovery have to
be coordinated. Third, by differentiate between products yet to be repaired and
usable the situation explained at the above naturally causes to a two-echelon inven-
tory system. Therefore, in this context, surveys on adequate strategies for echelon
stock control, such as PULL against PUSH policies are relevant.
Inventory models can be classified as deterministic or stochastic (Figure 13.4).
In a deterministic model, quantity of returns and the time of the demands and
returns are known.
In stochastic models, the demands and returns are not known and included (i)
repair systems and (ii) product recovery systems that is classified into periodic and
continuous review models.
260 Logistics Operations and Management

An Inventory System with Remanufacturing [51]
Using the remanufacturing operation, a usable stock could be improved into a
newly manufactured stock. Figure 13.5 demonstrates an inventory system with
remanufacturing. The model has the following assumptions:
� There is no disposal option for returned products.� The holding cost for serviceables is larger than that for returns.� Variable costs of manufacturing and remanufacturing are not included.
The objective is to minimize total setup and holding costs. Two alternatives are
considered: (1) a joint setup for manufacturing and remanufacturing when the same
production line is used for both processes, and (2) separate setups for manufactur-
ing and remanufacturing.
Joint Setup Cost ModelThis model is appropriate for a system that has manufacturing and remanufacturing
activities on the same production line and that use the same resources.
Disposal
Inventory system
Outside procurementproduction
Demand fornew products
Serviceableinventory
Recoverableinventory
Returnof usedproduct Recovery
process
Figure 13.4 Framework of inventory management with returns [8].
Serviceableinventory
Productdemand
Manufacturing
Remanufacturing
Return inventory
Customer
Figure 13.5 An inventory system with remanufacturing [51].
261Reverse Logistics

This model is formulated as follows:
Variables
Irt 5 number of returned items
hr5 holding cost per unit time for a returned item
Rt5 number of items returned in period t
xrt 5 amount remanufactured in time t
Minimize
XT
t5 1Kδt 1 hrIrt 1 hsIst ð13:10Þ
subject to
Irt2 1 1Rt 2 xrt 5 Irt ’ tAf1; . . . ;Tg ð13:11Þ
Ist2 1 1 xmt 1 xrt 2Dt 5 Ist ’ tAf1; . . . ; Tg ð13:12Þ
xtm 1 xrt #Mtδt ’ tAf1; . . . ; Tg ð13:13Þ
Mt 5XT
i5 tDi ’ tAf1; . . . ; Tg ð13:14Þ
xmt ; xrt ; I
st ; I
rt $ 0; δt;Af0; 1g ’ tAf1; . . . ;Tg ð13:15Þ
Equations (13.11) and (13.12) implicate the balance of return inventory and
usable stocks. Equation (13.13) keeps track of the setups.
Separate Setup Cost ModelThis model is appropriate for a system that has manufacturing and remanufacturing
activities on separate production lines. The formulation of the model is as follows:
Kr5 setup costs for remanufacturing
Km5 setup costs for manufacturing
Minimize
XT
t5 1Krδrt 1Kmδmt 1 hrIrt 1 hsIst ð13:16Þ
Irt2 1 1Rt 2 xrt 5 Irt ’ tAf1; . . . ;Tg ð13:17Þ
Irt2 1 1 xmt 1 xrt 2Dt 5 Ist ’ tAf1; . . . ; Tg ð13:18Þ
xrt #Mtδrt ’ tAf1; . . . ;Tg ð13:19Þ
xtm #Mtδmt ’ tAf1; . . . ; Tg ð13:20Þ
262 Logistics Operations and Management

Mt 5XT
i5 tDi ’ tAf1; . . . ; Tg ð13:21Þ
xmt ; xrt ; I
st ; I
rt $ 0; δrt ;δ
mt Af0; 1g ’ tAf1; . . . ;Tg ð13:22Þ
13.5.3 Production Planning with Reuse
Returned items and parts are converted into raw materials by processes such as
melting and grinding. These activities are not separate from other production pro-
cesses. The products must be disassembled before recycling.
Selection of Recovery Options
For returned items, we need to know whether or not they are reusable. For exam-
ple, for products with complex structures, the appropriate level of disassembly and
processing must be selected for the component released with the technical and eco-
nomical considerations taken into account.
Scheduling in a Product Recovery Environment
Two aspects must be considered in handling corresponding production activities:
(1) MRP for product recovery and (2) shop floor control in remanufacturing.
13.6 Classification of Product Recovery Networks [9]
The main differences between recovery networks are the following:
� The degree of centralization� Number of levels� Connections with other existing networks� The supply-chain structure (open vs. closed loop)� The degree of branch cooperation
Centralization is a measure of the horizontal integration or width of a network
by the number of locations that carry out similar activities.
Number of levels is a measure of the vertical integration or depth of a network
by the number of facilities and how good visits sequentially.
Connections with other existing networks indicate how well a new network inte-
grates with previously existing networks.
Open-loop versus closed-loop network identifies the relationship between
incoming and outgoing network flows.
Degree of branch cooperation refers to the parties who are responsible for set-
ting up the network.
263Reverse Logistics

Recovery Network Characteristics
Recovery situations can be categorized by characteristics into products, supply
chain, and resources.
The physical and economical features of discarded products are concerned to choose the
recovery options.
Supply chain characteristics that are listed follow determine the recovery network character-
istics: investigates the actor’s behavior and the connections between them in the supply
chain, driving force exist for recovery and reuse of products, obligations in the supply chain,
re-user’s category and behavior of disposer.
Resources include both human resources and those of recovery facilities.
Product Recovery Network Types
Product recovery networks can be assigned to three major categories: (1) bulk recy-
cling networks, (2) assembled-product remanufacturing networks, and (3) reusable
items network.
References
[1] M.P. De Brito, R. Dekker, Reverse Logistics—A Framework. Econometric Institute
Report, Erasmus University Rotterdam, Rotterdam, 2002.
[2] D.S. Rogers, R.S. Tibben-Lembke, Going Backwards: Reverse Logistics Trends and
Practices, Reverse Logistics Executive Council, Pittsburg, PA, 1999.
[3] F. McLeod, A. Hickford, S. Maynard, T. Cherrett, J. Alen, Developing innovative and
more sustainable approaches to reverse logistics for the collection, recycling and dis-
posal of waste products from urban, 2007. www.greenlogistics.org.
[4] S. Dowlatshahi, Developing a theory of reverse logistics, Interfaces 30(3) (2000)
143�155.
[5] S.E. Genchev, Reverse logistics program design: a company study, Business Horizons
52 (2009) 139�148.
[6] B.C.J. Zoeteman, H.R. Krikke, J. Venselaar, Handling WEEE waste flows: on the
effectiveness of producer responsibility in a globalizing world, Int. J. Adv. Manuf.
Technol. 47 (2010) 415�436.
[7] B. Janse, P. Schuur, M.P. de Brito, A reverse logistics diagnostic tool: the case of the
consumer electronics industry, Int. J. Adv. Manuf. Technol. 47 (2010) 495�513.
[8] M. Fleischmann, J.M. Bloemhof-Ruwaard, R. Dekker, Quantitative models for reverse
logistics: a review, Eur. J. Oper. Res. 103 (1997) 1�17.
[9] M. Fleischmann, H.R. Krikke, R. Dekker, P.F. Simme Douwe, A characterization of
logistics networks for product recovery, Omega 28 (2000) 653�666.
[10] S. Minner, Strategic safety stocks in reverse logistics supply chains, Int. J. Prod. Econ.
71 (2001) 417�428.
[11] D.W. Krumwiede, C. Sheu, A model for reverse logistics entry by third-party providers,
Omega 30 (2002) 325�333.
[12] T. Hu, J.B. Sheu, K.H. Huang, A reverse logistics cost minimization model for the
treatment of hazardous wastes, Trans. Res. Part E, 38 (2002) 457�473.
264 Logistics Operations and Management

[13] R. Kleber, S. Minnera, G. Kiesmuller, A continuous time inventory model for a product
recovery system with multiple options, Int. J. Prod. Econ. 79 (2002) 121�141.
[14] P.A. Horvath, C.W. Autry, W.E. Wilcox, Liquidity implications of reverse logistics for
retailers: a Markov chain approach, J. Retailing 81 (2004) 191�203.
[15] O. Listes, R. Dekker, A stochastic approach to a case study for product recovery net-
work design, Eur. J. Oper. Res. 160 (2005) 268�287.
[16] V. Ravi, R. Shankar, M.K. Tiwari, Analyzing alternatives in reverse logistics for end-
of-life computers: ANP and balanced scorecard approach, Comput. Ind. Eng. 48 (2005)
327�356.
[17] H. Min, H.J. Ko, C.S. Ko, A genetic algorithm approach to developing the multi-
echelon reverse logistics network for product returns, Int. J. Manage. Sci. 34 (2006)
56�69.
[18] F. Schultmann, M. Zumkeller, O. Rentz, Modeling reverse logistic tasks within closed-
loop supply chains: an example from the automotive industry, Eur. J. Oper. Res. 171
(2006) 1033�1050.
[19] H. Min, H.J. Ko, The dynamic design of a reverse logistics network from the per-
spective of third-party logistics service providers, Int. J. Prod. Econ. 113 (2007)
176�192.
[20] J.B. Sheu, A coordinated reverse logistics system for regional management of multi-
source hazardous wastes, Comput. Oper. Res. 34 (2007) 1442�1462.
[21] R.K. Pati, P. Vrat, P. Kumar, A goal programming model for paper recycling system,
Int. J. Manage. Sci. 36 (2008) 405�417.
[22] F. Du, G.W. Evans, A bi-objective reverse logistics network analysis for post-sale ser-
vice, Comput. Oper. Res. 35 (2008) 2617�2634.
[23] J.B. Sheu, Green supply chain management, reverses logistics and nuclear power gener-
ation, Transport. Res. Part E, 44 (2008) 19�46.
[24] R.F. Saen, A new model for selecting third-party reverses logistics providers in the
presence of multiple dual-role factors, Int. J. Adv. Manuf. Technol. 46 (2010)
405�410.
[25] M.C. Fonseca, A. Garcıa-Sanchez, M. Ortega-Mier, F. Saldanha-da-Gama, A sto-
chastic bi-objective location model for strategic reverse logistics, Top 18(1) (2010)
158�184.
[26] M.S. Pishvaee, K. Kianfar, B. Karimi, Reverse logistics network design using simulated
annealing, Int. J. Adv Manuf. Technol. 47 (2010) 269�281.
[27] P. Sasikumar, G. Kannan, A.N. Haq, A multi-echelon reverse logistics network design
for product recovery—a case of truck tire remanufacturing, Int. J. Adv. Manuf.
Technol. 49(9�12) (2010) 1223�1234.
[28] M. Jahre, Household waste collection as a reverse channel: a theoretical perspective,
Int. J. Phy. Dist. Logistic Manag. 25(2) (1995) 39�55.
[29] L. Pohlen, M. Farris, Reverse logistics in plastics recycling, Int. J. Phy. Dist. Logistic
Manag. 22(7) (1992) 35�47.
[30] J. Dethloff, Vehicle routing and reverse logistics: the vehicle routing problem with
simultaneous delivery and pick-up, OR Spektrum 23 (2001) 79�96.
[31] I. Dobos, Optimal production�inventory strategies for a HMMS-type reverse logistics
system, Int. J. Prod. Econ. 81�82 (2003) 351�360.
[32] H.K. Chen, H.W. Chou, Y.C. Chiu, On the modeling and solution algorithm for the reverse
logistics recycling flow equilibrium problem, Trans. Res. Part C, 15 (2007) 218�234.
[33] S. Kara, F. Rugrungruang, H. Kaebernick, Simulation modeling of reverse logistics net-
works, Int. J. Prod. Econ. 106 (2007) 61�69.
265Reverse Logistics

[34] T. Efendigil, S. Onut, E. Kongar, A holistic approach for selecting a third-party
reverse logistics provider in the presence of vagueness, Comput. Ind. Eng. 54 (2008)
269�287.
[35] A. Mutha, S. Pokharel, Strategic network design for reverse logistics and remanufactur-
ing using new and old product modules, Comput. Ind. Eng. 56 (2009) 334�346.
[36] C.K.M. Lee, T.M. Chan, Development of RFID-based reverse logistics system, Expert
Syst. Appl. 36 (2009) 9299�9307.
[37] M. Thierry, M. Salomon, J. Van Nunen, L. Van Wassenhove, Strategic issues in prod-
uct recovery management, California Management Review 37(2) (1995) 114�135.
[38] K. Kim, I. Song, J. Kim, B. Jeong, Supply planning model for remanufacturing system
in reverse logistics environment, Comput. Ind. Eng. 51 (2006) 279�287.
[39] AI. Barros, R. Dekker, V. Scholten, A two-level network for recycling sand: a case
study, Eur. J. Oper. Res. 110 (1998) 199�214.
[40] M. Fleischmann, J.M. Beullens, L.N. Bloemhof-Ruwaard, Van Wassenhove, The
impact of product recovery on logistics network design, Prod. Oper. Manag. 10(2)
(2001) 156�173.
[41] H.M.L. Blanc, H.A. Fleuren, H.R. Krikke, Redesign of a recycling system for LPG-
tanks, OR Spectrum 26 (2004) 283�304.
[42] I.L. Blanc, M.V. Krieken, H. Krikke, H. Fleuren, Vehicle routing concepts in
the closed-loop container network of ARN � a case study, OR Spectrum 28 (2006)
53�71.
[43] M.M. Amini, D. Retzlaff-Roberts, C.C. Bienstock, Designing a reverse logistics opera-
tion for short cycle time repair services, Int. J. Prod. Econ. 96 (2005) 367�380.
[44] M.A. Seitz, A critical assessment of motives for product recovery: the case of engine
remanufacturing, J. Cleaner Prod. 15 (2007) 1147�1157.
[45] M. Asari, K. Fukui, S.I. Sakai, Life-cycle flow of mercury and recycling scenario of
fluorescent lamps in Japan, Sci. Total Environ. 393 (2008) 1�10.
[46] G. Kannan, P. Sasikumar, K. Devika, A genetic algorithm approach for solving a closed
loop supply chain model: a case of battery recycling, Appl. Math. Model. 34 (2010)
655�670.
[47] R. Geyer, V.D. Blass, The economics of cell phone reuse and recycling, Int. J. Adv.
Manuf. Technol. 47 (2010) 515�525.
[48] L. Kroon, G. Vrijens, Returnable containers: An example of reverse logistics, Int. J.
Phy. Dist. Logistic Manag. 25(2) (1995) 56�68.
[49] R. Dekker, M. Fleischmann, L. Wassenhove, Reverse Logistics, Springer-Verlag,
Berlin, Heidelberg, New York, 2003.
[50] A.I. Kokkinaki, R. Dekker, J.V. Nunen, C. Pappis, An Exploratory Study on Electronic
Commerce for Reverse Logistics Econometric Institute, Report EI-9950/A, 1999.
[51] A. Sbihi, R.W. Eglese, Combinatorial optimization and Green Logistics, 4OR (5)
(2007) 99�116.
266 Logistics Operations and Management

14Retail Logistics
Hamid Afshari and Fatemeh Hajipouran Benam
Iran Khodro Industrial Group (IKCO), Iran
14.1 Overview
14.1.1 Introduction
The distribution process finishes with retailing, where each transaction sells a prod-
uct or service that has personal, family, or domestic use whether in the form of
food, clothes, or cars.
As a science, logistics also has affected retailing, and today’s mix of retailing
and logistics provides great benefits. Logistics is concerning with producing, exe-
cuting, transporting, sorting, providing services, and managing inventories in ways
that interact with each other. The big cycle of logistics starts with planning the
physical movements of products from wholesaler to retailer to customer, and then
implementing and controlling them. The plan must be effective in time and costs.
There are three common and simultaneous advantages for companies if their logis-
tics system is working and useful: (1) reducing stock outs, (2) decreasing invento-
ries, and (3) improving customer services.
An optimum Retail logistics is the one which leads us to a 100% satisfaction in
accessibility to on shelves goods for customer when they are needed [41]. Retail
logistics is concerned with product availability. It means we must know what the
customer wants, how to produce it, and where and when to deliver it [1].
Today is a high point in retail sales history. Many companies are now leaders in
terms of sales, including WalMart, General Motors, and other manufacturing
giants. Because of more opportunities, it is easy to start a new retail business or
become a franchisee. However, some consumers are bored with shopping or do not
have time for it, and many retailers sell goods at low profit and try to satisfy custom-
ers’ expectations, so there are many challenges that retailers face. A retail decision
maker must be able to answer such questions as, how can we serve customers while
earning a fair profit? How can we remain competitive in an environment in which
consumers have so many choices? How can we improve our business with loyal
customers? These questions must be addressed in any well-structured retail
strategy.
Logistics Operations and Management. DOI: 10.1016/B978-0-12-385202-1.00014-1
© 2011 Elsevier Inc. All rights reserved.

14.1.2 Retail Strategy
A retail strategy is a plan that guides the retail firm. It affects the firm’s business
activities and its reactions to competitors and markets. Every retailer must follow
six steps in strategic planning.
1. Define the category of goods or services and the firm’s specific mission (such as full
service or no frills).
2. Define long- and short-term targets for sales and profit, market share, and so on.
3. Determine customer types and characteristics (such as gender and salary level) and needs
(such as brand preferences).
4. Plan a long-term target to define direction for the company and its employees.
5. Develop a complete strategy that includes factors such as store locations, classified
products, costs, and advertising in order to achieve targets.
6. Assess and execute the plan and solve ongoing problem.
As mentioned already, retailing is the final part of the distribution chain and
includes businesses and people transporting products and services from producers
to consumers. A typical distribution channel is shown in Figure 14.1. What consu-
mers expect from a retailer is to have large variety of products from which to
choose and buy a limited quantity, because a retailer collects goods in large quanti-
ties from various producers but sells in small amounts. Some producers choose a
basic system of distribution and sell their products to a few retailers. Consequently,
retailers play an important role between manufacturers, wholesalers, and customers.
The main role of retailers is a sorting process.
Retailers play a critical role between customers and wholesalers, so they can
provide considerable valuable information to wholesalers in anticipating sales, such
as consumers’ needs. Manufacturers can improve goods and services according to
retailers’ feedback. Small suppliers and their retailers can maintain close relation-
ships that may help each other in transporting, storing, advertising, and prepaying
for products, and the relationship also can affect costs and profits when retailers
accomplish their goals. Retailers also keep close relations with customers via
accessible locations, prompt responses to customer’s demand and accurately and
being able in credit purchases processing. Some retailers also offer customers spe-
cial activities such as wrapping, delivery, and installation. In addition, most large
retailers use multichannel retailing in selling goods and services to customer, and
both face-to-face selling and selling by websites to make shopping easier for
customers.
As mentioned, there are many ways for manufacturers to sell their products such
as through retailers, mail-order catalogs, websites, and toll-free phone numbers.
This means manufacturers can have more customers, reduce costs, increase sales,
Manufacturer Wholesaler RetailerFinal
consumer
Figure 14.1 A typical channel of distribution [2].
268 Logistics Operations and Management

and improve profits. For example, Sherwin-Williams and Polo Ralph Lauren both
have full ranges of retailing functions as well as selling through traditional
retailers [2].
14.1.3 Goods and Service Retailing
One of the most important retailing items to be considered is the difference between
retailers. Two types of firms offer goods and services: store-based and nonstore-
based. There are also differences between retailers that sell services and those that
sell goods. Customers want to know the differences in the services that retailers
offer [2].
Goods retailing includes selling tangible (physical) products. Service retailing
involves intangible issues; customers do not buy or gain physical products. Some
retailers just focus on goods, some just provide service retailing, and others work
on both.
Service retailing includes many diversified business areas from one-to-one ser-
vices (personal), accommodations (hotel and motel), automobile repair services,
and so on. Furthermore, although some services are not exactly retailing activities,
they should be assumed so when they are involved in customer sale package.
Service retailing is categorized into three main groups: renting goods and
services, repair and improvement services, and nongoods services.
1. Renting goods and services: In this type of retailing, services are acquired for specific
times or goods are leased for limited time periods. After the specified time is up, the
goods must be returned or the service must end. Examples are car-rental services and
video rentals.
2. Repair and improvement services: In this category, retailers do not own any goods.
Customers give their goods or property to retailers for specific purposes such as mainte-
nance, servicing, and so on. Home-appliance repair services and seasonal apartment
repair services are examples.
3. Nongoods services: By using these services, consumers profit by intangible personal
services. Sellers have to offer personal expertise for a specified time because they are not
offering tangible goods. Travel agents, real-estate brokers, stockbrokers, and personal
trainers are examples.
14.1.4 Factors That Affect International Retailing
Nowadays retailers do not limit themselves to national borders, and international
retailers have focused on new markets. The following elements affect the level of
productivity of a retailing strategy [2].
Timing: Being first in a market is less important than being in the market before
there is serious competition.
A balanced international program: Selecting the suitable market is critical.
A growing middle class: According to current trends, middle class markets are
growing which will lead to more sales and more income.
Matching concept to market: Improving quality and mixing fashion in a market
will make a business more successful. If a market has developed, then retailers that
269Retail Logistics

offer discounts are more successful because consumers are more interested in price,
variety, and convenience [2].
14.1.5 Information Flow in a Retail Distribution Channel
Technologies now are changing the roles of business players more than ever.
Information technology is one of the largest influences. In an effective retail distri-
bution channel, efficient information passes through three main players: providers
(manufactures or wholesalers), retailers, and consumers. The outcome is close rela-
tionship among these parties with the purpose of forecasting the needs of each
party.
A supplier needs the following kinds of information.
1. From the retailer, he/she needs sales prediction for each group, rates of inventory turn-
over, information on rivals, the amount of customer returns, and so on.
2. From the consumer, he/she needs to know attitudes about styles and models, how loyal
customers are to brands, how willing customers are to pay more for better quality, and
so on.
The information a retailer needs consists of the following:
1. From a wholesaler, he/she needs advance notice of new styles and model changes,
instructions for complex products, sales forecasts, price changes, and so on.
2. From consumers, he/she needs to know why people shop at a particular retailer, what
satisfies and dissatisfies them about retailers, where else they shop, and so on.
Also, consumers want the following:
1. From wholesalers, they want instructions on how to assemble and operate a product, how
long warranty coverage will last, what they can expect in after-sale service and support,
and so on.
2. From retailers, they want to know in which stores they can find specific products and
how they can pay for them.
The main role in gathering data for wholesalers, suppliers, and customers
belongs to retailers. They can assist other channel members by performing the fol-
lowing functions:
� Permit data gathering according to their principles. Many research firms like to conduct
surveys at shopping centers because of the large and broad base of shoppers.� Collect needed information for suppliers such as how shoppers react to displays.� Pass along information on the attributes of consumers buying particular brands and mod-
els. Because credit transactions account for a major portion of sales, many retailers link
purchases with consumer age, income, occupation, and other factors.
For the best information flows, collaboration and cooperation are necessary;
especially between suppliers and retailers. This is not always easy. According to
one senior retail executive, the traditional supply chain has one important problem:
retailers and suppliers do not like to share information. This is the main reason for
disorganized supply chains.
270 Logistics Operations and Management

14.1.6 The World’s Top Retailers
WalMart is number one in world retailing, its sales totaling more than the second,
third, and fourth largest retailers in the world combined.
Several US retailers are the biggest retailers in the world, but Europeans engage
in more international retail business and have more branches in many countries.
Japan retailers have weak remaking among world retailers, according to a report by
Ira Kalish (Table 14.1) [3].
As noted, WalMart is the world’s largest retailer. It owes this position to its
strategy of expanding the number of its US stores and improving the productivity
of its old stores. It also joined with British supermarket chain in 2000.
Second place in the world’s top 100 retailers is France’s Carrefour. Previously,
second place belonged to Germany’s Metro, which is now in fourth place. Seven
out of the ten largest retailers are based in the United States, and only one of those
has a presence outside of North America. The others are focused on their home
market. Except for US and Japanese retailers, a rule is suggested that retailers can-
not gain a comprehensive share of single markets. This concept can also be fol-
lowed in Europe, especially in France, that due to regulatory restrictions on large
store development, the growth of retailers in their home markets is limited. That is
why they have strong incentives to invest in new markets.
14.2 Typology
14.2.1 Introduction
The main structure of a business is its retail establishments. In the United States,
there are 2.3 million retail firms (including those with no payroll in which only
owners or family members work), and they operate 3 million establishments. An
Table 14.1 The World’s Top 10 Retailers [3]
Rank Retailer Base Type Regionalization
1 WalMart Stores, Inc. United States Discount store Global
2 Carrefour Group France Hypermarkets Global
3 The Kroger Company United States Supermarkets Single country
4 Metro AG Germany Diversified Global
5 The Home Depot, Inc. United States Hardwares Global
6 Albertson’s, Inc. United States Supermarkets Single country
7 ITM Enterprises SA France Supermarkets Regional
8 Sears, Roebuck and Co. United States Department stores Regional
9 Kmart Corporation United States Discount stores Single country
10 Target Corporation United States Discount stores Single country
271Retail Logistics

institutional discussion shows the proportional sizes and differences between some
kinds of retailing. It also shows the influence of external environments on different
retailers. Institutional analysis is important in strategic planning when selecting and
setting missions, selecting possible ownership strategies, organizing goods and ser-
vices, and, in particular, defining objectives.
We examine retail institutions from these perspectives: ownership sets of strate-
gies related to stores and nonstore-based electronic and nontraditional retailing. An
institution might wisely allocate in more than one group.
14.2.2 Ownership Institution
From the ownership point of view, stores are categorized as independently owned;
members of chains; franchised, leased, managed, and owned by manufacturers;
wholesalers; or customers.
Retailers at first were small, but they are very large now. (Most of the stores are
run by small firms that have one outlet, and over one-half of all firms have two or
fewer paid employees). Besides, there are also very large retailers. The top five US
retailers have more than 2.5 million employees and more than $550 billion income.
Ownership opportunities abound. For example, according to the US Census Bureau
[4], women own about 1 million retail firms, African Americans (men and women)
about 100,000 retail firms, and Asian Americans (men and women) about 200,000
retail firms.
Each ownership format serves a marketplace niche, if its strategy is executed
well.
Independent retailers stress on specific customers and attempt to satisfy custo-
mers friendly verbal communications that are vital. It is suggested that independent
retailers do not focus on great number of customers and do not debate about prices.
Chain retailers benefit during their widely known images, economies of Scale
and mass promotions. They should widely maintain their image chain and should
not be inflexible in adapting themselves to changes that take place in the
marketplace.
Franchisors have strong geographic coverage because of franchisee investments
and the motivation of franchisees as owner-operators. They should not get bogged
down in policy disputes with franchisees or charge excessive royalty fees.
Leased departments enable store operators and outside parties to join forces and
enhance the shopping experience while sharing expertise and expenses. They
should not hurt the image of the store or place too much pressure on the leasees to
bring in store traffic.
A firm can have more control over sources of supply by a vertically integrated
channel, but it should not provide consumers with too little choice of products or
too few outlets.
Cooperatives provide members with price savings. They should not expect too
much involvement by members or add facilities that raise costs too much.
272 Logistics Operations and Management

14.2.3 Store-Based Strategy Mix Institution
According to store-based strategy mix point of view, there are 14 store-based retail
institutions, among which, some of them sell general merchandise products and
others sell food-oriented goods. These groups are discussed in this section.
Although not all are included, the strategy mixes do provide a good overview of
store-based strategies. It must be clarified that more different product lines that
retailers sell will be lead to more assortments in retailing strategies.
Food-oriented strategic retail formats are described and are as follows: conve-
nience store, conventional supermarkets, food-based superstores, combinational
stores, box (limited-line) stores, and warehouse stores.
A convenience store is properly located, usually is open for a long hour, and
undertakes fair amount of services. The store facility is small—considerably smal-
ler than conventional supermarkets—and presents moderate prices and customer
services. The ease of shopping and the impersonal nature of many large supermar-
kets make these convenience stores particularly appealing to their customers, many
of whom are men.
A supermarket is a self-service food shop that has sales of more than $2 million
per year.
A food-based superstore exceeds a conventional supermarket in size and goods
but is reversely smaller than a combination store. This format originated in the
1970s as supermarkets sought to stem sales declines by expanding store sizes and
the numbers of nonfood items carried. Some supermarkets merged with drug-
stores or general merchandise stores but more of them grew into food-based
superstores.
A combination store unites supermarket and general merchandise in one facility,
with general merchandise accounting for 25�40% of sales. The format began in
the late 1960s and early 1970s, as common checkout areas were set up for sepa-
rately owned supermarkets and drugstores or supermarkets and general merchan-
dise store. The natural offshoot was integrating operations under one management.
If an economy supermarket merges with a discount department store, a supercenter
will be formed. It is the US version of the even larger hypermarket (the European
institution pioneered by firms such as Carrefour that did not succeed in United
States).
The box (limited-line) store is a discounter concentrating on fewer issues, mod-
erate working hours, fewer services, and fewer brands, and it is usually food based.
Prices are on shelves or overhead signs. Items are displayed in cut cases.
A warehouse store is a food-based discounter offering a moderate number of
food items in a no-frills setting. It appeals to one-stop food shoppers, concentrates
on special purchases of popular brands, uses cut-case displays, offers little service,
posts prices on shelves, and locates in secondary sites.
We now examine the following general merchandise strategy retail formats:
specialty stores, traditional department stores, full-line discount stores, variety
stores, off-price chains, factory outlets, membership clubs, and flea markets.
273Retail Logistics

A specialty store provides only particular services or sells only particular goods.
These stores include fewer goods but more types of each. This will help the store
to advise customers on products better than its rivals.
Department stores are large retailing units that include many types and assort-
ments of goods and services. Each type of good or service is located in separate
department and helps customers select the appropriate goods and services.
A full-line discount store is a type of department store with these features:
� It conveys the image of a high-volume, low-cost outlet selling a broad product assortment
for less than conventional prices.� It is more apt to carry the range of product lines once expected at department stores,
including electronics, furniture, and appliances, as well as auto accessories, gardening
tools, and housewares.� Shopping carts and centralized checkout service provided.� Customer service is not usually provided within store departments but in a centralized
area. Customers are free to select goods and services with minimal assistance.� Nondurable (soft) goods feature private brands, whereas durable (hard) goods emphasize
well-known manufacturer brands.� Infrastructures and equipments are not expensive and decrease operational costs more
than those in traditional department stores.
A variety store offers assortments of reasonably priced services and goods such as
apparel and accessories, costume jewelry, notions and small wares, candy, toys, and
other items in its general price range. It has fewer staff members in sales, and shelves
are open for customers to select. These stores do not have many product lines, may
not be largely departmentalized, and may even do not have home-delivery services.
An off-price chain features brand-name (sometimes designer) apparel and acces-
sories, footwear (primarily women’s and family), fabrics, cosmetics, and house-
wares, and sells them at everyday-low prices in an efficient, limited-service
environment. It frequently has community dressing rooms, centralized checkout
counters, no gift wrapping, and extra charges for alterations. The chains buy mer-
chandise opportunistically as special deals occur.
A factory outlet is a store managed by a manufacturer. More factory stores now
operate in clusters or in outlet malls to expand customer traffic, and they use coop-
erative ads.
A membership (warehouse) club tends to customers with price information who
are shop members. It straddles the line between wholesaling and retailing. Some
members are small business owners and employees who pay a membership fee to
buy merchandise at wholesale prices. They make purchases for use in operating
their firms or for personal use and yield 60% of club sales.
At a flea market, many retail vendors sell a range of products at discount prices
in plain surroundings. It is rooted in the centuries-old tradition of street selling in
which shoppers can touch and sample items and haggle over prices. Vendors used
to sell only antiques, bric-a-brac, and assorted used merchandise. Today, they also
frequently sell new goods, such as clothing, cosmetics, watches, consumer electron-
ics, housewares, and gift items. Usually, flea markets are found in nontraditional
areas such as racetracks, stadiums, and arenas.
274 Logistics Operations and Management

14.2.4 Nonstore-Based Institution
We now examine retailing channels, whether single or multiple, and then nonstore-
based retailing.
Initially, retailers undertake single-channel retailing, and one retail format may
be selected that can be store-based or nonstore-based (catalog retailing, direct sell-
ing, etc.). Multichannel retailing may be used when corporations reach a substantial
growth. This means that multiple formats of retailing will help retailer and cus-
tomer via sharing costs and grouping suppliers. Retail leader WalMart sells through
stores (including WalMart stores, Sam’s Club, and Neighborhood Market) and a
website [5].
Nontraditional retailing also comprises video kiosk and airport retailing, two
key formats that do not fit neatly into store-based or non-store-based retailing.
Sometimes they are store based, other times they are not. What they have in com-
mon is their departure from traditional retailing strategies.
14.2.5 Types of Locations
To explain the types of locations is a matter of importance in typology before
deciding the desirable location. There are three types of location: isolated,
unplanned business district, and planned shopping center. Each has its own attri-
butes: makeup of competitors, parking, proximity to nonretail institutions (such as
office buildings), and other factors.
An isolated store is located somewhere other than a road or street. The important
point is that there are no competitive retailers beside and the stores should afford to
supply all of the needs. The advantages of this type of retail location are many:
� There is no competition in close proximity.� Rental costs are relatively low.� There is flexibility; no group rules must be followed in operations, and larger space may
be obtained.� Isolation is good especially for stores that are located in midways or proper shopping
areas.� Better visibility from road traffic is possible.� Facilities can be adapted to individual specifications.� Easy parking can be arranged.� Cost reductions are possible, leading to lower prices.
There are also various disadvantages to this retail location type:
� Initially, it may be difficult to attract customers.� Many people will not travel very far to get to one store on a repeating basis.� Most people like variety in shopping.� Advertising expenses may be high.� Costs such as outside lighting, security, grounds maintenance, and trash collection are not
shared.� Other retailers and community zoning laws may restrict access to desirable locations.� A store must often be built rather than rented.
275Retail Logistics

Now we describe two popular retail stores among customers which are names as
Unplanned district and Planned shopping centers.
First of two is Unplanned district which is not planned for a long range, before
establishment, commences with two or more stores and usually they are very near
each other.
Stores locate based on what is best for them, not a district or neighborhood.
Four shoe stores may exist in an area that lacks a pharmacy.
In contrast, planned shopping centers are structured and established according to
unified architecture and central ownership and management. These shopping cen-
ters usually include parking areas. Some parameters such as location and store size
are influenced by the trading areas where they are located.
This is a benefit of planned shopping center: there is enough variety of stores
based on population, and the composition of stores and products meets customers’
requirements for quality and diversity. In these business areas, managers allocate
particular stores for each type of product, and each retailer is informed about the
quantity and quality of product that can be sold. Therefore, in properly managed
centers, well-considered strategies of coordination and cooperation ensure long
lives for the stores and retailers located in these centers.
14.3 Techniques
14.3.1 Location and Site Evaluation
Location and site evaluation are essential techniques in retailing. Many analyses
have been conducted of stores’ general and specific positions. The “100% loca-
tion” is a common expression among experts who recognize that a specified loca-
tion for each store is optimal. Because different retailers need different kinds of
locations, a fully optimized place for one store might be malfunctional for others.
An upscale ladies’ apparel shop would seek a location unlike that sought by a
convenience store. The apparel shop would benefit from heavy pedestrian traffic
and close proximity to a major department store and other specialty stores. The
convenience store would rather be in an area with ample parking and heavy
vehicular traffic. It does not need to be close to other stores. In this situation,
retailers should use decision-making strategies including defining proper criteria
and proper mechanisms of decision making. Two firms may rate the same site
differently [2].
Another issue in deciding a location in supply-chain management is where to
establish warehouses, distribution points, and even administrative offices to coordi-
nate all activities regarding distribution-system management. To further explain,
new researcher in facility location is presented. As described by Gebennini et al.
[6], the generic facility location problem in logistic systems is defined by taking
simultaneous decisions regarding design, management, and control of a generic dis-
tribution network [7�11]. Melo et al. [12] presented a review of the literature on
facility location and supply-chain management. According to this review, the fol-
lowing are the most important decisions in facility location:
276 Logistics Operations and Management

1. Location of new supply facilities in a given set of demand points. The demand points cor-
respond to existing customer locations.
2. Demand flows to be allocated to available or new suppliers—i.e., production or distribu-
tion facilities.
3. Configuration of a transportation network—i.e., design of paths from suppliers to
customers and the management of routes and vehicles in order to supply demand needs
simultaneously.
In fact, in much of the research, the facility location problem is strongly associ-
ated with effective management of multistage production and distribution networks.
Many papers in recent years have studied the facility location [8,13�17], and all of
them have brought contributions to the main concept.
In traditional supply-chain management, the focus of the integration of Supply
Chain Network (SCN) is usually on single objective such as minimum cost or max-
imum profit. For example, the total cost of the supply chain as an objective func-
tion was considered by more studies [18�25]. Real cases are usually accompanied
with multiple objectives and designers should consider the issue. The design/plan-
ning/scheduling projects are usually involving trade-offs among different incompat-
ible goals. Recently, multiobjective optimization of SCNs has been considered by
different researchers in literature. Sabri and Beamon [26] developed an integrated
multi-objective supply-chain model for strategic and operational supply-chain plan-
ning under uncertainties of product, delivery, and demand.
Although cost, fill rates, and flexibility were considered as objectives, the e-con-
straint method had been used as a solution methodology. Chan et al. [27] proposed
a multi-objective genetic optimization procedure for the order-distribution problem
in a demand-driven SCN. They considered minimization of the total cost of the sys-
tem, total delivery days, and the equity of the capacity utilization ratio for manu-
facturers as objectives. Chen and Lee [7] developed a multiproduct, multistage, and
multiperiod scheduling model for a multistage SCN with uncertain demands and
product prices. As objectives, fair profit distribution among all participants, safe
inventory levels, maximum customer service levels, and robustness of decision to
uncertain demands had been considered, and a two-phased fuzzy decision-making
method was proposed to solve the problem. Erol and Ferrell [28] proposed a model
that assigns suppliers to warehouses and warehouses to customers. They used a
multi-objective optimization modeling framework for minimizing cost and maxi-
mizing customer satisfaction. Guillen et al. [29] formulated the SCN design prob-
lem as a multi-objective stochastic mixed-integer linear-programming model,
which was solved by the e-constraint method and branch-and-bound techniques.
Objectives were Supply Chain (SC) profit over the time horizon and customer sat-
isfaction level. Chan et al. [27] developed a hybrid approach based on genetic algo-
rithm and the analytic hierarchy process (AHP) for production and distribution
problems in multifactory supply-chain models. Operating cost, service level, and
resource utilization had been considered as objectives in their study.
Some authors in recent years have developed multiperiod models. Freling et al.
[30] presented a model for simultaneously optimizing inventory and designing a
distribution network. They explored the single-sourcing version of the problem by
using a branch-and-price optimal-solution procedure. Ambrosino and Scutella [31]
277Retail Logistics

proposed linear models to solve the simultaneous warehouse location-inventory
management-routing problem. Snyder et al. [9] formulated the stochastic version of
the joint location-inventory management problem by introducing the likelihood of
occurrence of each cost factor into the objective function. Thanh et al. [32] pro-
posed a mixed-integer linear model for the design and planning of a production-
distribution system. Gebennini et al. [6] presented a nonlinear model supporting
strategic, tactical, and operational choices of decision makers in the field of facility
location, inventory, and production management that are formulated in a multiper-
iod perspective. Afshari et al. [33] introduced a multi-objective model for optimiz-
ing the multicommodity distribution facility location problem. This model
improved inventory decisions in distribution network design.
The last attempt to accost proposed models with real cases is how to make facil-
ity location decisions where multiple objectives are considered. In real cases, cor-
porations include many goods and commodities, and solutions for single
commodities will not be satisfactory. A model that illustrates the above-mentioned
cases is presented. This model includes a multi-objective mixed-integer program-
ming formulation for location within a network distribution problem. Objectives
are to minimize total cost, including establishment and transportation costs, and to
maximize customer satisfaction. The problem describes two location layers in mul-
tiple periods.
Components of a supply chain and their parts are described as follows:
Central warehouses: The main stocks of supply-chain demands are supplied
here. There are L potential locations for central warehouses.
Regional warehouses: Stocks between central warehouses that customers
demand are distributed here. There are M potential locations for regional ware-
houses and they are located in the capital of provinces.
Customers: There are N customers located in the cities of the provinces.
Goods: O types of commodities can be supplied for the customers demanding O
families of cars.
Assumptions of the problem are as follows:
� There are limited capacities for both central and regional warehouses.� Transportation cost per unit is a coefficient of the distances between central and regional
warehouses and between regional warehouses and customers.� There is a minimum level of customer satisfaction.
There are two objectives for a supply chain: (1) minimizing total cost, including
establishment, transportation, and inventory management costs and (2) maximizing
customer satisfaction.
Sets and Indices
L5 sets of central warehouses ð Lj j5 l; kALÞM5 sets of regional warehouses ð Mj j5m; jAMÞN5 sets of customers ð Nj j5 n; iANÞO5 sets of good types ð Oj j5 o; tAOÞF5 sets of periods ð Fj j5 f ; pAFÞ
278 Logistics Operations and Management

Variables
Vk 51 If the potential point of k for central warehouses is located
0 Otherwise
�
uj 51 If the potential point of j for regional warehouses is located
0 Otherwise
�
xpijt5 percentage of demand customer i for commodity t that is supplied by regional
warehouse j in period p
ypjkt5 percentage of demand regional warehouse j for commodity t that is supplied by
central warehouse k in period p.
Parameters
apit5 demand of customer i for commodity t in period p
bpjt5 capacity of regional warehouse j for commodity t in period p
c5 cost of transportation per unit
dij5 distance between regional warehouse j and customer i
d0jk 5 distance between regional warehouse j and central warehouse k
epkt5 capacity of central warehouse k for commodity t in period p
sit5minimum level of customer satisfaction i for commodity t
qk5 cost of installation central warehouse k
wj5 cost of installation regional warehouse j
hw5warehousing cost per unit goods in warehouses
hs5warehousing cost per unit goods in stocks
π5 back-ordered cost per unit goods
dwspjkt5 demand of regional warehouse j from commodity t to central warehouse k in
period p.
Mathematical Model
Min z15Xp
Xj
Xi
Xt
cUdijapitxpijt
1Xp
Xk
Xj
Xt
cUd0jkbpjkt1
Xj
wjuj1Xk
qkvk
1hwXp
Xj
Xk
Xt
bpjtypjkt2Xt
Xi
apitxpijt
!
1Xp
πXt
Xi
apit 12Xj
xpijt
!1hs
Xp
Xt
Xk
epkt2Xj
ypjkt
!
279Retail Logistics

Min Z2 51
nUoUf
Xp
Xot51
Xni51
Xmj51
xpijt
Xo
t51
Xn
i51xpijt # nUoUuj ’j; p ð14:1Þ
Xn
i51apitxpijt # bpjt ’j; p5 1 ð14:2Þ
Xi
Xt
apitxpijt
2Xt
Xk
bðp2 1Þjtyðp2 1Þjkt 2Xk
aðp2 1Þitxðp2 1Þijt
!
1X
t
Xiaðp2 1Þit 12
Xjxðp2 1Þijt
� �#X
tbpjt ’j; p. 1 ð14:3Þ
Xjxpijt # 1 ’i; p; t ð14:4Þ
Xjxpijt $ sit ’i; p; t ð14:5Þ
Xkypjkt # 1 ’j; p; t ð14:6Þ
Xt
Xjypjkt $mUoUvk ’k; p ð14:7Þ
Xj
Xtbpjtypjkt #
Xtepkt ’k; p5 1 ð14:8Þ
Xj
Xt
bpjtypjkt 2Xt
eðp2 1Þkt 2Xj
bðp2 1Þjtyðp2 1Þjkt
!
#X
tepkt ’k; p. 1 ð14:9Þ
Xkbpjtypjkt $
Xiapitxpijt ’j; p5 1; t ð14:10Þ
280 Logistics Operations and Management

bpjtuj $Xk
dwspjkt
1X
j
Xt
Xkbðp2 1Þjtyðp2 1Þjkt 2
Xiaðp2 1Þitxðp2 1Þijt
� �’j; p. 1; t ð14:11Þ
dwspjkt # bpjtuj
2X
j
Xt
Xkbðp2 1Þjtyðp2 1Þjkt 2
Xkaðp2 1Þitxðp2 1Þijt
� �’j; p. 1; t ð14:12Þ
dwspjkt #Xi
Xt
apitxpijt 1 aðp2 1Þitð12 xðp2 1ÞijtÞ
2X
j
Xt
Xkbðp2 1Þjtyðp2 1Þjkt 2
Xiaðp2 1Þitxðp2 1Þijt
� �’j; p. 1; t; k
ð14:13Þepktvk $
Xjdwspjkt ’p. 1; t; k ð14:14Þ
ujAf0; 1g ’j ð14:15Þ
vkAf0; 1g ’k ð14:16Þ
The first objective function, Z1, is multiplied by the weighting coefficient of P
and is a summation of the following:
� Transportation cost between central and regional warehouses,Po
t5 1
Pmj5 1
Pni5 1 cU
dijapitxpijt� Transportation cost between regional warehouses and customer,
Pot5 1
Plk5 1Pm
j5 1 cd0jkapitxpijt
� Installation cost for central warehouses,Pm
j5 1 wjuj� Installation cost for regional warehouses,
Plk5 1 qkvk
� Warehousing costs for commodities in all periods in regional and central warehouses.
The second objective, Z2 is the summation of the level of the customer satisfac-
tion that is multiplied by (12P).
Constraints (14.1), (14.4), (14.6), and (14.7) state that if regional warehouse j or
central warehouse k satisfies the demand in period p, then it has been installed.
Constraints (14.2), (14.3), (14.8), and (14.9) show capacity restriction for each
regional warehouse for each commodity in all periods. Constraint (14.5) implies that
there is a minimum level of customer satisfaction i for commodity t. Constraints
(14.10�14.14) consider that amount of supply should be greater than amount of
demand. Constraints (14.15) and (14.16) are related to integer programming.
281Retail Logistics

14.3.2 Human Resource Management
According to Ed Sweeney from the United Kingdom’s Advisory, Conciliation, and
Arbitration Service (ACAS) [34], workers in the retail, hospitality, and construction
sectors are more likely to file employment claims because these industries often do
not have good human resources practices, according to an interview in Personnel
Today magazine.
ACAS chair Sweeney noted that many of the employers in these sectors had lit-
tle experience and knowledge in human resource issues. In addition, the lack of
effective unions and high staff turnover in these industries led to more employment
disputes than in any other.
As shown, human resource management (HRM) is a critical activity in retailing.
Also some researches show that frontline service employees (FLSES) actions will
lead to significant results in successful service operation. In contrast, much cus-
tomer dissatisfaction is reported by the firms that did not implement suggested idea.
HRM includes five major and related steps: recruitment, selecting, training,
compensating, and supervising. The outcomes of this process are qualified employ-
ees who had the chance to enter the firm, then to have the opportunity to develop
and progress the people who work in organization.
In the case of labor diversity, two rules should be notified: (1) the labor should
be hired and empowered fairly, without regard to gender, ethnic background, and
other related factors and (2) in a diverse society, the workplace should be represen-
tative of such diversity.
Retailers must be careful not to violate employees’ privacy rights. Only neces-
sary data about workers should be gathered. Also these data must be secured, and
employers should be sensitive about disclosing such data about employees.
We will now explain each activity in HRM that is used to fill sales and middle-
management positions.
In recruiting retail personnel, a retailer generates a list of job applicants. The
sources for recruitment might be inside or outside a company. In addition to these
sources, the Web is playing a bigger role in recruitment.
Selecting retail personnel is the next step. This is done by matching the traits of
potential employees with specific job recruitments. Job analysis and description,
the application blank, interviewing testing (optional), references, and a physical
examination (optional) are tools in the process. They should be integrated.
The third step is training retail personnel. Every new employee should receive
pre-training, organization’s structure and policies, working hours, and his/her duties.
New employees should also be introduced to co-workers. After proper recruit-
ment and suitable selection, training starts. Training programs are useful for both
new and existing personnel and help them to perform better. Training can range
from one-day session that covers topics such as operating a computerized cash reg-
ister, selling techniques, or registering a complaint regarding affirmative action pro-
grams to long-term education that covers many operational issues in a retailer’s
main business.
Compensating retail personnel, whether through direct payment or indirect
and nonmonetary means, should be satisfying enough for employees to ensure
282 Logistics Operations and Management

long-time cooperation. To better motivate employees, some firms also have profit-
sharing programs.
As an element of HRM in retailing, supervision is chiefly a role of retailer to
prepare environmental activities that lead to better performance for both employee
and retailer. The retailer, by communicating personally or through meetings, tries
to maintain the culture of the organization which finally benefits those who work
in the firm. Retailers can succeed by highlighting morale, by explaining the rela-
tionship among employees, and by motivating and innovating, which finally bene-
fits those who work in the firm.
14.3.3 Pricing in Retailing
Pricing is the result of a trade-off between retailer and customer. A customer seeks
satisfaction from using services and goods, while a retailer looks for profitability.
Some believe that the pricing strategy should be compatible with the main business
parameters such as the position of the retailer among competitors, total profit, and
rate of return on investments [2].
Each retailer may benefit by applying one of three pricing options. First, low
prices can offer a competitive advantage, although it primarily obliges a retailer
to be content with low profit per unit margin. However, it simultaneously leads to
lower operational costs, more inventory turnover, and more sales. Many stores such
as off-price shops and full-line discount stores use this strategy. Second, a retailer
can move in the middle, which means that goods and services are sold at moderate
prices. The problem with this strategy is that it faces competition from both low-
cost retailers and prestige stores. The quality of products is from average to above
average. Conventional department stores and some of drugstores apply this strategy
in pricing. Third, a prestigious image can be adopted. This is the aim of some retai-
lers. Smaller target markets, higher prices, less turnover, and higher profit margins
per unit are characteristics of stores that use this strategy. Customers who use these
stores are usually more satisfied and more loyal. Specialty stores and upscale
department stores are in this category.
On the whole, for all types of pricing strategy, the success factor is to create a
valuable position in customer’s mind if he or she selects a specific type of shop
with specific pricing strategy. That is why Sports Authority has shifted from its
longtime three-tier pricing strategy—good, better, and best—to one that emphasizes
only better and best products in order to improve gross margins and achieve greater
customer loyalty: “We don’t want to be in the $199 treadmill business because we
will never win that war.”
Whether buying an inexpensive $4 ream of paper or a $40 ream of embossed,
personalized stationery, every customer wants to feel the purchase represents a
good value. The consumer is not necessarily looking only for the best price. He or
she is often interested in the best value, which may be reflected in a superior shop-
ping experience.
Today, customers can easily find and compare prices on the Internet, and this
fact should be considered by retailers. In the past, when consumers could only
compare prices by visiting individual stores, the process was time consuming,
283Retail Logistics

which dissuaded most people from shopping around. Now, with a few clicks of a
computer mouse, a shopper can quickly gain online price information from several
retailers in just minutes without leaving home.
14.3.4 Customer Satisfaction in Retailing
Customer satisfaction is a key concept in all businesses, including retailing. Many
researchers have tried to highlight key factors and the benefits of customer satisfac-
tion. Surely, loyalty is the best result of customer satisfaction, one that ensures
business results.
The research of Luo and Humborg [35] showed two achievements in customer
satisfaction with no previously discussed background. This research showed that
besides increasing future advertisement and promotion efficiency of the firm, cus-
tomer satisfaction can increase human resource performance accordingly.
A conceptual model was presented for understanding shopper satisfaction with
entertainment consumption. This research was investigated on satisfaction structure
of those who were looking for shopping-mall entertainments [36]. Although enter-
tainment consumption is a usual activity in shopping centers, only some researchers
have worked on this issue. In their research, they examined entertainment con-
sumption in shopping center context. They presented a model comparing five key
constructs. Therefore, by introducing and discussing about the relationship among
these five constructs, the researchers presented new models and concepts about
retailing and satisfaction. As new concepts are developed in retailing, it is impor-
tant for retailers to adopt them.
14.3.5 World Retail Congress [37]
To bring leading international players in retailing such as TESCO, Carrefour, and
IKEA together, the World Retail Congress was established to conduct essential
debates with international policy makers. Usually, discussions lead to better growth
policies and decisions for the global retail economy and sustains the earning and
competitive issues of both national and international retailing markets.
Some of the speakers and lecturers in this congress have presented new achieve-
ments and experiences. For example, Lan McGarrigle, Director of the World Retail
Award in 2008, highlighted the importance of excellence across the entire spectrum
of retail activity and emphasized that it is obligation in today’s competitive market.
He also referred to the role of the congress, which encourages worldwide retailers
to accept and implement higher standards in innovation, responsibility, manage-
ment, and operation.
14.4 Future Trends
The Economist Intelligence Unit has reported on global economic, industrial, and
corporate trends in the world with what it calls “2020 foresight” [38]. This section
denotes consumer goods and retailing industry in 2020.
284 Logistics Operations and Management

Studying future trends is an essential activity to ensure that strategies are sus-
tainable. It is also useful to forecast possible failures and problems and take actions
to avoid them.
Looking at the future, two significant growth areas have been diagnosed. First,
opportunity is increasing sales in current markets; second, this opportunity includes
entering emerging markets. Each opportunity has its own challenges and differ-
ences. Many researchers predict that the greatest growth will happen in countries
that are not members of the Organization for Economic Cooperation and
Development. At currently trending market exchange rates, the United States is
expected to be the biggest consumer market in 2020, and the country’s share of
world consumer spending will be approximately constant. The European Union’s
share will decrease step by step. In 2020, the leading emerging markets, especially
China and India, will see the largest increase in the share of world consumer spend-
ing. It even has been predicted that China will close the gap with the United States
in many key indexes like those mentioned in this chapter.
Another challenge is maturity increasing sales and seems to be harder in devel-
oped markets. Matured markets and high debt level is a problem in most Western
countries. The competition in low-price markets will increase considerably.
Besides all the earlier mentioned issues, new growth is predicted. Changing demo-
graphic patterns will create new markets. Another source of growth through either
immigration or high birthrates in subgroups of the population will establish new
markets that encourage competition and innovation.
Even though many retailers think of population changes as an opportunity, some
believe them to be a threat, mainly because aging changes popular trends and
habits such as fast-food-chain stores and mortgage broking. So it will be hard for
those who establish their business targeting younger aged groups. In developing
markets, more investments according to current trend will diminish the returns in
future. In all conditions, competition is available. In spite of strict competitiveness
among industries, cost efficiency is still vital. Multichannel marketing may be
applied to ensure return on investments, but still there are some barriers that limit
the benefits. Some firms use resources from low-cost countries, but this is not a
sustainable solution. Cost-control strategies may be a useful solution for some years
but cannot be relied upon in 2020. Some experts suggest that firms may use multi-
channel marketing via the Internet and also may use other techniques such as cus-
tomer-relationship management technologies. Threats are predictable even for these
new techniques and technologies (e.g., market saturation, decreasing margins and
conflict between channels), but firms should find their own way for long-term solu-
tion and maintain their competitive advantages.
14.5 Case Study
14.5.1 History of Russian Retail Chains [39]
The strategies and policies of the former Soviet Union prevented the development
of a national retail system. In 1990, the stocks in state store were greatly
285Retail Logistics

diminished, and a retail system was found only in small markets (20�50 square
meters) operating in open-air areas and general areas such as stadiums and railway
stations. Still, some of these markets attracted people from as far away as 200 kilo-
meters. In Russia, big cities such as Moscow and Saint Petersburg were developed
into retail centers, whereas some markets in smaller cities were still developing.
The claim that emphasizes in 1992 Moscow constituted 12% of whole Russian con-
sumer goods turnover which shifted to 35% in 2000 has statistical proof. After eco-
nomic infrastructures were improved in smaller cities, Moscow’s share was
decreased and this share was divided among those cities. During this period of
time, the purchasing process gradually returned from open markets to store and
simultaneously store chains were established. New stores were open 24 hours a
day. Each brand was clearly separated, and distinctive services were offered. After
these developments, the growth of chain stores was rapid, and the turnover of lead-
ing Russian retailers almost doubled each year. Retailing became the second-
leading sector for investment after the excavation of natural resources, a trend that
continued to 2000. On the eve of the twenty-first century, the Russian retail market
saw the entry of new retail chains from Western European countries. METRO cash
and carry in 2001, IKEA from 2002, and Auchan in 2002 were examples. Now the
purchasing process shifted again, but this time from supermarkets to hypermarkets.
It means that the format and size of markets were changed. The first markets in the
1990s were just from 70 to 400 square meters; in the middle of the 1990s, the aver-
age stores were between 1000 and 2500 square meters. The first hypermarkets
were 10,000 square meters.
When Russian retail chains were faced with strong competition from Western
retail chains, they established their own Western-style hypermarkets. Supermarket
chain Seventh Continent, discounter chain Piaterochka, and supermarket chain
Perekriostok were pioneers. Step by step, Russian retail chains progressed, and in
January 2008, Russian retailers (along with Chinese retailers) figured in the list of
the world’s 250 largest retailers for the first time as reported by Deloitte Touche
Tohmatsu in conjunction with Stores magazine.
14.5.2 Conventional Food Retailing with a Spotlight onDifferentiation [40]
Another case study is about chasing the third larger conventional grocer in the
United States, Safeway Inc., which appointed Orangetwice. This is an example of
shifting from old and conventional way to modern food retailing.
Shortly, the founders believed that if a change is necessary, then do it and make
it fast. Orangetwice believes in differentiation. It means that a buying experience
must differ from day to day and that a customer should feel it. Therefore, adding
value to customers is a new concept that is emphasized by this firm. According to
changed situation, customers are not loyal to brands and seek added value without
respect to brands. One choice is price but time is another parameter. It means that
286 Logistics Operations and Management

customers prefer to enjoy the time they spend in shops. By this view, shopping is a
leisure activity. Retailers also undertake to decorate and design the environment to
seem fascinating. They even offer customers meal solutions instead of just selling
goods and foods.
Orangetwice understood this fact and they transferred from white box design to
fresh and organic design with natured environment.
Consultant is a new role for grocery retailers. They suggest customers what to
buy and how to use the products. Presentation skills thus are critical, and staff
members of these stores are friendly and knowledgeable experts in their fields.
Safeway Inc. started new strategy and initialized new relationship with customers.
These actions encouraged customer to consider Safeway Inc. instead of grocery
retailer for a lunch or dinner option. The strategic thought led revolution and
extraordinary gaining. After implementation, sales were increased up to 50%.
References
[1] J. Fernie, L. Sparks, Logistics and Retail Management, Kogan, London, 2004.
[2] B. Berman, J.R. Evans, Retail Management: A Strategic Approach, Prentice Hall,
Upper Saddle River, New Jersey, USA, 2006.
[3] Available from: http://www.siamfuture.com/retailbuscenter/retailindus/top100.asp.
[4] Available from: www.census.gov.
[5] Available from: www.walmart.com.
[6] E. Gebennini, R. Gamberini, R. Manzini, An integrated production�distribution model
for the dynamic location and allocation problem with safety stock optimization,
Int. J. Prod. Econ. 122 (2009) 286�304.
[7] C. Chen, W. Lee, Multi-objective optimization of multi-echelon supply chain networks
with uncertain product demands and prices, Comput. Chem. Eng. 28 (2004)
1131�1144.
[8] R. Manzini, M. Gamberi, A. Regattieri, Applying mixed integer programming to the
design of a distribution logistic network, Int. J. Ind. Eng. 13 (2006) 207�218.
[9] L.V. Snyder, M. Daskin, C.P. Teo, The stochastic location model with risk pooling,
Eur. J. Oper. Res. 179 (2007) 1221�1238.
[10] N.A.H. Agatz, M. Fleischmann, A.E.E. van NunenJo, E-fulfillment and multi-channel
distribution—a review, Eur. J. Oper. Res. 187 (2008) 339�356.
[11] C.S. ReVelle, H.A. Eiselt, M.S. Daskin, A bibliography for some fundamental problem
categories in discrete location science, Eur. J. Oper. Res. 184 (2008) 817�848.
[12] M.T. Melo, S. Nickel, F. Saldanha-da-Gama, Facility location and supply chain man-
agement—a review, Eur. J. Oper. Res. 196 (2009) 401�412.
[13] D.R. Sule, Logistics of Facility Location and Allocation, Marcel Dekker Inc.,
New York, 2001.
[14] L. Zhang, G. Rushton, Optimizing the size and locations of facilities in competitive
multi-site service systems, Comput. Oper. Res. 35 (2008) 327�338.
[15] S. Wadhwa, A. Saxena, F.T.S. Chan, Framework for flexibility in dynamic supply
chain management, Int. J. Prod. Res. 46 (2008) 1373�1404.
287Retail Logistics

[16] Y. Hinojosa, J. Kalcsics, S. Nickel, J. Puerto, S. Velten, Dynamic supply chain design
with inventory, Comput. Oper. Res. 35 (2008) 373�391.
[17] P. Baker, The design and operation of distribution centers within agile supply chains,
Int. J. Prod. Econ. 111 (2008) 27�41.
[18] V. Jayaraman, H. Pirkul, Planning and coordination of production and distribution facil-
ities for multiple commodities, Eur. J. Oper. Res. 133 (2001) 394�408.
[19] S.S. Syam, A model and methodologies for the location problem with logistical compo-
nents, Comput. Oper. Res. 29 (2002) 1173�1193.
[20] A. Syarif, Y. Yun, M. Gen, Study on multi-stage logistics chain network: a spanning
tree-based genetic algorithm approach, Comput. Ind. Eng. 43 (2002) 299�314.
[21] V. Jayaraman, A. Ross, A simulated annealing methodology to distribution network
design and management, Eur. J. Oper. Res. 144 (2003) 629�645.
[22] H. Yan, Z. Yu, T.C.E. Cheng, A strategic model for supply chain design with logical
constraints: formulation and solution, Comput. Oper. Res. 30(14) (2003) 2135�2155.
[23] M. Gen, A. Syarif, Hybrid genetic algorithm for multi-time period production/distribu-
tion planning, Comput. Ind. Eng. 48(4) (2005) 799�809.
[24] T.H. Truong, F. Azadivar, Optimal design methodologies for configuration of supply
chains, Int. J. Prod. Res. 43(11) (2005) 2217�2236.
[25] A. Amiri, Designing a distribution network in a supply chain system: formulation and
efficient solution procedure, Eur. J. Oper. Res. 171(2) (2006) 567�576.
[26] E.H. Sabri, B.M. Beamon, A multi-objective approach to simultaneous strategic and
operational planning in supply chain design, Omega 28 (2000) 581�598.
[27] F.T.S. Chan, S.H. Chung, S. Wadhwa, A hybrid genetic algorithm for production and
distribution, Omega 33 (2004) 345�355.
[28] I. Erol, W.G. Ferrell Jr., A methodology to support decision making across the supply
chain of an industrial distributor, Int. J. Prod. Econ. 89 (2004) 119�129.
[29] G. Guillen, F.D. Mele, M.J. Bagajewicz, A. Espuna, L. Puigjaner, Multi objective sup-
ply chain design under uncertainty, Chem. Eng. Sci. 60 (2005) 1535�1553.
[30] R. Freling, H.E. Romeijn, D.R. Morales, A.P.M. Wagelmans, A branch-and-price algo-
rithm for multi period single-sourcing problem, Operat. Res. 51 (2003) 922�939.
[31] D. Ambrosino, M.G. Scutella, Distribution network design: new problems and related
models, Eur. J. Oper. Res. 165 (2005) 610�624.
[32] P.N. Thanh, N. Bostel, O. Peton, A dynamic model for facility location in the design of
complex supply chains, Int. J. Prod. Econ. 113 (2008) 678�693.
[33] H. Afshari, M. Amin Nayeri, A. Ardestanijaafari, Optimizing Inventory Decisions in
Facility Location within Distribution Network Design, Proceedings of the International
Multi Conference of -Engineers and Computer Scientists, Vol. III, IMECS 2010, March
17�19, 2010, Hong Kong.
[34] Available from: www.clickajob.co.uk/news/professional-men-planning-office-escape-
7789.html
[35] X. Luo, C. Humborg, Neglected outcomes of customer satisfaction, J. Market. 71
(2007) 133�149.
[36] J. Sit, B. Merrilees, 2005. Understanding satisfaction formation of shopping mall enter-
tainment seekers: a conceptual model, ANZMAC, 2005 Conference.
[37] Available from: www.worldretailcongress.com.
[38] Available from: www.eiu.com.
288 Logistics Operations and Management

[39] V. Kolossov, O. Vendina, J. O’Loughlin, Moscow as an emergent world city: interna-
tional links, business developments, and the entrepreneurial city, Eurasian Geography
and Economics, 43(3) (2002) 170�196.
[40] Available from: http://www.tatatinplate.com/differ_1.shtm.
[41] A. Mckinnon, The Fundamental Drivers of Transport Demand, Heriot-Watt University,
the Netherlands, 1997.
289Retail Logistics

This page intentionally left blank

15Humanitarian Logistics Planningin Disaster Relief Operations
Ehsan Nikbakhsh1 and Reza Zanjirani Farahani2
1Department of Industrial Engineering, Faculty of Engineering, TarbiatModares University, Tehran, Iran2Department of Informatics and Operations Management, KingstonBusiness School, Kingston University, Kingston Hill, Kingston UponThames, Surrey KT2 7LB
15.1 Introduction
Although human technological advancements have cured many diseases and solved
many problems, it is still widely believed that the capacities of many societies are not
enough to cope with the massively destructive effects of natural and human-made
disasters. Hence, disasters have always been identified with their huge negative
impacts on the humans’ condition, nations’ critical infrastructures, and societies’
planning systems. To be able to cope with effects of a disaster, humans try to prepare
themselves by creating and enhancing necessary infrastructures and planning for vari-
ous relief operations in advance.
As much as creating and enhancing infrastructures can mitigate the effects of
disasters, humans are still required to devise better proactive plans and improve
the implementation of relief operations. One main aspect of such planning and
implementation is the logistics of relief operations. Humanitarian logistics can be
simply defined as a branch of logistics dealing with logistical aspects of a disaster
management system, including various activities such as procuring, storing, and
transporting food, water, medicine, and other supplies as well as human resources,
necessary machinery and equipments, and the injured before and after disasters
have struck.
As a result of recent natural disasters such as the Asian tsunami in 2004 and
hurricane Katrina in 2005, the field of logistics in the context of humanitarian
operations has gained considerable attention from academics as well as practi-
tioners [1]. There are several reasons for this attraction, including the need for agile
and capable logistics systems that can deal with different kinds of disasters [2], spe-
cialized large-scale risk and disruption management, and the effects of disasters on
human lives and economies as well [3]. It also has been estimated that the number
Logistics Operations and Management. DOI: 10.1016/B978-0-12-385202-1.00015-3
© 2011 Elsevier Inc. All rights reserved.

of both natural and human-made disasters will increase fivefold over the next 50
years [4]. Therefore, humanitarian logistics is one of the most important aspects of
disaster management systems.
The main goal of this chapter is to introduce humanitarian logistics fundamen-
tals, including various topics such as disasters, disaster management systems,
humanitarian logistics, mathematical modeling and solving logistical decisions,
coordination, and performance measurement in humanitarian responses. To achieve
this goal, first a classification of different types of disasters and their effects on
human lives are given in Section 15.2. After introducing the concept of the disaster
management system cycle and important activities in each phase in Section 15.3,
humanitarian logistics and its particular characteristics and main stages are
discussed in Section 15.4. Then mathematical modeling of some humanitarian
logistics decisions and their optimization solution techniques are discussed in
Section 15.5. Next, concepts of coordination and performance measurement in the
context of humanitarian logistics are discussed in Sections 15.6 and 15.7, respec-
tively. Case studies regarding the success factors of humanitarian logistics system
are presented in Section 15.8. Concluding remarks and possible research directions
are given in Section 15.9.
15.2 Disasters
A hazard can be defined as a rare severe event that has negative effects on human
life, properties, and the environment, and may lead to a disaster [5]. Hence, any
event that endangers or devastates these can be considered a disaster. In other
words, disasters can create extensive pain and discomfort for human beings and
disrupt a society’s normal day-to-day activities. Therefore, to be able to cope with
the massively destructive effects of a disaster, humans should prepare themselves
by creating and enhancing necessary infrastructures and planning many relief
operations in advance.
Some researchers such as Cuny and Russell believe that the only true disasters
are economic disasters [6,7]. This is because a better disaster management system
requires long-term investments in infrastructure and public awareness. Similarly,
Akkihal [8] explains that disasters happen when fluctuations in ecological and geo-
logical systems exceed a civilization’s capacity to absorb such fluctuations.
Intuitively, the success of humanitarian logistics practices in every society can thus
be considered highly related to society’s socioeconomic conditions. In the remain-
ing parts of this section, we first review some of disaster classification systems and
then discuss the effects of disasters on human beings.
15.2.1 Classification of Disasters
Broadly speaking, disasters can be divided into two main classes: natural
and human made [5]. Natural disasters are direct or indirect consequences of natural
292 Logistics Operations and Management

phenomena. Their origin can be from three main sources: hydrometeorological,1
geological,2 or biological3 [9]. Figure 15.1 compares the number of occurrences
for each class of natural disasters based on their origins for the last century. This
figure clearly shows a distinct growth pattern in hydrometeorological disasters in
comparison with other types of natural disasters that can be attributed to global
warming and climate change. Examples of natural disasters are storms, earth-
quakes, floods, droughts, epidemics, and volcanic activities (see Figure 15.2 for
a more comprehensive classification of natural disasters and their occurrence rate
for 1990�2005). On the other hand, human-made disasters or technological
disasters are the direct consequences of human activities, whether deliberate (e.g.,
wars and terrorist attacks) or not (e.g., industrial accidents and infrastructure
failures).
Disasters, whether natural or human-made, have various consequences, includ-
ing loss of human lives, destruction of infrastructures, and ruptured socioeconomic
conditions. It is noteworthy that hazardous events that happen outside the bound-
aries of human habitats are not considered to be disasters. For example, a severe
earthquake happening in a remote and uninhabited desert has little impact on
human life and surroundings, so it is not a disaster. The consequences of such an
earthquake in a populated region, however, would be considered catastrophic.
1 Natural processes or phenomena of atmospheric, hydrological, or oceanographic nature.2 Natural earth processes or phenomena.3 Processes of organic origin or those conveyed by biological vectors, including exposure to pathogenic
microorganisms, toxins, and bioactive substances.
1900
–190
9
1910
–191
9
1920
–192
9
1930
–193
9
1940
–194
9
1950
–195
9
1960
–196
9
1970
–197
9
1980
–198
9
1990
–199
9
2000
–200
5
3000
2500
2000
1500
1000
500
0
Hydrometeorological Geological Biological Total
Figure 15.1 Occurrence of natural disasters based on origin, 1900�2005 [10].
293Humanitarian Logistics Planning in Disaster Relief Operations

15.2.2 Effects of Disasters on Nations
Disasters have been identified with massive casualties and destruction for a very
long time. In the ancient world, because of a lack of preplanning and limited capac-
ities of societies to respond to disastrous events of large magnitude, disaster could
even lead to the destruction of a complete civilization (e.g., the catastrophic erup-
tion of the volcanic Mount Vesuvius in AD 79 buried the city of Pompeii). Today,
disasters still cause many casualties and considerable destruction mainly because of
ineffective preventive measures, incomplete preparedness, and weak relief logistics
systems.
Quantification of the effects of disasters would enhance our understanding of
the sometimes irrecoverable effects of disasters (Tables 15.1�15.3). The first fac-
tors to be considered in analyzing each disaster are usually the number of human
casualties and people displaced. Table 15.1 shows disaster statistics for four coun-
tries: China, India, Iran, and the United States. During the 28-year-period consid-
ered, more than 376,000 people had been killed in these four countries alone. Also,
more than 4 billion people have been affected by disasters in a way. Based on the
statistical data in the twentieth century alone, more than 3.5 million people were
killed by natural disasters such as floods, earthquakes, and volcanoes (drought and
famine are not included in this total) [15]. Also, 15 million people are estimated to
have been killed by disasters during the second millennium. See [16] for a bibliog-
raphy of research on deaths caused by natural disasters.
Other important factors in disaster analysis are the cost of relief operations and
the economic damages of disasters. Over the last decade, huge sums of money
have been either spent on or lost because of disasters. One main cost after a disaster
is that for relief operations. In 2003, about $6 billion was spent on humanitarian
relief operations around the world. Also, the tsunami of March 22, 2005 required
Epidemic, 13%
Insect infestation,1%
Extremetemperature, 4%
Drought, 6%
Wild fire, 4%
Wind storm, 25%
Volcano, 2%Landslide, 5%
Flood, 32%
Earthquake andtsunami, 8%
Figure 15.2 Distribution of natural disasters by type, 1990�2005 [11].
294 Logistics Operations and Management

allocation of about $6.4 billion for the response alone [17]. Besides relief opera-
tions costs, economic damages on societies are substantial (see Table 15.2 for natu-
ral disasters and Table 15.3 for human-made disasters). Natural disasters imposed
nearly $1200 billion in damages and economic losses during 1991�2005 [13]. For
example, many economic sectors of Asian countries, including fisheries, agricul-
ture, livestock, tourism, and microenterprises, were severely affected by the 2004
Asian tsunami [18]. Also, in the United States alone, economic damage of more
than $483 billion from 601 disasters during 1980�2008 has been reported.
Table 15.3 World’s Five Most Important Industrial Accidents Based on Economic Damage,
1900�2010 [14]
Place Date Damage (US$1000)
Spain November 17, 2002 9,960,407
Soviet Union April 26, 1986 2,800,000
Russia August 17, 2009 1,320,000
United Kingdom July 7, 1988 1,200,000
United States October 23, 1989 1,100,000
Table 15.1 Statistics of Disaster Damages in Four Countries, 1980�2008 [12]
China India Iran United States
Number of events 533 395 138 601
Number of people killed 147,204 139,393 77,984 12,030
Average number of people
killed per year
5076 4807 2689 415
Number of people affected 2,500,735,703 1,506,794,740 42,657,823 24,482,933
Average number of people
affected per year
86,232,266 51,958,439 1,470,959 844,239
Economic damage (US$1000) 230,947,214 45,184,830 21,374,696 483,481,510
Economic damage per year
(US$1000)
7,963,697 1,558,098 737,058 16,671,776
Table 15.2 Total Amount of Economic Damage (US$ Billion) from Natural Disasters,
1991�2005 [13]
Hydrometeorological Geological Biological
Africa 3.93 6.14 0.01
America 400.82 29.98 0.13
Asia 357.70 219.74 0.00
Europe 142.83 16.17 0.00
Oceania 14.51 0.87 0.14
295Humanitarian Logistics Planning in Disaster Relief Operations

Looking at the consequences of disasters from the perspectives of humans, infra-
structures, and societies can create a better understanding of the effects of disasters
on nations. Table 15.4 summarizes the consequences of some of the most common
natural disasters. A brief analysis of this table shows that besides casualties and
the destruction of houses and infrastructures, disasters can also lead to socioeconomic
disruptions such as unemployment, emigration and immigration, and the halting of
day-to-day business and industrial activities. Hence, designing preventive measures
and recovery plans for these consequences and other more obvious consequences are
necessary.
15.3 Disaster Management System Cycle
Disaster management can be defined as the discipline of avoiding and dealing with
risks [20]. In other words, disaster management is a set of processes designed to be
implemented before, during, and after disasters to prevent or mitigate their effects.
This discipline involves preparing for disasters, responding to them, and finally
supporting and rebuilding the society after initial disaster relief operations have
ended. Because disasters pose a permanent threat, disaster management systems
and practices should be continually monitored and improved. Also, the success of
these systems relies heavily on effective and efficient cooperation and coordination
of organizations participating in relief operations.
Table 15.4 Consequences of Some Common Natural Disasters [19]
Consequences Natural Disasters
Earthquakes Cyclones Floods Fires Drought or
Famine
Casualties † † † † †
Injured and diseased † † † † †
Epidemic diseases † †
Destruction of agricultural crops † † † †
Destruction of houses † † † †
Damaged infrastructures † † † †
Communication disruption † † † †
Transportation disruption † † † †
Public panic † † † †
Pillage and insecurity † † † †
Public-order disturbance † † †
Temporary migration † †
Permanent emigration or immigration ΔDisabling or halting industrial sector † † † † ΔDisabling service sector † † † † ΔDisruption of socioeconomic systems † † † † Δ
†, primary effect; Δ, secondary effect.
296 Logistics Operations and Management

Any disaster management system consists of four main phases: mitigation, pre-
paredness, response, and recovery (Figure 15.3); each will be discussed in the
remainder of this section. Also, the main activities during each phase are shown in
Table 15.5. A recent survey of articles on application of operations research (OR)
and management science techniques in each of the four aforementioned phases are
given in Altay and Green [21].
Finally, we must bear in mind that the success of every disaster management sys-
tem is highly dependent on the characteristics of the region affected by a disaster in
addition to the characteristics and intensity of each particular disaster. For example,
in addition to countries’ usual logistical preparedness, factors such as transportation
and communication infrastructures and systems, environmental conditions, geograph-
ical conditions, and time of occurrence during the day and year have crucial impacts
on the level of casualties and destruction caused by a disaster. Therefore, a compre-
hensive model for disaster management cannot be achieved without localizing the
available models and best practices for each country and region.
15.3.1 Mitigation
Mitigation measures try to prevent hazards from turning into disasters or to reduce
their destructive effects. This phase is different from the other three phases in requir-
ing long-term planning and investment [22]. Because of the nature of preventive
measures, mitigation is the most effective and important phase against disaster
effects. The measures implemented in this phase can be categorized as structural and
nonstructural [20]. Structural measures use technological advancement in order to
mitigate the disasters effects (e.g., flood levees, strengthening existing buildings, and
strengthening crucial links such as bridges in transportation networks). Examples of
nonstructural measures are legislation, land-use planning, and insurance.
15.3.2 Preparedness
In this phase, various plans and solutions are devised in case a disaster
occurs. Examples of these plans and solutions include various aspects of everything
Figure 15.3 The four main phases of a
disaster management system.
297Humanitarian Logistics Planning in Disaster Relief Operations

Table 15.5 Major Activities of Disaster Management System Life Cycle [21]
Phase Activity
Mitigation � Establishing land-use planning and control to prevent occupation of high-
hazard areas
� Using technological advancement to mitigate disasters effects
� Establish preventive measures to control developing situations
� Improving disaster resistance of structures by enforcing building codes
� Establishing tax incentives or disincentives
� Ensuring application of proper methods in rebuilding buildings and
infrastructures after disasters
� Measuring potential for extreme hazards using risk-analysis techniques
� Enforcing the use of insurance plans to reduce disasters’ financial impacts
Preparedness � Recruiting personnel for emergency services
� Establishing community volunteer groups
� Emergency planning
� Logistical planning
� Acquiring and stockpiling necessary items
� Developing mutual aid agreements and memorandums of understanding
with other organizations, NGOs, international organizations, and other
countries
� Providing training for both response personnel and concerned citizens
� Performing threat-based public education
� Budgeting
� Acquiring necessary vehicles and equipments
� Acquiring, stockpiling, and maintaining emergency supplies
� Constructing central and regional emergency operations centers
� Developing communications systems
� Planning regular disaster exercises to train personnel and test capabilities
Response � Activating emergency operations plan
� Activating emergency operations centers
� Evacuating disaster areas
� Opening shelters and providing mass care
� Providing emergency rescue and medical care
� Firefighting
� Performing search and rescue
� Providing emergency infrastructure protection and recovering lifeline
services
� Establishing fatality management
� Ensuring the security of affected areas by deploying police or military forces
Recovery � Providing disaster debris cleanup
� Providing financial assistance to individuals and governments
� Rebuilding roads, bridges, and key facilities
� Providing sustained mass care for displaced people and animals
� Reburying displaced human remains
� Fully restoring lifeline services
� Providing mental health and pastoral care
298 Logistics Operations and Management

about the disaster management system such as preplanning the logistics of relief
operations (e.g., locating necessary facilities, stockpiling necessary items, and
transporting people, equipments, and other items), establishing communication
plans, defining the responsibilities of each participating relief organization, coordi-
nating operations, and training relief personnel.
15.3.3 Response
This phase requires the immediate dispatching of the necessary personnel, equip-
ment, and items to the disaster area. Generally, a combination of medical units,
police or military forces, firefighters, and search units with the necessary vehicles
and equipment are deployed right after a disaster occurs, depending on its intensity
and extent. The next waves usually include backup human resources and equipments
for the aforementioned groups as well as necessary items (e.g., primary supplies
such as food, drinking water, clothing, tents and temporary building structures, and
medicine), voluntary forces, and nongovernmental organizations (NGOs). The prep-
aration of an effective response plan for coordinating relief forces and operations is
critical to the success of a disaster management system.
15.3.4 Recovery
The main purpose behind the recovery phase is restoring the areas affected by disasters
to their previous state. This phase is mainly concerned with secondary needs of people
such as restoring and rebuilding houses and city facilities. One of the main opportu-
nities of this phase is to enhance the infrastructures and conditions of the affected area
by using fundamental mitigation techniques [23].
15.4 Humanitarian Logistics
Humanitarian logistics is a branch of logistics dealing with the preparedness and
response phases of a disaster management system. Humanitarian logistics can be
defined as:
. . . the process of planning, implementing and controlling the efficient, cost-effec-
tive flow and storage of goods and materials, as well as related information, from
the point of origin to the point of consumption for the purpose of alleviating the
suffering of vulnerable people. The function encompasses a range of activities,
including preparedness, planning, procurement, transport, warehousing, tracking
and tracing, and customs clearance [4].
Humanitarian logistics is crucial to the effectiveness and speed of relief opera-
tions and programs [24]. These logistics systems are usually required to procure,
store, and transport food, water, medicine, and other supplies as well as human
299Humanitarian Logistics Planning in Disaster Relief Operations

resources, necessary machinery and equipments, and the injured during the pre-
and postdisaster periods.
The variety of logistical operations in disaster relief are so extensive that they
make humanitarian logistics the most expensive part of disaster relief operations,
accounting for about 80% of them [25]. Also, relief operations require deploying a
huge number of logistical vehicles, equipments, and personnel. For example, in the
Wenchuan earthquake on May 12, 2008, in China [26], 6 cargo-transport planes
and 19 helicopters were sent to the region in 24 hours. About 5800 military medical
and rescue personnel and 150 tons of supplies were conveyed to the affected area.
The effective and efficient implementation of such a huge operation, considering
the chaotic nature of the situation (e.g., public panic and the destruction of transpor-
tation and communication infrastructures), is actually a complex and difficult one.
In the remaining parts of this section, we first see brief comparison of humani-
tarian logistics systems and commercial supply chains in Section 15.4.1. Then the
main stages of a generic humanitarian logistics system and required items and
equipments in relief operations are discussed in Sections 15.4.2 and 15.4.3, respec-
tively. For more information on concepts, methods, and models in the fields of
humanitarian logistics and disaster operations management, see [3,21,24,25, 27,28].
15.4.1 Humanitarian Logistics Systems Versus Commercial SupplyChains
In practice, managing humanitarian logistics systems can be considered to be very
different from managing their commercial counterparts. This is mainly because of
different inherent characteristics of demand in each system. In commercial supply
chains, the demand for the product is usually either estimated using proper forecast-
ing techniques (i.e., push production system) or initiated by the customer (i.e., pull
production system). Therefore, commercial supply chain managers try their best to
eliminate the elements of uncertainty as much as possible. However, the nature of
demand in humanitarian logistics is very uncertain because disaster time, location,
and intensity—and hence exact relief requirements—are not known until after a
disaster occurs. Based on the above explanations, the specific attributes of humani-
tarian logistics systems are as follows [24,25,27�32]:
1. The missions of not-for-profit organizations are different from profit-making entities (i.e.,
ensuring speedy and lifesaving responses instead of maximizing profits and reducing
costs).
2. There are more complicated trade-offs of objectives because of different types of stake-
holders, including governments, relief organizations, donors, and people affected by the
disaster.
3. Complex characteristics of demand include:
a. uncertainty of demand in features such as location, time, type, and quantity;
b. suddenly occurring demand and therefore urgently shorter lead times;
c. high stakes associated with adequate and timely delivery.
4. Complex operational conditions exist because of:
a. the chaotic nature of events during the postdisaster period;
300 Logistics Operations and Management

b. a lack of resources (e.g., vehicles, equipments, food and water supplies, and medical
supplies);
c. a lack of proper access to vital infrastructures (e.g., transportation and communication);
d. a lack of experienced and professional human resources;
e. a lack of security in the regions affected by the disaster.
5. Coordination between organizations participating in relief operations is often lacking.
6. Relief organizations must act in accordance with humanity, neutrality, and principles of
impartiality.
7. There is often a politicized environment in which it is difficult to maintain a humanitarian
perspective to operations.
8. There is no way to punish ineffective organizations because of absence of the humanitar-
ian logistics system final beneficiaries’ voice in the performance appraisal and evaluation
process. Since the affected people are not directly involved in this process, provided they
are not dead, they usually cannot claim for more than their damages, which is usually
paid by insurances and governments, whereas in a commercial supply chain, an ineffec-
tive member has to pay for its own inefficiencies.
It is worth noting that almost all of the items listed are serious challenges to the
performance of any supply chain system, not just humanitarian logistics systems.
For example, a lack of proper transportation infrastructures forces humanitarian
relief teams to use various modes of transportation ranging from advanced modes
(and usually more expensive) such as helicopters and cargo planes to more primi-
tive modes such as animals (e.g., elephants and donkeys).
Although, until about 10 years ago, logistics was considered to be not necessary
by many humanitarian organizations [24,25,27�32], but today many of them are
trying to implement many of the concepts and practices used by commercial supply
chains as advocated by researchers [24,30]. Also as mentioned in [24,25,29], com-
mercial supply chains can learn a lot from humanitarian logistics systems, espe-
cially about important topics such as supply chain risk and disruption management.
Therefore, mapping the application of best practices of each side to the other is
important ongoing research in the field of supply chain management.
15.4.2 Humanitarian Logistics Chain Structure
The humanitarian logistics chain structure consists of three main stages
(Figure 15.4): supply acquisition and procurement, pre-positioning and warehous-
ing, and transportation [25]. The first stage in any humanitarian logistics chain is
acquisition and procurement of necessary items and equipments. Any relief organi-
zation is required to obtain its necessary items and equipments from local or global
suppliers using various procurement techniques such as direct purchasing and
tenders. The main challenges in this stage are reducing the purchasing costs (con-
sidering the possible inflation of prices in local markets after disasters), ensuring
the availability of supplies during the necessary times, reducing lead times, and
coordinating in-kind donations with respect to other acquired items [29].
After acquiring necessary items and equipments for the predisaster and postdisa-
ster periods, the responsible relief organizations are obliged to pre-position and
301Humanitarian Logistics Planning in Disaster Relief Operations

store their items and equipments in suitable locations considering the location of
disaster-prone areas. Challenges of this stage include the high costs of opening
and operating permanent warehouses [29], inventory holding costs, and possible
deterioration of items. Also, there is a high risk that warehouses will be destroyed
during disasters, so those used for humanitarian logistics should have higher resis-
tance against disasters and be located wisely.
Finally, transportation is the last important stage of any humanitarian logistics
chain in which human personnel, equipment, and necessary items are sent to prede-
fined central distribution centers (CDCs), distribution intermediary points, local dis-
tribution centers, and finally regions affected by the disaster. Transportation during
the postdisaster period is somehow the most difficult stage of humanitarian logistics
even if different kinds of preventive measures and plans have been taken into
account [27]. This is mainly because transportation infrastructures and equipment
are usually damaged and in poor condition after a disaster. Also, the geographical,
weather conditions, and insecurities of the affected regions might restrict the types
of transport vehicles and their usage methods.
15.4.3 Required Items and Equipments in Humanitarian Logistics
Usually after a disaster in a region, there is a high demand for various items and
equipments for facilitating the relief operations. Based on information from the
Suppliers
Centraldistribution
centers
In-kinddonations
Transportation
TransportationSupply purchasingand procurement
Prepositioning/Warehousing
Postdisaster flowPredisaster flow
Intermediarystocking and
distribution points
Localdistribution
points
Localdistribution
points
Local distribution
Ben
ifici
arie
s
Figure 15.4 Humanitarian logistics chain structure [29].
302 Logistics Operations and Management

Pan American Health Organization and the World Health Organization [33], an
extended list of required items and equipment includes but is not limited to the
following:
1. Food
2. Water and sanitary items
3. Environmental health equipments and items (e.g., water-treatment equipment and items)
4. Medicine (including both general pharmaceutical products and specific pharmaceutical
products in possible cases of epidemics)
5. Health kits and supplies for supporting health-care processes
6. Field hospitals
7. Clothing and blankets
8. Items associated with infants and children (e.g., instant milk, diapers, formula, and toys)
9. Shelters and temporary housing facilities (e.g., tents)
10. Electrical power generating equipment
11. Fuel (e.g., coal, gas, or oil)
12. Field kitchen equipment and utensils
13. Cleaning supplies
14. Agricultural commodities and livestock
15. Specialized equipment for handling hazardous materials
16. Communication equipment
17. Firefighting equipment
18. Debris-removal equipment and vehicles
19. Construction equipment and vehicles
Keep in mind that the list is general, so different items and various amounts of
them would be required based on the characteristics of each disaster and its specific
situation. The urgency level of each item differs from others and is based on each
specific situation; some of them are top priority and should be delivered during the
early stages of postdisaster period. For example, in case of an earthquake during
cold winter, the timely delivery of enough clothing, blankets, and fuel is critical.
Also, in some countries specific items are required according to their cultural rules.
For example, delivering enough chadors after a disaster is an important feature of
disaster relief operations in Muslim countries. Finally, another important aspect of
required items is the perishability of some items such as food and medicine. This
characteristic calls for specifically designed ordering and inventory systems for
such items because they cannot be feasibly stocked for longer terms.
15.5 Humanitarian Logistics Problems
One crucial aspect of humanitarian logistics systems is the importance of effective
planning of both preparedness processes and response operations. This is because
of the uncertain nature of disasters, where many factors such as type, time, loca-
tion, and intensity are unknown before the disaster occurs. In addition, many deci-
sions regarding types of operations and their requirements have to be taken either
in advance (preparedness phase) or shortly after the disaster (response phase).
Finally, the chaotic nature of events during the postdisaster period makes common
303Humanitarian Logistics Planning in Disaster Relief Operations

human judgment and decision making subject to more costly mistakes. Therefore,
advanced analytical decision-making techniques are important assets to the
decision-making process in humanitarian logistics systems.
Among various available analytical decision-making techniques, OR is a great
set of tools for better decision making about humanitarian logistics systems
problems, and consequently improving the performance of disaster management
systems. OR can be simply defined as an interdisciplinary field for “applying
advanced analytical methods to help make better decisions.”4 The common analytical
tools used in OR include but are not limited to mathematical modeling, optimization,
simulation, probability and statistics, stochastic processes, queuing systems, game
theory, forecasting, data mining, multicriteria decision making, and system dynamics.
Remaining parts of this section introduce some of the fundamental models and
their solution techniques, which can be used in modeling and optimizing humani-
tarian logistics systems.
15.5.1 Location Models
One important aspect of a humanitarian logistics system is determining the location
of various facilities and infrastructures, including but not limited to central ware-
houses of relief items, local warehouses, permanent relief facilities such as major
hospitals and positioned relief equipment and vehicles, and temporary relief facili-
ties such as mobile hospitals. To deal with locating these kinds of facilities, location
science can be of great assistance. A simple but useful model for locating facilities
is the p-median problem, which locates p facilities and allocates the demand nodes
to them while minimizing the total weighted transportation costs. Without loss of
generality, we assume that the facilities are CDCs, whereas the demand nodes are
previously located regional distribution centers (RDCs). To model this problem, the
following sets and parameters are required:
CDC: set of central distribution-center nodes
RDC: set of regional distribution-center nodes
F0i : available supplies of relief items in the ith CDC
hj: required quantities of relief items at the jth RDC
CRij: transportation costs for a unit of the relief item between the ith CDC and the jth
RDC
The required variables for the p-median problem are as follows:
xji: binary variable for allocating the demand of the jth RDC to the ith CDC
yi: binary variable for opening the ith CDC
The mathematical model of the capacitated p-median problem is as follows [34]:
MinimizeX
iACDC
XjARDC
hidijxji ð15:1Þ
4 http://www.scienceofbetter.org/
304 Logistics Operations and Management

subject to
XiACDC
xji 5 1 ’jARDC ð15:2Þ
XiACDC
yi 5 p ð15:3Þ
XjARDC
hjxji #F0iyi ’iACDC ð15:4Þ
xji # Yi ’iACDC; jARDC ð15:5Þ
xjiAf0; 1g ’iACDC; jARDC ð15:6Þ
yiAf0; 1g ’iACDC ð15:7Þ
In the above model, objective function (15.1) minimizes the total weighted
transportation costs. Constraint (15.2) allocates the demand of each RDC to exactly
one CDC, whereas constraint (15.3) selects exactly p new CDCs to be opened.
Constraint (15.4) limits the total demand allocated to each CDC, and constraint
(15.5) ensures that demand of an RDC can be allocated only to a CDC, providing
that CDC is opened. This formulation could be easily extended to consider the
fixed cost of opening new facilities, FC0i; by replacing objective function (15.1)
with the following objective function:
MinimizeX
iACDC
FC0iyi 1
XiACDC
XjARDC
hidijxij ð15:8Þ
The problem (15.8) and (15.2)�(15.7) is known as the capacitated fixed-charge
facility location problem. Although both discussed problems are nondeterministic
polynomial-time hard (NP-hard) [35], numerous effective solution techniques have
been proposed to solve them, including benders decomposition, Lagrangian relaxa-
tion, and various metaheuristics such as genetic algorithm, tabu search, simulated
annealing, and neural network. For a recent review of metaheuristics applied to
solve the p-median problem, see [36].
The nature of the objective function in the p-median and fixed-charge location pro-
blems is a pull objective function that tries to locate the facilities as near as possible to
the demand nodes. This characteristic is not always desirable because on-time delivery
is a critical part of many relief operations. In such situations, it is most desirable that
every demand node is reachable (or covered) in a specific amount of time. The famous
model for dealing with such situations is the set covering location model. In this
model, a demand node is considered to be coverable by a facility if and only if it is
305Humanitarian Logistics Planning in Disaster Relief Operations

within a specified distance of the facility. If we denote the covering of demand node j
by facility i with a binary parameter such as aji, then the set covering location model
can be stated as follows [37]:
MinimizeX
iACDC
FC0iyi ð15:9Þ
subject to
XiACDC
ajiyi $ 1 ’jARDC ð15:10Þ
yiAf0; 1g ’iACDC ð15:11Þ
In the formulation stated above, objective function (15.9) minimizes the total
cost of opening CDCs, whereas constraint (15.10) ensures that each RDC is cov-
ered by at least one opened CDC. The set covering location problem is considered
to be an integer-friendly problem [38] because its linear programming relaxation
solution is usually integer; if not, the branch-and-bound method can solve it with
limited search effort.
The model (15.9)�(15.11) is not perfect and has two major drawbacks:
1. Usually, locating all the needed facilities cannot be justified economically.
2. The model does not distinguish between demand nodes with different weights (e.g., popu-
lation in the context of humanitarian logistics).
The maximal covering location problem can be considered an improvement on
the set covering location problem because of eliminating the above drawbacks.
This model locates at most p facilities in order to maximize the total covered
demand. If zj is defined as the binary variable for denoting the covering of RDC
node j by at least one facility, the mathematical model of the maximal covering
problem can be stated as follows [35]:
MinimizeX
jARDC
hjzj ð15:12Þ
subject to
XiACDC
yi # p ð15:13Þ
zj 2X
iACDC
ajiyi # 0 ’jARDC ð15:14Þ
306 Logistics Operations and Management

yiAf0; 1g ’iACDC ð15:15Þ
zjAf0; 1g ’jARDC ð15:16Þ
In the above model, objective function (15.12) maximizes the total demand cov-
ered by the opened facilities. Constraint (15.13) ensures locating at most p facili-
ties, whereas constraint (15.14) links the covering of the demand node variable to
the location decision variable. Although this problem is NP-hard, it can be still
solved effectively via various heuristics. For example, one can relax constraint
(15.14) using Lagrangian relaxation and then solve the resulting problem using the
subgradient optimization technique [39].
Note that because location models with median objectives are deciding about
the allocation of demand nodes to facilities in addition to decisions on facilities’
locations, they implicitly cover the transportation and inventory decisions as well.
Therefore, explicit consideration of inventory and transportation structures and
costs can be a great enhancement of location models in the context of humanitarian
logistics. One model with such feature is discussed in great detail in Section 15.5.4.
Finally, other location models such as p-center can be discussed in the context
of humanitarian logistics, but complete treatment of such models is out the scope
of this chapter. The reader is referred to the following sources for a complete treat-
ment of other types of location models: Daskin [34,35], Revelle and Eiselt [37],
Drezner and Hamacher [40], and ReVelle et al. [41]. Also, the reader is referred to
these additional sources for more familiarity with more advanced location models
in humanitarian logistics literature: Balcik and Beamon [27]; Adivar et al. [42];
and Najafi et al. [43].
15.5.2 Transportation and Distribution Models
Another aspect of operating a humanitarian logistics system is the transportation
of relief items from suppliers and major warehouses to local operation bases,
and then distributing them among the people in need. The first transportation
part, which is usually a long-haul type of transportation, can be dealt with using
various transportation models available in the literature such as the famous basic
transportation model discussed in numerous OR books such as Taha [44] and
Hillier and Lieberman [45]. This problem can be defined on a bipartite graph
G5 (N, E), where N consists of supply (suppliers and major warehouses) and
demand (local operation bases) nodes. For the sake of simplicity, we assume
that supply nodes are, in fact, CDCs and the demand nodes are RDCs as previ-
ously introduced in Section 15.5.1. Finally, E includes the edges connecting the
nodes in each part of the graph to the other part. The only required decision var-
iable is xij, which is the amount of relief items to be transported between the ith
CDC and the jth RDC.
307Humanitarian Logistics Planning in Disaster Relief Operations

Considering the previously introduced notation, the mathematical model of the
transportation problem would be as follows:
MinimizeX
iACDC
XjARDC
CRijxij ð15:17Þ
subject to
XiACDC
xij 5 hj ’jARDC ð15:18Þ
XjARDC
xij #F0i ’iACDC ð15:19Þ
xij $ 0 ’iACDC; jARDC ð15:20Þ
In the above formulation, objective function (15.17) minimizes total transportation
costs, whereas constraints (15.18) and (15.19) ensure demand satisfaction and supply
capacity limit, respectively. Because the technology matrix of the above problem is a
totally unimodular matrix (TUM), the linear programming relaxation of constraints
(15.17�15.20) will always yield an all-integer solution providing that all of the right-
hand side coefficients are integers [46]. Techniques such as network simplex [47] can
effectively solve this problem. Also, various assumptions can be added to this model,
including considering multiple commodities of relief items, multiple periods of deci-
sion making, multiple modes of transportation, and transportation of human resources
and wounded people to represent more complex situations and problems; see [48] for
more information on implementing such assumptions.
The transportation problem has one inherent assumption regarding the type of
deliveries—that each delivery requires a vehicle at full capacity, hence a round trip
must be made each time for each delivery (Figure 15.5A). This assumption is not consis-
tent with various situations where the quantities of delivered items to each demand node
are less than vehicles’ capacities, and multiple demand nodes can be served in each trip
(Figure 15.5B). This is especially true when short-haul transportations are required to
deliver necessary relief items. Hence, another aspect of a humanitarian logistics system
is the distribution of relief items among people in need using short-haul transportation
systems. The main mathematical model for dealing with such situation is the vehicle
routing problem (VRP) model, which was originally introduced by Dantzig and Ramser
[49]. The main assumption of this model is serving every relief demand node (RDN) in
a tour (i.e., exactly one vehicle should enter and exit each demand node).
Considering the previously introduced notation, the remaining required sets and
parameters are as follows:
RDN: set of relief demand nodes
0: index of the RDC acting as the depot of the vehicles
N1: set of all nodes belonging to the set RDN , {0}
308 Logistics Operations and Management

L: set of all available vehicles
αkm: travel cost between the nodes k and m, k and m A N1
r(S): minimum number of vehicles required to serve set S, ’S D RDN, S6¼[
Also, a binary variable, vkm, is required for denoting whether edge (k, m), where
k and m A N1 (k6¼m) is traversed by a vehicle. Considering the introduced notation,
the mathematical model of the VRP is as follows [50]:
MinimizeXmAN1
XkAN1
αkmvkm ð15:21Þ
B
RDC
C
Demand nodes
Demand nodes
RDC #1RDC #2
CDC #1
A
CDC #2
Demand nodes
Figure 15.5 Effect of demand on delivery trip structure: (A) full-truckload demand; (B)
less-than-truckload demand in a single-depot system; (C) less-than-truckload demand in a
multiple-depot system.
309Humanitarian Logistics Planning in Disaster Relief Operations

subject to
XkAN1
vkm 5 1 ’mARDN ð15:22Þ
XmAN1
vkm 5 1 ’kARDN ð15:23Þ
XkARDN
vk0 5 Lj j ð15:24Þ
XkARDN
v0k 5 Lj j ð15:25Þ
Xk=2S
XmAS
vkm $ rðSÞ ’SDRDN; S 6¼ [ ð15:26Þ
vkmAf0; 1g ’k;mAN1 ð15:27Þ
In the above formulation, objective function (15.21) minimizes the total distribu-
tion costs. Constraints (15.22) and (15.23) ensure that exactly one vehicle enters an
RDN and one vehicle leaves it. Similarly, constraints (15.24) and (15.25) ensure
that exactly jLj vehicles leave the RDC and then return to it. Finally, constraint
(15.26) acts as a subtour elimination constraint as well as a capacity constraint.
Similar to the location problems discussed in Section 15.5.2, the VRP is NP-hard
[51], therefore the variety of its solution techniques ranges from exact algorithms
such as Lagrangian relaxation and branch and price to various metaheuristics. The
reader is referred to [52,53] for a complete overview of the VRP, its extensions, and
solution techniques. Also, the reader is referred to [54�56] for examples of applying
variations of the vehicle-routing model to optimization of disaster relief operations.
At the end of this section, it is of great interest to pay more attention to an
important aspect of relief items’ distribution. During a disaster, various regions are
usually affected with varied disaster strength levels. Hence, the condition and
urgency level of various demand nodes might be completely different from one
another. According to Sheu [57], different demand zones can be clustered into dif-
ferent groups based on time passed from the last delivery to each zone, percentage
of casualties, percentage of children and elders, and level of damage to buildings.
15.5.3 Inventory Models
Humanitarian logistics systems are usually forced to keep some of their required
relief items and equipment in stock, in order to increase their levels of preparedness
against sudden disasters. However, similar to commercial supply chains, high levels
of inventory holding costs could be a burden on humanitarian organizations
310 Logistics Operations and Management

because of their limited funds and operating resources. Therefore, designing effec-
tive inventory systems for humanitarian organization can be of great importance.
To demonstrate the modeling of an inventory system for a humanitarian logistics
system, we discuss a simple deterministic multiperiod model in detail. Consider a
set of CDCs that respond to the demand for a set of relief items, K, ordered by a
set of RDCs during various relief operations in multiple consecutive periods of
planning, T. Each relief item has a limited supply in each period, skt, k A K, t A T;
and the distribution centers have limited capacities, σi, i A CDC. The demand of
each RDC for each type of relief item is denoted by djkt, j A RDC, k A K, t A T.
Also, consider pkt, hkt, and πkt to be the purchasing, holding, and shortage costs of
each relief item in each planning period. The pure inventory level, surplus inven-
tory level, shortage inventory level, and purchasing quantities for each item in each
period and CDC are denoted by Ikit; I 1kit ; I2kit ; and qkit, respectively. Also, the per-
centage of the demand of an RDC for a relief item during a period allocated to a
specific CDC is denoted by xjkit. Considering the above notations and assuming
that the initial inventory level for each item in each CDC is known and equal to
Iki,0, the multiobjective mathematical model of such inventory system for a humani-
tarian logistics system is as follows:
MinimizeXtAT
XkAK
pkX
iACDC
qkit 1 hkX
iACDC
I1kit
( )ð15:28Þ
Minimize
maxtAT
XkAK
πk
XiACDC
I 2kit
( )ð15:29Þ
subject to
Ikit 2 Ikiðt2 1Þ 5 qkit 2X
jARDC
djktxjkit ’iACDC; kAK; tAT ð15:30Þ
XiACDC
xjkit # 1 ’jARDC; kAK; tAT ð15:31Þ
XiACDC
qkit # skt ’kAK; tAT ð15:32Þ
XkAK
I1kit #σi ’iACDC; tAT ð15:33Þ
Ikit 5 I1kit 2 I2kit ’iACDC; kAK; tAT ð15:34Þ
311Humanitarian Logistics Planning in Disaster Relief Operations

xjkitA 0; 1f g ’iACDC; jARDC; kAK; tAT ð15:35Þ
qki $ 0 ’kAK; iACDC ð15:36Þ
In the above formulation, objective function (15.28) minimizes the total pur-
chasing and holding costs for total planning horizon, whereas objective function
(15.29) minimizes the maximum of the shortage costs in every planning period.
Though objective function (15.29) is nonlinear, its linearization is fairly straightfor-
ward. Constraint (15.30) ensures an inventory balance of each relief item for each
CDC in each period. Constraint (15.31) ensures demand for each item from each
RDC is at most fulfilled completely. Constraints (15.32) and (15.33) ensure the
supply limit of each item and capacity limit of each CDC in each period, respec-
tively. Finally, constraint (15.34) relates the pure inventory level variable to its
respective surplus and shortage inventory level variables. The proposed model is a
multiobjective, mixed-integer linear programming model that requires efficient
multiobjective optimization techniques such as multiobjective evolutionary algo-
rithms for creating nondominated solutions.
It is noteworthy since humanitarian logistics systems mostly belong to nonprofit
organizations, considering shortage cost and possibility of not satisfying an RDC
are somehow questionable and against humanitarian principles. However, the
proposed multiobjective model can be useful in reducing the negative effects of
such assumptions. Also, it must be noted that in uncertain disaster environments,
shortages can and will happen. Therefore, using various modeling techniques such
as stochastic programming and robust optimization can be of great help in extending
the above model to embrace such complex situations. Demonstration of such exten-
sion is beyond the scope of this chapter, and the reader is referred to [58,59] for an
overview of the aforementioned modeling techniques.
At the end, it is noteworthy that research regarding effectively designing inven-
tory systems for humanitarian logistics systems is still limited in comparison with
other aspects of humanitarian logistics systems, and much research is needed. The
reader is referred to [60] for a discussion of an advanced inventory model in the
context of integrated logistics models (see Section 15.5.4).
15.5.4 Integrated Logistics Models
One important approach to logistics problems is the integration of decisions
concerning different levels of decision making and then simultaneously solving
the respective problem. This concept considers the effects of facilities location,
transportation and routing, inventory control, and production planning and schedul-
ing decisions on each other [61]. This approach to logistics problems prevents
from local optimization of dependent problems such as location and routing pro-
blems [62]. Integrated logistics problems consist of different problems such as
312 Logistics Operations and Management

location-routing [63], inventory-location [64], queuing-location [65], and inventory-
routing [66] problems.
In the context of humanitarian logistics, two of the most important decisions are
the location of RDCs and the delivery of relief items such as medicine and medical
equipments to various relief demand points in tours (because of less-than-vehicle
capacity demand quantities; see Figure 15.5C). These two decisions can be mod-
eled and solved simultaneously using a location-routing model.
Now, consider a two-echelon relief-chain structure consisting of three layers,
including CDCs of relief items (which are preestablished and might not be near the
regions affected by the disaster), RDCs of relief items (which might be set up
temporarily), and finally the relief demand points. This problem can be defined on
an undirected graph G5 (N, E) in which its nodes, N, consist of three previously
introduced entities including CDCs, RDCs, and RDNs. Also, the edges of this
graph, E, are composed of edges linking CDCs to RDCs, RDCs to RDNs, and
RDNs to RDNs. Triangle inequality is assumed to be valid for edges linking RDCs
to RDNs and any RDN to another RDN. Also, capacities of the CDCs, RDCs,
and homogeneous vehicle fleet are deterministic and known. Demand of each RDN
is deterministic and cannot be split among various RDCs. Finally, it is assumed that
delivering relief items to each RDN must happen exactly in a specific period of
time known as the hard time window. The hard time window constraints indicate
the level of urgency for delivering the required items to each demand node.
This problem is known as the two-echelon location-routing problem with hard
time windows constraints (2ELRPHTW) in the literature. Considering the previ-
ously introduced notations, the remaining required set and parameters of the
2ELRPHTW are as follows:
RDC: set of regional distribution centers
FCj: fixed cost of opening jth RDC
VCj: variable cost of operating the jth RDC for a unit of the commodity
Fj: capacity of the jth RDC
nvj: maximum number of vehicles assignable to the jth RDC (nvj 5 Fj=σ �
)
CV: fixed cost of operating a vehicle
σ: vehicle capacityτ: maximum allowable route duration
Dk: demand of the kth RDN
tkm: travel time between nodes k and m, k and m A N1
[ak,bk]: acceptable time interval for serving the kth RDN
Considering the previously introduced variables, the required variables for the
2ELRPHTW are as follows:
yj: binary variable for opening the jth RDC
vkml: binary variable for traveling edge (k,m) by the lth vehicle for all k and m A N1
(k 6¼m)
ujl: binary variable for assigning the lth vehicle to the jth RDC
zkj: binary variable for assigning the kth RDN to the jth RDC
wlk: arrival time of the lth vehicle to the kth RDN
313Humanitarian Logistics Planning in Disaster Relief Operations

Based on [67], the mathematical model of the two-echelon location-routing
problem with hard time window constraints is as follows:
MinimizeX
jARDC
FCjyj 1X
iACDC
XjARDC
CRijxij 1X
jARDC
VCj
XkARDN
Dkzkj
1CVX
jARDC
XlAL
ujl 1XlAL
XmAN1
XkAN1
αkmvkmlð15:37Þ
subject to
XjARDC
xij #F0i ’iACDC ð15:38Þ
XiACDC
xij #Fjyj ’jARDC ð15:39Þ
XkARDN
Dkzkj 2X
iACDC
xij # 0 ’jARDC ð15:40Þ
XlAL
XmAN1
vkml 5 1 ’kARDN ð15:41Þ
XmAN1
XkAN1
dkmvkml # τ ’lAL ð15:42Þ
XmAN1
vmkl 2XmAN1
vkml 5 0 ’kAN1; ’lAL ð15:43Þ
XmAN1
vkml 1XhAN1
vjhl 2 zkj # 1 ’kARDN; ’jARDC; ’lAL ð15:44Þ
XkARDN
vkjl 5 ujl ’jARDC; ’lAL ð15:45Þ
XkARDN
vjkl 5 ujl ’jARDC; ’lAL ð15:46Þ
XlAL
ujl # nvjyj ’jARDC ð15:47Þ
wlm $wl
k 1 tkm 2Mð12 vkmlÞ ’k;mARDN; lAL ð15:48Þ
am #wlm # bm ’mARDN; lAL ð15:49Þ
xij $ 0 ’iACDC; ’jARDC ð15:50Þ
314 Logistics Operations and Management

yjAf0; 1g ’jARDC ð15:51Þ
ujlAf0; 1g ’jARDC; ’lAL ð15:52Þ
vkmlAf0; 1g ’kAN1; ’mAN1; ’lAL ð15:53Þ
zkjAf0; 1g ’kARDN; ’jARDC ð15:54Þ
In the above model, objective function (15.37) includes RDCs opening fixed
costs, CDCs to RDCs commodity transportation costs, RDCs variable costs, fixed
costs of the vehicle, and, finally, routing costs. Constraint (15.38) restricts the
amount of outgoing commodity from each CDC to its capacity, whereas the incom-
ing commodity into each RDC is limited to its capacity by constraint (15.39).
Constraint (15.40) balances the incoming and outgoing commodity volume at each
RDC. Constraint (15.41) requires each RDN to be assigned to the route of exactly
one vehicle. Constraint (15.42) limits the capacity of each vehicle.
Constraint (15.43) ensures the conservation of flow in each RDC and RDN
node. Constraint (15.44) assigns an RDN to an RDC if a vehicle enters that RDN
and leaves the RDC itself at first. Constraints (15.45) and (15.46) ensure that if a
vehicle is assigned to an RDC, it both enters and leaves that RDC. Constraint
(15.47) limits number of vehicles assigned to an RDC to its vehicle capacity.
Constraint (15.48) calculates the arrival time of vehicles to RDNs and also elimi-
nates subtours [68]. Finally, constraint (15.49) defines the hard time window
domain for each RDN.
Solving medium- and large-sized instances of this problem via exact methods is
a challenging and difficult task because of the NP-hard nature of its subproblems
[51,69]. Among the effective solution techniques proposed for solving the location-
routing problems, various techniques such as decomposition [70], Lagrangian
relaxation [71], tabu search [72], and simulated annealing [73] have been proposed.
For recent reviews of models and solution methods proposed for various types of
location-routing problems, the reader is referred to [61,63].
Besides location-routing problem, various integrated models can be used in the
context of humanitarian logistics. For example, Barbarosoglu et al. [74] have
addressed the problem of hierarchically making decisions about assigning helicop-
ters and pilots to air bases (tactical level) as well as routing helicopters to serve the
affected regions (operational level). Because the complete introduction of such
models is beyond the scope of this chapter, the reader is referred to [63,66] for
reviews of inventory-routing and location-inventory problems, respectively.
15.6 Coordination of Humanitarian Logistics Systems
After a disaster occurs in a region, different international organizations and NGOs,
besides the responsible governmental organizations, are involved in carrying out the
315Humanitarian Logistics Planning in Disaster Relief Operations

humanitarian relief operations. This is mainly because of a lack of sufficient
recourses, equipments, and (professional) human recourses. For example, more than
44 countries participated in Bam’s earthquake rescue and relief operations [75].
Efficient and effective use of these many groups, coming from different organiza-
tional structures and cultures, requires a close cooperation and coordination between
them. However, the chaotic nature of postdisaster relief operations, lack of neces-
sary resources, and presence of different and numerous relief organizations have
contributed to a lack of teamwork and consequently the failure of many relief opera-
tions [76,77]. Hence, coordination of humanitarian logistical operations is one of the
most important aspects of humanitarian logistics, especially during preparedness
and response phases. In the remainder of this section, supply chain coordination,
important factors in coordinating humanitarian logistics operations, and coordina-
tion mechanism in humanitarian logistics are discussed in brief overviews.
15.6.1 Supply Chain Coordination
To manage a supply chain effectively and efficiently, a coordinated execution of
supply chain operations is required [78]. However, because of conflict of interest
between the supply chain participants (i.e., different objectives and each partici-
pant’s self-serving focus), the necessary level of coordination cannot be achieved.
This is mainly because of the inefficiency of locally optimal decisions of each sup-
ply chain participant regarding the whole supply chain efficiency [79]. Supply-
chain coordination tries to increase the whole supply chain profit, efficiency, and
effectiveness through global decision-making models instead of using individually
local optimal decisions of each participant. Hence, coordination mechanisms seek
to encourage supply chain members to follow globally optimal decisions for the
whole supply chain [80]. Broadly speaking, supply chain coordination can be clas-
sified into two main classes, namely, vertical coordination and horizontal coordina-
tion. Vertical coordination refers to the coordination of an organization with its
downstream and upstream supply chain participants, whereas horizontal coordina-
tion refers to the coordination of same-level supply chain participants.
Supply chain coordination mechanisms can be classified based on five character-
istics: level of formality, resource-sharing structure, decision style, level of control,
and risk and reward sharing scheme [81,82]. Therefore, to achieve coordination in
a supply chain, various techniques may be employed such as information and
resource sharing, central decision making, conducting joint projects, various types
of contracts such as revenue sharing [78], regional division of tasks, or a cluster-
based system.
15.6.2 Important Factors in Coordinating Humanitarian LogisticsOperations
Because of the severe effects of disasters, usually multiple organizations are
engaged in relief operations. However, as mentioned earlier, the characteristics of
316 Logistics Operations and Management

Table 15.6 Characteristics of Potential Relief-Chain Coordination Mechanisms [29]
Coordination
Mechanism
Coordination Cost Opportunistic
Risk Cost
Operational Risk Cost Technological
Requirements
Beneficial to
Relief
Environment
Potential for
Implementation
QRa, CRb, VMIc,
CVMIdLow High High High No Higher for large
NGOs but
generally low
Collaborative
procurement
Low, especially if
supported by an
umbrella organization
Low Low when no contracts;
high in competitive
environment
Low Yes High (currently
observed)
Warehouse
standardization
High Varies High Medium Yes Low
Third-party
warehousing
(umbrella
organization)
Low Low Low Low Yes High (currently
observed)
Third-party
warehousing
(private-sector
partner)
Medium Medium Varies Low Yes High (currently
observed)
Transportation
Shipper collaboration High Varies High Medium No Low
4PL High High High Medium No Low
aQuick response.bContinuous replenishment.cVendor-managed inventory.dConsignment vendor-managed inventory.
317
Humanitarian
Logistics
Plan
ningin
Disaster
Relief
Operatio
ns

postdisaster relief operations can have a direct negative effect on the successful
coordination of cooperative operations between different organizations. Some of
these characteristics originally discussed in [29] are as follows:
1. Number and diversity of organization involved: Usually, because of a disaster’s severe
effects, various organizations with different policies, training, and operational procedures
and methods are required to be involved in relief operations. Although the participating
organizations have the very same goal (i.e., helping people), the diversity in methods,
organizational culture, and policies [24]; the challenges of communicating between orga-
nizations with different speaking languages [83]; and the lack of coordination experience
in affected countries [84] may lead to create more barriers in coordination of relief
operations.
2. Donor expectations and funding structure: Most of the time, dealing with disasters
requires huge amount of money, food, clothing, and other relief items that might not be
readily available during initial days after the disaster. As a result, different international
and private aid agencies along various countries usually provide the affected national
governments and their corresponding organizations with necessary items and money.
Because aid agencies are heavily dependent on donations [84], they are usually forced to
act in accordance with the donors’ requirement such as using the donations in a short
amount of time or types of allowed relief activities [83,85]. These kinds of restrictions
are considered as a barrier against the coordination of relief operations [29].
3. Unpredictability: Disaster environments are actually very uncertain because of various
factors such as the location, timing, and intensity of disasters; regional infrastructures;
preparedness of relief organizations; and, finally, the political environment of the affected
country [29].
4. Resource scarcity and oversupply: During the pre- and postdisaster humanitarian logistics
operations, deploying enough human resources and equipment as well as delivering the
right amount of necessary items is crucial. However, because of the inherent uncertainties
of disasters, insufficiency or oversupply of human resources, equipment, and other items
might still happen. Hence, matching demand and supply is an important aspect of relief
operations [29].
5. Costs of coordination: Coordinating the relief operations, whether during the pre- or post-
disaster periods, requires various trips to different countries and regions as well as holding
meetings between the corresponding organizations [86]. These trips and meetings impose
higher staff salaries and travel expenses, and funding these costs might be impossible for
smaller relief organizations and aid agencies because of their limited resources [83].
15.6.3 Humanitarian Coordination Mechanisms
As mentioned in Section 15.4, the main stages of any humanitarian logistics chain
can be classified into several stages: acquisition and procurement, pre-positioning
and warehousing, and transportation. Based on the results of Balcik et al. [29], char-
acteristics of the most prominent commercial supply chain coordination mechanisms
that are currently being practiced in humanitarian logistics chains or can be applied
to them are given in Table 15.6. These supply chain coordination mechanisms are
compared with one another based on six factors, including coordination cost (i.e.,
direct costs associated with coordination), opportunistic risk cost (i.e., costs associ-
ated with reduced or lost bargaining power or resource control), operational risk
318 Logistics Operations and Management

cost (i.e., costs associated with partner’s poor performance), technological require-
ments, being beneficial to relief environment, and finally the potential for imple-
mentation [29,81]. The results of Balcik et al. [29] show that collaborative
procurement and third-party warehousing are currently the most widely used coordi-
nation mechanisms because of their inherent low costs and technological require-
ments. Also, the authors pointed out that the use of more costly mechanisms such as
shipper collaboration and 4PL5 service providers requires new types of relationships
between relief organizations and aid agencies.
15.7 Performance Measurement of Humanitarian LogisticsSystems
Every organization is accountable for its decisions and actions to its customers,
employees, suppliers, and shareholders according to its mission, vision, and goals.
Hence, performance measurement and management, either working for profit or
not, is an important part of analyzing and aligning an organization’s performance
path with its original vision and goals as well as shareholders’ views and needs.
Bear in mind, however, that balancing the performance of an organization in vari-
ous performance measures might be a challenging task because some performance
measures are usually in conflict with one another. For example, increasing the flex-
ibility of a process might require higher levels of investment and operating costs.
Performance measurement in supply chain management is also an important aspect
of an organization’s performance measurement mainly because of its important
role in management of physical and information flows in the logistics systems of
the organization.
Considering the previous discussions, performance measurement of humanitar-
ian logistics systems and improving them and gaining experience from previous
disaster relief operations are of great importance. This importance can be attributed
to two main factors, including dependency of human lives on the effectiveness and
responsiveness of humanitarian logistics systems as well as limited available
resources for relief operations after a disaster occurs (e.g., unpreparedness of relief
organizations and destruction of vital infrastructures). Also as mentioned by Schulz
[87], the continuous use of a performance measurement system in a relief organiza-
tion can lead to continuous improvement and more efficiency.
Besides the above reasoning, many organizations that participate in relief opera-
tions are not-for-profit organizations, and performance measurement is an important
aspect of their systems as required by their donors and supporters. As pointed out by
Poister [88], “effective performance measurement systems can help nonprofit man-
agers make better decisions, improve performance, and provide more accountabil-
ity.” Moreover, when they are designed and implemented effectively, performance
measures provide feedback on agency performance, and motivate managers and
5 Fourth-party logistics.
319Humanitarian Logistics Planning in Disaster Relief Operations

employees to work harder and smarter to improve performance. They can also help
allocate resources more effectively, evaluate the efficacy of alternative approaches,
and gain greater control over operations, even while allowing increased flexibility at
the operating level.
Usually, in evaluating a supply chain performance, different performance metrics
such as cost, quality, time, responsiveness of the whole supply chain as well as its
processes, reliability of processes, process flexibility, level of resource sharing, visi-
bility, innovativeness, and trust between different actors of a supply chain are con-
sidered [89�93]. However, the types of metrics needed in humanitarian logistics
systems are different and unique because of the inherent characteristics of humani-
tarian logistics systems mentioned in Section 15.4.1. This is highlighted in the fol-
lowing facts [32,94]:
1. Many of the services offered in humanitarian relief operations are intangible and there-
fore hard to quantify.
2. Outcomes are unknown.
3. The performance in each mission is hard to quantify and hence hardly measurable.
4. Interests, goals, and standards of stakeholders are different.
5. Accuracy and reliability of available data is not satisfactory.
Considering the above facts, we can conclude that the process of designing
and implementing a performance measurement system in humanitarian systems
would be a challenging and complicated task. However, as mentioned by Schulz
and Heigh [95] based on experiences of designing such system for the International
Federation of Red Cross and Red Crescent Societies (IFRC), this process can and
should be kept as simple as possible. The success factors of such a process are the
integration of key stakeholders throughout the process as well as simplicity and
user friendliness of the methods and tools [95].
In this section, two examples of performance metric systems proposed by
Beamon and Balcik [32] and Davidson [96] are explained. Davidson has proposed
a metric system based on the following four core metrics:
1. Appeal coverage: This measures the performance of an organization in meeting its appeal
for an operation in terms of both finding donors and delivering items. This metric is mea-
sured via two submetrics, including percentage of appeal coverage and percent of items
delivered.
2. Donation-to-delivery time: This is a measure of how long it takes for an item to be deliv-
ered to the destination after a donor has promised its donation.
3. Financial efficiency: As a measure of the financial aspects of organizational performance,
this metric is measured via three submetrics: (a) absolute ratio of the forecasted prices to
the actual prices paid for items delivered in the operation, (b) relative ratio of the fore-
casted prices to the actual prices paid for items delivered in the operation, and (c) ratio of
the total transportation costs incurred over the total costs for delivered items at a specific
point in time.
4. Assessment accuracy: This measures how much the operation’s final budget changed
over time from the original budget. It is measured as the ratio of revised budget to the
original budget.
320 Logistics Operations and Management

Beamon and Balcik [32] also have proposed a framework for evaluating a
humanitarian logistics system performance based on the three main metric classes,
namely, resource, output, and flexibility, originally proposed by Beamon [97] for
commercial supply chains. The resulting performance measures are available in
Table 15.7.
At the end, it is noteworthy that, in comparison with the number of investiga-
tions done on the planning aspects of humanitarian logistics systems (see Sections
15.5 and 15.6), only limited research has been done on the performance measure-
ment of these systems [32,94�96,98]. Therefore, one of the main research areas in
the field of humanitarian logistics systems is to develop more comprehensive per-
formance measurement frameworks, especially considering the intangible aspects
of humanitarian logistics systems.
Table 15.7 Proposed Humanitarian Logistics System Performance Measures [32]
Resource Output Flexibility
Total cost Total amount of delivered
disaster supplies
Amount of individual units
of tier 1 supplies that can
be provided in time period
TcOverhead costs Total amount of delivered
disaster supplies of each
type
Minimum response time
Total transportation and
handling cost
Total amount of delivered
disaster supplies to each
region
Variety of different types of
supplies that the logistics
system can provide in a
specified time period
Value of held inventory Amount of delivered disaster
supplies to each recipient
Inventory obsolescence
and spoilage
Target fill rate achievement
Ordering and setup costs Average item fill rate
Inventory holding costs Probability of stock out
Cost of supplies Percentage of back orders
Number of relief workers
employed per aid
recipient
Number of stock outs
Percentage of value-
added hours
Average back-order level
Money spent per aid
recipient
Average response time
Donations received per
time period
Minimum response time
321Humanitarian Logistics Planning in Disaster Relief Operations

15.8 Case Studies and Learned Lessons
This section presents case studies and learned lessons regarding the humanitarian
logistics system as presented through available reports, documents, and articles.
The three cases include the decentralized approach of the IFRC to humanitarian
logistics following the 2006 Indonesian earthquake in Yogyakarta, the performance
evaluation of disaster logistics systems during hurricane Katrina in 2005, and the
key success factors of natural disaster management systems in the Asian tsunami of
2004.
15.8.1 The Yogyakarta Earthquake, 2006
On May 27, 2006, an earthquake of magnitude 6.3 occurred in the Indian Ocean
20 km south-southwest of the Indonesian city of Yogyakarta [99]. The earthquake
caused 5782 deaths, injured 36,299 people, damaged 135,000 houses, and left an
estimated 1.5 million people homeless [100]. The quake also destroyed or severely
damaged public buildings and facilities (e.g., railways, airports, and hospitals)
[101]. Because Yogyakarta International Airport was closed, relief flights had to be
rerouted to either Solo airport (60 km northeast of Yogyakarta) or Semarang airport
(120 km north of Yogyakarta). Finally, water, electricity, transportation, and com-
munications infrastructures in the regions affected by the quake were severely dam-
aged. Immediately following the disaster, the Indonesia Red Cross Society
mobilized more than 400 employees and volunteers and 10 mobile medical action
teams to undertake assessment and relief operations [102]. The Indonesian presi-
dent moved the army to the central Java province to aid rescue efforts and evacuate
victims [100]. Also, about 20 countries and humanitarian organizations offered
relief aid to the Indonesian government [100].
One prominent feature of the Yogyakarta earthquake was the exemplary perfor-
mance of the IFRC during the relief operations compared to its previous perfor-
mance in similar operations such as the Asian tsunami in 2004 and the Pakistani
earthquake in 2005 [101]. Various improvements were observed such as lower total
costs (cheaper relief chains), lower lead times (faster relief chains), and the number
of families served by the relief teams (better relief chains) based on an internal
IFRC case study [101]. For example, the Yogyakarta relief operations were 3 times
and 6 times faster than the Pakistani earthquake and Asian tsunami relief opera-
tions, respectively. The main reason behind such performance is attributed to the
decentralization of the IFRC humanitarian logistics chain.
Traditionally, the IRFC used to transport necessary items using transcontinental
flights from various donors and national Red Cross and Red Crescent societies to
local airports near a disaster. These kinds of operations required more money and
were slow and time consuming (because of the bottlenecks created at local airports
and warehouses). In the process of decentralizing their relief chain [101], IFRC
chose three cities to be their regional logistics units (RLUs). These cities include
Dubai (covering Africa, Europe, and the Middle East), Kuala Lumpur (covering
322 Logistics Operations and Management

Asia and Australia), and Panama (covering the Americas). Hence, on receiving a
help request from any national Red Cross or Red Crescent society, one of the
RLUs is the main RLU responsible for coordinating and operating relief operations.
Based on the results of Gatignon et al. [101], various factors contributed to such
performance including the following:
1. Pre-positioned, regional operational capacity: Having regional infrastructures and
stocked items helps increasing the speed of operations.
2. Procuring required items from local and regional sources: Having local and regional sup-
pliers instead of relying heavily on long-distance donations leads to lower purchasing and
transportation costs and of course, faster delivery.
3. Local coordination of relief logistics operations: Having a local coordinator more familiar
with the region and local authorities instead of the previously global coordinator, posi-
tioned in Geneva, has increased the level of relief operations coordination.
4. Standardization of processes and items: Using various standardized logistics processes
including needs assessments, procurement, warehousing, and fleet management leads to
better flow of material management, maintaining the quality of procured items, and con-
sequently lower costs.
5. Adapting information systems for tracing goods: Customizing their Humanitarian
Logistics Software (HLS) according to the needs of the field ensures better tracking of
material flows.
6. Employing skillful and experienced personnel and training them: Applying the knowledge
and experience of such human resources can lead to better decision making in the field as
well as better performance.
15.8.2 Hurricane Katrina, 2005
On August 23, 2005, hurricane Katrina formed over the Bahamas and crossed over
southern Florida as a category 1 hurricane. Then it headed toward the Gulf of
Mexico as a category 3 hurricane, causing massive destruction in southeast
Louisiana on August 29 [103]. Because of Katrina’s massive power, the levee sys-
tem protecting New Orleans from Lake Pontchartrain and the Mississippi River
failed and most of the city became flooded [104]. Considered to be the costliest
hurricane of US history, hurricane Katrina caused about 1836 deaths and an eco-
nomic damage of approximately $81.2 billion [105]. Besides deaths and the huge
economic damage, the hurricane’s environmental effects were considerable because
of massive oil spills [106].
The US disaster management system in United States (currently known as the
National Response Framework) has a hierarchical structure, so disasters are usually
dealt with first at the lowest possible governmental level. Hence, a state govern-
ment is supposed to be the last entity responsible for disaster relief. The scale of
hurricane Katrina, however, led the state government to declare a state of emer-
gency and call for national support. The disaster response started with various
operations such as positioning relief teams across the inundated areas to assist and
evacuate citizens and distribute relief items initiated by the Federal Emergency
Management Agency (FEMA). The deployed forces included FEMA, state and
local agencies, federal and National Guard soldiers, and volunteers [106]. After
323Humanitarian Logistics Planning in Disaster Relief Operations

Katrina’s second landfall on August 29, the relief operations continued with various
operations such as evacuating remaining citizens, distributing relief items, provid-
ing temporary housing, and removing debris. Besides the national capacity to
respond to the disaster, many foreign countries and aid agencies offered to help the
United States in relief operations (see [107] for a list of responders).
However, the quality and quantity of relief operations raised various questions
(see [105] for a brief review of such criticisms). The weak performance of relief
operations can be attributed to multiple factors, including the following:
1. A lack of central command and leadership
2. Insufficient local government, federal, and state capacities for dealing with a disaster of
such magnitude, including enough trained personnel, funds, and resources
3. Lack of clarity in the national response plan
4. Late deployment of forces
5. Insufficient experience of the FEMA director and members
6. Poor performance of communication systems
7. Lack of collaboration and coordination
8. Inefficient budget expenditure system
9. Inconsistencies of the information systems
10. Poor logistics planning, including planning of transportation and distribution operations
[105,108]
Iqbal et al. [108] have suggested the following for better disaster relief opera-
tions considering the event before, during, and after the disaster of hurricane
Katrina:
1. Nationwide preparedness
2. Better and preplanned humanitarian logistics operations
3. Improved forecasting techniques used for disaster relief
4. Use a more flexible and transparent logistics system
5. Enhancing evacuation operations
6. Better pre-positioning of relief supplies in the country
7. More involvement of NGOs, volunteers, and private sector in various relief operations
8. Use of more reliable communication technologies and information technology structures
for better collaboration and coordination
9. Use of modern technologies such as GIS and real-time tracking systems for better and
more equitable distribution of disaster relief items
15.8.3 Asian Tsunami, 2004
On December 26, 2004, an underground earthquake of magnitude 9.1 struck in the
Indian Ocean, off the west coast of Sumatra, Indonesia [109]. The severe earth-
quake created a series of tsunamis with waves as high as 30 m. The effects of this
disaster on peoples’ lives were catastrophic: 230,000 deaths, 125,000 injured, and
about 1.69 million people left homeless in more than 15 countries [110]. The eco-
nomic damages by the disaster were devastating. For example, the reported eco-
nomic damage to Indonesia and Sri Lanka (the two most severely affected
countries) were about $4451.6 and $970 billion, respectively [111]. Regarding the
324 Logistics Operations and Management

humanitarian actions, this disaster attracted donations worth more than $7 billion
from around the world [110].
The responses of affected countries by the tsunami were different and diverse
[112]. Among the affected countries, Maldives was the only country with no
national disaster management system, so it relied mainly on its military forces
capacities and appointed the minister of defense as the chief coordinator of relief
operations. On the other hand, other countries were more dependent on their own
national disaster management systems. However, the preparedness level of these
countries varied greatly. For example, India and Thailand succeeded in assisting
other affected countries in addition to attending to the needs of their own affected
citizens. In Indonesia and Sri Lanka, the severities of damages were beyond their
national capacities. Besides the national relief operations, many countries (such as
Australia, Canada, Germany, Japan, the United States, and Pakistan) and interna-
tional agencies and NGOs (such as IFRC, UNDP, UNICEF, and Islamic Relief
Worldwide) participated in the relief operations [113].
Based on the study of various reports and research article on the disaster and
interviews with some of the logistics managers after the disaster [114], the follow-
ing weaknesses were observed:
1. Lack of preparedness
2. Lack of knowledge about local needs, capacities, and vulnerabilities among foreign aid
teams
3. Lack of coordinated requirement assessments
4. Presence of competition between aid agencies
5. Lack of coordination and information sharing between foreign aid agencies
6. Lack of logistics professionals
7. Lack of long-term vision of the situation among donors and governments
Based on the above weaknesses, the following key factors regarding the success
of disaster management systems were identified [114]:
1. Preparing for disaster in vulnerable regions
2. Cooperating with local organizations and NGOs as well as using local information about
capacities and requirements in planning the relief operations
3. Involving local forces in assessment of the needs
4. Sharing information between participating organization in relief operations
5. Involving logistics professionals during planning and execution of relief operations
6. Improving the logistics knowledge of local officials and forces
7. Effectiveness of logistics systems
8. Importance of creating a national disaster plan
9. Necessity of using holistic approach to design disaster management systems
15.9 Conclusion
Disasters have always profoundly affected human lives in any country, whether
developed, developing, or underdeveloped. As stated by Oloruntoba [115], the
325Humanitarian Logistics Planning in Disaster Relief Operations

destructive effects of disasters not only affect underdeveloped and developing
countries but also affect developed countries. Therefore, proactive planning to
reduce negative impacts of disasters is a necessary step toward better living condi-
tions for all human beings. Disaster management systems are part of humans’
endeavors to better prepare themselves against disasters. However, despite some
improvements in infrastructures, disasters still kill many humans. In such situations,
conducting effective relief operations is of high importance.
A crucial aspect of disaster management systems are humanitarian logistics sys-
tems, which are responsible for “planning, implementing and controlling the effi-
cient, cost-effective flow and storage of goods and materials, as well as related
information, from the point of origin to the point of consumption for the purpose of
alleviating the suffering of vulnerable people” [4]. Humanitarian logistics systems
are usually required to procure, store, and transport food, water, medicine, other
supplies as well as human resources, necessary machinery and equipment, and the
injured during pre- and postdisaster periods. Although similar in concepts to com-
mercial supply chains, humanitarian logistics systems differ from their commercial
counterparts in the sense that demand for humanitarian services is highly uncertain
in many aspects such as time, location, and type of services needed.
This chapter discussed basic concepts in disaster management and fundamentals
of humanitarian logistics systems, including disasters and their effects, cycles of
disaster management systems, definition and stages of humanitarian logistics, their
comparison with commercial supply chains, basic mathematical models for opti-
mizing humanitarian logistics operations, coordination mechanisms in humanitarian
logistics, and performance measurements of such systems. Also, case studies were
presented for more familiarity with important learned lessons and success factors
of humanitarian logistics systems in practice.
At the end, various aspects of humanitarian logistics seem to need more attention
from academics. These aspects include developing more advanced OR models for
dealing with the complexities and uncertainties of disaster environment, designing
specific inventory-control systems for humanitarian logistics by considering
medium-term stocking of relief items and the perishability of relief items, devising
better coordination practices and systems, and finally extending performance
measurement systems to cover more tangible and intangible aspects of humanitarian
logistics.
References
[1] G. Kovacs, K.M. Spens, Humanitarian logistics in disaster relief operations, Int. J.
Phys. Distrib. Logist. Manage. 37 (2007) 99�114.
[2] R. Oloruntoba, R. Gray, Humanitarian aid: an agile supply chain? Supply Chain
Manage. 11 (2006) 115�120.
[3] G. Kovacs, K. Spens, Identifying challenges in humanitarian logistics, Int. J. Phys.
Distrib. Logist. Manage. 39 (2009) 506�528.
326 Logistics Operations and Management

[4] Fritz Institute, in: A.S. Thomas, L.R. Kopczak (Eds.), From Logistics to Supply Chain
Management: The Path Forward in the Humanitarian Sector, Fritz Institute, San
Francisco, CA, 2005.
[5] UNDRO, An Overview of Disaster Management—Disaster Management Training
Program, second ed., UNDP/UNDRO, New York, 1992.
[6] F.C. Cuny, Disasters and Development, Oxford University Press, Oxford, 1983.
[7] T. Russell, The Humanitarian Relief Supply Chain: Analysis of the 2004 South East Asia
Earthquake and Tsunami, Massachusetts Institute of Technology, Cambridge, MA, 2005.
[8] A.R. Akkihal, Inventory Pre-Positioning for Humanitarian Operations, Massachusetts
Institute of Technology, Cambridge, MA, 2006.
[9] ISDR, Terminology: basic terms of disaster risk reduction. International Strategy for
Disaster Reduction (ISDR), Geneva, Switzerland.http://www.unisdr.org/eng/library/lib-
terminology-eng%20home.htm, 2004 (accessed October 3, 2010).
[10] ISDR, Disaster statistics 1991�2005: disaster occurrence—Trends century.
International Strategy for Disaster Reduction (ISDR), Geneva, Switzerland. http://www.
unisdr.org/disaster-statistics/occurrence-trends-century.htm, 2006 (accessed October 3,
2010).
[11] ISDR, Disaster statistics 1991�2005: disaster occurrence—Type of disasters. Inter-
national Strategy for Disaster Reduction (ISDR), Geneva, Switzerland. http://www.
unisdr.org/disaster-statistics/occurrence-type-disas.htm, 2006 (accessed October 3,
2010).
[12] Universite catholique de Louvain, EM-DAT: The OFDA/CRED International Disaster
Database. EM-DAT, 11.08, Brussels, Belgium, 2009.
[13] ISDR, Disaster statistics 1991�2005: disaster impact—Economic damage. International
Strategy for Disaster Reduction (ISDR), Geneva, Switzerland. http://www.unisdr.org/
disaster-statistics/impact-economic.htm, 2006 (accessed October 3, 2010).
[14] Universite catholique de Louvain, EM-DAT: The OFDA/CRED International Disaster
Database. EM-DAT, 12.07, Brussels, Belgium, 2010.
[15] M. White, Deaths by mass unpleasantness: estimated totals for the entire 20th century.
http://users.erols.com/mwhite28/warstat8.htm, 2005 (accessed October 3, 2010).
[16] I. Kelman, Disaster deaths. http://www.ilankelman.org/disasterdeaths.html, 2009
(accessed October 3, 2010).
[17] M. Aslanzadeh, E. Ardestani Rostami, L. Kardar, Logistics management and SCM in
disasters, in: R. Zanjirani Farahani, N. Asgari, H. Davazani (Eds.), Supply Chain and
Logistics in National, International and Governmental Environment: Concepts and
Models, Springer, Berlin, 2009.
[18] K. Seneviratne, D. Amaratunga, R. Haigh, C. Pathirage, Knowledge management for
disaster resilience: identification of key success factors, CIB2010 World Congress, The
Lowry, Salford Quays, United Kingdom, 2010.
[19] National Disaster Management, Social, economic and health consequences of natural
calamities, Vol. 2007, National Disaster Management Center of Ministry of Home
Affairs of Government of India, North Block, New Delhi, 2007.
[20] G.D. Haddow, J.A. Bullock, Introduction to Emergency Management, Butterworth-
Heinemann, Amsterdam, 2004.
[21] N. Altay, W.G. Green, OR/MS research in disaster operations management, Eur. J.
Oper. Res. 175 (2006) 475�493.
[22] J.P. Wilson, Policy Actions of Texas Gulf Coast Cities to Mitigate Hurricane Damage:
Perspectives of City Officials, Texas State University, San Marcos, TX, 2009.
327Humanitarian Logistics Planning in Disaster Relief Operations

[23] D. Alexander, Principles of Emergency Planning and Management, Terra Publishing,
Harpenden, 2002.
[24] L.N. Van Wassenhove, Humanitarian aid logistics: supply chain management in high
gear, J. Oper. Res. Soc. 57 (2006) 475�489.
[25] R. Tomasini, L.N. Van Wassenhove, Humanitarian Logistics, Palgrave Macmillan,
Basingstoke, Hampshire, 2009.
[26] L. Li, S. Tang, An artificial emergency-logistics-planning system for severe disasters,
IEEE Intell. Syst. 23 (2008) 86�88.
[27] B. Balcik, B.M. Beamon, Facility location in humanitarian relief, Int. J. Logist. Res.
Appl. 11 (2008) 101�121.
[28] B.M. Beamon, Humanitarian relief chains: issues and challenges, in: Proceedings of the
34th International Conference on Computers and Industrial Engineering, San Francisco,
CA, 2004, pp. 77�82.
[29] B. Balcik, B.M. Beamon, C.C. Krejci, K.M. Muramatsu, M. Ramirez, Coordination in
humanitarian relief chains: practices, challenges and opportunities, Int. J. Prod. Econ.
126 (2010) 22�34.
[30] A. Thomas, L.R. Kopczak, Life-saving supply chains: challenges and the path forward,
in: H.L. Lee, C.-Y. Lee (Eds.), Building Supply Chain Excellence in Emerging
Economies, Springer, New York, NY, 2006, pp. 93�111.
[31] L. Kopczak, M.E. Johnson, Rebuilding confidence: trust, control and information tech-
nology in humanitarian supply chains, in: 2007 Academy of Management Annual
Meeting, Philadelphia, PA, 2007.
[32] B.M. Beamon, B. Balcik, Performance measurement in humanitarian relief chains, Int.
J. Publ. Sect. Manage. 21 (2008) 4�25.
[33] Pan American Health Organization and World Health Organization, Humanitarian
Supply Chain and Logistics in the Health Sector, PAHO, Washington, DC, 2001.
[34] M.S. Daskin, Networks and Discrete Location: Models, Algorithms, and Applications,
Wiley, New York, NY, 1995.
[35] M.S. Daskin, What you should know about location modeling, Naval Res. Logist. 55
(2008) 283�294.
[36] N. Mladenovic, J. Brimberg, P. Hansen, J.A. Moreno-Perez, The p-median problem: a
survey of metaheuristic approaches, Eur. J. Oper. Res. 179 (2007) 927�939.
[37] C.S. Revelle, H.A. Eiselt, Location analysis: a synthesis and survey, Eur. J. Oper. Res.
165 (2005) 1�19.
[38] C.S. Revelle, Facility sitting and integer friendly programming, Eur. J. Oper. Res. 65
(1993) 147�158.
[39] R.D. Galvo, C. ReVelle, A Lagrangean heuristic for the maximal covering location
problem, Eur. J. Oper. Res. 88 (1996) 114�123.
[40] Z. Drezner, H.W. Hamacher (Eds.), Facility Location: Applications and Theory,
Springer-Verlag, New York, NY, 2002.
[41] C.S. ReVelle, H.A. Eiselt, M.S. Daskin, A bibliography for some fundamental problem
categories in discrete location science, Eur. J. Oper. Res. 184 (2008) 817�848.
[42] B. Adivar, T. Atan, B.S. Oflac, T. Orten, Improving social welfare chain using optimal
planning model, Supply Chain Manage. 15 (2010) 290�305.
[43] M. Najafi, R. Zanjirani Farahani, M.P. de Brito, W. Dullaert, Location and Distribution
Management of Relief Centers: A Genetic Algorithm Approach, Amirkabir University
of Technology, Tehran, 2010.
[44] H. Taha, Operations Research: An Introduction, eighth ed., Prentice Hall, Upper Saddle
River, NJ, 2007.
328 Logistics Operations and Management

[45] F.S. Hillier, G.J. Lieberman, Introduction to Operations Research, seventh ed.,
McGraw-Hill, New York, NY, 2001.
[46] L.A. Wolsey, Integer Programming, Wiley, New York, NY, 1998.
[47] S. Bazaraa, J.J. Jarvis, Linear Programming and Network Flows, second ed., Wiley,
New York, NY, 1977.
[48] R. Zanjirani Farahani, S. Sharahi, Bi-objective Genetic Algorithm for Multi-objective
Logistics Planning in Disasters, Amirkabir University of Technology, Tehran, 2010.
[49] G.B. Dantzig, R.H. Ramser, The truck dispatching problem, Manage. Sci. 6 (1959)
80�91.
[50] P. Toth, D. Vigo, An overview of vehicle routing problem, in: P. Toth, D. Vigo (Eds.),
The Vehicle Routing Problem, Society for Industrial and Applied Mathematics,
Philadelphia, PA, 2002, pp. 1�26.
[51] J.-F. Cordeau, G. Laporte, M.W.P. Savelsbergh, D. Vigo, Vehicle routing, in: C.
Barnhart, G. Laporte (Eds.), Handbook of Operations Research and Management
Science—Transportation, Elsevier, Amsterdam, 2006, pp. 367�428.
[52] P. Toth, D. Vigo (Eds.), The Vehicle Routing Problem, Society for Industrial and
Applied Mathematics, Philadelphia, PA, 2002.
[53] B. Golden, S. Raghavan, E. Wasil (Eds.), The Vehicle Routing Problem: Latest
Advances and New Challenges, Springer, New York, NY, 2008.
[54] B. Balcik, B.M. Beamon, K. Smilowitz, Last mile distribution in humanitarian relief, J.
Intell. Transport. Syst. Technol. Plan. Oper. 12 (2008) 51�63.
[55] A.M. Campbell, D. Vandenbussche, W. Hermann, Routing for relief efforts, Transport.
Sci. 42 (2008) 127�145.
[56] L. Ozdamar, E. Ekinci, B. Kucukyazici, Emergency logistics planning in natural disas-
ters, Ann. Oper. Res. 129 (2004) 217�245.
[57] J.-B. Sheu, An emergency logistics distribution approach for quick response to urgent
relief demand in disasters, Transport. Res. Part E 43 (2007) 687�709.
[58] J.R. Birge, F. Louveaux, Introduction to Stochastic Programming, Springer, New York,
NY, 1997.
[59] A. Ben-Tal, L. El Ghaoui, A. Nemirovski, Robust Optimization, Princeton University
Press, Princeton, NJ, 2009.
[60] H.O. Mete, Z.B. Zabinsky, Stochastic optimization of medical supply location and dis-
tribution in disaster management, Int. J. Prod. Econ. 126 (2010) 76�84.
[61] H. Min, V. Jayaraman, R. Srivastava, Combined location-routing problems: a research
directions synthesis and future, Eur. J. Oper. Res. 108 (1998) 1�15.
[62] S. Salhi, G.K. Rand, The effect of ignoring routes when locating depots, Eur. J. Oper.
Res. 39 (1989) 150�156.
[63] G. Nagy, S. Salhi, Location-routing: issues, models and methods, Eur. J. Oper. Res.
177 (2007) 649�672.
[64] M.S. Daskin, C.R. Coullard, Z.-J.M. Shen, An inventory-location problem: formulation,
solution algorithm and computational results, Ann. Oper. Res. 110 (2002) 83�106.
[65] H. Shavandi, H. Mahlooji, Fuzzy hierarchical queueing models for the location set cov-
ering problem in congested systems, Sci. Iranica 15 (2008) 378�388.
[66] F. Baita, W. Ukovich, R. Pesenti, D. Favaretto, Dynamic routing-and-inventory prob-
lem: a review, Transport. Res. Part A 32 (1998) 585�598.
[67] E. Nikbakhsh, S.H. Zegordi, A heuristic algorithm and a lower bound for the two-echelon
location-routing problem with soft time windows constraints, Sci. Iranica 17 (2010) 36�47.
[68] M. Desrochers, G. Laporte, Improvements and extensions to the Miller�Tucker�Zemlin subtour elimination constraints, Oper. Res. Lett. 10 (1991) 27�36.
329Humanitarian Logistics Planning in Disaster Relief Operations

[69] N. Megiddo, K.J. Supowit, On the complexity of some common geometric location
problems, SIAM J. Comput. 13 (1984) 182�196.
[70] T.H. Wu, C. Low, J.W. Bai, Heuristic solutions to multi-depot location-routing pro-
blems, Comput. Oper. Res. 29 (2002) 1393�1415.
[71] Z. Ozyurt, D. Aksen, Solving the multi-depot location-routing problem with
Lagrangian relaxation, in: K. Baker, A. Joseph, A. Mehrotra, M.A. Trick (Eds.),
Extending the Horizons: Advances in Computing, Optimization, and Decision
Technologies, Springer, New York, NY, 2007.
[72] M. Albareda-Sambola, J.A. Dıaz, E. Fernandez, A compact model and tight bounds for
a combined location-routing problem, Comput. Oper. Res. 32 (2005) 407�428.
[73] C.K.Y. Lin, C.K. Chow, A. Chen, A location-routing-loading problem for bill delivery
services, Comput. Ind. Eng. 43 (2002) 5�25.
[74] G. Barbarosoglu, L. Ozdamar, A. Cevik, An interactive approach for hierarchical analy-
sis of helicopter logistics in disaster relief operations, Eur. J. Oper. Res. 140 (2002)
118�133.
[75] USAID, Assistance for Iranian earthquake victims. U.S. Agency for International
Development, Washington, DC. http://www.usaid.gov/iran/, 2004 (accessed October 3, 2010).
[76] G. Fenton, Coordination in the Great Lakes, Forced Mig. Rev. (2003) 23�24.
[77] N. Altay, Issues in disaster relief logistics, in: M. Gad-el-Hak (Ed.), Large-Scale
Disasters: Prediction, Control and Mitigation, Cambridge University Press, New York,
NY, 2008, pp. 120�146.
[78] G.P. Cachon, Supply chain coordination with contracts, in: A.G. de Kok, S.C. Graves
(Eds.), Handbooks in Operations Research and Management Science: Supply Chain
Management: Design, Coordination and Operation, vol. 11, Elsevier Science
Publishers, Amsterdam, 2003.
[79] S. Whang, Coordination in operations: a taxonomy, J. Oper. Manag. 12 (1995)
413�422.
[80] I. Giannoccaro, P. Pontrandolfo, Supply chain coordination by revenue sharing con-
tracts, Int. J. Prod. Econ. 89 (2004) 131�139.
[81] L. Xu, B.M. Beamon, Supply chain coordination and cooperation mechanisms: an
attribute-based approach, J. Supply Chain Manage. 42 (2006) 4�12.
[82] J.E. McCann, J.R. Galbraith, Interdepartmental Relations, in: P.C. Nystrom, W.H.
Starbuck (Eds.), The Handbook of Organizational Design, vol. 2, Oxford University
Press, New York, NY, 1981, pp. 60�84.
[83] S. Moore, E. Eng, M. Daniel, International NGOs and the role of network centrality in
humanitarian aid operations: a case study of coordination during the 2000 Mozambique
floods, Disasters 27 (2003) 305�318.
[84] J. Seaman, Malnutrition in emergencies: how can we do better and where do the
responsibilities lie? Disasters 23 (1999) 306�315.
[85] M. Stephenson, Making humanitarian relief networks more effective: operational coor-
dination, trust and sense making, Disasters 29 (2005) 337�350.
[86] L. Minear, The Humanitarian Enterprise: Dilemmas and Discoveries, Kumarian Press,
Bloomfield, CT, 2002.
[87] S.F. Schulz, Disaster Relief Logistics: Benefits of and Impediments to Horizontal
Cooperation Between Humanitarian Organizations. Doctor of Economics, Berlin
Institute of Technology, 2008.
[88] T.H. Poister, Measuring Performance in Public and Nonprofit Organizations, Jossey-
Bass, San Francisco, CA, 2003.
330 Logistics Operations and Management

[89] R. Bhagwat, M.K. Sharma, Performance measurement of supply chain management: a
balanced scorecard approach, Comput. Ind. Eng. 53 (2007) 43�62.
[90] F.T.S. Chan, Performance measurement in a supply chain, Int. J. Adv. Manuf. Tech.
21 (2003) 534�548.
[91] Supply Chain Council, Supply Chain Operations Reference Model 9.0, Supply Chain
Council, Cypress, TX, 2009.
[92] A. Gunasekaran, C. Patel, R.E. McGaughey, A framework for supply chain perfor-
mance measurement, Int. J. Prod. Econ. 87 (2004) 333�347.
[93] J.P.C. Kleijnen, M.T. Smits, Performance metrics in supply chain management,
J. Oper. Res. Soc. 54 (2003) 507�514.
[94] E.A. Van Der Laan, M.P. De Brito, D.A. Vergunst, Performance measurement in
humanitarian supply chains, Int. J. Risk Assess. Manag. 13 (2009) 22�45.
[95] S.F. Schulz, I. Heigh, Logistics performance management in action within a humani-
tarian organization, Manag. Res. News 32 (2009) 1038�1049.
[96] A.L. Davidson, Key Performance Indicators in Humanitarian Logistics, Massachusetts
Institute of Technology, Cambridge, MA, 2006.
[97] B.M. Beamon, Measuring supply chain performance, Int. J. Oper. Prod. Manag. 19
(1999) 275�292.
[98] G. Kovacs, P. Tatham, Humanitarian logistics performance in the light of gender, Int.
J. Prod. Perform. Manag. 58 (2009) 174�187.
[99] USGS NEIC, Magnitude 6.3—Java, Indonesia. U.S. Geological Survey, Reston, VA.
http://earthquake.usgs.gov/earthquakes/eqinthenews/2006/usneb6/, 2010 (accessed October
3, 2010).
[100] Wikipedia Contributors, May 2006 Java earthquake. Wikipedia, The Free
Encyclopedia. http://en.wikipedia.org/wiki/May_2006_Java_earthquake, 2010
(accessed October 3, 2010).
[101] A. Gatignon, L.N. Van Wassenhove, A. Charles, The Yogyakarta earthquake: humani-
tarian relief through IFRC’s decentralized supply chain, Int. J. Prod. Econ. 126 (2010)
102�110.
[102] IFRC, Indonesia: Yogyakarta Earthquake—IFRC Information Bulletin No. 1, May 27,
2006.
[103] NASA, Hurricane Season 2005: Katrina. National Aeronautics and Space
Administration, Washington, DC. http://www.nasa.gov/vision/earth/lookingatearth/
h2005_katrina.html, 2005 (accessed October 3, 2010).
[104] M. Gad-el-Hak, The art and science of large-scale disasters, in: M. Gad-el-Hak (Ed.),
Large-Scale Disasters: Prediction, Control and Mitigation, Cambridge University
Press, New York, NY, 2008, pp. 5�68.
[105] Wikipedia Contributors, Hurricane Katrina. Wikipedia, The Free Encyclopedia. http://
en.wikipedia.org/wiki/Hurricane_Katrina, 2010 (accessed October 3, 2010).
[106] Wikipedia Contributors, Hurricane Katrina disaster relief. Wikipedia, The Free
Encyclopedia. http://en.wikipedia.org/wiki/Hurricane_Katrina_disaster_relief, 2010
(accessed October 3, 2010).
[107] Wikipedia Contributors, International response to Hurricane Katrina. Wikipedia, The
Free Encyclopedia. http://en.wikipedia.org/wiki/International_response_to_Hurricane_
Katrina, 2010 (accessed October 3, 2010).
[108] Midwest Transportation Consortium, in: Q. Iqbal, K. Mehler, M.B. Yildirim (Eds.),
Comparison of Disaster Logistics Planning and Execution for 2005 Hurricane Season,
2007 Ames, IA, May 2007
331Humanitarian Logistics Planning in Disaster Relief Operations

[109] USGS NEIC, Magnitude 9.1—Off the West Coast of Northern Sumatra. U.S.
Geological Survey, Reston, VA. http://earthquake.usgs.gov/earthquakes/eqinthenews/
2004/usslav/, 2009 (accessed October 3, 2010).
[110] Wikipedia Contributors, 2004 Indian Ocean earthquake and tsunami. Wikipedia, The
Free Encyclopedia. http://en.wikipedia.org/wiki/2004_Indian_Ocean_earthquake_and_
tsunami, 2010 (accessed October 3, 2010).
[111] P.-C. Athukorala, B.P. Resosudarmo, The Indian Ocean Tsunami: Economic Impact,
Disaster Management and Lessons, Australian National University, Economics
RSPAS, Canberra, 2005.
[112] R. Samii, L.N. Van Wassenhove, The Logistics of Emergency Response: Tsunami Versus
Haiti. INSEAD—Social Innovation Center, Fontainebleau Cedex. http://www.insead.edu/
facultyresearch/centres/isic/documents/TsunamiversusHaiti.pdf, 2010 (accessed October 3,
2010).
[113] Wikipedia Contributors, Humanitarian response to the 2004 Indian Ocean earthquake.
Wikipedia, The Free Encyclopedia. http://en.wikipedia.org/wiki/Humanitarian_
response_to_the_2004_Indian_Ocean_earthquake, 2010 (accessed October 3, 2010).
[114] M. Perry, Natural disaster management planning: a study of logistics managers
responding to the tsunami, Int. J. Phys. Distrib. Logist. Manag. 37 (2007) 409�433.
[115] R. Oloruntoba, An analysis of the cyclone Larry emergency relief chain: some key
success factors, Int. J. Prod. Econ. 126 (2010) 85�101.
332 Logistics Operations and Management

16Freight-TransportationExternalities
Fatemeh Ranaiefar1 and Amelia Regan2
1Institute of Transportation Studies, University of California,Irvine, CA, USA2Computer Science and Institute of Transportation Studies,University of California, Irvine, CA, USA
16.1 Introduction
Freight transportation is a primary component of all supply-chain and logistics sys-
tems. However, the cost of moving commodities between cities and countries is
borne not only by direct stakeholders (shippers, carriers, or consignees) but also by
other members of society who may not benefit directly from these movements. In
economics literature, this is referred to as the external cost of an activity. Air,
noise, and water pollution; vegetation and wildlife destruction; and road accidents
are some of the negative impacts of freight transportation. Freight movements and
their associated negative impacts have been steadily increasing over the last few
decades in most parts of the world. Negative environmental effects of freight trans-
portation are a serious concern, because of the associated long-term direct and indi-
rect impacts such as increasing greenhouse gases (GHGs) and global warming.
External or social costs of freight transportation have received increased atten-
tion recently in development strategies because of sustainability issues. A widely
accepted definition of sustainable development is “development that meets the
needs of the present without compromising the ability of future generations to meet
their own needs” [1]. Strategies for sustainable transportation consider economic
development, environmental preservation, and social development [2]. But as the
negative impacts of freight transportation increase, achieving sustainability goals
becomes ever more challenging.
In general economic terms, the external costs of a product or service can be a
source of market failure because these occur outside the market. It is desirable to
internalize all costs of transportation, first because the demand-and-supply equilib-
rium will occur at a more sustainable level, and second because providers are more
likely to be more responsible for their decisions and customers will use the services
more efficiently. It is also important for governments to know to what extent stake-
holders cover the costs when designing taxation and regulation policies.
Logistics Operations and Management. DOI: 10.1016/B978-0-12-385202-1.00016-5
© 2011 Elsevier Inc. All rights reserved.

In recent years “greenness” ideas such as green ports, green transportation, and
green logistics have been discussed in the literature to emphasize the environmental
and sustainability aspects of freight transportation. The goal of green logistics is
“planning freight logistics systems that incorporate sustainability goals with a pri-
mary focus on the reduction of environmental externalities” [3]. However, there are
typically trade-offs or even conflicts between environmental and logistics systems
requirements, which makes it hard to achieve both simultaneously [4].
In this chapter, first we investigate different types of freight-transportation
externalities with a focus on road transportation. The results of related studies in
the United States and Europe are presented and compared though consistent
comparison is challenging because of differences in the times and locations of
the studies as well as currency exchange rates and basic assumptions such as the
statistical value of life. Later we present practical policies that have been intro-
duced to reduce these externalities in the United States and some other parts of
the world.
16.2 Freight-Transportation Trends and Costs
Trucks are the dominant mode of inland freight transportation. Based on the latest
available data (2004�2007), 76.2% of freight ton-km transported in Europe [5] and
73.0% of total inland tonnage movements in the United States (28.6% of total
ton-km) [6] was carried by road transportation. In the United States, truck transpor-
tation is growing at 3.5% annually, compared to 2.5% for all vehicles. Trucks now
routinely approach 40% of the traffic mix on certain segments of interstate high-
ways at peak times and are likely to increase in the future. At the same time, truck
accidents and fatalities are a significant and continual public concern [7]. On aver-
age, trucks have higher costs, fuel consumption, and emissions per ton-km of
freight transported than marine and rail modes. The US Federal Highway
Administration report on air quality (2005) reveals that heavy-duty vehicles have
the highest contribution to regional and global emissions: 33% of NOx and 23.3%
of fine particulate matter (PM10) from all mobile source pollutions are produced by
heavy-duty trucks [8]. Therefore, this review has truck transportation as its focus.
To understand, different types of costs in truck transportation we have to classify
the costs and discuss each class separately. In general, there are four nonexclusive
classes of costs in each industry. These are shown in Table 16.1 [9].
Litman [9,10] proposed a detailed cost breakdown for passenger transportation.
Here we present this list with modification for over-the-road freight transportation.
Not all of the categories listed in Table 16.2 have been estimated in the litera-
ture or in practice. Some cannot be easily estimated; even when estimated, the
results might not be homogenous for all studies because of a diversity of cost struc-
tures. Some categories such as the barrier effect are well known to exist but are
hard to estimate because there is no measure to quantify the mobility of nontruck
users in roadways with or without trucks.
334 Logistics Operations and Management

In the SOFTICE [11] project, about 40 major European shippers were surveyed
to identify the main parameters affecting freight cost structure. Drivers’ wages and
fuel cost were identified as the most significant costs factors. For collection and
distribution, truck drivers’ wages are, on average, 50.4% of the total operating cost.
The cost of administration (11.6%), depreciation (10.9%), and fuel (10.3%) are the
next three largest costs. For long-distance haulage, trucks drivers’ wages and fuel
cost are, respectively, 33.0% and 20.4% of total operating cost. These statistics do
not include the external costs, but the study presents simulation results of several
scenarios in which users have to pay the full costs of freight transportation.
External, fixed, long-term, nonmarket, and indirect costs tend to be undervalued by
users. This skews user and society decisions and results in an inefficient and unsus-
tainable transportation systems.
As shown simply in Figure 16.1, the demand for freight transportation might
change if marginal (total) cost increases because of including external costs. D2 is
the quantity demanded, considering full freight-transportation costs as part of the
private total cost, whereas D1 is the quantity-demanded level with only users’
costs. In the next section, we review different classes of external costs related to
freight transportation on roads.
Table 16.1 General Classification of Costs
Cost Class Definition Example
Internal and
external costs
Costs borne by users are internal,
and those borne by others or
society are external costs
Fare: internal
Air pollution: external
Variable and fixed
costs
Short-term costs proportional to
service being used are variable,
but long-run costs not related to
amount of service being used are
fixed costs
Fuel: variable
Insurance: fixed
Market and
nonmarket costs
Market costs involve goods that are
regularly traded in a competitive
market. Nonmarket costs involve
entities that are not regularly
traded in the market
Fuel: market
Noise pollution: nonmarket
Perceived and
actual costs
Costs that the users are aware of and
make an estimation of are
perceived costs, whereas actual
costs include all costs that may be
ignored or underestimated by
users. The greater the difference
between perceived and actual
costs, the less efficient the
system
Expected travel time versus
actual travel time due to
delays in congested traffic
335Freight-Transportation Externalities

16.3 Over-the-Road Freight-Transportation Externalities
Logistics systems have both physical and information infrastructure and regulatory
components. Truck fleets, road network infrastructures, freight terminals, and load-
ing and unloading facilities are the components of physical infrastructure, whereas
communication systems make up the information infrastructure and road traffic
regulations and other related laws comprise the regulatory component. All of these
components affect system performance. The costs mentioned in Table 16.2 can be
categorized by three primary sources: (1) infrastructure development and mainte-
nance, (2) vehicle operations, and (3) system inefficiency or malfunction.
Table 16.2 Freight Transportation Costs Specification
Cost Description E/I V/F M/NM
Vehicle ownership Vehicle expenses that are not proportional to the
distance that the vehicle is driven
I F M
Vehicle operation User expenses that are proportional to vehicle use I V M
Operating subsidies Vehicle expenses not paid by the user E V M
Reliability risk Costs associated with likelihood of delay E V M
Accidents Vehicle accident costs borne by users I V M
Vehicle accident costs not borne by users E V NM
Handling facilities
and terminals
Cost for providing cranes, loaders for loading and
unloading facilities, land for intermodal
terminals
I V M
Terminal costs not borne by users E F M
Congestion Increased delay, vehicle costs, and stress an
additional truck imposes on other road users
E V NM
Road facilities Road construction, maintenance, and operating
expenses not borne by road users
E V M
Roadway land
value
Opportunity cost of land used for roads E F NM
Municipal services Public services devoted to vehicle traffic E V M
Equity/option value Reduced mode options for rural areas E V NM
Air pollution Costs of motor-vehicle emissions E V NM
Noise Costs of motor-vehicle noise E V NM
Resource
consumption
External costs resulting from the consumption of
petroleum and other natural resources
E V NM
Barrier effect The disutility truck traffic imposes on pedestrians
or other vehicles’ mobility. Also called
severance
E V NM
Land-use impact Economic, environmental, and social costs
resulting from developing new facilities,
terminals, and ports
E V NM
Water pollution Water pollution and hydrologic impacts E V NM
Waste disposal External costs from motor-vehicle waste disposal E V NM
E, external cost; F, fixed cost; I, internal cost; M, market cost; NM, nonmarket cost; V, variable cost.
336 Logistics Operations and Management

The first group results in some destruction of the natural environment. Clearly,
however, the infrastructures are shared by both passenger and freight transportation,
and the external costs imposed to society are generated by both types of users. In
addition to the extensive resources required for road building, highway develop-
ment also affect regional land-use patterns because cities tend to develop along
access roads. The pollutants generated from infrastructure maintenance also are a
burden to the environment.
The second source of cost includes extensive environmental and social externali-
ties. Some are directly related to trucking operations, such as air pollution from
engine exhaust, but some are because of the way drivers operate trucks, such as
idling when they could be waiting with their engines off. The US Department of
Energy estimated that more than 25 million barrels a year (.$2 billion) is con-
sumed by trucks idling overnight (about 2% of heavy-vehicle fuel consumption in
the United States). Each individual truck typically idles for about 1830 hours each
year, and idling trucks consume 3157 million gallons of fuel (diesel and gas) each
year. This is 8.5% of total commercial truck fuel consumption [12]. About 34% of
engine run time for long-haul trucks is spent idling, and around 41% of truck dri-
vers do not take any steps to reduce their idle time [13].
The third group of costs relates to inefficiencies or reduced productivity in opera-
tions. This is a topic of interest to both industry analysts and researchers. Increasing
fuel efficiency is a crucial goal. The other issue is empty running. When a vehicle is
traveling empty or with a low load factor, the operating external costs are imposed on
the system with little or no benefit. About 20% and more than 30% of truck trips are
empty flows (these numbers vary by type of truck) in the United States and Europe,
respectively [14,15]. Empty movements are caused by geographical demand imbal-
ances, scheduling constraints, and vehicle incompatibilities. Clearly, not all empty
flows can be eliminated, but communication and scheduling technologies, along with
better management, should lead to a decrease in these nonproductive movements.
MB MSC
Marginal social cost (MSC = MD + MPC)
Marginal benefit (MB)
Marginal private cost (MPC)
Marginal damage (MD)
MPC
MD
D1
Units of good Q
D20
Pri
ce (
$)
Figure 16.1 Economic diagram for freight-transportation demand and cost.
337Freight-Transportation Externalities

The other approach to classify the external costs is by the type of impacts they
have on society as shown in Figure 16.2.
Different methods are used to quantify or estimate the costs of the negative
impacts identified above, although not all of them can be easily measured or esti-
mated. However, where such measurement or estimation is possible, two different
economic approaches are generally applied: average cost estimation and marginal
cost estimation. Marginal cost is the cost to society of one additional unit of freight
transportation. This is a more accurate measure of the cost, but it can require disag-
gregate data to estimate. Such data may be difficult and expensive to acquire. On
the other hand, average cost can be calculated using aggregate data such as number
of fatalities and injuries associated with a unit distance of truck operation, average
load factor, and average cost per ton-km, which are much more likely to be avail-
able to researchers and decision makers. Regardless of the technical approach, there
are three general steps as shown in Figure 16.3.
Estimation of each type of externality requires special consideration. It should
be noted that the monetary value of damages that are related to human health care
or human life are highly dependent on the value of statistical life (VOSL).
Different agencies and countries have different estimations, and they update their
numbers annually based on inflation rates or other factors. This creates challenges
for comparing findings across different studies. Some studies only discuss specific
types of externalities [3,16�20], whereas others try to estimate or review the most
important externalities related to transportation in general or freight transportation
specifically [10,21�29].
16.3.1 Air Pollution
Air pollution causes extensive damage to the environment and society at both the
local and global levels. Local-level effects can be seen on humans and animal
health, in vegetation and crop damage, and in reduced enjoyment of outdoor
Traffic congestionWasted resourcesLonger travel times
Ecosystem destructionGHG increase
Climate change
Air polutionWater polution
Waste productsLoss of green fields
Human healthNoise polutionStressful driving/ visual intrusionAccidents death injuries
Ecological
EnvironmentSocial
Economic
Figure 16.2 Truck-transportation negative impacts.
338 Logistics Operations and Management

activities. Global-level effects are primarily in climate change. Researchers estimate
the social cost of releasing GHGs in the atmosphere separately from air-pollution
costs. As mentioned before, if we want to quantify the environmental externalities
of freight transportation, then we should estimate relevant emissions from the activ-
ities that generate those emissions. Then different damages and related monetary
values should be estimated. This process includes estimation of values that rely on
the existence of required data, an acceptable and efficient data-collection method,
confidence in the quality of the data, and knowledge about the different effects of
emissions. Therefore, all the methods have some degree of uncertainty. Further,
data obtained in a single geographic region are typically not directly applicable to
other regions because of differences in geographic layout and willingness to pay for
mitigation measures (e.g., the greater Los Angeles basin vs. the greater Houston
area). The environmental effects of different types of pollutants are shown in
Table 16.3.
The magnitude of air pollution caused by trucks depends on vehicle characteris-
tics (engine type and condition, fuel type, vehicle age), road characteristics (vehicle
speed, traffic congestion level), and driver behavior (idling, average speed, acceler-
ation profile). Different methodologies have been presented in the literature to esti-
mate the environmental costs of freight transportation [10,22,24,27,31,32].
The Transportation Research Board report Paying Our Way presents a com-
prehensive methodology to calculate marginal external cost of freight transporta-
tion in the United States [27]. A five-step methodology is applied to estimate
the air pollution external marginal cost for four different case studies, including
different types of trucks, origin and destination, length of trip, and type of com-
modity. The steps are (1) estimate change in emissions, (2) resulting change in
ambient air quality, (3) change in exposure of humans and property, (4) physical
effects of the change in exposure, and (5) economic value of the effects. Their
results show the average air-pollution costs for rural and urban areas to be
• What are the detailed activities that generate costs to society or the environment?Define a quantifiable variable that measures a specific externality
Estimate monetary value of damages• How much people are willing to pay to avoid risk of exposure to each damage?
• What is considered damage?• What is the estimation funtion for each type of damage?
Estimate different damages caused by each externality
Figure 16.3 General steps in estimation of freight-transportation externalities.
339Freight-Transportation Externalities

$0.017 and $0.025, respectively, per truckload per kilometer for intercity freight
transportation.1
The European Commission has sponsored a series of studies related to the esti-
mation of the transport air-pollution external cost [17,29,31,32]. Maibach et al. [32]
presented a comprehensive report on the estimation of transport marginal external
costs with case studies in European countries. The bottom-up “impact pathway
approach” [24] is used to estimate the external cost of passenger transport. A pas-
senger car unit (PCU) factor that varies between 2 and 3.5, depending on the type
of freight vehicle, is then applied to estimate freight-transportation’s air-pollution
costs. However, top-down approaches are also discussed. Although the results of
the approaches are similar in terms of their order of magnitude, the bottom-up
approach aims at estimating marginal costs, whereas the top-down approach pro-
duces an average value. The bottom-up approach starts at the microlevel: marginal
costs are estimated from the source of emission via quality changes in the air,
water, and soil. Finally, monetary values of the impacts are estimated. In contrast,
top-down approaches are more aggregate and consider average costs but can ana-
lyze the total market equilibrium when new policies are in effect, such as a modal
shift because of a change in gas prices. Their results show that the average external
1 Original calculations were based on 1995 dollars.
Table 16.3 Environmental Effects of Air Pollution [8,30]
Pollutant Effects
VOC: volatile organic compounds
(mainly hydrocarbons)
Produces ground-level ozone (O3), which leads to
regional smog production and impairs visibility and
alters the taste and smell of air
SO2: sulfur dioxide Formation of acid rain, which can adversely affect
vegetation, buildings, and humans
NOx: nitrogen oxides Produces ground-level ozone (O3), which leads to
regional smog production
Formation of nitric acid (HNO3), which causes paint
deterioration, corrosion, degradation of buildings, and
damage to agricultural crops
Short-term health effects include acute irritation,
neurophysiological dysfunction, and respiratory
problems
Long-term health effects are damage to lung tissue and
possibly lung cancer
PM10: particulate matter (10 μm) Can cause severe health problems
Increases GHG emissions
CO: carbon monoxide CO can form ozone and has direct effect on global
warming when reacting with hydroxyl (OH) radicals
CO2: carbon dioxide Concentration of CO2 increases GHG effects
340 Logistics Operations and Management

cost of air pollution for different types of trucks is between h0.05 and h0.012 per
vehicle-km for urban areas and as much as h0.09 per vehicle-km for interurban
freight transportation.2
Small and Kazimi [20] estimated the health (mortality and morbidity) cost
from particulate matter and ozone for heavy-duty vehicles using what they
termed the direct estimation of damages model. They developed several scenar-
ios based on different statistical values of human life and different levels of
emissions’ impacts on human health. Their baseline scenario results for Los
Angeles estimate the cost at $0.527 per vehicle-mile ($0.327 per vehicle-km),3
which is significantly higher than other estimates in the literature. The authors
attribute this difference to the geographic characteristics of the Los Angeles
basin region, which traps pollutants between mountain barriers that surround the
area.
Forkenbrock [24] took an average from 2233 US counties, using estimates pro-
vided in a range of different studies, and came up with $0.082 per vehicle-mile
($0.051 per vehicle-km).4 His estimate is very low compared with other studies.
16.3.2 Global Climate Change
Although there is no consensus about the precise role of GHG emissions in climate
change, it is clear that the transportation sector is the second greatest source of GHG
(after industrial sources) in the United States [33]. Because CO2 is the dominant
GHG, the impacts of other emissions such as CH4, CO, and NO2 are also calculated
based on CO2 equivalent factors. The uncertainty of different cost-estimation methods
associated with damages from truck GHG emissions is very high because of a wide
potential range of GHG impacts that can be included in the models, the intensive data
requirements for quantifying them, and exogenous variables used to estimate global
effects. Thus, many researchers propose lower and upper bounds rather than a single
marginal value or average cost per unit. Apart from the different impacts and range of
GHGs included in a model, considering the emissions from the complete life cycle of
freight-transportation activities or only from tailpipe emissions results in significant
variation in final estimations.
ExternE [31] proposed two complementary methods. The first one is a bottom-up
approach that estimates damage costs from the impacts of climate change. The second
one is based on the avoidance costs. These avoidance costs are estimated as an equiv-
alent for the preferences followed when focusing on a target policy (i.e., based on the
motivation to follow the path to sustainable development). The latter approach is
mainly developed for measuring the Kyoto Protocol target, which is an 8% reduction
in GHG emissions by 2012, compared to 1990 for the European Union (EU) as a
whole.
2 Based on 2000 prices.3 Based on 1992 prices using a $4.87 million value of life.4 Based on 1994 prices using a $2.9 million value of life.
341Freight-Transportation Externalities

The first approach is fairly complicated and uses the Climate Framework for
Uncertainty, Negotiation, and Distribution (FUND), and it is done separately for
CO2, CH4, and NO2. Impacts of climate change with energy consumption, agricul-
ture, coastal zones, forestry, unmanaged ecosystems, water resources, malaria and
dengue fever, and cardiovascular health are estimated separately or reviewed from
other sources. Their final estimation is h5�20 per ton of CO2 equivalent.
Maibach et al. [32] also recommended using an avoidance cost method to reduce
the uncertainties associated with assessing climate damage costs. He proposed that
the marginal cost of GHG emissions can be present based on a fuel-consumption
rate for each class of vehicles, including trucks. He concluded that the long-term
external cost of GHG emissions is an increasing function starting from h20 per ton
of CO2 in 2010 to h85 per ton of CO2 in 2050.
Delucchi and McCubbin [23] estimated the cost of GHG emission for the entire life
cycle of freight transportation, including a wide range of GHGs, as $0.0003�0.0274
per ton-mile ($0.0002�0.0188 per ton-km) using 2006 prices.
Forkenbrock [24] considered only CO2 as the main GHG related to trucking. He
estimated the social cost of GHG emission from truck transportation based on an
initial set of assumptions as follows: one gallon of diesel fuel releases 22.8 pounds
of CO2, the minimum cost of releasing CO2 to the atmosphere for society is $10
per ton of CO2, the average fuel efficiency for long-haul trucks is 5.2 miles per gal-
lon, and the average payload is 14.8 tons5 per vehicle-mile. He concluded that
the cost of GHG emissions from truck transportation is $0.15 per ton-mile ($0.10
per ton-km).
16.3.3 Noise Pollution
Noise pollution is more of a concern in urban than rural transportation systems.
Some studies even assume external costs of zero for noise pollution in rural areas
[27]. Medium to heavy trucks are 10�18 decibels (dB) louder than passenger cars
[27]. Truck noise is annoying to residents and pedestrians. Therefore, truck opera-
tions during evening and night hours are restricted or prohibited in some areas.
Transport noise above a threshold can increase or cause health problems such as
changes in heartbeat frequency, increases in blood pressure, hormonal changes, and
sleeping problems. The external costs of noise pollution have been studied exten-
sively in Europe and the United States [10,27,29,31,32].
The external cost of noise is mainly reflected in property values when people
are less willing to pay for areas near highways. However, this is independent from
the health-related costs of noise pollution.
The level of truck noise pollution is influenced by several factors such as vehi-
cle speeds, traffic flow (free flow vs. stop and go), road surfaces, weather, and
vehicle type and conditions. The index used for noise is the energy mean sound
5 An American ton is a short ton, which is 0.90718474 metric ton. Thus, the American 1 ton-mile is
1.45997231821056 ton-km.
342 Logistics Operations and Management

level, [dB(A)6]. It gives the average sound level over a given period. Noise has a
logarithmic relationship with traffic volume. This means that marginal noise pollu-
tion decreases as traffic flow increases. In other words, if the current traffic is
medium to high, then the marginal noise pollution is small and probably below
average, but in low traffic the marginal level can be much higher than average.
Time of day, population density exposed to the pollution, and existing noise level
are the main drivers of noise cost [32]. Noise levels also decrease with an almost
linear relationship with distance from the source. At about 1000 ft (0.3048 km)
from the highway, the noise level reaches the background level [27].
In the United States, the first noise-estimation models were developed by the
Federal Highway Administration (FHWA) and the National Cooperative Highway
Research Program in the late 1960s. The most common model for vehicle traffic is
the FHWA’s software TNM 2.5 model. Haling and Cohen [16] provide a review of
noise-estimation and -prediction models. They also estimate the noise cost pro-
duced by trucks of different sizes and carrying different loads using a hedonic price
method. This method is based on the reduction of property values caused by vehi-
cle noise emissions. In a hedonic price technique, the actual value of a residential
property is dependent on both the physical characteristics of the property and envi-
ronmental attributes such as pollution levels. Their results show a large variation of
noise cost, depending on the type of vehicle, operating conditions, and location
of the roadway in relation to residential areas. Haling and Cohen present the results
of their estimation by truck type (number of axles and weight), traffic volume, and
land development type (urban, rural). Each category is then classified by vehicle
speed. The cost estimations vary from 0 to $0.1148 per vehicle-mile ($0.0713 per
vehicle-km) in 1993 prices. Mayeres et al. [34] also used the same technique and
applied it for Brussels with classification in the results. They estimated that the
marginal cost of noise pollution in Brussels is h0.014 per vehicle-km during peak
hours and h0.058 per vehicle-km during off-peak hours (using 2005 prices).
The European Commission studies used two approaches (marginal value and
average value) to estimate the noise cost. The extensive report, ExternE [31], pro-
vides an estimate of the marginal cost of noise pollution. The noise costs for two
simulated scenarios in which one has an additional vehicle are calculated. The sec-
ond approach is based on willingness to pay to have a more quiet environment.
This amount is then multiplied by the number of people exposed to the noise. This
approach allows us to calculate the average cost of noise pollution. As mentioned
before, in moderate traffic the marginal and average costs of noise are approxi-
mately the same, whereas in uncongested or heavily congested situations these
costs can be very far apart. Nash [29] estimates that the noise cost of heavy good
vehicles (HGVs) for daytime versus nighttime and urban versus rural separately.
The daytime cost is between h0.08 and h0.26, and the nighttime cost is between
6 “This index has a logarithmic scale, reflecting the logarithmic manner in which the human ear responds
to sound pressure. Since the human ear is also more sensitive at some frequencies than at others, a fre-
quency weighting is applied to measurements and calculations. The most common frequency weighting
is the ‘A weighting,’ hence the use of dB(A)” [32].
343Freight-Transportation Externalities

h0.23 and h0.78 per vehicle-km for urban areas and the upper bound of
h0.03�0.05 per vehicle-km for daytime and nighttime for interurban areas.
16.3.4 Congestion
External congestion costs are experienced by all system users because of the entrance
of one additional user into the system when the system is approaching or exceeding
capacity. There are two types of congestion costs. The first refers to the delay
imposed by one vehicle on another (flow congestion), and the second refers to one
vehicle preventing another from gaining access to the network. The other impact of
congestion is a significant increase in pollution because of speed reduction. A detailed
review of different types of congestion costs is presented in Maibach et al. [32].
Flow congestion is usually described and measured in the literature using speed-
flow diagrams. This represents the relationship between congestion and travel time,
which is not a linear function. Thus, on a congested road, a small decrease in traffic
volume results in a relatively large decrease in delays. On the other hand, the larger
the vehicle is, the greater its contribution to congestion. Trucks can have 1.5�2.5
times the impact on congestion that passenger cars have, depending on the roadway
conditions because they require more road space and are slower to accelerate [35].
Litman [10] did a comprehensive literature review of transport congestion costs
and compared the results of different studies in the United States and Canada.
Maibach et al. [32] also reviewed different methods of estimation and internaliza-
tion of congestion costs and present empirical results for European countries.
The common microsimulation procedure to calculate the marginal contribution
of trucks to transport congestion cost is to calculate the difference in speed of other
vehicles when a truck is added to the traffic flow [29,34]. Nash [29] estimated the
congestion cost of HGVs at between h0.02 and h0.09 per vehicle-km for urban
areas and h0.09�0.13 per vehicle-km for interurban areas.
16.3.5 Accidents
The US National Highway Traffic Safety Administration (NHTSA) system [36]
reported that in 2008, large trucks were involved in 21.1% of fatal accidents, 4.7% of
injury crashes, and 7.8% of crashes with only property damage. Light trucks, which
includes many passenger vehicles (SUVs, vans, minivans, and so on in addition to
package delivery and utility vehicles), were involved in 60.3%, 59.9%, and 63.1% of
fatal accidents, injury crashes, and property-damage-only crashes, respectively.
Each accident has a monetary and nonmomentary cost. The monetary cost of acci-
dents is paid by affected road users, so these are viewed as internal costs, including
automobile insurance and medical and emergency service. However, the nonmonetary
costs, including increased travel time and emissions, are borne by the larger society,
and some individuals who are not beneficiaries of the transportation system bear the
loss of family members or long-term pain from injuries. Estimation of the monetary
value of the costs caused by freight trucks requires access to accident records that detail
the role of trucks in accidents, information that is not generally readily available [24].
344 Logistics Operations and Management

The cost of an accident can be viewed as the amount of money that people
would pay to reduce the risk of that type of accident. Making this calculation is
highly dependent on the availability of appropriate data. The first step is to measure
accident rates. There are two typical approaches used to measure accident rates.
The first approach uses accident records directly and calculates the accident rate
per vehicle distance traveled [19,23,25,29]. The second approach is to estimate
accident rates as function of traffic volume [27,29,34]. Other factors also affect the
rate of accidents, such as road conditions, weather, and time of day, but it is almost
impossible to incorporate them because of expensive data-collection issues.
The next step is to measure the cost associated with each type of accident.
Lindberg [19] divided the cost of an accident into direct and indirect parts. The
direct part is the tangible cost in the present or future, whereas the indirect one is
the lost production capacity resulted from losing a member of society. The estima-
tion of the indirect cost depends on the structure of the society, but Lindberg esti-
mated the indirect cost as a percentage of VOSL for some European countries: 8%
of VOSL for fatal accidents and 20% of VOSL for injury accidents. He also esti-
mated an extra external cost of an accident to the relatives and friends of the person
who suffered from the accident at 40% of VOSL.
Lindberg [19] reviewed two case studies to find out if the external accident cost
increases with axle weight or not. In other words, is the accident rate for HGVs dif-
ferent from other road users? Do the characteristics of the accidents in which HGVs
are involved differ significantly from other accidents? He defined three accident-
risk measures to compare HGV and light-vehicle accidents: number of accidents
per 1000 vehicles, number of accident per million vehicle-kilometers, and average
proportion of internal cost to total cost of the accident. He concluded that there is
no conclusive evidence on the relationship between truck configuration and
accident risk. In a given traffic flow of other vehicles, the total number of accidents
increases at a decreasing rate. The number of accidents per 1000 vehicles also
strictly increases with increases in vehicle weight class in all case studies. However,
the accident risk per vehicle-kilometer does not show a consistent pattern. The risk
per kilometer for light vehicles is more than 3 times that of the heavy vehicles. This
might be because of differences in the type of exposure as heavier vehicles operate
less in urban areas. The ratio of internal cost of the accident to the total cost is
between 0.03 (for the lightest vehicles) and 0.38 (for the heaviest vehicles) for the
different weight classes, but it does not show a clear trend as vehicle weight
increases.
Delucchi and McCubbin [23] estimated the external cost of an accident at
between $0.1 and $2.0 per ton-mile ($0.07�1.37 per ton-km) using 1991 US data.
These lower and upper bounds are related to assumptions regarding the fraction of
accident costs internalized by insurance liability premiums. Forkenbrock [24] esti-
mated the cost at $0.0059 per ton-mile ($0.0040 per ton-km) using 1994 US data.
The Transportation Research Board [27] estimated the marginal cost of accidents
by examining six representative case studies. Within each case study, researchers
presented their estimations for urban and rural areas separately. However, they did
not arrive at any general conclusions about the difference of accident costs in rural
345Freight-Transportation Externalities

and urban areas. Some case studies have higher cost in rural areas, and others have
higher costs in urban areas. The average estimation across the different case studies
is $0.0051 per ton-mile7 (0.0035 per ton-km) using 1996 dollars. Some of the esti-
mations from these studies differ by as much as an order of magnitude, making
comparison and general conclusions difficult.
16.3.6 Construction and Maintenance
External cost of construction and maintenance of transportation facilities such as
roads, bridges, tunnels, and terminals; the manufacturing of vehicles; and fuel pro-
vision, which requires petroleum exploration, refining, and distribution of fuel are
often ignored as a source of cost borne by society. Dredging, landfilling, and clear-
ing land for large freight terminals have significant environmental impacts, espe-
cially with respect to local wildlife [3].
It is very important how infrastructure costs are allocated between heavy and
light vehicles. Litman [10] cited a study in Canada in 1994 in which trucks
imposed an average marginal infrastructure cost of US$0.51 per ton-km. Heavy
trucks make up only about 9% of Canadian vehicle traffic, but they account for
about 25% of roadway costs.
The indirect emissions produced to facilitate road freight transportation are con-
sidered as part of the environmental life-cycle assessment (LCA) of freight trans-
portation. The result of freight-transportation LCA in the United States
demonstrates that significant emissions are produced outside the operational phase
[18]. “In fact the majority of emissions of PM10, SO2, CO, and Pb are found to
occur outside the operational phase for road freight transportation. In particular,
PM10 and SO2 are found to have significant emissions associated with infrastruc-
ture, comprising approximately 75% and 20% of the life-cycle emissions, respec-
tively” [37]. Heavy trucks also cause most of the damage to road pavements
because of the exponential relationship between one extra axle load and pavement
damage. The American Association of State Highway and Transportation Officials
(AASHTO) [38] estimated this effect roughly as the fourth power rule, which indi-
cates that road damage is proportionate to axle weight raised to the power four.
16.4 Policies to Reduce Externalities
Clearly, no single policy can compensate for all externalities. Each group of strate-
gies focuses on certain aspect of external costs, but the common goal is to either
reduce truck travel or increase efficiency of the transportation system. If that can
be done, then the total cost will be reduced because external costs are included in
variable operations cost. User charges should be applied to the source of an exter-
nality to have maximum economic efficiency. Murphy and Poist [39] identified the
7 Assuming, on average, 14.8 tons transported per vehicle.
346 Logistics Operations and Management

following strategies that could be employed by firms to manage and respond to
environmental issues related to freight transportation and logistics:
� Reduce consumption whenever possible� Reuse materials whenever possible� Recycle materials whenever possible� Redesign logistical system components for greater environmental efficiency� Reject suppliers who lack environmental concerns� Increase the education and training of company personnel� Encourage greater governmental involvement and regulation� Publicize environmental efforts and accomplishments� Promote industry cooperative efforts� Conduct environmental audits� Use outside or third parties to manage environmental issues� Hire and promote environmentally conscious personnel
Policies for reducing freight-transportation externalities can be divided into two
groups based on the level of their decision makers. At lower levels firms, manufac-
turers, and trucking companies can implement different policies to reduce the exter-
nal costs of freight transportation. At the higher levels, local or national
government policies can provide incentives or penalties for lower-level participants
to behave in a more sustainable manner. Yano and Katsuhiko [40] listed some of
these policies as follows:
� Shift from truck to rail or ships� Shift from private trucks to for hire trucks� Promote efficient delivery schedules� Use back hauling� Reconsider delivery routes based on real-time traffic conditions� Promote cooperative deliveries� Drive with ecology in mind (e.g., reduce idling or maintain constant speed)� Reconsider locating distribution centers to decrease delivery distances� Decrease the number of deliveries by reconsidering lot size or delivery frequency� Change to larger trucks� Introduce environmentally friendly trucks
In this section, we will discuss these policies in more detail.
16.4.1 Urban Freight Strategies
The economic success of a city depends on the efficient movement of goods and
services as well as people. The main purpose of urban freight transport is the distri-
bution of goods at the end of the supply chain to the final users, thus many smaller
deliveries are made with high frequency.
The environmental impacts of freight movements are more problematic in urban
areas than in rural ones. Urban areas are affected more by negative impacts of
freight transportation, because quality of life in urban areas is more vulnerable.
External costs of public health impacts because of emissions, injuries, and death
caused by accidents, noise pollution, and visual intrusion are much higher in cities.
347Freight-Transportation Externalities

There are two groups of solutions to reduce external costs of urban freight trans-
portation: (1) government policies and regulations and (2) company initiatives [21].
In practice, it is necessary to apply both to get desired advantages. Some potential
solutions for reducing urban freight external costs are shown in Table 16.4.
16.4.2 Vehicle-Technology Improvements
New and tightened standards to regulate pollutants (carbon monoxide, hydrocar-
bons, oxides of nitrogen, and particulate matter) have forced heavy vehicle manu-
facturers to improve vehicle designs to be less destructive to the environment.
Table 16.5 classifies different technology improvements in trucks with respect to
different external costs.
A detailed investigation of truck technology development is beyond the scope of
this study, but making new technologies economical for carriers is a critical way to
reduce the external cost of emissions and noise.
16.4.3 Intelligent Transportation Systems
Information technologies and intelligent transportation systems (ITSs) offer some
promise for reducing freight transportation’s external costs. Intelligent freight trans-
portation uses advanced technologies and intelligent decision making to make
existing infrastructure for freight transportation more efficient [41]. ITS has two
key elements: intelligence and integration. The first is characterized by knowledge
discovery made possible by better access to data and advanced data-analysis techni-
ques, and the second by an understanding of how to use that data to manage the
elements of the system more efficiently. Freight ITS benefits from reduced delay
and congestion costs because of the development of integrated systems [42].
Containerized cargo is the main focus in some intelligent freight transportation
because it reduces handling cost and loading and unloading time, increases storage
efficiency, and increases average payloads [43].
Crainic et al. [44] reviewed freight ITS, including advances in two-way commu-
nication, location and tracking devices, electronic data interchange (EDI), advanced
planning, and operation decision-support systems and classified them into two
groups: commercial vehicle operations (CVO) and advanced fleet management sys-
tems (AFMS). The first group includes systemwide, regional, national, or continen-
tal applications, and the second group is more concerned about the operations of a
particular firm or group of firms. Both groups require e-business activities to be
partially integrated across firms, and both are the result of adopting EDI in freight
transportation. EDI is a two-way communication and vehicle and cargo location
and tracking technology. Of course, the original motivation for development of
these technologies was not reducing externalities but increasing the efficiency of
the freight-transportation system, which can indirectly decrease externalities.
348 Logistics Operations and Management

Table 16.4 Solutions for Reducing External Costs of Urban Transportation
Solution Challenges Benefits
Out-of-hours delivery Staffing Reduced congestion
Quality control Increased access to curbsides
Noise
Security
Increased costs resulting from
longer operating hours
Parking and maneuvering for
other vehicles in congested
area during daytime
Reduced accidents
Consolidation and
transshipment
centers
Large land required with good
location and access to multiple
transport modes
Sufficient handling facilities
required and high initial
investment and operating cost
Not applicable for all types of
goods (highly perishable,
hazardous, high security)
Increased air and noise pollution
in area adjacent to terminal
Reduced VMT/VKT will
reduce emissions, pollution,
accidents, and congestion
levels
Increased load factors will
increase efficiency
Reduced emissions result from
increased use of rail mode
Cooperative
operation of
private sector (city
logistics) [41]
Hard to mange
Requires cooperation among
retailers and logistics
companies rather than normal
competition
Requires higher level of logistics
control in supply chain
High initial investment
Avoids duplication and
inefficiencies
Reduces total operation cost
Reduced VMT/VKT reduces
emission, pollution,
accidents, and congestion
Improve operational
efficiency
Increase load factors (vehicle
size, shipment size)
Increase fuel efficiency
Using routing and scheduling
software
Improve economic efficiency
or increase market share by
being more environmentally
responsible
Improve collection and delivery
system (material handling
technology, unitization of
loads, coordination between
shipper, carrier, customer)
Using effective in-vehicle
communication systems
349Freight-Transportation Externalities

16.4.4 Pricing Strategies
Efficient pricing is very important for sustainable freight transport. Underpricing
has long-term effects on land-use patterns and commodity movements. Pricing
strategies have been suggested or implemented in some countries in the form of
extra fuel taxes or road tolls for trucks [11]. Fair pricing strategies require a reason-
able estimation of the external costs generated by different users. The average cost
and marginal cost approaches discussed in previous sections affect the magnitude
of pricing strategies, especially in cases with high variation between marginal and
average costs such as noise pollution. The significant concern used to justify
increasing prices is equity. Equity becomes a very important issue when the extra
revenue generated by such strategies is to be allocated. If the revenues are used to
compensate for the harm caused by freight transportation, then equity is increased.
But if the revenue is spent on roadway development or new freight terminals’
buildings and equipment, then the equity is decreased.
Nonpricing strategies such as increasing fuel efficiency might lead to increase
other environmental externalities because of so-called “rebound effect” of fuel effi-
ciency. For example, increasing fuel efficiency makes operation costs cheaper so
idle engine or empty truck flows might increase [45].
Fuel Taxes
Fuel taxes are the most common pricing strategy to internalize freight-transportation
externalities. However, this is not the most effective strategy because higher fuel
prices do not affect the time of travel, routing, or commodity flow distribution or
provide incentives for trucking companies to buy low-pollutant trucks or encourage
industries to make their supply chains more efficient. Because of the low elasticity
of freight-transportation demand to fuel prices, increasing fuel taxes in the long run
probably will not reduce congestion, accidents, or noise and air pollution. The other
issue is the international transport or transit flows that allow external cost spillovers
to other regions. In transportation systems such as the United States or Europe,
where different tax rates are implemented in neighboring regions, it is well known
Table 16.5 Technological Improvements to Reduce External Costs
External Cost Technology Improvement
Noise Reduction of engine noise
Air brake silencers
Reduced exhaust noise levels
Better body design
Safety and accident Better brakes
Emission Reduction of exhaust emissions
Alternative fuels
Energy efficiency Larger vehicles
350 Logistics Operations and Management

that drivers fill their tanks in the lower tax-rate region before crossing into the higher
tax regions. De Borger et al. [46] investigate the potential of tax competition
between regions in this situation and present a model for the second-best solution
considering the externalities spillover. However, they also analyzed the implication
of price discrimination between domestic and international transport on a regional
territory and concluded that the optimum tax level depends on the presence or
absence of possible discrimination between domestic and international flows. De
Borger et al. did not solve their model empirically, but Parry [47] estimated that the
optimal (second-best) diesel fuel tax is $1.12 per gallon in the United States.
In Europe, fuel tax is the main policy to internalize external costs of road freight
transport, which is roughly estimated as h0.26 per vehicle-km. However, the degree
of internalization varies from 30% in Poland, Greece, and Luxembourg to 88% in
England [48].
Congestion Pricing
Congestion pricing or dynamic road pricing based on traffic congestion can
also internalize congestion costs but not other externalities such as pollution
and accidents. However, less congestion on roadways will indirectly reduce
pollution and the number of accidents. There are two approaches for congestion
pricing in the literature. These are referred to as the first-best and second-best
solutions. The first-best policy for a congested road network applies tolls equal
to marginal external costs on each individual link. This approach has limita-
tions in practice because of the implementation and monitoring cost of each
toll point. However, it is often used as a theoretical benchmark. In the second-
best solution, tolls are set for a subset of links in the network only. Tolls can
be set on lanes or cordons. The objective is to maximize social welfare given
some set of constraints—for example, on a number of toll points. The resulting
policy, which is not the best efficient solution, is called the second-best
policy [49].
The main goals for tolling are demand reduction, traffic allocation, and revenue
generation, so it is important to study the impacts of different tolling regimes.
Time-varying versus static road pricing is one of the aspects of these regimes. The
trade-offs are between the costs, revenue, and network efficiency. Dynamic toll
pricing tends to generate higher revenue and improved network efficiency but has
higher operating and infrastructure costs than static pricing. De Palma et al. [50]
studied different models of road pricing, including flat rate (time-independent toll-
ing), fine tolling (tolls vary over time), and step tolling (a base toll for off-peak
time and an extra toll during peak hours) and concluded that time-varying tolls will
increase the efficiency of a network.
Kleist and Doll [51] studied the impacts of tolling for HGVs by analyzing the
change in the behavior of freight-transportation actors (shippers, carriers and for-
warders, and consignees). They found that carriers may (1) shift to secondary
roads, (2) shift to more cost-effective vehicles, or (3) improve their productivity.
The first impact is a negative consequence of tolling, because “secondary roads
351Freight-Transportation Externalities

are usually more sensitive to pavement degradation, congestion, environmental
and noise pollution than the highways.” The second impact is ambiguous. Carriers
may switch to lighter vehicles to pay fewer or no tolls or to heavier vehicles
because they tend to be more cost-effective. The third impact is the best result of
tolling because some carriers may decrease their vehicle-miles (or -kilometers)
traveled (VMT or VKT) by improving routing plans to reduce empty travel or by
increasing load factors. It also encourages firms to merge in order to access larger
markets as well as load and vehicle pooling. Shippers and consignees may also
react in two different ways to increases in transport costs: (1) reducing the quan-
tity of shipments and (2) reducing travel distances. These are possible through
relocation of the firms, suppliers, or consignees and in-house production instead of
purchased goods. As the transportation cost is very small compared to production
cost, tolling HGV usually does not affect shipper or consignees behavior signifi-
cantly. Kleist and Doll also comprehensively studied the relative influence of dif-
ferent HGV tolling schemes on the economy and on freight-transport flows for
interurban goods movement with a microsimulation model and a four-step travel
demand model across all of Europe. The toll rates were set to between h0.13 and
h0.20 per km for all or some European highways. They estimated that 5�25% of
HGV traffic would shift from highways to secondary roads under different scenar-
ios. The modal shift was estimated to be insignificant after road tolling (less than
1% of total market share), but the impacts were highly dependent on commodity
type and trip distance. Unitized goods show the maximum modal shift toward rail
transport for long hauls because of how easily these can be transferred. Further,
their study found that the average load factor increased between 0.2% and 1.8%
for various commodities in different scenarios.
16.4.5 Intermodal Transportation
Intermodal freight terminals provide opportunities to consolidate loads from at least
two modes before these loads are delivered to customers. These terminals are usu-
ally dominated by trucks as the primary mode, connecting to either rail transporta-
tion or waterways. Because the loads are consolidated and shifted to modes other
than truck, intermodal transports are more sustainable and have less external costs
than single-truck load transportation.
Janic [26] proposed a framework to compare the full cost of intermodal and road
freight transportation. He applied the model in European intermodal rail�truck
transport and to an equivalent road freight transport network using EU data. The
results show that although intermodal network has an economies-of-scale property
(the average full costs decrease at a decreasing rate as the quantity of loads rises),
the road network has a constant return to scale. Intermodal networks also have
greater economies of distance than road networks. In other words, the full costs of
both networks decrease more than proportionally as door-to-door distances increase,
but the rate is greater for intermodal networks.
Janic’s [26] study suggests,
352 Logistics Operations and Management

If the full costs are to be used as the main basis for pricing, the breakeven distance
will increase for intermodal transport and thus push it to compete in longer dis-
tance markets, with increasingly diminishing demand. However, intermodal trans-
port can neutralize the effects of the higher prices associated with internalizing by
increasing the service frequencies in medium-distance markets (around
600�900 km) to meet the large demand there. (p. 43)
However, despite an increasing awareness among policy makers about the benefits
of intermodal transportation, the highest estimated share of intermodal transportation
in Europe is only 10% [28]. The numbers in the United States are no higher. This poor
market share does not create incentives for transportation planners or policy makers to
allocate large investments of public funds for required intermodal infrastructures.
Ricci and Black [28] reviewed the factors that lead to inefficiencies in intermodal
freight transportation in Europe and propose innovative policies and incentives to
increase the market share and hence the productivity of intermodal facilities. They
also break down the activities in an intermodal chain into 11 groups and discuss exter-
nal and internal costs associated with each set of activities. The external costs of inter-
modal transport are generated by the movement of vehicles (locomotives, wagons,
trains, trucks, barges, ships) or by the use of machinery and equipment to physically
transship from one vehicle to another similar vehicle of the same mode or various
modes. Calculating the marginal cost of externalities requires an integrated accounting
system and may highly vary across the regions because of various parameters includ-
ing efficiency of operations, load factors, average length of a journey leg, characteris-
tics of the journey leg (e.g., average speed) and the scale of movements (economies of
scale) [28]. They used the ExternE [31] methodology to calculate the external costs of
intermodal transport for three major European corridors and compared it with all-road
transport. On average, for transporting a 40-ft container, the marginal external costs of
all-road transport is 2�3 times higher than intermodal transport.
16.4.6 Strategies to Reduce Empty Travel
As mentioned earlier, between 20% and 30% of truck travel involves repositioning
empty vehicles. The associated external costs of empty travel are borne by society,
whereas carriers (directly) and shippers and consignees (indirectly) pay for opera-
tional costs without gaining any direct benefits. Thus, there are incentives for all
participants in freight transportation to reduce empty running vehicles. Empty
movements or very low load factors result mainly from the imbalance of flows
between different regions. However, as the average length of journey increases, the
load factors and back loading tend to be higher because operators have stronger
incentives to find return loads and consolidate loads. McKinnon and Ge [15] dis-
cussed the factors that constrain back loading practically:
� Lack of coordination between purchasing and logistics departments� Unreliability of collection and delivery operations� Priority given to the outbound delivery service� Inadequate knowledge of available loads
353Freight-Transportation Externalities

� Incompatibility of vehicles and products� Resource constraints
Despite the above constraints, decreasing empty running is still possible, and it
is an effective way to reduce the external cost of freight transportation. As an
example, the empty kilometers traveled by HGVs in England decreased from
33.7% of total truck VMT in 1973 to 26.5% in 2003, while average load factors
remained almost stable during most of the period [15]. This change occurred gradu-
ally over three decades, but considering the growth in road freight movement, this
reduction is equal to saving d1.3 billion in total road freight-transportation cost and
not emitting 1.1 million tons of CO2 into the atmosphere by trucks in 2003.
McKinnon and Ge [15] investigated the reasons that led to this reduction and con-
cluded that the following changes were effective in declining empty running:
� Outsourcing of road haulage operations from in-house to third-party transport� Increasing geographical balance in traffic flow through wider sourcing of commodities,
centralization of production and inventory, and greater regional specialization� Increasing the average length of haulage� Increasing the direct costs of traveling (fuel, labor) per kilometer� Increasing the average number of stops (for collection or delivery) per trip� Developing reverse logistics (packaging waste, handling equipment and product into
existing logistics networks)� Developing load-matching services through online freight-exchange data sources� Adopting new management initiatives
From the preceding list, we can conclude that reducing operational costs is the
main incentive for reducing empty distances traveled by trucks. Thus, if the actors
in freight transportation (shippers, carriers, and consignees) have to pay the true
cost of their actions, they will increase their performance and efficiency.
16.5 Conclusion
The intent of this study is to review the social costs of freight transportation and
the policies being used to reduce these costs. Identifying sources of externalities in
logistics systems is very important. First, these costs are nonmarket costs and can
lead to market failure. Second, although the users do not pay for these costs, they
are sources of inefficiency in the system; they cause damage to society and envi-
ronment without creating any benefit. Third, in general, reducing externalities will
increase the sustainability of the system. Finally, users can increase their long-term
benefits by reducing external costs.
We focused on freight transported by trucks because trucks carry the highest
share of goods (in ton-kilometer) relative to other transportation modes while having
the highest external costs as well. Predictions for the future in United States and
Europe are that this mode share will remain essentially unchanged in the future.
We categorized external costs of freight transportation based on their impacts in
four groups, namely social, economic, environmental, and ecological. We reviewed
354 Logistics Operations and Management

Table 16.6 Summary of Freight Transportation External Costs from Different Studies
Cost Study
Forkenbrock [24] Beuthe [22] Paying Our Way [27] ExternE [31] UNITE [29] Delucchi [23]
Base year prices 1994 1995 1996 2000 2003 2006
Method Average Marginal Marginal Marginal Marginal Average
Unit $ct/ton-km hct/ton-km $ct/v.km hct/v.km hct/v.km $ct/ton-km
Congestion — 2.108 1.528�4.207 1.05�3.15 2.0�13.0 0.370
Accident 0.404 0.937 5.477�13.414 0.09�17.05 0.084 0.075�1.370
Air pollution 0.055 1.82 1.650�2.069 2.05�28.9 2.09�17.52 0.068�12.88
Climate change 0.103 — — 1.425�2.05 2.0�3.28 0.014�4.041
Noise pollution 0.027 0.665 0.0�4.039 0.06�30.98 0.0�78.25 0.0�3.630
Water pollution — — — 1.05 — 0.021�0.034
Energy security — — 0.444�0.888 — — 0.151�0.576
Infrastructure 0.171 0.204 11.00�14.919 — 3.62�5.17 —
Total 0.76 5.734 20.099�39.536 5.725�83.18 9.794�117.304 0.329�22.459
355
Freig
ht-T
ransportatio
nExtern
alities

the literature for different estimation methods. Not all of the negative impacts of
freight transportation have been quantified and estimated in previous literature,
because of data availability constrains and the cost of gathering required data. The
major costs include congestion, accidents, air pollution, climate change, noise pol-
lution, and construction and maintenance of infrastructures. Water-pollution and
energy-security costs are also reviewed in some studies, but we did not discuss
them here. Table 16.6 presents a summary of estimations from some of the
reviewed studies. Note that the initial assumptions of these studies are not the
same, which explains part of the differences in the results. The results are presented
directly from the original studies without any adjustment for currency or discount
rate for different years.
Acknowledgments
We would like to thank Professor Kenneth Small for his helpful comments and suggestions
on our work. Any errors or omissions are, of course, solely the responsibility of the authors.
References
[1] National Research Council (U.S.), Policy Division, Board on Sustainable Development,
Our Common Journey: A Transition Toward Sustainability, National Academy Press,
Washington, DC, 1999. p. 23.
[2] C.M. Jeon, A. Amekudzi, Addressing sustainability in transportation systems: defini-
tions, indicators and metrics, J. Infrastruct. Sys. 11 (2005) 31�50.
[3] N. Sathaye, Y. Li, A. Horvath, S. Madanat, The Environmental Impacts of Logistics
Systems and Options for Mitigation, University of California, Berkeley, CA,
2006UCB-ITS-VWP-2006-4.
[4] J.P. Rodrigue, B. Slack, C. Comtois, Green Logistics, in: A. Brewer, K.J. Button,
D. Hensher (Eds.), Handbook of Logistics and Supply Chain Management,
Pergamon, Amsterdam, 2001.
[5] Eurostat, Online. http://epp.eurostat.ec.europa.eu/portal/page/portal/product_details/
dataset?p_product_code5TSDTR220, cited August 12, 2010.
[6] U.S. Department of Transportation. National Transportation Statistics, Online. http://
www.bts.gov/publications/national_transportation_statistics/, cited August 15, 2010.
[7] Transportation Research Board, Freight Transportation Research Needs Statements,
TRB, Washington, DC, 2002.
[8] J. Ang-Olson, S. Ostria, Assessing the Effects of Freight Movement on Air Quality at
the National and Regional Level, Office of Natural and Human Environment, U.S.
Federal Highway Administration, Washington, DC, 2005.
[9] T. Litman, Transportation Cost Analysis for Sustainability, Victoria Transport Policy
Institute, Victoria, BC, 1999.
[10] T.A. Litman, Transportation Cost and Benefit Analysis Techniques, Estimates and
Implications, Second ed., Victoria Transport Policy Institute, Victoria, BC, 2010. Cited
online: September 15, 2010. http://www.vtpi.org/tca/
356 Logistics Operations and Management

[11] A. Musso, Survey on Freight Transport Including a Cost Comparison for Europe
(SOFTICE), European Commission, 1999.
[12] L. Gaines, T. Levinson, Clean Cities Program: Idle Reduction, U.S. Department of
Energy, 2009. Cited online: June 27, 2010. http://www1.eere.energy.gov/cleancities/
pdfs/idle_reduction.pdf.
[13] N. Lutsey, C.J. Brodrick, D. Sperling, C. Oglesby, Heavy-duty truck idling characteris-
tics: results from a nationwide truck survey, Transport. Res. Record 1880 (2004) 29�38.
[14] U.S. Census Bureau, Service Annual Survey: transportation and warehousing 2008,
2010, p. 14.
[15] A.C. McKinnon, Y. Ge, The potential for reducing empty running by trucks: a retro-
spective analysis, Int. J. Phys. Dist. Logist. Manag. 36(5) (2006) 391�410.
[16] D Haling, H. Cohen, Residential noise damage costs caused by motor vehicles,
J. Transport. Res. Board 1559 (1996) 84�93.
[17] J. Bates, Economic Evaluation of Emissions Reductions in the Transport Sector of the
Bottom-Up Analysis, European Commission, 2001.
[18] C. Facanha, A. Horvath, Environmental assessment of freight transportation in the
U.S., Int. J. Life Cycle Assess. 11 (2006) 229�239.
[19] G. Lindberg, Accidents, Res. Transport. Econ. 14 (2005) 155�183.
[20] K.A. Small, C. Kazimi, On the costs of air pollution from motor vehicles, J. Transport
Econ. Pol. 29 (1995) 7�32.
[21] M. Browne, M. Piotrowska, A. Woodburn, J. Allen, Literature review WM9: part I—
urban freight transport, Green Logist. (2007) 277�290.
[22] M. Beuthe, J.-F. Geerts, F. Degrandsart, B. Jourquin, External costs of the Belgian
interurban freight traffic: a network analysis of their internalization, Transport. Res.
Part D 7 (2002) 285�301.
[23] M. Delucchi, D. McCubbin, External Cost of Transport in the U.S, in: A. de
Palma, R. Lindsey, E. Quinet, R. Vickerman (Eds.), Handbook of Transport
Economics, Edward Elgar Publishing Ltd, Cheltenham, UK, 2010.
[24] D. Forkenbrock, External costs of intercity truck freight transportation, Transport. Res.
Part A 33 (1999) 505�526.
[25] INFRASS/IWW, External cost of transport, Final report, 2004.
[26] M. Janic, Modeling the full cost of an intermodal and road freight transport network,
Transport. Res. Part D 12 (2007) 33�44.
[27] Transportation Research Board, Paying Our Way: Estimating Marginal Social Costs of
Freight Transportation, TRB, Washington, DC, 1996. Special Report 246.
[28] A. Ricci, I. Black, The social costs of intermodal freight transport, Res. Transport.
Econ. 14 (2005) 245�285.
[29] C. Nash, UNITE (UNIfication of accounts and marginal costs for Transport Efficiency)
Final Report, 5th Framework RTD Programme, 2003.
[30] U.S. Environmental Protection Agency, Health Assessment Document for Diesel
Engine Exhaust, Office of Research and Development. National Center for
Environmental Assessment, U.S. EPA, Washington, DC, 2002.
[31] P. Bickel, R. Friedrich, Externalities of Energy, European Commission, 2005.
[32] M. Maibach, C. Schreyer, D. Sutter, H.P. van Essen, B.H. Boon, R. Smokers, et al., Handbook
on Estimation of External Costs in the Transport Sector, European Commission, 2008.
[33] U.S. Environmental Protection Agency, Inventory of U.S. Greenhouse Gas Emissions
and Sinks: 1998�2008, U.S. EPA, Washington, DC, 2010.
[34] I. Mayeres, S. Ochelen, S. Proost, The marginal external costs of urban transport,
Transport. Res. Part D 1 (1996) 111�130.
357Freight-Transportation Externalities

[35] Highway Capacity Manual, Transportation Research Board, National Research Council,
Washington, DC, 2000.
[36] NHTSA Traffic Safety Facts, A Compilation of Motor Vehicle Crash Data from the
Fatality Analysis Reporting System and the General Estimates System, U.S.
Department of Transportation, 2008.
[37] C. Facanha, A. Horvath, Evaluation of life-cycle air emission factors of freight trans-
portation, Environ. Sci. Tech. 41 (2007) 7138�7144.
[38] Highway Research Board, The AASHTO road test, Report 7, Summary report, Special
Report 61G, Publication no. 1061, National Academy of Sciences, National Research
Council, Washington, DC, 1961.
[39] P.R. Murphy, F.P. Richard, Green perspectives and practices: a comparative logistics
study, Supply Chain Manage. An. Int. J. 8 (2003) 122�131.
[40] Y. Yano, K. Hayashi, Typology of efforts by Japanese companies to address logistics
related environmental issues, in: E. Taniguchi, R.G. Thompson (Eds.), Innovations in
City Logistics, Nova Science Publishers, Inc., Hauppauge, NY, 2008.
[41] H. Quak, R.V. Duin, J. Visser, City logistics over the years ... lessons learned, research
directions and interests, in: E. Taniguchi, R.G. Thompson (Eds.), Innovations in City
Logistics, Nova Science Publishers, Inc, Hauppauge, NY, 2008, pp. 37�53.
[42] E. Taniguchi, R. Thompson, T. Yamada, R.V. Duin, City Logistics, Pergamon, Oxford,
2001.
[43] P.A. Ioannou, Intelligent Freight Transportation, CRC Press, Boca Raton, FL, 2008.
[44] T.G. Crainic, M. Gendreau, J.Y. Potvin, Intelligent freight-transportation systems:
assessment and the contribution of operations research, Transport. Res. Part C 17
(2009) 541�557.
[45] F. Ruzzenenti, R. Basosi, The rebound effect: an evolutionary perspective, Ecol. Econ.
67 (2008) 526�537.
[46] B. De Borger, C. Courcelle, D. Swysen, Optimal pricing of transport externalities in a
federal system: identifying the role of tax competition, tax exporting and externality
spillovers, J. Transport. Econ. Pol. 37 (2003) 69�94.
[47] I. Parry, How should heavy-duty trucks be taxed? Resource for the future, 2006.
[48] M. Piecyk, A. McKinnon, Internalizing the External Costs of Road Freight Transport in
the UK, Heriot-Watt University, Edinburgh, 2007.
[49] K.A. Small, E.T. Verhoef, The Economics of Urban Transportation, Routledge, 2007.
[50] A. De Palma, R. Lindsey, E. Quinet, Time-varying road pricing and choice of toll loca-
tions, in: G. Santos (Ed.), Road Pricing: Theory and Evidence, Elsevier, Amsterdam,
2004.
[51] L. Kleist, C. Doll, Economic and environmental impacts of road tolls for HGVs in
Europe, Res. Transport. Econ. 11 (2005) 153�192.
358 Logistics Operations and Management

17Robust Optimization of UncertainLogistics Networks
Sara Hosseini1 and Wout Dullaert2,3
1Petrochemical Industries Development Management Co., Tehran, Iran2Institute of Transport and Maritime Management Antwerp, Universityof Antwerp, Belgium3Antwerp Maritime Academy, Antwerp, Belgium
Logistics, as comprehensively defined by Riopel et al. [1] “is that part of the
supply-chain process that plans, implements, and controls the efficient, effective
forward and reverse flow and storage of goods, services, and related information
between the point of origin and the point of consumption in order to meet custom-
ers’ requirements.” So it is obvious that planning and managing this vast range of
processes would be extremely complicated. In other words, decision makers should
concentrate on managing any probable risk of the logistics system, starting from
the design phase. As a result, unforeseen conditions during implementation will be
less likely to invalidate the basic design plan or disturb the performance targets.
One of the main difficulties of the logistics management problems is how to
wisely consider the uncertainty about the future in the modeling phase. In the real
world, the existence of noisy, incomplete, or erroneous information and data is an
unavoidable fact that widely affects the efficiency of the logistics network pro-
cesses (e.g., location of logistics centers, distribution plans, and customer demands)
at the implementation phase, so not correctly modeling for these inherent uncertain-
ties might result in impractical plans. Hence, one critical role of logistic managers
relates to the way of facing noisy and uncertain environments in order to obtain
more effective networks with less replanning.
The importance of this subject has caused a considerable growth in the number
of studies dedicated to the uncertainty in supply-chain and logistic networks and
their associated modeling approaches to optimize the design and performance of
the networks under uncertainty.
Two general approaches have been used in the face of uncertainty in the logis-
tics studies and planning: reactive and proactive.
1. Reactive approaches: They are postoptimal, so they cannot provide any direct mechanism
to control the sensitivity of decisions to the uncertainties. Sensitivity analysis is catego-
rized in this group.
2. Proactive approaches: In contrast to the previous group, these practices are applied to
yield solutions that are less sensitive to the uncertainty. Stochastic programming is a con-
ventional optimization method with probabilistic data that belong to this category.
Logistics Operations and Management. DOI: 10.1016/B978-0-12-385202-1.00017-7
© 2011 Elsevier Inc. All rights reserved.

One shortage of stochastic programming is its limitation to handle decision
makers’ preferences or risk aversion. More recently, an improved stochastic pro-
gramming called robust programming has been developed with the capability of
tackling this shortage. Owing to the flexible modeling qualifications allowed by
robust optimization (RO), it is believed that this approach can provide a credible
methodology for real-world uncertain logistics problems. In other words, the sim-
plicity of implementation of this method enables decision makers to manage and
control the logistics system without having to learn complicated programming
procedures.
17.1 A Literature Review on RO
Klibi et al. [2] present a critical review of the supply-chain network (SCN) design
problem under uncertainty and of the available proposed models for properly for-
mulizing the uncertainty at the design phase. Several definitions of robustness, lit-
erature of it in the supply-chain context, and the necessity of SCN robustness to
ensure sustainable value creation are reviewed and discussed in their paper. The
theory, methodology, and main approaches to cope with optimization problems
under uncertainty are reviewed by Sahinidis [3]. One of these approaches is a spe-
cial type of stochastic nonlinear programming called RO introduced by Mulvey
et al. [4]. Bai et al. [5] have made some applications for RO models in which the
traditional stochastic linear programming fails to identify a robust solution.
Gutierrez et al. [6] have addressed a robustness approach in the formation of regret
model to a standard MIP formulation of uncapacitated network design problems.
Therein, some algorithms that are adaptations of Bender’s decomposition method-
ology have been developed to generate robust network designs. Vladimirou and
Zenios [7] have presented a RO model to obtain a trade-off between the stability of
recourse decisions and the expected cost of a solution. Yu and Li [8] have devel-
oped a new RO model for stochastic logistic problems. Their proposed formulation
needs only adding half of the variables toward the formulation of Mulvey et al. [4]
for transferring a nonlinear robust model to a linear program. Landeghem and
Vanmaele [9] have proposed the concept of robust planning, which applies risk
assessment within uncertain demand and supply chains at the tactical level. Also,
they indicated the value of robust planning in a European chemical enterprise.
Leung et al. [10] have presented a RO model for an uncertain cross-border logistics
problem with fleet composition to determine an optimal long-term transportation
strategy under different economic growth scenarios. More recently, Leung et al.
[11] have applied the improved RO formulation proposed by Yu and Li [8] to solve
a multisite production planning problem in an uncertain environment. An RO prob-
lem in the form of regret model is studied by Baohua and Shiwei [12] for logistics
center location and allocation in an uncertain environment. By numerical experi-
ments, it has been shown that the results of this method are better than those of the
stochastic optimization model. Yin et al. [13] have developed three robust
360 Logistics Operations and Management

improvement schemes (sensitivity based, scenario based, and min-max) for road
networks under future uncertain demand, applying different techniques to model
uncertainty with different prospective on robustness.
17.2 Optimization Under Uncertainty
17.2.1 Uncertainties in the Logistics Networks
One of the main challenges for mathematical modeling of an effective logistics net-
work that adapts with the real-world data is how to logically incorporate uncertain
and noisy data in the network design phase. In fact, making any mistake in this
phase may result in serious malfunction of the logistics network in the implementa-
tion phase, so it probably fails to achieve some of targeted goals. As a conse-
quence, additional costs would be imposed on the system to penalize the lack of
precise network design.
In recent decades, notable studies, but certainly not enough, have been published
that focus on conveniently recognizing and formulizing the uncertainties in network
design problems. For example, Davis [14] introduced uncertainty as a major factor
affecting the supply chain that is not adequately handled by managers. He identi-
fied supplier performance, manufacturing processes, and customer demands as
major sources of uncertainty. In a similar way, Landeghem and Vanmaele [9] listed
the main sources of uncertainty regarding the degree of their effects at different
levels of the supply chains in Table 17.1.
Table 17.1 Sources of Uncertainty in the Supply Chain: Low, Medium, and High Leverage
of Decisions [9]
Sources of Uncertainties Operational Tactical Strategical
Exchange rates KKK KK
Supplier lead-time K KKK K
Supplier quality KK K
Manufacturing yield KK KK
Transportation times KK KK K
Stochastic costs K KKK KK
Political environment KK
Customs regulations K KK KKK
Available capacity KK KK K
Subcontractor availability KKK KK
Information delays KKK KK
Stochastic demand K KKK KK
Price fluctuations K KKK K
Low (K); medium (KK); high (KKK).
361Robust Optimization of Uncertain Logistics Networks

17.2.2 Optimization Approaches Under Uncertainties
As a good classification, Sahinidis [3] categorizes and reviews the main optimiza-
tion approaches under uncertainty into three groups: (1) stochastic programming
(recourse models, robust stochastic programming, and probabilistic models); (2)
fuzzy programming (flexible and possibilistic models); and (3) stochastic dynamic
programming.
In stochastic programming, it is assumed that the probability distribution func-
tions of the uncertain parameters are known and that decision makers try to find an
optimal solution that minimizes the expected value of objective. One development
of stochastic programming is RO, which describes the uncertain parameters by the
discrete scenarios or a continuous range and is capable of handling decision
makers’ favored risk aversion. The goal in this approach is obtaining a series of
solutions that are less sensitive to any realizations of the uncertain parameters. In
fact, the term robustness has emerged in statistics and become popular in the field
of control theory since the 1970s. This word is used when the control system is
influenced by unavoidable fluctuations of parameters.
17.2.3 Robust Optimization
In general, RO consists of two types of constraints: structural and control. The
input data in the first group are free of noise; the second ones are influenced by
noisy data. Also, two sets of variables are defined: design and control. The control
variables are subjected to uncertainty, unlike the design variables.
The scenario-based RO involves a set of scenarios Ω5 {1,2, . . . , S}. Under
each scenario sAΩ, the coefficients of the control constraints will become {dS, BS,
CS, eS}, with a fixed given probability of occurrence of a scenario s,
Ps
PSPS 5 1
� �. Let ys be the control variable ’sAΩ and δs be the error vector that
shows the value of the allowed infeasibility in the control constraints under sce-
nario s. Then a mathematical formulation for the RO model is as follows:
Min σðx; y1; y2; . . . ; ysÞ1ωρðδ1; δ2; . . . ; δsÞ ð17:1Þ
subject to
Ax5 b ð17:2Þ
Bsx1Csy1 δs 5 es for all sAΩ ð17:3Þ
x$ 0 ; ys $ 0 for all sAΩ ð17:4Þ
The first term of the objective function would be a moment of the
ξs 5 cTx1 dsTyswith probability Ps under scenario s. This term represents the solu-
tion’s robustness. The optimal solution of this model will be called robust if it
remains close to optimality for any realization of the scenario sAΩ.
362 Logistics Operations and Management

The second term of the objective function prepares a feasibility penalty value to
penalize the probable violations of the control constraints. This term is referred as
model robustness. Each solution will be robust if it remains almost feasible for any
realization of the scenario sAΩ.
The weight ω is used to obtain a good trade-off between the solution robustness
(optimality) and the model robustness (feasibility) under the conception of the multi-
criteria decision making.
The RO includes two major model formulations [12]: a regret model and a vari-
ability model.
Regret Model
In this model, the regret value of a scenario is referred to as the absolute or relative
difference between the objective value of the feasible solution and the best objec-
tive function.
Let S denote the set of scenarios and x be the feasible solution of the determin-
istic model Ps, ’sAS. Zs(x) is the objective of Ps and Z�S is the optimal objective of
it. Also, let given constant ω$ 0 be the regret coefficient. Zs(x)2 Z�S is the absolute
regret value, and [Zs(x)2 Z�S ]/Z
�S is the relative regret value. The overall framework
of this model is discussed below.
MinXS
qSZSðxÞffiffiffiffiffiffiffiffiffiffiffiffiffiffiffia2 1 b2
pð17:5Þ
subject to
½ZSðxÞ# ð11ωÞZ�S � xAΩ ð17:6Þ
If [Zs(x)2 Z�S ]/Z
�S #ω ’sAS, then x is the robust solution of Ps. Maybe there
exist several robust solutions. The optimal solution of the above model is the best
robust solution.
Variability Model
In this model, the higher moments of the distribution of the objective value are
used to reduce the sensitivity of model to uncertain data—i.e., the standard devia-
tion and variance.
The following nonlinear formulation was proposed by Mulvey et al. [4] for the
first term of RO:
σðx; y1; y2; . . . ; ysÞ5XsAΩ
Psξs 1λXsAΩ
Ps ξs 2Xs0AΩ
Ps0ξs0
!2
ð17:7Þ
363Robust Optimization of Uncertain Logistics Networks

To reduce the complexity of this formulation, Yu and Li [8] proposed the fol-
lowing form:
σðx; y1; y2; . . . ; ysÞ5XsAΩ
Psξs 1λXsAΩ
Ps ξs 2Xs0AΩ
Ps0ξs0
���������� ð17:8Þ
Then this form is converted to a linear form using two nonnegative deviational
variables. The overall framework of their model is:
σðx; y1; y2; . . . ; ysÞ5XsAΩ
Psξs 1λXsAΩ
Ps ξs 2Xs0AΩ
Ps0ξs0
!1 2θs
" #ð17:9Þ
subject to
ξs 2XsAΩ
Psξs 1 θs $ 0 ð17:10Þ
θs $ 0 ð17:11ÞBesides these two main models—regret and variability—there exist other formu-
lations of RO such as the worst-case analysis, which contains two principles named
minimax and maximin. Here, it does not matter for decision makers how much the
system performance changes above the level, as long as it achieves a certain
acceptable level. This asymmetric effect could result in a performance improve-
ment in the worst case, whereas the average performance is poorer. When applying
this method, it is not necessary to consider all possible realizations of uncertain
data in the uncertainty set.
17.3 RO of Logistics Networks
As mentioned before, in the real world, the logistics networks frequently encounter
uncertain data. Ignoring each of them might result in resource waste and low net-
work efficiency. The studies show the helpful role of RO to logistics managers and
decision makers to wisely solve the uncertain logistics problems. Moreover, the
obtained results from the sets of real-world data indicate that the RO model is
more realistic in dealing with future economic conditions. This section presents
applications of RO in logistics networks.
17.3.1 A Variability Formation of RO for the General LogisticsProblem [8]
An efficient RO model has been presented by Yu and Li [8] for solving an uncer-
tain logistics problem. First, they reviewed a general deterministic logistics prob-
lem and then adjusted this model in three RO approaches introduced by Mulvey
et al. [4] and Mulvey and Ruszczynski [15]. They studied the limitations of each
approach such as having to add many extra variables and constraints. After that,
364 Logistics Operations and Management

they presented a novel RO formulation for the general logistics problem. Finally,
two logistics examples (a wine company and an airline company) prove that the
proposed method is more computationally efficient than the conventional methods
because it contains a lower number of variables or constraints.
We formulate a general framework of a deterministic logistics problem that
aims to minimize the costs associated with the production and distribution of pro-
ducts under a variety of constraints as follows:
MinXi
Xk
cikxik 1Xk
ckxk 1Xk
Xj
ckjxkj ð17:12Þ
subject to
Ax$ b ð17:13ÞXk
xkj 2Dj 5 gj ’j ð17:14Þ
All xik; xk; xkj;Dj; gj $ 0 ð17:15ÞLet xik be the amount of raw material shipped from location i to plant k, and cik
be the unit cost for their shipment. Let xkj be the amount of product x shipped from
plant k to market j, and ckj be the unit cost for their shipment. Also, xk denotes the
amount of product x produced at plant k, and ck represents the unit cost for their
production. Dj denotes the demand of market j for this product, and gj represents
the safety stock at marketplace j, which is specified by the decision maker.
Here, the objective of Eqn (17.12) is to minimize the total cost of transportation,
production, and inventory. Equation (17.13) represents the general constraints associ-
ated with flow balance, workers, materials, funds, and other resources requirements in
related locations, plants, and markets. Equation (17.14) expresses the constraints of
supply and demand in markets.
Now the novel RO formulation of the general logistics after transforming it to a
standard linear problem, introduced by Yin et al. [13], is presented as follows:
MinXsAS
Ps
Xi
Xk
cikxik 1Xk
cskxk 1Xk
Xj
ckjxkj
!
1λXsAS
Ps
Xi
Xk
cikxik 1Xk
cskxk 1Xk
Xj
ckjxkj
!
2Xs0AS
Ps0Xi
Xk
cikxik 1Xk
cs0kxk 1Xk
Xj
ckjxkj
!1 2θs
266664
377775
1ωXsAS
Ps ω1sj
Xk
xkj 2Dj 2 gsj 1 δsj
!1ω2
sj δsj
!
ð17:16Þ
365Robust Optimization of Uncertain Logistics Networks

subject to
Ax$ b ð17:17Þ
XsAS
Ps
Xi
Xk
cikxik 1Xk
cskxk 1Xk
Xj
ckjxkj
!
2Xi
Xk
cikxik 1Xk
cskxk 1Xk
Xj
ckjxkj
!2 θs # 0
ð17:18Þ
Xk
xkj 1Dj 1 gsj 2 δsj # 0 ’ j and s ð17:19Þ
All xik; xk; xkj; Dsj; gsj; θs; δsj $ 0 ð17:20Þ
where θs denotes the deviation for violation of the mean, and δsj represents the
deviation for violations of the control constraints.
This new linear formulation just needs to add n1m deviation variables (where
n and m are the number of scenarios and total constraints, respectively), whereas
the proposed model by Mulvey et al. [4] requires adding 2n1 2m.
17.3.2 A Regret Formation of RO for the Logistic Center Locationand Allocation [12]
Logistics centers have a very important role in the logistics networks. If the exis-
tent uncertainty in the parameters of these systems is ignored through the design
phase, then some impractical location plans might be obtained. Moreover, it is
recommended to consider the distribution plan when working on the location of the
logistics centers.
This field is concentrated under uncertain demand in Baohua and Shiwei [12].
They present a RO model using the regret formation and solve it by both the enu-
meration method and the genetic algorithm. Finally, it has been shown by numeri-
cal experiments that the RO model can obtain better solutions than the stochastic
optimization model via reducing the risk of decisions.
The formulation of the regret model of logistics center location and allocation
model with uncertain demand is presented as follows.
Let S denote the set of scenarios. ’sAS, ρs denotes the probability of scenario s.
V denotes the set of nodes. Q denotes the set of supply nodes. L represents the set
of possible locations of logistics center. D is the set of demand nodes. A represents
the set of arcs. ’iAA, oi is the origin of arc i, and di is the destination of arc i. P is
the set of products. qpj denotes the supply capacity of product p in the supply node
j, jAQ and pAP. ηj is the operation capacity of the possible location j, jAL. rpj
denotes the capacity needed for unit product p in possible location j, jAQ and
pAP. n denotes the largest number of logistics center. ω denotes the regret
366 Logistics Operations and Management

coefficient. In this chapter, the regret coefficients are assumed to be identical for
all scenarios.
Also, let ysip denotes the flow of product p on the arc i under scenario s, which is
the integer decision variable. xj denotes the location of logistics centers and binary
decision variable. xj5 1 if the logistics center is going to be built at site j; other-
wise, xj5 0.
P : Min Z5XsAS
ρsZs ð17:21Þ
subject to
Zs 5XjAL
Wjxj 1XsAS
XpAP
XiAA
cpi y
sip ð17:22Þ
XiAAjdi5j
ysip 5X
iAAjoi5j
ysip ’sAS; jAL; pAP ð17:23Þ
XiAAjdi5j
ysip $ dsjp ’sAS; jAD; pAP ð17:24Þ
XiAAjoi5j
ysip # qpj ’sAS; jAQ; pAP ð17:25Þ
XpAP
rpj
XiAAjdi5j
ysip
!# ηjxj ’sAS; jAL ð17:26Þ
XjAL
xj # n ð17:27Þ
ZsðxÞ2 Z�s
� �=Z�
s #ω ’sAS ð17:28Þ
YsipAZ 1 ’sAS; iAA; pAP ð17:29Þ
xjAð0; 1Þ ’jAL ð17:30Þ
The objective function of Eqn (17.21) aims to minimize the total average cost
under all scenarios. Equation (17.22) provides the total cost under each scenario s.
Equation (17.23) is the flow conservation constraint of each logistics center node.
Equation (17.24) ensures that the demand should be satisfied at each demand
node. Equation (17.25) ensures that the total supply of each supply node should not
exceed its capacity. Equation (17.26) is the operation capacity constraint of each
logistics center node. Equation (17.27) ensures that the number of logistics centers
is restricted to a given number. Equation (17.28) ensures that the feasible solution
367Robust Optimization of Uncertain Logistics Networks

of model P should meet the requirement of the robust solution. Equations (17.29)
and (17.30) are logical constraints of the decision variables.
17.3.3 A Min-Max Formation of RO for Road Networks [13]
Three robust improvement schemes are presented by Yin et al. [13], including sen-
sitivity based, scenario based, and min-max for road networks under future uncer-
tain demand. In this chapter, the improvement schemes are called robust if the
resulted solutions are less sensitive to any realizations of uncertain demands (in the
sensitivity-based and scenario-based schemes) or if the system performs better
against the worst-case or high-consequence demand scenarios (in the min-max
scheme). They formulate these different schemes as robust programs and present
convenient solution algorithms. Finally, they validate their proposed models by
numerical examples and simulation tests.
The min-max scheme for road networks is studied as follows.
Consider a network G5 (N,A), where N is the set of nodes, and A is the set of
links. Let W be the set of all origin�destination (O�D) pairs in the network.
Denote travel demand between all O�D pairs as a vector q, which is assumed to
be unknown but bounded by an uncertainty set Q. Rw is the set of routes between
O�D pair wAW, and qw is the demand between O�D pair w. δwar 5 1 if route r
between O�D pair w uses link a and 0 otherwise. Denote V as the set of feasible
link flow vectors (v). Denote the travel time for each link aAA as ta(va,ca). va is the
traffic flow, and ca is the capacity of link aAA. c1a is the continuous capacity
increase of link a. ha c1a
� �is the construction cost function that is generally
assumed to be nonnegative, increasing, and differentiable; B is the available bud-
get; cmaxa is the upper limit of the capacity increase; and c0 is the vector of the origi-
nal link capacities.
Minc1 ;v
MaxqAQ
Xa
vaUta va; c0a 1 c1
a
� � ð17:31Þ
subject to
XaAA
haðc1a Þ#B ð17:32Þ
0# c1a # cmax
a aAA ð17:33Þ
va 5XwAW
XrARw
qwUδwarUpwr ðtwðv; c0 1 c1 ÞÞ aAA; vAV ; qAQ ð17:34Þ
To solve this RO model, they propose a heuristic algorithm that includes an iter-
ative procedure to obtain move directions and to generate a sequence of solutions
until a convergence criterion is met.
368 Logistics Operations and Management

At the end of their study, they conclude some facts about the situations in which
the use of each improvement scheme is preferred. Upon their conclusion, the sensi-
tivity-based model is preferred when the fluctuations of the uncertain parameters
are believed to be nonsignificant, or when the robustness approach is considered as
a side improvement effort. In the other side, when it is intended to make the system
performance more stable, the preferred model will be the scenario-based one.
Finally, when the system performance is measured under the worst-case or high-
consequence scenarios, the min-max model will be appropriate to be applied by
decision makers. This model does not need any prior information about distribu-
tions of uncertain parameters.
17.4 Challenges of RO
In spite of the simplicity of implementation of this method and its applicability in
modeling real-world cases, it cannot be ignored that there are several limitations in
this approach. Two major shortcomings of the scenario-based RO are (1) how to
determine the number of scenarios that should be included in the model to find the
robust solution and (2) how to generate those scenarios and specify their related
probabilities [13]. In this way, some studies have been done to overcome these lim-
itations. For example, variance-reduction methods can be used to generate the rep-
resentative scenarios.
However, we believe that the merits of developing RO would encourage the
decision makers to incorporate uncertainty into the logistics networks’ design
phase. Besides, this field is attractive enough for further research.
References
[1] D. Riopel, A. Langevin, J.F. Campbell, The network of logistics decisions, in: A.
Langevin D. Riopel (Eds.), Logistics Systems: Definition and Optimization, Springer,
New York, 2005.
[2] W. Klibi, A. Martel, A. Guitouni, The design of robust value-creating supply chain net-
works: a critical review, Eur. J. Oper. Res. 162 (2009) 4�29.
[3] N.V. Sahinidis, Optimization under uncertainty: state-of-the-art and opportunities,
Comput. Chem. Eng. 28 (2004) 971�983.
[4] J.M. Mulvey, R.J. Vanderbei, S.A. Zenios, Robust optimization of large-scale systems,
Oper. Res. 43 (1995) 264�281.
[5] D. Bai, T. Carpenter, J.M. Mulvey, Making a case for robust optimization models,
Manage. Sci. 43 (1997) 895�907.
[6] G.J. Gutierrez, P. Kouvelis, A.A. Kurawarwala, A robustness approach to uncapacitated
network design problems, Eur. J. Oper. Res. 94 (1996) 362�376.
[7] H. Vladimirou, S.A. Zenios, Stochastic linear programs with restricted recourse, Eur. J.
Oper. Res. 101(1) (1997) 177�192.
369Robust Optimization of Uncertain Logistics Networks

[8] C.S. Yu, H. Li, A robust optimization model for stochastic logistic problems, Int. J.
Prod. Econ. 64 (2000) 385�397.
[9] V.H. Landeghem, H. Vanmaele, Robust planning: a new paradigm for demand chain
planning, J. Oper. Manage. 20 (2002) 769�783.
[10] S.C.H. Leung, Y. Wu, K.K. Lai, A robust optimization model for a cross-border logis-
tics problem with fleet composition in an uncertain environment, Math. Comput.
Model. 36 (2002) 1221�1234.
[11] S.C.H. Leung, S.O. Tsang, W.L. Ng, Y. Wu, A robust optimization model for multi-
site production planning in an uncertain environment, Eur. J. Oper. Res. 181 (2007)
224�238.
[12] W. Baohua, H.E. Shiwei, Robust optimization model and algorithm for logistics center
location and allocation under uncertain environment, J. Transp. Syst. Inf. Technol. 9(2)
(2009) 69�74.
[13] Y. Yin, S.M. Madanat, X. Lu, Robust improvements schemes for road networks under
demand uncertainty, Eur. J. Oper. Res. 198 (2009) 470�479.
[14] T. Davis, Effective supply chain management, Sloan Manage. Rev. 34 (1993) 35�46.
[15] J.M. Mulvey, A. Ruszczynski, A new scenario decomposition method for large-scale
stochastic optimization, Oper. Res. 43 (1995) 477�490.
370 Logistics Operations and Management

18Integration in Logistics Planningand Optimization
Behnam Fahimnia1, Reza Molaei2 and
Mohammad Hassan Ebrahimi3
1School of Management, Division of Business, University of SouthAustralia, Adelaide, Australia2Department of Technology Development, Iran Broadcasting Services(IRIB), Tehran, Iran3Terminal Management System Department, InfoTech InternationalCompany, Tehran, Iran
18.1 Logistics Planning and Optimization Problem
A logistics system (LS) is a network of organizations, people, activities, informa-
tion, and resources involved in the physical flow of products from supplier to cus-
tomer. An LS may consist of three main networks or subsystems:
1. Procurement: The acquisition of raw material and parts from suppliers and their transpor-
tation to the manufacturing plants.
2. Production: The transformation of the raw materials into finished products.
3. Distribution: The transportation of finished products from plants to a network of stocking
locations (warehouses) and from there to end users.
Logistics planning (LP) is the process of integrating and utilizing suppliers, manu-
facturers, warehouses, and retailers so that products are produced and delivered at the
right quantities and at the right time while minimizing costs and satisfying customer
requirements [1]. Implementation of LS has crucial impacts on a company’s financial
performance and LP optimization is essential to achieve globally optimized opera-
tions. The six major cost components that form the overall logistics costs are: (1) raw
material costs, (2) costs of raw material transportation from vendors to manufacturing
plants, (3) production costs at manufacturing plants, (4) transportation costs from
plants to warehouses, (5) inventory or storage costs at warehouses, and (6) transporta-
tion costs from warehouses to end users (Figure 18.1). In a logistics optimization
model, the overall systemwide costs are to be minimized through effective procure-
ment, production, distribution, and inventory management. It is widely acknowledged
that many benefits can be achieved by treating a logistics network as a whole
(integration in LS) for optimization purposes, which requires the simultaneous mini-
mization of all systemwide costs [2].
Logistics Operations and Management. DOI: 10.1016/B978-0-12-385202-1.00018-9
© 2011 Elsevier Inc. All rights reserved.

Manufacturers End users
Material costs
Transportationcosts
Productioncosts
Transportationcosts
Strategicplan Source Make Deliver Buy
Vendors
Transportationcosts
Inventory costs(Storage)
Warehouses
Figure 18.1 Participants of a logistics system.
372
Logistics
Operatio
nsandManagem
ent

18.2 Significance of Integrated LP
A new approach to the analysis of LSs has been recently proposed based on the
integration of decisions of different functions in production and distribution net-
works into a single optimization model [3]. In fact, optimization of activities in
individual subsystems of LS does not guarantee the global optimization, and this
has been the driving reason why researchers have changed direction toward more
integrated approaches. Efficient and effective planning and control of activities
within a logistics network offer opportunities in terms of cost and lead-time reduc-
tions as well as improved quality [4]. Two issues—profitability and a quicker
response to market changes—can justify the call to implement effective and effi-
cient integrated logistics optimization models.
18.2.1 Profitability
Manufacturing, distribution, and service industries have realized the magnitude of
savings that can be achieved through better planning and management of complex
LSs [5]. Research shows that a great portion of such financial improvements are
achieved when the associated decision makings are integrated and coordinated
among like-minded entities participating in the logistics network [6]. Concurrent
reduction in production costs, distribution costs, and inventory holding costs can
only be achieved through the effective integration of procurement, production, and
distribution activities across a logistics network.
18.2.2 Quicker Response to Market Changes
Lead-time reduction is an unavoidable element of today’s time-based competitions.
Sajadieh et al. [7] refer to this point and cites that one important benefit of coordi-
nation in a logistics network is a more efficient management of inventories across
the entire supply chain (SC) that would consequently contribute to a shorter lead
time. Further, the integrated management of a logistics network can improve infor-
mation flow, which would naturally lead to improved product flow and thereby
shorter lead times. Many potential benefits can be obtained from lead-time reduc-
tions, including better responsiveness to market changes, more accurate forecasts,
significant reductions of bullwhip effects throughout a logistics network, smaller
order sizes, reduction in work-in-progress (WIP) inventory and inventory of fin-
ished goods, and improved customer satisfaction [8�10].
18.3 Issues in Integrated LP
A logistics plan integrates the procurement plan, production plan, and distribution
plan. A typical integrated logistics plan aims to deal with the following problems
simultaneously: (1) quantity of raw material transported from vendors to
373Integration in Logistics Planning and Optimization

manufacturing plants; (2) quantity of each product produced at each plant during
each period; (3) quantity of each product outsourced during each period; (4) WIP
inventory amount stored at each plant at the end of each period; (5) inventory
amount of finished products stored at stack buffers at each plant at the end of each
period; (6) quantity of each product shipped from stack buffers to warehouses during
each period; (7) quantity of each product shipped from warehouses to end users dur-
ing each period; (8) quantity of each product shipped directly from stack buffers to
end users during each period; (9) inventory amount of finished products stored at
warehouses at the end of each period; and (10) quantity of each product backordered
(i.e., shortage or backlogged amount for failing to satisfy the customer demand at
one period) at end users at the end of each period.
An integrated logistics plan covers the planning of activities in a vast scope
from raw material suppliers to manufacturers and warehouses through to end users.
This large planning scope with multiple players makes the LP problem complex
containing several decision variables and constraints. The problem presented by the
analysis of LSs is so complex that optimal solutions are very hard to obtain [3]. The
difficulties associated with this type of decision making can be further amplified by
the complex maze of the network, geographical span of the SC, limited visibility,
and involvement of varied entities with conflicting objectives [6]. For this reason,
simplification of a real-life scenario becomes unavoidable in developing an LP
model [11,12].
Most of the LP problems are classified under the category of nondeterministic
polynomial-time hard (NP-hard) problems, which are very difficult to solve using
ordinary planning and optimization techniques. Literature on LP and optimization
indicates that past research is subject to oversimplification of real-life scenarios.
Oversimplification may preclude a logistics model from functioning effectively in real-
world scenarios. Hence, there is a need to extend the scope of the proposed models to
perform the optimization of the detailed aggregated logistics plan. The attempt to repli-
cate the real scenarios as closely as possible makes the LP a challenging problem [12].
Various techniques have been used to solve small- and medium-sized LP prob-
lems ranging from mathematical models, heuristics, simulation, and knowledge-
based systems to the latest fuzzy programming approaches [12]. However, finding
the optimal solution in a complex LP problem using the presented approaches in the
literature is impossible or subject to heavy computing overheads. Consequently,
there is also a need to enhance the quality and precision of the solutions for the opti-
mization of complex real-life LP problems.
18.4 An Integrated LP Model
This section aims to formulate an LP problem consisting of multiple production
plants producing different product types during several time periods and distrib-
uting the finished products from plants to various end users located in different
geographical locations through a number of warehouses. Mixed-integer program-
ming (MIP) is used for this purpose. The following subsections will discuss the key
374 Logistics Operations and Management

performance indicators used, assumptions, parameters and decision variables, and
finally the MIP formulation of the objective function.
18.4.1 Key Performance Indicators
The first issue in constructing a mathematical model is to determine the appropriate
key performance indicator of the system. A number of performance indicators can
be suggested for evaluating the performance of an LS, such as overall system costs,
inventory management, delivery performance, and network responsiveness [13].
Literature on the LP models indicates that the cost-based value characteristics (e.g.
total cost, profit, setup cost, delivery cost, and penalty cost) have been the most
popular performance measures [12]. Cost-based optimization has a direct financial
implication on system performance and clearly reflects the efficiency of the LS.
The proposed model in this section is based on cost trade-off analysis, and there-
fore the objective functions aim to minimize the overall LS costs as the main per-
formance measure.
18.4.2 Assumptions
There are a set of assumptions to be considered in the proposed LP model in this
chapter. The procurement activities (including the raw material acquisition and its
transportation to manufacturing plants) are disregarded in this model. Therefore, the
proposed model is concerned with the production of multiple products in different
manufacturing plants and the distribution of finished products from plants to end
users (via a number of warehouses). In addition, demand is deterministic, and the
aggregate demand for all types of final products in the concerned periods is assumed
to be known for several periods in the near future. The aggregate demand at each
end user is the total demand for each product that might have been ordered by sev-
eral individuals and retailers at end users. Other assumptions include the following.
� Variety of products (i) to be produced is known.� Number, location, and capacity of plants (m) and warehouses (w) are known.� Number and location of end users (e) are known.� All demands for each product have to be satisfied, sooner or later, during the planning
horizon. A penalty cost will be incurred if the demand for a certain product at one period
is decided to be backordered. The backordered demands are to be satisfied in the next
periods before the end of the planning horizon.� Production and distribution capacity limitations, capacity of raw material supply, and lim-
itations in storage capacity at stack buffers and warehouses are known.� To simplify the inventory management issues, a zero switch role is used in this model.
This implies that the inventory levels of all products (at stack buffers and warehouses)
are to be zero at the beginning and the end of the planning horizon. WIP inventory hold-
ing at manufacturing plants is disregarded in this model.� Transportation costs are proportional to transportation distances.� End users or customer zones are the locations where products are delivered to the final
customers and have no holding capacity to store the products.
375Integration in Logistics Planning and Optimization

18.4.3 Parameters and Decision Variables
Before formulating the objective function of a model, all system inputs and deci-
sion variables must be clearly defined. Indices used for the purpose of mathemati-
cal modeling in this chapter include i for product types, m for manufacturing
plants, b for stack buffers, w for warehouses, e for end users, and t for time-periods.
Parameters represent the input data for a system. Therefore, a parameter is a vari-
able with a fixed given value that is used as an input to the optimization system
[12]. The following parameters are used in our model.
Diet5 forecasted demand for product i at end user e in period t
Om5 fixed costs of opening and operating plant m for the next planning horizon T
O0w 5 fixed costs of opening and operating warehouse w for the planning horizon T
Hibt5 unit holding cost for finished product i at stack buffer b in period t
H0iwt 5 unit holding cost for finished product i at warehouse w in period t
HCibt5 holding capacity (maximum units) at stack buffer b for product i in period t
HC0iwt 5 holding capacity (units) at warehouse w for product i in period t
Tibwt5 unit transportation cost for product i from stack buffer b to warehouse w in t
T0iwet 5 unit transportation cost for product i from warehouse w to end user e in t
T vibet 5 unit transportation cost for product i directly from stack buffer b to e in t
Pimt5 unit production cost of product i at plant m in period t
OSimt5 unit outsourcing cost of product i ordered by plant m in period t
SCiet5 unit backordering (shortage) cost for product i at end user e in period t
Smaxiet 5maximum amount of shortage permitted (maximum backordering) for product i at
end user e in period t
λigmt5 capacity hours for the production of product i on g at plant m in t
γimt5 capacity units of raw material supply for product i at plant m in period t
Eibt5 the distribution capacity at stack buffer b for product i in period t
E0iwt 5 the distribution capacity at warehouse w for product i in period t
Decision variables are the outputs of the model or the variables in which the
values need to be determined by the optimization model. The decision variables for
the presented model in this chapter are listed below:
Iimt5 quantity of product i produced at plant m in period t
I0imt 5 quantity of product i outsourced by plant m in period t
Jibwt5 quantity of product i shipped from buffer b to warehouse w during period t
J0iwet 5 quantity of product i shipped from warehouse w to end user e during period t
Jvibet 5 quantity of product i shipped directly from stack buffer b to end user e during t
Yibt5 inventory amount of finished product i left at buffer b at the end of period t
Ziwt5 amount of product i stored at warehouse w at the end of period t
Siet5 quantity of product i backordered at end user e at the end of period t
The integer variables include the following:
Fibwt 51; If product i is shipped from buffer b to warehouse w at period t
0; Otherwise
�
376 Logistics Operations and Management

F0iwet 5
1; If product i is shipped from warehouse w to end user e at period t
0; Otherwise
�
Fvibet 5
1; If product i is shipped from buffer b to end user e at period t
0; Otherwise
�
Gmt 51; If plant m operates in period t
0; Otherwise
�
G0wt 5
1; If warehouse w is open in period t
0; Otherwise
�
diet 51; If demand for product i at end user e is not satisfied at period t
0; Otherwise
�
18.4.4 Objective Function and Model Constraints
The objective function (i.e., cost function) in the LP problem under investigation
minimizes the sum of production costs, outsourcing costs, inventory holding costs,
transportation costs, and backlogging costs. The cost function for the proposed LP
problem is the objective function of the model presented in Eqn (18.1). This equa-
tion consists of 10 cost components. Components 1 and 4 are the fixed costs of
opening and operating plants and warehouses. These are independent of the rate
and quantities of production and distribution at a plant or warehouse and may
include the costs of building and facilities, amortizations of machines and tools,
salaries of managers, annual insurance payments, and so on. Components 2 and 3
express production and outsourcing costs, respectively. Components 5 and 6 repre-
sent the inventory holding costs in stack buffers and warehouses, respectively.
Components 7, 8, and 9 express the transportation costs for the distribution of items
from plants to end users. This can be done directly from plants to end users (as in
component 7) or indirectly from plants to warehouses and then from warehouses to
end users (as in components 8 and 9). Component 10 stands for the shortage (pen-
alty) costs incurred if backlogging occurs at the end users.
Min Z 5
Xm
Xt
GmtOmt 1Xi
Xm
Xt
IimtUPimt 1Xi
Xm
Xt
I0imtUOSimt 1X
w
Xt
G0wtO
0wt 1
Xi
Xb
Xt
HibtUYibt 1Xi
Xw
Xt
H0iwtUZiwt 1X
i
Xb
Xw
Xt
JibwtUTibwtUFibwt 1Xi
Xw
Xe
Xt
J0iwetUT
0iwetUF
0iwet 1X
i
Xb
Xe
Xt
JvibetUTvibetUF
vibet 1
Xi
Xe
Xt
SietUSCietUdiet
ð18:1Þ
377Integration in Logistics Planning and Optimization

The proposed model is subject to capacity constraints; demand and shortage
constraints; balance constraints at stack buffers, warehouses, and end users; and
variables constraints.
Capacity Constraints of Plants
Raw material supply capacity restrictions:
Iimt # γimt ’ i;m; t ð18:2Þ
Demand satisfaction constraint: The total amount of production and outsourcing
for every product at all plants must meet the forecast demand for that product at
the end of planning horizon (i.e., complete satisfaction of all demands for every
product at the end of planning phase):
Xm
Xt
Iimt 1 I0imt
� �5Xe
Xt
Diet ’ i ð18:3Þ
Capacity Constraints at Stack Buffers
Stack buffer capacity restriction:
Yibt #HCibt ’ i; b; t ð18:4Þ
Inventory balance at stack buffers:
Yibt 5 Yibðt2 1Þ 1 Iimt 1 Ivimt� �
2Xw
Jibwt 1Xe
Jvibet
" #’ i; b;m; t ð18:5Þ
Capacity Constraints of Warehouses
Ziwt #HC0iwt ’ i;w; t ð18:6Þ
Distribution Capacity Limits at Buffers
Xw
Jibwt 1Xe
Jvibet #Eibt ’ i; b; t ð18:7Þ
378 Logistics Operations and Management

Distribution Capacity Constraint at Warehouses
The distribution capacity limitation at warehouses:
Xe
J0iwet #E
0iwt ’ i;w; t ð18:8Þ
Inventory balance at warehouses:
Ziwðt2 1Þ 1Xb
JibwtUFibwt 5Xe
J0iwetUF
0iwet 1 Ziwt ’ i;w; t ð18:9Þ
Backlogging Constraints at End Users
Maximum allowed shortage at end users:
Siet # SMaxiet ’ i; e; t ð18:10Þ
Balance equations at end users: The shipments of a product to an end user sat-
isfy the demand for that product; otherwise some amount of shortage would
appear.
Xw
J0iwet 1
Xb
Jvibet 5Diet 2 SietUdiet 1 Sieðt2 1ÞUdieðt2 1Þ ’ i; e; t ð18:11Þ
Zero Switch Role
Xt5 0
Yibt 5Xt5 T
Yibt 5 0 ’ i; b ð18:12Þ
Xt5 0
Ziwt 5Xt5 T
Ziwt 5 0 ’ i;w ð18:13Þ
Nonnegativity Restriction for all Decision Variables
Iimt $ 0 ’ i;m; t ð18:14Þ
I0imt $ 0 ’ i;m; t ð18:15Þ
379Integration in Logistics Planning and Optimization

Jibwt $ 0 ’ i; b;w; t ð18:16Þ
J0iwet $ 0 ’ i;w; e; t ð18:17Þ
Jvibet $ 0 ’ i; b; e; t ð18:18Þ
Yibt $ 0 ’ i; b; t ð18:19Þ
Ziwt $ 0 ’ i;w; t ð18:20Þ
Siet $ 0 ’ i; e; t ð18:21Þ
18.5 Optimization Tools and Techniques
The concept of optimization refers to the process through which we minimize or
maximize a function by means of systematically selecting the best values for the
decision variables from a set of available alternatives. Many techniques have been
proposed in the literature for the effective optimization of different integrated logis-
tics plans, each with its own strengths and weaknesses. These tools and techniques
can be classified into four categories: mathematical techniques, heuristics tech-
niques, simulation, and genetic algorithms. This section briefly discusses the
strengths and weaknesses of each technique.
18.5.1 Mathematical Techniques
Mathematical techniques are based on the representation of the essential aspects of
an actual system using mathematical languages. Basically, a mathematical model
needs to contain enough details to answer the questions for a certain problem [14].
Mathematical techniques may include linear programming, nonlinear programming,
MIP, and Lagrangian Relaxation [15�17]. Different mathematical techniques have
been adopted to solve logistics problems, including linear programming models
[18�22], MIP models [23�39], and Lagrangian Relaxation models [40�43].
Mathematical programming models have been demonstrated to be useful analyt-
ical tools in optimizing decision-making problems such as those encountered in LP
[44,45]. Linear programming was first proposed in 1947 and has been widely used
in solving constrained optimization problems. “Programming” in this case is appli-
cable when all of the underlying models of the real-world processes are linear
380 Logistics Operations and Management

[17,46]. MIP is used when some of the variables in the model are real values and
others are integer values (0, 1). Mixed-integer linear programming (MILP) occurs
when objective function and all the constraints are linear in form; otherwise, it is
mixed-integer nonlinear programming (MINLP), which is harder to solve [16]. The
idea behind the Lagrangian Relaxation methodology is to relax the problem by
removing the constraints that make the problem difficult to solve, putting them into
the objective function, and assigning a weight to each constraint [47]. Each weight
represents a penalty that is added to a solution that does not satisfy the particular
constraint.
All of the mathematical techniques are fully matured and are thus guaranteed to
produce the optimal solution (or near-optimal solutions) for a certain type of prob-
lem [12]. However, for two reasons this technique has limited application in solv-
ing complex logistics problems. First, mathematical equations are not always easy
to formulate, and the associated complexities in the development of mathematical
algorithms increase as the number of variables and constraints increase [12,48].
Because the majority of logistics networks are complex with the presence of large
numbers of variables and constraints, mathematical methods may not be very effec-
tive in solving real-world LP problems [12,15]. Second, even if it is possible to
translate a difficult LP problem into mathematical equations, the problem would
become intractable or NP-hard because of the exponential growth of the model size
and complexity [12,49]. The drawbacks of mathematical techniques may make it
almost impossible to employ them for solving real-life, large-scale LP problems
unless the problems are oversimplified.
18.5.2 Heuristic Techniques
The limitations of mathematical techniques have forced the use of heuristics in find-
ing feasible solutions for large-scale LP problems. Heuristic methods are experi-
ence-based techniques that are generally used to rapidly find a solution that is hoped
to be close to the optimal. Therefore, the upside of using heuristics is their relatively
rapid response time in handling large problems. One popular heuristic that can be
used for both discrete and continuous problems is simulated annealing [50].
Jayaraman and Ross [51] used simulated annealing methodology for distribution
network design in SCs and demonstrated the effectiveness and usefulness of the
solution approach to complex logistics problems. There have also been many other
attempts in literature for solving various logistics problems using different heuristic
techniques [52�58].
There are, however, few reasons why heuristics techniques are not always
employed as an effective method for the optimization of complex integrated LP
problems. The first problem with heuristic techniques is that they do not promise
an optimal solution to the problem. In fact, in many cases they cannot even promise
a near-optimal result [50]. The second problem is that heuristic techniques (e.g.
simulated annealing) may not be very effective in locating the global optimal or
near-optimal solutions in complex LP problems with a vast search space. Although
the simulated annealing approach can often manage to make its way through the
381Integration in Logistics Planning and Optimization

traps of local optima, its ability and efficiency in exploring the search space is
highly limited by its characteristic of examining only one point of the space at a
time [59].
18.5.3 Simulation Modeling
Simulation modeling in the area of LP is used to observe how a real system per-
forms, diagnoses problems, predicts the effect of changes in the system, evaluates
logistics activities, and suggests possible solutions for improvements [60]. Because
of many influential sources of stochastic variation and interdependencies in
today’s LSs, simulation can be a highly effective tool in making operationally and
economically sound business decisions [61]. Advancement of computing facilities
and the development of user-friendly and easy-to-understand simulation software
packages (e.g. AutoMod, Arena, and SIMFLEX) are the encouraging motivations
toward the wider utilization of simulation modeling in SC analysis [12,14,61�65].
There are, however, two downsides for simulation modeling that can justify the
limited application of this methodology for the optimization of complex logistics
models [12,49]. First, it is difficult to search for an optimal value using simulation
techniques. Like heuristic techniques, the first and main drawback of a simulation
modeling is its inability to guarantee optimality of the developed solution. Second,
it is costly and takes much time and effort to analyze the obtained results.
Simulation software packages are generally very expensive to purchase and very
time consuming to analyze the autogenerated reports and results.
18.5.4 Genetic Algorithms
Introduced by John Holland [66], a genetic algorithm (GA) is a stochastic algo-
rithm categorized in the class of general-purpose search methods that simulate the
processes in a natural evolution system [67,68]. GAs combine directed and stochas-
tic search methods and are able to achieve a good balance between exploration and
exploitation of the search space [68]. GAs have been proven to be highly effective
in solving complex engineering and manufacturing problems, and some of their
successful applications in the optimization of LP models have been proposed in the
literature [22,49,69�80].
The advantages of using GA techniques for solving large optimization problems
are their robustness, searching flexibility, and evolutionary nature [59]. GAs are
able to search large, complicated, and unpredictable search spaces that facilitate
this technique to locate the optimal solution demonstrated by the convergence of
the fitness function as the number of evolutions increases [12,66,68,81,82]. GA
produces a large population of solutions, for each of which the evaluation of the fit-
ness function is sought; hence, a parallel computer is required when running GA
for very large-scale optimization problems [83].
There are, however, a number of challenges when designing a customized GA
procedure to solve a particular LP problem. The first challenge in developing a
GA-based optimization technique is to form the chromosome structure that
382 Logistics Operations and Management

accordingly affects the entire GA procedure. Based on the size and nature of the
problem, dissimilar LP problems require different chromosome representations, and
therefore the existing GA procedures cannot be used to solve different problems
from various complexity levels. The second difficulty is the construction of cus-
tomized genetic operators to perform the mating process on the chromosomes.
Lastly, the design of a constraint-handling mechanism is generally a complicated
task that ensures the effective implementation of the model constraints.
18.6 A Case Study
In Section 18.4 attention has been paid to the mathematical modeling of an inte-
grated LP problem using MINLF. Based on this formulation, this section presents
a medium-sized case study and uses GAs to find the optimal logistics plan for a
company producing and distributing home gym equipments. The following subsec-
tions will discuss the case problem, the optimization procedure, and the results
achieved.
18.6.1 Case Problem
Body shape group (BSG) has four manufacturing plants, four warehouses, and five
customer zones (end users) in major cities in Australia. BSG manufactures and dis-
tributes six types of home gyms (i1 � i6), including two types of benches (i1 and
i2), two types of stack machines (i3 and i4), and two types of plate-loaded machines
(i5 and i6). Plants 1 and 2 (m1 and m2) are located in Sydney and Melbourne and
are able to produce all six types of products. Plant 3 (m3) in Adelaide can only pro-
duce benches and stack machines (i1 � i4), and m4 in Perth is able to produce stack
machines and plate-loaded machines (i3 � i6). The planning horizon for the pro-
posed LP problem is 1 year, which comprises 12 equal periods of 1 month (t1 �t12). The aggregated demands for the six types of products at four end users are
known at every period of the planning horizon. Also known are the BSG
manufacturing and distribution data, including production and outsourcing costs for
each product type, inventory holding costs, transportation costs, and backlogging
costs.
Production capacity constraints as well as holding and distribution capacity
at stack buffers and warehouses are known for this case study. BSG has cer-
tain production and storage capacity constraints at each manufacturing plant,
backlogging limitations enforced from the customers, and holding and distribu-
tion capacity constraints at its stack buffers and warehouses. Partial delivery is
not allowed in this case problem, which implies that the customer demand for
each product at each end user is to be delivered in one lot; otherwise, the
associated demand will be backordered in order to be satisfied in subsequent
periods.
383Integration in Logistics Planning and Optimization

18.6.2 Optimization Procedure
With the presence of numerous variables in a complex LP problem, the optimal
solution can only be achieved by the delicate trade-off in allocating the production
of products to the manufacturing plants in the way to minimize the overall logistics
costs. For an LP problem of a realistic size, the size of the search space and the
number of feasible solutions could be extremely large. The principle of GA optimi-
zation differs from most traditional optimization methods in that GA is capable of
handling large search spaces easily [59,68,69].
In a typical type of GA (refer to Figure 18.2), the possible solutions of the prob-
lem are represented by chromosomes. Every chromosome is coded in the way to
contain the potential solution to the problem. This process is called chromosome
representation and forms the main difference between various GA models. In the
first step of the GA process, a population of chromosomes is created with a group
of randomly generated solutions (chromosomes). Then, all individuals in the popu-
lation are evaluated by scoring them based on how fit they are (i.e., a fitness value
for each chromosome). Following this, multiple individuals are randomly selected
from the population to produce offspring through the application of genetic opera-
tors (generally includes crossover operator and mutation operators). The generated
offspring form the new generation. Fitness values are evaluated again for the new
generation. Based on the concept of natural evolution, this process evolves toward
a better solution in consecutive generations. The reproduction process (i.e., scoring,
crossover, and mutation) is repeated until a suitable solution is found or the termi-
nation criteria are satisfied. This process is illustrated in Figure 18.2.
For the proposed case problem in this chapter, the developed cost function in
Section 18.4 (i.e., objective function in Eqn (18.1)) acts as the fitness function in
Figure 18.2 The typical GA process.
384 Logistics Operations and Management

the GA process. It has been a common approach in solving LP problems to define
the fitness function equal to the objective function, which in many cases is also the
cost function [49,74,75,78]. In this case, the chromosome with the lowest fitness
value signifies the fittest chromosome. To simplify the coding process, a linear
chromosome representation is adopted for the presented case study. In this way, all
of the decision variables (see Section 18.4) are located along a straight chromo-
some in which each gene of the chromosome accommodates the real value of a
variable.
A multipoint crossover operator is employed for the proposed GA model. In a
single-point crossover operator, a crossover point is randomly selected between the
first and last bits of the parents’ chromosomes. Parents 1 and 2 pass their binary
codes from the left of the crossover point to offspring 1 and 2, respectively. Then
the binary codes in the right of the crossover point of parent 1 and parent 2 go to
offspring 2 and offspring 1, respectively. The number of randomly selected cross-
over points determines the type of crossover used: single point, two point, or multi-
ple point. In terms of chromosome maintenance, the destructive effects of a
multipoint crossover may lead to more exploration rather than exploitation in chro-
mosomes, whereas having a small number of crossover points contributes to more
exploitation than exploration [12].
A simple flip nonuniform mutation is adopted as the background operator in the
sense that it helps GA find the solutions that crossover alone might not encounter.
A mutation operator alters a certain percentage of the bits (genes) in a chromo-
some. This can stop GA from early convergence and ensure the feasibility of the
developed offspring by maintaining diversity in the population [12]. Crossover rate
and mutation rate (e.g., the proportion of chromosomes in the mating pool on
which the crossover and mutation operator will apply) is to be determined experi-
mentally (i.e., trial and error practice).
It is always difficult to prove the convergence to the optimal solution in the opti-
mization of complex problems. Therefore, a termination point is generally set to
stop the process. A multiple termination condition is adopted in the proposed GA
procedure in this chapter: (1) stop by limiting the number of iterations or genera-
tions and (2) stop when minimal change in fitness value is observed in consecutive
generations.
18.6.3 Results Achieved
The GA model presented in Section 18.6.2 was coded in Microsoft Visual Basic
6.0 using MS Excel as the program interface. The machine used to run the pro-
gram was a PC with an Intel Core2 Duo Processor, with 4 GB DDR RAM at
1066 MHz. The program was run for a population size of 100 chromosomes,
crossover rate of 0.6, and mutation rate 0.2. To track the evolution of fitness
function and the rate of convergence, the overall logistics costs (the value of
objective function) and its cost components (including production costs, distribu-
tion costs, and shortage or backordering costs) were recorded at every generation
for 1500 iterations. Table 18.1 shows the achieved results (i.e., the average
385Integration in Logistics Planning and Optimization

fitness function values and their cost components) recorded at the intervals of
50 iterations.
The evolution of the average fitness function values is graphically illustrated in
Figure 18.3, demonstrating the reasonable convergence speed of the GA model.
The proposed model converges to optimality consistently with a typical reduction
in overall logistics costs of more than 10% (optimal cost of $3,017,958.97 at
Table 18.1 Numerical Results of the GA Model Recorded at Every 50 Generations
(Average Values)
Generation Objective Function
Value
Objective Function Cost Components
Production
Costs
Distribution
Costs
Backlogging
Costs
1 3362735.46 1535734.35 1785087.53 41913.59
50 3518056.29 1585712.71 1885604.83 46738.76
100 3432194.00 1570540.31 1816000.42 45653.27
150 3322349.64 1342030.76 1933676.20 46642.68
200 3332406.08 1395911.51 1890112.39 46382.18
250 3269328.90 1339857.54 1884197.35 45274.01
300 3300088.48 1279846.07 1972214.67 48027.74
350 3413263.23 1353061.36 2010694.26 49507.61
400 3237457.66 1182422.41 2003883.03 51152.22
450 3438569.33 1337718.85 2050300.23 50550.26
500 3335353.62 1317070.94 1964474.69 53807.99
550 3232867.64 1279079.26 1904696.90 49091.49
600 3113441.80 1143276.59 1921706.87 48458.34
650 3325795.10 1266882.61 2010020.71 48891.78
700 3239138.49 1188170.25 2002909.63 48058.61
750 3356759.78 1271412.43 2031592.60 53754.75
800 3383898.14 1301476.02 2031889.50 50532.62
850 3310228.58 1262840.23 1998644.31 48744.05
900 3231536.32 1236590.42 1945626.04 49319.87
950 3175533.05 1215303.27 1912822.28 47407.50
1000 3224699.33 1157885.90 2017513.73 49299.71
1050 3259193.36 1224197.47 1984848.84 50147.06
1100 3309834.29 1200427.46 2057050.37 52356.47
1150 3204893.68 1222135.88 1931309.80 51448.01
1200 3219992.61 1227578.66 1945790.49 46623.47
1250 3092748.56 1056950.94 1987857.14 47940.48
1262 3017958.97 1040282.48 1931422.03 46254.46
1300 3118698.65 1049077.61 2022842.91 46778.13
1350 3200044.66 1129250.06 2022542.90 48251.70
1400 3207720.89 1139170.30 2018833.82 49716.77
1450 3063926.54 994753.07 2023145.36 46028.12
1500 3185100.62 1097770.99 2040909.97 46419.66
386 Logistics Operations and Management

generation 1262 compared to the original cost of $3,362,735.46 at generation 1). In
another attempt, the model was run with the stopping condition of the model set to
terminate the process when the difference between the overall SC costs in 10 con-
secutive generations becomes less than $1. The results of this experiment indicate
that optimal results are typically achieved after 3200 iterations with only minimal
difference in fitness function value compared to what we achieved in generation
1262 from the first experiment (i.e., about 11% reduction in overall logistics costs
at generations 3224�3234 compared to just more than 10% in the first experiment
at generation 1262).
In a nutshell, the results achieved from these experiments reveal that the pro-
posed optimization model in this chapter yields significant cost-reduction benefits
within acceptable model runtime through the global integration of activities across
a logistics network.
References
[1] Y. Chang, H. Makatsoris, Supply chain modelling using simulation, Int. J. Simul. Syst.
Sci. Technol. 2(1) (2001) 24�30.
[2] H. Mohammadi Bidhandi, R.M. Yusuff, M.M.H. Megat Ahmed, M.R. Abu Bakar,
Development of a new approach for deterministic supply chain network design, Eur. J.
Oper. Res. 198(1) (2009) 121�128.
[3] A.M. Sarmiento, R. Nagi, A review of integrated analysis of production-distribution
systems, IIE Trans. 31(11) (1999) 1061�1074.
[4] F. Persson, J. Olhager, Performance simulation of supply chain designs, Int. J. Prod.
Econ. 77(3) (2002) 231�245.
[5] A. Muriel, D. Simchi-Levi, Supply chain design and planning—applications of optimi-
zation techniques for strategic and tactical models, in: A.G. de Kok, S.C. Graves
(Eds.), Handbooks in Operations Research and Management Science, (Volume 11),
Elsevier, 2003, pp. 15�93.
282930313233343536
1Cos
t fun
ctio
n va
lue
(× 1
00,0
00)
Generations
Cost function evolution Trendline (cost values)
100 200 300 400 500 600 700 800 900 100011001200130014001500
Figure 18.3 The evolution of fitness function (average values) in 1500 iterations.
387Integration in Logistics Planning and Optimization

[6] S.S. Pitty, W. Li, A. Adhitya, R. Srinivasan, I.A. Karimi, Decision support for inte-
grated refinery supply chains: Part 1. Dynamic simulation, Comput. Chem. Eng. 32(11)
(2008) 2767�2786.
[7] M.S. Sajadieh, M.R.A. Jokar, M. Modarres, Developing a coordinated vendor-buyer
model in two-stage supply chains with stochastic lead-times, Comput. Oper. Res. 36(8)
(2009) 2484�2489.
[8] S.W. Ryu, K.K. Lee, A stochastic inventory model of dual sourced supply chain with
lead-time reduction, Int. J. Prod. Econ. 81�82 (2003) 513�524.
[9] E. Eskigun, R. Uzsoy, P.V. Preckel, G. Beaujon, S. Krishnan, J.D. Tew, Outbound
supply chain network design with mode selection, lead times and capacitated vehicle
distribution centers, Eur. J. Oper. Res. 165(1) (2005) 182�206.
[10] M. Leng, M. Parlar, Lead-time reduction in a two-level supply chain: non-cooperative
equilibria vs. coordination with a profit-sharing contract, Int. J. Prod. Econ. 118(2)
(2009) 521�544.
[11] D.J. Thomas, P.M. Griffin, Coordinated supply chain management, Eur. J. Oper. Res.
94(1) (1996) 1�15.
[12] A.M.N. Lair, An Integrated Model for Optimising Manufacturing and Distribution
Network Scheduling, Ph.D. Thesis, School of Advanced Manufacturing and
Mechanical Engineering, University of South Australia, Adelaide, 2008, p. 266.
[13] C. Surie, M. Wagner, Supply chain analysis, in: H. Stadtler, C. Kilger (Eds.), Supply
Chain Management and Advanced Planning: Concepts, Models, Software, and Case
Studies, Springer, Heidelberg, Berlin, 2005.
[14] J. Banks, Getting Started with AutoMod, second ed., Brooks Automation, Inc.,
Chelmsford, MA, 2004 (permission of John Wiley & Sons, Inc.).
[15] D.W. Jordan, P. Smith, Mathematical Techniques: An Introduction for the Engineering,
Physical, and Mathematical Sciences, third ed., OUP, Oxford, 2002.
[16] J.W. Chinneck, Binary and mixed-integer programming, in: Practical Optimization: A
Gentle Introduction, Carleton University: Ottawa, Ontario, Canada, 2004 (Chapter 13).
[17] J.W. Chinneck, Introduction, in: Practical Optimization: A Gentle Introduction,
Carleton University: Ottawa, Ontario, Canada, 2004 (Chapter 1).
[18] M. Chen, W. Wang, A linear programming model for integrated steel production and
distribution planning, Int. J. Oper. Prod. Manage. 17(6) (1997) 592�610.
[19] A. Kanyalkar, G. Adil, An integrated aggregate and detailed planning in a multi-site
production environment using linear programming, Int. J. Prod. Res. 43(20) (2005)
4431�4454.
[20] A. Kanyalkar, G. Adil, Aggregate and detailed production planning integrating procure-
ment and distribution plans in a multi-site environment, Int. J. Prod. Res. 45(22) (2007)
5329�5353.
[21] A. Kanyalkar, G. Adil, A robust optimisation model for aggregate and detailed planning
of a multi-site procurement-production-distribution system, Int. J. Prod. Res. 48(3)
(2010) 635�656.
[22] T.-F. Liang, Fuzzy multi-objective production/distribution planning decisions with mul-
ti-product and multi-time period in a supply chain, Comput. Ind. Eng. 55(3) (2008)
676�694.
[23] K.S. Bhutta, F. Huq, G. Frazier, Z. Mohamed, An integrated location, production, dis-
tribution and investment model for a multinational corporation, Int. J. Prod. Econ. 86
(3) (2003) 201�216.
[24] J. Ferrio, J. Wassick, Chemical supply chain network optimization, Comput. Chem.
Eng. 32(11) (2008) 2481�2504.
388 Logistics Operations and Management

[25] H. Gunnarsson, M. Ronnqvist, D. Carlsson, Integrated production and distribution plan-
ning for Sodra Cell AB, J. Math. Model. Algorithms 6(1) (2007) 25�45.
[26] M. Hamedi, R. Farahani Zanjirani, M.M. Husseini, G.R. Esmaeilian, A distribution
planning model for natural gas supply chain: a case study, Energy Policy 37(3) (2009)
799�812.
[27] A.N. Haq, P. Vrat, A. Kanda, An integrated production-inventory-distribution model
for manufacture of urea: a case, Int. J. Prod. Econ. 25(1�3) (1991) 39�49.
[28] Y. Kim, C. Yun, S.B. Park, S. Park, L.T. Fan, An integrated model of supply network
and production planning for multiple fuel products of multi-site refineries, Comput.
Chem. Eng. 32(11) (2008) 2529�2535.
[29] Z.M. Mohamed, An integrated production-distribution model for a multi-national com-
pany operating under varying exchange rates, Int. J. Prod. Econ. 58(1) (1999) 81�92.
[30] T. Paksoy, H. Kursat Gules, D. Bayraktar, Design and optimization of a strategic pro-
duction-distribution model for supply chain management: case study of a plastic profile
manufacturer in Turkey, Selcuk J. Appl. Math. 8(2) (2007) 83�99.
[31] P. Tsiakis, L.G. Papageorgiou, Optimal production allocation and distribution supply
chain networks, Int. J. Prod. Econ. 111(2) (2008) 468�483.
[32] H. Yan, Z. Yu, T.C.E. Cheng, A strategic model for supply chain design with logical
constraints: formulation and solution, Comput. Oper. Res. 30(14) (2003) 2135�2155.
[33] H. Selim, C. Araz, I. Ozkarahan, Collaborative production-distribution planning in sup-
ply chain: a fuzzy goal programming approach, Transp. Res. Part E Logistics Transp.
Rev. 44(3) (2008) 396�419.
[34] K. Demirli and A.D. Yimer, Production-distribution planning with fuzzy costs, in:
NAFIPS 2006—Annual Meeting of the North American Fuzzy Information Processing
Society, 2006.
[35] C.-L. Chen, W.-C. Lee, Multi-objective optimization of multi-echelon supply chain net-
works with uncertain product demands and prices, Comput. Chem. Eng. 28(6�7)
(2004) 1131�1144.
[36] C. Dhaenens-Flipo, G. Finke, An integrated model for an industrial production-distribu-
tion problem, IIE Trans. 33 (2001) 705�715.
[37] B. Bilgen, Application of fuzzy mathematical programming approach to the production
allocation and distribution supply chain network problem, Expert Syst. Appl. 37(6)
(2010) 4488�4495.
[38] K. Das, S. Sengupta, A hierarchical process industry production-distribution planning
model, Int. J. Prod. Econ. 117(2) (2009) 402�419.
[39] N. Rizk, A. Martel, S. D’Amours, Multi-item dynamic production-distribution planning
in process industries with divergent finishing stages, Comput. Oper. Res. 33(12) (2006)
3600�3623.
[40] G. Barbarosoglu, D. Ozgur, Hierarchical design of an integrated production and 2-eche-
lon distribution system, Eur. J. Oper. Res. 118(3) (1999) 464�484.
[41] V. Jayaraman, H. Pirkul, Planning and coordination of production and distribution facil-
ities for multiple commodities, Eur. J. Oper. Res. 133(2) (2001) 394�408.
[42] T. Nishi, M. Konishi, M. Ago, A distributed decision making system for integrated
optimization of production scheduling and distribution for aluminum production line,
Comput. Chem. Eng. 31(10) (2007) 1205�1221.
[43] S.S. Syam, A model and methodologies for the location problem with logistical compo-
nents, Comput. Oper. Res. 29(9) (2002) 1173�1193.
[44] J. Xu, Y. He, M. Gen, A class of random fuzzy programming and its application to sup-
ply chain design, Comput. Ind. Eng. 56(3) (2009) 937�950.
389Integration in Logistics Planning and Optimization

[45] A.M. Geoffrion, A guided tour of recent practical advances in integer linear program-
ming, Omega 4(1) (1976) 49�57.
[46] G.B. Dantzig, Linear programming, Oper. Res. 50(1) (2002) 42�47.
[47] M.L. Fisher, An applications oriented guide to Lagrangian relaxation, Interfaces 15(2)
(1985) 10�21.
[48] C.A. Mendez, J. Cerda, I.E. Grossmann, I. Harjunkoski, M. Fahl, State-of-the-art
review of optimization methods for short-term scheduling of batch processes, Comput.
Chem. Eng. 30(6�7) (2006) 913�946.
[49] B. Park, H. Choi, M. Kang, Integration of production and distribution planning using a
genetic algorithm in supply chain management, in: Analysis and Design of Intelligent
Systems Using Soft Computing Techniques, 2007, pp. 416�426.
[50] J.W. Chinneck, Heuristics for discrete search: genetic algorithms and simulated
annealing, in: Practical Optimization: A Gentle Introduction, Carleton University,
Ottawa, Ontario, Canada, 2004 (Chapter 14).
[51] V. Jayaraman, A. Ross, A simulated annealing methodology to distribution network
design and management, Eur. J. Oper. Res. 144(3) (2003) 629�645.
[52] M.A. Cohen, H.L. Lee, Strategic analysis of integrated production-distribution systems:
models and methods, Oper. Res. Soc. Am. 36(2) (1988) 216�228.
[53] J.L. Coronado, An Optimization Model for Strategic Supply Chain Design Under
Stochastic Capacity Disruptions, Doctoral Thesis, College of Engineering, Texas A&M
University, Texas, 2008, pp. 1�110.
[54] L. Ozdamar, T. Yazgac, A hierarchical planning approach for a production-distribution
system, Int. J. Prod. Res. 37(16) (1999) 3759.
[55] D.F. Pyke, M.A. Cohen, Performance characteristics of stochastic integrated produc-
tion-distribution systems, Eur. J. Oper. Res. 68(1) (1993) 23�48.
[56] D.F. Pyke, M.A. Cohen, Multiproduct integrated production-distribution systems, Eur.
J. Oper. Res. 74(1) (1994) 18�49.
[57] P. Yilmaz, B. Catay, Strategic level three-stage production distribution planning with
capacity expansion, Comput. Ind. Eng. 51(4) (2006) 609�620.
[58] W.-C. Yeh, A hybrid heuristic algorithm for the multistage supply chain network prob-
lem, Int. J. Adv. Manuf. Technol. 26 (2005) 675�685.
[59] K. Xing, Design for Upgradability: Modelling and Optimisation, Ph.D. Thesis, School
of Advanced Manufacturing and Mechanical Engineering, University of South
Australia, Adelaide, 2006.
[60] M.J. Tarokh, M. Golkar, Supply chain simulation methods, in: 2006 IEEE International
Conference on Service Operations and Logistics, and Informatics, SOLI ’06, 2006.
[61] E.J. Williams, A. Gunal, Supply chain simulation and analysis with SIMFLEX, in:
2003 Winter Simulation Conference, USA, 2003.
[62] C. Chung, Simulation Modeling Handbook: A Practical Approach (Industrial and
Manufacturing Engineering Series), CRC Press, Boca Raton, FL, 2004.
[63] H. Pierreval, R. Bruniaux, C. Caux, A continuous simulation approach for
supply chains in the automotive industry, Simul. Model. Pract. Theory 15(2) (2007)
185�198.
[64] H.S. Hwang, G.S. Cho, A performance evaluation model for order picking warehouse
design, Comput. Ind. Eng. 51(2) (2006) 335�342.
[65] D. Burnett, T. LeBaron, Efficiency modeling warehouse systems, in: Proceedings of
the 2001 Winter Simulation Conference, 2001.
390 Logistics Operations and Management

[66] J.H. Holland, Adaptation in Natural and Artificial Systems: An Introductory Analysis
with Applications to Biology, Control, and Artificial Intelligence, University of
Michigan Press, Ann Arbor, 1975.
[67] K. Ganesh, M. Punniyamoorthy, Optimization of continuous-time production planning
using hybrid genetic algorithms-simulated annealing, Int. J. Adv. Manuf. Technol. 26
(2005) 148�154.
[68] B. Fahimnia, Optimisation of Manufacturing Lead-Time, Using Genetic Algorithm,
Master’s Thesis, School of Advanced Manufacturing and Mechanical Engineering,
University of South Australia, Adelaide, 2006, p. 151.
[69] R.A. Aliev, B. Fazlollahi, B.G. Guirimov, R.R. Aliev, Fuzzy-genetic approach to aggre-
gate production-distribution planning in supply chain management, Inform. Sci. 177
(20) (2007) 4241�4255.
[70] F. Altiparmak, M. Gen, L. Lin, A genetic algorithm for supply chain network design, in:
35th International Conference on Computers and Industrial Engineering, 2005.
[71] F. Altiparmak, M. Gen, L. Lin, I. Karaoglan, A steady-state genetic algorithm for mul-
ti-product supply chain network design, Comput. Ind. Eng. 56(2) (2007) 531�537.
[72] F. Altiparmak, M. Gen, L. Lin, T. Paksoy, A genetic algorithm approach for multi-
objective optimization of supply chain networks, Comput. Ind. Eng. 51(1) (2006)
196�215.
[73] F.T.S. Chan, S.H. Chung, S. Wadhwa, A hybrid genetic algorithm for production and
distribution, Omega 33(4) (2005) 345�355.
[74] R.Z. Farahani, M. Elahipanah, A genetic algorithm to optimize the total cost and ser-
vice level for just-in-time distribution in a supply chain, Int. J. Prod. Econ. 111(2)
(2008) 229�243.
[75] M. Gen, A. Syarif, Hybrid genetic algorithm for multi-time period production/distribu-
tion planning, Comput. Ind. Eng. 48(4) (2005) 799�809.
[76] A. Syarif, Y. Yun, M. Gen, Study on multi-stage logistic chain network: a spanning
tree-based genetic algorithm approach, Comput. Ind. Eng. 43(1�2) (2002) 299�314.
[77] A. Tasan, A two step approach for the integrated production and distribution planning
of a supply chain, Intell. Comput. 4113 (2006) 883�888.
[78] W.-C. Yeh, An efficient memetic algorithm for the multi-stage supply chain network
problem, Int. J. Adv. Manuf. Technol. 29(7) (2006) 803�813.
[79] A.D. Yimer, K. Demirli, A genetic approach to two-phase optimization of dynamic
supply chain scheduling, Comput. Ind. Eng. 58(3) (2009) 411�422.
[80] A. Kazemi, M. Fazel Zarandi, S. Moattar Husseini, A multi-agent system to solve the
production�distribution planning problem for a supply chain: a genetic algorithm
approach, Int. J. Adv. Manuf. Technol. 44(1) (2009) 180�193.
[81] R. Marian, Optimisation of Assembly Sequences Using Genetic Algorithms, Ph.D.
Thesis, School of Advanced Manufacturing and Mechanical Engineering, University of
South Australia, Adelaide, 2003, p. 287.
[82] B. Sobhi-Najafabadi, Optimal Design of Permanent Magnet Generators, Ph.D. Thesis,
School of Electrical and Information Engineering, University of South Australia,
Adelaide, 2002, p. 331.
[83] R. Haupt, S. Haupt, Practical genetic algorithms, Discrete Applied Mathematics, John
Wiley & Sons, Inc., New Jersey, 2004, pp. 1�261.
391Integration in Logistics Planning and Optimization

This page intentionally left blank

19Optimization in Natural GasNetwork Planning
Maryam Hamedi1, Reza Zanjirani Farahani2 and
Gholamreza Esmaeilian1,3
1Department of Mechanical and Manufacturing Engineering, UniversityPutra Malaysia, Serdang, Selangor, Malaysia2Department of Informatics and Operations Management, KingstonBusiness School, Kingston University, Kingston Hill, Kingston UponThames, Surrey KT2 7LB3Department of Industrial Engineering, Payam Noor Universiti, Iran
19.1 Introduction
19.1.1 Natural Gas Network Modeling
A vast number of real-world problems in various types of systems are presented
using network modeling. A network model represents a powerful visual that helps
to present connections among the system’s components used in different fields of
science. Optimization of network design, network flow, and network operation has
been considered as a fundamental issue in different research fields from technical
and financial perspectives. Usually, network problems are known as complex struc-
tural problems that, in real cases, seek optimal solutions. Considering the character-
istics of networks optimization problems, a large number of algorithms have been
developed in the literature, and many tried to solve them in reliable times to find
the most suitable and optimal solutions.
As one of the most important sources of energy, natural gas is used to satisfy
the needs of many commercial and residential users throughout the world
through a huge and complex network. Each day, a large amount of money is
spent on the different stages and main processes of this network, such as explo-
ration, extraction, processing, production, transportation, storage, and distribution
[1]. Since the 1960s, many different problems have been defined for the plan-
ning of design, flow, operation, and development of natural gas transmission
and distribution networks. The natural gas network planning problems are multi-
disciplinary, and have been tackled by researchers in different fields from around
the world.
Logistics Operations and Management. DOI: 10.1016/B978-0-12-385202-1.00019-0
© 2011 Elsevier Inc. All rights reserved.

19.1.2 Natural Gas Network Introducing
The aim of the natural gas network is to satisfying consumers’ demands efficiently
and at minimal cost. Therefore, some components should be used properly through
the network, and some processes should be planned exactly. In this section, the
main components of the natural gas network and its main processes are explained.
Natural Gas Network Components
Like other networks, natural gas network components can be divided into two
physical categories: fixed entities and current entities.
Fixed physical entities include arcs, which correspond with pipelines, compres-
sor stations, and valves and nodes that present physical interconnection points.
� Arc components
� Pipelines: The two types of pipelines of concern to researchers are passive pipelines,
which correspond to regular pipelines, and active pipelines, which are regular pipe-
lines with compressors [2].
� Compressor stations: The transmission capacity of a gas pipeline is limited but can be
arranged based on the supply-and-demand nodes by setting differences among input
and output pressures of the pipeline. Compressors are located at suitable locations
through the network to enlarge the pressure differences between two nodes of pipe-
lines to increase the network’s transmission capacity [2].
� Valves: To make the flow of natural gas stop for a certain section of pipelines in situa-
tions such as maintenance or replacement, valves are used along the entire length of
interstate pipelines.� Node components. As shown in Figure 19.1, components belonging to nodes in the natu-
ral gas network include the following:
� Supply nodes, which have only output flow
� Demand nodes, which have only input flow
� Intermediate nodes, which have both input and output flows
Current physical entities can be classified as financial, informational, and physi-
cal flows. Usually, flows in the natural gas network are controlled by a dispatcher
or dispatching organizations. These organizations obtain information about natural
gas pressures and flows over pipeline systems and check warning signals from
companies via simulation systems.
Natural Gas Network Processes
The natural gas is supplied through gas and oil wells and produced in refineries. In
the natural gas network, some methods exist to move gas from producers to consu-
mers in order to satisfy customers’ demands, but the pipeline system is the most
cost-effective way to transport gas over long distances. Consumers of natural gas
are divided into three main groups: domestic and commercial subscribers, industrial
consumers, and exports. Usually, the priority of natural gas networks is to serve
domestic and commercial consumers.
394 Logistics Operations and Management

Natural gas suppliers and natural gas consumers are connected through a com-
plex and huge network in such a way that there is a long distance between them,
and natural gas must flow by the use of suitable pressure. During long transporta-
tion, pressures are lost because of friction between the natural gas and the inner
walls of pipelines. In addition, the natural gas volume is reduced because of heat
transmitted from the environment. Therefore, compressor stations are installed to
set and hold pressure continuity along the network and to periodically determine
the capacity of the transmitted gas.
Generally, compressor stations are one of the most complex entities in a natural gas
network because they consist of several compressor units (typically 15�20) that have
been connected in different configurations such as series, parallel, or a combination of
both, and they have different types [3]. Two of the main types of compressor units are
centrifugal and reciprocating units. Centrifugal units are more common in the industry
and consequently in related research assumptions [4]. Without considering which type
of the compressor unit is used in the model, both types of unit have two options—
turning on and turning off—which makes their behavior nonlinear. When the demand
of the customer increases, the pressure of the pipeline drops. Therefore, at least one
compressor should be opened until the gas pressure resumes an acceptable level [5].
Figure 19.1 Natural gas network components.
395Optimization in Natural Gas Network Planning

The whole process of the natural gas network can be concluded in four main
parts: supply, transportation, storage, and sale of the natural gas in the market
places.
SupplySupply usually starts with development and exploration, extracting the gas reserves,
and processing the extracted gas. In practice, the same company performs all three
functions. Exploration is concerned with locating natural gas and petroleum depos-
its. After a team of exploration geologists and geophysicists has located a potential
natural gas deposit, in the extraction phase a team of drilling experts digs down to
where the natural gas is assumed to be [30].
TransportationNatural gas transportation is the most important process in the natural gas indus-
try. It consists of a complex pipeline network that moves natural gas from various
origins to consumers in order to satisfy their demands. The network is divided
into two main networks, namely, transmission and distribution. Moving a large
volume of gas at high pressure over long distances from a gas source to distribu-
tion centers is done in transmission networks. Routing gas to individual consum-
ers is done through distribution networks [6]. The efficiency of transportation is a
suitable criterion to estimate the whole of a natural gas system’s performance.
Considering the aim of the network and consequently the physical characteristics
of its components, the natural gas network can be split into the transmission net-
work and distribution networks. The scope of both networks is presented in
Figure 19.2.
Transmission network: Rıos-Mercado et al. [6] have shown how a gas transmis-
sion network, including pipelines, junction nodes, and compressor stations, is dif-
ferent from conventional networks by two special characteristics. (1) Beside the
flow variables, which present the mass flow rate for each arc, a pressure variable is
Refinery Refined gas
Importation ExportationFuel of station
CGS
Storage
Domestic and commercial
Power plan
Transmission network
Distribution
Evacuation to air
Injection
Gas andOil
CS
Figure 19.2 The process of transportation during the natural gas network.
396 Logistics Operations and Management

defined at every node. (2) Unlike most networks, which consider only mass flow
balances, transmission networks take into account two other types of constraints:
� A nonlinear equality constraint on each pipe caused by the connection that exists between
flow and pressure drop.� The feasible limits that are available to operate pressures and flows inside each compres-
sor, which are represented by a nonlinear and nonconvex set.
Usually, the operating expenses of the natural gas transmission network are esti-
mated through the operating costs of the compressor stations, which can be deter-
mined based on the fuel consumed at each compressor station. For example,
Borraz-Sanchez and Rıos-Mercado [7] estimated that 3�5% of transmitted gas is
consumed by compressor stations. Because a huge volume of natural gas is being
transported through the network, about 25�50% of the total operating budget of
companies is spent on running the compressor stations. Therefore, minimizing the
total fuel consumption of the compressor stations along the network is one of the
main objectives for transmission networking because of its effects on overall gas
operation costs [6].
Distribution network: Distribution networks are different from transmission net-
works in several perspectives. They do not have valves, compressors, or nozzles,
and pipes act under fewer pressures. Therefore, pipelines are smaller, and networks
are simpler [8]. Most natural gas users, which are domestic and commercial consu-
mers, receive the gas from local distribution companies. A smaller number of natu-
ral gas users such as power-generation companies receive the natural gas directly
from high-capacity interstate and intrastate pipelines. In large municipal areas,
local gas companies usually deliver gas to users through stations called city gates.
For the design of distribution networks, first the network topology should be
defined by technical teams; second, required features must be determined so pipe-
lines and pumps can meet the flow of their nodes and pressure requirements [8].
StorageBecause natural gas processes, including exploration, production, and transporta-
tion, are time consuming and because all of the produced natural gas is not always
needed at various destinations, a part of the extra gas is injected into storage units,
which usually are located near market centers and are usable for unlimited periods.
Gas storage is one of the new and critical steps of the natural gas network process
that must respond to the demands of different periods of the year. Traditionally,
during summer months, natural gas was stored to respond to increased demands
during the coldest months, but nowadays natural gas demand in summer has
increased because special users such as power-generation companies must produce
electricity for air conditioners during summer. In addition, natural gas storage plays
a critical role in unexpected events such as natural disasters, which may affect pro-
duction and transportation. In general, some of the main reasons behind using stor-
age along the natural gas network are its capability to respond to cyclic
fluctuations when temperatures vary and consumption is high, improving services
to all customers, keeping market shares competitive with other sources of energy,
397Optimization in Natural Gas Network Planning

and achieving operations with high load factors. Natural gas storage can be done in
different ways, but underground reservoirs are the most important method. The
storage deals with pipelines, local distribution companies, producers, and pipeline
shippers (US Department of Energy, US Energy Information Agency, March
1995).
Sales and MarketingMarketing natural gas means selling natural gas or organizing its business from
well to end users at various levels. At this stage, all of the required intermediate
steps are considered: transportation arrangements, storage, accounting, and espe-
cially sales. Marketers in the natural gas industry play a complex role and may be
joint endeavors with producers, pipelines, or local utilities or may be an indepen-
dent group concerned with selling natural gas to retailers or end users. Natural gas
usually has three to four owners before reaching customers. Marketers utilize their
skills to reduce their exposure to risks and increase throughput by forecasting the
behavior of the natural gas market, finding buyers, and securing ways to deliver the
natural gas to end users.
19.2 Natural Gas Network Problems
19.2.1 Formulating
A number of useful notations and concepts are common in most of the developed
models dealing with network optimization in the natural gas industry and can be
useful to researchers who want to start modeling. As mentioned previously, the nat-
ural gas network is composed of pipelines and compressor stations as arcs and
nodes. Several general indices and parameters will be presented here and are
depicted in Figure 19.3. For more details, see Rıos-Mercado [3].
Indices:
i,j: index of nodes, i,jAN5 f1; . . . ; Nj jgk: index of compressor stations, kAC5 f1; . . . ; Cj jgm: index of units (turbocompressor) of compressor station, mAU5 f1; . . . ; Uj jgl: pipelines, lAL5 f1; . . . ; Lj jgn: nodes
c: compressor stations
i
pi
x1i x j2
pj
j
Supply node
1
a1 > 0 a i = 0 a j = 0
Demand node
Transshipment node
Transshipment node
2
Figure 19.3 Basic notations for planning models in natural gas networks.
398 Logistics Operations and Management

l: pipelines
u: units
Sa: set of arcs
Parameters:
Pij: associate capacity between ith and jth nodes
Cij: transshipment cost for each unit of natural gas between ith and jth nodes
Variables:
Pi: the gas pressure at node i
Xij: the mass flow rate between nodes i and j
αi: the net flow through the node i
μmk 51; if unit m of compressor station k must be opened
0; if unit m of compressor station k must be closed
�
Considering the above notations, Sa5 L,C in a manner that L-C5[.
In some problem areas, the nonlinear behaviors of compressor stations units (tur-
bocompressors) are considered. Figure 19.4 presents the positions of turbocompres-
sors in a compressor station. Turning these turbocompressors on and off is one of
the main decisions that have to be taken in the natural gas network [3].
19.2.2 Optimization
In optimization problems, the search for the optimal solution is done by iteratively
transferring the current solution to a newer and hopefully better solution.
Optimization methods can usually overcome numerical simulation approaches
because of two main limitations. First, there is no guarantee from simulation
approaches that the achieved result is optimal (or cost is minimal). Second, deter-
mining pipe diameters depends only on the experience of users. Therefore, for
the same problem, different users always take different decisions, which is not of
interest [8].
A typical pipeline network for delivering natural gas requires a vast number of
facilities and limitations, which should be considered. Because of the complex
nature of the natural gas pipeline network, problems defined in this scope seek
i j. . . pi: suction
pressure press
pj: dischargepressure press um
u1
m1ki
mmk
Figure 19.4 The behavior of
compressor station units.
399Optimization in Natural Gas Network Planning

different aims and methods that certain requirements have to be considered in their
optimization methodologies to achieve satisfactory and robust enough solutions to
cover the most important aspects of the network. In such complex and huge net-
works, proper planning for transmission and distribution networks has a special
importance because even a small reduction in operation expenses and investment
costs can include considerable amounts of money and improvements in the system
utilization, which is more valuable in gas-rich countries. Growing natural gas net-
works, make them more complex, and from the optimization perspective, develop-
ing effective algorithms becomes more important.
Network Optimization
According to Osiadacz [19], network optimization means finding a certain objec-
tive function in such a way that design parameters, development structures, and
parameters of the network operation are optimum. In the last two decades, so many
researchers in the natural gas area have paid attention to optimization methods to
find the optimal solution in various fields of the natural gas industry. Depending on
which decisions are going to be made and what are the variables that are sought to
make optimum objective function, all optimization problems defined in this field
can be decomposed into four groups: optimal design, optimal flow, optimal opera-
tion, and optimal expansion.
Network DesignNetwork design decisions are key strategic decisions, and the consequences of mak-
ing these decisions poorly are often severe [10]. The network design problem occurs
in many diverse application areas, including facility location, material-handling sys-
tems, natural gas or electric power transportation, and telecommunications.
In the optimal design of a natural gas network, the main design parameters of
basic components of the network including pipelines and compressor stations are
provided over a planning horizon in such a way that considering the network
constraints the customers are satisfied with a minimum annualized cost [11,12].
Outputs of the system will be the design characteristics of pipelines, including
diameters, pressures, and flow rates, and such design parameters of compressor sta-
tions as location, suction pressure, pressure ratio, station throughput, fuel consump-
tion, and station power consumption. Each parameter and characteristic influences
the overall construction and operating cost to some degree [12].
Mohitpour et al. [13] defined and explained the major influencing factors on
pipeline system design: properties of fluid, design conditions, magnitude or loca-
tions of demand and supply nodes, codes and standards, route, topography, access,
environmental impacts, financial matters, hydrological impacts, seismic and volca-
nic impacts, material, construction, operation, protection, and long-term integrity.
Network FlowThe main objective of network flow optimization in the natural gas and other
industries is minimizing costs and providing sufficient services to customers, which
400 Logistics Operations and Management

is close to operational decisions. In this type of problem, decision variables are
defined to determine the volume of gas flowing through the network. Many of the
network flow’s problems such as minimum cost flow problems, shortest path pro-
blems, maximum flow problems, and transmission network planning can be mod-
eled as different forms of mathematical programming with linear or nonlinear
functions and integer or mixed-integer variables.
To date, many models have been developed to describe the gas flow though the
network as well, but there are several difficulties to find the suitable solution for
the developed models because of their nonlinear and nonconvex nature [3].
By making use of the introduced notations, the general form of network flow
model, taken from Ahuja et al. [14], can be presented as follows:
Minimize
Xði;jÞAN
CijXij ð19:1Þ
subject to
Xfi:ði; jÞANg
X2ij
Xfj:ðj;iÞANg
Xji 5αi ð19:2Þ
0#Xij #Pij ’i; jAN ð19:3Þ
Set of the first constraints (Eqn (19.2)) is mass balance constraints, and set of
the second constraints (Eqn (19.3)) presents the capacity boundaries for gas flowing
between the ith and jth nodes.
Network OperationSome operational decisions should be taken into account for the network to ensure
that the demand for natural gas is met. At high pressures of natural gas, the opera-
tion cost of the network is determined based on the operation of compressors
because of the significant percentage of running costs of compressor stations in the
total budget of companies. In low and medium pressures, an optimal operational
cost is achieved through leakage reduction by optimizing the nodal pressures [9].
In general, the operating cost belonging to the natural gas network normally takes
up more than 60% of the total cost of the pipeline [5]. Therefore, operational deci-
sions have a significant effect on the network performances. Given the fact that the
amount of natural gas in the pipeline system is set by compressor stations and that
the cost associated with the operation of compressor stations, including turning
them on and off, the most critical operational decision in a natural gas network is
selecting compressors. This important decision, which is influenced by the com-
pressors’ capacity and the energy required to turn the compressor units on and off,
significantly affects total natural gas operation cost. Another critical factor on the
performance of the natural gas network is starting or stopping compressors because
of their different outputs [5]. Therefore, efficient operation of the complex
401Optimization in Natural Gas Network Planning

networks of natural gas can substantially reduce airborne emissions, increase
safety, and decrease the daily operating cost [3].
Network ExpansionIn today’s competitive markets, natural gas companies are interested in expanding
the network and consequently serving potential customers because their market
shares will be larger and the achieved profits will increase. In network expansion,
generally the objective is scheduling the investments to supply an economic and
reliable energy with minimal cost, which is not easy to achieve [15]. To make an
optimal capacity expansion of natural gas network, several decisions regarding the
time, size, and location of expansion should be made [11]. The projects dealing
with networks expansion have various steps that are different from country to
country and from company to company based on rules and governmental eco-
nomic policies [16].
Referring to the literature, researchers mentioned different aspects to current
difficulties of network development and expansion. Davidson et al. [10] have indi-
cated these difficulties from some angles: the many existing options for expanding
and generating a prespecified layout, existing uncertainties in absorbing the custo-
mers and profits, difficulty in estimating construction costs because of difficulties
in calculating the length and unit cost per length for new pipes to expand, and
finally the dynamic nature of the problem. In this matter, Kabirian and Hemmati
[16] have paid attention to the presentation of an integrated strategic plan, which
considers different aspects of the network development on a long-time horizon.
They introduced the difficulties of this subject in various points, including cover-
ing development and strategic planning in both short and long run, identifying the
locations and schedules of new compressor stations and pipelines in the network,
determining the best type and routing of the pipelines, selecting the best combina-
tion of natural gas procurement from available sources, and providing the best
operating conditions for compressor stations in long-run horizons [16]. By accu-
racy of data input for new substation availability, substation reinforcements, local
generation, and future load location, which should be sent under dynamic or non-
determined status, a robust decision making is possible. These uncertainties can be
presented in mathematical models as well, but the nature of the problem, which is
nonconvex and multiobjective, makes it difficult to solve. However, it can be sim-
plified through linearization of the objective functions and simplify the problem
description [15].
Chung et al. [17] focused on transmission networks planning through a mathe-
matical model with three objectives, including investment cost, reliability, and
environmental impacts. The model was formulated using the approach of goal pro-
gramming and solved by a genetic algorithm (GA). For analyzing the decisions, a
fuzzy decision method was used to select the best scheme. In distribution networks,
Carvalho and Ferreira [15] proposed an evolutionary algorithm for the stochastic
planning of the large-scale networks under uncertain conditions and introduced the
difficulties of optimizing networks expansion, including multistage investment
decisions, the large-scale distribution network, and a huge variety of operation
402 Logistics Operations and Management

policies, variable demands, investment costs, equipment variabilities, and locations
that make the decision very insightful.
The reviewed papers in the scope of optimization in the natural gas industry
based on the decisions tried to make have been classified in Table 19.1.
19.2.3 Model Characteristics
Each defined problem on natural gas networks follows several assumption. The
assumptions are presented in the form of constraints and affect the problem com-
plexity and formulation. In addition, sometimes researchers focus on part of a
network that has special characteristics. Usually, in this area some properties are
determined as the problem statement first. Some of the most usual attributes of nat-
ural gas network problems have been illustrated in this section.
Steady State or Nonsteady State
The state of natural gas pipeline networks in different models is presented with two
main categories: steady state and transient state. These states are determined
through considering or not considering a partial differential equation involving deri-
vation with respect to time [4]. In other words, this classification is dependent on
how the gas flow changes in relation to time.
Steady state: In a large number of previous researches with optimization pro-
blems in the field of natural gas network, the operation of systems is assumed in
steady states because in the previous decades there was no need to quick responses
to variability of demands and conditions and problems were simplified by convert-
ing to subproblems in steady states [18].
In a steady-state system, the flow of gas is determined with some values which
are independent from the time and constraints of the system, especially the ones
describing the pipelines gas flow are described by algebraic nonlinear equations
[6]. In the steady-state assumptions, it is possible to work out the partial differential
equation and reduce to a nonlinear equation with no derivatives, which from the
optimization view makes the problem more tractable [4].
Because loads and supplies are not a function of time in steady-state problems,
the structure of the network—including the number of sources, compressor stations,
valves and regulators, and the optimal parameters of operations including pressures
and flows—are determined once [9]. General equations for steady-state flows in
natural gas networks have been collected in Coelho and Pinho [19].
Nonsteady (transient) state: When load variations in a system are high, steady-
state operations of that system are not desirable or even possible to consider such
as when factors like deregulation and peak shaving are being considered.
Therefore, efficient and responsive operations in dynamic statuses are essentially
required to respond rapid variations in demands and conditions [18]. In a transient
state system, the system variables such as mass flow rates through the pipelines
and gas pressure levels at each node are defined as the functions of the time
403Optimization in Natural Gas Network Planning

Table 19.1 Classified Papers Based on Their Problem’s Objectives
Author Type of Network Network Design Network Flow and Operation Network
Expansion
Transmission Distri-
bution
Investment
Cost
Minimization
Maximizing
NPV
Maximize
Customer
Satisfaction
Minimize
Transporta-
tion Cost
Compressor
Selection to
Minimize
Costs
Fuel Cost
Minimization
Maximize
Customer
Satisfaction
Optimize
Scheduling
of
Investments
Carvalho and Ferreira [15] — O — — — — — — — OWu et al. [22] O — — — — — — O — —
Rıos-Mercado [3] O — — — — — — O — —
Uraikul et al. [5] O — — — — — O — O —
Chung et al. [17] O — — — — — — — — OBorraz-Sanchez and Rıos-
Mercado [4]
O — — — — — — O — —
Mora and Ulieru [24] O — — — — — — O — —
Davidson et al. [10] — O — O — — — — — —
Rıos-Mercado et al. [6] O — — — — — — O — —
Kabirian and Hemmati [16] O — O — — — — — — —
Abbaspour et al. [18] O — — — — — — O — —
Wu et al. [8] — O O — — — — — — —
Sadegheih and Drake [28] O — — — — — — — — OBorraz-Sanchez and Rıos-
Mercado [7]
— — — — — — — O — —
Hamedi et al. [1] O O — — — O — — — —

dynamically. Usually, descriptive models are used to analyze transient states
because of their intractable from the optimization point of view [7].
Cyclic Topology or Noncyclic Topology
Two fundamental types of network topologies are cyclic topology and noncyclic
topology.
Cyclic: A cyclic topology is concerned with a network in which at least one
cycle is present, including two or more compressor station arcs such as in
Figure 19.5. In practice, effective algorithms for cyclic topologies do not exist [7].
Noncyclic: Most of the pipeline systems have noncyclic structures. A serial (or
gun-barrel) structure is a special type of a noncyclic network where the associated
reduced network is a simple path [3]. Tree structures are another type of the noncy-
clic topology. A tree structure involves multiple converging and diverging branches
in such a way that all nodes have in-degree equal to one, except one node, which
has in-degree equal to zero [3]. Figure 19.6 is a sample for a serial topology, and
Figure 19.7 presents a tree topology in natural gas networks.
To recognize the natural gas network topologies, Borraz-Sanchez and Rıos-
Mercado [7] explained a usual methodology. First, remove the compressor arcs from
a given network temporarily. Second, merge the remaining connected components
and eventually put the compressor arcs back in place. The obtained network is a
reduced network. Three cases will occur from the reduced network. If it has a single
path, the given network has a serial (gun-barrel) topology. If in the reduced network
the compressors are arranged in branches, then the topology is a tree. If in the reduced
network compressor stations are arranged to form cycle, the topology is cyclic.
19.2.4 Types of Methods
After introducing the natural gas problems and their main characteristics to distin-
guish them from each other, a basic classification is done regarding methods of
solving the natural gas pipeline networks. To find the best solution for the network
problems, estimating the problem complexity is very important. It is quite clear to
scholars in this area that the problems with cyclic structure are more difficult to
Figure 19.5 A cyclic topology.
405Optimization in Natural Gas Network Planning

solve than problems with noncyclic topology. In other words, the dimension of pro-
blems with cyclic topology is usually large and cannot be reduced by removing or
fixing variables as happens in some noncyclic topology problems. The majority of
the noncyclic gas network topologies have been developed based on dynamic pro-
gramming and there are a large number of optimization algorithms for this type of
topologies. Before we explain the suitability of methods for solving the planning
problems of the natural gas network, we present Table 19.2.
Dynamic Programming
For the last few decades, dynamic programming (DP) has been utilized to opti-
mally solve very large noncyclic networks such as gun-barrel and diverging
branch tree systems, and some subclasses of cyclic networks. In general, to solve
network problems with noncyclic systems by DP, flow variables are determined
in advance and pressure variables are kept. Therefore, by converting a multi-
dimensional problem into one dimension, the problem is simplified and solved
easily. In a diverging branch, the problem is decomposed into a sequence of
several one-dimensional DP problems in such a way that each deals with a sin-
gle branch [6].
Since a DP simply satisfies constraints of any natural gas network and over-
comes to nonconvexity and nonlinearity difficulties of feasible solutions, it can be
used for noncyclic topologies but its computation difficulties increase with pro-
blems dimensions exponentially [7]. Unlike noncyclic topology, the applicability of
DP for cyclic topologies is limited because the cycles break the linear structure of
the network and the flow variables must be explicitly managed. In other words, the
Figure 19.7 A tree topology.
Figure 19.6 A serial (gun-barrel) topology with three compressor stations.
406 Logistics Operations and Management

DP for cyclic networks will be multidimensional. The main limitation of DP
regarding the cyclic topology is that to solve this type of the problem the flow vari-
ables must be fixed. Therefore, the achieved solution is optimal only with respect
to a prespecified set of flow variables [4]. As it would appear from the literature,
by increasing the consideration of cyclic topologies in the defined problems
belonging to the natural gas system, the success of DP has been reduced.
Gradient Search
In 1987, the generalized reduced gradient (GRG) was introduced for the first time.
GRG is based on a nonlinear optimization technique for noncyclic structures. In
comparison to DP approaches, in the dimensionality issue for cyclic topologies
GRG acts well, but it does not guarantee a global optimal solution, especially in
cases where decision variables are discrete [4,7].
Hierarchical Control Mechanisms
In some transmission and distribution network problems, which are difficult to
solve in an integrated way, other techniques such as hierarchical structures can be
used in the process of solution to decompose the solution space to several levels.
In the case of natural gas network hierarchical approaches, Rıos-Mercado et al.
[6] illustrated that the overall network is decomposed into two levels: the network
state level as the highest level, and the compressor station level as the lowest
level.
Mathematical Programming
Since DP can not avoid trapping into the local optimum solutions, DP-based
approaches and gradient searches have not had a valuable success rate to overcome
difficulties of cyclic topologies in natural gas network problems. Therefore, these
methods are more useful for the problems, which have fixed the flow variables,
and consequently the optimality of the solution is only with respect to a prespeci-
fied set of flow variables. For more than half a century, mathematical programming
approaches have been used in various sections of the natural gas industry. Because
Table 19.2 Priority of Methods to Solve Natural Gas Network Problems
Method Topology
Cyclic Noncyclic
DP 4 1
Gradient search 2 2
Hierarchical programming 3 3
Mathematical programming 1 4
407Optimization in Natural Gas Network Planning

of nonconvexity of feasible solutions and nonlinearity and nonconvexity of objec-
tive functions of natural gas optimization problems formulated by mathematical
models, a large number of local optimum solutions exist where metaheuristic meth-
ods help to escape from the local optimality. Overall, a rapid improving in optimi-
zation algorithms is seen for solving complex mathematical models of natural gas
networks, which has had a significant growth especially for cyclic topologies
because of difficulties in solving the problems.
19.3 Survey on Application of Optimization
Many optimization approaches have been developed to make significant improve-
ments in different fields of the natural gas networks with a number of general
assumptions, but still a tremendous potential exists in this field. By increasing the
complexity of natural gas problems, more algorithms are being defined from the
optimization perspective. Therefore, analyzing the previous researches can be help-
ful to scholars for future research. Rıos-Mercado [3] focused on reviewing fuel cost
minimization, which is only one field of optimization in the natural gas industry.
Considering the application of optimization methods in different fields of this criti-
cal industry and its importance in all fields, this section focuses on comprehen-
sively surveying the most important optimization problems in the natural gas
network and organizing the latest papers on this topic.
19.3.1 Subnetworks
Transmission
Some of the problems of natural gas, which have been formulated mathematically,
obey the general frame of mathematical models. This means each mathematical
model includes an objective function, some constraints, and a number of variables
in such a manner that the differences among these components separate developed
models.
Chung et al. [17] developed a fuzzy mathematical model that considered more
than one objective to solve the planning problem of transmission networks, which
tries to optimize investment cost, reliability, and environmental impacts. The
developed model was solved through a GA, and efficient results were achieved.
To minimize the operational cost of natural gas networks, one of the most critical
operations studied by some researchers is the compressor selection. This problem
is important because it is associated with the cost of turning compressors on and
off, which is a considerable part of total operation cost. Uraikul et al. [5] pre-
sented the compressor selection problem in the form of a mixed-integer linear
programming (MILP) and by considering three types of the cost including operat-
ing cost, start, and stop penalties. The mentioned penalties refer to the cost of
turning the compressors on and off in such a way that the energy used for start-
ing a compressor is more than the required energy for stopping it. To escape
408 Logistics Operations and Management

from being trapped in this model into nonlinearity, some types of cost, which are
based on time or have uncertainties such as maintenance cost, have not been con-
sidered in the developed model. Among researchers who have focused on the nat-
ural gas network optimization, only a few have adopted the difficulties of cyclic
topologies and have not simplified the problem to the linear or tree structure. The
research work of Borraz-Sanchez and Rıos-Mercado [4] is in this group. They
presented the problem of optimal operation of a natural gas pipeline system in
cyclic topologies through combining a nonsequential DP approach within a Tabu
search (TS) technique through four main phases: preprocessing, finding an initial
feasible flow, finding an optimal set of pressure values, and flow modifications.
What makes this work different from noncyclic research is flow modification,
which was done in noncyclic approaches by determining a unique set of optimal
flow values in the preprocessing phase. What makes this work a little far from
reality are its steady-state assumptions.
Kabirian and Hemmati [16] developed a nonlinear optimization mathematical
model for formulating a strategic planning model to find the best feasible develop-
ment plan for natural gas transmission networks. The objective of the developed
model was determining the type, location, and installation schedule of pipelines
and compressor stations over a long planning horizon with the goal of least cost
and with a consideration of network constraints. To achieve optimal or near opti-
mal plans, an algorithm based on random searches was applied. Mahlke et al. [20]
formulated the problem of transient technical optimization in the form of a mixed-
integer nonlinear problem with the aim of minimizing the fuel gas consumption.
Because of difficulties with the time-dependent natural gas transmission network,
they limited their work to achieve a good feasible solution in a suitable run time
through a simulated annealing (SA).
Distribution
In spite of the simplicity of distribution networks and the relatively low importance
of the transmission network from the perspective of design cost, it is very critical
to satisfy costumers. A considerable number of optimization methods in the form
of mathematical models have been developed for distribution networking to find
the best design and optimal operation along the pipelines. Among reviewed papers,
Carvalho and Ferreira [15] tried to develop a mathematical model for large-scale
distribution networks to make robust expansion on variable conditions and
under deregulation. Wu et al. [8] considered a nonlinear network and proposed the
problem of minimizing the investment cost through the distribution network under
steady-state assumptions. They developed a model by introducing new variable and
converting the primal problem to a nonconvex constrained problem. Therefore, by
escaping from the available difficulties in solving the primal nonsmooth and non-
convex problem of designing a distributed layout, a global optimization approach
was achieved. Moreover, Davidson et al. [10] also focused on investment planning
in the natural gas distribution networks.
409Optimization in Natural Gas Network Planning

19.3.2 Main Problems
Fuel Cost Minimization
Because of the long distances among the supply and consumption nodes in the
natural gas network, many compressor stations are used along the route to set the
natural gas pressure throughout the pipeline systems. By considering the tremen-
dous amount of transported gas in pipelines per day, minimizing the gas consumed
by compressors is critically important. Global optimization can be lead to a 20%
saving in fuels consumed by compressor stations [21]. To date, a great deal of
research has been performed to develop new techniques to decrease the consumed
fuel of consumption in compressor stations.
In the problem of fuel cost minimization, the decision variables are pressure
dropped at each node of the network, flow rate at each pipeline, and the number of
units operating within each compressor station [22]. In general, defined problems
for the fuel cost minimization differ from each other because of some assumptions
and methodologies applied by researchers to determine the value of variables in the
optimal case. In a number of previous works, to avoid or decrease the nonlinearity
of the model, the number of compressor units in each compressor station has been
considered as fixed. In addition, some of the developed models have been simpli-
fied by considering only one unit for each compressor station, whereas compressor
stations usually have multiple units. Balancing or not balancing the network is
another matter. If the network is assumed balanced, then in each node of the net-
work the sum of all net flows will equal zero. This means there are no differences
between the total output flows of supply nodes and input flows to demand nodes
[23]. Other assumptions may be related to a steady state or a transient state of the
model or topology of the networks, which are referred to the problem statement. In
addition, regarding the methodology, in some research if there is more than one
variable, the values of variables are achieved simultaneously. In contrast, some of
the researchers have proposed methodologies based on multistage iterative proce-
dures. Rıos-Mercado et al. [6] developed a two-stage procedure to optimize the
fuel cost minimization in such a way that gas flow variables were fixed at the first
stage and optimal pressure variables were found via DP. Then the pressure vari-
ables were considered fixed at the second stage, and a set of flow variables was
achieved, taking the network topology into consideration to improve the objective
function. Some authors relax the nonconvex and nonlinear models by relaxation
techniques because generally such problems are very difficult to solve. For exam-
ple, for fuel cost minimization, Wu et al. [8] developed a mathematical model with
steady-state assumptions and a nonconvex feasible domain; a nonlinear,
nonconvex, and discontinuous fuel function; and a nonconvex set of pipeline flow
equations. To solve the developed model, it was relaxed in two ways. First, the fuel
cost objective function is relaxed; second, nonconvex and nonlinear compressor
domains are relaxed. In their procedure solution, the optimal solution of the origi-
nal problems involves upper bound, and the optimum solution of the relaxed pro-
blems is lower bound. The general formation of fuel cost minimization in the
410 Logistics Operations and Management

natural gas network, considered to be the most applied variables including flow
rate and pressure, has been presented by Rıos-Mercado [3]. Another research that
investigated the fuel cost minimization of compressor stations belongs to Mora and
Ulieru [24]. It focused on developing a new method to achieve a near optimal fea-
sible solution in a shorter reasonable time for minimizing the amount of natural gas
consumed by the compressor station units.
Some of the latest papers on minimizing the fuel costs of compressor stations
and variables that have been used to achieve optimal values are cited in Table 19.3.
Investment Cost Optimization
Carvalho and Ferreira [15] presented the general form of optimizing investment
policies, which have been adapted to the information structure of scenarios, based
on the minimum cost as follows:
Minimize F(U)subject to
UAY
UðsÞAΩs
sAS
ð19:4Þ
where F is a function of operational and investment costs, U presents a policy, and
Y is universe of not opposing decision policies; the universe of admissible policies
for the sth scenario has been presented in Ωs; and, finally, S illustrates a set of
available scenarios.
To make an investment strategy for minimizing the risk and increasing profits,
Davidson et al. [10] developed a dynamic model integrated with a geographical
Table 19.3 Common Decision Variables in Fuel Cost Minimization Problems
Author Mass Flow Rates
Through Each Arc
Suction Pressure and
Discharge Pressure
Number of
Compressor
Units
Wu et al. [22] O O OCobos-Zaleta and Rıos-
Mercado [23]
O O O
Borraz-Sanchez and
Rıos-Mercado [4]
O O —
Mora and Ulieru [24] O O —
Rıos-Mercado et al. [6] O O —
Abbaspour et al. [18] O O —
Borraz-Sanchez and
Rıos-Mercado [7]
O O —
Chebouba et al. [29] — O O
411Optimization in Natural Gas Network Planning

information system (GIS). Among investment projects with sequencing, budget,
and timing limitations, the model made a trade-off to maximize the expected net
present value (NPV) and minimize the variance among NPVs. This model consid-
ers both the revenues and cost while selecting the best expansion project with the
aim of taking a decision support system to present the revenue of serving new cus-
tomers and related costs to constructions as well as considering the uncertainties. It
was solved by rollout heuristic algorithms to improve the solution quality. In this
case, GIS helps to identify opportunities in potential network expansion, data col-
lection, and perception made because of the developed model. Kabirian and
Hemmati [16] developed a model with the aim of least discounted operating and
capital cost to plan for the natural gas transmission network.
Minimizing the Cash-Out Penalties of the Shipper
In drawing a contract between the shipper and a pipeline company to deliver a cer-
tain volume of gas among several points, a problem may occur in marketing natural
gas because of the differences among the promised amount of gas and the real
amount actually delivered along a transmission network. In those cases where
imbalances occur, pipeline companies penalize shippers by imposing a cash-out
penalty policy, which is a function of daily imbalance. Therefore, the problem,
which should be solved optimally, is making decisions for shippers to minimize
their incurred penalty by carrying out their daily imbalances [25].
Table 19.4 presents a summary for some of the reviewed papers that have
focused on optimization problems in the natural gas industry.
19.3.3 Mathematical Models Classifications
To the best of our knowledge, a vast number of works have been done on the
optimization approaches and developing suitable algorithms to find the optimal
solutions for the natural gas distribution and transmission networks. In this part,
we classify the earliest papers that focused on the mathematical modeling in
Table 19.5. Some general findings are obviously seen in this table. For example,
the optimization has a more effective role in transmission network in comparison
to distribution network because the natural gas spends more time under high
pressures in transmission networks because of the long distances among produc-
ers and city gate stations and because more instruments are used in the transmis-
sion network. Therefore, more problems have been defined in this segment.
Moreover, as it would appear from the table, although some data in the natural
gas industry are not deterministic, to simplify the problem researchers have not
considered uncertainties in the form of fuzzy or statistical data such as what
Carvalho and Ferreira [15] and Davidon et al. [10] did. Other issues such as
type of problems, number of objectives, and more useful solution methods
regarding the optimization of mathematical models developed for natural gas net-
work planning are presented in the following subsections.
412 Logistics Operations and Management

Table 19.4 A Summary of Optimization Problems in the Natural Gas Industry
Author
Transm
ission(T)
or
Distribution(D
)
Type of Optimization System Topology Solution Method
Fuel
Cost
Minim
ization
Investm
ent
Cost
Minim
ization
Cash-O
ut
Penalties
oftheShipper
SteadyState
Transient
Cyclic
Noncyclic
DP
Gradient
Research
Hierarchical
Mathem
atical
Programming
Gun
Barrel
Tree
Wu et al. [22] T O — — O — — — — — — — OCarvalho and Ferreira [15] D — O — O — — — — — — — OChung et al. [17] T — — — — — — — — — — — OUraikul et al. [5] T — O — O — — — — — — — OBorraz-Sanchez and Rıos-Mercado [4] T O — — — — O — — — — — ODavidson et al. [10] D — O — — O — — — — — — ORıos-Mercado et al. [6] T O — — — O — — O — — —
Abbaspour et al. [18] T O — — — O — — — — — — —
Wu et al. [8] D — O — O — — — O — — — OMahlke et al. [20] T O — — — O — — — — — — OChebouba et al. [29] T O — — O — — — O — — — OBorraz-Sanchez and Rıos-Mercado [7] T O — — O — O — — — — — O
413
Optim
izationin
Natu
ralGas
Netw
ork
Plan
ning

Table 19.5 Summary of Developed Mathematical Models For Natural Gas
Author Network Number of
Objectives
Type of
Model
Variables Type of Data Solution Method
Distribution Trans-
mission
Single Multi Deter-
ministic
Fuzzy Stochastic Exact Heuristic Metaheuristic
Carvalho and
Ferreira [15]
O — — O MILP Expected value of the scenario — — O — O —
Chung et al. [17] — O — O NLP Number of possible circuit
additions in each path
— — — — — GA
Uraikul et al. [5] — O O — MILP On�off compressor units
(compressor selection)
O — — O — —
Borraz-Sanchez
and Rıos-
Mercado [4]
— O O — NLP Mass flow rates through each arc,
gas pressure level at each node
O — — — — TS
Davidson et al. [10] O — — O INLP Each phase of each project in each
year is done or not
— — O — O —
Wu et al. [8] O — O — NLP Length of the pipes’ diameters,
pressure drops at each node of
the network, and mass flow rate
at each pipeline
O — — O — —
Kabirian and
Hemmati [16]
— O O — NLP Type, location, and installation
schedule of pipeline and
compressors
O — — — O —
Mahlke et al. [20] — O O — MINLP Gas flow in valves and
compressors, gas pressure at
beginning and end of pipeline,
fuel gas consumption, on�off
compressor or valves
O — — — — SA
Borraz-Sanchez
and Rıos-
Mercado [7]
— O O — NLP Mass flow rate in each arc, gas
pressure in each node
O — — — — TS
Hamedi et al. [1] — O — O NLP Transported gas volume, shortage
volume, on�off compressor units
O — — O O —

Types of Problem
In general, optimization problems can be classified based on the type of variables
(continuous, integer, or mixed) and nature of functions used as the objective func-
tion and constraints. Considering these two factors, six types of problems are
defined as presented in Table 19.6. Because of the nonlinearity behavior of the com-
pressor station units and other factors and existence of mixed continuous and integer
variables, most of the optimization problems of the natural gas network planning
are categorized in nonlinear problems. Dependent on the defined variables, they can
be Non-Linear Programming (NLP), Integer Non-Linear Programming (INLP), and
Mixed Integer Non-Linear Programming( MINLP).
Number of Objectives
In practice to plan for a natural gas network optimally, more than one objective,
generally conflict objectives, should be considered. For example, minimizing net-
work flows or investment cost versus the maximum satisfaction of the customers
involve two conflict objectives, which should be achieved simultaneously.
In theory, if all objectives are seen in the solution methodology, problems
become more difficult, especially when a large number of objectives are consid-
ered. In a few cases, all objectives are transformed into a single objective, but in
most situations, it is not possible. Therefore, a number of researchers focus only on
one objective and do not pay attention to others or relax them, and another group
of researchers keeps the nature of problems and applies a multiobjective optimiza-
tion method based on an approach. For example, if goal values of objective func-
tions are known, the goal programming approach can be a suitable option.
Solution Methods
The nature of natural gas network problems that are categorized in the group of
NP-hard problems is nonconvex and nonlinear. Therefore, the design and selection
of proper solution methods are very critical in this field. Mallinson et al. [26]
described two general methods to optimize natural gas network problems. In the
first method, numbers of optimization problem variables are reduced by eliminating
the flow variables; in the second one, to achieve a better behavior, the optimization
problem is solved without removing any variable. By reduction techniques, the
solution of the problem becomes easier, but finding the suitable algorithm has
Table 19.6 Classification of Optimization Problems in Mathematical Models
Functions Variables
Continuous Integer Mixed
Linear LP ILP MILP
Nonlinear NLP INLP MINLP
415Optimization in Natural Gas Network Planning

troubles because the selected algorithm could perhaps not provide a feasible solu-
tion or in several cases it shows error messages. In addition, in some cases, how-
ever, a valid solution seems to be achieved, but after inspecting the results, it was
detected that some constraints have not been satisfied [26].
In general, three options exist to solve mathematical models. Researchers try to
choose the best one based on the model’s complexity and solution time limitations.
These options are exact methods, heuristic methods, and metaheuristic methods.
Exact TechniquesThe problem featuring in the natural gas transmission and distribution networks
because of its nonlinear and nonconvex nature cannot be solved using classical
techniques like exact methods from mathematical programming because these
methods are usually time consuming and unable to solve NP-hard problems even
on a small scale. A number of researchers have tried to solve the developed models
by exact techniques, but they had to oversimplify their approaches and compressor
station models, which in practice may be inaccurate.
Heuristic TechniqueThe heuristic methods give the final solution in shorter time in comparison with
exact methods, but there is a risk of trapping in the first local optimality.
Therefore, achieving a global optimal solution is not guaranteed.
Metaheuristic TechniquesThe best choice to solve NP-hard problems, that their solution time is dependent on
the problem size exponentially, is the metaheuristic method, which guarantees find-
ing the global optimum solution through decreasing the problem complexity with-
out any limitations regarding the problem size. Some of the common effective
methods, which researchers in different fields are interested in and in natural gas
network planning also achieved many successes, are GA, SA, and TS. Chung et al.
[17] used a GA for the problem of transmission networks planning to avoid arriving
at local optimality and utilized a fuzzy decision analysis to select the best possible
planning scheme. Mahlke et al. [20] exploited an SA to find a feasible solution in a
reliable short time because of its simplicity to apply. TS allows designers to take
advantages of the previous information in the selection of algorithms and subalgo-
rithms. In optimization problems dealing with natural gas networks, the high non-
convexity of objective functions and the capability of TS to escape from local
optimality have made it very efficient with an appropriate discrete solution space.
Borraz-Sanchez and Rıos-Mercado [4] combined TS with nonsequential DP for the
fuel cost minimization in the natural gas transmission network.
19.4 Case Studies
Some researchers applied developed optimization models to the natural gas indus-
try in a number of special cases and achieved significant results. Two case studies
416 Logistics Operations and Management

are described in this section to illustrate the real application of optimization models
dealing with the natural gas industry.
19.4.1 Case 1: Optimization of Planning in the Natural Gas SupplyChain
Hamedi et al. [1] developed a mathematical model to optimize the flowing gas
through the network along a six-level supply chain with the aim of minimizing
direct or indirect distribution costs. The mathematical model is a mixed-integer
nonlinear programming (MINLP) model converted to linear programming to solve
and is limited to six groups of constraints, including capacity, input and output bal-
ancing, demand satisfaction, network flow continuity, and relative constraints to
the required binary variables. To reduce the model’s complexities for the large-size
problems, it has been divided into two parts based on the relations among pipelines
and solved hierarchically. In such a manner that in each step, one section of the
problem is solved exactly through Lingo software and its outputs are passed to the
next part as inputs. Therefore, by decreasing the computational complexity a nearly
optimized solution is achieved.
The result of applying the developed model and hierarchical algorithm on the
natural gas network of a gas-rich country presents the 19.839% improvements
(near to 452,754.222 cost unit with the given parameters) in the defined objective
function in contrast with implemented plans in the reality. Even assuming that a
part of this improvement is due to simplifier assumptions, the huge cost of trans-
mission and distribution of natural gas to the consumers makes this improvement
valuable for the natural gas industry.
19.4.2 Case 2: Optimization of a Multiobjective Natural Gas ProductionPlanning
Barton and Selot [27] formulated a nonconvex MINLP model for the upstream nat-
ural gas production system, which has been considered from the wells to the lique-
fied natural gas plants (excluding the plants). The upstream production-planning
model involves two important components, including the model of actual produc-
tion facilities and networks (the infrastructure model) and the customer require-
ments (the contractual rule model). In this model, the natural gas network has been
presented as a multiproduct network with nonlinear pressure-flow rate relations in
the wells and the trunk line network. Moreover, production-sharing contracts
(PSCs) and operational rules have been considered. The developed model, which
comprises three objective functions, is a relatively large nonconvex MINLP (sev-
eral hundred continuous variables and tens of binary variables). Maximizing dry
gas production to satisfy contractual demands, maximizing Natural Gas Liquid
(NGL) production to increase revenue for the upstream operator, and prioritizing
production from certain fields are the objectives that the model seeks to achieve
them. Because it was not possible to obtain global optimization approaches
417Optimization in Natural Gas Network Planning

directly, the model has been reduced through a reduction heuristic and solved by a
global branch-and-cut algorithm.
The result of applying the developed model in a real-world case study in
Malaysia indicates its efficiency in increasing the secondary products production,
achieving optimal long-term asset management beside satisfying contractual
requirements of gas supply and customers in short term.
19.5 Conclusions and Directions for Further Research
Because using many instruments, including pipelines, compressor stations,
valves, and regulators over long distances and using a variety of network topolo-
gies and technologies, natural gas networks have been known as a complex and
difficult problem to solve. Therefore, when this problem is mathematically mod-
eled, the problem will be NP-hard and cannot be solved easily. On the other
hand, gradient search and DP approaches have had limitations to consider real
characteristics of network models because of their limitations in avoiding trap-
ping a local optimality. From the optimization point of view, to solve planning
models of natural gas networks, mathematical models and consequently meta-
heuristic algorithms seem the most desirable solution methods. This is more
valuable when the problem is formulated based on transient assumptions and the
cyclic topologies are considered. As it would appear from reviewing papers
implemented in real cases, by optimal design of natural gas networks, which is
possible using mathematical models and solving with suitable algorithms to find
the closest optimum solution, considerable improvements can be achieved.
Because of the enormity of the problem, even a small improvement in a natural
gas network could save a huge amount of money per day, and the need to
develop more models and algorithms is strongly felt among planners. Within
optimization problems in natural gas networks, minimizing the fuel cost con-
sumed by compressor stations has received more attention among researchers
although there are not many developed models to optimize expansion or invest-
ment costs. To date, many optimization algorithms in different fields of natural
gas networks planning have been introduced for all the steady state, the transient
state, and different topologies, cyclic or noncyclic. Although the proposed opti-
mization algorithms have been really successful, comprehensive models are
needed to consider all constraints simultaneously and solve the problem aggre-
gately. Moreover, in the developed models, transient systems have not been of
interest to the researchers during the last decades to optimize because of increas-
ing difficulties. In addition, cyclic topologies have had a few successes in
researches and implementations. Because of difficulties available in natural gas
networks planning, researchers usually avoid considering varieties in demand
data, production data, and other fuzzy or statistical data. Therefore, it can be a
suitable point for future researches to develop new models. Furthermore, a num-
ber of technical perspectives can make scientific gaps for new researches in the
planning of natural gas networks, including considering the temperature as a
418 Logistics Operations and Management

new variable, considering various types of compressor station units, and present-
ing the network in low or medium pressures instead of high pressures only.
References
[1] M. Hamedi, R.Z. Farahani, M.M. Husseini, G.R. Esmaeilian, A distribution planning
model for natural gas supply chain: a case study, Energ. Policy 37 (2009) 799�812.
[2] J. Muno, N. Jimenez-Redondo, J. Perez-Re, J. Barquin, Natural gas network modeling
for power systems reliability studies, in: Bologna PowerTech Conference ed., Bologna,
Italy, 2003, pp. 23�26.
[3] R.Z. Rıos-Mercado, Natural gas pipeline optimization, in: P.M. Pardalos, M.G.C.
Resende (Eds.), Handbook of Applied Optimization, Oxford University Press, New
York, 2002, pp. 813�825.
[4] C. Borraz-Sanchez, R.Z. Rıos-Mercado, A Hybrid Meta-heuristic Approach for Natural
Gas Pipeline Network Optimization, Springer-Verlag, Berlin Heidelberg, 2005,
pp. 54�65.
[5] V. Uraikul, C.W. Chan, P. Tontiwachwuthikul, MILP model for compressor selection
in natural gas pipeline operations, Environ. Informat. Arch. 1 (2003) 138�145.
[6] R.Z. Rıos-Mercado, S. Kim, E.A. Boyd, Efficient operation of natural gas transmission
systems: a network-based heuristic for cyclic structures, Comput. Oper. Res. 33 (2006)
2323�2351.
[7] C. Borraz-Sanchez, R.Z. Rıos-Mercado, Improving the operation of pipeline systems on
cyclic structures by tabu search, Comput. Chem. Eng. 33 (2009) 58�64.
[8] Y. Wu, K.K. Lai, Y. Liu, Deterministic global optimization approach to steady-state
distribution gas pipeline networks, Optim. Eng. 8 (2007) 259�275.
[9] A.J. Osiadacz, Dynamic optimization of high pressure gas networks using hierarchical
systems theory, in: 26th Annual Meeting PSIG (Pipeline simulation Interest Group) ed.,
San Diego, California, 1994.
[10] R.A. Davidson, J.L. Arthur Jr., J. Ma, L.K. Nozick, T.D. O’Rourke, Optimization of
investments in natural gas distribution networks, J. Energ. Eng. (2006) 52�60.
[11] Z. Huang, A. Seireg, Optimization in oil and gas pipeline engineering, J. Energy
Resour. Technol. 107 (1985) 264�267.
[12] F. Tabkhi, L. Pibouleau, C. Azzaro-Pantel, S. Domenech, Total cost minimization of a
high-pressure natural gas network, J. Energy Resour. Technol. 131 (2009) 043002.
[13] M. Mohitpour, H. Golshan, A. Murray, Pipeline Design and Construction: A Practical
Approach, ASME Press, New York, NY, 2003.
[14] R.K. Ahuja, T.L. Magnanti, J.B. Orlin, Some recent advances in network flows, Soc.
Ind. Appl. Math. 33 (1991) 175�219.
[15] P.M.S. Carvalho, L.A.F.M. Ferreira, Planning large-scale distribution network for
robust expansion under deregulation, in: Power Engineering Society Transmission and
Distribution Conference (IEEE, ed.), 2000, pp. 1305�1310.
[16] A. Kabirian, M.R. Hemmati, A strategic planning model for natural gas transmission
networks, Energ. Policy 35 (2007) 5656�5670.
[17] T.S. Chung, K.K. Li, G.J. Chen, J.D. Xie, G.Q. Tang, Multi-objective transmission net-
work planning by a hybrid GA approach with fuzzy decision analysis, Int. J. Electr.
Power Energy Syst. 25 (2003) 187�192.
419Optimization in Natural Gas Network Planning

[18] M. Abbaspour, P. Krishnaswami, K.S. Chapman, Transient optimization in natural gas
compressor stations for linepack operation, J. Energy Resour. Technol. 129 (2007)
314�324.
[19] P.M. Coelho, C. Pinho, Considerations about equations for steady state flow in natural
gas pipelines, J. Brazil. Soc. Mech. Sci. Eng. (2007) 262�273.
[20] D. Mahlke, A. Martin, S. Moritz, A simulated annealing algorithm for transient optimi-
zation in gas networks, Math. Meth. Oper. Res. 66 (2007) 99�115.
[21] D.W. Schroeder, Hydraulic analysis in the natural gas industry, in advances in indus-
trial engineering applications and practice, Int. J. Ind. Eng. (1996) 960�965.
[22] S. Wu, R.Z. Rios-Mercado, E.A. Boyd, L.R. Scott, Model relaxations for the fuel cost
minimization of steady-state gas pipeline networks, Math. Comput. Model. 31 (2000)
197�220.
[23] D. Cobos-Zaleta, R.Z. Rıos-Mercado, A MINLP model for a minimizing fuel consump-
tion on natural gas pipeline networks, in: Congreso Latino Iberoamericano de
Investigacion de Operaciones (CLAIO) ed., Chile, 2002.
[24] T. Mora, M. Ulieru, Minimization of energy use in pipeline operations – an application
to natural gas transmission systems, Industrial Electronics Society, IECON, 31st annual
conference of IEEE, 2005. ISBN:0-7803-9252-3.
[25] V.V. Kalashnikov, R.Z. Rıos-Mercado, A natural gas cash-out problem: a bilevel pro-
gramming framework and a penalty function method, Optim. Eng. 7 (2006) 403�420.
[26] J. Mallinson, A.E. Fincham, S.P. Bull, J.S. Rollett, M.L. Wong, Methods for optimizing
gas transmission networks, Ann. Oper. Res. 43 (1993) 443�454.
[27] P.I. Barton, A. Selot, A production allocation framework for natural gas production sys-
tems, in: V. Plesu, P.S. Agachi (Eds.), 17th European Symposium on Computer Aided
Process Engineering—ESCAPE17, Elsevier, Amsterdam, 2007.
[28] A. Sadegheih, P.R. Drake, System network planning expansion using mathematical pro-
gramming, genetic algorithms and tabu search, Energ. Conver. Manag. 49 (2008)
1557�1566.
[29] A. Chebouba, F. Yalaoui, A. Smati, L. Amodeo, K. Younsi, A. Tairi, Optimization of
natural gas pipeline transportation using ant colony optimization, Comput. Oper. Res.
36 (2009) 1916�1923.
[30] E. Dept, What Exactly “IS” Natural Gas?, from http://oilprice.com/Energy/Natural-Gas/
What-Exactly-IS-Natural-Gas.html., 2009.
420 Logistics Operations and Management

20Risk Management in GasNetworks: A Survey
Reza Zanjirani Farahani1, Mohammad Bakhshayeshi
Baygi2 and Seyyed Mostafa Mousavi3
1Department of Informatics and Operations Management, KingstonBusiness School, Kingston University, Kingston Hill, Kingston UponThames, Surrey KT2 7LB2Mechanical and Industrial Engineering Department, University ofConcordia, Montreal, Canada3Centre for Complexity Science, University of Warwick, Coventry, UK
20.1 Structure of Gas Networks
Natural gas networks are complicated, starting from the wells to end users. Natural
gas is found in some places underground, and there are many exploration methods
to determine whether or not natural gas exists in a particular place. After investiga-
tion, the act of drilling starts and a well is made, a process called extraction. After
technically and economically ensuring that recovering the existing gas is feasible,
the gas is lifted up. This gas cannot be used in its raw state and needs to be pro-
cessed. Refining stations are usually close to the wells to separate parts of the gas
and prepare it for customer use. For natural gas, pipes are the usual mode of trans-
portation. The pipes that deliver natural gas from the wells to refinery stations are
called gathering pipes; they are usually low pressure and low diameter. If the gas
extracted from a well has more than the standard amounts or levels of sulfur and
carbon dioxide, special types of gathering pipes are required; the so-called sour gas
is dangerous, and care should be taken in its transportation.
Because gas wells are usually located in places far from customers, a complex
system is needed to deliver the gas. A transportation system called the mainline
system of gas networks is used to deliver the gas through transmission pipes and
compressor stations to customers. Transmission pipes are usually of high pressure,
large diameter, and long distance. The task of compressor stations is to balance the
gas pressure in the pipes. The mainline system needs large amount of investment,
approximately 80% of total investment. The amount of investment depends on the
parameters of the system, including pipe diameter, thickness, pressure, length, and
compression ratio. A large number of articles have tried to optimize this system
from various aspects. Ruan et al. [1] presented a mathematical model that took into
Logistics Operations and Management. DOI: 10.1016/B978-0-12-385202-1.00020-7
© 2011 Elsevier Inc. All rights reserved.

account all of the parameters important to the amount of investment. Kabiriana and
Hemmati [2] presented a strategic planning model to determine the type, location,
and installation schedule with a cost-minimization objective function. Cheboubaa
et al. [3] proposed a metaheuristic algorithm called ant colony optimization (ACO)
to determine the number of compressor stations and the discharge pressure
for each.
In the next step in gas networks, which is called distribution, gas is delivered to
the end user. Local distribution companies (LDCs) receive the gas in city gates,
transfer points from transmission pipes to LDCs, and deliver it to individual custom-
ers. This delivery is done with the help of an extensive network of small-diameter
distribution pipes throughout municipal areas. End users of natural gas from LDCs
are residential, commercial, and industrial sectors and power-generation customers.
Note, however, that some large commercial and industrial customers receive natural
gas directly from the high-pressure pipelines. Literature is extensive on different
aspects of gas distribution. Hamedi et al. [4] presented a six-level supply chain to
minimize the cost of gas transmission and distribution. Generally, there are many
articles related to the transmission or distribution of gas, among which Herran-
Gonzalez et al. [5]; Martin et al. [6]; Rıos-Mercado et al. [7]; Wong and Larson [8];
and Wu et al. [9] can be mentioned.
Natural gas is not always used when delivered, so it is usually stored under-
ground. This storage capability can be very helpful, especially when shortages
occur in the network. Gas networks also use physically manipulated and automated
controls such as the supervisory control and data acquisition (SCADA) system to
ensure appropriate communications between equipment and control center.
Figure 20.1 demonstrates the schematic view of gas networks with all key parts
shown.
Refinery
Storagefacilties
City gate
Industrialcustomers
Powergenerationcustomers
Commercialcustomers
Residentialcustomers
Importation
Gas wellsCompressor
stations
Exportation
Figure 20.1 Schematic view of a gas network.
422 Logistics Operations and Management

20.2 The Vulnerabilities and Risks of Gas Networks
Why is risk important in gas networks? Is it important to think about the risks? In
the first part of this section we will discuss why we consider risk in gas networks.
The remainder of this section thoroughly explains all existing vulnerabilities and
risks in gas networks.
20.2.1 Why Is Risk Investigation Important?
The material presented in this section has been mostly excerpted from a US federal
commission [10]. Gas has a very complicated network and is the subject of much
attention nowadays in the energy sector, which is why it is really important to con-
sider the associated risks. These can be considered an important challenge for coun-
tries, especially in the future. The reliability of gas networks has been affected by
many factors, including the following:
� Gas has become very popular, giving rise to a competitive market in which equipment
has been extensively used.� The age of pipelines is an important matter. Pipes are usually exposed to failure risks
because of leakage. In many countries, pipes are very old, creating an increasing risk of
failure.� Environmental considerations have become more crucial lately, and gas networks will be
financially affected as they consider these issues. In fact, gas networks have already
caused considerable harm to the environment.� Many countries are dependent on imported gas from other countries. This creates great
risk when they do not know how reliable their supply may be for many reasons, including
politics and the environment.� The use of information technology (IT) has led to more efficient operations, but on the
other hand it has caused major problems. The networks are increasingly exposed to cyber
attacks. In addition, the commitment of employees has declined in recent years.
With the aforementioned reasons in mind, we now consider certain challenges
that exist in all countries that need to be addressed and solved, including the
following:
� Reliable systems of delivery that can manage change must be developed.� The increasing complexity of the network must be managed well because it is interdepen-
dent with other systems such as electrical systems.� Mainline systems must be protected against disturbances that can cause long-term
problems in delivery.� Having the conditions in which the network can be seen as a whole, so the public and
private sectors can experience helpful interactions.� Appropriate regulations and policies must be developed and applied to ensure reliable
delivery of natural gas.� Communication systems must be upgraded so that information can be shared rapidly by
system components at appropriate times.� Security systems must be able to protect the network from cyber disturbances.
423Risk Management in Gas Networks: A Survey

The preceding points show the importance of studying risk. The next sections
investigate current gas network vulnerabilities and risks.
20.2.2 What Are the Vulnerabilities and Risks of Gas Networks?
Before discussing the available vulnerabilities and risks, it is important to know the
relationship between vulnerability and risk. Vulnerability is related to a weakness
that exists in the system. This weakness can lead to different losses, according to
its environment, so risk is the probability that a weakness is misused to attack the
system. To manage the risk, it is important to identify the vulnerabilities of gas
networks and the risks related to those vulnerabilities, which can be different in dif-
ferent environments. In fact, the first step in recognizing risk is identifying the
vulnerabilities that exist in a system.
The Vulnerabilities of Gas Networks
Gas networks have always had various types of vulnerabilities. In the past, physical
security of the networks could mitigate the risk of physical attacks. Natural disasters
can also cause loss to gas networks. Today, with the advent of modern technologies,
these vulnerabilities are managed efficiently, but new types of vulnerabilities have
appeared that did not exist before. The security of various information systems used
in networks is an important challenge nowadays. The Internet has given many
attackers the opportunity to try and attack systems, so the number of attacks has
increased dramatically. Cyber attacks can lead to significant losses for the system,
so they are considered to be a significant threat to the gas networks. Globalization
and downsizing are other phenomena that have seriously affected the systems
because the management of these risks at the international level is difficult, espe-
cially when a great many employees are not as committed to corporations because
of downsizing, among other reasons. For more information, the National Petroleum
Council has classified the vulnerabilities of gas networks [11]. In this section, we
use the same categorization of vulnerabilities and discuss them more briefly while
acknowledging the latest works done in each area. Vulnerabilities that can affect
the strength of the system have been classified into the following seven categories.
Vulnerability 1: Information SystemsVulnerabilities in information systems is considered to be critical today. The infor-
mation revolution has made big changes in many different aspects of our lives, and
IT has made many changes in businesses. Nowadays, the world is considered a vil-
lage in which even faraway places can communicate with each other within sec-
onds. Information systems are also developing rapidly and new advances occur
every day. These technologies have increased the efficiency of many processes,
and most businesses are so dependent on these processes that they cannot function
properly without them. In fact, businesses have made themselves so reliant on these
technologies that they can be harmed by various threats. Gas networks, like other
424 Logistics Operations and Management

businesses, now face significant security challenges. The wide range of vulnerabil-
ities include the following:
� Manual systems have been widely replaced by the information systems on which the gas
companies depend. There are no manual backups for automated processes, so there is no
possibility of returning a system to a manual status.� Because of the competitive market, gas industries rapidly welcome new technologies to
reduce their cost and increase their efficiency. However, the security of these systems is
an important concern.� The use of joint systems can be considered a type of vulnerability. For example, many
companies are interested in having joint systems for their e-commerce, so a problem in
one system can be transferred to other systems as well causing huge losses.� The information systems have increased access from local to national and international
levels; as a result of this wider access, systems are exposed to more electronic
vulnerabilities.� The IT advances have allowed attackers to attack from almost anywhere. They can attack
systems even from home, so it becomes difficult to determine the origins of an attack.� There is a great competition in software industry market, so most vendors try to offer
their products to the market as soon as possible. As a result, many softwares do not have
adequate security features. These insecure systems are exposed to different professional
attacks and cannot provide enough security. Updating software systems with frequent
security patches is critical.� The gas industries widely use e-commerce, so it is exposed to different virus attacks.
Some antivirus programs are available, but they are reactive and there are more viruses in
the IT environment than these programs can handle.� In the gas industries, most of today’s equipment has become automated in order to
increase their efficiency. The gas networks are highly reliant on the Internet, intranets,
and extranets, or they depend on satellites, fiber-optic cables, microwave, phones, and so
on. A disruption in one of these systems can even cause gas networks to fail to respond
appropriately to customers because most operations are done automatically and need
these communication systems.
This vulnerability has become one of the most important threats to the gas
industries and its risks are rapidly increasing. Currently, the widespread hacking
tools that are available are leading to more people, even amateurs, using these
tools. Hackers have become more professional and have gained the ability to better
exploit vulnerabilities and attack the systems.
Vulnerability 2: Globalization of EconomiesAccording to the Merriam-Webster dictionary, globalization is the “development of
an increasingly integrated global economy marked especially by free trade, free
flow of capital, and the tapping of cheaper foreign labor markets.” As a result, each
country sees itself not only as a nation but also as part of the world. Gas industries
have experienced globalization by foreign ownership and consolidations of multi-
national corporations, among other events. Most companies try to develop their ser-
vices to an international level. This issue has made dramatic changes in the
industry, especially by changing business models and the mix of various
425Risk Management in Gas Networks: A Survey

stakeholders. Globalization has increased the complexity of the industry because
there are many differences between nations, from cultural to regulatory, and this
has made new vulnerabilities for the network. Some of the important vulnerabilities
are as follows:
� Globalization has made businesses highly dependent on each other. Gas industries have
become multinational. In many countries, such as the United States, foreigners can own
the companies. This has made the economies and problems of countries dependent on
each other. A problem in one country may have many consequences for others in which
they have no control. For example, OPEC decisions can have worldwide effects on the
prices.� Because there are no international standards for security, it is not possible to have world-
wide protection. Many countries do not have strong systems, and this inconsistency can
affect other countries negatively, even those that have good measures to protect
themselves.� Increasing interdependency is part of globalization. Many sectors, such as information
systems, finance and banking, and transportation, should work efficiently to support glob-
alization, and the management of this added complexity is a real concern.� One important vulnerability of globalization is related to cultural differences. To some
extent, each country is in cultural transition, which can lead to instability. Different work
ethics in different countries affect productivity. This instability can have large effects on
the industry because investment would be hard to attract because of its high risk.
Vulnerability 3: Business RestructuringBusiness restructuring, according to the American Heritage Dictionary of Business
Terms, is “a significant rearrangement of a firm’s assets or liabilities. A firm’s
restructuring may include discontinuing a line of business, closing several plants,
and making extensive employee cutbacks. Restructuring generally entails a one-
time charge against earnings.”
The competitive market has made most of the gas companies reduce their costs
and downsize their workforces with increasing automation. In the past, employees
usually have had strong commitments to a company, but nowadays this commit-
ment has lessened because of downsizing, outsourcing, and different social con-
tracts, among other trends. Many employees who have left companies are angry
about the terms and conditions, and employees who are currently working are not
satisfied with their heavy workloads. All of these influences have led employees to
pay much more attention to their own welfare rather than the interests of the com-
pany and also exploit the vulnerabilities of the system. The following, which is a
type of business restructure, has caused various vulnerabilities which are discussed
in more detail below:
� Outsourcing is a transaction in which one company sells some of its processes to another
company but is also responsible for final services. Outsourcing leads to considerable vul-
nerability. Many employees detach themselves as outsourcing occurs, and new employees
are usually hired by a contracting company to do their former tasks, sometimes even for
their former company. These employees are not as committed as full-time employees. It
is not uncommon that the contracting company has less-reliable procedures for doing the
function. When the critical processes are outsourced, the employees of the contracting
426 Logistics Operations and Management

company find good information about the procedures. This also creates vulnerability,
because the corporation would have serious problems if the contracting company fails for
any reason.� A strategic alliance is an agreement between firms of different countries to cooperate on
any activity or joint venture that is created from at least two different firms. This matter
has shown some vulnerability, especially as related to intellectual property (IP). IP is dif-
ficult to protect in a venture or alliance, and it would be more at risk if the companies
separate because employees of the joint venture may continue their personal relationships
with each other.� Just-in-time logistics is related to the concept that material and equipment should be
in place at the time they are needed in the process. Just-in-time logistics creates great vul-
nerability when the equipment is not delivered in the required time. In fact, this matter
makes the corporate very dependent on vendors and transportation infrastructures for
timely delivery of the equipment.
Vulnerability 4: Political and Regulatory ConcernsIn most developed countries, individual companies take responsibility for invest-
ing in infrastructure. These companies naturally seek their own profit. The
amount of capital in gas infrastructures is significant and has a long-term payoff
period, so investing in infrastructure is really a strategic but difficult decision for
these firms to make. Political and regulatory concerns are among the factors that
can increase the uncertainty of making these decisions and make decision mak-
ing more difficult. These regulations should guarantee the profit of all stake-
holders, including consumers, governments, and companies. There exist many
examples in which regulations did not consider the profit of the companies very
well and caused serious problems for these firms. The increase in the risk of
investment in critical infrastructure diminishes the robustness of the system,
which is never acceptable. In fact, according to the International Energy Agency
[12], governments should play a more important role in reliable delivery of gas
to customers by setting clear policies for the whole system instead of just man-
aging part of the system.
Pelletier and Wortmann [13] presented a multistage model to evaluate the risk
of investment in infrastructures in Western Europe under the uncertainty of trans-
port tariff changes. This risk is important to calculate to determine whether or not
there is enough motivation for investment, especially after the restructuring of the
gas market because of liberalization in Western Europe, which led to the shortening
of gas transport contracts. Jepma [14] and Jepma et al. [15] conducted comprehen-
sive studies on the consequences of the tariff differences in gas distribution while
considering only the profit of shippers as the objective. According to works on tar-
iffs, differences have made some illogical rerouting in the network, causing a
change from the route with the shortest path to the one with the least expenses. As
a result, congestion may appear in the cheapest route. Apart from congestion, this
problem can lead to the false expansion of the cheapest grid, leading to a subopti-
mal network. This phenomenon—congestion and false investment motivation—is
known as Jepma effect.
427Risk Management in Gas Networks: A Survey

Vulnerability 5: Interdependencies of BusinessesToday, most businesses are dependent on others. In other words, they rely on other
systems for their operations. In fact, the advent of IT made many businesses highly
dependent on each other, such as banking, gas, power, and transportation. Gas net-
works are highly dependent on other systems, especially electricity and
transportation.
The interdependency of gas on electricity can be seen from two points of view.
First, IT is playing an important role in gas industries, and it cannot operate unless
electricity is provided. In fact, the gas industry would stop operating without elec-
tricity. Second, many combined-cycle gas and electricity plants are appearing
because of the efficient working of these plants, so the gas company can easily
choose, according to the prices of gas and electricity, whether it wants to sell gas as
fuel or use it to generate electricity and sell this as the final product. The combined-
cycle power plants have increased the interdependency of gas and electricity and
have largely added to the complexity of the system. There are many researchers in
this field, especially in recent years as these plants have become more popular.
Unsihuay-Vila et al. [16] present a model for the expansion of the integrated gas
and electricity systems. Whiteford et al. [17] assess the risks of the interlinked gas
and electricity systems in the United Kingdom, because these plants using gas for
the electricity generation are producing about a third of the total demand of electric-
ity in the United Kingdom. Arnold et al. [18] introduced a system for controlling
the combined electric and gas systems to work more efficiently and to mitigate the
risks of interdependency of gas and electricity. Munoz et al. [19] designed a model
for the combined gas and electricity systems in order to investigate their reliability.
Fedora [20] studied the reliability analysis of the linked gas and electricity systems
in North America.
The gas industry is also highly dependent on transportation systems. A failure in
one of these systems can lead to many problems in the gas industry because just-
in-time logistics have become critical in gas delivery.
These interdependencies can cause problems. A failure in one system may lead
to failures in all other systems. Outages in one system can lead to outages in other
systems. These incidents can even be seen as a natural disaster.
Vulnerability 6: Physical and Human MattersGas networks are comprised of complicated and capital-intensive equipment. This
equipment and other assets are exposed to many threats and risks. Disruption in
each asset has a different effect on the network, so they are ranked according to
their potential impact. Some assets have low vulnerability because their damage
would only have local disruptions of short duration. Others have medium vulnera-
bility because their damage would lead to regional effects with economic losses
and even losses in human life. The other assets have high vulnerability because
their damage would even have national or international effects and might cause
high economic losses and extreme hardship for consumers. Transmission pipelines,
compressor stations, and storage and distribution facilities are usually considered
428 Logistics Operations and Management

among the assets with high vulnerability. Some of these types vulnerabilities are
as follows:
� Underground pipelines are very vulnerable to accidental damage. Although these pipe-
lines are marked for easy identification, they are also easily damaged, especially by con-
struction equipment.� The use of equipment has increased considerably, especially because of the advent of IT.
As a result, the loss of equipment would have a severe impact.� Companies try to decrease their inventories of spare parts, so that it can be used to
increase in outage durations in the case of any problem.� Nowadays, the gas industry widely uses automated facilities, and reaching and repairing
them when needed can also be time consuming.
There are many risks and threats that use the physical and human matter-vulner-
ability, (some of which are human error, pipe breaks, contamination, and employee
dissatisfaction) as justification.
Vulnerability 7: Natural DisastersThere is a great number of natural disasters which can cause much damage to the
gas infrastructures. Among them, earthquakes, storms, hurricanes, tornadoes, bliz-
zards, floods, and volcanic eruptions can be mentioned. In these cases, emergency
acts are really needed to mitigate the losses. There are many countries, like United
States, which have saved great record in this regard. However, it seems that it is
more difficult now, in comparison with the past, to act appropriately when these
disasters strike because business restructuring and downsizing led to the resignation
of many skilled workers who could be of great help in times of these disasters.
Also, the increase of interdependency of the industry on other industries has
increased the degree of difficulty in dealing with these problems.
The Risks of Gas Networks
In the previous section, all of the vulnerabilities of gas networks were investigated
and some of their probable threats or risks were mentioned. Those vulnerabilities
can have different impacts in different environments. In fact, recognizing the vul-
nerabilities is a major step in recognizing the risks because the vulnerabilities are
the cause and effect of the risks and it is important to reduce the risks to an
acceptable level. Natural gas risks have been classified as falling into the following
five categories [12]:
� Technical risks are problems related to such externals as weather conditions.� Political risks are limitations in or interruption of external supplies.� Regulatory risks create inabilities to deliver because of wrong regulation.� Economic risks create problems in gas delivery because of such events as price increases.� Environmental risks include contamination of deliveries.
The discussed vulnerabilities can each lead to many risks in different conditions.
The risks can also be divided into two categories along a time horizon. Short-term
risks are those that have minimal effects. Long-term risks, however, are considered
the ones that have the longest lasting effects.
429Risk Management in Gas Networks: A Survey

20.3 How to Manage Risks in Gas Networks?
The previous sections introduced gas networks and a concise review of all possible
vulnerabilities and risks. This section provides a fairly deep insight into developing
plans to evaluate and lower risks in the new economy, and it also tries to help the
reader understand key components of risk-management steps.
We defined risk as the possibility of exploitation by an attacker using existing
vulnerabilities. “Risk management can therefore be considered the identification,
assessment, and prioritization of risks followed by coordinated and economical
application of resources to minimize, monitor, and control the probability or impact
of unfortunate events” [21]. There are many risks associated with the gas industry
that are common in other industries, too. Therefore, the need for complete risk-
management guidelines is required. A high degree of interconnections between
businesses has made identification of the risk of a company a much more difficult
task. With the emergence of thermal plants, security of power supply has become
highly dependent on the security of the gas supply, which was discussed in depth
in the previous section.
Inspired by the National Petroleum Council [11], a six-step risk-management
process that is applicable to the gas industry has been proposed. They are (1) valu-
ating key assets and estimating losses, (2) identifying and describing vulnerabilities
and threats, (3) doing risk assessment, (4) developing usable options for risk abate-
ment, (5) analyzing options to select the cost-effective ones, and (5) implementing
chosen activities. A schematic view of the steps is depicted in Figure 20.2.
Risk management is a dynamic and continuous process that should be integrated
into the culture of organization with an effective policy and promising program to
give us what we expect. This dynamic process should be repeated periodically
(e.g., annually or every 3 years). It stands to reason that the risk environment,
This processshould be
repeated after a predefinedperiod of time
Valuating key asset and estimating losses
Performing risk assessment
Implementing chosen activities
Identifying and describing vulnerabilitiesand threats
Developing applicable risk-abatementoptions
Analyzing options to select the cost-effective ones
Figure 20.2 Risk-
management steps.
430 Logistics Operations and Management

vulnerabilities, laws, and so on are changing constantly. In the remainder of this
chapter we will look carefully at all of the steps.
20.3.1 Valuating Key Asset and Estimating Losses
The first step is to valuate assets and estimate the losses. In this part, the main
focus is on determining the value of all assets that exist in the company and
whether they are vulnerable. By having the value of each asset, the incurred loss if
the asset that was damaged or destroyed can be calculated. Because we want to
protect assets that are more vulnerable and would create greater financial losses for
a company, a simple rating system that uses qualitative criteria can be used.
Furthermore, Vaidya and Kumar [22] reviewed the application of the analytic hier-
archy process (AHP) method in order to prioritize and rank different options that
can be used as an advanced rating system. According to the National Petroleum
Council [11], asset valuation and loss estimation in more sophisticated systems is
measured in monetary units. “These values may be based on such parameters as
the original cost to create the asset, the cost to obtain a temporary replacement for
the asset, the permanent replacement cost for the asset, costs associated with the
loss of revenue, an assigned cost for the loss of human life or degradation of envi-
ronmental resources, costs to public/stakeholder relations, legal and liability costs,
and the costs of increased regulatory oversight” [11]. With the appearance of cyber
threats and their incredible losses to assets, the estimation of cost has become more
difficult. Methods for assessing this value rely heavily on principles of asset man-
agement and available data.
Knowing the value of each asset will determine the level of effort that should be
made to protect various assets. For example, trade secrets and control systems are
vital to all companies, and no insurance company can pay the incurred loss if
something bad happens.
For more information on methodologies that can be used to put a value on each
asset, readers are referred to asset-management books.
20.3.2 Identifying and Describing Vulnerabilities and Threats
Risk identification tries to find ways in which a company is exposed to risk. This
requires an analyst to have at least a primary knowledge of the organization;
the legal, social, and political structure of the environment; and the objectives of
the organization on an operational and strategic level [23]. In Section 20.2, we dis-
cussed many threats and vulnerabilities that exist in gas networks. The problem
here is to identify them. Although every organization can hire outside consultants
to perform the job, an in-house worker trained in appropriate techniques (shown in
Figure 20.3) can be used to identify various risks.
Choosing an appropriate technique to identify risk in a company depends on
many factors such as the assigned budget. According to Dunjo et al. [24], hazard
and operability (HAZOP) methodology is a process hazard analysis technique used
worldwide to consider and analyze problems related to hazards and system
431Risk Management in Gas Networks: A Survey

operability by evaluating the impacts of any deviations from design specifications.
They present a concise review on all papers published in this area. In business stud-
ies, many aspects of a company such as its accountancy, money matters, marketing,
and organizational behavior are studied. Questionnaire surveys are methods for
acquiring information (usually statistical) about the attributes, attitudes, or actions
related to a population with the help of a structurally defined set of questions.
Preston [25] provided very good guidelines for the appropriate time to use a ques-
tionnaire and efficient ways that can be used to design, construct, administer, and
present a questionnaire.
Brainstorming is an individual or group methodology for generating ideas,
increasing creative efficiency, and finding solutions to various problems. Accident
and incident investigation is a tool for uncovering not only earlier missed hazards
but also hazards where loss of controls occurred. “Effective [accident and incident]
investigations should be capable of identifying a broad range of factors that may
have contributed to an [accident or incident], from an operator’s action moments
before an [accident or incident] to a senior-level executive decision made years ear-
lier” [26]. As previously noted, vulnerability and threat identification is a dynamic
process, especially in the case of cyber risk. After identifying all the risks, we
should also describe them in the best formatted manner (may be a standard table is
the most useful tool). The first column of each row can be the risk items, and sub-
sequent columns can represent consequence of each risk, its effect on the system,
degree of damage that occurred, and class of business activity that was affected
Brainstorming
Questionnairesurvey
Industrybenchmarking
Scenarioanalysis
Risk-assessmentworkshops
Incidentinvestigation
Auditing andinspection
Risk-identification
techniques examples
HAZOP(hazard and operability)
studies
Businessstudies
Figure 20.3 Examples of risk-identification techniques [23].
432 Logistics Operations and Management

such as tactical, operational, or strategic activities. For example, Lee and Shu [27]
used an intuitionalistic fuzzy fault tree analysis (FTA) to find out the most impor-
tant components of the system for the problem of failure analysis of a liquefied
natural gas (LNG) terminal emergency shutdown (ESD) system to understand weak
trail in the ESD and show the areas in which important improvements could
be done.
20.3.3 Performing Risk Assessments
The goal of risk assessment is to evaluate the risks to each asset using information
gathered from previous steps. Risk assessment is the main part of the risk-
management process. Here we need to integrate the cost incurred and the probabil-
ity that an asset will be destroyed or damaged. We know the vulnerabilities of the
understudied system, but integrating the probability and impact of these vulnerabil-
ities on the system is the outcome of this process. The probability of occurrence is
a matter of contemplation because it has many components. Just because there is a
vulnerability does not mean an attacker will absolutely exploit it, so this is associ-
ated with a probability. Furthermore, this attempt can be successful or not. Finally,
the degree of success (or cost incurred in each state) itself has a random distribu-
tion that makes probability assessment much more difficult. On the other hand, the
impact of each vulnerability dictates how much the company should invest to miti-
gate possible losses [11]. For instance, damage resulting from an earthquake in a
department store is a risk that can strongly affect its operation, but the impact of
this vulnerability may be more severe on a plant that produces petrochemical mate-
rials. This company should make more efforts to control and reduce the conse-
quences of this phenomenon should it occur.
Although managers tend to use prescriptive measures to assess the risk, a great
number of quantitative risk assessment (QRA) methods have been widely pre-
sented: Cagno et al. [28]; Krueger and Smith [29]; Metropolo and Brown [30]; Jo
and Ahn [31]; Sklavounos and Rigas [32]; Jo and Crowl [33]; Brito and De
Almeida [34]; Suardin et al. [35]; Brito et al. [36]; and Han and Weng [37], among
others.
Jo and Ahn [31] presented a QRA approach applicable in the planning and
building phases of new pipelines or modifying existing ones. By using the informa-
tion of pipeline geometry and population density from geographic information sys-
tems, they estimated the parameters of fatal length and cumulative fatal length. The
former is used to determine individual risk (the probability of loss of life at any
special location because of all unwanted events) and the pipeline failure rate. The
latter plus the failure rate can be used to estimate risk (the relationship between the
frequency of an event and the number of its casualties).
Han and Weng [37] present an integrated QRA method that is composed of the
probability assessment of accidents, consequence analysis, and risk evaluation.
This method analyzes consequences, including those outside and inside gas pipe-
lines. Individual and societal risk caused by different accidents are related to the
outside risk of pipelines and economic risk derived from pressure redistribution
433Risk Management in Gas Networks: A Survey

related to outside risk of pipelines. In their method, using the FTA, event tree anal-
ysis, and historical data or modified empirical formula, the expected failure rate
per unit pipeline is calculated as follows:
ρ5X
kρkKkða1; a2; . . .Þ ð20:1Þ
In the above formula, ρ shows the expected failure rate per unit pipeline (1/year
km), ρk demonstrates the basic failure rate per unit length of pipeline (1/year km),
and Kk shows the correction function for any failure cause, a1,a2, . . .. These are the
arguments of the correction function, and the subscript k indicates each failure
cause such as corrosion, construction defects, external interference, or ground
movement.
The main sources of harm to gas pipelines from outside are toxic gas diffusion,
jet flames, fireballs, and unconfined vapor cloud explosions. They measure all of
these adverse effects by quantitative criteria and finally calculate the fatal probabil-
ity for destruction.
According to the dose�effect relationship between the dose of the concrete harm-
ful load as toxicity, heat or pressure and such recipient categories as death or inju-
ries, the function of fatality probability unit PT is defined to quantitatively describe
the harmful load. Fatality probability unit can be used for the measurement of the
damage from an accident and that is the critical basis of the calculation of death
probability percentage, which is the final result of the accident consequence. [37]
The main source of harm from outside gas pipelines is economic loss. For exam-
ple, it is possible to estimate PT from an accident using the following formula:
PT 5 a1 b lnIf ð20:2Þ
where empirical constant a represents the hazard only related to a studied harmful
load and b (also an empirical constant) represents the vulnerability of recipients to
the load. If , for a given exposure time, is a dose of the load. Also note that a rela-
tionship exists between the death probability percentage and the fatality probability
unit, by which we can calculate death probabilities.
They finally do the risk evaluation process in which risk is defined as a function
of the probability of an accident and its consequences. For example, they calculate
economic risk as follows (considering the assumption that economic production is
in direct proportion to the gas supply pressure):
EðRÞ5 � ðK 0 � ðPnode 2Pnode; nowÞÞ ð20:3Þ
where E(R) is the financial risk, K0* is the expected failure rate of the nodes (calcu-
lated in the first step), Pnode is gas supply pressure of the nodes in a normal situa-
tion, and Pnode, now is the gas supply pressure after a disruption. Note that the term
in second parenthesis represents financial loss.
434 Logistics Operations and Management

Brito et al. [36] tried to design a multiattribute model for investigating risk in
natural gas pipelines. An evolutionary version of Brito and Almeida [34], this paper
used the ELECTRE TRI method integrated with utility theory to do so. Identifying
the hazard scenarios, they divided the pipeline into a definite number of sections
(each section has specific threats and vulnerabilities), and then the impact of each
scenario on each section is calculated. After estimation of payoff sets (H, E, F) in
which H stands for human, E for environment, and F for financial, the utility func-
tion of each is elicited (using the utility theory). Data from consequence probabili-
ties on human environment and financial and utility functions are used to calculate
human, environment, and financial losses, and these data are combined with hazard
scenario probabilities to calculate human, environmental, and financial risks for
each section. Finally, a number of risk categories are defined and all of the identi-
fied risks are put into these categories (using ELECTRE TRI).
For the consequence analysis of the outside pipelines, heat and overpressure are
considered to calculate the individual risk and societal risk. The economic risk of
the gas pipeline network is used to study the results of the inside gas pipelines. A
sample of an urban gas pipeline network is used to show the presented integrated
quantitative risk-analysis method.
For more information on guidelines for QRA, readers are referred to the TNO
Purple Book [38].
20.3.4 Developing Applicable Risk-Abatement Options
In this step, different options to mitigate risk are introduced and categorized. The
outputs of the previous step are much like the causes of pain, and output of this
step resemble remedies that are prescribed to alleviate these pains. Different
options can be employed to fight the risks. Some are preventive and should be
done before a loss event, and some are just applicable when the event occurs.
Preventive measures include deterring the sources of threats and eliminating vul-
nerability events. Event-dependent activities include reductions of potential loss,
managing the crisis, and rapid restoration to get back to normal. “Risk abatement is
achieved through policies and procedures, technology, and insurance” [12].
Setting preventive governmental and international laws to deter the sources of
threats are part of a common strategy. For example, severe international laws can
be set to act against terrorism. Furthermore, some policies can be made to eliminate
vulnerabilities, such as forcing all companies in a country to use computerized sys-
tems in which more reliable information systems are provided. Establishing institu-
tions such as the North American Electricity Council (NERC) in power sectors can
be helpful in establishing operating policies and planning standards to ensure the
reliability of gas systems.
With the usage of the high-tech systems, risk can be abated. For example, some
sophisticated control systems can be used to determine the defects of gas pipelines.
Using new technologies, gas can be transported in a liquefied state (LNG). Recent
advances in the area of operations research and mathematical modeling brought
about more accurate solutions for problems in the real world. For example, in the
435Risk Management in Gas Networks: A Survey

area of gas networks, Unsihuay-Vila et al. [16] presented a long-term, multiage,
and multistage model for the supply and interconnections expansion planning of
integrated electricity and natural gas. The model of this work considered the value
chain of both natural gas and electricity. This robust model, which minimizes
investment and operational cost, dictates that to reduce the risk of power supply we
are recommended to have natural gas storage when hydropower is considered. Shi
et al. [39] proposed to use natural gas hydrate (NGH) instead of LNG and com-
pressed natural gas (CNG) because NGH has particular advantages such as moder-
ate conditions of production and storage, simple technology, and high security.
Insurance companies are the best example for managing risk and rapidly restor-
ing a situation to normal.
20.3.5 Analyzing Options to Select Cost-Effective Ones
Although the previous step tries to clarify the risk environment, threats, and vulner-
abilities, this step tries to find strategies and activities that should be used to act
against this situation and abate the risk. Already-known and different strategies that
can be taken should be recognized, and the efficient ones should be elected through
a cost�benefit analysis process. Having the information of the previous steps is
crucial: If we do not know the risk environment, then there is no guarantee an
activity can reduce the risk. Employing the AHP tool, decision trees, the use of a
plus/minus/interesting (PMI) tool which weighs pros and cons of each option is
also helpful. A review of decision-making techniques is given in Huitt [40]. The
journal Risk Analysis [41] presents a 0�1 knapsack formulation that tries to per-
form a valid cost�benefit analysis when a number of mitigation options and a lim-
ited amount are available. Although monetary value is incurred by owners and
operators of the gas network, there are benefits that the aforementioned article tried
to maximize subjected to total some of cost which can be paid for. Knowing this,
the following formula is used:
maxXN
i5 1bixi ð20:4Þ
subject to
XN
i5 1biwi #W ð20:5Þ
xiA0; 1 ’i ð20:6Þ
where
bi is the benefit derived from implementation of countermeasure i
wi is the cost of countermeasure i
W is the available budget
N is the total number of available countermeasures
436 Logistics Operations and Management

In this formula, the total benefit (Eqn (20.4)) derived from implementing cost-
effective countermeasures is trying to be maximized, while in Eqn (20.5) the total
cost spent is trying to not be more than W. The problem is solved using a dynamic
programming method. It may be good to say that in the same paper a concise risk-
management procedure is presented that is partly similar to what we have presented
here.
A range of different options may be used. In fact, a combination of these options
should be chosen based on a cost�benefit analysis. For example, to have a robust
system in a gas supply network, we can either purchase high-quality pipes with no
control system or low-quality pipes with high-tech control systems, or even a com-
bination of both.
20.3.6 Implementing Chosen Activities
Implementing risk-abatement activities is the sixth step that should be undertaken.
If a program is not executed effectively and efficiently, then the time used to plan
the previous steps has been wasted. To do a good job, we must define effective
plans and procedures, assign and train promising staff, monitor the work to guaran-
tee that the plans are implemented carefully and accordingly, and look dynamically
at new situations that may have different threats, vulnerabilities, and risk
environments.
References
[1] Y. Ruan, Q. Liu, W. Zhou, B. Batty, W. Gao, J. Ren, T. Watanabe, A procedure to
design the mainline system in natural gas networks, Appl. Math. Model. 33 (2009)
3040�3051.
[2] A. Kabiriana, M.R. Hemmati, A strategic planning model for natural gas transmission
networks, Energy Pol. 35 (2007) 5656�5670.
[3] A. Cheboubaa, F. Yalaoui, A. Smati, L. Amodeoa, K. Younsi, A. Tairi, Optimization of
natural gas pipeline transportation using ant colony optimization, Comput. Oper. Res.
36 (2009) 1916�1923.
[4] M. Hamedi, R.Z. Farahani, M. Moattar Husseini, G.R. Esmaeilian, A distribution plan-
ning model for natural gas supply chain: a case study, Energy Pol. 37 (2009) 799�812.
[5] A. Herran-Gonzalez, J.M. De La Cruz, B. De Andres-Toro, J.L. Risco-Mart�n,Modeling and simulation of a gas distribution pipeline network, Appl. Math. Model. 33
(2009) 1584�1600.
[6] A. Martin, M. Moller, S. Moritz, Mixed integer models for the stationary case of gas
network optimization, Math. Program. 105 (2006) 563�582.
[7] R.Z. Rıos-Mercado, S. Kim, E.A. Boyd, Efficient operation of natural gas transmission
systems: a network-based heuristic for cyclic structures, Comput. Oper. Res. 33 (2006)
2323�2351.
[8] P.J. Wong, R.E. Larson, Optimization of tree structured natural gas transmission
networks, J. Math. Anal. Appl. 24(3) (1968) 613�626.
437Risk Management in Gas Networks: A Survey

[9] S. Wu, R.Z. Rios-Mercado, E.A. Byod, L.R. Scott, Model relaxation for the fuel cost
minimization of steady state gas pipeline networks, Math. Comput. Model. 31(2�3)
(2000) 197�220.
[10] Critical Infrastructure Assurance Office, Tab B Preliminary Research and Development
Roadmap for Protecting and Assuring the Energy Infrastructure. Preliminary Research
and Development Roadmap for Protecting and Assuring Critical National
Infrastructures (Transition Office of the President’s Commission on Critical
Infrastructure Protection and the Critical Infrastructure Assurance Office, Washington,
DC), 1998. Available from: http://www.oe.energy.gov/DocumentsandMedia/
Preliminary_RandD_Roadmap_for_Prot_and_Assur_Critical_Natl_Infr.pdf (accessed
April 2010).
[11] National Petroleum Council, Securing oil and natural gas infrastructures in the new
economy. A report by the National Petroleum Council: Committee on Critical
Infrastructure Protection, 2001.
[12] International Energy Agency, Security of gas supply in open markets. International
Energy Agency (IEA), 2004.
[13] C. Pelletier, J.C. Wortmann, A risk analysis for gas transport network planning expan-
sion under regulatory uncertainty in Western Europe, Energy Pol. 37 (2009) 721�732.
[14] C. Jepma, Gaslevering onder druk, Stichting JIN. Available from: www.jiqweb.org,
2001 (52pp.) (in Dutch).
[15] C. Jepma, M. Broekhof, W. van der Gaast, Hydra, Aantasting van leveringszekerheid
stichting JIN, 2004 (106pp.) (in Dutch).
[16] C. Unsihuay-Vila, J.W. Marangon-Lima, A.C. Zambroni de Souza, I.J. Perez-Arriaga,
P.P. Balestrassi, A model to long-term, multiarea, multistage, and integrated expansion
planning of electricity and natural gas systems, IEEE Trans. Power Syst. 25(2) (2010)
1154�1168.
[17] J.R.G. Whiteford, G.P. Harrison, J.W. Bialek, Electricity and gas interaction: a UK per-
spective and risk assessment, IEEE, 2009, 978-1-4244-4241-6/09.
[18] M. Arnold, R.R. Negenborn, G. Andersson, B.D. Schutter, Model-based predictive con-
trol applied to multi-carrier energy systems, IEEE, 2009, 978-1-4244-4241-6/09.
[19] J. Munoz, N. Jimenez-Redondo, J. Perez-Re, J. Barquin Natural gas network modeling
for power systems reliability studies. 2003 IEEE Bologna PowerTech Conference, June
23�26, 2003, Bologna, Italy.
[20] Fedora P.A., Reliability review of North American gas/electric system interdependency,
in: Proceedings of the 37th Hawaii International Conference on System Sciences, 2004.
[21] D.W. Hubbard, The Failure of Risk Management: Why It’s Broken and How to Fix It,
John Wiley & Sons, Hoboken, NJ, 2009.
[22] O.S. Vaidya, S. Kumar, Analytic hierarchy process: an overview of applications, Eur. J.
Oper. Res. 169(1) (2006) 1�29.
[23] The Institute of Risk Management, A risk management standard, The Institute of Risk
Management, 2002. Available from: www.theirm.org.
[24] J. Dunjo, V. Fthenakis, J.A. Vılchea, J. Arnaldos, Hazard and operability (HAZOP)
analysis: a literature review, J. Hazard. Mater. 173(1�3) (2010) 19�32.
[25] V. Preston, Questionnaire survey, Int. Encycl. Hum. Geog. (2009) 46�52.
[26] S. Reinach, A. Viale, Application of a human error framework to conduct train
accident/incident investigations, Accident Anal. Prevent. 38(2) (2006) 396�406.
[27] C. Lee, M. Su Fault-tree analysis of intuitionistic fuzzy sets for liquefied natural gas
terminal emergency shut-down system. IIH-MSP, vol. 2, pp. 574�577, Third
438 Logistics Operations and Management

International Conference on International Information Hiding and Multimedia Signal
Processing (IIH-MSP), 2007.
[28] E. Cagno, F. Caron, M. Mancini, F. Ruggeri, Using AHP in determining the prior dis-
tributions on gas pipeline failures in a robust Bayesian approach, Reliability Eng. Sys.
Safety 67 (2000) 275�284.
[29] J. Krueger, D. Smith, A practical approach to fire hazard analysis for offshore struc-
tures, J. Hazard. Mater. 104 (2003) 107�122.
[30] P.L. Metropolo, A.E.P. Brown, Natural gas pipeline accident consequence analysis, in:
3rd International Conference on Computer Simulation in Risk Analysis & Hazard
Mitigation, Sintra, Portugal, 2004, pp. 307�310.
[31] Y. Jo, B.J. Ahn, A method of quantitative risk assessment for transmission pipeline car-
rying natural gas, J. Hazard. Mater. A123 (2005) 1�12.
[32] S. Sklavounos, F. Rigas, Estimation of safety distances in the vicinity of fuel gas pipe-
lines, J. Loss Prevent. Process Ind. 19 (2006) 24�31.
[33] Y.D. Jo, D.A. Crowl, Individual risk analysis of high-pressure natural gas pipelines,
J. Loss Prevent. Process Ind. 21 (2008) 589�595.
[34] A.J. Brito, A.J. de. Almeida, Multi-attribute risk assessment for risk ranking of natural
gas pipelines, Reliability Eng. Sys. Safety J. 94(2) (2009) 187�198.
[35] J.A. Suardin, A.J. McPhate, A. Sipkema, Fire and explosion assessment on oil and gas
floating production storage offloading (FPSO): an effective screening and comparison
tool, Process Safety Environ. Protect. 87 (2009) 147�160.
[36] A.J. Brito, A.J. de Almeida, C.M.M. Mota, A multicriteria model for risk sorting of nat-
ural gas pipelines based on ELECTRE TRI integrating utility theory, Eur. J. Oper. Res.
200 (2010) 812�821.
[37] Z.Y. Han, W.G. Weng, An integrated quantitative risk analysis method for natural gas
pipeline network, J. Loss Prevent. Process Ind. 23(3) (2010) 428�436.
[38] TNO Purple Book, Guidelines for quantitative risk assessment. CPR18E, first ed.,
Committee for the Prevention of Disasters, The Netherlands, 1999.
[39] G. Shi, Y. Jing, X. Zhang, G. Zheng Prospects of natural gas storage and transportation
using hydrate technology in China, IEEE, 2009, 978-1-4244-2800-7/09.
[40] W. Huitt, Problem solving and decision making: consideration of individual differences
using the Myers-Briggs type indicator, J. Psychol. Type 24 (1992) 33�44.
[41] Risk management for natural gas pipeline distribution networks. Risk Anal. J. (2009).
439Risk Management in Gas Networks: A Survey

This page intentionally left blank

21Modeling the Energy Freight-Transportation Network
Mohsen Rajabi
Department of Industrial Management, Faculty of Management,Tehran University, Tehran, Iran
21.1 Introduction
21.1.1 Energy in the World
Societies all over the world are entirely dependent on energy for achieving and sus-
taining their development. Energy, in any form, plays a vital role in the industrial
environment. Whenever sufficient energy is available, economic development
occurs. A wide range of energy forms are being consumed, including natural gas
(NG) for industrial uses and heating, electricity for light and to power electronic
devices, petrochemicals to produce plastics, and petroleum derivatives such as gas-
oline and diesel for transportation.
Because modern life is based on energy, individuals, corporations, and firms
should have a reliable access to energy in all its forms. Problems involving the con-
tinuous transportation and delivery of energy can lead to the disruption and break-
down of economic, industrial, and social infrastructures. An energy resource cannot
be reliable unless, first of all, it is delivered to right place at the right time, and sec-
ondly, it must be available in the consumer desired quantity. Maintaining the effi-
cient and reliable generation, transportation, and distribution of energy is the most
important in a world which is so dependent on energy.
Different kinds of energy are used in today’s industries and in people’s lives.
Some are fossil fuel resources such as oil and gas, but electricity, nuclear energy,
solar energy resources, wind energy, and wave energy are also being used. All of
these types should be delivered to consumers. The two most useful forms are fossil
fuels and electricity. Electrical and gas systems are quite similar. Both are designed
to carry energy from suppliers to consumers. The process of generating the energy
and delivering it to the final consumer can be structured into:
� Suppliers (electrical power plants or gas fields)� Transmission (high-voltage or high-pressure networks)� Distribution (medium-low voltage network or medium- or low-pressure network)� Customers (electricity customers or gas customers) [1].
Logistics Operations and Management. DOI: 10.1016/B978-0-12-385202-1.00021-9
© 2011 Elsevier Inc. All rights reserved.

Nevertheless, there are differences between these two types of energy. NG is
directly obtained from gas fields, whereas electrical energy is a secondary form of
energy that is produced by the transformation of a primary form in a power plant.
Moreover, gas can be stored for future use in peak load periods, whereas electrical
energy cannot be efficiently stored.
As societies develop, they inevitably need more and newer sources of energy.
Planning for power-generation expansion is necessary to meet the rising need for
energy. Planning determines which types, where, and when new generation or
transmission installations should be constructed [2]. Clearly, in any expansion plan,
there is an interaction between the energy supply and transport and power plants.
For example, gas is carried from gas fields (suppliers) to consumers in liquefied
natural gas (LNG) ships or flows through pipelines. Gas consumers can be classified
as domestic or industrial customers [1]. Combined-cycle power plants are NG
industrial customers that use gas to generate electricity. The expansions of pipeline
networks, which are the part of the energy-transportation network, are complex and
extensive. It is also possible to increase the capacity of the pipelines. However, the
transmission capacity of a gas pipeline is not unbounded and depends on the pres-
sure difference between the two ends of the pipeline. To increase the capacity of the
network, compressors can be added at certain locations. Compressors enlarge the
pressure difference between the two nodes of pipeline network. By expanding
the network or increasing the capacity, the amount of gas that can be supplied to
consumers is always limited.
21.1.2 The Importance of Energy Around the World
The organization and structure of the power industry has undergone important
change in many countries over the last few years. Reasons for change are political,
economic, and technical. The development of combined-cycle power plants is the
best example of a technical change. These plants use NG as the primary fuel to
generate electricity. They have efficient procedures and several advantages com-
pared to traditional thermal and nuclear power plants. In addition to that, they
require less startup investment cost and shorter depreciation periods. The tradi-
tional economies of scale that were the reason for the existence of big regulated
utilities have either disappeared or greatly reduced. This new insight compels the
restructuring of the power industry into a free electricity market. The general trend
is to move toward a greater competition, which means larger risks for private com-
panies [1].
NG is considered one of the most reliable sources for supplying the world’s
growing energy demands. The industrial heating sector is the largest consumer of
NG. Electrical power generation comes after that. It has grown strongly after the
introduction and development of combined-cycle generation technology (CC-NG)
in the 1980s. One reason for this growth has been abundant NG resources around
the world: the United States, Russia, Europe, Latin America, and the Middle East.
These resources have favored gas-fired generation as the key factor in the total
growth of NG consumption. As there are still NG reserves that have not been yet
442 Logistics Operations and Management

discovered, this consumption is certain to keep growing. As a result, investment in
infrastructure such as terminals, pipeline networks, and compressors will increase
in the future.
Countries around the world have understood the importance of energy and its
role in the development of their societies. The following examples show how coun-
tries pay attention to and invest in the energy resources and on-time transportation
of energy to the customer.
In recent years, Latin America has been one of the most intensive development
regions for NG and electricity [3]. The region is highly dependent on hydropower
(about 57% of the region’s installed capacity is hydro), and the need to diversify
away from heavy investments in hydropower and oil is driving many countries to
promote the use of NG, especially for power generation. Examples of these devel-
opments are in Brazil, Chile, and Colombia. Countries in the region are diverse in
size, electrical installed capacity, electrical power demand, and electrical trans-
mission and NG network characteristics (level of meshing and geographical exten-
sion) [4].
Economic reforms let private sectors invest in energy-generation and energy-
freight sectors that were previously reserved to national governments. These
reforms boosted the development of an energy infrastructure in Latin America.
Electricity and NG pipelines developed in the region, separately in each country
and in cross-border electricity�gas interconnections. The introduction of NG in the
energy matrix of these countries was more aggressive at the end of the 1990s with
the construction of cross-border gas pipelines (Bolivia�Brazil, Argentina�Chile,
etc.) and the development of local gas production fields [3].
NG is mostly used in industries and automotive sections. As these two sections
have experienced significant growth, their consumption rates of NG have increased.
Another reason for the increase in the use of NG is the growing numbers of gas-
fired thermal generation plants producing electricity.
In addition, Chile and Brazil decided to implement regasification plants in order
to start importing LNG beginning in 2009 [4]. The motivation for both countries is
similar: (1) to diversify the gas supply for the country (in the case of Chile, to
diversify from Argentina; and in the case of Brazil, to diversify from Bolivia) and
(2) to create a flexible supply able to accommodate the use of gas to power
generation.
In China, NG is becoming one of the main resources of energy, in addition to
coal and oil, and its consumption is rapidly increasing [5].
In Spain, gas systems have been restructured from a regulated market to a free
and competitive market in the last few years. Gas companies are building combined-
cycle power plants to get into the electricity market [1]. Such companies have the
opportunity to act in both gas and electricity markets. They can either sell their gas
as fuel in the gas market or generate electricity and sell it in the electricity market.
Thus, these two markets are related to each other with respect to market price, and
the coupling between them is much stronger.
In the European Union, only a few countries have the advantage of having sub-
stantial energy resources that not only meet their domestic needs but also can be
443Modeling the Energy Freight-Transportation Network

exported to other countries in the region. Norway, the Netherlands, Denmark, and
the United Kingdom are among these countries. There have been considerable
investments in pipeline networks in order to transport energy to other European
terminals.
The growth in energy-transportation networks then led to the establishment of
organizations to manage and coordinate the transmission system. They were also in
charge of negotiating import and export transactions between countries that pos-
sessed energy and those that did not.
In the United Kingdom, one of the energy exporter and importer countries in the
European Union, NG will play a great role in the energy sector in the future. With
the closure of coal-fired power plants and the retirement of nuclear plants, the need
for NG is inevitable. However, the country’s gas supply has decreased as the coun-
try has become more dependent on gas to generate energy in recent years. This fact
made the country rely more on imported energy sources than domestic resources.
Ensuring on-time supply and delivery of energy to the country is necessary in order
to increase the energy sector’s security.
Over the past few years, more and more gas has been drawn from indigenous
North Sea supplies to meet significantly rising domestic consumption. Rather than
government looking to protect and prolong supplies (the practice in Norway, for
example), policy changes in the 1980s led to the fastest possible promotion of NG
production in the area known as the UK Continental Shelf [6].
21.1.3 Energy Freight Transportation
Generally speaking, freight transportation is a vital component of the economy.
It supports production, trade, and consumption activities by ensuring the effi-
cient movement of raw materials and finished goods and their on-time deliv-
ery. Transportation accounts for a significant part of the final cost of products
and represents an important component of the national expenditures of any
country [7].
Freight transportation has always been an integral component of economic
development. It has now emerged as one of the most critical and dynamic aspects
of the transport sector, where change has become the norm. Freight transportation
is the main element supporting global commodities and, more generally, supply
chains, complex and functionally integrated networks of production, trade, and ser-
vice activities that cover all stages of production from the transformation of raw
materials to market distribution and after-market services [8].
The cost of a transportation system directly influences the cost of finished
goods. The rising cost and complexity of shipping and delivering goods is adding
to pressures faced by manufacturers and producers across the globe. However, as a
result of the surge in global activities over the past 10 years, this issue has taken on
new dimensions and importance. Thus, the freight-transportation industry must per-
form at a high level in order to become economically efficient. With respect to
quality standards, transportation has to offer high-quality services while being
reliable.
444 Logistics Operations and Management

The political evolution of the world also affects the transportation sector. This
fact becomes more important as the significant political and economic role of
energy is taken into consideration. The appearance and expansion of energy term-
inals in increasing free-trade zones, political changes that result in new markets, and
growing economic globalization have tremendous consequences for the evolution of
transportation systems. Not all of the consequences are studied or understood well,
and they need to be evaluated to become apparent.
NG is a vital component of the world’s supply of energy. NG has made a
strong comeback in the global energy balance since the mid-1970s as a direct
response to increasing crude oil prices that began then. This development was
given further impetus in the late 1980s in light of new concerns about potential
global warming and climate change. The low-carbon intensity of NG (lowest
among the fossil fuels) has made it the fuel of choice from an environmental point
of view [1].
The transportation economics of NG, as one major form of energy, depend
greatly on the annual volume of gas fields and transport distances. However, consum-
ers or existing gas pipelines are usually at long distances from NG fields where
gas pipelines cannot be built and operated economically. In developing countries,
economical transporting and storing of NG is an important issue.
Two technologies have been introduced to condense NG to make it easy to
transport safely. LNG and compressed natural gas (CNG) technologies have been
applied in the gas industry for several years. LNG technology can reduce its vol-
ume by about 620 times using the liquefaction of NG, whereas CNG technology
reduces its volume by about 200 times using compression [5]. Unit transport costs
and unit storage costs are greatly reduced by both technologies.
The production, processing, transportation, and consumption of LNG and associ-
ated products are an issue of great interest in the energy industry. An LNG supply
chain consists of loading ports shipping LNG to one or more receiving ports [9]. A
typical supply chain is depicted in Figure 21.1. The loading ports and receiving
ports structures are depicted in more detail in Figures 21.2 and 21.3, respectively.
Shipping
Loading Receiving
Figure 21.1 A typical supply chain [9].
445Modeling the Energy Freight-Transportation Network

NG is one of the cleanest, most efficient, and most useful of all energy sources.
It is basically formed of methane but also contains heavier hydrocarbons such as
ethane, propane, and butane. After extraction, it is purified to make it easier to
transport and store. Impurities such as water, sulfur, sand, and other compounds
make NG harder to transport, so they must be separated and removed.
In its raw form, NG is unsuitable for delivery, so it is condensed into a liquid
at almost atmospheric pressure by cooling it to approximately �162�C. LNG is
about 1/614th the volume of NG at standard temperature and pressure. To transport
it over long distances where pipelines do not exist, it is carried by specially
designed cryogenic vessels and cryogenic tankers and stored in specially designed
tanks [10].
Huge advances in maritime transportation technology have been made in recent
decades. These advances now increase opportunities to transport energy, oil in par-
ticular, over long distances. Since 1980, the world’s maritime fleet has grown in
LNG Gas Gas pipe line
Well groups
Gas processing plants
Plant inlet/slug catchers
Gas treatment plants
Fractionation trains
Liquefaction trains
Jetties
Berth
LNG tanks
Power station
Electricity demand
Gas
demand
Figure 21.2 The structure of a loading port [9].
446 Logistics Operations and Management

parallel with the seaborne trade. Table 21.1 shows the growth of world fleet in the
period of 23 years from 1980 to 2003 [11].
The ocean shipping industry has a monopoly on the transportation of energy to
faraway continents and countries. Pipelines are the only transportation mode that is
cheaper than ships, but they are far from versatile because they can move only fluid
types of energy over fixed routes, and they are feasible and economical only under
specific conditions. Other modes of energy transportation (rail and truck) have their
advantages, but ships are probably the least regulated mode of transportation
because they usually operate in international waters, and few international treaties
cover their operations.
Table 21.1 World Fleet by Vessel Type (Million DWT)
Year Oil Tankers Bulk Carriers General Cargo Container Ships Other Total
1980 339 186 116 11 31 683
1990 246 234 103 26 49 658
2000 286 281 103 69 69 808
2001 286 294 100 77 69 826
2002 304 300 97 83 60 844
2003 317 307 95 91 47 857
Berth
Jetties
Electricity demand LNG tanks
Power station
LNG demand
Gas demandLNGGas
Figure 21.3 The structure of a receiving port [9].
447Modeling the Energy Freight-Transportation Network

Pipeline transportation is more economical over short distances, whereas LNG
shipping is more attractive over greater distances [12]. Once NG is in the transmis-
sion network, it travels from suppliers to customers over long distances. The gas
network can be described as having supply nodes, demand nodes, and intermediate
nodes. The gas is injected into the system through the supply nodes and flows out
of the system through the demand nodes, which are also known as consumers.
Demand nodes are classified as electrical customers and nonelectrical customers
[1]. Electrical customers are combined-cycle power plants that use the gas as fuel
to produce electrical energy. Nonelectrical customers are the remainder of NG sys-
tem customers.
Except for the two technologies, some technologies, especially natural gas
hydrate (NGH) technology, are being developed to store and transport NG.
Energy in transit is exposed to unexpected dangers that may cause extensive
damage to life, property, and environment. For NG, incidents such as leak or spill,
irregular high or low temperatures, explosion, and flame can occur as it is trans-
ported or stored [10]. Industry analysts have analyzed the statistical likelihood of
these events occurring simultaneously, and transient analysis has been used to
derive the level of support necessary in pipe design to ensure there would be no
system failure [6].
Safety is a high priority with companies that are in charge of moving and dis-
tributing NG. It is very important that they analyze the probabilities of failure in
the system, assess the worst results of such incidents, and provide guidance in
developing safety and security requirements.
In addition to establishing rules for a well-functioning internal gas market, the
European Community wanted to provide measures that would provide an adequate
level of security for gas supplies. The directive (2004�2004/67/EC) set out certain
instruments that were to be used by each member state to enhance security [13].
The instruments are as follows:
� Provide pipeline capacity to enable diversion of supplies and system flexibility.� Transmit system operator cooperation to coordinate dispatch.� Invest in infrastructure for gas imports in the form of regasification terminals and
pipelines.
The evolution of technology has also had a major influence on energy freight
transportation. The problem is whether the transportation system can adapt to
advances in new technologies and fuels and whether it will be well organized and
operated in the new era. Freight transportation must perform within rapidly changing
technological, political, and economic conditions and trends. Significant changes
in technology are not about traditional hardware but about advances in information
technology and software. The introduction of the Internet and the increasing use of
it has dramatically changed the process of transportation, the way it is being con-
trolled, and the interaction between carriers, shippers, and terminals.
Intelligent transportation systems, on the other hand, offer means to efficiently
operate and raise new challenges, as illustrated by the evolution toward modifying
planned routes to respond in real time to changes in traffic conditions or new
448 Logistics Operations and Management

demands. More complex planning and operating procedures are a direct result of
these new policies, requirements, technologies, and challenges [14]. Freight trans-
portation must adapt to and perform within these rapidly changing political, social,
and economic conditions and trends. In addition, freight transportation is in itself a
complex domain. Many different firms, organizations, and institutions, each with
its own set of objectives and means, make up the industry. Infrastructure and even
service modifications are capital intensive and usually require long implementation
delays; important decision processes are often strongly interrelated. It is thus a
domain in which accurate and efficient methods and tools are required to assist and
enhance analysis, planning, operation, and control processes.
21.2 Energy Freight-Transportation Network
21.2.1 Application of Energy Freight-Transportation Models
Transportation network problems in the real world are studied through network
models. A model is a representation of an object or a problem being studied.
Models and methods of freight-transportation networks present the evolution of the
network as well as the response to rapidly changing environments. Models must be
capable of responding to various changes and modifications: modifications in exist-
ing infrastructure, the introduction of modern carriers, the construction of new
facilities, the introduction of new technologies resulting in changes of volumes and
patterns of supplying energy, the increasing rate of energy consumption resulting in
faster transportation, variations in energy prices, changes to labor conditions, new
regional or international policies and legislations, and so on. Network models help
better explain the relationships between network components.
Transportation scientists try to explain spatial interactions that result in the
movement of objects from place to place. It includes research in the fields of
geography, economics, and location theory. Transportation science goes back sev-
eral centuries. Its methodologies draw from physics, operations research, proba-
bility, and control theory. It is fundamentally a quantitative discipline, relying on
mathematical models and optimization algorithms to explain the phenomena of
transportation [14].
Scientists try to solve the problems in models in order to reach to an optimal
solution. Different aspects of a network such as network design, network flow, and
network operation are varieties of basic issues being considered in sciences such as
operation research, management, accounting, and engineering. Therefore, algo-
rithms of different types have been developed to solve the problems in reasonable
time to find the optimal solution.
Transportation of energy for industrial or individual uses is of great importance
in developing and underdeveloping countries. As a large amount of money is
invested in energy-related issues such as supplying transportation and storage of
energy, it is a priority to study freight-transportation network models. There are
researchers of different fields working on the network models as the problems of
449Modeling the Energy Freight-Transportation Network

transportation and distribution of energy are multidisciplinary. As the result, varie-
ties of algorithm and solutions have been found to deal with the problems.
21.2.2 Energy Freight-Transportation Network
The need for energy freight transportation derives from the significant distances
between energy’s production and supply point and the consumption point. Whether
it is petroleum or the downstream products of it such as gas and gasoline, a trans-
portation system must move and deliver it to the final point to meet demands.
Therefore, the transportation system requires carriers to use any appropriate means
to facilitate the delivery of energy at such distances. Another reason for using vari-
eties of carriers would be the need to move energy according to schedule, in reli-
able containers, with the lowest possibility of happening hazards, and in reasonable
costs while meeting the quality standards to satisfy consumer demands. Achieving
this aim requires that the components of transportation system operate properly.
A transportation system can be defined as a set of elements and the interactions
between them that produces both the demand for travel within a given area and the
provision of transportation services to satisfy this demand. Many elements operate
in every transportation network, so identifying and controlling all of these interact-
ing elements in order to design and implement the network is hardly possible.
Therefore, it is inevitable to isolate the elements that are relevant more to the prob-
lem being studied and to keep the remaining ones as external factors.
Levels of Planning
In general, transportation systems are classified into three levels, according to the
planning level of the system: strategic, tactical, and operational. Because a trans-
portation system has close relationships with management decisions and policies
and is a complex organization of components from human and material resources
to facilities, infrastructures, carriers, and containers, it is necessary for such system
to be planned in detail.
Strategic Level
Long-term planning—or, in other words, strategic planning—is directly concerned
with the design of physical network and related models of transportation and its
evolution, allocating the location of terminals, ports, and the same facilities; the
expansion of transportation capacity; and tariff policies. It determines the general
policies and the development trend of the system in the long-term horizon.
Therefore, strategic planning involves the highest level of managers and may need
large capital investments to be executed.
Knowing that transportation networks are not just national but in many cases
international, strategic planning is also done at national, international, and even
regional levels. As discussed previously and as elaborated on in “Route” section,
models of transportation networks are designed in the strategic level of planning.
450 Logistics Operations and Management

Tactical Level
Over a medium-term horizon, tactical planning determines resource allocation and
utilization in order to make the system operate efficiently. Medium-term planning
includes carrier scheduling and routing, and it is responsible for the design of net-
work service. The decisions for this level of planning are taken by medium-level
managers of the organization.
Operational Level
Performed by local and operational management, this level of planning is con-
cerned with the issues happening in the short term. In today’s rapidly changing
environment, time has an important role, so scheduling and implementing carriers,
services, crews, and maintenance activities and efficiently routing and allocating
carriers and crews in the short term are the problems that operational managers
have to deal with.
21.2.3 Classifications of Energy Freight-Transportation Networks
The energy-transportation process is usually divided into three parts, two of them
being similar. The process begins at the production point, which can be a port, a
terminal, a petroleum platform in the middle of the ocean, or an electricity produc-
tion zone, and generally any production point for any kind of energy. The process
next comes to containers of energy. Energy is mainly transported through railways,
shipping lines, and energy container trucks. It can be said that pipelines and cable
networks are other examples of energy transportation. However, these are the faci-
lities mostly used to distribute the energy rather than transport it. Transporting
energy usually includes long distances and large amounts that pipelines and cable
networks are not capable of handling. The third and last part of the process is the
receiving ports or terminals, where the energy goes through distribution to be deliv-
ered to the consumption points.
Freight transportation also can be categorized into shippers, carriers, and gov-
ernments. Shippers originate the demand for transportation, whereas carriers are
utilities such as railways, motor carriers, and shipping lines. Governments are
responsible for providing transportation infrastructures such as railroads, ports, and
platforms and to pass relevant laws.
Another classification of energy freight-transportation components, like other
types of transportation, has two main elements: demand and supply [15].
With respect to distance, freight transportation can be divided into long-haul
versus short-haul transportation. In long-haul freight transportation, the carrier
moves over long distances and between national or international ports and term-
inals. Large vessels, railways, and, in rare cases, trucks are used in this type of
transportation. However, in short-haul transportation, energy and related products
are transported by large trucks. Although trucks are the main means of short-haul
451Modeling the Energy Freight-Transportation Network

transportation, railways are also appropriate when there is a need to deliver large
amounts of energy—for instance, gasoline—to short distances.
Clearly, government plays a large role in developing institutions responsible for
facilitating the transportation process. Governments contribute the infrastructure:
roads, highways, and a significant portion of ports, internal navigation, and rail
facilities. Governments also regulate (e.g., dangerous and toxic goods transporta-
tion) and tax the industry [14].
The following sections are brief notes about the different components of the
transportation process.
Energy Production and Receiving Point
The process of energy freight transportation begins at a production point such as an
oil platform. Where the energy is produced and is ready to be transported, based on
the type of energy, the production process and method of storage are varied. For
instance, at an offshore oil platform, oil is extracted from wells and stored in indus-
trial facilities called oil depots. Oil that is stored in depots is in the final step of
refining and therefore is ready for customer use. Oil depots usually have particular
reserve tanks that are used for discharging the product to transportation vehicles.
Energy Containers
Because the production points of energy freights are most often long distances
from consumption points, transportation is inevitable, so selecting the
suitable mode of transporting energy products is an important concern.
For transporting energy freight to customers, a number of carriers and methods
can be used. The dominant ones are trucks, pipelines, marine lines, and railroads.
Each method has its own advantages and disadvantages regarding issues such as
reliability, cost, safety, security, and accessibility. Nowadays with the changes in
environmental conditions, other elements should be taken into consideration, such
as pollution problems, noise production, traffic jams, and energy consumption of a
node [16]. Choosing the proper container depends on optimizing these various cri-
teria, and sometimes it is more beneficial to use a combination of them to better
serve customers. This is called intermodal transportation.
The following part of this section introduces some common carriers for trans-
porting energy freight.
RailwaysRail is one common method of freight transportation. This is a cost-effective
method, especially for carrying energy freights. Although this method has less
speed and somehow lower reliability, it costs much less than other methods, thus
making freight more affordable. Moreover, compared to truck transportation, it can
transport bulkier and heavier commodities such as coal, chemicals, and petroleum
in large volume to more distant areas [16]. In the United States, coal is the leading
commodity of rail transportation. Another advantage of railroads is that service pro-
viders can use existing infrastructures; in most countries, governments provide the
452 Logistics Operations and Management

infrastructure and therefore it needs less investment [14]. However, in some coun-
tries, especially underdeveloped ones, not all of a region is covered by railways. As
a result, there is less opportunity to use this mode to transport energy freight on a
national scale.
Shipping LinesAmong the different modes of transporting energy freights, maritime transportation
is most often used to transport critical and strategic energy commodities such as oil
and related products between countries and continents. Today, more than 60% of
all oil is transported by ships. Maritime lines are used to transport crude oil and its
products, and their related costs are often less than other modes.
Special oil tankers are used to transport oil; these are the largest vessels in the
world [17].
TrucksTrucks are among the most popular methods of transporting commodities within
and between countries. It is the leading way to transport commodities in most
countries such as the United States. Like other modes of transportation, it has
advantages and disadvantages. Its wide coverage, convenient accessibility, fast
responsiveness, and flexibility make it popular. Furthermore, in some circum-
stances the application of trucks and road transportation is inevitable, because not
all consumption points are connected by rail or water. Although in most cases it is
more suitable for short distances and lightweight shipments, it is more costly than
rail transportation.
In addition to that, this mode of transportation has disadvantages that must be
considered in making decisions, such as its pollution and the amount of fossil
fuels it consumes. It also causes traffic congestion and has low levels of safety.
In most countries, the number of road accidents and tolls are very high, and it is
not possible to get rid of it completely even with precautionary rules and stan-
dards [16].
Demand and Supply
Travel demand derives from the need for energy in other parts of the region or the
world that is deprived of energy resources. As shown in Figure 21.4, the demand
flows in transportation systems rise from the fact that there are discrepancies in
each and every freight transportation—that is, the distance between production and
receiving points varies from one place to another, the energy containers stretch
from trucks to vessels, and the types of energy vary from petroleum to NG. Their
movements make up freight travel’s demand flows.
21.2.4 Introducing the Energy Freight-Transportation Network Models
The network of energy freight transportation is of different levels, from regional
movements through highways and trucks, to national movements through railways,
and to international movements through shipping lines and large vessels. Designing
453Modeling the Energy Freight-Transportation Network

and evaluating the models of such networks requires quantifying interactions
among the elements of existing and future transportation systems [15].
Although every element cannot be identified or controlled in modeling, it still
plays a central role in the design and evaluation of transportation systems. Factors
such as a region’s or country’s transportation infrastructure, constraints of delivery
points, and marine and road traffics all influence the behavior of a network model
but can hardly be modeled or controlled. It is therefore necessary for scientists of
energy-transportation networks to account for these hidden parameters when
designing a network model.
Transportation planning, from goods to energy transportation, has been widely
discussed in books and papers, but most of them are about road transportation by
truck rather than other modes of transportation. It may be questioned why there is a
Figure 21.4 Relationships between the transportation system and the activity system [15].
454 Logistics Operations and Management

lower level of attention, in spite of the large capital investments and operating costs
associated with these other modes. Although research on rail planning problems
has increased considerably over the last 15 years, it is not the same for maritime
transportation.
Christiansen [18] has some explanations. First, there is low visibility; people
mostly see trucks or trains rather than ships, and ships are not the major transpor-
tation mode worldwide. In addition, large organizations that sponsor research
mostly operate fleets of trucks, not ships. Second, the planning problems of ship-
ping networks are less structured than the other modes. This makes the planning
more expensive because of the customization of decision-support systems. There
is more uncertainty in maritime operations because of weather conditions, mechan-
ical problems, and incidents such as strikes. Slacks in maritime transportation
planning are few because they have high costs. Most quantitative models origi-
nated in vertically integrated organizations where ocean shipping is just one com-
ponent of the business. This occurs because there are many small family-owned
companies, because the ocean shipping industry has a long tradition and it is not
open to new ideas.
Modeling the Transportation of Hazardous Materials
The US Department of Transportation (USDOT) defines a hazardous material as
any substance or material capable of causing harm to people, property, or the envi-
ronment [19]. It has categorized a list of hazardous materials into nine classes
according to their physical, chemical, and nuclear properties. Gases and flammable
and combustible liquids are among the classes.
It should be mentioned that most hazardous materials (hazmats) originate at
locations other than their destination. Oil, for instance, is extracted from oil fields
and shipped to a refinery (typically via pipeline); many oil products, such as heat-
ing oil and gasoline, are refined at a refinery and then shipped to storage tanks at
different locations within a country or abroad.
The risks associated with the transportation of oil and gases and their conse-
quences can be significant because of the nature of the cargo: fatalities, injuries,
evacuation, property damage, environmental degradation, and traffic disruption.
Reductions in hazmat transportation risks can be achieved in many different
ways. Some of these ways are not related to modeling and planning the transporta-
tion network, such as driver training and regular vehicle maintenance. Others can
be studied through operation research and modeling.
As mentioned in previous sections, energy can be moved over roads, rails, or
water. In some cases, shipments are intermodal; they are switched from one mode to
another during transit. Hazmat transportation incidents can occur at three points: the
origin when loading, the destination when unloading, and en route. To identify
the route that minimizes fuel costs and travel times between production and receiv-
ing points, operation research models are designed with the related constraints.
According to different routes, energy transportation as a kind of hazardous mate-
rial is a typical multiobjective problem with multiple stakeholders that are difficult
455Modeling the Energy Freight-Transportation Network

to solve. Transport by truck, for instance, has choices between selecting short routes
while moving through heavily populated areas or selecting longer routes through
less populated areas, which makes the transportation cost more and expose to risks.
Mathematical models that are described in the following sections allow repre-
sentation and analysis of the interactions among the various elements of a transpor-
tation system.
Components of Energy Freight-Transportation Models
Modeling any transportation network requires identification of components that are
acting reciprocally. Ghiani et al. [20] introduce cost as the major component of the
transportation model and then classify the problems based on relevant costs.
As mentioned in the previous section, despite the fact that factors affect the
transportation network model, they can hardly be identified, quantified, and mod-
eled. Some of the main factors are categorized under the name of external factors,
which is a subcategory of operational factors [21].
The transport infrastructure is of great importance. Lacking such a capability
could affect the scheduling and delivery of the energy shipment. In some regions,
there are not proper rail networks and essential facilities in the terminals to transfer
energy to a location. Ports have to be well equipped for large vessels to berth and
transfer the energy freight.
In addition to that, a transportation network is affected by trade barriers as well
as laws and taxation policies. Variation in any of these parameters around the world
may affect the decision concerning the most appropriate mode of transportation
and routings for cost reasons. Legal requirements are likely to differ from one
country to another. As a result, there would be problems in costs and planning
while trying to adapt to the requirements.
Because parameters and problems of modeling ship fleets are different from
those of other modes of transportation, ships operate under different conditions.
Table 21.2 provides a comparison of the operational characteristics of the different
freight-transportation modes. Shipping lines are mostly in international territories,
which means they are crossing multiple national jurisdictions. In energy freight
transportation with ships, each unit represents a large capital investment that trans-
lates into a high daily cost because they must pay port fees and operate in interna-
tional routes.
In addition to that, other means of energy freight transportation generally come
in a small number of sizes and similar models and designs, whereas among ships
we find a large variety of designs that result in nonhomogeneous fleets.
More than that, ships have higher risks and lower certainty in their operations
because of their higher dependence on weather conditions and on technology, and
because they usually pass multiple jurisdictions. However, because ships operate
around the clock, their schedules usually do not have buffers of planned idleness
that can absorb delays. As far as trains are concerned, they have their own dedi-
cated rights of way, they cannot pass each other except for specific locations, and
their size and composition are flexible (both numbers of cars and numbers of power
456 Logistics Operations and Management

units). As a result, the operational environment of ships is different from other
modes of freight transportation, and they have different fleet-planning problems.
Energy Freight-Transportation Costs
There are different costs during a transportation network. They can be divided into
transportation costs and handling costs [15]. Transportation costs include the cost
Table 21.2 Comparison of Operational Characteristics of Freight Transportation Modes [18]
Operational
Characteristics
Mode
Ship Aircraft Truck Train Pipeline
Barriers to entry Small Medium Small Large Large
Industry
concentration
Low Medium Low High High
Fleet variety
(physical and
economic)
Large Small Small Small NA
Power unit is an
integral part of
transportation unit
Yes Yes Often No NA
Transportation unit
size
Fixed Fixed Usually
fixed
Variable NA
Operating around the
clock
Usually Seldom Seldom Usually Usually
Trip (or voyage)
length
Days�weeks Hours�days Hours�days Hours�days Days�weeks
Operational
uncertainty
Larger Larger Smaller Smaller Smaller
Right of way Shared Shared Shared Dedicated Dedicated
Pays port fees Yes Yes No No No
Route tolls Possible None Possible Possible Possible
Destination change
while underway
Possible No No No Possible
Port period spans
multiple
operational time
windows
Yes No No Yes NA
Vessel�port
compatibility
depends on load
weight
Yes Seldom No No NA
Multiple products
shipped together
Yes No Yes Yes NA
Returns to origin No No Yes No NA
NA, not applicable.
457Modeling the Energy Freight-Transportation Network

of operating a fleet, the cost of transporting a shipment, the cost of hiring carrier if
not owned, and the cost of a shipment when a public carrier is used. Handling costs
are not discussed in energy freight transportation, because they are incurred when
inserting individual items into a bin, loading the bin onto an outbound carrier, and
reversing these operations at a destination.
The Cost of Operating a FleetThe main costs are related to crews’ wages, fuel consumption, container deprecia-
tion, maintenance, insurance, administration, and occupancy. It is obvious that
wages and insurance are time dependent, fuel consumption and maintenance are
distance dependent, and that depreciation depends on both time and distance
whereas administration and occupancy costs are customarily allocated as a fixed
annual charge.
The Cost for Transporting a ShipmentThis type of cost is paid by a carrier for transporting a shipment. It is rather arbi-
trary because it would be difficult to assign a trip cost to each shipment, where sev-
eral shipments are moved jointly by the same carrier—that is, a large vessel
containing barrels of petroleum and other downstream products simultaneously.
The Cost of Hiring CarrierAlthough hire charges are parts of a transportation total cost, they are still unidenti-
fied and hard to evaluate.
The Cost of a Shipment Using a Public CarrierThe cost for transporting a shipment when using a public carrier can be calculated
on the basis of the rates published by the carrier. The size and equipment of a car-
rier as well as the origin, destination, and route of the movement are factors that
are taken into account when calculating this cost.
Risk
As discussed in “Modeling the Transportation of Hazardous Materials” section,
energy in the form of gas and oil is one type of hazardous material. As a result,
possible incidents during loading, transporting, and unloading should be considered
when making models. To estimate the probability and cost of a hazmat release inci-
dent, various consequences must be considered. The consequences can be catego-
rized as injuries and fatalities (often referred to as population exposure) [22,23],
cleanup costs, property damage, evacuation, product loss, traffic incident delays,
and environmental damage. It is clear that all impacts must be converted to the
same unit (e.g., dollars) while modeling in order to permit comparison and compli-
cation of the total impact cost.
Route
Some models presented in the field of energy-transportation networks seek to mini-
mize travel distances between production and consumption points. It first occurs
458 Logistics Operations and Management

that the shortest possible route—roads and railways or marine lines—would be the
answer. However, looking profoundly at all of the issues concerning routing prob-
lems shows that there are significant components that prevent the model from being
designed and solved in such an easy way.
The previous sections contain explanations about the parameters dealing with
routing problems. As mentioned, not all shortest distances have the lowest expense.
Models of freight transportation seek to solve a multiobjective function in which
more than two factors are optimized. A routing model should give decision makers
the shortest route with the minimum cost simultaneously. Because it would be quite
hard to achieve such a solution, the models show an appropriate solution that does
not necessarily have the minimum distance or cost.
More than that, previous sections explained one important issue that has arisen
in recent years. The security of the routes matters considerably as the rates of lost
or attacked energy freight increase. There are routes with lower levels of security
that have a minimum cost or distance. Meanwhile, secure roads or marine lines cer-
tainly cost more for longer distances. Routing model planners have to design mod-
els that can achieve a good solution while at the same time accounting for as many
issues involved in the problem as possible.
Models of Energy Freight-Transportation Network
Modeling problems of energy freight-transportation networks contain assumptions,
constraints, and one or more objective functions. Models usually focus on one attri-
bute of the network—for instance, minimizing the cost of moving energy while
ignoring other effective attributes or considering them as constant parameters.
As discussed in previous sections, particularly “Energy Containers” section,
modes of energy freight transportation vary from trucks to trains to fleet. The tacti-
cal planning level perspective is missing in ship routing and scheduling studies
reported in the literature. Fleet scheduling is often performed under tight con-
straints. Flexibility in cargo quantities and delivery time is often not permitted. So
the shipping company tries to find an optimal fleet schedule based on such con-
straints while trying to meet the objective functions—that is, maximizing profit or
minimizing costs. Brønmo et al. [24] and Fagerholt [25] have developed models
that consider flexibility in shipment sizes and time windows. The models are not
specified in energy but would be applicable in shipping energy problems as well.
The results of their studies show that there might be a great potential in collabora-
tion and integration along the factors of a transportation process—for instance,
between shippers and shipping companies.
Christiansen et al. [18] introduce a planning problem in which a single product
is transported and call it the single-product-inventory ship-routing problem
(s-ISRP). The assumptions and constraints of the model are close to reality—that
is, transporting energy using ships. The production and consumption rate of the
transported product—energy, in this case—is constant during the planning horizon.
The advantage of the model is that contrary to similar scheduling problems, neither
the number of calls at a given port during the planning horizon nor the quantity to
459Modeling the Energy Freight-Transportation Network

be loaded or unloaded in each port call are not predetermined. There needs to be
some initial input in order to determine the number of possible calls at each port,
the time windows for the start of loading, and the range of feasible loads for each
port of call. The initial information would be the location of loading and unloading
ports, supply and demand rates, and inventory information at each port. Eventually,
the planning problem finds routes and schedules that minimize the transportation
cost without interrupting the production or consumption processes.
Ghiani et al. [20] continue the problems based on transportation cost, discussing
freight-traffic assignment problems and classifying them as static or dynamic.
Static models are appropriate when decisions related to transportation are not
affected explicitly by time. The graph G 5 (V, A) is then applied, where the vertex
set V often corresponds to a set of facilities as terminals, ports, and platforms in
production and receiving points, and the arcs in the set A represent transportation
carriers linking the facilities.
In addition to that, they take a time dimension into account in dynamic models,
including a time-expanded directed graph. In a time-expanded directed graph, a
given planning horizon is divided into a number of time periods, T1, T2. . ., anda physical network is replicated in each time period. Then temporal links are added.
A temporal link connects two representations of the same terminal at two different
periods of time. They may describe a transportation service or the energy freight
waiting to be loaded onto an incoming carrier.
Some linear and nonlinear models based on cost parameter are as follows:
minimum-cost flow formulation; linear single-commodity, minimum-cost flow
problems; and linear multicommodity, minimum-cost flow problems.
As explained in “Modeling the Transportation of Hazardous Materials” section
about oil and gases as types of hazardous materials, transporting them contains
risks that have to be measured. Erkut et al. [26] talk about risk along an edge or
route while transporting hazmats in what they call linear risk. They focus on
hazmat transportation on both roads and railways. A road or rail network is
defined as nodes and edges. The nodes stand for the production and consumption
points, road or rail intersections, and population centers. The road segments con-
necting two nodes are called the edges. It is assumed that each point on an edge
has the same incident probability and level of consequence. As a result, a long
stretch of a highway or railway moving through a series of population centers
and farmland should not be represented as a single edge but as a series of edges.
This is the difference between a hazmat transportation network and other mate-
rial networks. Erkut and Verter [27] discuss this difference as a limit to the por-
tability of network databases between different transport applications. Also,
along with Erkut and Verter [27], Jin et al. [28] and Jin and Batta [29] suggest
a risk model that considers the dependency to the impedances of preceding road
segments.
Transporting energy from place to place requires a detailed plan and a schedule
in order to minimize the costs during the process and determine the shortest route
in time windows while accounting for the probability of incidents. This fact makes
researchers model the realities and propose varieties of models to solve the
460 Logistics Operations and Management

problems. The models cover different transport modes. Erkut et al. [26] have pro-
vided a classification of papers reviewing different problems. Table 21.3 presents
an extended version of what they have done. Not all of the research shown in the
table concentrates on energy transportation, but some of it discusses models of
transporting hazmats such as energy.
Some research has also focused on designing a transportation network. The net-
works are used to transporting hazardous materials in general, but they may also be
applicable for energy freight transportation. Some of them are as follows: Berman
et al. [65]; Erkut and Alp [66]; Erkut and Gzara [67]; Erkut and Ingolfsson [39];
Kara and Verter [68]; and Verter and Kara [69].
Although the cost of a transportation network is a significant factor, other para-
meters also act on the network. A transportation network service problem which is
in the operational level consists of deciding on some elements. The elements
include the characteristics (frequency, number of intermediate stops, etc.) of the
routes to be operated, the traffic assignment along these routes, and the operating
rules and laws at each terminal [20].
Service network design models can be classified into frequency-based and
dynamic models. Variables in frequency-based models express how often each
transportation service is operated in a given time horizon, while in dynamic models
a time-expanded network is used to provide a more detailed description of the net-
work. Models of service network design in both categories are fixed-charge net-
work design models, the linear fixed-charge network design model, the weak and
strong continuous relaxation.
21.3 Case Studies
Some researchers have attempted to model the components of a real case and apply
the models in order to achieve proper solutions. It would be difficult to account for
all the parameters dealing with a problem, but the researchers have done their best
to approximate reality while making models. The more realistic the model, the
more it can achieve.
21.3.1 Case: A Pricing Mechanism for Determining the TransportationRates
Farahani et al. [70] developed a systematic method for calculating the transporta-
tion rates for tanker trucks of the National Iran Oil Product Distribution Co.
(NIOPDC). The objective of the research was to design a computer-based system
for calculating transportation rates and estimating the required budget. Determining
appropriate transportation rates is critical, because of the cost of transporting oil
products.
The researchers first reviewed and classified studies that determined transporta-
tion rates. Afterward, the current supply chain of oil products was described, and
461Modeling the Energy Freight-Transportation Network

Table 21.3 A Classification of Energy/Hazmats Transportation Model
Road Railway Marine Deterministic
Models
Stochastic
Models
Single
Objective
Multiple
Objective
Local Routing
Models
Global
Routing
Models
Akgun et al. [30] * *
Batta and Chiu [31] *
Bowler and Mahmassani
[32]
*
Chang et al. [33] *
Corea and Kulkarni [34] *
Carotenuto et al. [35] *
Darzentas and Spyrou
[36]
*
Dell’Olmo et al. [37] *
Erkut and Ingolfsson [38] *
Erkut and Ingolfsson [39] *
Erkut and Vecter [27] *
Fagerholt and Rygh [40] *
Frank [41] *
Fu and Rilett [42] * *
Glickman [43] *
Glickman [44] * *
Gopalan and Kolluri [45] *
Haas and Kichner [46] *
Hall [47] * *
Iakovou et al. [48] * *
Iakovou [49] *
Kara et al. [50] *
Kulkarni [51] *
462
Logistics
Operatio
nsandManagem
ent

Lindner-Dutton et al. [52] *
Marianov and ReVelle
[53]
* * * *
Miller-Hooks [54] * *
Miller-Hooks and
Mahmassani [55]
* *
Mirchandani [56] *
ReVelle et al. [57] *
Richetta and Larson [58] *
Sherali et al. [59] *
Turnquist [60] *
Verma and Verter [61] *
Weigkricht and Fedra
[62]
* * *
Wijeratne et al. [63] * *
Zografos and
Androutsopoulos [64]
*
463
Modelin
gtheEnerg
yFreig
ht-T
ransportatio
nNetw
ork

then the process used for calculating the transportation rates for the company was
explained. In the remainder come the purpose, input and output of the case, which
is accompanied by the introduction of the new developed system and the techni-
ques used to calculate the transportation rates. The work contains an example to
approve the model, the necessary data, and the final results.
There have been two generic approaches for transportation rates determination;
one of them is based on learning from previous patterns and behaviors, and the
other is based upon total transportation cost. The researchers have used the second
approach because it estimates the total transportation cost while taking into account
time value of money. The designed technique to determine transportation rates is a
combination of two methods; time value of money methods and engineering eco-
nomics methods.
To estimate the next year’s transportation budget, information from previous
years is used because the monthly depot-to-depot transportation is estimated only
for the next month. The budget is divided into two parts that are calculated sepa-
rately. It consists of the procurement transportation (depot-to-depot transportation)
budget and the depot-to-retailer transportation budget.
The system that supports the models of rate calculation and estimation of trans-
portation budget includes three parts. A central database collects and saves the
information related to rate calculation and budget estimation. The main part is the
processing system based on the models of determining liquid gas transportation
rates, oil product transportation rates, and estimating transportation budget.
To compare the designed models with the previous ones, calculated rates are
compared with current rates in the company. Also, a sensitivity analysis is carried
out of main input parameters. In addition to that, the paper assesses the results of
chosen routes and their rates. The sample routes are a combination of intercity and
inner-city routes, including depot-to-depot and depot-to-retailer cases.
The results indicate the estimation of costs for freight transportation, loading,
and unloading. The software developed in the paper estimates transportation rates
and the final required budget based on the database.
21.4 Conclusions and Directions for Further Research
To summarize, we have explained the importance of energy throughout the world.
We clarified that energy plays a vital role in today’s human lives, so planning and
scheduling the transportation of energy in an almost optimal situation is inevitable.
Therefore, modeling the energy freight-transportation network requires modeling
real problems and then solving them with methods such as operation research or
fuzzy logic.
However, there are many components involved in a transportation network that
affect network modeling. Modes of transportation alter the planning and modeling
of a network. For instance, maritime transportation differs greatly from other
modes of transporting energy—that is, trucks and trains. It includes specific
464 Logistics Operations and Management

characteristics and requires decision support models which would be appropriate to
solve its problems. More research in maritime transportation problems has been
done recently than ever before, but the field still needs much attention compared to
other modes. To model and solve more realistic problems in maritime transporta-
tion, there has to be development of optimization algorithms and computing power.
While trying to design a model that is able to minimize the cost, travel destina-
tion, and time, it is necessary that the risk of such models when becomes applicable
should be at the lowest possible level. Some presented models in previous sections
were specific to energy transportation, and others were general in transporting haz-
ardous materials of which energy is a part. Some models were explained, whereas
for other problems we confined ourselves to a review of research about the trans-
portation of energy that has been categorized in different fields from modes of
transportation to single- or multiple-objective models. Readers were referred to
sources that deal more extensively with the problems.
Erkut et al. [26] suggest that researchers emphasize global routing problems on
stochastic time-varying networks because it has received almost no attention. The
problem is so close to reality and most of maritime transportations are global and
goes through international waters.
Furthermore, risk models and the probabilities of risk during freight transporta-
tion still need to be studied. The field would be rather difficult to survey, because
there is no agreement on general accident probabilities and conflicting numbers are
reported by different researchers. Lack of essential data limits improvements in
such fields, and perhaps more attention should be paid to quantifying and modeling
perceived risks. In general, risk and its relevant topic in energy freight transporta-
tion is of high importance, but unfortunately it has attracted little attention.
During the previous decade, attacks on energy freights increased as the price of
energy rose. Energy freight can be a significant target to terrorists around the
world. This fact raises the interest in the security of such freight. The US federal
government, for instance, now requires hazmat truckers to submit to fingerprinting
and criminal background checks [71]. However, security as an important factor in
freight transportation has not yet received much attention from operations research-
ers. Obviously, the problem is complex, and many parameters should be considered
while modeling. Erkut et al. [26] propose three dimensions for operation research-
ers to focus on security issue: rerouting around major cities, changes in the model-
ing of incidence risks, and route-planning methodology.
In addition, as fleets become larger, network planning problems become harder.
So the need arises for a new generation of researchers and planners who have less
practical but more academic backgrounds. As computer technology advances, new
software and optimization-based decision-support systems are introduced for the
varieties of applications in energy freight transportation. These advances make it
easier to model all of the important problem components. This new generation of
planners is more adapted to computers and software and therefore is capable of
modeling realistic issues and finding good solutions to hard problems in a reason-
able amount of time.
465Modeling the Energy Freight-Transportation Network

References
[1] J. Munoz, N. Jimenez-Redondo, J. Perez-Ruiz, J. Barquin, Natural gas network model-
ing for power systems reliability studies, in: IEEE Bologna PowerTech Conference,
Bologna, Italy, 2003.
[2] C. Unsihuay-Vila, J.W. Marangon-Lima, A.C.Z. de Souza, I.J. Perez-Arriaga, A model
to long-term, multiarea, multistage, and integrated expansion planning of electricity and
natural gas systems, IEEE Trans. Power Syst. 25(2) (2009) 1154�1168 (May 2010).
[3] IEA, South American Gas—Daring to Tap the Bounty, IEA Press, France, 2003.
[4] L.A. Barroso, H. Rudnick, S. Mocarquer, R. Kelman, B. Bazerra, LNG in South
America: the markets, the prices and the security of supply, in: IEEE Power and
Energy Society General Meeting—Conversion and Delivery of Electrical Energy in the
21st Century, Pittsburgh, PA, 2008.
[5] G. Shi, Y. Jing, X. Zhang, G. Zheng, Prospects of Natural Gas Storage and
Transportation Using Hydrate Technology in China, IEEE, Baoding, China, 2009.
[6] J.R.G. Whiteford, G.P. Harrison, J.W. Bialek, Electricity and Gas Interaction: A UK
Perspective and Risk Assessment, IEEE, Edinburgh, UK, 2009.
[7] T.G. Crainic, G. Laporte, Planning models for freight transportation, Eur. J. Oper. Res.
97(3) (1997) 409�438.
[8] P. Nijkamp, Globalization, international transport and the global environment: a
research and policy challenge, Transport. Plan. Technol. 26(1) (2003) 1�8.
[9] N. Stchedroff, R.C.H. Cheng, Modeling a continuous process with discrete simulation
techniques and its application to LNG supply chains, in: Winter Simulation
Conference, 2003.
[10] C.-L. Lee, M.-H. Shu, Fault-tree analysis of intuitionistic fuzzy sets for liquefied natural gas
terminal emergency shut-down system, in: Third International Conference on International
Information Hiding and Multimedia Signal Processing, IEEE Computer Society, 2007.
[11] UNCTAD, Review of Maritime Transport, United Nations, New York and Geneva,
2003.
[12] B.E. Okogu, Issue in global gahlral gas: a primer and analysis, 2002.
[13] Council Directive 2004/67/EC, Council of the European Union, 2004, 1�5.
[14] R.W. Hall, Handbook of Transportation Science, second ed., Kluwer Academic
Publishers, New York, 2003.
[15] E. Cascetta, second ed., Transportation Systems Analysis—Models and Applications,
vol. 29, Springer Science1Business Media, New York, 2009.
[16] D. Lowe, Intermodal Freight Transport., Elsevier Butterworth-Heinemann, Oxford,
Great Britain, 2005.
[17] H.S. Marcus, Marine Transportation Management, Croom Helm and Auburn House
Publishing Company, London and Dover Massachusetts, 1987.
[18] M. Christiansen, K. Fagerholt, B. Nygreen, D. Ronen, Maritime Transportation, in: C.
Barnhart, G. Laporte (Eds.), Handbook in Operation Research and Management
Science, vol. 14, Elsevier B.V, 2007.
[19] USDOT, List of Hazardous Materials, The Office of Hazardous Materials Safety, US
Department of Transportation, Washington, 2004.
[20] G. Ghiani, G. Laporte, R. Musmanno, Introduction to Logistics Systems Planning and
Control, John Wiley and Sons, West Sussex, England, 2004.
[21] A. Rushton, P. Croucher, P. Baker, The Handbook of Logistics and Distribution
Management, third ed., Kogan Page, London, 2006.
466 Logistics Operations and Management

[22] M.D. Abkowitz, J.P. DeLorenzo, R. Duych, A. Greenberg, T. McSweeney, Assessing
the economic effect of incidents involving truck transport of hazardous materials,
Transport. Res. Rec. 1763 (2001) 125�129.
[23] FMCSA, Comparative Risks of Hazardous Materials and Non-Hazardous Materials
Truck Shipment Accidents/Incidents, Federal Motor Carrier Safety Administration,
Washington, DC, 2001.
[24] G. Brønmo, M. Christiansen, B. Nygreen, Ship routing and scheduling with flexible
cargo sizes, J. Oper. Res. Soc. 58 (2007) 1167�1177.
[25] K. Fagerholt, Ship scheduling with soft time windows—an optimization based
approach, Eur. J. Oper. Res. 131 (2001) 559�571.
[26] E. Erkut, S.A. Tijandra, V. Verter., Hazardous materials transportation, in: C. Barnhart,
G. Laporte (Eds.), Handbook in Operation Research and Management Science, vol. 14,
Elsevier B.V., 2007.
[27] E. Erkut, V. Verter, Modeling of transport risk for hazardous materials, Oper. Res. 46
(5) (1998) 625�642.
[28] H.H. Jin, R.J. Batta, M.H. Karwan, On the analysis of two new models for transporting
hazardous materials, Oper. Res. 44(5) (1996) 710�723.
[29] H.H. Jin, R. Batta, Objectives derived from viewing hazmat shipments as a sequence of
independent Bernoulli trials, Transport. Sci. 31(3) (1997) 252�261.
[30] V. Akgun, E. Erkut, R. Batta, On finding dissimilar paths, Eur. J. Oper. Res. 121(2)
(2000) 232�246.
[31] R. Batta, S.S. Chiu, Optimal obnoxious paths on a network: transportation of hazardous
materials, Oper. Res. 36(1) (1988) 84�92.
[32] L.A. Bowler, H.S. Mahmassani, Routing of Radioactive Shipments in Networks with
Time-Varying Costs and Curfews, Technical Report ANRCP-1998-11, Amarillo
National Resource Center for Plutonium, TX, 1998.
[33] T.S. Chang, L.K. Nozick, M.A. Turnquist, Multi-objective path finding in stochastic
dynamic networks, with application to routing hazardous materials shipments,
Transport. Sci. 39(3) (2005) 383�399.
[34] G. Corea, V.G. Kulkarni, Shortest paths in stochastic networks with arc lengths having
discrete distributions, Networks 23 (1993) 175�183.
[35] P. Carotenuto, S. Giordani, S. Ricciardelli, Finding minimum and equitable risk routes
for hazmat shipments, Comput. Oper. Res. 34(5) (2007) 1304�1327.
[36] J. Darzentas, T. Spyrou, Ferry traffic in the Aegean Islands: a simulation study,
J. Oper. Res. Soc. 47 (1996) 203�216.
[37] P. Dell’Olmo, M. Gentili, A. Scozzari, On finding dissimilar Pareto-optimal paths, Eur.
J. Oper. Res. 162 (2005) 70�82.
[38] E. Erkut, A. Ingolfsson, Catastrophe avoidance models for hazardous materials route
planning, Transport. Sci. 34(2) (2000) 165�179.
[39] E. Erkut, A. Ingolfsson, Transport risk models for hazardous materials: revisited, Oper.
Res. Lett. 31(1) (2005) 81�89.
[40] K. Fagerholt, B. Rygh, Design of a sea-borne system for fresh water transport—a simu-
lation study, Belgian J. Oper. Res. Stat. Comput. Sci. 40(3�4) (2002) 137�146.
[41] H. Frank, Shortest paths in probabilistic graphs, Oper. Res. 17 (1969) 583�599.
[42] L. Fu, L.R. Rilett, Expected shortest paths in dynamic and stochastic traffic networks,
Transport. Res. Part B 32(7) (1998) 499�516.
[43] T.S. Glickman, Rerouting railroad shipments of hazardous materials to avoid populated
areas, Accid. Anal. Prev. 15(5) (1983) 329�335.
467Modeling the Energy Freight-Transportation Network

[44] T.S. Glickman, Benchmark estimates of release accident rates in hazardous materials
transportation of rail and truck, Transport. Res. Rec. 1193 (1988) 22�28.
[45] R. Gopalan, R. Batta, M.H. Karwan, K.S. Kolluri, Modeling equity of risk in the trans-
portation of hazardous materials, Oper. Res. 38(6) (1990) 961�975.
[46] T.J. Haas, J.J. Kichner, Hazardous materials in marine transportation—a practical
course, J. Chem. Educ. 64(1) (1987) 34�35.
[47] R.W. Hall, The fastest path through a network with random time-dependent travel
times, Transport. Sci. 20(3) (1986) 182�188.
[48] E. Iakovou, C. Douligeris, H. Li, C. Ip, L. Yudhbir, A maritime global route
planning model for hazardous materials transportation, Transport. Sci. 33(1) (1999)
34�48.
[49] E. Iakovou, An interactive multiobjective model for the strategic maritime transporta-
tion of petroleum products: risk analysis and routing, Safety Sci. 39(1�2) (2001)
19�29.
[50] B.Y. Kara, E. Erkut, V. Verter, Accurate calculation of hazardous materials transport
risks, Oper. Res. Lett. 31(4) (2003) 285�292.
[51] V.G. Kulkarni, Shortest paths in networks with exponentially distributed arc lengths,
Networks 16 (1986) 255�274.
[52] L. Lindner-Dutton, R. Batta, M. Karwan, Equitable sequencing of a given set of hazard-
ous materials shipments, Transport. Sci. 25 (1991) 124�137.
[53] V. Marianov, C. ReVelle, Linear, non-approximated models for optimal routing in haz-
ardous environments, J. Oper. Res. Soc. 49(2) (1998) 157�164.
[54] E.D. Miller-Hooks, Adaptive least-expected time paths in stochastic, time-varying
transportation and data networks, Networks 37(1) (2001) 35�52.
[55] E.D. Miller-Hooks, H.S. Mahmassani, Optimal routing of hazardous materials in sto-
chastic, time-varying transportation networks, Transport. Res. Rec. 1645 (1998)
143�151.
[56] P.B. Mirchandani, Shortest distance and reliability of probabilistic networks, Comput.
Oper. Res. 3 (1976) 347�355.
[57] C. ReVelle, J. Cohon, D. Shobrys, Simultaneous siting and routing in the disposal of
hazardous wastes, Transport. Sci. 25(2) (1991) 138�145.
[58] O. Richetta, R. Larson, Modeling the increased complexity of New York City’s refuse
marine transport system, Transport. Sci. 31(3) (1997) 272�293.
[59] H.D. Sherali, L.D. Brizendine, T.S. Glickman, S. Subramanian, Low-probability high-
consequence considerations in routing hazardous materials shipments, Transport. Sci.
31 (1997) 237�251.
[60] M. Turnquist, Multiple objectives, uncertainty and routing decisions for hazardous
materials shipments, in: L.F. Cohn (Ed.), Proceedings of the 5th International
Conference on Computing in Civil and Building Engineering, ASCE, New York, 1993,
pp. 357�364.
[61] M. Verma, V. Verter, Rail transportation of hazardous materials: population exposure
to airborne toxins, Comput. Oper. Res. 34(5) (2007) 1287�1303.
[62] E. Weigkricht, K. Fedra, Decision-support systems for dangerous goods transportation,
INFOR 33(2) (1995) 84�99.
[63] A.B. Wijeratne, M.A. Turnquist, P.B. Mirchandani, Multiobjective routing of hazardous
materials in stochastic networks, Eur. J. Oper. Res. 65 (1993) 33�43.
[64] K.G. Zografos, K.N. Androutsopoulos, A heuristic algorithm for solving hazardous
materials distribution problems, Eur. J. Oper. Res. 152(2) (2004) 507�519.
468 Logistics Operations and Management

[65] O. Berman, V. Verter, B. Kara, Designing emergency response networks for hazardous
materials transportation, Comput. Oper. Res. 34(5) (2007) 1374�1388.
[66] E. Erkut, O. Alp, Integrated routing and scheduling of hazmat trucks with stops en
route, Transport. Sci. 41(1) (2007) 107�122.
[67] E. Erkut, F. Gzara, A Bi-level Programming Application to Hazardous Material
Transportation Network Design, Research Report, Department of Finance and
Management Science, University of Alberta School of Business, Edmonton, Alberta,
Canada, 2005.
[68] B.Y. Kara, V. Verter, Designing a road network for hazardous materials transportation,
Transport. Sci. 38(2) (2004) 188�196.
[69] V. Verter, B.Y. Kara, A Path-Based Approach for the Hazardous Network Design
Problem, Faculty of Management, McGill University, Montreal, 2005.
[70] R.Z. Farahani, E. Miandoabchi, S.M. Mousavi, M.B. Baygi, A Pricing Mechanism for
Determining of Transportation Rates: A Case Study for Oil Industry, Tehran, 2009.
[71] M. Glaze, New security requirements for hazmat transportation, Occup. Health Saf.
72 (9) (2003) 182�185.
469Modeling the Energy Freight-Transportation Network